|
|
| Stores and branches | | 4,935 stores and branches in 48 U.S. states and two U.S. territories and 172 stores and branches in nine Canadian provinces | | 36,644 | | | 6,289 | |
Item 3. Legal Proceedings.
Refer to discussion in Note 13. Contingencies, of the Notes to the Consolidated Financial Statements included herein for information relating to legal proceedings.
Item 4. Mine Safety Disclosures.
Not applicable.
PART II
Item 5. Market for Registrant’s Common Equity, Related Stockholder Matters and Issuer Purchases of Equity Securities.
Our common stock is listed on the New York Stock Exchange under the symbol “AAP.”
As of March 5, 2024, there were 1,067 holders of record of our common stock, which does not include the number of beneficial owners whose shares were represented by security position listings.
The following table sets forth information with respect to repurchases of our common stock for the fourth quarter ended December 30, 2023:
| | | | | | | | | | | | | | | | | | | | | | | | | | |
| Period | | Total Number of Shares Purchased (1) | | Average Price Paid per Share (1) | | Total Number of Shares Purchased as Part of Publicly Announced Programs | | Maximum Dollar Value that May Yet Be Purchased Under the Programs (in thousands) (2) |
| October 8, 2023 to November 4, 2023 | | 20 | | | $ | 51.20 | | | — | | | $ | 947,339 | |
| November 5, 2023 to December 2, 2023 | | 5,340 | | | $ | 52.49 | | | — | | | $ | 947,339 | |
| December 3, 2023 to December 30, 2023 | | 1 | | | $ | 56.25 | | | — | | | $ | 947,339 | |
| Total | | 5,361 | | | $ | 52.49 | | | — | | | |
(1)The aggregate cost of repurchasing shares in connection with the net settlement of shares issued as a result of the vesting of restricted stock units was $0.3 million, or an average price of $52.49 per share, during the twelve weeks ended December 30, 2023.
(2)On February 8, 2022, our Board of Directors authorized an additional $1 billion to the existing share repurchase program. This authorization is incremental to the $1.7 billion that was previously authorized by our Board of Directors.
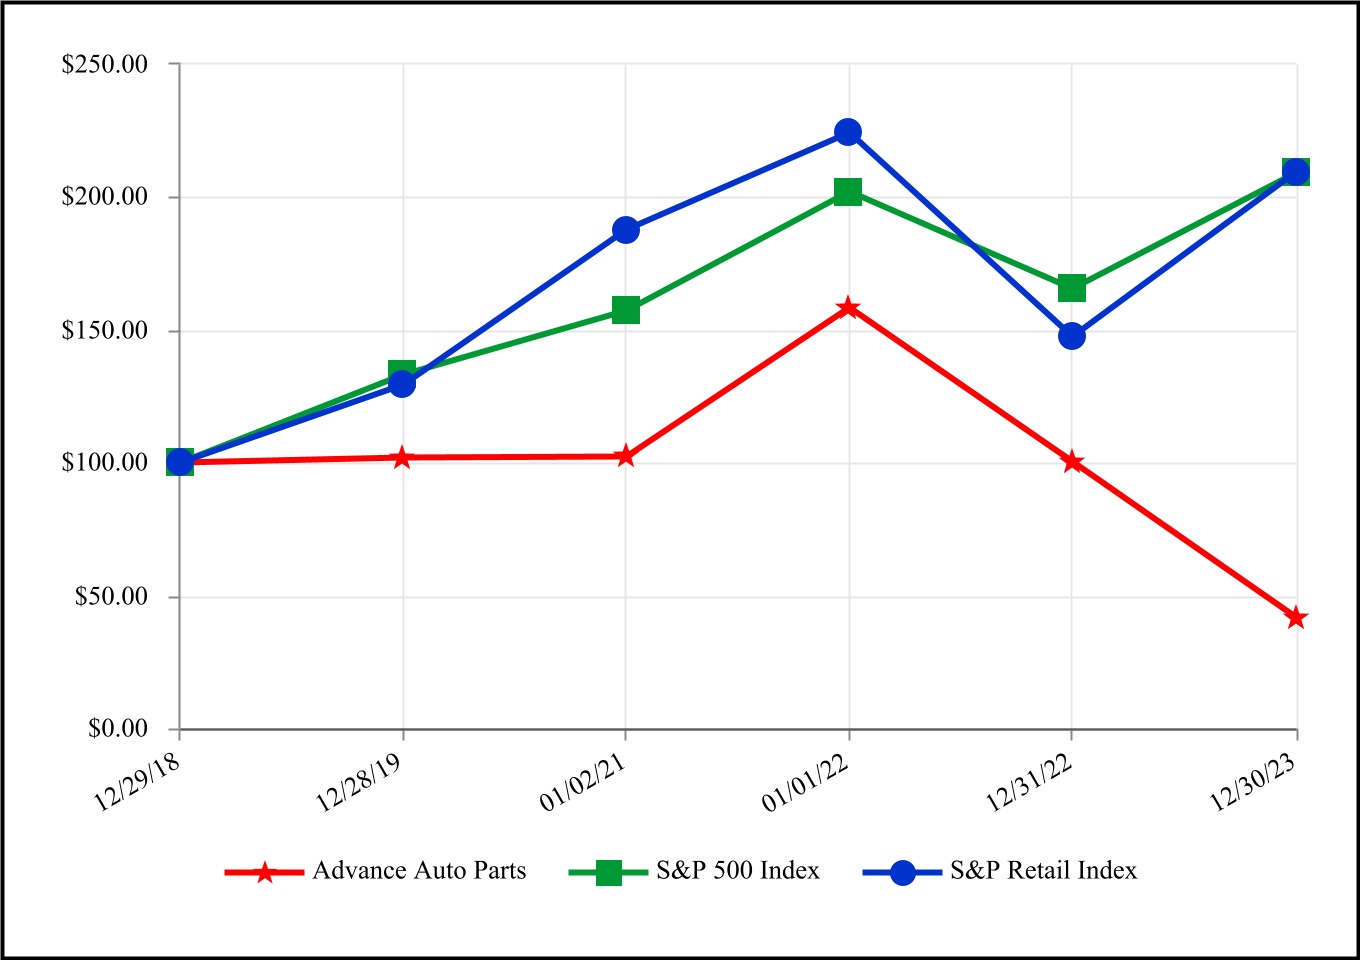
Stock Price Performance
The following graph shows a comparison of the cumulative total return on our common stock, the Standard & Poor’s (“S&P”) 500 Index and the S&P’s Retail Index. The graph assumes that the value of an investment in our common stock was $100.00 on December 29, 2018, and that any dividends have been reinvested. The comparison in the graph below is based solely on historical data and is not intended to forecast the possible future performance of our common stock.
COMPARISON OF CUMULATIVE TOTAL RETURN AMONG
ADVANCE AUTO PARTS, INC., S&P 500 INDEX
AND S&P RETAIL INDEX
| | | | | | | | | | | | | | | | | | | | | | | | | | | | | | | | | | | | | | |
| Company/Index | | December 29, 2018 | | December 28, 2019 | | January 2, 2021 | | January 1, 2022 | | December 31, 2022 | | December 30, 2023 |
| Advance Auto Parts | | $ | 100.00 | | | $ | 102.01 | | | $ | 102.25 | | | $ | 158.16 | | | $ | 100.43 | | | $ | 41.52 | |
| S&P 500 Index | | $ | 100.00 | | | $ | 132.97 | | | $ | 157.02 | | | $ | 202.09 | | | $ | 165.49 | | | $ | 209.00 | |
| S&P Retail Index | | $ | 100.00 | | | $ | 129.15 | | | $ | 187.82 | | | $ | 224.09 | | | $ | 147.26 | | | $ | 209.70 | |
Item 6. [Reserved]
Item 7. Management’s Discussion and Analysis of Financial Condition and Results of Operations.
The following discussion and analysis of financial condition and results of operations should be read in conjunction with our consolidated historical financial statements and the notes to those statements that appear elsewhere in this report. Our discussion contains forward-looking statements based upon current expectations that involve risks and uncertainties, such as our plans, objectives, expectations and intentions. Actual results and the timing of events could differ materially from those anticipated in these forward-looking statements as a result of a number of factors, including those set forth under the section titled “Part 1. Item 1A. Risk Factors” elsewhere in this report. The discussion of our financial condition and changes in our results of operations, liquidity and capital resources for the fiscal year ended December 31, 2022 (“2022”) compared with the fiscal year ended January 1, 2022 (“2021”) has been omitted from this Form 10-K, but are included in “Item 7. Management’s Discussion and Analysis of Financial Condition and Results of Operations” of our Form 10-K for 2022, filed with the Securities and Exchange Commission (“SEC”) on February 28, 2023. Amounts are presented in thousands, except per share data, unless otherwise stated.
Management Overview
A high-level summary of our financial results and other highlights from 2023 includes:
•Net sales during 2023 were $11.3 billion, an increase of 1.2% compared with 2022, driven by new store openings and favorable product mix, partially offset by a 0.3% decline in comparable store sales.
•Gross profit margin for 2023 was 40.1% of Net sales, a decrease of 414 basis points compared with 2022. This decrease was primarily due to higher product costs, inventory-related charges and elevated supply chain costs.
•Operating income for 2023 was $114.4 million, a decrease of $555.9 million from 2022. As a percentage of Net sales, operating income was 1.0%, a decrease of 500 basis points compared with 2022. The increase in Selling, general and administrative (“SG&A”) costs was primarily driven by increased labor-related costs and occupancy expenses.
•Cash flow from operations was $287.4 million during 2023, a decrease of 61.0% compared with 2022, primarily due to lower Net income.
•Diluted earnings per share (“Diluted EPS”) was $0.50 during 2023 compared with $7.65 in 2022.
Business and Risk Update
We have been executing various initiatives to improve the customer experience, expand margins and drive consistent execution for both professional and do-it-yourself (“DIY”) customers, including:
•Continued refinement of a demand-based assortment, leveraging purchase and search history from our common catalog
•Advancement towards optimizing our footprint by market to drive share, repurpose our in-market store and asset base and streamline our distribution network
•Progress in the implementation of a more efficient end-to-end supply chain to deliver our broad assortment of inventory
•Continued negotiations with vendors on strategic sourcing and pricing to help mitigate inflationary pressures
•Rationalization of product assortment
•Investment in our frontline workforce
•Incremental investments in store and distribution center distribution
As announced in the third quarter of 2023, we initiated a comprehensive operational and strategic review of our business to help improve execution and position Advance for long-term success and increased shareholder value. We have identified and are pursuing cost reductions that we expect will generate at least $150 million in savings on an annualized basis, of which, we intend to invest approximately $50 million in employee compensation and training with a clear focus on improving the retention of our frontline team members. In addition, we recently launched an initiative to eliminate costs related to our indirect spend by an additional $50 million on an annualized basis We also announced the potential sales of our Worldpac business and the Canadian portion of our Carquest business. Our operational and strategic review progress is ongoing.
Industry Update
Operating within the automotive aftermarket industry, we are influenced by a number of general macroeconomic factors, many of which are similar to those affecting the overall retail industry. In addition to the “Business and Risk Update” section included within Management’s Discussion and Analysis of Financial Condition and Results of Operations, these factors include, but are not limited to:
•Inflationary pressures, including logistics and labor
•Global supply chain disruptions
•Rising fuel costs
•Miles driven
•Unemployment rates
•Consumer confidence and purchasing power
•Competition
•Changes in new car sales
•Vehicle manufacturer warranties
•Average age of vehicles in operation
•Economic and geopolitical uncertainty
•Deferral of elective automotive maintenance and improvements in new car quality
•Increased foreign currency exchange volatility
While these factors tend to fluctuate, we remain confident in the long-term growth prospects for the automotive parts industry.
Results of Operations
The following table sets forth certain of our operating data expressed as a percentage of net sales for the periods indicated.
| | | | | | | | | | | | | | | | | | | | | | | | | | | | | | | | | | | | | | | | | | | | | | | | | | |
| Year Ended | | 2023 vs. 2022
$ Change | | Basis Points | | 2022 vs. 2021
$ Change | | Basis Points |
| (in millions) | December 30, 2023 | | December 31, 2022 | | January 1, 2022 | | | | |
| Net sales | $ | 11,287.6 | | 100.0 | % | | $ | 11,154.7 | | 100.0 | % | | $ | 10,998.0 | | 100.0 | % | | $ | 132.9 | | | — | | | $ | 156.7 | | | — | |
| Cost of sales | 6,764.1 | | 59.9 | | | 6,222.5 | | 55.8 | | | 6,074.0 | | 55.2 | | | 541.6 | | | 414 | | | 148.5 | | | 55 | |
| Gross profit | 4,523.5 | | 40.1 | | | 4,932.2 | | 44.2 | | | 4,924.0 | | 44.8 | | | (408.7) | | | (414) | | | 8.2 | | | (55) | |
| SG&A | 4,409.1 | | 39.1 | | | 4,262.0 | | 38.2 | | | 4,101.6 | | 37.3 | | | 147.1 | | | 85 | | | 160.4 | | | 91 | |
| Operating income | 114.4 | | 1.0 | | | 670.2 | | 6.0 | | | 822.4 | | 7.5 | | | (555.8) | | | (500) | | | (152.2) | | | (147) | |
| Interest expense | (88.1) | | (0.8) | | | (51.1) | | (0.5) | | | (37.8) | | (0.3) | | | (37.0) | | | (32) | | | (13.3) | | | (11) | |
| Loss on debt extinguishment | — | | — | | | (7.4) | | (0.1) | | | — | | — | | | 7.4 | | | 7 | | | (7.4) | | | (7) | |
Other income (expense), net | 5.5 | | 0.0 | | | (7.4) | | (0.1) | | | (2.1) | | 0.0 | | | 12.9 | | | 12 | | | (5.3) | | | (5) | |
| Provision for income taxes | 2.1 | | — | | | 140.0 | | 1.3 | | | 185.9 | | 1.7 | | | (137.9) | | | (124) | | | (45.9) | | | (44) | |
| Net income | $ | 29.7 | | 0.3 | % | | $ | 464.3 | | 4.16 | % | | $ | 596.6 | | 5.42 | % | | $ | (434.6) | | | (390) | | | $ | (132.3) | | | (126) | |
Note 1: Table amounts may not foot due to rounding.
Net Sales
Net sales for 2023 were $11.3 billion, an increase of $132.9 million, or 1.2%, compared with 2022, and was primarily driven by new store openings and favorable product mix, partially offset by a decline in units sold. Category growth was led by brakes and batteries. Comparable store sales decreased 0.3% due to a decline in the DIY business.
We calculate comparable store sales based on the change in store or branch sales starting once a location has been open for 13 complete four-week periods (approximately one year) and by including e-commerce sales. Sales to independently-owned Carquest stores are excluded from our comparable store sales. Acquired stores are included in our comparable store sales once the stores have completed 13 complete accounting periods following the acquisition date. We include sales from relocated stores in comparable store sales from the original date of opening. Comparable sales is intended only as supplemental information and is not a substitute for Net sales presented in accordance with accounting principles generally accepted in the United States of America (“GAAP”).
Gross Profit
Gross profit in 2023 was $4.52 billion, or 40.1% of Net sales, compared with $4.93 billion, or 44.2% of Net sales in 2022, a decrease of 414 basis points. Gross profit as a percentage of Net sales was negatively impacted by higher product costs not fully covered by pricing actions of $180.9 million, a change in estimate associated with inventory reserves and other inventory-related charges of $143.5 million as well as elevated supply chain expenses. Gross margin decline was partially offset by favorable product mix.
Selling, General and Administrative Expenses
SG&A for 2023 was $4.41 billion, or 39.1% of Net sales, compared with $4.26 billion, or 38.2% of Net sales for 2022, an increase of 85 basis points. This increase as a percentage of Net sales was primarily driven by increased labor-related costs and occupancy expenses.
Interest Expense
Interest expense for 2023 was $88.1 million, an increase of $37.0 million compared with 2022. This increase was primarily due to interest incurred on higher borrowings against our revolver as well as issuances of senior unsecured notes in 2023. Refer to Note 6. Long-term Debt and Fair Value of Financial Instruments of the Notes to the Consolidated Financial Statements included herein for further details.
Provision for Income Taxes
Our Provision for income taxes for 2023 was $2.1 million compared with $140.0 million for 2022, a favorable change of $137.9 million primarily due to a decrease in taxable income. Our effective tax rate was 6.6% for 2023 and 23.2% for 2022. In 2023, the rate decreased compared with prior year primarily due to a tax benefit resulting from the expiration of statute of limitations for certain tax years in multiple states as well as enhanced utilization of tax credits in the current year and a discrete charge related to share-based compensation.
Liquidity and Capital Resources
Overview
Our primary cash requirements necessary to maintain our current operations include payroll and benefits, inventory purchases, contractual obligations, capital expenditures, payment of income taxes, funding of initiatives under our strategic business plan and other operational priorities, including payment of interest on our long-term debt. Historically, we have also used available funds to repay borrowings under our credit facility, to periodically repurchase shares of our common stock under our share repurchase program, to pay our quarterly cash dividend and for acquisitions; however, depending on the priorities of our business and in consideration of ongoing uncertainties related to general global macroeconomic conditions, our future uses of cash may differ, including with respect to the weight we place on the preservation of cash and liquidity, degree of investment in our business and other capital allocation factors.
Typically, we have funded our cash requirements primarily through cash generated from operations, supplemented by borrowings under our credit facilities and notes offerings as needed. We believe funds generated from our expected results of operations, available cash and cash equivalents and available borrowings under our credit facility will be sufficient to fund our obligations for the next year. We also believe such funds, cash and available borrowings, together with our ability to generate cash through credit facilities and notes offerings as needed, will be sufficient to fund our obligations long-term. Cash requirements for obligations next year and beyond are discussed in the “Contractual and Off Balance Sheet Obligations” section below.
Share Repurchases
In August 2019, our Board of Directors approved a share repurchase program. Under the program, we may periodically repurchase shares of our common stock at market prices through open market purchases effected through a broker dealer and in privately negotiated transactions. The Board of Directors may increase or otherwise modify, renew, suspend or terminate the share repurchase program without prior notice. On February 8, 2022, our Board of Directors authorized an additional $1.0 billion toward our share repurchase program. Previously, in April 2021 and November 2019, our Board of Directors authorized $1.0 billion and $700.0 million for our share repurchase program.
During 2023, we did not repurchase any shares of our common stock in connection with our share repurchase program. During 2022, we repurchased 3.0 million shares of our common stock at an aggregate cost of $598.2 million, or an average price of $201.88 per share, under our share repurchase program. Given macroeconomic uncertainties and our focus on strengthening our balance sheet, we expect to continue our pause on share repurchases in 2024, but may resume share repurchases in the future.
Capital Expenditures
Our primary capital requirements have been the funding of our investments in information technology and supply chain, e-commerce and maintenance of existing stores and branches. We lease approximately 84% of our stores and branches.
Our capital expenditures were $242.4 million in 2023, a decrease of $181.7 million from 2022, related to the decrease of spend in information technology and supply chain as well as fewer store openings from 2022 to 2023.
Our future capital requirements will depend in large part on the timing or number of the investments we make in information technology and supply chain network initiatives and existing stores and new store development (leased and owned locations) within a given year. In 2024, we anticipate that our capital expenditures related to such investments will range from $200 million to $250 million but may vary with business conditions.
Analysis of Cash Flows
The following table summarizes our cash flows from operating, investing and financing activities:
| | | | | | | | | | | | | | | | | |
| | Year Ended |
| December 30, 2023 | | December 31, 2022 | | January 1, 2022 |
| Cash flows provided by operating activities | $ | 287,375 | | | $ | 736,571 | | | $ | 1,107,022 | |
| Cash flows used in investing activities | (235,489) | | | (424,448) | | | (287,314) | |
Cash flows provided by (used in) financing activities | 189,267 | | | (620,704) | | | (1,064,112) | |
| Effect of exchange rate changes on cash | (8,487) | | | (8,664) | | | 5,474 | |
Net increase (decrease) in cash and cash equivalents | $ | 232,666 | | | $ | (317,245) | | | $ | (238,930) | |
Operating Activities
In 2023, Net cash provided by operating activities decreased $449.2 million to $287.4 million. The net decrease in cash flows provided by operating activities compared with the prior year was primarily driven by lower Net income and higher accounts receivable. Refer to “Results of Operations” for further details on our results.
Investing Activities
In 2023, Net cash used in investing activities decreased $189.0 million to $235.5 million compared with 2022. This decrease was attributable to reduced purchases of property and equipment due to the completion of back office integration in the prior year, partially offset by investments in new store openings.
Financing Activities
In 2023, Net cash provided by financing activities increased by $810.0 million to $189.3 million compared with 2022. The net increase in cash provided by financing activities was attributable to a reduction in share repurchases of our common stock of $604.0 million and the incremental net proceeds of $251 million from the issuances of senior unsecured notes in 2023 compared with 2022.
Our Board of Directors has declared a quarterly cash dividend since 2006. Any payments of dividends in the future will be at the discretion of our Board of Directors and will depend upon our results of operations, cash flows, capital requirements and other factors deemed relevant by our Board of Directors.
Long-Term Debt
On March 9, 2023, we issued our 5.90% senior unsecured notes due 2026 (the “2026 Notes”) at 99.94% of the principal amount of $300.0 million and our 5.95% senior unsecured notes due 2028 (the “2028 Notes”) at 99.92% of the principal amount of $300.0 million. The 2026 Notes and 2028 Notes bear interest at a rate of 5.90% and 5.95%, respectively, and are payable semi-annually in arrears in March and September. Proceeds from our 2026 and 2028 Notes were utilized to make repayments on our revolving facility and supplement operational and capital expenditures.
As of March 12, 2024, we had a credit rating from S&P of BB+ and from Moody’s Investor Service of Baa3. The current outlooks by S&P and Moody’s were stable and negative, respectively. The current pricing grid used to determine our borrowing rate under our revolving credit facility is based on our credit ratings. If our credit ratings further decline, it would negatively impact our interest rate, and our access to additional financing on favorable terms may be limited. In addition, further decline in our credit ratings would likely reduce the attractiveness of our supplier finance programs, whereby our suppliers are provided financing arrangements based on our credit rating. This could result in significantly lower supplier or bank participation in those programs. Following the downgrade in our credit rating from S&P, certain banks reduced participation in our programs. This capacity has been substantially replaced with new participating banks as well as existing participating banks providing increased capacity. Lower participation in our supplier payment programs would shorten our payable terms, resulting in an increase in our working capital requirements, and may have a material negative impact on our liquidity or capital resources.
With respect to all senior unsecured notes for which Advance Auto Parts, Inc. (“Issuer”) is an issuer or provides a full and unconditional guarantee, Advance Stores, a wholly-owned subsidiary of the Issuer, serves as the guarantor (“Guarantor Subsidiary”). The subsidiary guarantees related to our senior unsecured notes are full and unconditional and joint and several, and there are no restrictions on the ability of the Issuer to obtain funds from its Guarantor Subsidiary. Our captive insurance subsidiary, an insignificant wholly-owned subsidiary of the Issuer, does not serve as guarantor of our senior unsecured notes.
Contractual and Off Balance Sheet Obligations
We enter into operating leases for certain store locations, distribution centers, office spaces, equipment and vehicles. Our property leases generally contain renewal and escalation clauses and other concessions. These provisions are considered in our calculation of our minimum lease payments that are recognized as expense on a straight-line basis over the applicable lease term. Any lease payments that are based upon an existing index or rate are included in our minimum lease payment calculations. As of December 30, 2023, our operating lease obligations were $2.66 billion. As of December 30, 2023, our long-term debt, consisting of senior unsecured notes with varying maturities through 2032, was $1.8 billion. Future interest payable related to long-term debt was $380.0 million as of December 30, 2023. As part of our normal operations, we enter into purchase commitments primarily for the purchase of goods or services that are enforceable, legally binding and specify all significant terms, including fixed or minimum quantities to be purchased; fixed, minimum or variable price provisions; and the approximate timing of the transaction. As of December 30, 2023, our purchase commitments were $133.0 million.
On February 27, 2023, we entered into Amendment No. 1 (“Amendment No. 1”) to the Credit Agreement, dated November 9, 2021, with Advance Auto Parts, Inc., as Borrower, Advance Stores Company, Incorporated, as a Guarantor, the lenders party thereto, and Bank of America, N.A., as administrative agent (“2021 Credit Agreement”). Amendment No. 1 extends the maturity date of the 2021 Credit Agreement by one year from November 9, 2026, to November 9, 2027. Amendment No. 1 also replaces an adjusted LIBOR benchmark rate with a Term Secured Overnight Financing Rate benchmark rate, as adjusted by an increase of ten basis points, plus the applicable margin under the 2021 Credit Agreement. Amendment No. 1 made no other material changes to the terms of the 2021 Credit Agreement. On August 21, 2023, we entered into Amendment No. 2 (“Amendment No. 2”) to the 2021 Credit Agreement in order to amend certain financial covenants related to the Consolidated Coverage Ratio (as defined therein), and on November 20, 2023, we entered into Amendment No. 3 (“Amendment No. 3”) to the 2021 Credit Agreement in order to further amend financial covenants related to the Consolidated Coverage Ratio. Pursuant to Amendment No. 2 and Amendment No. 3, we will not permit the Consolidated Coverage Ratio to be less than (a) 1.75 to 1.00 for each period of four fiscal quarters ending on October 7, 2023 through and including the period of four fiscal quarters ending on October 5, 2024, (b) 2.00 to 1.00 for each period of four fiscal quarters ending on December 28, 2024 through and including the period of four fiscal quarters ending on October 4, 2025 and (c) 2.25 to 1.00 for each period of four fiscal quarters ending after October 4, 2025. Amendment No. 2. and Amendment No. 3 made no other material changes to the terms of the 2021 Credit Agreement. On February 26, 2024, we entered into Amendment No. 4 (“Amendment No. 4”) to the Credit Agreement dated November 9, 2021, with Advance Auto Parts, Inc., as Borrower, Advance Stores Company, Incorporated, as a Guarantor, the lenders party thereto, and Bank of America, N.A., as administrative agent to enable certain addbacks to the definition of Consolidated EBITDA contained therein for specific write-downs of inventory and vendor receivables. Amendment No. 4 also updated certain limitations on future incurrences of other indebtedness and liens, replacing the cap thereon of 10% of consolidated net tangible assets with $400 million, and eliminated the $250 million basket for accounts receivable securitization transactions. Amendment No. 4 made no other material changes to the terms of the 2021 Credit Agreement.
In addition to our Consolidated Coverage Ratio requirement, we are required to maintain a maximum leverage ratio of 3.75 to 1.00. Our compliance with these covenants will depend upon achieving our financial targets including improvements in operating income. As of December 30, 2023, giving consideration to the amendments to our 2021 Credit Agreement, we were in compliance with the financial covenants required thereby. We currently expect to be in compliance with these financial covenants for the next 12 months. However, risk of noncompliance increases if our financial performance worsens or we are required to increase borrowings to fund operations. If we are not in compliance with the financial covenants required by our 2021 Credit Agreement, and cannot timely secure an amendment or waiver thereof, we would be in default of our 2021 Credit Agreement and our outstanding senior unsecured notes, which would have a material adverse impact on our financial condition.
Critical Accounting Policies
Our financial statements have been prepared in accordance with GAAP. Our discussion and analysis of the financial condition and results of operations are based on these financial statements. The preparation of these financial statements requires the application of accounting policies in addition to certain estimates and judgments by our management. Our estimates and judgments are based on currently available information, historical results and other assumptions we believe are reasonable. Actual results could differ materially from these estimates.
The preparation of our financial statements included the following significant estimates and exercise of judgment.
Vendor Incentives
We receive incentives in the form of reductions to amounts owed and/or payments from vendors related to volume rebates and other promotional considerations. Many of these incentives are under agreements with terms in excess of one year, while others are negotiated on an annual basis or less. Advertising allowances received as a reimbursement of specific, incremental and identifiable costs incurred to promote a vendor’s products are included as an offset to SG&A when the cost is incurred. Volume rebates and vendor promotional allowances that do not meet the requirements for offsetting in SG&A and that are earned based on inventory purchases are initially recorded as a reduction to inventory. These deferred amounts are recorded as a reduction to Cost of sales as the inventory is sold.
Vendor promotional allowances provided as a reimbursement of specific, incremental and identifiable costs incurred to promote a vendor’s products are included as an offset to SG&A when the cost is incurred if the fair value of that benefit can be reasonably estimated. Certain of our vendor agreements contain purchase volume incentives that provide for increased funding when graduated purchase volumes are met. Amounts accrued throughout the year could be impacted if actual purchase volumes differ from projected annual purchase volumes. Periodic assessments of the accruals are performed to determine the appropriateness of the estimate and are adjusted accordingly.
Amounts received or receivable from vendors that are not yet earned are reflected initially as a reduction to inventory, which subsequently is recorded to Cost of sales. Our estimate of the portion of deferred revenue that will be realized within one year of the balance sheet date is included in Other current liabilities. Earned amounts that are receivable from vendors are included in Receivables, net, except for that portion expected to be received after one year, which is included in Other assets, net. We regularly review the receivables from vendors to ensure they are able to meet their obligations. Historically, the change in our reserve for receivables related to vendor funding has not been significant.
Self-Insurance Reserves
Our self-insurance reserves consist of the estimated exposure for claims filed, claims incurred but not yet reported and projected future claims, and are established using actuarial methods followed in the insurance industry and our historical claims experience. Specific factors include, but are not limited to, assumptions about health care costs, the severity of accidents, the incidence of illness and the average size of claims. Generally, claims for automobile and general liability and workers’ compensation take several years to settle. We classify the portion of our self-insurance reserves that is not expected to be settled within one year in Other long-term liabilities.
While we do not expect the amounts ultimately paid to differ significantly from our estimates, our self-insurance reserves and corresponding Cost of sales and SG&A could be affected if future claim experience differs significantly from historical trends and actuarial assumptions. A 10% change in our self-insurance liabilities at December 30, 2023 would result in a change in expense of approximately $15.0 million for 2023.
Excess and Obsolete Inventory Reserves
In connection with a strategic and operational review of the business, we reviewed the rationalization of product assortment and planned decisive actions related to inventory. As a result, we made a change in our estimate of excess inventory reserves resulting in an increase to Cost of sales of approximately $116 million. Our excess and obsolete inventory reserve assessment includes analyzing our inventory at the SKU level by assessing each SKU quantity based on years on hand, the stage within the product lifecycle the SKU is assigned and sales history. From this data analysis, our excess and obsolete inventory is identified, analyzed and compared against our reserve. Additionally, from time to time, specific SKUs may be identified as excess and/or obsolete for which a reserve will be recognized.
We classify each product into a product lifecycle category: introduction, expansion, saturation, reduction and disposition. This assessment is routinely performed and includes, but is not limited to, the analysis of anticipated, historical and actual demand; and changes in customer preferences. SKU-level classifications are updated as warranted.
New Accounting Pronouncements
For a description of recently adopted and issued accounting standards, including the expected dates of adoption and estimated effects, if any, on our consolidated financial statements, see “Recently Issued Accounting Pronouncements” in Note 2. Significant Accounting Policies, of the Notes to the Consolidated Financial Statements included herein.
Item 7A. Quantitative and Qualitative Disclosures about Market Risks.
We are subject to interest rate risk to the extent we borrow against our revolving credit facility as it is based, at our option, on adjusted Term Secured Overnight Financing Rate (“SOFR”) plus a margin, or an alternate base rate plus a margin. As of December 30, 2023, we had no borrowings outstanding under our revolving credit facility. As of December 31, 2022, we had $185.0 million of borrowings outstanding under our revolving credit facility.
Our financial assets that are exposed to credit risk consist primarily of trade accounts receivable and vendor receivables. We are exposed to normal credit risk from customers. Our concentration of credit risk is limited because our customer base consists of a large number of customers with relatively small balances, which allows the credit risk to be spread across a broad base. We have not historically had significant credit losses.
We are exposed to foreign currency exchange rate fluctuations for the portion of our inventory purchases denominated in foreign currencies. We believe that the price volatility relating to foreign currency exchange rates is partially mitigated by our ability to adjust selling prices. During 2023 and 2022, foreign currency transactions did not materially impact Net income.
Item 8. Financial Statements and Supplementary Data.
Item 9. Changes in and Disagreements with Accountants on Accounting and Financial Disclosure.
None.
Item 9A. Controls and Procedures.
Disclosure Controls and Procedures
Disclosure controls and procedures (as that term is defined in Rules 13a-15(e) and 15d-15(e) under the Securities Exchange Act of 1934, as amended (the “Exchange Act”)), are management’s controls and other procedures that are designed to ensure that information required to be disclosed by management in the Company’s reports that are filed or submitted under the Exchange Act is recorded, processed, summarized and reported within the time periods specified in the SEC’s rules and forms, and that such information is accumulated and communicated to management, including the Company’s principal executive officer and principal financial officer, as appropriate to allow timely decisions regarding required disclosure. Internal controls over financial reporting, no matter how well designed, have inherent limitations, including the possibility of human error and the override of controls. Therefore, even those systems determined to be effective can provide only “reasonable assurance” with respect to the reliability of financial reporting and financial statement preparation and presentation. Further, because of changes in conditions, the effectiveness may vary over time.
Evaluation of Disclosure Controls and Procedures
Management evaluated, with the participation of the Company’s principal executive officer and principal financial officer, the effectiveness of its disclosure controls and procedures as of December 30, 2023. Based on this evaluation, the Company’s principal executive officer and our principal financial officer have concluded that, as of the end of the period covered by this report, the Company’s disclosure controls and procedures were not effective to accomplish their objectives at the reasonable assurance level due to the material weakness described below.
Management’s Report on Internal Control over Financial Reporting
Management is responsible for establishing and maintaining adequate internal control over financial reporting as defined in Rule 13(a) - 15(f) under the Exchange Act. Management’s internal control over financial reporting is a process designed under the supervision of our principal executive officer and principal financial officer, and effected by our Board of Directors, management and other personnel, to provide “reasonable assurance” regarding the reliability of financial reporting and the preparation of our financial statements for external purposes in accordance with GAAP. Management’s internal control over financial reporting includes policies and procedures that (1) pertain to the maintenance of records that, in reasonable detail, accurately and fairly reflect the transactions and dispositions of the Company’s assets; (2) provide reasonable assurance that transactions are recorded as necessary to permit preparation of financial statements in accordance with GAAP, and that its receipts and expenditures are being made only in accordance with authorizations of management and directors; and (3) provide “reasonable assurance” regarding prevention or timely detection of unauthorized acquisition, use or disposition of its assets that could have a material effect on the financial statements.
As of December 30, 2023, management, including the Company’s principal executive officer and principal financial officer, assessed the effectiveness of its internal control over financial reporting based on the criteria established in Internal Control - Integrated Framework (2013) issued by the Committee of Sponsoring Organizations of the Treadway Commission (“COSO”). Based on this evaluation, the Company’s principal executive officer and our principal financial officer have concluded that, as of the end of the period covered by this report, the Company’s internal control over financial reporting was not effective to accomplish their objectives at the reasonable assurance level solely due to the material weakness described below.
As previously disclosed in our Form 10-Q for the period ended April 22, 2023 and continuing to exist as of December 30, 2023, management identified a material weakness in our internal control over financial reporting that existed due to turnover of key accounting positions. The Company was not able to attract, develop and retain sufficient resources to fulfill internal control and accounting responsibilities.
A material weakness is a deficiency, or combination of deficiencies, in internal control over financial reporting, such that there is a reasonable possibility that a material misstatement of the annual or interim financial statements will not be prevented or detected on a timely basis.
Management has corrected the relevant prior periods of its Consolidated Financial Statements and related footnotes in this Form 10-K for the immaterial errors identified for comparative purposes. Further, management believes that the Consolidated Financial Statements and related financial information included present fairly, in all material respects, our balance sheets, statements of operations, comprehensive income and cash flows as of and for the periods presented.
Attestation Report of Registered Public Accounting Firm
Management’s internal control over financial reporting as of December 30, 2023 has been audited by Deloitte & Touche LLP, an independent registered public accounting firm, who also audited the Company’s consolidated financial statements for the year ended December 30, 2023, as stated in their report included herein, which expresses an adverse opinion on the effectiveness of its internal control over financial reporting as of December 30, 2023.
Remediation Efforts to Address the Previously Disclosed Material Weakness
The Company has devoted, and will continue to devote, significant time and resources to complete its remediation of the material weakness. The following components of the remediation plan, among others, have been executed:
•Backfilled open roles and hired approximately 30 experienced personnel (both permanent employees and contract labor) with the requisite accounting and internal controls knowledge and experience to sufficiently complement the existing global controllership organization;
•Completed the review of the organizational structure of the global controllership function by a third-party consultant and implemented recommended changes;
•Assessed our methodologies, policies and procedures to ensure adequate design and effectiveness of processes supporting internal control over financial reporting;
•Added redundant and compensating internal controls to enhance our internal control structure and commenced testing of certain controls during the third quarter and completed full testing in the fourth quarter;
•Assessed the specific training needs for newly hired and existing personnel and developed and delivered training programs designed to uphold our internal controls standards;
•Following the departure of the Company’s Chief Financial Officer during the third fiscal quarter of 2023, hired a new Chief Financial Officer who began employment with the Company on November 27, 2023; and
•Following the departure of the Company’s Chief Accounting Officer during the fourth fiscal quarter of 2023, hired a new Chief Accounting Officer who began employment with the Company on January 9, 2024.
The Company considers the remediation of the material weakness to be a top priority and has made significant progress in executing the remediation plan. The material weakness will not be considered fully remediated until the remediation actions are tested and deemed to have been operating effectively for a sufficient period of time.
Changes in Internal Control Over Financial Reporting
Except for the changes described above, there has been no change in the Company’s internal control over financial reporting during the fourth quarter ended December 30, 2023 that has materially affected or is reasonably likely to materially affect its internal control over financial reporting as defined in Rules 13a-15(f) and 15d-15(f) under the Exchange Act.
Item 9B. Other Information.
During the twelve weeks ended , 2023, Rule 10b5-1 or non-Rule 10b5-1 trading arrangements were adopted or terminated by the Company’s officers or directors as each term is defined in Item 408 of Regulation S-K.
Item 9C. Disclosure Regarding Foreign Jurisdictions that Prevent Inspections.
Not applicable.
PART III
Item 10. Directors, Executive Officers and Corporate Governance.
For a discussion of our directors, executive officers and corporate governance, see the information set forth in the sections and subsections entitled “Proposal No. 1 - Election of Directors,” “Corporate Governance,” “Additional Information Regarding Executive Compensation - Information Concerning our Executive Officers,” “Audit Committee Report,” and “Additional Information Regarding Executive Compensation - Delinquent Section 16(a) Reports,” “Code of Ethics and Business Conduct” and “Code of Ethics for Finance Professionals” in our proxy statement for the 2024 annual meeting of stockholders to be filed with the SEC within 120 days after the close of our fiscal year ended December 30, 2023 (the “2024 Proxy Statement”), which is incorporated herein by reference.
Item 11. Executive Compensation.
See the information set forth in the sections entitled “Compensation Committee Report,” “Compensation Discussion and Analysis,” “Compensation Program Risk Assessment,” “Additional Information Regarding Executive Compensation” and “Director Compensation” in the 2024 Proxy Statement, which is incorporated herein by reference.
Item 12. Security Ownership of Certain Beneficial Owners and Management and Related Stockholder Matters.
See the information set forth in the subsections entitled “Equity Compensation Plan Information” and “Security Ownership of Certain Beneficial Owners and Management” in the 2024 Proxy Statement, which is incorporated herein by reference.
Item 13. Certain Relationships and Related Transactions, and Director Independence.
See the information set forth in the subsections entitled “Corporate Governance - Related Party Transactions” and “Board Independence and Structure” in the 2024 Proxy Statement, which is incorporated herein by reference.
Item 14. Principal Accountant Fees and Services.
See the information set forth in the subsection entitled “2023 and 2022 Audit Fees” in the 2024 Proxy Statement, which is incorporated herein by reference.
PART IV
Item 15. Exhibits, Financial Statement Schedules.
| | | | | | | | |
| (1) Financial Statements | | |
Audited Consolidated Financial Statements of Advance Auto Parts, Inc. and Subsidiaries for the years ended , 2023, December 31, 2022 and January 1, 2022: | | |
| | |
| | |
| | |
| | |
| | |
| | |
| | |
| | |
| (2) Financial Statement Schedule | | |
| | |
| | |
| (3) Exhibits | | |
| | |
REPORT OF INDEPENDENT REGISTERED PUBLIC ACCOUNTING FIRM
To the stockholders and the Board of Directors of Advance Auto Parts, Inc.
Opinion on the Financial Statements
We have audited the accompanying consolidated balance sheets of Advance Auto Parts, Inc. and subsidiaries (the "Company") as of December 30, 2023 and December 31, 2022, the related consolidated statements of operations, comprehensive income, changes in stockholders' equity, and cash flows for each of the three years in the period ended December 30, 2023, and the related notes and the schedule listed in the Index at Item 15 (collectively referred to as the "financial statements"). In our opinion, the financial statements present fairly, in all material respects, the financial position of the Company as of December 30, 2023 and December 31, 2022, and the results of its operations and its cash flows for each of the three years in the period ended December 30, 2023, in conformity with accounting principles generally accepted in the United States of America.
We have also audited, in accordance with the standards of the Public Company Accounting Oversight Board (United States) (PCAOB), the Company's internal control over financial reporting as of December 30, 2023, based on criteria established in Internal Control — Integrated Framework (2013) issued by the Committee of Sponsoring Organizations of the Treadway Commission and our report dated March 12, 2024, expressed an adverse opinion on the Company's internal control over financial reporting because of a material weakness.
Basis for Opinion
These financial statements are the responsibility of the Company's management. Our responsibility is to express an opinion on the Company's financial statements based on our audits. We are a public accounting firm registered with the PCAOB and are required to be independent with respect to the Company in accordance with the U.S. federal securities laws and the applicable rules and regulations of the Securities and Exchange Commission and the PCAOB.
We conducted our audits in accordance with the standards of the PCAOB. Those standards require that we plan and perform the audit to obtain reasonable assurance about whether the financial statements are free of material misstatement, whether due to error or fraud. Our audits included performing procedures to assess the risks of material misstatement of the financial statements, whether due to error or fraud, and performing procedures that respond to those risks. Such procedures included examining, on a test basis, evidence regarding the amounts and disclosures in the financial statements. Our audits also included evaluating the accounting principles used and significant estimates made by management, as well as evaluating the overall presentation of the financial statements. We believe that our audits provide a reasonable basis for our opinion.
Critical Audit Matter
The critical audit matter communicated below is a matter arising from the current-period audit of the financial statements that was communicated or required to be communicated to the audit committee and that (1) relates to accounts or disclosures that are material to the financial statements and (2) involved our especially challenging, subjective, or complex judgments. The communication of critical audit matters does not alter in any way our opinion on the financial statements, taken as a whole, and we are not, by communicating the critical audit matter below, providing a separate opinion on the critical audit matter or on the accounts or disclosures to which it relates.
Vendor Incentives — Refer to Note 2 to the Consolidated Financial Statements
Critical Audit Matter Description
The Company receives incentives in the form of reductions in amounts owed to and/or payments due from vendors related to volume rebates and other promotions. Volume rebates and vendor promotional allowances are earned based on inventory purchases and initially recorded as a reduction to inventory, except for allowances provided as reimbursement of specific, incremental and identifiable costs incurred to promote a vendor’s products that are offset in selling, general and administrative expenses. The deferred amounts are recorded as a reduction in cost of sales as the inventory is sold. Total deferred vendor incentives included as a reduction of inventories were $ million as of December 30, 2023.
While many of these incentives are under long-term agreements in excess of one year, others are negotiated on an annual basis or shorter. Accordingly, auditing vendor incentives was challenging due to the extent of audit effort required to evaluate whether the vendor incentives were recorded in accordance with the terms of the vendor agreements.
How the Critical Audit Matter Was Addressed in the Audit
Our audit procedures related to whether the vendor incentives were recorded in accordance with the terms of the vendor agreements included the following, among others:
•We tested the effectiveness of controls over the process that ensures that all vendor agreements are communicated to accounting.
•We tested the effectiveness of controls over the recording of vendor incentives as a reduction in inventories, and subsequently as a reduction in cost of sales as the related inventory was sold.
•We selected a sample of vendor incentives from the income recognized as a reduction to cost of sales during the year and from incentive income that was deferred at year-end, and recalculated, using the terms of the vendor agreement, both the amount recorded as deferred vendor incentives as a reduction in inventories and the amount recognized in earnings as a reduction in cost of sales.
•We selected a sample of vendors from the Company’s inventory purchases made during the year and confirmed directly with the vendor that the agreement obtained from the Company and used in the determination of recording vendor incentives as a reduction in cost of sales was the most recent for the applicable period between the parties.
/s/
March 12, 2024
We have served as the Company’s auditor since 2002.
REPORT OF INDEPENDENT REGISTERED PUBLIC ACCOUNTING FIRM
To the stockholders and the Board of Directors of Advance Auto Parts, Inc.
Opinion on Internal Control over Financial Reporting
We have audited the internal control over financial reporting of Advance Auto Parts, Inc. and subsidiaries (the “Company”) as of December 30, 2023, based on criteria established in Internal Control — Integrated Framework (2013) issued by the Committee of Sponsoring Organizations of the Treadway Commission (COSO). In our opinion, because of the effect of the material weakness identified below on the achievement of the objectives of the control criteria, the Company has not maintained effective internal control over financial reporting as of December 30, 2023, based on criteria established in Internal Control — Integrated Framework (2013) issued by COSO.
We have also audited, in accordance with the standards of the Public Company Accounting Oversight Board (United States) (PCAOB), the consolidated financial statements and financial statement schedule as of and for the year ended December 30, 2023, of the Company and our report dated March 12, 2024, expressed an unqualified opinion on those consolidated financial statements and financial statement schedule.
Basis for Opinion
The Company’s management is responsible for maintaining effective internal control over financial reporting and for its assessment of the effectiveness of internal control over financial reporting, included in the accompanying Management’s Report on Internal Controls over Financial Reporting. Our responsibility is to express an opinion on the Company’s internal control over financial reporting based on our audit. We are a public accounting firm registered with the PCAOB and are required to be independent with respect to the Company in accordance with the U.S. federal securities laws and the applicable rules and regulations of the Securities and Exchange Commission and the PCAOB.
We conducted our audit in accordance with the standards of the PCAOB. Those standards require that we plan and perform the audit to obtain reasonable assurance about whether effective internal control over financial reporting was maintained in all material respects. Our audit included obtaining an understanding of internal control over financial reporting, assessing the risk that a material weakness exists, testing and evaluating the design and operating effectiveness of internal control based on the assessed risk, and performing such other procedures as we considered necessary in the circumstances. We believe that our audit provides a reasonable basis for our opinion.
Definition and Limitations of Internal Control over Financial Reporting
A company’s internal control over financial reporting is a process designed to provide reasonable assurance regarding the reliability of financial reporting and the preparation of financial statements for external purposes in accordance with generally accepted accounting principles. A company’s internal control over financial reporting includes those policies and procedures that (1) pertain to the maintenance of records that, in reasonable detail, accurately and fairly reflect the transactions and dispositions of the assets of the company; (2) provide reasonable assurance that transactions are recorded as necessary to permit preparation of financial statements in accordance with generally accepted accounting principles, and that receipts and expenditures of the company are being made only in accordance with authorizations of management and directors of the company; and (3) provide reasonable assurance regarding prevention or timely detection of unauthorized acquisition, use, or disposition of the company’s assets that could have a material effect on the financial statements.
Because of its inherent limitations, internal control over financial reporting may not prevent or detect misstatements. Also, projections of any evaluation of effectiveness to future periods are subject to the risk that controls may become inadequate because of changes in conditions, or that the degree of compliance with the policies or procedures may deteriorate.
Material Weakness
A material weakness is a deficiency, or a combination of deficiencies, in internal control over financial reporting, such that there is a reasonable possibility that a material misstatement of the company’s annual or interim financial statements will not be prevented or detected on a timely basis. The following material weakness has been identified and included in management's assessment. Management has identified a material weakness in internal control over financial reporting due to the inability to attract, develop and retain sufficient resources to fulfill internal control and accounting responsibilities. This material weakness was considered in determining the nature, timing, and extent of audit tests applied in our audit of
the consolidated financial statements and financial statement schedule as of and for the year ended December 30, 2023, of the Company, and this report does not affect our report on such financial statements.
/s/
March 12, 2024
Advance Auto Parts, Inc. and Subsidiaries
Consolidated Balance Sheets
(in thousands, except per share data)
| | | | | | | | | | | |
| | December 30, 2023 | | December 31, 2022 |
| Assets | |
| Current assets: | | | |
| Cash and cash equivalents | $ | | | | $ | | |
| Receivables, net | | | | | |
| Inventories, net | | | | | |
| Other current assets | | | | | |
| Total current assets | | | | | |
Property and equipment, net of accumulated depreciation of $ and $ | | | | | |
| Operating lease right-of-use assets | | | | | |
| Goodwill | | | | | |
| Other intangible assets, net | | | | | |
| Other assets | | | | | |
| Total assets | $ | | | | $ | | |
| | | |
| Liabilities and Stockholders’ Equity | | | |
| Current liabilities: | | | |
| Accounts payable | $ | | | | $ | | |
| Accrued expenses | | | | | |
| Current portion of long-term debt | | | | | |
| Other current liabilities | | | | | |
| Total current liabilities | | | | | |
| Long-term debt | | | | | |
| Non-current operating lease liabilities | | | | | |
| Deferred income taxes | | | | | |
| Other long-term liabilities | | | | | |
| Total liabilities | | | |
| | | |
| Commitments and contingencies | | | |
| | | |
| Stockholders’ equity: | | | |
Preferred stock, nonvoting, $ par value, shares authorized; shares issued or outstanding | | | | | |
Common stock, voting, $ par value, shares authorized; shares issued and outstanding at December 30, 2023 shares issued and outstanding at December 31, 2022 | | | | | |
| Additional paid-in capital | | | | | |
Treasury stock, at cost, and shares | () | | | () | |
| Accumulated other comprehensive loss | () | | | () | |
| Retained earnings | | | | | |
| Total stockholders’ equity | | | | | |
| Total liabilities and stockholders’ equity | $ | | | | $ | | |
The accompanying notes to the consolidated financial statements are an integral part of these statements.
Advance Auto Parts, Inc. and Subsidiaries
Consolidated Statements of Operations
(in thousands, except per share data)
| | | | | | | | | | | | | | | | | |
| Year Ended |
| December 30, 2023 | | December 31, 2022 | | January 1, 2022 |
| Net sales | $ | | | | $ | | | | $ | | |
| Cost of sales | | | | | | | | |
| Gross profit | | | | | | | | |
| Selling, general and administrative expenses | | | | | | | | |
| Operating income | | | | | | | | |
| Other, net: | | | | | |
| Interest expense | () | | | () | | | () | |
| Loss on early redemptions of senior unsecured notes | | | | () | | | | |
Other income (expense), net | | | | () | | | () | |
| Total other, net | () | | | () | | | () | |
| Income before provision for income taxes | | | | | | | | |
| Provision for income taxes | | | | | | | | |
| Net income | $ | | | | $ | | | | $ | | |
| | | | | |
| Basic earnings per common share | $ | | | | $ | | | | $ | | |
| Weighted average common shares outstanding | | | | | | | | |
| | | | | |
| Diluted earnings per common share | $ | | | | $ | | | | $ | | |
| Weighted average common shares outstanding | | | | | | | | |
| | | | | |
Consolidated Statements of Comprehensive Income
(in thousands)
| | | | | | | | | | | | | | | | | |
| | Year Ended |
| December 30, 2023 | | December 31, 2022 | | January 1, 2022 |
Net income | $ | | | | $ | | | | $ | | |
Other comprehensive loss: | | | | | |
Changes in net unrecognized other postretirement benefit costs, net of tax of $(), $ and $ | | | | () | | | () | |
| Currency translation adjustments | () | | | () | | | () | |
Total other comprehensive loss | () | | | () | | | () | |
Comprehensive income | $ | | | | $ | | | | $ | | |
The accompanying notes to the consolidated financial statements are an integral part of these statements.
| | | | | | | | | | | | | | | | | | | | | | | | | | | | | | | | | | | | | | | | | |
Advance Auto Parts, Inc. and Subsidiaries Consolidated Statements of Changes in Stockholders’ Equity (in thousands, except per share data) |
| | | | | | | | | | | |
| | Common Stock | | Additional Paid-in Capital | | Treasury Stock, at cost | | Accumulated Other Comprehensive Loss | | Retained Earnings | | Total Stockholders’ Equity |
| | Shares | | Amount | | | | |
| Balance, January 2, 2021 | | | | $ | | | | $ | | | | $ | () | | | $ | () | | | $ | | | | $ | | |
| Net income | — | | | — | | | — | | | — | | | — | | | | | | | |
| | | | | | |
| Total other comprehensive income | — | | | — | | | — | | | — | | | () | | | — | | | () | |
| Restricted stock units and deferred stock units vested | | | | — | | | — | | | — | | | — | | | — | | | — | |
| Share-based compensation | — | | | — | | | | | | — | | | — | | | — | | | | |
| Stock issued under employee stock purchase plan | | | | — | | | | | | — | | | — | | | — | | | | |
| Repurchases of common stock | () | | | — | | | — | | | () | | | — | | | — | | | () | |
Cash dividends declared ($ per common share) | — | | | — | | | — | | | — | | | — | | | () | | | () | |
| Other | | | | — | | | () | | | — | | | — | | | — | | | () | |
| Balance, January 1, 2022 | | | | | | | | | | () | | | () | | | | | | | |
| Net income | — | | | — | | | — | | | — | | | — | | | | | | | |
| Total other comprehensive income | — | | | — | | | — | | | — | | | () | | | — | | | () | |
| Issuance of shares upon the exercise of stock options | | | | — | | | | | | — | | | — | | | — | | | | |
| Restricted stock units and deferred stock units vested | | | | — | | | — | | | — | | | — | | | — | | | — | |
| Share-based compensation | — | | | — | | | | | | — | | | — | | | — | | | | |
| Stock issued under employee stock purchase plan | | | | — | | | | | | — | | | — | | | — | | | | |
| Repurchases of common stock | () | | | — | | | — | | | () | | | — | | | — | | | () | |
Cash dividends declared ($ per common share) | — | | | — | | | — | | | — | | | — | | | () | | | () | |
| Other | | | | — | | | () | | | — | | | — | | | — | | | () | |
| Balance, December 31, 2022 | | | | | | | | | | () | | | () | | | | | | | |
| Net income | — | | | — | | | — | | | — | | | — | | | | | | | |
| Total other comprehensive loss | — | | | — | | | — | | | — | | | () | | | — | | | () | |
| | | | | | |
|
|
|
|
|
|
| Other | | | | | |
| Total accrued expenses | $ | | | | $ | | |
10
billion toward the existing share repurchase program. Previously in April 2021 and November 2019, our Board of Directors authorized $ billion and $ million for our share repurchase program. Our share repurchase program permits the repurchase of our common stock on the open market and in privately negotiated transactions from time to time. The Board of Directors may increase or otherwise modify, renew, suspend or terminate the share repurchase program without prior notice.
During 2023, we did not repurchase any shares of our common stock under our share repurchase program. We had $ million remaining under our share repurchase program as of December 30, 2023. During 2022, we repurchased million shares of our common stock at an aggregate cost of $ million or an average price of $ per share, under our share repurchase program.
11.
| | $ | | | | $ | | | | Denominator | | | | | |
| Basic weighted average common shares | | | | | | | | |
| Dilutive impact of share-based awards | | | | | | | | |
Diluted weighted average common shares(1) | | | | | | | | |
| | | | | |
| Basic earnings per common share | $ | | | | $ | | | | $ | | |
| Diluted earnings per common share | $ | | | | $ | | | | $ | | |
thousand thousand and thousand.
12.
| | $ | () | | | $ | () | | | State | | | | () | | | () | |
| Foreign | | | | | | | | |
| $ | | | | $ | () | | | $ | | |
| 2022 | | | | | |
| Federal | $ | | | | $ | | | | $ | | |
| State | | | | | | | | |
| Foreign | | | | () | | | | |
| $ | | | | $ | | | | $ | | |
| 2021 | | | | | |
| Federal | $ | | | | $ | | | | $ | | |
| State | | | | | | | | |
| Foreign | | | | | | | | |
| $ | | | | $ | | | | $ | | |
% for 2023, 2022 and 2021)$ | | | | $ | | | | $ | | | State income taxes, net of federal income tax | () | | | | | | | |
| |
| Other, net | | | | () | | | () | |
| Provision for income taxes | $ | | | | $ | | | | $ | | |
Deferred Income Tax Assets (Liabilities)
| | $ | | | | Share-based compensation | | | | | |
| Accrued medical and workers compensation | | | | | |
| Net operating loss carryforwards | | | | | |
| Operating lease liabilities | | | | | |
| Other, net | | | | | |
| Total deferred income tax assets before valuation allowances | | | | | |
| Less: Valuation allowance | () | | | () | |
| Total deferred income tax assets | | | | | |
| Deferred income tax liabilities: | | | |
| Property and equipment | () | | | () | |
| Inventories | () | | | () | |
| Intangible assets | () | | | () | |
| Operating lease right-of-use assets | () | | | () | |
| Total deferred income tax liabilities | () | | | () | |
| Net deferred income tax liabilities | $ | () | | | $ | () | |
As of December 30, 2023 and December 31, 2022, our net operating loss (“NOL”) carryforwards comprised state NOLs of $ million and $ million. These NOLs may be used to reduce future taxable income and expire periodically through 2039. Due to uncertainties related to the realization of these NOLs in certain jurisdictions, as well as other credits available to us, we have recorded a valuation allowance of $ million as of December 30, 2023 and $ million as of December 31, 2022. In addition, we recorded a $ million valuation allowance on foreign tax credit carryforwards as of December 30, 2023. The amount of deferred income tax assets realizable could change in the future if projections of future taxable income change.
We have not recorded deferred taxes when earnings from foreign operations are considered to be indefinitely invested outside of the U.S. As of December 30, 2023 and December 31, 2022, these accumulated net earnings generated by our foreign operations were $ million and $ million, which did not include earnings deemed to be repatriated as part of the U.S. Tax Cuts and Jobs Act. It is not practicable to determine the income tax liability that would be payable if such earnings were repatriated.
| | $ | | | | $ | | | | Increases related to prior period tax positions | | | | | | | | |
| Decreases related to prior period tax positions | | | | () | | | () | |
| Increases related to current period tax positions | | | | | | | | |
| Settlements | | | | () | | | () | |
| Expiration of statute of limitations | () | | | () | | | () | |
| Unrecognized tax benefits, end of period | $ | | | | $ | | | | $ | | |
As of December 30, 2023, December 31, 2022 and January 1, 2022, the entire amount of unrecognized tax benefits, if recognized, would reduce our annual effective tax rate of %, % and %. During 2023, 2022 and 2021, we recorded income tax-related interest and penalties of $ million, $ million and $ million due to uncertain tax positions included in the Provision for income taxes in the accompanying Consolidated Statements of Operations. As of December 30, 2023 and December 31, 2022, we recorded a liability for potential interest of $ million and $ million and for potential penalties of $ million for each year. We do not provide for any penalties associated with tax contingencies unless considered probable of assessment. We do not expect our unrecognized tax benefits to change significantly over the next 12 months. With few exceptions, we are no longer subject to U.S. federal, state and local or non-U.S. income tax examinations by tax authorities for years before 2020.
13.
In the normal course of business, the Company identified a potential discrepancy in trade compliance pertaining to customs transactions. The Company is conducting a thorough review of transactions, and if the review identifies any relevant errors, the Company will reimburse U.S. Customs and Border Protection (“CBP”) for duties, fees and interest owed, if any. The Company has submitted a voluntary initial prior disclosure with the CBP. Since filing its voluntary initial prior disclosure, the Company has not identified any material errors. Based on currently known information, it is too early for management to reasonably estimate the loss, or range of loss, if any, that may result. Accordingly, management has not recorded a loss contingency as of December 30, 2023, related to this matter.
14.
million, $ million and $ million in 2023, 2022 and 2021.
Deferred Compensation
We maintain a non-qualified deferred compensation plan for certain team members. This plan provides for a minimum and maximum deferral percentage of the team member’s base salary and bonus as determined by the Retirement Plan Committee. We established and maintain a deferred compensation liability for this plan. As of December 30, 2023 and December 31, 2022, these liabilities were $ million and $ million and are included within Accrued Expenses in the Consolidated Balance Sheets.
15.
and vest one-third annually over three years. We record compensation expense for the grant date fair value of the option awards evenly over the vesting period.
At December 30, 2023, there were million shares of common stock available for future issuance under the 2023 Plan based on management’s current estimate of the probable vesting outcome for performance-based awards. Shares forfeited become available for reissuance and are included in availability.
Restricted Stock Units
For time-based RSUs, the fair value of each award was determined based on the market price of our common stock on the date of grant. Time-based RSUs generally vest over a three-year period in equal annual installments beginning on the first anniversary of the grant date. During the vesting period, holders of RSUs are entitled to receive dividend equivalents, but are not entitled to voting rights.
For performance-based RSUs, the fair value of each award was determined based on the market price of our common stock on the date of grant. Performance-based awards generally may vest following a three-year period subject to the achievement of certain financial goals as specified in the grant agreements. Depending on our results during the three-year performance period, the actual number of awards vesting at the end of the period generally ranges from % to % of the performance award. Performance-based RSUs generally do not have dividend equivalent rights and do not have voting rights until the
thousand performance-based RSUs granted during 2023. There were performance-based RSUs granted during 2022 or 2021. The change in units based on performance represents the change in the number of granted awards expected to vest based on the updated probability assessment as of December 30, 2023. Compensation expense for performance-based awards of $ million, $ million and $ million in 2023, 2022 and 2021 was determined based on management’s estimate of the probable vesting outcome.
% | | | % | | | % | | Expected dividend yield | | % | | | % | | | % |
Expected stock price volatility(2) | | % | | | % | | | % |
(1)The risk-free interest rate is based on the U.S. Treasury constant maturity interest rate having a term consistent with the vesting period of the award.
(2)Expected volatility is determined based on historical volatility over a matching look-back period and is consistent with the correlation coefficients between our stock prices and our peer group.
Additionally, we estimated a liquidity discount of % using the Chaffe Model to adjust the fair value for the post-vest restrictions. Vesting of market-based RSUs depends on our relative total shareholder return among a designated group of peer companies during a three-year period and will be subject to a one-year holding period after vesting.
| | $ | | | | | | | $ | | | | | | | $ | | | | Granted | | | | $ | | | | | | | $ | | | | | | | $ | | |
Change in units based on performance | | | | $ | | | | () | | | $ | | | | | | | $ | | |
Vested (1) | () | | | $ | | | | () | | | $ | | | | () | | | $ | | |
| Forfeited | () | | | $ | | | | | | | $ | | | | () | | | $ | | |
| Nonvested at December 30, 2023 | | | | $ | | | | | | | $ | | | | | | | $ | | |
| | | | | (1) The vested shares of market-based RSUs were not exercised due to low multiplier effect for 2020 awards.
| | $ | | | | $ | | |
| Total grant date fair value of RSUs vested | $ | | | | $ | | | | $ | | |
| Performance-based: | | | | | |
| Weighted average fair value of RSUs granted | $ | | | | $ | | | | $ | | |
| Total grant date fair value of RSUs vested | $ | | | | $ | | | | $ | | |
| Market-based: | | | | | |
| Weighted average fair value of RSUs granted | $ | | | | $ | | | | $ | | |
| Total grant date fair value of RSUs vested | $ | | | | $ | | | | $ | | |
As of December 30, 2023, the maximum potential payout under our currently outstanding performance-based and market-based RSUs were thousand and thousand units.
Stock Options
In 2023, we granted thousand stock options where the weighted average fair value of stock options granted was $ per share. The fair value was estimated on the date of grant by applying the Black-Scholes-Merton option-pricing valuation model.
The following table includes summary information for stock options as of , 2023:
| | | | | | | | | | | | | | | | | | | | | | | |
| Number of Awards | | Weighted Average Exercise Price | | Weighted Average Remaining Contractual Life (Years) | | Aggregate Intrinsic Value |
| Outstanding at December 31, 2022 | | | | $ | | | | | | |
| Granted | | | | $ | | | | | | |
| Exercised | | | | $ | | | | | | |
| Forfeited | () | | | $ | | | | | | |
| Outstanding at December 30, 2023 | | | | $ | | | | | | $ | | |
| Exercisable at December 30, 2023 | | | | $ | | | | | | $ | | |
%– | % | Expected life (2) | years |
Expected volatility (3) | % | – | % |
Expected dividend yield (4) | % | – | % |
(1) The risk-free interest rate is based on the yield in effect at grant for zero-coupon U.S. Treasury notes with maturities equivalent to the expected term of the stock options.
(2) The expected term represents the period of time options granted are expected to be outstanding. As we do not have sufficient historical data, we utilized the simplified method provided by the Securities and Exchange Commission to calculate the expected term as the average of the contractual term and vesting period.
(3) Expected volatility is the measure of the amount by which the stock price has fluctuated or is expected to fluctuate. We utilized historical trends and the implied volatility of our publicly traded financial instruments in developing the volatility estimate for our stock options.
(4) The expected dividend yield is calculated based on our expected quarterly dividend and the three-month average stock price as of the grant date.
Other Considerations
Total income tax benefit related to share-based compensation expense for 2023, 2022 and 2021 was $ million, $ million and $ million.
As of December 30, 2023, there was $ million of unrecognized compensation expense related to all share-based awards that is expected to be recognized over a weighted average period of years.
Deferred Stock Units
We grant share-based awards annually to our Board of Directors in connection with our annual meeting of stockholders. These awards are granted in the form of DSUs as provided for in the Advance Auto Parts, Inc. Deferred Stock Unit Plan for Non-Employee Directors and Selected Executives (“DSU Plan”). Each DSU is equivalent to one share of our common stock and will be distributed in common shares after the director’s service on the Board ends. DSUs granted vest over a one-year service period. Additionally, the DSU Plan provides for the deferral of compensation earned in the form of (i) an annual retainer for directors and (ii) wages for certain highly compensated team members. These DSUs are settled in common stock with the participants at a future date, or over a specified time period, as elected by the participants in accordance with the DSU Plan.
We granted thousand, and DSUs in 2023, 2022 and 2021. The weighted average fair value of DSUs granted during 2023, 2022 and 2021 was $, $ and $. The DSUs were awarded at a price equal to the market price of our underlying common stock on the date of the grant. For 2023, 2022 and 2021, we recognized $ million, $ million and $ million of share-based compensation expense for these DSU grants.
Employee Stock Purchase Plan
We also offer an employee stock purchase plan (“ESPP”). Under the ESPP, eligible team members may elect salary deferrals to purchase our common stock at a discount of % from its fair market value on the date of purchase. There are annual limitations on the amounts a team member may elect of either $ thousand per team member or % of compensation, whichever is less. As of December 30, 2023, there were million shares available to be issued under the ESPP.
16.
| | $ | () | | | $ | () | | | 2021 activity | () | | | () | | | () | |
| Balance, January 1, 2022 | | | | () | | | () | |
| 2022 activity | () | | | () | | | () | |
| Balance, December 31, 2022 | | | | () | | | () | |
| 2023 activity | | | | () | | | () | |
| Balance, , 2023 | $ | | | | $ | () | | | $ | () | |
17.
, 2023 and December 31, 2022, $ billion and $ billion of our Accounts payable were to suppliers participating in these financing arrangements.
Our confirmed obligations to suppliers participating in these financing arrangements consist of the following:
| | | | | |
| December 30, 2023 |
| Confirmed obligations outstanding at the beginning of the year | $ | | |
| Invoices confirmed during the year | | |
| Confirmed invoices paid during the year | () | |
| Confirmed obligations outstanding at the end of the year | $ | | |
| | $ | () | | | $ | | | | Receivables, net | | | | () | | | | |
| Inventories, net | | | | | | | | |
| |
| Total current assets | | | | () | | | | |
| |
| |
| |
| |
| |
| Total assets | $ | | | | $ | () | | | $ | | |
| | | | | |
| Liabilities and Stockholders’ Equity | | | | | |
| Accounts payable | $ | | | | $ | | | | $ | | |
| Accrued expenses | | | | () | | | | |
| |
| Total current liabilities | | | | | | | | |
| |
| |
| Deferred income taxes | | | | () | | | | |
| Other long-term liabilities | | | | | | | | |
| Total liabilities | | | | | | | | |
| |
| |
| |
| |
| Accumulated other comprehensive loss | () | | | () | | | () | |
| Retained earnings | | | | () | | | | |
| Total stockholders’ equity | | | | () | | | | |
| Total liabilities and stockholders’ equity | $ | | | | $ | () | | | $ | | |
| | | | | | | | | | | | | | | | | |
| Condensed Consolidated Balance Sheet |
| December 31, 2022 |
| As Previously Reported | | Adjustments | | As Corrected |
| Assets | | | | | |
| Cash and cash equivalents | $ | | | | $ | | | | $ | | |
| Receivables, net | | | | () | | | | |
| Inventories, net | | | | () | | | | |
| |
| Total current assets | | | | () | | | | |
| |
| |
| |
| |
| |
| Total assets | $ | | | | $ | () | | | $ | | |
| | | | | |
| Liabilities and Stockholders’ Equity | | | | | |
| Accounts payable | $ | | | | $ | | | | $ | | |
| Accrued expenses | | | | () | | | | |
| |
| |
| Total current liabilities | | | | | | | | |
| |
| |
| Deferred income taxes | | | | () | | | | |
| Other long-term liabilities | | | | | | | | |
| Total liabilities | | | | | | | | |
| |
| |
| |
| |
| Accumulated other comprehensive loss | () | | | | | | () | |
| Retained earnings | | | | () | | | | |
| Total stockholders’ equity | | | | () | | | | |
| Total liabilities and stockholders’ equity | $ | | | | $ | () | | | $ | | |
| | $ | () | | | $ | | | | Receivables, net | | | | () | | | | |
| Inventories, net | | | | () | | | | |
| Other current assets | | | | | | | | |
| Total current assets | | | | () | | | | |
| |
| |
| |
| |
| |
| Total assets | $ | | | | $ | () | | | $ | | |
| | | | | |
| Liabilities and Stockholders’ Equity | | | | | |
| Accounts payable | $ | | | | $ | | | | $ | | |
| Accrued expenses | | | | () | | | | |
| |
| |
| Total current liabilities | | | | | | | | |
| |
| |
| |
| |
| Total liabilities | | | | | | | | |
| |
| |
| |
| |
| Accumulated other comprehensive loss | () | | | | | | () | |
| Retained earnings | | | | () | | | | |
| Total stockholders’ equity | | | | () | | | | |
| Total liabilities and stockholders’ equity | $ | | | | $ | () | | | $ | | |
| | | | | | | | | | | | | | | | | |
| Condensed Consolidated Balance Sheet |
| October 7, 2023 |
| As Previously Reported | | Adjustments | | As Corrected |
| Assets | | | | | |
| Cash and cash equivalents | $ | | | | $ | () | | | $ | | |
| Receivables, net | | | | () | | | | |
| Inventories, net | | | | () | | | | |
| Other current assets | | | | | | | | |
| Total current assets | | | | | | | | |
| |
| |
| |
| |
| |
| Total assets | $ | | | | $ | | | | $ | | |
| | | | | |
| Liabilities and Stockholders’ Equity | | | | | |
| Accounts payable | $ | | | | $ | | | | $ | | |
| Accrued expenses | | | | | | | | |
| |
| |
| Total current liabilities | | | | | | | | |
| |
| |
| |
| |
| Total liabilities | | | | | | | | |
| |
| |
| |
| |
| Accumulated other comprehensive loss | () | | | | | | () | |
| Retained earnings | | | | () | | | | |
| Total stockholders’ equity | | | | () | | | | |
| Total liabilities and stockholders’ equity | $ | | | | $ | | | | $ | | |
| | $ | | | | $ | | | | Gross profit | | | | () | | | | |
| Selling, general and administrative expenses | | | | | | | | |
| Operating income | | | | () | | | | |
| |
| |
| |
| Other (expense) income, net | | | | () | | | () | |
| Total other, net | () | | | () | | | () | |
| Income before provision for income taxes | | | | () | | | | |
| Provision for income taxes | | | | () | | | | |
| Net income | $ | | | | $ | () | | | $ | | |
| | | | | |
| Basic earnings per share | $ | | | | $ | () | | | $ | | |
| |
| |
| Diluted earnings per common share | $ | | | | $ | () | | | $ | | |
| |
| | | | | | | | | | | | | | | | | |
| Condensed Consolidated Statement of Operations |
| December 31, 2022 |
| Year Ended |
| As Previously Reported | | Adjustments | | As Corrected |
| Cost of sales | $ | | | | $ | | | | $ | | |
| Gross profit | | | | () | | | | |
| Selling, general and administrative expenses | | | | | | | | |
| Operating income | | | | () | | | | |
| |
| |
| |
| Other (expense) income, net | () | | | () | | | () | |
| Total other, net | () | | | () | | | () | |
| Income before provision for income taxes | | | | () | | | | |
| Provision for income taxes | | | | () | | | | |
| Net income | $ | | | | $ | () | | | $ | | |
| | | | | |
| Basic earnings per share | $ | | | | $ | () | | | $ | | |
| |
| |
| Diluted earnings per common share | $ | | | | $ | () | | | $ | | |
| |
| | $ | | | | $ | | |
| Gross profit | | | | () | | | | |
| Selling, general and administrative expenses | | | | () | | | | |
| Operating income | | | | | | | | |
| |
| |
| |
| |
| |
| Income before provision for income taxes | | | | | | | | |
| Provision for income taxes | | | | | | | | |
| Net income | $ | | | | $ | | | | $ | | |
| | | | | |
| Basic earnings per share | $ | | | | $ | | | | $ | | |
| |
| |
| Diluted earnings per common share | $ | | | | $ | | | | $ | | |
| |
|
|
|
|
|
|
|
|
| | | | | |
| | | | | |
| | | | | |
| | | | | |
| | | | | |
|
|
|
|
| | | | | |
| | | | | |
|
| | | | | |
| | $ | | | | $ | | | | $ | | | | $ | | | | $ | | |
| Gross profit | | | | () | | | | | | | | | () | | | | |
| Selling, general and administrative expenses | | | | | | | | | | | | | | | | | |
Operating (loss) income | () | | | () | | | () | | | | | | () | | | | |
| | | | |
| | | | |
| | | | |
| | | | |
| | | | |
(Loss) income before provision for income taxes | () | | | () | | | () | | | | | | () | | | | |
| Provision for income taxes | () | | | () | | | () | | | | | | () | | | | |
Net (loss) income | $ | () | | | $ | () | | | $ | () | | | $ | | | | $ | () | | | $ | | |
| | | | | | | | | | | |
Basic (loss) earnings per share | $ | () | | | $ | () | | | $ | () | | | $ | | | | $ | () | | | $ | | |
| | | | |
| | | | |
Diluted (loss) earnings per common share | $ | () | | | $ | () | | | $ | () | | | $ | | | | $ | () | | | $ | | |
| | | | |
|
)
)
|
)
)
|
)
|
)
|
)
|
)
)
|
)
)| () | | | $ | | | | $ | | |
(1) Adjustments to retained earnings do not foot due to the previous adjustments made in third quarter 2023.
| | | | | | | | | | | | | | | | | |
| Condensed Consolidated Statement of Cash Flows |
| Fifty-Two Weeks Ended January 1, 2022 |
| As Previously Reported | | Adjustments | | As Corrected |
| Net income | $ | | | | $ | () | | | $ | | |
| Provision for deferred income taxes | | | | () | | | | |
| Net change in: | | | | | |
| Receivables, net | () | | | | | | () | |
| Inventories, net | () | | | () | | | () | |
| Accounts payable | | | | | | | | |
| Accrued expenses | | | | () | | | | |
| Net cash provided by operating activities | | | | () | | | | |
| Effect of exchange rate changes on cash | | | | () | | | | |
Net (decrease) increase in cash and cash equivalents | () | | | () | | | () | |
| Cash and cash equivalents, beginning of period | | | | () | | | | |
| Cash and cash equivalents, end of period | $ | | | | $ | () | | | $ | | |
| |
| | $ | () | | | $ | | |
| Provision for deferred income taxes | | | | | | | | |
| Net change in: | | | | | |
| Receivables, net | | | | () | | | | |
| Inventories, net | () | | | | | | () | |
| Accounts payable | | | | | | | | |
| Accrued expenses | () | | | () | | | () | |
| |
| Net cash provided by operating activities | | | | | | | | |
| |
| |
| Effect of exchange rate changes on cash | () | | | | | | () | |
| Net (decrease) increase in cash and cash equivalents | () | | | | | | () | |
| Cash and cash equivalents, beginning of period | | | | () | | | | |
Cash and cash equivalents, end of period | $ | | | | $ | | | | $ | | |
| | | | | | | | | | | | | | | | | |
| Condensed Consolidated Statement of Cash Flows |
| Sixteen Weeks Ended April 22, 2023 |
| As Previously Reported | | Adjustments | | As Corrected |
| Net income | $ | | | | $ | | | | $ | | |
Other, net | | | | | | | | |
| Net change in: | | | | | |
| Receivables, net | () | | | () | | | () | |
| Inventories, net | () | | | () | | | () | |
| Accounts payable | () | | | | | | () | |
| Accrued expenses | | | | | | | | |
| Other assets and liabilities, net | | | | () | | | () | |
Net cash used in operating activities | () | | | () | | | () | |
| Other, net | () | | | () | | | () | |
| Net cash used in financing activities | | | | () | | | | |
| Effect of exchange rate changes on cash | | | | () | | | | |
| Net (decrease) increase in cash and cash equivalents | () | | | () | | | () | |
Cash and cash equivalents, beginning of period | | | | | | | | |
| Cash and cash equivalents, end of period | $ | | | | $ | () | | | $ | | |
| | $ | () | | | $ | | | | Provision for deferred income taxes | | | | $ | | | | $ | | |
| Other, net | | | | $ | | | | $ | | |
| Net change in: | | | | | |
| Receivables, net | () | | | () | | | () | |
| Inventories, net | () | | | () | | | () | |
| Accounts payable | () | | | | | | () | |
| Accrued expenses | | | | () | | | | |
| Other assets and liabilities, net | () | | | () | | | () | |
Net cash used in operating activities | () | | | () | | | () | |
| Other, net | () | | | () | | | () | |
| Net cash used in financing activities | | | | () | | | | |
| Effect of exchange rate changes on cash | | | | () | | | | |
| Net (decrease) increase in cash and cash equivalents | | | | () | | | | |
| Cash and cash equivalents, beginning of period | | | | | | | | |
| Cash and cash equivalents, end of period | $ | | | | $ | () | | | $ | | |
| | | | | | | | | | | | | | | | | |
| Condensed Consolidated Statement of Cash Flows |
| Forty Weeks Ended October 7, 2023 |
| As Previously Reported | | Adjustments | | As Corrected |
| Net income | $ | | | | $ | () | | | $ | | |
| Provision for deferred income taxes | () | | | | | | () | |
| Other, net | | | | | | | | |
| Net change in: | | | | | |
| Receivables, net | () | | | () | | | () | |
| Inventories, net | () | | | | | | () | |
| Accounts payable | () | | | | | | () | |
| Accrued expenses | | | | | | | | |
| Other Assets and Liabilities | () | | | () | | | () | |
| Net cash provided by operating activities | | | | () | | | | |
| Other, net | () | | | () | | | () | |
| Net cash used in financing activities | | | | () | | | | |
| Effect of exchange rate changes on cash | () | | | | | | () | |
| Net (decrease) increase in cash and cash equivalents | | | | () | | | | |
| Cash and cash equivalents, beginning of period | | | | | | | | |
| Cash and cash equivalents, end of period | $ | | | | $ | () | | | $ | | |
| | $ | | | | $ | () | | | $ | | | | December 31, 2022 | | $ | | | | $ | | | | $ | () | | | $ | | |
| December 30, 2023 | | $ | | | | $ | | | | $ | () | | | $ | | |
(1)Accounts written off during the period. These amounts did not impact our Statements of Operations for any year presented.
Other valuation and qualifying accounts have not been reported in this schedule because they are either not applicable or because the information has been included elsewhere in this report.
EXHIBIT INDEX
| | | | | | | | | | | | | | | | | |
| | | Incorporated by Reference | Filed |
| Exhibit No. | Exhibit Description | Form | Exhibit | Filing Date | Herewith |
| | 10-Q | 3.1 | | 8/14/2018 | |
| | 8-K | 3.1 | | 8/14/2023 | |
| | 10-K | 4.0 | | 2/18/2020 | |
| | 8-K | 4.1 | | 4/29/2010 | |
| | 8-K | 10.45 | | 6/3/2011 | |
| | 8-K | 4.4 | | 1/17/2012 | |
| | 8-K | 4.5 | | 12/21/2012 | |
| | 8-K | 4.6 | | 4/19/2013 | |
| | 8-K | 4.7 | | 12/9/2013 | |
| | 10-Q | 4.11 | | 5/28/2014 | |
| | 8-K | 4.1 | | 4/17/2020 | |
| | 8-K | 4.6 | | 9/30/2020 | |
| Ninth Supplemental Indenture, dated as of March 4, 2022, among Advance Auto Parts, Inc., Advance Stores Company, Incorporated and Computershare Trust Company, N.A., as successor to Wells Fargo, National Association, as Trustee. | 8-K | 4.1 | | 3/4/2022 | |
| Tenth Supplemental Indenture, dated as of March 9, 2023, among Advance Auto Parts, Inc., Advance Stores Company, Incorporated and Computershare Trust Company, N.A., as successor to Wells Fargo Bank, National Association, as Trustee. | 8-K | 4.1 | | 3/9/2023 | |
| | 8-K | 4.1 | | 3/9/2023 | |
| | 8-K | 4.6 | | 9/30/2020 | |
| | 8-K | 4.1 | | 3/9/2023 | |
| | 8-K | 4.1 | | 4/17/2020 | |
| | | | | | | | | | | | | | | | | |
| | | Incorporated by Reference | Filed |
| Exhibit No. | Exhibit Description | Form | Exhibit | Filing Date | Herewith |
| | 8-K | 4.1 | | 3/4/2022 | |
| | 8-K | 10.19 | | 5/20/2004 | |
| | 10-K | 10.17 | | 3/1/2011 | |
| | 10-K | 10.52 | | 3/3/2015 | |
| | 10-K | 10.54 | | 3/3/2015 | |
| | 10-K | 10.55 | | 2/28/2017 | |
|
| 10-K | 10.56 | | 2/28/2017 | |
| | 10-K | 10.58 | | 2/21/2018 | |
| | | | | X |
| | 10-K | 10.57 | | 2/9/2019 | |
| | 10-Q | 10.1 | | 6/2/2021 | |
| | 10-Q | 10.2 | | 6/2/2021 | |
| | 10-Q | 10.3 | | 6/2/2021 | |
| | 10-Q | 10.2 | | 5/24/2022 | |
| | 10-Q | 10.3 | | 5/24/2022 | |
| | 10-Q | 10.4 | | 5/24/2022 | |
| | 10-Q | 10.3 | | 6/6/2023 | |
| | 10-Q | 10.4 | | 6/6/2023 | |
| | 10-Q | 10.5 | | 6/6/2023 | |
| | | | | | | | | | | | | | | | | |
| | | Incorporated by Reference | Filed |
| Exhibit No. | Exhibit Description | Form | Exhibit | Filing Date | Herewith |
| | 10-Q | 10.1 | | 6/6/2023 | |
| | 10-Q | 10.6 | | 6/6/2023 | |
| | 10-Q | 10.7 | | 6/6/2023 | |
| | 10-Q | 10.8 | | 6/6/2023 | |
| | 10-K | 10.45 | | 2/22/2021 | |
| | | | | X |
| | 10-Q | 10.1 | | 5/31/2016 | |
| | 10-Q | 10.2 | | 5/31/2016 | |
| | 10-K | 10.50 | | 2/28/2017 | |
| | 10-Q | 10.9 | | 6/6/2023 | |
| | 10-Q | 10.1 | | 11/13/2018 | |
| | 10-K | 10.53 | | 2/9/2019 | |
| | | | | X |
| | 8-K | 10.01 | | 8/23/2023 | |
| | 8-K | 10.01 | | 11/15/2023 | |
| | 8-K | 10.1 | | 11/15/2021 | |
| | 8-K | 10.2 | | 11/15/2021 | |
| | 10-K | 10.29 | 02/28/2023 |
|
| | 10-Q | 10.1 | | 8/23/2023 | |
| | 10-Q | 10.5 | | 11/21/2023 | |
| | | | | X |
| | 8-K | 10.1 | | 2/28/2024 | |
| | | | | X |
| | | | | X |
| | | | | X |
| | | | | | | | | | | | | | | | | |
| | | Incorporated by Reference | Filed |
| Exhibit No. | Exhibit Description | Form | Exhibit | Filing Date | Herewith |
| | | | | X |
| | | | | X |
| | | | | X |
| 101.INS | XBRL Instance Document. | | | | X |
| 101.SCH | XBRL Taxonomy Extension Schema Document. | | | | X |
| 101.CAL | XBRL Taxonomy Extension Calculation Linkbase Document. | | | | X |
| 101.DEF | XBRL Taxonomy Extension Definition Linkbase Document. | | | | X |
| 101.LAB | XBRL Taxonomy Extension Labels Linkbase Document. | | | | X |
| 101.PRE | XBRL Taxonomy Extension Presentation Linkbase Document. | | | | X |
| 104.1 | Cover Page Interactive Data File (Embedded within the Inline XBRL document and included in Exhibit). | | | | X |
Item 16. Form 10-K Summary.
None.
Signatures
Pursuant to the requirements of Section 13 or 15(d) of the Securities Exchange Act of 1934, the registrant has duly caused this report to be signed on its behalf by the undersigned, thereunto duly authorized.
| | | | | | | | | | | | | | |
| | ADVANCE AUTO PARTS, INC. |
| Dated: | March 12, 2024 | | By: | /s/ Ryan P. Grimsland |
| | | | Ryan P. Grimsland |
| | | | Executive Vice President, Chief Financial Officer |
Pursuant to the requirements of the Securities Exchange Act of 1934, this report has been signed below by the following persons on behalf of the registrant and in the capacities and on the dates indicated.
| | | | | | | | | | | | | | |
| Signature | | Title | | Date |
| | | | |
| /s/ Shane M. O’Kelly | | President and Chief Executive Officer and Director | | March 12, 2024 |
| Shane M. O’Kelly | | (Principal Executive Officer) | | |
| | | | |
| /s/ Ryan P. Grimsland | | Executive Vice President, Chief Financial Officer | | March 12, 2024 |
| Ryan P. Grimsland | | (Principal Financial Officer) | | |
| | | | |
/s/ Elizabeth E. Dreyer | | Senior Vice President, Controller and Chief Accounting Officer | | March 12, 2024 |
Elizabeth E. Dreyer | | (Principal Accounting Officer) | | |
| | | | |
| /s/ Eugene I. Lee, Jr. | | Chairman and Director | | March 12, 2024 |
| Eugene I. Lee, Jr. | | | | |
| | | | |
| /s/ Carla J. Bailo | | Director | | March 12, 2024 |
| Carla J. Bailo | | | | |
| | | | |
| /s/ John F. Ferraro | | Director | | March 12, 2024 |
| John F. Ferraro | | | | |
| | | | |
| /s/ Joan M. Hilson | | Director | | March 12, 2024 |
| Joan M. Hilson | | | | |
| | | | |
| /s/ Jeffrey J. Jones II | | Director | | March 12, 2024 |
| Jeffrey J. Jones II | | | | |
| | | | |
| /s/ Douglas A. Pertz | | Director | | March 12, 2024 |
| Douglas A. Pertz | | | | |
| | | | |
| | Director | | March 12, 2024 |
Gregory L. Smith | | | | |
| | | | |
| | Director | | March 12, 2024 |
Thomas W. Seboldt | | | | |
| | | | |
| /s/ Sherice R. Torres | | Director | | March 12, 2024 |
| Sherice R. Torres | | | | |
| | | | |
| /s/ Arthur L. Valdez Jr. | | Director | | March 12, 2024 |
| Arthur L. Valdez Jr. | | | | |
| | | | |
| | Director | | March 12, 2024 |
| A. Brent Windom | | | | |
| | | | |

Similar companies
See also O REILLY AUTOMOTIVE INC -
Annual report 2022 (10-K 2022-12-31)
Annual report 2023 (10-Q 2023-09-30)
See also AUTOZONE INC -
Annual report 2023 (10-K 2023-08-26)
Annual report 2023 (10-Q 2023-05-06)
See also MARINEMAX INC -
Annual report 2022 (10-K 2022-09-30)
Annual report 2023 (10-Q 2023-06-30)
See also OneWater Marine Inc. -
Annual report 2022 (10-K 2022-09-30)
Annual report 2023 (10-Q 2023-06-30)
See also CarParts.com, Inc. -
Annual report 2022 (10-K 2022-12-31)
Annual report 2023 (10-Q 2023-09-30)