AUTOMATIC DATA PROCESSING INC - Quarter Report: 2019 December (Form 10-Q)
UNITED STATES
SECURITIES AND EXCHANGE COMMISSION
Washington, D.C. 20549
______________
FORM 10-Q
______________
☒ | QUARTERLY REPORT PURSUANT TO SECTION 13 OR 15(d) OF THE SECURITIES EXCHANGE ACT OF 1934 | |||
For the Quarterly Period Ended December 31, 2019
OR
☐ | TRANSITION REPORT PURSUANT TO SECTION 13 OR 15(d) OF THE SECURITIES EXCHANGE ACT OF 1934 | |||
For the Transition Period From to
Commission File Number 1-5397
__________________________
AUTOMATIC DATA PROCESSING, INC.
(Exact name of registrant as specified in its charter)
__________________________
Delaware | 22-1467904 | |
(State or other jurisdiction of incorporation or organization) | (IRS Employer Identification No.) | |
One ADP Boulevard | ||
Roseland, | NJ | 07068 |
(Address of principal executive offices) | (Zip Code) | |
Registrant's telephone number, including area code: (973) 974-5000
__________________________
Securities registered pursuant to Section 12(b) of the Act: | ||
Title of each class | Trading Symbol(s) | Name of each exchange on which registered |
Common Stock, $0.10 Par Value (voting) | ADP | NASDAQ Global Select Market |
Indicate by check mark whether the registrant: (1) has filed all reports required to be filed by Section 13 or 15(d) of the Securities Exchange Act of 1934 during the preceding 12 months (or for such shorter period that the registrant was required to file such reports), and (2) has been subject to such filing requirements for the past 90 days. Yes ý No o
Indicate by check mark whether the registrant has submitted electronically every Interactive Data File required to be submitted pursuant to Rule 405 of Regulation S-T (§232.405 of this chapter) during the preceding 12 months (or for such shorter period that the registrant was required to submit such files). Yes ý No o
Indicate by check mark whether the registrant is a large accelerated filer, an accelerated filer, a non-accelerated filer, a smaller reporting company, or an emerging growth company. See the definitions of “large accelerated filer,” “accelerated filer,” “smaller reporting company,” and "emerging growth company" in Rule 12b-2 of the Exchange Act.
Large Accelerated Filer | ☒ | Accelerated filer | ☐ |
Non-accelerated filer | ☐ | Smaller reporting company | ☐ |
Emerging growth company | ☐ | ||
If an emerging growth company, indicate by check mark if the registrant has elected not to use the extended transition period for complying with any new or revised financial accounting standards provided pursuant to Section 13(a) of the Exchange Act. o
Indicate by check mark whether the registrant is a shell company (as defined in Rule 12b-2 of the Exchange Act). | Yes | ☐ | No | ☒ |
The number of shares outstanding of the registrant’s common stock as of January 28, 2020 was 431,754,252.
Table of Contents
Page | ||
Item 3. | ||
Item 4. | ||
2
Part I. FINANCIAL INFORMATION
Item 1. Financial Statements
Automatic Data Processing, Inc. and Subsidiaries
Statements of Consolidated Earnings
(In millions, except per share amounts)
(Unaudited)
Three Months Ended | Six Months Ended | ||||||||||||||
December 31, | December 31, | ||||||||||||||
2019 | 2018 | 2019 | 2018 | ||||||||||||
REVENUES: | |||||||||||||||
Revenues, other than interest on funds held for clients and PEO revenues | $ | 2,398.4 | $ | 2,319.8 | $ | 4,704.7 | $ | 4,537.8 | |||||||
Interest on funds held for clients | 137.7 | 129.1 | 271.5 | 247.6 | |||||||||||
PEO revenues (A) | 1,133.4 | 1,043.5 | 2,189.0 | 2,017.3 | |||||||||||
TOTAL REVENUES | 3,669.5 | 3,492.4 | 7,165.2 | 6,802.7 | |||||||||||
EXPENSES: | |||||||||||||||
Costs of revenues: | |||||||||||||||
Operating expenses | 1,836.0 | 1,772.4 | 3,623.6 | 3,469.5 | |||||||||||
Systems development and programming costs | 168.7 | 156.1 | 336.9 | 314.1 | |||||||||||
Depreciation and amortization | 89.4 | 71.7 | 178.3 | 144.3 | |||||||||||
TOTAL COSTS OF REVENUES | 2,094.1 | 2,000.2 | 4,138.8 | 3,927.9 | |||||||||||
Selling, general, and administrative expenses | 754.3 | 745.2 | 1,480.9 | 1,459.0 | |||||||||||
Interest expense | 31.6 | 38.6 | 71.5 | 74.5 | |||||||||||
TOTAL EXPENSES | 2,880.0 | 2,784.0 | 5,691.2 | 5,461.4 | |||||||||||
Other income, net | (46.0 | ) | (32.6 | ) | (100.6 | ) | (46.5 | ) | |||||||
EARNINGS BEFORE INCOME TAXES | 835.5 | 741.0 | 1,574.6 | 1,387.8 | |||||||||||
Provision for income taxes | 183.9 | 182.8 | 340.6 | 324.2 | |||||||||||
NET EARNINGS | $ | 651.6 | $ | 558.2 | $ | 1,234.0 | $ | 1,063.6 | |||||||
BASIC EARNINGS PER SHARE | $ | 1.51 | $ | 1.28 | $ | 2.86 | $ | 2.44 | |||||||
DILUTED EARNINGS PER SHARE | $ | 1.50 | $ | 1.27 | $ | 2.84 | $ | 2.42 | |||||||
Basic weighted average shares outstanding | 431.5 | 435.7 | 432.1 | 436.2 | |||||||||||
Diluted weighted average shares outstanding | 433.3 | 438.0 | 434.3 | 438.9 | |||||||||||
(A) Professional Employer Organization (“PEO”) revenues are net of direct pass-through costs, primarily consisting of payroll wages and payroll taxes of $12,371.6 million and $11,751.1 million for the three months ended December 31, 2019 and 2018, respectively, and $22,882.2 million and $21,380.5 million for the six months ended December 31, 2019 and 2018, respectively.
See notes to the Consolidated Financial Statements.
3
Automatic Data Processing, Inc. and Subsidiaries
Statements of Consolidated Comprehensive Income
(In millions)
(Unaudited)
Three Months Ended | Six Months Ended | ||||||||||||||
December 31, | December 31, | ||||||||||||||
2019 | 2018 | 2019 | 2018 | ||||||||||||
Net earnings | $ | 651.6 | $ | 558.2 | $ | 1,234.0 | $ | 1,063.6 | |||||||
Other comprehensive income/(loss): | |||||||||||||||
Currency translation adjustments | 34.3 | (24.7 | ) | (14.6 | ) | (47.6 | ) | ||||||||
Unrealized net gains/(losses) on available-for-sale securities | (35.5 | ) | 168.3 | 60.6 | 118.0 | ||||||||||
Tax effect | 7.5 | (38.8 | ) | (13.3 | ) | (26.6 | ) | ||||||||
Reclassification of net (gain)/losses on available-for-sale securities to net earnings | (7.1 | ) | 0.5 | (9.4 | ) | 1.4 | |||||||||
Tax effect | 1.6 | (0.1 | ) | 2.1 | (0.3 | ) | |||||||||
Reclassification of pension liability adjustment to net earnings | 1.9 | 26.2 | 0.2 | 26.3 | |||||||||||
Tax effect | (0.5 | ) | (6.3 | ) | — | (6.4 | ) | ||||||||
Other | 0.7 | — | 0.7 | — | |||||||||||
Tax effect | (0.2 | ) | — | (0.2 | ) | — | |||||||||
Other comprehensive income, net of tax | 2.7 | 125.1 | 26.1 | 64.8 | |||||||||||
Comprehensive income | $ | 654.3 | $ | 683.3 | $ | 1,260.1 | $ | 1,128.4 | |||||||
See notes to the Consolidated Financial Statements.
4
Automatic Data Processing, Inc. and Subsidiaries
Consolidated Balance Sheets
(In millions, except per share amounts)
(Unaudited)
December 31, | June 30, | |||||||
2019 | 2019 | |||||||
Assets | ||||||||
Current assets: | ||||||||
Cash and cash equivalents | $ | 1,500.4 | $ | 1,949.2 | ||||
Short-term marketable securities | 7.2 | 10.5 | ||||||
Accounts receivable, net of allowance for doubtful accounts of $53.1 and $54.9, respectively | 2,587.9 | 2,439.3 | ||||||
Other current assets | 660.9 | 509.1 | ||||||
Total current assets before funds held for clients | 4,756.4 | 4,908.1 | ||||||
Funds held for clients | 36,608.6 | 29,434.2 | ||||||
Total current assets | 41,365.0 | 34,342.3 | ||||||
Long-term receivables, net of allowance for doubtful accounts of $0.5 and $0.4, respectively | 21.6 | 23.8 | ||||||
Property, plant and equipment, net | 761.3 | 764.2 | ||||||
Operating lease right-of-use asset | 500.2 | — | ||||||
Deferred contract costs | 2,397.3 | 2,428.5 | ||||||
Other assets | 596.6 | 934.4 | ||||||
Goodwill | 2,314.9 | 2,323.0 | ||||||
Intangible assets, net | 1,102.5 | 1,071.5 | ||||||
Total assets | $ | 49,059.4 | $ | 41,887.7 | ||||
Liabilities and Stockholders' Equity | ||||||||
Current liabilities: | ||||||||
Accounts payable | $ | 132.9 | $ | 125.5 | ||||
Accrued expenses and other current liabilities | 2,051.5 | 1,759.0 | ||||||
Accrued payroll and payroll-related expenses | 428.7 | 721.1 | ||||||
Dividends payable | 389.3 | 340.1 | ||||||
Short-term deferred revenues | 210.4 | 220.7 | ||||||
Obligations under reverse repurchase agreements (A) | — | 262.0 | ||||||
Short-term debt | 1,001.6 | — | ||||||
Income taxes payable | 38.1 | 54.8 | ||||||
Total current liabilities before client funds obligations | 4,252.5 | 3,483.2 | ||||||
Client funds obligations | 36,269.9 | 29,144.5 | ||||||
Total current liabilities | 40,522.4 | 32,627.7 | ||||||
Long-term debt | 1,003.0 | 2,002.2 | ||||||
Operating lease liabilities | 360.2 | — | ||||||
Other liabilities | 726.0 | 798.7 | ||||||
Deferred income taxes | 702.4 | 659.9 | ||||||
Long-term deferred revenues | 381.0 | 399.3 | ||||||
Total liabilities | 43,695.0 | 36,487.8 | ||||||
Commitments and contingencies (Note 13) | ||||||||
Stockholders' equity: | ||||||||
Preferred stock, $1.00 par value: authorized, 0.3 shares; issued, none | — | — | ||||||
Common stock, $0.10 par value: authorized, 1,000.0 shares; issued, 638.7 shares at December 31, 2019 and June 30, 2019; outstanding, 431.8 and 434.2 shares at December 31, 2019 and June 30, 2019, respectively | 63.9 | 63.9 | ||||||
Capital in excess of par value | 1,253.7 | 1,183.2 | ||||||
Retained earnings | 17,987.6 | 17,500.6 | ||||||
Treasury stock - at cost: 206.9 and 204.5 shares at December 31, 2019 and June 30, 2019, respectively | (13,709.6 | ) | (13,090.5 | ) | ||||
Accumulated other comprehensive loss | (231.2 | ) | (257.3 | ) | ||||
Total stockholders’ equity | 5,364.4 | 5,399.9 | ||||||
Total liabilities and stockholders’ equity | $ | 49,059.4 | $ | 41,887.7 | ||||
(A) As of June 30, 2019, $261.4 million of long-term marketable securities and $0.6 million of cash and cash equivalents have been pledged as collateral under the Company's reverse repurchase agreements. Refer to Note 9.
See notes to the Consolidated Financial Statements.
5
Automatic Data Processing, Inc. and Subsidiaries
Statements of Consolidated Cash Flows
(In millions)
(Unaudited)
Six Months Ended | ||||||||
December 31, | ||||||||
2019 | 2018 | |||||||
Cash Flows from Operating Activities: | ||||||||
Net earnings | $ | 1,234.0 | $ | 1,063.6 | ||||
Adjustments to reconcile net earnings to cash flows provided by operating activities: | ||||||||
Depreciation and amortization | 234.9 | 196.5 | ||||||
Amortization of deferred contract costs | 456.0 | 434.6 | ||||||
Deferred income taxes | 44.1 | 33.0 | ||||||
Stock-based compensation expense | 73.3 | 77.0 | ||||||
Net pension expense | (0.4 | ) | 31.5 | |||||
Net amortization of premiums and accretion of discounts on available-for-sale securities | 26.3 | 27.4 | ||||||
Impairment of intangible assets | — | 12.1 | ||||||
Gain on sale of assets | (2.1 | ) | (4.1 | ) | ||||
Other | 6.5 | 18.1 | ||||||
Changes in operating assets and liabilities, net of effects from acquisitions: | ||||||||
Increase in accounts receivable | (198.8 | ) | (670.0 | ) | ||||
Increase in other assets | (605.4 | ) | (594.4 | ) | ||||
Increase in accounts payable | 12.3 | 19.0 | ||||||
(Decrease) / increase in accrued expenses and other liabilities | (149.8 | ) | 287.2 | |||||
Net cash flows provided by operating activities | 1,130.9 | 931.5 | ||||||
Cash Flows from Investing Activities: | ||||||||
Purchases of corporate and client funds marketable securities | (2,875.3 | ) | (1,300.8 | ) | ||||
Proceeds from the sales and maturities of corporate and client funds marketable securities | 2,995.2 | 1,163.4 | ||||||
Capital expenditures | (100.7 | ) | (80.0 | ) | ||||
Additions to intangibles | (167.7 | ) | (139.3 | ) | ||||
Acquisitions of businesses, net of cash acquired | — | (120.4 | ) | |||||
Proceeds from the sale of property, plant, and equipment and other assets | 23.6 | 7.9 | ||||||
Net cash flows used in investing activities | (124.9 | ) | (469.2 | ) | ||||
Cash Flows from Financing Activities: | ||||||||
Net increase / (decrease) in client funds obligations | 7,093.7 | (1,567.1 | ) | |||||
Payments of debt | (1.1 | ) | (1.1 | ) | ||||
Repurchases of common stock | (615.1 | ) | (526.6 | ) | ||||
Net proceeds from stock purchase plan and stock-based compensation plans | (4.4 | ) | 5.5 | |||||
Dividends paid | (686.0 | ) | (605.0 | ) | ||||
Net payments of reverse repurchase agreements | (262.0 | ) | — | |||||
Net proceeds from commercial paper borrowings | — | 1,206.0 | ||||||
Net cash flows provided by / (used in) financing activities | 5,525.1 | (1,488.3 | ) | |||||
Effect of exchange rate changes on cash, cash equivalents, restricted cash, and restricted cash equivalents | (12.2 | ) | (32.1 | ) | ||||
Net change in cash, cash equivalents, restricted cash, and restricted cash equivalents | 6,518.9 | (1,058.1 | ) | |||||
Cash, cash equivalents, restricted cash, and restricted cash equivalents, beginning of period | 6,796.2 | 6,542.1 | ||||||
Cash, cash equivalents, restricted cash, and restricted cash equivalents, end of period | $ | 13,315.1 | $ | 5,484.0 | ||||
Reconciliation of cash, cash equivalents, restricted cash, and restricted cash equivalents to the Consolidated Balance Sheets | ||||||||
Cash and cash equivalents | $ | 1,500.4 | $ | 2,785.6 | ||||
Restricted cash and restricted cash equivalents included in funds held for clients (A) | 11,814.7 | 2,698.4 | ||||||
Total cash, cash equivalents, restricted cash, and restricted cash equivalents | $ | 13,315.1 | $ | 5,484.0 | ||||
Supplemental disclosures of cash flow information: | ||||||||
Cash paid for interest | $ | 70.6 | $ | 73.3 | ||||
Cash paid for income taxes, net of income tax refunds | $ | 350.4 | $ | 280.3 | ||||
(A) See Note 6 for a reconciliation of restricted cash and restricted cash equivalents in funds held for clients on the Consolidated Balance Sheets.
See notes to the Consolidated Financial Statements.
6
Automatic Data Processing, Inc. and Subsidiaries
Notes to the Consolidated Financial Statements
(Tabular dollars in millions, except per share amounts or where otherwise stated)
(Unaudited)
Note 1. Basis of Presentation
The accompanying Consolidated Financial Statements and footnotes thereto of Automatic Data Processing, Inc., its subsidiaries and variable interest entity (“ADP” or the “Company”) have been prepared in accordance with accounting principles generally accepted in the United States of America (“U.S. GAAP”). The Consolidated Financial Statements and footnotes thereto are unaudited. In the opinion of the Company’s management, the Consolidated Financial Statements reflect all adjustments, which are of a normal recurring nature, that are necessary for a fair presentation of the Company’s interim financial results.
The Company has a grantor trust, which holds the majority of the funds provided by its clients pending remittance to employees of those clients, tax authorities, and other payees. The Company is the sole beneficial owner of the trust. The trust meets the criteria in Accounting Standards Codification (“ASC”) 810, “Consolidation” to be characterized as a variable interest entity (“VIE”). The Company has determined that it has a controlling financial interest in the trust because it has both (1) the power to direct the activities that most significantly impact the economic performance of the trust (including the power to make all investment decisions for the trust) and (2) the right to receive benefits that could potentially be significant to the trust (in the form of investment returns) and, therefore, consolidates the trust. Further information on these funds and the Company’s obligations to remit to its clients’ employees, tax authorities, and other payees is provided in Note 6, “Corporate Investments and Funds Held for Clients.”
The preparation of financial statements in conformity with U.S. GAAP requires management to make estimates and assumptions that affect the assets, liabilities, revenue, expenses, and accumulated other comprehensive income that are reported in the Consolidated Financial Statements and footnotes thereto. Actual results may differ from those estimates. Interim financial results are not necessarily indicative of financial results for a full year. The information included in this Quarterly Report on Form 10-Q should be read in conjunction with the Company’s Annual Report on Form 10-K for the fiscal year ended June 30, 2019 (“fiscal 2019”).
Revision of Previously Reported Financial Information
The Company has historically classified certain fees collected from worksite employers for certain benefits within PEO revenues, and the associated costs of these benefits have historically been classified within operating expenses as PEO zero-margin benefits pass-through costs in the Company's Statements of Consolidated Earnings. During the quarter ended September 30, 2019, management determined that the Company does not retain risk and is acting as the agent, rather than as the primary obligor, for a portion of the fees collected for worksite employee benefits and the worksite employer is primarily responsible for fulfilling certain aspects of the service and has discretion in establishing price. Accordingly, the accompanying Statements of Consolidated Earnings for the three and six months ended December 31, 2018 have been revised to correct the amounts previously reported on a gross basis to a net basis by reducing PEO revenues and operating expenses for associated costs of an equal amount, as follows:
Three Months Ended | ||||||||||
December 31, 2018 | ||||||||||
As reported | Revision | As revised | ||||||||
PEO revenues | $ | 1,057.0 | (13.5 | ) | $ | 1,043.5 | ||||
TOTAL REVENUES | 3,505.9 | (13.5 | ) | 3,492.4 | ||||||
Operating expenses | 1,785.9 | (13.5 | ) | 1,772.4 | ||||||
Total Expenses | 2,797.5 | (13.5 | ) | 2,784.0 | ||||||
EARNINGS BEFORE INCOME TAXES | 741.0 | — | 741.0 | |||||||
Provision for income taxes | 182.8 | — | 182.8 | |||||||
NET EARNINGS | $ | 558.2 | — | $ | 558.2 | |||||
7
Six Months Ended | ||||||||||
December 31, 2018 | ||||||||||
As reported | Revision | As revised | ||||||||
PEO revenues | $ | 2,043.7 | (26.4 | ) | $ | 2,017.3 | ||||
TOTAL REVENUES | 6,829.1 | (26.4 | ) | 6,802.7 | ||||||
Operating expenses | 3,495.9 | (26.4 | ) | 3,469.5 | ||||||
Total Expenses | 5,487.8 | (26.4 | ) | 5,461.4 | ||||||
EARNINGS BEFORE INCOME TAXES | 1,387.8 | — | 1,387.8 | |||||||
Provision for income taxes | 324.2 | — | 324.2 | |||||||
NET EARNINGS | $ | 1,063.6 | — | $ | 1063.6 | |||||
The correction of these previously reported amounts had no impact on the Company's earnings before income taxes, net earnings, consolidated financial condition or cash flows. In addition, corresponding revisions have been made elsewhere in the Company's consolidated footnote disclosures, where applicable, including its Interim Financial Data by Segment disclosure.
Note 2. New Accounting Pronouncements
Recently Adopted Accounting Pronouncements
Effective July 1, 2019, the Company adopted accounting standard update (“ASU”) 2016-02, “Leases (ASC 842)” under the optional transition method. As a result, the Company recorded on the Consolidated Balance Sheets total operating lease right-of-use (“ROU”) assets of $573.3 million and total operating lease liabilities of $522.6 million, as of the adoption date. The adoption did not have an impact on our Statements of Consolidated Earnings or Statements of Consolidated Cash Flows. Refer to Note 7 for further details.
8
Recently Issued Accounting Pronouncements
The following table summarizes recent ASU's issued by the Financial Accounting Standards Board (“FASB”) which have been assessed:
Standard | Description | Effective Date | Effect on Financial Statements or Other Significant Matters |
ASU 2018-14 Compensation-Retirement Benefits-Defined Benefit Plans | This update modifies the disclosure requirements for employers that sponsor defined benefit pension or other post-retirement plans by removing and adding certain disclosures for these plans. The eliminated disclosures include (a) the amounts in accumulated other comprehensive income expected to be recognized in net periodic benefit costs over the next fiscal year, and (b) the effects of a one percentage point change in assumed health care cost trend rates on the net periodic benefit costs and the benefit obligation for post-retirement health care benefits. Additional disclosures include descriptions of significant gains and losses affecting the benefit obligation for the period. The amendments in ASU 2018-14 would need to be applied on a retrospective basis. | July 1, 2021 (Fiscal 2022) | The adoption of this guidance will modify disclosures but will not have an impact on the Company's consolidated results of operations, financial condition, or cash flows. |
ASU 2018-13 Fair Value Measurement | This update modifies the disclosure requirements on fair value measurements. Certain disclosures in ASU 2018-13 would need to be applied on a retrospective basis and others on a prospective basis. | July 1, 2020 (Fiscal 2021) | The adoption of this guidance will modify disclosures but will not have an impact on the Company's consolidated results of operations, financial condition, or cash flows. |
ASU 2016-13 Financial Instruments - Credit Losses (Topic 326): Measurement of Credit Losses on Financial Instruments | This update introduces the current expected credit loss (CECL) model, which will require an entity to measure credit losses for certain financial instruments and financial assets, including trade receivables. Under this update, on initial recognition and at each reporting period, an entity will be required to recognize an allowance that reflects the entity’s current estimate of credit losses expected to be incurred over the life of the financial instrument. In addition, this update modifies the impairment model for available-for-sale debt securities and provides for a simplified accounting model for purchased financial assets with credit deterioration since their origination. In November 2019, the FASB issued Accounting Standard Update 2019-11 Codification Improvements to Topic 326, Financial-Credit Losses which provides clarification and eliminates inconsistencies to amendments included in Update 2016-13. | July 1, 2020 (Fiscal 2021) | The adoption of this guidance will not have a material impact on its consolidated results of operations, financial condition, or cash flows. |
Note 3. Revenue
Based upon similar operational and economic characteristics, the Company’s revenues are disaggregated by its three strategic pillars: Human Capital Management (“HCM”), HR Outsourcing (“HRO”), and Global (“Global”) Solutions, with separate disaggregation for PEO zero-margin benefits pass-through revenues and client fund interest revenues. The Company believes these revenue categories depict how the nature, amount, timing, and uncertainty of its revenue and cash flows are affected by economic factors.
9
HCM provides a suite of product offerings that assist employers of all types and sizes in all stages of the employment cycle, from recruitment to retirement. Global is generally consistent with the types of services provided within HCM but represents geographies outside of the United States and includes our multinational offerings. HCM and Global revenues are primarily attributable to fees for providing solutions for payroll, benefits, talent, retirement services and HR processing and fees charged to implement the Company's solutions for clients.
HRO provides a comprehensive human resources outsourcing solution, including offering benefits, providing workers’ compensation insurance, and administering state unemployment insurance, among other human resources functions. This revenue is primarily driven by the PEO. Amounts collected from PEO worksite employers include payroll, fees for benefits, and an administrative fee that also includes payroll taxes, fees for workers’ compensation and state unemployment taxes. The payroll and payroll taxes collected from the worksite employers are presented in revenue net, as the Company does not retain risk and acts as an agent with respect to this aspect of the PEO arrangement. With respect to the payroll and payroll taxes, the worksite employer is primarily responsible for providing the service and has discretion in establishing wages. The fees collected from the worksite employers for benefits (i.e., PEO benefits pass-throughs), workers’ compensation and state unemployment taxes are presented in revenues and the associated costs of benefits, workers’ compensation and state unemployment taxes are included in operating expenses, as the Company acts as a principal with respect to this aspect of the arrangement. With respect to these fees, the Company is primarily responsible for fulfilling the service and has discretion in establishing price. The Company has further disaggregated HRO to separate out its PEO zero-margin benefits pass-through revenues.
The Company recognizes client fund interest revenues on collected but not yet remitted funds held for clients in revenues as earned, as the collection, holding and remittance of these funds are critical components of providing these services.
The following tables provide details of revenue by our strategic pillars with disaggregation for PEO zero-margin benefits pass-throughs and client fund interest, and include a reconciliation to the Company’s reportable segments:
Three Months Ended | Six Months Ended | ||||||||||||||
December 31, | December 31, | ||||||||||||||
Types of Revenues | 2019 | 2018 | 2019 | 2018 | |||||||||||
HCM | $ | 1,647.9 | $ | 1,599.4 | $ | 3,216.5 | $ | 3,114.7 | |||||||
HRO, excluding PEO zero-margin benefits pass-throughs | 650.1 | 614.2 | 1,241.2 | 1,176.7 | |||||||||||
PEO zero-margin benefits pass-throughs | 722.4 | 659.7 | 1,421.5 | 1,300.2 | |||||||||||
Global | 511.4 | 490.0 | 1,014.5 | 963.5 | |||||||||||
Interest on funds held for clients | 137.7 | 129.1 | 271.5 | 247.6 | |||||||||||
Total Revenues | $ | 3,669.5 | $ | 3,492.4 | $ | 7,165.2 | $ | 6,802.7 | |||||||
Reconciliation of disaggregated revenue to our reportable segments for the three months ended December 31, 2019:
Types of Revenues | Employer Services | PEO | Other | Total | |||||||||||
HCM | $ | 1,649.8 | $ | — | $ | (1.9 | ) | $ | 1,647.9 | ||||||
HRO, excluding PEO zero-margin benefits pass-throughs | 239.9 | 411.0 | (0.8 | ) | 650.1 | ||||||||||
PEO zero-margin benefits pass-throughs | — | 722.4 | — | 722.4 | |||||||||||
Global | 511.4 | — | — | 511.4 | |||||||||||
Interest on funds held for clients | 136.4 | 1.3 | — | 137.7 | |||||||||||
Total Segment Revenues | $ | 2,537.5 | $ | 1,134.7 | $ | (2.7 | ) | $ | 3,669.5 | ||||||
10
Reconciliation of disaggregated revenue to our reportable segments for the three months ended December 31, 2018:
Types of Revenues | Employer Services | PEO | Other | Total | |||||||||||
HCM | $ | 1,599.6 | $ | — | $ | (0.2 | ) | $ | 1,599.4 | ||||||
HRO, excluding PEO zero-margin benefits pass-throughs | 232.9 | 383.8 | (2.5 | ) | 614.2 | ||||||||||
PEO zero-margin benefits pass-throughs | — | 659.7 | — | 659.7 | |||||||||||
Global | 490.0 | — | — | 490.0 | |||||||||||
Interest on funds held for clients | 127.9 | 1.2 | — | 129.1 | |||||||||||
Total Segment Revenues | $ | 2,450.4 | $ | 1,044.7 | $ | (2.7 | ) | $ | 3,492.4 | ||||||
Reconciliation of disaggregated revenue to our reportable segments for the six months ended December 31, 2019:
Types of Revenues | Employer Services | PEO | Other | Total | |||||||||||
HCM | $ | 3,219.8 | $ | — | $ | (3.3 | ) | $ | 3,216.5 | ||||||
HRO, excluding PEO zero-margin benefits pass-throughs | 475.6 | 767.5 | (1.9 | ) | 1,241.2 | ||||||||||
PEO zero-margin benefits pass-throughs | — | 1,421.5 | — | 1,421.5 | |||||||||||
Global | 1,014.5 | — | — | 1,014.5 | |||||||||||
Interest on funds held for clients | 269.0 | 2.5 | — | 271.5 | |||||||||||
Total Segment Revenues | $ | 4,978.9 | $ | 2,191.5 | $ | (5.2 | ) | $ | 7,165.2 | ||||||
Reconciliation of disaggregated revenue to our reportable segments for the six months ended December 31, 2018:
Types of Revenues | Employer Services | PEO | Other | Total | |||||||||||
HCM | $ | 3,116.4 | $ | — | $ | (1.7 | ) | $ | 3,114.7 | ||||||
HRO, excluding PEO zero-margin benefits pass-throughs | 463.4 | 717.1 | (3.8 | ) | 1,176.7 | ||||||||||
PEO zero-margin benefits pass-throughs | — | 1,300.2 | — | 1,300.2 | |||||||||||
Global | 963.5 | — | — | 963.5 | |||||||||||
Interest on funds held for clients | 245.3 | 2.3 | — | 247.6 | |||||||||||
Total Segment Revenues | $ | 4,788.6 | $ | 2,019.6 | $ | (5.5 | ) | $ | 6,802.7 | ||||||
Contract Balances
The timing of revenue recognition for HCM, HRO and Global Solutions is consistent with the invoicing of clients, as invoicing occurs in the period the services are provided. Therefore, the Company does not recognize a contract asset or liability resulting from the timing of revenue recognition and invoicing.
Changes in deferred revenue related to set up fees for the six months ended December 31, 2019 were as follows:
Contract Liability | |||
Contract liability, July 1, 2019 | $ | 563.4 | |
Recognition of revenue included in beginning of year contract liability | (88.7 | ) | |
Contract liability, net of revenue recognized on contracts during the period | 66.1 | ||
Currency adjustments | (4.0 | ) | |
Contract liability, December 31, 2019 | $ | 536.8 | |
11
Note 4. Earnings per Share (“EPS”)
Basic | Effect of Employee Stock Option Shares | Effect of Employee Restricted Stock Shares | Diluted | |||||||||||
Three Months Ended December 31, 2019 | ||||||||||||||
Net earnings | $ | 651.6 | $ | 651.6 | ||||||||||
Weighted average shares (in millions) | 431.5 | 1.1 | 0.7 | 433.3 | ||||||||||
EPS | $ | 1.51 | $ | 1.50 | ||||||||||
Three Months Ended December 31, 2018 | ||||||||||||||
Net earnings | $ | 558.2 | $ | 558.2 | ||||||||||
Weighted average shares (in millions) | 435.7 | 1.2 | 1.1 | 438.0 | ||||||||||
EPS | $ | 1.28 | $ | 1.27 | ||||||||||
Six Months Ended December 31, 2019 | ||||||||||||||
Net earnings | $ | 1,234.0 | $ | 1,234.0 | ||||||||||
Weighted average shares (in millions) | 432.1 | 1.1 | 1.1 | 434.3 | ||||||||||
EPS | $ | 2.86 | $ | 2.84 | ||||||||||
Six Months Ended December 31, 2018 | ||||||||||||||
Net earnings | $ | 1,063.6 | $ | 1,063.6 | ||||||||||
Weighted average shares (in millions) | 436.2 | 1.3 | 1.4 | 438.9 | ||||||||||
EPS | $ | 2.44 | $ | 2.42 | ||||||||||
Options to purchase 1.3 million and 0.8 million shares of common stock for the three months ended December 31, 2019 and 2018, respectively, and 1.0 million and 0.6 million shares of common stock for the six months ended December 31, 2019 and 2018, respectively, were excluded from the calculation of diluted earnings per share because their inclusion would have been anti-dilutive.
Note 5. Other Income, Net
Three Months Ended | Six Months Ended | ||||||||||||||
December 31, | December 31, | ||||||||||||||
2019 | 2018 | 2019 | 2018 | ||||||||||||
Interest income on corporate funds | $ | (25.7 | ) | $ | (28.1 | ) | $ | (58.0 | ) | $ | (56.6 | ) | |||
Realized gains on available-for-sale securities | (7.6 | ) | (0.3 | ) | (10.1 | ) | (0.6 | ) | |||||||
Realized losses on available-for-sale securities | 0.5 | 0.8 | 0.7 | 2.0 | |||||||||||
Impairment of intangible assets | — | — | — | 12.1 | |||||||||||
Gain on sale of assets | — | (4.1 | ) | (1.9 | ) | (4.1 | ) | ||||||||
Gain on sale of investment | (0.2 | ) | — | (0.2 | ) | — | |||||||||
Non-service components of pension expense, net (see Note 11) | (13.0 | ) | (0.9 | ) | (31.1 | ) | 0.7 | ||||||||
Other income, net | $ | (46.0 | ) | $ | (32.6 | ) | $ | (100.6 | ) | $ | (46.5 | ) | |||
In fiscal 2019, the Company wrote down $12.1 million of internally developed software which was determined to have no future use due to redundant software identified as part of an acquisition. In addition, the Company recognized a gain of $4.1 million for the sale of assets in relation to the Service Alignment Initiative.
12
Note 6. Corporate Investments and Funds Held for Clients
Corporate investments and funds held for clients at December 31, 2019 and June 30, 2019 were as follows:
December 31, 2019 | |||||||||||||||
Amortized Cost | Gross Unrealized Gains | Gross Unrealized Losses | Fair Market Value (A) | ||||||||||||
Type of issue: | |||||||||||||||
Money market securities, cash and other cash equivalents | $ | 13,315.1 | $ | — | $ | — | $ | 13,315.1 | |||||||
Available-for-sale securities: | |||||||||||||||
Corporate bonds | 10,933.2 | 218.8 | (2.9 | ) | 11,149.1 | ||||||||||
Asset-backed securities | 4,205.2 | 37.6 | (3.5 | ) | 4,239.3 | ||||||||||
U.S. Treasury securities | 3,581.8 | 26.7 | (3.8 | ) | 3,604.7 | ||||||||||
U.S. government agency securities | 2,046.7 | 20.9 | (1.3 | ) | 2,066.3 | ||||||||||
Canadian government obligations and Canadian government agency obligations | 1,177.4 | 3.8 | (6.2 | ) | 1,175.0 | ||||||||||
Canadian provincial bonds | 723.1 | 10.9 | (0.6 | ) | 733.4 | ||||||||||
Municipal bonds | 586.9 | 19.0 | (0.1 | ) | 605.8 | ||||||||||
Other securities | 1,208.1 | 20.8 | (1.4 | ) | 1,227.5 | ||||||||||
Total available-for-sale securities | 24,462.4 | 358.5 | (19.8 | ) | 24,801.1 | ||||||||||
Total corporate investments and funds held for clients | $ | 37,777.5 | $ | 358.5 | $ | (19.8 | ) | $ | 38,116.2 | ||||||
(A) Included within available-for-sale securities are corporate investments with fair values of $7.2 million and funds held for clients with fair values of $24,793.9 million. All available-for-sale securities were included in Level 2 of the fair value hierarchy.
June 30, 2019 | |||||||||||||||
Amortized Cost | Gross Unrealized Gains | Gross Unrealized Losses | Fair Market Value (B) | ||||||||||||
Type of issue: | |||||||||||||||
Money market securities, cash and other cash equivalents | $ | 6,796.2 | $ | — | $ | — | $ | 6,796.2 | |||||||
Available-for-sale securities: | |||||||||||||||
Corporate bonds | 10,691.8 | 182.8 | (6.7 | ) | 10,867.9 | ||||||||||
Asset-backed securities | 4,658.3 | 37.8 | (5.4 | ) | 4,690.7 | ||||||||||
U.S. Treasury securities | 2,933.0 | 23.8 | (8.0 | ) | 2,948.8 | ||||||||||
U.S. government agency securities | 2,612.0 | 17.7 | (5.8 | ) | 2,623.9 | ||||||||||
Canadian government obligations and Canadian government agency obligations | 1,164.1 | 7.0 | (6.0 | ) | 1,165.1 | ||||||||||
Canadian provincial bonds | 800.2 | 14.5 | (0.5 | ) | 814.2 | ||||||||||
Municipal bonds | 596.1 | 16.4 | (0.1 | ) | 612.4 | ||||||||||
Other securities | 1,116.1 | 20.6 | (0.6 | ) | 1,136.1 | ||||||||||
Total available-for-sale securities | 24,571.6 | 320.6 | (33.1 | ) | 24,859.1 | ||||||||||
Total corporate investments and funds held for clients | $ | 31,367.8 | $ | 320.6 | $ | (33.1 | ) | $ | 31,655.3 | ||||||
(B) Included within available-for-sale securities are corporate investments with fair values of $271.9 million and funds held for clients with fair values of $24,587.2 million. All available-for-sale securities were included in Level 2 of the fair value hierarchy.
13
For a description of the fair value hierarchy and the Company's fair value methodologies, including the use of an independent third-party pricing service, see Note 1 “Summary of Significant Accounting Policies” in the Company's Annual Report on Form 10-K for fiscal 2019. The Company did not transfer any assets between Levels during the six months ended December 31, 2019 or fiscal 2019. In addition, the Company concurred with and did not adjust the prices obtained from the independent pricing service. The Company had no available-for-sale securities included in Level 1 or Level 3 at December 31, 2019.
The unrealized losses and fair values of available-for-sale securities that have been in an unrealized loss position for a period of less than and greater than 12 months as of December 31, 2019, are as follows:
December 31, 2019 | |||||||||||||||||||||||
Securities in Unrealized Loss Position Less Than 12 Months | Securities in Unrealized Loss Position Greater Than 12 Months | Total | |||||||||||||||||||||
Gross Unrealized Losses | Fair Market Value | Gross Unrealized Losses | Fair Market Value | Gross Unrealized Losses | Fair Market Value | ||||||||||||||||||
Corporate bonds | $ | (2.6 | ) | $ | 715.4 | $ | (0.3 | ) | $ | 260.3 | $ | (2.9 | ) | $ | 975.7 | ||||||||
Asset-backed securities | (2.6 | ) | 593.2 | (0.9 | ) | 628.8 | (3.5 | ) | 1,222.0 | ||||||||||||||
U.S. Treasury securities | (0.4 | ) | 257.5 | (3.4 | ) | 1,005.0 | (3.8 | ) | 1,262.5 | ||||||||||||||
U.S. government agency securities | (0.7 | ) | 91.7 | (0.6 | ) | 743.3 | (1.3 | ) | 835.0 | ||||||||||||||
Canadian government obligations and Canadian government agency obligations | (6.2 | ) | 870.1 | — | — | (6.2 | ) | 870.1 | |||||||||||||||
Canadian provincial bonds | (0.6 | ) | 113.8 | — | 30.5 | (0.6 | ) | 144.3 | |||||||||||||||
Municipal bonds | (0.1 | ) | 19.0 | — | 6.6 | (0.1 | ) | 25.6 | |||||||||||||||
Other securities | (1.1 | ) | 140.6 | (0.3 | ) | 67.2 | (1.4 | ) | 207.8 | ||||||||||||||
$ | (14.3 | ) | $ | 2,801.3 | $ | (5.5 | ) | $ | 2,741.7 | $ | (19.8 | ) | $ | 5,543.0 | |||||||||
The unrealized losses and fair values of available-for-sale securities that have been in an unrealized loss position for a period of less than and greater than 12 months as of June 30, 2019, are as follows:
June 30, 2019 | |||||||||||||||||||||||
Securities in Unrealized Loss Position Less Than 12 Months | Securities in Unrealized Loss Position Greater Than 12 Months | Total | |||||||||||||||||||||
Gross Unrealized Losses | Fair Market Value | Gross Unrealized Losses | Fair Market Value | Gross Unrealized Losses | Fair Market Value | ||||||||||||||||||
Corporate bonds | $ | (0.6 | ) | $ | 151.9 | $ | (6.1 | ) | $ | 2,055.6 | $ | (6.7 | ) | $ | 2,207.5 | ||||||||
Asset-backed securities | (0.2 | ) | 171.9 | (5.2 | ) | 2,083.5 | (5.4 | ) | 2,255.4 | ||||||||||||||
U.S. Treasury securities | — | 1.8 | (8.0 | ) | 1,159.4 | (8.0 | ) | 1,161.2 | |||||||||||||||
U.S. government agency securities | — | — | (5.8 | ) | 1,671.4 | (5.8 | ) | 1,671.4 | |||||||||||||||
Canadian government obligations and Canadian government agency obligations | (6.0 | ) | 662.7 | — | 1.1 | (6.0 | ) | 663.8 | |||||||||||||||
Canadian provincial bonds | (0.3 | ) | 81.5 | (0.2 | ) | 50.1 | (0.5 | ) | 131.6 | ||||||||||||||
Municipal bonds | — | 1.5 | (0.1 | ) | 23.3 | (0.1 | ) | 24.8 | |||||||||||||||
Other securities | (0.1 | ) | 36.4 | (0.5 | ) | 148.1 | (0.6 | ) | 184.5 | ||||||||||||||
$ | (7.2 | ) | $ | 1,107.7 | $ | (25.9 | ) | $ | 7,192.5 | $ | (33.1 | ) | $ | 8,300.2 | |||||||||
At December 31, 2019, Corporate bonds include investment-grade debt securities with a wide variety of issuers, industries, and sectors, primarily carry credit ratings of A and above, and have maturities ranging from January 2020 through November 2029.
14
At December 31, 2019, asset-backed securities include AAA-rated senior tranches of securities with predominantly prime collateral of fixed-rate auto loan, credit card, equipment lease, and rate reduction receivables with fair values of $2,101.3 million, $1,597.4 million, $418.8 million, and $121.8 million, respectively. These securities are collateralized by the cash flows of the underlying pools of receivables. The primary risk associated with these securities is the collection risk of the underlying receivables. All collateral on such asset-backed securities has performed as expected through December 31, 2019.
At December 31, 2019, U.S. government agency securities primarily include debt directly issued by Federal Home Loan Banks and Federal Farm Credit Banks with fair values of $1,150.0 million and $715.6 million, respectively. U.S. government agency securities represent senior, unsecured, non-callable debt that primarily carry ratings of Aaa by Moody's, and AA+ by Standard & Poor's, with maturities ranging from January 2020 through December 2029.
At December 31, 2019, other securities and their fair value primarily include U.S. government agency commercial mortgage-backed securities of $739.3 million issued by Federal Home Loan Mortgage Corporation and Federal National Mortgage Association, Aa2-rated United Kingdom Gilt securities of $201.9 million, and AAA-rated and AA-rated supranational bonds of $90.6 million.
Classification of corporate investments on the Consolidated Balance Sheets is as follows:
December 31, | June 30, | |||||||
2019 | 2019 | |||||||
Corporate investments: | ||||||||
Cash and cash equivalents | $ | 1,500.4 | $ | 1,949.2 | ||||
Short-term marketable securities | 7.2 | 10.5 | ||||||
Long-term marketable securities (a) | — | 261.4 | ||||||
Total corporate investments | $ | 1,507.6 | $ | 2,221.1 | ||||
(a) - Long-term marketable securities are included within Other assets on the Consolidated Balance Sheets.
Funds held for clients represent assets that, based upon the Company's intent, are restricted for use solely for the purposes of satisfying the obligations to remit funds relating to the Company’s payroll and payroll tax filing services, which are classified as client funds obligations on our Consolidated Balance Sheets.
Funds held for clients have been invested in the following categories:
December 31, | June 30, | |||||||
2019 | 2019 | |||||||
Funds held for clients: | ||||||||
Restricted cash and cash equivalents held to satisfy client funds obligations | $ | 11,814.7 | $ | 4,847.0 | ||||
Restricted short-term marketable securities held to satisfy client funds obligations | 5,241.3 | 5,013.9 | ||||||
Restricted long-term marketable securities held to satisfy client funds obligations | 19,552.6 | 19,573.3 | ||||||
Total funds held for clients | $ | 36,608.6 | $ | 29,434.2 | ||||
Client funds obligations represent the Company's contractual obligations to remit funds to satisfy clients' payroll, tax, and other payee payment obligations and are recorded on the Consolidated Balance Sheets at the time that the Company impounds funds from clients. The client funds obligations represent liabilities that will be repaid within one year of the balance sheet date. The Company has reported client funds obligations as a current liability on the Consolidated Balance Sheets totaling $36,269.9 million and $29,144.5 million at December 31, 2019 and June 30, 2019, respectively. The Company has classified funds held for clients as a current asset since these funds are held solely for the purpose of satisfying the client funds obligations. Of the Company’s funds held for clients at December 31, 2019 and June 30, 2019, $33,001.5 million and $26,648.0 million, respectively, are held in the grantor trust. The liabilities held within the trust are intercompany liabilities to other Company subsidiaries and are eliminated in consolidation.
The Company has reported the cash flows related to the purchases of corporate and client funds marketable securities and related to the proceeds from the sales and maturities of corporate and client funds marketable securities on a gross basis in the investing section of the Statements of Consolidated Cash Flows. The Company has reported the cash and cash equivalents related to client funds investments with original maturities of ninety days or less, within the beginning and ending balances of
15
cash, cash equivalents, restricted cash, and restricted cash equivalents. These amounts have been reconciled to the Consolidated Balance Sheets on the Statements of Consolidated Cash Flows. The Company has reported the cash flows related to the cash received from and paid on behalf of clients on a net basis within net increase / (decrease) in client funds obligations in the financing activities section of the Statements of Consolidated Cash Flows.
Approximately 78% of the available-for-sale securities held a AAA-rating or AA-rating at December 31, 2019, as rated by Moody's, Standard & Poor's, DBRS for Canadian dollar-denominated securities, and Fitch for asset-backed and commercial mortgage-backed securities. All available-for-sale securities were rated as investment grade at December 31, 2019.
Expected maturities of available-for-sale securities at December 31, 2019 are as follows:
One year or less | $ | 5,248.5 | |
One year to two years | 5,107.8 | ||
Two years to three years | 4,930.4 | ||
Three years to four years | 3,740.3 | ||
After four years | 5,774.1 | ||
Total available-for-sale securities | $ | 24,801.1 | |
Note 7. Leases
During the first quarter of the fiscal year ending June 30, 2020 ("fiscal 2020"), the Company adopted ASC 842 using the optional transition method under which financial results reported in periods prior were not adjusted and continue to be reported in accordance with historic accounting under ASC 840 - Leases.
The Company elected the following practical expedients permitted under the lease standard:
• | The Company did not reassess prior conclusions about lease identification, lease classification or initial direct costs, and did not use hindsight for leases existing at adoption date. |
• | The Company did not record leases with an initial term of 12 months or less on the consolidated balance sheet but continues to expense them on a straight-line basis over the lease term. |
• | The Company elected to combine lease and non-lease components for our facilities leases only. Non-lease components consist primarily of maintenance services. |
The Company records leases on the consolidated balance sheets as operating lease ROU assets, records the current portion of operating lease liabilities within accrued expenses and other current liabilities and, separately, records long-term operating lease liabilities.
The Company has entered into operating lease agreements for facilities and equipment. The Company's leases have remaining lease terms of up to approximately ten years. Operating lease ROU assets and operating lease liabilities are recognized at the lease commencement date based on the present value of the lease payments over the lease term. The lease liabilities are measured by discounting future lease payments at the Company’s collateralized incremental borrowing rate for financing instruments of a similar term, unless the implicit rate is readily determinable. ROU assets also include adjustments related to prepaid or deferred lease payments and lease incentives. As of December 31, 2019, total operating lease ROU assets were $500.2 million, current and long-term operating lease liabilities were approximately $104.5 million and $360.2 million, respectively. The difference between total ROU assets and total lease liabilities are primarily attributable to pre-payments of our obligations and the recognition of various lease incentives.
The components of operating lease expense were as follows:
Three Months Ended | Six Months Ended | ||||||
December 31, | December 31, | ||||||
2019 | 2019 | ||||||
Operating lease cost | $ | 42.3 | $ | 86.5 | |||
Short-term lease cost | 1.2 | 3.9 | |||||
Variable lease cost | 0.7 | 2.0 | |||||
Total operating lease cost | $ | 44.2 | $ | 92.4 | |||
16
Information related to our operating lease ROU assets and operating lease liabilities was as follows:
December 31, 2019 | |||
Cash paid for operating lease liabilities | $ | 75.8 | |
Operating lease ROU assets obtained in exchange for new operating lease liabilities | $ | 17.4 | |
Weighted-average remaining lease term (in years) | 6 | ||
Weighted-average discount rate | 2.4 | % | |
As of December 31, 2019, maturities of operating lease liabilities are as follows:
Six months ending June 30, 2020 | $ | 58.9 | |
Twelve months ending June 30, 2021 | 102.4 | ||
Twelve months ending June 30, 2022 | 85.4 | ||
Twelve months ending June 30, 2023 | 73.1 | ||
Twelve months ending June 30, 2024 | 51.4 | ||
Thereafter | 128.6 | ||
Total undiscounted lease obligations | 499.8 | ||
Less: Imputed interest | (35.1 | ) | |
Net lease obligations | $ | 464.7 | |
Note 8. Goodwill and Intangible Assets, net
Changes in goodwill for the six months ended December 31, 2019 are as follows:
Employer Services | PEO Services | Total | |||||||||
Balance at June 30, 2019 | $ | 2,318.2 | $ | 4.8 | $ | 2,323.0 | |||||
Additions and other adjustments | (2.5 | ) | — | (2.5 | ) | ||||||
Currency translation adjustments | (5.6 | ) | — | (5.6 | ) | ||||||
Balance at December 31, 2019 | $ | 2,310.1 | $ | 4.8 | $ | 2,314.9 | |||||
Components of intangible assets, net, are as follows:
December 31, | June 30, | |||||||
2019 | 2019 | |||||||
Intangible assets: | ||||||||
Software and software licenses | $ | 2,617.6 | $ | 2,519.3 | ||||
Customer contracts and lists | 900.4 | 860.7 | ||||||
Other intangibles | 238.9 | 237.9 | ||||||
3,756.9 | 3,617.9 | |||||||
Less accumulated amortization: | ||||||||
Software and software licenses | (1,840.3 | ) | (1,762.3 | ) | ||||
Customer contracts and lists | (593.8 | ) | (566.4 | ) | ||||
Other intangibles | (220.3 | ) | (217.7 | ) | ||||
(2,654.4 | ) | (2,546.4 | ) | |||||
Intangible assets, net | $ | 1,102.5 | $ | 1,071.5 | ||||
Other intangibles consist primarily of purchased rights, trademarks and trade names (acquired directly or through acquisitions). All intangible assets have finite lives and, as such, are subject to amortization. The weighted average remaining useful life of the intangible assets is 6 years (6 years for software and software licenses, 6 years for customer contracts and lists, and 4 years for other intangibles). Amortization of intangible assets was $69.7 million and $55.4 million for the three months
17
ended December 31, 2019 and 2018, respectively, and $139.1 million and $108.8 million for the six months ended December 31, 2019 and 2018, respectively.
Estimated future amortization expenses of the Company's existing intangible assets are as follows:
Amount | |||
Six months ending June 30, 2020 | $ | 147.6 | |
Twelve months ending June 30, 2021 | $ | 241.8 | |
Twelve months ending June 30, 2022 | $ | 194.1 | |
Twelve months ending June 30, 2023 | $ | 154.5 | |
Twelve months ending June 30, 2024 | $ | 120.4 | |
Twelve months ending June 30, 2025 | $ | 69.1 | |
Note 9. Short-term Financing
The Company has a $3.8 billion, 364-day credit agreement that matures in June 2020 with a one year term-out option. The Company also has a $2.75 billion five year credit facility that matures in June 2024 that contains an accordion feature under which the aggregate commitment can be increased by $500 million, subject to the availability of additional commitments. In addition, the Company has a five year $3.75 billion credit facility maturing in June 2023 that also contains an accordion feature under which the aggregate commitment can be increased by $500 million, subject to the availability of additional commitments. The interest rate applicable to committed borrowings is tied to LIBOR, the effective federal funds rate, or the prime rate, depending on the notification provided by the Company to the syndicated financial institutions prior to borrowing. The Company is also required to pay facility fees on the credit agreements. The primary uses of the credit facilities are to provide liquidity to the commercial paper program and funding for general corporate purposes, if necessary. The Company had no borrowings through December 31, 2019 under the credit agreements.
The Company's U.S. short-term funding requirements related to client funds are sometimes obtained on an unsecured basis through the issuance of commercial paper, rather than liquidating previously-collected client funds that have already been invested in available-for-sale securities. This commercial paper program provides for the issuance of up to $10.3 billion in aggregate maturity value. The Company’s commercial paper program is rated A-1+ by Standard & Poor’s and Prime-1 (“P-1”) by Moody’s. These ratings denote the highest quality commercial paper securities. Maturities of commercial paper can range from overnight to up to 364 days. At December 31, 2019 and June 30, 2019, the Company had no commercial paper borrowing outstanding. Details of the borrowings under the commercial paper program are as follows:
Three Months Ended | Six Months Ended | ||||||||||||||
December 31, | December 31, | ||||||||||||||
2019 | 2018 | 2019 | 2018 | ||||||||||||
Average daily borrowings (in billions) | $ | 3.5 | $ | 3.8 | $ | 3.7 | $ | 3.8 | |||||||
Weighted average interest rates | 1.7 | % | 2.3 | % | 2.0 | % | 2.1 | % | |||||||
Weighted average maturity (approximately in days) | 2 days | 2 days | 2 days | 2 days | |||||||||||
The Company’s U.S., Canadian and United Kingdom short-term funding requirements related to client funds obligations are sometimes obtained on a secured basis through the use of reverse repurchase agreements, which are collateralized principally by government and government agency securities, rather than liquidating previously-collected client funds that have already been invested in available-for-sale securities. These agreements generally have terms ranging from overnight to up to five business days. At December 31, 2019 there were no outstanding obligations related to reverse repurchase agreements. At June 30, 2019, the Company had $262.0 million of outstanding obligations related to the reverse repurchase agreements, which were fully paid in early July 2019. Details of the reverse repurchase agreements are as follows:
Three Months Ended | Six Months Ended | ||||||||||||||
December 31, | December 31, | ||||||||||||||
2019 | 2018 | 2019 | 2018 | ||||||||||||
Average outstanding balances | $ | 335.9 | $ | 325.4 | $ | 381.2 | $ | 410.2 | |||||||
Weighted average interest rates | 1.7 | % | 1.9 | % | 1.8 | % | 1.8 | % | |||||||
18
Note 10. Debt
The Company has fixed-rate notes with 5-year and 10-year maturities for an aggregate principal amount of $2.0 billion (collectively the “Notes”). The Notes are senior unsecured obligations, and interest is payable in arrears, semi-annually.
The principal amounts and associated effective interest rates of the Notes and other debt as of December 31, 2019 and June 30, 2019, are as follows:
Debt instrument | Effective Interest Rate | December 31, 2019 | June 30, 2019 | |||||||
Fixed-rate 2.25% notes due September 15, 2020 | 2.37% | $ | 1,000.0 | $ | 1,000.0 | |||||
Fixed-rate 3.375% notes due September 15, 2025 | 3.47% | 1,000.0 | 1,000.0 | |||||||
Other | 8.9 | 10.9 | ||||||||
2,008.9 | 2,010.9 | |||||||||
Less: current portion | (1,001.6 | ) | (2.5 | ) | ||||||
Less: unamortized discount and debt issuance costs | (4.3 | ) | (6.2 | ) | ||||||
Total long-term debt | $ | 1,003.0 | $ | 2,002.2 | ||||||
The effective interest rates for the Notes include the interest on the Notes and amortization of the discount and debt issuance costs.
As of December 31, 2019, the fair value of the Notes, based on Level 2 inputs, was $2,068.9 million. For a description of the fair value hierarchy and the Company's fair value methodologies, including the use of an independent third-party service, see Note 1 “Summary of Significant Accounting Policies” in the Company's Annual Report on Form 10-K for fiscal 2019.
Note 11. Employee Benefit Plans
A. Stock-based Compensation Plans. Stock-based compensation consists of the following:
The Company's share-based compensation consists of stock options, time-based restricted stock, time-based restricted stock units, performance-based restricted stock, and performance-based restricted stock units. The Company also offers an employee stock purchase plan for eligible employees.
The Company currently utilizes treasury stock to satisfy stock option exercises, issuances under the Company's employee stock purchase plan, and restricted stock awards. From time to time, the Company may repurchase shares of its common stock under its authorized share repurchase program. In November 2019, the Board of Directors authorized the repurchase of $5 billion of our common stock, replacing in its entirety the previous 2015 authorization to purchase up to 25 million shares of our common stock. The Company repurchased 1.8 million and 2.2 million shares in the three months ended December 31, 2019 and 2018, respectively, of which $155.4 million in the three months ended December 31, 2019 were repurchased under the November 2019 authorization. The Company repurchased 3.7 million and 3.8 million shares in the six months ended December 31, 2019 and 2018, respectively. The Company considers several factors in determining when to execute share repurchases, including, among other things, actual and potential acquisition activity, cash balances and cash flows, issuances due to employee benefit plan activity, and market conditions.
The following table represents pre-tax stock-based compensation expense for the three and six months ended December 31, 2019 and 2018, respectively:
Three Months Ended | Six Months Ended | ||||||||||||||
December 31, | December 31, | ||||||||||||||
2019 | 2018 | 2019 | 2018 | ||||||||||||
Operating expenses | $ | 3.4 | $ | 3.4 | $ | 7.4 | $ | 8.8 | |||||||
Selling, general and administrative expenses | 28.0 | 30.4 | 56.3 | 58.4 | |||||||||||
System development and programming costs | 4.8 | 4.8 | 9.6 | 9.8 | |||||||||||
Total stock-based compensation expense | $ | 36.2 | $ | 38.6 | $ | 73.3 | $ | 77.0 | |||||||
19
The methods and assumptions used in the determination of the fair value of stock-based awards are consistent with those described in the Company's Form 10-K for fiscal 2019. See the Company's Annual Report on Form 10-K for fiscal 2019 for a detailed description of the Company's stock-based compensation awards and employee stock purchase plan, including information related to vesting terms, service and performance conditions, payout percentages, and process for estimating the fair value of stock options granted.
B. Pension Plans
The components of net pension expense were as follows:
Three Months Ended | Six Months Ended | ||||||||||||||
December 31, | December 31, | ||||||||||||||
2019 | 2018 | 2019 | 2018 | ||||||||||||
Service cost – benefits earned during the period | $ | 14.9 | $ | 14.9 | $ | 29.9 | $ | 29.9 | |||||||
Interest cost on projected benefits | 15.4 | 19.7 | 30.9 | 39.3 | |||||||||||
Expected return on plan assets | (29.5 | ) | (33.0 | ) | (59.0 | ) | (65.9 | ) | |||||||
Net amortization and deferral | 1.5 | — | 2.9 | 0.1 | |||||||||||
Settlement charges and special termination benefits | — | 12.8 | (5.1 | ) | 28.1 | ||||||||||
Net pension expense | $ | 2.3 | $ | 14.4 | $ | (0.4 | ) | $ | 31.5 | ||||||
In fiscal 2018, the Company offered a Voluntary Early Retirement Program (“VERP”) to certain eligible U.S.-based associates aged 55 or above with at least 10 years of service. During the three and six months ended December 31, 2018, the Company recorded $12.8 million and $28.1 million, respectively, of non-cash settlement charges and special termination benefits.
Note 12. Income Taxes
The effective tax rate for the three months ended December 31, 2019 and 2018 was 22.0% and 24.7%, respectively. The decrease in the effective tax rate is primarily due to the release of a valuation allowance related to foreign tax credit carryforwards and a reduction in the operating tax rate due to the mix between domestic and foreign earnings.
The effective tax rate for the six months ended December 31, 2019 and 2018 was 21.6% and 23.4%, respectively. The decrease in the effective tax rate is primarily due to the release of a valuation allowance related to foreign tax credit carryforwards, a reduction in the operating tax rate due to the mix between domestic and foreign earnings and an increase in tax incentives related to our software development activities.
Note 13. Commitments and Contingencies
In June 2018, a potential class action complaint was filed against ADP in the Circuit Court of Cook County, Illinois. The complaint asserts that ADP violated the Illinois Biometric Privacy Act, was negligent and unjustly enriched itself in connection with its collection, use and storage of biometric data of employees of its clients who are residents of Illinois in connection with certain services provided by ADP to clients in Illinois. The complaint seeks statutory and other unspecified monetary damages, injunctive relief and attorney’s fees. In addition, similar potential class action complaints have been filed in Illinois state courts against ADP and/or certain of its clients with respect to the collection, use and storage of biometric data of the employees of these clients. All of these claims are still in their earliest stages and the Company is unable to estimate any reasonably possible loss, or range of loss, with respect to these matters. The Company intends to vigorously defend against these lawsuits.
The Company is subject to various claims, litigation and regulatory compliance matters in the normal course of business. When a loss is considered probable and reasonably estimable, the Company records a liability in the amount of its best estimate for the ultimate loss. Management currently believes that the resolution of these claims, litigation and regulatory compliance matters against us, individually or in the aggregate, will not have a material adverse impact on our consolidated results of operations, financial condition or cash flows. These matters are subject to inherent uncertainties and management's view of these matters may change in the future.
It is not the Company’s business practice to enter into off-balance sheet arrangements. In the normal course of business, the Company may enter into contracts in which it makes representations and warranties that relate to the performance of the Company’s services and products. The Company does not expect any material losses related to such representations and warranties.
20
Note 14. Stockholders' Equity
Changes in stockholders' equity by component are as follows:
Three Months Ended | |||||||||||||||||||||||
December 31, 2019 | |||||||||||||||||||||||
Common Stock | Capital in Excess of Par Value | Retained Earnings | Treasury Stock | AOCI | Total | ||||||||||||||||||
Balance at September 30, 2019 | $ | 63.9 | $ | 1,213.7 | $ | 17,729.6 | $ | (13,412.6 | ) | $ | (233.9 | ) | $ | 5,360.7 | |||||||||
Net earnings | — | — | 651.6 | — | — | 651.6 | |||||||||||||||||
Other comprehensive income | — | — | — | — | 2.7 | 2.7 | |||||||||||||||||
Stock-based compensation expense | — | 31.3 | — | — | — | 31.3 | |||||||||||||||||
Issuances relating to stock compensation plans | — | 8.7 | — | 14.5 | — | 23.2 | |||||||||||||||||
Treasury stock acquired (1.8 shares) | — | — | — | (311.5 | ) | — | (311.5 | ) | |||||||||||||||
Dividends declared ($0.91 per share) | — | — | (393.6 | ) | — | — | (393.6 | ) | |||||||||||||||
Balance at December 31, 2019 | $ | 63.9 | $ | 1,253.7 | $ | 17,987.6 | $ | (13,709.6 | ) | $ | (231.2 | ) | $ | 5,364.4 | |||||||||
Three Months Ended | |||||||||||||||||||||||
December 31, 2018 | |||||||||||||||||||||||
Common Stock | Capital in Excess of Par Value | Retained Earnings | Treasury Stock | AOCI | Total | ||||||||||||||||||
Balance at September 30, 2018 | $ | 63.9 | $ | 1,035.1 | $ | 16,741.1 | $ | (12,421.2 | ) | $ | (740.1 | ) | $ | 4,678.8 | |||||||||
Net earnings | — | — | 558.2 | — | — | 558.2 | |||||||||||||||||
Other comprehensive income | — | — | — | — | 125.1 | 125.1 | |||||||||||||||||
Stock-based compensation expense | — | 35.0 | — | — | — | 35.0 | |||||||||||||||||
Issuances relating to stock compensation plans | — | 6.0 | — | 13.3 | — | 19.3 | |||||||||||||||||
Treasury stock acquired (2.2 shares) | — | — | — | (312.3 | ) | — | (312.3 | ) | |||||||||||||||
Dividends declared ($0.79 per share) | — | — | (340.2 | ) | — | — | (340.2 | ) | |||||||||||||||
Balance at December 31, 2018 | $ | 63.9 | $ | 1,076.1 | $ | 16,959.1 | $ | (12,720.2 | ) | $ | (615.0 | ) | $ | 4,763.9 | |||||||||
21
Six Months Ended | |||||||||||||||||||||||
December 31, 2019 | |||||||||||||||||||||||
Common Stock | Capital in Excess of Par Value | Retained Earnings | Treasury Stock | AOCI | Total | ||||||||||||||||||
Balance at June 30, 2019 | $ | 63.9 | $ | 1,183.2 | $ | 17,500.6 | $ | (13,090.5 | ) | $ | (257.3 | ) | $ | 5,399.9 | |||||||||
Net earnings | — | — | 1,234.0 | — | — | 1,234.0 | |||||||||||||||||
Other comprehensive income | — | — | — | — | 26.1 | 26.1 | |||||||||||||||||
Stock-based compensation expense | — | 67.3 | — | — | — | 67.3 | |||||||||||||||||
Issuances relating to stock compensation plans | — | 3.2 | — | 84.9 | — | 88.1 | |||||||||||||||||
Treasury stock acquired (3.7 shares) | — | — | — | (704.0 | ) | — | (704.0 | ) | |||||||||||||||
Dividends declared ($1.70 per share) | — | — | (740.2 | ) | — | — | (740.2 | ) | |||||||||||||||
Other | — | — | (6.8 | ) | — | — | (6.8 | ) | |||||||||||||||
Balance at December 31, 2019 | $ | 63.9 | $ | 1,253.7 | $ | 17,987.6 | $ | (13,709.6 | ) | $ | (231.2 | ) | $ | 5,364.4 | |||||||||
Six Months Ended | |||||||||||||||||||||||
December 31, 2018 | |||||||||||||||||||||||
Common Stock | Capital in Excess of Par Value | Retained Earnings | Treasury Stock | AOCI | Total | ||||||||||||||||||
Balance at June 30, 2018 | $ | 63.9 | $ | 1,014.8 | $ | 16,546.6 | $ | (12,209.6 | ) | $ | (679.8 | ) | $ | 4,735.9 | |||||||||
Net earnings | — | — | 1,063.6 | — | — | 1,063.6 | |||||||||||||||||
Other comprehensive income | — | — | — | — | 64.8 | 64.8 | |||||||||||||||||
Stock-based compensation expense | — | 69.7 | — | — | — | 69.7 | |||||||||||||||||
Issuances relating to stock compensation plans | — | (8.4 | ) | — | 83.5 | — | 75.1 | ||||||||||||||||
Treasury stock acquired (3.8 shares) | — | — | — | (594.1 | ) | — | (594.1 | ) | |||||||||||||||
Dividends declared ($1.48 per share) | — | — | (651.1 | ) | — | — | (651.1 | ) | |||||||||||||||
Balance at December 31, 2018 | $ | 63.9 | $ | 1,076.1 | $ | 16,959.1 | $ | (12,720.2 | ) | $ | (615.0 | ) | $ | 4,763.9 | |||||||||
22
Note 15. Reclassifications out of Accumulated Other Comprehensive Income (“AOCI”)
Changes in AOCI by component are as follows:
Three Months Ended | |||||||||||||||||||
December 31, 2019 | |||||||||||||||||||
Currency Translation Adjustment | Net Gains/Losses on Available-for-sale Securities | Pension Liability | Other | Accumulated Other Comprehensive Loss | |||||||||||||||
Balance at September 30, 2019 | $ | (318.1 | ) | $ | 298.1 | $ | (213.9 | ) | $ | — | $ | (233.9 | ) | ||||||
Other comprehensive (loss)/income before reclassification adjustments | 34.3 | (35.5 | ) | — | 0.7 | (0.5 | ) | ||||||||||||
Tax effect | — | 7.5 | — | (0.2 | ) | 7.3 | |||||||||||||
Reclassification adjustments to net earnings | — | (7.1 | ) | (A) | 1.9 | (B) | — | (5.2 | ) | ||||||||||
Tax effect | — | 1.6 | (0.5 | ) | — | 1.1 | |||||||||||||
Balance at December 31, 2019 | $ | (283.8 | ) | $ | 264.6 | $ | (212.5 | ) | $ | 0.5 | $ | (231.2 | ) | ||||||
Three Months Ended | |||||||||||||||
December 31, 2018 | |||||||||||||||
Currency Translation Adjustment | Net Gains/Losses on Available-for-sale Securities | Pension Liability | Accumulated Other Comprehensive Loss | ||||||||||||
Balance at September 30, 2018 | $ | (249.9 | ) | $ | (311.4 | ) | $ | (178.8 | ) | $ | (740.1 | ) | |||
Other comprehensive (loss)/income before reclassification adjustments | (24.7 | ) | 168.3 | — | 143.6 | ||||||||||
Tax effect | — | (38.8 | ) | — | (38.8 | ) | |||||||||
Reclassification adjustments to net earnings | — | 0.5 | (A) | 26.2 | (B) | 26.7 | |||||||||
Tax effect | — | (0.1 | ) | (6.3 | ) | (6.4 | ) | ||||||||
Balance at December 31, 2018 | $ | (274.6 | ) | $ | (181.5 | ) | $ | (158.9 | ) | $ | (615.0 | ) | |||
Six Months Ended | |||||||||||||||||||
December 31, 2019 | |||||||||||||||||||
Currency Translation Adjustment | Net Gains/Losses on Available-for-sale Securities | Pension Liability | Other | Accumulated Other Comprehensive Loss | |||||||||||||||
Balance at June 30, 2019 | $ | (269.2 | ) | $ | 224.6 | $ | (212.7 | ) | $ | — | $ | (257.3 | ) | ||||||
Other comprehensive (loss)/income before reclassification adjustments | (14.6 | ) | 60.6 | — | 0.7 | 46.7 | |||||||||||||
Tax effect | — | (13.3 | ) | — | (0.2 | ) | (13.5 | ) | |||||||||||
Reclassification adjustments to net earnings | — | (9.4 | ) | (A) | 0.2 | (B) | — | (9.2 | ) | ||||||||||
Tax effect | — | 2.1 | — | — | 2.1 | ||||||||||||||
Balance at December 31, 2019 | $ | (283.8 | ) | $ | 264.6 | $ | (212.5 | ) | $ | 0.5 | $ | (231.2 | ) | ||||||
23
Six Months Ended | |||||||||||||||
December 31, 2018 | |||||||||||||||
Currency Translation Adjustment | Net Gains/Losses on Available-for-sale Securities | Pension Liability | Accumulated Other Comprehensive Loss | ||||||||||||
Balance at June 30, 2018 | $ | (227.0 | ) | $ | (274.0 | ) | $ | (178.8 | ) | $ | (679.8 | ) | |||
Other comprehensive (loss)/income before reclassification adjustments | (47.6 | ) | 118.0 | — | 70.4 | ||||||||||
Tax effect | — | (26.6 | ) | — | (26.6 | ) | |||||||||
Reclassification adjustments to net earnings | — | 1.4 | (A) | 26.3 | (B) | 27.7 | |||||||||
Tax effect | — | (0.3 | ) | (6.4 | ) | (6.7 | ) | ||||||||
Balance at December 31, 2018 | $ | (274.6 | ) | $ | (181.5 | ) | $ | (158.9 | ) | $ | (615.0 | ) | |||
(A) Reclassification adjustments out of AOCI are included within Other income, net, on the Statements of Consolidated Earnings.
(B) Reclassification adjustments out of AOCI are included in net pension expense (see Note 11).
Note 16. Interim Financial Data by Segment
Based upon similar economic and operational characteristics, the Company’s strategic business units have been aggregated into the following two reportable segments: Employer Services and PEO Services. The primary components of the “Other” segment are certain corporate overhead charges and expenses that have not been allocated to the reportable segments, including corporate functions, costs related to our transformation office, non-recurring gains and losses, the elimination of intercompany transactions, and interest expense. Certain revenues and expenses are charged to the reportable segments at a standard rate for management reasons. Other costs are recorded based on management responsibility. Beginning in the first quarter of fiscal 2020, the Company made changes to the allocation methodology for certain corporate allocations, in both the current period and the prior period in the table below, which did not materially affect reportable segment results. In addition, the segment results in the table below reflect the impact of the revision to PEO revenues for comparability. Refer to Note 1 to our Consolidated Financial Statements for more information on this revision.
24
Segment Results:
Revenues | |||||||||||||||
Three Months Ended | Six Months Ended | ||||||||||||||
December 31, | December 31, | ||||||||||||||
2019 | 2018 | 2019 | 2018 | ||||||||||||
Employer Services | $ | 2,537.5 | $ | 2,450.4 | $ | 4,978.9 | $ | 4,788.6 | |||||||
PEO Services | 1,134.7 | 1,044.7 | 2,191.5 | 2,019.6 | |||||||||||
Other | (2.7 | ) | (2.7 | ) | (5.2 | ) | (5.5 | ) | |||||||
$ | 3,669.5 | $ | 3,492.4 | $ | 7,165.2 | $ | 6,802.7 | ||||||||
Earnings before Income Taxes | |||||||||||||||
Three Months Ended | Six Months Ended | ||||||||||||||
December 31, | December 31, | ||||||||||||||
2019 | 2018 | 2019 | 2018 | ||||||||||||
Employer Services | $ | 767.4 | $ | 733.0 | $ | 1,448.4 | $ | 1,372.9 | |||||||
PEO Services | 167.1 | 157.3 | 315.5 | 301.1 | |||||||||||
Other | (99.0 | ) | (149.3 | ) | (189.3 | ) | (286.2 | ) | |||||||
$ | 835.5 | $ | 741.0 | $ | 1,574.6 | $ | 1,387.8 | ||||||||
25
Item 2. Management's Discussion and Analysis of Financial Condition and Results of Operations
(Tabular dollars are presented in millions, except per share amounts)
FORWARD-LOOKING STATEMENTS
This document and other written or oral statements made from time to time by Automatic Data Processing, Inc. and its subsidiaries (“ADP” or “the Company”) may contain “forward-looking statements” within the meaning of the Private Securities Litigation Reform Act of 1995. Statements that are not historical in nature and which may be identified by the use of words like “expects,” “assumes,” “projects,” “anticipates,” “estimates,” “we believe,” “could” and other words of similar meaning, are forward-looking statements. These statements are based on management’s expectations and assumptions and depend upon or refer to future events or conditions and are subject to risks and uncertainties that may cause actual results to differ materially from those expressed. Factors that could cause actual results to differ materially from those contemplated by the forward-looking statements or that could contribute to such difference include: ADP's success in obtaining and retaining clients, and selling additional services to clients; the pricing of products and services; the success of our new solutions; compliance with existing or new legislation or regulations; changes in, or interpretations of, existing legislation or regulations; overall market, political and economic conditions, including interest rate and foreign currency trends; competitive conditions; our ability to maintain our current credit ratings and the impact on our funding costs and profitability; security or cyber breaches, fraudulent acts, and system interruptions and failures; employment and wage levels; changes in technology; availability of skilled technical associates; the impact of new acquisitions and divestitures; and the adequacy, effectiveness and success of our business transformation initiatives. ADP disclaims any obligation to update any forward-looking statements, whether as a result of new information, future events, or otherwise, except as required by law. These risks and uncertainties, along with the risk factors discussed under “Item 1A. - Risk Factors” in our Annual Report on Form 10‑K for the fiscal year ended June 30, 2019 (“fiscal 2019”), and in other written or oral statements made from time to time by ADP, should be considered in evaluating any forward-looking statements contained herein.
NON-GAAP FINANCIAL MEASURES
In addition to our U.S. GAAP results, we use adjusted results and other non-GAAP metrics to evaluate our operating performance in the absence of certain items and for planning and forecasting of future periods. Adjusted EBIT, adjusted EBIT margin, adjusted net earnings, adjusted diluted earnings per share, adjusted effective tax rate and organic constant currency are all non-GAAP financial measures. Please refer to the accompanying financial tables in the “Non-GAAP Financial Measures” section for a discussion of why ADP believes these measures are important and for a reconciliation of non-GAAP financial measures to their comparable GAAP financial measures.
26
EXECUTIVE OVERVIEW
We are a leading global provider of cloud-based Human Capital Management (“HCM”) technology solutions - including payroll, talent management, Human Resources and benefits administration, and workforce management - to employers around the world. As a leader in this industry, we deliver on our global HCM strategy and make investments in highly strategic areas and technology in order to strengthen our underlying business model and prospects for continued growth.
Highlights from the six months ended December 31, 2019 include:
Employer Services New Business Bookings | PEO Average Number of Worksite Employees | ||||
á | 4% | á | 7% | to 571,000 | |
Revenues | Revenues | |||||
á | 5% to | $7.2 billion | á | 6% organic constant currency | ||
EBIT Margin | Adjusted EBIT Margin | |||||
á | 160 basis points to | 22.0% | á | 70 basis points to | 22.3% | |
Diluted earnings per share ("EPS") | Adjusted diluted EPS | |||||
á | 17% to | $2.84 | á | 13% to | $2.86 | |
Our shareholder friendly actions continued as we returned approximately: | ||||||
$690 million | $620 million | |||||
via dividends | via share repurchases | |||||
At ADP, we are always designing for people and we continue to innovate by anticipating our clients' evolving needs as the world of work changes. We are leading the HCM industry with innovations like our next gen platforms and driving growth through our strategic, cloud-based HCM solutions. We further enable these solutions by supplementing them with organic, differentiated investments such as the ADP Marketplace and ADP Datacloud, and through our compliance expertise.
As we continue our transformation journey, our initiatives are yielding efficiencies and are focused on changing how we work. We continue to deliver balanced revenue and profit growth, margin expansion, and ultimately drive long-term shareholder value.
Through our investments, innovations and continued transformation, we are enhancing our position as a leading global HCM provider that can help businesses address the entire worker spectrum from full-time to freelancer and from hire through retire. As the HCM market continues to evolve rapidly, we remain focused on rethinking a better, more personalized world at work and helping our clients and their workers achieve their full potential.
We have a strong business model and operate in a growing global market. We are committed to building upon our past successes by investing in our business through enhancements in R&D and by driving meaningful transformation in the way we operate. We are proud of the recognition received for our new and exciting products and for the positive momentum that we have been delivering to our shareholders. We continue to generate a high percentage of recurring revenues, healthy and improving margins, and consistent strong cash flows. Our financial condition remains solid at December 31, 2019. Through our investments in innovation and transformation, we are positioned to maintain our positive momentum for fiscal year ended June 30, 2020 (“fiscal 2020”).
27
RESULTS AND ANALYSIS OF CONSOLIDATED OPERATIONS
Total Revenues
For the three and six months ended December 31, respectively:
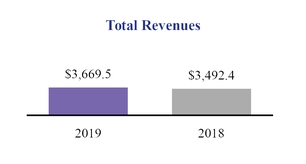
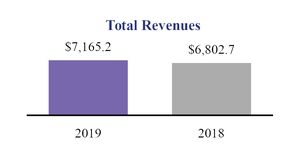
Growth: | á | 5% | á | 5% | |
Organic constant currency: | á | 6% | á | 6% | |
For the three months ended December 31, 2019, our revenue growth includes one percentage point of unfavorability from foreign currency. For the six months ended December 31, 2019, our revenue growth includes about one percentage point of unfavorability from foreign currency partially offset by benefits from acquisitions. Revenues for the three and six months ended December 31, 2019 increased due to new business started from New Business Bookings and continued strong retention. Refer to “Analysis of Reportable Segments” for additional discussion of the increases in revenue for both of our reportable segments, Employer Services and Professional Employer Organization (“PEO”) Services.
Total revenues for the three months ended December 31, 2019 include consolidated interest on funds held for clients of $137.7 million, as compared to $129.1 million for the three months ended December 31, 2018. The increase in the consolidated interest earned on funds held for clients resulted from an increase in our average client funds balance of 6.3% to $25.1 billion for the three months ended December 31, 2019, as compared to the three months ended December 31, 2018.
Total revenues for the six months ended December 31, 2019 include consolidated interest on funds held for clients of $271.5 million, as compared to $247.6 million for the six months ended December 31, 2018. The increase in the consolidated interest earned on funds held for clients resulted from an increase in our average client funds balance of 6.5% to $24.4 billion for the six months ended December 31, 2019, as compared to the six months ended December 31, 2018.
28
Total Expenses
Three Months Ended | Six Months Ended | ||||||||||||||||||||
December 31, | December 31, | ||||||||||||||||||||
2019 | 2018 | % Change | 2019 | 2018 | % Change | ||||||||||||||||
Costs of revenues: | |||||||||||||||||||||
Operating expenses | $ | 1,836.0 | $ | 1,772.4 | 4 | % | $ | 3,623.6 | $ | 3,469.5 | 4 | % | |||||||||
Systems development and programming costs | 168.7 | 156.1 | 8 | % | 336.9 | 314.1 | 7 | % | |||||||||||||
Depreciation and amortization | 89.4 | 71.7 | 25 | % | 178.3 | 144.3 | 24 | % | |||||||||||||
Total costs of revenues | 2,094.1 | 2,000.2 | 5 | % | 4,138.8 | 3,927.9 | 5 | % | |||||||||||||
Selling, general and administrative expenses | 754.3 | 745.2 | 1 | % | 1,480.9 | 1,459.0 | 2 | % | |||||||||||||
Interest expense | 31.6 | 38.6 | n/m | 71.5 | 74.5 | n/m | |||||||||||||||
Total expenses | $ | 2,880.0 | $ | 2,784.0 | 3 | % | $ | 5,691.2 | $ | 5,461.4 | 4 | % | |||||||||
n/m - not meaningful
For the three months ended December 31, 2019, our total expenses increased due to an increase in PEO Services zero-margin benefits pass-through costs, selling and marketing expenses and amortization expense. The increase was partially offset by a decrease in net charges related to our transformation initiatives, operating efficiencies as a result of our continued successful execution on transformation initiatives, and the impact of foreign currency in the three months ended December 31, 2019.
For the six months ended December 31, 2019, our total expenses increased due to an increase in PEO Services zero-margin benefits pass-through costs, selling and marketing expenses, costs to service our client base in support of our growing revenue, and amortization expense. The increase was partially offset by a decrease in net charges related to our transformation initiatives, operating efficiencies as a result of our continued successful execution on transformation initiatives, and the impact of foreign currency in the six months ended December 31, 2019.
Operating expenses increased as our PEO Services zero-margin benefits pass-through costs increased to $722.4 million and $1,421.5 million from $659.7 million and $1,300.2 million for the three and six months ended December 31, 2019 and 2018, respectively.
Systems development and programming costs increased for the three and six months ended December 31, 2019 due to increased investments and costs to develop, support, and maintain our products, partially offset by capitalization of costs related to our strategic projects, including our next gen platforms, and reduced costs from our transformation initiatives. Depreciation and amortization expense increased related to the amortization of our internally developed software and acquisitions of intangibles.
Selling, general and administrative expenses increased for the three and six months ended December 31, 2019 due to increased selling and marketing expenses as a result of investments in our sales force and our brand. The increase was partially offset by broad-based efficiencies as a result of our transformation initiatives and a decrease in net charges related to our transformation initiatives in the three and six months ended December 31, 2019.
29
Other Income, net
Three Months Ended | Six Months Ended | ||||||||||||||||||||||
December 31, | December 31, | ||||||||||||||||||||||
2019 | 2018 | $ Change | 2019 | 2018 | $ Change | ||||||||||||||||||
Interest income on corporate funds | $ | (25.7 | ) | $ | (28.1 | ) | $ | (2.4 | ) | $ | (58.0 | ) | $ | (56.6 | ) | $ | 1.4 | ||||||
Realized gains on available-for-sale securities | (7.6 | ) | (0.3 | ) | 7.3 | (10.1 | ) | (0.6 | ) | 9.5 | |||||||||||||
Realized losses on available-for-sale securities | 0.5 | 0.8 | 0.3 | 0.7 | 2.0 | 1.3 | |||||||||||||||||
Impairment of intangible assets | — | — | — | — | 12.1 | 12.1 | |||||||||||||||||
Gain on sale of assets | — | (4.1 | ) | (4.1 | ) | (1.9 | ) | (4.1 | ) | (2.2 | ) | ||||||||||||
Gain on sale of investment | (0.2 | ) | — | 0.2 | (0.2 | ) | — | 0.2 | |||||||||||||||
Non-service components of pension expense, net | (13.0 | ) | (0.9 | ) | 12.1 | (31.1 | ) | 0.7 | 31.8 | ||||||||||||||
Other income, net | $ | (46.0 | ) | $ | (32.6 | ) | $ | 13.4 | $ | (100.6 | ) | $ | (46.5 | ) | $ | 54.1 | |||||||
Other income, net, increased $13.4 million and $54.1 million for the three and six months ended December 31, 2019, as compared to the three and six months ended December 31, 2018. The increase was due to the non-service components of pension expense, net during the three and six months ended December 31, 2019. Additionally, in fiscal 2019, we wrote down $12.1 million of internally developed software which was determined to have no future use due to redundant software identified as part of an acquisition offset by the gain on sale of assets of $4.1 million in relation to the Service Alignment Initiative.
Earnings before Income Taxes (“EBIT”)
For the three months ended December 31:
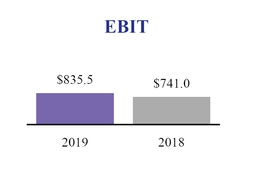
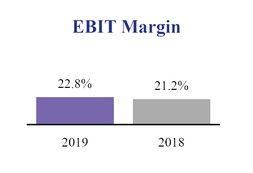
Growth: | á | 13% | á | 160bps |
For the six months ended December 31:
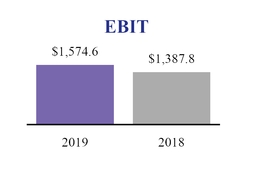
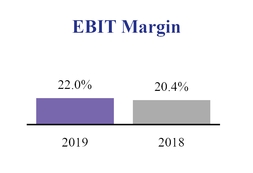
Growth: | á | 13% | á | 160bps |
30
Earnings before income taxes increased for the three and six months ended December 31, 2019 due to the increases in revenues partially offset by increases in expenses discussed above.
Overall margin increased for the three and six months ended December 31, 2019 as a result of our continued successful execution of our broad-based transformation initiatives as well as operating efficiencies. In addition, our margin improvement was aided by lower transformation initiative related charges of $28.1 million and $61.0 million for the three and six months ended December 31, 2019, respectively. These were partially offset by incremental pressure from growth in our zero-margin benefits pass-throughs, increased selling and marketing expenses and amortization expense.
Adjusted EBIT
For the three months ended December 31:
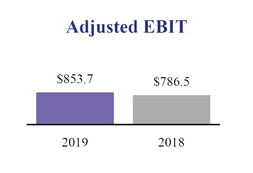
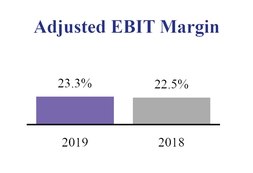
Growth: | á | 9% | á | 70bps |
For the six months ended December 31:
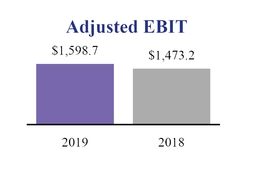
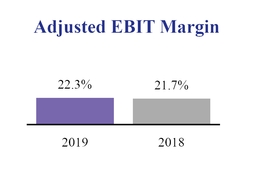
Growth: | á | 9% | á | 70bps |
Adjusted EBIT excludes net charges related to our transformation initiatives in the respective periods for the three and six months ended December 31, 2019 and 2018, reflecting a decrease in net charges of $28.1 million and $61.0 million during the three and six months ended December 31, 2019, respectively, as compared to the three and six months ended December 31, 2018, respectively. For the three and six months ended December 31, 2019, adjusted EBIT increased due to the increases in revenues offset by the increases in expenses discussed above. Our adjusted EBIT margin reflects changes described above in our EBIT margin.
Provision for Income Taxes
The effective tax rate for the three months ended December 31, 2019 and 2018 was 22.0% and 24.7%, respectively. The decrease in the effective tax rate is primarily due to the release of a valuation allowance related to foreign tax credit carryforwards and a reduction in the operating tax rate due to the mix between domestic and foreign earnings.
The effective tax rate for the six months ended December 31, 2019 and 2018 was 21.6% and 23.4%, respectively. The decrease in the effective tax rate is primarily due to the release of a valuation allowance related to foreign tax credit carryforwards, a
31
reduction in the operating tax rate due to the mix between domestic and foreign earnings and an increase in tax incentives related to our software development activities.
Adjusted Provision for Income Taxes
The adjusted effective tax rate for the three months ended December 31, 2019 and 2018 was 22.0% and 24.6%, respectively. The adjusted effective tax rate for the six months ended December 31, 2019 and 2018 was 21.6% and 23.4%, respectively. The drivers of the decrease in the adjusted effective tax rate are the same as the drivers of the decrease in the effective tax rate discussed above.
Net Earnings and Diluted EPS
For the three months ended December 31:
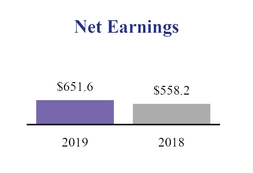
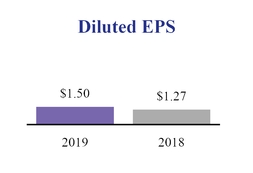
Growth: | á | 17% | á | 18% |
For the six months ended December 31:
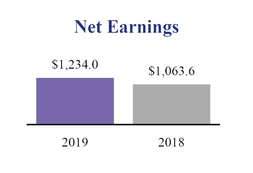
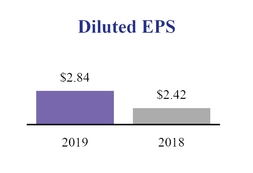
Growth: | á | 16% | á | 17% |
For the three and six months ended December 31, 2019, the net earnings reflect the changes described above in our earnings before income taxes and our effective tax rate.
For the three and six months ended December 31, 2019, diluted EPS increased as a result of an increase in net earnings and the impact of fewer shares outstanding resulting from the repurchase of approximately 3.7 million shares during the six months ended December 31, 2019 and 3.8 million shares for the six months ended December 31, 2018, partially offset by the issuances of shares under our employee benefit plans.
32
Adjusted Net Earnings and Adjusted Diluted EPS
For the three months ended December 31:

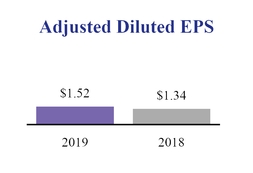
Growth: | á | 12% | á | 13% |
For the six months ended December 31:
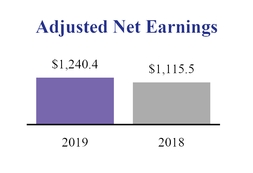
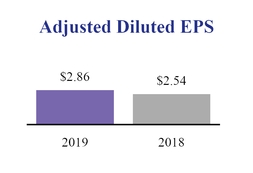
Growth: | á | 11% | á | 13% |
For the three and six months ended December 31, 2019, adjusted net earnings reflect the changes described above in our adjusted EBIT and our adjusted effective tax rate.
For the three and six months ended December 31, 2019, adjusted diluted EPS reflects the changes described above in our adjusted net earnings and shares outstanding.
ANALYSIS OF REPORTABLE SEGMENTS
Revenues | |||||||||||||||||||||||||||
Three Months Ended | % Change | Six Months Ended | |||||||||||||||||||||||||
December 31, | December 31, | % Change | |||||||||||||||||||||||||
2019 | 2018 | As Reported | Organic constant currency | 2019 | 2018 | As Reported | Organic constant currency | ||||||||||||||||||||
Employer Services | $ | 2,537.5 | $ | 2,450.4 | 4 | % | 4 | % | $ | 4,978.9 | $ | 4,788.6 | 4 | % | 5 | % | |||||||||||
PEO Services | 1,134.7 | 1,044.7 | 9 | % | 9 | % | 2,191.5 | 2,019.6 | 9 | % | 9 | % | |||||||||||||||
Other | (2.7 | ) | (2.7 | ) | n/m | n/m | (5.2 | ) | (5.5 | ) | n/m | n/m | |||||||||||||||
$ | 3,669.5 | $ | 3,492.4 | 5 | % | 6 | % | $ | 7,165.2 | $ | 6,802.7 | 5 | % | 6 | % | ||||||||||||
33
Earnings before Income Taxes | |||||||||||||||||||||
Three Months Ended | % Change | Six Months Ended | % Change | ||||||||||||||||||
December 31, | December 31, | ||||||||||||||||||||
2019 | 2018 | As Reported | 2019 | 2018 | As Reported | ||||||||||||||||
Employer Services | $ | 767.4 | $ | 733.0 | 5 | % | $ | 1,448.4 | $ | 1,372.9 | 5 | % | |||||||||
PEO Services | 167.1 | 157.3 | 6 | % | 315.5 | 301.1 | 5 | % | |||||||||||||
Other | (99.0 | ) | (149.3 | ) | n/m | (189.3 | ) | (286.2 | ) | n/m | |||||||||||
$ | 835.5 | $ | 741.0 | 13 | % | $ | 1,574.6 | $ | 1,387.8 | 13 | % | ||||||||||
n/m - not meaningful
Employer Services
Revenues
Revenues increased for the three months ended December 31, 2019 due to new business started from New Business Bookings and continued strong retention. Our revenues also increased due to increased interest earned on funds held for clients as a result of growth in average client funds balances, and an increase in the number of employees on our clients’ payrolls as our pays per control increased 2.2% for the three months ended December 31, 2019 as compared to the three months ended December 31, 2018. Our pays per control metric measures the number of employees on our clients' payrolls as measured on a same-store-sales basis utilizing a representative subset of payrolls ranging from small to large businesses that are reflective of a broad range of U.S. geographic regions.
Revenues increased for the six months ended December 31, 2019 due to new business started from New Business Bookings and continued strong retention. Our revenue growth includes about one percentage point of unfavorability from foreign currency partially offset by benefits from acquisitions. Our revenues also increased due to increased interest earned on funds held for clients as a result of growth in average client funds balances, and an increase in the number of employees on our clients’ payrolls as our pays per control increased 2.3% for the six months ended December 31, 2019, as compared to the six months ended December 31, 2018.
Earnings before Income Taxes
Employer Services’ earnings before income taxes increased for the three months ended December 31, 2019 due to increased revenues discussed above, offset by increased expenses due to increased selling and marketing expenses as a result of investments in our sales force and our brand, and amortization expense. These increases in expenses were partially offset by operating efficiencies as a result of our transformation initiatives and the impact from foreign currency.
Employer Services' earnings before income taxes increased for the six months ended December 31, 2019 due to increased revenues discussed above, offset by increased expenses due to increased selling and marketing expenses as a result of investments in our sales force and our brand, costs to service our client base in support of our growing revenue, and amortization expense. These increases in expenses were partially offset by operating efficiencies as a result of our transformation initiatives and the impact from foreign currency.
34
For the three and six months ended December 31, respectively:
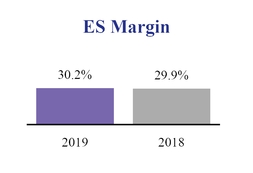

Growth: | á | 30bps | á | 40bps |
Employer Services' overall margin increased for the three and six months ended December 31, 2019 as a result of the continued successful execution of our broad-based transformation initiatives, as well as operating efficiencies. This increase was partially offset by increased selling and marketing expenses and amortization expense.
PEO Services
Revenues
PEO Revenues | |||||||||||||||||||||||||||||
Three Months Ended | Change | Six Months Ended | Change | ||||||||||||||||||||||||||
December 31, | December 31, | ||||||||||||||||||||||||||||
2019 | 2018 | $ | % | 2019 | 2018 | $ | % | ||||||||||||||||||||||
PEO Services' revenues | $ | 1,134.7 | $ | 1,044.7 | $ | 90.0 | 9 | % | $ | 2,191.5 | $ | 2,019.6 | $ | 171.9 | 9 | % | |||||||||||||
Less: PEO zero-margin benefits pass-throughs | 722.4 | 659.7 | 62.7 | 10 | % | 1,421.5 | 1,300.2 | 121.3 | 9 | % | |||||||||||||||||||
PEO Services' revenues excluding zero-margin benefits pass-throughs | $ | 412.3 | $ | 385.0 | $ | 27.3 | 7 | % | $ | 770.0 | $ | 719.4 | $ | 50.6 | 7 | % | |||||||||||||
PEO Services' revenues increased 9% for the three and six months ended December 31, 2019, respectively, due to a 6% and 7% increase in the average number of Worksite Employees for the three and six months ended December 31, 2019, respectively, driven by an increase in the number of new PEO Services clients and growth of our existing clients. PEO Services' revenue excluding zero-margin benefits pass-throughs increased 7% for the three and six months ended December 31, 2019, respectively, and includes pressure from lower workers compensation and State Unemployment Insurance (“SUI”) costs and related pricing.
Earnings before Income Taxes
PEO Services' earnings before income taxes increased 6% for the three months ended December 31, 2019 due to the increased revenues discussed above offset by an increase in expenses of $80.2 million. The increase in expenses was related to an increase in zero-margin benefits pass-through costs of $62.7 million described above and increased selling expenses, partially offset by an increase of $3.1 million in pre-tax benefit related to ADP Indemnity in the three months ended December 31, 2019, as compared to the three months ended December 31, 2018.
PEO Services' earnings before income taxes increased 5% for the six months ended December 31, 2019 due to the increased revenues discussed above offset by an increase in expenses of $157.5 million. The increase in expenses was related to an increase in zero-margin benefits pass-through costs of $121.3 million described above, increased selling expenses and a decrease of $2.2 million in pre-tax benefit related to ADP Indemnity in the six months ended December 31, 2019, as compared to the six months ended December 31, 2018.
35
For the three and six months ended December 31, respectively:
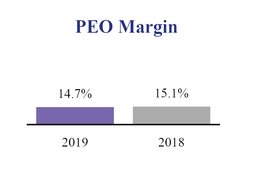

Growth: | â | 30bps | â | 50bps |
PEO Services' overall margin decreased due to increased selling expenses offset by an increase of $3.1 million in pre-tax benefit from ADP Indemnity in the three months ended December 31, 2019, as compared to the three months ended December 31, 2018.
PEO Services' overall margin decreased due to increased selling expenses and a decrease of $2.2 million in pre-tax benefit from ADP Indemnity in the six months ended December 31, 2019, as compared to the six months ended December 31, 2018.
ADP Indemnity provides workers' compensation and employer's liability deductible reimbursement insurance protection for PEO Services' Worksite Employees up to $1 million per occurrence. PEO Services has secured a workers’ compensation and employer’s liability insurance policy that has a $1 million per occurrence retention and, in fiscal years 2012 and prior, aggregate stop loss insurance that covers any aggregate losses within the $1 million retention that collectively exceed a certain level, from an admitted and licensed insurance company of AIG. The Company has obtained approximately $242 million of irrevocable standby letters of credit in favor of licensed insurance companies of AIG to secure TotalSource workers’ compensation obligations if ADP were to fail to reimburse AIG for workers’ compensation payments. The Company had no drawdowns during the six months ended December 31, 2019 and December 31, 2018, respectively, under the letters of credit. We utilize historical loss experience and actuarial judgment to determine the estimated claim liability, and changes in estimated ultimate incurred losses are included in the PEO segment. ADP Indemnity recorded a pre-tax benefit of approximately $4.7 million and $8.1 million for the three and six months ended December 31, 2019, compared to $1.6 million and $10.3 million for the three and six months ended December 31, 2018. For the fiscal years 2013 to 2019, ADP Indemnity paid premiums to enter into reinsurance arrangements with ACE American Insurance Company, a wholly-owned subsidiary of Chubb Limited, to cover substantially all losses incurred by ADP Indemnity during these policy years. Each of these reinsurance arrangements limits our overall exposure incurred up to a certain limit. We believe the likelihood of ultimate losses exceeding this limit is remote. For the six months ended December 31, 2019, ADP Indemnity paid a premium of $215.0 million to enter into a reinsurance arrangement with Chubb Limited to cover substantially all losses incurred by ADP Indemnity for the fiscal 2020 policy year on terms substantially similar to the fiscal 2019 reinsurance policy.
Other
The primary components of the “Other” segment are certain corporate overhead charges and expenses that have not been allocated to the reportable segments, including corporate functions, costs related to our transformation office, non-recurring gains and losses, the elimination of intercompany transactions, and interest expense.
36
Non-GAAP Financial Measures
In addition to our U.S. GAAP results, we use the adjusted results and other non-GAAP metrics set forth in the table below to evaluate our operating performance in the absence of certain items and for planning and forecasting of future periods:
Adjusted Financial Measure | U.S. GAAP Measures |
Adjusted EBIT | Net earnings |
Adjusted provision for income taxes | Provision for income taxes |
Adjusted net earnings | Net earnings |
Adjusted diluted earnings per share | Diluted earnings per share |
Adjusted effective tax rate | Effective tax rate |
Organic constant currency | Revenues |
We believe that the exclusion of the identified items helps us reflect the fundamentals of our underlying business model and analyze results against our expectations and against prior period, and to plan for future periods by focusing on our underlying operations. We believe that the adjusted results provide relevant and useful information for investors because it allows investors to view performance in a manner similar to the method used by management and improves their ability to understand and assess our operating performance. The nature of these exclusions is for specific items that are not fundamental to our underlying business operations. Since these adjusted financial measures and other non-GAAP metrics are not measures of performance calculated in accordance with U.S. GAAP, they should not be considered in isolation from, as a substitute for, or superior to their corresponding U.S. GAAP measures, and they may not be comparable to similarly titled measures at other companies.
37
Three Months Ended | % Change | Six Months Ended | % Change | |||||||||||||||||||
December 31, | December 31, | |||||||||||||||||||||
2019 | 2018 | As Reported | 2019 | 2018 | As Reported | |||||||||||||||||
Net earnings | $ | 651.6 | $ | 558.2 | 17 | % | $ | 1,234.0 | $ | 1,063.6 | 16 | % | ||||||||||
Adjustments: | ||||||||||||||||||||||
Provision for income taxes | 183.9 | 182.8 | 340.6 | 324.2 | ||||||||||||||||||
All other interest expense (a) | 14.7 | 14.9 | 29.5 | 30.0 | ||||||||||||||||||
All other interest income (a) | (5.4 | ) | (6.6 | ) | (13.8 | ) | (14.2 | ) | ||||||||||||||
Gain on sale of assets | (0.2 | ) | — | (0.2 | ) | — | ||||||||||||||||
Transformation initiatives (b) | 9.1 | 37.2 | 8.6 | 69.6 | ||||||||||||||||||
Adjusted EBIT | $ | 853.7 | $ | 786.5 | 9 | % | $ | 1,598.7 | $ | 1,473.2 | 9 | % | ||||||||||
Adjusted EBIT Margin | 23.3 | % | 22.5 | % | 22.3 | % | 21.7 | % | ||||||||||||||
Provision for income taxes | $ | 183.9 | $ | 182.8 | 1 | % | $ | 340.6 | $ | 324.2 | 5 | % | ||||||||||
Adjustments: | ||||||||||||||||||||||
Gain on sale of assets (c) | (0.1 | ) | — | (0.1 | ) | — | ||||||||||||||||
Transformation initiatives (c) | 2.3 | 9.2 | 2.1 | 17.2 | ||||||||||||||||||
Tax Cuts and Jobs Act (d) | — | (0.6 | ) | — | 0.5 | |||||||||||||||||
Adjusted provision for income taxes | $ | 186.1 | $ | 191.4 | (3 | )% | $ | 342.6 | $ | 341.9 | — | % | ||||||||||
Adjusted effective tax rate (e) | 22.0 | % | 24.6 | % | 21.6 | % | 23.4 | % | ||||||||||||||
Net earnings | $ | 651.6 | $ | 558.2 | 17 | % | $ | 1,234.0 | $ | 1,063.6 | 16 | % | ||||||||||
Adjustments: | ||||||||||||||||||||||
Gain on sale of assets | (0.2 | ) | — | (0.2 | ) | — | ||||||||||||||||
Income tax provision on gain on sale of assets (c) | 0.1 | — | 0.1 | — | ||||||||||||||||||
Transformation initiatives (b) | 9.1 | 37.2 | 8.6 | 69.6 | ||||||||||||||||||
Income tax provision for transformation initiatives (c) | (2.3 | ) | (9.2 | ) | (2.1 | ) | (17.2 | ) | ||||||||||||||
Tax Cuts and Jobs Act (d) | — | 0.6 | — | (0.5 | ) | |||||||||||||||||
Adjusted net earnings | $ | 658.3 | $ | 586.8 | 12 | % | $ | 1,240.4 | $ | 1,115.5 | 11 | % | ||||||||||
Diluted EPS | $ | 1.50 | $ | 1.27 | 18 | % | $ | 2.84 | $ | 2.42 | 17 | % | ||||||||||
Adjustments: | ||||||||||||||||||||||
Gain on sale of assets (c) | — | — | — | — | ||||||||||||||||||
Transformation initiatives (b) (c) | 0.02 | 0.06 | 0.01 | 0.12 | ||||||||||||||||||
Tax Cuts and Jobs Act (d) | — | — | — | — | ||||||||||||||||||
Adjusted diluted EPS | $ | 1.52 | $ | 1.34 | 13 | % | $ | 2.86 | $ | 2.54 | 13 | % | ||||||||||
(a) We include the interest income earned on investments associated with our client funds extended investment strategy and interest expense on borrowings related to our client funds extended investment strategy as we believe these amounts to be fundamental to the underlying operations of our business model. The adjustments in the table above represent the interest income and interest expense that is not related to our client funds extended investment strategy and are labeled as “All other interest expense” and “All other interest income.”
(b) The transformation initiatives for the three months ended December 31, 2019 include net reversals of charges related to our
Service Alignment Initiative of $1.8 million, offset by charges of $10.9 million related to other transformation initiatives. The transformation initiatives for the six months ended December 31, 2019 include net reversals of charges related to our Voluntary Early Retirement Program (“VERP”) and Service Alignment Initiative of $7.6 million, and a gain on sale of assets related to our Service Alignment Initiative of $1.9 million, offset by charges of $18.1 million related to other transformation initiatives. Unlike other severance charges which are not included as an adjustment to get to adjusted results, these specific charges relate to actions that are part of our broad-based, company-wide transformation initiative.
38
(c) The tax provision (benefit) on transformation initiatives and gain on sale of assets was calculated based on the annualized marginal rate in effect during the quarter of the adjustment.
(d) There was no impact from the Tax Cuts and Jobs Act in the three and six months ended December 31, 2019.
(e) The Adjusted effective tax rate is calculated as our Adjusted provision for income taxes divided by the sum of our Adjusted net earnings plus our Adjusted provision for income taxes.
The following table reconciles our reported growth rates to the non-GAAP measure of organic constant currency, which excludes the impact of acquisitions, the impact of dispositions, and the impact of foreign currency. The impact of acquisitions and dispositions is calculated by excluding the current year revenues of acquisitions until the one-year anniversary of the transaction and by excluding the prior year revenues of divestitures for the one-year period preceding the transaction. The impact of foreign currency is determined by calculating the current year result using foreign exchange rates consistent with the prior year. The PEO segment is not impacted by acquisitions, dispositions or foreign currency.
Three Months Ended | Six Months Ended | ||||
December 31, | December 31, | ||||
2019 | 2019 | ||||
Consolidated revenue growth as reported | 5 | % | 5 | % | |
Adjustments: | |||||
Impact of acquisitions | — | % | — | % | |
Impact of foreign currency | — | % | — | % | |
Consolidated revenue growth, organic constant currency | 6 | % | 6 | % | |
Employer Services revenue growth as reported | 4 | % | 4 | % | |
Adjustments: | |||||
Impact of acquisitions | — | % | — | % | |
Impact of foreign currency | 1 | % | 1 | % | |
Employer Services revenue growth, organic constant currency | 4 | % | 5 | % | |
FINANCIAL CONDITION, LIQUIDITY AND CAPITAL RESOURCES
For corporate liquidity, we expect existing cash, cash equivalents, short-term marketable securities, and cash flow from operations, together with our $10.3 billion of committed credit facilities and our ability to access both long-term and short-term debt financing from the capital markets, will be adequate to meet our operating, investing, and financing activities such as our regular quarterly dividends, share repurchases, and capital expenditures.
For client funds liquidity, we have the ability to borrow through our financing arrangements under our U.S. short-term commercial paper program and our U.S., Canadian and United Kingdom short-term reverse repurchase agreements together with our $10.3 billion of committed credit facilities and our ability to use corporate liquidity when necessary to meet short-term funding requirements related to client funds obligations. Please see “Quantitative and Qualitative Disclosures about Market Risk” for a further discussion of the risks of our client funds extended investment strategy. See Note 9 of our Consolidated Financial Statements for a description of our short-term financing including commercial paper.
As of December 31, 2019, cash and cash equivalents were $1.5 billion, which were primarily invested in time deposits and money market funds.
39
Operating, Investing and Financing Cash Flows
Our cash flows from operating, investing, and financing activities, as reflected in the Statements of Consolidated Cash Flows for the six months ended December 31, 2019 and 2018, respectively, are summarized as follows:
Six Months Ended | ||||||||||||
December 31, | ||||||||||||
2019 | 2018 | $ Change | ||||||||||
Cash provided by / (used in): | ||||||||||||
Operating activities | $ | 1,130.9 | $ | 931.5 | $ | 199.4 | ||||||
Investing activities | (124.9 | ) | (469.2 | ) | 344.3 | |||||||
Financing activities | 5,525.1 | (1,488.3 | ) | 7,013.4 | ||||||||
Effect of exchange rate changes on cash, cash equivalents, restricted cash, and restricted cash equivalents | (12.2 | ) | (32.1 | ) | 19.9 | |||||||
Net change in cash, cash equivalents, restricted cash, and restricted cash equivalents | $ | 6,518.9 | $ | (1,058.1 | ) | $ | 7,577.0 | |||||
Net cash flows provided by operating activities for the six months ended December 31, 2019 and December 31, 2018 include cash payments for reinsurance agreements of $215.0 million and $218.0 million, respectively, which represent the policy premium for the entire fiscal year. The increase in operating cash provided is due to an increase in net earnings and net favorable change in the components of working capital within operating activities, as compared to the six months ended December 31, 2018.
Net cash flows from investing activities changed due to the timing of proceeds and purchases of corporate and client funds marketable securities of $257.3 million, lower payments made related to acquisitions, partially offset by payments made related to acquisitions of intangibles and capital expenditures in the six months ended December 31, 2019.
Net cash flows from financing activities changed due to a net increase in client fund obligations of $8,660.8 million, which is due to the timing of impounds from our clients and payments to our clients' employees and other payees, partially offset by more cash returned to shareholders via dividends and share repurchases, a repayment of reverse repurchase agreements and a decrease of net proceeds commercial paper borrowings for the six months ended December 31, 2019.
We purchased 3.7 million shares of our common stock at an average price per share of $164.99 during the six months ended December 31, 2019, as compared to purchases of 3.8 million shares at an average price per share of $139.16 during the six months ended December 31, 2018. From time to time, the Company may repurchase shares of its common stock under its authorized share repurchase programs. The Company considers several factors in determining when to execute share repurchases, including, among other things, actual and potential acquisition activity, cash balances and cash flows, issuances due to employee benefit plan activity, and market conditions.
Capital Resources and Client Funds Obligations
We have $2.0 billion of senior unsecured notes with maturity dates in 2020 and 2025. We may from time to time revisit the long-term debt market to refinance existing debt, finance investments including acquisitions for our growth, and maintain the appropriate capital structure. However, there can be no assurance that volatility in the global capital and credit markets would not impair our ability to access these markets on terms acceptable to us, or at all. See Note 10 of our Consolidated Financial Statements for a description of our long-term financing.
Our U.S. short-term funding requirements related to client funds are sometimes obtained on an unsecured basis through the issuance of commercial paper, rather than liquidating previously-collected client funds that have already been invested in available-for-sale securities. This commercial paper program provides for the issuance of up to $10.3 billion in aggregate maturity value. Our commercial paper program is rated A-1+ by Standard & Poor’s and Prime-1 (“P-1”) by Moody’s. These ratings denote the highest quality commercial paper securities. Maturities of commercial paper can range from overnight to up to 364 days. At December 31, 2019 and June 30, 2019, the Company had no commercial paper borrowing outstanding. Details of the borrowings under the commercial paper program are as follows:
40
Three Months Ended | Six Months Ended | ||||||||||||||
December 31, | December 31, | ||||||||||||||
2019 | 2018 | 2019 | 2018 | ||||||||||||
Average daily borrowings (in billions) | $ | 3.5 | $ | 3.8 | $ | 3.7 | $ | 3.8 | |||||||
Weighted average interest rates | 1.7 | % | 2.3 | % | 2.0 | % | 2.1 | % | |||||||
Weighted average maturity (approximately in days) | 2 days | 2 days | 2 days | 2 days | |||||||||||
Our U.S., Canadian and United Kingdom short-term funding requirements related to client funds obligations are sometimes obtained on a secured basis through the use of reverse repurchase agreements, which are collateralized principally by government and government agency securities, rather than liquidating previously-collected client funds that have already been invested in available-for-sale securities. These agreements generally have terms ranging from overnight to up to five business days. We have successfully borrowed through the use of reverse repurchase agreements on an as-needed basis to meet short-term funding requirements related to client funds obligations. At December 31, 2019 there were no outstanding obligations related to reverse repurchase agreements. At June 30, 2019, the Company had $262.0 million of outstanding obligations related to the reverse repurchase agreements, which were fully paid in early July 2019. Details of the reverse repurchase agreements are as follows:
Three Months Ended | Six Months Ended | |||||||||||||
December 31, | December 31, | |||||||||||||
2019 | 2018 | 2019 | 2018 | |||||||||||
Average outstanding balances | $ | 335.9 | $ | 325.4 | $ | 381.2 | 410.2 | |||||||
Weighted average interest rates | 1.7 | % | 1.9 | % | 1.8 | % | 1.8 | % | ||||||
We vary the maturities of our committed credit facilities to limit the refinancing risk of any one facility. We have a $3.8 billion, 364-day credit agreement that matures in June 2020 with a one year term-out option. In addition, we have a five-year $2.75 billion credit facility and a five-year $3.75 billion credit facility maturing in June 2024 and June 2023, respectively, each with an accordion feature under which the aggregate commitment can be increased by $500 million, subject to the availability of additional commitments. The primary uses of the credit facilities are to provide liquidity to the commercial paper program and funding for general corporate purposes, if necessary. We had no borrowings through December 31, 2019 under the credit facilities. We believe that we currently meet all conditions set forth in the revolving credit agreements to borrow thereunder and we are not aware of any conditions that would prevent us from borrowing part or all of the $10.3 billion available to us under the revolving credit agreements. See Note 9 of our Consolidated Financial Statements for a description of our short-term financing including credit facilities.
Our investment portfolio does not contain any asset-backed securities with underlying collateral of sub-prime mortgages, alternative-A mortgages, sub-prime auto loans or sub-prime home equity loans, collateralized debt obligations, collateralized loan obligations, credit default swaps, derivatives, auction rate securities, structured investment vehicles or non-investment grade fixed-income securities. We own AAA-rated senior tranches of fixed rate auto loan, credit card, equipment lease and rate reduction receivables, secured predominantly by prime collateral. All collateral on asset-backed securities is performing as expected. In addition, we own senior debt directly issued by Federal Home Loan Banks and Federal Farm Credit Banks. Our client funds investment strategy is structured to allow us to average our way through an interest rate cycle by laddering the maturities of our investments out to five years (in the case of the extended portfolio) and out to ten years (in the case of the long portfolio). This investment strategy is supported by our short-term financing arrangements necessary to satisfy short-term funding requirements relating to client funds obligations. See Note 6 of our Consolidated Financial Statements for a description of our corporate investments and funds held for clients.
Capital expenditures for the six months ended December 31, 2019 were $94.1 million, as compared to $77.0 million for the six months ended December 31, 2018. Capital expenditures for fiscal 2020 are expected to be about $175 million, as compared to $163 million in fiscal 2019.
QUANTITATIVE AND QUALITATIVE DISCLOSURES ABOUT MARKET RISK
Our overall investment portfolio is comprised of corporate investments (cash and cash equivalents, short-term and long-term marketable securities) and client funds assets (funds that have been collected from clients but have not yet been remitted to the applicable tax authorities or client employees).
41
Our corporate investments are invested in cash and cash equivalents and highly liquid, investment-grade marketable securities. These assets are available for our regular quarterly dividends, share repurchases, capital expenditures and/or acquisitions, as well as other corporate operating purposes. All of our short-term and long-term fixed-income securities are classified as available-for-sale securities.
Our client funds assets are invested with safety of principal, liquidity, and diversification as the primary objectives. Consistent with those objectives, we also seek to maximize interest income and to minimize the volatility of interest income. Client funds assets are invested in highly liquid, investment-grade marketable securities, with a maximum maturity of 10 years at the time of purchase, and money market securities and other cash equivalents.
We utilize a strategy by which we extend the maturities of our investment portfolio for funds held for clients and employ short-term financing arrangements to satisfy our short-term funding requirements related to client funds obligations. Our client funds investment strategy is structured to allow us to average our way through an interest rate cycle by laddering the maturities of our investments out to five years (in the case of the extended portfolio) and out to ten years (in the case of the long portfolio). As part of our client funds investment strategy, we use the daily collection of funds from our clients to satisfy other unrelated client funds obligations, rather than liquidating previously-collected client funds that have already been invested in available-for-sale securities. We minimize the risk of not having funds collected from a client available at the time such client’s obligation becomes due by impounding, in virtually all instances, the client’s funds in advance of the timing of payment of such client’s obligation. As a result of this practice, we have consistently maintained the required level of client funds assets to satisfy all of our obligations.
There are inherent risks and uncertainties involving our investment strategy relating to our client funds assets. Such risks include liquidity risk, including the risk associated with our ability to liquidate, if necessary, our available-for-sale securities in a timely manner in order to satisfy our client funds obligations. However, our investments are made with the safety of principal, liquidity, and diversification as the primary goals to minimize the risk of not having sufficient funds to satisfy all of our client funds obligations. We also believe we have significantly reduced the risk of not having sufficient funds to satisfy our client funds obligations by consistently maintaining access to other sources of liquidity, including our corporate cash balances, available borrowings under our $10.3 billion commercial paper program (rated A-1+ by Standard and Poor’s and P-1 by Moody’s, the highest possible credit ratings), and our ability to engage in reverse repurchase agreement transactions and available borrowings under our $10.3 billion committed credit facilities. The reduced availability of financing during periods of economic turmoil, even to borrowers with the highest credit ratings, may limit our ability to access short-term debt markets to meet the liquidity needs of our business. In addition to liquidity risk, our investments are subject to interest rate risk and credit risk, as discussed below.
We have established credit quality, maturity, and exposure limits for our investments. The minimum allowed credit rating at time of purchase for corporate, Canadian government agency and Canadian provincial bonds is BBB, for asset-backed securities is AAA, and for municipal bonds is A. The maximum maturity at time of purchase for BBB-rated securities is 5 years, for single A rated securities is 7 years, and for AA-rated and AAA-rated securities is 10 years. Time deposits and commercial paper must be rated A-1 and/or P-1. Money market funds must be rated AAA/Aaa-mf.
42
Details regarding our overall investment portfolio are as follows:
Three Months Ended | Six Months Ended | ||||||||||||||
December 31, | December 31, | ||||||||||||||
2019 | 2018 | 2019 | 2018 | ||||||||||||
Average investment balances at cost: | |||||||||||||||
Corporate investments | $ | 5,142.0 | $ | 5,600.2 | $ | 5,598.5 | $ | 5,752.5 | |||||||
Funds held for clients | 25,051.7 | 23,575.6 | 24,366.6 | 22,876.3 | |||||||||||
Total | $ | 30,193.7 | $ | 29,175.8 | $ | 29,965.1 | $ | 28,628.8 | |||||||
Average interest rates earned exclusive of realized (gains)/losses on: | |||||||||||||||
Corporate investments | 2.0 | % | 2.0 | % | 2.1 | % | 2.0 | % | |||||||
Funds held for clients | 2.2 | % | 2.2 | % | 2.2 | % | 2.2 | % | |||||||
Total | 2.2 | % | 2.2 | % | 2.2 | % | 2.1 | % | |||||||
Realized gains on available-for-sale securities | $ | (7.6 | ) | $ | (0.3 | ) | $ | (10.1 | ) | $ | (0.6 | ) | |||
Realized losses on available-for-sale securities | 0.5 | 0.8 | 0.7 | 2.0 | |||||||||||
Net realized (gains)/losses on available-for-sale securities | $ | (7.1 | ) | $ | 0.5 | $ | (9.4 | ) | $ | 1.4 | |||||
December 31, 2019 | June 30, 2019 | ||||||
Net unrealized pre-tax gains on available-for-sale securities | $ | 338.7 | $ | 287.5 | |||
Total available-for-sale securities at fair value | $ | 24,801.1 | $ | 24,859.1 | |||
We are exposed to interest rate risk in relation to securities that mature, as the proceeds from maturing securities are reinvested. Factors that influence the earnings impact of interest rate changes include, among others, the amount of invested funds and the overall portfolio mix between short-term and long-term investments. This mix varies during the fiscal year and is impacted by daily interest rate changes. The annualized interest rates earned on our entire portfolio increased from 2.1% for the six months ended December 31, 2018 to 2.2% for the six months ended December 31, 2019. A hypothetical change in both short-term interest rates (e.g., overnight interest rates or the federal funds rate) and intermediate-term interest rates of 25 basis points applied to the estimated average investment balances and any related short-term borrowings would result in approximately a $15 million impact to earnings before income taxes over the ensuing twelve-month period ending December 31, 2020. A hypothetical change in only short-term interest rates of 25 basis points applied to the estimated average short-term investment balances and any related short-term borrowings would result in approximately a $5 million impact to earnings before income taxes over the ensuing twelve-month period ending December 31, 2020.
We are exposed to credit risk in connection with our available-for-sale securities through the possible inability of the borrowers to meet the terms of the securities. We limit credit risk by investing in investment-grade securities, primarily AAA-rated and AA-rated securities, as rated by Moody’s, Standard & Poor’s, DBRS for Canadian dollar denominated securities, and Fitch for asset-backed and commercial mortgage backed securities. Approximately 78% of our available-for-sale securities held a AAA-rating or AA-rating at December 31, 2019. In addition, we limit amounts that can be invested in any security other than U.S. government and government agency, Canadian government, and United Kingdom government securities.
We operate and transact business in various foreign jurisdictions and are therefore exposed to market risk from changes in foreign currency exchange rates that could impact our consolidated results of operations, financial position, or cash flows. We manage our exposure to these market risks through our regular operating and financing activities and, when deemed appropriate, through the use of derivative financial instruments. We may use derivative financial instruments as risk management tools and not for trading purposes.
43
CRITICAL ACCOUNTING POLICIES
Our Consolidated Financial Statements and accompanying notes have been prepared in accordance with accounting principles generally accepted in the United States of America (“U.S. GAAP”). The preparation of these financial statements requires management to make estimates, judgments, and assumptions that affect reported amounts of assets, liabilities, revenues, expenses, and other comprehensive income. We continually evaluate the accounting policies and estimates used to prepare the Consolidated Financial Statements. The estimates are based on historical experience and assumptions believed to be reasonable under current facts and circumstances. Actual amounts and results could differ from these estimates made by management. Refer to Note 2 of our Consolidated Financial Statements for changes to our accounting policies effective for the fiscal 2020.
NEW ACCOUNTING PRONOUNCEMENTS
See Note 2, New Accounting Pronouncements, of Notes to the Consolidated Financial Statements for a discussion of recent accounting pronouncements.
Item 3. Quantitative and Qualitative Disclosures About Market Risk
The information called for by this item is provided under the caption “Quantitative and Qualitative Disclosures about Market Risk” under Item 2 – Management's Discussion and Analysis of Financial Condition and Results of Operations.
Item 4. Controls and Procedures
The Company carried out an evaluation, under the supervision and with the participation of the Company's management, including its Chief Executive Officer and Chief Financial Officer, of the effectiveness of the Company's disclosure controls and procedures, as defined in Rules 13a-15(e) and 15d-15(e) of the Securities Exchange Act of 1934 (the “evaluation”). Disclosure controls and procedures include, without limitation, controls and procedures designed to ensure that information required to be disclosed by the Company in the reports that it files or submits under the Securities Exchange Act of 1934 is accumulated and communicated to the Company's management, including its Chief Executive Officer and Chief Financial Officer, or persons performing similar functions, as appropriate to allow timely decisions regarding required disclosure. Based on the evaluation, the Company's Chief Executive Officer and Chief Financial Officer have concluded that the Company's disclosure controls and procedures were effective as of December 31, 2019 in ensuring that (i) information required to be disclosed by the Company in reports that it files or submits under the Securities Exchange Act of 1934 is accumulated and communicated to the Company's management, including its Chief Executive Officer and Chief Financial Officer, to allow timely decisions regarding required disclosure and (ii) such information is recorded, processed, summarized and reported within the time periods specified in the Securities and Exchange Commission's rules and forms.
There was no change in the Company's internal control over financial reporting that occurred during the three months ended December 31, 2019 that has materially affected, or is reasonably likely to materially affect, the Company's internal control over financial reporting.
PART II. OTHER INFORMATION
Except as noted below, all other items are either inapplicable or would result in negative responses and, therefore, have been omitted.
Item 1. Legal Proceedings
In the normal course of business, the Company is subject to various claims and litigation. While the outcome of any litigation is inherently unpredictable, the Company believes it has valid defenses with respect to the legal matters pending against it and the Company believes that the ultimate resolution of these matters will not have a material adverse impact on its financial condition, results of operations, or cash flows.
Item 1A. Risk Factors
There have been no material changes in our risk factors disclosed in Part 1, Item 1A, of our Annual Report on Form 10-K for the fiscal year ended June 30, 2019.
44
Item 2. Unregistered Sales of Equity Securities and Use of Proceeds.
Issuer Purchases of Equity Securities
Total Number of Shares Purchased (1) | Average Price Paid per Share | Total Number of Shares Purchased as Part of the Publicly Announced Common Stock Repurchase Plan (2) | Maximum Number (or Approximate Dollar Value) of Shares that may yet be Purchased under the Common Stock Repurchase Plan (2) | |||||||||||
Period | ||||||||||||||
October 1 to 31, 2019 | 714,248 | $ | 161.08 | 714,020 | 7,347,656 | |||||||||
November 1 to 11, 2019 | 217,381 | $ | 161.62 | 216,585 | 7,131,071 | |||||||||
November 12 to 30, 2019 | 307,724 | $ | 169.78 | 300,404 | $ | 4,949,003,740 | ||||||||
December 1 to 31, 2019 | 618,715 | $ | 168.95 | 617,922 | $ | 4,844,607,795 | ||||||||
Total | 1,858,068 | 1,848,931 | ||||||||||||
(1) During the three months ended December 31, 2019, pursuant to the terms of the Company's restricted stock program, the Company purchased 9,137 shares at the then market value of the shares in connection with the vesting of restricted shares of employees under such program to satisfy certain tax withholding requirements through the delivery of shares to the Company instead of cash.
(2) On November 12, 2019, the Board of Directors authorized the repurchase of $5 billion of our common stock, replacing in its entirety the previous 2015 authorization to purchase up to 25 million shares of common stock, included in the table above as follows:
Date of Approval | |
August 2015 | 25 million shares |
November 2019 | $5 billion |
There is no expiration date for the new common stock repurchase plan.
45
Item 6. Exhibits
Exhibit Number | Exhibit |
Certification by Carlos A. Rodriguez pursuant to Rule 13a-14(a) of the Securities Exchange Act of 1934 | |
Certification by Kathleen A. Winters pursuant to Rule 13a-14(a) of the Securities Exchange Act of 1934 | |
Certification by Carlos A. Rodriguez pursuant to 18 U.S.C. Section 1350, as adopted pursuant to Section 906 of the Sarbanes-Oxley Act of 2002 | |
Certification by Kathleen A. Winters pursuant to 18 U.S.C. Section 1350, as adopted pursuant to Section 906 of the Sarbanes-Oxley Act of 2002 | |
101.INS | Instance Document - the instance document does not appear in the Interactive Data File because its XBRL tags are embedded within the Inline XBRL document |
101.SCH | Inline XBRL Taxonomy Extension Schema |
101.CAL | Inline XBRL Taxonomy Extension Calculation Linkbase |
101.LAB | Inline XBRL Taxonomy Label Linkbase |
101.PRE | Inline XBRL Taxonomy Extension Presentation Linkbase |
101.DEF | Inline XBRL Taxonomy Extension Definition Document |
104 | Cover Page Interactive Data File - the cover page interactive data file does not appear in the Interactive Data File because its XBRL tags are embedded within the Inline XBRL document |
46
SIGNATURES
Pursuant to the requirements of the Securities Exchange Act of 1934, the registrant has duly caused this report to be signed on its behalf by the undersigned thereunto duly authorized.
AUTOMATIC DATA PROCESSING, INC. (Registrant) | ||
Date: | January 31, 2020 | /s/ Kathleen A. Winters Kathleen A. Winters |
Chief Financial Officer (Title) | ||
47
Similar companies
See also Workday, Inc. - Annual report 2023 (10-K 2023-01-31) Annual report 2025 (10-Q 2025-07-31)See also Verisk Analytics, Inc. - Annual report 2022 (10-K 2022-12-31) Annual report 2023 (10-Q 2023-09-30)
See also Toast, Inc. - Annual report 2024 (10-K 2024-12-31) Annual report 2025 (10-Q 2025-06-30)
See also Zendesk, Inc. - Annual report 2021 (10-K/A 2021-12-31) Annual report 2022 (10-Q 2022-09-30)
See also Globant S.A.