BARNES GROUP INC - Annual Report: 2022 (Form 10-K)
UNITED STATES
SECURITIES AND EXCHANGE COMMISSION
Washington, D.C. 20549
FORM 10-K
| ☒ | ANNUAL REPORT PURSUANT TO SECTION 13 OR 15(d) OF THE SECURITIES EXCHANGE ACT OF 1934 | ||||
For the fiscal year ended December 31, 2022
| ☐ | TRANSITION REPORT PURSUANT TO SECTION 13 OR 15(d) OF THE SECURITIES EXCHANGE ACT OF 1934 | ||||
For the transition period from to
Commission file number 1-4801
BARNES GROUP INC.
(Exact name of registrant as specified in its charter)
| Delaware |  | 06-0247840 | ||||||||||||
| (State of incorporation) | (I.R.S. Employer Identification No.) | |||||||||||||
| 123 Main Street | ||||||||||||||
| Bristol | ||||||||||||||
| Connecticut | 06010 | |||||||||||||
| (Address of Principal Executive Office) | (Zip Code) | |||||||||||||
(860) 583-7070
Registrant’s telephone number, including area code
Securities registered pursuant to Section 12(b) of the Act:
| Title of Each Class | Trading Symbol | Name of Each Exchange on Which Registered | ||||||||||||
| Common Stock, par value $0.01 per share | B | New York Stock Exchange | ||||||||||||
Securities registered pursuant to Section 12(g) of the Act:
None
Indicate by check mark if the registrant is a well-known seasoned issuer, as defined in Rule 405 of the Securities Act. Yes x No ¨
Indicate by check mark if the registrant is not required to file reports pursuant to Section 13 or Section 15(d) of the Act. Yes ¨ No x
Indicate by check mark whether the registrant (1) has filed all reports required to be filed by Section 13 or 15(d) of the Securities Exchange Act of 1934 during the preceding 12 months (or for such shorter period that the registrant was required to file such reports), and (2) has been subject to such filing requirements for the past 90 days. Yes x No ¨
Indicate by check mark whether the registrant has submitted electronically every Interactive Data File required to be submitted pursuant to Rule 405 of Regulation S-T (§ 232.405 of this chapter) during the preceding 12 months (or for such shorter period that the registrant was required to submit such files). Yes x No ¨
Indicate by check mark whether the registrant is a large accelerated filer, an accelerated filer, a non-accelerated filer, a smaller reporting company, or an emerging growth company. See the definitions of “large accelerated filer,” “accelerated filer,” “smaller reporting company,” and "emerging growth company" in Rule 12b-2 of the Exchange Act.
| Large accelerated filer | ☒ | Accelerated filer | ☐ | ||||||||
| Non-accelerated filer | ☐ | Smaller reporting company | ☐ | ||||||||
| Emerging growth company | ☐ | ||||||||||
If an emerging growth company, indicate by check mark if the registrant has elected not to use the extended transition period for complying with any new or revised financial accounting standards provided pursuant to Section 13(a) of the Exchange Act. ¨
Indicate by check mark whether the registrant has filed a report on and attestation to its management’s assessment of the effectiveness of its internal control over financial reporting under Section 404(b) of the Sarbanes-Oxley Act (15 U.S.C. 7262(b)) by the registered public accounting firm that prepared or issued its audit report. ☒
Indicate by check mark whether the registrant is a shell company (as defined in Rule 12b-2 of the Act). Yes ☐ No x
The aggregate market value of the voting stock (Common Stock) held by non-affiliates of the registrant as of the close of business on June 30, 2022 was approximately $1,512,703,137 based on the closing price of the Common Stock on the New York Stock Exchange on that date. The registrant does not have any non-voting common equity.
The registrant had outstanding 50,602,273 shares of common stock as of February 15, 2023.
Documents Incorporated by Reference
Portions of the registrant’s definitive proxy statement to be delivered to stockholders in connection with the Annual Meeting of Stockholders to be held on May 5, 2023 are incorporated by reference into Part III.
Barnes Group Inc.
Index to Form 10-K
Year Ended December 31, 2022
| Page | ||||||||
| Part I | ||||||||
| Item 1. | ||||||||
| Item 1A. | ||||||||
| Item 1B. | ||||||||
| Item 2. | ||||||||
| Item 3. | ||||||||
| Item 4. | ||||||||
| Part II | ||||||||
| Item 5. | ||||||||
| Item 6. | ||||||||
| Item 7. | ||||||||
| Item 7A. | ||||||||
| Item 8. | ||||||||
| Item 9. | ||||||||
| Item 9A. | ||||||||
| Item 9B. | ||||||||
| Item 9C. | ||||||||
| Part III | ||||||||
| Item 10. | ||||||||
| Items 11-14. | ||||||||
| Part IV | ||||||||
| Item 15. | ||||||||
| Item 16. | ||||||||
FORWARD-LOOKING STATEMENTS
This Annual Report may contain forward-looking statements as defined in the Private Securities Litigation Reform Act of 1995. Forward-looking statements often address our expected future operating and financial performance and financial condition, and often contain words such as "anticipate," "believe," "expect," "plan," "estimate," "project," "continue," "will," "should," "may," and similar terms. These forward-looking statements do not constitute guarantees of future performance and are subject to a variety of risks and uncertainties that may cause actual results to differ materially from those expressed in the forward-looking statements. These include, among others: the Company’s ability to manage economic, business and geopolitical conditions, including rising interest rates, global price inflation and shortages impacting the availability of materials; the duration and severity of the COVID-19 pandemic, and governments’ responses to the pandemic such as regional lockdowns, including their impacts across our business on demand, supply chains, operations and liquidity; failure to successfully negotiate collective bargaining agreements or potential strikes, work stoppages or other similar events; changes in market demand for our products and services; rapid technological and market change; the ability to protect and avoid infringing upon intellectual property rights; challenges associated with the introduction or development of new products or transfer of work; higher risks in global operations and markets; the impact of intense competition; the physical and operational risks from natural disasters, severe weather events, and climate change which may limit accessibility to sufficient water resources,
outbreaks of contagious diseases and other adverse public health developments; acts of war, terrorism and other international conflicts; the failure to achieve anticipated cost savings and benefits associated with workforce reductions and restructuring actions; currency fluctuations and foreign currency exposure; impacts from goodwill impairment and related charges; our dependence upon revenues and earnings from a small number of significant customers; a major loss of customers; inability to realize expected sales or profits from existing backlog due to a range of factors, including changes in customer sourcing decisions, material changes, production schedules and volumes of specific programs; the impact of government budget and funding decisions; government-imposed sanctions, tariffs, trade agreements and trade policies; changes or uncertainties in laws, regulations, rates, policies or interpretations that impact the Company’s business operations or tax status, including those that address climate change, environmental, health and safety matters, and the materials processed by our products or their end markets; fluctuations in the pricing or availability of raw materials, freight, transportation, energy, utilities and other items required by our operations; labor shortages or other business interruptions at transportation centers, shipping ports, our suppliers’ facilities or our facilities; disruptions in information technology systems, including as a result of cybersecurity attacks or data security breaches; the ability to hire and retain senior management and qualified personnel; the continuing impact of prior acquisitions and divestitures, and any other future strategic actions, and our ability to achieve the financial and operational targets set in connection with any such actions; the ability to achieve social and environmental performance goals; the outcome of pending and future litigation and governmental proceedings; the impact of actual, potential or alleged defects or failures of our products or third-party products within which our products are integrated, including product liabilities, product recall costs and uninsured claims; future repurchases of common stock; future levels of indebtedness; the impact of shareholder activism; and other risks and uncertainties described in documents filed with or furnished to the Securities and Exchange Commission ("SEC") by the Company, including, among others, those in the Management's Discussion and Analysis of Financial Condition and Results of Operations and Risk Factors sections of the Company's filings. The Company assumes no obligation to update its forward-looking statements.
PART I
Item 1. Business
BARNES GROUP INC. (1)
Barnes Group Inc. (the “Company” or "Barnes") is a global provider of highly engineered products, differentiated industrial technologies, and innovative solutions, serving a wide range of end markets and customers. Its specialized products and services are used in far-reaching applications including healthcare, automation, packaging, aerospace, mobility, and manufacturing. The Company’s skilled and dedicated employees around the globe are committed to the highest performance standards and achieving consistent, sustainable profitable growth.
Our Strategy
The Company’s strategy has evolved to focus on two critical initiatives to unlock the full potential of Barnes’ enterprise value:
Core Business Execution by Driving “Top Line, Bottom Line & Pipeline Growth.” We drive Top Line by identifying business activities that strengthen our direct connection with customers to increase bookings and effectively convert these into revenue. We drive Bottom Line by leveraging each Top Line growth opportunity using commercial excellence combined with operational productivity to generate improved profitability. This improved profitability funds future pipeline investments. We drive Pipeline Growth by re-investing into product line innovation and intimate customer engagement to increase the vibrancy and attractiveness of Barnes to existing and future customers. These will be reflected in increased sales opportunities that in turn drive our Top Line growth.
Integrate, Consolidate & Rationalize. We integrate our businesses, product lines, go-to-market strategies and processes to deliver improved effectiveness by leveraging the broad capabilities of the Company with each customer globally. We consolidate, including through the multi-phase facility consolidation projects already underway at Barnes, to drive facility utilization improvements, better leverage of manufacturing operations, and inefficiency reduction across the organization. We rationalize by carefully & comprehensively evaluating all operational costs and investments to focus expenditures on driving Return on Invested Capital in the most impactful manner.
These two focus initiatives will collectively work to drive transformational value creation for all Barnes stakeholders.
Structure
The Company operates under two global business segments: Industrial and Aerospace. The Industrial segment, through 2022, included the Molding Solutions, Force & Motion Control, Automation and Engineered Components business units. The Aerospace segment includes the Original Equipment Manufacturing (“OEM”) business and the Aftermarket business, which includes maintenance repair and overhaul (“MRO”) services and the manufacture and delivery of aerospace aftermarket spare parts.
REPORTABLE SEGMENTS
Industrial
The Industrial segment is a global provider of highly-engineered, high-quality precision components, products and systems for critical applications serving a diverse customer base in end-markets such as mobility, industrial equipment, automation, personal care, packaging, electronics, and medical devices. Focused on innovative custom solutions, Industrial participates in the design phase of components and assemblies whereby customers receive the benefits of application and systems engineering, new product development, testing and evaluation, and the manufacturing of final products. Products are sold primarily through its direct sales force and global distribution channels. Industrial's Molding Solutions business designs and manufactures customized hot runner systems, advanced mold cavity sensors and process control systems, and precision high cavitation mold assemblies - collectively, the enabling technologies for many complex injection molding applications. The Force & Motion Control business provides innovative cost-effective force and motion control solutions for a wide range of metal forming and other industrial markets. The Automation business designs and develops robotic grippers, advanced end-of-arm tooling systems, sensors and other automation components for intelligent robotic handling solutions and industrial automation applications. Industrial's Engineered Components business manufactures and supplies precision mechanical
__________
(1) As used in this annual report, “Company,” “Barnes Group,” “we” and “our” refer to the registrant and its consolidated subsidiaries except where the context requires otherwise, and “Industrial” and “Aerospace” refer to the registrant’s segments, not to separate corporate entities.
1
products used in transportation and industrial applications, including mechanical springs and high-precision punched and fine-blanked components. As we continue the work of delivering on our growth strategy and driving focus on the integration, consolidation, and rationalization of our global businesses, effective January 1, 2023, we combined our Force & Motion Control business and Engineered Components business to form a single new strategic business named Motion Control Solutions. The formation of Motion Control Solutions aligns with our “Integrate, Consolidate & Rationalize” initiative as we continue to transform the Company.
Industrial competes with a broad base of large and small companies engaged in the manufacture and sale of engineered products, precision molds, hot runner systems, robotic handling solutions and precision components. Industrial competes on the basis of quality, service, reliability of supply, engineering and technical capability, geographic reach, product breadth, innovation, design, timeliness and price. Industrial has a global presence, with manufacturing, distribution and assembly operations in the United States, China, Germany, Italy, Sweden and Switzerland, among others. Industrial also has sales and service operations in the United States, China/Hong Kong, Germany, Italy and Switzerland, among others. For additional information regarding net sales by geographic area, refer to Notes 3 and 21 of the Consolidated Financial Statements. Sales by Industrial to its five largest customers accounted for approximately 10% of its sales in 2022.
Aerospace
Aerospace is a global manufacturer of complex fabricated and precision-machined components and assemblies for turbine engines, nacelles and structures for both commercial and defense-related aircraft. The Aerospace Aftermarket business provides aircraft engine component MRO services, including services performed under our Component Repair Programs (“CRPs”), for many of the world’s major turbine engine manufacturers, commercial airlines and the defense market. The Aerospace Aftermarket business also manufactures and delivers aftermarket spare parts and participates in revenue sharing programs (“RSPs”) under which the Company has an exclusive right to supply designated aftermarket parts over the life of specific aircraft engine programs.
Aerospace’s OEM business offers a comprehensive range of in-house manufacturing solutions and capabilities, including components and assemblies. The applications for these components primarily include engines, airframes and nacelles. Aerospace OEM competes with a large number of fabrication and machining companies. Our competitive advantage is based mainly on value derived from quality, concurrent engineering and technical capability, product breadth, solutions-providing new product introduction, timeliness, service and price. Aerospace’s fabrication and machining operations, with facilities in Connecticut, Michigan, Ohio, Utah, Malaysia and Singapore, produce critical engine, nacelle and airframe components through technologically advanced manufacturing processes.
The Aerospace Aftermarket business supplements jet engine OEMs’ maintenance, repair and overhaul capabilities, and competes with the service centers of major commercial airlines and other independent service companies for the repair and overhaul of turbine engine components. The manufacture and supply of aerospace aftermarket spare parts, including those related to the RSPs, are dependent upon the reliable and timely delivery of high-quality components. Aerospace’s Aftermarket facilities, located in Connecticut, Ohio and Singapore, specialize in the repair and refurbishment of highly engineered components and assemblies such as cases, rotating life limited parts, rotating air seals, turbine shrouds, vanes and honeycomb air seals. Aerospace Aftermarket's facility in Malaysia is focused on the supply of spare parts. For additional information regarding net sales by geographic area, refer to Notes 3 and 21 of the Consolidated Financial Statements. Sales by Aerospace to its largest customer, General Electric ("GE"), accounted for approximately 57% of its total sales in 2022 . Sales to its next three largest customers in 2022 collectively accounted for approximately 15% of its total sales.
RESOURCES OF THE BUSINESS
Human Capital Management
Our people are one of our greatest assets. Our skilled and dedicated employees around the globe are committed to the highest performance standards and achieving consistent, sustainable profitable growth. At December 31, 2022, the Company had approximately 5,200 employees worldwide. Approximately 20% were in the Asia-Pacific region, approximately 40% in the Europe, Middle East and Africa region and approximately 40% in the Americas region.
The Company maintains a global Health, Safety and Environmental Affairs ("HSE") program which focuses on employee safety throughout the enterprise. Our HSE program maintains a set of HSE standards, consistent with our commitment to worker health and safety and to environmental protection, as well as with prevailing regulatory frameworks in place around the globe. All locations are required to meet local laws and regulations, or our Company's HSE standards, whichever are more
2
stringent. We measure and monitor results using standard protocols. These results are communicated to the senior leadership team and Board of Directors on a regular basis.
The Company’s long history is grounded in its core values and principles which have guided our ongoing transformation and growth. Our Company Values promote a culture of collaboration, empowerment, diversity and inclusion, and an environment providing opportunity, dignity and respect for all of our employees. Grounded in these values and as an integral part of the Barnes Enterprise System ("BES"), we manage human capital through our Talent Management System ("TMS"). TMS integrates our key human resource processes and tools to facilitate talent management decisions and enables the Company to have the right people with the right skills in the right roles at the right time. TMS enhances our ability to attract and hire talented employees, as well as supports their growth, development and engagement - empowering them to perform at their very best, every day. Aligned with our vision, TMS helps accelerate the ongoing transformation of our Company, to drive business performance, and support the successful execution of the Company’s growth strategy.
The TMS framework focuses on five key areas (pillars) - Attract, Perform, Develop, Engage and Recognize – all supported by tools and processes that our employees, managers and leaders can use to support their own professional growth and development, as well as leverage to make better talent management decisions that promote and cultivate an agile and high performance organization.
Attract – encompasses the processes and tools available to employees and management that support and facilitates the planning and effective recruiting, hiring and on-boarding of our employees.
Perform – highlights the processes and tools that help our employees fully leverage and utilize their skills and capabilities to perform at their best and contribute meaningfully to achieving the goals and objectives of the business.
Develop – comprises the Human Resource processes and tools that support the growth and development of our employees through on-going training, skill-building, assessment, career planning and development and enrichment opportunities.
Engage – contains Human Resource programs and tools that support employee engagement and involvement across the Company and in the communities in which our employees work and live.
Recognize – aligned with our “pay-for-performance” philosophy, highlights Human Resource processes and programs used to recognize and reward our employees and facilitate their on-going engagement. Furthermore, our compensation programs are designed to align the compensation of our employees with the Company’s performance, and provide the proper incentives to attract, retain and motivate employees to achieve superior results for both short-term and long-term performance.
In managing our global businesses, and as part of TMS, we focus on several human capital measures and objectives including those related to the hiring, performance, succession planning and retention of our employees. We accomplish this through the effective utilization of our robust TMS tools, and the ongoing commitment and engagement of the senior leadership team – all with a view of identifying and developing the next generation workforce, the future leaders of the Company and promoting a high-performance organization.
Intellectual Property
Patents and other proprietary rights, including trade secrets, unpatented know-how such as know-how related to manufacturing processes, and continuing technological innovations, are important to our business. We own a large portfolio of patents, trademarks and trade names and are a party to certain intellectual property licenses that enhance our competitive position. While we consider them to be valuable assets, we do not believe that any of these patents, trademarks, licenses or other intellectual property rights is individually significant to the Company or either of our segments. We maintain procedures to protect our intellectual property. For a discussion of certain risks related to the Company's intellectual property, see "Part I, Item 1A. Risk Factors - Risks Related to Intellectual Property."
3
Regulatory Capital Expenditures
The Company’s efforts to comply with numerous federal, state and local laws and regulations applicable to its business and products often result in capital expenditures. The Company makes capital expenditures to design and upgrade its aerospace and industrial products to comply with or exceed standards applicable to the industries we serve. The Company’s ongoing HSE compliance program also results in capital expenditures. Regulatory and HSE considerations are a part of significant capital expenditure decisions; however, expenditures during 2022 related solely to regulatory compliance were not material.
Raw Materials
The principal raw materials used to manufacture our products are various grades and forms of steel, from rolled steel bars, plates and sheets, to high-grade valve steel wires and sheets, various grades and forms (bars, sheets, forgings, castings and powders) of stainless steels, aluminum alloys, titanium alloys, copper alloys, graphite, and iron-based, nickel-based (Inconels) and cobalt-based (Hastelloys) superalloys for complex aerospace applications. Prices for steel, titanium, Inconel, Hastelloys, as well as other specialty materials, have periodically increased due to higher demand and, in some cases, reduction of the availability of materials. During portions of fiscal year 2022, for example, the Company experienced increased commodity and component prices and, in some instances, shortages due to supply chain disruptions, labor shortages, increased demand and other factors associated with COVID-19 and the Russia-Ukraine war. The Company expects continued volatility in the availability and prices for commodities and raw materials that we use in our products and in our supply chain in fiscal year 2023.
SEASONALITY
No material portion of our business is considered to be seasonal.
EXECUTIVE OFFICERS OF THE COMPANY
For information regarding the Executive Officers of the Company, see Part III, Item 10 of this Annual Report.
GOVERNMENTAL REGULATIONS AND ENVIRONMENTAL MATTERS
We are subject to numerous environmental, legal, and regulatory requirements related to our products and global operations. For a discussion of the risks associated with these, see "Part I - Item 1A - Risk Factors."
We are subject to laws and regulations related to anti-corruption such as the U.S. Foreign Corrupt Practices Act, data privacy and security laws, such as the European Union's General Data Protection Regulation, and regulations relating to import-export control. A portion of our products, including defense-related products, may require governmental licenses. Additionally, our U.S. government contracts are generally subject to Federal Acquisition Regulations (“FAR”), agency-specific regulations that implement or supplement FAR, and other applicable laws and regulations which impose a broad range of requirements, many of which are unique to government contracting. These include various procurement, import and export, security, disclosure of cost and pricing data, contract termination and adjustment, and audit requirements.
Our products and operations, including past and present business operations and, past and present ownership and operations of real property, are subject to a variety of extensive and changing U.S. federal, state, local, and non-U.S. environmental, health and safety laws and regulations concerning, among other things, the health and safety of our employees; product safety, packaging and labeling; the generation, storage, use, transportation and disposal of certain materials (including chemicals and hazardous materials) used in or derived from our manufacturing processes; emission or discharge of substances into the environment; and investigation and remediation of hazardous substances or materials at various sites. We use and generate hazardous substances and wastes in our operations. In addition, many of our current and former properties are or have been used for industrial purposes. Accordingly, we monitor hazardous waste management and applicable environmental permitting and reporting for compliance with applicable laws at our locations in the ordinary course of our business.
Moreover, climate change and other Environmental Safety and Governance-related ("ESG") laws, regulations, treaties, and similar initiatives and programs are being adopted and implemented throughout the world, many with which we will be required to comply. We are committed to maintaining compliance with ESG-related laws applicable to our operations and products. We endeavor to meet this commitment through our global HSE program described above, and an approach to ethical standards and strong governance that are foundational to our business.
4
AVAILABLE INFORMATION
The Company maintains a website (www.onebarnes.com) and our annual report on Form 10-K, quarterly reports on Form 10-Q, current reports on Form 8-K, and amendments to those reports are available without charge on our website as soon as reasonably practicable after they are filed with, or furnished to, the U.S. Securities and Exchange Commission ("SEC"). In addition, we have posted on our website, and will make available in print to any stockholder who makes a request, our Corporate Governance Guidelines, our Code of Business Ethics and Conduct ("Code"), and the charters of the Audit Committee, Compensation and Management Development Committee and Corporate Governance Committee (the responsibilities of which include serving as the nominating committee) of the Company’s Board of Directors. We post in the Governance section of the Investor Relations page of our website information regarding any amendment to, or waiver from, the provisions of the Code to the extent such disclosure is required. References to our website in this Annual Report are provided as a convenience and do not constitute, and should not be viewed as, an incorporation by reference of the information contained on, or available through, the website. Therefore, such information should not be considered part of this Annual Report.
Item 1A. Risk Factors
Our business, financial condition, results of operations and/or cash flows could be materially and adversely affected by any of the following risks. Our business could also be affected by additional risks that are not presently known to us or that we currently consider to be immaterial. The below risks should be read in conjunction with Part II - Item 7 - "Management's Discussion and Analysis of Financial Condition and Results of Operations."
RISKS RELATED TO THE COVID-19 PANDEMIC
Our business, results of operations and financial condition have been adversely affected, and could be materially adversely affected in the future, by the global COVID-19 pandemic and related economic disruptions. COVID-19 has negatively impacted the global economy, disrupted global supply chains, caused inflationary pressure in the U.S. and elsewhere, and created significant volatility, uncertainty and disruption within global financial markets. COVID-19 has adversely affected, and continues to pose risks to, our business, including our operational and financial performance, and may adversely impact our stock price, our ability to access capital markets and our ability to fund liquidity needs. Moreover, it may have the effect of heightening many of the other risks described in this Part I, Item 1A.
There continues to be considerable uncertainty regarding the duration and extent to which COVID-19 will resurge in certain regions of the world; its severity; the emergence, contagiousness, and threat of new and different strains of the virus; disruptions or closures of our manufacturing operations or those of our customers and suppliers in certain regions due to government shutdowns and other restrictions or due to employee absenteeism and other staffing issues related to COVID-19; and disruptions in the supply chain, including those caused by industry capacity constraints and material availability. Although certain restrictions related to COVID-19 have eased, uncertainty continues to exist regarding such measures and potential future measures, and this uncertainty is expected to continue in 2023, and may significantly adversely affect our business and outlook.
RISKS RELATED TO OUR BUSINESSES AND THE INDUSTRIES WITHIN WHICH WE OPERATE
We depend on revenues and earnings from a small number of significant customers. Any bankruptcy of or loss of or cancellation, reduction or delay in purchases by these customers could harm our business. Net sales to GE and its subsidiaries in 2022 accounted for 20% of our total sales and approximately 57% of Aerospace's net sales. Approximately 15% of Aerospace's net sales in 2022 were to its next three largest customers. Approximately 10% of Industrial's sales in 2022 were to its five largest customers. Some of our success will depend on the business strength and viability of those customers. We cannot assure you that we will be able to retain our largest customers. Some of our customers may in the future reduce their purchases due to economic conditions or shift their purchases from us to our competitors, in-house or to other sources. Some of our long-term sales agreements provide that the customer may unilaterally reduce or discontinue its projected purchases without penalty or terminate for convenience. The loss of one or more of our largest customers, any reduction, cancellation or delay in sales to these customers (including a reduction in aftermarket volume in our Aerospace Aftermarket business' Revenue Sharing Programs), our inability to successfully develop relationships with new customers, or future price concessions we make to retain customers could significantly reduce our sales and profitability.
We may not recover all of our up-front costs related to new or existing programs. New programs may require significant up-front investments for capital equipment, engineering, inventory, design and tooling. As OEMs in the transportation and aerospace industries have looked to suppliers to bear increasing responsibility for the design, engineering and manufacture of systems and components, they have increasingly shifted the financial risk associated with those responsibilities
5
to the suppliers as well. This trend may continue and is most evident in the area of engineering cost reimbursement. We cannot assure you that we will have adequate funds to make such up-front investments or to recover such costs from our customers as part of our product pricing or through sales volume. In such event, our profitability, liquidity and cash flows may be adversely affected. In addition, we incur costs and make capital expenditures for new program awards based upon certain estimates of production volumes and production complexity. While we attempt to recover such costs and capital expenditures by appropriately pricing our products, the prices of our products are based in part upon planned production volumes. If the actual production is significantly less than planned or significantly more complex than anticipated, we may be unable to recover such costs. In addition, because a significant portion of our overall costs is fixed, declines in our customers’ production levels can adversely affect the level of our reported profits even if our up-front investments are recovered.
We may not realize all of the sales expected from our existing backlog or anticipated orders. At December 31, 2022, we had $1,020.3 million of order backlog, the majority of which related to Aerospace OEM customers, as compared with $904.6 million at the end of 2021. Of the 2022 year-end backlog, $759.8 million was attributable to Aerospace and $260.5 million was attributable to Industrial. Approximately 60% of the Company's consolidated year-end backlog is expected to be recognized during 2023, with the remainder scheduled to be recognized after 2023. There can be no assurances that the revenues projected in our backlog will be realized or, if realized, will result in profits. We consider backlog to be firm customer orders for future delivery. OEM customers may provide projections of components and assemblies that they anticipate purchasing in the future under existing programs. These projections may represent orders that are beyond lead time and are included in backlog when supported by a long term agreement. Our customers may have the right under certain circumstances or with certain penalties or consequences to terminate, reduce or defer firm orders that we have in backlog. If this occurs, we may be protected from certain costs and losses, but our sales will nevertheless be adversely affected. Although we strive to maintain strong relationships with our customers, there is an ongoing risk that orders may be canceled or rescheduled due to fluctuations in our customers’ business requirements.
Also, our realization of sales from new and existing programs is inherently subject to a number of important risks and uncertainties, including whether our customers execute the launch of programs on time, or at all, the number of units that our customers actually produce, the timing of production and manufacturing insourcing decisions made by our customers. In addition, until firm orders are placed, our customers may have the right to discontinue a program or replace us with another supplier at any time without penalty. Our failure to realize sales from new and existing programs could have a material adverse effect on our net sales, results of operations and cash flows.
We face risks of cost overruns and losses on fixed-price contracts and orders in backlog. We sell certain of our products under firm, fixed-price contracts providing for a fixed price for the products regardless of the production or purchase costs incurred by us, which includes certain orders in backlog, some of which have long lead times. The cost of producing and delivering products may be adversely affected by increases in the cost of labor, materials, fuel, outside processing, freight, shipping, overhead and other factors, including manufacturing inefficiencies. Such increased costs may result in cost overruns and losses on contracts.
Original equipment manufacturers in the aerospace and transportation industries have significant pricing leverage over suppliers and may be able to achieve price reductions over time. Additionally, we may not be successful in our efforts to raise prices on our customers. While many of our customers permit periodic adjustments to pricing based on changes in component prices and other factors, we may bear the risk of price increases that occur between any such repricing or, if such repricing is not permitted, during the balance of the term of the particular customer contract. There is substantial and continuing pressure from OEMs in the aerospace and transportation industries, including automotive, to reduce the prices they pay to suppliers. We attempt to manage such downward pricing pressure, while trying to preserve our business relationships with our customers, by seeking to reduce our production costs through various measures, including purchasing raw materials and components at lower prices and implementing cost-effective process improvements. Our suppliers have periodically resisted, and in the future may resist, pressure to lower their prices and may seek to impose price increases. If we are unable to offset OEM price reductions, our profitability and cash flows could be adversely affected. In addition, OEMs have substantial leverage in setting purchasing and payment terms, including the terms of accelerated payment programs under which payments are made prior to the account due date in return for an early payment discount. OEMs can unexpectedly change their purchasing policies and/or payment practices, which could have a negative impact on our short-term working capital.
We operate in highly competitive markets. Our future growth is dependent upon our ability to bring to market competitive, and increasingly complex, new products and services that achieve market acceptance with acceptable margins. Our two global business segments compete with a number of larger and smaller companies in the markets we serve. Some of our competitors have greater financial, production, research and development, or other resources than we do. Within Aerospace, certain of our OEM customers compete with our repair and overhaul business, and some compete with us where they have the ability to manufacture the components and assemblies that we supply to them but have chosen, for capacity
6
limitations, cost considerations or other reasons, to outsource the manufacturing to us. Our customers award business based on, among other things, price, quality, reliability of supply, service, technology and design. Our competitors’ efforts to grow market share could exert downward pressure on our product pricing and margins. Our competitors may also develop products or services, or methods of delivering those products or services, that are superior to ours. In addition, our competitors may adapt more quickly than us to new technologies or evolving customer requirements. We cannot assure you that we will be able to compete successfully with our existing or future competitors.
The industries in which we operate have been experiencing consolidation, both in our suppliers and the customers we serve. Supplier consolidation is in part attributable to OEMs more frequently awarding long-term sole source or preferred supplier contracts to the most capable suppliers in an effort to reduce the total number of suppliers. If consolidation of our existing competitors or customers occurs, we would expect the competitive pressures we face to increase, and we cannot assure you that our business, financial condition, results of operations or cash flows will not be adversely impacted as a result.
Our operations focus on highly engineered components which require extensive engineering and research and development time. Moreover, our ability to develop new products and services and to compete successfully will depend, in part, on our ability to continue to make investments of significant resources. These efforts divert resources from other potential investments in our businesses, may not lead to the development of new products or services on a timely basis, and may require us to reduce costs by such means as reducing excess capacity, improving productivity, eliminating redundancies and increasing production in low-cost countries. We have invested, and expect to continue to invest, in optimizing our manufacturing footprint in low-cost countries. We cannot assure you that we will have sufficient resources to continue to make such investments or that we will be successful in maintaining our competitive position. If we are unable to differentiate our products and services or maintain a low-cost footprint, we may lose market share or be forced to reduce prices, thereby lowering our margins.
Our competitive advantage may be adversely impacted if we cannot continue to introduce new products ahead of our competition, or if our products are rendered obsolete by other products or by new, different technologies and processes. The success of our new products will depend on a number of factors, including innovation, customer acceptance, the efficiency of our suppliers in providing materials and component parts, and the performance and quality of our products relative to those of our competitors. Additionally, we may face increased or unexpected costs associated with new product introduction, including the use of additional resources such as personnel and capital. We cannot provide assurance that we will not experience new product introduction delays in the future. As we introduce new products, we may be unable to detect and correct defects in product design. Even after introduction, new or enhanced products may not satisfy customer preferences and product failures may cause customers to reject our products. As a result, these products may not achieve market acceptance and our brand image could suffer. Any such occurrences could significantly reduce our revenues, increase our operating costs, or otherwise materially and adversely affect our business, financial condition, results of operations and cash flows.
The development of new products and services presents security risks. An increasing number of our products and services are delivered with digital capabilities and the accompanying interconnected device networks, some of which include sensors, data, and advanced computing capabilities. If we are unable to manage the lifecycle cybersecurity risk in development, deployment and operation of our digital platforms and services, the possible consequences include financial loss, reputational damage, exposure to legal claims or enforcement actions, theft of intellectual property, the diminution in the value of our investment in research, development and engineering, and increased cybersecurity protection and remediation costs, which in turn could adversely affect our business, financial condition, results of operations and cash flows.
A significant portion of the sales of certain businesses within our Industrial segment are realized from the design, manufacture, distribution and service of highly-engineered and customized products and systems for plastic injection molding and plastics processing across a broad spectrum of applications. Sales volume is dependent upon the need for equipment used to produce plastic products, which may be significantly influenced by the demand for plastic products, the capital investment needs of companies in the plastic injection molding and plastics processing industries, changes in technological advances, and changes in laws or regulations such as those related to single-use plastics, product and packaging composition, and recycling. Decrease in demand for plastic products or equipment used in the production of plastic products or unfavorable developments in these industries generally could have a material adverse effect on our business, financial condition, and results of operations.
Demand for our defense-related products depends on government spending. A portion of Aerospace's sales is derived from defense markets, including single-sourced and dual-sourced sales. The defense market is largely dependent upon government budgets and is subject to governmental appropriations. Although multi-year contracts may be authorized in connection with major procurements, funds are generally appropriated on a fiscal year basis even though a program may be expected to continue for several years. Consequently, programs are often only partially funded and additional funds are committed only as further appropriations are made. We cannot assure you that maintenance of or increases in defense spending
7
will be allocated to programs that would benefit our business. Moreover, we cannot assure you that new defense-related aircraft programs in which we participate will enter full-scale production as expected. A decrease in levels of defense spending or the government’s termination of, or failure to fully fund, one or more of the contracts for the programs in which we participate could have a material adverse effect on our financial position and results of operations.
The aerospace industry is highly regulated. Complications related to aerospace regulations may adversely affect the Company. A substantial portion of our income is derived from our aerospace businesses. The aerospace industry is highly regulated in the U.S. by the Federal Aviation Administration and in other countries by similar regulatory agencies. We must be certified by these agencies and, in some cases, by individual OEMs in order to engineer, produce and service systems and components used in specific aircraft models. If material authorizations or approvals were delayed, suspended or revoked, our business could be adversely affected. In the future, new or more stringent governmental regulations may be adopted or industry oversight heightened, and we may incur significant expenses to comply with any such new regulations or heightened industry oversight.
Fluctuations in the price of jet fuel, resins, energy and other raw materials and their availability may impact our operating results. Fuel costs constitute a significant portion of operating expenses for companies in the aerospace industry. Fluctuations in fuel costs could impact levels and frequency of aircraft maintenance and overhaul activities, and airlines' decisions on maintaining, deferring or canceling new aircraft purchases, in part based on the value associated with new fuel efficient technologies. Increases in fuel prices can also increase our packaging and transportation costs. Both we and our customers purchase supplies of resins, which are oil-based components used in the manufacture of certain products, and any significant increases in resin costs could adversely impact future operating results, including as a result of customers' decisions on maintaining, deferring or canceling new programs. Weather-related events, natural disasters, political disruptions or wars involving oil-producing countries, changes in governmental policy concerning aircraft fuel production, changes in refining capacity, and other unpredictable events may result in future fuel supply shortages and fuel price increases. For example, widespread disruption to oil production, refinery operations and pipeline capacity in certain areas of the U.S. can impact the price of jet fuel significantly. Geopolitical conflicts, such as conflicts in the Middle East, an important source of oil for the U.S. and other countries where we do business, and the Russia-Ukraine war, cause prices for fuel and energy to be volatile and availability to be impacted. In addition, new laws or regulations adopted in response to climate change could increase energy and transportation costs, as well as the costs of certain raw materials and components. In recent years, the costs of certain raw materials, transportation and energy necessary for our operations and the production and distribution of our products have increased significantly. While we have implemented cost containment measures and selective price increases, as well as taken other actions to offset these inflationary pressures in our supply chain, we may not be able to completely offset all the increases in our operational costs, and there could be a material adverse effect on our financial condition or results of operations.
RISKS ASSOCIATED WITH OPERATING A GLOBAL BUSINESS AND REGULATORY RISKS
Our operations depend on our global manufacturing, sales and service facilities and information systems which are subject to physical, environmental, operational and other risks that could disrupt our operations. We have a significant number of manufacturing facilities, technical service centers, and sales and distribution centers both within and outside the U.S. The global scope of our business subjects us to increased risks and uncertainties such as threats of war, terrorism and instability of governments, and economic, regulatory and legal systems in countries in which we or our customers conduct business. In addition, our customers' and suppliers' facilities, as well as our own facilities, are located in areas that may be affected by natural disasters, including earthquakes, windstorms, droughts and floods, or by limited accessibility to sufficient water resources, which could cause significant physical damage and disruption to our equipment and facilities, as well as the infrastructure of our customers and suppliers, and, in turn, could have a material adverse effect on our business, financial condition, results of operations and cash flows. Additionally, some of our manufacturing equipment and tooling is custom-made and is not readily replaceable. Loss of such equipment or tooling could have a negative impact on our manufacturing capabilities and, as a result, our financial condition, results of operations and cash flows.
A major catastrophe such as an earthquake, windstorm, drought, flood or other natural disaster, infectious disease outbreak, significant labor strikes, work stoppages, or political unrest, in any of the areas where we or our customers or key suppliers conduct operations could result in a prolonged interruption of our business. Any disruption resulting from these events could cause significant delays in the manufacture or shipment of products or the provision of repair and other services that may result in our loss of sales and customers. Although we have obtained property damage and business interruption insurance, our insurance will not cover all potential risks, and we cannot assure you that we will have adequate insurance to compensate us for all losses that result from any insured risks. Any material loss not covered by insurance could have a material adverse effect on our financial condition, results of operations and cash flows. We cannot assure you that insurance will be available in the future at a cost acceptable to us or at a cost that will not have a material adverse effect on our profitability, net income and cash flows.
8
The global nature of our operations subjects us to financial and regulatory risks in the countries in which we and our customers, suppliers and other business partners operate. In addition, we sell or may in the future sell our products and services to the U.S. and foreign governments and in foreign countries. As a global business, we are subject to complex laws, regulations and other conditions in the U.S. and other countries in which we operate, and associated risks, including: U.S.-imposed embargoes of sales to specific countries; foreign import controls; import regulations and duties; export regulations (which require us to comply with stringent licensing regimes); reporting requirements regarding the use of "conflict" minerals mined from certain countries; anti-dumping regulations; unclaimed property laws; price and currency controls; dividend remittance restrictions; expropriation of assets; war, civil uprisings and riots; government instability; government-imposed economic uncertainties, such as a prolonged U.S. federal government shutdown; government contracting requirements including cost accounting standards and various procurement, security and audit requirements, as well as requirements to certify to the government compliance with these requirements; the necessity of obtaining governmental approval for new and continuing products and operations; and legal systems or decrees, laws, taxes, regulations, interpretations and court decisions that are not always fully developed and that may be retroactively or arbitrarily applied. In the past, we have experienced inadvertent violations of some of these regulations, including export regulations and regulations prohibiting sales of certain products, none of which has had or, we believe, will have a material adverse effect on our business. Any significant violations of these or other regulations in the future could result in civil or criminal sanctions, suspension of production, loss of export or other licenses, other restrictions on our operations or damage to our reputation. We may also be subject to unanticipated income taxes, excise and custom duties, import taxes, export taxes, value added taxes, or other governmental assessments, and taxes may be impacted by changes in legislation in the tax jurisdictions in which we operate. In addition, our organizational and capital structure may limit our ability to transfer funds between countries without incurring adverse tax consequences. Any of these events could result in a loss of business or other unexpected costs that could reduce sales or profits and have a material adverse effect on our financial condition, results of operations and cash flows.
We are subject to environmental laws and regulations and the risk of environmental liabilities, violations and litigation. We are subject to a variety of U.S. federal, state, local and non-U.S. environmental, health and safety laws and regulations concerning, among other things, the health and safety of our employees, the generation, storage, use, transportation and disposal of certain materials including hazardous materials, emissions or discharges of substances into the environment, and investigation and remediation of hazardous substances or materials at various sites. Our operations involve the use, primarily in our manufacturing processes, of substances subject to these laws and regulations. Our failure to comply with these laws or regulations could result in regulatory penalties, fines, and legal liabilities; suspension of production; alteration of our manufacturing; damage to our reputation; and restrictions on our operations or sales. Furthermore, environmental laws outside of the U.S. are becoming more stringent, resulting in increased costs and compliance burdens.
In addition, certain environmental laws assess liability on current or previous owners or operators of real property for the costs of investigation, removal or remediation of hazardous substances or materials at their properties or at properties from or upon which they have disposed of hazardous substances. In addition to cleanup actions brought by governmental authorities, private parties could bring personal injury or other claims based on alleged presence of, or exposure to, hazardous substances. The ultimate cost of site cleanup and timing of future cash outflows is difficult to predict, given the uncertainties regarding the extent of the required cleanup, the interpretation of applicable laws and regulations, and alternative cleanup methods.
The costs of complying with current or future environmental protection and health and safety laws and regulations, or liabilities arising from past or future releases of, or exposures to, hazardous substances, may exceed our estimates, or have a material adverse effect on our business, results of operations, financial condition, and cash flows.
Climate change, or legal, regulatory or market measures to address climate change, may materially adversely affect our financial condition and business operations. Climate change resulting from increased concentrations of greenhouse gases in the atmosphere could present risks to our future operations from natural disasters and extreme weather conditions, such as hurricanes, tornadoes, earthquakes, wildfires, droughts or flooding. Such extreme weather conditions could pose physical risks to our facilities and disrupt operation of our supply chain and may impact operational costs. The impacts of climate change on global water resources may result in water scarcity, which could in the future impact our ability to access sufficient quantities of water in certain locations and result in increased costs.
Concern over climate change will likely result in new legal or regulatory requirements designed to reduce greenhouse gas emissions and mitigate the effects of climate change. Further, our customers and the markets we serve may impose emissions reduction or other environmental standards and requirements, including plastic injection molding and plastics processing and conventional fuel-based automotive markets. As a result, we may experience increased compliance burdens and operational costs and raw material sourcing, manufacturing operations and the distribution of our products may be adversely affected. Moreover, we may not be able to timely meet these requirements due to the required level of capital investment or technological advancement. While we have been committed to continuous improvements to meet anticipated regulations and
9
preferences, there can be no assurance that our commitments will be successful, that our products will be accepted by the market, that proposed regulations will not have a negative competitive impact or that economic returns will reflect our investments in new product development. There also continues to be a lack of consistent climate legislation, which creates economic and regulatory uncertainty. These factors may impact the demand for, or obsolescence of, certain of our products, and adversely affect our results of operations.
We are committed to reducing our carbon emissions, water consumption and waste generation, which may require us to expend significant resources that could increase our operational costs. Further, there can be no assurance of the extent to which any of our commitments will be achieved, or that any future investments we make in furtherance of achieving such targets and goals will meet investor expectations or any binding or non-binding legal standards regarding sustainability performance. Moreover, we may determine that it is in the best interest of our Company and our stockholders to prioritize other business, social, governance or sustainability investments over the achievement of our current commitments based on economic, regulatory and social factors, business strategy or pressure from investors, activist groups or other stakeholders. If we are unable to meet these commitments, then we could incur adverse publicity and reaction from investors, activist groups or other stakeholders, which could adversely impact the perception of us and our products and services by current and potential customers, as well as investors, which could in turn adversely impact our results of operations.
We could be adversely affected by violations of the U.S. Foreign Corrupt Practices Act ("FCPA") and similar worldwide anti-corruption laws and data privacy and security laws. The FCPA and similar anti-corruption laws generally prohibit companies and their intermediaries from making improper payments to government officials for the purpose of obtaining or retaining business or obtaining an unfair advantage. Recent years have seen a substantial increase in the global enforcement of anti-corruption laws. Our operations outside the United States, including in developing countries, expose us to the risk of such violations. Our policies mandate compliance with these anti-corruption laws. Despite our training and compliance program, we cannot provide assurance that our internal control policies and procedures will always protect us from reckless or criminal acts committed by our employees or agents. Violations, or allegations, could damage our reputation, as well as result in substantial fines, sanctions, civil and/or criminal penalties, termination of relationships with business partners and curtailment of operations in certain jurisdictions, and as a result might materially and adversely affect our business, results of operations or financial condition.
Additionally, to conduct our operations, we regularly move data across borders, and consequently we are subject to a variety of increasingly complex and changing laws and regulations regarding privacy, data protection and data security, including those related to the collection, storage, use, transmission and protection of personal information and other customer, vendor or employee data. The interpretation and enforcement of such laws and regulations, such as the European Union’s General Data Protection Regulation, continue to develop and there is significant uncertainty with respect to how compliance with these laws and regulations may evolve and the costs and complexity of future compliance. Violations could result in substantial fines, sanctions or civil penalties, and damage to our reputation and might materially and adversely affect our business, results of operations or financial condition.
International trade policies may impact demand for our products and our competitive position. Our results could be impacted by changes in tariffs, trade agreements, sanctions or other trade restrictions imposed or agreed to by the U.S. or foreign governments. For example, a government’s adoption of “buy national” policies or imposition of trade regulations in response to war or other global crises could have a negative impact on our results of operations due to their impact on commodity pricing and supply chains. Trade restrictions, including withdrawal from or modification of existing trade agreements, negotiation of new trade agreements, and imposition of new (and retaliatory) tariffs against certain countries or covering certain products has the potential to adversely impact demand for our products, our costs, customers, suppliers and/or the U.S. or foreign economies or certain sectors thereof in which we compete, and impair our ability to expand our business by offering new technologies, products and services. It remains unclear what the U.S. federal government or foreign governments will or will not do in the future with respect to tariffs or other international trade agreements and policies. Trade restrictions, and changes in or uncertainty surrounding global trade policies, may adversely impact our competitive position, businesses, financial condition, results of operations and cash flows.
The global nature of our business exposes us to foreign currency fluctuations that may affect our future revenues, debt levels and profitability. As noted above, we have manufacturing facilities and technical service centers, and sales and distribution centers around the world, and the majority of our foreign operations use the local currency as their functional currency. These include, among others, the Brazilian real, British pound sterling, Canadian dollar, Chinese renminbi, Czech koruna, Euro, Japanese yen, Korean won, Malaysian ringgit, Mexican peso, Singaporean dollar, Swedish krona, and the Swiss franc. Since our financial statements are denominated in U.S. dollars, changes in currency exchange rates between the U.S. dollar and other currencies expose us to translation risk when the local currency financial statements are translated to U.S. dollars. Changes in currency exchange rates may also expose us to transaction risk. We may buy hedges in certain currencies to
10
reduce or offset our exposure to currency exchange rate fluctuations; however, these transactions may not be adequate or effective to protect us against unfavorable exchange rate fluctuations. We have not engaged in any speculative hedging activities. Currency fluctuations may adversely impact our revenues and profitability in the future.
RISKS RELATED TO SUPPLY AND MANUFACTURING
The ability of suppliers to deliver raw materials, parts and components and energy resources, and our ability to manufacture without disruption, could affect our results of operations. We use a wide range of materials (including steel, stainless steel, titanium, aluminum, Inconel, Hastelloys and other specialty materials) and components (including semiconductors and other electronic components) in the global production of our products, which come from numerous suppliers around the world. Our operations and those of our suppliers are subject to disruption for a variety of reasons, including COVID-19 related supplier plant shutdowns or slowdowns, transportation delays, work stoppages, labor shortages, price inflation, financial issues such as supplier bankruptcy, information technology failures, and hazards such as fire, earthquakes, flooding, droughts or other natural disasters, new laws or regulations, global economic or political events including terrorist attacks and war, and suppliers’ allocations to other purchasers. Because not all of our business arrangements provide for guaranteed supply, and some key raw materials, parts and components and energy resources may be available only from a single supplier or a limited group of suppliers, we are subject to supply and pricing risk. For example, we expect to continue to be impacted by supply chain issues due to economic, political and other factors largely beyond our control, increased material costs and component shortages, supply chain disruptions and delays, and cost inflation, all of which could continue or escalate in the future. The effects of climate change, including extreme weather events, long-term changes in temperature levels, water availability, supply costs impacted by increasing energy costs, or energy costs impacted by carbon prices or offsets may exacerbate these risks. Such disruptions could interrupt our ability to manufacture certain products and result in increased pricing, and could materially and adversely affect our business, financial condition, results of operations and cash flows.
Any product liability, warranty, contractual or other claims may harm our business or otherwise adversely affect our financial condition. We are exposed to potential product liability risks that are inherent in the design, manufacture and sale of our products and the products we buy from third parties and sell to our customers, and to potential warranty, contractual or other claims. Our products are complex and may contain defects, errors, or experience failures or unsatisfactory performance, due to any number of issues, including issues in materials, design, fabrication, packaging and/or use within a system or item of equipment. Further, because of the complexity of our products, defects or errors might only be detected when the products are in use. Development of new products increases complexity and adds risk to manufacturing reliability, and increases the likelihood of product defects or errors. Risks associated with product defects are exacerbated by the fact that our customers typically integrate our products into other equipment and systems. Our products may be responsible for critical functions in our customers’ products. Failure of our products to perform to specifications, or other product defects, could lead to substantial damage to the products we sell to our customers, the equipment and/or systems into which our products are integrated and to the end users of such equipment/and or systems. Such defects could give rise to warranty claims or claims under indemnification clauses in our agreements, which may range from individual customer claims to full recalls of all products in the field, and result in significant costs, including costs related to developing solutions, recalling products, inspecting, repairing or replacing defective products, or writing down defective inventory, and could result in the loss of sales and divert the attention of our engineering personnel from our product development efforts. In addition, defects in our products could result in failure to achieve market acceptance, a loss of participation in customer programs, a shifting of business to our competitors, and litigation or regulatory action against us, and could harm our reputation, our relationships with customers and our ability to attract new customers, as well as the perceptions of our brands. Other potential adverse impacts of product defects include shipment delays, write-offs of property, plant and equipment and intangible assets, and losses on unfavorable purchase commitments.
Moreover, the occurrence of defects may give rise to product liability claims, particularly if defects in our products or the products into which they are integrated result in personal injury or death, and could result in significant costs, expenses and losses. For example, we may be exposed to potential liability for personal injury, property damage or death as a result of the failure of an aircraft or automotive component designed, manufactured or sold by us, or the failure of an aircraft or automotive component that has been serviced by us or of the components themselves. If a product liability claim is brought against us, the cost of defending the claim could be significant, and could divert the efforts of our technical and management personnel and harm our business, even if we are successful. We may be named in product liability claims even if there is no evidence that our products caused the damage in question, and even though we may have indemnity from our customers, and such claims could result in significant costs and expenses.
We vigorously defend ourselves in connection with these matters. We cannot, however, assure you that the costs, charges and liabilities associated with these matters will not be material, or that those costs, charges and liabilities will not exceed any amounts reserved for them in our Consolidated Financial Statements. Further, while we have liability insurance for certain
11
risks, our insurance may not cover all liabilities, including potential reputational impacts. Additionally, insurance coverage may not be available in the future on acceptable terms or at a cost acceptable to us. The above is exacerbated by the fact that our products may be used, and perform critical functions, in various high-risk applications such as aerospace, automobiles, and robotics, among others. Accordingly, defects in our products could have an adverse impact on us, on our customers and the end users of our customers’ products. If any of these risks materialize, there could be a material adverse effect on our business, results of operations and financial condition.
RISKS RELATED TO HUMAN CAPITAL
Our future success depends, in part, on our ability to continue to attract, develop, engage and retain qualified employees. Our executive officers and key management personnel are critical to driving business performance and successfully executing the Company’s growth strategy. Because of the complex nature of many of our products and services, and our focus on technological and product innovations, we are generally dependent on an educated and highly skilled workforce, including our engineering talent and our sales professionals. We manage human capital through our Talent Management System, which is aimed at enhancing our ability to attract and hire talented employees, as well as supporting their growth, development and engagement; however, we cannot guarantee the system's effectiveness. Failure to attract, develop, engage and retain qualified employees, whether as a result of an insufficient number of qualified applicants, difficulty in recruiting new employees, or inadequate resources to train, integrate and retain qualified employees, could impair our ability to execute our business strategy, and could adversely affect our business, financial condition, results of operations or cash flows. In addition, while we aim to reduce the impact of the departure of employees, our operations or ability to execute our business strategy may be impacted by the loss of employees, particularly when departures involve groups of employees, such as restructuring and workforce reduction actions. Such losses may adversely affect the Company through decreased employee morale, the loss of knowledge of departing employees, and the devotion of resources to reorganizing and reassigning job roles and responsibilities, and could increase the risk of claims or litigation from former employees.
Our business, financial condition, results of operations and cash flows could be adversely impacted by strikes or work stoppages. We employ approximately 5,200 people worldwide. Approximately 35% of these employees are covered by collective bargaining agreements, trade union agreements and/or national industry agreements. Although we believe that our relations with our employees and labor unions that represent our employees are good, and we have experienced no material strikes or work stoppages recently, we cannot assure you that we will not experience in the future these and other types of conflicts with labor unions, works councils, other groups representing employees or our employees generally, nor that any future negotiations with our labor unions will not result in significant increases in the cost of labor, including healthcare, pensions or other benefits. Any potential strikes or work stoppages, and the resulting adverse impact on our relationships with customers, could have a material adverse effect on our business, financial condition, results of operations or cash flows. Similarly, a protracted strike or work stoppage at any of our major customers, suppliers or other vendors could materially adversely affect our business.
RISKS RELATED TO INFORMATION TECHNOLOGY, CYBERSECURITY AND DATA PRIVACY
Any disruption or failure in the operation of our information systems, including from conversions or integrations of information technology (“IT”) or reporting systems, could have a material adverse effect on our business, financial condition, results of operations and cash flows. Our IT systems are an integral part of our business. We depend on our IT systems to help communicate internally and externally, and to manage and support a variety of business processes and activities, such as processing orders, managing inventory, making payments, collecting accounts receivable, and storing information. In addition, our IT systems allow us to purchase, sell and ship products timely and efficiently, to maintain cost-effective operations, and to provide superior service to our customers. Moreover, we use IT systems to record, process and summarize financial information and results of operations for internal reporting purposes and to comply with regulatory financial reporting, legal and tax requirements. We periodically implement, upgrade and integrate IT systems, such as our enterprise resource planning ("ERP") and customer relationship management (“CRM”) platforms across our businesses. If we experience a problem with the functioning of an important IT system as a result of the increased burden placed on our IT infrastructure or a security breach or a service issue experienced by an external third party vendor that stores or processes our data, including during system upgrades and/or new system implementations, the resulting disruptions could have an adverse effect on our business or operating results.
Increased cybersecurity requirements, vulnerabilities, threats and more sophisticated and targeted IT-related crime could pose a risk to our systems, networks, products, data and services and have a material adverse effect on our business, financial condition, results of operations and cash flows. In the ordinary course of our business, we store sensitive data, including intellectual property, our proprietary business information and that of our customers, suppliers and business
12
partners, and personally identifiable information in our data centers and on our networks. In addition to utilizing non-cloud environments, we also leverage cloud-based systems, where data is stored and exchanged with external third party vendors. The secure maintenance and transmission of this information is critical to our business operations. Despite our security measures, our IT systems and infrastructure, including vendor-hosted systems, may be vulnerable to attacks by hackers or breached due to employee error, malfeasance or other disruptions. These cybersecurity threats and incidents can range from uncoordinated individual attempts to gain unauthorized access to IT systems to sophisticated and targeted measures known as advanced persistent threats, directed at the Company, its products, its customers and/or its third-party service providers, including cloud providers. These threats and incidents originate from many sources globally and include malwares that take the form of computer viruses, ransomware, worms, Trojan horses, spyware, adware, scareware, rogue software, and other programs that act against the computer user. Our customers are increasingly requiring cybersecurity protections, and we may incur additional costs to comply with such demands. While we deploy measures to deter, prevent, detect, respond to and mitigate these threats, including identity and access controls and vulnerability assessments, despite these efforts, cybersecurity incidents, depending on their nature and scope, could compromise our networks and the information stored there, including critical data and confidential or proprietary information (our own or that of third parties), could be accessed, altered, publicly disclosed, lost or stolen. Such incidents could remain undetected for an extended period of time, and the losses arising from such incidents could exceed our available insurance coverage for such matters. Such incidents could also disrupt our operations, impacting manufacturing production and transactional processing, and result in increased cybersecurity protection and remediation costs, legal claims or proceedings, liability under laws that protect the privacy of personal information, regulatory penalties, theft of intellectual property, and damage our reputation, which could adversely affect our business, revenues and competitive position. Further, cybersecurity and data protection laws and regulations continue to evolve in the U.S. and worldwide. This adds compliance complexity and may increase our costs of compliance and expose us to litigation, monetary damages, regulatory enforcement actions or fines in one or more jurisdictions. In addition, as security threats continue to evolve and increase in frequency and sophistication, it will likely require investing in additional resources to protect the security of our IT systems.
RISKS RELATED TO INTELLECTUAL PROPERTY
We may be unable to adequately protect or enforce our intellectual property rights. Our intellectual property rights may not be sufficiently broad or otherwise may not provide us a significant competitive advantage, and patents may not be issued for pending or future patent applications owned by or licensed to us. As patents expire, we could face increased competition, which could negatively impact our operating results. Infringement of our intellectual property and other proprietary rights by a third party, or copying of our technology in countries where we do not hold patents, could result in uncompensated lost market and revenue opportunities. We cannot be certain that the measures we have implemented will prevent our intellectual property from being improperly disclosed, challenged, invalidated, or circumvented, particularly in countries where intellectual property rights are not highly developed or protected. For example, competitors may avoid infringement liability by developing non-infringing competing technologies or by effectively concealing infringement. We may need to spend significant resources monitoring and enforcing our intellectual property rights and we may not be aware of or able to detect or prove infringement by third parties. Our ability to enforce our intellectual property rights is subject to litigation risks, as well as uncertainty as to the protection and enforceability of those rights in some countries. If we seek to enforce our intellectual property rights, we may be subject to claims that those rights are invalid or unenforceable, and others may seek counterclaims against us, which could have a negative impact on our business. In addition, changes in intellectual property laws or their interpretation may impact our ability to protect and assert our intellectual property rights, increase costs and uncertainties in the prosecution of patent applications and enforcement or defense of issued patents, and diminish the value of our intellectual property. If we do not protect and enforce our intellectual property rights successfully, or if they are circumvented, invalidated, or rendered obsolete by the rapid pace of technological change, it could have an adverse impact on our competitive position and our operating results.
Our employees, consultants and other parties are subject to confidentiality obligations, but this protection may be inadequate to deter or prevent misappropriation, theft, misuse, disclosure, loss or destruction of our proprietary information and/or infringement of our intellectual property. For example, employees and former employees, in particular former employees who become employees of our competitors, may misappropriate, use, publish or provide to our competitors, customers or other third parties our intellectual property, advantageous know-how or other proprietary information. Similarly, we provide access to certain of our intellectual property and other proprietary information to our direct and indirect customers and certain of our consultants who may wrongfully use or disclose such intellectual property or information. Any of these events could harm our competitive position, reduce the value of our investment in research and development and other strategic initiatives, cause us to lose business, damage our reputation, subject us to legal or regulatory proceedings, cause us to incur other loss or liability and otherwise adversely affect our business.
Third parties may claim that one or more of our products or services infringe their intellectual property rights. Regardless of the merit of such claims, any dispute or litigation regarding patents or other intellectual property could be costly
13
and time-consuming to defend and resolve due to the complexity of our technology and the uncertainty of intellectual property litigation, and could divert our management and key personnel from our business operations. A claim of intellectual property infringement could force us to enter into a costly or restrictive license agreement, which might not be available under acceptable terms or at all, require us to redesign our products, which would be costly and time-consuming, or subject us to significant damages or to an injunction against the development and sale of certain of our products or services. Our intellectual property portfolio may not be useful in asserting a counterclaim, or negotiating a license, in response to a claim of intellectual property infringement. In addition, we may face claims based on the theft or unauthorized use or disclosure of third-party trade secrets and other confidential business information. Any such incidents and claims could severely harm our business and reputation, result in significant expenses, harm our competitive position, and prevent us from selling certain products and services, all of which could have a significant adverse impact on our business and results of operations.
RISKS RELATED TO LIQUIDITY AND OTHER RISKS
We have significant indebtedness that could affect our operations and financial condition, and our failure to meet certain financial covenants required by our debt agreements may materially and adversely affect our assets, financial position and cash flows. At December 31, 2022, we had consolidated debt obligations of $571.1 million, representing approximately 30% of our total capital (indebtedness plus stockholders’ equity) as of that date. Our level of indebtedness, proportion of variable rate debt obligations and the significant debt servicing costs associated with that indebtedness may adversely affect our operations and financial condition. For example, our indebtedness could require us to dedicate a substantial portion of our cash flows from operations to payments on our debt, thereby reducing the amount of our cash flows available for working capital, capital expenditures, investments in technology and research and development, acquisitions, dividends and other general corporate purposes; limit our flexibility in planning for, or reacting to, changes in the industries in which we compete; place us at a competitive disadvantage compared to our competitors, some of whom have lower debt service obligations and greater financial resources than we do; limit our ability to borrow additional funds; or increase our vulnerability to general adverse economic and industry conditions. In addition, a majority of our debt arrangements require us to maintain certain debt and interest coverage ratios and limit our ability to incur debt, make investments or undertake certain other business activities. These requirements could limit our ability to obtain future financing and may prevent us from taking advantage of attractive business opportunities. Our ability to meet the financial covenants or requirements in our debt arrangements may be affected by events beyond our control, and we cannot assure you that we will satisfy such covenants and requirements. A breach of these covenants or our inability to comply with the restrictions could result in an event of default under our debt arrangements which, in turn, could result in an event of default under the terms of our other indebtedness. Upon the occurrence of an event of default under our debt arrangements, after the expiration of any grace periods, our lenders could elect to declare all amounts outstanding under our debt arrangements, together with accrued interest, to be immediately due and payable. If this were to happen, we cannot assure you that our assets would be sufficient to repay in full the payments due under those arrangements or our other indebtedness or that we could find alternative financing to replace that indebtedness.
Conditions in the worldwide credit markets may limit our ability to expand our credit lines beyond current bank commitments. In addition, our profitability may be adversely affected as a result of increases in interest rates. At December 31, 2022, we and our subsidiaries had $571.1 million aggregate principal amount of consolidated debt obligations outstanding, of which approximately 64% had interest rates that float with the market (not hedged against interest rate fluctuations). A 100 basis point increase in the interest rate on the floating rate debt in effect at December 31, 2022 would result in an approximate $3.7 million annualized increase in interest expense.
We have significant goodwill and an impairment of our goodwill could cause a decline in our net worth. Our total assets include substantial goodwill. At December 31, 2022, our goodwill totaled $835.5 million. The goodwill results from our prior acquisitions, representing the excess of the purchase price we paid over the net assets of the companies acquired. We assess whether there has been an impairment in the value of our goodwill during each calendar year or more frequently if an event or change in circumstances indicates that the fair value of a reporting unit has been reduced below its carrying value. If future operating performance at one or more of our reporting units does not meet expectations or fair values fall due to significant stock market declines, we may be required to reflect an incremental non-cash charge to operating results for goodwill impairment. During the three-month period ended June 30, 2022, management recorded a non-cash goodwill impairment charge of $68.2 million related to the Automation reporting unit as the estimated fair value of the reporting unit declined below its carrying value. See Note 6 of the Consolidated Financial Statements. The Company has continued to evaluate macro-economic conditions through December 31, 2022. Based on our subsequent assessments, there was no additional impairment of goodwill as of December 31, 2022. In the event there are future adverse changes in our estimated future cash flows and/or changes in key assumptions, including but not limited to discount rates, revenue growth or margins, and/or terminal growth rates, we may be required to record additional non-cash impairment charges to Automation goodwill. The recognition of an additional impairment of a significant portion of goodwill would negatively affect our results of
14
operations and total capitalization, the effect of which could be material. See “Part II - Item 7 - Management's Discussion and Analysis of Financial Condition and Results of Operations - Critical Accounting Policies.”
We may not realize all of the intangible assets related to the Aerospace Aftermarket businesses. We participate in aftermarket RSPs under which we receive an exclusive right to supply designated aftermarket parts over the life of the related aircraft engine program to our customer, GE. As consideration, we pay participation fees, which are recorded as intangible assets and are recognized as a reduction of sales over the estimated life of the related engine programs. Our total investments in participation fees under our RSPs as of December 31, 2022 equaled $299.5 million, all of which have been paid. At December 31, 2022, the remaining unamortized balance of these participation fees was $135.3 million.
We entered into CRPs, also with GE, which provide for, among other items, the right to sell certain aftermarket component repair services for CFM56, CF6, CF34 and LM engines directly to other customers over the life of the engine program as one of a few GE licensed suppliers. In addition, the CRPs extended certain contracts under which the Company currently provides these services directly to GE. Our total investments in CRPs as of December 31, 2022 equaled $111.8 million, all of which have been paid. At December 31, 2022, the remaining unamortized balance of the CRPs was $70.0 million. We recorded the CRP payments as intangible assets which are recognized as a reduction of sales over the remaining useful life of these engine programs.
The realizability of each asset is dependent upon future revenues related to the programs' aftermarket parts and services and is subject to impairment testing if circumstances indicate that its carrying amount may not be recoverable. The potential exists that actual revenues will not meet expectations due to a change in market conditions, including, for example, the replacement of older engines with new, more fuel-efficient engines or our ability to maintain market share within the aftermarket business. A shortfall in future revenues may result in the failure to realize the net amount of the investments, which could adversely affect our financial condition and results of operations. In addition, profitability could be impacted by the amortization of the participation fees and licenses, and the expiration of the international tax incentives on these programs. See “Part II - Item 7 - Management's Discussion and Analysis of Financial Condition and Results of Operations - Critical Accounting Policies.”
We carry significant inventories and a loss in net realizable value could cause a decline in our net worth. At December 31, 2022, our inventories totaled $283.4 million. Inventories are valued at the lower of cost or net realizable value based on management's judgments and estimates concerning future sales levels, quantities and prices at which such inventories will be sold in the normal course of business. Accelerating the disposal process or changes in estimates of future sales potential may necessitate future reduction to inventory values. See “Part II - Item 7 - Management's Discussion and Analysis of Financial Condition and Results of Operations - Critical Accounting Policies.”
We maintain pension and other postretirement benefit plans in the U.S. and certain international locations. Our costs of providing defined benefit plans are dependent upon a number of factors, such as the rates of return on the plans’ assets, interest rates, exchange rate fluctuations, future governmental regulation, global fixed income and equity prices, and our required and/or voluntary contributions to the plans. Declines in the stock market, prevailing interest rates, declines in discount rates, improvements in mortality rates and rising medical costs may cause an increase in our pension and other postretirement benefit expenses in the future and result in reductions in our pension fund asset values and increases in our pension and other postretirement benefit obligations. These changes have caused and may continue to cause a significant reduction in our net worth and without sustained growth in the pension investments over time to increase the value of the plans’ assets, and depending upon the other factors listed above, we could be required to increase funding for some or all of these pension and postretirement plans.
Changes in taxation requirements could affect our financial results. Our products are subject to import and excise duties and/or sales or value-added taxes in many jurisdictions in which we operate. Increases in indirect taxes could affect our products’ affordability and therefore reduce our sales. We are also subject to income tax in numerous jurisdictions in which we generate revenues. Changes in tax laws, tax rates or tax rulings may have a significant adverse impact on our effective tax rate. Among other things, our tax liabilities are affected by the mix of pretax income or loss among the tax jurisdictions in which we operate and the potential repatriation of foreign earnings to the U.S. Further, during the ordinary course of business, we are subject to examination by the various tax authorities of the jurisdictions in which we operate which could result in an unanticipated increase in taxes. Any potential changes or interpretive guidance may impact current and deferred income tax expense and deferred tax balances for U.S operations as well as the potential future repatriation of foreign income. The impact of any proposed changes in tax regulations may adversely affect our financial condition, results of operations and cash flow.
Changes in accounting guidance could affect our financial results. New accounting guidance that may become applicable to us from time to time, or changes in the interpretations of existing guidance, could have a significant effect on our
15
reported results for the affected periods. Adoption of new accounting guidance could have a material impact on our financial statements and may retroactively affect the accounting treatment of transactions completed before adoption. See Note 1 of the Consolidated Financial Statements.
Actions of activist stockholders could cause us to incur substantial costs, divert management’s attention and resources, and have an adverse effect on our business. From time to time, we may be subject to proposals by stockholders urging us to take certain corporate actions. Activist stockholder activity could have an adverse effect on our business as responding to proxy contests and reacting to other actions by activist stockholders can be costly and time-consuming, disrupt our operations and divert the attention of management and our employees. For example, we may be required to retain the services of various professionals to advise us on activist stockholder matters, including legal, financial, and communications advisers, the costs of which may negatively impact our future financial results. In addition, perceived uncertainties as to our future direction, strategy or leadership created as a consequence of activist stockholder initiatives may result in the loss of potential business opportunities, harm our ability to attract new investors, customers, and employees, and cause our stock price to experience periods of volatility or stagnation.
RISKS RELATED TO STRATEGIC TRANSACTIONS
Our restructuring and integration actions could have long-term adverse effects on our business. As we implement restructuring activities across our businesses to adjust our cost structure, we may not achieve expected cost savings from workforce reductions or restructuring activities and actual charges, costs and adjustments due to these actions may vary materially from our estimates. In addition, our consolidation and integration activities may not provide the expected benefits. Our ability to realize anticipated cost savings, synergies and revenue enhancements may be affected by a number of factors, including the following: our ability to effectively eliminate duplicative back office overhead and overlapping personnel, rationalize manufacturing capacity, synchronize IT systems, consolidate warehousing and other facilities and shift production to more economical facilities; significant cash and non-cash integration and implementation costs or charges in order to achieve those cost savings, which could offset any such savings; and our ability to avoid labor disruption in connection with these activities. In addition, delays in implementing planned restructuring, consolidation or integration activities or other productivity improvements may diminish the expected operational or financial benefits.
Our acquisition and other strategic initiatives, some of which may be outside the industries in which we currently operate, may not be successful. We have made a number of acquisitions in the past, and we anticipate that we may, from time to time, acquire additional businesses, assets or securities of companies, and enter into joint ventures and other strategic relationships that we believe would provide a strategic fit with our businesses. These activities expose the Company to a number of risks and uncertainties, the occurrence of any of which could materially adversely affect our business, cash flows, financial condition and results of operations. A portion of the industries that we serve are mature industries. As a result, our future growth may depend in part on the successful acquisition and integration of acquired businesses into our existing operations. On the other hand, if we acquire a company that operates in an industry that is different from the ones in which we currently operate, our lack of experience with that company's industry could have a material adverse impact on our ability to manage that business and realize the benefits of that acquisition. We may not be able to identify and successfully negotiate suitable acquisitions, obtain financing on satisfactory terms, negotiate reasonable terms, properly perform due diligence and determine all the significant risks associated with a particular acquisition, avoid diversion of our management's attention from other important business activities, or obtain regulatory approvals or otherwise complete acquisitions in the future.
We could have difficulties integrating acquired businesses with our existing operations, including coordinating and consolidating separate systems, retaining market acceptance of acquired products and services, maintaining employee morale and retaining key employees, and implementing our enterprise resource planning systems and operational procedures and disciplines. Any such difficulties may make it more difficult to maintain relationships with employees, customers, business partners and suppliers. In addition, even if integration is successful, the financial performance of acquired businesses may not be as expected and there can be no assurance that we will realize anticipated benefits from our acquisitions. We cannot assure you that we will effectively assimilate the business or product offerings of acquired companies into our business or product offerings or realize anticipated operational synergies. These activities may result in difficulties, significant expense and accounting charges, disrupt our business or divert management’s time and attention.
Acquisitions involve numerous other risks, including potential exposure to unknown liabilities of acquired companies and the possible loss of key employees and customers of the acquired business. Certain of the acquisition agreements by which we have acquired businesses require the former owners to indemnify us against certain liabilities related to the business operations before we acquired it. However, the liability of the former owners is limited and certain former owners may be unable to meet their indemnification responsibilities. We cannot assure you that these indemnification provisions will protect us
16
fully or at all, and as a result we may face unexpected liabilities that adversely affect our financial condition. In connection with acquisitions or joint venture investments outside the U.S., we may enter into derivative contracts to purchase foreign currency in order to hedge against the risk of foreign currency fluctuations in connection with such acquisitions or joint venture investments, which subjects us to the risk of foreign currency fluctuations associated with such derivative contracts. Additionally, our final determinations and appraisals of the fair value of assets acquired and liabilities assumed in our acquisitions may vary materially from earlier estimates.
We continually assess the strategic fit of our existing businesses and may divest or otherwise dispose of businesses that are deemed not to fit with our strategic plan or are not achieving the desired return on investment, and we cannot be certain that our business, operating results and financial condition will not be materially and adversely affected. A successful divestiture depends on various factors, including our ability to effectively transfer liabilities, contracts, facilities and employees to any purchaser, identify and separate the intellectual property to be divested from the intellectual property that we wish to retain, reduce fixed costs previously associated with the divested assets or business, and collect the proceeds from any divestitures. In addition, if customers of the divested business do not receive the same level of service from the new owners, this may adversely affect our other businesses to the extent that these customers also purchase other products offered by us. All of these efforts require varying levels of management resources, which may divert our attention from other business operations. If we do not realize the expected benefits, our consolidated financial position, results of operations and cash flows could be negatively impacted. In addition, divestitures of businesses involve a number of risks, including significant costs and expenses, the loss of customer relationships, and a decrease in revenues and earnings associated with the divested business. Furthermore, divestitures potentially involve significant post-closing separation activities, which could involve the expenditure of material financial resources and significant employee resources. Any divestiture may result in a dilutive impact to our future earnings if we are unable to offset the dilutive impact from the loss of revenue associated with the divestiture, as well as significant write-offs, including those related to goodwill and other intangible assets, which could have a material adverse effect on our results of operations and financial condition.
Item 1B. Unresolved Staff Comments
None.
17
Item 2. Properties
| Number of Facilities - Owned | ||||||||||||||||||||||||||
| Location | Industrial | Aerospace | Other | Total | ||||||||||||||||||||||
| Manufacturing: | ||||||||||||||||||||||||||
North America | 5 | 5 | — | 10 | ||||||||||||||||||||||
Europe | 9 | — | — | 9 | ||||||||||||||||||||||
Asia | 1 | 2 | — | 3 | ||||||||||||||||||||||
Central and Latin America | 2 | — | — | 2 | ||||||||||||||||||||||
| 17 | 7 | — | 24 | |||||||||||||||||||||||
| Non-Manufacturing: | ||||||||||||||||||||||||||
North America | — | — | 1* | 1 | ||||||||||||||||||||||
| — | — | 1 | 1 | |||||||||||||||||||||||
* The Company's Corporate office.
| Number of Facilities - Leased | ||||||||||||||||||||||||||
| Location | Industrial | Aerospace | Other | Total | ||||||||||||||||||||||
| Manufacturing: | ||||||||||||||||||||||||||
North America | 3 | 2 | — | 5 | ||||||||||||||||||||||
Europe | 4 | — | — | 4 | ||||||||||||||||||||||
Asia | 4 | 6 | — | 10 | ||||||||||||||||||||||
| 11 | 8 | — | 19 | |||||||||||||||||||||||
| Non-Manufacturing: | ||||||||||||||||||||||||||
North America | 8 | 2 | 1** | 11 | ||||||||||||||||||||||
Europe | 19 | 1 | — | 20 | ||||||||||||||||||||||
Asia | 23 | — | — | 23 | ||||||||||||||||||||||
Central and Latin America | 3 | — | — | 3 | ||||||||||||||||||||||
| 53 | 3 | 1 | 57 | |||||||||||||||||||||||
** Industrial Segment headquarters and certain Shared Services groups.
18
Item 3. Legal Proceedings
We are subject to litigation from time to time in the ordinary course of business and various other suits, proceedings and claims are pending against us and our subsidiaries. While it is not possible to determine the ultimate disposition of each of these proceedings and whether they will be resolved consistent with our beliefs, we expect that the outcome of these proceedings, individually or in the aggregate, will not have a material adverse effect on our consolidated financial position, cash flows or results of operations.
Item 4. Mine Safety Disclosures
Not applicable.
19
PART II
Item 5. Market for Registrant’s Common Equity, Related Stockholder Matters and Issuer Purchases of Equity Securities
Market Information
The Company’s common stock is traded on the New York Stock Exchange under the symbol “B”. As of February 15, 2023, there were approximately 1,609 holders of record of the Company’s common stock.
Dividends
Payment of future dividends will depend upon the Company’s financial condition, results of operations and other factors deemed relevant by the Company’s Board of Directors, as well as any limitations resulting from financial covenants under the Company’s credit facilities or debt indentures.
Securities Authorized for Issuance Under Equity Compensation Plans
For information regarding Securities Authorized for Issuance Under Equity Compensation Plans, see Part III, Item 12 of this Annual Report.
Performance Graph
A stock performance graph based on cumulative total returns (price change plus reinvested dividends) for $100 invested in the Company on December 31, 2017 is set forth below.
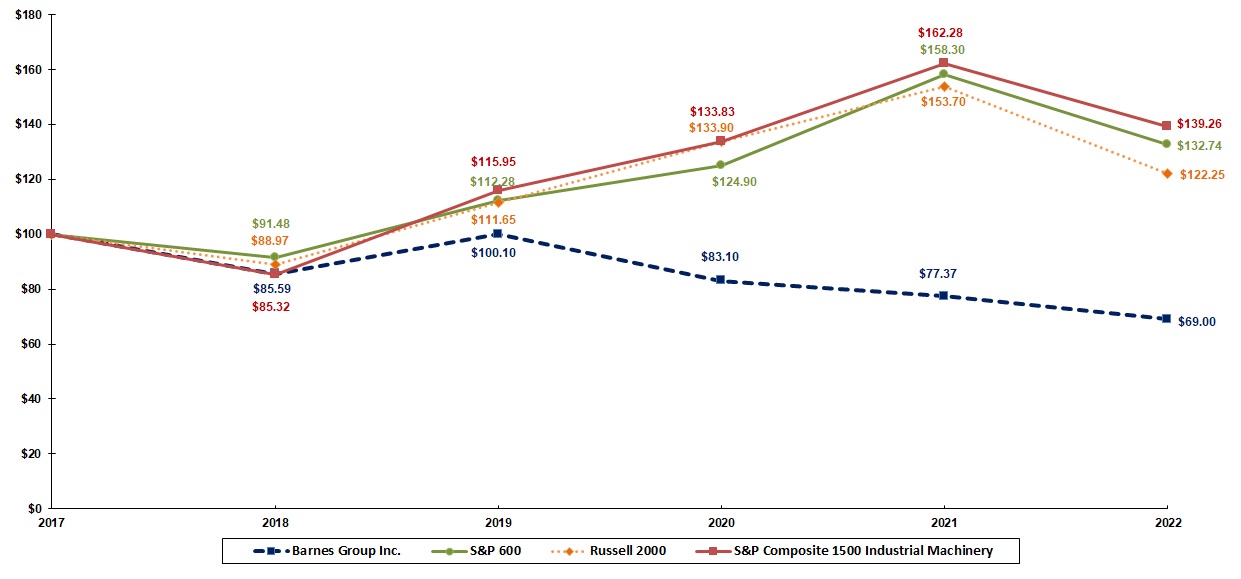
| 2017 | 2018 | 2019 | 2020 | 2021 | 2022 | |||||||||||||||||||||||||||||||||
| Barnes Group Inc. | $100.00 | $85.59 | $100.10 | $83.10 | $77.37 | $69.00 | ||||||||||||||||||||||||||||||||
| S&P 600 | $100.00 | $91.48 | $112.28 | $124.90 | $158.30 | $132.74 | ||||||||||||||||||||||||||||||||
| Russell 2000 | $100.00 | $88.97 | $111.65 | $133.90 | $153.70 | $122.25 | ||||||||||||||||||||||||||||||||
| S&P Composite 1500 Industrial Machinery | $100.00 | $85.32 | $115.95 | $133.83 | $162.28 | $139.26 | ||||||||||||||||||||||||||||||||
The performance graph includes the S&P 600 Small Cap Index, the Russell 2000 Index, and the S&P 1500 Industrial Machinery Sub-Industry Index (the "S&P Machinery Index"), all of which include the Company. The S&P Machinery Index was added in the current period as it includes peer companies which operate within similar industries as Barnes.
20
Issuer Purchases of Equity Securities
| Period | Total Number of Shares (or Units) Purchased | Average Price Paid Per Share (or Unit) | Total Number of Shares (or Units) Purchased as Part of Publicly Announced Plans or Programs | Maximum Number of Shares (or Units) that May Yet Be Purchased Under the Plans or Programs(2) | ||||||||||||||||||||||
| October 1-31, 2022 | 7,908 | $ | 35.25 | — | 3,404,000 | |||||||||||||||||||||
| November 1-30, 2022 | 709 | $ | 37.09 | — | 3,404,000 | |||||||||||||||||||||
| December 1-31, 2022 | 498 | $ | 40.64 | — | 3,404,000 | |||||||||||||||||||||
| Total | 9,115 | (1) | $ | 35.69 | — | |||||||||||||||||||||
(1)All acquisitions of equity securities during the fourth quarter of 2022 were the result of the operation of the terms of the Company's stockholder-approved equity compensation plans and the terms of the equity rights granted pursuant to those plans to pay for the related income tax upon issuance of shares. The purchase price of a share of stock used for tax withholding is the market price on the date of issuance.
(2)At March 31, 2019, 1.5 million shares of common stock had not been purchased under the publicly announced Repurchase Program (the “Program” or "Repurchase Program"). On April 25, 2019, the Board of Directors of the Company increased the number of shares authorized for repurchase under the Program by 3.5 million shares of common stock (5.0 million authorized, in total). The Program permits open market purchases, purchases under a Rule 10b5-1 trading plan and privately negotiated transactions.
Item 6. Reserved
21
Item 7. Management’s Discussion and Analysis of Financial Condition and Results of Operations
The following discussion should be read in conjunction with our consolidated financial statements and related notes in this Annual Report on Form 10-K. In addition to historical information, this discussion contains forward-looking statements that involve risks, uncertainties, and assumptions that could cause actual results to differ materially from our expectations. Factors that could cause such differences include those described in the section titled “Risk Factors” and elsewhere in this report. We undertake no obligation to update any of the forward-looking statements.
Management's Discussion and Analysis of Financial Condition and Results of Operations for 2020 is included in Item 7 of the Company’s Annual Report on Form 10-K for the year ended December 31, 2021, as filed with the Securities and Exchange Commission and is incorporated by reference, and should be referred to for information regarding this period.
OVERVIEW
The Company achieved sales of $1,261.9 million in 2022, an increase of $3.0 million, or 0.2%, from 2021. Organic sales (net sales excluding foreign currency translation, acquisition and divestiture impacts) increased by $55.8 million, or 4.4%, including an increase of $66.8 million, or 18.4%, at Aerospace, partially offset by a decrease of $11.0 million, or 1.2%, at Industrial. The strengthening of the U.S. dollar against foreign currencies decreased net sales within the Industrial segment by approximately $52.8 million. Operating income decreased 61.9% from $150.0 million in 2021 to $57.1 million in 2022 and operating margin decreased from 11.9% in 2021 to 4.5% in 2022, largely a result of a $68.2 million goodwill impairment charge, $20.6 million of pre-tax charges related to restructuring activities, and increased raw material, utility, labor and freight costs, partially offset by pricing and procurement actions taken by management, combined with the profit contribution of higher volumes within the Aerospace Aftermarket business. The goodwill impairment charge of $68.2 million decreased operating margin by 5.4% in 2022.
Impact of Macroeconomic Trends and Management Actions
Several macroeconomic trends continued to present challenges across our businesses during 2022, including labor and supply chain constraints, rising interest rates, the lingering effects of COVID-19 and inflationary pressures, resulting in increased freight, energy, labor and raw material costs. Management has taken several actions to mitigate the impacts of these events and circumstances.
In addition to taking pricing actions to partially recover costs, the Company has remained focused on cost management and productivity initiatives to mitigate these impacts. Management also continues to focus on driving core business execution through revenue growth, margin expansion, and new business development. More recently, management attention has been directed towards integrating our existing businesses, consolidating operations and facilities where appropriate, and rationalizing operational costs and investments; all with the goal of improving profitability and return on invested capital. In July 2022, management commenced a systematic multi-phased initiative to significantly reduce costs and integrate the Company's operations, decreasing complexity and focusing on improved performance across Industrial. More specifically, at this time, the Company announced a restructuring program to further reduce costs within the Industrial segment, in response to the macroeconomic disruption caused by the aforementioned items. Additional actions were subsequently announced in October 2022 (see Note 9 of the Consolidated Financial Statements). Management also continues to evaluate the ongoing Russia-Ukraine war and the potential for impacts on the Company's Consolidated Financial Statements.
Historically at Barnes, acquisitions and strategic relationships with our customers have been a key growth driver for the Company and we continue to seek alliances which foster long-term business relationships. Past acquisitions have allowed us to extend into new or adjacent markets, expand our geographic reach, and commercialize new products, processes and services. The Company continually evaluates its business portfolio to optimize product offerings and maximize value based on growing our "Top Line". We have significantly transformed our business with our entrance into new markets. Recently, the Company has paused acquisitions and is more narrowly assessing acquisitions as it focuses on driving core business execution and financial performance via the planned integration and consolidation actions described above. At Aerospace, the Company will evaluate acquisitions to expand its business, capabilities, and/or technologies. Historically, capital investment in our Aerospace business has been for participation in aftermarket programs such as our Revenue Sharing Programs ("RSP") and Component Repair Programs ("CRP").
The combined benefits from these initiatives collectively work to drive transformational value creation for all Barnes stakeholders.
22
Our Business
The Company consists of two operating segments: Industrial and Aerospace.
Key Performance Indicators
Management evaluates the performance of its reportable segments based on the sales, operating profit, operating margins and cash generation of the respective businesses. Each segment has standard key performance indicators (“KPIs”), a number of which are focused on employee safety-related metrics (total recordable incident rate and lost time incident rate), customer metrics (on-time-delivery and quality), internal effectiveness and productivity/efficiency metrics (sales effectiveness, global sourcing, operational excellence, functional excellence, cost of quality, days working capital and return on invested capital) and specific KPIs on profitable growth.
Key Industry Data
In both segments, management tracks a variety of economic and industry data as indicators of the health and outlook of a particular sector.
At Industrial, key data for the manufacturing operations include the Institute for Supply Management’s manufacturing PMI Composite Index (and similar indices for European and Asian-based businesses); the Bureau of Economics Industrial Production Index (the "IPI"); worldwide forecasts for light vehicle production, as well as new model introductions and existing model refreshes; North American heavy duty vehicle production; interconnection consulting hot runner systems worldwide report for auto, medical, personal care and packaging industries; and global GDP growth forecasts.
At Aerospace, management of the Aftermarket business monitors the number of aircraft in the active fleet, the number of aircraft temporarily or permanently taken out of service, aircraft utilization rates for the major airlines, engine shop visits, airline profitability, aircraft fuel costs and passenger traffic. The Aerospace OEM business regularly tracks orders, backlog and deliveries for each of the major aircraft manufacturers, as well as engine purchases made for new aircraft. Management also monitors annual appropriations for the U.S. defense market related to purchases of new or used aircraft and engine components.
RESULTS OF OPERATIONS
Sales
| ($ in millions) | 2022 | 2021 | $ Change | % Change | 2020 | |||||||||||||||||||||||||||
| Industrial | $ | 832.7 | $ | 896.5 | $ | (63.8) | (7.1) | % | $ | 770.1 | ||||||||||||||||||||||
| Aerospace | 429.2 | 362.4 | 66.8 | 18.4 | % | 354.3 | ||||||||||||||||||||||||||
| Total | $ | 1,261.9 | $ | 1,258.8 | $ | 3.0 | 0.2 | % | $ | 1,124.4 | ||||||||||||||||||||||
The Company reported net sales of $1,261.9 million in 2022, an increase of $3.0 million, or 0.2%, from 2021. Organic sales increased by $55.8 million, driven by an increase of $66.8 million at Aerospace, partially offset by a decrease of $11.0 million at Industrial. The increase at Aerospace was driven by sales growth across both businesses, resulting primarily from continued global improvement in aerospace markets. From an Industrial standpoint, sales decreased as compared with the prior year period, as continued pressure from global supply chain constraints impacted near-term automotive and broader industrial production. As compared with the prior year period, the Molding Solutions business was most impacted by these macroeconomic factors. The Engineered Components business and the Force and Motion business experienced modest organic sales growth relative to the prior year period, whereas the Automation business remained flat. The strengthening of the U.S. dollar against foreign currencies decreased net sales within the Industrial segment by approximately $52.8 million. The Company's international sales decreased by 3.3% year-over-year while domestic sales increased by 5.7%. Excluding the impact of foreign currency translation on sales, however, the Company's international sales in 2022 increased by 3.6% from 2021.
23
Expenses and Operating Income
| ($ in millions) | 2022 | 2021 | $ Change | % Change | 2020 | |||||||||||||||||||||||||||
| Cost of sales | $ | 840.0 | $ | 803.9 | $ | 36.1 | 4.5 | % | $ | 721.2 | ||||||||||||||||||||||
| % sales | 66.6 | % | 63.9 | % | 64.1 | % | ||||||||||||||||||||||||||
Gross profit (1) | $ | 421.9 | $ | 455.0 | $ | (33.1) | (7.3) | % | $ | 403.2 | ||||||||||||||||||||||
| % sales | 33.4 | % | 36.1 | % | 35.9 | % | ||||||||||||||||||||||||||
| Selling and administrative expenses | $ | 296.6 | $ | 305.0 | $ | (8.4) | (2.8) | % | $ | 279.8 | ||||||||||||||||||||||
| % sales | 23.5 | % | 24.2 | % | 24.9 | % | ||||||||||||||||||||||||||
| Goodwill impairment charge | $ | 68.2 | $ | — | $ | 68.2 | 100.0 | % | $ | — | ||||||||||||||||||||||
| % sales | 5.4 | % | — | % | $ | — | ||||||||||||||||||||||||||
| Operating income | $ | 57.1 | $ | 150.0 | $ | (92.9) | (61.9) | % | $ | 123.4 | ||||||||||||||||||||||
| % sales | 4.5 | % | 11.9 | % | 11.0 | % | ||||||||||||||||||||||||||
(1)Sales less cost of sales
Cost of sales in 2022 increased 4.5% from 2021, and gross profit margin decreased from 36.1% in the 2021 period to 33.4% in the 2022 period. Gross margins improved at Aerospace and declined at Industrial. Within Industrial, gross profit and gross profit margin decreased primarily as a result of decreased sales volume, unfavorable productivity, in part caused by supply chain constraints, and inflationary pressures, which were partially offset by a decrease in employee related costs, including incentive compensation. Within Aerospace, higher volumes within both businesses on a year over year basis, in particular the higher margin Aftermarket business, contributed to an increase in both gross profit and gross profit margin during 2022. In addition, $3.0 million of pre-tax charges related to restructuring actions and transformational activities (aggregate of $20.6 million, including selling and administrative costs) impacted gross profit across the segments. Selling and administrative expenses in 2022 decreased 2.8% from the 2021 period. Sales, however, remained flat between the 2022 and 2021 periods. As a percentage of sales, selling and administrative costs decreased from 24.2% in 2021 to 23.5% in the 2022 period. The decrease in selling and administrative costs as a percentage of sales was primarily driven by lower employee costs, including incentive compensation, partially offset by $17.6 million of pre-tax charges related to restructuring actions and transformational activities (aggregate of $20.6 million). The goodwill impairment charge of $68.2 million related to the Automation reporting unit also impacted operating results during 2022, reducing operating income margin by 5.4% in 2022. Operating income in 2022 decreased 61.9% to $57.1 million from the 2021 period and operating income margin decreased from 11.9% in the 2021 period to 4.5% in the 2022 period, primarily driven by the goodwill impairment charge, the pre-tax charges related to restructuring actions and the additional items noted above.
Excluding the goodwill impairment charge, operating profit and operating margin during the 2022 period was $125.3 million and 9.9%, respectively.
Interest expense
Interest expense in 2022 decreased $1.6 million to $14.6 million from 2021, primarily a result of decreased average borrowings.
Other expense (income), net
Other expense (income), net in 2022 was $4.3 million compared to $6.0 million in 2021. Other expense (income), net during the 2022 and 2021 periods includes other components of pension expense of $0.1 million and $2.4 million, respectively. Other expense (income), net also includes foreign currency losses of $0.5 million and $0.6 million in the 2022 and 2021 periods, respectively.
Income Taxes
The Company's effective tax rate was 64.7% in 2022, compared with 21.9% in 2021. The increase in the effective tax rate in 2022 was primarily driven by the goodwill impairment charge of $68.2 million, incurred in the second quarter, which is not tax deductible for book purposes. Excluding the goodwill impairment charge the effective tax rate for 2022 would have been 23.2%. Additional drivers causing the increase in the effective tax rate include the absence of a benefit related to a realignment of tax basis goodwill and intangibles in Italy and a benefit related to the Mutual Aid Process ("MAP") approval (discussed below), both which were recognized in 2021, as well as an increase in valuation allowances for disallowed expenses
24
related to Internal Revenue Code Section 162(m) for covered employee’s compensation (see description below). These were offset by a favorable mix of non-U.S. earnings, including a significant increase in the impact of favorable tax holidays.
Section 162(m) of the Internal Revenue Code (the “Code”) includes a tax deduction limitation for compensation in excess of $1.0 million to any individual who served as the CEO or CFO at any time during the tax year, and the three highest paid individuals during the tax year other than the CEO or CFO (a “Covered Employee”). Pursuant to the Code, an individual remains a Covered Employee upon retirement. The Company increased its tax valuation allowance by $2.6 million for payments, primarily related to pension, to be made to Covered Employees.
During the second quarter of 2021, the Italian tax authorities released tax guidance related to the application of tax basis realignment rules for intangible property ("Realignment") which provides Italian taxpayers with the opportunity to step up the basis of goodwill and intangibles to their fair market value and amortize the step up over 18 years for tax purposes in exchange for paying a 3% tax on the step up, payable over a three years period. The Company opted to elect the Realignment in June 2021 and accordingly recorded a tax payable of $3.0 million and a long-term tax payable of $6.0 million. The Company made its first required installment payment of $3.0 million during the third quarter of 2021, reducing the long-term tax payable accordingly. The Company also recorded a deferred tax asset of $83.9 million related to the Realignment. Accounting guidance requires that when a deferred tax asset is realigned for tax purposes, a corresponding revaluation reserve also be recorded. Under Italian tax rules, any dividends paid out of this revaluation reserve are subject to tax at a 24% rate. Accordingly, the Company recorded a deferred tax liability of $72.2 million related to the potential 24% tax due on any dividends, paid out of the revaluation reserve. The deferred tax asset and liability balances have been presented on a net basis on the Consolidated Balance Sheets. The Company also recorded a one-time $2.7 million benefit to the provision related to this election and related accounting. In December 2021 the Italian government increased the amortization period to 50 years but then reversed the period back to 10 years for the intangible component of the step up in 2022; however the change has no impact on the accounting for the transaction as reported above.
In 2019 and 2017, the Company recorded additional income taxes resulting from audits at certain subsidiaries in Germany. The Company filed applications with the Internal Revenue Service ("IRS") under the MAP to allow for offsetting positions within the US tax filings for the Germany-related adjustments. In 2021 the MAP applications were approved by the IRS. The Company recognized a tax benefit of $2.0 million in 2021 to reflect the tax benefit realized as a result of the IRS approval.
The Aerospace and Industrial segments have a number of multi-year tax holidays in China, Malaysia and Singapore. The China holiday was granted in 2021 and provides for a corporate income tax of 15% for the approved businesses. The holiday runs for a three year period ending December 31, 2023. It is anticipated that the company will re-apply for the holiday in 2024. Aerospace was granted an income tax holiday for operations recently established in Malaysia. This holiday commenced effective November 2020 (retroactively) and remains effective for a period of ten years. The Aerospace business was granted additional tax holidays in Singapore under the Pioneer program in the fourth quarter of 2022. This holiday provides reduced tax rates for certain Aerospace programs manufactured at the Singapore location and will run through December 2025. All of the holidays are subject to the Company meeting certain commitments in the respective jurisdictions.
During 2022, the Company did not repatriate any dividends to the U.S, compared to $68.3 million in 2021. Pursuant to the Tax Cuts and Jobs Act (“Act”), the 2021 dividend was not taxable in the U.S. The Act, which was enacted in 2017, made broad and complex changes to the U.S. Tax Code and included, but was not limited to, requiring a one-time Transition Tax on certain unrepatriated accumulated earnings of foreign subsidiaries of the Company (payable over eight years) and exempted foreign dividends paid to the U.S. during the year from taxation if such earnings were included within the Transition Tax.
In 2023, the Company expects the effective tax rate to approximate 25%, a decrease from the rate of 64.7% and an increase from the adjusted rate of 23.2% in 2022. The decrease is due to the exclusion of the goodwill impairment in the 2023 rate offset by an unfavorable projected earnings mix in 2023.
See Note 14 of the Consolidated Financial Statements for a reconciliation of the U.S. federal statutory income tax rate to the consolidated effective income tax rate.
25
Income and Income Per Share
| (in millions, except per share) | 2022 | 2021 | Change | % Change | 2020 | |||||||||||||||||||||||||||
| Net income | $ | 13.5 | $ | 99.9 | $ | (86.4) | (86.5) | % | $ | 63.4 | ||||||||||||||||||||||
| Net income per common share: | ||||||||||||||||||||||||||||||||
| Basic | $ | 0.26 | $ | 1.96 | $ | (1.70) | (86.7) | % | $ | 1.25 | ||||||||||||||||||||||
| Diluted | $ | 0.26 | $ | 1.96 | $ | (1.70) | (86.7) | % | $ | 1.24 | ||||||||||||||||||||||
| Weighted average common shares outstanding: | ||||||||||||||||||||||||||||||||
| Basic | 51.0 | 50.9 | — | 0.1 | % | 50.9 | ||||||||||||||||||||||||||
| Diluted | 51.1 | 51.1 | — | — | % | 51.1 | ||||||||||||||||||||||||||
Basic and diluted net income per common share decreased for 2022 as compared to 2021 due to the decrease in net income year over year. Basic and diluted weighted average common shares outstanding were consistent year over year and were only slightly impacted by the repurchase of 200,000 and 100,000 shares during 2022 and 2021, respectively, as part of the Company's publicly announced Repurchase Program (as defined herein) as well as the issuance of additional shares for employee stock plans.
Financial Performance by Business Segment
Industrial
| ($ in millions) | 2022 | 2021 | $ Change | % Change | 2020 | |||||||||||||||||||||||||||
| Sales | $ | 832.7 | $ | 896.5 | $ | (63.8) | (7.1) | % | $ | 770.1 | ||||||||||||||||||||||
| Operating profit | (19.1) | 97.7 | (116.8) | (119.5) | % | 66.6 | ||||||||||||||||||||||||||
| Operating margin | (2.3) | % | 10.9 | % | 8.6 | % | ||||||||||||||||||||||||||
Sales at Industrial were $832.7 million in 2022, a decrease of $63.8 million, or 7.1%, from 2021. Organic sales decreased by $11.0 million, or 1.2%, during 2022, primarily driven by lower volumes, partially offset by pricing actions, intended to address inflationary pressures. Most meaningfully, the Molding Solutions business experienced a year-over-year organic sales decline relative to 2021. The Engineered Components and Force and Motion Control businesses experienced modest organic sales growth relative to the prior year, with the Automation business remaining flat. The impacts of global supply chain constraints on near-term automotive and broader industrial production reduced sales volumes across the transportation, medical and personal care end-markets. Volumes increased on a sequential basis during the fourth quarter of 2022 in the transportation, personal care and packaging end-markets, albeit volumes were tempered by a resurgence of COVID-19 in China, impacting production accordingly. The impact of foreign currency translation decreased sales by approximately $52.8 million as the U.S. dollar strengthened against foreign currencies.
The operating loss in 2022 at Industrial of $19.1 million, as compared with an operating profit of $97.7 million in 2021, was driven by a $68.2 million goodwill impairment charge related to the Automation business, $20.9 million of pre-tax charges related to restructuring activities and the profit impact of decreased organic sales. Unfavorable productivity was partially driven by global supply chain constraints in the comparable 2022 period, while inflationary pressures increased freight, utilities, labor and raw material costs across the broader industry during 2022, partially offset by lower employee costs, including incentive compensation. During 2022, inflationary pressures and increased global sourcing costs of approximately $33.0 million were partially offset by the pricing and other actions taken by the Company, providing a recovery of approximately $32.0 million. Operating margin decreased from 10.9% in the 2021 period to (2.3)% in the 2022 period as a result of the items described above (primarily the goodwill impairment charge). The goodwill impairment charge of $68.2 million decreased Industrial operating margin by 8.2% in 2022.
Outlook:
In Industrial, management remains focused on generating organic sales growth through expanded go-to-market strategies, which includes additional sales and marketing resources and the introduction of new products and services to comprehensively leverage the Company's full product portfolio with customers in our global industrial end-markets. Our end markets remain impacted by continuing economic headwinds including absenteeism, a resurgence of COVID-19 in certain
26
regions of China and supply chain constraints. Sales within China and Europe declined on a year-over-year basis, albeit sales within these regions increased on a sequential basis in the fourth quarter. Order rates remained flat on a year-over-year basis and on a sequential basis in the fourth quarter within Europe, whereas order rates decreased on both a year-over-year and sequential basis in China. Supply chain disruptions and consumer uncertainty surrounding the economy impacted current period shipments and a resurgence of COVID-19, primarily in China, impacted orders across several Industrial business and regions. Orders within our key region of North America declined on a year-over-year basis, however improved on a sequential basis during the fourth quarter of 2022. For overall industrial end-markets, the manufacturing Purchasing Managers' Index ("PMI") ended 2022 below 50 in the United States, Europe and China. Global production of light vehicles is forecasted to improve in 2023, albeit forecasted growth projections have declined since early 2022. Continued global supply constraints may continue to impact near-term automotive builds. Management expects these supply constraints to begin tapering in 2023. Our customers and the markets we serve may impose emissions reduction or other environmental standards and requirements, including our conventional fuel-based automotive markets, thereby impacting sales volumes within our automotive end markets. Management also tracks closely the impact of pricing changes and lead times on raw materials and freight, given the continued ongoing pressure of supply chain constraints. Management remains focused on labor constraints that have continued to impact the business throughout 2022 and may continue to impact 2023. Management continues to closely monitor our end markets, as global medical end market order rates strengthened within our Molding Solutions business on both a sequential basis in the fourth quarter and on a year-over-year basis. We expect medical to remain strong over the longer term given an aging population and expanded medical applications. Orders within the personal care market remained flat on a year-over-year basis and decreased within packaging end markets, albeit both improved on a sequential basis in the fourth quarter of 2022. Sales volumes at certain of our businesses is dependent upon the need for equipment used in plastic injection molding markets, which may be significantly influenced by the demand for plastic products, the capital investment needs of companies in the plastic injection molding and plastics processing industries, changes in technological advances and changes in laws or regulations such as those related to single-use plastics, product and packaging composition, and recycling. Automation orders improved organically on a year-over-year basis. Management continues to evaluate continued inflationary pressures and the ongoing Russia-Ukraine war and the potential for impacts on the Company. Within the segment, our exposure in Russia is minimal, with historical annual sales of less than $2.0 million. As noted above, our sales were negatively impacted by $52.8 million from fluctuations in foreign currencies. To the extent that the U.S. dollar fluctuates relative to other foreign currencies, our sales may be impacted relative to the prior year periods. The relative impact on operating profit is not expected to be as significant as the impact on sales as most of our businesses have expenses primarily denominated in local currencies, where their revenues reside, however operating margins may be impacted. Management is focused on sales growth through expanded sales and marketing resources, customer engagement, innovation and expanding geographic reach. Strategic investments in new technologies, manufacturing processes and product development are expected to provide benefits over the long term, and management continues to evaluate such opportunities.
The Company is focused on the proactive management of costs to increase competitiveness and to mitigate the ongoing impacts of the current macroeconomic environments, including the continuing risks of supply chain constraints and broad based inflation on operating profit. Management also remains focused on strategic investments and new product and process introductions, as well as driving productivity. The Company continues to manage its cost structure to align with the intake of orders and sales given remaining uncertainty within certain end-markets as we enter 2023. In July 2022, management commenced a systematic multi-phased restructuring initiative (the "Actions") to significantly reduce costs and integrate the Company's operations, decreasing complexity and focusing on improved performance across Industrial. During the first phase of the Actions, authorized in July 2022, management focused on the consolidation of two manufacturing sites and a number of branch offices, and changes in infrastructure to eliminate certain roles across a number of locations in the Industrial segment businesses. The second phase of the Actions commenced during October 2022, resulting in the consolidation of additional facilities that drive both operations and the development and creation of innovation. Collectively, the Actions are expected to reduce annualized costs by approximately $26.0 million within the Industrial segment, with an estimated cost of $29.0 million. See Note 9 of the Consolidated Financial Statements for additional discussion. Management will continue to explore opportunities for additional cost savings, while working closely with vendors and customers as it relates to the timing of deliveries and pricing initiatives. Operating profit may continue to be impacted by changes in sales volume, mix and pricing, inflation, labor and freight costs, utility cost, and the levels of investments in growth and innovation that are made within each of the Industrial businesses. The ongoing events and uncertainty related to the Russia-Ukraine war have also driven delivery and other logistical challenges, further magnifying the impacts of increased freight cost, and utility cost and availability, mentioned above. Operating profit may also be impacted by enactment of or changes in tariffs, trade agreements and trade policies that may affect the cost, lead times and/or availability of goods, including but not limited to, steel and aluminum. Costs associated with new product and process introductions, restructuring and other cost initiatives, and strategic investments may negatively impact operating profit.
27
Aerospace
| ($ in millions) | 2022 | 2021 | $ Change | % Change | 2020 | |||||||||||||||||||||||||||
| Sales | $ | 429.2 | $ | 362.4 | $ | 66.8 | 18.4 | % | $ | 354.3 | ||||||||||||||||||||||
| Operating profit | 76.2 | 52.3 | 23.9 | 45.7 | % | 56.8 | ||||||||||||||||||||||||||
| Operating margin | 17.7 | % | 14.4 | % | 16.0 | % | ||||||||||||||||||||||||||
Aerospace recorded sales of $429.2 million in 2022, an 18.4% increase from 2021. Sales increased 7.4% and 42.0% within the OEM and Aftermarket businesses, respectively, relative to the 2021 period. The year-over-year increase in OEM sales was driven by continued growth within narrow body airframe production. Sales within OEM, although having increased since the comparable 2021 period, declined sequentially in the fourth quarter of 2022. This decline came largely as a result of unfavorable labor productivity during the period, rather than the impact of demand. Within Aftermarket, airline traffic and aircraft utilization have continued to ramp during 2022. Sales within the segment are largely denominated in U.S. dollars and therefore were not significantly impacted by changes in foreign currency.
Operating profit at Aerospace increased 45.7% from 2021 to $76.2 million. The increase in operating profit resulted from mix across the businesses and, more specifically, the comparably higher Aftermarket sales during 2022, as discussed above, partially offset by unfavorable productivity. Operating profit also increased as a result of a favorable restructuring adjustment of $0.3 million during 2022 compared with a restructuring charge of $0.9 million during the 2021 period. Unfavorable productivity during the full year period was driven in part by labor availability and supply chain challenges. The availability of labor improved during the quarter ended December 31, 2022, although labor productivity was unfavorable as new employees were moved into production. Recruiting efforts have increased during the period and staffing has improved heading into 2023. Operating margin increased from 14.4% in the 2021 period to 17.7% in the 2022 period, primarily a result of the impacts of the items discussed above.
Outlook:
Sales in the Aerospace OEM business are based on the general state of the aerospace market driven by the worldwide economy and are supported by its order backlog through participation in certain strategic commercial and defense-related engine and airframe programs. OEM sales grew in 2022 relative to the comparable 2021 period, and orders have remained healthy as customer aircraft production schedules continue to normalize. The Company expects, however, that the OEM business will see a continued recovery in demand for its manufactured components as narrow body airframe production remains strong, whereas wide body airframe production, albeit improving, remains soft. The duration and depth of the aerospace market disruptions remain uncertain at this time. Aerospace management continues to work with customers to evaluate engine and airframe build schedules, giving management the ability to react timely to such changes. Management is working closely with suppliers to align raw material schedules with production requirements. Management also remains focused on labor and supply chain constraints (including raw material and castings) that continued to impact the business and on executing long-term agreements while expanding its share of production on key programs. Backlog at OEM was $750.1 million at December 31, 2022, an increase of 10.3% since December 31, 2021, at which time backlog was $680.1 million. Approximately 40% of OEM backlog is expected to be recognized over the next 12 months. A COVID-19 resurgence has the potential to materially impact the aerospace industry, including our more significant OEM customers, and it could materially affect our Aerospace business and results of operations. The Aerospace OEM business may also be impacted by changes in the content levels on certain platforms, changes in customer sourcing decisions, adjustments to customer inventory levels, labor and commodity availability (including the availability of commodities such as titanium sourced in Russia) and pricing, labor productivity, vendor sourcing capacity and the use of alternate materials. Additional impacts may include the redesign of parts, quantity of parts per engine, cost schedules agreed to under contract with the engine and airframe manufacturers, as well as the pursuit and duration of new programs. Fluctuations in fuel costs, interest rates, and potential changes in regulatory requirements could impact airlines' decisions on maintaining, deferring or canceling new aircraft purchases, in part based on the value associated with new fuel-efficient technologies and targets established by airlines to reduce greenhouse gas emissions.
The Aerospace Aftermarket business continues to demonstrate recovery as airline traffic and aircraft utilization improve, aircraft are being removed from storage and placed into service and airlines begin to return to profitability. Domestic and international passenger traffic have improved as significant domestic health and travel restrictions have been lifted with continued growth forecasted through 2023. International travel restrictions have been lifted, although geopolitical considerations continue to impact wide body aircraft utilization and corresponding Aftermarket orders. Freight-related air traffic continues to support Aftermarket growth. Sales in the Aerospace Aftermarket business may continue to be impacted by inventory management and changes in customer sourcing, deferred or limited maintenance activity during engine shop visits and the use of surplus (used) material during the engine repair and overhaul process. Management believes that its Aerospace
28
Aftermarket business continues to be competitively positioned based on well-established long-term customer relationships, including maintenance and repair contracts in the MRO business and long-term Revenue Sharing Programs ("RSPs") and Component Repair Programs ("CRPs"). The MRO business may also be impacted by airlines electing to closely manage their aftermarket costs as engine performance and quality improves. Fluctuations in fuel costs and potential changes in regulatory requirements and their corresponding impacts on airline profitability and behaviors within the aerospace industry could also impact levels and frequency of aircraft maintenance and overhaul activities, and airlines' decisions on maintaining, deferring or canceling new aircraft purchases, in part based on the economics associated with new fuel-efficient technologies.
Given the pressures on sales growth resulting from labor and supply chain constraints, the Company remains focused on
proactive cost management and improved productivity to mitigate continued pressure on operating profit. Industry demand
remains partially constrained by the availability of skilled labor, although improvements were recognized during the three months ended December 31, 2022. Aerospace will continue to explore opportunities for additional productivity, including working closely with vendors and customers as it relates to the timing of deliveries and pricing initiatives. Management also remains focused on growth through strategic investments, acquisition and new product and process introductions. Driving productivity continues as a key initiative. Operating profit is expected to be affected by the impact of the changes in sales volume noted above, mix and pricing, particularly as they relate to the higher profit Aftermarket RSP spare parts business, and investments made in each of its businesses. Operating profits may also be impacted by potential changes in tariffs, trade agreements and trade policies that may affect the cost and/or availability of goods and labor constraints. Costs associated with new product and process introductions, the physical transfer of work to other global regions, additional productivity initiatives and restructuring activities may also negatively impact operating profit.
LIQUIDITY AND CAPITAL RESOURCES
Management assesses the Company's liquidity in terms of its overall ability to generate cash to fund its operating and investing activities. Of particular importance in the management of liquidity are cash flows generated from operating activities, capital expenditure levels, dividends, capital stock transactions, effective utilization of surplus cash positions overseas and adequate lines of credit. The Company currently maintains sufficient liquidity and will continue to evaluate ways to enhance its liquidity position as it navigates through the disrupted business environment that has resulted from COVID-19 and more recent geopolitical uncertainty, in addition to the macroeconomic trends discussed above.
The Company believes that its ability to generate cash from operations in excess of its internal operating needs is one of its financial strengths. Management continues to focus on cash flow and working capital management, and anticipates that operating activities in 2023 will generate sufficient cash to fund operations. See additional discussion regarding currently available debt facilities below. The Company continues to invest within its businesses, with its estimate of 2023 capital spending to approximate $50 million.
In October 2014, the Company entered into a Note Purchase Agreement (“Note Purchase Agreement”), among the Company and New York Life Insurance Company, New York Life Insurance and Annuity Corporation and New York Life Insurance and Annuity Corporation Institutionally Owned Life Insurance Separate Account, as purchasers, for the issuance of $100.0 million aggregate principal amount of 3.97% senior notes due October 17, 2024 (the “3.97% Senior Notes”). The 3.97% Senior Notes are senior unsecured obligations of the Company and pay interest semi-annually on April 17 and October 17 of each year at an annual rate of 3.97%. The 3.97% Senior Notes will mature on October 17, 2024 unless earlier prepaid in accordance with their terms. Subject to certain conditions, the Company may, at its option, prepay all or any part of the 3.97% Senior Notes in an amount equal to 100% of the principal amount of the 3.97% Senior Notes so prepaid, plus any accrued and unpaid interest to the date of prepayment, plus the Make-Whole Amount, as defined in the Note Purchase Agreement, with respect to such principal amount being prepaid. The Note Purchase Agreement contains customary affirmative and negative covenants that are similar to the covenants required under the Amended Credit Agreement, as discussed below. At December 31, 2022, the Company was in compliance with all covenants under the Note Purchase Agreement.
On October 8, 2020, the Company entered into the sixth amendment to its fifth amended and restated revolving credit agreement with Bank of America (the “Sixth Amendment”) and the first amendment to the Note Purchase Agreement with New York Life (the “First NPA Amendment” and, collectively with the Sixth Amendment, the "Amendments"). The Sixth Amendment maintained the borrowing availability of $1,000.0 million along with access to request an additional $200.0 million through an accordion feature. The Sixth Amendment and the First NPA Amendment provided for an increase in the Company’s maximum ratio of Consolidated Senior Debt, as defined, to Consolidated EBITDA, as defined, from 3.25 times (or, if a certain permitted acquisition above $150.0 million is consummated, 3.50 times) to 3.75 times in each case at the end of the four fiscal quarters, beginning with December 31, 2020, and regardless of whether a permitted acquisition, as defined, is consummated, providing additional financing flexibility and access to liquidity. Additionally, the Sixth Amendment requires the Company to
29
maintain a maximum ratio of Consolidated Total Debt, as defined, to Consolidated EBITDA, of not more than 3.75 times in each case, at the end of the four fiscal quarters, beginning with December 31, 2020 and regardless of whether a permitted acquisition, as defined, is consummated. Furthermore, the First NPA Amendment provides for (i) adjustments to the ratio of Consolidated Total Debt to Consolidated EBITDA to conform to a more restrictive total leverage ratio that may be required under the Sixth Amendment, (ii) an increase in the amount of allowable add-back for restructuring charges when calculating Consolidated EBITDA from $15.0 million to $25.0 million and (iii) a required fee payment equal to 0.50% per annum times the daily outstanding principal amount of the note during each of the four fiscal quarters, following the quarter ended December 31, 2020, if the Company’s Senior Leverage Ratio, as defined, exceeds 3.25 times. In October 2020, the Company paid fees and expenses of $1.4 million in conjunction with executing the Amendments. Such fees have been deferred within Other Assets on the accompanying Consolidated Balance Sheet and are being amortized on the Consolidated Statements of Income.
On February 10, 2021, the Company and certain of its subsidiaries entered into the sixth amended and restated senior unsecured revolving credit agreement (the "Amended Credit Agreement") and retained Bank of America, N.A. as the Administrative Agent for the lenders. The Amended Credit Agreement maintains the $1,000.0 million of availability under the facility, while increasing the available borrowings under the accordion feature from $200.0 million to $250.0 million (aggregate availability of $1,250.0 million) and extends the maturity date through February 2026. The Amended Credit Agreement also adjusts the interest rate to either the Eurocurrency rate, as defined in the Amended Credit Agreement, plus a margin of 1.175% to 1.775% or the base rate, as defined in the Amended Credit Agreement, plus a margin of 0.175% to 0.775%, depending on the Company's leverage ratio at the time of the borrowing. Multi-currency borrowings, pursuant to the Amended Credit Agreement, bear interest at their respective interbank offered rate (i.e. Euribor) or 0.00% (higher of the two rates) plus a margin of between 1.175% to 1.775%. As with the earlier facility, the Company's borrowing capacity is limited by various debt covenants in the Amended Credit Agreement, as described further below. The Amended Credit Agreement required the Company to maintain a Senior Debt Ratio of not more 3.25 times (or, if a permitted acquisition above $150.0 million is consummated, 3.50 times at the end of each of the first four fiscal quarters ending after the consummation of any such acquisition). In addition, the Amended Credit Agreement requires the Company to maintain a Total Debt Ratio of not more than 3.75 for each fiscal quarter (or, if a permitted acquisition above $150.0 million is consummated, 4.25 times at the end of each of the first four fiscal quarters ending after the consummation of any such acquisition). A ratio of Consolidated EBITDA to Consolidated Cash Interest Expense, as defined, of not less than 4.25, is required at the end of each fiscal quarter. The Amended Credit Agreement also contemplates the potential replacement of LIBOR (as defined below) with a successor financing rate, pursuant to the intent of the United Kingdom's Financial Conduct Authority to phase out use of LIBOR (see description below). See additional discussion immediately below regarding the Company's ongoing evaluation related to this potential change in financing rates. The Company paid fees and expenses of $4.3 million in conjunction with executing the Amended Credit Agreement. Such fees have been deferred within Other assets on the Consolidated Balance Sheets and will be amortized into interest expense on the Consolidated Statements of Income through its maturity. The Company subsequently amended the Credit Agreement on October 11, 2021 (the "LIBOR Transition Amendment"), defining certain applicable multi-currency borrowing rates that may be used as replacement rates for LIBOR, which is expected to be discontinued by reference rate reform. See Note 1 of the Consolidated Financial Statements, as well as discussion below. As a result of the Company's contract amendments to address the replacement of LIBOR, the Company does not anticipate a material impact on our business, financial condition, results of operations or cash flow as a result of this change.
On April 6, 2022, the Company entered into Amendment No. 1 to the Amended Credit Agreement (“Amendment No. 1”), which (i) replaced the LIBOR interest rate for U.S. dollar loans to a term Secured Overnight Financing Rate including a Secured Overnight Financing Rate adjustment (or "SOFR", as defined in the Amended Credit Agreement), (ii) added a daily SOFR option for U.S. dollar loans and a term SOFR option for U.S. dollar loans, and (iii) added the ability to borrow foreign swing line loans based on the Euro Short Term Rate (as defined) with the same interest spread as the interest spread for SOFR Loans (as defined) and Alternative Currency Loans (defined as loans denominated in Euro, Sterling, Swiss Francs or Yen). In addition, Amendment No. 1 lowered the interest rate spread on (i) SOFR Loans and Alternative Currency Loans to a range from 0.975% to 1.70%, depending on the leverage ratio (the “Leverage Ratio”) of Consolidated Total Debt (as defined) to Consolidated EBITDA (as defined) as of the end of each fiscal quarter, and (ii) loans based on the Base Rate (as defined), to a range from 0.00% to 0.70%, depending on the Company’s Leverage Ratio as of the end of each fiscal quarter. Amendment No. 1 also lowered the facility fee, which is required to be paid by the Company under the Amended Credit Agreement and is calculated on the full amount of the revolving facility, to a range from 0.15% to 0.30%, depending on the Company’s Leverage Ratio at the end of each fiscal quarter. In April 2022, the Company paid fees and expenses of $1.0 million in conjunction with executing Amendment No. 1. Such fees are deferred within Other Assets on the Consolidated Balance Sheets and will be amortized on the Consolidated Statements of Income.
The United Kingdom's Financial Conduct Authority, which regulates the London Interbank Offered Rate (“LIBOR”), announced its intent to phase out the use of LIBOR by December 31, 2021. The U.S. Federal Reserve, in conjunction with the
30
Alternative Reference Rates Committee, a steering committee comprised of large U.S. financial institutions, identified the Secured Overnight Financing Rate (“SOFR”) as its preferred benchmark alternative to U.S. dollar LIBOR. Published by the Federal Reserve Bank of New York, SOFR represents a measure of the cost of borrowing cash overnight, collateralized by U.S. Treasury securities, and is calculated based on directly observable U.S. Treasury-backed repurchase transactions. The Company’s Amended Credit Agreement and corresponding interest rate swap are tied to LIBOR, with each maturing in February 2026, as noted above. In March 2021, the ICE Benchmark Association announced that it would extend the publication of overnight, 1, 3, 6 and 12 month LIBOR rates until June 30, 2023, while ceasing publication of all other LIBOR rates including 1 week and 2 month rates. The Company's Amended Credit Agreement was further amended in October 2021 and in April 2022 to address the replacement of LIBOR, defining certain applicable multi-currency borrowing rates that may be used as a replacement. The Company is continuing to monitor the potential impact of the replacement of LIBOR, but does not anticipate a material impact on our business, financial condition, results of operations and cash flows. The Company's Amended Credit Agreement was further amended in October 2021 and in April 2022 to address the replacement of LIBOR via the LIBOR Transition Agreement and Amendment No. 1, respectively, as detailed above. As a result of the Company's contract amendments to address the replacement of LIBOR, the Company does not anticipate a material impact on our business, financial condition, results of operations or cash flow as a result of this change.
At December 31, 2022, the Company was in compliance with all applicable covenants. The Company anticipates continued compliance under the Agreements in each of the next four quarters. The Company's most restrictive financial covenant is the Senior Debt Ratio, which required the Company to maintain a ratio of Consolidated Senior Debt to Consolidated EBITDA of not more than 3.25 times at December 31, 2022. The actual ratio at December 31, 2022 was 2.35 times, as defined.
In 2022, 2021 and 2020, the Company acquired 0.2 million shares, 0.1 million shares and 0.4 million shares of the Company's common stock, respectively, under the Repurchase Program at a cost of $6.7 million, $5.2 million and $15.6 million, respectively. Management will continue to evaluate additional repurchases based on prevailing market conditions, our liquidity requirements, contractual restrictions and other factors. See "Part II - Item 5 - Market for Registrant’s Common Equity, Related Stockholder Matters and Issuer Purchases of Equity Securities."
Operating cash flow may be supplemented with external borrowings to meet near-term business expansion needs and the Company's current financial commitments. The Company has assessed its credit facilities in conjunction with the Amended Credit Facility and currently expects that its bank syndicate, comprised of 12 banks, will continue to support its recently executed Amended Credit Agreement, which matures in February 2026. At December 31, 2022, the Company had $533.3 million unused and available for borrowings under its $1,000.0 million Amended Credit Facility, subject to covenants in the Company's revolving debt agreements. At December 31, 2022, additional borrowings of $338.9 million of Total Debt including $217.5 million of Senior Debt would have been allowed under the financial covenants. The Company intends to use borrowings under its Amended Credit Agreement to support the Company's ongoing growth initiatives. Recently, the Company has paused acquisitions and is more narrowly assessing acquisitions as it focuses on driving core business execution and financial performance via the planned integration and consolidation actions described above. The Company believes its credit facilities and access to capital markets, coupled with cash generated from operations, are adequate for its anticipated future requirements. The Company maintains communication with its bank syndicate as it continues to monitor its cash requirements.
The Company had no borrowings under short-term bank credit lines at December 31, 2022.
The Company entered into an interest rate swap agreement (the "2017 Swap") with one bank, which converted the interest on the first $100.0 million of the Company's one-month LIBOR-based borrowings from a variable rate plus the borrowing spread to a fixed rate of 1.92% plus the borrowing spread. The 2017 Swap expired on January 31, 2022. On March 24, 2021, the Company entered into a new interest rate swap agreement (the "2021 Swap") with this same bank that commenced on January 31, 2022 and that converted the interest on the first $100.0 million of the Company's one-month LIBOR-based borrowings from a variable rate plus the borrowing spread to a fixed rate of 1.17% plus the borrowing spread. On April 6, 2022, the Company entered into Amendment No. 1 to the Amended Credit Agreement, which replaced the LIBOR interest rate for U.S. dollar loans with the SOFR rate (see Note 8). As a result, the Company subsequently amended the 2021 Swap (the "Amended 2021 Swap"), effective April 30, 2022, such that the one-month SOFR-based borrowing rate replaced the one-month LIBOR-based borrowing rate. The Amended 2021 Swap, which will expire on January 30, 2026, converts the interest on the first $100.0 million of the Company's one-month SOFR-based borrowings from a variable rate plus the borrowing spread to a fixed rate of 1.075% plus the borrowing spread. The execution of the Amended 2021 Swap did not result in a material impact on our business, financial condition, results of operations or cash flow. The Amended 2021 Swap remained in place at September 30, 2022 and these interest rate swap agreements are accounted for as cash flow hedges. The Amended 2021 Swap remained in place at December 31, 2022 and is accounted for as cash flow hedges. At December 31, 2022, the Company's total
31
borrowings were comprised of approximately 36% fixed rate debt and 64% variable rate debt. At December 31, 2021, the Company's total borrowings were comprised of approximately 34% fixed rate debt and 66% variable rate debt.
The funded status of the Company's pension plans is dependent upon many factors, including actual rates of return that impact the fair value of pension assets and changes in discount rates that impact projected benefit obligations. The unfunded status of the pension plans increased from $22.3 million at December 31, 2021 to $27.4 million at December 31, 2022 as a decrease in the fair value of the pension plan assets was only partially offset by the decrease in the projected benefit obligations ("PBOs"), following an update to certain actuarial assumptions. The Company recorded $3.7 million of non-cash after-tax increases in stockholders equity (through other non-owner changes to equity) when recording the current year adjustments for changes in the funded status of its pension and postretirement benefit plans as required under accounting for defined benefit and other postretirement plans. This increase in stockholders equity resulted from changes in actuarial assumptions, primarily an increase in discount rates and the amortization of actuarial losses and prior service cost recorded earlier, partially offset by unfavorable variances between expected and actual returns on pension plan assets.
In 2022, the Company made no discretionary contributions to its U.S Qualified pension plans. The Company expects to contribute approximately $9.7 million to its various defined benefit pension plans in 2023. No discretionary contributions to the U.S. Qualified pension plans are currently planned in 2023. See Note 12 of the Consolidated Financial Statements.
As noted above, the U.S. government enacted the Act on December 22, 2017. The Company completed its computation of the Transition Tax as required pursuant to SAB 118 in 2018, resulting in a final net Transition Tax expense of $86.7 million. The Company elected to pay the Transition Tax over the allowed eight-year period. The installment payments for the Transition Tax are not expected to have a material impact on the liquidity or capital resources of the Company. The Company expects to make the payments through the use of available cash or borrowings under the Amended Credit Agreement.
The Company completed the sale of the Seeger business to Kajo Neukirchen Group effective February 1, 2020. Gross proceeds received were 39.0 million Euros ($42.9 million) after consideration of post-closing adjustments, which were made during 2020, pursuant to the terms of the SPA. The Company yielded net cash proceeds of $36.1 million after consideration of cash sold and transaction costs. Resulting tax charges of $4.2 million were recognized in the first quarter of 2020 following the completion of the sale. The Company utilized the proceeds from the sale to reduce debt under the Amended Credit Agreement.
At December 31, 2022, the Company held $76.9 million in cash and cash equivalents, the majority of which was held by foreign subsidiaries. These amounts have no material regulatory or contractual restrictions and, on a long-term basis, are expected to primarily fund international investments. The Act changed the impact of U.S taxation on foreign distributions. The Company is continuously evaluating its position regarding the potential repatriation of overseas cash. The evaluation of potential repatriation is dependent upon several variables, including foreign taxation of dividends and the impact of withholding tax. The Company did not repatriate any overseas cash to the U.S. during 2022.
The Company’s efforts to comply with numerous federal, state and local laws and regulations applicable to its business and products often results in capital expenditures. The Company makes capital expenditures to design and upgrade its aerospace and industrial products to comply with or exceed standards applicable to the industries we serve. The Company’s ongoing HSE compliance program also results in capital expenditures. Regulatory and HSE considerations are a part of significant capital expenditure decisions; however, expenditures during 2022, related solely to regulatory compliance were not material.
Any future acquisitions are expected to be financed through cash, borrowings and equity, or a combination thereof. We may from time to time seek to retire or repurchase our outstanding debt through cash purchases and/or exchanges for equity securities, in open market purchases, under a Rule 10b5-1 trading plan, privately negotiated transactions or otherwise. Such repurchases or exchanges, if any, will depend on prevailing market conditions, our liquidity requirements, contractual restrictions and other factors.
32
Cash Flow
| ($ in millions) | 2022 | 2021 | $ Change | % Change | 2020 | |||||||||||||||||||||||||||
| Operating activities | $ | 75.6 | $ | 167.8 | $ | (92.2) | (55.0) | % | $ | 215.5 | ||||||||||||||||||||||
| Investing activities | (36.0) | (29.8) | (6.2) | 20.7 | % | (4.2) | ||||||||||||||||||||||||||
| Financing activities | (64.8) | (114.7) | 49.8 | (43.5) | % | (219.7) | ||||||||||||||||||||||||||
| Exchange rate effect | (5.5) | (2.9) | (2.6) | 91.0 | % | 6.1 | ||||||||||||||||||||||||||
| (Decrease) increase in cash, cash equivalents and restricted cash | $ | (30.8) | $ | 20.4 | $ | (51.2) | (250.6) | % | $ | (2.3) | ||||||||||||||||||||||
Operating activities provided $75.6 million in 2022 compared to $167.8 million in 2021. The 2022 period included a use of cash for working capital of $72.1 million, driven by growth in inventories, compared to a use of cash for working capital of $3.2 million in the 2021 period. Inventory levels increased during 2022 as a result of supply chain constraints and strategic builds to support customer demands, combined with the impact of inflation. Operating cash flows in the 2022 period were also negatively impacted by outflows for accrued liabilities, primarily related to incentive compensation.
Investing activities used $36.0 million in 2022 and $29.8 million in 2021. In 2022, investing activities included capital expenditures of $35.1 million compared to $34.1 million in 2021. The Company expects capital spending in 2023 to approximate $50 million. Capital expenditures relate to both maintenance and support of growth initiatives, which include the purchase of equipment to support new products and services, and are expected to be funded primarily through cash flows from operations.
Cash used by financing activities in 2022 included a net decrease in borrowings of $11.5 million compared to a net decrease of $67.4 million in 2021. Proceeds from the issuance of common stock were $0.5 million and $1.4 million in 2022 and 2021, respectively. In 2022, the Company repurchased 0.2 million shares of the Company's stock at a cost of $6.7 million compared with the purchase of 0.1 million shares at a cost of $5.2 million in 2021. Total cash used to pay dividends was $32.4 million in both the 2022 and 2021 periods. Withholding taxes paid on stock issuances were $1.1 million in the 2022 period and $1.4 million in the 2021 period. Other financing cash flows during 2022 and 2021 included $12.3 million and $0.8 million of net cash payments, respectively, resulting from the settlement of foreign currency hedges related to intercompany financing. Other financing cash flows in the 2022 period also included $1.0 million of payments made in conjunction with executing Amendment No. 1 to the Amended Credit Agreement whereas other financing cash flows in the 2021 period also included $4.3 million of payments made in conjunction with executing the Amended Credit Agreement and $4.2 million of payments related to the residual interest in a subsidiary.
Debt Covenants
As noted above, borrowing capacity is limited by various debt covenants in the Company's debt agreements. Following is a reconciliation of Consolidated EBITDA, a key metric in the debt covenants, to the Company's net income (in millions):
33
| 2022 | |||||
| Net income | $ | 13.5 | |||
| Add back: | |||||
| Interest expense | 14.6 | ||||
| Income taxes | 24.7 | ||||
| Depreciation and amortization | 93.3 | ||||
| Adjustment for non-cash stock based compensation | 12.7 | ||||
| Workforce reduction and restructuring charges | 15.0 | ||||
| Non-cash goodwill impairment charge | 68.2 | ||||
| Other adjustments | 0.7 | ||||
| Consolidated EBITDA, as defined within the Amended Credit Agreement | $ | 242.7 | |||
Consolidated Senior Debt, as defined, as of December 31, 2022 | $ | 571.1 | |||
| Ratio of Consolidated Senior Debt to Consolidated EBITDA | 2.35 | ||||
| Maximum | 3.25 | ||||
Consolidated Total Debt, as defined, as of December 31, 2022 | $ | 571.1 | |||
| Ratio of Consolidated Total Debt to Consolidated EBITDA | 2.35 | ||||
| Maximum | 3.75 | ||||
Consolidated Cash Interest Expense, as defined, as of December 31, 2022 | $ | 14.6 | |||
| Ratio of Consolidated EBITDA to Consolidated Cash Interest Expense | 16.59 | ||||
| Minimum | 4.25 | ||||
The Amended Credit Agreement allows for certain adjustments within the calculation of the financial covenants, including the non-cash impairment charge of $68.2 million. Other adjustments consist primarily of due diligence and transaction expenses and net gains on the sale of assets as permitted under the Amended Credit Agreement. The Company's financial covenants are measured as of the end of each fiscal quarter. At December 31, 2022, additional borrowings of $338.9 million of Total Debt including $217.5 million of Senior Debt would have been allowed under the covenants. Senior Debt includes primarily the borrowings under the Amended Credit Agreement, the 3.97% Senior Notes and the borrowings under the lines of credit. The Company's unused committed credit facilities at December 31, 2022 were $533.3 million; however, the borrowing capacity was limited by the debt covenants to $338.9 million of Total Debt and $217.5 million of Senior Debt at December 31, 2022.
Contractual Obligations and Commitments
At December 31, 2022, the Company had the following contractual obligations and commitments:
| ($ in millions) | Total | Less than 1 Year | 1-3 Years | 3-5 Years | More than 5 Years | |||||||||||||||||||||||||||
Long-term debt obligations (1) | $ | 571.1 | $ | 1.4 | $ | 102.7 | $ | 467.0 | $ | — | ||||||||||||||||||||||
Estimated interest payments under long-term obligations (2) | 61.5 | 21.2 | 38.3 | 2.0 | — | |||||||||||||||||||||||||||
Operating lease obligations (3) | 31.1 | 11.1 | 10.9 | 2.8 | 6.3 | |||||||||||||||||||||||||||
Purchase obligations (4) | 310.5 | 267.6 | 40.9 | 1.9 | 0.1 | |||||||||||||||||||||||||||
Expected pension contributions (5) | 9.7 | 9.7 | — | — | — | |||||||||||||||||||||||||||
Expected benefit payments – other postretirement benefit plans (6) | 19.5 | 2.6 | 4.6 | 4.0 | 8.2 | |||||||||||||||||||||||||||
Long-term U.S. Tax Reform obligations(7) | 39.1 | — | 39.1 | — | — | |||||||||||||||||||||||||||
| Total | $ | 1,042.5 | $ | 313.7 | $ | 236.6 | $ | 477.7 | $ | 14.6 | ||||||||||||||||||||||
(1)Long-term debt obligations represent the required principal payments under such agreements. As noted above, the Company entered into an Amended Credit Agreement on February 10, 2021, extending the maturity of the $1,000.0 million facility from February 2022 to February 2026.
(2)Interest payments under long-term debt obligations have been estimated based on the borrowings outstanding and market interest rates as of December 31, 2022. The Amended Credit Agreement extends the maturity of the facility and the timing of corresponding interest payments through February 2026.
34
(3)The Company’s operating lease payments included herein reflect the future minimum undiscounted fixed lease payments, which represent the basis for calculating the Company’s operating lease liabilities as of December 31, 2022. Refer to Note 19 of the Consolidated Financial Statements.
(4)The amounts do not include purchase obligations reflected as current liabilities on the consolidated balance sheet. The purchase obligation amount includes all outstanding purchase orders as of the balance sheet date as well as the minimum contractual obligation or termination penalty under other contracts.
(5)The amount included in “Less Than 1 Year” reflects anticipated contributions to the Company’s various pension plans. Anticipated contributions beyond one year are not determinable.
(6)Amounts reflect anticipated benefit payments under the Company’s other postretirement benefit plans based on current actuarial assumptions. Expected benefit payments, as presented above, do not extend beyond 2031. See Note 12 of the Consolidated Financial Statements.
(7)Amounts reflect anticipated long-term payments related to the Tax Cuts and Jobs Act that was enacted on December 22, 2017. Payments are allowed over an eight-year period. See Note 14 of the Consolidated Financial Statements. The amount payable in 2023 is included within accrued liabilities on the Consolidated Balance Sheets.
The above table does not reflect unrecognized tax benefits as the timing of the potential payments of these amounts cannot be determined. See Note 14 of the Consolidated Financial Statements.
OTHER MATTERS
Inflation
Inflation generally affects the Company through its costs of labor, equipment, raw materials, freight and utilities. The Company strives to offset these items by price increases, commodity price escalator provisions, operating improvements, and other cost-saving initiatives. In certain end markets, implementing price increases may be difficult and there is no assurance that the Company will be successful. From time to time, the Company may encounter difficulties in obtaining certain raw materials or components necessary for production due to supply chain constraints and logistical challenges, which may also negatively impact the pricing of materials and components sourced or used by the Company. Through 2022, for example, raw material availability and inflationary pressures have impacted certain of our business. See "Part I, Item 1A. Risk Factors.
Critical Accounting Estimates
The preparation of financial statements requires management to make estimates and assumptions that affect the reported amounts of assets and liabilities at the date of the financial statements and the reported amounts of revenues and expenses during the reporting period. Significant accounting policies are disclosed in Note 1 of the Consolidated Financial Statements. The most significant areas involving management judgments and estimates are described below. Actual results could differ from such estimates.
Inventory Valuation: Inventories are valued at the lower of cost, determined on a first-in, first-out basis, or net realizable value. The primary components of cost included in inventories are raw material, labor and overhead. Provisions are made to reduce excess or obsolete inventories to their estimated net realizable value. The process for evaluating the value of excess and obsolete inventory often requires the Company to make subjective judgments and estimates concerning future sales levels, quantities and prices at which such inventory will be sold in the normal course of business and estimated costs. Estimates of excess and obsolete inventory may differ from actual results due to changes in market value, channels of distribution, customer preferences and overall economic and market conditions. Accelerating the disposal process or changes in estimates based on future sales potential or estimated costs may necessitate future adjustments to these provisions.
Revenue recognition: Revenue is recognized by the Company when control of the product or solution is transferred to the customer. Control is generally transferred when products are shipped or delivered to customers, title is transferred, the significant risks and rewards of ownership have transferred, the Company has rights to payment and rewards of ownership pass to the customer. Customer acceptance may also be a factor in determining whether control of the product has transferred. Although revenue is generally transferred at a point in time, a certain portion of businesses with customized products or contracts in which the Company performs work on customer-owned assets requires the use of an over time recognition model as certain contracts meet one or more of the established criteria pursuant to the accounting standards governing revenue recognition. Also, service revenue is recognized as control transfers, which is concurrent with the services being performed. The estimation of both total revenue and cost at completion includes a number of variables and requires significant judgement. A portion of our Aerospace OEM business as well as a portion of our Molding Solutions Products business has an estimate at completion process in which management reviews the progress and execution of our performance obligations for significant contracts with revenue recognized under an over time model. Factors considered in these estimates include, but are not limited to, performance under the contract, progress towards completion, identified risks and opportunities, sourcing determinations and related changes in estimates of costs to be incurred. The potential exists that there will be a material change in estimates or assumptions used to calculate revenue recognized under an over time model and as a result changes to these estimates could have a material adverse effect on our results of operations. Adjustments to net sales, cost of sales and the related impact to
35
operating income are recognized as necessary. Revenue recognized from performance obligations satisfied in previous periods was not material in 2022, 2021 and 2020. See Note 3 of the Consolidated Financial Statements.
Business Acquisitions, Intangible Assets and Goodwill: Assets and liabilities acquired in a business combination are recorded under the acquisition method of accounting at their estimated fair values at the dates of acquisition. At December 31, 2022, the Company had $835.5 million and $230.7 million of goodwill and identifiable intangible assets related to acquisitions, respectively. Goodwill represents the cost of acquisitions in excess of fair values assigned to the underlying identifiable net assets of acquired businesses. Identifiable intangible assets acquired in business acquisitions include customer relationships, patents and technology and trademarks/trade names. The fair value of acquired customer relationship intangibles was determined as of the acquisition dates based on estimates and judgments regarding expectations for the future after-tax cash flows arising from customer relationships that existed on the acquisition date over their estimated lives, less a contributory assets charge, all of which is discounted to present value using an appropriate discount rate. The fair value of the patents and technology and trademark/trade name intangible assets were determined utilizing the relief from royalty method which is a form of the income approach. Under this method, an after-tax royalty rate based on market royalty rates is applied to projected revenue associated with the patents/technology and trademark/trade name and discounted to present value using an appropriate discount rate. See Note 6 of the Consolidated Financial Statements.
Goodwill and indefinite-lived intangible assets are subject to impairment testing annually or more frequently if an event or change in circumstances indicates that the fair value of a reporting unit has been reduced below its carrying value. Management completes its annual impairment assessments during the second quarter of each year as of April 1. The Company utilizes the option to first assess qualitative factors to determine whether it is necessary to perform the Step 1 quantitative goodwill impairment test in accordance with applicable accounting standards. Under the qualitative assessment, management considers relevant events and circumstances including but not limited to macroeconomic conditions, industry and market considerations, overall unit performance and events directly affecting a unit. If the Company determines that the Step 1 quantitative impairment test is required, management estimates the fair value of the reporting unit primarily using the income approach, which reflects management’s cash flow projections, and also evaluates the fair value using the market approach. Inherent in management’s development of cash flow projections are assumptions and estimates, including those related to future earnings, growth rates and the weighted average cost of capital. The Company compares the fair value of the reporting unit with the carrying value of the reporting unit. If the fair values were to fall below the carrying values, the Company would recognize a non-cash impairment charge to income from operations for the amount by which the carrying amount of any reporting unit exceeds the reporting unit’s fair value, assuming the loss recognized does not exceed the total amount of goodwill for the reporting unit.
The Company performed its annual assessment as of April 1, 2022. Based on this assessment, the estimated fair value of the Automation reporting unit, which represents the 2018 acquisition of Gimatic, exceeded its carrying value, while the estimated fair value of each of the remaining reporting units significantly exceeded their carrying values. The Company evaluated deteriorating macro-economic conditions subsequent to the date of the assessment, including inflationary pressures, rising interest rates, worsening global supply chain constraints and demand outlook, which materialized during the second quarter of 2022, which impacted performance and outlook at Automation and resulted in a triggering event. Management revised its cash flow projections and weighted average cost of capital, resulting in a non-cash goodwill impairment charge of $68.2 million related to the Automation reporting unit as the estimated fair value of the reporting unit declined below its carrying value. The goodwill impairment charge was recorded during the three-month period ended June 30, 2022.
The reduction in the estimated fair value of the Automation reporting unit resulted primarily from the following factors:
•An increase in the weighted-average cost of capital used to estimate the fair value of the reporting unit, resulting primarily from a higher risk-free interest rate.
•A decrease in near term projected revenue growth rates and EBITDA margins reflecting ongoing macroeconomic conditions. Management revised downward its outlook for net sales, margins and adjusted cash flow forecasts to reflect deferred growth projections. Changes in projections were driven by deteriorating economic conditions, including inflationary pressures and continued global supply chain constraints, including semiconductor shortages on near-term automotive and broader industrial production, unfavorable productivity and geopolitical factors. Management considered recessionary pressures and corresponding uncertainties on the business as it relates to automotive end markets. While we expect growth in automation markets to continue to be strong in the long term, our growth rates are tempered in the near term by the automotive markets.
36
•A change in the tax amortization period of the Automation goodwill that was made by the Italian government, for tax purposes, from 18 years to 50 years. Italian tax authorities granted the business an opportunity to step up the basis of goodwill and intangibles to its fair market value in 2021, following the release of tax guidance related to the application of tax basis realignment rules for intangible property (“Realignment”). See further discussion related to the Realignment within Management's Discussion and Analysis of Financial Condition and Results of Operations (Item 7).
Many of the factors used in estimating fair value are outside the control of management, and these assumptions and estimates can change in future periods as a result of both Company-specific and overall economic conditions, including the impacts of inflationary pressures, increased interest rates and global supply chain constraints, amongst others. Estimating the fair value of individual reporting units also requires that management make continued assumptions and estimates regarding future plans and strategies, in addition to the consideration of economic, geopolitical and regulatory conditions. Management’s quantitative assessment includes a review of the potential impacts of current and projected market conditions from a market participant’s perspective on reporting units’ projected cash flows, growth rates and cost of capital to assess the likelihood of whether the fair value would be less than the carrying value. Following the June 2022 goodwill impairment, there is no excess of reporting unit fair value over the carrying amount, as the carrying value was reduced to fair value.
Based on our second quarter impairment assessments and as noted above, the estimated fair value for each of the remaining reporting units significantly exceeded their carrying values, and there was no impairment at any other reporting units in 2022. The Company assesses the impairment of the identifiable finite-lived intangible assets subject to amortization whenever significant events or significant changes in circumstances indicate that their carrying value may not be recoverable. The Company did not identify any impairments related to such intangible assets during 2022.
The Company has continued to evaluate the macro-economic conditions, as described above, throughout the second half of 2022. Management evaluated the significant increase in interest rates and further deteriorating macro-economic conditions that materialized during the fourth quarter of 2022, again resulting in a triggering event at Automation. Management performed a Step 1 quantitative assessment as of December 31, 2022 and concluded that there was no additional goodwill impairment at the business. In the event there are future adverse changes in our estimated future cash flows and/or changes in key assumptions, including but not limited to discount rates, revenue growth or margins, and/or terminal growth rates, we may be required to record additional non-cash impairment charges to Automation goodwill. At December 31, 2022, the goodwill related to the Automation reporting unit was 179.7 million Euros ($191.8 million).
Aerospace Aftermarket Programs: The Company participates in aftermarket RSPs under which the Company receives an exclusive right to manufacture and supply designated aftermarket parts over the life of the related aircraft engine program to our customer, GE. As consideration, the Company has paid participation fees, which are recorded as intangible assets. The carrying value of these intangible assets was $135.3 million at December 31, 2022. The Company records amortization of the related asset as sales dollars are being earned based on a proportional sales dollar method. Specifically, this method amortizes each asset as a reduction to revenue based on the proportion of sales under a program in a given period to the estimated aggregate sales dollars over the life of that program which reflects the pattern in which economic benefits are realized.
The Company also participates in CRPs with GE which provide for, among other items, the right to sell certain aftermarket component repair services for CFM56, CF6, CF34 and LM engines directly to other customers over the life of the engine program as one of a few GE licensed suppliers. In addition, the CRPs extended certain existing contracts under which the Company provides these services directly to GE. Our total investments in CRPs as of December 31, 2022 equaled $111.8 million, all of which have been paid. At December 31, 2022, the carrying value of the CRPs was $70.0 million. The Company recorded the CRP payments as an intangible asset which is recognized as a reduction of sales over the remaining life of these engine programs based on the estimated sales over the life of such programs. This method reflects the pattern in which the economic benefits of the CRPs are realized.
The recoverability of each asset is subject to significant estimates about future revenues related to the programs' aftermarket parts and services. The Company evaluates these intangible assets for recoverability and updates amortization rates on an agreement by agreement basis for the RSPs and on an individual asset basis for the CRPs. The assets are reviewed for recoverability periodically including whenever events or changes in circumstances indicate that their carrying amount may not be recoverable. Annually, the Company evaluates the remaining life of these assets to determine whether events and circumstances warrant a revision to the remaining periods of amortization. Management updates revenue projections, which include a comparison of actual experience against projected revenue and industry projections. The potential exists that actual revenues will not meet expectations due to a change in market conditions, including, for example, the replacement of older engines with new, more fuel-efficient engines or the Company's ability to capture additional production share within the aftermarket business. A shortfall in future revenues may indicate a triggering event requiring a write down or further evaluation
37
of the recoverability of the assets or require the Company to accelerate amortization expense prospectively dependent on the level of the shortfall. The Company has not identified any impairment of these assets, although changes in projected RSP and CRP revenue has impacted amortization rates that will be applied prospectively. See Note 6 of the Consolidated Financial Statements.
Pension and Other Postretirement Benefits: Accounting policies and significant assumptions related to pension and other postretirement benefits are disclosed in Note 12 of the Consolidated Financial Statements. As discussed further below, the significant assumptions that impact pension and other postretirement benefits include discount rates, mortality rates and expected long-term rates of return on invested pension assets.
The Company selected the expected long-term rate of return of its U.S. defined benefit plans based on consideration of historical and projected rates of return on the weighted target asset mix of our pension investments. The target mix reflects a 65% equity investment target and a 35% target for fixed income and cash investments (in aggregate). The equity investment of 65% is more heavily weighted on global equity investment targets, rather than U.S. targets. The historical rates of return for the Company's defined benefit plans were calculated based upon compounded average rates of return of published indices. Management selected a long-term expected rate of return on its U.S. pension assets of 7.75%. The long-term rates of return for non-U.S. plans were selected based on actual historical rates of return of published indices that reflect the plans’ target asset allocations.
The discount rate used for the Company’s U.S. pension plans reflects the rate at which the pension benefits could be effectively settled. At December 31, 2022, the Company selected a discount rate of 5.50% based on a bond matching model for its U.S. pension plans. Market interest rates have increased in 2022 as compared with 2021 and, as a result, the discount rate used to measure pension liabilities increased from 2.95% at December 31, 2021. The discount rates for non-U.S. plans were selected based on highly rated long-term bond indices and yield curves that match the duration of the plan’s benefit obligations.
A one-quarter percentage point change in the assumed long-term rate of return on the Company’s U.S. pension plans as of December 31, 2022 would impact the Company’s 2023 pre-tax income by approximately $0.9 million. A one-quarter percentage point decrease in the discount rate on the Company's U.S. pension plans as of December 31, 2022 would also decrease the Company’s 2023 pre-tax income by approximately $1.1 million. The Company reviews these and other assumptions at least annually.
The Company recorded $3.7 million of non-cash after-tax increases in stockholders equity (through other non-owner changes to equity) when recording the current year adjustments for changes in the funded status of its pension and postretirement benefit plans as required under accounting for defined benefit and other postretirement plans. This increase in stockholders equity resulted primarily from changes in actuarial assumptions, primarily an increase in discount rate, the amortization of actuarial losses and prior service costs recorded earlier (including curtailment charges resulting from actions taken during 2022), partially offset by unfavorable variances between expected and actual returns on pension plan assets.
During 2022, the fair value of the Company’s pension plan assets decreased by $135.0 million and the projected benefit obligation decreased by $129.9 million. The decrease in the projected benefit obligation included payments of benefits to plan participants of $27.5 million, a $118.3 million (pre-tax) decrease due to actuarial gains resulting primarily from a change in the discount rates used to measure pension liabilities partially offset by annual service and interest costs of $5.7 million and $14.1 million, respectively. Changes to other actuarial assumptions in 2022 did not have a material impact on our stockholders equity or projected benefit obligation. Actual pre-tax losses on total pension plan assets were $105.8 million compared with an expected pre-tax return on pension assets of $28.9 million. Pension expense for 2023 is expected to decrease from $4.0 million in 2022, excluding curtailment losses of $1.2 million, settlement gains of $0.6 million and special termination benefits of $0.4 million, to pension income of $4.5 million, also excluding the impacts of any potential curtailments or settlements.
Income Taxes: As of December 31, 2022, the Company had recognized $18.0 million of deferred tax assets, net of valuation reserves. The realization of these benefits is dependent, in part, on the amount and timing of future taxable income in jurisdictions where the deferred tax assets reside. For those jurisdictions where the expiration dates of tax loss carryforwards or the proposed operating results indicate that realization is unlikely, a valuation allowance is provided. Management currently believes that sufficient taxable income should be earned in the future to realize the deferred tax assets, net of valuation allowances recorded.
The valuation of deferred tax assets requires significant judgment. Management’s assessment that the deferred tax assets will be realized represents its estimate of future results; however, there can be no assurance that such expectations will be met. Changes in management’s assessment of achieving sufficient future taxable income could materially increase the Company’s tax expense and could have a material adverse impact on the Company’s financial condition and the results of operations.
38
Additionally, the Company is exposed to certain tax contingencies in the ordinary course of business and records those tax liabilities in accordance with the guidance for accounting for uncertain tax positions. For tax positions where the Company believes it is more likely than not that a tax benefit will be sustained, the Company has recorded the largest amount of tax benefit with a greater than 50% likelihood of being realized. For those income tax positions where it is more likely than not that a tax benefit will not be sustained, no tax benefit is recognized in the financial statements. A change in judgement that results in subsequent recognition, derecognition or change in measurement of a tax position taken in a earlier period will be recognized in the period that the change occurred. We do not anticipate a significant change in our unrecognized tax benefits within the next twelve months. The Company or its subsidiaries file income tax returns in the U.S. federal jurisdiction, and various state and foreign jurisdictions. With a few exceptions, tax years remaining open to examination in significant foreign jurisdictions include tax years 2018 and forward and for the U.S. include tax years 2016 and forward. See Note 14 of the Consolidated Financial Statements. A one percentage point increase/decrease in our tax rate would have affected our 2022 earnings by $0.4 million. Changes in judgement related to tax positions taken in previous periods was not material in 2022, 2021 and 2020.
As noted above, a significant portion of revenue is generated by foreign locations. Current guidance requires the recognition of a tax liability under the assumption that foreign earnings will be repatriated in the future, unless the Company can assert that the earnings are indefinitely reinvested. Management’s annual assessment in determining whether the earnings are indefinitely reinvested is based on an analysis of U.S. cash requirements and working capital requirements of the foreign operations, including capital expenditures, combined with any limitations, such as dividend restrictions or local law limits, which would limit possible repatriation. All remaining earnings are considered indefinitely reinvested as defined per the indefinite reversal criterion within the accounting guidance for income taxes.
Stock-Based Compensation: The Company accounts for its stock-based employee compensation plans at fair value on the grant date and recognizes the related cost in its consolidated statement of income in accordance with accounting standards related to share-based payments. The fair values of stock options granted under the 2014 Barnes Group Stock and Incentive Award Plan ("2014 Plan") is estimated using the Black-Scholes option-pricing model based on certain assumptions. Compensation expense may be adjusted in future periods based on the achievement of the requisite service condition. The fair values of service and performance-based share awards granted under the 2014 Plan are determined based on the fair market value of the Company’s stock price on the grant date. Compensation expense is based on fair value and is recorded each period based up on a probability assessment of achieving performance goals. The fair value of market-based performance share awards under the 2014 Plan is estimated on the grant date using the Monte Carlo valuation method. The fair value of the performance-vested stock options granted in July 2022 under the CEO's Stock Option Award was also estimated using the Monte Carlo valuation method on the grant date. Compensation expense for awards valued using the Monte Carlo valuation method is fixed at the date of grant and will not be adjusted in future periods. See Note 13 of the Consolidated Financial Statements.
EBITDA
Earnings before interest expense, income taxes, depreciation and amortization and the goodwill impairment charge in 2022 (“EBITDA”) was $213.2 million for 2022 compared to $235.1 million for 2021. EBITDA is a measurement not in accordance with generally accepted accounting principles (“GAAP”). The Company defines EBITDA as net income plus interest expense, income taxes, and depreciation and amortization which the Company incurs in the normal course of business; in addition to these adjustments, the Company also excluded the impact of the goodwill impairment charge. The Company does not intend EBITDA to represent cash flows from operations as defined by GAAP, and the reader should not consider it as an alternative to net income, net cash provided by operating activities or any other items calculated in accordance with GAAP, or as an indicator of the Company’s operating performance. The Company’s definition of EBITDA may not be comparable with EBITDA as defined by other companies. The Company believes EBITDA is commonly used by financial analysts and others in the industries in which the Company operates and, thus, provides useful information to investors. Accordingly, the calculation has limitations depending on its use.
39
Following is a reconciliation of EBITDA to the Company’s net income (in millions):
| 2022 | 2021 | |||||||||||||
| Net income | $ | 13.5 | $ | 99.9 | ||||||||||
| Add back: | ||||||||||||||
| Interest expense | 14.6 | 16.2 | ||||||||||||
| Income taxes | 24.7 | 27.9 | ||||||||||||
| Depreciation and amortization | 92.2 | 91.1 | ||||||||||||
| Non-cash goodwill impairment charge | 68.2 | — | ||||||||||||
| EBITDA | $ | 213.2 | $ | 235.1 | ||||||||||
40
Item 7A. Quantitative and Qualitative Disclosures About Market Risk
Market risk is the potential economic loss that may result from adverse changes in the fair value of financial instruments. The Company’s financial results could be impacted by changes in interest rates and foreign currency exchange rates, and commodity price changes. The Company uses financial instruments to hedge its exposure to fluctuations in interest rates and foreign currency exchange rates. The Company does not use derivatives for speculative or trading purposes.
The Company’s long-term debt portfolio consists of fixed-rate and variable-rate instruments and is managed to reduce the overall cost of borrowing while also minimizing the effect of changes in interest rates on near-term earnings. The Company’s primary interest rate risk is derived from its outstanding variable-rate debt obligations. Financial instruments have been used by the Company to hedge its exposures to fluctuations in interest rates.
In April 2017, the Company entered into an interest rate swap agreement (the "2017 Swap") transacted with one bank which converted the interest on the first $100.0 million of borrowings from a variable rate plus the borrowing spread to a fixed rate of 1.92% plus the borrowing spread. The 2017 Swap expired on January 31, 2022. On March 24, 2021, the Company entered into a new interest rate swap agreement (the "2021 Swap") with this same bank that commenced on January 31, 2022 and converted the interest on the first $100.0 million of the Company's one-month LIBOR-based borrowings from a variable rate plus the borrowing spread to a fixed rate of 1.17% plus the borrowing spread. On April 6, 2022, the Company entered into Amendment No. 1 to the Amended Credit Agreement, which replaced the LIBOR interest rate for U.S. dollar loans with the SOFR rate (see Note 8). As a result, in May 2022 the Company subsequently amended the 2021 Swap (the "Amended 2021 Swap"), effective April 30, 2022, such that the one-month SOFR-based borrowing rate replaced the one-month LIBOR-based borrowing rate. The 2021 Amended Swap will expire on January 30, 2026. The result of a hypothetical 100 basis point increase in the interest rate on the average bank borrowings of the Company’s variable-rate debt during 2022 would have reduced annual pretax profit by $3.7 million.
At December 31, 2022, the fair value of the Company’s fixed-rate debt was $101.0 million, compared with its carrying amount of $104.4 million. The Company estimates that a 100 basis point decrease in market interest rates at December 31, 2022 would have increased the fair value of the Company's fixed rate debt to $102.7 million.
The Company has manufacturing, sales and distribution facilities around the world and thus makes investments and conducts business transactions denominated in various currencies. The Company is exposed primarily to financial instruments denominated in currencies other than the functional currency at its international locations. A 10% adverse change in foreign currencies relative to the U.S dollar at December 31, 2022 would have resulted in a $1.4 million loss in the fair value of those financial instruments. At December 31, 2022, the Company held $76.9 million of cash and cash equivalents, the majority of which is held by foreign subsidiaries.
Foreign currency commitments and transaction exposures are managed at the operating units as an integral part of their businesses in accordance with a corporate policy that addresses acceptable levels of foreign currency exposures.
Additionally, to reduce foreign currency exposure, management generally maintains the majority of foreign cash and short-term investments in functional currency and uses forward currency contracts for non-functional currency denominated monetary assets and liabilities and anticipated transactions in an effort to reduce the effect of the volatility of changes in foreign exchange rates on the income statement. Management assesses the strength of currencies in certain countries such as Brazil and Mexico, relative to the U.S. dollar, and may elect during periods of local currency weakness to invest excess cash in U.S. dollar-denominated instruments.
The Company’s exposure to commodity price changes relates to certain manufacturing operations that utilize high-grade steel spring wire, stainless steel, titanium, Inconel, Hastelloys and other specialty metals. The Company attempts to manage its exposure to price increases through its procurement and sales practices. See “Part I - Item 1A - Risk Factors” for additional disclosure related to this market risk.
The results of the Company could be impacted by changes in tariffs, trade agreements or other trade restrictions imposed or agreed to by the U.S. or foreign governments.
41
Item 8. Financial Statements and Supplementary Data
BARNES GROUP INC.
CONSOLIDATED STATEMENTS OF INCOME
(Dollars in thousands, except per share data)
| Years Ended December 31, | ||||||||||||||||||||
| 2022 | 2021 | 2020 | ||||||||||||||||||
| Net sales | $ | 1,261,868 | $ | 1,258,846 | $ | 1,124,391 | ||||||||||||||
| Cost of sales | 839,996 | 803,850 | 721,238 | |||||||||||||||||
| Selling and administrative expenses | 296,559 | 304,978 | 279,783 | |||||||||||||||||
| Goodwill impairment charge | 68,194 | — | — | |||||||||||||||||
| 1,204,749 | 1,108,828 | 1,001,021 | ||||||||||||||||||
| Operating income | 57,119 | 150,018 | 123,370 | |||||||||||||||||
| Interest expense | 14,624 | 16,209 | 15,944 | |||||||||||||||||
| Other expense (income), net | 4,310 | 5,992 | 5,931 | |||||||||||||||||
| Income before income taxes | 38,185 | 127,817 | 101,495 | |||||||||||||||||
| Income taxes | 24,706 | 27,944 | 38,120 | |||||||||||||||||
| Net income | $ | 13,479 | $ | 99,873 | $ | 63,375 | ||||||||||||||
| Per common share: | ||||||||||||||||||||
| Basic | $ | 0.26 | $ | 1.96 | $ | 1.25 | ||||||||||||||
| Diluted | $ | 0.26 | $ | 1.96 | $ | 1.24 | ||||||||||||||
| Weighted average common shares outstanding: | ||||||||||||||||||||
| Basic | 50,962,447 | 50,926,374 | 50,880,846 | |||||||||||||||||
| Diluted | 51,084,167 | 51,079,063 | 51,097,586 | |||||||||||||||||
See accompanying notes.
42
BARNES GROUP INC.
CONSOLIDATED STATEMENTS OF COMPREHENSIVE (LOSS) INCOME
(Dollars in thousands)
| Years Ended December 31, | |||||||||||||||||
| 2022 | 2021 | 2020 | |||||||||||||||
| Net income | $ | 13,479 | $ | 99,873 | $ | 63,375 | |||||||||||
| Other comprehensive (loss) income, net of tax | |||||||||||||||||
Unrealized gain (loss) hedging activities, net of tax (1) | 5,781 | 917 | (642) | ||||||||||||||
Foreign currency translation adjustments, net of tax (2) | (78,110) | (60,252) | 86,894 | ||||||||||||||
Defined benefit pension and other postretirement benefits, net of tax (3) | 3,667 | 29,812 | 1,928 | ||||||||||||||
| Total other comprehensive (loss) income, net of tax | (68,662) | (29,523) | 88,180 | ||||||||||||||
| Total comprehensive (loss) income | $ | (55,183) | $ | 70,350 | $ | 151,555 | |||||||||||
(1) Net of tax of $1,825, $334 and $(230) for the years ended December 31, 2022, 2021 and 2020, respectively.
(2) Net of tax of $0, $0 and $(66) for the years ended December 31, 2022, 2021 and 2020, respectively.
(3) Net of tax of $(489), $8,916 and $401 for the years ended December 31, 2022, 2021 and 2020, respectively.
See accompanying notes.
43
BARNES GROUP INC.
CONSOLIDATED BALANCE SHEETS
(Dollars in thousands)
| December 31, | ||||||||||||||
| 2022 | 2021 | |||||||||||||
| Assets | ||||||||||||||
| Current assets | ||||||||||||||
| Cash and cash equivalents | $ | 76,858 | $ | 102,860 | ||||||||||
Accounts receivable, less allowances (2022 – $5,222; 2021 – $5,625) | 291,883 | 262,257 | ||||||||||||
| Inventories | 283,402 | 239,655 | ||||||||||||
| Prepaid expenses and other current assets | 80,161 | 75,437 | ||||||||||||
| Total current assets | 732,304 | 680,209 | ||||||||||||
| Deferred income taxes | 18,028 | 21,976 | ||||||||||||
| Property, plant and equipment, net | 320,139 | 341,462 | ||||||||||||
| Goodwill | 835,472 | 955,370 | ||||||||||||
| Other intangible assets, net | 442,492 | 500,246 | ||||||||||||
| Other assets | 65,295 | 77,557 | ||||||||||||
| Total assets | $ | 2,413,730 | $ | 2,576,820 | ||||||||||
| Liabilities and Stockholders’ Equity | ||||||||||||||
| Current liabilities | ||||||||||||||
| Notes and overdrafts payable | $ | 8 | $ | 1,900 | ||||||||||
| Accounts payable | 145,060 | 131,076 | ||||||||||||
| Accrued liabilities | 158,568 | 175,583 | ||||||||||||
| Long-term debt – current | 1,437 | 1,835 | ||||||||||||
| Total current liabilities | 305,073 | 310,394 | ||||||||||||
| Long-term debt | 569,639 | 599,932 | ||||||||||||
| Accrued retirement benefits | 54,352 | 76,784 | ||||||||||||
| Deferred income taxes | 62,562 | 66,704 | ||||||||||||
| Long-term tax liability | 39,086 | 52,114 | ||||||||||||
| Other liabilities | 36,691 | 42,126 | ||||||||||||
Commitments and contingencies (Note 22) | ||||||||||||||
| Stockholders’ equity | ||||||||||||||
Common stock – par value $0.01 per share | ||||||||||||||
Authorized: 150,000,000 shares | ||||||||||||||
Issued: at par value (2022 – 64,481,493 shares; 2021 – 64,343,582 shares) | 645 | 643 | ||||||||||||
| Additional paid-in capital | 529,791 | 516,562 | ||||||||||||
Treasury stock, at cost (2022 – 13,890,802 shares; 2021 – 13,658,483 shares) | (531,507) | (523,642) | ||||||||||||
| Retained earnings | 1,567,898 | 1,587,041 | ||||||||||||
| Accumulated other non-owner changes to equity | (220,500) | (151,838) | ||||||||||||
| Total stockholders’ equity | 1,346,327 | 1,428,766 | ||||||||||||
| Total liabilities and stockholders’ equity | $ | 2,413,730 | $ | 2,576,820 | ||||||||||
See accompanying notes.
44
BARNES GROUP INC.
CONSOLIDATED STATEMENTS OF CASH FLOWS
(Dollars in thousands)
| Years Ended December 31, | ||||||||||||||||||||
| 2022 | 2021 | 2020 | ||||||||||||||||||
| Operating activities: | ||||||||||||||||||||
| Net income | $ | 13,479 | $ | 99,873 | $ | 63,375 | ||||||||||||||
| Adjustments to reconcile net income to net cash provided by operating activities: | ||||||||||||||||||||
| Depreciation and amortization | 92,150 | 91,085 | 87,656 | |||||||||||||||||
| Gain on disposition of property, plant and equipment | (821) | (1,027) | (94) | |||||||||||||||||
| Stock compensation expense | 12,804 | 11,470 | 10,300 | |||||||||||||||||
| Seeger divestiture charges | — | — | 6,677 | |||||||||||||||||
| Non-cash goodwill impairment charge | 68,194 | — | — | |||||||||||||||||
| Changes in assets and liabilities, net of the effects of divestitures: | ||||||||||||||||||||
| Accounts receivable | (39,484) | (18,793) | 107,381 | |||||||||||||||||
| Inventories | (48,591) | (7,350) | 2,147 | |||||||||||||||||
| Prepaid expenses and other current assets | (9,257) | (5,208) | (5,721) | |||||||||||||||||
| Accounts payable | 15,998 | 22,909 | (9,968) | |||||||||||||||||
| Accrued liabilities | (25,659) | (1,630) | (37,430) | |||||||||||||||||
| Deferred income taxes | 2,645 | (19,354) | (5,867) | |||||||||||||||||
| Long-term retirement benefits | (1,474) | 3,423 | (1,418) | |||||||||||||||||
| Long-term tax liability | (6,948) | (6,949) | (6,949) | |||||||||||||||||
| Other | 2,523 | (643) | 5,373 | |||||||||||||||||
| Net cash provided by operating activities | 75,559 | 167,806 | 215,462 | |||||||||||||||||
| Investing activities: | ||||||||||||||||||||
| Proceeds from disposition of property, plant and equipment | 1,825 | 3,007 | 449 | |||||||||||||||||
| Proceeds from the sale of businesses, net of cash sold | — | — | 36,062 | |||||||||||||||||
| Capital expenditures | (35,082) | (34,117) | (40,698) | |||||||||||||||||
| Other | (2,729) | 1,304 | — | |||||||||||||||||
| Net cash used in investing activities | (35,986) | (29,806) | (4,187) | |||||||||||||||||
| Financing activities: | ||||||||||||||||||||
| Net change in other borrowings | (1,333) | (173) | (5,855) | |||||||||||||||||
| Payments on long-term debt | (108,415) | (115,507) | (266,424) | |||||||||||||||||
| Proceeds from the issuance of long-term debt | 98,285 | 48,300 | 98,107 | |||||||||||||||||
| Proceeds from the issuance of common stock | 513 | 1,427 | 1,989 | |||||||||||||||||
| Common stock repurchases | (6,721) | (5,229) | (15,550) | |||||||||||||||||
| Dividends paid | (32,376) | (32,402) | (32,402) | |||||||||||||||||
| Withholding taxes paid on stock issuances | (1,144) | (1,421) | (3,368) | |||||||||||||||||
| Other | (13,638) | (9,661) | 3,837 | |||||||||||||||||
| Net cash used provided by financing activities | (64,829) | (114,666) | (219,666) | |||||||||||||||||
| Effect of exchange rate changes on cash flows | (5,525) | (2,893) | 6,054 | |||||||||||||||||
| (Decrease) increase in cash, cash equivalents and restricted cash | (30,781) | 20,441 | (2,337) | |||||||||||||||||
| Cash, cash equivalents and restricted cash at beginning of year | 111,909 | 91,468 | 93,805 | |||||||||||||||||
| Cash, cash equivalents and restricted cash at end of year | 81,128 | 111,909 | 91,468 | |||||||||||||||||
| Less: Restricted cash, included in Prepaid expenses and other current assets | (2,135) | (4,524) | (4,944) | |||||||||||||||||
| Less: Restricted cash, included in Other assets | (2,135) | (4,525) | (7,379) | |||||||||||||||||
| Cash and cash equivalents at end of year | $ | 76,858 | $ | 102,860 | $ | 79,145 | ||||||||||||||
See accompanying notes.
45
BARNES GROUP INC.
CONSOLIDATED STATEMENTS OF CHANGES IN STOCKHOLDERS’ EQUITY
(Dollars and shares in thousands)
| Common Stock (Number of Shares) | Common Stock (Amount) | Additional Paid-In Capital | Treasury Stock (Number of Shares) | Treasury Stock | Retained Earnings | Accumulated Other Non-Owner Changes to Equity | Total Stockholders’ Equity | |||||||||||||||||||||||||||||||||||||||||||
January 1, 2020 | 63,873 | $ | 639 | $ | 489,282 | 13,051 | $ | (498,074) | $ | 1,489,176 | $ | (210,495) | $ | 1,270,528 | ||||||||||||||||||||||||||||||||||||
| Comprehensive income | — | — | — | — | — | 63,375 | 88,180 | 151,555 | ||||||||||||||||||||||||||||||||||||||||||
Dividends declared ($0.64 per share) | — | — | — | — | — | (32,402) | — | (32,402) | ||||||||||||||||||||||||||||||||||||||||||
| Common stock repurchases | — | — | — | 396 | (15,550) | — | — | (15,550) | ||||||||||||||||||||||||||||||||||||||||||
| Employee stock plans | 298 | 3 | 12,249 | 83 | (3,368) | (338) | — | 8,546 | ||||||||||||||||||||||||||||||||||||||||||
| December 31, 2020 | 64,171 | 642 | 501,531 | 13,530 | (516,992) | 1,519,811 | (122,315) | 1,382,677 | ||||||||||||||||||||||||||||||||||||||||||
| Comprehensive (loss) income | — | — | — | — | — | 99,873 | (29,523) | 70,350 | ||||||||||||||||||||||||||||||||||||||||||
Dividends declared ($0.64 per share) | — | — | — | — | — | (32,402) | — | (32,402) | ||||||||||||||||||||||||||||||||||||||||||
| Residual interest in subsidiary | — | — | 2,177 | — | — | — | — | 2,177 | ||||||||||||||||||||||||||||||||||||||||||
| Common stock repurchases | — | — | — | 100 | (5,229) | — | — | (5,229) | ||||||||||||||||||||||||||||||||||||||||||
| Employee stock plans | 173 | 1 | 12,854 | 28 | (1,421) | (241) | — | 11,193 | ||||||||||||||||||||||||||||||||||||||||||
| December 31, 2021 | 64,344 | 643 | 516,562 | 13,658 | (523,642) | 1,587,041 | (151,838) | 1,428,766 | ||||||||||||||||||||||||||||||||||||||||||
| Comprehensive income (loss) | — | — | — | — | — | 13,479 | (68,662) | (55,183) | ||||||||||||||||||||||||||||||||||||||||||
Dividends declared ($0.64 per share) | — | — | — | — | — | (32,376) | — | (32,376) | ||||||||||||||||||||||||||||||||||||||||||
| Common stock repurchases | — | — | — | 200 | (6,721) | — | — | (6,721) | ||||||||||||||||||||||||||||||||||||||||||
| Employee stock plans | 137 | 2 | 13,229 | 33 | (1,144) | (246) | — | 11,841 | ||||||||||||||||||||||||||||||||||||||||||
| December 31, 2022 | 64,481 | $ | 645 | $ | 529,791 | 13,891 | $ | (531,507) | $ | 1,567,898 | $ | (220,500) | $ | 1,346,327 | ||||||||||||||||||||||||||||||||||||
See accompanying notes.
46
BARNES GROUP INC.
NOTES TO CONSOLIDATED FINANCIAL STATEMENTS
(All dollar amounts included in the notes are stated in thousands except per share data
and the tables in Note 21)
1. Summary of Significant Accounting Policies
General: The preparation of consolidated financial statements requires management to make estimates and assumptions that affect the reported amounts of assets and liabilities at the date of the financial statements and the reported amounts of revenues and expenses during the reporting period. Actual results could differ from those estimates.
The COVID-19 pandemic ("COVID-19") has resulted in a disruption in business activities worldwide and has caused weakened economic conditions, both in the United States and abroad. COVID-19 has had, and may continue to have, a significant negative impact on the Company's ongoing operations and the end markets in which it serves. The Company has assessed the impacts on its accounting estimates, assumptions and disclosures.
Consolidation: The accompanying consolidated financial statements include the accounts of the Company and all of its subsidiaries. Intercompany transactions and account balances have been eliminated.
Revenue recognition: The Company accounts for revenue in accordance with Accounting Standard Codification 606, Revenue from Contracts with Customers. Revenue is recognized by the Company when control of the product or solution is transferred to the customer. Control is generally transferred when products are shipped or delivered to customers, title is transferred, the significant risks and rewards of ownership have transferred, the Company has rights to payment and rewards of ownership pass to the customer. Customer acceptance may also be a factor in determining whether control of the product or solution has transferred. Although revenue is generally transferred at a point in time, a certain portion of businesses with customized products or contracts in which the Company performs work on customer-owned assets requires the use of an over time recognition model as certain contracts meet one or more of the established criteria pursuant to the accounting standards governing revenue recognition. Also, service revenue is recognized as control transfers, which is concurrent with the services being performed. See Note 3. Management fees related to the Aerospace Aftermarket Revenue Sharing Programs ("RSPs") are satisfied through an agreed upon reduction from the sales price of each of the related spare parts. These fees recognize our customer's necessary performance of engine program support activities, such as spare parts administration, warehousing and inventory management, and customer support, and are not separable from our sale of products, and accordingly, they are reflected as a reduction to sales, rather than as costs incurred, when revenues are recognized.
Cash and cash equivalents: Cash in excess of operating requirements is generally invested in short-term, highly liquid, income-producing investments. All highly liquid investments purchased with an original maturity of three months or less are considered cash equivalents. Cash equivalents are carried at cost which approximates fair value.
Accounts receivable: The Company records accounts receivable at net realizable value. Balances are reviewed regularly and reserves are adjusted when events or circumstances indicate carrying values may not be recoverable. Effective January 1, 2020, the Company adopted the amended guidance related to credit losses on financial instruments. See "Recently Adopted Accounting Standards" below for additional discussion regarding the application of this amended guidance.
Inventories: Inventories are valued at the lower of cost, determined on a first-in, first-out basis, or net realizable value. The primary components of cost included in inventories are raw material, labor and overhead. Provisions are made to reduce excess or obsolete inventories to their estimated net realizable value. The process for evaluating the value of excess and obsolete inventory often requires the Company to make judgments and estimates concerning future sales levels, quantities and prices at which such inventory will be sold in the normal course of business and estimated costs. Accelerating the disposal process or changes in estimates based on future sales potential or estimated costs may necessitate future adjustments to these provisions.
Property, plant and equipment: Property, plant and equipment is recorded at cost. Depreciation is recorded using a straight-line method of depreciation over estimated useful lives, generally ranging from 20 to 50 years for buildings and to 12 years for machinery and equipment. The Company assesses the impairment of property, plant and equipment whenever events or changes in circumstances indicate the carrying value may not be recoverable.
47
Goodwill: Goodwill represents the excess purchase price over the fair value of net assets of companies acquired in business combinations. Goodwill is considered an indefinite-lived asset. Goodwill is subject to impairment testing in accordance with accounting standards governing such on an annual basis, in the second quarter, or more frequently if an event or change in circumstances indicates that the fair value of a reporting unit has been reduced below its carrying value. Based on our assessment as of April 1, the estimated fair value of the Automation reporting unit, which represents the 2018 acquisition of Gimatic, exceeded its carrying value, while the estimated fair value of each of the remaining reporting units significantly exceeded their carrying values. The Company evaluated deteriorating macro-economic conditions subsequent to the date of the assessment, including inflationary pressures, rising interest rates, worsening global supply chain constraints and demand outlook, which materialized during the second quarter of 2022, impacting performance and outlook at Automation and resulted in a triggering event. Management revised its cash flow projections and weighted average cost of capital, resulting in a non-cash goodwill impairment charge of $68,194 related to the Automation reporting unit as the estimated fair value of the reporting unit declined below its carrying value. Management evaluated the significant increase in interest rates and further deteriorating macro-economic conditions that materialized during the fourth quarter of 2022, again resulting in a triggering event at Automation. Management performed a Step 1 quantitative assessment as of December 31, 2022 and concluded that there was no additional goodwill impairment at the business. The goodwill impairment charge was recorded in the three month period ended June 30, 2022. See Note 6.
Leases: Contracts are evaluated at inception to determine whether they contain a lease. Operating lease right-of use assets and liabilities are recognized based on the present value of the future minimum lease payments over the lease term at the lease commencement date for operating leases with an initial term greater than 12 months. The Company recognizes lease expense for minimum lease payments on a straight line basis over the term of the lease. Certain leases provide the option to purchase the leased property and are therefore evaluated for finance lease consideration. The depreciable life of leased assets are limited by the expected term of the lease, unless there is a transfer of title or purchase option and the Company believes it is reasonably certain of exercise. The Company utilizes its incremental borrowing rate by lease term to calculate the present value of our future lease payments if an implicit rate is not specified. See Note 19.
Aerospace Aftermarket Programs: The Company participates in aftermarket RSPs under which the Company receives an exclusive right to manufacture and supply designated aftermarket parts over the life of the related aircraft engine program. As consideration, the Company has paid participation fees, which are recorded as long-lived intangible assets. The Company records amortization of the related intangible asset as sales dollars are being earned based on a proportional sales dollar method. Specifically, this method amortizes each asset as a reduction to revenue based on the proportion of sales under a program in a given period to the estimated aggregate sales dollars over the life of that program. This method reflects the pattern in which the economic benefits of the RSPs are realized.
The Company also entered into Component Repair Programs ("CRPs") that provide for, among other items, the right to sell certain aftermarket component repair services for CFM56, CF6, CF34 and LM engines directly to other customers as one of a few GE licensed suppliers. In addition, the CRPs extended certain existing contracts under which the Company currently provides these services directly to GE. The Company recorded the consideration paid for these rights as an intangible asset that is amortized as a reduction to sales over the remaining life of these engine programs based on the estimated sales over the life of such programs. This method reflects the pattern in which the economic benefits of the CRPs are realized.
The recoverability of each asset is subject to significant estimates about future revenues related to the program’s aftermarket parts and services. The Company evaluates these intangible assets for recoverability and updates amortization rates on an agreement by agreement basis for the RSPs and on an individual asset program basis for the CRPs. The assets are reviewed for recoverability periodically including whenever events or changes in circumstances indicate that their carrying amount may not be recoverable. At least annually, the Company evaluates the remaining useful life of these assets to determine whether events and circumstances warrant a revision to the remaining periods of amortization. Management updates revenue projections, which includes comparing actual experience against projected revenue and industry projections. The potential exists that actual revenues will not meet expectations due to a change in market conditions including, for example, the replacement of older engines with new, more fuel-efficient engines or the Company's ability to maintain market share within the Aftermarket business. A shortfall in future revenues may indicate a triggering event requiring a write down or further evaluation of the recoverability of the assets or require the Company to accelerate amortization expense prospectively dependent on the level of the shortfall. The Company has not identified any impairment of these assets, although changes in projected RSP and CRP revenue has impacted amortization rates that will be applied in remaining periods.
Other Intangible Assets: Other intangible assets consist primarily of the Aerospace Aftermarket programs, as discussed above, customer relationships, tradenames, patents and proprietary technology. These intangible assets, with the exception of
48
certain tradenames, have finite lives and are amortized over the periods in which they provide benefit. The Company assesses the impairment of long-lived assets, including identifiable intangible assets subject to amortization, whenever significant events or significant changes in circumstances indicate the carrying value may not be recoverable. Tradenames with indefinite lives are subject to impairment testing in accordance with accounting standards governing such on an annual basis, in the second quarter, or more frequently if an event or change in circumstances indicates that the fair value of the asset has been reduced below its carrying value. Based on the assessments performed during 2022, there were no impairments of other intangible assets. See Note 6.
Derivatives: Accounting standards related to the accounting for derivative instruments and hedging activities require that all derivative instruments be recorded on the balance sheet at fair value. Foreign currency contracts may qualify as fair value hedges of unrecognized firm commitments, cash flow hedges of recognized assets and liabilities or anticipated transactions, or a hedge of a net investment. Changes in the fair market value of derivatives that qualify as fair value hedges or cash flow hedges are recorded directly to earnings or accumulated other non-owner changes to equity, depending on the designation. Amounts recorded to accumulated other non-owner changes to equity are reclassified to earnings in a manner that matches the earnings impact of the hedged transaction. Any ineffective portion, or amounts related to contracts that are not designated as hedges, are recorded directly to earnings. The Company’s policy for classifying cash flows from derivatives is to report the cash flows consistent with the underlying hedged item. See Note 10.
Foreign currency: Assets and liabilities are translated at year-end rates of exchange; revenues and expenses are translated at average rates of exchange. The resulting translation gains or losses are reflected in accumulated other non-owner changes to equity within stockholders’ equity. Net foreign currency transaction losses of $540, $572 and $1,518 in 2022, 2021 and 2020, respectively, were recorded within other expense (income), net in the Consolidated Statements of Income.
Research and Development: Costs are incurred in connection with efforts aimed at discovering and implementing new knowledge that is critical to developing new products, processes or services, significantly improving existing products or services, and developing new applications for existing products and services. Research and development expenses for the creation of new and improved products, processes and services were $15,774, $22,928 and $16,949, for the years 2022, 2021 and 2020, respectively, and are included in selling and administrative expense.
Pension and Other Postretirement Benefits: The Company accounts for its defined benefit pension plans and other postretirement plans by recognizing the overfunded or underfunded status of the plans, calculated as the difference between plan assets and the projected benefit obligation related to each plan, as an asset or liability on the Consolidated Balance Sheets. Benefit costs associated with the plans primarily include current service costs, interest costs and the amortization of actuarial losses, partially offset by expected returns on plan assets, which are determined based upon actuarial valuations. Settlement and curtailment losses (gains) may also impact benefit costs. The Company regularly reviews actuarial assumptions, including discount rates and the expected return on plan assets, which are updated at the measurement date, December 31st. The impact of differences between actual results and the assumptions are generally accumulated within Other Comprehensive Income and amortized over future periods, which will affect benefit costs recognized in such periods. The Company bifurcates the components of net periodic benefit cost for pension and other postretirement plans. The service cost component of expense requires presentation with other employee compensation costs in operating income, whereas the other components of expense are reported separately outside of operating income. See Note 12.
Stock-Based Compensation: Stock-based employee compensation awards are accounted for based on their fair value on the grant date and the related cost is recognized in the Consolidated Statements of Income in accordance with accounting standards related to share-based payments. The fair values of stock options are estimated using the Black-Scholes option-pricing model based on certain assumptions. The fair values of service and performance based share awards are estimated based on the fair market value of the Company’s stock price on the grant date. The fair values of market based performance share awards and performance-vested stock options are estimated using the Monte Carlo valuation method. See Note 13.
Income Taxes: Deferred tax assets and liabilities are recognized for future tax effects attributable to temporary differences, operating loss carryforwards and tax credits. The measurement of deferred tax assets and liabilities is determined using tax rates from enacted tax law of the period in which the temporary differences, operating loss carryforwards and tax credits are expected to be realized. The effect of a change in income tax rates is recognized in the period of the enactment date. The guidance related to accounting for income taxes requires that deferred tax assets be reduced by a valuation allowance if, based on all available evidence, it is more likely than not that the deferred tax asset will not be realized. The Company is exposed to certain tax contingencies in the ordinary course of business and records those tax liabilities in accordance with the
49
guidance for accounting for uncertain tax positions. The Company has elected to account for tax on Global Intangible Low- Taxed Income (“GILTI”) as a period cost, when incurred. See Note 14.
Recent Accounting Standards
The Financial Accounting Standards Board ("FASB") establishes changes to accounting principles under U.S. GAAP through the use of Accounting Standards Updates ("ASUs") to the FASB's Accounting Standards Codification. The Company evaluates the applicability and potential impacts of recent ASUs on its Consolidated Financial Statements and related disclosures.
Recently Adopted Accounting Standards
In December 2019, the FASB amended its guidance related to income taxes. The amended guidance simplifies the accounting for income taxes, eliminating certain exceptions to the general income tax principles, in an effort to reduce the cost and complexity of application. The amended guidance is effective for annual periods beginning after December 15, 2020, and interim periods within those reporting periods. Early adoption is permitted in any interim or annual period. The guidance requires application on either a prospective, retrospective or modified retrospective basis, contingent on the income tax exception being applied. The Company has adopted this guidance, on a prospective basis, on January 1, 2021 and it did not have a material impact on the Company's Consolidated Financial Statements.
Recently Issued Accounting Standards
The United Kingdom's Financial Conduct Authority, which regulates the London Interbank Offered Rate (“LIBOR”), announced its intent to phase out the use of LIBOR by December 31, 2021. The U.S. Federal Reserve, in conjunction with the Alternative Reference Rates Committee, a steering committee comprised of large U.S. financial institutions, identified the Secured Overnight Financing Rate (“SOFR”) as its preferred benchmark alternative to U.S. dollar LIBOR. Published by the Federal Reserve Bank of New York, SOFR represents a measure of the cost of borrowing cash overnight, collateralized by U.S. Treasury securities, and is calculated based on directly observable U.S. Treasury-backed repurchase transactions. In March 2020, in response to this transition, the FASB issued guidance related to this rate reform, which provides optional expedients and exceptions for applying U.S. GAAP to contracts, hedging relationships and other transactions that reference LIBOR or another reference rate expected to be discontinued by reference rate reform, and addresses operational issues likely to arise in modifying contracts to replace discontinued reference rates with new rates. In January 2021, the FASB issued further clarifying guidance regarding derivatives, as it relates to this transition. In December 2022, the FASB extended the expiration of the guidance through December 31, 2024. The Company’s Amended Credit Agreement (Note 8) and corresponding interest rate Swaps (Note 9) each mature in February 2026. In March 2021, the Intercontinental Exchange Benchmark Association announced that it will extend the publication of overnight, 1, 3, 6 and 12 month LIBOR rates until June 30, 2023, while ceasing publication of all other LIBOR rates including 1 week and 2 month rates. The Company's Amended Credit Agreement was further amended in October 2021 and in April 2022 to address the replacement of LIBOR via the LIBOR Transition Agreement and Amendment No. 1, respectively (see Note 8), with SOFR. The Company's corresponding interest rate Swaps were amended in May 2022 to address the replacement of LIBOR. As a result of the Company's contract amendments to address the replacement of LIBOR, the Company does not anticipate a material impact on our business, financial condition, results of operations or cash flow as a result of this change.
In October 2021, the FASB amended its guidance related to business combinations. The amended guidance requires entities to recognize and measure contract assets and contract liabilities acquired in business combinations on the acquisition date in accordance with Accounting Standards Codification 606, Revenue from Contracts with Customers. The new guidance is effective on a prospective basis for fiscal years, and interim periods within those fiscal years, beginning after December 15, 2022, with early adoption permitted. The Company is currently evaluating the amended guidance as the guidance will be applicable to future acquisitions.
In September 2022, the FASB amended its guidance related to supplier finance programs. The amended guidance requires additional disclosures surrounding the use of supplier finance programs to purchase goods or services including disclosing the key terms of the programs, the amount of obligations outstanding at the end of the reporting period, and a roll-forward of those obligations. The new guidance, except the amendment on roll-forward information, is effective for fiscal years beginning after December 15, 2022, including interim periods within those fiscal years. The amendment on roll-forward information is
50
effective for fiscal years beginning after December 15, 2023. Early adoption is permitted. The Company does not anticipate that this guidance will have a material impact on its Consolidated Financial Statements.
2. Divestiture
On February 1, 2020, the Company completed the sale of the Seeger business, consisting of partnership interests and shares, respectively, of Seeger-Orbis GmbH & Co. OHG and Seeger-Orbis Mechanical Components (Tianjin) Co., Ltd. (“Seeger”) to Kajo Neukirchen Group ("KNG"). Gross proceeds received were 38,964 Euros ($42,915) after consideration of post-closing adjustments, which were made during the fourth quarter of 2020, pursuant to the terms of the Share Purchase and Transfer Agreement ("SPA"). The Company yielded net cash proceeds of $36,062 after consideration of cash sold and transaction costs. Resulting tax charges of $4,211 were recognized in the first quarter of 2020 following the completion of the sale. Divestiture charges of $2,466 resulted from the completion of the sale and were recorded within Selling and Administrative expenses on the Consolidated Statement of Income for the year ended December 31, 2020.
The Company utilized the proceeds from the sale to reduce debt under the Amended Credit Agreement. Pursuant to the SPA, 6,000 Euros of the proceeds were placed in escrow to be released through 2024, pending any potential settlement of claims. Cash related to a pending claim would remain in escrow until a final determination of the claim has been made. Of the 6,000 Euros, 4,000 Euros remained in escrow as of December 31, 2022 with 2,000 Euros and 2,000 Euros recorded as restricted cash within Prepaid expenses and other current assets and Other assets (non-current), respectively. As of December 31, 2021, 6,000 Euros remained in escrow with 2,000 Euros and 4,000 Euros recorded as restricted cash within Prepaid expenses and other current assets and Other assets (non-current), respectively.
3. Revenue
The Company is a global provider of highly engineered products, differentiated industrial technologies, and innovative solutions, serving a wide range of end markets and customers. Its specialized products and services are used in far-reaching applications in healthcare, automation, packaging, aerospace, mobility, and manufacturing. Revenue is recognized by the Company when control of the product or solution is transferred to the customer. Control is generally transferred when products are shipped or delivered to customers, title is transferred, the significant risks and rewards of ownership have transferred, the Company has rights to payment and the rewards of ownership pass to the customer. Customer acceptance may also be a factor in determining whether control of the product has transferred. Although revenue is generally recognized at a point in time, a certain portion of the Company's businesses with customized products or contracts in which the Company performs work on customer-owned assets requires the use of an over-time recognition model as certain contracts meet one or more of the established criteria pursuant to the accounting guidance. Also, service revenue is recognized as control transfers, which is concurrent with the services being performed.
51
The following tables present the Company's revenue disaggregated by products and services, geographic regions and end markets, by segment:
| 2022 | |||||||||||||||||
| Industrial | Aerospace | Total Company | |||||||||||||||
| Product and Services | |||||||||||||||||
| Engineered Components Products | $ | 189,458 | $ | — | $ | 189,458 | |||||||||||
| Molding Solutions Products | 402,598 | — | 402,598 | ||||||||||||||
| Force & Motion Control Products | 181,197 | — | 181,197 | ||||||||||||||
| Automation Products | 59,462 | — | 59,462 | ||||||||||||||
| Aerospace Original Equipment Manufacturing ("OEM") Products | — | 265,179 | 265,179 | ||||||||||||||
| Aerospace Products and Services ("Aftermarket") | — | 163,974 | 163,974 | ||||||||||||||
| $ | 832,715 | $ | 429,153 | $ | 1,261,868 | ||||||||||||
Geographic Regions (A) | |||||||||||||||||
| Americas | $ | 357,032 | $ | 307,712 | $ | 664,744 | |||||||||||
| Europe | 296,856 | 79,283 | 376,139 | ||||||||||||||
| Asia | 172,922 | 37,348 | 210,270 | ||||||||||||||
| Rest of World | 5,905 | 4,810 | 10,715 | ||||||||||||||
| $ | 832,715 | $ | 429,153 | $ | 1,261,868 | ||||||||||||
| End Markets | |||||||||||||||||
| Aerospace Original Equipment Manufacturing | $ | 12,541 | $ | 265,179 | $ | 277,720 | |||||||||||
| Aerospace Aftermarket | — | 163,974 | 163,974 | ||||||||||||||
| Medical, Personal Care & Packaging | 186,729 | — | 186,729 | ||||||||||||||
| Tool and Die | 85,947 | — | 85,947 | ||||||||||||||
| General Industrial | 254,681 | — | 254,681 | ||||||||||||||
| Auto Molding Solutions | 138,978 | — | 138,978 | ||||||||||||||
| Auto Production | 94,377 | — | 94,377 | ||||||||||||||
| Automation | 59,462 | — | 59,462 | ||||||||||||||
| $ | 832,715 | $ | 429,153 | $ | 1,261,868 | ||||||||||||
(A) Sales by geographic regions are based on the location to which the product is shipped and services are delivered.
52
| 2021 | |||||||||||||||||
| Industrial | Aerospace | Total Company | |||||||||||||||
| Product and Services | |||||||||||||||||
| Engineered Components Products | $ | 184,241 | $ | — | $ | 184,241 | |||||||||||
| Molding Solutions Products | 458,681 | — | 458,681 | ||||||||||||||
| Force & Motion Control Products | 185,597 | — | 185,597 | ||||||||||||||
| Automation Products | 67,964 | — | 67,964 | ||||||||||||||
| Aerospace OEM Products | — | 246,850 | 246,850 | ||||||||||||||
| Aerospace Aftermarket | — | 115,513 | 115,513 | ||||||||||||||
| $ | 896,483 | $ | 362,363 | $ | 1,258,846 | ||||||||||||
Geographic Regions (A) | |||||||||||||||||
| Americas | $ | 356,518 | $ | 271,241 | $ | 627,759 | |||||||||||
| Europe | 335,679 | 58,237 | 393,916 | ||||||||||||||
| Asia | 199,578 | 29,701 | 229,279 | ||||||||||||||
| Rest of World | 4,708 | 3,184 | 7,892 | ||||||||||||||
| $ | 896,483 | $ | 362,363 | $ | 1,258,846 | ||||||||||||
| End Markets | |||||||||||||||||
| Aerospace OEM | $ | 9,278 | $ | 246,850 | $ | 256,128 | |||||||||||
| Aerospace Aftermarket | — | 115,513 | 115,513 | ||||||||||||||
| Medical, Personal Care & Packaging | 219,672 | — | 219,672 | ||||||||||||||
| Tool and Die | 95,466 | — | 95,466 | ||||||||||||||
| General Industrial | 255,942 | — | 255,942 | ||||||||||||||
| Auto Molding Solutions | 150,125 | — | 150,125 | ||||||||||||||
| Auto Production | 98,036 | — | 98,036 | ||||||||||||||
| Automation | 67,964 | — | 67,964 | ||||||||||||||
| $ | 896,483 | $ | 362,363 | $ | 1,258,846 | ||||||||||||
(A) Sales by geographic regions are based on the location to which the product is shipped and services are delivered.
53
| 2020 | |||||||||||||||||
| Industrial | Aerospace | Total Company | |||||||||||||||
| Product and Services | |||||||||||||||||
| Engineered Components Products | $ | 161,024 | $ | — | $ | 161,024 | |||||||||||
| Molding Solutions Products | 400,806 | — | 400,806 | ||||||||||||||
| Force & Motion Control Products | 153,397 | — | 153,397 | ||||||||||||||
| Automation Products | 54,892 | — | 54,892 | ||||||||||||||
| Aerospace OEM Products | — | 234,578 | 234,578 | ||||||||||||||
| Aerospace Aftermarket | — | 119,694 | 119,694 | ||||||||||||||
| $ | 770,119 | $ | 354,272 | $ | 1,124,391 | ||||||||||||
Geographic Regions (A) | |||||||||||||||||
| Americas | $ | 293,339 | $ | 257,370 | $ | 550,709 | |||||||||||
| Europe | 308,288 | 62,250 | 370,538 | ||||||||||||||
| Asia | 164,002 | 30,316 | 194,318 | ||||||||||||||
| Rest of World | 4,490 | 4,336 | 8,826 | ||||||||||||||
| $ | 770,119 | $ | 354,272 | $ | 1,124,391 | ||||||||||||
| End Markets | |||||||||||||||||
| Aerospace OEM | $ | 11,182 | $ | 234,577 | $ | 245,759 | |||||||||||
| Aerospace Aftermarket | — | 119,695 | 119,695 | ||||||||||||||
| Medical, Personal Care & Packaging | 213,725 | — | 213,725 | ||||||||||||||
| Tool and Die | 81,187 | — | 81,187 | ||||||||||||||
| General Industrial | 192,547 | — | 192,547 | ||||||||||||||
| Auto Molding Solutions | 125,337 | — | 125,337 | ||||||||||||||
| Auto Production | 91,249 | — | 91,249 | ||||||||||||||
| Automation | 54,892 | — | 54,892 | ||||||||||||||
| $ | 770,119 | $ | 354,272 | $ | 1,124,391 | ||||||||||||
(A) Sales by geographic market are based on the location to which the product is shipped and services are delivered.
Revenue from products and services transferred to customers at a point in time accounted for approximately 80 percent of revenue for the year ended December 31, 2022, approximately 80 percent of revenue for the year ended December 31, 2021 and approximately 85 percent of revenue for the year ended December 31, 2020. A majority of revenue within the Industrial segment and Aerospace OEM business, along with a portion of revenue within the Aerospace Products and Services business ("Aftermarket") business, is recognized at a point in time, primarily when the product or solution is shipped to the customer.
Revenue from products and services transferred to customers over-time accounted for approximately 20 percent of revenue for the year ended December 31, 2022, approximately 20 percent of revenue for the year ended December 31, 2021 and approximately 15 percent of revenue for the year ended December 31, 2020. The Company recognizes revenue over-time in instances where a contract supports a continual transfer of control to the customer. Substantially all of our revenue in the Aerospace Aftermarket maintenance repair and overhaul business (within Aftermarket Products and Services) and a portion of the revenue for Engineered Components products, Molding Solutions products and Aerospace OEM products is recognized over-time. Within the Molding Solutions and Aerospace Aftermarket businesses, this continual transfer of control to the customer partially results from repair and refurbishment work performed on customer-controlled assets. With other contracts, this continual transfer of control to the customer is supported by clauses in the contract, or governing commercial law of the relevant jurisdiction, where we deliver products that do not have an alternative use and require an enforceable right to payment of costs incurred (plus a reasonable profit) or the Company has a contractual right to complete any work in process and receive full contract price.
54
Performance Obligations. A performance obligation represents a promise within a contract to provide a distinct good or service to the customer. The Company accounts for a contract when it has approval and commitment from both parties, the rights of the parties are identified, payment terms are identified, the contract has commercial substance and collectability of consideration is probable. Transaction price reflects the amount of consideration to which the Company expects to be entitled in exchange for transferred goods or services. A contract’s transaction price is allocated to each distinct performance obligation and revenue is recognized as the performance obligation is satisfied.
The majority of our revenues is from contracts that are less than one year, however certain Aerospace OEM and Molding Solutions business contracts extend beyond one year. In the Industrial segment, customers are typically OEMs or suppliers to OEMs and, in some businesses, distributors. In the Aerospace segment, customers include commercial airlines, OEMs and other aircraft and defense-related parts and service providers.
To determine the proper revenue recognition method for contracts, the Company uses judgment to evaluate whether two or more contracts should be combined and accounted for as one single contract and whether the combined or single contract should be accounted for as more than one performance obligation. Contracts within the Aerospace OEM and Industrial Engineered Components businesses typically have contracts that are combined as the customer may issue multiple purchase orders at or near the same point in time under the terms of a long term agreement.
Revenue is recognized in an over-time model based on the extent of progress towards completion of the performance obligation. The selection of the method to measure progress towards completion requires judgment and is based on the nature of the products or services to be provided. The Company utilizes the cost-to-cost measure of progress for over time contracts as we believe this measure best depicts the transfer of control to the customer, which occurs as we incur costs on contracts.
Contract Estimates. Due to the nature of the work performed in completing certain performance obligations, the estimation of both total revenue and cost at completion includes a number of variables and requires significant judgment, as described further below.
Estimating total contract revenue requires judgment as certain contracts contain pricing discount structures, rebates, early payment discounts, or other provisions that can impact transaction price. The Company generally estimates variable consideration utilizing the expected value methodology as multiple inputs are considered and weighed, such as customer history, customer forecast communications, economic outlooks, and industry data. In certain circumstances where a particular outcome is probable, we utilize the most likely amount to which we expect to be entitled. The Company includes estimated amounts in the transaction price to the extent it is probable that a significant reversal of cumulative revenue recognized will not occur when the uncertainty associated with the variable consideration is resolved.
Estimating the total expected costs related to contracts also requires significant judgment. The Aerospace OEM business as well as a portion of our Molding Solutions Products business has an Estimate at Completion process in which management reviews the progress and execution of our performance obligations for significant contracts with revenue recognized under an over-time model. As part of this process, management reviews information including, but not limited to, performance under the contract, progress towards completion, identified risks and opportunities, sourcing determinations and related changes in estimates of costs to be incurred. These considerations include management's judgment about the ability and cost to achieve technical requirements and other contract requirements. Management makes assumptions and estimates regarding labor efficiency, the complexity of the work to be performed, the availability of materials, the length of time to complete the performance obligation (e.g., to estimate increases in wages and prices for materials and related support cost allocations), execution by our subcontractors and overhead cost rates, among other variables.
The Company generally utilizes the portfolio approach to estimate the amount of revenue to recognize for certain other contracts which require over-time revenue recognition. Such contracts are grouped together either by revenue stream, customer or product. Each portfolio of contracts is grouped together based on having similar characteristics. The portfolio approach is utilized only when the result of the accounting is not expected to be materially different than if applied to individual contracts.
Adjustments to net sales, cost of sales and the related impact to operating income are recognized as necessary in the period they become known. Revenue recognized from performance obligations satisfied in previous periods was not material in 2022, 2021 or 2020.
55
Contract Balances. The timing of revenue recognition, invoicing and cash collections affects accounts receivable, unbilled receivables (contract assets) and customer advances and deposits (contract liabilities) on the Consolidated Balance Sheets.
Unbilled Receivables (Contract Assets) - Pursuant to the over-time revenue recognition model, revenue may be recognized prior to the customer being invoiced. An unbilled receivable is recorded to reflect revenue that is recognized when 1) the cost-to-cost method is applied and 2) such revenue exceeds the amount invoiced to the customer. Unbilled receivables are included within Prepaid Expenses and Other Current Assets on the Consolidated Balance Sheets as of December 31, 2022 and 2021.
Customer Advances and Deposits (Contract Liabilities) - The Company may receive a customer advance or deposit, or have an unconditional right to receive a customer advance, prior to revenue being recognized. Certain contracts within the Molding Solutions business, for example, may require such advances. Since the performance obligations related to such advances have not been satisfied, a contract liability is established. An offsetting asset of equal amount is recorded as an account receivable until the advance is collected. Advances and deposits are included within Accrued Liabilities on the Consolidated Balance Sheets until the respective revenue is recognized. Advance payments are not considered a significant financing component as they are generally received less than one year before the customer solution is completed. These assets and liabilities are reported on the Consolidated Balance Sheets on an individual contract basis at the end of each reporting period.
Net contract assets (liabilities) consisted of the following:
| December 31, 2022 | December 31, 2021 | $ Change | % Change | ||||||||||||||||||||
| Unbilled receivables (contract assets) | $ | 42,423 | $ | 33,522 | $ | 8,901 | 27 | % | |||||||||||||||
| Contract liabilities | (27,857) | (25,374) | (2,483) | 10 | % | ||||||||||||||||||
| Net contract assets | $ | 14,566 | $ | 8,148 | $ | 6,418 | 79 | % | |||||||||||||||
Contract liabilities balances at December 31, 2022 and December 31, 2021 include $9,593 and $9,364, respectively, of customer advances for which the Company has an unconditional right to collect payment. Accounts receivable, as presented on the Consolidated Balance Sheet, includes corresponding balances at December 31, 2022 and December 31, 2021, respectively.
Changes in the net contract assets balance during the year ended December 31, 2022 were impacted by a $2,483 increase in contract liabilities, driven primarily by new customer advances and deposits, partially offset by revenue recognized in the current period. Adding to this net contract asset increase was a $8,901 increase in contract assets, driven primarily by contract progress (i.e. unbilled receivable), offset by earlier contract progress being invoiced to the customer.
The Company recognized approximately 90% of the revenue related to the contract liability balance as of December 31, 2021 during the year ended December 31, 2022 and approximately 100% of the revenue related to the contract liability balance as of December 31, 2020 during the year ended December 31, 2021, primarily representing revenue from the sale of molds and hot runner systems within the Molding Solutions business.
Contract Costs. The Company may incur costs to fulfill a contract. Costs are incurred to develop, design and manufacture tooling to produce a customer’s customized product in conjunction with certain of its contracts, primarily in the Aerospace OEM business. For certain contracts, control related to this tooling remains with the Company. The tooling may be deemed recoverable over the life of the related customer contract (oftentimes a long-term agreement). The Company therefore capitalizes these tooling costs and amortizes them over the shorter of the tooling life or the duration of the long-term agreement. The Company may also incur costs related to the development of product designs (molds or hot runner systems) within its Molding Solutions business. Control of the design may be retained by the Company and deemed recoverable over the contract to build the systems or mold, therefore this design work cost is capitalized and amortized to cost of sales when the related revenue is recognized. Amortization related to these capitalized costs to fulfill a contract were $12,518, $13,446, and $12,847 in the years ended December 31, 2022, 2021 and 2020, respectively.
Capitalized costs, net of amortization, to fulfill a contract balances were as follows:
56
| December 31, 2022 | December 31, 2021 | |||||||
| Tooling | $ | 2,728 | $ | 3,800 | ||||
| Design costs | 2,887 | 3,252 | ||||||
| $ | 5,615 | $ | 7,052 | |||||
Remaining Performance Obligations. The Company has elected to disclose remaining performance obligations only for contracts with an original duration of greater than one year. Such remaining performance obligations represent the transaction price of firm orders for which work has not yet been performed and, for Aerospace, excludes projections of components and assemblies that Aerospace OEM customers anticipate purchasing in the future under existing programs, which represent orders that are beyond lead time and do not represent performance obligations pursuant to the accounting guidance. As of December 31, 2022, the aggregate amount of the transaction price allocated to remaining performance obligations was $241,659. The Company expects to recognize revenue on approximately 65% of the remaining performance obligations over the next 12 months, with the remainder being recognized within 24 months. As of December 31, 2021, the aggregate amount of the transaction price allocated to remaining performance obligations was $177,304.
4. Inventories
Inventories at December 31 consisted of:
| 2022 | 2021 | |||||||||||||
| Finished goods | $ | 105,965 | $ | 88,954 | ||||||||||
| Work-in-process | 68,664 | 65,468 | ||||||||||||
| Raw materials and supplies | 108,773 | 85,233 | ||||||||||||
| $ | 283,402 | $ | 239,655 | |||||||||||
5. Property, Plant and Equipment
Property, plant and equipment, net, at December 31 consisted of:
| 2022 | 2021 | |||||||||||||
| Land | $ | 18,018 | $ | 18,476 | ||||||||||
| Buildings | 184,909 | 187,012 | ||||||||||||
| Machinery and equipment | 704,053 | 699,407 | ||||||||||||
| 906,980 | 904,895 | |||||||||||||
| Less accumulated depreciation | (586,841) | (563,433) | ||||||||||||
| $ | 320,139 | $ | 341,462 | |||||||||||
Depreciation expense was $47,163, $47,600 and $46,590 during 2022, 2021 and 2020, respectively.
57
6. Goodwill and Other Intangible Assets
Goodwill: The following table sets forth the change in the carrying amount of goodwill for each reportable segment and the Company:
| Industrial | Aerospace | Total Company | |||||||||||||||
| January 1, 2021 | $ | 980,794 | $ | 30,786 | $ | 1,011,580 | |||||||||||
| Foreign currency translation | (56,210) | — | (56,210) | ||||||||||||||
| December 31, 2021 | 924,584 | 30,786 | 955,370 | ||||||||||||||
| Impairment charge (see below) | (68,194) | (68,194) | |||||||||||||||
| Foreign currency translation | (51,704) | — | (51,704) | ||||||||||||||
| December 31, 2022 | $ | 804,686 | $ | 30,786 | $ | 835,472 | |||||||||||
As of April 1, 2022, management performed its annual impairment testing of goodwill. The Company utilizes the option to first assess qualitative factors to determine whether it is necessary to perform the Step 1 quantitative goodwill impairment test in accordance with applicable accounting standards. Under the qualitative assessment, management considers relevant events and circumstances including but not limited to macroeconomic conditions, industry and market considerations, overall reporting unit performance and events directly affecting a reporting unit. If the Company determines that the Step 1 quantitative impairment test is required, management estimates the fair value of the reporting unit primarily using an income approach, which reflects management’s cash flow projections, and also evaluates the fair value using a market approach. Inherent in management’s development of cash flow projections are assumptions and estimates, including those related to future earnings, growth rates and the weighted average cost of capital. The Company compares the fair value of the reporting unit with the carrying value of the reporting unit. If the fair values were to fall below the carrying values, the Company would recognize a non-cash impairment charge to income from operations for the amount by which the carrying amount of any reporting unit exceeds the reporting unit’s fair value, assuming the loss recognized does not exceed the total amount of goodwill for the reporting unit.
Based on our assessment as of April 1, the estimated fair value of the Automation reporting unit, which represents the 2018 acquisition of Gimatic, exceeded its carrying value, while the estimated fair value of each of the remaining reporting units significantly exceeded their carrying values. The Company evaluated deteriorating macro-economic conditions subsequent to the date of the assessment, including inflationary pressures, rising interest rates, worsening global supply chain constraints and demand outlook, which materialized during the second quarter of 2022, impacting performance and outlook at Automation and resulted in a triggering event. Management revised its cash flow projections and weighted average cost of capital, resulting in a non-cash goodwill impairment charge of $68,194 related to the Automation reporting unit as the estimated fair value of the reporting unit declined below its carrying value. The goodwill impairment charge of $68,194 was recorded during the three-month period ended June 30, 2022.
Based on our second quarter assessments and as noted above, the estimated fair value for each of the remaining reporting units significantly exceeded their carrying values and there was no impairment at any other reporting units in 2022.
The Company has continued to evaluate the macro-economic conditions, as described above, during the second half of 2022. Based on our third and fourth quarter assessments, there was no additional impairment of goodwill as of December 31, 2022.
58
Other Intangible Assets: Other intangible assets at December 31 consisted of:
| 2022 | 2021 | |||||||||||||||||||||||||||||||
| Range of Life-Years | Gross Amount | Accumulated Amortization | Gross Amount | Accumulated Amortization | ||||||||||||||||||||||||||||
| Amortized intangible assets: | ||||||||||||||||||||||||||||||||
| Revenue Sharing Programs | Up to 30 | $ | 299,500 | $ | (164,162) | $ | 299,500 | $ | (151,961) | |||||||||||||||||||||||
| Component Repair Programs | Up to 30 | 111,839 | (41,880) | 111,839 | (35,632) | |||||||||||||||||||||||||||
| Customer relationships | 10-16 | 337,189 | (156,442) | 337,189 | (137,856) | |||||||||||||||||||||||||||
| Patents and technology | 4-11 | 123,433 | (92,875) | 123,433 | (86,002) | |||||||||||||||||||||||||||
| Trademarks/trade names | 10-30 | 10,949 | (10,772) | 10,949 | (10,587) | |||||||||||||||||||||||||||
| Other | Up to 10 | 9,413 | (2,966) | 7,450 | (2,072) | |||||||||||||||||||||||||||
| 892,323 | (469,097) | 890,360 | (424,110) | |||||||||||||||||||||||||||||
| Unamortized intangible assets: | ||||||||||||||||||||||||||||||||
| Trade names | 55,670 | — | 55,670 | — | ||||||||||||||||||||||||||||
| Foreign currency translation | (36,404) | — | (21,674) | — | ||||||||||||||||||||||||||||
| Other intangible assets | $ | 911,589 | $ | (469,097) | $ | 924,356 | $ | (424,110) | ||||||||||||||||||||||||
The Company has entered into a number of Aftermarket RSP and CRP agreements each of which is with our customer, General Electric ("GE"). See Note 1 for a further discussion of these programs. As of December 31, 2022, the Company has made all required payments under the RSP and CRP agreements.
Amortization of intangible assets for the years ended December 31, 2022, 2021 and 2020 was $44,987, $43,485 and $41,066, respectively. Estimated amortization of intangible assets for future periods is as follows: 2023 - $46,000; 2024 - $44,000; 2025 - $44,000; 2026 - $43,000 and 2027 - $41,000.
7. Accrued Liabilities
Accrued liabilities at December 31 consisted of:
| 2022 | 2021 | |||||||||||||
| Payroll and other compensation | $ | 32,276 | $ | 49,872 | ||||||||||
| Contract liabilities (Note 3) | 27,857 | 25,374 | ||||||||||||
| Pension and other postretirement benefits (Note 12) | 10,999 | 6,043 | ||||||||||||
| Accrued income taxes | 29,201 | 37,908 | ||||||||||||
| Lease liability (Note 19) | 10,209 | 11,125 | ||||||||||||
| Business reorganizations (Note 9) | 11,000 | 1,222 | ||||||||||||
| Other | 37,026 | 44,039 | ||||||||||||
| $ | 158,568 | $ | 175,583 | |||||||||||
59
8. Debt and Commitments
Long-term debt and notes and overdrafts payable at December 31 consisted of:
| 2022 | 2021 | |||||||||||||||||||||||||
| Carrying Amount | Fair Value | Carrying Amount | Fair Value | |||||||||||||||||||||||
| Amended Credit Agreement | $ | 466,672 | $ | 464,373 | $ | 495,262 | $ | 516,380 | ||||||||||||||||||
3.97% Senior Notes | 100,000 | 96,894 | 100,000 | 105,541 | ||||||||||||||||||||||
| Borrowings under lines of credit and overdrafts | 8 | 8 | 224 | 224 | ||||||||||||||||||||||
| 4,404 | 4,085 | 6,505 | 6,827 | |||||||||||||||||||||||
| Other | — | — | 1,676 | 1,676 | ||||||||||||||||||||||
| 571,084 | 565,360 | 603,667 | 630,648 | |||||||||||||||||||||||
| Less current maturities | (1,445) | (3,735) | ||||||||||||||||||||||||
| Long-term debt | $ | 569,639 | $ | 599,932 | ||||||||||||||||||||||
The Company’s long-term debt portfolio consists of fixed-rate and variable-rate instruments and is managed to reduce the overall cost of borrowing and to mitigate fluctuations in interest rates. Among other things, interest rate fluctuations impact the market value of the Company’s fixed-rate debt.
In October 2014, the Company entered into a Note Purchase Agreement (“Note Purchase Agreement”), among the Company and New York Life Insurance Company, New York Life Insurance and Annuity Corporation and New York Life Insurance and Annuity Corporation Institutionally Owned Life Insurance Separate Account, as purchasers, for the issuance of $100,000 aggregate principal amount of 3.97% Senior Notes due October 17, 2024 (the “3.97% Senior Notes”). The 3.97% Senior Notes are senior unsecured obligations of the Company and pay interest semi-annually on April 17 and October 17 of each year at an annual rate of 3.97%. The 3.97% Senior Notes will mature on October 17, 2024 unless earlier prepaid in accordance with their terms. Subject to certain conditions, the Company may, at its option, prepay all or any part of the 3.97% Senior Notes in an amount equal to 100% of the principal amount of the 3.97% Senior Notes so prepaid, plus any accrued and unpaid interest to the date of prepayment, plus the Make-Whole Amount, as defined in the Note Purchase Agreement, with respect to such principal amount being prepaid. The fair value of the 3.97% Senior Notes was determined using the U.S. Treasury yield and a long-term credit spread for similar types of borrowings, which represent Level 2 observable inputs.
On October 8, 2020, the Company entered into the sixth amendment to its fifth amended and restated revolving credit agreement with Bank of America (the “Sixth Amendment”) and the first amendment to the Note Purchase Agreement with New York Life (the “First NPA Amendment” and, collectively with the Sixth Amendment, the "Amendments"). The Sixth Amendment maintained the borrowing availability of $1,000,000 along with access to request an additional $200,000 through an accordion feature. The Sixth Amendment and the First NPA Amendment provided for an increase in the Company’s maximum ratio of Consolidated Senior Debt, as defined, to Consolidated EBITDA, as defined, from 3.25 times (or, if a certain permitted acquisition above $150,000 is consummated, 3.50 times) to 3.75 times in each case at the end of the four fiscal quarters, beginning with December 31, 2020, and regardless of whether a permitted acquisition, as defined, is consummated, providing additional financing flexibility and access to liquidity. Additionally, the Sixth Amendment requires the Company to maintain a maximum ratio of Consolidated Total Debt, as defined, to Consolidated EBITDA, of not more than 3.75 times in each case, at the end of the four fiscal quarters, beginning with December 31, 2020, and regardless of whether a permitted acquisition is consummated. Furthermore, the First NPA Amendment provides for (i) adjustments to the ratio of Consolidated Total Debt to Consolidated EBITDA, as defined, to conform to a more restrictive total leverage ratio that may be required under the Sixth Amendment, (ii) an increase in the amount of allowable add-back for restructuring charges when calculating Consolidated EBITDA from $15,000 to $25,000 and (iii) a required fee payment equal to 0.50% per annum times the daily outstanding principal amount of the note during each of the four fiscal quarters, following the quarter ended December 31, 2020, if the Company’s Senior Leverage Ratio, as defined, exceeds 3.25 times. In October 2020, the Company paid fees and expenses of $1,384 in conjunction with executing the Amendments. Such fees have been deferred within Other Assets on the accompanying Consolidated Balance Sheet and are being amortized into interest expense on the Consolidated Statements of Income.
On February 10, 2021, the Company and certain of its subsidiaries entered into the sixth amended and restated senior unsecured revolving credit agreement (the "Amended Credit Agreement") and retained Bank of America, N.A. as the Administrative Agent for the lenders. The Amended Credit Agreement maintains the $1,000,000 of availability under the
60
facility, while increasing the available borrowings under the accordion feature from $200,000 to $250,000 (aggregate availability of $1,250,000) and extends the maturity date through February 2026. The Amended Credit Agreement also adjusts the interest rate to either the Eurocurrency rate, as defined in the Amended Credit Agreement, plus a margin of 1.175% to 1.775% or the base rate, as defined in the Amended Credit Agreement, plus a margin of 0.175% to 0.775%, depending on the Company's leverage ratio at the time of the borrowing. Multi-currency borrowings, pursuant to the Amended Credit Agreement, bear interest at their respective interbank offered rate (i.e. Euribor) or 0.00% (higher of the two rates) plus a margin of between 1.175% and 1.775%. As with the earlier facility, the Company's borrowing capacity is limited by various debt covenants in the Amended Credit Agreement, as described further below. The Amended Credit Agreement requires the Company to maintain a Senior Debt Ratio of not more than 3.25 times (or, if a permitted acquisition above $150,000 is consummated, 3.50 times at the end of each of the first four fiscal quarters ending after the consummation of any such acquisition). In addition, the Amended Credit Agreement requires the Company to maintain a Total Debt Ratio of not more than 3.75 for each fiscal quarter (or, if a permitted acquisition above $150,000 is consummated, 4.25 times at the end of each of the first four fiscal quarters ending after the consummation of any such acquisition). A ratio of Consolidated EBITDA to Consolidated Cash Interest Expense, as defined, of not less than 4.25, is required at the end of each fiscal quarter. The Company paid fees and expenses of $4,306 in conjunction with executing the Amended Credit Agreement. Such fees have been deferred within Other Assets on the Consolidated Balance Sheets and are being amortized into interest expense on the Consolidated Statements of Income through their maturity. Cash used to pay these fees has been recorded through other financing activities on the Consolidated Statements of Cash Flows. The Company further amended the Amended Credit Agreement on October 11, 2021, defining certain applicable multi-currency borrowing rates that may be used as replacement rates for LIBOR, which is expected to be discontinued by reference rate reform. See Note 1.
On April 6, 2022, the Company entered into Amendment No. 1 (“Amendment No. 1”) to the Amended Credit Agreement, which (i) replaced the LIBOR interest rate for U.S. dollar loans to a term Secured Overnight Financing Rate including a Secured Overnight Financing Rate adjustment (or "SOFR", as defined in the Amended Credit Agreement), (ii) added a daily SOFR option for U.S. dollar loans and a term SOFR option for U.S. dollar loans, and (iii) added the ability to borrow foreign swing line loans based on the Euro Short Term Rate (as defined) with the same interest spread as the interest spread for SOFR Loans (as defined) and Alternative Currency Loans (defined as loans denominated in Euro, Sterling, Swiss Francs or Yen). In addition, Amendment No. 1 lowered the interest rate spread on (i) SOFR Loans and Alternative Currency Loans to a range from 0.975% to 1.70%, depending on the leverage ratio (the “Leverage Ratio”) of Consolidated Total Debt (as defined) to Consolidated EBITDA (as defined) as of the end of each fiscal quarter, and (ii) loans based on the Base Rate (as defined), to a range from 0.00% to 0.70%, depending on the Company’s Leverage Ratio as of the end of each fiscal quarter. Amendment No. 1 also lowered the facility fee, which is required to be paid by the Company under the Amended Credit Agreement and is calculated on the full amount of the revolving facility, to a range from 0.15% to 0.30%, depending on the Company’s Leverage Ratio at the end of each fiscal quarter. In April 2022, the Company paid fees and expenses of $1,037 in conjunction with executing Amendment No. 1. Such fees have been deferred within Other Assets on the Consolidated Balance Sheets and will be amortized into interest expense on the Consolidated Statements of Income through the maturity of Amended Credit Agreement. Cash used to pay these fees was recorded through other financing activities on the Consolidated Statements of Cash Flows.
Borrowings and availability under the Amended Credit Agreement were $466,672 and $533,328, respectively, at December 31, 2022 and $495,262 and $504,738, respectively, at December 31, 2021, subject to covenants in the Company's revolving debt agreements. At December 31, 2022, additional borrowings of $338,869 of Total Debt (including $217,542 of Senior Debt) would have been allowed under the financial covenants. The average interest rate on these borrowings was 3.67% and 1.48% on December 31, 2022 and 2021, respectively. Borrowings included Euro-denominated borrowings of 310,700 Euros ($331,672) at December 31, 2022 and 318,450 Euros ($360,262) at December 31, 2021. The fair value of the borrowings is based on observable Level 2 inputs. The borrowings were valued using discounted cash flows based upon the Company's estimated interest costs for similar types of borrowings.
At December 31, 2022, the Company was in compliance with all applicable covenants. The Company anticipates continued compliance in each of the next four quarters while continuing to monitor its future compliance based on current and future economic conditions. The Company's most restrictive financial covenant is the Senior Debt Ratio, which required the Company to maintain a ratio of Consolidated Senior Debt to Consolidated EBITDA of not more than 3.25 times at December 31, 2022. The actual ratio at December 31, 2022 was 2.35 times, as defined.
In addition, the Company has approximately $71,000 in uncommitted short-term bank credit lines ("Credit Lines") and overdraft facilities. The Credit Lines are accessed locally and are available primarily within the U.S., Europe and Asia. The Credit Lines are subject to the applicable borrowing rates within each respective country and vary between jurisdictions (e.g. LIBOR, Euribor, etc.). The Company had no borrowings under the credit lines at December 31, 2022 or 2021. The Company
61
had borrowed $8 and $224 under the overdraft facilities at December 31, 2022 and 2021, respectively. Repayments under the Credit Lines are due within one month after being borrowed. Repayments of the overdrafts are generally due within two days after being borrowed. The carrying amounts of the Credit Lines and overdrafts approximate fair value due to the short maturities of these financial instruments.
The Company also has several finance leases under which $4,404 and $6,505 was outstanding at December 31, 2022 and December 31, 2021, respectively. The fair value of finance leases is based on observable Level 2 inputs. These instruments were valued using discounted cash flows based upon the Company's estimated interest costs for similar types of borrowings.
Other debt includes bank acceptances. Bank acceptances represent financial instruments accepted by certain China-based vendors in lieu of cash paid on payables, generally range from three to six months in maturity and are guaranteed by banks. The Company had no bank acceptances outstanding at December 31, 2022 and $1,676 of bank acceptances outstanding at December 31, 2021. The carrying amounts of the bank acceptances approximate fair value due to the short maturities of these financial instruments.
Long-term debt and notes payable as of December 31, 2022 are payable as follows: $1,445 in 2023, $101,927 in 2024, $737 in 2025, $466,975 in 2026, $0 in 2027 and $0 thereafter. The amount payable under the Amended Credit Agreement at December 31, 2022 is included in 2026 based on the maturity date of the Amended Credit Agreement.
In addition, the Company had undrawn letters of credit totaling $8,068 at December 31, 2022.
Interest paid was $13,535, $15,206 and $15,088 in 2022, 2021 and 2020, respectively. Interest capitalized was $391, $282 and $348 in 2022, 2021 and 2020, respectively, and is being depreciated over the lives of the related fixed assets.
9. Business Reorganizations
In June 2020, the Company announced restructuring and workforce reduction actions ("2020 Actions") which were implemented across its businesses and functions in response to the macroeconomic disruption in global industrial and aerospace end-markets arising from COVID-19. During 2020, a resulting pre-tax charge of $19,116 was recorded primarily related to employee severance and termination benefits. These actions were substantially complete as of December 31, 2020 and reduced the Company’s global workforce by approximately 8%. A corresponding liability of $100, per below, remained and was included within accrued liabilities as of December 31, 2022. The Company does not expect any additional costs related to the 2020 Actions. The employee termination costs are recorded primarily within Selling and Administrative Expenses in the accompanying Consolidated Statements of Income. Of the aggregate charges recorded, $2,251 was reflected within the results of the Aerospace segment, $15,907 was reflected within the results of the Industrial segment and $958 of pension curtailment and settlement losses were included in Other expense (income), net.
The following table sets forth the change in the liability related to these actions:
| January 1, 2021 | $ | 13,151 | ||||||||||||
| Employee severance and other termination benefits | (2,224) | |||||||||||||
| Payments | (9,705) | |||||||||||||
| December 31, 2021 | 1,222 | |||||||||||||
| Employee severance and other termination benefits | (321) | |||||||||||||
| Payments | (801) | |||||||||||||
| December 31, 2022 | $ | 100 | ||||||||||||
In 2021, the Company initiated additional restructuring actions ("2021 Actions") at a number of locations. The 2021 Actions included a transfer of manufacturing capabilities to leverage existing capacity which is expected to reduce labor and infrastructure costs. The 2021 Actions resulted in pre-tax charges of $2,869, primarily related to employee severance and termination benefits, in 2021 and net benefits of $465 in 2022 and have been recorded within Selling and Administrative Expenses in the accompanying Consolidated Statements of Income. The Company does not expect any additional costs related to the 2021 Actions.
62
In 2022, the Company authorized additional restructuring actions (“2022 Actions”) focused on the consolidation of two manufacturing sites and a number of branch offices and changes in infrastructure to eliminate certain roles across a number of locations in the Industrial segment businesses. Resulting pre-tax charges of $17,986 were recorded in 2022. Of the aggregate, $11,880 related to employee termination costs, primarily employee severance and other termination benefits, which are expected to be paid in cash by the end of 2023 and which are recorded within Selling and Administrative Expenses in the accompanying Consolidated Statements of Income. The remaining $6,106 included $3,186 of accelerated depreciation of assets and $1,417 of pension curtailment losses and special termination benefits which are recorded in Cost of sales and Other expense (income), net, respectively, in the accompanying Consolidated Statements of Income. A corresponding liability of $10,900, per below, related to the employee termination costs remained and was included within accrued liabilities as of December 31, 2022. The Company expects to incur additional costs of approximately $11,000 in 2023 related to the 2022 Actions, which are expected to be completed in 2023.
The following table sets forth the change in the liability for the employee termination costs related to the 2022 Actions:
| January 1, 2022 | $ | — | |||
| Employee severance and other termination benefits | 11,880 | ||||
| Payments | (980) | ||||
| December 31, 2022 | $ | 10,900 | |||
10. Derivatives
The Company has manufacturing, service and sales facilities around the world and thus makes investments and conducts business transactions denominated in various currencies. The Company is also exposed to fluctuations in interest rates and commodity price changes. These financial exposures are monitored and managed by the Company as an integral part of its risk management program.
Derivative financial instruments have been used by the Company to hedge its exposure to fluctuations in interest rates. On April 28, 2017, the Company entered into an interest rate swap agreement (the "2017 Swap") with one bank which converted the interest on the first $100,000 of the Company's one-month LIBOR-based borrowings from a variable rate plus the borrowing spread to a fixed rate of 1.92% plus the borrowing spread. The 2017 Swap expired on January 31, 2022. On March 24, 2021, the Company entered into a new interest rate swap agreement (the "2021 Swap") with this same bank that commenced on January 31, 2022 and that converted the interest on the first $100,000 of the Company's one-month LIBOR-based borrowings from a variable rate plus the borrowing spread to a fixed rate of 1.17% plus the borrowing spread. On April 6, 2022, the Company entered into Amendment No. 1 to the Amended Credit Agreement, which replaced the LIBOR interest rate for U.S. dollar loans with the SOFR rate (see Note 8). As a result, in May 2022 the Company subsequently amended the 2021 Swap (the "Amended 2021 Swap"), effective April 30, 2022, such that the one-month SOFR-based borrowing rate replaced the one-month LIBOR-based borrowing rate. The Amended 2021 Swap, which will expire on January 30, 2026, converts the interest rate on the first $100,000 of the Company's one-month SOFR-based borrowings from a variable rate plus the borrowing spread to a fixed rate of 1.075% plus the borrowing spread. The execution of the Amended 2021 Swap did not result in a material impact on our business, financial condition, results of operations or cash flow. These interest rate swap agreements (the "Swaps") are accounted for as cash flow hedges.
The Company also uses derivative financial instruments to hedge its exposures to fluctuations in foreign currency exchange rates. The Company has various contracts outstanding which primarily hedge recognized assets or liabilities and anticipated transactions in various currencies including the Euro, British pound sterling, U.S. dollar, Canadian dollar, Japanese yen, Singapore dollar, Korean won, Swedish kroner, Chinese renminbi, Mexican peso, Hong Kong dollar and Swiss franc. Certain foreign currency derivative instruments are treated as cash flow hedges of forecasted transactions. All foreign exchange contracts are due within two years.
The Company does not use derivatives for speculative or trading purposes or to manage commodity exposures.
The Company records the derivatives at fair value on the Consolidated Balance Sheets within Prepaid Expenses and Other Current Assets, Other Assets, Accrued Liabilities or Other Liabilities depending on their fair value and remaining contractual period. Changes in the fair market value of derivatives accounted for as cash flow hedges are recorded to accumulated other comprehensive income and reclassified to earnings in a manner that matches the earnings impact of the hedged transaction. Reclassifications to earnings for the Swaps are recorded through interest expense and reclassifications to
63
earnings for foreign exchange contracts are recorded through net sales. Changes in the fair market value of the foreign exchange contracts that are not designated hedging instruments are recorded directly to earnings through Other expense (income), net.
The fair values of the Amended 2021 Swap were $8,535 and $316 as of December 31, 2022 and December 31, 2021, respectively, and were recorded in Other Assets in the Consolidated Balance Sheets for the periods. The fair values of the Company's other derivatives were not material to the Company's Consolidated Balance Sheets as of December 31, 2022 or December 31, 2021. See Note 11. With the exception of the increase in fair value of the Amended 2021 Swap from December 31, 2021 to December 31, 2022, the activity related to the derivatives that have been designated hedging instruments was not material to the Company's Consolidated Financial Statements for the periods ended December 31, 2022, 2021 or 2020. The Company recognized (losses) gains of $(12,937), $(2,494) and $5,631 related to the foreign exchange contracts that are not accounted for as hedging instruments within other expense (income), net, in the Consolidated Statements of Income for the periods ended December 31, 2022, 2021 and 2020, respectively. Such (losses) gains were substantially offset by net gains or losses recorded on the underlying hedged asset or liability (the "underlying"). Offsetting net gains or losses on the underlying are also recorded within Other expense (income), net.
The Company's policy for classifying cash flows from derivatives is to report the cash flows consistent with the underlying hedged item. Other financing cash flows during the years ended December 31, 2022, 2021 and 2020, as presented on the Consolidated Statements of Cash Flows, include $12,324, $766 and $(5,587), respectively, of net cash payments (proceeds) related to the settlement of foreign currency hedges related to intercompany financing.
11. Fair Value Measurements
The provisions of the accounting standard for fair value define fair value as the price that would be received to sell an asset or paid to transfer a liability in an orderly transaction between market participants at the measurement date. This standard classifies the inputs used to measure fair value into the following hierarchy:
| Level 1 | Unadjusted quoted prices in active markets for identical assets or liabilities. | |||||||
| Level 2 | Unadjusted quoted prices in active markets for similar assets or liabilities, or unadjusted quoted prices for identical or similar assets or liabilities in markets that are not active, or inputs other than quoted prices that are observable for the asset or liability. | |||||||
| Level 3 | Unobservable inputs for the asset or liability. | |||||||
The following table provides the assets and liabilities reported at fair value and measured on a recurring basis as of December 31, 2022 and 2021:
| Fair Value Measurements Using | ||||||||||||||||||||||||||
| Total | Quoted Prices in Active Markets for Identical Assets (Level 1) | Significant Other Observable Inputs (Level 2) | Significant Unobservable Inputs (Level 3) | |||||||||||||||||||||||
| December 31, 2022 | ||||||||||||||||||||||||||
| $ | 8,856 | $ | — | $ | 8,856 | $ | — | |||||||||||||||||||
| (1,023) | — | (1,023) | — | |||||||||||||||||||||||
| Bank acceptances | 13,260 | — | 13,260 | — | ||||||||||||||||||||||
| Rabbi trust assets | 2,104 | 2,104 | — | — | ||||||||||||||||||||||
| $ | 23,197 | $ | 2,104 | $ | 21,093 | $ | — | |||||||||||||||||||
| December 31, 2021 | ||||||||||||||||||||||||||
| Asset derivatives | $ | 375 | $ | — | $ | 375 | $ | — | ||||||||||||||||||
| Liability derivatives | (107) | — | (107) | — | ||||||||||||||||||||||
| Bank acceptances | 13,240 | — | 13,240 | — | ||||||||||||||||||||||
| Rabbi trust assets | 3,001 | 3,001 | — | — | ||||||||||||||||||||||
| $ | 16,509 | $ | 3,001 | $ | 13,508 | $ | — | |||||||||||||||||||
64
The derivative contracts are valued using observable current market information as of the reporting date such as the prevailing SOFR-based interest rates and foreign currency spot and forward rates. Bank acceptances represent financial instruments accepted from certain China-based customers in lieu of cash paid on receivables, have maturities of one year or less and are guaranteed by banks. The carrying amounts of the bank acceptances, which are included within prepaid expenses and other current assets, approximate fair value due to their short maturities. The fair values of rabbi trust assets are based on quoted market prices from various financial exchanges. For disclosures of the fair values of the Company’s pension plan assets, see Note 12.
12. Pension and Other Postretirement Benefits
The accounting standards related to employers’ accounting for defined benefit pension and other postretirement plans requires the Company to recognize the funded status of its defined benefit postretirement plans as assets or liabilities in the accompanying consolidated balance sheets and to recognize changes in the funded status of the plans in comprehensive income.
The Company has various defined contribution plans, the largest of which is its Retirement Savings Plan. Most U.S. salaried and non-union hourly employees are eligible to participate in this plan. See Note 17 for further discussion of the Retirement Savings Plan. The Company also maintains various other defined contribution plans which cover certain other employees. Company contributions under certain of these plans are based on the performance of the business units and employee compensation. Contribution expense under these other defined contribution plans was $4,870, $5,475 and $5,301 in 2022, 2021 and 2020, respectively.
Defined benefit pension plans in the U.S. cover a majority of the Company’s U.S. employees at the Engineered Components and Force & Motion Control businesses of Industrial, certain former U.S. employees, including retirees, and a portion of employees at the Company’s Corporate Office. Employees at certain international businesses within Industrial are also covered by defined benefit pension plans. Plan benefits for salaried and non-union hourly employees are based on years of service and average salary. Plans covering union hourly employees provide benefits based on years of service. The Company funds U.S. pension costs in accordance with the Employee Retirement Income Security Act of 1974, as amended (“ERISA”). Non-U.S. defined benefit pension plans cover certain employees of certain international locations in Europe and Canada.
The Company provides other medical, dental and life insurance postretirement benefits for certain of its retired employees in the U.S. and Canada. It is the Company’s practice to fund these benefits as incurred.
65
The accompanying balance sheets reflect the funded status of the Company’s defined benefit pension plans at December 31, 2022 and 2021. Reconciliations of the obligations and funded status of the plans follow:
| 2022 | 2021 | |||||||||||||||||||||||||||||||||||||
| U.S. | Non-U.S. | Total | U.S. | Non-U.S. | Total | |||||||||||||||||||||||||||||||||
| Benefit obligation, January 1 | $ | 442,756 | $ | 89,460 | $ | 532,216 | $ | 461,296 | $ | 96,508 | $ | 557,804 | ||||||||||||||||||||||||||
| Service cost | 3,869 | 1,820 | 5,689 | 4,378 | 2,169 | 6,547 | ||||||||||||||||||||||||||||||||
| Interest cost | 13,144 | 964 | 14,108 | 11,963 | 786 | 12,749 | ||||||||||||||||||||||||||||||||
| Amendments | 121 | — | 121 | 862 | — | 862 | ||||||||||||||||||||||||||||||||
| Actuarial gain | (94,516) | (23,739) | (118,255) | (10,734) | (3,747) | (14,481) | ||||||||||||||||||||||||||||||||
| Benefits paid | (24,882) | (2,592) | (27,474) | (25,009) | (4,499) | (29,508) | ||||||||||||||||||||||||||||||||
| Transfers in | — | 2,694 | 2,694 | — | 2,468 | 2,468 | ||||||||||||||||||||||||||||||||
| Plan curtailments | 708 | — | 708 | — | (603) | (603) | ||||||||||||||||||||||||||||||||
| Plan settlements | — | (4,527) | (4,527) | — | (2,464) | (2,464) | ||||||||||||||||||||||||||||||||
| Special termination benefits | 395 | — | 395 | — | — | — | ||||||||||||||||||||||||||||||||
| Participant contributions | — | 1,034 | 1,034 | — | 1,171 | 1,171 | ||||||||||||||||||||||||||||||||
| Foreign exchange rate changes | — | (4,403) | (4,403) | — | (2,329) | (2,329) | ||||||||||||||||||||||||||||||||
| Benefit obligation, December 31 | 341,595 | 60,711 | 402,306 | 442,756 | 89,460 | 532,216 | ||||||||||||||||||||||||||||||||
| Fair value of plan assets, January 1 | 422,563 | 87,366 | 509,929 | 413,898 | 88,880 | 502,778 | ||||||||||||||||||||||||||||||||
| Actual return on plan assets | (95,573) | (10,275) | (105,848) | 30,880 | 2,214 | 33,094 | ||||||||||||||||||||||||||||||||
| Company contributions | 2,773 | 1,321 | 4,094 | 2,794 | 1,403 | 4,197 | ||||||||||||||||||||||||||||||||
| Participant contributions | — | 1,034 | 1,034 | — | 1,171 | 1,171 | ||||||||||||||||||||||||||||||||
| Benefits paid | (24,882) | (2,592) | (27,474) | (25,009) | (4,499) | (29,508) | ||||||||||||||||||||||||||||||||
| Plan settlements | — | (4,527) | (4,527) | — | (2,464) | (2,464) | ||||||||||||||||||||||||||||||||
| Transfers in | — | 2,694 | 2,694 | — | 2,468 | 2,468 | ||||||||||||||||||||||||||||||||
| Foreign exchange rate changes | — | (4,982) | (4,982) | — | (1,807) | (1,807) | ||||||||||||||||||||||||||||||||
| Fair value of plan assets, December 31 | 304,881 | 70,039 | 374,920 | 422,563 | 87,366 | 509,929 | ||||||||||||||||||||||||||||||||
| (Underfunded) Overfunded status, December 31 | $ | (36,714) | $ | 9,328 | $ | (27,386) | $ | (20,193) | $ | (2,094) | $ | (22,287) | ||||||||||||||||||||||||||
Benefit obligations decreased in 2022 and 2021 primarily due to actuarial gains, resulting largely from increases in the discount rate, and the payment of benefits to plan participants, partially offset by interest costs.
Projected benefit obligations related to pension plans with benefit obligations in excess of plan assets follow:
| 2022 | 2021 | |||||||||||||||||||||||||||||||||||||
| U.S. | Non-U.S. | Total | U.S. | Non-U.S. | Total | |||||||||||||||||||||||||||||||||
| Projected benefit obligation | $ | 268,811 | $ | 34,820 | $ | 303,631 | $ | 43,184 | $ | 49,272 | $ | 92,456 | ||||||||||||||||||||||||||
| Fair value of plan assets | 226,866 | 33,856 | 260,722 | 5,592 | 34,463 | 40,055 | ||||||||||||||||||||||||||||||||
Information related to pension plans with accumulated benefit obligations in excess of plan assets follows:
| 2022 | 2021 | |||||||||||||||||||||||||||||||||||||
| U.S. | Non-U.S. | Total | U.S. | Non-U.S. | Total | |||||||||||||||||||||||||||||||||
| Accumulated benefit obligation | $ | 46,267 | $ | 34,762 | $ | 81,029 | $ | 43,108 | $ | 49,131 | $ | 92,239 | ||||||||||||||||||||||||||
| Fair value of plan assets | 9,813 | 33,856 | 43,669 | 5,592 | 34,463 | 40,055 | ||||||||||||||||||||||||||||||||
The accumulated benefit obligation for all defined benefit pension plans was $395,663 and $520,356 at December 31, 2022 and 2021, respectively.
66
Amounts related to pensions recognized in the accompanying balance sheets consist of:
| 2022 | 2021 | |||||||||||||||||||||||||||||||||||||
| U.S. | Non-U.S. | Total | U.S. | Non-U.S. | Total | |||||||||||||||||||||||||||||||||
| Other assets | $ | 5,231 | $ | 10,292 | $ | 15,523 | $ | 17,399 | $ | 12,715 | $ | 30,114 | ||||||||||||||||||||||||||
| Accrued liabilities | 8,369 | — | 8,369 | 3,160 | — | 3,160 | ||||||||||||||||||||||||||||||||
| Accrued retirement benefits | 33,576 | 964 | 34,540 | 34,432 | 14,809 | 49,241 | ||||||||||||||||||||||||||||||||
| Accumulated other non-owner changes to equity, net | (108,265) | (2,636) | (110,901) | (96,425) | (13,684) | (110,109) | ||||||||||||||||||||||||||||||||
Amounts related to pensions recognized in accumulated other non-owner changes to equity, net of tax, at December 31, 2022 and 2021, respectively, consist of:
| 2022 | 2021 | |||||||||||||||||||||||||||||||||||||
| U.S. | Non-U.S. | Total | U.S. | Non-U.S. | Total | |||||||||||||||||||||||||||||||||
| Net actuarial loss | $ | (106,887) | $ | (2,131) | $ | (109,018) | $ | (94,496) | $ | (13,095) | $ | (107,591) | ||||||||||||||||||||||||||
| Prior service costs | (1,378) | (505) | (1,883) | (1,929) | (589) | (2,518) | ||||||||||||||||||||||||||||||||
| $ | (108,265) | $ | (2,636) | $ | (110,901) | $ | (96,425) | $ | (13,684) | $ | (110,109) | |||||||||||||||||||||||||||
The accompanying balance sheets reflect the underfunded status of the Company’s other postretirement benefit plans at December 31, 2022 and 2021. Reconciliations of the obligations and underfunded status of the plans follow:
| 2022 | 2021 | |||||||||||||
| Benefit obligation, January 1 | $ | 29,839 | $ | 33,104 | ||||||||||
| Service cost | 77 | 103 | ||||||||||||
| Interest cost | 808 | 819 | ||||||||||||
| Actuarial gain | (6,375) | (2,115) | ||||||||||||
| Benefits paid | (2,597) | (2,690) | ||||||||||||
| Participant contributions | 141 | 589 | ||||||||||||
| Foreign exchange rate changes | 71 | 29 | ||||||||||||
| Benefit obligation, December 31 | 21,964 | 29,839 | ||||||||||||
| Fair value of plan assets, January 1 | — | — | ||||||||||||
| Company contributions | 2,456 | 2,101 | ||||||||||||
| Participant contributions | 141 | 589 | ||||||||||||
| Benefits paid | (2,597) | (2,690) | ||||||||||||
| Fair value of plan assets, December 31 | — | — | ||||||||||||
| Underfunded status, December 31 | $ | 21,964 | $ | 29,839 | ||||||||||
Benefit obligations decreased in 2022 and 2021 primarily due to increases in actuarial gains, resulting largely from increases in the discount rate, and by the payment of benefits to plan participants.
Amounts related to other postretirement benefits recognized in the accompanying balance sheets consist of:
| 2022 | 2021 | |||||||||||||
| Accrued liabilities | $ | 2,630 | $ | 2,883 | ||||||||||
| Accrued retirement benefits | 19,334 | 26,956 | ||||||||||||
| Accumulated other non-owner changes to equity, net | 2,261 | (2,198) | ||||||||||||
67
Amounts related to other postretirement benefits recognized in accumulated other non-owner changes to equity, net of tax, at December 31, 2022 and 2021 consist of:
| 2022 | 2021 | |||||||||||||
| Net actuarial gain (loss) | $ | 2,269 | $ | (2,141) | ||||||||||
| Prior service loss | (8) | (57) | ||||||||||||
| $ | 2,261 | $ | (2,198) | |||||||||||
The sources of changes in accumulated other non-owner changes to equity, net, during 2022 were:
| Pension | Other Postretirement Benefits | |||||||||||||
| Prior service cost | $ | (92) | $ | — | ||||||||||
| Net gain (loss) | (11,480) | 4,441 | ||||||||||||
| Amortization of prior service costs | 636 | 27 | ||||||||||||
| Amortization of actuarial loss | 9,218 | (2) | ||||||||||||
| Foreign exchange rate changes | 926 | (7) | ||||||||||||
| $ | (792) | $ | 4,459 | |||||||||||
Weighted-average assumptions used to determine benefit obligations as of December 31, are:
| 2022 | 2021 | |||||||||||||
| U.S. plans: | ||||||||||||||
| Discount rate | 5.50 | % | 2.95 | % | ||||||||||
| Increase in compensation | 3.05 | % | 3.03 | % | ||||||||||
| Non-U.S. plans: | ||||||||||||||
| Discount rate | 3.60 | % | 1.17 | % | ||||||||||
| Increase in compensation | 2.76 | % | 2.77 | % | ||||||||||
| Interest crediting rate | 2.01 | % | 1.34 | % | ||||||||||
The investment strategy of the plans is to generate a consistent total investment return sufficient to pay present and future plan benefits to retirees, while minimizing the long-term cost to the Company. Target allocations for asset categories are used to earn a reasonable rate of return, provide required liquidity and minimize the risk of large losses. Targets may be adjusted, as necessary, to reflect trends and developments within the overall investment environment. The weighted-average target investment allocations by asset category were as follows during 2022: 65% in equity securities and 35% in fixed income securities, including cash.
68
The fair values of the Company’s pension plan assets at December 31, 2022 and 2021 by asset category are as follows:
| Fair Value Measurements Using | ||||||||||||||||||||||||||
| Asset Category | Total | Quoted Prices in Active Markets for Identical Assets (Level 1) | Significant Other Observable Inputs (Level 2) | Significant Unobservable Inputs (Level 3) | ||||||||||||||||||||||
| December 31, 2022 | ||||||||||||||||||||||||||
| Cash and short-term investments | $ | 3,542 | $ | 3,542 | $ | — | $ | — | ||||||||||||||||||
| Equity securities: | ||||||||||||||||||||||||||
| U.S. large-cap | 35,734 | — | 35,734 | — | ||||||||||||||||||||||
| U.S. mid-cap | 14,205 | 14,205 | — | — | ||||||||||||||||||||||
| U.S. small-cap | 14,622 | 14,622 | — | — | ||||||||||||||||||||||
| International equities | 104,377 | — | 104,377 | — | ||||||||||||||||||||||
| Global equity | 42,154 | 42,154 | — | — | ||||||||||||||||||||||
| Fixed income securities: | ||||||||||||||||||||||||||
| U.S. bond funds | 97,170 | — | 97,170 | — | ||||||||||||||||||||||
| International bonds | 61,295 | — | 61,295 | — | ||||||||||||||||||||||
| Other | 1,821 | — | — | 1,821 | ||||||||||||||||||||||
| $ | 374,920 | $ | 74,523 | $ | 298,576 | $ | 1,821 | |||||||||||||||||||
| December 31, 2021 | ||||||||||||||||||||||||||
| Cash and short-term investments | 4,195 | 4,195 | — | — | ||||||||||||||||||||||
| Equity securities: | ||||||||||||||||||||||||||
| U.S. large-cap | 49,079 | — | 49,079 | — | ||||||||||||||||||||||
| U.S. mid-cap | 19,469 | 19,469 | — | — | ||||||||||||||||||||||
| U.S. small-cap | 18,795 | 18,795 | — | — | ||||||||||||||||||||||
| International equities | 136,557 | — | 136,557 | — | ||||||||||||||||||||||
| Global equity | 60,393 | 60,393 | — | — | ||||||||||||||||||||||
| Fixed income securities: | ||||||||||||||||||||||||||
| U.S. bond funds | 143,035 | — | 143,035 | — | ||||||||||||||||||||||
| International bonds | 75,515 | — | 75,515 | — | ||||||||||||||||||||||
| Other | 2,891 | — | — | 2,891 | ||||||||||||||||||||||
| $ | 509,929 | $ | 102,852 | $ | 404,186 | $ | 2,891 | |||||||||||||||||||
The fair values of the Level 1 assets are based on quoted market prices from various financial exchanges. The fair values of the Level 2 assets are based primarily on quoted prices in active markets for similar assets or liabilities. The Level 2 assets are comprised primarily of commingled equity funds and fixed income securities. Commingled equity funds are valued at their net asset values based on quoted market prices of the underlying assets. Fixed income securities are valued using a market approach which considers observable market data for the underlying asset or securities. The Level 3 assets relate to a defined benefit plan within the Molding Solutions business. These pension assets are fully insured and have been estimated based on accrued pension rights and actuarial rates. These pension assets are limited to fulfilling the Company's pension obligations.
The Company expects to contribute approximately $9,712 to the pension plans in 2023. No contributions to the U.S. Qualified pension plans, specifically, are required, and the Company does not currently plan to make any discretionary contributions to such plans in 2023.
69
The following are the estimated future net benefit payments, which include future service, over the next 10 years:
| Pensions | Other Postretirement Benefits | |||||||||||||
| 2023 | $ | 34,976 | $ | 2,630 | ||||||||||
| 2024 | 32,411 | 2,400 | ||||||||||||
| 2025 | 32,292 | 2,247 | ||||||||||||
| 2026 | 32,165 | 2,079 | ||||||||||||
| 2027 | 28,824 | 1,947 | ||||||||||||
Years 2028-2032 | 141,030 | 8,196 | ||||||||||||
| Total | $ | 301,698 | $ | 19,499 | ||||||||||
Pension and other postretirement benefit costs consist of the following:
| Pensions | Other Postretirement Benefits | |||||||||||||||||||||||||||||||||||||
| 2022 | 2021 | 2020 | 2022 | 2021 | 2020 | |||||||||||||||||||||||||||||||||
| Service cost | $ | 5,689 | $ | 6,547 | $ | 6,269 | $ | 77 | $ | 103 | $ | 81 | ||||||||||||||||||||||||||
| Interest cost | 14,108 | 12,749 | 15,084 | 808 | 819 | 1,041 | ||||||||||||||||||||||||||||||||
| Expected return on plan assets | (28,944) | (27,858) | (29,698) | — | — | — | ||||||||||||||||||||||||||||||||
| Amortization of prior service cost | 387 | 332 | 359 | 36 | 29 | 27 | ||||||||||||||||||||||||||||||||
| Recognized losses | 12,710 | 16,006 | 13,626 | (2) | 258 | 35 | ||||||||||||||||||||||||||||||||
| Curtailment loss/(gain) | 1,158 | (133) | 484 | — | — | — | ||||||||||||||||||||||||||||||||
| Settlement (gain)/loss | (605) | 205 | 549 | — | — | — | ||||||||||||||||||||||||||||||||
| Special termination benefits | 395 | — | — | — | — | — | ||||||||||||||||||||||||||||||||
| Net periodic benefit cost | $ | 4,898 | $ | 7,848 | $ | 6,673 | $ | 919 | $ | 1,209 | $ | 1,184 | ||||||||||||||||||||||||||
The curtailment loss of $1,158 and a portion of the special termination benefits of $395 in 2022 as well as the curtailment loss of $484 and a majority of the settlement loss of $549 in 2020 relate to restructuring and workforce reduction actions that were taken during the periods. See Note 9.
The components of net periodic benefit cost other than service cost are included in Other Expense (Income) on the Consolidated Statements of Income.
Weighted-average assumptions used to determine net periodic benefit cost for years ended December 31 are:
| 2022 | 2021 | 2020 | ||||||||||||||||||
| U.S. plans: | ||||||||||||||||||||
| Discount rate | 2.95 | % | 2.65 | % | 3.40 | % | ||||||||||||||
| Long-term rate of return | 7.25 | % | 7.25 | % | 7.75 | % | ||||||||||||||
| Increase in compensation | 3.03 | % | 2.56 | % | 2.56 | % | ||||||||||||||
| Non-U.S. plans: | ||||||||||||||||||||
| Discount rate | 1.17 | % | 0.83 | % | 1.28 | % | ||||||||||||||
| Long-term rate of return | 2.33 | % | 1.96 | % | 3.02 | % | ||||||||||||||
| Increase in compensation | 2.77 | % | 2.75 | % | 2.75 | % | ||||||||||||||
| Interest crediting rate | 1.34 | % | 1.34 | % | 1.34 | % | ||||||||||||||
The expected long-term rate of return is based on consideration of projected rates of return and the historical rates of return of published indices that reflect the plans’ target asset allocation.
The Company’s accumulated postretirement benefit obligations, exclusive of pensions, take into account certain cost-sharing provisions. The annual rate of increase in the cost of covered benefits (i.e., health care cost trend rate) is assumed to be
70
7.52% and 6.56% at December 31, 2022 and 2021, respectively, decreasing gradually to a rate of 4.00% by December 31, 2046.
The Company actively contributes to a Swedish pension plan that supplements the Swedish social insurance system. The pension plan guarantees employees a pension based on a percentage of their salary and represents a multi-employer pension plan, however the pension plan was not significant in any year presented. This pension plan is not underfunded.
13. Stock-Based Compensation
The Company measures the cost of all share-based payments, including stock options, at fair value on the grant date and recognizes this cost in the results of operations, net of expected forfeitures. With the exception of the performance-vested stock options granted in July 2022 under the CEO’s Stock Option Award (“Performance-Vested Stock Options”), the fair value of stock options is estimated on the grant date using the Black-Scholes option-pricing model based on certain assumptions. The fair value of the Performance-Vested Stock Options is estimated on the grant date using the Monte Carlo valuation method. The fair values of service- and performance-based stock awards are estimated based on the fair market value of the Company’s stock price on the grant date. The fair value of market-based performance share awards is estimated on the grant date using the Monte Carlo valuation method.
Refer to Note 17 for a description of the Company’s stock-based compensation plans and their general terms. As of December 31, 2022, incentives have been awarded in the form of performance share awards and restricted stock unit awards (collectively, “Rights”) and stock options. The Company has elected to use the straight-line method to recognize compensation costs. Stock options and awards typically vest over a period ranging from six months to five years. Performance-Vested Stock Options cliff-vest in five years, subject to continued service and the achievement of compound annual growth rates (“CAGRs”) in the price of the Company’s common shares above the option exercise price as of the fifth anniversary of the grant date, with 0% vesting at a CAGR of less than 5%, 33.3% vesting at a CAGR of 5%, 66.6% vesting at a CAGR of 7% and 100% vesting at a CAGR of 9% or greater. The maximum term of stock option awards is 10 years. Upon exercise of a stock option or upon vesting of Rights, shares may be issued from treasury shares held by the Company or from authorized shares.
During 2022, 2021 and 2020, the Company recognized $12,804, $11,470, and $10,300, respectively, of stock-based compensation cost and $2,444, $2,263, and $2,198, respectively, of related tax benefits in the accompanying consolidated statements of income. Additionally, the Company recognized excess tax expense in the tax provision of $(1,257), $(523) and $(579) in 2022, 2021 and 2020, respectively. The Company has realized all available tax benefits related to deductions from excess stock awards exercised or Rights vested. At December 31, 2022, the Company had $20,435 of unrecognized compensation costs related to unvested awards which are expected to be recognized over a weighted average period of 3.15 years.
The following table summarizes information about the Company’s stock option awards during 2022:
| Number of Shares | Weighted-Average Exercise Price | |||||||||||||
| Outstanding, January 1, 2022 | 766,614 | $ | 50.71 | |||||||||||
| Granted | 1,306,370 | 31.66 | ||||||||||||
| Exercised | (5,209) | 28.77 | ||||||||||||
| Forfeited | (215,172) | 46.83 | ||||||||||||
| Outstanding, December 31, 2022 | 1,852,603 | 37.79 | ||||||||||||
71
The following table summarizes information about stock options outstanding at December 31, 2022:
| Options Outstanding | Options Exercisable | |||||||||||||||||||||||||||||||
| Range of Exercise Prices | Number of Shares | Average Remaining Life (Years) | Average Exercise Price | Number of Shares | Average Exercise Price | |||||||||||||||||||||||||||
$30.32 | 1,183,406 | 9.53 | $ | 30.32 | — | $ | — | |||||||||||||||||||||||||
$30.71 to $37.13 | 128,164 | 3.15 | 32.14 | 120,800 | 32.07 | |||||||||||||||||||||||||||
$45.25 to $47.07 | 154,882 | 5.31 | 46.36 | 117,282 | 46.72 | |||||||||||||||||||||||||||
$51.55 to $59.28 | 209,082 | 5.16 | 55.89 | 176,676 | 56.49 | |||||||||||||||||||||||||||
$59.46 to $66.10 | 177,069 | 5.00 | 62.92 | 168,045 | 62.94 | |||||||||||||||||||||||||||
The Company received cash proceeds from the exercise of stock options of $150, $1,083 and $1,596 in 2022, 2021 and 2020, respectively. The total intrinsic value (the amount by which the stock price exceeded the exercise price of the option on the date of exercise) of the stock options exercised during 2022, 2021 and 2020 was $55, $439 and $781, respectively.
The weighted-average grant date fair value of stock options (excluding performance-vested stock options) granted in 2022, 2021 and 2020 was $15.63, $17.30, and $14.69, respectively. The fair value of each stock option grant on the date of grant was estimated using the Black-Scholes option-pricing model based on the following weighted average assumptions:
| 2022 | 2021 | 2020 | ||||||||||||||||||
| Risk-free interest rate | 1.98 | % | 0.55 | % | 1.45 | % | ||||||||||||||
| Expected life (years) | 5.5 | 5.5 | 5.5 | |||||||||||||||||
| Expected volatility | 40.1 | % | 40.0 | % | 26.0 | % | ||||||||||||||
| Expected dividend yield | 1.22 | % | 1.23 | % | 1.25 | % | ||||||||||||||
The risk-free interest rate is based on the term structure of interest rates at the time of the option grant. The expected life represents an estimate of the period of time that options are expected to remain outstanding. Assumptions of expected volatility of the Company’s common stock and expected dividend yield are estimates of future volatility and dividend yields based on historical trends.
The grant date fair value of the performance-vested stock options granted in 2022 was $8.45 and was estimated using the Monte Carlo valuation method since it includes a market condition. The assumptions used to determine the fair value of the 2022 award include a 3.46% risk-free interest rate and a 34.5% expected volatility rate. Compensation expense for the performance-vested stock options is fixed at the date of grant and will not be adjusted in future periods based upon the achievement of the stock price CAGR performance goal.
The following table summarizes information about stock options outstanding that are expected to vest and stock options outstanding that are exercisable at December 31, 2022:
| Options Outstanding, Expected to Vest | Options Outstanding, Exercisable | |||||||||||||||||||||||||||||||||||||||||||
Shares (1) | Weighted- Average Exercise Price | Aggregate Intrinsic Value | Weighted- Average Remaining Term (Years) | Shares | Weighted- Average Exercise Price | Aggregate Intrinsic Value | Weighted- Average Remaining Term (Years) | |||||||||||||||||||||||||||||||||||||
| 1,784,035 | $ | 37.79 | $ | 13,075 | 7.82 | 582,803 | $ | 51.32 | $ | 1,061 | 4.21 | |||||||||||||||||||||||||||||||||
(1) Includes 1,183,406 of Performance-Vested Stock Options that were granted to the CEO in July 2022. It is assumed that such options achieve the required five-year compound annual growth rates and are 100% vested.
72
The following table summarizes information about the Company’s Rights during 2022:
| Service Based Rights | Service and Performance Based Rights | Service and Market Based Rights | ||||||||||||||||||||||||||||||||||||
| Number of Units | Weighted-Average Grant Date Fair Value | Number of Units | Weighted-Average Grant Date Fair Value | Number of Units | Weighted-Average Grant Date Fair Value | |||||||||||||||||||||||||||||||||
| Outstanding, January 1, 2022 | 259,107 | $ | 49.27 | 174,197 | $ | 58.70 | 87,115 | $ | 97.62 | |||||||||||||||||||||||||||||
| Granted | 250,789 | 40.75 | 90,412 | 44.72 | 45,222 | 83.42 | ||||||||||||||||||||||||||||||||
| Forfeited | (86,056) | 49.59 | (71,329) | 49.33 | (35,664) | 87.89 | ||||||||||||||||||||||||||||||||
| Additional Earned | — | — | (52,919) | 60.53 | (26,469) | 97.19 | ||||||||||||||||||||||||||||||||
| Issued | (121,601) | 52.98 | — | — | — | — | ||||||||||||||||||||||||||||||||
| Outstanding, December 31, 2022 | 302,239 | 140,361 | 70,204 | |||||||||||||||||||||||||||||||||||
The Company granted 250,789 restricted stock unit awards and 135,634 performance share awards in 2022. All of the restricted stock unit awards vest upon meeting certain service conditions. "Additional Earned" reflects performance share awards earned above or failed to earn (below) target that have been issued. The performance share awards are part of the long-term Performance Share Award Program (the "Awards Program"), which is designed to assess the long-term Company performance relative to the performance of companies included in the Russell 2000 Index or to pre-established goals. The performance goals are independent of each other and based on equally weighted metrics. For awards granted in 2022, 2021 and 2020, the metrics included the Company's total shareholder return ("TSR"), operating income before depreciation and amortization growth ("EBITDA growth") and return on invested capital ("ROIC"). The TSR and EBITDA growth metrics are designed to assess the long-term Company performance relative to the performance of companies included in the Russell 2000 Index over a three-year period. ROIC is designed to assess the Company’s performance compared to pre-established goals over a three-year performance period. The participants can earn from zero to 250% of the target award and the award includes a forfeitable right to dividend equivalents, which are not included in the aggregate target award numbers. Compensation expense for the awards is recognized over the three-year service period based upon the value determined under the intrinsic value method for EBITDA growth and ROIC portions of the award and the Monte Carlo simulation valuation model for the TSR portion of the award since it contains a market condition. The assumptions used to determine the weighted-average fair values of the market based portion of the 2022 awards include a 1.98% risk-free interest rate and a 50.27% expected volatility rate.
Compensation expense for the TSR portion of the awards is fixed at the date of grant and will not be adjusted in future periods based upon the achievement of the TSR performance goal. Compensation expense for the EBITDA growth and the ROIC portions of the awards is recorded each period based upon a probability assessment of achieving the goals with a final adjustment at the end of the service period based upon the actual achievement of those performance goals.
73
14. Income Taxes
The components of Income from continuing operations before income taxes and Income taxes follow:
| 2022 | 2021 | 2020 | ||||||||||||||||||
| Income from continuing operations before income taxes: | ||||||||||||||||||||
| U.S. | $ | (53,088) | $ | (28,832) | $ | (21,538) | ||||||||||||||
| International | 91,273 | 156,649 | 123,033 | |||||||||||||||||
| Income from continuing operations before income taxes | $ | 38,185 | $ | 127,817 | $ | 101,495 | ||||||||||||||
| Income tax provision: | ||||||||||||||||||||
| Current: | ||||||||||||||||||||
| U.S. – federal | $ | 276 | $ | 4,733 | $ | 3,697 | ||||||||||||||
| U.S. – state | 778 | 1,009 | (92) | |||||||||||||||||
| International | 29,374 | 38,609 | 41,506 | |||||||||||||||||
| 30,428 | 44,351 | 45,111 | ||||||||||||||||||
| Deferred: | ||||||||||||||||||||
| U.S. – federal | $ | (790) | $ | (6,800) | $ | 1,914 | ||||||||||||||
| U.S. – state | (579) | (1,051) | 222 | |||||||||||||||||
| International | (4,353) | (8,556) | (9,127) | |||||||||||||||||
| (5,722) | (16,407) | (6,991) | ||||||||||||||||||
| Income taxes | $ | 24,706 | $ | 27,944 | $ | 38,120 | ||||||||||||||
In 2021, the Company had a deferred tax liability for foreign withholding taxes of $185 on $3,501 of undistributed earnings on its international subsidiaries earned before 2017. In 2022, the Company removed the deferred tax liability as any related foreign withholding tax has been paid and all other undistributed earnings have been considered indefinitely reinvested. All remaining earnings are considered indefinitely reinvested as defined per the indefinite reversal criterion within the accounting guidance for income taxes. If the earnings were distributed in the form of dividends, the Company would not be subject to U.S. Tax but could be subject to foreign income and withholding taxes. Determination of the amount of this unrecognized deferred income tax liability is not practicable. The Company did not repatriate any dividends to the U.S. from accumulated foreign earnings in 2022, as compared to $68,262 in 2021. On December 31, 2022, the Company's unremitted foreign earnings were approximately $1,799,000.
74
Deferred income tax assets and liabilities at December 31 consist of the tax effects of temporary differences related to the following:
| 2022 | 2021 | |||||||||||||
| Deferred tax assets: | ||||||||||||||
| Pension | $ | 11,505 | $ | 8,803 | ||||||||||
| Tax loss carryforwards | 10,970 | 11,067 | ||||||||||||
| Inventory valuation | 8,015 | 10,660 | ||||||||||||
| Other postretirement/postemployment costs | 7,715 | 7,741 | ||||||||||||
| Accrued compensation | 7,430 | 9,775 | ||||||||||||
| Goodwill | 8,981 | 14,960 | ||||||||||||
| Lease obligation | 8,493 | 9,790 | ||||||||||||
| Other | 17,310 | 16,609 | ||||||||||||
| Valuation allowance | (6,456) | (3,869) | ||||||||||||
| Total deferred tax assets | 73,963 | 85,536 | ||||||||||||
| Deferred tax liabilities: | ||||||||||||||
| Depreciation and amortization | (81,409) | (94,286) | ||||||||||||
| Goodwill | (9,899) | (9,909) | ||||||||||||
| Swedish tax incentive | (7,196) | (8,531) | ||||||||||||
| Right of use liability | (8,456) | (9,826) | ||||||||||||
| Other | (11,537) | (7,712) | ||||||||||||
| Total deferred tax liabilities | (118,497) | (130,264) | ||||||||||||
| Net deferred tax liabilities | $ | (44,534) | $ | (44,728) | ||||||||||
Amounts related to deferred taxes in the balance sheets as of December 31, 2022 and 2021 are presented as follows:
| 2022 | 2021 | |||||||||||||
| Non-current deferred tax assets | $ | 18,028 | $ | 21,976 | ||||||||||
| Non-current deferred tax liabilities | (62,562) | (66,704) | ||||||||||||
| Net deferred tax liabilities | $ | (44,534) | $ | (44,728) | ||||||||||
The standards related to accounting for income taxes require that deferred tax assets be reduced by a valuation allowance if, based on all available evidence, it is more likely than not that the deferred tax asset will not be realized. Available evidence includes the reversal of existing taxable temporary differences, future taxable income exclusive of temporary differences, taxable income in carryback years and tax planning strategies.
The realization of these assets is dependent in part on the amount and timing of future taxable income in the jurisdictions where deferred tax assets reside. As of December 31, 2022, the Company has gross tax loss carryforwards of $36,236; $3,599 which relates to U.S tax loss carryforwards which have carryforward periods up to 20 years for federal purposes and ranging from to 20 years for state purposes; $2,819 of which relates to international tax loss carryforwards with carryforward periods ranging from to 20 years; and $29,818 of which relates to international tax loss carryforwards with unlimited carryforward periods. In addition, the Company has tax credit carryforwards of $417 with remaining carryforward periods ranging from to five years. Currently the Company has a valuation allowance of $6,090 and $366 related to loss carryforwards and credit carryforwards, respectively, as it believes it is more likely than not that future income will not be earned to timely utilize certain net operating losses or credit carryforwards which have expiration dates. As the ultimate realization of the remaining net deferred tax assets is dependent upon future taxable income, if such future taxable income is not earned and it becomes necessary to recognize a valuation allowance, it could result in a material increase in the Company’s tax expense which could have a material adverse effect on the Company’s financial condition and results of operations.
75
In the second quarter of 2021, the Italian tax authorities released tax guidance related to the application of tax basis realignment rules for intangible property ("Realignment") which provides Italian taxpayers with the opportunity to step up the basis of goodwill and intangibles to their fair market value and amortize the step up over 18 years for tax purposes in exchange for paying a 3% tax on the step up, payable over a three years period. The Company opted to elect the Realignment in June 2021 and accordingly recorded a tax payable of $3,008 and a long-term tax payable of $6,016. The Company made its first required installment payment of $3,008 during the third quarter of 2021, reducing the long-term tax payable accordingly. The Company also recorded a deferred tax asset of $83,921 related to the Realignment. Accounting guidance requires that when a deferred tax asset is realigned for tax purposes, a corresponding revaluation reserve also be recorded. Under Italian tax rules, any dividends paid out of this revaluation reserve are subject to tax at a 24% rate. Accordingly, the Company recorded a deferred tax liability of $72,190 related to the potential 24% tax due on any dividends, paid out of the revaluation reserve. The deferred tax asset and liability balances have been presented on a net basis on the Consolidated Balance Sheets. The Company also recorded a one-time $2,707 benefit to the provision related to this election and related accounting. In December 2021, the Italian government increased the amortization period to 50 years but then reversed the period back to 10 years for the intangible component of the step up in 2022; however the change has no impact on the accounting for the transaction as reported above.
In August 2022, the U.S. government enacted tax legislation commonly referred to as the Inflation Reduction Act of 2022 (“IRA”) into law. The IRA will impose a 1% excise tax on the fair market value of certain stock repurchased by a public traded company after December 31, 2022 and restored and modified certain tax-related energy incentives. The Company does not anticipate a material impact on our business, financial condition, results of operations or cash flow as a result of this change.
Management is required to assess whether its valuation allowance analysis is affected by various components of tax law including future GILTI inclusions, changes to the deductibility of executive compensation and interest expense and changes to the NOL and FTC rules. The Company increased the valuation allowance by $2,559 for payments to be made to covered employees in the future, which the Company believes will not be deductible under Section 162M. The total valuation allowance recorded against future executive compensation is $3,198.
A reconciliation of the U.S. federal statutory income tax rate to the consolidated effective income tax rate from continuing operations follows:
| 2022 | 2021 | 2020 | ||||||||||||||||||
| U.S. federal statutory income tax rate | 21.0 | % | 21.0 | % | 21.0 | % | ||||||||||||||
| Foreign operations taxed at different rates | 0.6 | 0.1 | 5.6 | |||||||||||||||||
| Foreign losses without tax benefit | 7.5 | 1.9 | 3.0 | |||||||||||||||||
| Italian goodwill & intangible realignment | — | (2.1) | — | |||||||||||||||||
| Goodwill impairment | 37.5 | — | — | |||||||||||||||||
| GILTI | 12.0 | 2.3 | 3.0 | |||||||||||||||||
| Tax holidays | (30.2) | (2.5) | (1.0) | |||||||||||||||||
| Stock awards excess tax expense | 3.3 | 0.4 | 0.6 | |||||||||||||||||
| Tax on Seeger transaction | — | — | 4.9 | |||||||||||||||||
| Charge (benefit) for change in valuation allowances | 9.3 | — | (0.5) | |||||||||||||||||
Audits including MAP Approval | 2.8 | (1.5) | 0.2 | |||||||||||||||||
| Adjustment to prior year's tax return | (2.2) | 1.0 | — | |||||||||||||||||
| Foreign tax rate change | — | 0.4 | — | |||||||||||||||||
| Other | 3.1 | 0.9 | 0.8 | |||||||||||||||||
| Consolidated effective income tax rate | 64.7 | % | 21.9 | % | 37.6 | % | ||||||||||||||
In 2019 and 2017, the Company recorded additional income taxes resulting from audits at certain subsidiaries in Germany. The Company filed applications with the Internal Revenue Service ("IRS") under the Mutual Aid Process ("MAP") to allow for offsetting positions within the US tax filings for the Germany-related adjustments. In 2021 the MAP applications were approved by the IRS. The Company recognized a tax benefit of $1,967 in 2021 to reflect the tax benefit realized as a result of the IRS approval.
76
Payment of the Transition Tax assessed is required over an eight-year period. The short-term portion of the Transition Tax payable, $13,029, has been included within Accrued Liabilities on the Consolidated Balance Sheet as of December 31, 2022. The long-term portion of the assessment, $39,086, is included as a Long-term tax liability on the Consolidated Balance Sheet and is payable as follows: $17,371 in 2024 and $21,715 in 2025.
The Aerospace and Industrial segments have a number of multi-year tax holidays in Singapore, China and Malaysia. Tax benefits of $11,528 ($0.23 per diluted share), $3,219 ($0.06 per diluted share) and $1,065 ($0.02 per diluted share) were realized in 2022, 2021 and 2020, respectively. These holidays are subject to the Company meeting certain commitments in the respective jurisdictions. Aerospace was granted an income tax holiday for operations recently established in Malaysia. This holiday commenced effective November 2020 (retroactively) and remains effective for a period of ten years. The China tax holiday was granted in 2021 and the holiday runs for a three year period ending December 31, 2023. It is anticipated that the Company will re-apply for the holiday in 2024. The Aerospace business was granted additional tax holidays in Singapore under the Pioneer program in 2022. This holiday provides reduced tax rates for certain Aerospace programs manufactured at the Singapore location and will run through December 2025.
Income taxes paid globally, net of refunds, were $49,639, $58,324, and $60,427 in 2022, 2021 and 2020, respectively.
As of December 31, 2022, 2021 and 2020, the total amount of unrecognized tax benefits recorded in the consolidated balance sheet was $8,250, $8,671, and $9,156, respectively, which, if recognized, would have reduced the effective tax rate in prior years, with the exception of amounts related to acquisitions. A reconciliation of the unrecognized tax benefits for 2022, 2021 and 2020 follows:
| 2022 | 2021 | 2020 | ||||||||||||||||||
| Balance at January 1 | $ | 8,671 | $ | 9,156 | $ | 8,919 | ||||||||||||||
| Increase (decrease) in unrecognized tax benefits due to: | ||||||||||||||||||||
| Tax positions taken during prior periods | — | — | 550 | |||||||||||||||||
| Tax positions taken during the current period | 873 | 637 | 649 | |||||||||||||||||
| Settlements | — | (70) | — | |||||||||||||||||
| Lapse of the applicable statute of limitations | (1,171) | (1,218) | (900) | |||||||||||||||||
| Foreign currency translation | (123) | 166 | (62) | |||||||||||||||||
| Balance at December 31 | $ | 8,250 | $ | 8,671 | $ | 9,156 | ||||||||||||||
The Company recognizes interest and penalties, if any, related to unrecognized tax benefits in income tax expense. The Company recognized interest and penalties as a component of income taxes of $(264), $(93), and $(196) in the years 2022, 2021 and 2020, respectively. The liability for unrecognized tax benefits includes gross accrued interest and penalties of $3,318, $3,582, and $3,675 at December 31, 2022, 2021 and 2020, respectively.
The Company or its subsidiaries file income tax returns in the U.S. federal jurisdiction, and various state and foreign jurisdictions. In the normal course of business, the Company is subject to examination by various taxing authorities, including the IRS in the U.S. and the taxing authorities in other major jurisdictions including China, Germany, Singapore, Sweden and Switzerland. With a few exceptions, tax years remaining open to examination in significant foreign jurisdictions include tax years 2018 and forward and for the U.S. include tax years 2016 and forward. The Company is undergoing a tax audit by the IRS for the 2016, 2017 and 2018 tax year. The Company is under a German tax audit for the Seeger business group for the years 2018 through 2019 and the first month of 2020. Pursuant to the sale and purchase agreement, the Company agreed to certain indemnifications for taxes assessed for audit periods related to the Seeger business. Refer to Note 2. The Company is also under German tax audits for the FOBOHA and Manner business groups for years 2019 and 2020.
15. Common Stock
There were no shares of common stock issued from treasury in 2022, 2021 or 2020.
In 2022, 2021 and 2020, the Company acquired 200,000 shares, 100,000 shares and 396,000 shares, respectively, of the Company’s common stock at a cost of $6,721, $5,229 and $15,550, respectively. These amounts exclude shares reacquired to pay for the related income tax upon issuance of shares in accordance with the terms of the Company’s stockholder-approved
77
equity compensation plans and the equity rights granted under those plans ("Reacquired Shares"). These Reacquired Shares were placed in treasury.
In 2022, 2021 and 2020, 137,911 shares, 172,261 shares and 298,565 shares of common stock, respectively, were issued from authorized shares for the exercise of stock options, various other incentive awards and purchases by the Company's Employee Stock Purchase Plan.
16. Preferred Stock
At December 31, 2022 and 2021, the Company had 3,000,000 shares of preferred stock authorized, none of which were outstanding.
17. Stock Plans
Most U.S. salaried and non-union hourly employees are eligible to participate in the Company’s 401(k) plan (the "Retirement Savings Plan"). The Retirement Savings Plan provides for the investment of employer and employee contributions in various investment alternatives including the Company’s common stock, at the employee’s direction. The Company contributes an amount equal to 50% of employee contributions up to 6% of eligible compensation. The Company expenses all contributions made to the Retirement Savings Plan. Effective January 1, 2013, the Retirement Savings Plan was amended to provide certain salaried employees hired on or after January 1, 2013 with an additional annual retirement contribution of 4% of eligible earnings. The Company recognized expense of $4,164, $3,970 and $3,679 in 2022, 2021 and 2020, respectively. As of December 31, 2022, the Retirement Savings Plan held 681,013 shares of the Company’s common stock.
The Company has an Employee Stock Purchase Plan (“ESPP”) under which eligible employees may elect to have up to the lesser of $25 or 10% of base compensation deducted from their payroll checks for the purchase of the Company’s common stock at 95% of the average market value on the date of purchase. The maximum number of shares which may be purchased under the ESPP is 4,550,000. The number of shares purchased under the ESPP was 11,101, 7,667 and 10,041 in 2022, 2021 and 2020, respectively. The Company received cash proceeds from the purchase of these shares of $363, $344 and $393 in 2022, 2021 and 2020, respectively. As of December 31, 2022, 232,020 additional shares may be purchased.
The 2014 Barnes Group Stock and Incentive Award Plan (the “2014 Plan”) was approved on May 9, 2014 by the Company's stockholders. The 2014 Plan permits the issuance of incentive awards, stock option grants and stock appreciation rights to eligible participants to purchase up to 6,913,978 shares of common stock. The amount includes shares available for purchase under earlier stock and incentive plans which were merged into the 2014 Plan. The 2014 Plan allows for stock options and stock appreciation rights to be issued at a ratio of 1:1 and other types of incentive awards at a ratio of 2.84:1 from the shares available for future grants. As of December 31, 2022, there were 2,223,889 shares available for future grants under the 2014 Plan, inclusive of Shares Reacquired and shares made available through 2022 forfeitures. As of December 31, 2022, there were 2,310,838 shares of common stock outstanding to be issued upon the exercise of stock options and the vesting of Rights.
Rights under the 2014 Plan entitle the holder to receive, without payment, one share of the Company’s common stock after the expiration of the vesting period. Certain of these Rights are also subject to the satisfaction of established performance goals. Additionally, holders of certain Rights are credited with dividend equivalents, which are converted into additional Rights, and holders of certain restricted stock units are paid dividend equivalents in cash when dividends are paid to other stockholders. All Rights have a vesting period of up to five years.
Although the Performance-Vested Stock Options were not granted under the 2014 Plan, they will be administered in accordance with the terms and conditions of the 2014 Plan (other than Section 4 thereof). This stock option award was approved by the Compensation and Management Development Committee of the Board of Directors of Barnes without shareholder approval pursuant to New York Stock Exchange Rule 303A.08.
Under the Non-Employee Director Deferred Stock Plan, as amended, each non-employee director who joined the Board of Directors prior to December 15, 2005 was granted the right to receive 12,000 shares of the Company’s common stock upon retirement. In 2022, 2021 and 2020, $18, $19 and $21, respectively, of dividend equivalents were paid in cash related to these shares. There was no compensation cost related to this plan in 2022, 2021 or 2020. There are 26,400 shares reserved for issuance under this plan.
Total maximum shares reserved for issuance under all stock plans aggregated 4,793,147 at December 31, 2022.
78
18. Weighted Average Shares Outstanding
Net income per common share is computed in accordance with accounting standards related to earnings per share. Basic earnings per share is calculated using the weighted-average number of common shares outstanding during the year. Share-based payment awards that entitle their holders to receive nonforfeitable dividends before vesting should be considered participating securities and, as such, should be included in the calculation of basic earnings per share. The Company’s restricted stock unit awards which contain nonforfeitable rights to dividends are considered participating securities. Diluted earnings per share reflects the assumed exercise and conversion of all dilutive securities. Shares held by the Retirement Savings Plan are considered outstanding for both basic and diluted earnings per share. There are no adjustments to net income for purposes of computing income available to common stockholders for the years ended December 31, 2022, 2021 or 2020. A reconciliation of the weighted-average number of common shares outstanding used in the calculation of basic and diluted earnings per share follows:
| Weighted-Average Common Shares Outstanding | ||||||||||||||||||||
| 2022 | 2021 | 2020 | ||||||||||||||||||
| Basic | 50,962,447 | 50,926,374 | 50,880,846 | |||||||||||||||||
| Dilutive effect of: | ||||||||||||||||||||
| Stock options | 20,910 | 74,798 | 66,738 | |||||||||||||||||
| Performance share awards | 100,810 | 77,891 | 150,002 | |||||||||||||||||
| Diluted | 51,084,167 | 51,079,063 | 51,097,586 | |||||||||||||||||
The calculation of weighted-average diluted shares outstanding excludes all anti-dilutive shares. During 2022, 2021 and 2020, the Company excluded 1,352,548, 533,177 and 484,835 stock awards, respectively, from the calculation of diluted weighted-average shares outstanding as the stock awards were considered anti-dilutive.
19. Leases
The Company maintains leases of certain manufacturing, distribution and assembly facilities, office space, land, machinery and equipment. Leases generally have remaining terms of one year to five years. Leases with an initial term of twelve months or less are not recorded on the Consolidated Balance Sheets. The Company recognizes lease expense for minimum lease payments on a straight line basis over the term of the lease. Certain leases include options to renew or terminate. Renewal options are exercisable per the discretion of the Company and vary based on the nature of each lease, with renewal periods generally ranging from one year to five years. The term of the lease includes renewal periods only if the Company is reasonably certain that it will exercise the renewal option. When determining if a renewal option is reasonably certain of being exercised, the Company considers several factors, including but not limited to, the cost of moving to another location, the cost of disruption to operations, whether the purpose or location of the leased asset is unique and the contractual terms associated with extending the lease.
Certain leases provide the option to purchase the leased property and are therefore evaluated for finance lease consideration. Right-of-use ("ROU") assets and lease liabilities related to finance leases were not material as of December 31, 2022 and 2021. ROU assets arising from finance leases are included in property, plant and equipment, net, and the corresponding liabilities are included in Long Term Debt - Current and Long-Term Debt on the Consolidated Balance Sheet. The depreciable life of leased assets are limited by the expected term of the lease, unless there is a transfer of title or purchase option and the Company believes it is reasonably certain of exercise.
Lease agreements generally do not contain any material residual value guarantees or materially restrictive covenants and the Company does not sublease to any third parties. The Company does not have any material leases that have been signed but not commenced.
79
Contracts are evaluated at inception to determine whether they contain a lease, where the Company obtains the right to control an identified asset. The following table sets forth the classification of ROU assets and lease liabilities on the Consolidated Balance Sheets:
| Operating Leases | Classification | December 31, 2022 | December 31, 2021 | |||||||||||||||||
| Leased Assets | ||||||||||||||||||||
| ROU assets | $ | 27,054 | $ | 29,393 | ||||||||||||||||
| Lease Liabilities | ||||||||||||||||||||
| Current lease liability | 10,209 | 11,125 | ||||||||||||||||||
| Long-term lease liability | 17,128 | 18,018 | ||||||||||||||||||
| $ | 27,337 | $ | 29,143 | |||||||||||||||||
Operating lease ROU assets and operating lease liabilities are recognized based on the present value of the future minimum lease payments over the lease term at commencement date. New operating lease ROU assets represent the lease liability, plus any lease payments made at or before the commencement date, less any lease incentives received. The Company's real estate leases, which are comprised primarily of manufacturing, distribution and assembly facilities, represent a majority of the lease liability. A significant portion of lease payments are fixed, although an immaterial portion of payments are variable in nature. Variable lease payments vary based on changes in facts and circumstances related to the use of the ROU and are recorded as incurred. The Company utilizes its incremental borrowing rate by lease term to calculate the present value of our future lease payments if an implicit rate is not specified. The discount rate is risk adjusted on a secured basis and is the rate at which the Company would be charged to borrow the amount equal to the lease payments over a similar term.
The Company has lease agreements with lease and non-lease components, which are accounted for as a single lease component. The Company applies a portfolio approach to effectively account for the operating lease ROU assets and liabilities.
Operating lease costs for the twelve months ended December 31, 2022, 2021 and 2020 were $17,099, $17,687 and $17,379, respectively, and were included within Cost of Sales and Selling and Administrative expenses. Operating lease costs include short-term and variable leases costs, which were not material during the period.
Future minimum lease payments under non-cancellable leases as of December 31, 2022 were as follows:
| Operating Leases | ||||||||
| 2023 | $ | 10,883 | ||||||
| 2024 | 7,497 | |||||||
| 2025 | 3,405 | |||||||
| 2026 | 1,620 | |||||||
| 2027 | 1,161 | |||||||
| After 2027 | 6,280 | |||||||
| Total lease payments | $ | 30,846 | ||||||
| Less: Interest | 3,509 | |||||||
| Present value of lease payments | $ | 27,337 | ||||||
80
| December 31, | |||||||||||||||||
| Lease Term and Discount Rate | 2022 | 2021 | 2020 | ||||||||||||||
| Weighted-average remaining lease term (years) | |||||||||||||||||
| Operating leases | 5.8 | 5.8 | 5.8 | ||||||||||||||
| Weighted-average discount rates | |||||||||||||||||
| Operating leases | 3.38 | % | 3.01 | % | 3.52 | % | |||||||||||
| Year Ended December 31, | ||||||||||||||||||||
| Other Information | 2022 | 2021 | 2020 | |||||||||||||||||
| Cash paid for amounts included in the measurement of lease liabilities | ||||||||||||||||||||
| Operating cash flows from operating leases | $ | 13,596 | $ | 14,586 | $ | 13,907 | ||||||||||||||
| Leased assets obtained in exchange for new operating lease liabilities | $ | 11,498 | $ | 15,287 | $ | 8,012 | ||||||||||||||
20. Changes in Accumulated Other Comprehensive Income by Component
The following tables set forth the changes in accumulated other comprehensive income by component for the years ended December 31, 2022 and December 31, 2021:
| Gains and Losses on Cash Flow Hedges | Pension and Other Postretirement Benefit Items | Foreign Currency Items | Total | ||||||||||||||||||||
| January 1, 2022 | $ | 160 | $ | (112,307) | $ | (39,691) | $ | (151,838) | |||||||||||||||
| Other comprehensive income (loss) before reclassifications to consolidated statements of income | 6,155 | (6,212) | (78,110) | (78,167) | |||||||||||||||||||
| Amounts reclassified from accumulated other comprehensive income to the consolidated statements of income | (374) | 9,879 | — | 9,505 | |||||||||||||||||||
| Net current-period other comprehensive income (loss) | 5,781 | 3,667 | (78,110) | (68,662) | |||||||||||||||||||
| December 31, 2022 | $ | 5,941 | $ | (108,640) | $ | (117,801) | $ | (220,500) | |||||||||||||||
| Gains and Losses on Cash Flow Hedges | Pension and Other Postretirement Benefit Items | Foreign Currency Items | Total | ||||||||||||||||||||
| January 1, 2021 | $ | (757) | $ | (142,119) | $ | 20,561 | $ | (122,315) | |||||||||||||||
| Other comprehensive income (loss) before reclassifications to consolidated statements of income | 73 | 17,025 | (60,252) | (43,154) | |||||||||||||||||||
| Amounts reclassified from accumulated other comprehensive income to the consolidated statements of income | 844 | 12,787 | — | 13,631 | |||||||||||||||||||
| Net current-period other comprehensive income (loss) | 917 | 29,812 | (60,252) | (29,523) | |||||||||||||||||||
| December 31, 2021 | $ | 160 | $ | (112,307) | $ | (39,691) | $ | (151,838) | |||||||||||||||
81
The following table sets forth the reclassifications out of accumulated other comprehensive income by component for the years ended December 31, 2022 and December 31, 2021:
| Details about Accumulated Other Comprehensive Income Components | Amount Reclassified from Accumulated Other Comprehensive Income | Affected Line Item in the Consolidated Statements of Income | ||||||||||||||||||
| 2022 | 2021 | |||||||||||||||||||
| Gains and losses on cash flow hedges | ||||||||||||||||||||
Interest rate contracts | $ | 647 | $ | (1,846) | Interest expense | |||||||||||||||
Foreign exchange contracts | (152) | 716 | Net sales | |||||||||||||||||
| 495 | (1,130) | Total before tax | ||||||||||||||||||
| (121) | 286 | Tax (expense) benefit | ||||||||||||||||||
| 374 | (844) | Net of tax | ||||||||||||||||||
| Pension and other postretirement benefit items | ||||||||||||||||||||
| Amortization of prior-service costs | $ | (423) | $ | (361) | (A) | |||||||||||||||
| Amortization of actuarial losses | (12,708) | (16,264) | (A) | |||||||||||||||||
| Curtailment (loss)/gain | (450) | 133 | (A) | |||||||||||||||||
| Settlement gain/(loss) | 605 | (205) | (A) | |||||||||||||||||
| (12,976) | (16,697) | Total before tax | ||||||||||||||||||
| 3,097 | 3,910 | Tax benefit | ||||||||||||||||||
| (9,879) | (12,787) | Net of tax | ||||||||||||||||||
| Total reclassifications in the period | $ | (9,505) | $ | (13,631) | ||||||||||||||||
(A) These accumulated other comprehensive income components are included within the computation of net periodic Pension and Other Postretirement Benefits cost. See Note 12.
21. Information on Business Segments
The Company is organized based upon the nature of its products and services and reports under two global business segments: Industrial and Aerospace. Segment information is consistent with how management reviews the businesses, makes investing and resource allocation decisions and assesses operating performance. The Company has not aggregated operating segments for purposes of identifying these two reportable segments.
Industrial is a global provider of highly-engineered, high-quality precision components, products and systems for critical applications serving a diverse customer base in end-markets such as mobility, industrial equipment, automation, personal care, packaging, electronics, and medical devices. Focused on innovative custom solutions, Industrial participates in the design phase of components and assemblies whereby customers receive the benefits of application and systems engineering, new product development, testing and evaluation, and the manufacturing of final products. Products are sold primarily through its direct sales force and global distribution channels. Industrial's Molding Solutions business designs and manufactures customized hot runner systems, advanced mold cavity sensors and process control systems, and precision high cavitation mold assemblies - collectively, the enabling technologies for many complex injection molding applications. The Force & Motion Control business provides innovative cost effective force and motion control solutions for a wide range of sheet metal forming and other industrial markets. The Automation business designs and develops robotic grippers, advanced end-of-arm tooling systems, sensors and other automation components for intelligent robotic handling solutions and industrial automation applications. Industrial's Engineered Components business manufactures and supplies precision mechanical products used in mobility and industrial applications, including mechanical springs, and high-precision punched and fine-blanked components. Effective January 1, 2023, the Company combined Industrial's Force & Motion Control business and Engineered Components business to form a single new strategic business called Motion Control Solutions.
Industrial competes with a broad base of large and small companies engaged in the manufacture and sale of engineered products, precision molds, hot runner systems, robotic handling solutions and precision components. Industrial competes on the
82
basis of quality, service, reliability of supply, engineering and technical capability, geographic reach, product breadth, innovation, design, timeliness and price. Industrial has a global presence in multiple countries, with manufacturing, distribution and assembly operations in the United States, China, Germany, Italy, Sweden and Switzerland, among others. Industrial also has sales and service operations in the United States, China/Hong Kong, Germany, Italy and Switzerland, among others.
Aerospace is a global manufacturer of complex fabricated and precision machined components and assemblies for turbine engines, nacelles and structures for both commercial and defense-related aircraft. The Aerospace Aftermarket business provides aircraft engine component MRO services, including services performed under our Component Repair Programs (“CRPs”), for many of the world’s major turbine engine manufacturers, commercial airlines and the defense market. The Aerospace aftermarket activities also include the manufacture and delivery of aerospace aftermarket spare parts, including revenue sharing programs (“RSPs”) under which the Company receives an exclusive right to supply designated aftermarket parts over the life of specific aircraft engine programs.
Aerospace’s OEM business offers a comprehensive range of in-house manufacturing solutions and capabilities, including components and assemblies. The applications for these components primarily include engines, airframes and nacelles. Aerospace OEM competes with a large number of fabrication and machining companies. Our competitive advantage is based mainly on value derived from quality, concurrent engineering and technical capability, product breadth, solutions-providing new product introduction, timeliness, service, price and intellectual property. Aerospace’s fabrication and machining operations, with facilities in Arizona, Connecticut, Michigan, Ohio, Utah and Singapore, produce critical engine, nacelle and airframe components through technologically advanced manufacturing processes.
The Aerospace Aftermarket business supplements jet engine OEMs’ maintenance, repair and overhaul capabilities, and competes with the service centers of major commercial airlines and other independent service companies for the repair and overhaul of turbine engine components. The manufacture and supply of aerospace aftermarket spare parts, including those related to the RSPs, are dependent upon the reliable and timely delivery of high-quality components. Aerospace’s Aftermarket facilities, located in Connecticut, Ohio and Singapore, specialize in the repair and refurbishment of highly engineered components and assemblies such as cases, rotating life limited parts, rotating air seals, turbine shrouds, vanes and honeycomb air seals. Aerospace Aftermarket's facility in Malaysia is focused on the supply of spare parts.
The Company evaluates the performance of its reportable segments based on the operating profit of the respective businesses, which includes net sales, cost of sales, selling and administrative expenses and certain components of other expense (income), net, as well as the allocation of corporate overhead expenses.
Sales between the business segments and between the geographic areas in which the businesses operate are accounted for on the same basis as sales to unaffiliated customers. Additionally, revenues are attributed to countries based on the location of facilities.
83
The following table (in millions) sets forth summarized financial information by reportable business segment:
| Industrial | Aerospace | Other | Total Company | |||||||||||||||||||||||
| Sales | ||||||||||||||||||||||||||
| 2022 | $ | 832.7 | $ | 429.2 | $ | — | $ | 1,261.9 | ||||||||||||||||||
| 2021 | 896.5 | 362.4 | — | 1,258.8 | ||||||||||||||||||||||
| 2020 | 770.1 | 354.3 | — | 1,124.4 | ||||||||||||||||||||||
Operating profit (loss)(A) | ||||||||||||||||||||||||||
| 2022 | $ | (19.1) | $ | 76.2 | $ | — | $ | 57.1 | ||||||||||||||||||
| 2021 | 97.7 | 52.3 | — | 150.0 | ||||||||||||||||||||||
| 2020 | 66.6 | 56.8 | — | 123.4 | ||||||||||||||||||||||
| Assets | ||||||||||||||||||||||||||
| 2022 | $ | 1,680.4 | $ | 590.6 | $ | 142.7 | $ | 2,413.7 | ||||||||||||||||||
| 2021 | 1,827.9 | 583.0 | 165.9 | 2,576.8 | ||||||||||||||||||||||
| 2020 | 1,908.4 | 623.5 | 144.3 | 2,676.2 | ||||||||||||||||||||||
| Depreciation and amortization | ||||||||||||||||||||||||||
| 2022 | $ | 54.1 | $ | 37.3 | $ | 0.7 | $ | 92.2 | ||||||||||||||||||
| 2021 | 57.5 | 32.8 | 0.9 | 91.1 | ||||||||||||||||||||||
| 2020 | 57.7 | 29.0 | 0.9 | 87.7 | ||||||||||||||||||||||
| Capital expenditures | ||||||||||||||||||||||||||
| 2022 | $ | 19.2 | $ | 14.9 | $ | 1.0 | $ | 35.1 | ||||||||||||||||||
| 2021 | 21.3 | 12.7 | 0.2 | 34.1 | ||||||||||||||||||||||
| 2020 | 19.4 | 20.8 | 0.5 | 40.7 | ||||||||||||||||||||||
(A) Industrial operating losses in the period ended December 31, 2022 include a $68,194 goodwill impairment charge. Assets at Industrial were impacted by a corresponding amount given the reduction to the goodwill balance. See Note 6.
_______________________
Notes:
One customer, General Electric, accounted for 20%, 16% and 17% of the Company’s total revenues in 2022, 2021 and 2020, respectively.
“Other” assets include corporate-controlled assets, the majority of which are cash and cash equivalents and deferred tax assets.
A reconciliation of the total reportable segments’ operating profit to income before income taxes follows (in millions):
| 2022 | 2021 | 2020 | ||||||||||||||||||
| Operating profit | $ | 57.1 | $ | 150.0 | $ | 123.4 | ||||||||||||||
| Interest expense | 14.6 | 16.2 | 15.9 | |||||||||||||||||
| Other expense (income), net | 4.3 | 6.0 | 5.9 | |||||||||||||||||
| Income before income taxes | $ | 38.2 | $ | 127.8 | $ | 101.5 | ||||||||||||||
84
The following table (in millions) summarizes total net sales and long-lived assets of the Company by geographic area:
| Domestic | International | Other | Total Company | |||||||||||||||||||||||
| Sales | ||||||||||||||||||||||||||
| 2022 | $ | 545.2 | $ | 806.8 | $ | (90.2) | $ | 1,261.9 | ||||||||||||||||||
| 2021 | 516.4 | 829.4 | (87.0) | 1,258.8 | ||||||||||||||||||||||
| 2020 | 483.8 | 714.0 | (73.4) | 1,124.4 | ||||||||||||||||||||||
| Long-lived assets | ||||||||||||||||||||||||||
| 2022 | $ | 360.2 | $ | 1,303.2 | $ | — | $ | 1,663.4 | ||||||||||||||||||
| 2021 | 380.7 | 1,493.9 | — | 1,874.6 | ||||||||||||||||||||||
| 2020 | 383.2 | 1,628.6 | — | 2,011.8 | ||||||||||||||||||||||
________________________
Notes: Germany, with sales of $204.3 million, $243.1 million and $223.3 million in 2022, 2021 and 2020, respectively, and Singapore, with sales of $144.9 million, $136.8 million and $129.8 million in 2022, 2021 and 2020, respectively, represent the only international countries with revenues in excess of 10% of the Company's total revenues in those years. “Other” revenues represent the elimination of inter-company sales between geographic locations, of which approximately 78%, 78% and 67% were sales from international locations to domestic locations in 2022, 2021 and 2020, respectively.
Germany, with long-lived assets of $388.2 million, $428.9 million and $481.5 million as of December 31, 2022, 2021 and 2020, respectively, Singapore, with long-lived assets of $196.7 million, $201.6 million and $214.8 million as of December 31, 2022, 2021 and 2020, respectively and Italy, with long-lived assets of $300.4 million, $398.2 million and $443.1 million as of December 31, 2022, 2021 and 2020, respectively, represent the international countries with long-lived assets that exceeded 10% of the Company's total long-lived assets in those years.
22. Commitments and Contingencies
Product Warranties
The Company provides product warranties in connection with the sale of certain products. From time to time, the Company is subject to customer claims with respect to product warranties. The Company accrues its estimated exposure for warranty claims at the time of sale based upon the length of the warranty period, historical experience and other related information known to the Company. Liabilities related to product warranties and extended warranties were not material as of December 31, 2022 or 2021.
In July 2021, a customer asserted breach of contract and contractual warranty claims regarding a part manufactured by the Company. While the Company disputes the asserted claims, the Company and the customer are in discussions seeking to resolve the matter. No litigation or other proceeding has been initiated. While it is currently not possible to determine the ultimate outcome of this matter, the Company intends to vigorously defend its position and believes that the ultimate resolution will not have a material adverse effect on the Company’s consolidated financial position or liquidity, but could be material to the consolidated results of operations of any one period.
Litigation
The Company is subject to litigation from time to time in the ordinary course of business and various other suits, proceedings and claims are pending involving the Company and its subsidiaries. The Company records a loss contingency liability when a loss is considered probable and the amount can be reasonably estimated. While it is not possible to determine the ultimate disposition of each of these proceedings and whether they will be resolved consistent with the Company's beliefs, the Company expects that the outcome of such proceedings, individually or in the aggregate, will not have a material adverse effect on financial condition or results of operations.
85
Report of Independent Registered Public Accounting Firm
To the Board of Directors and Stockholders of Barnes Group Inc.
Opinions on the Financial Statements and Internal Control over Financial Reporting
We have audited the accompanying consolidated balance sheets of Barnes Group Inc. and its subsidiaries (the “Company”) as of December 31, 2022 and 2021, and the related consolidated statements of income, of comprehensive (loss) income, of changes in stockholders’ equity and of cash flows for each of the three years in the period ended December 31, 2022, including the related notes and schedule of valuation and qualifying accounts for each of the three years in the period ended December 31, 2022 appearing under Item 15(c) (collectively referred to as the “consolidated financial statements”). We also have audited the Company's internal control over financial reporting as of December 31, 2022, based on criteria established in Internal Control - Integrated Framework (2013) issued by the Committee of Sponsoring Organizations of the Treadway Commission (COSO).
In our opinion, the consolidated financial statements referred to above present fairly, in all material respects, the financial position of the Company as of December 31, 2022 and 2021, and the results of its operations and its cash flows for each of the three years in the period ended December 31, 2022 in conformity with accounting principles generally accepted in the United States of America. Also in our opinion, the Company maintained, in all material respects, effective internal control over financial reporting as of December 31, 2022, based on criteria established in Internal Control - Integrated Framework (2013) issued by the COSO.
Basis for Opinions
The Company's management is responsible for these consolidated financial statements, for maintaining effective internal control over financial reporting, and for its assessment of the effectiveness of internal control over financial reporting, included in Management’s Report on Internal Control over Financial Reporting appearing under Item 9A. Our responsibility is to express opinions on the Company’s consolidated financial statements and on the Company's internal control over financial reporting based on our audits. We are a public accounting firm registered with the Public Company Accounting Oversight Board (United States) (PCAOB) and are required to be independent with respect to the Company in accordance with the U.S. federal securities laws and the applicable rules and regulations of the Securities and Exchange Commission and the PCAOB.
We conducted our audits in accordance with the standards of the PCAOB. Those standards require that we plan and perform the audits to obtain reasonable assurance about whether the consolidated financial statements are free of material misstatement, whether due to error or fraud, and whether effective internal control over financial reporting was maintained in all material respects.
Our audits of the consolidated financial statements included performing procedures to assess the risks of material misstatement of the consolidated financial statements, whether due to error or fraud, and performing procedures that respond to those risks. Such procedures included examining, on a test basis, evidence regarding the amounts and disclosures in the consolidated financial statements. Our audits also included evaluating the accounting principles used and significant estimates made by management, as well as evaluating the overall presentation of the consolidated financial statements. Our audit of internal control over financial reporting included obtaining an understanding of internal control over financial reporting, assessing the risk that a material weakness exists, and testing and evaluating the design and operating effectiveness of internal control based on the assessed risk. Our audits also included performing such other procedures as we considered necessary in the circumstances. We believe that our audits provide a reasonable basis for our opinions.
Definition and Limitations of Internal Control over Financial Reporting
A company’s internal control over financial reporting is a process designed to provide reasonable assurance regarding the reliability of financial reporting and the preparation of financial statements for external purposes in accordance with generally accepted accounting principles. A company’s internal control over financial reporting includes those policies and procedures that (i) pertain to the maintenance of records that, in reasonable detail, accurately and fairly reflect the transactions and dispositions of the assets of the company; (ii) provide reasonable assurance that transactions are recorded as necessary to permit preparation of financial statements in accordance with generally accepted accounting principles, and that receipts and expenditures of the company are being made only in accordance with authorizations of management and directors of the company; and (iii) provide reasonable assurance regarding prevention or timely detection of unauthorized acquisition, use, or disposition of the company’s assets that could have a material effect on the financial statements.
Because of its inherent limitations, internal control over financial reporting may not prevent or detect misstatements. Also, projections of any evaluation of effectiveness to future periods are subject to the risk that controls may become inadequate because of changes in conditions, or that the degree of compliance with the policies or procedures may deteriorate.
86
Critical Audit Matters
The critical audit matter communicated below is a matter arising from the current period audit of the consolidated financial statements that was communicated or required to be communicated to the audit committee and that (i) relates to accounts or disclosures that are material to the consolidated financial statements and (ii) involved our especially challenging, subjective, or complex judgments. The communication of critical audit matters does not alter in any way our opinion on the consolidated financial statements, taken as a whole, and we are not, by communicating the critical audit matter below, providing a separate opinion on the critical audit matter or on the accounts or disclosures to which it relates.
Goodwill Impairment Assessments – Automation Reporting Unit
As described in Notes 1 and 6 to the consolidated financial statements, the Company’s consolidated goodwill balance was $835.5 million as of December 31, 2022, of which a portion related to the Automation reporting unit within the Industrial reportable segment. Goodwill is subject to impairment testing on an annual basis, in the second quarter, or more frequently if an event or change in circumstances indicates that the fair value of a reporting unit has been reduced below its carrying value. Management utilizes the option to first assess qualitative factors to determine whether it is necessary to perform the Step 1 quantitative goodwill impairment test. If management determines that the Step 1 quantitative impairment test is required, management estimates the fair value of the reporting unit primarily using the income approach, which reflects management’s cash flow projections. Inherent in management’s development of cash flow projections are assumptions and estimates, including those related to future earnings, growth rates, and the weighted average cost of capital. Based on management’s annual assessment as of April 1, the estimated fair value of the Automation reporting unit exceeded its carrying value. Subsequently, management evaluated deteriorating macro-economic conditions that materialized during the second quarter of 2022, which resulted in a triggering event. During the three month period ended June 30, 2022, management revised its cash flow projections and weighted average cost of capital, resulting in a non-cash goodwill impairment charge of $68.2 million related to the Automation reporting unit as the estimated fair value of the reporting unit declined below its carrying value. Further, management evaluated the significant increase in interest rates and further deteriorating macro-economic conditions that materialized during the fourth quarter of 2022, resulting in a triggering event at the Automation reporting unit. Management performed a Step 1 quantitative assessment as of December 31, 2022 and concluded that there was no additional goodwill impairment.
The principal considerations for our determination that performing procedures relating to the goodwill impairment assessments of the Automation reporting unit is a critical audit matter are (i) the significant judgment by management when developing the fair value estimates of the Automation reporting unit; (ii) a high degree of auditor judgment , subjectivity , and effort in performing procedures and evaluating management’s significant assumptions related to future earnings, growth rates, and the weighted average cost of capital; and (iii) the audit effort involved the use of professionals with specialized skill and knowledge.
Addressing the matter involved performing procedures and evaluating audit evidence in connection with forming our overall opinion on the consolidated financial statements. These procedures included testing the effectiveness of controls relating to management’s goodwill impairment assessments, including controls over the valuation of the Automation reporting unit. These procedures also included, among others (i) testing management’s process for developing the fair value estimates of the Automation reporting unit; (ii) evaluating the appropriateness of the income approach; (iii) testing the completeness and accuracy of the underlying data used in the income approach; and (iv) evaluating the reasonableness of the significant assumptions used by management related to future earnings, growth rates, and the weighted average cost of capital. Evaluating management’s significant assumptions related to future earnings and growth rates involved evaluating whether the assumptions used by management were reasonable considering (i) the current and past performance of the Automation reporting unit; (ii) the consistency with external market and industry data; and (iii) whether these assumptions were consistent with evidence obtained in other areas of the audit. Professionals with specialized skill and knowledge were used to assist in evaluating (i) the appropriateness of the income approach and (ii) the reasonableness of the weighted average cost of capital significant assumption.
/s/ PricewaterhouseCoopers LLP
Hartford, Connecticut
February 21, 2023
We have served as the Company’s auditor since 1994.
87
Item 9. Changes in and Disagreements with Accountants on Accounting and Financial Disclosure
None.
Item 9A. Controls and Procedures
Disclosure Controls and Procedures
Management, including the Company’s President and Chief Executive Officer and Chief Financial Officer, has evaluated the effectiveness of the design and operation of the Company’s disclosure controls and procedures as of the end of the period covered by this report. Based upon, and as of the date of, that evaluation, the President and Chief Executive Officer and Chief Financial Officer concluded that the disclosure controls and procedures were effective, in all material respects, and designed to provide reasonable assurance that the information required to be disclosed in the reports the Company files and submits under the Securities Exchange Act of 1934 (the “Exchange Act”), as amended, is (i) recorded, processed, summarized and reported as and when required and (ii) is accumulated and communicated to the Company’s management, including our President and Chief Executive Officer and Chief Financial Officer, as appropriate to allow timely decisions regarding required disclosure.
Management’s Report on Internal Control Over Financial Reporting
Management is responsible for establishing and maintaining adequate internal control over financial reporting, as such term is defined in Exchange Act Rule 13a-15(f). Under the supervision and with the participation of management, including the President and Chief Executive Officer and Chief Financial Officer, the Company conducted an assessment of the effectiveness of its internal control over financial reporting based on the framework in the “Internal Control - Integrated Framework 2013” issued by the Committee of Sponsoring Organizations of the Treadway Commission. Based on the assessment under this framework, management concluded that the Company’s internal control over financial reporting was effective, in all material respects, as of December 31, 2022.
PricewaterhouseCoopers LLP, the independent registered public accounting firm that audited the financial statements included in this Annual Report, has issued an attestation report on the Company’s internal control over financial reporting as of December 31, 2022, which appears within Item 8 of this Annual Report on Form 10-K.
Changes in Internal Control Over Financial Reporting
There has been no change to our internal control over financial reporting during the Company’s fourth fiscal quarter that has materially affected, or is reasonably likely to materially affect, our internal control over financial reporting.
Item 9B. Other Information
None.
Item 9C. Disclosure Regarding Foreign Jurisdictions that Prevent Inspections
Not Applicable.
88
PART III
Item 10. Directors, Executive Officers and Corporate Governance
Information with respect to our directors, corporate governance and other information required by this Item 10 may be found in the “Governance” and “Stock Ownership” sections of our definitive proxy statement to be delivered to stockholders in connection with the Annual Meeting of Stockholders to be held on May 5, 2023 (the “Proxy Statement”). Such information is incorporated herein by reference.
EXECUTIVE OFFICERS
The Company’s executive officers as of the date of this Annual Report are as follows:
| Name | Position | Age as of December 31, 2022 | ||||||
| Thomas J. Hook | President and Chief Executive Officer | 60 | ||||||
| Dawn N. Edwards | Senior Vice President, Human Resources | 54 | ||||||
| Lukas Hovorka | Senior Vice President, Corporate Development | 50 | ||||||
| Jay B. Knoll | Senior Vice President, General Counsel and Secretary | 59 | ||||||
| Stephen G. Moule | Senior Vice President, Barnes, and President, Barnes Industrial | 50 | ||||||
| Ian M. Reason | Senior Vice President, Barnes, and President, Barnes Aerospace | 58 | ||||||
| Julie K. Streich | Senior Vice President, Finance and Chief Financial Officer | 52 | ||||||
Each officer holds office until his or her successor is appointed and qualified or otherwise as provided in the Company’s Amended and Restated By-Laws. No family relationships exist among the executive officers of the Company. Of the Company’s executive officers, Ms. Edwards and Mr. Hovorka have been employed by the Company or its subsidiaries in an executive or managerial capacity for at least the past five years. There are no arrangements or understandings with any other person under which any executive officer was selected as an officer.
Mr. Hook was appointed President and Chief Executive Officer effective July 14, 2022 and has been a member of the Barnes Board of Directors since 2016. From February 2021 to July 2022, Mr. Hook served as Chief Executive Officer of SaniSure, Inc. and as a director of SaniSure, Inc. from December 2019 to July 2022. Prior to that, he was the Chief Executive Officer of Q Holding Company from September 2017 to January 2021. Prior to that, he was the Chief Executive Officer of Integer (formerly, Greatbatch) from August 2006 to May 2017, after having served as its Chief Operating Officer from September 2004 to August 2006. Earlier in his career, Mr. Hook held various positions of increasing responsibility with CTI Molecular Imaging, General Electric Medical Systems, Van Owen Group Acquisition Company, and Duracell, Inc. Mr. Hook is currently a director of NeuroNexus Inc.
Ms. Edwards was appointed Senior Vice President, Human Resources effective August 2009. From December 2008 until August 2009, she served as Vice President of Human Resources - Global Operations. From September 1998 until December 2008, Ms. Edwards served as Group Director, Human Resources for Barnes Aerospace, Associated Spring and Barnes Industrial. Ms. Edwards joined the Company in September 1998.
Mr. Hovorka was appointed Senior Vice President, Corporate Development effective March 1, 2021. He joined the Company in 2008 as Director, Corporate Development, and served as the Company's Vice President, Corporate Development prior to his current appointment. Prior to joining the Company, Mr. Hovorka held the position of Director/Vice President, Corporate Development with ITOCHU International Inc. and, before that, held roles with both Robertson Stephens and Goldman Sachs.
Mr. Knoll was appointed Senior Vice President, General Counsel and Secretary effective January 1, 2023. Mr. Knoll came to Barnes with over 15 years of General Counsel experience with global, diversified industrial and technology companies.
89
Prior to joining the Company, Mr. Knoll served in roles of increasing responsibility for Rogers Corporation since 2014, most recently as Senior Vice President, Corporate Development, General Counsel and Chief Sustainability Officer.
Mr. Moule was appointed Senior Vice President, Barnes, and President, Barnes Industrial effective December 1, 2019. Before joining the Company, Mr. Moule was President, Americas at Gilbarco Veeder-Root (GVR), a $1.1B operating unit within the Fortive Corporation. Mr. Moule joined GVR in 2007 and held various positions of increasing responsibility including President, North America, as well as Managing Director, United Kingdom; Managing Director, Europe; President Europe & CIS; and President, Europe, Middle East & Africa, all based in London, England.
Mr. Reason was appointed Senior Vice President, Barnes and President, Barnes Aerospace effective May 2, 2022. Prior to joining the Company, Mr. Reason served as President, Mechanical Solutions, Interiors & Structures with the Triumph Group, a $1.8B aviation and industrial company. Prior to joining the Triumph Group in 2016, Mr. Reason held positions of increasing responsibility at BAE Systems from 2004 to 2016 including Vice President, F-35 Customer Engagement and U.S. General Manager; and Vice President, Business Development & Strategy.
Ms. Streich was appointed Senior Vice President, Finance and Chief Financial Officer effective May 3, 2021. Prior to joining the Company, Ms. Streich served in various roles at Centrica PLC from 2012 through 2020. Ms. Streich served as Centrica PLC’s Senior Vice President, Head of Finance Operations from 2019 to 2020, as Vice President, Group Head of Global Planning and Analytics from 2017 to 2019, and as Chief Financial Officer of its Direct Energy Home business from 2016 to 2017. Prior to joining Centrica in 2012, Ms. Streich held finance positions of increasing responsibility with Pentair Process Technologies, Irwin Financial Corporation, Eagle Materials, MeadWestvaco, and Menasha Corporation.
Items 11-14.
The information called for by Items 11-14 is incorporated by reference to the "Governance," "Stock Ownership," "Executive Compensation," "Director Compensation in 2022," "Securities Authorized for Issuance Under Equity Compensation Plans," "Related Person Transactions," and "Principal Accountant Fees and Services" sections in our Proxy Statement.
90
PART IV
Item 15. Exhibits, Financial Statement Schedule
| (a)(1) | The following Financial Statements and Supplementary Data of the Company are set forth herein under Item 8 of this Annual Report: | |||||||
Report of Independent Registered Public Accounting Firm (PCAOB ID No. 238) | ||||||||
| (a)(2) | See Financial Statement Schedule under Item 15(c). | |||||||
| (a)(3) | See Item 15(b) below. | |||||||
| (b) | The Exhibits required by Item 601 of Regulation S-K are filed within the Exhibit Index of this Annual Report, which is incorporated herein by reference. | |||||||
| (c) | Financial Statement Schedule. | |||||||
Item 16. Form 10-K Summary
None
91
Schedule II—Valuation and Qualifying Accounts
Years Ended December 31, 2022, 2021 and 2020
(In thousands)
| Allowances for Credit Losses: | |||||
| Balance January 1, 2020 | $ | 5,197 | |||
| Provision charged to income | 1,200 | ||||
| Doubtful accounts written off | (417) | ||||
Other adjustments(1) | 368 | ||||
| Balance December 31, 2020 | 6,348 | ||||
| Provision charged to income | (11) | ||||
| Doubtful accounts written off | (562) | ||||
Other adjustments(1) | (150) | ||||
| Balance December 31, 2021 | 5,625 | ||||
| Provision charged to income | 131 | ||||
| Doubtful accounts written off | (178) | ||||
Other adjustments(1) | (356) | ||||
| Balance December 31, 2022 | $ | 5,222 | |||
________________
(1)These amounts are comprised primarily of foreign currency translation and other reclassifications.
92
Schedule II—Valuation and Qualifying Accounts
Years Ended December 31, 2022, 2021 and 2020
(In thousands)
| Valuation Allowance on Deferred Tax Assets: | |||||
| Balance January 1, 2020 | $ | 3,592 | |||
| Additions charged to income tax expense | 743 | ||||
| Reductions charged to other comprehensive income | 24 | ||||
| Reductions credited to income tax expense | (600) | ||||
| Changes due to foreign currency translation | (2) | ||||
| Balance December 31, 2020 | 3,757 | ||||
| Additions charged to income tax expense | 346 | ||||
| Reductions charged to other comprehensive income | (15) | ||||
| Reductions credited to income tax expense | (241) | ||||
| Changes due to foreign currency translation | 22 | ||||
| Balance December 31, 2021 | 3,869 | ||||
| Additions charged to income tax expense | 2,763 | ||||
| Reductions charged to other comprehensive income | (41) | ||||
| Reductions credited to income tax expense | (59) | ||||
| Changes due to foreign currency translation | (76) | ||||
| Balance December 31, 2022 | $ | 6,456 | |||
________________
93
SIGNATURES
Pursuant to the requirements of Section 13 or 15(d) of the Securities Exchange Act of 1934, the Company has duly caused this report to be signed on its behalf by the undersigned, thereunto duly authorized.
| Date: | February 21, 2023 | ||||||||||||||||
| BARNES GROUP INC. | |||||||||||||||||
| By | /S/ THOMAS J. HOOK | ||||||||||||||||
| Thomas J. Hook | |||||||||||||||||
| President and Chief Executive Officer | |||||||||||||||||
Pursuant to the requirements of the Securities Exchange Act of 1934, this report has been signed below as of the above date by the following persons on behalf of the Company in the capacities indicated.
| /S/ THOMAS J. HOOK | ||
| Thomas J. Hook | ||
| President and Chief Executive Officer | ||
| (Principal Executive Officer), and Director | ||
| /S/ JULIE K. STREICH | ||
| Julie K. Streich | ||
| Senior Vice President, Finance and | ||
| Chief Financial Officer | ||
| (Principal Financial Officer) | ||
| /S/ MARIAN ACKER | ||
| Marian Acker | ||
| Vice President, Controller | ||
| (Principal Accounting Officer) | ||
94
| /S/ THOMAS O. BARNES | ||
| Thomas O. Barnes | ||
| Director | ||
| /S/ ELIJAH K. BARNES | ||
| Elijah K. Barnes | ||
| Director | ||
| /S/ JAKKI L. HAUSSLER | ||
| Jakki L. Haussler | ||
| Director | ||
| /S/ RICHARD J. HIPPLE | ||
| Richard J. Hipple | ||
| Director | ||
| /S/ DAPHNE E. JONES | ||
| Daphne E. Jones | ||
| Director | ||
| /S/ NEAL J. KEATING | ||
| Neal J. Keating | ||
| Director | ||
| /S/ MYLLE H. MANGUM | ||
| Mylle H. Mangum | ||
| Director | ||
| /S/ HANS-PETER MÄNNER | ||
| Hans-Peter Männer | ||
| Director | ||
| /S/ ANTHONY V. NICOLOSI | ||
| Anthony V. Nicolosi | ||
| Director | ||
| /S/ JOANNA L. SOHOVICH | ||
| JoAnna L. Sohovich | ||
| Director | ||
95
EXHIBIT INDEX
Barnes Group Inc.
Annual Report on Form 10-K
for the Year ended December 31, 2022
| Exhibit No. | Description | Reference | ||||||
2.1* | Sale and Purchase Agreement, dated as of September 19, 2018, between Barnes GTE S.r.l., the Company and AGIC Gripper (Netherlands) B.V., HDX S.À.R.L., Asia-Germany Industry 4.0 Promotion Cross-Border Fund I L.P., Xenon Private Equity V Limited Partnership and certain other sellers named therein. | |||||||
| 3.1 | Restated Certificate of Incorporation; Certificate of Designation, Preferences and Rights of Series A Junior Participating Preferred Stock; Certificate of Change of Location of registered office and of registered agent, dated December 13, 2002; Certificate of Merger of domestic limited liability company into a domestic company, dated May 19, 2004; Certificate of Amendment of Restated Certificate of Incorporation, dated April 20, 2006; and Certificate of Amendment of Restated Certificate of Incorporation, dated as of May 3, 2013. | |||||||
| 3.2 | Amended and Restated By-Laws as of July 28, 2016. | |||||||
| 4.1 | Description of Securities. | |||||||
| 10.1 | (i) Fifth Amended and Restated Senior Unsecured Revolving Credit Agreement, dated September 27, 2011. | |||||||
| (ii) Amendment No. 2 and Joinder to Credit Agreement dated as of September 27, 2013 (amending Fifth Amended and Restated Senior Unsecured Revolving Credit Agreement, dated as of September 27, 2011). | ||||||||
| (iii) Amendment No. 3 to Credit Agreement dated as of October 15, 2014. | ||||||||
| (iv) Amendment No. 4 to Credit Agreement dated as of February 2, 2017. | ||||||||
| (v) Amendment No. 5 to Credit Agreement dated as of October 19, 2018. | ||||||||
| (vi) Amendment No. 6 to Credit Agreement dated as of October 8, 2020. | ||||||||
(vii) Sixth Amended and Restated Senior Unsecured Revolving Credit Agreement, dated as of February 10, 2021. | ||||||||
| (viii) LIBOR Transition Amendment, dated as of October 11, 2021. | ||||||||
96
| (ix) Amendment No. 1 to Sixth Amended and Restated Senior Unsecured Revolving Credit Agreement, dated as of April 6, 2022. | ||||||||
| 10.2 | (i) Note Purchase Agreement, dated as of October 15, 2014, among the Company and New York Life Insurance Company, New York Life Insurance and Annuity Corporation and New York Life Insurance and Annuity Corporation Institutionally Owned Life Insurance Separate Account (BOLI 30C). | |||||||
| (ii) First Amendment to Note Purchase Agreement, dated as of October 8, 2020. | ||||||||
10.3** | (i) Barnes Group Inc. Management Incentive Compensation Plan, amended December 28, 2018. | |||||||
| Filed with this report. | ||||||||
| 10.4** | (i) Offer Letter, dated as of June 18, 2022, by and between Barnes Group Inc. and Thomas J. Hook. | |||||||
| (ii) Employee Non-Disclosure, Non-Competition, Non-Solicitation and Non-Disparagement Agreement, dated as of June 18, 2022, by and between Barnes Group Inc. and Thomas J. Hook. | ||||||||
| (iii) Barnes Group Inc. Inducement Stock Option Award Summary of Grant and Inducement Stock Option Award Agreement dated July 14, 2022. | ||||||||
10.5** | Offer Letter to Julie K. Streich, dated April 20, 2021. | |||||||
10.6** | Offer Letter to Stephen Moule, dated October 24, 2019. | |||||||
| (ii) Covenant Agreement and Release of Claims. | ||||||||
10.7** | Offer Letter to Ian Reason, dated March 17, 2022. | |||||||
10.8** | Offer Letter to Lukas Hovorka, dated February 12, 2021. | |||||||
| 10.9** | Filed with this report. | |||||||
10.10** | (i) Offer Letter between the Company and Patrick Dempsey, dated February 22, 2013. | |||||||
(ii) Amendment to Offer Letter to Patrick Dempsey, dated January 6, 2015. | ||||||||
97
(iii) Employee Non-Disclosure, Non-Competition, Non-Solicitation and Non-Disparagement Agreement between the Company and Patrick J. Dempsey, dated February 27, 2013. | ||||||||
| (iv) Transition and Retirement Agreement, dated as of June 18, 2022, by and between Barnes Group Inc. and Patrick J. Dempsey. | ||||||||
10.11** | (i) Offer Letter to Michael A. Beck, dated January 28, 2016. | |||||||
10.12** | Offer Letter to Patrick T. Hurley, dated January 4, 2019. | |||||||
10.13** | Offer Letter to James C. Pelletier, dated February 14, 2020. | |||||||
10.14** | (i) Barnes Group Inc. Retirement Benefit Equalization Plan, as amended and restated effective January 1, 2013. | |||||||
| (ii) First Amendment to the Barnes Group Inc. Retirement Benefit Equalization Plan dated December 12, 2014. | ||||||||
10.15** | (i) Barnes Group Inc. Supplemental Senior Officer Retirement Plan, as amended and restated effective January 1, 2009. | |||||||
| (ii) Amendment to the Barnes Group Inc. Supplemental Senior Officer Retirement Plan. | ||||||||
| (iii) Second Amendment to the Barnes Group Inc. Supplemental Senior Officer Retirement Plan dated December 12, 2014. | ||||||||
10.16** | (i) Amended and Restated Supplemental Executive Retirement Plan effective April 1, 2012. | |||||||
| (ii) Amendment 2013-1 to the Barnes Group Inc. Supplemental Executive Retirement Plan dated July 23, 2013. | ||||||||
| (iii) Amendment 2014-1 to the Barnes Group Inc. Supplemental Executive Retirement Plan dated December 12, 2014. | ||||||||
10.17** | Barnes Group Inc. Senior Executive Enhanced Life Insurance Program, as amended and restated effective April 1, 2011. | |||||||
10.18** | Barnes Group Inc. Enhanced Life Insurance Program, as amended and restated effective April 1, 2011. | |||||||
98
10.19** | Barnes Group Inc. Executive Group Term Life Insurance Program effective April 1, 2011. | |||||||
10.20** | Form of Barnes Group Inc. Executive Officer Severance Agreement, as amended March 31, 2010. | |||||||
10.21** | Form of Barnes Group Inc. Executive Officer Severance Agreement, effective February 19, 2014. | |||||||
10.22** | Barnes Group Inc. Executive Separation Pay Plan, as amended and restated effective January 1, 2012. | |||||||
10.23** | Barnes Group Inc. Executive Separation Pay plan, as amended and restated effective March 7, 2019. | |||||||
10.24** | (i) Trust Agreement between the Company and Fidelity Management Trust Company (Barnes Group 2009 Deferred Compensation Plan) dated September 1, 2009. | |||||||
| (ii) Amended and Restated Barnes Group 2009 Deferred Compensation Plan effective as of April 1, 2012. | ||||||||
| (iii) First Amendment to the Barnes Group 2009 Deferred Compensation Plan dated December 12, 2014. | ||||||||
10.25** | Barnes Group Inc. Non-Employee Director Deferred Stock Plan, as amended and restated December 31, 2008. | |||||||
10.26** | Barnes Group Inc. Directors’ Deferred Compensation Plan, as amended and restated December 31, 2008. | |||||||
10.27** | Barnes Group Inc. Trust Agreement for Specified Plans. | |||||||
10.28** | Form of Incentive Compensation Reimbursement Agreement between the Company and certain Officers. | Incorporated by reference to Exhibit 10.23 to the Company’s report on Form 10-K (Commission file number 0001-04801) for the year ended December 31, 2016. | ||||||
10.29** | Form of Indemnification Agreement between the Company and its Officers and Directors. | Incorporated by reference to Exhibit 10.24 to the Company’s report on Form 10-K (Commission file number 0001-04801) for the year ended December 31, 2016. | ||||||
10.30** | (i) Barnes Group Inc. Stock and Incentive Award Plan, as amended March 15, 2010. | Incorporated by reference to Exhibit 10.25(ii) to the Company’s report on Form 10-K (Commission file number 0001-04801) for the year ended December 31, 2016. | ||||||
| (ii) Exercise of Authority Relating to the Stock and Incentive Award Plan, dated March 3, 2009. | Incorporated by reference to Exhibit 10.25(iii) to the Company’s report on Form 10-K (Commission file number 0001-04801) for the year ended December 31, 2016. | |||||||
99
| (iii) Amendment 2010-1 approved on December 9, 2010 to the Barnes Group Inc. Stock and Incentive Award Plan as amended March 15, 2010. | Incorporated by reference to Exhibit 10.25(iv) to the Company’s report on Form 10-K (Commission file number 0001-04801) for the year ended December 31, 2016. | |||||||
10.31** | 2014 Barnes Group Inc. Stock and Incentive Award Plan. | |||||||
10.32** | Form of Barnes Group Inc. Stock and Incentive Award Plan Restricted Stock Unit Summary of Grant and Restricted Stock Unit Agreement for US Directors dated February 7, 2017 (for non-management directors). | |||||||
10.33** | Form of Barnes Group Inc. Stock and Incentive Award Plan Restricted Stock Unit Summary of Grant and Restricted Stock Unit Agreement for non-US Directors dated October 13, 2016 (for non-management directors). | |||||||
10.34** | Form of Barnes Group Inc. Stock and Incentive Award Plan Stock Option Summary of Grant and Stock Option Agreement for Employees in Grade 21 and up dated as of February 8, 2011. | |||||||
10.35** | Form of Barnes Group Inc. Stock and Incentive Award Plan Stock Option Summary of Grant and Stock Option Agreement for Employees in Grade 21 and up dated May 9, 2014. | |||||||
10.36** | Form of Barnes Group Inc. Stock and Incentive Award Plan Stock Option Summary of Grant and Stock Option Agreement for Employees in Grade 21 and up dated February 9, 2016. | |||||||
10.37** | Form of Barnes Group Inc. Stock and Incentive Award Plan Restricted Stock Unit Summary of Grant for Employees and Restricted Stock Unit Agreement dated February 9, 2016. | |||||||
10.38** | Form of Barnes Group Inc. Stock and Incentive Award Plan Performance Share Award Summary of Grant and Performance Share Award Agreement for Officers and Other Individuals as Designated by the Compensation and Management Development Committee dated as of February 13, 2019. | |||||||
10.39** | Form of Barnes Group Inc. Stock and Incentive Award Plan Performance Share Award Summary of Grant and Performance Share Award Agreement for Officers and Other Individuals as Designated by the Compensation and Management Development Committee dated as of February 13, 2020. | |||||||
10.40** | Form of Barnes Group Inc. Stock and Incentive Award Plan Performance Share Award Summary of Grant and Performance Share Award Agreement for Officers and Other Individuals as Designated by the Compensation and Management Development Committee dated as of February 11, 2021. | |||||||
10.41** | Performance-Linked Bonus Plan for Selected Executive Officers approved by Shareholders on May 6, 2016. | Incorporated by reference to Exhibit 10.42 to the Company’s report on Form 10-K (Commission file number 0001-04801) for the year ended December 31, 2016. | ||||||
| 21 | Filed with this report. | |||||||
| 23 | Filed with this report. | |||||||
100
| 31.1 | Filed with this report. | |||||||
| 31.2 | Filed with this report. | |||||||
| 32 | Furnished with this report. | |||||||
| 101.INS | XBRL Instance Document. | Filed with this report. | ||||||
| 101.SCH | XBRL Taxonomy Extension Schema Document. | Filed with this report. | ||||||
| 101.CAL | XBRL Taxonomy Extension Calculation Linkbase Document. | Filed with this report. | ||||||
| 101.DEF | XBRL Taxonomy Extension Definition Linkbase Document. | Filed with this report. | ||||||
| 101.LAB | XBRL Taxonomy Extension Label Linkbase Document. | Filed with this report. | ||||||
| 101.PRE | XBRL Taxonomy Extension Presentation Linkbase Document. | Filed with this report. | ||||||
_________________________
* The Company hereby agrees to provide the Commission upon request copies of any omitted exhibits or schedules to this exhibit required by Item 601(b)(2) of Regulation S-K.
** Management contract or compensatory plan or arrangement.
101
Similar companies
See also Parker-Hannifin Corp - Annual report 2023 (10-K 2023-06-30) Annual report 2023 (10-Q 2023-09-30)See also Crane NXT, Co. - Annual report 2022 (10-K 2022-12-31) Annual report 2023 (10-Q 2023-09-30)
See also WATTS WATER TECHNOLOGIES INC - Annual report 2022 (10-K 2022-12-31) Annual report 2025 (10-Q 2025-06-29)
See also Mueller Water Products, Inc. - Annual report 2022 (10-K 2022-09-30) Annual report 2023 (10-Q 2023-06-30)
See also HELIOS TECHNOLOGIES, INC. - Annual report 2022 (10-K 2022-12-31) Annual report 2023 (10-Q 2023-09-30)