BGC Group, Inc. - Annual Report: 2017 (Form 10-K)
UNITED STATES
SECURITIES AND EXCHANGE COMMISSION
Washington, D.C. 20549
FORM 10-K
FOR ANNUAL AND TRANSITION REPORTS PURSUANT TO SECTION 13 OR 15(d)
OF THE SECURITIES EXCHANGE ACT OF 1934
(Mark One)
|
☒ |
ANNUAL REPORT PURSUANT TO SECTION 13 OR 15(d) OF THE SECURITIES EXCHANGE ACT OF 1934 |
For the fiscal year ended December 31, 2017
OR
|
☐ |
TRANSITION REPORT PURSUANT TO SECTION 13 OR 15(d) OF THE SECURITIES EXCHANGE ACT OF 1934 |
For the transition period from to
Commission File Numbers: 0-28191, 1-35591
BGC Partners, Inc.
(Exact Name of Registrant as Specified in Its Charter)
|
Delaware |
|
13-4063515 |
|
(State or Other Jurisdiction of Incorporation or Organization) |
|
(I.R.S. Employer Identification No.) |
|
|
|
|
|
499 Park Avenue, New York, NY |
|
10022 |
|
(Address of Principal Executive Offices) |
|
(Zip Code) |
(212) 610-2200
(Registrant’s telephone number, including area code)
Securities registered pursuant to Section 12(b) of the Act:
|
Title of Each Class |
|
Name of Each Exchange on Which Registered |
|
Class A Common Stock, $0.01 par value 8.125% Senior Notes due 2042 |
|
The NASDAQ Stock Market LLC New York Stock Exchange |
Securities registered pursuant to Section 12(g) of the Act:
None
(Title of Class)
Indicate by check mark if the registrant is a well-known seasoned issuer, as defined in Rule 405 of the Securities Act. Yes ☒ No ☐
Indicate by check mark if the registrant is not required to file reports pursuant to Section 13 or Section 15(d) of the Act. Yes ☐ No ☒
Indicate by check mark whether the registrant: (1) has filed all reports required to be filed by Section 13 or 15(d) of the Securities Exchange Act of 1934 during the preceding 12 months (or for such shorter period that the registrant was required to file such reports), and (2) has been subject to such filing requirements for the past 90 days. Yes ☒ No ☐
Indicate by check mark whether the registrant has submitted electronically and posted on its corporate Web site, if any, every Interactive Data File required to be submitted and posted pursuant to Rule 405 of Regulation S-T (§232.405 of this chapter) during the preceding 12 months (or for such shorter period that the registrant was required to submit and post such files). Yes ☒ No ☐
Indicate by check mark if disclosure of delinquent filers pursuant to Item 405 of Regulation S-K is not contained herein, and will not be contained, to the best of registrant’s knowledge, in definitive proxy or information statements incorporated by reference in Part III of this Form 10-K or any amendment to this Form 10-K. ☐
Indicate by check mark whether the registrant is a large accelerated filer, an accelerated filer, a non-accelerated filer, a smaller reporting company or an emerging growth company. See the definitions of “large accelerated filer,” “accelerated filer,” “smaller reporting company” and “emerging growth company” in Rule 12b-2 of the Exchange Act. (Check one):
|
Large Accelerated Filer |
☒ |
Accelerated Filer |
☐ |
|
Non-accelerated Filer |
☐ |
Smaller Reporting Company |
☐ |
|
Emerging growth company |
☐ |
|
|
If an emerging growth company, indicate by check mark if the registrant has elected not to use the extended transition period for complying with any new or revised financial accounting standards provided pursuant to Section 13(a) of the Exchange Act. ☐
Indicate by check mark whether the registrant is a shell company (as defined in Rule 12b-2 of the Exchange Act). Yes ☐ No ☒
The aggregate market value of voting common equity held by non-affiliates of the registrant, based upon the closing price of the Class A common stock on June 30, 2017 as reported on NASDAQ, was approximately $2,906,205,624.
Indicate the number of shares outstanding of each of the registrant’s classes of common stock, as of the latest practicable date.
|
Class |
Outstanding at February 20, 2018 |
|
Class A Common Stock, par value $0.01 per share |
271,393,199 shares |
|
Class B Common Stock, par value $0.01 per share |
34,848,107 shares |
DOCUMENTS INCORPORATED BY REFERENCE.
Portions of the registrant’s definitive proxy statement for its 2018 annual meeting of stockholders are incorporated by reference in Part III of this Annual Report on Form 10-K
2017 FORM 10-K ANNUAL REPORT
TABLE OF CONTENTS
|
|
|
|
|
Page |
|
|
|
|
|
|
|
|
|
|
|
|
|
ITEM 1. |
|
|
4 |
|
|
ITEM 1A. |
|
|
41 |
|
|
ITEM 1B. |
|
|
88 |
|
|
ITEM 2. |
|
|
88 |
|
|
ITEM 3. |
|
|
89 |
|
|
ITEM 4. |
|
|
89 |
|
|
|
|
|
|
|
|
|
|
|
|
|
|
|
|
|
|
|
|
ITEM 5. |
|
|
90 |
|
|
ITEM 6. |
|
|
97 |
|
|
ITEM 7. |
|
MANAGEMENT’S DISCUSSION AND ANALYSIS OF FINANCIAL CONDITION AND RESULTS |
|
99 |
|
ITEM 7A. |
|
|
159 |
|
|
ITEM 8. |
|
|
162 |
|
|
ITEM 9. |
|
CHANGES IN AND DISAGREEMENTS WITH ACCOUNTANTS ON ACCOUNTING AND |
|
246 |
|
ITEM 9A. |
|
|
246 |
|
|
ITEM 9B. |
|
|
246 |
|
|
|
|
|
|
|
|
|
|
|
|
|
|
|
|
|
|
|
|
ITEM 10. |
|
|
247 |
|
|
ITEM 11. |
|
|
247 |
|
|
ITEM 12. |
|
SECURITY OWNERSHIP OF CERTAIN BENEFICIAL OWNERS AND MANAGEMENT AND |
|
247 |
|
ITEM 13. |
|
CERTAIN RELATIONSHIPS AND RELATED TRANSACTIONS, AND |
|
247 |
|
ITEM 14. |
|
|
247 |
|
|
|
|
|
|
|
|
|
|
|
|
|
|
|
|
|
|
|
|
ITEM 15. |
|
|
248 |
|
|
ITEM 16. |
|
|
255 |
SPECIAL NOTE ON FORWARD-LOOKING INFORMATION
This Annual Report on Form 10-K (this “Form 10-K”) contains forward-looking statements within the meaning of Section 27A of the Securities Act of 1933, as amended, which we refer to as the “Securities Act,” and Section 21E of the Securities Exchange Act of 1934, as amended, which we refer to as the “Exchange Act.” Such statements are based upon current expectations that involve risks and uncertainties. Any statements contained herein that are not statements of historical fact may be deemed to be forward-looking statements. For example, words such as “may,” “will,” “should,” “estimates,” “predicts,” “possible,” “potential,” “continue,” “strategy,” “believes,” “anticipates,” “plans,” “expects,” “intends,” and similar expressions are intended to identify forward-looking statements.
Our actual results and the outcome and timing of certain events may differ significantly from the expectations discussed in the forward-looking statements. Factors that might cause or contribute to such a discrepancy include, but are not limited to, the factors set forth below and may impact either or both of our operating segments:
|
|
• |
market conditions, including trading volume and volatility, potential deterioration of equity and debt capital markets and markets for commercial real estate and related services, and our ability to access the capital markets; |
|
|
• |
pricing, commissions and fees, and market position with respect to any of our products and services and those of our competitors; |
|
|
• |
the effect of industry concentration and reorganization, reduction of customers, and consolidation; |
|
|
• |
liquidity, regulatory, and clearing capital requirements and the impact of credit market events; |
|
|
• |
our relationships and transactions with Cantor Fitzgerald, L.P. and its affiliates, which we refer to as “Cantor,” including Cantor Fitzgerald & Co., which we refer to as “CF&Co,” and Cantor Commercial Real Estate Company, L.P., which we refer to as “CCRE,” as well as those with our publicly traded subsidiary, Newmark Group, Inc., which owns our Real Estate Services business and which we refer to as “Newmark,” any related conflicts of interest, any impact of Cantor’s results on our credit ratings and associated outlooks, any loans to or from us, Newmark or Cantor, the Berkeley Point Acquisition (defined below) from and our investment in Real Estate LP (defined below) with CCRE, CF&Co’s acting as our sales agent or underwriter under our controlled equity or other offerings, Cantor’s holdings of our debt securities, CF&Co’s acting as a market maker in our debt securities, CF&Co’s acting as our financial advisor in connection with potential business combinations, dispositions, or other transactions, our participation in various investments, stock loans or cash management vehicles placed by or recommended by CF&Co, and any services provided by or other arrangements with CCRE; |
|
|
• |
risks associated with the integration of acquired businesses with our other businesses; |
|
|
• |
economic or geopolitical conditions or uncertainties, the actions of governments or central banks, including uncertainty regarding the U.K. exit from the European Union following the referendum and related rulings, and the impact of terrorist acts, acts of war or other violence or political unrest, as well as natural disasters or weather-related or similar events, including power failures, communication and transportation disruptions, and other interruptions of utilities or other essential services (including recent hurricanes); |
|
|
• |
the effect on our businesses, our clients, the markets in which we operate, and the economy in general of recent changes in the U.S. and foreign tax and other laws, possible shutdowns of the U.S. government, sequestrations, uncertainties regarding the debt ceiling and the federal budget, and other potential political policies and impasses; |
|
|
• |
the effect on our businesses of worldwide governmental debt issuances, austerity programs, increases or decreases in deficits, and other changes to monetary policy, and potential political impasses or regulatory requirements, including increased capital requirements for banks and other institutions or changes in legislation, regulations and priorities; |
|
|
• |
extensive regulation of our businesses and customers, changes in regulations relating to financial services companies, commercial real estate and other industries, and risks relating to compliance matters, including regulatory examinations, inspections, investigations and enforcement actions, and any resulting costs, increased financial and capital requirements, enhanced oversight, fines, penalties, sanctions, and changes to or restrictions or limitations on specific activities, operations, compensatory arrangements, and growth opportunities, including acquisitions, hiring, and new businesses, products, or services; |
|
|
• |
factors related to specific transactions or series of transactions, including credit, performance, and principal risk, trade failures, counterparty failures, and the impact of fraud and unauthorized trading; |
|
|
• |
risks related to changes in our relationships with the Government Sponsored Enterprises (“GSEs”) and Housing and Urban Development (“HUD”), changes in prevailing interest rates and the risk of loss in connection with loan defaults; |
1
|
|
• |
certain financial risks, including the possibility of future losses, reduced cash flows from operations, increased leverage and the need for short- or long-term borrowings, including from Cantor, the ability of us or Newmark to refinance our respective indebtedness, or other sources of cash relating to acquisitions, dispositions, or other matters, potential liquidity and other risks relating to our ability to obtain financing or refinancing of existing debt on terms acceptable to us, if at all, and risks of the resulting leverage, including potentially causing a reduction in our credit ratings and the associated outlooks and increased borrowing costs, including as a result of the Berkeley Point Acquisition (defined below), as well as interest rate and foreign currency exchange rate fluctuations; |
|
|
• |
risks associated with the temporary or longer-term investment of our available cash, including defaults or impairments on our investments, stock loans or cash management vehicles and collectability of loan balances owed to us by partners, employees, or others; |
|
|
• |
our ability to enter new markets or develop new products, trading desks, marketplaces, or services for existing or new customers and to induce such customers to use these products, trading desks, marketplaces, or services and to secure and maintain market share; |
|
|
• |
our ability to enter into marketing and strategic alliances and business combinations or other transactions in the financial services, real estate, and other industries, including acquisitions, tender offers, dispositions, reorganizations, partnering opportunities and joint ventures, and our ability to maintain or develop relationships with independently owned offices in our Real Estate Services business and our ability to grow in other geographic regions, including the Berkeley Point Acquisition and the Separation (defined below), the Newmark IPO (defined below) and our proposed distribution of shares of Newmark owned by us, the anticipated benefits of any such transactions, relationships or growth and the future impact of such transactions, relationships or growth on our other businesses and our financial results for current or future periods, the integration of any completed acquisitions and the use of proceeds of any completed dispositions, and the value of and any hedging entered into in connection with consideration received or to be received in connection with such dispositions and any transfers thereof; |
|
|
• |
the timing of the distribution of the shares we own in Newmark to our stockholders and whether the distribution will occur at all; |
|
|
• |
our estimates or determinations of potential value with respect to various assets or portions of our businesses, including with respect to the accuracy of the assumptions or the valuation models or multiples used; |
|
|
• |
our ability to hire and retain personnel, including brokers, salespeople, managers, and other professionals; |
|
|
• |
our ability to expand the use of technology for hybrid and fully electronic trading in our product and service offerings; |
|
|
• |
our ability to effectively manage any growth that may be achieved, while ensuring compliance with all applicable financial reporting, internal control, legal compliance, and regulatory requirements; |
|
|
• |
our ability to identify and remediate any material weaknesses in our internal controls that could affect our ability to prepare financial statements and reports in a timely manner, control our policies, practices and procedures, operations and assets, assess and manage our operational, regulatory and financial risks, and integrate our acquired businesses and brokers, salespeople, managers and other professionals; |
|
|
• |
the effectiveness of our risk management policies and procedures, and the impact of unexpected market moves and similar events; |
|
|
• |
information technology risks, including capacity constraints, failures, or disruptions in our systems or those of the clients, counterparties, exchanges, clearing facilities, or other parties with which we interact, including cybersecurity risks and incidents and regulatory focus; |
|
|
• |
the fact that the prices at which shares of our Class A common stock are sold in one or more of our controlled equity offerings or in other offerings or other transactions or the price of shares in Newmark that we own may vary significantly, and purchasers of shares in such offerings or other transactions, as well as existing stockholders, may suffer significant dilution if the price they paid for their shares is higher than the price paid by other purchasers in such offerings or transactions; |
|
|
• |
our ability to meet expectations with respect to payments of dividends and distributions and repurchases of shares of our Class A common stock and purchases or redemptions of limited partnership interests of BGC Holdings, L.P., which we refer to as “BGC Holdings,” or other equity interests in or any of our other subsidiaries, including Newmark and its subsidiaries, including from Cantor, our executive officers, other employees, partners, and others, and the net proceeds to be realized by us from offerings of our shares of Class A common stock; and |
2
The foregoing risks and uncertainties, as well as those risks and uncertainties discussed under the headings “Item 1A—Risk Factors,” and “Item 7A—Quantitative and Qualitative Disclosures About Market Risk” and elsewhere in this Form 10-K, may cause actual results and events to differ materially from the forward-looking statements. The information included herein is given as of the filing date of this Form 10-K with the Securities and Exchange Commission (the “SEC”), and future results or events could differ significantly from these forward-looking statements. The Company does not undertake to publicly update or revise any forward-looking statements, whether as a result of new information, future events, or otherwise.
WHERE YOU CAN FIND MORE INFORMATION
We file annual, quarterly and current reports, proxy statements and other information with the Securities and Exchange Commission (the “SEC”). You may read and copy any document we file at the SEC’s Public Reference Room located at One Station Place, 100 F Street, N.E., Washington, D.C. 20549. You can also request copies of the documents, upon payment of a duplicating fee, by writing the Public Reference Section of the SEC. Please call the SEC at 1-800-SEC-0330 for further information on the Public Reference Room. These filings are also available to the public from the SEC’s website at www.sec.gov.
Our website address is www.bgcpartners.com. Through our website, we make available, free of charge, the following documents as soon as reasonably practicable after they are electronically filed with, or furnished to, the SEC: our Annual Reports on Form 10-K; our proxy statements for our annual and special stockholder meetings; our Quarterly Reports on Form 10-Q; our Current Reports on Form 8-K; Forms 3, 4 and 5 and Schedules 13D filed on behalf of Cantor, CF Group Management, Inc. (“CFGM”), our directors and our executive officers; and amendments to those documents. Our website also contains additional information with respect to our industry and business. The information contained on, or that may be accessed through, our website is not part of, and is not incorporated into, this Annual Report on Form 10-K.
3
Throughout this document BGC Partners, Inc. is referred to as “BGC” and, together with its subsidiaries, as the “Company,” “BGC Partners,” “we,” “us,” or “our.”
Our Businesses
We are a leading global brokerage company servicing the financial and real estate markets through our Financial Services and Real Estate Services businesses. Through brands including BGC®, GFI®, Sunrise™, Besso™, and R.P. Martin™, among others, our Financial Services business specializes in the brokerage of a broad range of products, including fixed income (rates and credit), foreign exchange, equities, energy and commodities, insurance, and futures. Our Financial Services business also provides a wide range of services, including trade execution, broker-dealer services, clearing, trade compression, post trade, information, and other back-office services to a broad range of financial and non-financial institutions. Our integrated platform is designed to provide flexibility to customers with regard to price discovery, execution and processing of transactions, and enables them to use voice, hybrid, or in many markets, fully electronic brokerage services in connection with transactions executed either over-the-counter (“OTC”) or through an exchange. Through our electronic brands including FENICS®, BGC Trader™, FENICS Market Data™, BGC Market Data™, Capitalab®, and Lucera®, we offer fully electronic brokerage, financial technology solutions, market data, post-trade services and analytics related to financial instruments and markets.
We offer Real Estate Services through our publicly traded subsidiary, Newmark Group, Inc. (“Newmark”). Newmark completed its initial public offering (which we refer to as the “Newmark IPO”) on December 19, 2017, and its Class A common stock trades on the NASDAQ Global Select Market under the ticker symbol “NMRK.” Newmark’s brands include Newmark Knight Frank®, Newmark Cornish & Carey™, Apartment Realty Advisors® (“ARA”), Computerized Facility Integration™, and Excess Space Retail Services, Inc.®. Newmark is a full-service commercial real estate services business that offers a complete suite of services and products for both owners and occupiers across the entire commercial real estate industry. Newmark’s investor/owner services and products include investment sales, agency leasing, property management, valuation and advisory, diligence and underwriting and, under other trademarks and names like Berkeley Point and NKF Capital Markets, government sponsored enterprise lending, loan servicing, debt and structured finance and loan sales. Newmark’s occupier services and products include tenant representation, global corporate services, real estate management technology systems, workplace and occupancy strategy, consulting, project management, lease administration and facilities management. Newmark enhances these services and products through innovative real estate technology solutions and data analytics designed to enable its clients to increase their efficiency and profits by optimizing their real estate portfolio. Newmark has relationships with many of the world’s largest commercial property owners, real estate developers and investors, as well as Fortune 500 and Forbes Global 2000 companies.
BGC, BGC Trader, GFI, FENICS, FENICS.COM, Capitalab, Swaptioniser, ColleX, Newmark, Grubb & Ellis, ARA, Computerized Facility Integration, Landauer, Lucera, Excess Space, Excess Space Retail Services, Inc., Berkeley Point and Grubb are trademarks/service marks, and/or registered trademarks/service marks of BGC Partners, Inc. and/or its affiliates. Knight Frank is a service mark of Knight Frank (Nominees) Limited.
Our customers include many of the world’s largest banks, broker-dealers, investment banks, trading firms, hedge funds, governments, corporations, property owners, real estate developers and investment firms. BGC Partners has more than 100 offices globally in major markets including New York and London, as well as in Atlanta, Beijing, Bogotá, Boston, Buenos Aires, Charlotte, Chicago, Copenhagen, Dallas, Denver, Dubai, Dublin, Geneva, Hong Kong, Houston, Istanbul, Johannesburg, Los Angeles, Madrid, Mexico City, Miami, Moscow, Nyon, Paris, Philadelphia, Rio de Janeiro, San Francisco, Santa Clara, Santiago, São Paulo, Seoul, Shanghai, Singapore, Sydney, Tel Aviv, Tokyo, Toronto, and Washington, D.C.
As of December 31, 2017, we had over 4,000 brokers, salespeople, managers and other front-office personnel across all of our businesses.
Our History
The voice brokerage business within our Financial Services segment originates from one of the oldest and most established inter-dealer or wholesale brokerage franchises in the financial intermediary industry. Cantor started our wholesale intermediary brokerage operations in 1972. In 1996, Cantor launched its eSpeed system, which revolutionized the way government bonds are traded in the inter-dealer market by providing a fully electronic trading marketplace. eSpeed, Inc. (“eSpeed”) completed an initial public offering in 1999 and began trading on NASDAQ, yet it remained one of Cantor’s controlled subsidiaries. Following eSpeed’s initial public offering, Cantor continued to operate its inter-dealer voice brokerage business separately from eSpeed. In August 2004, Cantor announced the reorganization and separation of its inter-dealer voice brokerage business into a subsidiary called “BGC,” in honor of B. Gerald Cantor, the pioneer in screen brokerage services and fixed income market data products. In April 2008, BGC and certain other Cantor assets merged with and into eSpeed, and the combined company began operating under the name “BGC
4
Partners, Inc.” In June 2013, BGC sold certain assets relating to its U.S. Treasury benchmark business and the name “eSpeed” to Nasdaq, Inc. (“Nasdaq,” formerly known as “NASDAQ OMX Group, Inc.) (see --“Nasdaq Transaction”).
Prior to the events of September 11, 2001, our financial brokerage business was widely recognized as one of the leading full-service wholesale financial brokers in the world, with a rich history of developing innovative technological and financial solutions. After September 11, 2001 and the loss of the majority of our U.S.-based employees, our voice financial brokerage business operated primarily in Europe.
Since the formation of BGC in 2004, we have substantially rebuilt our U.S. presence and have continued to expand our global footprint through the acquisition and integration of established brokerage companies and the hiring of experienced brokers. Through these actions, we have been able to expand our presence in key markets and position our Financial Services business for sustained growth. In 2016 and 2017, we have completed or announced several acquisitions, including the acquisition of the businesses of Sunrise Brokers Group, an independent financial brokerage specializing largely in equity derivatives, and the acquisition of Besso Insurance Group Limited, an independent Lloyd’s of London insurance brokerage.
Our Real Estate Services business, Newmark, was founded in 1929 with an emphasis on New York-based investor and owner services such as tenant and agency leasing. We acquired Newmark in 2011, and since the acquisition, Newmark has embarked on a rapid expansion throughout the United States across all critical business lines in the real estate services and product sectors.
Initial Public Offering of our Real Estate Services Business
On December 19, 2017, Newmark completed its previously announced initial public offering of 20 million shares of its Class A common stock, par value $0.01 per share (the “Newmark Class A common stock”). Prior to the Newmark IPO, Newmark was our wholly owned subsidiary. On December 26, 2017, the underwriters of the Newmark IPO closed on their overallotment option to purchase an additional 3 million shares of Newmark’s Class A common stock from Newmark at the initial public offering price of $14.00 per share, less underwriting discounts and commissions. As a result, Newmark received aggregate net proceeds of approximately $295.4 million from the initial public offering, after deducting underwriting discounts and commissions and estimated offering expenses. As of December 31, 2017, we owned all 15.8 million of the issued and outstanding shares of Newmark’s Class B common stock, par value $0.01 per share (the “Newmark Class B Common Stock”), and 115.6 million shares of Newmark Class A common stock, which together represent approximately 92.3% of the combined voting power of Newmark’s outstanding common stock. We currently expect to pursue a distribution to our stockholders of all of the shares of Newmark’s common stock that we then own in a manner that is intended to qualify as generally tax-free for U.S. federal income tax purposes. The determination of whether, when and how to proceed with any such distribution is entirely within our discretion and the shares we own in Newmark are subject to a 180-day “lock-up” restriction. See Newmark IPO and Separation Transaction.”
The Separation
On December 13, 2017, prior to the Newmark IPO, pursuant to the Separation and Distribution Agreement (defined below), we transferred substantially all of the assets and labilities relating to our Real Estate Services business to Newmark, including Berkeley Point and the right to receive the remainder of the Nasdaq payment. In connection with the Separation, Newmark assumed certain indebtedness and made a proportional distribution of interests in Newmark Holdings to holders of interests in BGC Holdings. See “Newmark IPO and Separation Transactions.”
Berkeley Point Acquisition
In September 2017, pursuant to the BP Transaction Agreement (defined below), we purchased from an affiliate of CFLP all of the outstanding membership interests of Berkeley Point Financial LLC (“Berkeley Point”), a leading commercial real estate finance company focused on the origination, servicing and sale of loans through government-sponsored and government-funded loan programs. The total consideration for the acquisition of Berkeley Point was $875 million, subject to certain adjustments. We concurrently invested $100 million of cash in CF Real Estate Finance Holdings, L.P. (“Real Estate LP”), a real-estate joint venture with an affiliate of CFLP, in exchange for approximately 27% of the capital of Real Estate LP. Real Estate LP may conduct activities in any real estate-related business or asset-backed securities-related business or any extensions thereof and ancillary activities thereto. See “BP Acquisition Agreement and Real Estate LP Limited Partnership Agreement.”
GFI and Trayport Transactions
In early 2016, we completed our merger with GFI Group (“GFI”) and now own 100% of GFI’s outstanding shares following a tender offer in 2015. GFI is a leading intermediary and provider of trading technologies and support services to the global OTC and listed markets. GFI serves institutional clients in operating electronic and hybrid markets for cash and derivative products across multiple asset classes.
5
On December 11, 2015, we completed the sale (the “Trayport Transaction”) of all of the equity interests in the entities that make up the Trayport business to Intercontinental Exchange, Inc. (“ICE”). The Trayport business was GFI’s electronic European energy software, trading, and market data business.
Nasdaq Transaction
On June 28, 2013, we completed the sale (the “Nasdaq Transaction”) of certain assets to Nasdaq, Inc. (“Nasdaq,” formerly known as “NASDAQ OMX Group, Inc.”), which purchased certain assets and assumed certain liabilities from us and our affiliates, including the eSpeed brand name and various assets comprising the fully electronic portion of our benchmark on-the-run U.S. Treasury brokerage, market data and co-location service businesses (“eSpeed”), for cash consideration of $750 million paid at closing, plus an earn-out of up to 14,883,705 shares of Nasdaq common stock to be paid ratably in each of the fifteen years following the closing, provided that Nasdaq produces at least $25 million in gross revenues for the applicable year. Nasdaq has recorded more than $2.4 billion in gross revenues for each of the last 11 calendar years and generated gross revenues of approximately $4.0 billion in 2016. As of December 31, 2017, 4,961,235 shares of common stock of Nasdaq have been received by us. The economic impact of such shares that have already been received by us and remain with us following the separation. The right to receive the remainder of the Nasdaq payment was transferred from us to Newmark prior to the completion of the Newmark IPO. Newmark has recorded a gain related to the 2017 Nasdaq payment of $76 million in 2017, and expects its future results to include up to an additional 9,922,470 Nasdaq shares to be received over time. These expected future shares were valued at approximately $762 million based on the last reported sale price of a share of common stock of Nasdaq on December 31, 2017.
As a result of the sale of eSpeed, we only sold our on-the-run benchmark 2-, 3-, 5-, 7-, 10-, and 30-year fully electronic trading platform for U.S. Treasury notes and bonds. We continue to offer voice brokerage for on-the-run U.S. Treasuries, as well as across various other products in rates, credit, FX, market data and software solutions. We continue to focus our efforts on converting voice and hybrid desks to electronic execution.
Overview of Our Products and Services
Financial Services (including FENICS)
Financial Brokerage
We are focused on serving three principal financial brokerage markets:
|
|
• |
traditional, liquid brokerage markets, such as government bonds; |
|
|
• |
illiquid markets, such as emerging market bonds and single name credit derivatives; and |
|
|
• |
targeted local markets throughout the world, such as rates products in Brazil. |
We provide electronic marketplaces in several financial markets through various products and services, including FENICS, BGC Trader, and several multi-asset hybrid offerings for voice and electronic execution, including BGC’s Volume Match and GFI’s CreditMatch. These electronic marketplaces include government bond markets, interest rate derivatives, spot foreign exchange, foreign exchange derivatives, corporate bonds, and credit derivatives. We believe that we offer a comprehensive application providing volume, access, speed of execution and ease of use. Our trading platform establishes a direct link between our brokers and customers and occupies valuable real estate on traders’ desktops, which is difficult to replicate. We believe that we can leverage our platform to offer fully electronic trading as additional products transition from voice and hybrid trading to fully electronic execution.
Our fully electronic businesses within our Financial Services segment are collectively referred to as “FENICS.” These offerings include fully electronic brokerage products, as well as offerings in market data, software solutions, and post-trade services across both BGC and GFI. FENICS results do not include the results of Trayport, either before or after the completed sale to ICE. We have leveraged our hybrid platform to provide real-time product and pricing information through applications such as BGC Trader. We also provide straight-through processing to our customers for an increasing number of products. Our end-to-end solution includes real-time and auction-based transaction processing, credit and risk management tools and back-end processing and billing systems. Customers can access our trading application through our privately managed global high speed data network, over the Internet, or through third-party communication networks.
6
The following table identifies some of the key Financial Services products that we broker:
|
Rates |
Interest rate derivatives |
|
|
|
|
|
Off-the-run U.S. Treasuries |
|
|
|
|
|
Global government bonds |
|
|
|
|
|
Agencies |
|
|
|
|
|
Futures |
|
|
|
|
|
Dollar derivatives |
|
|
|
|
|
Repurchase agreements |
|
|
|
|
|
Non-deliverable swaps |
|
|
|
|
|
Interest rate swaps and options |
|
|
|
|
Credit |
Credit derivatives |
|
|
|
|
|
Asset-backed securities |
|
|
|
|
|
Convertibles |
|
|
|
|
|
Corporate bonds |
|
|
|
|
|
High yield bonds |
|
|
|
|
|
Emerging market bonds |
|
|
|
|
Foreign Exchange |
Foreign exchange options |
|
|
|
|
|
G-10 |
|
|
|
|
|
Emerging markets |
|
|
|
|
|
Cross currencies |
|
|
|
|
|
Exotic options |
|
|
|
|
|
Spot FX |
|
|
|
|
|
Emerging market FX options |
|
|
|
|
|
Non-deliverable forwards |
|
|
|
|
Energy and Commodities (OTC and listed derivatives) |
Electricity |
|
|
|
|
|
Natural Gas |
|
|
|
|
|
Coal |
|
|
|
|
|
Base and precious metals |
|
|
|
|
|
Refined and crude oil |
|
|
|
|
|
Emissions |
|
|
|
|
|
Soft commodities |
|
|
|
|
Equities, Insurance, and Other |
Equity derivatives |
|
|
|
|
|
Cash equities |
|
|
|
|
|
Index futures |
|
|
|
|
|
Other derivatives and futures Insurance brokerage
|
Certain categories of trades settle for clearing purposes with CF&Co, one of our affiliates. CF&Co is a member of the Financial Industry Regulatory Authority (“FINRA”) and the Fixed Income Clearing Corporation (“FICC”), a subsidiary of the Depository Trust & Clearing Corporation. In addition, certain affiliated entities are subject to regulation by the Commodity Futures Trading Commission (the “CFTC”), including CF&Co and BGC Financial, L.P. (“BGC Financial”).We, CF&Co, BGC Financial and other affiliates act in a matched principal or principal capacity in markets by posting and/or acting upon quotes for our account. Such
7
activity is intended, among other things, to assist us, CF&Co and other affiliates in managing proprietary positions (including, but not limited to, those established as a result of combination trades and errors), facilitating transactions, framing markets, adding liquidity, increasing commissions and attracting order flow. Similarly, when framing a market in a “name passing” marketplace, we and our affiliates may post quotations that we believe reflect contemporaneous and/or anticipated potential market interest in an effort to facilitate liquidity for market participants on our respective platforms. We and our affiliates use commercially reasonable efforts to find a counterparty for any resulting transactions, at the customary minimum size level for that market.
Market Data
FENICS Market Data is a supplier of real-time, tradable, indicative, end-of-day and historical market data. Our market data product suite includes fixed income, interest rate derivatives, credit derivatives, foreign exchange, foreign exchange options, money markets, energy, metals, and equity derivatives and structured market data products and services. The data are sourced from the voice, hybrid and electronic broking operations, as well as the market data operations, including BGC, GFI and RP Martin, among others. The data are made available to financial professionals, research analysts and other market participants via direct data feeds and BGC-hosted FTP environments, as well as via information vendors such as Bloomberg, Thomson Reuters, ICE Data Services, QUICK Corp., and other select specialist vendors.
Software Solutions and Post-Trade Services
Through our Software Solutions business, we provide customized screen-based market solutions to both related and unrelated parties. Our clients are able to develop a marketplace, trade with their customers, issue debt, access program trading interfaces and access our network and our intellectual property. We can add advanced functionality to enable our customers to distribute branded products to their customers through online offerings and auctions, including private and reverse auctions, via our trading platform and global network.
We offer an FX price discovery, pricing analysis, risk management and trading software used by nearly 2,000 users globally at mid-tier banks, financial institutions and corporate clients. We also offer post-trade services through our Capitalab® brand.
During the fourth quarter of 2016, we released FENICS Trading Solutions™, a platform which supports all aspects of FXO trading. Our clients are able to utilize the platform to set workflow rules which allow them to better manage their trade flows and facilitate liquidity management, price making and distribution.
Our Software Solutions business provides the software and technology infrastructure for the transactional and technology related elements of the Freedom International Brokerage Company (“Freedom”) marketplace as well as certain other services in exchange for specified percentages of transaction revenue from the marketplace. Our Software Solutions revenues from February 27, 2015 through December 11, 2015, included results from GFI’s Trayport Business, which was sold to ICE as described above.
In the fourth quarter of 2017, Capitalab’s Initial Margin Optimisation ("IMO") service completed its largest G-4 Interest Rates IMO to date with more than 15 participating counterparties. The service enabled these counterparties to multilaterally shrink delta, vega and curvature bilateral counterparty risks and significantly reduce both non-cleared Initial Margin (“IM”) and cleared IM at the Central Clearing Counterparty. In January this year, Capitalab executed the first combined compression cycle in Swaptions, Caps, Floors and cleared interest rate Swaps due to its appointment as an Approved Compression Service Provider at LCH’s SwapClear.
Aqua Business
In October 2007, we spun off our former eSpeed Equities Direct business to form Aqua Securities, L.P. (“Aqua”), a business owned 51% by Cantor and 49% by us. Aqua’s purpose is to provide access to new block trading liquidity in the equities markets. The SEC has granted approval for Aqua to operate an Alternative Trading System in compliance with Regulation ATS.
Financial Services Industry Recognition
Our Financial Services business has consistently won global industry awards and accolades in recognition of its performance and achievements. Recent examples include:
|
|
• |
In 2017, Sunrise Brokers was ranked as the #1 Equity Products Broker globally by Risk Magazine for the 11th consecutive year and as the #1 Equity Exotic Derivatives broker for the 15th year; |
|
|
• |
In 2017, BGC was ranked as the #1 Interest rate – inflation swaps broker (US dollar and euro) globally and #1 Interest rate – inflation options broker (US dollar, euro, and sterling) by Risk Magazine; |
8
|
|
• |
In 2017, GFI was ranked as the #1 broker in Coal, Gold, Silver, Platinum and Palladium, and overall Precious Metals globally by Energy Risk Magazine; |
|
|
• |
Capitalab was named Compression/Compaction Service of the Year by GlobalCapital in their 2016 Global Derivatives Awards; |
|
|
• |
In 2017, FENICS Trading Solutions (TS) won the Technology Development of the Year Award from Asia Risk Magazine; |
|
|
• |
In 2017, FENICS Pro won the Best Vendor for FXO Pricing & Risk Management Award from FX Magazine; |
|
|
• |
BGC and GFI were jointly named Equity Derivatives Interdealer Broker of the Year by GlobalCapital in their 2016 Global Derivatives Awards; |
|
|
• |
BGC and GFI were jointly named Credit Derivatives Interdealer Broker of the Year by GlobalCapital in their 2016 Global Derivatives Awards; |
|
|
• |
In 2015, BGC Partners’ acquisition of GFI Group was named Deal of the Year by Futures & Options World. |
Real Estate Products and Services
Newmark offers a diverse array of integrated services and products designed to meet the full needs of both real estate investors/owners and occupiers. Our technology advantages, industry-leading talent, deep and diverse client relationships and suite of complementary services and products allow us to actively cross-sell our services and drive industry-leading margins.
Leading Commercial Real Estate Technology Platform and Capabilities
We offer innovative real estate technology solutions for both investors/owners and occupiers that enable our clients to increase efficiency and realize additional profits. Our differentiated, value-added and client-facing technology platforms have been utilized by clients that occupy over 3.5 billion square feet of commercial real estate space globally. Our N360 platform is a powerful tool that provides instant access and comprehensive commercial real estate data in one place via mobile or desktop. For our occupier clients, the VISION platform provides integrated business intelligence, reporting and analytics. Our deep and growing real estate database and commitment to providing innovative technological solutions empower us to provide our clients with value-adding technology products and data-driven advice and analytics.
Real Estate Investor/Owner Services and Products
Capital Markets. We provide clients with strategic solutions to their real estate capital concerns. We offer a broad range of real estate capital markets services, including asset sales, sale leasebacks, mortgage and entity-level financing, equity-raising, underwriting and due diligence. Through our mortgage bankers and brokers, we are able to offer multiple debt and equity alternatives to fund capital markets transactions through third-party banks, insurance companies and other capital providers, as well as through our government-sponsored enterprise lending platform, Berkeley Point. Although preliminary figures suggest U.S. commercial real estate sales volumes across the industry declined 7% year-over-year in 2017 according to Real Capital Analytics (“RCA”), commercial mortgage origination volumes were forecast to increase by an estimated 15% in 2017 according to the Mortgage Bankers Association (“MBA”). In comparison, our capital markets revenues, which are more heavily weighted to investment sales than debt financing and note sales (which we use interchangeably with “commercial mortgage brokerage” when discussing our results), increased 19% year-over-year in 2017. We completed approximately $46 billion in capital markets transactions in 2017, representing an increase of approximately 34% year-over-year. This $46 billion in transactions includes approximately $11 billion in financing and note sales.
Agency Leasing. We execute marketing and leasing programs on behalf of investors, developers, governments, property companies and other owners of real estate to secure tenants and negotiate leases. Revenue is typically recognized when a lease is signed and/or a tenant occupies the space and is calculated as a percentage of the total revenue that the landlord is expected to derive from the lease over its term. In certain markets revenue is determined on a per square foot basis. As of December 31, 2017, we represent buildings that total over 360 million square feet of commercial real estate on behalf of owners in the U.S.
Valuation and Advisory. We operate a national valuation and advisory business, which has grown expansively in 2017 by approximately 215 professionals. Our appraisal team executes projects of nearly every size and type, from single properties to large portfolios, existing and proposed facilities and mixed-use developments across the spectrum of asset values. Clients include banks, pension funds, insurance companies, developers, corporations, equity funds, REITs and institutional capital sources. These institutions utilize the advisory services we provide in their loan underwriting, construction financing, portfolio analytics, feasibility determination, acquisition structures, litigation support and financial reporting.
9
Property Management. We provide property management services on a contractual basis to owners and investors in office, industrial and retail properties. Property management services include building operations and maintenance, vendor and contract negotiation, project oversight and value engineering, labor relations, property inspection/quality control, property accounting and financial reporting, cash flow analysis, financial modeling, lease administration, due diligence and exit strategies. We have an opportunity to grow our property or facilities management contracts in connection with other high margin leasing or other contracts. We may provide services through our own employees or through contracts with third-party providers. We typically receive monthly management fees based upon a percentage of monthly rental income generated from the property under management, or in some cases, the greater of such percentage or a minimum agreed upon fee. We are often reimbursed for our administrative and payroll costs, as well as certain out-of-pocket expenses, directly attributable to properties under management. Our property management agreements may be terminated by either party with notice generally ranging between 30 to 90 days; however, we have developed long-term relationships with many of these clients and our typical contract has continued for many years.
Government Sponsored Enterprise (“GSE”) Lending and Loan Servicing. As a low-risk intermediary, our Berkeley Point business originates loans guaranteed by government agencies or entities and pre-sells such loans prior to transaction closing. Berkeley Point is approved to participate in loan origination, sales and servicing programs operated by the two GSEs, Fannie Mae and Freddie Mac. Berkeley Point also originates, sells and services loans under HUD’s FHA programs, and is an approved HUD MAP and HUD LEAN lender, as well as an approved Ginnie Mae issuer. In 2017, Berkeley Point was a top-five Fannie Mae and Freddie Mac lender according to the GSEs. For the year ended December 31, 2017, Berkeley Point’s GSE and FHA loan originations increased by 16% year-on-year to $8.9 billion.
Berkeley Point does not originate loans to be held for investment. Substantially all of Berkeley Point’s originations are for GSE and HUD/FHA lending programs in which the loan is pre-sold via these programs to investors prior to the closing of the loan with the borrower, significantly reducing distribution risk. Berkeley Point finances its loan originations through collateralized financing agreements in the form of warehouse loan agreements (which we refer to as “WHAs”) with three lenders and an aggregate commitment as of December 31, 2017 of $950 million and an uncommitted $325 million Fannie Mae loan repurchase facility. As of December 31, 2017, Berkeley Point had collateralized financing outstanding of approximately $360 million. Collateral includes the underlying originated loans and related collateral, the commitment to purchase the loans as well as credit enhancements from the applicable GSE or HUD. Berkeley Point typically completes the distribution of the loans it originates within 30 to 60 days of closing. Proceeds from the distribution are applied to reduce borrowings under the WHAs, thus restoring borrowing capacity for further loan originations.
In conjunction with our origination services, we sell the loans that we originate under GSE and FHA programs and retain the servicing of those loans. The servicing portfolio provides a stable, predictable, and recurring stream of revenues to us over the life of each loan. As of December 31, 2017, Berkeley Point’s total servicing portfolio was $58.0 billion (of which less than 10% relates to special servicing) and average remaining servicing term per loan was approximately eight years for its primary servicing portfolio.
The combination of Berkeley Point and ARA brings together, respectively, a leading multifamily debt origination platform with a top-two multifamily investment sales business that executed approximately $20 billion of capital markets activity in 2017, which we believe will provide substantial cross-selling opportunities. In particular, we expect revenues to increase as Berkeley Point begins to capture a greater portion of the financings on ARA’s investment sales transactions.
Intercompany Referrals. Berkeley Point, CCRE (a subsidiary of Cantor) and BGC Partners have entered into arrangements in respect of intercompany referrals. Pursuant to these arrangements, the respective parties refer, for customary fees, opportunities for commercial real estate loans to CCRE, opportunities for real estate investment, broker or leasing services to our Newmark business, and opportunities for government-sponsored loan originations to our Berkeley Point business.
Due Diligence and Underwriting. We provide commercial real estate due diligence consulting and advisory services to a variety of clients, including lenders, investment banks and investors. Our core competencies include underwriting, modeling, structuring, due diligence and asset management. We also offer clients cost-effective and flexible staffing solutions through both on-site and off-site teams. We believe that this business line gives us another way to cross-sell services to our clients.
Real Estate Occupier Services and Products
Tenant Representation Leasing. We represent commercial tenants in all aspects of the leasing process, including space acquisition and disposition, strategic planning, site selection, financial and market analysis, economic incentives analysis, lease negotiations, lease auditing and project management. Fees are generally earned when a lease is signed and/or the tenant takes occupancy of the space. In many cases, landlords are responsible for paying the fees. We use innovative technology and data to provide tenants with an advantage in negotiating leases, which has contributed to our market share gains.
10
Workplace and Occupancy Strategy. We provide services to help organizations understand their current workplace standards and develop plans and policies to optimize their real estate footprint. We offer a multi-faceted consulting service underpinned by robust data and technology.
Global Corporate Services (“GCS”) and Consulting. GCS is our consulting and services business that focuses on reducing occupancy expense and improving efficiency for corporate real estate occupiers, with large, often multi-national presence. We provide beginning-to-end corporate real estate solutions for clients. GCS makes its clients more profitable by optimizing real estate usage, reducing overall corporate footprint, and improving work flow and human capital efficiency through large scale data analysis and our industry-leading technology. We offer global enterprise optimization, asset strategy, transaction services, information management, an operational technology product and transactional and operational consulting. Our consultants provide expertise in financial integration, portfolio strategy, location strategy and optimization, workplace strategies, workflow and business process improvement, merger and acquisition integration, and industrial consulting. We utilize a variety of advanced technology tools to facilitate the provision of transaction and management services to our clients. For example, our innovative VISION tool provides data integration, analysis and reporting, as well as the capability to analyze potential “what if” scenarios to support client decision making. VISION is a scalable and modular enterprise solution that serves as an integrated database and process flow tool supporting the commercial real estate cycle. Our VISION tool combines the best analytical tools available and allows the client to realize a highly accelerated implementation timeline at a reduced cost. We believe that we have achieved more than $3 billion in savings for our clients to date.
We provide real estate strategic consulting and systems integration services to our global clients including many Fortune 500 and Forbes Global 2000 companies, owner-occupiers, government agencies, healthcare and higher education clients. We also provide enterprise asset management information consulting and technology solutions which can yield hundreds of millions of dollars in cost-savings for its client base on an annual basis. The relationships developed through the software implementation at corporate clients lead to many opportunities for us to deliver additional services. We also provide consulting services through our GCS business. These services include operations consulting related to financial integration, portfolio strategy, location strategy and optimization, workplace strategies, workflow and business process improvement, merger and acquisition integration and industrial consulting. Fees for these services are on a negotiated basis and are often part of a multi-year services agreement. Fees may be contingent on meeting certain financial or savings objectives with incentives for exceeding agreed upon targets.
Recurring Revenue Streams. GCS often provides a recurring revenue stream when it enters into multi-year contracts that provide repeatable transaction work, as opposed to one-off engagements in specific markets and other recurring fees for ongoing services, such as facilities management and lease administration, over the course of the contract. Today’s clients are focused on corporate governance, consistency in service delivery, centralization of the real estate function and procurement. Clients are also less focused on transaction-based outcomes and more focused on overall results, savings, efficiencies and optimization of their overall business objectives. GCS was specifically designed to meet these objectives. We believe that GCS is hired to solve business problems, not “real estate” problems.
Project Management. We provide a variety of services to tenants and owners of self-occupied spaces. These include conversion management, move management, construction management and strategic occupancy planning services. These services may be provided in connection with a discrete tenant representation lease or on a contractual basis across a corporate client’s portfolio. Fees are generally determined on a negotiated basis and earned when the project is complete.
Real Estate and Lease Administration. We manage leases for our clients for a fee, which is generally on a per lease basis. As of December 31, 2017, we have more than 20,000 leases under management. We also perform lease audits and certain accounting functions related to the leases. Our lease administration services include critical date management, rent processing and rent payments. These services provide additional insight into a client’s real estate portfolio, which allows us to deliver significant value back to the client through provision of additional services, such as tenant representation, project management and consulting assignments, to minimize leasing and occupancy costs.
Facilities Management. We manage a broad range of properties on behalf of users of commercial real estate, including headquarters, facilities and office space, for a broad cross section of companies, including Fortune 500 and Forbes Global 2000 companies. We manage the day-to-day operations and maintenance for urban and suburban commercial properties of most types, including office, industrial, data centers, healthcare, retail, call centers, urban towers, suburban campuses, and landmark buildings. Facilities management services may also include facility audits and reviews, energy management services, janitorial services, mechanical services, bill payment, maintenance, project management, and moving management. While facility management contracts are typically three to five years in duration, they may be terminated on relatively short notice periods. Our facilities management services cover more than 250,000 work orders annually.
11
We offer services to clients on a global basis. In 2005, we partnered with London-based Knight Frank in order to enhance our ability to provide best-in-class local service to our clients, throughout the world. Knight Frank is a leading independent, global real estate services firm providing integrated prime and commercial real estate services and operates in over 200 key office hubs across Europe, the Middle East, Asia, Australia and Africa. Outside of the Americas, we collaborate with Knight Frank to ensure that our clients have access to local expertise and to highly-skilled professionals in the locales where they choose to transact. We expect that our cross-selling efforts with Knight Frank will lead to continued growth, particularly as our growing capital markets business increases its penetration with foreign investors.
While we have the right to expand our international operations, we may be subject to certain short-term contractual restrictions due to our existing agreement with Knight Frank, which was extended, effective December 28, 2017, for a three-year period with a 90-day mutual termination right. The agreement restricts the parties from operating a competing commercial real estate business in the other party’s areas of responsibility. Our areas of responsibility are North America and South America. Knight Frank’s areas of responsibility are the Asia-Pacific region, Europe, the Middle East and Africa.
Domestic and Latin American Real Estate Services Alliances
In certain smaller markets in the United States and elsewhere in the Americas in which we do not maintain owned offices, we have agreements in place to operate on a collaborative and cross-referral basis with certain independently-owned offices in return for contractual and referral fees paid to us and/or certain mutually beneficial co-branding and other business arrangements. We do not derive a significant portion of our revenue from these relationships. These independently owned offices generally use some variation of our branding in their names and marketing materials. These agreements are normally multi-year contracts, and generally provide for mutual referrals in their respective markets, generating additional contract and brokerage fees. Through these independently-owned offices, our clients have access to additional brokers with local market research capabilities as well as other commercial real estate services in locations where our business does not have a physical presence.
Real Estate Services Industry Recognition
As a result of our experienced management team’s ability to skillfully grow the Company, we have become a nationally recognized brand. Over the past several years, we have consistently won a number of U.S. industry awards and accolades, been ranked highly by third-party sources and significantly increased our rankings, which we believe reflects recognition of our performance and achievements. For example:
|
|
• |
Ranked #4 Top Brokers in sales of Office Properties, Real Estate Alert, First Half 2017, up from #17 in 2010, the year before the Newmark was acquired by BGC; |
|
|
• |
Ranked #3 Top Brokerage Firm, Commercial Property Executive, 2017; |
|
|
• |
Ranked #4 Top Brokerage Firm, National Real Estate Investor, 2017; |
|
|
• |
Ranked #5 Multifamily Fannie Mae DUS producer for 2017 by the agency, up from #10 in 2013, the year before Berkeley Point was acquired; |
|
|
• |
Ranked #5 Multifamily Freddie Mac lender in 2017 by the agency, up from #10 in 2013 (per the MBA), the year before Berkeley Point was acquired; |
|
|
• |
Ranked #2 Top Brokers of Multifamily Properties, Real Estate Alert, 2017; |
|
|
• |
Ranked #2 Best Commercial Real Estate Tenant Representation Firm, New York Law Journal, 2017; also ranked #2 Best Commercial Real Estate Property Management Firm, New York Law Journal, 2017; |
|
|
• |
Ranked #4 New York’s Largest Commercial Property Managers, Crain’s New York Business, 2017; |
|
|
• |
Ranked Top 100 Global Outsourcing Firms, International Association of Outsourcing Professionals, 2017; |
|
|
• |
Winner of 12 REBNY Deal of the Year Awards in the last 12 Years, Real Estate Board of New York or Winner of REBNY 2015 Most Ingenious Deal of the Year Award and 2015 Most Ingenious Retail Detail of the Year Award; |
|
|
• |
Ranked #2 Commercial Real Estate Firms, Newmark Cornish & Carey, Silicon Valley Business Journal, 2017; and |
|
|
• |
Ranked #5 of the Top 25 in Sales Volume, Real Capital Analytics Survey, 2017, up from #21 in 2010, the year before Newmark was acquired by BGC. |
12
In Financial Services, we primarily serve the wholesale and/or inter-dealer markets, including many of the world’s largest banks that regularly trade in capital markets, brokerage houses, investment firms, hedge funds, and investment banks. Customers using our branded products and services also include professional trading firms, futures commission merchants, and other professional market participants and financial institutions. Our market data products and services are available through many platforms and are available to a wide variety of capital market participants, including banks, investment banks, brokerage firms, asset managers, hedge funds, investment analysts and financial advisors. We also license our intellectual property portfolio and offerings in Software Solutions to various financial markets participants. For the year ended December 31, 2017, our top ten Financial Services customers, collectively, accounted for approximately 18% of our total revenue on a consolidated basis, and our largest customer accounted for approximately 2% of our total revenue on a consolidated basis.
In Real Estate Services, our clients include a full range of real estate owners, occupiers, tenants, investors, lenders and multi-national corporations in numerous markets, including office, retail, industrial, multifamily, student housing, hotels, data center, healthcare, self-storage, land, condominium conversions, subdivisions and special use. Newmark’s clients vary greatly in size and complexity, and include for-profit and non-profit entities, governmental entities and public and private companies. For the year ended December 31, 2017, our Real Estate Services’ business’ top 10 clients, collectively, accounted for approximately 7% of our Real Estate Services business’ total revenue on a consolidated basis, and our largest client accounted for less than 2% of our total Real Estate Services business’ revenue on a consolidated basis.
Sales and Marketing
Financial Services Sales and Marketing
In our Financial Services segment, our brokers and salespeople are the primary marketing and sales resources to our customers. Thus, our sales and marketing program is aimed at enhancing the ability of our brokers to cross-sell effectively in addition to informing our customers about our product and service offerings. We also employ product teams and business development professionals. We leverage our customer relationships through a variety of direct marketing and sales initiatives and build and enhance our brand image through marketing and communications campaigns targeted at a diverse audience, including traders, potential partners and the investor and media communities. We may also market to our existing and prospective customers through a variety of co-marketing/co-branding initiatives with our partners.
Our brokerage product team is composed of product managers who are each responsible for a specific part of our brokerage business. The product managers seek to ensure that our brokers, across all regions, have access to technical expertise, support and multiple execution methods in order to grow and market their business. This approach of combining marketing with our product and service strategy has enabled us to turn innovative ideas into both deliverable fully electronic and hybrid solutions, such as BGC Trader, our multi-asset hybrid offering to our customers for voice and electronic execution.
Our team of business development professionals is responsible for growing our global footprint through raising awareness of our products and services. The business development team markets our products and services to new and existing customers. As part of this process, they analyze existing levels of business with these entities in order to identify potential areas of growth and also to cross-sell our multiple offerings.
Our market data, software solutions, and post-trade products and services are promoted to our existing and prospective customers through a combination of sales, marketing and co-marketing campaigns.
Real Estate Services Sales and Marketing
In our Real Estate Services business, we seek to develop our brand and to highlight our expansive platform while reinforcing our position as a leading commercial real estate services firm in the United States through national brand and corporate marketing, local marketing of specific product lines and targeted broker marketing efforts.
National Brand and Corporate Marketing
At a national level, we utilize media relations, industry sponsorships and sales collateral and targeted advertising in trade and business publications to develop and market our brand. We believe that our emphasis on our unique capabilities enables us to demonstrate our strengths and differentiate ourselves from our competitors. Our multi-market business groups provide customized collateral, website and technology solutions that address specific client needs.
13
Local Product Line Marketing and Targeted Broker Efforts
On a local level, our offices (including those owned by us and independently owned offices) have access to tools and templates that provide our sales professionals with the market knowledge we believe is necessary to educate and advise clients, and also to bring properties to market quickly and effectively. These tools and templates include proprietary research and analyses, web-based marketing systems and ongoing communications and training about our depth and breadth of services. Our sales professionals use these local and national resources to participate directly in selling to, advising and servicing clients. We provide marketing services and materials to certain independently owned offices as part of an overall agreement allowing them to use our branding. We also benefit from shared referrals and materials from local offices.
Additionally, we invest in and rely on comprehensive research to support and guide the development of real estate and investment strategy for our clients. Research plays a key role in keeping colleagues throughout the organization attuned to important trends and changing conditions in world markets. We disseminate this information internally and externally directly to prospective clients and the marketplace through the company website. We believe that our investments in research and technology are critical to establishing our brand as a thought leader and expert in real estate-related matters and provide a key sales and marketing differentiator.
Technology
Financial Services Technology
Pre-Trade Technology. Our financial brokers use a suite of pricing and analytical tools that have been developed both in-house and in cooperation with specialist software suppliers. The pre-trade software suite combines proprietary market data, pricing and calculation libraries, together with those outsourced from what we believe to be the best-of-breed providers in the sector. The tools in turn publish to a normalized, global market data distribution platform, allowing prices and rates to be distributed to our proprietary network, data vendor pages, secure websites and trading applications as indicative pricing.
Inter-Dealer and Wholesale Trading Technology. We utilize a sophisticated proprietary electronic trading platform to provide execution and market data services to our customers. The services are available through our proprietary API, FIX and a multi-asset proprietary trading platform, operating under brands including BGC Trader™, CreditMatch®, FENICS®, GFI ForexMatch®, BGCForex™, BGCCredit™, BGCRates™, FenicsFX™ and FenicsUST™. This platform presently supports a wide and constantly expanding range of products and services, which includes FX Options, European corporate bonds, European CDS, interest rate swaps in multiple currencies, US REPO, TIPS, MBS, government bonds, spot FX, NDFs, and other products. Every product on the platform is supported in either view-only, hybrid/managed or fully electronic mode, and can be transitioned from one mode to the next in response to market demands. The flexible BGC technology stack is designed to support feature-rich work flows required by the hybrid mode as well as delivering high throughput and low transaction latency required by the fully-electronic mode. Trades executed by our customers in any mode are eligible for immediate electronic confirmation through direct straight-through processing (“STP”) links as well as STP hubs. The BGC trading platform services are operated out of several globally distributed data centers and delivered to customers over BGC’s global private network, third-party connectivity providers as well as the Internet. BGC’s proprietary graphical user interfaces and the API/FIX connectivity are deployed at hundreds of major banks and institutions and service thousands of users.
Post-Trade Technology. Our platform automates previously paper and telephone-based transaction processing, confirmation and other functions, substantially improving and reducing the cost of many of our customers’ back offices and enabling STP. In addition to our own system, confirmation and trade processing is also available through third-party hubs, including MarkitWIRE, ICElink, Reuters RTNS, and STP in FIX for various banks.
We have electronic connections to most mainstream clearinghouses, including The Depository Trust & Clearing Corporation (“DTCC”), CLS Group, Euroclear, Clearstream, Monte Titoli, LCH.Clearnet, Eurex Clearing, CME Clearing and the Options Clearing Corporation (“OCC”). As more products become centrally cleared, and as our customers request that we use a particular venue, we expect to expand the number of clearinghouses to which we connect in the future.
Systems Architecture. Our systems consist of layered components, which provide matching, credit management, market data distribution, position reporting, customer display and customer integration. The private network currently operates from four concurrent core data centers (two of which are in the U.K., one of which is in Trumbull, Connecticut and one of which is in Weehawken, NJ) and six hub cities throughout the world acting as distribution points for all private network customers. In June 2015, we transferred the Rochelle Park data center to a co-location center in Weehawken, New Jersey. Our network hubs beyond the core data centers are in Chicago, Hong Kong, Săo Paolo, Singapore, Tokyo and Toronto. The redundant structure of our system provides multiple backup paths and re-routing of data transmission in the event of failure.
In addition to our own network system, we also receive and distribute secure trading information from customers using the services of multiple, major Internet service providers throughout the world. These connections enable us to offer our products and services via the Internet to our global customers.
14
We devote substantial efforts to the development and improvement of our hybrid and electronic marketplaces and licensed software products and services. We work with our customers to identify their specific requirements and make modifications to our software, network distribution systems and technologies that are responsive to those needs. Our efforts focus on internal development, strategic partnering, acquisitions and licensing. As of December 31, 2017, we employed over 500 technology professionals in our Financial Services segment.
Our Intellectual Property
In both our Financial Services and Real Estate Service segments, we regard our technology and intellectual property rights, including our brands, as a critical part of our business. We hold various trademarks, trade dress and trade names and rely on a combination of patent, copyright, trademark, service mark and trade secret laws, as well as contractual restrictions, to establish and protect our intellectual property rights. We own numerous domain names and have registered numerous trademarks and/or service marks in the United States and foreign countries. Our trademark registrations must be renewed periodically, and, in most jurisdictions, every 10 years.
We have adopted a comprehensive intellectual property program to protect our proprietary technology and innovations. We currently have licenses covering various patents from related parties. We also have agreements to license technology that may be covered by several pending and/or issued U.S. patent applications relating to various aspects of our electronic trading systems, including both functional and design aspects. We have filed a number of patent applications to further protect our proprietary technology and innovations, and have received patents for some of those applications. We will continue to file additional patent applications on new inventions, as appropriate, demonstrating our commitment to technology and innovation.
Our patent portfolio continues to grow and we continue to look for opportunities to license and/or otherwise monetize the patents in our portfolio.
Credit Risk
Credit risk arises from potential non-performance by counterparties and customers. We have established policies and procedures to manage our exposure to credit risk. We maintain a thorough credit approval process to limit exposure to counterparty risk and employ stringent monitoring to control the counterparty risk from our matched principal and agency businesses. Our account opening and counterparty approval process includes verification of key customer identification, anti-money laundering verification checks and a credit review of financial and operating data. The credit review process includes establishing an internal credit rating and any other information deemed necessary to make an informed credit decision, which may include correspondence, due diligence calls and a visit to the entity’s premises, as necessary.
Credit approval is granted subject to certain trading limits and may be subject to additional conditions, such as the receipt of collateral or other credit support. Ongoing credit monitoring procedures include reviewing periodic financial statements and publicly available information on the client and collecting data from credit rating agencies, where available, to assess the ongoing financial condition of the client.
Principal Transaction Risk
Through our subsidiaries, we execute matched principal transactions in which we act as a “middleman” by serving as counterparty to both a buyer and a seller in matching back-to-back trades. These transactions are then settled through a recognized settlement system or third-party clearing organization. Settlement typically occurs within one to three business days after the trade date. Cash settlement of the transaction occurs upon receipt or delivery of the underlying instrument that was traded. We generally avoid settlement of principal transactions on a free-of-payment basis or by physical delivery of the underlying instrument. However, free-of-payment transactions may occur on a very limited basis.
The number of matched principal trades we execute has continued to grow as compared to prior years. Receivables from broker-dealers and clearing organizations and payables to broker-dealers and clearing organizations on our consolidated statements of financial condition primarily represent the simultaneous purchase and sale of the securities associated with those matched principal transactions that have not settled as of their stated settlement dates. Our experience has been that substantially all of these transactions ultimately settle at the contracted amounts.
Market Risk
Market risk refers to the risk that a change in the level of one or more market prices, rates, indices or other factors will result in losses for a specified position. In our Financial Services business, we may allow certain of our desks to enter into unmatched
15
principal transactions in the ordinary course of business and hold long and short inventory positions. These transactions are primarily for the purpose of managing proprietary positions, facilitating clients’ execution needs, adding liquidity to a market or attracting additional order flow. As a result, we may have market risk exposure on these transactions. Our exposure varies based on the size of our overall positions, the risk characteristics of the instruments held and the amount of time the positions are held before they are disposed of. We have limited ability to track our exposure to market risk and unmatched positions on an intra-day basis; however, we attempt to mitigate market risk on these positions by strict risk limits, extremely limited holding periods and hedging our exposure. These positions are intended to be held short term to facilitate customer transactions. However, due to a number of factors, including the nature of the position and access to the market on which it trades, we may not be able to unwind the position and we may be forced to hold the position for a longer period than anticipated. All positions held longer than intra-day are marked to market.
We also have investments in marketable equity securities, which are publicly traded, and which had a fair value of $208.2 million as of December 31, 2017. These include the shares of common stock of NASDAQ that we received in exchange for a portion of our electronic benchmark Treasury platform and the shares of the common stock of ICE that we received in exchange for Trayport. Investments in marketable securities carry a degree of risk, as there can be no assurance that the marketable securities will not lose value and, in general, securities markets can be volatile and unpredictable. As a result of these different market risks, our holdings of marketable securities could be materially and adversely affected. We seek to minimize the effect of price changes on a portion of our investments in marketable securities through the use of derivative contracts. However, there can be no assurance that our hedging activities will be adequate to protect us against price risks associated with our investments in marketable securities. See Note 10—“Marketable Securities” and Note 13—“Derivatives” to our consolidated financial statements in Part II, Item 8 of this Annual Report on Form 10-K for further information regarding these investments and related hedging activities.
Our risk management procedures and strict limits are designed to monitor and limit the risk of unintended loss and have been effective in the past. However, there is no assurance that these procedures and limits will be effective at limiting unanticipated losses in the future. Adverse movements in the securities positions or a downturn or disruption in the markets for these positions could result in a substantial loss. In addition, principal gains and losses resulting from these positions could on occasion have a disproportionate effect, positive or negative, on our consolidated financial condition and results of operations for any particular reporting period.
Operational Risk
Our Financial Services businesses are highly dependent on our ability to process a large number of transactions across numerous and diverse markets in many currencies on a daily basis. If any of our data processing systems does not operate properly or is disabled or if there are other shortcomings or failures in our internal processes, people or systems, we could suffer impairment to our liquidity, financial loss, a disruption of our businesses, liability to clients, regulatory intervention or reputational damage. These systems may fail to operate properly or become disabled as a result of events that are wholly or partially beyond our control, including a disruption of electrical or communications services or our inability to occupy one or more of our buildings. The inability of our systems to accommodate an increasing volume of transactions could also constrain our ability to expand our businesses.
In addition, despite our contingency plans, our ability to conduct business may be adversely impacted by a disruption in the infrastructure that supports our businesses and the communities in which they are located. This may include a disruption involving electrical, communications, transportation or other services used by us or third parties with whom we conduct business.
Further, our operations rely on the secure processing, storage and transmission of confidential and other information on our computer systems and networks. Although we take protective measures such as software programs, firewalls and similar technology to maintain the confidentiality, integrity and availability of our and our clients’ information, the nature of the threats continue to evolve. As a result, our computer systems, software and networks may be vulnerable to unauthorized access, loss or destruction of data (including confidential client information), account takeovers, unavailability or disruption of service, computer viruses, acts of vandalism, or other malicious code, cyber-attacks and other events that could have an adverse security impact. There have also been an increasing number of malicious cyber incidents in recent years in various industries, including ours. Any such cyber incidents involving our computer systems and networks, or those of third parties important to our businesses, could present risks to our operations.
Foreign Currency Risk
We are exposed to risks associated with changes in foreign exchange rates. Changes in foreign currency rates create volatility in the U.S. dollar equivalent of our revenues and expenses in particular with regard to British Pounds and Euros. In addition, changes in the remeasurement of our foreign currency denominated net assets are recorded as part of our results of operations and fluctuate with changes in foreign currency rates. We monitor the net exposure in foreign currencies on a daily basis and may hedge our exposure as deemed appropriate with highly rated major financial institutions.
16
We had $982.5 million in fixed-rate debt outstanding as of December 31, 2017. These debt obligations are not currently subject to fluctuations in interest rates, although in the event of refinancing or issuance of new debt, such debt could be subject to changes in interest rates.
In our Real Estate Services business, Newmark assumed from us the Term Loan (defined below) and Converted Term Loan (defined below). Newmark OpCo (defined below) also assumed from BGC U.S. (defined below) certain note obligations owed to BGC Partners that have an outstanding principal amount of $412.5 million, plus accrued and unpaid interest thereon (which we refer to as the “BGC Notes”). See “Newmark IPO and Separation Transactions.” Following the Newmark IPO and the repayment of the Term Loan and the Converted Term Loan, in the event that any member of the Newmark group receives net proceeds from the incurrence of indebtedness for borrowed money (subject to certain exceptions), Newmark OpCo will be obligated to use such net proceeds to repay the BGC Notes. In addition, Newmark will be obligated to repay any remaining amounts under the Term Loan, Converted Term Loan, and BGC Notes prior to the distribution. Subsequent to the Newmark IPO, Newmark intends to replace the financing provided by the BGC Notes that remain outstanding with new senior term loans (which may be secured or unsecured), new senior unsecured notes, other long- or short-term financing or a combination thereof in an aggregate principal amount of approximately $412.5 million. While the terms of these borrowings, including the interest rates, have not yet been determined, our interest expense could be exposed to changes in interest rates. In that event, Newmark may enter into interest rate swap agreements to attempt to hedge the variability of future interest payments due to changes in interest rates.
Berkeley Point is an intermediary that originates loans which are generally pre-sold prior to loan closing. Therefore, for loans held for sale to the GSEs and HUD, we are not currently exposed to unhedged interest rate risk. Prior to closing on loans with borrowers, we enter into agreements to sell the loans to investors, and originated loans are typically sold within 45 days of funding. The coupon rate for each loan is set concurrently with the establishment of the interest rate with the investor.
Some of our assets and liabilities are subject to changes in interest rates. Earnings from escrows are generally based on LIBOR. 30-day LIBOR as of December 31, 2017 and 2016 was 157 basis points and 77 basis points, respectively. A 100-basis point increase in the 30-day LIBOR would increase our annual earnings by approximately $8.1 million based on our escrow balance as of December 31, 2017 compared to $11.4 million based on our escrow balance as of December 31, 2016. A 100-basis point decrease in 30-day LIBOR would decrease our annual earnings by approximately $8.1 million based on the escrow balance as of December 31, 2017 compared to $8.8 million decrease based on a decrease in 30-day LIBOR to zero and our escrow balance as of December 31, 2016.
We use warehouse facilities, borrowings from related parties, and a repurchase agreement to fund loans we originate under our various lending programs. The borrowing costs of our warehouse facilities and the repurchase agreement is based on LIBOR. A 100-basis point increase in 30-day LIBOR would decrease our annual net interest income by approximately $3.6 million based on our outstanding balances as of December 31, 2017 compared to $7.3 million based on our outstanding balances as of December 31, 2016. A 100-basis point decrease in 30-day LIBOR would increase our annual earnings by approximately $3.6 million based on our outstanding warehouse balance as of December 31, 2017 compared to $7.3 million increase based on a decrease in 30-day LIBOR to zero as of December 31, 2016.
Disaster Recovery
Our processes address disaster recovery concerns. We operate most of our technology from dual-primary data centers at our two different London locations. Either site alone is capable of running all of our essential systems. In addition, we maintain technology operations from data centers in New Jersey and Connecticut. Replicated instances of this technology are maintained in our London data centers. All data centers are built and equipped to best-practice standards of physical security with appropriate environmental monitoring and safeguards. Failover for the majority of our systems is automated.
Competition
Financial Services Competition
We encounter competition in all aspects of our businesses. In our Financial Services businesses, we compete primarily with other inter-dealer or wholesale brokers, including for brokers, salespeople, and suitable acquisition candidates. Our existing and potential competitors are numerous and include other inter-dealer brokerage firms, multi-dealer trading companies, financial technology companies and market data and information vendors, securities and futures exchanges, electronic communications networks, crossing systems, software companies, consortia, business-to-business marketplace infrastructure companies and niche market energy and other commodity Internet-based trading systems.
17
Inter-Dealer or Wholesale Financial Brokers
Our Financial Services segment primarily competes with three major, diversified inter-dealer and/or wholesale financial brokers. These include NEX Group plc (“NEX”) (formerly known as ICAP plc), TP ICAP plc (“TP ICAP”) (formerly known as “Tullett Prebon plc”) and Compagnie Financière Tradition (which is majority owned by Viel & Cie) (“Tradition”), all of which are currently publicly traded companies. Other such competitors include a number of smaller, private firms that tend to specialize in specific product areas or geographies, such as Marex Spectron Group Limited in energy and commodities and Gottex Brokers Holding SA in OTC interest rate derivatives.
Demand for services of brokers is directly affected by national and international economic and political conditions, broad trends in business and finance, the level and volatility of interest rates, changes in and uncertainty regarding tax laws and substantial fluctuations in the volume and price levels of securities transactions. Other significant factors affecting competition in the brokerage industry are the quality and ability of professional personnel, the depth and pricing efficiency of the markets in which the brokers transact, the strength of the technology used to service and execute on those markets and the relative prices of products and services offered by the brokers and by competing markets and trading processes.
Market Data and Financial Software Vendors
The majority of our large inter-dealer and wholesale financial broker competitors also sell proprietary market data and information, which competes with our market data offerings. In addition to direct sales, we resell market data through large market data and information providers. These companies have established significant presences on the vast majority of trading desks in our industry. Some of these market data and information providers, such as Bloomberg L.P. and Thomson Reuters Corporation, include in their product mix electronic trading and execution of both OTC and listed products in addition to their traditional market data offerings.
Exchanges and Other Trading Platforms
Although our businesses will often use exchanges to execute transactions brokered in both listed and OTC markets, we believe that exchanges have sought and will seek to migrate products traditionally traded in OTC markets by inter-dealer and/or wholesale financial brokers to exchanges. However, we believe that when a product goes from OTC to exchange-traded, the underlying or related OTC market often continues to experience growth in line with the growth of the exchange-traded contract. In addition, ICE operates both regulated exchanges and OTC execution services, and in the latter it competes directly with inter-dealer and/or wholesale financial brokers in energy, commodities, and credit products. ICE entered these OTC markets primarily by acquiring independent OTC brokers, and we believe that it is likely ICE or other exchange operators may seek to compete with us in the future by acquiring other such brokers, by creating futures products designed to mimic OTC products, or through other means.
In addition to exchanges, other electronic trading platforms which currently operate in the dealer-to-client markets, including those run by MarketAxess Holdings Inc., have stated an intention to compete with us in the inter-dealer markets. At the same time, we have begun to offer an increasing number of our services to the customers of firms like MarketAxess.
Further, ICE also operates a swap execution facility (“SEF”), as does Tradeweb Markets LLC (“Tradeweb”), and we expect that other exchanges and trading platforms may also seek to do so.
In connection with the NASDAQ Transaction, we agreed that, for three years after the closing, we and Cantor will not engage in the business of fully electronic brokerage of benchmark on-the-run U.S. Treasuries and certain transactions in first off-the-run U.S. Treasuries, subject to certain exceptions. See “NASDAQ Transaction.” Certain subsidiaries of GFI agreed that, for two years after the closing of the Trayport Transaction, they will not provide software to operate a trading network for certain energy commodities in Europe, substantially as conducted by the Trayport Business at closing, subject to certain exceptions. The anniversaries of the transactions have since passed and we are able to compete in these markets.
Banks and Broker-Dealers
Banks and broker-dealers have in the past created and/or funded consortia to compete with exchanges and inter-dealer brokers. For example, NEX’s inter-dealer businesses for fully electronic trading of U.S. Treasuries and spot foreign exchange both began as dealer-owned consortia before being acquired by NEX. An example of a current and similar consortium is Tradeweb. Currently, several large banks hold stakes in Tradeweb, an Internet-based market intermediary. Thomson Reuters Corporation is Tradeweb’s single largest shareholder. Although Tradeweb operates primarily as a dealer to customer platform, some of its offerings include a voice and electronic inter-dealer platform and a SEF. In addition, Tradeweb’s management has said that it would like to expand into other inter-dealer markets, and as such may compete with us in other areas over time.
18
In addition, certain investment management firms that traditionally deal with banks and broker-dealers have expressed a desire to have direct access to certain parts of the wholesale financial markets via firms such as ours. We believe that over time, interdealer-brokers will therefore gain a small percentage of the sales and trading market currently dominated by banks and broker-dealers. Since their collective revenues are many times those of the global inter-dealer market, we believe that our gaining a small share of banks and broker-dealers’ revenues would lead to a meaningful increase in our Financial Services revenues.
Overall, we believe that we may also face future competition from market data and technology companies and some securities brokerage firms, some of which are currently our customers, as well as from any future strategic alliances, joint ventures or other partnerships created by one or more of our potential or existing competitors.
Real Estate Services Competition
In our Real Estate Services business, we compete across a variety of business disciplines within the commercial real estate industry, including commercial property and corporate facilities management, owner-occupier, property and agency leasing, property sales, valuation, capital markets (equity and debt) solutions, GSE lending and loan servicing and development services. Each business discipline is highly competitive on a local, regional, national and global level. Depending on the geography, property type or service, we compete with other commercial real estate service providers, including outsourcing companies that traditionally competed in limited portions of our real estate management services business and have recently expanded their offerings. These competitors include companies such as Aramark, ISS A/S and ABM Industries. We also compete with in-house corporate real estate departments, developers, institutional lenders, insurance companies, investment banking firms, investment managers and accounting and consulting firms in various parts of our business. Despite recent consolidation, the commercial real estate services industry remains highly fragmented and competitive. Although many of our competitors are local or regional firms that are smaller than us, some of these competitors are more entrenched than us on a local or regional basis. We are also subject to competition from other large multi-national firms that have similar service competencies to ours, including CBRE Group, Inc., Jones Lang LaSalle Inc., Cushman & Wakefield (majority-owned by TPG Capital), Savills Studley, Inc. and Colliers International Group, Inc. In addition, more specialized firms like HFF, Inc., Marcus & Millichap Inc., Eastdil Secured LLC (part of Wells Fargo & Company) and Walker & Dunlop compete with us in certain service lines.
Seasonality
Traditionally, the financial markets around the world experience lower volume during the summer and at the end of the year due to a general slowdown in the business environment around holiday seasons, with our Financial Services revenues tending to be strongest in the first quarter and lowest in the fourth quarter. For the year 2016, we earned approximately 27% of our Financial Services revenues in the first quarter, while in 2017 we earned 26% of our Financial Services revenues in the first quarter.
Due to the strong desire of many market participants to close real estate transactions prior to the end of a calendar year, our Real Estate Services business exhibits certain seasonality, with our revenue tending to be lowest in the first quarter and strongest in the fourth quarter. For the full year ended 2016, we earned 20% of our Real Estate Services revenues in the first quarter and 29% of our Real Estate Services revenues in the fourth quarter, while the comparable figures were 21% and 29%, respectively, in 2017.
Partnership Overview
We believe that our partnership structure is one of the unique strengths of our business and we have applied our partnership model to both our Financial Services and our Real Estate Services businesses. Many of our key brokers, salespeople and other front office professionals have their own capital invested in our business, aligning their interests with our stockholders. Limited partnership interests in BGC Holdings and Newmark Holdings consist of: (i) “founding/working partner units” held by limited partners who are employees; (ii) “limited partnership units,” which consist of a variety of units that are generally held by employees such as REUs, RPUs, PSUs, PSIs, PSEs, LPUs, APSUs, APSIs, APSEs, AREUs, ARPUs and NPSUs; (iii) “Cantor units” which are the exchangeable limited partnership interests held by Cantor entities; and (iv) preferred partnership units (“Preferred Units”), which are working partner units that may be awarded to holders of, or contemporaneous with, the grant of REUs, RPUs, PSUs, PSIs, PSEs, LPUs, APSUs, APSIs, APSEs, AREUs, ARPUs and NPSUs. For further details, see “Our Organizational Structure.” NPSUs are partnership units that are not entitled to participate in partnership distributions, not allocated any items of profit or loss and may not be exchangeable into shares of our common stock. On terms and conditions determined by the General Partner of the Partnership in its sole discretion, NPSUs are expected to be replaced by a grant of PSUs, PPSUs, LPUs or PLPUs, which may be set forth in a written schedule and subject to additional terms and conditions, provided that, in all circumstances such grant of PSUs, PPSUs, LPUs or PLPUs shall be contingent upon our, including our affiliates, earning, in aggregate, at least $5 million in gross revenues in the calendar quarter in which the applicable award of PSUs, PPSUs, LPUs, or PLPUs is to be granted. In addition, we have NREUs, NPREUs, NLPUs, NPLPUs and NPPSUs (collectively, the “N Units”) which are non-distributing partnership units that may not be allocated any item of profit or loss and may not be made exchangeable into shares of our Class A common stock. Subject to the approval of the Compensation Committee or its designee, the N Units are expected to be converted into the underlying unit type (i.e., an NREU will be converted into an REU) and then participate in Partnership distributions, subject to terms and conditions determined
19
by the General Partner of the Partnership in its sole discretion, including that the recipient continue to provide substantial services to us and comply with his or her partnership obligations.
We believe that our partnership structure is an effective tool in recruiting, motivating and retaining key employees. Many brokers are attracted by the opportunity to become partners because the partnership agreement generally entitles partners to quarterly distributions of income from the partnership. While BGC Holdings limited partnership interests generally entitle our partners to participate in distributions of income from the operations of our business, upon leaving BGC Holdings (or upon any other redemption or purchase of such limited partnership interests as described below), any such partners are only entitled to receive over time, and provided he or she does not violate certain partner obligations, an amount for his or her BGC Holdings limited partnership interests that reflects such partner’s capital account or compensatory grant awards, excluding any goodwill or going concern value of our business unless Cantor, in the case of the founding partners, and we, as the general partner of BGC Holdings, otherwise determine. Our partners can receive the right to exchange their BGC Holdings limited partnership interests for shares of our Class A common stock (if, in the case of founding partners, Cantor so determines and, in the case of working partners and limited partnership unit holders, the BGC Holdings general partner, with Cantor’s consent, determines otherwise) and thereby realize any higher value associated with our Class A common stock. Similar provisions with respect to Newmark Holdings limited partnership interests are contained in the Newmark Holdings limited partnership agreement. We believe that, having invested in us, partners feel a sense of responsibility for the health and performance of our business and have a strong incentive to maximize our revenues and profitability.
Relationship Between BGC Partners and Cantor
See “Risk Factors—Risks Related to our Relationship with Cantor and its Affiliates.”
Newmark IPO and Separation Transactions
Separation and Distribution Agreement
On December 13, 2017, prior to the closing of the Newmark IPO, BGC, BGC Holdings, L.P. (“BGC Holdings”), BGC Partners, L.P. (“BGC U.S. OpCo”), Newmark, Newmark Holdings, Newmark Partners, L.P. (“Newmark OpCo”) and, solely for the provisions listed therein, Cantor and BGC Global Holdings, L.P. (“BGC Global OpCo”) entered into a Separation and Distribution Agreement (the “Separation and Distribution Agreement”). The Separation and Distribution Agreement sets forth the agreements among BGC, Cantor, Newmark and their respective subsidiaries regarding, among other things:
|
|
• |
|
the principal corporate transactions pursuant to which BGC, BGC Holdings and BGC U.S. OpCo and their respective subsidiaries (other than the Newmark Group (defined below), the “BGC Group”) transferred to Newmark, Newmark Holdings and Newmark OpCo and their respective subsidiaries (the “Newmark Group”) the assets and liabilities of the BGC Group relating to BGC’s Real Estate Services business (the “Separation”); |
|
|
• |
|
the proportional distribution of interests in Newmark Holdings to holders of interests in BGC Holdings; |
|
|
• |
|
the Newmark IPO; |
|
|
• |
|
the assumption and repayment of indebtedness by the BGC Group and the Newmark Group, as further described below; |
|
|
• |
|
the pro rata distribution of the shares of Newmark Class A common stock and the shares of Newmark Class B common stock held by BGC, pursuant to which shares of Newmark Class A Common Stock held by BGC would be distributed to the holders of shares of Class A common stock of BGC) and shares of Newmark Class B Common Stock held by BGC would be distributed to the holders of shares of Class B common stock of BGC (which are currently Cantor and another entity controlled by Howard W. Lutnick), which distribution is intended to qualify as generally tax-free for U.S. federal income tax purposes; provided that the determination of whether, when and how to proceed with the Distribution shall be entirely within the discretion of BGC; and |
|
|
• |
|
other agreements governing the relationship between BGC, Newmark and Cantor. |
Related Agreements
In connection with the Separation and the Newmark IPO, on December 13, 2017, the applicable parties entered into the following additional agreements:
|
|
• |
|
an Amended and Restated Agreement of Limited Partnership of Newmark Holdings, dated as of December 13, 2017; |
|
|
• |
|
an Amended and Restated Agreement of Limited Partnership of Newmark OpCo, dated as of December 13, 2017; |
|
|
• |
|
a Second Amended and Restated Agreement of Limited Partnership of BGC U.S. OpCo, dated as of December 13, 2017; |
|
|
• |
|
a Second Amended and Restated Agreement of Limited Partnership of BGC Global OpCo, dated as of December 13, 2017; |
20
|
• |
|
a Registration Rights Agreement, dated as of December 13, 2017, by and among Cantor, BGC and Newmark; |
|
|
• |
|
a Transition Services Agreement, dated as of December 13, 2017, by and between BGC and Newmark; |
|
|
• |
|
a Tax Matters Agreement, dated as of December 13, 2017, by and among BGC, BGC Holdings, BGC U.S. OpCo, Newmark, Newmark Holdings and Newmark OpCo; |
|
|
• |
|
an Amended and Restated Tax Receivable Agreement, dated as of December 13, 2017, by and between Cantor and BGC; |
|
|
• |
|
an Exchange Agreement, dated as of December 13, 2017, by and among Cantor, BGC and Newmark; |
|
|
• |
|
an Administrative Services Agreement, dated as of December 13, 2017, by and between Cantor and Newmark; and |
|
|
• |
|
a Tax Receivable Agreement, dated as of December 13, 2017, by and between Cantor and Newmark. |
Underwriting Agreement
On December 14, 2017, Newmark entered into the Underwriting Agreement by and among Newmark and Goldman Sachs & Co. LLC, Merrill Lynch, Pierce, Fenner & Smith Incorporated, Citigroup Global Markets Inc. and Cantor Fitzgerald & Co. as representatives of the several underwriters (“Underwriters”) named therein (the “Underwriting Agreement”), in connection with the initial public offering of up to 23.0 million shares of Newmark’s Class A Common Stock, which included 3.0 million shares of Class A Common Stock allocated to the Underwriters’ over-allotment option. Sandler O’Neill & Partners, L.P. acted as the qualified independent underwriter for purposes of Financial Industry Regulatory Authority Rule 5121.
Credit Agreements
On November 22, 2017, BGC and Newmark entered into an amendment (the “Term Loan Amendment”) to the unsecured senior term loan credit agreement (the “Term Loan Credit Agreement”), dated as of September 8, 2017, with Bank of America, N.A., as administrative agent (the “Administrative Agent”), and a syndicate of lenders. The Term Loan Credit Agreement provides for a term loan of up to $575.0 million (the “Term Loan”), pursuant to the Term Loan Amendment and effective as of the Separation, Newmark assumed the obligations of BGC as borrower under the Term Loan. The net proceeds from the Newmark IPO have been used to partially repay $304.3 million under the Term Loan, which had a balance of $270.7 million as of December 31, 2017.
On November 22, 2017, BGC and Newmark entered into an amendment (the “Revolver Amendment”) to the unsecured senior revolving credit agreement (the “Revolving Credit Agreement”), dated as of September 8, 2017, with the Administrative Agent and a syndicate of lenders. The Revolving Credit Agreement provides for revolving loans of up to $400.0 million (the “Revolving Credit Facility”). Pursuant to the Revolver Amendment, the then-outstanding borrowings of BGC under the Revolving Credit Facility were converted into a term loan (the “Converted Term Loan”) and, effective upon the Separation, Newmark assumed the obligations of BGC as borrower under the Converted Term Loan. BGC remains a borrower under, and retains access to, the Revolving Credit Facility for any future draws, subject to availability which increases as Newmark repays the Converted Term Loan. The Converted Term Loan had a balance of $400.0 million as of December 31, 2017.
2042 Promissory Note
On June 26, 2012, BGC issued an aggregate of $112.5 million principal amount of its 8.125% Senior Notes due 2042 (the “8.125% BGC Senior Notes”). In connection with the issuance of the 8.125% BGC Senior Notes, BGC lent the proceeds of the 8.125% BGC Senior Notes to BGC U.S. OpCo, and BGC U.S. OpCo issued an amended and restated promissory note, effective as of June 26, 2012, with an aggregate principal amount of $112.5 million payable to BGC (the “2042 Promissory Note”). In connection with the Separation, on December 13, 2017, Newmark OpCo assumed all of BGC U.S. OpCo’s rights and obligations under the 2042 Promissory Note.
2019 Promissory Note
On December 9, 2014, BGC issued an aggregate of $300.0 million principal amount of its 5.375% Senior Notes due 2019 (the “5.375% BGC Senior Notes”). In connection with the issuance of the 5.375% BGC Senior Notes, BGC lent the proceeds of the 5.375% BGC Senior Notes to BGC U.S. OpCo, and BGC U.S. OpCo issued an amended and restated promissory note, effective as of December 9, 2014, with an aggregate principal amount of $300.0 million payable to BGC (the “2019 Promissory Note”). In connection with the Separation, on December 13, 2017, Newmark OpCo assumed all of BGC U.S. OpCo’s rights and obligations under the 2019 Promissory Note.
21
Intercompany Revolving Credit Agreement
In connection with the Separation, on December 13, 2017, BGC entered into an unsecured senior revolving credit agreement (the “Intercompany Revolving Credit Agreement”) with Newmark. The Intercompany Revolving Credit Agreement provides for each party to issue revolving loans to the other party in the lender’s discretion.
BP Transaction Agreement and Real Estate LP Limited Partnership Agreement
On September 8, 2017, pursuant to a transaction agreement (which we refer to as the “BP Transaction Agreement”) with Cantor, CCRE, the general partner of CCRE, Real Estate LP and CF Real Estate Holdings GP, LLC, the general partner of Real Estate LP (which we refer to as the “Real Estate LP general partner”), BGC Partners purchased from CCRE all of the outstanding membership interests of Berkeley Point. The total consideration for the acquisition of Berkeley Point was $875 million, subject to certain adjustments. Concurrently with the acquisition of Berkeley Point, (i) BGC Partners invested $100 million of cash in Real Estate LP for approximately 27% of the capital of Real Estate LP, and (ii) Cantor contributed approximately $267 million of cash for approximately 73% of the capital of Real Estate LP. We refer to these transactions, collectively, as the “BP Transaction.” As part of the Separation described above, we contributed our interests in Berkeley Point and Real Estate LP to Newmark. Newmark accounted for its minority interest in Real Estate LP as an equity investment, and it is not consolidated in Newmark’s financial statements.
Berkeley Point Acquisition
Pursuant to the BP Transaction Agreement, we purchased from CCRE all of the outstanding membership interests of Berkeley Point for a purchase price equal to $875 million, subject to certain adjustments, with $3.2 million of the purchase price paid in units of BGC Holdings (which we refer to as the “Berkeley Point Acquisition”). In accordance with the BP Transaction Agreement, Berkeley Point made a distribution of $69.8 million to CCRE prior to the Berkeley Point Acquisition, for the amount by which Berkeley Point’s net assets exceeded $508.6 million. Cantor is entitled to receive the profits and obligated to bear the losses of the special asset servicing business of Berkeley Point, which represents less than 10% of Berkeley Point’s servicing portfolio and generates an immaterial amount of Berkeley Point’s servicing fee revenue.
Investment in Real Estate LP
Concurrently with the Berkeley Point Acquisition, we invested with Cantor in Real Estate LP. Real Estate LP may conduct activities in any real estate-related business or asset-backed securities-related business or any extensions thereof and ancillary activities thereto. Real Estate LP is operated and managed by Real Estate LP General Partner, which is controlled by Cantor.
Pursuant to the Amended and Restated Agreement of Limited Partnership of Real Estate LP (which we refer to as the “Real Estate LP limited partnership agreement”), Newmark is entitled to a cumulative annual preferred return of five percent of its capital account balance (which we refer to as the “Preferred Return”). After the Preferred Return is allocated, Cantor is then entitled to a cumulative annual preferred return of five percent of its capital account balance. Thereafter, Newmark is entitled to 60% of the gross percentage return on capital of Real Estate LP, multiplied by Newmark’s capital account balance in Real Estate LP (less any amounts previously allocated to BGC Partners or Newmark pursuant to the Preferred Return), with the remainder of the net income of Real Estate LP allocated to Cantor. Cantor will bear initial net losses of Real Estate LP, if any, up to an aggregate amount of approximately $37 million per year. These allocations of net income and net loss are subject to certain adjustments.
At the option of Newmark, and upon one-year’s written notice to Real Estate LP delivered any time on or after the fourth anniversary of the closing of the BP Transaction, Real Estate LP will redeem in full Newmark’s investment in Real Estate LP in exchange for Newmark’s capital account balance in Real Estate LP as of such time. At the option of Cantor, at any time on or after the fifth anniversary of the closing of the BP Transaction, Real Estate LP will redeem in full Newmark’s investment in Real Estate LP in exchange for Newmark’s capital account balance in Real Estate LP as of such time. At the option of Cantor, at any time prior to the fifth anniversary of the closing of the BP Transaction, Real Estate LP will redeem in full Newmark’s investment in Real Estate LP in exchange for (i) Newmark’s capital account balance in Real Estate LP as of such time plus (ii) the sum of the Preferred Return amounts for any prior taxable periods, less (iii) any net income allocated to BGC Partners or Newmark in any prior taxable periods.
Additional Terms of the BP Transaction Agreement
The BP Transaction Agreement includes customary representations, warranties and covenants, including covenants related to intercompany referral arrangements among Cantor, BGC Partners, Newmark and their respective subsidiaries. These referral arrangements provide for profit-sharing and fee-sharing arrangements at various rates depending on the nature of a particular referral. The parties have further agreed that, subject to limited exceptions, for so long as a member of the BGC group or a member of the Newmark group maintains an investment in Real Estate LP, Real Estate LP and the Cantor group will seek certain government-sponsored and government-funded loan financing exclusively through Berkeley Point.
22
Financial Services
U.S. Regulation
The financial services industry in the United States is subject to extensive regulation under both federal and state laws. As registered broker-dealers, introducing brokers and Futures Commissions Merchants, and other types of regulated entities as described below, certain of our subsidiaries are subject to laws and regulations which cover all aspects of financial services, including sales methods, trade practices, use and safekeeping of customers’ funds and securities, minimum capital requirements, recordkeeping, business practices, securities lending and financing of securities purchases and the conduct of associated persons. We and our subsidiaries also are subject to the various anti-fraud provisions of the Securities Act, the Exchange Act, the Commodity Exchange Act, certain state securities laws and the rules and regulations thereunder. We also may be subject to vicarious and controlling person liability for the activities of our subsidiaries and our officers, employees and affiliated persons.
The SEC is the federal agency primarily responsible for the administration of federal securities laws, including adopting rules and regulations applicable to broker-dealers (other than government securities broker-dealers) and enforcing both its rules regarding broker-dealers and the Treasury’s rules regarding government securities broker-dealers. In addition, we operate a number of platforms that are governed pursuant to SEC Regulation ATS. Broker-dealers are also subject to regulation by state securities administrators in those states in which they conduct business or have registered to do business. In addition, Treasury rules relating to trading government securities apply to such activities when engaged in by broker-dealers. The Commodities Futures Trading Commission (the “CFTC”) is the federal agency primarily responsible for the administration of federal commodities future laws and other acts, including the adoption of rules applicable to Futures Commissions Merchants, Designated Contract Markets (“DCM”) and Swap Execution Facilities (“SEF”) such as BGC Derivative Markets, L.P. and GFI Swaps Exchange LLC.
Much of the regulation of broker-dealers’ operations in the United States has been delegated to self-regulatory organizations. These self-regulatory organizations adopt rules (which are subject to approval by the SEC) that govern the operations of broker-dealers and government securities broker-dealers and conduct periodic inspections and examinations of their operations. In the case of our U.S. broker-dealer subsidiaries, the principal self-regulatory organization is FINRA. FINRA was formed from the consolidation of the NASD’s member regulation operations and the regulatory arm of the NYSE Group to act as the self-regulatory organization for all broker-dealers doing business within the United States. Accordingly, our U.S. subsidiaries are subject to both scheduled and unscheduled examinations by the SEC and FINRA. In our futures-related activities, our subsidiaries are also subject to the rules of the CFTC, futures exchanges of which they are members and the National Futures Association (“NFA”), a futures self-regulatory organization.
The changing regulatory environment, new laws that may be passed by Congress, and rules that may be promulgated by the SEC, the Treasury, the Federal Reserve Bank of New York, the CFTC, the NFA, FINRA and other self-regulatory organizations, or changes in the interpretation or enforcement of existing laws and rules, if adopted, may directly affect our operations and profitability and those of our competitors and customers and of the securities markets in which we participate in a way that could adversely affect our businesses.
The SEC, self-regulatory organizations and state securities administrators conduct informal and formal investigations of possible improprieties or illegal action by broker-dealers and their “associated persons,” which could be followed by the institution of administrative, civil and/or criminal proceedings against broker-dealers and/or “associated persons.” Among the sanctions that may result if administrative, civil or criminal proceedings were ever instituted against us or our “associated persons” are injunctions, censure, fines, penalties, the issuance of cease-and-desist orders or suspension or expulsion from the industry and, in rare instances, even imprisonment. The principal purpose of regulating and disciplining broker-dealers is to protect customers and the securities markets, rather than to protect broker-dealers or their creditors or equity holders. From time to time, our “associated persons” have been and are subject to routine investigations, none of which to date have had a material adverse effect on our businesses, financial condition, results of operations or prospects.
In light of recent events in the U.S. and global financial markets, regulators and legislators in the U.S. and European Union (“EU”) continue to craft new laws and regulations for the global OTC derivatives markets, including the Dodd-Frank Wall Street Reform and Consumer Protection Act (the “Dodd-Frank Act”), which became law in July 2010. The Dodd-Frank Act mandates or encourages several reforms regarding derivatives, including new regulations for swaps markets creating impartiality considerations, additional pre- and post-trade transparency requirements, and heightened collateral or capital standards, as well as recommendations for the obligatory use of central clearing for most standardized derivatives. The law also requires that standardized OTC derivatives be traded in an open and non-exclusionary manner on a DCM or a SEF. The SEC is still in the process of finalizing rules for the implementation of many of these requirements and it is anticipated that the SEC may release their rule set surrounding security-based SEFs in 2018. The actual implementation of such rules may be phased in over a longer period.
23
As these rules require authorized execution facilities to maintain robust front-end and back-office IT capabilities and to make large and ongoing technology investments, and because these execution facilities may be supported by a variety voice and auction-based execution methodologies, we expect our hybrid and fully electronic trading capability to perform strongly in such an environment.
Similarly, while the recently adopted Volcker Rule does not apply directly to us, the Volcker Rule may have a material impact on many of the banking and other institutions with which we do business or compete. There may be continued uncertainty regarding the Volcker Rule, its impact on various affected businesses, how those businesses will respond to it, and the effect that it will have on the markets in which we do business.
BGC Derivative Markets, L.P. (“BGC Derivative Markets”), and GFI Swaps Exchange LLC, our subsidiaries, began operating as SEFs on October 2, 2013. Both BGC Derivative Markets and GFI Swaps Exchange received permanent registration approval from the CFTC as SEFs on January 22, 2016. Mandatory Dodd-Frank Act compliant execution on SEFs by eligible U.S. persons commenced in February 2014 for “made available to trade” products, and a wide range of other rules relating to the execution and clearing of derivative products have been finalized with implementation periods in 2016 and beyond.
We believe that the November 2016 election results in the U.S. make it possible that some of the Dodd-Frank rules may be modified or repealed, which could be a net positive for our Financial Services business and its largest customers. Along these lines, the U.S. Treasury, in a report released in June 2017, called for streamlining of rules and easing regulatory burdens on banks. However, there can be no assurance that these rules will be amended, and we continue to expect the industry to be more heavily regulated than it was prior to the financial crisis of 2008-2009, and we are prepared to operate under a variety of regulatory regimes. While we continue to have compliance framework in place to comply with both existing and proposed rules and regulations, it is possible that the existing regulatory framework may be amended or relaxed.
U.K. and European Regulation
The Financial Conduct Authority (“FCA”) is the relevant statutory regulator for the United Kingdom financial services industry. The FCA’s objectives are to protect customers, maintain the stability of the financial services industry and promote competition between financial services providers. It has broad rule-making, investigative and enforcement powers derived from the Financial Services and Markets Act 2000 and subsequent and derivative legislation and regulations. The FCA’s recent focus has been on liquidity risk management and separation of business and prudential regulation. Currently, we have subsidiaries and branches regulated by the FCA (BGC Brokers L.P., the U.K. branch of Aurel BGC, GFI Securities Ltd., GFI Brokers Limited, Sunrise Brokers LLP and CSC Commodities Limited).
From time to time, we have been and are subject to periodic examinations, inspections and investigations, including periodic risk assessment and related reviews of our U.K. group. As a result of such reviews, we may be required to include or enhance certain regulatory structures and frameworks in our operating procedures, systems and controls. We are also required to obtain approval from the FCA to acquire control of U.K.-regulated firms.
Increasingly, the FCA has developed a practice of requiring senior officers of regulated firms to provide individual attestations or undertakings as to the status of a firm’s control environment, compliance with specific rules and regulations, or the completion of required tasks. Officers of BGC Brokers L.P. and GFI Brokers Limited have given such attestations or undertakings in the past and may do so again in the future. Similarly, the FCA can seek a voluntary requirement notice, which is a voluntary undertaking on behalf of a firm that is made publicly available on the FCA’s website.
Recent European Regulatory Developments
The European Market Infrastructure Regulation on OTC derivatives, central counterparties and trade repositories (“EMIR”) was adopted in July 2012. EMIR fulfills several of the EU’s G20 commitments to reform OTC derivatives markets. The reforms are designed to reduce systemic risk and bring more transparency to both OTC and listed derivatives markets. EMIR derivatives rules will apply initially to financial and non-financial firms that are counterparties to derivatives contracts in the EU and later to those trading outside the EU under certain circumstances.
Along with the implementation of EMIR reporting requirements, the Regulation on Wholesale Energy Markets Integrity and Transparency (“REMIT”) Implementation Acts became effective on January 7, 2015. The REMIT Implementing Acts developed by the European Commission define the details of reporting under REMIT, drawing up the list of reportable contracts and derivatives; defining details, timing and form of reporting, and establishing harmonized rules to report that information to the Agency for the Cooperation of Energy Regulators (“ACER”). They enable ACER to collect information in relation to wholesale energy market transactions and fundamentals through the Agency’s REMIT Information System (ARIS), to analyze this data to detect market abuse and to report suspicious events to the National Competent Authorities, which are responsible for investigating these matters further, and if required, imposing sanctions. Market participants and third parties reporting on their behalf have had to: (i) by October 7, 2015,
24
report transactions executed at organized market places and fundamental data from the central information transparency platforms; and (ii) by April 7, 2016, report transactions in the remaining wholesale energy contracts (OTC standard and non-standard supply contracts, transportation contracts) and additional fundamental data.
To achieve a high level of harmonization and convergence in regular supervisory reporting requirements, the Committee of European Banking Supervisors issued guidelines on prudential reporting with the aim of developing a supervisory reporting framework based on common formats, known as COREP. COREP has become part of European Banking Authorities’ implementing technical standards on reporting. In addition, guidelines on Financial Reporting covering consolidated and sub-consolidated financial reporting for supervisory purposes based on International Financial Reporting Standards are being developed, known as FINREP. These initiatives will impact the nature, timing and extent of regulatory reporting for our European regulated group.
Basel III (or the Third Basel Accord) is a global regulatory standard on bank capital adequacy, stress testing and market liquidity risk scheduled to be introduced by bank regulators in most, if not all, of the world’s major economies by 2019. Basel III is designed to strengthen bank capital requirements and introduces new regulatory requirements on bank liquidity and bank leverage. The adoption of these proposed rules could restrict the ability of our large bank and broker-dealer customers to operate proprietary trading businesses and to maintain current capital market exposures under the present structure of their balance sheets, and will cause these entities to need to raise additional capital in order to stay active in our marketplaces.
Much of our global derivatives volumes continue to be executed by non-U.S. based clients outside the U.S. and subject to local prudential regulations. As such, we will continue to operate a number of EU regulated venues in accordance with EU directives and licensed by the FCA and other EU based national Competent Authorities. The second Markets in Financial Instruments Directive II (“MiFID II”) was published by the European Securities and Markets Authority (“ESMA”) in September 2015, and implementation commenced in January 2018.
MiFID II requires a significant part of the market in these instruments to trade on trading venues subject to transparency regimes, not only in pre- and post- trade prices, but also in fee structures and access. In addition, it will have a particularly significant impact in a number of key areas, including corporate governance, transaction reporting, pre- and post-trade transparency, technology synchronization, best execution and investor protection. As was the case with the introduction of the Dodd-Frank Act, including the ramifications of Title VII across the financial markets, it is expected there will be a lengthy time period before all of the Regulatory Technical Standards are completely operative.
MiFID II is intended to help improve the functioning of the EU single market by achieving a greater consistency of regulatory standards. By design, therefore, it is intended that Member States should have very similar regulatory regimes in relation to the matters addressed to MiFID. MiFID II also introduces a new regulated execution venue category known as the Organized Trading Facility (“OTF”) (in addition to the venue category of Multilateral Trading Facility (“MTF”) for electronic trading) that will capture much of the voices and hybrid oriented trading in EU. Much of our existing EU derivatives and fixed income execution business will in the future take place on OTFs. Rules on public and non-discriminatory pricing structures of venues, and the related uncertainty of retaining traditional forms of revenue under the new regime, are expected to be a focus of our European regulated entities. Authorization has been obtained from the FCA to operate an OTF at BGC Brokers L.P., GFI Brokers Limited, GFI Securities Limited and Sunrise Brokers LLP, and to operate an MTF at GFI Brokers Limited and GFI Securities Limited. Authorization from the French Autorité des marchés financiers (“AMF”) has also been obtained to operate an OTF at Aurel BGC.
On June 23, 2016, the U.K. held a referendum regarding continued membership in the European Union (the “EU”). The exit from the EU is commonly referred to as “Brexit.” The Brexit vote passed by 51.9% to 48.1%. The referendum was non-binding. However, on March 29, 2017, the Prime Minister gave the European Council of the EU formal written notification of the U.K.’s intention to leave the EU, triggering the withdrawl process under Article 50 of the Lisbon Treaty. The effects of Brexit will depend on any agreements the U.K. makes to retain access to EU markets – including for financial services – either during a transitional period or more permanently. Negotiations started in earnest following the Parliamentary elections held on June 8, 2017. These negotiations under Article 50 are to determine the future terms of the U.K.’s relationship with the EU, including the terms of access to EU financial markets. There is proposed to be a transition period from March 29, 2019, when the U.K. is expected to leave the EU, to the end of 2020. Negotiations on the terms of the transition are continuing. Negotiations for an agreement with the EU following the U.K.’s exit could take longer and the EU could agree to a longer transition period.
We are unable to predict how any of these new laws and proposed rules and regulations in the U.S. or the U.K. will be implemented or in what form, or whether any additional or similar changes to statutes or rules and regulations, including the interpretation or implementation thereof or a relaxation or other amendment of existing rules and regulations, will occur in the future. Any such action could affect us in substantial and unpredictable ways, including increased reporting costs and a potential rearrangement in the sources of available revenue in a more transparent market. Certain enhanced regulations could subject us to the risk of fines, sanctions, enhanced oversight, increased financial and capital requirements and additional restrictions or limitations on our ability to conduct or grow our businesses, and could otherwise have an adverse effect on our businesses, financial condition, results of operations and prospects. We believe that uncertainty and potential delays around the final form of such new rules and
25
regulations might take may negatively impact our customers and trading volumes in certain markets in which we transact , although a relaxation of existing rules and requirements could potentially have a positive impact in certain markets. Increased capital requirements may also diminish transaction velocity. We believe that it remains premature to know conclusively the specific aspects of the U.S. and EU proposals that may directly affect our businesses, as some proposals have not yet been finalized and others which have been proposed remain subject to supervisory debate. While we generally believe the net impact of the rules and regulations may be positive for our businesses, it is possible that unintended consequences of the rules and regulations may materially adversely affect us in ways yet to be determined.
26
Other Financial Services Regulation
Our subsidiaries that have foreign operations are subject to regulation by the relevant regulatory authorities and self-regulatory organizations in the countries in which they do business. The following table sets forth certain jurisdictions, other than the United States, in which we do business and the applicable regulatory authority or authorities of each such jurisdiction:
|
|
|
|
Jurisdiction
|
Regulatory Authorities/Self-Regulatory Organizations
|
|
Argentina |
Comisión Nacional de Valores |
|
|
|
|
Australia |
Australian Securities and Investments Commission and Australian Securities Exchange |
|
|
|
|
Bahrain |
The Central Bank of Bahrain |
|
|
|
|
Belgium |
National Bank of Belgium, L’Autorité des services et marchés financiers |
|
|
|
|
Brazil |
Brazilian Securities and Exchange Commission, the Central Bank of Brazil, BM&F BOVESPA |
|
|
|
|
Canada |
Ontario Securities Commission, Autorite des Marches Financiers (Quebec), Investment Industry Regulatory Organization of Canada (IIROC) |
|
|
|
|
Chile |
Superintendencia de Valores y Seguros |
|
|
|
|
China |
China Banking Regulatory Commission, State Administration of Foreign Exchange |
|
|
|
|
Columbia |
Superintendencia Financiera de Columbia |
|
|
|
|
Denmark |
Finanstilsynet |
|
|
|
|
Dubai |
Dubai Financial Supervisory Authority |
|
|
|
|
France |
ACPR (L’Autorité de Contrôle Prudentiel et de Résolution), AMF (Autorité des Marchés Financiers) |
|
|
|
|
Hong Kong |
Hong Kong Securities and Futures Commission, The Hong Kong Monetary Authority and Professional Insurance Brokers Association |
|
|
|
|
Ireland |
Central Bank of Ireland |
|
|
|
|
Japan |
Japanese Financial Services Agency, Japan Securities Dealers Association and the Securities and Exchange Surveillance Commission |
|
|
|
|
Mexico |
Banking and Securities National Commission, Comision Nacional Bancaria y de Valores (CNBV) |
|
|
|
|
Peru |
Ministerio de Economica y Finanzas |
|
|
|
|
Philippines |
Securities and Exchange Commission |
|
|
|
|
Russia |
Federal Service for Financial Markets |
|
|
|
|
Singapore |
Monetary Authority of Singapore |
|
|
|
|
South Africa |
Johannesburg Stock Exchange |
|
|
|
|
|
|
|
South Korea |
Ministry of Strategy and Finance, The Bank of Korea, The Financial Services Commission and The Financial Supervisory Service |
|
|
|
|
Spain |
Comision Nacional del Mercado de Valores (CNMV) |
|
|
|
|
Switzerland |
Financial Markets Supervisory Authority (FINMA), Swiss Federal Banking Commission |
|
|
|
|
Turkey |
Capital Markets Board of Turkey and The Financial Crimes Investigation Board of Turkey and the Undersecretariat of the Turkish Treasury |
|
|
|
|
United Kingdom |
Financial Conduct Authority |
27
Real Estate Services Regulation
The brokerage of real estate sales and leasing transactions, property and facilities management, conducting real estate valuation and securing debt for clients, among other business lines, also require that we comply with regulations affecting the real estate industry and maintain licenses in the various jurisdictions in which we operate. Like other market participants that operate in numerous jurisdictions and in various business lines, we must comply with numerous regulatory regimes.
We could be required to pay fines, return commissions, have a license suspended or revoked, or be subject to other adverse action if we conduct regulated activities without a license or violate applicable rules and regulations. Licensing requirements could also impact our ability to engage in certain types of transactions, change the way in which we conduct business or affect the cost of conducting business. We and our licensed associates may be subject to various obligations and we could become subject to claims by regulators and/or participants in real estate sales or other services claiming that we did not fulfill our obligations. This could include claims with respect to alleged conflicts of interest where we act, or are perceived to be acting, for two or more clients. While management has overseen highly regulated businesses before and expects us to comply with all applicable regulations in a satisfactory manner, no assurance can be given that it will always be the case. In addition, federal, state and local laws and regulations impose various environmental zoning restrictions, use controls, and disclosure obligations that impact the management, development, use and/or sale of real estate. Such laws and regulations tend to discourage sales and leasing activities, as well as mortgage lending availability, with respect to such properties. In our role as property or facilities manager, we could incur liability under environmental laws for the investigation or remediation of hazardous or toxic substances or wastes relating to properties we currently or formerly managed. Such liability may be imposed without regard for the lawfulness of the original disposal activity, or our knowledge of, or fault for, the release or contamination. Further, liability under some of these may be joint and several, meaning that one of multiple liable parties could be responsible for all costs related to a contaminated site. Certain requirements governing the removal or encapsulation of asbestos-containing materials, as well as recently enacted local ordinances obligating property or facilities managers to inspect for and remove lead-based paint in certain buildings, could increase our costs of regulatory compliance and potentially subject us to violations or claims by regulatory agencies or others. Additionally, under certain circumstances, failure by our brokers acting as agents for a seller or lessor to disclose environmental contamination at a property could result in liability to a buyer or lessee of an affected property.
We are required to meet and maintain various eligibility criteria from time to time established by the GSEs and HUD, as well as applicable state and local licensing agencies, to maintain our status as an approved lender. These criteria include minimum net worth, operational liquidity and collateral requirements, and compliance with reporting requirements. We also are required to originate our loans and perform our loan servicing functions in accordance with the applicable program requirements and guidelines from time to time established by the GSEs and HUD. For additional information, see “Risk Factors—Risks Related to Our Real Estate Services Business—Regulatory/Legal—The loss of relationships with the GSEs and HUD would, and changes in such relationships could, adversely affect our ability to originate commercial real estate loans through such programs. Compliance with the minimum collateral and risk-sharing requirements of such programs, as well as applicable state and local licensing agencies, could reduce our liquidity.”
In order to continue our business in our current structure, Newmark and Newmark Holdings must not be deemed investment companies under the Investment Company Act. We intend to take all legally permissible action to ensure that such entities not be subject to such Act. For additional information, see “Risk Factors—Risks Related to Our Corporate and Partnership Structure—If we or Newmark Holdings were deemed an “investment company” under the Investment Company Act of 1940 (which we refer to as the “Investment Company Act”), the Investment Company Act’s restrictions could make it impractical for us to continue our business and structure as contemplated and could materially adversely affect our business, financial condition, results of operations and prospects.”
Capital Requirements
U.S.
Every U.S.-registered broker-dealer is subject to the Uniform Net Capital Requirements. FCMs, such as our subsidiaries, BGC Financial L.P. (“BGCF”) and Mint Brokers (“Mint”), are also subject to CFTC capital requirements. These requirements are designed to ensure financial soundness and liquidity by prohibiting a broker or dealer from engaging in business at a time when it does not satisfy minimum net capital requirements.
In the United States, net capital is essentially defined as net worth (assets minus liabilities), plus qualifying subordinated borrowings and less certain mandatory deductions that result from excluding assets that are not readily convertible into cash and from conservatively valuing certain other assets, such as a firm’s positions in securities. Among these deductions are adjustments, commonly referred to as “haircuts,” to the market value of securities positions to reflect the market risk of such positions prior to their liquidation or disposition. The Uniform Net Capital Requirements also impose a minimum ratio of debt to equity, which may include qualified subordinated borrowings.
28
Regulations have been adopted by the SEC that prohibit the withdrawal of equity capital of a broker-dealer, restrict the ability of a broker-dealer to distribute or engage in any transaction with a parent company or an affiliate that results in a reduction of equity capital or to provide an unsecured loan or advance against equity capital for the direct or indirect benefit of certain persons related to the broker-dealer (including partners and affiliates) if the broker-dealer’s net capital is, or would be as a result of such withdrawal, distribution, reductions, loan or advance, below specified thresholds of excess net capital. In addition, the SEC’s regulations require certain notifications to be provided in advance of such withdrawals, distributions, reductions, loans and advances that exceed, in the aggregate, 30% of excess net capital within any 30-day period. The SEC has the authority to restrict, for up to 20 business days, such withdrawal, distribution or reduction of capital if the SEC concludes that it may be detrimental to the financial integrity of the broker-dealer or may expose its customers or creditors to loss. Notice is required following any such withdrawal, distribution, reduction, loan or advance that exceeds, in the aggregate, 20% of excess net capital within any 30 day period. The SEC’s regulations limiting withdrawals of excess net capital do not preclude the payment to employees of “reasonable compensation.”
Five of our subsidiaries, BGCF, GFI Securities LLC, Kyte Securities LLC, Sunrise Brokers LLC and Mint, are registered with the SEC and are subject to the Uniform Net Capital Requirements. As FCMs, BGCF and Mint are also subject to CFTC minimum capital requirements. BGCF is also a member of the FICC, which imposes capital requirements on its members. We also hold a 49% limited partnership interest in Aqua, a U.S. registered broker-dealer and ATS. In addition, our SEFs, BGC Derivative Markets and GFI Swaps Exchange, are required to maintain financial resources to cover operating costs for at least one year, keeping at least enough cash or highly liquid securities to cover six months’ operating costs.
Compliance with the Uniform Net Capital Requirements may limit the extent and nature of our operations requiring the use of our registered broker-dealer subsidiaries’ capital, and could also restrict or preclude our ability to withdraw capital from our broker-dealer subsidiaries or SEFs.
Non-U.S.
Our international operations are also subject to capital requirements in their local jurisdictions. BGC Brokers L.P., BGC European Holdings, L.P., CSC Commodities Limited, GFI Brokers Limited. GFI Securities Limited, and Sunrise Brokers LLP, which are based in the United Kingdom, are subject to capital requirements established by the FCA. The FCA applies stringent provisions with respect to capital applicable to the operation of these firms, which vary depending upon the nature and extent of their activities. The provisions relating to capital and liquidity requirements enforced by the FCA have undergone significant changes in response to the current regulatory landscape, and our U.K. businesses are now required to maintain significantly higher regulatory capital than they have in the past.
In addition, the majority of our other foreign subsidiaries are subject to similar regulation by the relevant authorities in the countries in which they do business. Additionally, certain other of our foreign subsidiaries are required to maintain non-U.S. net capital requirements. For example, in Hong Kong, BGC Securities (Hong Kong), LLC and GFI (HK) Securities LLC are regulated by the Securities and Futures Commission. BGC Capital Markets (Hong Kong), Limited and GFI (HK) Brokers Ltd, are regulated by The Hong Kong Monetary Authority. All are subject to Hong Kong net capital requirements. In France, Aurel BGC and BGC France Holdings; in Australia, BGC Partners (Australia) Pty Limited, BGC (Securities) Pty Limited and GFI Australia Pty Ltd.; in Japan, BGC Shoken Kaisha Limited’s Japanese branch; in Singapore, BGC Partners (Singapore) Limited, and GFI Group PTE Ltd; in Korea, BGC Capital Markets & Foreign Exchange Broker (Korea) Limited and GFI Korea Money Brokerage Limited; and in Turkey, BGC Partners Menkul Degerler AS, all have net capital requirements imposed upon them by local regulators. In addition, the LCH (LIFFE/LME) clearing organization, of which BGC Brokers L.P. is a member, also imposes minimum capital requirements. In Latin America, BGC Liquidez Distribuidora De Titulos E Valores Mobiliarios Ltda. (Brazil) has net capital requirements imposed upon it by local regulators.
We had net assets in our regulated subsidiaries of $515.6 million and $543.8 million for the years ended December 31, 2017 and 2016, respectively.
Employees
As of December 31, 2017, we had 9,238 total employees, of which approximately 48% were primarily focused on our Financial Services segment and approximately 52% on our Real Estate Services segment.
As of the same date, we had 4,045 brokers, salespeople, managers and other front-office personnel, of which 2,491 worked in our Financial Services segment and 1,554 in our Real Estate Services segment. Approximately 56% of our brokers, salespeople, managers and other front-office personnel were based in the Americas, and approximately 33% were based in Europe, the Middle East and Africa, with the remaining approximately 11% based in the Asia-Pacific region.
29
As of the same date, we had 1,172 employees that are fully reimbursed by our property management or facilities management clients to whom we provide services and pass through such employee expense.
Generally, our employees are not subject to any collective bargaining agreements, except for certain reimbursable employees within our Real Estate Services segment, and certain of our employees based in our European offices that are covered by the national, industry-wide collective bargaining agreements relevant to the countries in which they work.
Our Financial Services business’ two largest offices are located at One Churchill Place, London, U.K. E14 5RD and 199 Water Street, 19th Floor, New York, NY 10038. Our Real Estate Services business’ principal executive offices are located at 125 Park Avenue, New York, New York, 10017. This office consists of approximately 130,000 square feet of space under a lease that expires in 2031.
In our Financial Services business, BGC operates out of over 50 offices around the world. In our Real Estate Services business, we operate out of more than 120 offices in the United States (in Alabama, Arizona, California, Colorado, Connecticut, Delaware, Florida, Georgia, Illinois, Maryland, Massachusetts, Michigan, Missouri, Nevada, New Jersey, New York, North Carolina, Ohio, Oregon, Pennsylvania, Tennessee, Texas, Virginia, Washington, and the District of Columbia), as well as two offices in Mexico, located in Mexico City and Monterrey. In addition, we have licensed our name to 23 commercial real estate providers that operate out of 50 offices in certain locations throughout the Americas where we do not have our own offices. Our partner, Knight Frank, operates out of approximately 411 offices. We believe our facilities are sufficient for our current needs.
Legal Proceedings
See the discussion of legal proceedings contained in Note 24— “Commitments, Contingencies and Guarantees” to our consolidated financial statements in Part II, Item 8 of this Annual Report on Form 10-K.
OUR ORGANIZATIONAL STRUCTURE
Stock Ownership
As of December 31, 2017, there were 256,968,372 shares of BGC Class A common stock outstanding, of which 14,676,499 shares were held by Cantor and CFGM, Cantor’s managing general partner. Each share of BGC Class A common stock is entitled to one vote on matters submitted to a vote of our stockholders.
In addition, as of December 31, 2017, Cantor and CFGM held 34,848,107 shares of BGC Class B common stock (which represents all of the outstanding shares of our Class B common stock), representing, together with BGC’s Class A common stock held by Cantor and CFGM, approximately 60.0% of our voting power on such date. Each share of BGC Class B common stock is generally entitled to the same rights as a share of BGC Class A common stock, except that, on matters submitted to a vote of our stockholders, each share of BGC Class B common stock is entitled to ten votes. The BGC Class B common stock generally votes together with the BGC Class A common stock on all matters submitted to a vote of our stockholders.
Through December 31, 2017, Cantor has distributed to its current and former partners an aggregate of 20,794,183 shares of BGC Class A common stock, consisting of (i) 19,338,660 shares to satisfy certain of Cantor’s deferred stock distribution obligations provided to such partners on April 1, 2008 (the “April 2008 distribution rights shares”), and (ii) 1,455,523 shares to satisfy certain of Cantor’s deferred stock distribution obligations provided to such partners on February 14, 2012 in connection with Cantor’s payment of previous quarterly partnership distributions (the “February 2012 distribution rights shares”). As of December 31, 2017, Cantor is still obligated to distribute to its current and former partners an aggregate of 15,812,788 shares of BGC Class A common stock, consisting of 14,033,084 April 2008 distribution rights shares and 1,779,704 February 2012 distribution rights shares.
We received shares of Newmark in connection with the Separation, and Newmark completed the Newmark IPO on December 19, 2017. As of December 31, 2017, we held 115,593,786 shares of Newmark’s Class A common stock, representing approximately 83.4% of Newmark’s outstanding Class A common stock. In addition, as of December 31, 2017, we held 15,840,049 shares of Newmark’s Class B common stock, representing all of the outstanding shares of Newmark’s Class B common stock. The remaining shares of Newmark’s Class A common stock are held by the public.
From time to time, we may actively continue to repurchase shares of BGC Class A common stock, or purchase or repurchase shares of Newmark’s Class A common stock, including from Cantor, Newmark, our executive officers, other employees, partners and others.
30
BGC Partners, Inc. Partnership Structure
We are a holding company with no direct operations, and we conduct substantially all of our operations through our operating subsidiaries. Our Financial Services business is operated through two operating partnerships, BGC U.S., which holds our U.S. businesses, and BGC Global, which holds our non-U.S. businesses. Our Real Estate Services business is held through our Class A and Class B share ownership in Newmark, which is a publicly traded subsidiary.
Newmark is also a holding company with no direct operations and conducts substantially all of its operations through its operating subsidiary Newmark Partners, L.P. (“Newmark OpCo) For more details about Newmark’s structure, see “Structure of Newmark” below.
For our Financial Services business, the limited partnership interests of the two operating partnerships are held by us and BGC Holdings, and the limited partnership interests of BGC Holdings are currently held by limited partnership unit holders, founding partners, and Cantor. We hold the BGC Holdings general partnership interest and the BGC Holdings special voting limited partnership interest, which entitle us to remove and appoint the general partner of BGC Holdings, and serve as the general partner of BGC Holdings, which entitles us to control BGC Holdings. BGC Holdings, in turn, holds the BGC U.S. general partnership interest and the BGC U.S. special voting limited partnership interest, which entitle the holder thereof to remove and appoint the general partner of BGC U.S., and the BGC Global general partnership interest and the BGC Global special voting limited partnership interest, which entitle the holder thereof to remove and appoint the general partner of BGC Global, and serves as the general partner of BGC U.S. and BGC Global, all of which entitle BGC Holdings (and thereby us) to control each of BGC U.S. and BGC Global. BGC Holdings holds its BGC Global general partnership interest through a company incorporated in the Cayman Islands, BGC Global Holdings GP Limited.
As of December 31, 2017, we held directly and indirectly, through wholly owned subsidiaries, BGC U.S. limited partnership interests and BGC Global limited partnership interests consisting of 291,816,479 units and 291,816,479 units, representing approximately 63.5% and 63.5% of the outstanding BGC U.S. limited partnership interests and BGC Global limited partnership interests, respectively. As of that date, BGC Holdings held BGC U.S. limited partnership interests and BGC Global limited partnership interests consisting of 167,697,910 units and 167,697,910 units, representing approximately 36.5% and 36.5% of the outstanding BGC U.S. limited partnership interests and BGC Global limited partnership interests, respectively.
Limited partnership unit holders, founding partners, and Cantor directly hold BGC Holdings limited partnership interests. Since BGC Holdings in turn holds BGC U.S. limited partnership interests and BGC Global limited partnership interests, limited partnership unit holders, founding partners, and Cantor indirectly have interests in BGC U.S. limited partnership interests and BGC Global limited partnership interests. Further, in connection with the Separation and Distribution Agreement, limited partnership interests in Newmark Holdings were distributed to the holders of limited partnership interests in BGC Holdings, whereby each holder of BGC Holdings limited partnership interests who at that time held a BGC Holdings limited partnership interest received a corresponding Newmark Holdings limited partnership interest, equal in number to a BGC Holdings limited partnership interest divided by 2.2 (i.e., 0.454545 of a unit in Newmark Holdings). Accordingly, existing partners in BGC Holdings are also partners in Newmark Holdings and hold corresponding units issued at the applicable ratio. Thus, such partners now also have an indirect interest in Newmark OpCo. Substantially all of the existing types of BGC Holdings partnership units have been replicated at Newmark Holdings. See “Structure of Newmark” below for detailed information about the Newmark Holdings partnership interests.
As of December 31, 2017, excluding Preferred Units and NPSUs described below, outstanding BGC Holdings partnership interests included 102,917,546 limited partnership units, 12,417,400 founding partner units and 52,362,964 Cantor units.
We may in the future effect additional redemptions of limited partnership units and founding partner units for shares of our Class A common stock. We may also continue our earlier partnership restructuring programs, whereby we redeemed or repurchased certain limited partnership units and founding partner units in exchange for new units, grants of exchangeability for shares of our Class A common stock or cash and, in many cases, obtained modifications or extensions of partners’ employment arrangements. We also generally expect to continue to grant exchange rights with respect to outstanding non-exchangeable limited partnership units and founding partner units, and to repurchase BGC Holdings partnership interests from time to time, including from Cantor, our executive officers, and other employees and partners, unrelated to our partnership restructuring programs.
Cantor units are generally exchangeable, when paired with 0.454545 of a Newmark Holdings Cantor unit, for up to 34,649,693 shares of our Class B common stock (or, at Cantor’s option or if there are no such additional authorized but unissued shares of our Class B common stock, our Class A common stock), subject to adjustments. Upon certain circumstances, Cantor may have the right to acquire additional Cantor units in connection with the redemption of or grant of exchangeability to certain non-exchangeable BGC Holdings founding partner units owned by persons who were previously Cantor partners prior to our 2008 acquisition of the BGC business from Cantor. Cantor has exercised this right from time to time. As of December 31, 2017, there were 418,606 FPUs remaining which BGC Holdings had the right to redeem or exchange and with respect to which Cantor had the right to purchase an equivalent number of Cantor units.
31
In order to facilitate partner compensation and for other corporate purposes, we created new preferred partnership units (“Preferred Units”), which are working partner units that may be awarded to holders of, or contemporaneous with the grant of, PSUs, PSIs, PSEs, LPUs, APSUs, APSIs, APSEs, REUs, RPUs, AREUs, and ARPUs. These new Preferred Units carry the same name as the underlying unit, with the insertion of an additional “P” to designate them as Preferred Units.
Such Preferred Units may not be made exchangeable into our Class A common stock and accordingly will not be included in the fully diluted share count. Each quarter, the net profits of BGC Holdings are allocated to such Units at a rate of either 0.6875% (which is 2.75% per calendar year) of the allocation amount assigned to them based on their award price, or such other amount as set forth in the award documentation (the “Preferred Distribution”), before calculation and distribution of the quarterly Partnership distribution for the remaining Partnership units. The Preferred Units will not be entitled to participate in Partnership distributions other than with respect to the Preferred Distribution. As of December 31, 2017, there were 17,138,578 such units granted and outstanding.
On May 9, 2014, partners of BGC Holdings created a new class of partnership units (NPSUs), which are non-distributing working partner units. For more information, see Note 18—“Related Party Transactions” to our consolidated financial statements in Part II, Item 8 of this Annual Report on Form 10-K.
On June 5, 2015, we entered into an agreement with Cantor providing Cantor, CFGM and other Cantor affiliates entitled to hold BGC Class B common stock the right to exchange from time to time, on a one-to-one basis, subject to adjustment, up to an aggregate of 34,649,693 shares of Class A common stock now owned or subsequently acquired by such Cantor entities for up to an aggregate of 34,649,693 shares of Class B common stock. Such shares of Class B common stock, which currently can be acquired upon the exchange of exchangeable limited partnership units owned in BGC Holdings, are already included in the Company’s fully diluted share count and will not increase Cantor’s current maximum potential voting power in the common equity. The exchange agreement will enable the Cantor entities to acquire the same number of shares of our Class B common stock that they are already entitled to acquire without having to exchange their exchangeable limited partnership units in BGC Holdings. A similar exchange agreement has been entered into at Newmark with respect to Newmark Class B common stock. See “Structure of Newmark.”
Under the BGC exchange agreement, Cantor and CFGM have the right to exchange 14,676,499 shares of Class A common stock owned by them as of December 31, 2017 for the same number of shares of Class B common stock. Cantor would also have the right to exchange any shares of Class A common stock subsequently acquired by it for shares of Class B common stock, up to 34,649,693 shares of Class B common stock.
We and Cantor have agreed that any shares of Class B common stock issued in connection with the exchange agreement would be deducted from the aggregate number of shares of Class B common stock that may be issued to the Cantor entities upon exchange of exchangeable limited partnership units in BGC Holdings. Accordingly, the Cantor entities will not be entitled to receive any more shares of Class B common stock under this agreement than they were previously eligible to receive upon exchange of exchangeable limited partnership units.
On November 4, 2015, five new classes of non-distributing partnership units were created. These new N Units carry the same name as the underlying unit with the insertion of an additional “N” to designate them as the N Unit type and are designated as NREUs, NPREUs, NLPUs, NPLPUs and NPPSUs. The N Units are not entitled to participate in Partnership distributions, will not be allocated any items of profit or loss and may not be made exchangeable into shares of the Company’s Class A common stock. Subject to the approval of the BGC Compensation Committee or its designee, certain N Units may be converted into the underlying unit type (i.e. an NREU will be converted into an REU) and will then participate in Partnership distributions, subject to terms and conditions determined by the general partner of BGC Holdings in its sole discretion, including that the recipient continue to provide substantial services to the Company and comply with his or her partnership obligations.
On December 14, 2016, certain terms and conditions of the N Units were amended in order to provide flexibility to the Company and BGC Holdings in using such N Units in connection with compensation arrangements and practices. The amendment provided for a minimum $5 million gross revenue requirement in a given quarter as a condition for an N Unit to be replaced by another type of BGC Holdings unit in accordance with the BGC Holdings Partnership Agreement and the award documentation.
On December 13, 2017, the Amended and Restated BGC Holdings Partnership Agreement was amended and restated (the “Second Amended and Restated BGC Holdings Partnership Agreement”) to include prior standalone amendments and to make certain other changes related to the Separation. The Second Amended and Restated BGC Holdings Partnership Agreement, among other things, reflects changes resulting from the division in the Separation of BGC Holdings into BGC Holdings and Newmark Holdings, including:
32
|
|
unit issued in the Separation in respect of each such Legacy BGC Holdings Unit (a “Legacy Newmark Holdings Unit”), based on the relative value of BGC and Newmark as of after the Newmark IPO; |
|
|
• |
an adjustment of the exchange mechanism between the Newmark IPO and the Distribution so that one exchangeable BGC Holdings unit, together with a number of exchangeable Newmark Holdings units equal to 0.454545 divided by the Newmark Holdings exchange ratio as of such time, must be exchanged in order to receive one share of BGC Class A common stock; and |
|
|
• |
a right of the employer of a partner (whether it be Newmark or BGC) to determine whether to grant exchangeability with respect to Legacy BGC Holdings Units or Legacy Newmark Holdings Units held by such partner. |
The Second Amended and Restated BGC Holdings Partnership Agreement also removes certain classes of BGC Holdings units that are no longer outstanding, and permits the general partner of BGC Holdings to determine the total number of authorized BGC Holdings units. The Second Amended and Restated BGC Holdings Limited Partnership Agreement was approved by the Audit Committee of the Board of Directors of the Company.
The following diagram illustrates our organizational structure as of December 31, 2017, following the Separation and the Newmark IPO. The diagram does not reflect the various subsidiaries of BGC, BGC U.S., BGC Global, Newmark, Newmark OpCo or Cantor, or the noncontrolling interests in our consolidated subsidiaries other than Cantor’s units in BGC Holdings and Newmark Holdings and the public’s interest in Newmark.*
33
STRUCTURE OF BGC PARTNERS, INC. FOLLOWING NEWMARK IPO
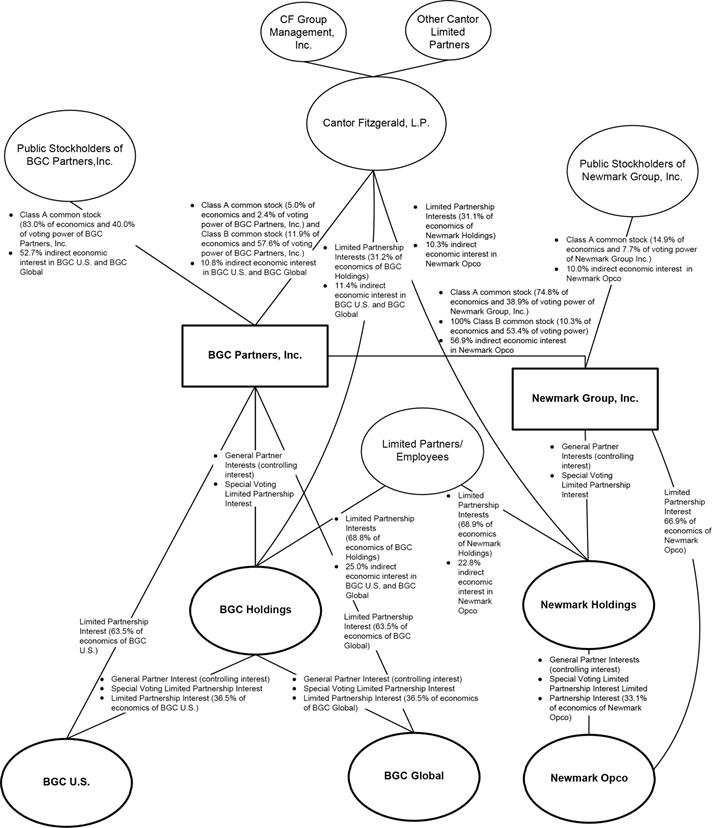
* Shares of BGC Class B common stock are convertible into shares of BGC Class A common stock at any time in the discretion of the holder on a one-for-one basis. Accordingly, if Cantor converted all of its BGC Class B common stock into Class A common stock, Cantor would hold 17.0% of the voting power, and the public stockholders would hold 83.0% of the voting power
34
(and Cantor’s indirect economic interests in BGC U.S. and BGC Global would remain unchanged). Similarly, shares of Newmark Class B common stock are convertible into shares of Newmark Class A common stock at any time in the discretion of the holder on a one-for-one basis. Accordingly, if BGC converted all of its Newmark Class B common stock into Class A common stock, BGC would hold 85.1% of the voting power of Newmark, and the public stockholders would hold 14.9% of the voting power (and BGC’s indirect economic interests in Newmark OpCo would remain unchanged). For purposes of the diagram, Cantor’s percentage ownership also includes CFGM’s percentage ownership. The diagram does not reflect certain BGC Class A common stock and BGC Holdings partnership units as follows: (a) any shares of BGC Class A common stock that may become issuable upon the conversion or exchange of any convertible or exchangeable debt securities that may in the future be sold under our shelf Registration Statement on Form S-3 (Registration No. 333-180331); (b) 17,138,578 BGC Preferred Units and 7,790,262 Newmark Preferred Units granted and outstanding (see “Partnership Structure” herein); and (c) 13,100,453 N Units in BGC Holdings and 5,954,751 N Units in Newmark Holdings outstanding.
The diagram reflects BGC Class A common stock and BGC Holdings partnership unit activity from January 1, 2017 through December 31, 2017 as follows: (a) an aggregate of 29,242,343 limited partnership units granted by BGC Holdings; (b) 5,956,979 shares of BGC Class A common stock sold by us under the November 2014 Sales Agreement pursuant to our Registration Statement on Form S-3 (Registration No. 333-200415); (c) 2,775,485 shares of BGC Class A common stock sold by us under the April 2017 Sales Agreement pursuant to our Registration Statement on Form S-3 (Registration No. 333-214772); (c) 1,386,769 shares of BGC Class A common stock repurchased by us; (d) 2,066,724 forfeited BGC limited partnership units; (e) 570,944 shares of BGC Class A common stock issued for vested restricted stock units; (f) 1,446,395 shares of BGC Class A common stock issued by us under our acquisition shelf Registration Statement on Form S-4 (Registration No. 333-169232), but not the 8,952,290 of such shares remaining available for issuance by us under such Registration Statement; (g) 1,545,751 BGC Holdings limited partnership and founding partner units redeemed or repurchased by us for cash; (h) 58,809 shares issued by us under our Dividend Reinvestment and Stock Purchase Plan shelf Registration Statement on Form S-3 (Registration No. 333-173109), but not the 9,658,374 of such shares remaining available for issuance by us under shelf Registration Statement on Form S-3 (Registration No. 333-196999); (i) 163,430 shares sold by selling stockholders under our resale shelf Registration Statement on Form S-3 (Registration No. 333-175034), but not the 983,573 of such shares remaining available for sale by selling stockholders under such Registration Statement; and (j) 25,327 shares sold by selling stockholders under our resale shelf Registration Statement on Form S-3 (Registration No. 333-167953), but not the 144,945 of such shares remaining available for sale by selling stockholders under such Registration Statement. Activity in Newmark Class A common stock and Newmark Holdings partnership units through December 31, 2017 is reflected in “Structure of Newmark” below.
STRUCTURE OF NEWMARK
Our Restructuring
Our subsidiary, Newmark Group, Inc., is a Delaware corporation. It was formed as NRE Delaware, Inc. on November 18, 2016 and changed its name to Newmark Group, Inc. on October 18, 2017. Newmark Group, Inc. was formed for the purpose of becoming a public company conducting the operations of our Real Estate Services segment, including Newmark and Berkeley Point.
Through the following series of transactions prior to and following the completion of the Newmark Separation and the Newmark IPO, Newmark became a separate publicly traded company:
|
|
• |
Prior to the completion of the Newmark IPO, the Separation pursuant to which members of the BGC group transferred to Newmark substantially all of the assets and liabilities of the our Real Estate Services segment, including Newmark, Berkeley Point and the right to receive the remainder of the Nasdaq payment, and various types of interests of Newmark Holdings were issued to holders of interests of BGC Holdings in proportion to such interests of BGC Holdings held by such holders immediately prior thereto. |
|
|
• |
Concurrently with the Separation, Newmark entered into the transactions described under “—Assumption and Repayment of Indebtedness” below. |
|
|
• |
Following the completion of the Newmark IPO, we may distribute the shares of Newmark’s common stock held by us to our stockholders as described under “—The Distribution” below. |
A majority of Newmark’s issued and outstanding shares of common stock are held by us. If we complete the Distribution, a majority of Newmark’s issued and outstanding shares of common stock will be held by our stockholders as of the date of the Distribution.
The types of interests in Newmark, Newmark Holdings and Newmark OpCo outstanding following the completion of the Separation are described under “—Structure of Newmark Following the Separation and Newmark IPO” below.
35
Prior to the completion of the Newmark IPO, pursuant to the Separation and Distribution Agreement, members of the BGC group transferred to Newmark substantially all of the assets and liabilities of the BGC group relating to BGC’s Real Estate Services segment, including Newmark, Berkeley Point and the right to receive the remainder of the Nasdaq payment. For a description of the Nasdaq payment, see “—Nasdaq Transaction.” Prior to the Separation, the BGC group held all of the historical assets and liabilities related to the Real Estate services business.
In connection with the Separation, Newmark Holdings limited partnership interests, Newmark Holdings founding partner interests, Newmark Holdings working partner interests and Newmark Holdings limited partnership units were distributed to holders of BGC Holdings limited partnership interests, BGC Holdings founding partner interests, BGC Holdings working partner interests and BGC Holdings limited partnership units in proportion to such interests of BGC Holdings held by such holders immediately prior to the Separation.
We also entered into a tax matters agreement with Newmark that governs the parties’ respective rights, responsibilities and obligations after the Separation with respect to taxes, tax attributes, the preparation and filing of tax returns, the control of audits and other tax proceedings, tax elections, assistance and cooperation in respect of tax matters, procedures and restrictions relating to the distribution, if any, and certain other tax matters. Newmark also entered into an administrative services agreement with Cantor, which governs the provision by Cantor of various administrative services to us, including Newmark, and our provision of various administrative services to Cantor, at a cost equal to (1) the direct cost that the providing party incurs in performing those services, including third-party charges incurred in providing services, plus (2) a reasonable allocation of other costs determined in a consistent and fair manner so as to cover the providing party’s appropriate costs or in such other manner as the parties agree. Newmark also entered into a transition services agreement with us, which governs the provision by us of various administrative services to Newmark, and Newmark’s provision of various administrative services to us, on a transitional basis (with a term of up to two years following the Distribution) and at a cost equal to (1) the direct cost that the providing party incurs in performing those services, including third-party charges incurred in providing services, plus (2) a reasonable allocation of other costs determined in a consistent and fair manner so as to cover the providing party’s appropriate costs or in such other manner as the parties agree.
Assumption and Repayment of Indebtedness
In connection with the Separation and prior to the closing of the Newmark IPO, Newmark assumed from us the Term Loan and the Converted Term Loan. Newmark OpCo also assumed from BGC U.S. the BGC Notes. Newmark contributed all of the net proceeds of the Newmark IPO to Newmark OpCo in exchange for a number of units representing Newmark OpCo limited partnership interests equal to the number of shares issued by Newmark in the Newmark IPO. Newmark OpCo used all of such net proceeds to partially repay intercompany indebtedness owed by Newmark OpCo to Newmark in respect of the Term Loan (which intercompany indebtedness was originally issued by BGC U.S. and was assumed by Newmark OpCo in connection with the Separation). Newmark used all of such repayment from Newmark OpCo to partially repay the Term Loan. The Term Loan had an outstanding principal amount of $270.7 million, plus accrued but unpaid interest thereon, with an interest rate calculated based on one-month LIBOR plus 2.75%, subject to adjustment, which was approximately 4.21% per annum as of December 31, 2017. The Term Loan will mature on September 8, 2019. In the event that any member of the Newmark group receives net proceeds from the incurrence of indebtedness for borrowed money or an equity issuance (in each case subject to certain exceptions), Newmark OpCo will be obligated to use such net proceeds to repay the remaining intercompany indebtedness owed by Newmark OpCo to Newmark in respect of the Term Loan (which in turn Newmark will use to repay the remaining amount outstanding on the Term Loan), and thereafter, to repay the remaining intercompany indebtedness owed by Newmark OpCo to Newmark in respect of the Converted Term Loan (which in turn Newmark will use to repay the remaining amount outstanding on the Converted Term Loan). Following the repayment of the Term Loan and the Converted Term Loan, in the event that any member of the Newmark group receives net proceeds from the incurrence of indebtedness for borrowed money (subject to certain exceptions), Newmark OpCo will be obligated to use such net proceeds to repay the BGC Notes. In addition, Newmark will be obligated to repay any remaining amounts under the BGC Notes prior to the Distribution.
The Distribution
We have advised Newmark that we currently expect to pursue the Distribution to our stockholders of all of the shares of Newmark’s common stock that we then own in a manner that is intended to qualify as generally tax-free for U.S. federal income tax purposes. As currently contemplated, shares of Newmark’s Class A common stock held by us would be distributed to the holders of shares of our Class A common stock and shares of Newmark’s Class B common stock held by us would be distributed to the holders of shares of our Class B common stock (which are currently Cantor and another entity controlled by Mr. Lutnick). The determination of whether, when and how to proceed with any such Distribution is entirely within our discretion. The shares of Newmark common stock that BGC Partners owns are subject to the 180-day “lock-up” restriction contained in the underwriting agreement for the Newmark IPO.
36
Structure of Newmark Following the Separation and Newmark IPO
As of December 31, 2017, there were 135,593,786 shares of Newmark’s Class A common stock issued and outstanding. BGC Partners held 115,593,786 shares of Newmark’s Class A common stock, representing approximately 83.4% of Newmark’s outstanding Class A common stock. Each share of Newmark Class A common stock is generally entitled to one vote on matters submitted to a vote of Newmark stockholders. In addition, BGC Partners held 15,840,049 shares of Newmark’s Class B common stock, representing all of the outstanding shares of Newmark’s Class B common stock. Together, the shares of Class A common stock and Class B common stock held by BGC Partners represented approximately 92.3% of Newmark’s total voting power. Each share of Class B common stock is generally entitled to the same rights as a share of Class A common stock, except that, on matters submitted to a vote of Newmark stockholders, each share of Class B common stock is entitled to 10 votes. The Class B common stock generally votes together with the Class A common stock on all matters submitted to a vote of Newmark stockholders. We expect Newmark to retain its dual class structure, and there are no circumstances under which the holders of Class B common stock would be required to convert their shares of such Class B common stock into shares of Class A common stock. Newmark’s certificate of incorporation does not provide for automatic conversion of shares of Class B common stock into shares of Class A common stock upon the occurrence of any event.
Newmark holds the Newmark Holdings general partnership interest and the Newmark Holdings special voting limited partnership interest, which entitle Newmark to remove and appoint the general partner of Newmark Holdings, and serve as the general partner of Newmark Holdings, which entitles Newmark to control Newmark Holdings. Newmark Holdings, in turn, holds the Newmark OpCo general partnership interest and the Newmark OpCo special voting limited partnership interest, which entitle Newmark Holdings to remove and appoint the general partner of Newmark OpCo, and serve as the general partner of Newmark OpCo, which entitles Newmark Holdings (and thereby Newmark) to control Newmark OpCo. In addition, as of December 31, 2017, Newmark indirectly, through wholly owned subsidiaries, held Newmark OpCo limited partnership interests consisting of approximately 154,433,835 units representing approximately 66.9% of the outstanding Newmark OpCo limited partnership interests. Newmark is a holding company that will hold these interests, serve as the general partner of Newmark Holdings and, through Newmark Holdings, act as the general partner of Newmark OpCo. As a result of Newmark’s ownership of the general partnership interest in Newmark Holdings and Newmark Holdings’ general partnership interest in Newmark OpCo, Newmark will consolidate Newmark OpCo’s results, and we will consolidate Newmark’s results, for financial reporting purposes.
Cantor, founding partners, working partners and limited partnership unit holders directly holds Newmark Holdings limited partnership interests. Newmark Holdings, in turn, holds Newmark OpCo limited partnership interests, and, as a result, Cantor, founding partners, working partners and limited partnership unit holders in Newmark Holdings indirectly have interests in Newmark OpCo limited partnership interests.
As a result of the distribution of limited partnership interests of Newmark Holdings to partners of BGC Holdings in connection with the Separation, each holder of BGC Holdings limited partnership interests holds a BGC Holdings limited partnership interest and a corresponding 0.454545 of a Newmark Holdings limited partnership interest for each BGC Holdings limited partnership interest held thereby immediately prior to the separation. The BGC Holdings limited partnership interests and Newmark Holdings limited partnership interests are each entitled to receive cash distributions from BGC Holdings and Newmark Holdings, respectively, in accordance with the terms of such partnership’s respective limited partnership agreement. We currently expect that the combined cash distributions to a holder of one BGC Holdings unit and a number of Newmark Holdings units equal to the contribution ratio (which is one divided by 2.2) following the Separation will equal the cash distribution payable to a holder of one BGC Holdings unit immediately prior to the Separation, before giving effect to the dilutive impact of the shares of Newmark’s common stock issued in the Newmark IPO.
The Newmark Holdings limited partnership interests held by Cantor are designated as Newmark Holdings exchangeable limited partnership interests. The Newmark Holdings limited partnership interests held by the founding partners are designated as Newmark Holdings founding partner interests. The Newmark Holdings limited partnership interests held by the working partners are designated as Newmark Holdings working partner interests. The Newmark Holdings limited partnership interests held by the limited partnership unit holders are designated as limited partnership units.
Each unit of Newmark Holdings limited partnership interests held by Cantor is exchangeable with Newmark for a number of shares of Class B common stock (or, at Cantor’s option or if there are no additional authorized but unissued shares of Class B common stock, a number of shares of Class A common stock) equal to the exchange ratio (which is currently one, but is subject to adjustments as set forth in the Separation and Distribution Agreement). Prior to the Distribution, however, such exchanges are subject to the limitation as described below.
As of December 31, 2017, 5,722,173 Newmark founding partner interests were outstanding. These founding partner interests were issued in the Separation to holders of BGC Holdings founding partner interests, who received such founding partner interests in connection with our acquisition of the BGC business from Cantor in 2008. The Newmark Holdings limited partnership interests held by founding partners are not exchangeable with Newmark unless (1) Cantor acquires such interests from Newmark Holdings upon termination or bankruptcy of the founding partners or redemption of their units by Newmark Holdings (which it has the right to do under certain circumstances), in which case such interests will be exchangeable with Newmark for Newmark’s Class A
37
common stock or Class B common stock as described above, or (2) Cantor determines that such interests can be exchanged by such founding partners with Newmark for Newmark’s Class A common stock, with each Newmark Holdings unit exchangeable for a number of shares of Newmark’s Class A common stock equal to the exchange ratio (which is currently one, but is subject to adjustments as set forth in the Separation and Distribution Agreement), on terms and conditions to be determined by Cantor (which exchange of certain interests Cantor expects to permit from time to time). Cantor has provided that certain founding partner interests are exchangeable with Newmark for Class A common stock, with each Newmark Holdings unit exchangeable for a number of shares of Newmark’s Class A common stock equal to the exchange ratio (which is currently one, but is subject to adjustments as set forth in the Separation and Distribution Agreement). Once a Newmark Holdings founding partner interest becomes exchangeable, such founding partner interest is automatically exchanged upon a termination or bankruptcy (x) with BGC Partners for Class A common stock of BGC Partners (after also providing the requisite portion of BGC Holdings founding partner interests) if the termination or bankruptcy occurs prior to the Distribution and (y) in all other cases, with us for Newmark’s Class A common stock.
Further, Newmark provides exchangeability for partnership units under other circumstances in connection with (1) our partnership redemption, compensation and restructuring programs, (2) other incentive compensation arrangements and (3) business combination transactions.
As of December 31, 2017, 5,644,273 Newmark working partner interests were outstanding. Working partner interests are not exchangeable with Newmark unless otherwise determined by Newmark with the written consent of the Newmark Holdings exchangeable limited partnership interest majority in interest, in accordance with the terms of the Newmark Holdings limited partnership agreement.
As of December 31, 2017, 76,431,000 Newmark limited partnership units were outstanding (including founding partner interests and working partner interests). Limited partnership units will be only exchangeable with Newmark in accordance with the terms and conditions of the grant of such units, which terms and conditions are determined in its sole discretion, as the Newmark Holdings general partner, with the consent of the Newmark Holdings exchangeable limited partnership interest majority in interest, in accordance with the terms of the Newmark Holdings limited partnership agreement.
Notwithstanding the foregoing, prior to the Distribution, without our prior consent, no Newmark Holdings limited partnership interests shall be exchangeable into shares of Newmark Class A common stock or Class B common stock. Prior to the Distribution, unless otherwise agreed by us, in order for a partner to exchange an exchangeable limited partnership interest in BGC Holdings or Newmark Holdings into a share of BGC common stock, such partner must exchange both one BGC Holdings exchangeable unit and 0.454545 of a Newmark Holdings exchangeable unit equal to the contribution ratio (which is one divided by 2.2), divided by the exchange ratio, in order to receive one share of BGC Partners common stock. Prior to the Distribution, to the extent that BGC receives any Newmark OpCo units as a result of any exchange of Newmark Holdings exchangeable unit as described in the immediately preceding sentence or as a result of any contribution by BGC to Newmark OpCo or purchase by BGC of Newmark OpCo units, then, in each case, BGC will contribute such Newmark OpCo units to Newmark in exchange for a number of shares of Newmark common stock equal to the number of such Newmark OpCo units multiplied by the exchange ratio (with the class of shares of our common stock corresponding to the class of shares of common stock that BGC issued upon such exchange).
The current exchange ratio between Newmark Holdings limited partnership interests and Newmark’s common stock is one. However, this exchange ratio will be adjusted if Newmark’s dividend policy and the distribution policy of Newmark Holdings are different. See “Item 5 – Market for The Registrant’s Common Equity, Related Stockholder Matters and Purchases of Equity Securities -Dividend Policy.” With each exchange, Newmark’s direct and indirect (and, prior to the Distribution and as described above, BGC’s indirect) interest in Newmark OpCo will proportionately increase because, immediately following an exchange, Newmark Holdings will redeem the Newmark Holdings unit so acquired for the Newmark OpCo limited partnership interest underlying such Newmark Holdings unit.
The profit and loss of Newmark OpCo and Newmark Holdings, as the case may be, are allocated based on the total number of Newmark OpCo units and Newmark Holdings units, as the case may be, outstanding.
The following diagram illustrates the ownership structure of Newmark as of December 31, 2017. The diagram does not reflect the various subsidiaries of Newmark, Newmark OpCo, BGC, BGC U.S., BGC Global or Cantor: the results of any exchange of Newmark Holdings exchangeable limited partnership interests or, to the extent applicable, Newmark Holdings founding partner interests, Newmark Holdings working partner interests or Newmark Holdings limited partnership units.
38
STRUCTURE OF NEWMARK FOLLOWING THE NEWMARK IPO
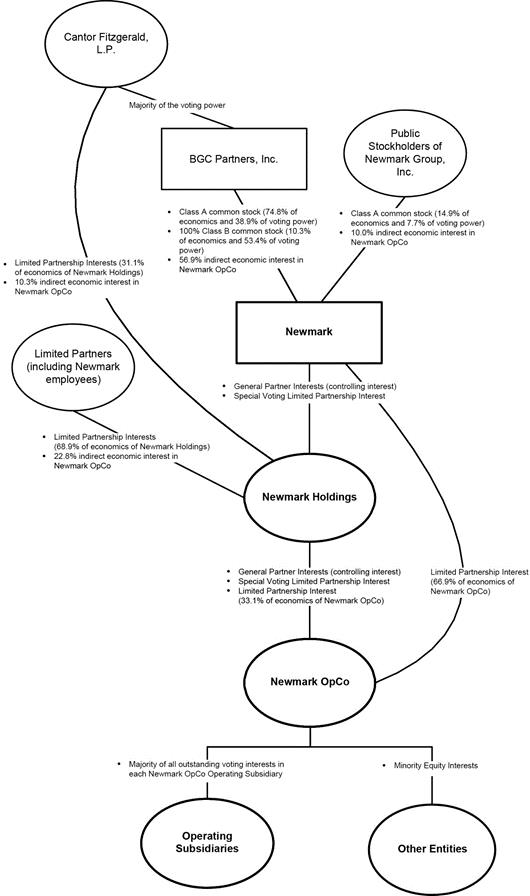
39
|
|
Shares of Newmark Class B common stock are convertible into shares of Newmark Class A common stock at any time in the discretion of the holder on a one-for-one basis. Accordingly, if BGC converted all of its Newmark Class B common stock into Newmark Class A common stock, BGC would hold approximately 85.1% of the voting power and the public stockholders would hold approximately 14.9% of the voting power (and the indirect economic interests in Newmark OpCo would remain unchanged). |
|
|
|
|
|
The diagram above does not show certain operating subsidiaries that are organized as corporations whose equity are either wholly owned by Newmark or whose equity are majority-owned by Newmark with the remainder owned by Newmark OpCo. |
Structure of Newmark Following the Distribution
We have advised Newmark that we currently expect to pursue a Distribution to our stockholders of all of the shares of Newmark common stock that we then own in a manner that is intended to qualify as generally tax-free for U.S. federal income tax purposes. As currently contemplated, shares of Newmark Class A common stock held by us would be distributed to the holders of shares of our Class A common stock, and shares of Newmark Class B common stock held by us would be distributed to the holders of shares of our Class B common stock (which are currently Cantor and another entity controlled by Mr. Lutnick). The determination of whether, when and how to proceed with any such Distribution is entirely within the discretion of BGC. The shares of Newmark common stock that BGC owned upon the completion of the Newmark IPO are subject to the 180-day “lock-up” restriction contained in the underwriting agreement for the Newmark IPO, which expires on June 13, 2018.
To account for potential changes in the number of shares of Class A common stock and Class B common stock of BGC and Newmark between the Newmark IPO and the Distribution, and to ensure that the Distribution (if it occurs) is pro rata to the stockholders of BGC, immediately prior to the Distribution, BGC will convert any shares of Class B common stock beneficially owned by BGC into shares of Newmark Class A common stock, or exchange any shares of Newmark Class A common stock beneficially owned by BGC Partners for shares of Newmark Class B common stock, so that the ratio of shares of Newmark Class B common stock held by BGC to the shares of Newmark Class A common stock held by BGC, in each case as of immediately prior to the Distribution, equals the ratio of shares of outstanding BGC Class B common stock to the shares of outstanding BGC Class A common stock, in each case as of the record date of the Distribution.
40
Any investment in shares of our Class A common stock, our 8.125% Senior Notes, our 5.375% Senior Notes, our 8.375% Senior Notes or our 5.125% Senior Notes or our other securities involves risks and uncertainties. The following are important risks and uncertainties that could affect our businesses, but we do not ascribe any particular likelihood or probability to them unless specifically indicated. Any of the risks and uncertainties set forth below, should they occur, could significantly and negatively affect our businesses, financial condition, results of operations, and prospects and/or the trading price of our Class A common stock, our 8.125% Senior Notes, our 5.375% Senior Notes, our 8.375% Senior Notes, our 5.125% Senior Notes or our other securities.
RISKS RELATED TO OUR BUSINESSES GENERALLY
Global Economic and Market Conditions
Our businesses, financial condition, results of operations and prospects have been and may continue to be affected both positively and negatively by conditions in the global economy and financial and commercial real estate markets generally.
Our businesses and results of operations have been and may continue to be affected both positively and negatively by conditions in the global economy and financial and commercial real estate markets generally. Difficult market and economic conditions and geopolitical uncertainties have in the past adversely affected and may in the future adversely affect our businesses. Such conditions and uncertainties include fluctuating levels of economic output, interest and inflation rates, employment levels, consumer confidence levels, and fiscal and monetary policy. Economic policies of the new administration and Congress, potential increases in interest rates and proposed tax cuts and infrastructure spending plans may change the regulatory and economic landscape. These conditions may directly and indirectly impact a number of factors in the global markets that may have a positive or negative effect on our operating results, including the levels of trading, investing, and origination activity in the securities and derivatives markets, the valuations of financial instruments, unexpected changes in interest rates, changes in and uncertainty regarding tax laws and substantial fluctuations in volume and commissions on securities and derivatives transactions, the absolute and relative level of currency rates, commercial real estate values in absolute terms and relative to other investing options, the volume of real estate transactions, and the actual and the perceived quality of issuers, borrowers and investors. For example, the actions of the U.S. Federal Reserve and international central banking authorities directly impact our cost of funds and may impact the value of financial instruments we hold. In addition, changes in monetary policy may affect the credit quality of our customers. Changes in domestic and international monetary policy are beyond our control and difficult to predict.
On a consolidated basis, for the twelve months ended December 31, 2017, approximately 51% of our total revenues were generated by our Financial Services segment and 48% of our total revenues were generated by our Real Estate Services segment, with 1% generated within the corporate category. As a result, our revenues and profitability are likely to decline significantly during periods of low trading volume in the financial markets in which we offer our products and services and may be similarly impacted by downturns in the commercial real estate markets.
The global financial services and the commercial real estate markets are, by their nature, risky and volatile and are directly affected by many national and international factors that are beyond our control. Any one of these factors may cause a substantial decline in the U.S. and global financial services and commercial real estate markets, resulting in reduced transactional volume and profitability for our businesses. These factors include:
|
|
• |
economic and geopolitical conditions and uncertainties in the United States, Europe and elsewhere in the world, including government deficits, debt and possible defaults, austerity measures, changes in interest rates, and changes in central bank and/or fiscal policies, including the level and timing of government debt issuances, purchases and outstanding amounts; |
|
|
• |
possible political turmoil with respect to the U.S. government, the European Union and/or its member states, China, or other major economies around the world; |
|
|
• |
the effect of Federal Reserve Board and other central banks’ monetary policies, increased capital requirements for banks and other financial institutions, and other regulatory requirements; |
|
|
• |
terrorism, war and other armed hostilities; |
|
|
• |
inflation, deflation and wavering institutional and consumer confidence levels; |
|
|
• |
the availability of capital for borrowings and investments by our clients and their customers; |
|
|
• |
the level and volatility of interest rates, foreign currency exchange rates and trading in certain equity, debt and commodity markets; |
|
|
• |
the level and volatility of the difference between the yields on corporate securities being traded and those on related benchmark securities, which we refer to as “credit spreads” |
41
|
|
• |
commercial real estate values and transaction volumes; and |
|
|
• |
margin requirements, capital requirements, credit availability, and other liquidity concerns with respect to our Financial Services segment, its clients, and the customers or its clients. |
Low transaction volumes for any of our brokerage asset classes generally result in reduced revenues. Under these conditions, our profitability is adversely affected since many of our costs are fixed. In addition, although less common, some of our financial services or commercial real estate transaction revenues are determined on the basis of the value of transactions or on spreads. For these reasons, substantial decreases in trading volume, declining prices, and/or reduced spreads could have material adverse effects on our businesses, financial condition, results of operations and prospects.
Any downgrades of the U.S. sovereign credit rating by one or more of the major credit rating agencies could have material adverse effects on financial and commercial real estate markets and economic conditions in the U.S. and throughout the world. This in turn could have a material adverse impact on our businesses, financial condition, results of operations, and prospects. Because of the unprecedented nature of any negative credit rating actions with respect to U.S. government obligations, the ultimate impacts on global markets and our businesses, financial condition, results of operations, and prospects are unpredictable and may not be immediately apparent. Additionally, the negative impact on economic conditions and global markets from further sovereign debt matters with respect to the EU and/or its member states, Japan, or other major economies could adversely affect our businesses, financial condition, results of operations and prospects. Concerns about the sovereign debt of certain major economies have caused uncertainty and disruption for financial markets globally, and continued uncertainties loom over the outcome of the various governments’ financial support programs and the possibility that EU member states or other major economies may experience similar financial troubles. Any downgrades of the long-term sovereign credit rating of the U.S. or additional sovereign debt crises in major economies could cause disruption and volatility of financial markets globally and have material adverse effects on our businesses, financial condition, results of operations and prospects.
Over the past year, concerns over slowing growth in China, the longer term declines in world-wide commodities prices relative to their 2008 and 2011 highs, especially for oil, and unusual changes in volatility in various securities and derivatives markets have led to uncertainties about the stability of financial markets and the likely responses of governments and central banks. Any one of these factors, or others, could have a material adverse effect on our businesses, financial condition, results of operations and prospects.
A U.K. exit from the European Union could materially adversely impact our customers, and counterparties, businesses, financial condition, results of operations and prospects.
On June 23, 2016, the U.K. held a referendum regarding continued membership in the European Union (the “EU”). The exit from the EU is commonly referred to as “Brexit.” The Brexit vote passed by 51.9% to 48.1%. The referendum was non-binding. However, on March 29, 2017, the Prime Minister gave the European Council of the EU formal written notification of the U.K.’s intention to leave the EU, triggering the withdrawl process under Article 50 of the Lisbon Treaty. The effects of Brexit will depend on any agreements the U.K. makes to retain access to EU markets – including for financial services – either during a transitional period or more permanently. Negotiations started in earnest following the Parliamentary elections held on June 8, 2017. These negotiations under Article 50 are to determine the future terms of the U.K.’s relationship with the EU access to EU financial markets. In addition, the U.K. vote to leave the E.U. may result in similar referendums or votes in other E.U. countries in which we do business. There is proposed to be a transition period from March 29, 2019, when the U.K. is expected to leave the EU to the end of 2020. Negotiations on the terms of the transition are continuing. Negotiations for an agreement with the EU, following the U.K.’s exit could take longer and the EU could agree to a longer transition period. Although we continue to have regulated entities and offices in place in many of the major European markets, during a transitional period — when the terms of the U.K. exit will be negotiated – and beyond, these and other risks and uncertainties could have a material adverse effect on our customers, counterparties, businesses, prospects, financial condition and results of operations.
Evolving Business Environments
We operate in rapidly evolving business environments. If we are unable to adapt our businesses effectively to keep pace with these changes, our ability to succeed will be adversely affected, which could have a material adverse effect on our businesses, financial condition, results of operations and prospects.
The pace of change in the industries in which we operate is extremely rapid. Operating in such rapidly changing business environments involves a high degree of risk. Our ability to succeed will depend on our ability to adapt effectively to these changing conditions. If we are unable to keep up with rapid changes, we may not be able to compete effectively.
42
To remain competitive, we must continue to enhance and improve the responsiveness, functionality, accessibility and features of our proprietary software, network distribution systems and technologies. Our business environments are characterized by rapid technological changes, changes in user and customer requirements and preferences, frequent product and service introductions embodying new technologies and the emergence of new industry standards and practices that could render our existing proprietary technology and systems obsolete. Our success will depend, in part, on our ability to:
|
|
• |
develop, license and defend intellectual property useful in our businesses; |
|
|
• |
enhance our existing products and services; |
|
|
• |
develop new products and services and technologies that address the increasingly sophisticated and varied needs of our existing and prospective customers; |
|
|
• |
respond to technological advances and emerging industry standards and practices on a cost-effective and timely basis; |
|
|
• |
respond to the demand for new products, services and technologies on a cost-effective and timely basis; and |
|
|
• |
adapt to technological advancements and changing standards to address the increasingly sophisticated requirements and varied needs of our customers and prospective customers. |
There can be no assurance that we will be able to respond in a timely manner to changing conditions or customer requirements. In our Financial Services businesses, the development of proprietary electronic trading technology entails significant technical, financial and business risks. Further, the adoption of new Internet, networking or telecommunications technologies may require us to devote substantial resources to modify, adapt and defend our technology. There can be no assurance that we will successfully implement new technologies or adapt our proprietary technology and transaction-processing systems to customer requirements or emerging industry standards, or that we will be able to successfully defend any challenges to any technology we develop. Any failure on our part to anticipate or respond adequately to technological advancements, customer requirements or changing industry standards, or any significant delays in the development, introduction or availability of new products, services or technologies, could have a material adverse effect on our businesses, financial condition, results of operations and prospects.
Geographic Concentration
Our businesses are geographically concentrated and could be significantly affected by any adverse change in the regions in which we operate.
Historically, our business operations have been substantially located in the U.S. and the U.K. While we are expanding our businesses to new geographic areas, we are still highly concentrated in these areas. Because we derived approximately 63% and approximately 22%, respectively, of our total revenues on a consolidated basis for the year ended December 31, 2017 from our operations in the U.S. and the U.K., respectively, our businesses are exposed to adverse regulatory and competitive changes, economic downturns and changes in political conditions in these countries. If we are unable to identify and successfully manage or mitigate these risks, our businesses, financial condition, results of operations and prospects could be materially adversely affected.
Risks Related to Our Real Estate Services Separation, the Newmark IPO and Distribution
The Separation and Newmark IPO
We may not yet be able to achieve some or all of the expected benefits of the Separation and Newmark IPO, which were completed in December 2017.
We may not be able to achieve the full strategic and financial benefits to us and our Real Estate Services business that were anticipated to result from the Separation and Newmark IPO in a timely manner, or at all. Such benefits may be limited in the period prior to the proposed distribution or may be delayed or not occur at all. These benefits include the following:
|
|
• |
improving strategic planning, increasing management focus and streamlining decision-making by providing the flexibility for each of us and our Real Estate Services business to separately implement our respective strategic plans and to respond more effectively to different customer needs and the changing economic environment; |
|
|
• |
allowing each of our Financial Services business and Real Estate Services business to adopt a capital structure, investment policy and dividend policy best suited to its respective financial profile and business needs, as well as resolving the current competition for capital among our various businesses; |
|
|
• |
facilitating acquisitions by Newmark through the use of its Class A common stock as acquisition currency. |
We may not achieve the anticipated benefits for a variety of reasons. In the interim period, we may be subject to additional risks and uncertainties which may affect our businesses or the business of Newmark, which remains our subsidiary
43
following the Newmark IPO until the completion of the proposed distribution. Such additional risks and uncertainties may include the following:
|
|
• |
the price of our Class A common stock and Newmark’s Class A common stock could fluctuate significantly in response to developments following the Separation and Newmark IPO, market speculation or other matters; |
|
|
• |
our financial results and the financial results of Newmark may be harmed, and each of our and Newmark’s ability to execute effectively upon its respective business plans may be affected adversely, by the competing demands on management’s time and attention; |
|
|
• |
each of us and Newmark may be adversely affected by competition from larger companies and a loss of purchasing power as a result of the reduction in our size relative to our businesses prior to the Separation and Newmark IPO; |
|
|
• |
each of us and Newmark may encounter difficulties in hiring, retaining and motivating key personnel during this process, or as a result of uncertainties generated by the process or any developments or actions relating to it; |
|
|
• |
each of us and Newmark may encounter difficulties obtaining sufficient debt financing to restructure its debt or to operate or expand its businesses, and each may incur a higher cost of capital as a result of the reduction of its asset base following the Separation and Newmark IPO; |
|
|
• |
each of us and Newmark may incur substantial increases in general and administrative expense associated with the need to retain and compensate third-party consultants and advisors (including legal counsel); and |
|
|
• |
each of us and Newmark may encounter difficulties in maintaining relationships or arrangements with customers, key suppliers, and other parties as a result of the Separation and the proposed distribution. |
Furthermore, prior to the completion of the distribution, our securities and other compliance obligations, including associated costs, will increase significantly as our Real Estate Services business will have independent reporting obligations and compliance and other related costs. Any of these factors or others could have a negative impact on our businesses, financial condition, results of operations and prospects.
The Distribution
The distribution is subject to various additional risks and uncertainties and may not be completed in accordance with the expected plans or timeline, or at all, may not achieve the anticipated benefits, and will involve significant time and expense and management attention, any of which could negatively impact our businesses, financial condition, results of operations and prospects.
We may, subject to market, financing and other conditions, distribute the shares of Class A common stock that we hold and will receive in Newmark pro rata to our stockholders in the distribution, which is intended to qualify as tax-free for U.S. federal income tax purposes. The distribution may not be completed in accordance with any expected plans or timeline, or at all, may not achieve the anticipated benefits, and will involve significant time and expense and management attention, any of which could negatively impact our businesses, financial condition, results of operations and prospects.
In addition, in connection with the distribution:
|
|
• |
the price of our Class A common stock, as well as the Class A common stock of Newmark, could fluctuate significantly in response to developments relating to the distribution or other action or market speculation regarding the distribution or other transactions; and |
|
|
• |
we and Newmark may experience delays or may fail to obtain our desired tax treatment, opinions or other approvals or clearances with respect to the distribution. |
Any of these factors or others could have a negative impact on our businesses, financial condition, results of operations and prospects.
There is no assurance that the distribution will occur. If the distribution does not occur, our business and common stock may suffer.
As of December 31, 2017, we held 115,593,786 shares of Newmark’s Class A common stock representing approximately 83.4% of Newmark’s outstanding Class A common stock. In addition, as of December 31, 2017, we held 15,840,049 shares of Newmark’s Class B common stock representing all of the outstanding shares of Newmark’s Class B common stock. We currently expect to pursue a distribution to our stockholders of all of the shares of Newmark’s common stock that we own in a manner that is intended to qualify as generally tax-free for U.S. federal income tax purposes. The shares of Newmark’s common stock that we owned upon the completion of the Newmark IPO are subject to the 180-day “lock-up” restriction contained in the underwriting agreement for
44
the Newmark IPO. Further, there is no assurance that we will complete the distribution. The distribution is subject to a number of conditions, even though we may distribute those shares in a tax-efficient manner to our stockholders, we may determine not to proceed with the distribution if our board of directors determines, in its sole discretion that the distribution is not in our best interest or the best interest of our stockholders. Accordingly, the distribution may not occur on the expected timeframe, or at all.
If, following the completion of the distribution, there is a determination that the distribution is taxable for U.S. federal income tax purposes because the facts, assumptions, representations or undertakings underlying the tax opinion with respect to the distribution are incorrect, or for any other reason, then we and our stockholders could incur significant U.S. federal income tax liabilities.
It is a condition to the distribution that we receive an opinion of outside counsel to the effect that the dstribution, together with certain related transactions, will qualify as a transaction that is described in Sections 355 and 368(a)(1)(D) of the Internal Revenue Code of 1986, as amended. The opinion will rely on certain facts, assumptions, representations and undertakings from us and Newmark regarding the past and future conduct of the companies’ respective businesses and other matters. If any of these facts, assumptions, representations or undertakings are incorrect or not otherwise satisfied, we and our stockholders may not be able to rely on the opinion of tax counsel.
Moreover, notwithstanding the opinion of counsel, the IRS could determine that the distribution is taxable if it determines that any of these facts, assumptions, representations or undertakings are not correct or have been violated, or if it disagrees with the conclusions in the opinion, or for any other reasons. In addition, certain events occurring after the distribution may not be in our control, including certain significant changes in the stock ownership of us or Newmark after the distribution. If the distribution or a related transaction is determined to be taxable for U.S. federal income tax purposes, we and our stockholders could incur significant U.S. federal income tax liabilities. Any such liabilities could be substantial, and could have a negative impact on our financial results and operations.
New Opportunities/Possible Transactions and Hires
If we are unable to identify and successfully exploit new product, service and market opportunities, including through hiring new brokers, salespeople, managers and other professionals, our businesses, financial condition, results of operations, cash flows and prospects could be materially adversely affected.
Because of significant competition in our market, our strategy is to broker more transactions, manage more properties, increase our share of existing markets and seek out new clients and markets. We may face enhanced risks as these efforts to expand our business result in our transacting with a broader array of clients and expose us to new products and services and markets. Pursuing this strategy may also require significant management attention and hiring expense and potential costs and liability in any litigation or arbitration that may result. We may not be able to attract new clients or brokers, salespeople, managers, or other professionals or successfully enter new markets. If we are unable to identify and successfully exploit new product, service and market opportunities, our business, financial condition, results of operations and prospects could be materially adversely affected.
We may pursue strategic alliances, acquisitions, joint ventures or other growth opportunities (including hiring new brokers), which could present unforeseen integration obstacles or costs and could dilute our stockholders. We may also face competition in our acquisition strategy, and such competition may limit our number of strategic alliances, acquisitions, joint ventures and other growth opportunities (including hiring new brokers).
We have explored a wide range of strategic alliances, acquisitions and joint ventures with other real estate services firms, including maintaining or developing relationships with independently owned offices, and with other companies that have interests in businesses in which there are brokerage, management or other strategic opportunities. We continue to evaluate and potentially pursue possible strategic alliances, acquisitions, joint ventures and other growth opportunities (including hiring new brokers). Such transactions may be necessary in order for us to enter into or develop new products or services or markets, as well as to strengthen our current ones.
Strategic alliances, acquisitions, joint ventures and other growth opportunities (including hiring new brokers) specifically involve a number of risks and challenges, including:
|
|
• |
potential disruption of our ongoing business and product, service and market development and distraction of management; |
|
|
• |
difficulty retaining and integrating personnel and integrating administrative, operational, financial reporting, internal control, compliance, technology and other systems; |
|
|
• |
the necessity of hiring additional management and other critical personnel and integrating them into current operations; |
45
|
|
• |
the risks relating to integrating accounting and financial systems and accounting policies and the related risk of having to recast our historical financial statements; |
|
|
• |
potential dependence upon, and exposure to liability, loss or reputational damage relating to systems, controls and personnel that are not under our control; |
|
|
• |
addition of business lines in which we have not previously engaged; |
|
|
• |
potential unfavorable reaction to our strategic alliance, acquisition or joint venture strategy by our clients; |
|
|
• |
to the extent that we pursue opportunities outside the United States, exposure to political, economic, legal, regulatory, operational and other risks that are inherent in operating in a foreign country, including risks of possible nationalization and/or foreign ownership restrictions, expropriation, price controls, capital controls, foreign currency fluctuations, regulatory and tax requirements, economic and/or political instability, geographic, time zone, language and cultural differences among personnel in different areas of the world, exchange controls and other restrictive government actions, as well as the outbreak of hostilities; |
|
|
• |
the upfront costs associated with pursuing transactions and recruiting personnel, which efforts may be unsuccessful in the increasingly competitive marketplace for the most talented producers and managers; |
|
|
• |
conflicts or disagreements between any strategic alliance or joint venture partner and us; |
|
|
• |
exposure to potential unknown liabilities of any acquired business, strategic alliance or joint venture that are significantly larger than we anticipate at the time of acquisition, and unforeseen increased expenses or delays associated with acquisitions, including costs in excess of the cash transition costs that we estimate at the outset of a transaction; |
|
|
• |
reduction in availability of financing due to credit rating downgrades or defaults by us in connection with strategic alliances, acquisitions, joint ventures and other growth opportunities; |
|
|
• |
a significant increase in the level of our indebtedness in order to generate significant cash resources that may be required to effect acquisitions; |
|
|
• |
dilution resulting from any issuances of shares of our common stock or limited partnership units in connection with strategic alliances, acquisitions, joint ventures and other growth opportunities; |
|
|
• |
adverse effects on our liquidity as a result of payment of cash resources and/or issuance of shares of our common stock or limited partnership units of Newmark OpCo; and |
|
|
• |
a lag in the realization of financial benefits from these transactions and arrangements. |
We face competition for acquisition targets, which may limit our number of acquisitions and growth opportunities and may lead to higher acquisition prices or other less favorable terms. To the extent that we choose to grow internationally from acquisitions, strategic alliances, joint ventures or other growth opportunities, we may experience additional expenses or obstacles, including the short-term contractual restrictions contained in our agreement with Knight Frank, which such agreement could both affect and be affected by such choice. See “Item 1 - Business—Our Knight Frank Partnership.” There can be no assurance that we will be able to identify, acquire or profitably manage additional businesses or integrate successfully any acquired businesses without substantial costs, delays or other operational or financial difficulties.
In addition, the acquisition of regulated firms generally requires the consent of the home jurisdiction regulator in which the target is domiciled and those jurisdictions in which the target has regulated subsidiaries. In certain circumstances one or more of these regulators may withhold their consent, impose restrictions or make their consent subject to conditions which may result in increased costs or delays.
Any future growth will be partially dependent upon the continued availability of suitable transactional candidates at favorable prices and upon advantageous terms and conditions, which may not be available to us, as well as sufficient liquidity and credit to fund these transactions. Future transactions and any necessary related financings also may involve significant transaction-related expenses, which include payment of break-up fees, assumption of liabilities, including compensation, severance and lease termination costs, and transaction and deferred financing costs, among others. In addition, there can be no assurance that such transactions will be accretive or generate favorable operating margins. The success of these transactions will also be determined in part by the ongoing performance of the acquired companies and the acceptance of acquired employees of our partnership compensation structure and other variables which may be different from the existing industry standards or practices at the acquired companies.
46
We will need to successfully manage the integration of recent acquisitions and future growth effectively. The integration and additional growth may place a significant strain upon our management, administrative, operational, financial reporting, internal control and compliance infrastructure. Our ability to grow depends upon our ability to successfully hire, train, supervise and manage additional employees, expand our operational, financial reporting, compliance and other control systems effectively, allocate our human resources optimally, maintain clear lines of communication between our transactional and management functions and our finance and accounting functions, and manage the pressure on our management, administrative, operational, financial reporting, internal control and compliance infrastructure. Additionally, managing future growth may be difficult due to our new geographic locations, markets and business lines. As a result of these risks and challenges, we may not realize the full benefits that we anticipate from strategic alliances, acquisitions, joint ventures or other growth opportunities. There can be no assurance that we will be able to accurately anticipate and respond to the changing demands we will face as we integrate and continue to expand our operations, and we may not be able to manage growth effectively or to achieve growth at all. Any failure to manage the integration of acquisitions and other growth opportunities effectively could have a material adverse effect on our businesses, financial condition, results of operations and prospects.
Liquidity, Funding and Indebtedness
Liquidity is essential to our businesses, and insufficient liquidity could have a material adverse effect on our businesses, financial condition, results of operations and prospects.
Liquidity is essential to our businesses. Failures of financial institutions have often been attributable in large part to insufficient liquidity. Liquidity is of particular importance to our trading businesses, and perceived liquidity issues may affect the willingness of our customers and counterparties to engage in transactions with us in both of our operating segments. Our liquidity could be impaired due to circumstances that we may be unable to control, such as a general market disruption or an operational problem that affects our trading customers or counterparties, other third parties or us, or a decrease in the market value of marketable securities held on our balance sheet.
We are a parent holding company with no direct operations. We conduct substantially all of our operations through our operating subsidiaries. We do not have any material assets other than our direct and indirect ownership in the equity of our subsidiaries and their respective operating subsidiaries. As a result, our operating cash flow is dependent upon the earnings of our subsidiaries. In addition, we are dependent on the distribution of earnings, loans or other payments by our subsidiaries to us. In the event of a bankruptcy, liquidation, dissolution, reorganization or similar proceeding with respect to any of our subsidiaries, we, as an equity owner of such subsidiary, and therefore holders of our securities, including our notes, will be subject to the prior claims of such subsidiary’s creditors, including trade creditors, and any preferred equity holders. Any dividends declared by us, any payment by us of our indebtedness or other expenses, and all applicable taxes payable in respect of our net taxable income, if any, are paid from cash on hand and funds received from distributions, dividends, loans and/or other payments from BGC U.S. and BGC Global and from Newmark. Regulatory, tax restrictions or elections, and other legal or contractual restrictions may limit our ability to transfer funds freely from our subsidiaries. In particular, many of our subsidiaries, including our broker-dealer subsidiaries, are subject to laws, regulations, and self-regulatory organization rules that authorize regulatory bodies to block or reduce the flow of funds to a parent holding company, or that prohibit such transfers altogether in certain circumstances. These laws, regulations and rules may hinder our ability to access funds that we may need to meet our obligations. Certain debt and security agreements entered into by our subsidiaries contain various restrictions, including restrictions on payments by our subsidiaries to us and the transfer by our subsidiaries of assets pledged as collateral. To the extent that we need funds to pay dividends, repay indebtedness and meet other expenses, or to pay taxes on our share of BGC U.S.’s and BGC Global’s net taxable income or Newmark dividends, and BGC U.S., BGC Global, Newmark and their respective subsidiaries are restricted from making such distributions or dividends under applicable law, regulations, or agreements, or are otherwise unable to provide such funds, it could materially adversely affect our businesses, financial condition, results of operations and prospects, including our ability to raise additional funding, including through access to the debt and equity capital markets.
Our ability to raise funding in the long-term or short-term debt capital markets or the equity capital markets, or to access secured lending markets, has in the past been and could in the future be adversely affected by conditions in the U.S. and international economy and markets, with the cost and availability of funding adversely affected by illiquid credit markets and wider credit spreads. To the extent we are not able to access the debt capital markets on acceptable terms in the future, we may seek to raise funding and capital through equity issuances or other means.
Turbulence in the U.S. and international economy and markets may adversely affect our liquidity and financial condition and the willingness of certain customers and counterparties to do business with each other or with us. Acquisitions and financial reporting obligations related thereto may impact our ability to access capital markets on a timely basis and may necessitate greater short-term borrowing in the interim, which in turn may adversely affect the interest rates on our debt and our credit ratings and associated outlooks.
Our funding base consists of longer-term capital (equity, notes payable and collateralized borrowings), shorter-term liabilities and accruals that are a natural outgrowth of specific assets and/or our Financial Services business model, such as matched
47
fails and accrued compensation. We generally have had limited need for short-term unsecured funding in our Financial Services segment. We may, however, need to access short-term capital sources to meet business needs from time to time, including, but not limited to, financing acquisitions, conducting operations, hiring or retaining brokers, providing liquidity and funding fails, including in situations where we may not be able to access the capital markets in a timely manner when desired by us. Contingent liquidity needs are largely limited to potential cash collateral that may be needed to meet clearing bank, clearinghouse and exchange margins and/or to fund fails. A significant portion of our cash is held in our largest regulated entities, and we believe that cash in and available to these entities, inclusive of financing provided by clearing banks, is adequate for potential cash demands of normal operations such as margin or funding fails.
In our Real Estate Services business, we need to access short-term capital sources in order to originate loans and to meet other business needs from time to time, including, but not limited to, financing acquisitions, conducting operations or hiring or retaining real estate brokers, salespeople, managers, and other professionals. Our inability to secure such short-term capital could have a material adverse effect on our businesses, financial condition, results of operations and prospects.
We are subject to the risk of failed loan deliveries, and even after a successful closing and delivery, may be required to repurchase the loan or to indemnify the investor if there is a breach of a representation or warranty made by us in connection with the sale of loans, which could have a material adverse effect on our business, financial condition, results of operations and prospects.
In our Real Estate Services business, we bear the risk that a borrower will not close on a loan that has been pre-sold to an investor and the amount of such borrower’s rate lock deposit and any amounts recoverable from such borrower for breach of its obligations are insufficient to cover the investor’s losses. In addition, the investor may choose not to take delivery of the loan if a catastrophic change in the condition of a property occurs after we fund the loan and prior to the investor purchase date. We also have the risk of errors in loan documentation which prevent timely delivery of the loan prior to the investor purchase date. A complete failure to deliver a loan could be a default under the warehouse line used to finance the loan. No assurance can be given that we will not experience failed deliveries in the future or that any losses will not have a material adverse effect on our businesses, financial condition, results of operations or prospects.
We must make certain representations and warranties concerning each loan we originate for the GSEs’ and HUD’s programs or securitizations. The representations and warranties relate to our practices in the origination and servicing of the loans and the accuracy of the information being provided by it. In the event of a material breach of representations or warranties concerning a loan, even if the loan is not in default, investors could, among other things, require us to repurchase the full amount of the loan and seek indemnification for losses from it, or, for Fannie Mae DUS loans, increase the level of risk-sharing on the loan. Our obligation to repurchase the loan is independent of our risk-sharing obligations. Our ability to recover on a claim against the borrower or any other party may be contractually limited and would also be dependent, in part, upon the financial condition and liquidity of such party. Although these obligations have not had a significant impact on our results to date, significant repurchase or indemnification obligations imposed on us could have a material adverse effect on our businesses, financial condition, results of operations and prospects.
We have debt, which could adversely affect our ability to raise additional capital to fund our operations and activities, limit our ability to react to changes in the economy or our industries, expose us to interest rate risk and prevent us from meeting our obligations under our indebtedness.
Our indebtedness, which at December 31, 2017 was $1,650.5 million, may have important, adverse consequences to us and our investors, including:
|
|
• |
it may limit our ability to borrow money, dispose of assets or sell equity to fund our working capital, capital expenditures, dividend payments, debt service, strategic initiatives or other obligations or purposes; |
|
|
• |
it may limit our flexibility in planning for, or reacting to, changes in the economy, the markets, regulatory requirements, our operations or businesses; |
|
|
• |
it may impact the timeframe for the completion of the proposed distribution; |
|
|
• |
we may be more highly leveraged than some of our competitors, which may place us at a competitive disadvantage; |
|
|
• |
it may make us more vulnerable to downturns in the economy or our businesses; |
|
|
• |
it may require a substantial portion of our cash flow from operations to make interest payments; |
|
|
• |
it may make it more difficult for us to satisfy other obligations; |
|
|
• |
it may increase the risk of a future credit ratings downgrade of us, which could increase future debt costs and limit the future availability of debt financing; and |
48
|
|
• |
we may not be able to borrow additional funds as needed or take advantage of business opportunities as they arise, pay cash dividends or repurchase common stock; and |
|
|
• |
there would be a material adverse effect on our businesses, financial condition, results of operations and prospects if we were unable to service our indebtedness or obtain additional financing or refinance our existing debt on terms acceptable to us. |
To the extent that we incur additional indebtedness, the risks described above could increase. In addition, our actual cash requirements in the future may be greater than expected. Our cash flow from operations may not be sufficient to service our outstanding debt or to repay the outstanding debt as it becomes due, and we may not be able to borrow money, sell assets or otherwise raise funds on acceptable terms, or at all, to service or refinance our debt.
In our Financial Services business, we are dependent upon the availability of adequate funding and sufficient regulatory capital and clearing margin. Clearing margin is the amount of cash, guarantees or similar collateral that we must provide or deposit with our third-party clearing organizations in support of our obligations under contractual clearing arrangements with these organizations. Historically, these needs have been satisfied from internally generated funds and proceeds from debt and equity financings. We have also relied on Cantor’s support to clear our transactions in U.S. Treasury and U.S. government agency products under the clearing agreement we entered into with Cantor in November 2008. Although we have historically been able to raise debt on acceptable terms, if for any reason we need to raise additional funds, including in order to meet regulatory capital requirements and/or clearing margin requirements arising from growth in our brokerage businesses, to complete acquisitions or otherwise, we may not be able to obtain additional financing when needed. If we cannot raise additional funds on acceptable terms, we may not be able to develop or enhance our businesses, take advantage of future growth opportunities or respond to competitive pressure or unanticipated requirements.
In our Real Estate Services business, we require a significant amount of short-term funding capacity for loans we originate through Berkeley Point. As of December 31, 2017, Berkeley Point had $950 million of committed loan funding available through three commercial banks and an uncommitted $325 million Fannie Mae loan repurchase facility. Consistent with industry practice, Berkeley Point’s existing warehouse facilities are short-term, requiring annual renewal. If any of the committed facilities are terminated or are not renewed or the uncommitted facility is not honored, we would be required to obtain replacement financing, which we may be unable to find on favorable terms, or at all, and, in such event, we might not be able to originate loans, which could have a material adverse effect on our businesses, financial condition, results of operations and prospects.
In addition, following the announcement of the Berkeley Point Acquisition and the subsequent Newmark IPO, both of our credit rating outlooks were amended to “negative watch,” which is subject to the successful completion of various capital raising activities. The additional indebtedness that we incur, as well as any changes to our credit ratings and associated outlooks, may restrict our ability to raise additional capital on favorable terms, and such leverage, and any resulting liquidity or credit issues, could have a material adverse effect on our businesses, financial condition, results of operation and prospects.
We may incur substantially more debt or take other actions which would intensify the risks discussed herein.
We may incur substantial additional debt in the future, some of which may be secured debt. Under the terms of our existing debt, we are permitted under certain circumstances to incur additional debt, grant liens on our assets to secure existing or future debt, recapitalize our debt or take a number of other actions that could have the effect of diminishing our ability to make payments on our debt when due. To the extent that we borrow additional funds subsequent to this offering, the terms of such borrowings may contain more stringent financial covenants, change of control provisions, make-whole provisions or other terms that could have a material adverse effect on our businesses, financial condition, results of operations and prospects.
Our debt agreements contain restrictions that may limit our flexibility in operating our businesses.
The Term Loan Credit Agreement and the Revolving Credit Agreement, each as amended, contain covenants that could impose operating and financial restrictions on us, including restrictions on our ability to, among other things and subject to certain exceptions:
|
|
• |
create liens on certain assets; |
|
|
• |
incur additional debt; |
|
|
• |
make significant investments and acquisitions; |
|
|
• |
consolidate, merge, sell or otherwise dispose of all or substantially all of our assets; |
|
|
• |
sell certain assets; |
49
|
|
• |
pay additional dividends on or make additional distributions in respect of our capital stock or make restricted payments; |
|
|
• |
enter into certain transactions with our affiliates; and |
|
|
• |
place restrictions on certain distributions from subsidiaries. |
Indebtedness that we may enter into in the future, if any, could also potentially contain similar or additional covenants or restrictions. Any of these restrictions could limit our ability to adequately plan for or react to market conditions and could otherwise restrict certain of our corporate activities. Any material failure to comply with these covenants could result in a default under the Term Loan Credit Agreement or the Revolving Credit Agreement, each as amended, as well as instruments governing our future indebtedness. Upon a material default, unless such default were cured by us or waived by lenders in accordance with the applicable agreements, the lenders under such agreements could elect to invoke various remedies under the agreements, including potentially accelerating the payment of unpaid principal and interest, terminating their commitments or, however unlikely, potentially forcing us into bankruptcy or liquidation. In addition, a default or acceleration under any of such agreements could trigger a cross default under the other agreements, including potential future debt arrangements. As long as Newmark is our subsidiary, Newmark will remain subject to restrictions under the Revolving Credit Agreement even if it has no outstanding indebtedness under the Revolving Credit Agreement. Although we believe that our operating results will be more than sufficient to cover all of these obligations, including potential future indebtedness, no assurance can be given that our operating results will be sufficient to service our indebtedness or to fund all of our other expenditures or to obtain additional or replacement financing on a timely basis and on reasonable terms in order to meet these requirements when due. See “Item 7 – Management’s Discussion and Analysis of Financial Condition and Results of Operations – Liquidity” in this Annual Report on Form 10-K.
Credit rating downgrades or defaults by us could adversely affect us.
The credit ratings and associated outlooks of companies may be critical to their reputation and operational and financial success. A company’s credit ratings and associated outlooks are influenced by a number of factors, including: operating environment, earnings and profitability trends, the prudence of funding and liquidity management practices, balance sheet size/composition and resulting leverage, cash flow coverage of interest, composition and size of the capital base, available liquidity, outstanding borrowing levels, the company’s competitive position in the industry and its relationships in the industry. A credit rating and/or the associated outlook can be revised upward or downward at any time by a rating agency if such rating agency decides that circumstances of that company or related companies warrant such a change. Any adverse ratings or reduction in the credit ratings of BGC Partners, Cantor or any of their other affiliates, and/or the associated outlook could adversely affect the availability of debt financing to us on acceptable terms, as well as the cost and other terms upon which we may obtain any such financing. In addition, credit ratings and associated outlooks may be important to clients in certain markets and in certain transactions. A company’s contractual counterparties may, in certain circumstances, demand collateral in the event of a credit ratings or outlook downgrade of that company.
Our acquisitions may require significant cash resources and may lead to a significant increase in the level of our indebtedness.
Potential future acquisitions may lead to a significant increase in the level of our indebtedness. We may enter into short- or long-term financing arrangements in connection with acquisitions which may occur from time to time. In addition, we may incur substantial non-recurring transaction costs, including break-up fees, assumption of liabilities and expenses and compensation expenses and we would likely incur similar expenses. The increased level of our consolidated indebtedness in connection with potential acquisitions may restrict our ability to raise additional capital on favorable terms, and such leverage, and any resulting liquidity or credit issues, could have a material adverse effect on our businesses, financial condition, results of operations and prospects.
We may not be able to realize the full value of the Nasdaq payment, which could have a material adverse effect on our businesses, financial condition, results of operations and prospects.
On June 28, 2013, we sold eSpeed to Nasdaq in the Nasdaq Transaction. The total consideration paid or payable by Nasdaq in the Nasdaq Transaction included an earn-out of up to 14,883,705 shares of common stock of Nasdaq to be paid ratably over 15 years after the closing of the Nasdaq Transaction, provided that Nasdaq produces at least $25 million in gross revenues for the applicable year. As of December 31, 2017, up to 9,922,470 Nasdaq shares remained payable by Nasdaq under this earn-out. In connection with the separation prior to the completion of Newmark’s IPO, we transferred to Newmark the right to receive the remainder of the Nasdaq payment. Newmark recognized the receipt of the first of these payments of Nasdaq shares in the quarter ended September 30, 2017, and expects to recognize the receipt of shares ratably in the third quarter of future fiscal years. This earn-out presents market risk to us as the value of consideration related to the Nasdaq payment is subject to fluctuations based on the stock price of Nasdaq common stock. Therefore, if Nasdaq were to experience financial difficulties or a significant downturn, the value of the Nasdaq payment may decline and Newmark may receive fewer or no additional Nasdaq shares pursuant to this earn-out, which could have a material adverse effect on our businesses, financial condition, results of operations and prospects.
50
We may incur substantially more debt or take other actions which would intensify the risks discussed herein.
We may incur substantial additional debt in the future, some of which may be secured debt. We are not restricted under the terms of the indentures governing our 8.125% Senior Notes, 5.375% Senior Notes, 5.125% Senior Notes and 8.375% Senior Notes from incurring additional debt, securing existing or future debt (with certain exceptions, including to the extent already secured), recapitalizing our debt or taking a number of other actions that are not limited by the terms of our debt instruments that could have the effect of diminishing our ability to make payments on our debt when due.
We may not have the funds necessary to repurchase the 8.125% Senior Notes, the 5.375% Senior Notes, the 5.125% Senior Notes or the 8.375% Senior Notes upon a change of control triggering event as required by the indentures governing these notes.
Upon the occurrence of a “change of control triggering event” (as defined in the indentures governing the 8.125% Senior Notes, the 5.375% Senior Notes, the 5.125% Senior Notes and the 8.375% Senior Notes), unless we have exercised our right to redeem such notes, holders of the notes will have the right to require us to repurchase all or any part of their notes at a price in cash equal to 100% of the then-outstanding aggregate principal amount of the notes repurchased plus accrued and unpaid interest, if any. There can be no assurance that we would have sufficient, available financial resources, or would be able to arrange financing, to repurchase the 8.125% Senior Notes, the 5.375% Senior Notes, the 5.125% Senior Notes or the 8.375% Senior Notes upon a “change of control triggering event.” A failure by us to repurchase the notes when required would result in an event of default with respect to the notes. In addition, such failure may also constitute an event of default and result in the effective acceleration of the maturity of our other then-existing indebtedness.
The requirement to offer to repurchase the 8.125% Senior Notes, the 5.375% Senior Notes, the 5.125% Senior Notes and the 8.375% Senior Notes upon a “change of control triggering event” may delay or prevent an otherwise beneficial takeover attempt of us.
The requirement to offer to repurchase the 8.125% Senior Notes, the 5.375% Senior Notes, the 5.125% Senior Notes and the 8.375% Senior Notes upon a “change of control triggering event” may in certain circumstances delay or prevent a takeover of us and/or the removal of incumbent management that might otherwise be beneficial to investors in our Class A common stock.
Intellectual Property
We may not be able to protect our intellectual property rights or may be prevented from using intellectual property necessary for our businesses.
Our success is dependent, in part, upon our intellectual property, including our proprietary technology. We rely primarily on trade secret, contract, patent, copyright, and trademark law in the U.S. and other jurisdictions as well as confidentiality procedures and contractual provisions to establish and protect our intellectual property rights to proprietary technologies, products, services or methods, and our brand. For example, we regularly file patent applications to protect inventions arising from our research and development, and we are currently pursuing patent applications around the world. We also control access to our proprietary technology, and enter into confidentiality and invention assignment agreements with our employees and consultants and confidentiality agreements with other third parties. Protecting our intellectual property rights is costly and time consuming.
Unauthorized use of our intellectual property could make it more expensive to do business and harm our operating results. We cannot ensure that our intellectual property rights are sufficient to protect our competitive advantages or that any particular patent, copyright or trademark is valid and enforceable, and all patents ultimately expire. In addition, the laws of some foreign countries may not protect our intellectual property rights to the same extent as the laws in the United States, or at all. Any significant impairment of our intellectual property rights could harm our business or our ability to compete.
Many companies, including those in the computer and financial services industries own large numbers of patents, copyrights, and trademarks and sometimes file lawsuits based on allegations of infringement or other violations of intellectual property rights. In addition, there has been a proliferation of patents applicable to these industries and a substantial increase in the number of such patent applications filed. Under current law, U.S. patent applications typically remain secret for 18 months or, in some cases, until a patent is issued. Because of technological changes in these industries, patent coverage, and the issuance of new patents, it is possible certain components of our products and services may unknowingly infringe existing patents or other intellectual property rights of others. Although we have taken steps to protect ourselves, there can be no assurance that we will be aware of all patents, copyrights or trademarks that may pose a risk of infringement by our products and services. Generally, it is not economically practicable to determine in advance whether our products or services may infringe the present or future rights of others.
Accordingly, we may face claims of infringement or other violations of intellectual property rights that could interfere with our ability to use intellectual property or technology that is material to our businesses. In addition, restrictions on the distribution
51
of some of the market data generated by our brokerage desks could limit the comprehensiveness and quality of the data we are able to distribute or sell. The number of such third-party claims may grow. Our technologies may not be able to withstand such third-party claims or rights against their use.
We may have to rely on litigation to enforce our intellectual property rights, protect our trade secrets, determine the validity and scope of the rights of others or defend against claims of infringement or invalidity. For example, we recently responded to a claim by Newmark Realty Capital, Inc. (which we refer to as “Realty Capital”) against Newmark alleging, among other things, trademark infringement under Section 32 of the Lanham Act. In connection with our answer, we filed counterclaims alleging that Realty Capital has infringed our trademarks and seeking an order cancelling Realty Capital’s registered trademarks. We also separately initiated an action before the U.S. Patent and Trademark Office seeking invalidation of Realty Capital’s registration of a design mark that includes the stand-alone name “Newmark.” On November 16, 2017, a federal court in the Northern District of California issued an order denying Realty Capital’s motion to enjoin us from using the name “Newmark” generally as a trademark, which supported Newmark’s rights and longstanding goodwill in relation to the use of the “Newmark” name. The same order temporarily enjoined Newmark from using the name “Newmark” for “mortgage banking, mortgage brokerage, loan servicing, investment brokerage, and investment consulting services in the field of commercial real estate.” This order is in effect until a decision at trial, which is currently scheduled for January 2019. Newmark has moved the court for an order reconsidering the injunction and lifting it in its entirety, and may eventually file an appeal if necessary. In response to Newmark’s request that the court stay the injunction pending reconsideration, the court ruled in Newmark’s favor and has suspended the injunction as to the categories of “investment consulting” and “investment brokerage.” In advance of the motion for reconsideration hearing, Realty Capital filed a motion for a new injunction prohibiting the use of “Newmark” for “any commercial real estate services” and demanding relief more expansive than the request the Court previously denied on November 16, 2017. We believe this latest submission is legally and factually meritless and filed in bad faith and have taken, and will continue to take, appropriate action to address it. No assurance can be given as to whether these cases will ultimately be determined in our favor or that our ability to use the “Newmark” name will be impacted by the proceedings. Any such claims or litigation, whether successful or unsuccessful, could result in substantial costs, the diversion of resources and the attention of management, any of which could materially negatively affect our businesses. Responding to these claims could also require us to enter into royalty or licensing agreements with the third parties claiming infringement, stop selling or redesign affected products or services or pay damages on our own behalf or to satisfy indemnification commitments with our customers. Such royalty or licensing agreements, if available, may not be available on terms acceptable to us, and may negatively affect our business, financial condition, results of operations or prospects. Despite these potential risks, even if we are permanently enjoined from using the “Newmark” name in the sectors described in the preliminary injunction order or in connection with commercial real estate services generally, we do not believe such an order would significantly affect the Company’s long-term prospects.
If our licenses from third parties are terminated or adversely changed or amended or contain material defects or errors, or if any of these third parties were to cease doing business or if products or services offered by third parties were to contain material defects or errors, our ability to operate our businesses may be materially adversely affected.
We license databases and software from third parties, much of which is integral to our systems and our business. The licenses are terminable if we breach our obligations under the license agreements. If any material licenses were terminated or adversely changed or amended, if any of these third parties were to cease doing business or if any licensed software or databases licensed by these third parties were to contain material defects or errors, we may be forced to spend significant time and money to replace the licensed software and databases, and our ability to operate our business may be materially adversely affected. Further, any errors or defects in third-party services or products (including hardware, software, databases, cloud computing and other platforms and systems) or in services or products that we develop ourselves, could result in errors in, or a failure of our services or products, which could harm our business. Although we take steps to locate replacements, there can be no assurance that the necessary replacements will be available on acceptable terms, if at all. There can be no assurance that we will have an ongoing license to use all intellectual property which our systems require, the failure of which could have a material adverse effect on our businesses, financial condition, results of operations and prospects.
IT Systems and Cybersecurity Risks
Defects or disruptions in our technology or services could diminish demand for our products and service and subject us to liability.
Because our technology, products and services are complex and use or incorporate a variety of computer hardware, software and databases, both developed in-house and acquired from third party vendors, our technology, products and services may have errors or defects. Errors and defects could result in unanticipated downtime or failure, and could cause financial loss and harm to our reputation and our business. We have from time to time found defects and errors in our technology, products and service and defects and errors in our technology, products or services may be detected in the future. In addition, our customers may use our technology, products and services in unanticipated ways that may cause a disruption for other customers. Furthermore, as we acquire companies, we may encounter difficulty in incorporating the acquired technologies, products and services, and maintaining the quality
52
standards that are consistent with our technology, products and services. Since our customers use our technology, products and services for important aspects of their business and for financial transactions, any errors, defects, or disruptions in such technology, products and services or other performance problems with our technology, products and services could subject our customers to financial loss and hurt our reputation.
If we experience computer systems failures or capacity constraints, our ability to conduct our business operations could be materially harmed.
If we experience computer systems failures or capacity constraints, our ability to conduct our business operations could be harmed. We support and maintain many of our computer systems and networks internally. Our failure to monitor or maintain these systems and networks or, if necessary, to find a replacement for this technology in a timely and cost-effective manner, could have a material adverse effect on our ability to conduct our business operations.
Although all of our business critical systems have been designed and implemented with fault tolerant and/or redundant clustered hardware and diversely routed network connectivity, our redundant systems or disaster recovery plans may prove to be inadequate. Although we operate four geographically disparate main data centers, they could be subject to failure due to environmental factors, power outage and other factors. We may be subject to system failures and outages which might impact our revenues and relationships with customers. In addition, we will be subject to risk in the event that systems of our customers, business partners, counterparties, vendors, and other third parties, including exchanges and clearing organizations, are subject to failures and outages.
We rely on various third parties for computer and communications systems, such as telephone companies, online service providers, data processors, and software and hardware vendors. Our systems, or those of our third-party providers, may fail or operate slowly, causing one or more of the following, which may not in all cases be covered by insurance:
|
|
• |
unanticipated disruptions in service to our customers; |
|
|
• |
slower response times; |
|
|
• |
delays in our customers’ trade executions; |
|
|
• |
failed settlement of trades; |
|
|
• |
incomplete or inaccurate accounting, recording or processing of trades; |
|
|
• |
financial losses; |
|
|
• |
litigation or other customer claims; and |
|
|
• |
regulatory actions. |
We may experience additional systems or network failures in the future from power or telecommunications failures, acts of God or war, weather-related events, terrorist attacks, human error, natural disasters, fire, power loss, sabotage, cyber-attacks, hardware or software malfunctions or defects, computer viruses, intentional acts of vandalism and similar events. Any system or network failure that causes an interruption in products or services or decreases the responsiveness of our service, including failures caused by customer error or misuse of our systems, could damage our reputation, businesses and brand name.
Malicious cyber-attacks and other adverse events affecting our operational systems or infrastructure, or those of third parties, could disrupt our businesses, result in the disclosure of confidential information, damage our reputation and cause losses or regulatory penalties.
Our businesses require us to process and monitor, on a daily basis, a very large number of transactions, many of which are highly complex, across numerous and diverse markets in many currencies. Developing and maintaining our operational systems and infrastructure is challenging, particularly as a result of rapidly evolving legal and regulatory requirements and technological shifts. Our financial, accounting, data processing or other operating and compliance systems and facilities may fail to operate properly or become disabled as a result of events that are wholly or partially beyond our control, including malicious cyber-attack or other adverse events, which may adversely affect our ability to process these transactions or provide services or products.
In addition, our operations rely on the secure processing, storage and transmission of confidential and other information on our computer systems and networks. Although we take protective measures such as software programs, firewalls and similar technology to maintain the confidentiality, integrity and availability of our and our customers’ information, and endeavor to modify these protective measures as circumstances warrant, the nature of cyber threats continues to evolve. As a result, our computer systems, software and networks may be vulnerable to unauthorized access, loss or destruction of data (including confidential customer information), account takeovers, unavailability or disruption of service, computer viruses, acts of vandalism, or other malicious code,
53
cyber-attack and other adverse events that could have an adverse security impact. Despite the defensive measures we have taken, these threats may come from external factors such as governments, organized crime, hackers, and other third parties including outsource or infrastructure-support providers and application developers, or may originate internally from within us. Given the high volume of transactions, certain errors may be repeated or compounded before they are discovered and rectified.
We also face the risk of operational disruption, failure, termination or capacity constraints of any of the third parties that facilitate our business activities, including customers, counterparties, exchanges, clearing agents, clearinghouses or other financial intermediaries. Such parties could also be the source of a cyber-attack on or breach of our operational systems, network, data or infrastructure.
There have been an increasing number of cyber-attacks in recent years in various industries, including ours, and cyber security risk management has been the subject of increasing focus by our regulators. If one or more cyber-attacks occur, it could potentially jeopardize the confidential, proprietary and other information processed and stored in, and transmitted through, our computer systems and networks, or otherwise cause interruptions or malfunctions in our, as well as our customers’ or other third parties’, operations, which could result in reputational damage, financial losses, customer dissatisfaction and/or regulatory penalties, which may not in all cases by covered by insurance. Any such cyber incidents involving our computer systems and networks, or those of third parties important to our businesses, could have a material adverse effect on our businesses, financial condition, results of operations and prospects.
Our financial services regulators in recent years have increased their examination and enforcement focus on matters relating to cybersecurity threats, including the assessment of firms’ vulnerability to cyber-attacks. In particular, regulatory concerns have been raised about firms establishing effective cybersecurity governance and risk management policies, practices and procedures; protecting firm networks and information; identifying and addressing risk associated with remote access to client information and fund transfer requests; identifying and addressing risks associated with customers business partners, counterparties, vendors, and other third parties, including exchanges and clearing organizations; preventing and detecting unauthorized activities; adopting effective mitigation and business continuity plans to address the impact of cybersecurity breaches; and establishing protocols for reporting cybersecurity incidents. While any insurance that we may have that covers a specific cybersecurity incident may help to prevent our realizing a significant loss from the incident, it would not protect us from the effects of adverse regulatory actions that may result from the incident or a finding that we had inadequate cybersecurity controls, including the reputational harm that could result from such regulatory actions.
Natural Disasters, Weather-Related Events, Terrorist Attacks, and Other Disruptions to Infrastructure
Our ability to conduct our businesses may be materially adversely impacted by catastrophic events, including natural disasters, weather-related events, terrorist attacks, and other disruptions.
We may encounter disruptions involving power, communications, transportation or other utilities or essential services depended on by us or by third parties with whom we conduct business. This could include disruptions as the result of natural disasters, pandemics, or weather-related or similar events, such as fires, hurricanes, earthquakes and floods, political instability, labor strikes or turmoil or terrorist attacks. For example, during 2012, our own operations and properties we manage for clients in the northeastern United States, and in particular New York City, were impacted by Hurricane Sandy, in some cases significantly. In 2017, several parts of the United States, including Texas, Florida and Puerto Rico, sustained significant damage from hurricanes. We continue to assess the impact on our borrowers and other clients and what impact, if any, these hurricanes could have on our businesses, financial condition, results of operations and prospects.
These disruptions may occur, for example, as a result of events affecting only the buildings in which we operate (such as fires), or as a result of events with a broader impact on the communities where those buildings are located. If a disruption occurs in one location and persons in that location are unable to communicate with or travel to or work from other locations, our ability to service and interact with our customers and others may suffer, and we may not be able to successfully implement contingency plans that depend on communications or travel.
Such events can result in significant injuries and loss of life, which could result in material financial liabilities, loss of business and reputational harm. They can also impact the availability and/or loss of commercial insurance policies, both for our own businesses and for those customers whose properties we manage and who may purchase their insurance through the insurance buying programs we make available to them.
There can be no assurance that the disaster recovery and crisis management procedures we employ will suffice in any particular situation to avoid a significant loss. Given that our employees are increasingly mobile and less reliant on physical presence in our offices, our disaster recovery plans increasingly rely on the availability of the Internet (including “cloud” technology) and mobile phone technology, so the disruption of those systems would likely affect our ability to recover promptly from a crisis situation. Although we maintain insurance for liability, property damage and business interruption, subject to deductibles and various
54
exceptions, no assurance can be given that our businesses, financial condition, results of operations and prospects will not be materially negatively affected by such events in the future.
Environmental Liabilities and Regulations; Climate Risks
Our operations are affected by federal, state and/or local environmental laws in the jurisdictions in which we maintain office space for our own operations and where we manage properties for clients in our Real Estate businesses, and we may face liability with respect to environmental issues occurring at properties that we occupy or manage.
Various laws, rules and regulations restrict the levels of certain substances that may be discharged into the environment by properties and such laws, rules and regulations may impose liability on current or previous real estate owners or operators for the cost of investigating, cleaning up or removing contamination caused by hazardous or toxic substances at the property. We may face costs or liabilities under these laws as a result of our role as an on-site property manager. Such liability may be imposed without regard to the lawfulness of the original disposal activity, or our knowledge of, or fault for, the release or contamination. Further, liability under some of these laws may be joint and several, meaning that one liable party could be held responsible for all costs related to a contaminated site. Insurance for such matters may not be available or sufficient. While we believe that we have taken adequate measures to prevent any such losses, no assurances can be given that these events will not occur. Within our own operations, we face additional costs from rising costs of environmental compliance, which make it more expensive to operate our corporate offices.
Certain requirements governing the removal or encapsulation of asbestos-containing materials, as well as recently enacted local ordinances obligating property or facilities managers to inspect for and remove lead-based paint in certain buildings, could increase our costs of legal compliance and potentially subject us to violations or claims. More stringent enforcement of existing regulations could cause us to incur significant costs in the future, and/or materially and adversely impact our commercial real estate brokerage and management services business.
Federal, state, local and foreign laws, rules and regulations impose various environmental zoning restrictions, use controls, and disclosure obligations which impact the management, development, use and/or sale of real estate. Such laws and regulations tend to discourage sales and leasing activities, as well as mortgage lending availability, with respect to some properties. A decrease or delay in such transactions may materially and adversely affect our business, financial condition, results of operations and prospects. In addition, a failure by us to disclose environmental concerns in connection with a real estate transaction may subject us to liability to a buyer/seller or lessee/lessor of property. While historically our Real Estate Services business has not incurred any significant liability in connection with these types of environmental issues, there is no assurance that this will not occur.
Our operations are generally conducted within leased office building space, and, accordingly, we do not currently anticipate that regulations restricting the emissions of greenhouse gases, or taxes that may be imposed on their release, would result in material costs or capital expenditures. However, we cannot be certain about the extent to which such regulations will develop as there are higher levels of understanding and commitments by different governments in the United States and around the world regarding risks related to the climate and how they should be mitigated. Regulations relating to climate change may affect the scope of services we provide to clients in their managed properties, but we expect that clients would typically bear any additional costs of doing so under applicable management agreements.
We anticipate that the potential effects of climate change may impact the decisions and analysis the employees in our Real Estate Services business make with respect to the properties they evaluate or manage on behalf of clients since climate change considerations may impact the relative desirability of locations and the cost of operating and insuring the properties. Future legislation that requires specific performance levels for building operations could make non-compliant buildings more expensive, which could materially adversely affect investments in properties we have made on behalf of clients.
Key Personnel and Employees
Our ability to retain our key employees and the ability of certain key employees to devote adequate time to us are critical to the success of our businesses, and failure to do so may materially adversely affect our businesses, financial condition, results of operations and prospects.
Our people are our most important resource. We must retain the services of our key employees and strategically recruit and hire new talented employees to attract customer transactions that generate most of our revenues.
Howard W. Lutnick, who serves as our Chief Executive Officer and as Chairman of us and Newmark, is also the Chairman of the Board, President and Chief Executive Officer of Cantor and President of CFGM, the managing partner of Cantor. Stephen M. Merkel, who serves as our Executive Vice President, General Counsel and Secretary, is employed as Executive Managing Director, General Counsel and Secretary of Cantor. In addition, Messrs. Lutnick and Merkel also hold offices at various other affiliates of Cantor. These two key employees are not subject to employment agreements with us or any of our subsidiaries.
55
Currently, Mr. Lutnick and Mr. Merkel each spends approximately 50% of his time on our matters (including Newmark), although these percentages may vary depending on business developments at us or Newmark or Cantor or any of our or Cantor’s other affiliates. As a result, these key employees (and others in key executive or management roles whom we may hire from time to time) dedicate only a portion of their professional efforts to our businesses and operations, and there is no contractual obligation for them to spend a specific amount of their time with us and/or Cantor. These two key employees may not be able to dedicate adequate time to our businesses and operations, and we could experience an adverse effect on our operations due to the demands placed on our management team by their other professional obligations. In addition, these key employees’ other responsibilities could cause conflicts of interest with us.
The BGC Holdings and the Newmark Holdings limited partnership agreements, which include non-competition and other arrangements applicable to our key employees who are limited partners of BGC Holdings and/or Newmark Holdings, may not prevent our key employees, including Messrs. Lutnick and Merkel, whose employment by Cantor is not subject to these provisions in the limited partnership agreements, from resigning or competing against us. In addition, our success in the Financial Services segment has largely been dependent on the efforts of Mr. Lutnick and our President, Shaun Lynn, and other executive officers. In the Real Estate Services segment, our success has similarly been dependent on efforts by Mr. Lutnick in connection with acquisitions and on an ongoing basis by officers such as Barry Gosin and other key employees, including some who have been hired in connection with these acquisitions. Should Mr. Lutnick leave or otherwise become unavailable to render services to us, control of us would likely pass to Cantor, and indirectly pass to the then-controlling stockholder of CFGM (which is Mr. Lutnick), Cantor’s managing general partner, or to such other managing general partner as CFGM would appoint, and as a result control could remain with Mr. Lutnick. If any of our key employees in our Financial Services or Real Estate Services segments were to join an existing competitor, form a competing company, offer services to Cantor that compete with our services or otherwise leave us, some of our customers could choose to use the services of that competitor or another competitor instead of our services, which could adversely affect our revenues and as a result could materially adversely affect our businesses, financial condition, results of operations and prospects.
Internal Controls
If we fail to implement and maintain an effective internal control environment, our operations, reputation and stock price could suffer, we may need to restate our financial statements, and we may be delayed or prevented from accessing the capital markets.
We are subject to the requirements of the Sarbanes-Oxley Act of 2002 and the applicable SEC rules and regulations that require an annual management report on our internal controls over financial reporting and an attestation report by our independent registered public accounting firm on our internal controls. The management report includes, among other matters, management’s assessment of the effectiveness of our internal controls over financial reporting.
Internal control over financial reporting, no matter how well designed, has inherent limitations. Therefore, internal controls over financial reporting determined to be effective can provide only reasonable assurance with respect to financial statement preparation and may not prevent or detect all misstatements. Due to the inherent limitations in all control systems, no evaluation of controls can provide absolute assurance that all control issues and instances of fraud, if any, have been detected. These inherent limitations include the realities that judgments in decision-making can be faulty, and that breakdowns can occur because of simple error or mistake. Additionally, controls can be circumvented by the individual acts of some persons, by collusion of two or more people, or by management override of the internal controls. Moreover, projections of any evaluation of effectiveness to future periods are subject to the risk that controls may become inadequate due to changes in conditions, or that the degree of compliance with the policies or procedures may deteriorate. As such, we could lose investor confidence in the accuracy and completeness of our financial reports, which may have a material adverse effect on our reputation and stock price.
Our ability to identify and remediate any material weaknesses in our internal controls could affect our ability to prepare financial reports in a timely manner, control our policies, procedures, operations, and assets, assess and manage our operational, regulatory, and financial risks, and integrate our acquired businesses. Similarly, we need to effectively manage any growth that we achieve in such a way as to ensure continuing compliance with all applicable internal control, financial reporting, and legal and regulatory requirements. Any failures to ensure full compliance with internal control and financial reporting requirements could result in restatement, delay or prevent us from accessing the capital markets, and harm our reputation and the market price for our Class A common stock.
Ongoing compliance with the Sarbanes-Oxley Act, as well as compliance with current and future regulatory control requirements, including those imposed or expected to be imposed by the FCA or other international regulators, may require significant expenses and divert management resources from our operations and could require a restructuring of our internal controls over financial reporting. Any such expenses, time reallocations, or restructuring could be disruptive and have a material adverse effect on our businesses, financial condition, results of operations and prospects.
56
The financial services and commercial real estate services markets in which we operate are generally affected by seasonality, which could have a material adverse effect on our results of operations in a given period.
Traditionally, the financial markets around the world experience lower volume during the summer and at the end of the year due to a general slowdown in the business environment around holiday seasons, and, therefore, our transaction volume levels may decrease during those periods. The timing of local holidays also affects transaction volumes.
With respect to the commercial real estate industry, due to the strong desire of many market participants to close real estate transactions prior to the end of a calendar year, our commercial real estate business exhibits certain seasonality, with our revenue tending to be lowest in the first quarter and strongest in the fourth quarter. While the seasonality in our two segments may be offsetting, these factors could have a material effect on our results of operations in any given period.
The seasonality of our businesses makes it difficult to determine during the course of the year whether planned results will be achieved, and thus to adjust to changes in expectations. To the extent that we are not able to identify and adjust for changes in expectations or we are confronted with negative conditions that inordinately impact seasonal norms, our businesses, financial condition, results of operations and prospects could be materially adversely affected.
Income Tax Regulations
Possible Impact of Final Income Tax Regulations
On October 13, 2016, the U.S. Department of the Treasury and the Internal Revenue Service released final regulations regarding the treatment of certain related party corporate debt as equity for U.S. federal income tax purposes. These regulations include provisions that may adversely affect the tax consequences of common transactions, including intercompany obligations and/or financing. These changes are expected to impact many companies in the financial services sector, including several of our customers and competitors. These regulations could have an adverse impact on our income tax position or could possibly cause us to change the manner in which we conduct certain financial activities in ways that impose other costs on us. Due to the short time these regulations have been in effect, we are unable to determine the extent, if any, to which these regulations would adversely affect our businesses, prospects, financial condition and results of operations.
On December 22, 2017, “H.R.1,” formerly known as the “Tax Cuts and Jobs Act (the “Tax Act”)” was signed into law in the U.S. The Tax Act is expected to have a favorable impact on the Company’s effective tax rate and net income as reported under generally accepted accounting principles both in the first quarter of 2018 and subsequent reporting periods to which the Tax Act is effective. The final impact of the Tax Act may differ from our estimate for the provision for income taxes, possibly materially, due to, among other things, changes in interpretations, additional guidance that may be issued, unexpected negative changes in business and market conditions that could reduce certain tax benefits, and actions taken by the Company as a result of the Tax Act.
RISKS RELATED TO OUR FINANCIAL SERVICES SEGMENT
General Financial Services Market Conditions
Consolidation and concentration of market share in the banking, brokerage, exchange and financial services industries could materially adversely affect our businesses, financial condition, results of operations and prospects because we may not be able to compete successfully.
In recent years, there has been substantial consolidation and concentration of market share among companies in the banking, financial brokerage, exchange, and financial services industries, resulting in increasingly large existing and potential competitors, and increased concentration in markets dominated by some of our largest customers. In addition, some of our large broker-dealer customers, such as Deutsche Bank, Barclays, and Credit Suisse have announced plans to further reduce their sales and trading businesses in fixed income, currency, and commodities. This is in addition to the drastic reductions in these businesses already completed by customers, including Morgan Stanley, UBS, and The Royal Bank of Scotland.
The combination of this consolidation and concentration of market share and the reduction by large customers of certain businesses may lead to increased concentration among our broker-dealer customers, which may reduce our ability to negotiate pricing and other matters with our customers and lower volumes. Additionally, the sales and trading global revenue market share has become increasingly concentrated over the past five years among five of the top investment banks across equities, fixed income, currencies and commodities asset classes.
We also face existing and potential competition from large exchanges, which seek or may seek to migrate trading from the inter-dealer market to their own. Consolidation and concentration of market share are occurring in this area as well. For example, in recent years, BATS Global Markets acquired the foreign-exchange trading venue, Hotspot from KCG Holdings, while BATS itself
57
announced plans to be acquired by CBOE. In addition, Deutsche Bourse and LSE Group announced their intention to merge; the Hong Kong Exchange and Clearing Limited acquired the London Metal Exchange; and ICE completed the acquisition of NYSE Euronext. Consolidation among exchanges may increase their financial resources and ability to compete with us.
Continued consolidation and concentration of market share in the financial services industry and especially among our customers could lead to the exertion of additional pricing pressure by our customers, impacting the commissions and spreads we generate from our brokerage services. Further, the consolidation and concentration among exchanges, and expansion by these exchanges into derivative and other non-equity trading markets, will increase competition for customer trades and place additional pricing pressure on commissions and spreads. These developments have increased competition from firms with potentially greater access to capital resources than we have. Finally, consolidation among our competitors other than exchange firms could result in increased resources and product or service offerings for our competitors. If we are not able to compete successfully in the future, our businesses, financial condition, results of operations and prospects could be materially adversely affected.
Actions taken by central banks in major global economies may have a material negative impact on our businesses.
In recent years, policies undertaken by certain central banks, such as the U.S. Federal Reserve, the European Central Bank, and the Bank of England, have involved quantitative easing or the buying and selling of currencies in the foreign exchange market. Quantitative easing involves open market transactions by monetary authorities to stimulate economic activity through the purchase of assets of longer maturity and has the effect of lowering interest rates further out on the yield curve.
For example, as of January 3, 2018, the U.S. Federal Reserve held approximately $3.4 trillion worth of long-dated U.S. Treasury and Federal Agency securities which are not being traded or hedged. This compares to $1.7 trillion at the beginning of 2011 and zero prior to September 2008. This has reduced volatility and volumes for listed and OTC interest rate products in the U.S. Although the Federal Reserve has ceased purchases, it continues to hold substantially all of the securities purchased. In addition, despite the recent increase in interest rates, the Federal Reserve may continue to use traditional methods to keep short-term interest rates low by historical standards.
Recently, central banks in other jurisdictions, including the EU, Japan and China, have undertaken quantitative easing and other steps aimed at reducing interest rates and stimulating their economies through monetary policy. In these jurisdictions also, interest rates are expected to remain low by historical standards for some time to come.
Similarly, global FX volumes were muted over various periods during the past several years, largely because certain major central banks, such as those in Japan and China, intervened to keep global currencies from appreciating, and because low interest rates (themselves partially a result of quantitative easing) in most major economies make carry-trade strategies less appealing for FX market participants. In addition, increased capital requirements for banks and other financial institutions are likely to result in increased holdings of government securities, which holdings will be less likely to be traded or hedged, thus reducing further transaction volumes in those securities. Since the new capital requirements make it more expensive for the banks and other financial institutions to hold assets other than government securities, the new requirements may also reduce their trading and hedging activities in corporate and asset-backed fixed income securities as well as in various other OTC cash and derivative instruments. Moreover, many of our large bank customers have faced increasing regulatory scrutiny of their rates and FX businesses, and this may negatively impact industry volumes. These central banking policies may materially adversely affect our businesses, particularly our rates and FX operations.
The migration of OTC swaps to SEF markets may adversely impact volumes, liquidity and demand for our services in certain markets.
BGC Derivative Markets and GFI Swaps Exchange, our subsidiaries, began operating as SEFs on October 2, 2013. Both BGC Derivative Markets and GFI Swaps Exchange received permanent registration approval from the CFTC as SEFs on January 22, 2016. Mandatory Dodd-Frank Act compliant execution on SEFs by eligible U.S. persons commenced in February 2014 for “made available to trade” products, and a wide range of other rules relating to the execution and clearing of derivative products have been finalized with implementation periods in 2016 and beyond.
Although we believe that BGC Derivative Markets and GFI Swaps Exchange are in compliance with applicable rules, no assurance can be given that this will always be the case, that the market for these products will not be less robust, that there may accordingly be less volume and liquidity in these markets, that there may be less demand for our services or the market in general or that the industry will not experience disruptions as customers or market participants transition to the rules associated with the Dodd-Frank Act. While we continue to have a compliance framework in place to comply with both existing and proposed rules and regulations, including any potential relaxation of rules and regulations, our businesses in these products could be significantly reduced and our businesses, financial condition, results of operations and prospects could be materially adversely affected by applicable regulations.
58
Even after the award of permanent registration status to our SEFs, we will incur significant additional costs, our revenues may be lower than in the past and our financial condition and results of operations may be materially adversely affected by future events.
The Dodd-Frank Act mandated that certain cleared swaps (subject to an exemption from the clearing requirement) trade on either a DCM or SEF. SEF and DCM core principles relate to trading and product requirements, compliance and audit-trail obligations, governance and disciplinary requirements, operational capabilities, surveillance obligations and financial information and resource requirements. While these principles may or may not be permanently enforced, we do know that we will be subject to a more complex regulatory framework going forward, and that there will be significant costs to prepare for and to comply with these ongoing regulatory requirements and potential amendments. We will incur increased legal fees, personnel expenses and other costs, as we work to analyze and implement the necessary legal structure for full compliance with all applicable regulations. There will also be significant costs related to the development, operation and enhancement of our technology relating to trade execution, trade reporting, surveillance, compliance and back-up and disaster recovery plans designed to meet the requirements of the regulators.
In addition, it is not clear at this point what the impact of these rules and regulations will be on the markets in which we currently provide our SEF services. During the continued implementation of the Dodd-Frank Act and related rules, the markets for cleared and non-cleared swaps may continue to be less robust, there may be less volume and liquidity in these markets and there may be less demand for our services.
Certain banks and other institutions may continue to be limited in their conduct of proprietary trading and may be further limited from trading in certain derivatives. The new rules, including the proprietary trading restrictions for certain banks and other institutions, could materially impact transaction volumes and liquidity in these markets and our businesses, financial condition, results of operations and prospects could be materially adversely impacted as a result.
If we fail to continue to qualify as a SEF under any of these conditions, we may be unable to maintain our position as a provider of execution and brokerage services in the markets for many of the OTC products for which we have traditionally acted as an intermediary. This would have a broad impact on us and could have a material adverse effect on our businesses, financial condition, results operations and prospects.
Our commodities derivatives activities, including those related to electricity, natural gas and environmental interests, subject us to extensive regulation, potential catastrophic events and other risks that may result in our incurring significant costs and liabilities.
We engage in the brokerage of commodities derivatives, including those involving electric power and natural gas, and related products and indices. These activities subject us and our customers to extensive regulatory oversight, involving federal, state and local and foreign commodities, energy, environmental, and other governmental laws and regulations and may result in our incurring significant costs and liabilities.
We or our clients may incur substantial costs in complying with current or future laws and regulations relating to our commodities-related activities, including trading of electricity, natural gas, and environmental interests. New regulation of OTC derivatives markets in the U.S. and similar legislation proposed or adopted abroad will impose significant new costs and new requirements on the commodities derivatives activities of us and our customers. Therefore, the overall reputation of us or our clients may be adversely affected by the current or future regulatory environment. Failure to comply with these laws and regulations may result in substantial civil and criminal penalties and fines for market participants.
The commodities-related activities of us and our clients are also subject to the risk of unforeseen catastrophic events, many of which are outside of our control, which could result in significant liabilities for us or our customers. We may not be able to obtain insurance to cover these risks, and the insurance that we have may be inadequate to cover our liabilities. The occurrence of any of such events may prevent us from performing under our agreements with customers, may impair our operations, and may result in litigation, regulatory action, negative publicity or other reputational harm, which could have a material negative effect on our businesses, financial condition, results of operations and prospects.
Regulatory/Legal
The financial services industry in which we operate is subject to significant regulation. We are subject to regulatory capital requirements on our regulated businesses, and a significant operating loss or any extraordinary charge against capital could materially adversely affect our ability to expand or, depending upon the magnitude of the loss or charge, even to maintain the current level of our businesses.
Many aspects of our businesses, like those of other financial intermediary firms, are subject to significant capital requirements. In the U.S., the SEC, FINRA, the CFTC, the NFA and various other regulatory bodies have stringent provisions with
59
respect to capital applicable to the operation of brokerage firms, which vary depending upon the nature and extent of these entities’ activities. Five of our subsidiaries, BGCF, GFI Securities LLC, Kyte Securities LLC, Sunrise Brokers LLC and Mint are registered with the SEC and subject to the Uniform Net Capital Requirements. As Futures Commissions Merchants (“FCMs”), BGCF and Mint are also subject to CFTC capital requirements. BGCF is also a member of the FICC, which imposes capital requirements on its members. We also hold a 49% limited partnership interest in Aqua, a U.S. registered broker-dealer and ATS. These entities are subject to SEC, FINRA, CFTC and NFA net capital requirements. In addition, our SEFs, BGC Derivative Markets and GFI Swaps Exchange, are required to maintain financial resources to cover operating costs for at least one year, keeping at least enough cash or highly liquid securities to cover six months’ operating costs.
Our international operations are also subject to capital requirements in their local jurisdictions. BGC Brokers L.P., BGC European Holdings, L.P., CSC Commodities Limited, GFI Brokers Limited, GFI Securities Limited and Sunrise Brokers LLP, which are based in the U.K., are currently subject to capital requirements established by the FCA. The FCA applies stringent provisions with respect to capital applicable to the operation of these brokerage firms, which vary depending upon the nature and extent of their activities. The provisions relating to capital and liquidity requirements enforced by the FCA have undergone significant change in recent years, and our U.K. businesses are now required to maintain significantly higher regulatory levels of capital than they have in the past.
In addition, the majority of our other foreign subsidiaries are subject to similar regulation by the relevant authorities in the countries in which they do business, such as Australia, France and Hong Kong. These regulations often include minimum capital requirements, which are subject to change. Further, we may become subject to capital requirements in other foreign jurisdictions in which we currently operate or in which we may enter.
We expect to continue to maintain levels of capital in excess of regulatory minimums. Should we fail to maintain the required capital, we may be required to reduce or suspend our broker-dealer operations during the period that we are not in compliance with capital requirements, and may be subject to suspension or revocation of registration or withdrawal of authorization or other disciplinary action from domestic and international regulators, which would have a material adverse effect on us. In addition, should we fail to maintain the capital required by clearing organizations of which we are a member, our ability to clear through those clearing organizations may be impaired, which may materially adversely affect our ability to process trades.
If the capital rules are changed or expanded, or if there is an unusually large charge against capital, our operations that require the intensive use of capital would be limited. Our ability to withdraw capital from our regulated subsidiaries is subject to restrictions, which, in turn, could limit our ability to pay our indebtedness and other expenses, dividends on our Class A common stock, and distributions on our BGC Holdings limited partnership interests, and to repurchase shares of our Class A common stock or purchase BGC Holdings limited partnership interests or other equity interests in our subsidiaries, including from Cantor, our executive officers, other employees, partners and others, and pursue strategic acquisitions or other growth opportunities. It is possible that capital requirements may also be relaxed as a result of future changes in U.S. regulation, although no assurance can be given that such changes will occur. We cannot predict our future capital needs or our ability to obtain additional financing. No assurance can be given that required capital levels will remain stable or that we will not incur substantial expenses in connection with maintaining current or increased capital levels or engaging in business restructurings or other activities in response to these requirements.
In addition, financial intermediary firms such as ours are subject to numerous conflicts of interests or perceived conflicts, including for example principal trading and trading to make markets. We have adopted various policies, controls and procedures to address or limit actual or perceived conflicts, and we will regularly seek to review and update our policies, controls and procedures. However, these policies, controls and procedures may result in increased costs and additional operational personnel. Failure to adhere to these policies, controls and procedures may result in regulatory sanctions or customer claims.
Our businesses, financial condition, results of operations and prospects could be materially adversely affected by new laws, rules or regulations or by changes in existing law, rules or regulations or the application thereof.
The financial services industry, in general, is heavily regulated. Proposals for additional legislation further regulating the financial services industry are periodically introduced in the U.S., the EU and other geographic areas. Moreover, the agencies regulating the financial services industry also periodically adopt changes to their rules and regulations, particularly as these agencies have increased the focus and intensity of their regulation of the financial services industry.
Changes in legislation and in the rules and regulations promulgated by the SEC, FINRA, the CFTC, the NFA, the U.S. Treasury, the FCA, the European Commission, the ESMA and other domestic and international regulators and self-regulatory organizations, as well as changes in the interpretation or enforcement of existing laws and rules, often directly affect the method of operation and profitability of broker-dealers and could result in restrictions in the way we conduct our businesses. For example, the U.S. Congress, the U.S. Treasury, the Board of Governors of the Federal Reserve System, SEC and the CFTC are continuing to review the nature and scope of their regulation and oversight of the government securities markets and U.S. markets. The second Markets in Financial Instruments Directive (“MiFID II”) was published by the European Securities and Markets Authority (“ESMA”) in September 2015, and implementation commenced in January 2018. MiFID II requires a significant part of the market in these instruments to trade on trading venues subject to transparency regimes, not only in pre- and post – trade prices, but also in fee structures and access. In addition, MiFID II has a particularly significant impact in a number of key areas, including corporate
60
governance, transaction reporting, pre- and post-trade transparency, technology synchronization, best execution and investor protection. MiFID II also introduces a new regulated execution venue category known as the Organized Trading Facility (“OTF”) (in addition to the venue category of Multilateral Trading Facility (“MTF”) for European electronic trading), that will capture much of the voice and hybrid oriented trading in the EU. Certain of our existing EU derivatives and fixed income execution business will in the future take place on OTFs. Rules on public and non-discriminatory pricing structures of venues, and the related uncertainty of retaining traditional forms of revenue under the new regime, are expected to be a focus of our European regulated entities. Authorization has been obtained from the FCA to operate an OTF at BGC Brokers L.P., GFI Brokers Limited, GFI Securities Limited and Sunrise Brokers LLP, and to operate an MTF at GFI Brokers Limited and GFI Securities Limited. Authorization from the French autorité des marchés financiers (“AMF”) has also been obtained to operate an OTF at Aurel BGC. The uncertainties resulting from the possibility of additional legislation and/or regulation could materially adversely impact our businesses. Failure to comply with any of these laws, rules or regulations could result in fines, penalties, restrictions or limitations on business activity, suspension or expulsion from the industry, any of which could have a material adverse effect upon us.
Similarly, while the recently adopted Volcker Rule will not apply directly to us, once effective, the Volcker Rule may have a material impact on many of the banking and other institutions with which we do business or compete. There may be a continued uncertainty regarding the application of the Volcker Rule, its impact on various affected businesses, how those businesses will respond to it, and the effect that it will have on the markets in which we do business.
Other regulatory initiatives include Basel III (or the Third Basel Accord), a global regulatory standard on bank capital adequacy, stress testing and market liquidity risk scheduled to be introduced by bank regulators in most, if not all, of the world’s major economies by 2019. Basel III is designed to strengthen bank capital requirements and introduces new regulatory requirements on bank liquidity and bank leverage. The adoption of these proposed rules could restrict the ability of our large bank and broker-dealer customers to operate proprietary trading businesses and to maintain current market exposures under the present structure of their balance sheets, and will cause these entities to need to raise additional capital in order to stay active in our marketplaces. As a result, their businesses, results of operations, financial condition or prospects could be materially adversely affected, which might cause them to do less business. Such potential impact could materially adversely affect the revenues and profitability of our Financial Services segment.
Further, the authorities of certain EU countries may from time to time institute changes to tax law that, if applicable to us, could have a material adverse effect on our businesses, financial condition, results of operations and prospects. Similarly, the U.S. has proposed a series of changes to U.S. tax law, some of which could apply to us. It is not possible to predict if any of these new provisions will be enacted or, if they are, what form they may take. It is possible that one or more of such provisions could negatively impact our costs and our effective tax rate, which would affect our after-tax earnings. If any of such changes to tax law were implemented and/or deemed to apply to us, they could have a material adverse effect on our businesses, financial condition, results of operations and prospects, including on our ability to attract, compensate and retain executives and brokers.
Republican Party control of both the U.S. Presidency and Congress could result in changes in legislation, regulations and priorities, including a freeze and review of pending regulations and possible revisions or relaxation of other regulations or initiatives. While we continue to have a compliance framework in place to comply with both existing and proposed rules and regulations, it is possible that the existing regulatory framework may be amended, which amendments could have a positive or negative impact on our businesses, financial condition, results of operations and prospects.
We believe that uncertainty and potential delays around the final form of such new laws and regulations might take may negatively impact trading volumes in certain markets in which we transact. Increased capital requirements may also diminish transaction velocity. We believe that it remains premature to know conclusively the specific aspects of the U.S. and EU proposals which may directly impact our businesses as some proposals have not yet been finalized and others which have been proposed remain subject to supervisory debate. Additionally, unintended consequences of the laws, rules and regulations may adversely affect us in ways yet to be determined. We are unable to predict how any of these new laws, rules, regulations and proposals will be implemented or in what form, or whether any additional or similar changes to laws, rules or regulations, including the interpretation or implementation thereof, will occur in the future. Any such action could affect us in substantial and unpredictable ways and could have a material adverse effect on our businesses, financial condition, results of operations and prospects.
Extensive regulation of our businesses restricts and limits our operations and activities and results in ongoing exposure to potential significant costs and penalties, including fines, sanctions, enhanced oversight, increased financial and capital requirements, and additional restrictions or limitations on our ability to conduct or grow our businesses.
The financial services industry, including our businesses, is subject to extensive regulation, which is very costly. The requirements imposed by regulators are designed to ensure the integrity of the financial markets and to protect customers and other third parties who deal with us and are not designed to protect the holders of our stock, notes or other securities. These regulations will
61
often serve to restrict or limit our operations and activities, including through capital, customer protection and market conduct requirements.
Our businesses are subject to regulation by governmental and self-regulatory organizations in the jurisdictions in which we operate around the world. Many of these regulators, including U.S. and non-U.S. government agencies and self-regulatory organizations, as well as state securities commissions in the U.S., are empowered to bring enforcement actions and to conduct administrative proceedings and examinations, inspections, and investigations, which may result in costs, penalties, fines, enhanced oversight, increased financial and capital requirements, restrictions or limitations, and censure, suspension, or expulsion. Self-regulatory organizations such as FINRA and the NFA, along with statutory bodies such as the SEC, the CFTC, and the FCA, and other international regulators, require strict compliance with their rules and regulations.
Firms in the financial services industry, including us, have experienced increased scrutiny in recent years, and penalties, fines and other sanctions sought by regulatory authorities, including the SEC, the CFTC, FINRA, the NFA, state securities commissions and state attorneys general in the U.S., and the FCA in the U.K. and other international regulators, have increased accordingly. This trend toward a heightened regulatory and enforcement environment can be expected to continue for the foreseeable future, and this environment may create uncertainty. From time to time, we have been and are subject to periodic examinations, inspections and investigations, including periodic risk assessment and related reviews of our U.K. group. As a result of such reviews, we may be required to include or enhance certain regulatory structures and frameworks in our operating procedures, systems and controls. We are also required to obtain approval from the FCA to acquire control of U.K. regulated firms and from other international regulators to acquire regulated entities in their jurisdictions.
Increasingly, the FCA has developed a practice of requiring senior officers of regulated firms to provide individual attestations or undertakings as to the status of the firm’s control environment, compliance with specific rules and regulations, or the completion of required tasks. Officers of BGC Brokers L.P. and GFI Brokers Limited have given such attestations or undertakings in the past and may do so again in the future. Similarly, the FCA can seek a voluntary requirement notice, which is a voluntary undertaking on behalf of a firm that is made publicly available on the FCA’s website. These activities have resulted, and may in the future result, in significant costs and remediation expenses, and possible disciplinary actions by the SEC, the CFTC, the FCA, self-regulatory organizations and state securities administrators and have impacted, and may impact in the future, our acquisitions of regulated businesses or entry into new business lines.
The brokerage and financial services industries in general face potential regulatory, litigation and/or criminal risks that may result in damages or fines or other penalties as well as costs, and we may face damage to our professional reputation and legal liability if our products and services are not regarded as satisfactory, our employees do not adhere to all applicable legal and professional standards, or for other reasons, all of which could have a material adverse effect on our businesses, financial condition, results of operations and prospects.
Many aspects of our current businesses involve substantial risks of liability. The expansion of our businesses, including into new areas, imposes additional risks of liability.
In the normal course of business, we have been a party to investigations, administrative proceedings, lawsuits, arbitrations and other actions involving primarily claims for damages. In certain circumstances, we could also face potential criminal investigations, enforcement actions or liability, including fines or other penalties. Examinations, inspections, regulatory inquiries and subpoenas or other requests for information or testimony may cause us to incur significant expenses, including fees for legal representation and other professional advisors and costs associated with document production and remediation efforts. Such regulatory, legal or other actions may also be directed at certain executives or employees who may be critical to our businesses or to particular brokerage desks. The risks associated with such matters often may be difficult to assess or quantify, and their existence and magnitude often remain unknown for substantial periods of time.
A settlement of, or judgment related to, any such matters could result in regulatory, civil or criminal liability, fines, penalties, restrictions or limitations on our operations and activities and other sanctions and could otherwise have a material adverse effect on our businesses, results of operations, financial condition and prospects. Any such action could also cause us significant reputational harm, which, in turn, could seriously harm us. In addition, regardless of the outcome of such matters, we may incur significant legal and other costs, including substantial management time, dealing with such matters, even if we are not a party to the litigation or a target of the inquiry.
In our Financial Services segment, we depend to a large extent on our relationships with our customers and our reputation for integrity and high-caliber professional services to attract and retain customers. We are subject to the risk of failure of our employees to comply with applicable laws, rules and regulations or to be adequately supervised by their managers, and to the extent that such individuals do not meet these requirements, we may be subject to the risk of fines or other penalties as well as reputational risk. As a result, if our customers are not satisfied with our products or services, or our employees do not adhere to all applicable legal
62
and professional standards, such matters may be more damaging to our Financial Services businesses than to other types of businesses. Significant regulatory action or substantial legal liability against us could have a material adverse effect on our businesses, financial condition, results of operations and prospects, or cause significant reputational damage to us, which could seriously harm us.
Financial Services Competition
Because competition for the services of brokers is intense, it could affect our ability to attract and retain a sufficient number of highly skilled brokers or other professional services personnel, in turn adversely impacting our revenues, resulting in a material adverse effect on our businesses, financial condition, results of operations and prospects.
Our ability to provide high-quality brokerage and other professional services and maintain long-term relationships with our customers depends, in large part, upon our brokers and other professionals in both of our segments. As a result, we must attract and retain highly qualified personnel.
In recent years, we have significantly grown the number of brokers in our businesses through new hires and acquisitions of existing businesses, and we expect to continue to do so in the future. Competition for the services of brokers is intense, especially for brokers with experience in the specialized businesses in which we participate or we may seek to enter. If we are unable to hire or retain highly qualified brokers, including retaining those employed by businesses we acquire in the future, we may not be able to enter new brokerage markets or develop new products or services. If we lose one or more of our brokers in a particular market in which we participate, our revenues may decrease and we may lose market share.
In addition, recruitment and retention of qualified brokers could result in substantial additional costs. We have been and are currently a party to, or otherwise involved in, several lawsuits and arbitrations involving competitor claims in connection with employee hires and/or departures. We may also pursue our rights through litigation when competitors hire our employees who are under contract with us. We believe such proceedings are common in the financial services industry due to its highly competitive nature. An adverse settlement or judgment related to these or similar types of claims could have a material adverse effect on our businesses, financial condition, results of operations and prospects. Regardless of the outcome of these claims, we generally incur significant costs and substantial management time in dealing with them.
If we fail to attract new personnel, or fail to retain and motivate our current personnel, or if we incur increased costs or restrictions associated with attracting and retaining personnel (such as lawsuits, arbitrations, sign-on or guaranteed bonuses or forgivable loans), our businesses, financial condition, results of operations and prospects could be materially adversely affected.
We face strong competition from brokerages, broker-dealers, financial services firms, and exchanges, many of which have greater market presence, marketing capabilities and financial, technological and personnel resources than we have, which could lead to pricing pressures that could adversely impact our revenues and as a result could materially adversely affect our businesses, financial condition, results of operations or prospects.
The financial services industry is intensely competitive, and is expected to remain so. In our Financial Services segment, we primarily compete with three major, diversified inter-dealer brokers and financial intermediaries. These include NEX Group plc (“NEX”) (formerly known as ICAP plc),TP ICAP plc (“TP ICAP”) (formerly known as Tullett Prebon plc) and Compagnie Financiere Tradition (which is majority owned by Viel & Cie) (“Tradition”), all of which are currently publicly traded companies. Other inter-dealer broker and financial intermediary competitors include a number of smaller, privately-held firms that tend to specialize in specific products and services or geographic areas.
We also compete with companies that provide alternative products and services, such as contracts traded on futures exchanges, and trading processes, such as the direct dealer-to-dealer market for government securities and stock exchange markets for corporate equities, debt and other securities. We increasingly compete, directly or indirectly, with exchanges for the execution of trades in certain products, mainly in derivatives such as futures, swaps, options and options on futures. Certain exchanges have made and will likely continue to make attempts to move certain OTC-traded products to exchange-based execution, or to create listed derivatives products that mimic the qualities of similar OTC-traded products. We also compete with consortia, such as those operated by Tradeweb, which are created or funded from time to time by banks, broker-dealers and other companies involved in financial services, such as Thomson Reuters Corporation to compete in various markets with exchanges and inter-dealer brokers. We may compete in OTC-traded products with platforms such as those owned by MarketAxess Holdings Inc., in fixed income products or various OTC FX platforms owned by exchanges such as BATS and Deutsche Börse. In addition, financial data and information firms such as Thomson Reuters Corporation and Bloomberg L.P. operate trading platforms for both OTC and listed products, and may attempt to compete with us for trade execution in the future.
63
Some of our competitors have greater market presence, marketing capabilities and financial, technological and personnel resources than we have and, as a result, our competitors may be able to:
|
|
• |
develop and expand their network infrastructures and product and service offerings more efficiently or more quickly than we can; |
|
|
• |
adapt more swiftly to new or emerging technologies and changes in customer requirements; |
|
|
• |
identify and consummate acquisitions and other opportunities more effectively than we can; |
|
|
• |
hire our brokers and other key employees; |
|
|
• |
devote greater resources to the marketing and sale of their products and services; |
|
|
• |
more effectively leverage existing relationships with customers and strategic partners or exploit more recognized brand names to market and sell their products and services; |
|
|
• |
provide a lower cost structure and lower commissions and fees; |
|
|
• |
provide access to trading in products or a range of products that at any particular time we do not offer; and |
|
|
• |
develop services that are preferred by our customers. |
In addition, new competitors may emerge, and our product and service lines may be threatened by new technologies or market trends that reduce the value of our existing product and service lines. If we are not able to compete successfully in the future, our revenues could be adversely impacted and as a result our businesses, financial condition, results of operations and prospects could be materially adversely affected.
Competition for financial brokerage transactions also has resulted in substantial commission discounting by brokers that compete with us for business. Further discounting could adversely impact our revenues and margins and as a result could materially adversely affect our businesses, financial condition, results of operations and prospects.
Our operations also include the sale of pricing and transactional data and information produced by our brokerage operations to securities information processors and/or vendors. There is a high degree of competition in pricing and transaction reporting products and services, and such businesses may become more competitive in the future. Competitors and customers of our financial brokerage businesses have together and individually offered market data and information products and services in competition with those offered and expected to be offered by us.
International Operations Risks
We are generally subject to various risks inherent in doing business in the international financial markets, in addition to those unique to the regulated brokerage industry, and any failure to identify and manage those risks could materially adversely affect our businesses, financial condition, results of operations and prospects.
We currently provide products and services to customers in many foreign countries, and we may seek to further expand our operations into additional jurisdictions. On a consolidated basis, revenues from foreign countries were over $1.3 billion, or more than two-thirds of total revenues in our Financial Services segment for the year ended December 31, 2017. In many countries, the laws and rules and regulations applicable to the financial services industry are uncertain and evolving, and it may be difficult for us to determine the exact requirements of local regulations in every jurisdiction. Our inability to remain in compliance with local laws and rules and regulations in a particular foreign jurisdiction could have a significant and negative effect not only on our businesses in that market but also on our reputation generally. If we are unable to manage any of these risks effectively, our businesses could be adversely affected.
There are also certain additional political, economic, legal, operational and other risks inherent in doing business in international financial markets, particularly in the regulated brokerage industry. These risks include:
|
|
• |
less developed automation in exchanges, depositories and national clearing systems; |
|
|
• |
additional or unexpected changes in regulatory requirements, capital requirements, tariffs and other trade barriers; |
|
|
• |
the impact of the laws, rules and regulations of foreign governmental and regulatory authorities of each country in which we conduct business, including initiatives such as Brexit; |
|
|
• |
possible nationalization, expropriation and regulatory, political and price controls; |
|
|
• |
difficulties in staffing and managing international operations; |
|
|
• |
capital controls, exchange controls and other restrictive governmental actions; |
64
|
|
• |
any failure to develop effective compliance and reporting systems, which could result in regulatory penalties in the applicable jurisdiction; |
|
|
• |
fluctuations in currency exchange rates; |
|
|
• |
reduced protections for intellectual property rights; |
|
|
• |
adverse labor and employment laws, including those related to compensation, tax, health insurance and benefits, and social security; |
|
|
• |
outbreak of hostilities; and |
|
|
• |
potentially adverse tax consequences arising from compliance with foreign laws, rules and regulations to which our international businesses are subject and the repatriation of overseas earnings. |
Credit Risk
Credit rating downgrades or defaults by us, Cantor or another large financial institution could adversely affect us or financial markets generally.
The commercial soundness of many financial institutions may be closely interrelated as a result of credit, trading, clearing or other relationships between the institutions. For example, we rely on Cantor as our clearing agent under the Clearing Agreement for certain securities transactions, primarily U.S. government securities, while we self-clear certain other products. A default by one of our customers could lead to liquidity concerns in our business and, to the extent that Cantor or another entity that clears for us has difficulty meeting capital requirements or otherwise meeting its obligations, we may need to provide our own liquidity.
As a result, concerns about, or a default or threatened default by, one institution could lead to significant market-wide liquidity problems, losses or defaults by other institutions. This is sometimes referred to as “systemic risk” and may adversely affect financial intermediaries, such as clearing agencies, clearing houses, banks, securities firms and exchanges, with which we interact on a daily basis, and therefore could adversely affect us. Similarly, our vendors, including insurance companies and other providers, are subject to normal business risks as well as risks related to U.S. and international economic and market conditions. Failure of any of these vendor institutions could also materially adversely affect us.
The credit ratings and associated outlooks of firms in the financial services industries, including us, may be critical to their reputation and operational and financial success. A firm’s credit ratings and associated outlooks are influenced by a number of factors, including but not limited to: operating environment, earnings and profitability trends, the prudence of funding and liquidity management practices, balance sheet size/composition and resulting leverage, cash flow coverage of interest, composition and size of the capital base, available liquidity, outstanding borrowing levels, the firm’s competitive position in the industry and its relationship with other firms. A credit rating and/or the associated outlook can be revised upward or downward at any time by a rating agency if such rating agency decides that circumstances of that firm or related firms warrant such a change. Any reduction in credit ratings and/or the associated outlook could adversely affect the availability of debt financing on acceptable terms, as well as the cost and other terms upon which any such financing can be obtained. In addition, credit ratings and associated outlooks may be important to customers or counterparties in certain markets and in certain transactions. Additional collateral may be required in the event of a credit ratings or outlook downgrade.
Our financial services activities are subject to credit and performance risks, which could result in us incurring significant losses that could materially adversely affect our businesses, financial condition, results of operations and prospects.
Our activities are subject to credit and performance risks. For example, our customers may not deliver securities to one of our operating subsidiaries which has sold those securities to another customer. If the securities due to be delivered have increased in value, there is a risk that we may have to expend our own funds in connection with the purchase of other securities to consummate the transaction. While we will take steps to ensure that our customers and counterparties have high credit standings and that financing transactions are adequately collateralized, the large dollar amounts that may be involved in our broker-dealer and financing transactions could subject us to significant losses if, as a result of customer or counterparty failures to meet commitments, we were to incur significant costs in liquidating or covering our positions in the open market.
We have adopted policies and procedures to identify, monitor and manage credit risk, in both agency and principal transactions, through reporting and control procedures and by monitoring credit standards applicable to our customers and counterparties. These policies and procedures, however, may not be fully effective, particularly against fraud, unauthorized trading and similar incidents. Some of these risk management methods depend upon the evaluation of information regarding markets, customers, counterparties or other matters that are publicly available or otherwise accessible by us. That information may not, in all cases, be accurate, complete, up-to-date or properly evaluated. If our policies and procedures are not fully effective or we are not always successful in monitoring or evaluating the risks to which we are, or may be, exposed, our businesses, financial condition,
65
results of operations and prospects could be materially adversely affected. In addition, our insurance policies do not provide coverage for these risks.
Transactions executed on a matched principal basis where the instrument has the same or similar characteristics to the counterparty may expose us to correlation risk. In this case, the counterparty’s inability to meet its obligations will also result in the value of the instrument declining. For example, if we were to enter into a transaction to sell to a customer a bond or structured note where the issuer or credit support provider was such customer’s affiliate, the value of the instrument would decline in value in tandem with the default. This correlation has the effect of magnifying the credit loss.
We are subject to financing risk because, if a transaction does not settle on a timely basis, the resulting unmatched position may need to be financed, either directly by us or through one of the clearing organizations, at our expense. These charges may be recoverable from the failing counterparty, but sometimes they are not. In addition, in instances where the unmatched position or failure to deliver is prolonged or widespread due to rapid or widespread declines in liquidity for an instrument, there may also be regulatory capital charges required to be taken by us, which, depending on their size and duration, could limit our business flexibility or even force the curtailment of those portions of our businesses requiring higher levels of capital. Credit or settlement losses of this nature could materially adversely affect our businesses, financial condition, results of operations and prospects.
Declines in the financial markets have also led to the exposure of several cases of financial fraud. If we were to have trading activity on an agency or principal basis with an entity engaged in defrauding investors or counterparties, we could bear the risk that the counterparty would not have the financial resources to meet their obligations, resulting in a credit loss. Similarly, we may engage in financial transactions with third parties that have been victims of financial fraud and, therefore, may not have the financial resources to meet their obligations to us.
In agency transactions, we charge a commission for connecting buyers and sellers and assisting in the negotiation of the price and other material terms of the transaction. After all material terms of a transaction are agreed upon, we identify the buyer and seller to each other and leave them to settle the trade directly. We are exposed to credit risk for commissions, as we bill customers for our agency brokerage services. Our customers may default on their obligations to us due to disputes, bankruptcy, lack of liquidity, operational failure or other reasons. Any losses arising from such defaults could materially adversely affect our businesses, financial condition, results of operations and prospects.
In certain financial products, we act as a “name passing” broker, where the parties to the trade will settle directly against each other when their names are given up. In these markets, we may from time to time provide quotes. These quotes are intended to provide market values where we believe a customer can execute a transaction in a particular financial product. These quotes reflect our good faith view as to a reasonable bid/offer for that particular product. Prices may be received directly from a customer, or we may provide prices where we are confident the customers will be able to execute a trade, but do not have a customer currently supporting the price. In these cases the price will be based on our professional judgment. We may post or provide bids and offers in an effort (i) to present suitable markets where none would otherwise exist, or (ii) to exhibit spreads that are more reflective of contemporaneous market opinion or activity. In such cases, our efforts are intended to facilitate liquidity for our customers and to draw market participants to participate in a transaction. Although we will exercise strenuous efforts to execute at any given price, we cannot guarantee an execution at a certain price level.
In emerging market countries, we primarily conduct our Financial Services businesses on an agency and matched principal basis, where the risk of counterparty default, inconvertibility events and sovereign default is greater than in more developed countries.
We enter into transactions in cash and derivative instruments primarily on an agency and matched principal basis with counterparties domiciled in countries in Latin America, Eastern Europe and Asia. Transactions with these counterparties are generally in instruments or contracts of sovereign or corporate issuers located in the same country as the counterparty. This exposes us to a higher degree of sovereign or convertibility risk than in more developed countries.
In addition, these risks may entail correlated risks. A correlated risk arises when the counterparty’s inability to meet its obligations also corresponds to a decline in the value of the instrument traded. In the case of a sovereign convertibility event or outright default, the counterparty to the trade may be unable to pay or transfer payment of an instrument purchased out of the country when the value of the instrument has declined due to the default or convertibility event.
The global financial crisis of recent years has heightened the risk of sovereign or convertibility events in emerging markets similar to the events that occurred in previous financial downturns. Our risk management function monitors the creditworthiness of emerging countries and counterparties on an ongoing basis and, when the risk of inconvertibility or sovereign default is deemed to be too great, correlated transactions or all transactions may be restricted or suspended. However, there can be no assurance that these procedures will be effective in controlling these risks.
66
Our Financial Services segment has its rates business as its largest product category, and we could be significantly affected by any downturn in the rates product market.
We offer our Financial Services in five broad product categories: rates, credit, foreign exchange, energy and commodities and equity and other asset classes. Our Financial Services brokerage revenues are strongest in our rates products, which accounted for approximately 30.9% of our total Financial Services brokerage revenues on a consolidated basis for the year ended December 31, 2017. While we focus on expanding and have successfully diversified our product offerings, we may currently be exposed to any adverse change or condition affecting the rates product market. Accordingly, the concentration of our businesses on rates products subjects our results to a greater market risk than if we had more diversified product offerings.
Due to our current customer concentration, a loss of one or more of our significant customers could materially harm our businesses, financial condition, results of operations and prospects.
For the year ended December 31, 2017, on a consolidated basis, our top ten Financial Services customers collectively, accounted for approximately 18.1% of our total revenues. We have limited long-term contracts with certain of these customers. If we were to lose one or more of these significant customers for any reason, including as a result of further consolidation and concentration in the financial services industry, and not be compensated for such loss by doing additional business with other customers or by adding new customers, our revenues would decline significantly and our businesses, financial condition, results of operations and prospects would materially suffer.
Our Financial Services revenues and profitability could be reduced or otherwise materially adversely affected by pricing plans relating to commissions and fees on our trading platform.
We negotiate from time to time with certain customers (including many of our largest customers) to enter into customized volume discount pricing plans. While the pricing plans are designed to encourage customers to be more active on our electronic trading platform, they reduce the amount of commissions and fees payable to us by certain of our most active customers for certain products, which could reduce our revenues and constrain our profitability. From time to time, these pricing plans come up for renewal. Failure of a number of our larger customers to enter into renewed agreements, or agreements on terms as favorable as existing agreements, could have a material adverse effect on volumes on our electronic trading platform, the commissions payable to us, our revenues and our profitability.
Reduced spreads in securities pricing, levels of trading activity and trading through market makers and/or specialists could materially adversely affect our businesses, financial condition, results of operations and prospects.
Computer-generated buy/sell programs and other technological advances and regulatory changes in the marketplace may continue to tighten securities spreads. In addition, new and enhanced alternative trading systems, such as electronic communications networks, have emerged as alternatives for individual and institutional investors, as well as broker-dealers. As such systems do not direct trades through market makers, their use could result in reduced revenues for us or for our customers. In addition, reduced trading levels could lead to lower revenues which could materially adversely affect our businesses, financial condition, results of operations and prospects.
We have market risk exposure from unmatched principal transactions entered into by some of our desks, as well as holdings of marketable equity securities, which could result in losses and have a material effect on our businesses, financial condition, results of operations, and prospects for any particular reporting period. In addition, financial fraud or unauthorized trading activity could also materially impact our businesses, financial condition, results of operations or prospects.
On a limited basis, our desks enter into unmatched principal transactions in the ordinary course of business to facilitate transactions, add liquidity, improve customer satisfaction, increase revenue opportunities and attract additional order flow or in certain instances as the result of an error and, in a limited number of instances and subject to risk management limits, for the purpose of proprietary trading. As a result, we have market risk exposure on these unmatched principal transactions.
Market risk refers to the risk that a change in the level of one or more market prices, rates, indices or other factors will result in losses for a specified position. In our Financial Services business, we may allow certain of our desks to enter into unmatched principal transactions in the ordinary course of business and hold long and short inventory positions. These transactions are primarily for the purpose of managing proprietary positions, facilitating clients’ execution needs, adding liquidity to a market or attracting additional order flow. As a result, we may have market risk exposure on these transactions. Our exposure varies based on the size of the overall position, the terms and liquidity of the instruments brokered and the amount of time the position is held before we dispose of the position. Although we have limited ability to track our exposure to market risk and unmatched positions on an intra-day basis,
67
we attempt to mitigate market risk on these positions by strict risk limits, extremely limited holding periods and hedging our exposure. These positions are intended to be held short term to facilitate customer transactions. However, due to a number of factors, including the nature of the position and access to the market on which it trades, we may not be able to unwind the position and we may be forced to hold the position for a longer period than anticipated. All positions held longer than intra-day are marked to market.
Certain categories of trades settle for clearing purposes with CF&Co, one of our affiliates. CF&Co is a member of FINRA and the FICC, a subsidiary of the Depository Trust & Clearing Corporation. In addition, certain affiliated entities are subject to regulation by the CFTC, including CF&Co and BGC Financial.We, CF&Co, BGC Financial and other affiliates act in a matched principal or principal capacity in markets by posting and/or acting upon quotes for our account. Such activity is intended, among other things, to assist us, CF&Co and other affiliates in managing proprietary positions (including, but not limited to, those established as a result of combination trades and errors), facilitating transactions, framing markets, adding liquidity, increasing commissions and attracting order flow. Similarly, when framing a market in a “name passing” marketplace, we and our affiliates may post quotations that we believe reflect contemporaneous and/or anticipated potential market interest in an effort to facilitate liquidity for market participants on our respective platforms. We and our affiliates use commercially reasonable efforts to find a counterparty for any resulting transactions, at the customary minimum size level for that market.
From a risk management perspective, we monitor risk on an end-of-day basis, and desk managers generally monitor such exposure on a continuous basis. Any unmatched positions are intended to be disposed of in the short term. However, due to a number of factors, including the nature of the position and access to the markets on which we trade, we may not be able to match the position or effectively hedge its exposure and often may be forced to hold a position overnight that has not been hedged. To the extent these unmatched positions are not disposed of intra-day, we mark these positions to market. Adverse movements in the securities underlying these positions or a downturn or disruption in the markets for these positions could result in a loss. In the event of any unauthorized trading activity or financial fraud that is not detected by management, it is possible that these unmatched positions could be outstanding for a long period. At the time of any sales and settlements of these positions, the price we ultimately realize will depend on the demand and liquidity in the market at that time and may be materially lower than their current fair values. In addition, our estimates or determinations of the values of our various positions, assets or businesses are subject to the accuracy of our assumptions and the valuation models or multiples used. Any principal losses and gains resulting from these positions could on occasion have disproportionate effects, negative or positive, on our businesses, financial condition, results of operations and prospects for any particular reporting period.
In addition, in recent years we have had considerable holdings of marketable securities received by us as consideration for the sale of certain businesses. These holdings include the shares of common stock of NASDAQ, Inc. that we received in exchange for a portion of our electronic benchmark Treasury platform, and the shares of common stock of ICE that we received in exchange for Trayport. We may seek to manage the market risk exposure inherent in such holdings by minimizing the effect of price changes on a portion of such holdings through the use of derivative contracts. There can, however, be no assurance that our hedging activities will be adequate to protect us against price risks associated with these holdings, or that the costs of such hedging activities will not be significant. Further, any such hedging activities and other risk management techniques may not be fully effective in mitigating our risk exposure in all market environments or against all types of risk, including unpredicted price movements, counterparty defaults or other risks that are unidentified or unanticipated. Any such events could have a material adverse effect on our businesses, financial condition, results of operations and prospects.
We have equity investments or profit sharing interests in entities whose primary business is proprietary trading. These investments could expose us to losses that could adversely affect our net income and the value of our assets.
We have equity investments or profit sharing interests in entities whose primary business is proprietary trading. The accounting treatment applied for these investments varies depending on a number of factors, including, but not limited to, our percentage ownership or profit share and whether we have any influence or control over the relevant entity. Under certain accounting standards, any losses experienced by these entities on their investment activities could adversely impact our net income and the value of our assets. In addition, if these entities were to fail and cease operations, we could lose the entire value of our investment and the stream of any shared profits from trading.
As a result of our acquisition of GFI, we became subject to various operational, financial, control and compliance risks of GFI and any expected revenue opportunities, cost savings, and other benefits and synergies expected to occur as a result of the acquisition may not occur in the currently contemplated timeframe, or at all.
As a result of our acquisition of GFI, we became exposed to various operational, financial, control and compliance risks of GFI that are not publicly disclosed. As a result, we are exposed to unknown risks and liabilities in connection with GFI and its acquisition. In addition, future earnings of our combined businesses could be materially adversely affected by a variety of factors, including, but not limited to, the impact of competition from other marketplace participants; economic conditions, including changes in trading volumes, inflation rates, interest rates, tax rates, or the availability of capital; our ability to comply with all covenants in our
68
credit facilities; and the risks and uncertainties with respect to our businesses as described in our reports and documents filed with the SEC. Further, the anticipated revenue opportunities, cost savings, and other benefits and synergies from the acquisition of GFI may not be fully realized, if at all, or may take longer to realize than currently contemplated. Any such factors or others could have a material adverse effect on our businesses, financial condition, results of operations and prospects. Similar factors could have an impact on our businesses in connection with other acquisitions from time to time, including to the extent that we complete acquisitions in new business lines or verticals.
Other General Financial Services Segment Risks
Our Financial Services operations are global and exchange rate fluctuations and international market events could materially adversely impact our financial results.
Because our Financial Services operations are global, we are exposed to risks associated with changes in foreign exchange rates. Changes in foreign currency rates create volatility in the U.S. dollar equivalent of revenues and expenses, in particular with regard to British Pounds and Euros. In addition, changes in the remeasurement of our foreign currency denominated net assets are recorded as part of our results of operations and fluctuate with changes in foreign currency rates. We monitor our net exposure in foreign currencies and markets on a daily basis and hedge our exposure as deemed appropriate with highly rated major financial institutions. However, potential movements in the U.S. dollar against other currencies in which we earn revenues could materially adversely affect our financial results.
Furthermore, our revenues derived from non-U.S. operations are subject to risk of loss from social or political instability, changes in government policies or policies of central banks, downgrades in the credit ratings of sovereign countries, expropriation, nationalization, confiscation of assets and unfavorable legislative and political developments in such non-U.S. jurisdictions. Revenues from the trading of non-U.S. securities may be subject to negative fluctuations as a result of the above factors. The impact of these fluctuations on our results could be magnified because generally non-U.S. trading markets, particularly in emerging market countries, are smaller, less liquid and more volatile than U.S. trading markets.
Employee misconduct, fraud, miscommunication or error could harm us by impairing our ability to attract and retain customers and subjecting us to significant financial losses, legal liability, regulatory sanctions and penalties and reputational harm; moreover, misconduct is difficult to detect and deter, and error is difficult to prevent.
Employee misconduct, fraud or error could subject us to financial losses, legal liability, and regulatory sanctions and penalties and could seriously harm our reputation and negatively affect us. Misconduct or fraud by employees could include engaging in improper or unauthorized transactions or activities, failing to properly supervise other employees or improperly using confidential information.
Employee errors and miscommunication, including mistakes in executing, recording or processing transactions for customers, could cause us to enter into transactions that customers may disavow and refuse to settle, which could expose us to the risk of material losses even if the errors and miscommunication are detected and the transactions are unwound or reversed. If our customers are not able to settle their transactions on a timely basis, the time in which employee errors and miscommunication are detected may be increased and our risk of material loss could be increased. The risk of employee error and miscommunication may be greater for products or services that are new or have non-standardized terms.
It is not always possible to deter and detect employee misconduct or fraud or prevent errors and miscommunications. While we have various supervisory systems and compliance processes and procedures in place, and seek to mitigate applicable risks, the precautions we take to deter and detect and prevent this activity may not be effective in all cases.
Although portions of our compensation structure are variable, significant parts of our cost structure are fixed, and if our revenues decline and we are unable to reduce our costs in the amount that our revenues decline, our profitability could be materially adversely affected.
Although portions of our compensation structure are variable, significant parts of our cost structure are fixed. We base our overall cost structure on historical and expected levels of demand for our products and services. If demand for these products and services and our resulting revenues decline, we may not be able to adjust our cost structure on a timely basis. If we are unable to reduce our costs in the amount that our revenues decline, our profitability could be materially adversely affected.
69
RISKS RELATED TO OUR REAL ESTATE SERVICES BUSINESS
General and Real Estate Services Market Conditions
Negative general economic conditions and commercial real estate market conditions (including perceptions of such conditions) can have a material adverse effect on our commercial Real Estate Services business, financial condition, results of operations and prospects.
Commercial real estate markets are cyclical. They relate to the condition of the economy or, at least, to the perceptions of investors and users as to the relevant economic outlook. For example, companies may be hesitant to expand their office space or enter into long-term real estate commitments if they are concerned about the general economic environment. Companies that are under financial pressure for any reason, or are attempting to more aggressively manage their expenses, may reduce the size of their workforces, limit capital expenditures, including with respect to their office space, permit more of their staff to work from home and/or seek corresponding reductions in office space and related management or other services.
Negative general economic conditions and declines in the demand for commercial real estate brokerage and related management services in several markets or in significant markets could also have a material adverse effect on our business, financial condition, results of operations, cash flows and prospects as a result of the following factors:
|
|
• |
A general decline in acquisition and disposition activity can lead to a reduction in the commissions and fees we receive for arranging such transactions, as well as in commissions and fees we earn for arranging the financing for acquirers. |
|
|
• |
A general decline in the value and performance of commercial real estate and in rental rates can lead to a reduction in management and leasing commissions and fees. Additionally, such declines can lead to a reduction in commissions and fees that are based on the value of, or revenue produced by, the properties for which we provide services. This may include commissions and fees for appraisal and valuation, sales and leasing, and property and facilities management. |
|
|
• |
Cyclicality in the commercial real estate markets may lead to volatility in our earnings, and the commercial real estate business can be highly sensitive to market perception of the economy generally and our industry specifically. Real estate markets are also thought to “lag” the broader economy. This means that, even when underlying economic fundamentals improve in a given market, it may take additional time for these improvements to translate into strength in the commercial real estate markets. |
|
|
• |
In weaker economic environments, income-producing multifamily real estate may experience higher property vacancies, lower investor and tenant demand and reduced values. In such environments, we could experience lower transaction volumes and transaction sizes as well as fewer loan originations with lower relative principal amounts, as well as potential credit losses arising from risk-sharing arrangements with respect to certain GSE loans. |
|
|
• |
Periods of economic weakness or recession, significantly rising interest rates, fiscal uncertainty, declining employment levels, declining demand for commercial real estate, falling real estate values, disruption to the global capital or credit markets, political uncertainty or the public perception that any of these events may occur, may negatively affect the performance of some or all of our business lines. |
|
|
• |
Our ability to raise funding in the long-term or short-term debt capital markets or the equity capital markets, or to access secured lending markets could in the future be adversely affected by conditions in the United States and international economy and markets, with the cost and availability of funding adversely affected by illiquid credit markets and wider credit spreads and changes in interest rates. |
While the U.S. commercial property market continues to display strength despite slowing growth of commercial property prices, according to Real Capital Analytics (which we refer to as “RCA”) as of January 25, 2018, there can be no assurances that such strength will continue. Although Newmark Research estimates that the spreads between commercial property capitalization rates for all property types and 10-year U.S. Treasuries remain around their long-term average, as of December 31, 2017, interest rates rose across the U.S. benchmark yield curve in 2017, due in part to expectations of increased economic growth due to recently enacted tax cuts. We would expect these expectations to fuel continued demand for commercial real estate for as long as the U.S. economy continues to expand at a moderate pace but there can be no assurances that such sentiment will continue.
Business Concentration Risks
Our Real Estate Services business is geographically concentrated and could be significantly affected by any adverse change in the regions in which we operate.
Our current Real Estate Services business operations are primarily located in the United States. While we are expanding our business to new geographic areas, and operate internationally through our alliance with Knight Frank, we are still highly
70
concentrated in the United States. Because we derived substantially all of our total revenues on a consolidated basis for the year ended December 31, 2017 from our operations in the United States, we are exposed to adverse competitive changes and economic downturns and changes in political conditions domestically. If we are unable to identify and successfully manage or mitigate these risks, our businesses, financial condition, results of operations, cash flows and prospects could be materially adversely affected.
The concentration of our Real Estate Services business with corporate clients can increase business risk, and our business can be adversely affected due to the loss of certain of these clients.
We value the expansion of business relationships with individual corporate clients because of the increased efficiency and economics that can result from developing recurring business from performing an increasingly broad range of services for the same client. Although our client portfolio is currently highly diversified—for the year ended December 31, 2017, our top 10 Real Estate Services clients, collectively, accounted for less than 7% of our total revenue on a consolidated basis, and our largest client accounted for less than 1% of our total revenue on a consolidated basis—as we grow our business, relationships with certain corporate clients may increase, and our client portfolio may become increasingly concentrated. For example, part of our strategy is to increase our GCS revenues which may lead to an increase in corporate clients and therefore greater concentration of revenues. Having increasingly large and concentrated clients also can lead to greater or more concentrated risks if, among other possibilities, any such client;
|
|
• |
experiences its own financial problems; |
|
|
• |
becomes bankrupt or insolvent, which can lead to our failure to be paid for services we have previously provided or funds we have previously advanced; |
|
|
• |
decides to reduce its operations or its real estate facilities; |
|
|
• |
makes a change in its real estate strategy, such as no longer outsourcing its real estate operations; |
|
|
• |
decides to change its providers of real estate services; or |
|
|
• |
merges with another corporation or otherwise undergoes a change of control, which may result in new management taking over with a different real estate philosophy or in different relationships with other real estate providers. |
Where we provide real estate services to firms in the financial services industry, including banks and investment banks, we are experiencing indirectly the increasing extent of the regulatory environment to which they are subject in the aftermath of the global financial crisis. This increases the cost of doing business with them, which we are not always able to pass on, as the result of the additional resources and processes we are required to provide as a critical supplier.
Regulatory/Legal
We may have liabilities in connection with our commercial Real Estate Services business, including appraisal and valuation, sales and leasing and property and facilities management activities.
As a licensed real estate broker and provider of commercial real estate services, we and our licensed sales professionals and independent contractors that work for us are subject to statutory due diligence, disclosure and standard-of-care obligations. Failure to fulfill these obligations could subject us or our sales professionals or independent contractors to litigation from parties who purchased, sold or leased properties that we brokered or managed.
We could become subject to claims by participants in real estate sales and leasing transactions, as well as building owners and companies for whom we provide management services, claiming that we did not fulfill our obligations. We could also become subject to claims made by clients for whom we provided appraisal and valuation services and/or third parties who perceive themselves as having been negatively affected by our appraisals and/or valuations. We also could be subject to audits and/or fines from various local real estate authorities if they determine that we are violating licensing laws by failing to follow certain laws, rules and regulations. While these liabilities have been insignificant in the past, we have no assurance that this will continue to be the case.
In our property and facilities management business, we hire and supervise third-party contractors to provide services for our managed properties. We may be subject to claims for defects, negligent performance of work or other similar actions or omissions by third parties we do not control. Moreover, our clients may seek to hold us accountable for the actions of contractors because of our role as property or facilities manager or project manager, even if we have technically disclaimed liability as a contractual matter, in which case we may be pressured to participate in a financial settlement for purposes of preserving the client relationship. While these liabilities have been insignificant in the past, we have no assurance that this will continue to be the case.
Because we employ large numbers of building staff in facilities that we manage, we face risk in potential claims relating to employment injuries, termination and other employment matters. While these risks are generally passed back to the building owner, we have no assurance it will continue to be the case.
71
In connection with a limited number of our facilities management agreements, we have guaranteed that the client will achieve certain savings objectives. In the event that these objectives are not met, we are obligated to pay the shortfall amount to the client. In most instances, the obligation to pay such amount is limited to the amount of fees (or the amount of a subset of the fees) earned by us under the contract, but no assurance can be given that we will be able to mitigate against these payments or that the payments, particularly if aggregated with those required under other agreements, would not have a material adverse effect on our ongoing arrangements with particular clients or our business, financial condition, results of operations or prospects. The percentage of our Real Estate Services revenue for the fiscal year ended December 31, 2017 subject to such obligations under our current facilities management agreements is less than 1%. While these liabilities have been immaterial to date, we have no assurance that this will continue to be the case.
Adverse outcomes of property and facilities management disputes or litigation could have a material adverse effect on our business, financial condition, results of operations and prospects, particularly to the extent we may be liable on our contracts, or if our liabilities exceed the amounts of the insurance coverage procured and maintained by us. Some of these litigation risks may be mitigated by any commercial insurance we maintain in amounts we believe are appropriate. However, in the event of a substantial loss or certain types of claims, our insurance coverage and/or self-insurance reserve levels might not be sufficient to pay the full damages. Additionally, in the event of grossly negligent or intentionally wrongful conduct, insurance policies that we may have may not cover us at all. Further, the value of otherwise valid claims we hold under insurance policies could become uncollectible in the event of the covering insurance company’s insolvency, although we seek to limit this risk by placing our commercial insurance only with highly rated companies. Any of these events could materially negatively impact our businesess, financial condition, results of operations and prospects. While these liabilities have been insignificant in the past, we have no assurance that this will continue to be the case.
If we fail to comply with laws, rules and regulations applicable to commercial real estate brokerage, valuation and appraisal and mortgage transactions and our other Real Estate Services business lines, then we may incur significant financial penalties.
Due to the broad geographic scope of our operations throughout North America and the commercial real estate services we perform, we are subject to numerous federal, state, local and foreign laws, rules and regulations specific to our services. For example, the brokerage of real estate sales and leasing transactions and other related activities require us to maintain brokerage licenses in each state in which we conduct activities for which a real estate license is required. We also maintain certain state licenses in connection with our lending, servicing and brokerage of commercial and multifamily mortgage loans. If we fail to maintain our licenses or conduct brokerage activities without a license or violate any of the laws, rules and regulations applicable to our licenses, then we may be subject to audits, required to pay fines (including treble damages in certain states) or be prevented from collecting commissions owed, be compelled to return commissions received or have our licenses suspended or revoked.
In addition, because the size and scope of commercial real estate transactions have increased significantly during the past several years, both the difficulty of ensuring compliance with the numerous state licensing and regulatory regimes and the possible loss resulting from non-compliance have increased. Furthermore, the laws, rules and regulations applicable to our business lines also may change in ways that increase the costs of compliance. The failure to comply with federal, state, local and foreign laws, rules and regulations could result in significant financial penalties that could have a material adverse effect on our businesses, financial condition, results of operations and prospects.
The loss of relationships with the GSEs and HUD would, and changes in such relationships could, adversely affect our ability to originate commercial real estate loans through such programs. Compliance with the minimum collateral and risk-sharing requirements of such programs, as well as applicable state and local licensing agencies, could reduce our liquidity.
Currently, through Berkeley Point, we originate a significant percentage of our loans for sale through the GSEs and HUD programs. Berkeley Point is approved as a Fannie Mae DUS lender, a Freddie Mac Program Plus seller/servicer in 12 states and the District of Columbia, a Freddie Mac Targeted Affordable Housing Seller, a HUD MAP lender nationwide, and a Ginnie Mae issuer. Our status as an approved lender affords us a number of advantages, which may be terminated by the applicable GSE or HUD at any time. Although we intend to take all actions to remain in compliance with the requirements of these programs, as well as applicable state and local licensing agencies, the loss of such status would, or changes in our relationships with the GSEs and HUD could, prevent us from being able to originate commercial real estate loans for sale through the particular GSE or HUD, which could have a material adverse effect on our business, financial condition, results of operations and prospects. It could also result in a loss of similar approvals from the GSEs or HUD. As of December 31, 2017, we exceeded the most restrictive applicable net worth requirement of these programs by approximately $347.4 million. In addition, over the last 10 years, Berkeley Point has achieved better 60 day+ delinquency rates than the industry average.
72
We are subject to risk of loss in connection with defaults on loans sold under the Fannie Mae DUS program that could materially and adversely affect our results of operations and liquidity.
Under the Fannie Mae DUS program, we originate and service multifamily loans for Fannie Mae without having to obtain Fannie Mae’s prior approval for certain loans, as long as the loans meet the underwriting guidelines set forth by Fannie Mae. In return for the delegated authority to make loans and the commitment to purchase loans by Fannie Mae, we must maintain minimum collateral and generally are required to share risk of loss on loans sold through Fannie Mae. With respect to most loans, we are generally required to absorb approximately one-third of any losses on the unpaid principal balance of a loan at the time of loss settlement. Some of the loans that we originate under the Fannie Mae DUS program are subject to reduced levels or no risk-sharing. However, we generally receive lower servicing fees with respect to such loans. Although our Berkeley Point business’s average annual losses from such risk-sharing programs have been a minimal percentage of the aggregate principal amount of such loans to date, if loan defaults increase, actual risk-sharing obligation payments under the Fannie Mae DUS program could increase, and such defaults could have a material adverse effect on our business, financial condition, results of operations and prospects. In addition, a material failure to pay our share of losses under the Fannie Mae DUS program could result in the revocation of Berkeley Point’s license from Fannie Mae and the exercise of various remedies available to Fannie Mae under the Fannie Mae DUS program.
A change to the conservatorship of Fannie Mae and Freddie Mac and related actions, along with any changes in laws and regulations affecting the relationship between Fannie Mae and Freddie Mac and the U.S. federal government or the existence of Fannie Mae and Freddie Mac, could have a material adverse effect on our business, financial condition, results of operations and prospects.
Each GSE has been created under a conservatorship established by its regulator, the Federal Housing Finance Agency, since 2008. The conservatorship is a statutory process designed to preserve and conserve the GSEs’ assets and property and put them in a sound and solvent condition. The conservatorships have no specified termination dates. There has been significant uncertainty regarding the future of the GSEs, including how long they will continue to exist in their current forms. Changes in such forms could eliminate or substantially reduce the number of loans we originate with the GSEs. Policymakers and others have focused significant attention in recent years on how to reform the nation’s housing finance system, including what role, if any, the GSEs should play. Such reforms could significantly limit the role of the GSEs in the nation’s housing finance system. Any such reduction in the loans we originate with the GSEs could lead to a reduction in fees related to the loans we originate or service. These effects could cause our Berkeley Point business to realize significantly lower revenues from its loan originations and servicing fees, and ultimately could have a material adverse effect on our businesses, financial condition, results of operations and prospects.
Real Estate Services Competition
We operate in a highly competitive commercial real estate services industry with numerous competitors, some of which may have greater financial and operational resources than we do.
We compete to provide a variety of services within the commercial real estate industry. Each of these business disciplines is highly competitive on a local, regional, national and global level. We face competition not only from other national real estate service companies, but also from global real estate services companies, boutique real estate advisory firms, and consulting and appraisal firms. Depending on the product or service, we also face competition from other real estate service providers, institutional lenders, insurance companies, investment banking firms, commercial banks, investment managers and accounting firms, some of which may have greater financial resources than we do. Although many of our competitors are local or regional firms that are substantially smaller than we are, some of our competitors are substantially larger than us on a local, regional, national or international basis and have similar service competencies to ours. Such competitors include CBRE Group, Inc., Jones Lang LaSalle Incorporated, Cushman & Wakefield, Savills Studley, Inc. and Colliers International. In addition, specialized firms like Walker & Dunlop, Inc., Berkadia Commercial Mortgage, LLC, HFF, Inc., Marcus & Millichap Inc. and Eastdil Secured, LLC compete with us in certain product offerings. Our industry has continued to consolidate, and there is an inherent risk that competitive firms may be more successful than we are at growing through merger and acquisition activity. See “Item 1 - Business—Competition.” In general, there can be no assurance that we will be able to continue to compete effectively with respect to any of our commercial real estate business lines or on an overall basis, to maintain current commission and fee levels or margins, or to maintain or increase our market share.
Additionally, competitive conditions, particularly in connection with increasingly large clients, may require us to compromise on certain contract terms with respect to the extent of risk transfer, acting as principal rather than agent in connection with supplier relationships, liability limitations and other terms and conditions. Where competitive pressures result in higher levels of potential liability under our contracts, the cost of operational errors and other activities for which we have indemnified our clients will be greater and may not be fully insured.
73
Other General Real Estate Services Risks
If we experience difficulties in collecting accounts receivable or experience defaults by multiple clients, it could materially adversely affect our businesses, financial condition, results of operations and prospects.
We face challenges in our ability to efficiently and/or effectively collect accounts receivable. Any of our clients or other parties obligated to make payments to us may experience a downturn in their business that may weaken their results of operations and financial condition. As a result, a client or other party obligated to make payments to us may fail to make payments when due, become insolvent or declare bankruptcy. A bankruptcy of a client or other party obligated to make payments to us would delay or preclude full collection of amounts owed to us. In addition, certain corporate services and property and facilities management agreements require that we advance payroll and other vendor costs on behalf of clients. If such a client or other party obligated to make payments to us were to file for bankruptcy, we may not be able to obtain reimbursement for those costs or for the severance obligations we would incur. Any such failure to make payments when due or the bankruptcy or insolvency of a large number of our clients (e.g., during an economic downturn) could result in disruption to our Real Estate Services business and material losses to us. While historically we have not incurred material losses as a result of the difficulties described above, this may not always be the case.
We may not be able to replace partner offices when affiliation agreements are terminated, which may decrease our scope of services and geographic reach.
We have agreements in place to operate on a collaborative and cross-referral basis with certain offices in the United States and elsewhere in the Americas in return for contractual and referral fees paid to us and/or certain mutually beneficial co-branding and other business arrangements. These independently owned offices generally use some variation of Newmark in their names and marketing materials. These agreements are normally multi-year contracts, and generally provide for mutual referrals in their respective markets, generating additional contract and brokerage fees. Through these independently owned offices, our clients have access to additional brokers with local market research capabilities as well as other commercial real estate services in locations where we do not have a physical presence. From time to time our arrangement with these independent firms may be terminated pursuant to the terms of the individual affiliation agreements. The opening of a Company-owned office to replace an independent office requires us to invest capital, which in some cases could be material. There can be no assurance that, if we lose additional independently owned offices, we will be able to identify suitable replacement affiliates or fund the establishment or acquisition of an owned office. In addition, although we do not control the activities of these independently owned offices and are not responsible for their liabilities, we may face reputational risk if any of these independently owned offices are involved in or accused of illegal, unethical or similar behavior. Failure to maintain coverage in important geographic markets may negatively impact our operations, reputation and ability to attract and retain key employees and expand domestically and internationally and could have a material adverse effect on our businesses, financial condition, results of operations and prospects.
Declines in or terminations of servicing engagements or breaches of servicing agreements could have a material adverse effect on our businesses, financial condition, results of operations and prospects.
We expect that loan servicing fees will continue to constitute a significant portion of our revenues from the Berkeley Point business for the foreseeable future. Nearly all of these fees are derived from loans that Berkeley Point originates and sells through the agencies’ programs or places with institutional investors. A decline in the number or value of loans that we originate for these investors or terminations of our servicing engagements will decrease these fees. HUD has the right to terminate Berkeley Point’s current servicing engagements for cause. In addition to termination for cause, Fannie Mae and Freddie Mac may terminate Berkeley Point’s servicing engagements without cause by paying a termination fee. Institutional investors typically may terminate servicing engagements with Berkeley Point at any time with or without cause, without paying a termination fee. We are also subject to losses that may arise from servicing errors, such as a failure to maintain insurance, pay taxes, or provide notices. If we breach our servicing obligations to the agencies or institutional investors, including as a result of a failure to perform by any third parties to which we have contracted certain routine back-office aspects of loan servicing, the servicing engagements may be terminated. Significant declines or terminations of servicing engagements or breaches of such obligations, in the absence of replacement revenue sources, could materially and adversely affect our business, financial condition and results of operations.
Reductions in loan servicing fees as a result of defaults or prepayments by borrowers could have a material adverse effect on our businesses, financial condition, results of operations and prospects.
In addition to exposure to potential loss sharing, our Real Estate Services business’s loan servicing business is also subject to potential reductions in loan servicing fees if the borrower defaults on a loan originated thereby, as the generation of loan servicing fees depends upon the continued receipt and processing of periodic installments of principal, interest and other payments such as amounts held in escrow to pay property taxes and other required expenses. The loss of such loan servicing fees would reduce the amount of cash actually generated from loan servicing and from interest on amounts held in escrow. The expected loss of future loan servicing fees would also result in non-cash impairment charges to earnings. Such cash and non-cash charges could have a material adverse effect on our businesses, financial condition, results of operations and prospects.
74
Real Estate LP may engage in a broad range of commercial real estate activities, and we will have limited influence over the selection or management of such activities.
In the BP Transaction, we acquired approximately 27% of the capital in Real Estate LP. Cantor controls the remaining 73% of its capital and controls the general partner of Real Estate LP, who will manage Real Estate LP. Real Estate LP collaborates with Cantor’s significant existing real estate finance business, and Real Estate LP may conduct activities in any real estate-related business or asset-backed securities-related business or any extensions thereof and ancillary activities thereto. Accordingly, we will have limited to no influence on the selection or management of the activities conducted by Real Estate LP, each of which may have different risks and uncertainty associated with it and that are each beyond our control.
RISKS RELATED TO OUR CORPORATE AND PARTNERSHIP STRUCTURE
Corporate Structure
Because our voting control is concentrated among the holders of our Class B common stock, the market price of our Class A common stock may be materially adversely affected by its disparate voting rights.
As of February 20, 2018, Cantor (including CFGM) beneficially owned all of the outstanding shares of our Class B common stock, representing approximately 56.1% of our total voting power. In addition, Cantor has the right to exchange exchangeable partnership interests in BGC Holdings into additional shares of Class B common stock, and pursuant to an exchange agreement with us, Cantor has the right to exchange shares of our Class A common stock for additional shares of Class B common stock.
As long as Cantor beneficially owns a majority of our total voting power, it will have the ability, without the consent of the public holders of our Class A common stock, to elect all of the members of our board of directors and to control our management and affairs. In addition, it will be able to determine the outcome of matters submitted to a vote of our stockholders for approval and will be able to cause or prevent a change of control of us. In certain circumstances, such as when transferred to an entity controlled by Cantor or Mr. Lutnick, the shares of Class B common stock issued to Cantor may be transferred without conversion to Class A common stock.
The holders of our Class A common stock and Class B common stock have substantially identical rights, except that holders of Class A common stock are entitled to one vote per share, while holders of Class B common stock are entitled to 10 votes per share on all matters to be voted on by stockholders in general. The Class B common stock is controlled by Cantor and is not subject to conversion or termination by our board of directors or any committee thereof, or any other stockholder or third party. This differential in the voting rights of Class B common stock could adversely affect the market price of our Class A common stock.
Delaware law may protect decisions of our board of directors that have a different effect on holders of our Class A common stock and Class B common stock.
Stockholders may not be able to challenge decisions that have an adverse effect upon holders of our Class A common stock compared to holders of our Class B common stock if our board of directors acts in a disinterested, informed manner with respect to these decisions, in good faith and in the belief that it is acting in the best interests of our stockholders. Newmark has a similar dual class structure. Delaware law generally provides that a board of directors owes an equal duty to all stockholders, regardless of class or series, and does not have separate or additional duties to different groups of stockholders, subject to applicable provisions set forth in a corporation’s certificate of incorporation and general principles of corporate law and fiduciary duties.
Delaware law, our corporate organizational documents and other requirements may impose various impediments to the ability of a third party to acquire control of us, which could deprive our investors of the opportunity to receive a premium for their shares.
We are a Delaware corporation, and the anti-takeover provisions of Delaware law impose various impediments to the ability of a third party to acquire control of us, even if a change of control would be beneficial to our Class A stockholders. Some provisions of the Delaware General Corporation Law (the “DGCL”), our amended and restated certificate of incorporation, and our amended and restated bylaws could make the following more difficult:
|
|
• |
acquisition of us by means of a tender offer; |
|
|
• |
acquisition of us by means of a proxy contest or otherwise; or |
|
|
• |
removal of our incumbent officers and directors. |
These provisions, summarized below, may discourage coercive takeover practices and inadequate takeover bids. These provisions may also encourage persons seeking to acquire control of us to first negotiate with our board of directors. We believe that
75
the benefits of increased protection give us the potential ability to negotiate with the initiator of an unfriendly or unsolicited proposal to acquire or restructure us and outweigh the disadvantages of discouraging those proposals because negotiation of them could result in an improvement of their terms.
Our amended and restated bylaws provide that special meetings of stockholders may be called only by the Chairman of our board of directors, or in the event the Chairman of our board of directors is unavailable, by the Chief Executive Officer or by the holders of a majority of the voting power of our Class B common stock, which is held by Cantor and CFGM. In addition, our certificate of incorporation permits us to issue “blank check” preferred stock.
Our amended and restated bylaws require advance written notice prior to a meeting of our stockholders of a proposal or director nomination which a stockholder desires to present at such a meeting, which generally must be received by our Secretary not later than 120 days prior to the first anniversary of the date of our proxy statement for the preceding year’s annual meeting. In the event that the date of the annual meeting is more than 30 days before or more than 60 days after such anniversary date, notice by the stockholder to be timely must be so delivered not later than the close of business on the later of the 120th day prior to the date of such proxy statement or the tenth day following the day on which public announcement of the date of such meeting is first made by us. Our bylaws provide that all amendments to our bylaws must be approved by either the holders of a majority of the voting power of all of our outstanding capital stock entitled to vote or by a majority of our board of directors.
We are subject to Section 203 of the DGCL. In general, Section 203 of the DGCL prohibits a publicly held Delaware corporation from engaging in a “business combination” with an “interested stockholder” for a period of three years following the date the person became an interested stockholder, unless the “business combination” or the transaction in which the person became an “interested stockholder” is approved in a prescribed manner. Generally, a “business combination” includes a merger, asset or stock sale or other transaction resulting in a financial benefit to the “interested stockholder.” An “interested stockholder” is a person who, together with affiliates and associates, owns 15% or more of a corporation’s outstanding voting stock, or was the owner of 15% or more of a corporation’s outstanding voting stock at any time within the prior three years, other than “interested stockholders” prior to the time our Class A common stock was traded on NASDAQ. The existence of this provision would be expected to have an anti-takeover effect with respect to transactions not approved in advance by our board of directors, including discouraging takeover attempts that might result in a premium over the market price for shares of Class A common stock.
In addition, our brokerage businesses are heavily regulated and some of our regulators require that they approve transactions which could result in a change of control, as defined by the then-applicable rules of our regulators. The requirement that this approval be obtained may prevent or delay transactions that would result in a change of control.
Further, our Seventh Amended and Restated Long Term Incentive Plan contains provisions pursuant to which grants that are unexercisable or unvested may automatically become exercisable or vested as of the date immediately prior to certain change of control events. Additionally, change in control and employment agreements between us and our named executive officers also provide for certain grants, payments, and grants of exchangeability in the event of certain change of control events.
The foregoing factors, as well as the significant common stock ownership by Cantor, including shares of our Class B common stock, and rights to acquire additional such shares, and the provisions of the indentures for our outstanding notes discussed above, could impede a merger, takeover or other business combination or discourage a potential investor from making a tender offer for our Class A common stock, which, under certain circumstances, could reduce the market value of the Class A common stock.
We are a parent holding company, and accordingly we are dependent upon distributions from BGC U.S. and BGC Global and dividends from Newmark to pay dividends, taxes and indebtedness and other expenses and to make repurchases.
We are a parent holding company with no direct operations and will be able to pay dividends, taxes and other expenses, and to make repurchases of shares our Class A common stock and purchases of BGC Holdings limited partnership interests or other equity interests in us or in our subsidiaries, including Newmark and its subsidiaries, only from our available cash on hand and funds received from distributions or loans from BGC U.S. and BGC Global and dividends from Newmark. As discussed above, regulatory, tax restrictions or elections, and other legal or contractual restrictions may limit our ability to transfer funds freely from our subsidiaries. In addition, any unanticipated accounting, tax or other charges against net income could adversely affect our ability to pay dividends and to make repurchases.
BGC U.S. and BGC Global intend to distribute to their limited partners, including us, on a pro rata and quarterly basis, cash that is not required to meet BGC U.S.’s and BGC Global’s anticipated business and regulatory needs. As a result, BGC U.S.’s and BGC Global’s ability, and in turn our ability, to pay dividends, taxes and indebtedness and other expenses and to make repurchases will depend upon the continuing profitability and strategic and operating needs of our businesses, including various capital adequacy and clearing capital requirements promulgated by federal, self-regulatory, and other authorities to which our subsidiaries are subject. Similarly, our subsidiary Newmark is a holding company with no direct operations, and will be able to pay
76
dividends, taxes and other expenses, and to make repurchases of shares of its Class A common stock and purchases of Newmark Holdings limited partnership interests or other equity interests in its subsidiaries, only from its available cash on hand and funds received from distributions, loans or other payments from Newmark OpCo.
Our board of directors has authorized a dividend policy which provides that we expect to pay a cash dividend to our common stockholders based on our “post-tax adjusted earnings per fully diluted share.” Our board of directors declared a dividend of 18 cents per share for the fourth quarter of 2017 and has indicated that it expects to maintain such 18 cent quarterly dividend until the completion of the proposed distribution. The balance of such adjusted earnings are expected to be available to repurchase shares of our Class A common stock or purchase BGC Holdings limited partnership interests or other equity interests in us or in subsidiaries, including Newmark and its subsidiaries, from Cantor, our executive officers, other employees, partners and others. Similarly, Newmark intends to pay dividends on a quarterly basis. Newmark’s ability to pay dividends is dependent upon its available cash on hand and funds received from distributions, loans or other payments from Newmark OpCo. Newmark OpCo intends to distribute to its limited partners, including Newmark, on a pro rata and quarterly basis, cash in an amount that will be determined by its general partner which is controlled by Newmark Holdings, which Newmark in turn controls. Newmark OpCo’s ability, and in turn Newmark’s ability, to make such distributions or dividends will depend upon the continuing profitability and strategic and operating needs of its business. Newmark may not pay the same dividend to its stockholders, including us, as the distribution paid by Newmark OpCo to its limited partners.
Our board of directors and our Audit Committee have authorized repurchases of shares of our Class A common stock and purchases of BGC Holdings limited partnership interests or other equity interests in Newmark and our other subsidiaries as part of this policy, including those held by Cantor and/or its partners, our executive officers, other employees and partners. In February 2017, this authorization was increased back to $300 million. As of February 20, 2018, we had approximately $176.5 million remaining under this $300 million authorization and may continue to actively make such repurchases or purchases, or cease to make such repurchases or purchases, from time to time. In addition, from time to time, we may reinvest all or a portion of the distributions we receive from BGC U.S. and BGC Global and dividends we receive from Newmark in BGC’s and Newmark’s respective businesses, and Newmark may similarly invest in Newmark’s business. Accordingly, there can be no assurance that future dividends will be paid or that dividend amounts will be maintained at current or future levels.
If our dividend policy is materially different than the distribution policy of BGC Holdings, upon the exchange of any BGC Holdings limited partnership interests such BGC Holdings limited partners could receive a disproportionate interest in the aggregate distributions by BGC U.S. and BGC Global that have not been distributed by us.
To the extent BGC Holdings distributes to its limited partners a greater share of income received from BGC U.S. and BGC Global than we distribute to our stockholders, then as founding/working partners, limited partnership unit holders and/or Cantor exercise any exchange right to acquire our Class A common stock or Class B common stock, as applicable, exchanging partners may receive a disproportionate interest in the aggregate distributions by BGC U.S. and BGC Global that have not been distributed by us. The reason is that the exchanging partner could receive both (1) the benefit of the distribution that has not been distributed by us from BGC U.S. and BGC Global to BGC Holdings (in the form of a distribution by BGC Holdings to its limited partners) and (2) the benefit of the distribution from BGC U.S. and BGC Global to us (in the form of a subsequent cash dividend paid by us, a greater percentage indirect interest in BGC U.S. and BGC Global following a repurchase of Class A common stock by us or a greater value of assets following a purchase of assets by us with the cash that otherwise would be distributed to our stockholders). Consequently, if our dividend policy does not match the distribution policy of BGC Holdings, other holders of Class A common stock and Class B common stock as of the date of an exchange could experience a reduction in their interest in the profits previously distributed by BGC U.S. and BGC Global that have not been distributed by us. Our current dividend policy could result in distributions to our common stockholders that are different from the distributions made by BGC Holdings to its unit holders.
The dual class structure of BGC Partners and Newmark common stock may adversely affect the trading market for such Class A common stock.
S&P Dow Jones and FTSE Russell have recently announced changes to their eligibility criteria for inclusion of shares of public companies on certain indices, including the S&P 500, namely, to exclude companies with multiple classes of shares of common stock from being added to such indices. In addition, several shareholder advisory firms have announced their opposition to the use of multiple class structures. As a result, the dual class structure of our common stock may prevent the inclusion of our Class A common stock in such indices and may cause shareholder advisory firms to publish negative commentary about our corporate governance practices or otherwise seek to cause us to change our capital structure. Any such exclusion from indices could result in a less active trading market for our Class A common stock. Any actions or publications by shareholder advisory firms critical of our corporate governance practices or capital structure could also adversely affect the value of our Class A common stock.
If we, BGC Holdings, or (prior to the distribution) Newmark were deemed an “investment company” under the Investment Company Act of 1940 (which we refer to as the “Investment Company Act”), the Investment Company Act’s
77
restrictions could make it impractical for us to continue our businesses and structure as contemplated and could materially adversely affect our businesses, financial condition, results of operations, and prospects.
Generally, an entity is deemed an “investment company” under Section 3(a)(1)(A) of the Investment Company Act if it is primarily engaged in the business of investing, reinvesting, or trading in securities, and is deemed an “investment company” under Section 3(a)(1)(C) of the Investment Company Act if it owns “investment securities” having a value exceeding 40% of the value of its total assets (exclusive of U.S. Government Securities and cash items) on an unconsolidated basis. We believe that none of us, BGC Holdings, or Newmark should be deemed an “investment company” as defined under Section 3(a)(1)(A) because none of us, BGC Holdings, or Newmark is primarily engaged in the business of investing, reinvesting, or trading in securities. Rather, through our operating subsidiaries, we, BGC Holdings, and Newmark are primarily engaged in the operation of various types of broker-dealer and commercial real estate services businesses as described in this report. None of us, BGC Holdings, or Newmark is an “investment company” under Section 3(a)(1)(C) because more than 60% of the value of our total assets on an unconsolidated basis are interests in majority-owned subsidiaries that are not themselves “investment companies.” In particular, our BGC broker-dealer subsidiaries are entitled to rely on, among other things, the broker-dealer/market intermediary exemption in Section 3(c)(2) of the Investment Company Act, and Berkeley Point, a significant Newmark subsidiary, is entitled to rely on, among other things, the mortgage banker exemption in Section 3(c)(5)(C) of the Investment Company Act.
To ensure that we, BGC Holdings, and Newmark are not deemed “investment companies” under the Investment Company Act, we need to be primarily engaged, directly or indirectly, in the non-investment company businesses of our operating subsidiaries. If we were to cease participation in the management of BGC Holdings, if BGC Holdings, in turn, were to cease participation in the management of the BGC OpCos, or if the BGC OpCos, in turn, were to cease participation in the management of our BGC operating subsidiaries, or if we were to cease participation in the management of Newmark (or if Newmark were to cease participation in the management of Newmark Holdings, if Newmark Holdings were to cease participation in the management of Newmark OpCo, or if Newmark OpCo were to cease participation in the management of the Newmark operating subsidiaries), that would increase the possibility that we, BGC Holdings, and Newmark could be deemed “investment companies.” Further, if we were deemed not to have a majority of the voting power of BGC Holdings (including through our ownership of the Special Voting Limited Partnership Interest), if BGC Holdings, in turn, were deemed not to have a majority of the voting power of the BGC OpCos (including through its ownership of Special Voting Limited Partnership Interests), or if the BGC OpCos, in turn, were deemed not to have a majority of the voting power of our BGC operating subsidiaries, or if we did not have a majority of the voting power of Newmark (or if Newmark did not have a majority of the voting power of Newmark Holdings, if Newmark Holdings did not have a majority of the voting power of Newmark OpCo, or if Newmark OpCo did not have a majority of the voting power of the Newmark operating subsidiaries), that would increase the possibility that we, BGC Holdings, and Newmark could be deemed “investment companies,” our interests in BGC Holdings and Newmark could be deemed “investment securities,” and we, BGC Holdings, and Newmark could be deemed “investment companies.”
We expect to take all legally permissible action to ensure that we, BGC Holdings, and Newmark are not deemed investment companies under the Investment Company Act, but no assurance can be given that this will not occur.
The Investment Company Act and the rules thereunder contain detailed prescriptions for the organization and operations of investment companies. Among other things, the Investment Company Act and the rules thereunder limit or prohibit transactions with affiliates, limit the issuance of debt and equity securities, prohibit the issuance of stock options, and impose certain governance requirements. If anything were to happen that would cause us, BGC Holdings, or Newmark to be deemed to be an “investment company” under the Investment Company Act, the Investment Company Act would limit our or its capital structure, ability to transact business with affiliates (including Cantor, BGC, BGC Holdings, and Newmark, as the case may be), and ability to compensate key employees. Therefore, if we, BGC Holdings, or Newmark became subject to the Investment Company Act, it could make it impractical to continue our businesses in this structure, impair agreements and arrangements, and impair the transactions contemplated by those agreements and arrangements, between and among us, BGC Holdings, and Newmark, or any combination thereof, and materially adversely affect our businesses, financial condition, results of operations, and prospects.
Partnership Structure
Our partnership structure may adversely affect our ability to recruit, retain, compensate and motivate some employee partners.
While we believe that our BGC Holdings partnership structure promotes recruitment and retention and motivation of our employee partners, some employee partners may be more attracted to the benefits of working at a privately controlled partnership, or at a public company with a different compensation structure than our own, which may adversely affect our ability to recruit, retain, compensate and motivate these persons. While BGC Holdings limited partnership interests entitle founding/working and other limited partners to participate in distributions of income from the operations of our businesses, upon leaving BGC Holdings (or upon any other redemption or purchase of such limited partnership interests, as described below), any such founding/working or other limited partners are, unless Cantor, in the case of the founding partners, and us, as the general partner of BGC Holdings, otherwise determine,
78
only entitled to receive over time, and provided he or she does not violate certain partner obligations, an amount for his or her BGC Holdings limited partnership interests that reflects such partner’s capital account or post-termination amount, if any, and not any goodwill or going concern value of our businesses. Further, certain partner units have no right to a post-termination payment, receive a preferred but fixed distribution amount, and/or cannot be made exchangeable into shares of our Class A common stock. Moreover, unless and until units are made exchangeable, limited partners have no unilateral right to exchange their BGC Holdings limited partnership interests for shares of Class A common stock.
The BGC Holdings limited partnership interests are also subject to redemption, and subject founding/working and other limited partners to non-competition and non-solicitation covenants, as well as other obligations. In addition, the exercise of Cantor’s right to purchase from BGC Holdings exchangeable limited partnership interests generally when founding partner units are redeemed or granted exchangeability will result in the share of distributions of income from the operations of our businesses on other outstanding BGC Holdings limited partnership interests, including those held by founding/working and other limited partners, to remain the same rather than increasing as would be the case if such interests were redeemed or granted exchangeability without such Cantor right to purchase. In addition, any purchase of exchangeable limited partnership units by Cantor from BGC Holdings following Cantor’s decision to grant exchangeability on founding partner units will result in additional dilution to the other partners of BGC Holdings.
The terms of the BGC Holdings limited partnership interests held by founding/working and limited partners also provide for the following:
|
|
• |
such units are not entitled to reinvest the distributions on their BGC Holdings limited partnership interests in additional BGC Holdings limited partnership interests at preferential or historical prices or at all; and |
|
|
• |
Cantor is entitled to receive any amounts from selected extraordinary transactions that are withheld from distributions to certain partners and forfeited by partners leaving BGC Holdings prior to their interests in such withheld distributions fully vesting, rather than any such forfeited amounts accruing to the benefit of all BGC Holdings limited partners on a pro rata basis. |
In addition, the ability to acquire shares of our Class A common stock underlying BGC Holdings exchangeable units is not dependent upon the partner’s continued employment with us or compliance with partner obligations, and such partners are therefore not restricted from leaving us by the potential loss of such shares.
The Newmark Holdings partnership structure is similar to the BGC Holdings partnership structure. While we believe that it also promotes recruitment and retention and motivation of our employee partners, it may not do so in certain instances for the same reasons described herein with respect to the BGC Holdings partnership structure.
We may be required to pay Cantor for a significant portion of the tax benefit, if any, relating to any additional tax depreciation or amortization deductions we claim as a result of any step up in the tax basis of the assets of BGC U.S., BGC Global or Newmark OpCo resulting from exchanges of interests in BGC Holdings (together with, prior to the distribution, interests in Newmark Holdings) for our common stock.
Certain partnership interests in BGC Holdings (together with, prior to the distribution, certain interests in Newmark Holdings) may be exchanged for shares of BGC Partners common stock. In the vast majority of cases, the partnership units that become exchangeable for shares of BGC common stock are units that have been granted as compensation, and, therefore, the exchange of such units will not result in an increase in BGC’s share of the tax basis of the tangible and intangible assets of BGC U.S., BGC Global and/or Newmark OpCo. However, exchanges of other partnership units – including non-tax-free exchanges of units by Cantor – could result in an increase in the tax basis of such tangible and intangible assets that otherwise would not have been available, although the Internal Revenue Service may challenge all or part of that tax basis increase, and a court could sustain such a challenge by the Internal Revenue Service. These increases in tax basis, if sustained, may reduce the amount of tax that BGC would otherwise be required to pay in the future. In such circumstances, the tax receivable agreement that BGC entered into with Cantor provides for the payment by BGC to Cantor of 85% of the amount of cash savings, if any, in the U.S. federal, state and local income tax or franchise tax that BGC actually realizes as a result of these increases in tax basis and certain other tax benefits related to its entering into the tax receivable agreement, including tax benefits attributable to payments under the tax receivable agreement. It is expected that BGC will benefit from the remaining 15% cash savings, if any, in income tax that we realize.
Risks Related to our Relationship with Cantor and Its Affiliates
We are controlled by Cantor, which has potential conflicts of interest with us and may exercise its control in a way that favors its interests to our detriment.
Cantor effectively is able to exercise control over our management and affairs and all matters requiring stockholder approval, including the election of our directors and determinations with respect to acquisitions and dispositions, as well as material
79
expansions or contractions of our businesses, entry into new lines of businesses and borrowings and issuances of our Class A common stock and Class B common stock or other securities. This control is subject to the approval of our Audit Committee on those matters requiring such approval. Cantor’s voting power may also have the effect of delaying or preventing a change of control of us.
Conflicts of interest may arise between us and Cantor in a number of areas relating to our past and ongoing relationships, including:
|
|
• |
potential acquisitions and dispositions of businesses; |
|
|
• |
the issuance or disposition of securities by us; |
|
|
• |
the election of new or additional directors to our board of directors; |
|
|
• |
the payment of dividends by us (if any), distribution of profits by BGC U.S., BGC Global and/or BGC Holdings and repurchases of shares of our Class A common stock or purchases of BGC Holdings limited partnership interests or other equity interests in our subsidiaries, including from Cantor, our executive officers, other employees, partners, and others; |
|
|
• |
business operations or business opportunities of ours and Cantor’s that would compete with the other party’s business opportunities, including Cantor’s and our brokerage and financial services; |
|
|
• |
intellectual property matters; |
|
|
• |
business combinations involving us; |
|
|
• |
conflicts between our agency trading for primary and secondary bond sales and Cantor’s investment banking bond origination business; |
|
|
• |
competition between our and Cantor’s other equity derivatives and cash equity inter-dealer brokerage businesses; |
|
|
• |
the nature, quality and pricing of administrative services to be provided to or by Cantor and/or Tower Bridge; and |
|
|
• |
provision of clearing capital pursuant to the Clearing Agreement and potential and existing loan arrangements. |
We also expect Cantor to manage its ownership of us so that it will not be deemed to be an investment company under the Investment Company Act, including by maintaining its voting power in us above a majority absent an applicable exemption from the Investment Company Act. This may result in conflicts with us, including those relating to acquisitions or offerings by us involving issuances of shares of our Class A common stock, or securities convertible or exchangeable into shares of Class A common stock, that would dilute Cantor’s voting power in us.
In addition, Cantor has from time to time in the past and may in the future consider possible strategic realignments of its own businesses and/or of the relationships that exist between and among Cantor and its other affiliates and us. Any future related-party transaction or arrangement between Cantor and its other affiliates and us is subject to the prior approval by our Audit Committee, but generally does not otherwise require the separate approval of our stockholders, and if such stockholder approval is required, Cantor may retain sufficient voting power to provide any such requisite approval without the affirmative consent of the other stockholders. Further, our regulators, including the FCA, may require the consolidation, for regulatory purposes, of Cantor and its other affiliates and us with respect to our U.K.-regulated entities or other entities or require other restructuring of the group. There is no assurance that such consolidation or restructuring would not result in a material expense or disruption to our businesses.
Moreover, the service of officers or partners of Cantor as our executive officers and directors, and those persons’ ownership interests in and payments from Cantor and its affiliates, could create conflicts of interest when we and those directors or executive officers are faced with decisions that could have different implications for us and Cantor. Our ability to retain our key employees and the ability of certain key employees to devote adequate time to us are critical to the success of our businesses, and failure to do so may adversely affect our businesses, financial condition, results of operations and prospects.
Our agreements and other arrangements with Cantor may be amended upon agreement of the parties to those agreements upon approval of our Audit Committee. During the time that we are controlled by Cantor, Cantor may be able to require us to agree to amendments to these agreements. We may not be able to resolve any potential conflicts, and, even if we do, the resolution may be less favorable to us than if we were dealing with an unaffiliated party.
In order to address potential conflicts of interest between Cantor and its representatives and us, our amended and restated certificate of incorporation contains provisions regulating and defining the conduct of our affairs as they may involve Cantor and its representatives, and our powers, rights, duties and liabilities and those of our representatives in connection with our relationship with Cantor and its affiliates, officers, directors, general partners or employees. Our certificate of incorporation provides that no Cantor Company, as defined in our certificate of incorporation, or any of the representatives, as defined in our certificate of incorporation, of a Cantor Company will owe any fiduciary duty to, nor will any Cantor Company or any of their respective representatives be liable for breach of fiduciary duty to, us or any of our stockholders, including with respect to corporate opportunities. In addition, Cantor and its
80
respective representatives have no duty to refrain from engaging in the same or similar activities or lines of business as us or doing business with any of our customers. The corporate opportunity policy that is included in our certificate of incorporation is designed to resolve potential conflicts of interest between us and Cantor and its representatives.
The BGC Holdings and Newmark Holdings limited partnership agreements contain similar provisions with respect to us and/or Cantor and Newmark and each of our respective representatives, and the BGC U.S. and BGC Global limited partnership agreements, as well as the Newmark Opco limited partnership agreement, contain similar provisions with respect to us and/or BGC Holdings and Newmark Holdings and each of our respective representatives.
If Cantor competes with us, it could materially harm our businesses, financial condition, results of operations and prospects.
Agreements between us and Cantor are between related parties, and the terms of these agreements may be less favorable to us than those that we could have negotiated with third parties and may subject us to litigation.
Our relationship with Cantor results in agreements with Cantor that are between related parties. As a result, the prices charged to us or by us for services provided under agreements with Cantor may be higher or lower than prices that may be charged by third parties, and the terms of these agreements may be less favorable to us than those that we could have negotiated with third parties. For example, pursuant to the separation agreement relating to our acquisition of certain of our BGC businesses from Cantor in 2008, Cantor has a right, subject to certain conditions, to be our customer and to pay the lowest commissions paid by any other customer, whether by volume, dollar or other applicable measure. In addition, Cantor has an unlimited right to internally use market data from us without any cost. Any future related-party transactions or arrangements between us and Cantor are subject to the prior approval by our Audit Committee, but generally do not otherwise require the separate approval of our stockholders, and if such stockholder approval were required, Cantor may retain sufficient voting power to provide any such requisite approval without the affirmative consent of the other stockholders.
These related-party relationships may from time to time subject us to litigation. For example, a purported derivative action, since dismissed, was filed alleging that certain related-party transactions were unfair to us.
We are controlled by Cantor, which in turn controls its wholly owned subsidiary, CF&Co, which is acting as our sales agent in our controlled equity offerings and provides us with additional investment banking services. In addition, other affiliates of Cantor may provide us with advice and services from time to time.
We are controlled by Cantor, which in turn controls its wholly owned subsidiary, CF&Co, which acts as our sales agent pursuant to a controlled equity offering sales agreement entered into on April 12, 2017 (the “Sales Agreement,”) and we may enter into similar agreements in the future. Pursuant to the Sales Agreement, we may offer and sell up to an aggregate of 20 million shares of our Class A common stock. Under the Sales Agreement, we agree to pay CF&Co 2% of the gross proceeds from the sale of shares of our Class A common stock.
In selling shares of our Class A common stock under the Sales Agreement, we may determine to instruct CF&Co not to sell our shares at less than a minimum price per share designated by us. Alternatively, we may instruct CF&Co to sell our shares so as to seek to realize a designated minimum price per share for all shares sold over a designated time period, or so as to seek to raise a designated minimum dollar amount of gross proceeds from sales of all such shares over a designated time period.
CF&Co has retained independent legal advisors in connection with its role as sales agent under the Sales Agreement, but for the reasons described below it may not be in a position to provide us with independent financial input in connection with the offering of shares of our Class A common stock pursuant to the Sales Agreement. We are not required to, and have not engaged, an independent investment banking firm to act as a qualified independent underwriter or to otherwise provide us with independent input in our controlled equity offerings.
While our board of directors and Audit Committee will be involved with any future decision by us to enter into or terminate new sales agreements with CF&Co, our management has been delegated the authority to determine, and to so instruct CF&Co with respect to, matters involving the manner, timing, number of shares, and minimum prices per share or proceeds for sales of our shares, or the suspension thereof, in our controlled equity offering pursuant to the Sales Agreement. Our management may be expected to consult with appropriate personnel from CF&Co in making such determinations, but given the overlap between our senior management and that of Cantor and its wholly-owned subsidiary, CF&Co, it may be expected that any joint determinations by our senior management and that of CF&Co with respect to our controlled equity offering will involve the same individuals. In making such joint determinations, our Audit Committee has instructed our senior management to act in the best interests of us and our stockholders. Nevertheless, in making such determinations, such individuals will not have the benefit of input from an independent investment banking firm that is able to make its own determinations with respect to our controlled equity offering, including, but not limited to, whether to suspend sales under the Sales Agreement or to terminate the Sales Agreement.
81
In addition, Cantor, CF&Co and their affiliates have provided investment banking services to us and our affiliates in the past, and may be expected to do so in the future, including acting as our financial advisor in connection with business combinations, dispositions, or other transactions, including the acquisition of GFI, and placing or recommending to us various investments, stock loans or cash management vehicles. They receive customary fees and commissions for these services. They may also receive brokerage and market data and analytics products and services from us and our respective affiliates. From time to time, CF&Co may make a market in our notes. We also provide to and receive from Cantor and its affiliates various administrative services.
Risks Related to Our Class A Common Stock
Purchasers, as well as existing stockholders, may experience significant dilution as a result of offerings of shares of our Class A common stock.
The Sales Agreement with CF&Co currently remains in effect to assist us with partner and employee sales of shares of Class A common stock. It provides for the issuance and sale of up to an aggregate of 20 million shares of our Class A common stock from time to time on a delayed or continuous basis. As of February 20, 2018, we have issued and sold an aggregate of approximately 17.3 million shares of Class A common stock under the Sales Agreement, with approximately 2.7 million shares of Class A common stock remaining to be sold under the Agreement. Further, we have an effective shelf registration statement on Form S-4 with respect to the offer and sale of up to an aggregate of 20 million shares of Class A common stock from time to time in connection with business combination transactions, including acquisitions of other businesses, assets, properties or securities. As of February 20, 2018, we have issued an aggregate of 11.0 million shares of Class A common stock under the Form S-4, all in connection with acquisitions. In addition, in connection with the conversion of our 8.75% Convertible Senior Notes due April 15, 2015, on April 13, 2015 we issued to Cantor in a private placement 24,042,599 shares of our Class A common stock, and in connection with the JPI Back-End Merger to complete our acquisition of GFI, on January 12, 2016 we issued to the JPI stockholders in a private placement 23,481,192 shares of Class A common stock; in both cases, we filed effective shelf registration statements on Form S-3, registering such shares of Class A common stock for resale. We also have an effective shelf registration statement on Form S-3 pursuant to which we can offer and sell up to an aggregate of 10 million shares of our Class A common stock under our Dividend Reinvestment and Stock Purchase Plan. As of February 20, 2018, we have issued approximately 342,000 shares of our Class A common stock under such Plan. We have filed a number of registration statements on Form S-8 pursuant to which we have registered the shares underlying our Long Term Incentive Plan. As of January 31, 2018, there were 188.5 million shares remaining for sale under such registration statements.
Because the sales of shares of our Class A common stock under the Sales Agreements have been made, and any other future sales of our Class A common stock may be made, in the markets at prevailing market prices or at prices related to such prevailing market prices, the prices at which these shares have been sold and may be sold in the future will vary, and these variations may be significant. Purchasers of these shares may suffer significant dilution if the price they pay is higher than the price paid by other purchasers of shares of our Class A common stock under the Sales Agreement and any future offerings of our shares of Class A common stock.
In addition, the sale by us of any shares of our Class A common stock may have the following effects:
|
|
• |
our existing Class A common stockholders’ proportionate ownership interest in us will decrease; |
|
|
• |
our existing Class A common stockholders may suffer significant dilution; |
|
|
• |
the amount of cash available per share for dividends payable on shares of our Class A common stock may decrease; |
|
|
• |
the relative voting strength of each previously outstanding share of our Class A common stock may be diminished; and |
|
|
• |
the market price of our Class A common stock may decline. |
Because we intend to use the net proceeds from the sale of shares of our Class A common stock under the Sales Agreement, and may use the net proceeds from future offerings, for general corporate purposes, which, among other things, are expected to include repurchases of shares of our Class A common stock and purchases of BGC Holdings units or other equity interests in us or in our subsidiaries from Cantor, our executive officers, other employees, partners, and others, and/or to replenish cash used to effect such repurchases and purchases, investors should be aware that such net proceeds will not be available for other corporate purposes, and that, depending upon the timing and prices of such repurchases of shares and purchases of units and of the sales of our shares under the Sales Agreement and the liquidity and depth of our market, we may sell a greater aggregate number of shares, at a lower average price per share, under the Sales Agreement than the number of shares or units repurchased or purchased, thereby increasing the aggregate number of shares and units outstanding and decreasing our earnings per share.
We intend to use the net proceeds of the sale of shares of Class A common stock under the Sales Agreement, and may use the net proceeds from future offerings, for general corporate purposes, which among other things, are expected to include repurchases of shares of our Class A common stock and purchases of BGC Holdings units or other equity interests in us or in our subsidiaries,
82
including Newmark and its subsidiaries, from Cantor, our executive officers, other employees, partners, and others, and/or to replenish cash used to effect such repurchases and purchases. From January 1, 2017 to December 31, 2017, we repurchased an aggregate of 1.4 million shares of Class A common stock at an aggregate purchase price of approximately $16.8 million with an average repurchase price of $12.10 per share. During that period, we redeemed for cash an aggregate of 7.6 million limited partnership units at an average price of $12.40 per unit and an aggregate of 875.6 thousand founding/working partner units at an average price of $10.70 per unit. In the future, we expect to continue to repurchase shares of our Class A common stock and redeem or partnership units from Cantor, our executive officers, other employees, partners, and others, and these repurchases and purchases may be significant.
To the extent that we continue to use the net proceeds of the sale of shares of our Class A common stock to fund repurchases of shares and purchases of units, or to replenish cash used to effect repurchases and purchases, net proceeds will not be available for other corporate purposes. In addition, to the extent that we seek to sell shares of our Class A common stock to raise net proceeds for repurchases of shares and purchases of units, depending upon the timing and prices of the repurchases of shares and purchases of units and of the sales of our shares and the liquidity and depth of our market, we may in fact sell a greater aggregate number of shares of our Class A common stock, at a lower average price per share, in our offerings than the aggregate number of shares repurchased and units purchased by us and the average price per share or unit that we are paying in such repurchases and purchases. Thus, our strategy may result in an increase in the number of our shares and units outstanding and a decrease in our earnings per share on both a basic and a fully diluted basis.
Nevertheless, our management believes that selling shares of our Class A common stock, and using the net proceeds of such sales to repurchase shares and purchase units, is in our best interest and that of our stockholders. While we believe that we can successfully manage our strategy, and that our share price may in fact increase as we increase the amount of cash available for dividends and share repurchases and unit purchases by paying a portion of the compensation of our employees in the form of partnership units and restricted stock, gradually lowering our compensation expenses for purposes of distributable earnings, and lowering our long-term effective tax rate for distributable earnings, there can be no assurance that our strategy will be successful or that we can achieve any or all of such objectives.
The market price of our Class A common stock has fluctuated significantly and may continue to do so. In addition, future sales of shares of Class A common stock by us or selling stockholders could materially adversely affect the market price of the Class A common stock.
The market price of our Class A common stock has fluctuated significantly, and the market price of our Class A common stock may continue to do so depending upon many factors, including our actual results of operations and perceived prospects, the prospects of our competition and of the financial and commercial real estate markets in general, differences between our actual financial and operating results and those expected by investors and analysts, changes in analysts’ recommendations or projections, seasonality, changes in general valuations for companies in our business segments, changes in general economic or market conditions and broad market fluctuations. The market price of our Class A common stock may continue to be subject to similar market fluctuations, which may be unrelated to our operating performance or prospects, and increased volatility could result in a decline in the market price of our Class A common stock. Declines in the price of our Class A common stock may adversely affect our ability to recruit and retain key employees, including brokers, salespeople, managers and other professionals.
Future sales of shares of our Class A common stock also could materially adversely affect the market price of our Class A common stock. If our existing stockholders sell a large number of shares, or if we issue a large number of shares of our Class A common stock in connection with public offerings, future acquisitions, strategic alliances, third-party investments and private placements or otherwise, the market price of our Class A common stock could decline significantly.
In addition to our sales of shares of our Class A common stock pursuant to our controlled equity offerings, our acquisition shelf, and our dividend reinvestment plan discussed above, events which could have such an effect include the following:
|
|
• |
In connection with the issuance of 24,042,599 shares of Class A common stock to Cantor upon the conversion by Cantor of the 8.75% Convertible Senior Notes, we filed an effective resale registration statement for such shares on Form S-3 on June 16, 2015; |
|
|
• |
In connection with the issuance of 23,481,192 shares of Class A common stock upon the closing of the JPI Back-End Merger, we filed an effective resale registration statement for such shares on Form S-3 on January 12, 2016; |
|
|
• |
We may issue shares of Class A common stock upon the conversion or exchange of any convertible or exchangeable debt securities that may be issued by us in the future; |
83
|
|
grants of restricted stock, RSUs, and options, and (v) donations of shares by us to The Cantor Fitzgerald Relief Fund; and |
|
|
• |
Stockholders may resell outstanding shares of our Class A common stock, including sales by Cantor partners who receive distribution rights shares from Cantor, The Cantor Fitzgerald Relief Fund which may receive donated shares from Cantor or others, and our employees and partners who hold our shares, including those received in compensatory arrangements from us or in connection with acquisitions. |
ADDITIONAL RISK FACTORS RELATED TO OUR OWNERSHIP OF NEWMARK GROUP, INC.
Our publicly traded subsidiary Newmark is controlled by BGC Partners (which is controlled by Cantor). Upon completion of the distribution, Newmark will be controlled by Cantor. BGC Partners’ and Cantor’s respective interests may conflict with Newmark’s interests, and BGC Partners and Cantor may exercise their control in a way that favors their respective interests to Newmark’s detriment.
As of December 31, 2017, BGC Partners held 115,593,786 shares of Newmark’s Class A common stock, which represented approximately 83.4% of Newmark’s outstanding Class A common stock. In addition, as of December 31, 2017, BGC Partners held 15,840,049 shares of Newmark’s Class B common stock which represented all of the outstanding shares of Newmark’s Class B common stock. Together, the shares of Class A common stock and Class B common stock held by BGC Partners represented approximately 92.3% of Newmark’s total voting power. BGC Partners is controlled by Cantor. If the distribution occurs, Cantor will beneficially own 6,671,146 shares of Newmark’s Class A common stock representing approximately 4.8% of Newmark’s outstanding Class A common stock, and all of the outstanding shares of Newmark’s Class B common stock, together representing approximately 55.6% of Newmark’s total voting power. We expect Newmark to retain its dual class structure, and there are no circumstances under which the holders of Class B common stock would be required to convert their shares of Class B common stock into shares of Class A common stock.
As a result, BGC Partners, directly through its ownership of shares of Newmark’s Class A common stock and Class B common stock, and Cantor, indirectly through its control of BGC Partners, are each able to exercise control over Newmark’s management and affairs and all matters requiring stockholder approval, including the election of its directors and determinations with respect to acquisitions and dispositions, as well as material expansions or contractions of its business, entry into new lines of business and borrowings and issuances of its Class A common stock and Class B common stock or other securities. BGC Partners’ voting power, prior to the completion of the distribution, and Cantor’s voting power, indirectly prior to the completion of the distribution and directly after the completion of the distribution, may also have the effect of delaying or preventing a change of control of Newmark.
BGC Partners’ and Cantor’s ability to exercise control over Newmark could create or appear to create potential conflicts of interest. Conflicts of interest may arise between Newmark and each of BGC Partners and Cantor in a number of areas relating to their past and ongoing relationships, including:
|
|
• |
potential acquisitions and dispositions of businesses; |
|
|
• |
the issuance or disposition of securities by Newmark; |
|
|
• |
the election of new or additional directors to our board of directors; |
|
|
• |
the payment of dividends by Newmark (if any), distribution of profits by Newmark OpCo and/or Newmark Holdings and repurchases of shares of Newmark’s Class A common stock or purchases of Newmark Holdings limited partnership interests or other equity interests in our subsidiaries, including from BGC Partners, Cantor or Newmark’s executive officers, other employees, partners and others; |
|
|
• |
business operations or business opportunities of Newmark’s and BGC Partners’ or Cantor’s that would compete with the other party’s business opportunities; |
|
|
• |
intellectual property matters; |
|
|
• |
business combinations involving us; and |
|
|
• |
the nature, quality and pricing of administrative services and transition services to be provided to or by BGC Partners or Cantor or their respective affiliates. |
Potential conflicts of interest could also arise if Newmark decides to enter into any new commercial arrangements with BGC Partners or Cantor in the future or in connection with BGC Partners’ or Cantor’s desire to enter into new commercial arrangements with third parties.
We also expect each of BGC Partners and Cantor to manage its respective ownership of Newmark so that it will not be deemed to be an investment company under the Investment Company Act, including by maintaining its voting power in Newmark
84
above a majority absent an applicable exemption from the Investment Company Act. This may result in conflicts with Newmark, including those relating to acquisitions or offerings by it involving issuances of shares of its Class A common stock, or securities convertible or exchangeable into shares of Class A common stock, that would dilute BGC Partners’ or Cantor’s voting power in Newmark.
In addition, each of BGC Partners and Cantor has from time to time in the past and may in the future consider possible strategic realignments of its own businesses and/or of the relationships that exist between and among BGC Partners and/or Cantor and their other respective affiliates and us. Any future material related-party transaction or arrangement between BGC Partners and/or Cantor and their other respective affiliates and Newmark is subject to the prior approval by Newmark’s audit committee, but generally does not require the separate approval of its stockholders, and if such stockholder approval is required, BGC Partners and/or Cantor may retain sufficient voting power to provide any such requisite approval without the affirmative consent of Newmark’s other stockholders. Further, Newmark’s regulators may require the consolidation, for regulatory purposes, of BGC Partners, Cantor and/or their other respective affiliates and Newmark or require other restructuring of the group. There is no assurance that such consolidation or restructuring would not result in a material expense or disruption to Newmark’s business.
Cantor has existing real estate-related businesses, and Newmark and Cantor are partners in a real estate-related joint venture, Real Estate LP. While these businesses do not currently compete with Newmark, it is possible that, in the future, real estate-related opportunities in which Newmark would be interested may also be pursued by Cantor and/or Real Estate LP, and Real Estate LP may conduct activities in any real estate-related business or asset-backed securities-related business or any extensions thereof and ancillary activities thereto. For example, Cantor’s commercial lending business has historically offered conduit loans to the multifamily market. While conduit loans have certain key differences versus multifamily agency loans, such as those offered by Berkeley Point, there can be no assurance that Cantor’s and/or Real Estate LP’s lending businesses will not seek to offer multifamily loans to Newmark’s existing and potential multifamily customer base.
Moreover, the service of officers or partners of BGC Partners or Cantor as Newmark’s executive officers and directors, and those persons’ ownership interests in and payments from BGC Partners or Cantor and their respective affiliates, could create conflicts of interest when Newmark and those directors or executive officers are faced with decisions that could have different implications for Newmark and them.
Newmark also has entered into agreements that provide certain rights to the holder of a majority of the Newmark Holdings exchangeable limited partnership interest, which is currently Cantor. For example, the Separation and Distribution Agreement provides that any quarterly dividend to Newmark’s common stockholders that is 25% or more of its post-tax Adjusted Earnings per fully diluted share shall require the consent of the holder of a majority of the Newmark Holdings exchangeable limited partnership interests. In addition, the Separation and Distribution Agreement requires Newmark to contribute any reinvestment cash (i.e., any cash that Newmark retains, after the payment of taxes, as a result of distributing a smaller percentage than Newmark Holdings from the distributions they receive from Newmark OpCo), as an additional capital contribution with respect to its existing limited partnership interest in Newmark OpCo, unless Newmark and the holder of a majority of the Newmark Holdings exchangeable limited partnership interests agree otherwise. See “Item 13 - Certain Relationships and Related-Party Transactions—Adjustment to Exchange Ratio” and “Certain Relationships and Related-Party Transactions—Use of Reinvestment Cash.” It is possible that Cantor, as the holder of a majority of the Newmark Holdings exchangeable limited partnership interest, will not agree to a higher dividend percentage or a different use of reinvestment cash, even if doing so might be more advantageous to the Newmark stockholders.
Newmark’s agreements and other arrangements with BGC Partners and Cantor, including the separation and distribution agreement, may be amended upon agreement of the parties to those agreements and approval of Newmark’s audit committee. During the time that Newmark is controlled by BGC Partners and/or Cantor, BGC Partners and/or Cantor may be able to require Newmark to agree to amendments to these agreements. Newmark may not be able to resolve any potential conflicts, and, even if it does, the resolution may be less favorable to it than if it were dealing with an unaffiliated party. Additionally, pursuant to the separation and distribution agreement, for so long as BGC Partners beneficially owns at least 50% of the total voting power of Newmark’s outstanding capital stock entitled to vote in the election of directors, Newmark will not, and will cause its subsidiaries to not (without BGC Partners’ prior written consent) take certain actions, including, without limitation, acquiring any other businesses or assets or disposing of any of its assets, in each case with an aggregate value for all such transactions in excess of $100 million, or incurring any indebtedness, other than indebtedness not in excess of $50 million in the aggregate or any indebtedness some or all of the proceeds of which are used to repay the Term Loan, the Converted Term Loan or the BGC Notes. See “Item 13 - Certain Relationships and Related-Party Transactions—Separation and Distribution Agreement—Operating Covenants.”
In order to address potential conflicts of interest between or among BGC Partners, Cantor and their respective representatives and Newmark, Newmark’s certificate of incorporation contains provisions regulating and defining the conduct of its affairs as they may involve BGC Partners and/or Cantor and their respective representatives, and Newmark’s powers, rights, duties and liabilities and those of its representatives in connection therewith. Newmark’s certificate of incorporation provides that, to the greatest extent permitted by law, no Cantor Company or BGC Partners Company, each as defined in Newmark’s certificate of incorporation, or any of the representatives, as defined in Newmark’s certificate of incorporation, of a Cantor Company or BGC Partners Company will, in its capacity as a Newmark stockholder or affiliate, owe or be liable for breach of any fiduciary duty to
85
Newmark or any of its stockholders. In addition, to the greatest extent permitted by law, none of any Cantor Company, BGC Partners Company or any of their respective representatives will owe any duty to refrain from engaging in the same or similar activities or lines of business as Newmark or its representatives or doing business with any of Newmark or its representatives’ clients or customers. If any Cantor Company, BGC Partners Company or any of their respective representatives acquires knowledge of a potential transaction or matter that may be a corporate opportunity (as defined in Newmark’s certificate of incorporation) for any such person, on the one hand, and Newmark or any of its representatives, on the other hand, such person will have no duty to communicate or offer such corporate opportunity to Newmark or any of its representatives, and will not be liable to Newmark, any of its stockholders or any of its representatives for breach of any fiduciary duty by reason of the fact that they pursue or acquire such corporate opportunity for themselves, direct such corporate opportunity to another person or do not present such corporate opportunity to Newmark or any of its representatives, subject to the requirement described in the following sentence. If a third party presents a corporate opportunity to a person who is both Newmark’s representative and a representative of a BGC Partners Company and/or a Cantor Company, expressly and solely in such person’s capacity as Newmark’s representative, and such person acts in good faith in a manner consistent with the policy that such corporate opportunity belongs to Newmark, then such person will be deemed to have fully satisfied and fulfilled any fiduciary duty that such person has to Newmark as its representative with respect to such corporate opportunity, provided that any BGC Partners Company, any Cantor Company or any of their respective representatives may pursue such corporate opportunity if Newmark decides not to pursue such corporate opportunity.
The corporate opportunity policy that is included in Newmark’s certificate of incorporation is designed to resolve potential conflicts of interest between Newmark and its representatives and BGC Partners, Cantor and their respective representatives. The Newmark Holdings limited partnership agreement contains similar provisions with respect to Newmark and/or BGC Partners and Cantor and each of their respective representatives, and the Newmark OpCo limited partnership agreement will contain similar provisions with respect to Newmark and/or Newmark Holdings and each of their respective representatives. This policy, however, could make it easier for BGC Partners or Cantor to compete with Newmark. If BGC Partners or Cantor competes with Newmark, it could materially harm Newmark’s business, financial condition, results of operations and prospects.
The market price of Newmark’s Class A common stock may be volatile, which could cause the value of our ownership of its Class A common stock to decline.
As of December 31, 2017, BGC Partners held 115,593,786 shares of Newmark’s Class A common stock, which represented approximately 83.4 % of Newmark’s outstanding Class A common stock. The market price of Newmark’s Class A common stock may fluctuate substantially due to a variety of factors, including:
|
|
• |
its quarterly or annual earnings, or those of other companies in its industry; |
|
|
• |
actual or anticipated fluctuations in its results of operations; |
|
|
• |
differences between its actual financial and operating results and those expected by investors and analysts; |
|
|
• |
changes in analysts’ recommendations or estimates or Newmark’s ability to meet those estimates; |
|
|
• |
the prospects of its competition and of the commercial real estate market in general; |
|
|
• |
changes in general valuations for companies in its industry; and |
|
|
• |
changes in business, legal or regulatory conditions, or other general economic or market conditions and overall market fluctuations. |
In particular, the realization of any of the risks described in these “Risk Factors” or under “Special Note Regarding Forward-Looking Statements” could have a material adverse impact on the market price of Newmark’s Class A common stock in the future and cause the value of our ownership of Newmark’s Class A common stock to decline. In addition, the stock markets in general have experienced substantial volatility that has often been unrelated to the operating performance of particular companies. These types of broad market fluctuations may adversely affect the trading price of Newmark’s Class A common stock.
In the past, stockholders of other companies have sometimes instituted securities class action litigation against issuers following periods of volatility in the market price of their securities. Any similar litigation against Newmark could result in substantial costs, divert management’s attention and its other resources and could have a material adverse effect on its business, financial condition, results of operations and prospects. There is no assurance that such a suit will not be brought against Newmark.
If securities or industry analysts do not publish research or reports about Newmark’s business, or publish negative reports about its business, its share price and trading volume could decline.
The trading market for Newmark’s Class A common stock depends, in part, on the research and reports that securities or industry analysts publish about Newmark or its business. If one or more of the analysts who cover Newmark downgrade is stock or publish unfavorable research about its business, Newmark’s stock price could decline. If one or more of these analysts ceases
86
coverage of the company or fails to publish reports on it regularly, demand for Newmark’s stock could decrease, which might cause its stock price and trading volume to decline.
Future sales of shares of Newmark’s Class A common stock could adversely affect the market price of Newmark’s Class A common stock. Newmark’s stockholders (including us) could be diluted by such future sales and be further diluted upon exchange of Newmark Holdings limited partnership interests into Newmark’s common stock and upon issuance of additional Newmark OpCo limited partnership interests to Newmark Holdings as a result of future issuances of Newmark Holdings limited partnership interests.
Future sales of Newmark’s shares could adversely affect the market price of its Class A common stock. If its existing stockholders sell a large number of shares, or if it issues a large number of shares of its common stock in connection with future acquisitions, strategic alliances, third-party investments and private placements or otherwise, the market price of its Class A common stock could decline significantly. Moreover, the perception in the public market that these stockholders might sell shares could depress the market price of its Class A common stock.
As of December 31, 2017, BGC Partners held 115,593,786 shares of Newmark’s Class A common stock, representing approximately 83.4% of Newmark’s outstanding Class A common stock. In addition, as of December 31, 2017, BGC Partners held 15,840,049 shares of Newmark’s Class B common stock representing all of the outstanding shares of Newmark’s Class B common stock. Together, the shares of Class A common stock and Class B common stock held by BGC Partners represented approximately 92.3% of Newmark’s total voting power.
BGC Partners currently expects to pursue a distribution to its stockholders of all of the shares of Newmark’s common stock that it then owns in a manner that is intended to qualify as generally tax-free for U.S. federal income tax purposes. The determination of whether, when and how to proceed with any such distribution is entirely within our discretion. The shares of Newmark’s common stock that BGC Partners and Newmark’s executive officers and directors own are subject to the 180-day “lock-up” restriction contained in the underwriting agreement for the Newmark IPO. If the distribution occurs, the distributed shares of Class A common stock would be eligible for immediate resale in the public market, except for those held by Cantor and other Newmark affiliates, which distributed shares could be sold pursuant to a registered offering or pursuant to an exemption under the Securities Act. We are unable to predict whether significant amounts of Newmark’s Class A common stock will be sold in the open market in anticipation of, or following, the distribution. Any potential sale, disposition or distribution of Newmark’s Class A common stock, or the perception that such sale, disposition or distribution could occur, could adversely affect prevailing market prices for Newmark’s Class A common stock.
Even if BGC Partners does not distribute the shares of Newmark’s common stock that it owns by means of the distribution, BGC Partners may sell all or a portion of such shares to the public or in one or more private transactions after the expiration of the “lock-up” restriction on June 13, 2018. Newmark has entered into a registration rights agreement with BGC Partners and Cantor that grants them registration rights to facilitate their sale of shares of Newmark’s Class A common stock in the market. Any sale or distribution, or expectations in the market of a possible sale or distribution, by BGC Partners or Cantor of all or a portion of Newmark’s shares of Class A common stock through the distribution, in a registered offering, pursuant to an exemption under the Securities Act or otherwise could depress or reduce the market price for Newmark’s Class A common stock or cause Newmark’s shares to trade below the prices at which they would otherwise trade.
Moreover, the shares of Newmark’s Class A common stock sold in the Newmark IPO are freely tradable without restriction, except for any shares acquired by a Newmark affiliate, which shares can be sold under Rule 144 under the Securities Act, subject to various volume and other limitations. Subject to certain limited exceptions, Newmark, its executive officers and directors and BGC Partners have agreed with the underwriters not to directly or indirectly sell, dispose of or hedge any shares of Newmark’s Class A common stock or securities convertible into or exchangeable for shares of Newmark’s Class A common stock without the prior written consent of Goldman Sachs & Co. LLC and Merrill Lynch, Pierce, Fenner & Smith Incorporated for the period ending on June 13, 2018. After the expiration of the 180-day “lock-up” restriction, Newmark’s executive officers and directors and BGC Partners could dispose of all or any part of their shares of Newmark’s Class A common stock through a public offering, sales under Rule 144 or other transactions. In addition, Goldman Sachs & Co. LLC and Merrill Lynch, Pierce, Fenner & Smith Incorporated may, in their sole discretion, release all or some portion of the shares subject to lock-up agreements at any time and for any reason. Sales of a substantial number of such shares upon expiration of the lock-up restriction and market stand-off agreements, the perception that such sales may occur, or early release of these agreements, could cause Newmark’s market price to fall or make it more difficult for an investor to sell shares of Class A common stock at a time and price that such an investor may deem appropriate.
Newmark has registered under the Securities Act 50 million of the 400 million shares of its Class A common stock which are reserved for issuance upon exercise of options, restricted stock and other equity awards granted under Newmark’s Long-Term Incentive Plan (which we refer to as the “Newmark Equity Plan”) and expects to register the balance from time to time in the future. These shares can be sold in the public market upon issuance, subject to restrictions under the securities laws applicable to resales by
87
affiliates. Newmark may in the future register additional shares of Class A common stock under the Securities Act that become reserved for issuance under other equity incentive plans.
In addition, as of December 31, 2017, there are outstanding 76,431,000 limited partnership interests of Newmark Holdings. Some of those limited partnership interests will be exchangeable with Newmark for shares of Newmark common stock based on the exchange ratio (which is currently one, but is subject to adjustments as set forth in the separation and distribution agreement). See “Item 13 - Certain Relationships and Related-Party Transactions—Adjustment to Exchange Ratio.” Prior to the distribution, however, such exchanges are subject to the limitation as described below under “Item 13 - Certain Relationships and Related-Party Transactions—Amended and Restated Newmark Holdings Limited Partnership Agreement—Exchanges.” Shares of Class A common stock issued upon such exchange would be eligible for resale in the public market. See “Item 13 - Certain Relationships and Related-Party Transactions—Amended and Restated Newmark Holdings Limited Partnership Agreement—Exchanges.”
Newmark may register for resale the shares of its Class A common stock for which the Newmark Holdings limited partnership interests are exchangeable. In light of the number of shares of Newmark common stock issuable in connection with the full exchange of the Newmark Holdings exchangeable limited partnership interests, the price of Newmark’s Class A common stock may decrease and Newmark’s ability to raise capital through the issuance of equity securities may be adversely impacted as these exchanges occur and any transfer restrictions lapse.
Prior to the distribution, to the extent that BGC Partners receives any Newmark OpCo units as a result of any exchange of Newmark Holdings exchangeable limited partnership interests or as a result of any contribution by BGC Partners to Newmark OpCo or purchase by BGC Partners of Newmark OpCo units, then, in each case, BGC Partners will contribute such Newmark OpCo units to Newmark in exchange for an equal number of newly issued shares of Newmark common stock, which would dilute the other stockholders of Newmark. See “Item 13 - Certain Relationships and Related-Party Transactions—Separation and Distribution Agreement—BGC Partners Contribution of Newmark OpCo Units Prior to the Distribution.”
Any such potential sale, disposition or distribution of Newmark common stock, or the perception that such sale, disposition or distribution could occur, could adversely affect prevailing market prices for Newmark’s Class A common stock and have a material adverse effect on the value of our ownership interest in Newmark.
Not applicable.
We have offices in the United States, Canada, Europe, United Kingdom, Latin America, Asia, Africa and the Middle East. Our principal executive offices are located at 499 Park Avenue, New York, New York. We also occupy a space at 199 Water Street, New York, New York, which serves as a trading operation for our Financial Services businesses, space at 125 Park Avenue, New York, New York, which serves as the headquarters of our commercial Real Estate Services businesses, and space at 55 Water Street, New York, New York, which serves as the headquarters of our GFI division. Under the Administrative Services Agreement with Cantor, we are obligated to Cantor for our pro rata portion (based on square footage used) of rental expense during the terms of the leases for such spaces.
Our largest presence outside of the New York metropolitan area is in London, located at One Churchill Place, Canary Wharf.
We currently occupy concurrent computing centers in Weehawken, New Jersey and Trumbull, Connecticut, which primarily service our Financial Services segment. In addition, we occupy two data centers in the United Kingdom located in Canary Wharf and Romford, respectively. Our U.S. Financial Services operations also have office space in Princeton, New Jersey, Edison, New Jersey, Palm Beach Gardens, Florida, Garden City, New York and Sugar Land, Texas, and both business segments have office space in Chicago.
In our Real Estate Services business, we operate out of more than 120 offices in the United States (in Alabama, Arizona, California, Colorado, Connecticut, Delaware, Florida, Georgia, Illinois, Maryland, Massachusetts, Michigan, Missouri, Nevada, New Jersey, New York, North Carolina, Ohio, Oregon, Pennsylvania, Tennessee, Texas, Virginia, Washington and the District of Columbia). In addition, Newmark has licensed its name to 21 commercial real estate providers that operate out of 37 offices in certain locations where Newmark does not have its own offices. Our partner, Knight Frank, operates out of approximately 411 offices.
88
See Note 24—“Commitments, Contingencies and Guarantees” to the Company’s consolidated financial statements included in Part II, Item 8 of this Annual Report on Form 10-K, for a description of our legal proceedings.
Not Applicable
89
|
ITEM 5. |
MARKET FOR THE REGISTRANT’S COMMON EQUITY, RELATED STOCKHOLDER MATTERS AND ISSUER PURCHASES OF EQUITY SECURITIES |
Price Range of Class A Common Stock
Our Class A common stock is traded on the NASDAQ Global Select Market under the symbol “BGCP.” There is no public trading market for our Class B common stock, which is held by Cantor and CFGM. The following table sets forth, for the fiscal quarters indicated, the high and low sales prices per share of our Class A common stock on the NASDAQ Global Select Market.
We declared quarterly dividends of $0.16 for each of the four quarters of 2016 and $0.18 for each of the four quarters of 2017.
|
|
|
High |
|
|
Low |
|
||
|
2018 |
|
|
|
|
|
|
|
|
|
First Quarter (through February 21, 2018) |
|
$ |
15.26 |
|
|
$ |
12.82 |
|
|
2017 |
|
|
|
|
|
|
|
|
|
First Quarter |
|
$ |
11.85 |
|
|
$ |
10.29 |
|
|
Second Quarter |
|
$ |
12.69 |
|
|
$ |
10.60 |
|
|
Third Quarter |
|
$ |
14.50 |
|
|
$ |
12.35 |
|
|
Fourth Quarter |
|
$ |
16.97 |
|
|
$ |
14.50 |
|
|
2016 |
|
|
|
|
|
|
|
|
|
First Quarter |
|
$ |
9.63 |
|
|
$ |
8.27 |
|
|
Second Quarter |
|
$ |
9.50 |
|
|
$ |
8.34 |
|
|
Third Quarter |
|
$ |
9.31 |
|
|
$ |
8.18 |
|
|
Fourth Quarter |
|
$ |
10.34 |
|
|
$ |
8.36 |
|
On February 21, 2018, the closing sales price of our Class A common stock on the NASDAQ Global Select Market was $13.35. As of February 21, 2018, there were 573 holders of record of our Class A common stock and two holders of record of our Class B common stock.
Dividend Policy
Our board of directors has authorized a dividend policy which provides that we expect to pay a cash dividend to our common stockholders based on our “post-tax adjusted earnings per fully diluted share.” Our board of directors declared a dividend of 18 cents per share for the fourth quarter of 2017 and has indicated that it expects to maintain such 18 cent quarterly dividend until the completion of the proposed distribution. The balance of any remaining adjusted earnings will be available to repurchase shares of our Class A common stock or redeem or purchase BGC Holdings limited partnership interests or other equity interests in our subsidiaries, including from Cantor, our executive officers, other employees, partners and others. Please see below for a detailed definition of “post-tax adjusted earnings per fully diluted share.”
Our board of directors and our Audit Committee have authorized repurchases of shares of our Class A common stock and redemptions of BGC Holdings limited partnership interests or other equity interests in us or in subsidiaries, including Newmark and its subsidiaries, from Cantor, our executive officers, other employees, partners and others. As of December 31, 2017, we had approximately $196.6 million remaining under this authorization and may continue to actively make repurchases or purchases, or cease to make such repurchases or purchases, from time to time.
We expect to pay such dividends, if and when declared by our board of directors, on a quarterly basis. The dividend to our common stockholders is expected to be calculated based on post-tax adjusted earnings allocated to us and generated over the fiscal quarter ending prior to the record date for the dividend. No assurance can be made, however, that a dividend will be paid each quarter.
The declaration, payment, timing and amount of any future dividends payable by us will be at the sole discretion of our board of directors. We are a holding company, with no direct operations, and therefore we are able to pay dividends only from our available cash on hand and funds received from distributions from BGC U.S. and BGC Global and dividends from Newmark. Our ability to pay dividends may also be limited by regulatory considerations as well as by covenants contained in financing or other agreements. In addition, under Delaware law, dividends may be payable only out of surplus, which is our net assets minus our capital (as defined under Delaware law), or, if we have no surplus, out of our net profits for the fiscal year in which the dividend is declared and/or the preceding fiscal year. Accordingly, any unanticipated accounting, tax, regulatory or other charges against net income may adversely affect our ability to declare dividends. While we intend to declare and pay dividends quarterly, there can be no assurance that our board of directors will declare dividends at all or on a regular basis or that the amount of our dividends will not change.
90
Share Repurchases and Unit Purchases
Our Board of Directors and our Audit Committee have authorized repurchases of our Class A common stock and redemptions of BGC Holdings limited partnership interests or other equity interests in our subsidiaries, including from Cantor, our executive officers, other employees, partners and others, including Cantor employees and partners. In February 2014, our Audit Committee authorized such repurchases of stock or units from Cantor employees and partners. On October 27, 2015, our Board of Directors and Audit Committee increased the share repurchase and unit redemption authorization to $300 million. On February 7, 2017, the Company’s, Board of Directors and Audit Committee again increased the Company’s share repurchase and unit redemption authorization to $300 million. As of December 31, 2017, we had approximately $196.6 million remaining from our share repurchase and unit redemption authorization. From time to time, we may actively continue to repurchase shares and/or redeem units.
During the year ended December 31, 2017, we repurchased 1,386,769 shares of our Class A common stock at an aggregate purchase price of approximately $16.8 million for an average price of $12.10 per share.
During the fourth quarter of 2017, we repurchased 140,404 shares of our Class A common stock at an aggregate purchase price of $2.2 million for an average price of $15.78 per share.
PERFORMANCE GRAPH
The performance graph below shows a comparison of the cumulative total stockholder return, on a net dividend reinvestment basis, of $100 invested on December 31, 2012, measured on December 31, 2013, December 31, 2014, December 31, 2015, December 31, 2016, and December 31, 2017. Peer Group 1 consists of Compagnie Financière Tradition SA, NEX Group plc, and TP ICAP plc. Peer Group 2 consists of CBRE Group Inc., Colliers International Group Inc., and Jones Lang LaSalle Inc. On June 2, 2015, First Service Corporation became Colliers International Group Inc. and spun off its residential property management and property services business into a separately traded public company. The stock performance of Colliers International Group Inc. before June 2, 2015 reflects the performance of the combined First Service Corporation. In December 2016, Tullett Prebon plc acquired ICAP plc’s global hybrid voice broking and information businesses. Also in December 2016, Tullett Prebon plc became TP ICAP plc and ICAP plc became NEX Group plc. The stock performance of TP ICAP plc before December 29, 2016 reflects the performance of Tullett Prebon plc. In addition, the stock performance of NEX Group plc prior to December 15, 2016 reflects the performance of ICAP plc. The returns of the peer group companies have been weighted according to their U.S. dollar stock market capitalization for purposes of arriving at a peer group average. Total returns are shown on a “net dividend” basis, which tax effects dividend reinvestments from companies operating under certain U.K. and European tax jurisdictions, according to local tax laws.
91
COMPARISON OF 5 YEAR CUMULATIVE TOTAL RETURN*
Among BGC Partners, Inc., the S&P 500 Index,
Peer Group 1 and Peer Group 2
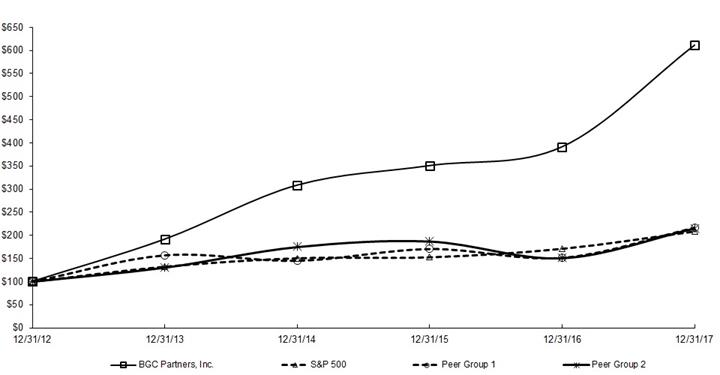
|
* |
$100 invested on 12/31/12 in stock or index, including reinvestment of dividends. |
Note: Peer group indices use beginning of period market capitalization weighting. The above graph was prepared by Zacks Investment Research, Inc. and used with their permission, all rights reserved, Copyright 1980-2018. S&P 500 is Copyright © 2018 S&P Dow Jones Indices LLC, a division of S&P Global, all rights reserved.
Partnership and Equity Repurchases
The following table details our share repurchase activity during the fourth quarter of 2017, including the total number of shares purchased, the average price paid per share, the number of shares repurchased as part of our publicly announced repurchase program and the approximate value that may yet be purchased under such program:
|
|
|
Total Number of Shares Purchased |
|
|
Average Price Paid per Share |
|
|
Total Number of Shares Purchased as Part of Publicly Announced Program |
|
|
Approximate Dollar Value of Shares that May Yet be Purchased Under the Program |
|
||||
|
October 1, 2017 through October 31, 2017 |
|
|
101,666 |
|
|
$ |
15.68 |
|
|
|
101,666 |
|
|
|
— |
|
|
November 1, 2017 through November 30, 2017 |
|
|
21,349 |
|
|
$ |
15.65 |
|
|
|
21,349 |
|
|
|
— |
|
|
December 1, 2017 through December 31, 2017 |
|
|
17,389 |
|
|
$ |
16.54 |
|
|
|
17,389 |
|
|
|
— |
|
|
Total |
|
|
140,404 |
|
|
$ |
15.78 |
|
|
|
140,404 |
|
|
$ |
195,577,825 |
|
Certain Definitions
We use non-GAAP financial measures including, but not limited to, “pre-tax adjusted earnings” and “post-tax adjusted earnings”, which are supplemental measures of operating results that are used by management to evaluate the financial performance of the Company and its consolidated subsidiaries. BGC believes that adjusted earnings best reflect the operating earnings generated by the Company on a consolidated basis and are the earnings which management considers when managing its business.
92
As compared with “income (loss) from operations before income taxes”, and “net income (loss) per fully diluted share”, all prepared in accordance with GAAP, adjusted earnings calculations primarily exclude certain non-cash items and other expenses that generally do not involve the receipt or outlay of cash by the Company and/or which do not dilute existing stockholders, as described below. In addition, adjusted earnings calculations exclude certain gains and charges that management believes do not best reflect the ordinary results of BGC.
Adjustments Made to Calculate Pre-Tax Adjusted Earnings
BGC defines pre-tax adjusted earnings as GAAP income (loss) from operations before income taxes and noncontrolling interest in subsidiaries excluding items, such as:
|
|
• |
Non-cash asset impairment charges, if any; |
|
|
• |
Allocations of net income to limited partnership units; |
|
|
• |
Non-cash charges related to the amortization of intangibles with respect to acquisitions; and |
|
|
• |
Non-cash charges relating to grants of exchangeability to limited partnership units that reflect the value of the shares of common stock into which the unit is exchangeable when the unit holder is granted exchangeability not previously expensed in accordance with GAAP. |
Virtually all of BGC’s key executives and producers have partnership or equity stakes in the Company and receive deferred equity or limited partnership units as part of their compensation. A significant percentage of the Company’s fully diluted shares are owned by its executives, partners and employees. The Company issues limited partnership units and grant exchangeability to unit holders to provide liquidity to its employees, to align the interests of its employees and management with those of common stockholders, to help motivate and retain key employees, and to encourage a collaborative culture that drives cross-selling and revenue growth.
When the Company issues limited partnership units, the shares of common stock into which the units can be ultimately exchanged are included in BGC’s fully diluted share count for Adjusted Earnings at the beginning of the subsequent quarter after the date of grant. BGC includes such shares in the Company’s fully diluted share count when the unit is granted because the unit holder is expected to be paid a pro-rata distribution based on BGC’s calculation of Adjusted Earnings per fully diluted share and because the holder could be granted the ability to exchange their units into shares of common stock in the future. Non-cash charges with respect to grants of exchangeability reflect the value of the shares of common stock into which the unit is exchangeable when the unit holder is granted exchangeability not previously expensed in accordance with GAAP. The amount of non-cash charges relating to grants of exchangeability the Company uses to calculate pre-tax.
Adjusted Earnings on a quarterly basis is based upon the Company’s estimate of expected grants of exchangeability to limited partnership units during the annual period, as described further below under “Adjustments Made to Calculate Post-Tax Adjusted Earnings.”
Adjusted Earnings also excludes non-cash GAAP gains attributable to originated mortgage servicing rights (which the Company refers to as “OMSRs”) and non-cash GAAP amortization of mortgage servicing rights (which the Company refers to as “MSRs”). Under GAAP, the Company recognizes OMSRs gains equal to the fair value of servicing rights retained on mortgage loans originated and sold. Subsequent to the initial recognition at fair value, MSRs are carried at the lower of amortized cost or fair value and amortized in proportion to the net servicing revenue expected to be earned. However, it is expected that any cash received with respect to these servicing rights, net of associated expenses, will increase Adjusted Earnings (and Adjusted EBITDA) in future periods.
Additionally, Adjusted Earnings calculations exclude certain unusual, one-time, non-ordinary or non-recurring items, if any. These items are excluded from Adjusted Earnings because the Company views excluding such items as a better reflection of the ongoing operations of BGC. BGC’s definition of Adjusted Earnings also excludes certain gains and charges with respect to acquisitions, dispositions, or resolutions of litigation. Management believes that excluding such gains and charges also best reflects the ongoing performance of BGC.
Recognition of Nasdaq Earn-out Payments
Consistent with Newmark’s methodology of recognizing income related to the receipt of Nasdaq earn-out payments in the third quarter under GAAP, beginning with the first quarter of 2018, BGC will recognize the receipt of Nasdaq earn-out payments when earned in the third quarter for Adjusted Earnings instead of pro-rating over four quarters. This GAAP methodology will lead to earlier recognition of the Nasdaq income under Adjusted Earnings.
93
Adjustments Made to Calculate Post-Tax Adjusted Earnings
Because Adjusted Earnings are calculated on a pre-tax basis, BGC also intends to report post-tax Adjusted Earnings on a consolidated basis. The Company defines post-tax Adjusted Earnings as pre-tax Adjusted Earnings reduced by the non-GAAP tax provision described below and Adjusted Earnings attributable to noncontrolling interest in subsidiaries.
The Company calculates its tax provision for post-tax Adjusted Earnings using an annual estimate similar to how it accounts for its income tax provision under GAAP. To calculate the quarterly tax provision under GAAP, BGC estimates its full fiscal year GAAP income (loss) from operations before income taxes and noncontrolling interests in subsidiaries and the expected inclusions and deductions for income tax purposes, including expected grants of exchangeability to limited partnership units during the annual period. The resulting annualized tax rate is applied to BGC’s quarterly GAAP income (loss) from operations before income taxes and noncontrolling interests in subsidiaries. At the end of the annual period, the Company updates its estimate to reflect the actual tax amounts owed for the period.
To determine the non-GAAP tax provision, BGC first adjusts pre-tax Adjusted Earnings by recognizing any, and only, amounts for which a tax deduction applies under applicable law. The amounts include non-cash charges with respect to grants of exchangeability; certain charges related to employee loan forgiveness; certain net operating loss carryforwards when taken for statutory purposes; certain charges related to tax goodwill amortization; and deductions with respect to charitable contributions. These adjustments may also reflect timing and measurement differences, including treatment of employee loans, changes in the value of units between the dates of grants of exchangeability and the date of actual unit exchange, variations in the value of certain deferred tax assets and liabilities and the different timing of permitted deductions for tax under GAAP and statutory tax requirements.
After application of these previously described adjustments, the result is the Company’s taxable income for its pre-tax Adjusted Earnings, to which BGC then applies the statutory tax rates. This amount is the Company’s non-GAAP tax provision. BGC views the effective tax rate on pre-tax Adjusted Earnings as equal to the amount of its non-GAAP tax provision divided by the amount of pre-tax Adjusted Earnings.
Generally, the most significant factor affecting this non-GAAP tax provision is the amount of non-cash charges relating to the grants of exchangeability to limited partnership units. Because the non-cash charges relating to the grants of exchangeability are deductible in accordance with applicable tax laws, increases in exchangeability have the effect of lowering the Company’s non-GAAP effective tax rate and thereby increasing its post-tax Adjusted Earnings.
Management uses post-tax Adjusted Earnings in part to help it evaluate, among other things, the overall performance of the business, to make decisions with respect to the Company’s operations, and to determine the amount of dividends payable to common stockholders and distributions payable to holders of limited partnership units.
BGC incurs income tax expenses based on the location, legal structure and jurisdictional taxing authorities of each of its subsidiaries. Certain of the Company’s entities are taxed as U.S. partnerships and are subject to the Unincorporated Business Tax (“UBT”) in New York City. Any U.S. federal and state income tax liability or benefit related to the partnership income or loss, with the exception of UBT, rests with the unit holders rather than with the partnership entity. The Company’s consolidated financial statements include U.S. federal, state and local income taxes on the Company’s allocable share of the U.S. results of operations. Outside of the U.S., BGC operates principally through subsidiary corporations subject to local income taxes. For these reasons, taxes for Adjusted Earnings are expected to be presented to show the tax provision the consolidated Company would expect to pay if 100 percent of earnings were taxed at global corporate rates.
Adjusted Earnings Attributable to Noncontrolling Interest in Subsidiaries
Adjusted Earnings attributable to noncontrolling interest in subsidiaries is calculated based on the relevant noncontrolling interest existing on the balance sheet date. Following the Newmark IPO, noncontrolling interests will exist for Newmark, and on the issuance of additional standalone units for BGC Holdings and Newmark Holdings, because relevant units/shares may have different economic entitlements to common stock of BGC Partners.
Calculations of Pre-Tax and Post-Tax Adjusted Earnings per Common Share
BGC’s Adjusted Earnings per common share calculations assume either that:
|
|
• |
The fully diluted share count includes the shares related to any dilutive instruments, but excludes the associated expense, net of tax, when the impact would be dilutive; or |
|
|
• |
The fully diluted share count excludes the shares related to these instruments, but includes the associated expense, net of tax. |
94
The share count for Adjusted Earnings excludes certain shares expected to be issued in future periods but not yet eligible to receive dividends and/or distributions. Each quarter, the dividend payable to BGC’s common stockholders, if any, is expected to be determined by the Company’s Board of Directors with reference to a number of factors, including post-tax Adjusted Earnings per common share. BGC may also pay a pro-rata distribution of net income to limited partnership units, as well as to Cantor for its noncontrolling interest. The amount of this net income, and therefore of these payments per unit, would be determined using the above definition of post-tax Adjusted Earnings per common share.
The declaration, payment, timing and amount of any future dividends payable by the Company will be at the discretion of its board of directors.
Other Matters with Respect to Adjusted Earnings
The term “Adjusted Earnings” should not be considered in isolation or as an alternative to GAAP net income (loss). The Company views Adjusted Earnings as a metric that is not indicative of liquidity or the cash available to fund its operations, but rather as a performance measure. Pre- and post-tax Adjusted Earnings are not intended to replace the Company’s presentation of its GAAP financial results. However, management believes that these measures help provide investors with a clearer understanding of BGC’s financial performance and offer useful information to both management and investors regarding certain financial and business trends related to the Company’s financial condition and results of operations. Management believes that Adjusted Earnings measures and the GAAP measures of financial performance should be considered together.
BGC anticipates providing forward-looking guidance for GAAP revenues and for certain Adjusted Earnings measures from time to time. However, the Company does not anticipate providing an outlook for other GAAP results. This is because certain GAAP items, which are excluded from Adjusted Earnings, are difficult to forecast with precision before the end of each period. The Company therefore believes that it is not possible to forecast GAAP results or to quantitatively reconcile GAAP results to non-GAAP results with sufficient precision unless BGC makes unreasonable efforts. The items that are difficult to predict on a quarterly basis with precision and which can have a material impact on the Company’s GAAP results include, but are not limited, to the following:
|
|
• |
Allocations of net income and grants of exchangeability to limited partnership units, which are determined at the discretion of management throughout and up to the period-end; |
|
|
• |
The impact of certain marketable securities, as well as any gains or losses related to associated mark-to- market movements and/or hedging. These items are calculated using period-end closing prices; |
|
|
• |
Non-cash asset impairment charges, which are calculated and analyzed based on the period-end values of the underlying assets. These amounts may not be known until after period-end; and |
|
|
• |
Acquisitions, dispositions and/or resolutions of litigation which are fluid and unpredictable in nature. |
Adjusted EBITDA and Adjusted EBITDA Before Allocations to Units Defined
BGC also provides an additional non-GAAP financial performance measure, “Adjusted EBITDA”, which it defines as GAAP “Net income (loss) available to common stockholders”, adjusted to add back the following items:
|
|
• |
Interest expense; |
|
|
• |
Fixed asset depreciation and intangible asset amortization; |
|
|
• |
Impairment charges; |
|
|
• |
Employee loan amortization and reserves on employee loans; |
|
|
• |
Provision (benefit) for income taxes; |
|
|
• |
Net income (loss) attributable to noncontrolling interest in subsidiaries; |
|
|
• |
Non-cash charges relating to grants of exchangeability to limited partnership interests; |
|
|
• |
Non-cash charges related to issuance of restricted shares; |
|
|
• |
Non-cash earnings or losses related to BGC’s equity investments; and |
|
|
• |
Net non-cash GAAP gains related to OMSR gains and MSR amortization |
The Company also discloses “Adjusted EBITDA before allocations to units”, which is Adjusted EBITDA excluding GAAP charges with respect to allocations of net income to limited partnership units. Such allocations represent the pro-rata portion of pre-tax earnings available to such unit holders. These units are in the fully diluted share count, and are exchangeable on a one-to-one
95
basis into common stock. As these units are exchanged into common shares, unit holders become entitled to cash dividends rather than cash distributions. The Company views such allocations as intellectually similar to dividends on common shares. Because dividends paid to common shares are not an expense under GAAP, management believes similar allocations of income to unit holders should also be excluded by investors when analyzing BGC’s results on a fully diluted share basis with respect to Adjusted EBITDA.
The Company’s management believes that these Adjusted EBITDA measures are useful in evaluating BGC’s operating performance, because the calculation of this measure generally eliminates the effects of financing and income taxes and the accounting effects of capital spending and acquisitions, which would include impairment charges of goodwill and intangibles created from acquisitions. Such items may vary for different companies for reasons unrelated to overall operating performance. As a result, the Company’s management uses these measures to evaluate operating performance and for other discretionary purposes. BGC believes that Adjusted EBITDA is useful to investors to assist them in getting a more complete picture of the Company’s financial results and operations.
Since these Adjusted EBITDA measures are not recognized measurements under GAAP, investors should use these measures in addition to GAAP measures of net income when analyzing BGC’s operating performance. Because not all companies use identical EBITDA calculations, the Company’s presentation of these Adjusted EBITDA measures are may not be comparable to similarly titled measures of other companies. Furthermore, these Adjusted EBITDA measures are not intended to be a measure of free cash flow or GAAP cash flow from operations, because these Adjusted EBITDA measures do not consider certain cash requirements, such as tax and debt service payments.
For a reconciliation of these non-GAAP measures to GAAP “Net income (loss) available to common stockholders”, the most comparable financial measure calculated and presented in accordance with GAAP, see the section of BGC’s most recent financial results press release titled “Reconciliation of GAAP Income (Loss) to Adjusted EBITDA”.
Liquidity Defined
BGC also uses a non-GAAP measure called “liquidity”. The Company considers liquidity to be comprised of the sum of cash and cash equivalents plus marketable securities that have not been financed, reverse repurchase agreements, and securities owned, less securities loaned and repurchase agreements. BGC considers this an important metric for determining the amount of cash that is available or that could be readily available to the Company on short notice.
96
The following table sets forth selected consolidated financial data for the last five years ended December 31, 2017. This selected consolidated financial data should be read in conjunction with “Item 7—Management’s Discussion and Analysis of Financial Condition and Results of Operations” and our Consolidated Financial Statements and the accompanying Notes thereto included elsewhere in this Annual Report on Form 10-K. Amounts in thousands, except per share data.
|
|
|
Year Ended December 31, |
|
|||||||||||||||||
|
|
|
20171, 2, 3, 4 |
|
|
20161, 2, 3, 4, 5 |
|
|
20151, 2, 3, 4, 5, 6 |
|
|
20141, 2, 3, 5 |
|
|
20131, 2, 5, 7 |
|
|||||
|
Consolidated Statements of Operations Data: |
|
|
|
|
|
|
|
|
|
|
|
|
|
|
|
|
|
|
|
|
|
Revenues: |
|
|
|
|
|
|
|
|
|
|
|
|
|
|
|
|
|
|
|
|
|
Commissions |
|
$ |
2,348,108 |
|
|
$ |
1,985,667 |
|
|
$ |
1,929,913 |
|
|
$ |
1,307,684 |
|
|
$ |
1,202,244 |
|
|
Principal transactions |
|
|
317,856 |
|
|
|
325,481 |
|
|
|
313,142 |
|
|
|
253,951 |
|
|
|
309,908 |
|
|
Total brokerage revenues |
|
|
2,665,964 |
|
|
|
2,311,148 |
|
|
|
2,243,055 |
|
|
|
1,561,635 |
|
|
|
1,512,152 |
|
|
Gains from mortgage banking activities, net |
|
|
205,999 |
|
|
|
193,387 |
|
|
|
115,304 |
|
|
|
79,751 |
|
|
|
— |
|
|
Real estate management and other services |
|
|
233,063 |
|
|
|
196,801 |
|
|
|
187,118 |
|
|
|
163,227 |
|
|
|
163,353 |
|
|
Servicing fees |
|
|
110,441 |
|
|
|
87,671 |
|
|
|
74,356 |
|
|
|
49,053 |
|
|
|
— |
|
|
Fees from related parties |
|
|
28,467 |
|
|
|
25,570 |
|
|
|
26,843 |
|
|
|
29,301 |
|
|
|
41,128 |
|
|
Data, software and post-trade |
|
|
54,557 |
|
|
|
54,309 |
|
|
|
102,371 |
|
|
|
11,565 |
|
|
|
16,821 |
|
|
Interest income |
|
|
51,103 |
|
|
|
33,876 |
|
|
|
24,742 |
|
|
|
14,658 |
|
|
|
6,833 |
|
|
Other revenues |
|
|
3,762 |
|
|
|
5,334 |
|
|
|
9,957 |
|
|
|
17,291 |
|
|
|
5,177 |
|
|
Total revenues |
|
|
3,353,356 |
|
|
|
2,908,096 |
|
|
|
2,783,746 |
|
|
|
1,926,481 |
|
|
|
1,745,464 |
|
|
Expenses: |
|
|
|
|
|
|
|
|
|
|
|
|
|
|
|
|
|
|
|
|
|
Compensation and employee benefits |
|
|
2,016,180 |
|
|
|
1,733,207 |
|
|
|
1,759,855 |
|
|
|
1,172,481 |
|
|
|
1,257,364 |
|
|
Allocations of net income and grant of exchangeability to LPUs and FPUs |
|
|
286,628 |
|
|
|
192,934 |
|
|
|
259,639 |
|
|
|
136,633 |
|
|
|
423,589 |
|
|
Total compensation and employee benefits |
|
|
2,302,808 |
|
|
|
1,926,141 |
|
|
|
2,019,494 |
|
|
|
1,309,114 |
|
|
|
1,680,953 |
|
|
Other expenses |
|
|
923,245 |
|
|
|
775,585 |
|
|
|
845,128 |
|
|
|
633,137 |
|
|
|
557,586 |
|
|
Total expenses |
|
|
3,226,053 |
|
|
|
2,701,726 |
|
|
|
2,864,622 |
|
|
|
1,942,251 |
|
|
|
2,238,539 |
|
|
Other income (losses), net: |
|
|
|
|
|
|
|
|
|
|
|
|
|
|
|
|
|
|
|
|
|
Gain (loss) on divestiture and sale of investments |
|
|
561 |
|
|
|
7,044 |
|
|
|
394,347 |
|
|
|
— |
|
|
|
723,147 |
|
|
Gains (losses) on equity method investments |
|
|
6,189 |
|
|
|
3,543 |
|
|
|
2,597 |
|
|
|
(7,969 |
) |
|
|
(9,508 |
) |
|
Other income (loss) |
|
|
97,944 |
|
|
|
97,213 |
|
|
|
122,708 |
|
|
|
48,842 |
|
|
|
39,466 |
|
|
Total other income (losses), net |
|
|
104,694 |
|
|
|
107,800 |
|
|
|
519,652 |
|
|
|
40,873 |
|
|
|
753,105 |
|
|
Income (loss) from operations before income taxes |
|
|
231,997 |
|
|
|
314,170 |
|
|
|
438,776 |
|
|
|
25,103 |
|
|
|
260,030 |
|
|
Provision (benefit) for income taxes |
|
|
150,268 |
|
|
|
60,332 |
|
|
|
120,619 |
|
|
|
741 |
|
|
|
92,166 |
|
|
Consolidated net income (loss) |
|
|
81,729 |
|
|
|
253,838 |
|
|
|
318,157 |
|
|
|
24,362 |
|
|
|
167,864 |
|
|
Less: Net income (loss) attributable to noncontrolling interest in subsidiaries |
|
|
30,254 |
|
|
|
68,816 |
|
|
|
158,198 |
|
|
|
1,491 |
|
|
|
101,001 |
|
|
Net income (loss) available to common stockholders |
|
$ |
51,475 |
|
|
$ |
185,022 |
|
|
$ |
159,959 |
|
|
$ |
22,871 |
|
|
$ |
66,863 |
|
|
Per share data: |
|
|
|
|
|
|
|
|
|
|
|
|
|
|
|
|
|
|
|
|
|
Basic earnings per share |
|
$ |
0.18 |
|
|
$ |
0.67 |
|
|
$ |
0.66 |
|
|
$ |
0.10 |
|
|
$ |
0.35 |
|
|
Fully diluted earnings per share |
|
$ |
0.17 |
|
|
$ |
0.65 |
|
|
$ |
0.62 |
|
|
$ |
0.10 |
|
|
$ |
0.34 |
|
|
Basic weighted-average shares of common stock outstanding |
|
|
287,378 |
|
|
|
277,073 |
|
|
|
243,460 |
|
|
|
220,697 |
|
|
|
193,694 |
|
|
Fully diluted weighted-average shares of common stock outstanding |
|
|
454,256 |
|
|
|
433,226 |
|
|
|
286,322 |
|
|
|
328,455 |
|
|
|
216,565 |
|
|
Dividends declared per share of common stock |
|
$ |
0.70 |
|
|
$ |
0.62 |
|
|
$ |
0.54 |
|
|
$ |
0.48 |
|
|
$ |
0.48 |
|
|
Dividends declared and paid per share of common stock |
|
$ |
0.70 |
|
|
$ |
0.62 |
|
|
$ |
0.54 |
|
|
$ |
0.48 |
|
|
$ |
0.48 |
|
|
Cash and cash equivalents |
|
$ |
634,333 |
|
|
$ |
535,613 |
|
|
$ |
563,028 |
|
|
$ |
710,751 |
|
|
$ |
716,973 |
|
|
Total assets |
|
$ |
5,457,130 |
|
|
$ |
5,047,586 |
|
|
$ |
4,783,324 |
|
|
$ |
3,914,125 |
|
|
$ |
2,082,420 |
|
|
Long-term debt and collateralized borrowings |
|
$ |
1,650,509 |
|
|
$ |
965,767 |
|
|
$ |
840,877 |
|
|
$ |
556,700 |
|
|
$ |
258,356 |
|
|
Notes payable to related parties |
|
$ |
— |
|
|
$ |
690,000 |
|
|
$ |
— |
|
|
$ |
150,000 |
|
|
$ |
150,000 |
|
|
Total liabilities |
|
$ |
4,270,974 |
|
|
$ |
3,361,469 |
|
|
$ |
3,139,644 |
|
|
$ |
2,977,692 |
|
|
$ |
1,316,772 |
|
|
Total stockholders’ equity |
|
$ |
633,886 |
|
|
$ |
1,183,560 |
|
|
$ |
893,972 |
|
|
$ |
611,785 |
|
|
$ |
460,307 |
|
|
1 |
Periods after June 28, 2013 reflect the Company’s divestiture of its on-the-run, electronic benchmark U.S. Treasury platform to NASDAQ on June 28, 2013. |
|
2 |
Amounts include the gain related to the earn-out associated with the NASDAQ transaction. |
|
3 |
Financial results have been retrospectively adjusted to include the financial results of Berkeley Point. |
97
|
4 |
On February 26, 2015, the Company completed the acquisition of GFI. The information includes the results of GFI following the acquisition. |
|
5 |
Financial results have been retrospectively adjusted to include the financial results of Lucera. |
|
6 |
Amounts include gains related to the Company’s sale of all of the equity interests in the entities that made up the Trayport business to Intercontinental Stock Exchange, Inc. on December 11, 2015. |
|
7 |
Amounts include gains related to the Company’s divestiture of its on-the-run, electronic benchmark U.S. Treasury platform to NASDAQ on June 28, 2013. |
98
The following discussion of BGC Partners, Inc.’s financial condition and results of operations should be read together with BGC Partners, Inc.’s consolidated financial statements and notes to those statements, as well as the cautionary statements relating to forward-looking statements within the meaning of Section 27A of the Securities Act of 1933, as amended (the “Securities Act”), and Section 21E of the Securities Exchange Act of 1934, as amended (the “Exchange Act”), included in this report. When used herein, the terms “BGC Partners,” “BGC,” the “Company,” “we,” “us” and “our” refer to BGC Partners, Inc., including consolidated subsidiaries.
This discussion summarizes the significant factors affecting our results of operations and financial condition during the years ended December 31, 2017 and 2016. This discussion is provided to increase the understanding of, and should be read in conjunction with, our consolidated financial statements and the notes thereto included elsewhere in this report.
OVERVIEW AND BUSINESS ENVIRONMENT
We are a leading global brokerage company servicing the financial and real estate markets through our Financial Services and Real Estate Services businesses. Through brands including BGC, GFI, Sunrise, Besso, and R.P. Martin, among others, our Financial Services business specializes in the brokerage of a broad range of products, including fixed income (rates and credit), foreign exchange, equities, energy and commodities, insurance, and futures. Our Financial Services business also provides a wide range of services, including trade execution, broker-dealer services, clearing, trade compression, post trade, information, and other back-office services to a broad range of financial and non-financial institutions. Our integrated platform is designed to provide flexibility to customers with regard to price discovery, execution and processing of transactions, and enables them to use voice, hybrid, or in many markets, fully electronic brokerage services in connection with transactions executed either over-the-counter (“OTC”) or through an exchange. Through our electronic brands including FENICS, BGC Trader, FENICS Market Data, BGC Market Data, Capitalab, and Lucera, we offer fully electronic brokerage, financial technology solutions, market data, post-trade services and analytics related to financial instruments and markets.
We offer Real Estate Services through our publicly traded subsidiary, Newmark Group, Inc. (“Newmark”). Newmark completed its initial public offering (which we refer to as the “Newmark IPO”) on December 19, 2017, and its Class A common stock trades on the NASDAQ Global Select Market under the ticker symbol “NMRK.” Newmark’s brands include Newmark Knight Frank, Newmark Cornish & Carey, Apartment Realty Advisors (“ARA”), Computerized Facility Integration, and Excess Space Retail Services, Inc. Newmark is a full-service commercial real estate services business that offers a complete suite of services and products for both owners and occupiers across the entire commercial real estate industry. Newmark’s investor/owner services and products include investment sales, agency leasing, property management, valuation and advisory, diligence and underwriting and, under other trademarks and names like Berkeley Point and NKF Capital Markets, government sponsored enterprise (“GSE”) lending, loan servicing, debt and structured finance and loan sales. Newmark’s occupier services and products include tenant representation, global corporate services, real estate management technology systems, workplace and occupancy strategy, consulting, project management, lease administration and facilities management. Newmark enhances these services and products through innovative real estate technology solutions and data analytics designed to enable its clients to increase their efficiency and profits by optimizing their real estate portfolio. Newmark has relationships with many of the world’s largest commercial property owners, real estate developers and investors, as well as Fortune 500 and Forbes Global 2000 companies.
BGC, BGC Trader, GFI, FENICS, FENICS.COM, Capitalab, Swaptioniser, ColleX, Newmark, Grubb & Ellis, ARA, Computerized Facility Integration, Landauer, Lucera, Excess Space, Excess Space Retail Services, Inc., Berkeley Point and Grubb are trademarks/service marks, and/or registered trademarks/service marks of BGC Partners, Inc. and/or its affiliates. Knight Frank is a service mark of Knight Frank (Nominees) Limited.
Our customers include many of the world’s largest banks, broker-dealers, investment banks, trading firms, hedge funds, governments, corporations, property owners, real estate developers and investment firms. BGC Partners has more than 100 offices globally in major markets including New York and London, as well as in Atlanta, Beijing, Bogotá, Boston, Buenos Aires, Charlotte, Chicago, Copenhagen, Dallas, Denver, Dubai, Dublin, Geneva, Hong Kong, Houston, Istanbul, Johannesburg, Los Angeles, Madrid, Mexico City, Miami, Moscow, Nyon, Paris, Philadelphia, Rio de Janeiro, San Francisco, Santa Clara, Santiago, São Paulo, Seoul, Shanghai, Singapore, Sydney, Tel Aviv, Tokyo, Toronto, and Washington, D.C.
As of December 31, 2017, we had over 4,000 brokers, salespeople, managers and other front-office personnel across all of our businesses.
99
Berkeley Point Acquisition and Related Transactions
On July 18, 2017 the Company announced that it had agreed to acquire Berkeley Point Financial LLC and its subsidiary (together referred to as “Berkeley Point” or “BPF”) from an affiliate of Cantor Fitzgerald, L.P. (“Cantor”). This affiliate of Cantor had acquired Berkeley Point on April 10, 2014. Berkeley Point is a leading commercial real estate finance company focused on the origination and sale of multifamily and other commercial real estate loans through government-sponsored and government-funded loan programs, as well as the servicing of commercial real estate loans, including those it originates. The Company’s Board of Directors, upon the unanimous recommendation of a Special Committee consisting of all four independent directors, assisted by independent advisors, unanimously approved the acquisition of Berkeley Point and the related transactions. The acquisition of Berkeley Point was completed on September 8, 2017. The total consideration for the acquisition of Berkeley Point was $875 million, subject to certain adjustments at closing. We believe that the addition of Berkeley Point will significantly increase the scale and scope of our Real Estate Services business and generate substantial revenue synergies.
This transaction has been determined to be a combination of entities under common control that resulted in a change in the reporting entity. Accordingly, our financial results have been recast to include the financial results of Berkeley Point in the current and prior periods as if Berkeley Point had always been consolidated.
The following tables summarize the impact of the Berkeley Point Acquisition to the Company’s consolidated statement of financial condition as of December 31, 2016 and to the Company’s consolidated statements of operations for the years ended December 31, 2016 and 2015 (in thousands, except per share amounts):
|
|
|
December 31, 2016 |
|
|||||||||
|
|
|
As Previously Reported |
|
|
Retrospective Adjustments |
|
|
As Retrospectively Adjusted |
|
|||
|
Total assets |
|
$ |
3,508,400 |
|
|
$ |
1,539,186 |
|
|
$ |
5,047,586 |
|
|
Total liabilities |
|
|
2,302,085 |
|
|
|
1,059,384 |
|
|
|
3,361,469 |
|
|
Total equity |
|
|
1,153,738 |
|
|
|
479,802 |
|
|
|
1,633,540 |
|
|
Total liabilities, redeemable partnership interest, and equity |
|
|
3,508,400 |
|
|
|
1,539,186 |
|
|
|
5,047,586 |
|
|
|
|
Year Ended December 31, 2016 |
|
|
Year Ended December 31, 2015 |
|
||||||||||||||||||
|
|
|
As Previously Reported |
|
|
Retrospective Adjustments |
|
|
As Retrospectively Adjusted |
|
|
As Previously Reported |
|
|
Retrospective Adjustments |
|
|
As Retrospectively Adjusted |
|
||||||
|
Income (loss) from operations before income taxes |
|
$ |
188,260 |
|
|
$ |
125,910 |
|
|
$ |
314,170 |
|
|
$ |
380,611 |
|
|
$ |
58,165 |
|
|
$ |
438,776 |
|
|
Consolidated net income (loss) |
|
|
128,008 |
|
|
|
125,830 |
|
|
|
253,838 |
|
|
|
260,115 |
|
|
|
58,042 |
|
|
|
318,157 |
|
|
Net income (loss) attributable to noncontrolling interest in subsidiaries |
|
|
25,531 |
|
|
|
43,285 |
|
|
|
68,816 |
|
|
|
138,797 |
|
|
|
19,401 |
|
|
|
158,198 |
|
|
Net income (loss) available to common stockholders |
|
|
102,477 |
|
|
|
82,545 |
|
|
|
185,022 |
|
|
|
121,318 |
|
|
|
38,641 |
|
|
|
159,959 |
|
|
Basic earnings (loss) per share |
|
|
0.37 |
|
|
|
0.30 |
|
|
|
0.67 |
|
|
|
0.50 |
|
|
|
0.16 |
|
|
|
0.66 |
|
|
Diluted earnings (loss) per share |
|
|
0.36 |
|
|
|
0.29 |
|
|
|
0.65 |
|
|
|
0.48 |
|
|
|
0.14 |
|
|
|
0.62 |
|
Newmark Initial Public Offering
On December 13, 2017, prior to the closing of the Newmark IPO, BGC, BGC Holdings, L.P. (“BGC Holdings”), BGC Partners, L.P. (“BGC U.S. OpCo”), Newmark, Newmark Holdings, L.P. (“Newmark Holdings”), Newmark Partners, L.P. (“Newmark OpCo”) and, solely for the provisions listed therein, Cantor and BGC Global Holdings, L.P. (“BGC Global OpCo”) entered into a Separation and Distribution Agreement (the “Separation and Distribution Agreement”). The Separation and Distribution Agreement sets forth the agreements among BGC, Cantor, Newmark and their respective subsidiaries regarding, among other things:
|
|
• |
the principal corporate transactions pursuant to which BGC, BGC Holdings and BGC U.S. OpCo and their respective subsidiaries (other than the Newmark Group (defined below), the “BGC Group”) transferred to Newmark, Newmark Holdings and Newmark OpCo and their respective subsidiaries (the “Newmark Group”) the assets and liabilities of the BGC Group relating to BGC’s Real Estate Services business (the “Separation”); |
|
|
• |
the proportional distribution of interests in Newmark Holdings to holders of interests in BGC Holdings; |
|
|
• |
the Newmark IPO; |
|
|
• |
the assumption and repayment of indebtedness by the BGC Group and the Newmark Group, as further described below; |
100
|
|
• |
other agreements governing the relationship between BGC, Newmark and Cantor. |
In connection with the Separation and the Newmark IPO, on December 13, 2017, the applicable parties entered into the following additional agreements:
|
|
• |
an Amended and Restated Agreement of Limited Partnership of Newmark Holdings, dated as of December 13, 2017; |
|
|
• |
an Amended and Restated Agreement of Limited Partnership of Newmark OpCo, dated as of December 13, 2017; |
|
|
• |
a Second Amended and Restated Agreement of Limited Partnership of BGC U.S. OpCo, dated as of December 13, 2017; |
|
|
• |
a Second Amended and Restated Agreement of Limited Partnership of BGC Global OpCo, dated as of December 13, 2017; |
|
|
• |
a Registration Rights Agreement, dated as of December 13, 2017, by and among Cantor, BGC and Newmark; |
|
|
• |
a Transition Services Agreement, dated as of December 13, 2017, by and between BGC and Newmark; |
|
|
• |
a Tax Matters Agreement, dated as of December 13, 2017, by and among BGC, BGC Holdings, BGC U.S. OpCo, Newmark, Newmark Holdings and Newmark OpCo; |
|
|
• |
an Amended and Restated Tax Receivable Agreement, dated as of December 13, 2017, by and between Cantor and BGC; |
|
|
• |
an Exchange Agreement, dated as of December 13, 2017, by and among Cantor, BGC and Newmark; |
|
|
• |
an Administrative Services Agreement, dated as of December 13, 2017, by and between Cantor and Newmark; and |
|
|
• |
a Tax Receivable Agreement, dated as of December 13, 2017, by and between Cantor and Newmark. |
Newmark is a holding company with no direct operations and conducts substantially all of its operations through its operating subsidiaries. Virtually all of Newmark’s consolidated net assets and net income are those of consolidated variable interest entities. Newmark Holdings, L.P. (“Newmark Holdings”) is a consolidated subsidiary of Newmark for which Newmark is the general partner. Newmark and Newmark Holdings jointly own Newmark Partners, L.P. (“Newmark OpCo), the operating partnership.
Immediately prior to the completion of the Newmark IPO, the Company entered into a separation and distribution agreement with Cantor, Newmark, Newmark Holdings, Newmark OpCo, BGC Holdings, BGC U.S. OpCo, and BGC Global OpCo. As a result of the separation and distribution agreement, the limited partnership interests in Newmark Holdings were distributed to the holders of limited partnership interests in BGC Holdings, whereby each holder of BGC Holdings limited partnership interests at that time will hold a BGC Holdings limited partnership interest and a corresponding Newmark Holdings limited partnership interest, which is equal to a BGC Holdings limited partnership interest multiplied by one divided by 2.2 (the “contribution ratio”), divided by the exchange ratio (which is the ratio by which a Newmark Holdings limited partnership interest can be exchanged for a number of Newmark Class A common stock). Initially, the exchange ratio will equal one, so that each Newmark Holdings limited partnership interest is exchangeable for one Newmark Class A common stock. For reinvestment, acquisition or other purposes, Newmark may determine on a quarterly basis to distribute to its stockholders a smaller percentage than Newmark Holdings distributes to its equity holders (excluding tax distributions from Newmark Holdings) of cash that it received from Newmark OpCo. In such circumstances, the Separation and Distribution Agreement provides that the exchange ratio will be reduced to reflect the amount of additional cash retained by Newmark as a result of the distribution of such smaller percentage, after the payment of taxes.
On December 19, 2017, Newmark Group, Inc. (“Newmark”) closed its initial public offering (“IPO”) of 20 million shares of Newmark’s Class A common stock at a price to the public of $14.00 per share. A registration statement relating to these securities was filed with, and declared effective by, the U.S. Securities and Exchange Commission. In addition, Newmark granted the underwriters a 30-day option to purchase up to an additional 3 million shares of Newmark's Class A common stock at the IPO price, less underwriting discounts and commissions (“the overallotment option”). Subsequent to the IPO, the underwriters exercised this option in full. Upon the closing of the overallotment option, which occurred on December 26, 2017, Newmark’s public stockholders owned approximately 9.8% of Newmark’s 234.2 million fully diluted shares outstanding. Newmark received aggregate net proceeds of $295.4 million from the IPO, after deducting underwriting discounts and commissions and estimated offering expenses.
101
Accordingly, our financial results reflect the agreements discussed above related to the Newmark IPO.
BGC currently expects to pursue a Distribution (or “spin-off”) to its common stockholders of all the Class A shares and Class B shares of Newmark common stock that it then owns in a manner intended to qualify as generally tax-free for U.S. federal income tax purposes. The Newmark common shares owned by BGC are subject to a 180-day “lock-up” restriction contained in the underwriting agreement for the Newmark IPO. The Distribution is subject to a number of conditions, and BGC may determine not to proceed with the Distribution if the BGC board of directors determines, in its sole discretion, that the Distribution is not in the best interest of the Company and its stockholders. Accordingly, the Distribution may not occur on the expected timeframe, or at all.
Lucera Acquisition
On November 4, 2016, we acquired from Cantor the 80% of the Lucera business (also known as “LFI Holdings, LLC” or “LFI”) not already owned by us. The aggregate purchase price paid by the Company to Cantor consisted of approximately $24.2 million in cash plus a $4.8 million post-closing adjustment. Lucera is a technology infrastructure provider tailored to the financial sector headquartered in New York. The acquisition was determined to be a combination of entities under common control that resulted in a change in the reporting entity. Accordingly, our financial results have been recast to include those of Lucera from its formation in 2013 as if it had always been consolidated.
Acquisition of GFI Group, Inc.
GFI is a leading intermediary and provider of trading technologies and support services to the global OTC and listed markets. GFI serves institutional clients in operating electronic and hybrid markets for cash and derivative products across multiple asset classes. On February 26, 2015, we successfully completed our tender offer to acquire shares of common stock, par value $0.01 per share, of GFI for $6.10 per share in cash and accepted for purchase 54.3 million shares tendered to us pursuant to the offer. The tendered shares, together with the 17.1 million shares already owned by us, represented approximately 56% of the then-outstanding shares of GFI. We issued payment for the tendered shares on March 4, 2015 in the aggregate amount of $331.1 million. On April 28, 2015, we purchased from GFI approximately 43.0 million new shares at that date’s closing price of $5.81 per share, for an aggregate purchase price of $250 million. The purchase price was paid to GFI in the form of a note due on June 19, 2018 that bore an interest rate of LIBOR plus 200 basis points. The new shares and the note are eliminated in consolidation. Following the issuance of the new shares, we owned approximately 67% of GFI’s outstanding common stock, which gave us control over the timing and process for the completion of a back-end merger (the “Back-End Mergers”) pursuant to the tender offer agreement.
On January 12, 2016, we completed our acquisition (the “JPI Merger”) of Jersey Partners, Inc. (“JPI”). The JPI Merger occurred pursuant to a merger agreement, dated as of December 22, 2015. Shortly following the completion of the JPI Merger, a subsidiary of BGC merged with and into GFI pursuant to a short-form merger under Delaware law, with GFI continuing as the surviving entity. The Back-End Mergers allowed BGC to acquire the remaining approximately 33% of the outstanding shares of GFI common stock that BGC did not already own. Following the closing of the Back-End Mergers, BGC and its affiliates now own 100% of the outstanding shares of GFI’s common stock.
In total, approximately 23.5 million shares of BGC Class A common stock were issued and $111.2 million in cash will be paid with respect to the closing of the Back-End Mergers, inclusive of adjustments ($89.9 million has been paid as of December 31, 2016). The total purchase consideration for all shares of GFI purchased by BGC was approximately $750 million, net of the $250.0 million note previously issued to GFI by BGC, which is eliminated in consolidation. This figure excludes the $29.0 million gain recorded in the first quarter of 2015 with respect to the appreciation of the 17.1 million shares of GFI held by BGC prior to the successful completion of the tender offer. The excess of total consideration over the fair value of the total net assets acquired, of approximately $450.0 million, has been recorded to goodwill and was allocated to our Financial Services segment.
We believe the combination of BGC and GFI creates a strong and diversified Financial Services business, well-positioned to capture future growth opportunities. Through this combination, we expect to deliver substantial benefits to customers of the combined company, and we expect to become the largest and most profitable wholesale financial brokerage company. We also believe this is a highly complementary combination, which has resulted, and will continue to result, in meaningful economies of scale. While the front-office operations will remain separately branded divisions, the back office, technology, and infrastructure of these two companies are being integrated in a smart and deliberate way.
On July 10, 2015, the Company guaranteed the obligations of GFI under the 8.375% Senior Notes; as a consequence of guaranteeing GFI’s debt, we have substantially improved the credit rating of GFI’s bonds and lowered future interest payments. We have also been able to free up capital set aside for regulatory and clearing purposes, allowing us to use our balance sheet more efficiently.
102
On December 11, 2015, we completed the sale (the “Trayport Transaction”) of all of the equity interests in the entities that make up the Trayport business to Intercontinental Exchange, Inc. (“ICE”). The Trayport business was GFI’s electronic European energy software, trading, and market data business. The Trayport Transaction occurred pursuant to a Stock Purchase Agreement, dated as of November 15, 2015. At the closing, we received 2,527,658 shares of ICE common stock issued with respect to the $650 million purchase price, which was adjusted at closing. Through December 31, 2017, we have sold more than 95% of our shares of ICE common stock. Trayport, prior to its sale, had generated gross revenues of approximately $80 million over the twelve months ended September 30, 2015. BGC expects to pay effective cash taxes of no more than $64 million related to the Trayport sale price, or an expected rate of less than 10%.
Nasdaq Transaction
On June 28, 2013, we completed the sale of certain assets to Nasdaq, Inc. (“Nasdaq,” formerly known as “NASDAQ OMX Group, Inc.”), which purchased certain assets and assumed certain liabilities from us and our affiliates, including the eSpeed brand name and various assets comprising the fully electronic portion of our benchmark on-the-run U.S. Treasury brokerage, market data and co-location service businesses (“eSpeed”), for cash consideration of $750 million paid at closing, plus an earn-out of up to 14,883,705 shares of Nasdaq common stock to be paid ratably in each of the fifteen years following the closing in which the consolidated gross revenue of Nasdaq is equal to or greater than $25 million. Through December 31, 2017, we have received 4,961,235 shares of Nasdaq common stock in accordance with the agreement. The contingent future issuances of Nasdaq common stock are also subject to acceleration upon the occurrence of certain events.
As a result of the sale of eSpeed, we only sold our on-the-run benchmark 2-, 3-, 5-, 7-, 10-, and 30-year fully electronic trading platform for U.S. Treasury Notes and Bonds. We continue to offer voice brokerage for on-the-run U.S. Treasuries, as well as across various other products in rates, credit, FX, market data and software solutions. As we continue to focus our efforts on converting voice and hybrid desks to electronic execution, our e-businesses, excluding Trayport and revenues from inter-company data, software, and post-trade services, have continued to grow their revenues and generated $222.9 million of net revenues during the most recent trailing twelve-month period ended December 31, 2017, up 6.8% from a year ago. These fully electronic revenues are more than double the annualized revenues of eSpeed, which generated $48.6 million in revenues for the six months ended June 30, 2013 and was sold in the second quarter of 2013 for $1.2 billion (based on the value of Nasdaq stock at the time the deal was announced).
For the purposes of this document and subsequent Securities and Exchange Commission (“SEC”) filings, all of our fully electronic businesses are referred to as “FENICS.” These offerings include Financial Services segment fully electronic brokerage products, as well as offerings in market data, software solutions, and post-trade services across both BGC and GFI. FENICS historical results do not include the results of eSpeed or those of Trayport, either before or after the completed sale to ICE. Going forward, we expect these businesses to become an even more valuable part of BGC as they continue to grow.
During the third quarter of 2017, the Company transferred the right to receive earn-out payments from Nasdaq from the Financial Services segment to the Real Estate Services segment. As a result, the Nasdaq payment for the third quarter of 2017 was recorded as “Other income (loss)” in the Real Estate Services segment.
Financial Services:
The financial intermediary sector has been a competitive area that grew over the period between 1998 and 2007 due to several factors. One factor was the increasing use of derivatives to manage risk or to take advantage of the anticipated direction of a market by allowing users to protect gains and/or guard against losses in the price of underlying assets without having to buy or sell the underlying assets. Derivatives are often used to mitigate the risks associated with interest rates, equity ownership, changes in the value of foreign currency, credit defaults by corporate and sovereign debtors and changes in the prices of commodity products. Over this same timeframe, demand from financial institutions, financial services intermediaries and large corporations had increased volumes in the wholesale derivatives market, thereby increasing the business opportunity for financial intermediaries.
Another key factor in the growth of the financial intermediary sector between 1998 and 2007 was the increase in the number of new financial products. As market participants and their customers strive to mitigate risk, new types of equity and fixed income securities, futures, options and other financial instruments have been developed. Most of these new securities and derivatives were not immediately ready for more liquid and standardized electronic markets, and generally increased the need for trading and required broker-assisted execution.
Due largely to the impacts of the global financial crises of 2008-2009, our Financial Services businesses had faced more challenging market conditions from 2009 until the second half of 2016. Accommodative monetary policies were enacted by several major central banks including the Federal Reserve, Bank of England, Bank of Japan and the European Central Bank in response to the
103
global financial crises. These policies have resulted in historically low levels of volatility and interest rates across many of the financial markets in which we operate. The global credit markets also faced structural issues such as increased bank capital requirements under Basel III. Consequently, these factors contributed to lower trading volumes in our rates and credit asset classes across most geographies in which we operated.
On June 23, 2016, the U.K. held a referendum regarding continued membership in the European Union (the “EU”). The exit from the EU is commonly referred to as “Brexit.” The Brexit vote passed by 51.9% to 48.1%. The referendum was non-binding. However, on March 29, 2017, the Prime Minister gave the European Council of the EU formal written notification of the U.K.’s intention to leave the EU, triggering the withdrawal process under Article 50 of the Lisbon Treaty. The effects of Brexit will depend on any agreements the U.K. makes to retain access to EU markets – either during a transitional period or more permanently. Negotiations started in earnest following the Parliamentary elections held on June 8, 2017. These negotiations under Article 50 are to determine the future terms of the U.K.’s relationship with the EU, including the terms of access to EU financial markets. There is proposed to be a transition period from March 29, 2019, when U.K. is expected to leave the EU, to the end of 2020. Negotiations on the terms of the transition are continuing. Negotiations for an agreement with the EU following the U.K’s exit could take longer and the EU could agree to a longer transition period.
The results of the Brexit referendum contributed to short-term volatility in most of the global financial markets in which we broker, and also led to currency exchange rate fluctuations that resulted in significant weakening of the British pound against most major foreign currencies. Although we generate a significant amount of revenue in the U.K., most of it is denominated in other currencies. However, a majority of our U.K. expenses are denominated in pounds. As a result, we expect a decrease in the value of the pound to have a minimal effect on our consolidated earnings.
There will be a transition period from March 29, 2019 when the U.K. is expected to leave the EU to the end of 2020. Since negotiations for an agreement with the EU following U.K.’s exit could take longer than that and the EU could agree to a longer transition period, we anticipate higher than average global financial market volatility to occur periodically for the foreseeable future, all else equal. Historically, elevated volatility has often led to increased volumes in the Financial Services markets in which we broker, which could be beneficial for our business. However, the outcome of any negotiations between the U.K. and the EU could prove disruptive for our Financial Services business and/or its customers for a period of time.
Regulators in the U.S. have finalized most of the new rules across a range of financial marketplaces, including OTC derivatives, as mandated by the Dodd-Frank Wall Street Reform and Consumer Protection Act (“Dodd-Frank Act”). Many of these rules became effective in prior years, while ongoing phase-ins are anticipated over coming years. We believe that the November 2016 election results in the U.S. make it possible that some of the Dodd-Frank rules may be modified or repealed, which could be a net positive for our Financial Services business and its largest customers. Along these lines, the U.S. Treasury, in a report released in June 2017, called for streamlining of rules and easing regulatory burdens on banks. However, there can be no assurance that these rules will be amended, and we continue to expect the industry to be more heavily regulated than it was prior to the financial crisis of 2008/2009, and we are prepared to operate under a variety of regulatory regimes.
In addition to regulations in the U.S., legislators and regulators in Europe and the Asia-Pacific region have crafted similar rules, some of which have already been implemented, while the rest are expected to be implemented in the future. For example, on September 29, 2017, the European Securities and Markets Authority (ESMA) issued its final draft Regulatory Technical Standard (RTS) implementing the trading obligation for derivatives under the Markets in Financial Instruments Regulation (MiFIR). ESMA’s draft RTS provides the implementing details for on-venue trading of interest rate swaps and credit default swaps. This RTS is part of a larger set of more sweeping market regulatory reforms in the EU known as MiFID II (Markets in Financial Instruments Directive), which went live at the beginning of 2018.
These OTC-related regulations and proposed rules call for, among other actions, additional pre- and post-trade market transparency, heightened collateral and capital standards, the transacting of certain derivatives using authorized venues, central clearing of most standardized derivatives, specific business conduct standards and the delivery of transaction data to newly designated trade repositories for public dissemination. The various markets in which we operate have at times been, and in the future may temporarily be disrupted as these rules are implemented.
BGC Derivative Markets and GFI Swaps Exchange, our subsidiaries, began operating as Swap Execution Facilities (“SEFs”) on October 2, 2013. Both BGC Derivative Markets and GFI Swaps Exchange received permanent registration approval from the Commodity Future Trading Commission (the “CFTC”) as SEFs on January 22, 2016. Mandatory Dodd-Frank Act compliant execution on SEFs by eligible U.S. persons commenced in February 2014 for “made available to trade” products, and a wide range of other rules relating to the execution and clearing of derivative products were finalized with implementation periods in 2016 and beyond. We also own ELX, which, became a dormant contract market on July 1, 2017.
104
As these rules require authorized execution facilities to maintain robust front-end and back-office IT capabilities and to make large and ongoing technology investments, and because these execution facilities may be supported by a variety of voice and auction-based execution methodologies, we expect our hybrid and fully electronic trading capability to perform strongly in such an environment.
In recent years, there has been significant consolidation among the interdealer-brokers and wholesale brokers with which we compete. In addition to our 2015 acquisition of GFI, Tullett Prebon plc (“Tullett”) and ICAP plc (“ICAP”) announced in November 2015 an agreement whereby Tullett would purchase the vast majority of ICAP’s global hybrid/voice broking, as well as portions of its information businesses. Following the completion of their proposed deal in December of 2016, ICAP changed its corporate name to “NEX Group plc” (“NEX”), while Tullett changed its name to “TP ICAP plc.” We expect to continue to compete with the remaining electronic markets, post-trade and information businesses of NEX through the various offerings on our FENICS platform. We will also continue to compete with TP ICAP across various voice/hybrid brokerage marketplaces. There has also been significant consolidation among smaller non-public wholesale brokers, including our acquisitions of R.P. Martin, Heat Energy Group, Remate Lince and Sunrise Brokers Group. We view the recent consolidation in the industry favorably, as we expect it to provide additional operating leverage to our Financial Services businesses in the future.
Growth Drivers
As a wholesale intermediary, our business is driven primarily by overall industry volumes in the markets in which we broker, the size and productivity of our front-office headcount (including brokers, salespeople, managers and other front-office personnel), regulatory issues, and the percentage of our revenues we are able to generate by fully electronic means.
Below is a brief analysis of the market and industry volumes for some of our financial services products including our overall hybrid and fully electronic trading activities.
Overall Market Volumes and Volatility
Volume is driven by a number of items, including the level of issuance for financial instruments, the price volatility of financial instruments, macro-economic conditions, the creation and adoption of new products, the regulatory environment, and the introduction and adoption of new trading technologies. Historically, increased price volatility has typically increased the demand for hedging instruments, including many of the cash and derivative products that we broker.
Rates volumes in particular are influenced by market volumes and volatility. Historically low and negative interest rates across the globe have significantly reduced the overall trading appetite for rates products. The ECB and Bank of Japan are among a number of central banks that have set key interest rates to near or below zero, while many sovereign bonds continue to trade at negative yields.. The U.K.’s referendum vote to exit the European Union drove historically low yields even lower in 2016 compared with the two prior years, as a subsequent flight to high quality and deeply liquid asset classes ensued. Although the election results in the U.S. resulted in yields rising above long-term lows during the fourth quarter of 2016 in many major markets, rates volumes were tempered for the full year 2016 and 2017 industry-wide by this continuing period of exceptionally low interest rates. These historically low yields have driven many traditional investor classes to other investible asset classes in search of higher yields.
Also weighing on yields and rates volumes are global central bank quantitative easing programs. The programs depress rates volumes because they entail central banks buying government securities or other securities in the open market — particularly longer-dated instruments — in an effort to promote increased lending and liquidity and bring down long-term interest rates. When central banks hold these instruments, they tend not to trade or hedge, thus lowering rates volumes across cash and derivatives markets industry-wide. Despite the conclusion of its quantitative easing program in the fourth quarter of 2014, the U.S. Federal Reserve still had approximately $3.4 trillion worth of long-dated U.S. Treasury and Federal Agency securities as of January 3, 2018, compared with $1.7 trillion at the beginning of 2011 and zero prior to September 2008. Additionally, the U.S. Federal Reserve had continued to roll over its existing positions and has thus kept its balance sheet at elevated levels since the fourth quarter of 2014. However, the Federal Reserve published a plan to reduce the size of its balance sheet (or “unwind”) at its meeting in June 2017. According to the Federal Open Market Committee statement dated September 20, 2017, the Federal Reserve will reduce the size of its balance sheet over time. As part of this plan, the Federal Reserve will not reinvest some of the proceeds from securities as they mature.
Other major central banks have also greatly increased the amount of longer-dated debt on their balance sheets over the past few years and have indicated that they may continue to do so until economic conditions allow for a tapering or an unwinding of their quantitative easing programs. As part of the gradual scaling back of its quantitative easing program, the ECB announced in October 2017 that it would reduce its bond-buying program from €60 billion to €30 billion a month from January 2018. As of the filing of this document, other major central banks such as the Bank of Japan or Swiss National Bank have not publicly disclosed plans to taper or unwind their programs. Economists from J.P. Morgan estimate that even with the Fed unwind, the overall dollar value of balance sheets of the G-4 (the U.S., Eurozone, Japan, and U.K.) might continue to rise as a percentage of G-4 GDP over the near term. According to Bloomberg, from December 31, 2006 through December 31, 2017, this amount has increased from 10.3% of G-4 GDP to an all-time high of 37.5%. The latter figure also represented an increase of approximately 250 basis points year-on-year and 10 basis points quarter-on-quarter.
105
Additional factors have weighed down market volumes in the products we broker. For example, the G-20 central banks have agreed to implement the Basel III accord. Basel III was drafted with the intention of making banks more stable in the wake of the financial crisis. The accord, which will continue to be phased in over the coming years, will force most large banks in G-20 nations to hold approximately three times as much Tier 1 capital as is required under the previous set of rules. These capital rules make it more expensive for banks to hold non-sovereign debt assets on their balance sheets, and as a result, analysts say that banks have reduced or will reduce their trading activity in corporate and asset-backed fixed income securities as well as in various other OTC cash and derivative instruments. We believe that this has further reduced overall industry volumes in many of the products we broker, particularly in credit.
On September 1, 2016, the U.S. and Japan implemented “Phase I” of the Basel Committee’s edict for initial margin and variation margins to be exchanged bilaterally between participants transacting in non-centrally cleared derivatives. “Phase I” adversely impacted trading activity at our large sell-side institutional clients during the third quarter of 2016 as they worked through arranging documentation to support the exchange of margins with each other. Some clients remain unable to deal with major counterparties. In addition, uncertainty around compliance globally has affected derivatives pricing. Although regulators in Europe, Hong Kong, Singapore and Australia previously announced delays to the “Phase I” implementation date, most uncleared bilateral rates, FX and credit derivatives trading with U.S. counterparties has necessarily included initial margin, resulting in a general widening of bid-offer spreads with subsequent reduced turnover. While there has been some substitution with trades in nearly similar products being submitted for central clearing so as to be out of scope for the new rule, these transactions did not replace the withdrawn volumes. The first tranche of this rule application in the EU occurred in the middle of the first quarter of 2017, and similar disruption may occur when similar rules are effective in the EU and in other jurisdictions as the aftermath may be spread across a wider set of participants. “Phases II and III,” which cover midsize and smaller institutions, are expected to be implemented over the next four years.
During the year ended December 31, 2017, industry volumes were generally mixed year-over-year for the OTC and listed products we broker in rates, credit, FX, equities, energy and commodities. Below is an expanded discussion of the volume and growth drivers of our various financial services brokerage product categories.
Rates Volumes and Volatility
Our rates business is influenced by a number of factors, including global sovereign issuances, secondary trading and the hedging of these sovereign debt instruments. The amount of global sovereign debt outstanding remains high by historical standards, and the level of secondary trading and related hedging activity remained somewhat muted for most of 2017. In addition, according to Bloomberg and the Federal Reserve Bank of New York, the average daily volume of various U.S. Treasuries, excluding Treasury bills, among primary dealers was 4% lower in 2017 as compared to the previous year. Additionally, interest rate derivative volumes were up 11% at Eurex, and up 28% and 9% for ICE and the CME Group Inc. (“CME”), respectively, all according to company press releases. In comparison, our revenue from FENICS fully electronic rates increased 36.1%, while our overall rates revenues were up approximately 9.0% as compared to a year earlier to $510.9 million.
Our rates revenues, like the revenues for most of our Financial Services products, are not totally dependent on market volumes and therefore do not always fluctuate consistently with industry metrics. This is largely because our voice, hybrid, and fully electronic desks in rates often have volume discounts built into their price structure, which results in our rates revenues being less volatile than the overall industry volumes.
Overall, analysts and economists expect the absolute level of sovereign debt outstanding to remain at elevated levels for the foreseeable future as governments finance their future deficits and roll over their sizable existing debt. For example, the Organization for Economic Cooperation and Development (the “OECD”), which includes almost all of the advanced and developed economies of the world, reported that general government debt (defined as general government net financial liabilities) as a percentage of nominal GDP is estimated to be 68% for the entire OECD in 2018. This would represent a slight decrease from 69% in 2016, but up considerably from the 38% figure in 2007. Meanwhile, economists expect that the effects of various forms of quantitative easing undertaken by the various major central banks will continue to negatively impact financial markets volumes, as economic growth remains weak in most OECD countries. As a result, we expect long-term tailwinds in our rates business from continuing high levels of government debt, but continued near-term headwinds due to the current low interest rate environment and continued accommodative monetary policies globally.
Foreign Exchange Volumes and Volatility
Global FX volumes were generally higher during 2017, as the year was impacted by increased market volatility related to uncertainty around global macro events, including Brexit negotiations and geopolitical tensions. Against this backdrop, spot FX volumes at Thomson Reuters were up 3% during the year, overall FX volumes were down 4% for EBS, while FX futures at CME were up 7%. In comparison, our overall FX revenues increased by 6.9% to $324.4 million.
106
The cash portion of our credit business is impacted by the level of global corporate bond issuance, while both the cash and credit derivatives sides of this business are impacted by sovereign and corporate issuance. The global credit derivative market turnover has declined over the last few years due to the introduction of rules and regulations around the clearing of credit derivatives in the U.S. and elsewhere, along with non-uniform regulation across different geographies. In addition, many of our large bank customers continue to reduce their inventory of bonds and other credit products in order to comply with Basel III and other international financial regulations. During 2017, primary dealer average daily volume for corporate bonds was up by 5% according to Bloomberg and the Federal Reserve Bank of New York, while dealer inventory of such bonds was 12% higher. As of December 31, 2017, total gross and net notional credit derivatives outstanding as reported by the International Swaps and Derivatives Association — a reflection of the OTC derivatives market — were flat and up by 4%, respectively, from a year earlier. During 2017, the notional amount of credit derivatives traded and the number of credit derivatives transactions were down by 6% and 18%, respectively, from a year earlier as reported by the ISDA. In comparison, our overall credit revenues were lower by 2.5% to $284.6 million.
Energy and Commodities
Energy and commodities volumes were generally mixed during 2017 compared with the year earlier. For example, according to the Futures Industry Association, the number of global futures contracts in agriculture, energy, non-precious metals, and precious metals were down by 34%, 3%, 7%, and 11%, respectively, in 2017 compared to the previous year. For the same timeframe, global listed options contracts in agriculture, energy, non-precious metals, and precious metals were down 3%, up 6%, up 3%, and up 1%, respectively. In comparison, BGC’s energy and commodities revenues were down by 8.5% to $204.0 million.
Equities, Insurance, and Other Asset Classes
Global equity volumes were generally mixed during 2017. Research from Goldman Sachs indicated that the average daily volumes of U.S. cash equities were down 11% year-on-year, while average daily volumes of U.S. equity-related options were approximately 4% higher, according to the Options Clearing Corporation (OCC). Meanwhile, UBS Research has noted that the average daily volumes of European cash equities shares were up 5% (in notional value). Over the same timeframe, Eurex average daily volumes of equity derivatives were down 5.9%. Our overall revenues from equities, insurance, and other asset classes increased by 87.1% to $327.4 million, led by the additions of Sunrise Brokers and Besso.
Fully Electronic Trading (FENICS) and Hybrid Trading
Historically, technology-based product growth has led to higher margins and greater profits over time for exchanges and wholesale financial intermediaries alike, even if overall company revenues remain consistent. This is largely because fewer employees are needed to process the same volume of trades as trading becomes more automated. Over time, the conversion of exchange-traded and OTC markets to electronic trading has also led, on average, to volumes increasing by enough to offset commissions declines, and thus often to similar or higher overall revenues. We have been a pioneer in creating and encouraging hybrid and fully electronic trading, and we continually work with our customers to expand such trading across more asset classes and geographies.
Outside of U.S. Treasuries and spot FX, the banks and broker-dealers that dominate the OTC markets had, until recent years, generally been hesitant in adopting electronically traded products. However, the banks, broker-dealers, and professional trading firms are now much more active in hybrid and fully electronically traded markets across various OTC products, including credit derivative indices, FX derivatives, non-U.S. sovereign bonds, corporate bonds, and interest rate derivatives. These electronic markets have grown as a percentage of overall industry volumes for the past few years as firms like BGC have invested in the kinds of technology favored by our customers. Recently enacted and pending regulation in Asia, Europe and the U.S. regarding banking, capital markets, and OTC derivatives has accelerated the adoption of fully electronic trading, and we expect to benefit from the rules and regulations surrounding OTC derivatives. Our understanding is that the rules that have been adopted or are being finalized will continue to allow for trading through a variety of means, including voice, and we believe the net impact of these rules and additional bank capital requirements will encourage the growth of fully electronic trading for a number of products we broker. We also believe that new clients, beyond our large bank customer base, will primarily transact electronically across our FENICS platform.
The combination of more market acceptance of hybrid and fully electronic trading and our competitive advantage in terms of technology and experience has contributed to our strong gains in electronically traded products. We continue to invest in hybrid and fully electronic technology broadly across our financial services product categories. FENICS has exhibited strong growth over the past several years, and we believe that this growth has outpaced the financial technology and wholesale brokerage industry as a whole. We expect this trend to continue as we convert more of our voice and hybrid brokerage into fully electronic brokerage across our FENICS platform.
107
FENICS net revenues, which exclude Trayport, increased by 6.8% to $222.9 million for the year ended December 31, 2017, as compared with $208.6 million for the year ended December 31, 2016. The increase in overall FENICS revenues for the period was primarily driven by strong growth from our fully electronic rates business. We offer electronically traded products on a significant portion of our Financial Services segment’s hundreds of brokerage desks. The revenues and profits of these products have been significantly higher than those of eSpeed and Trayport combined. eSpeed was sold to Nasdaq in the second quarter of 2013 for over $1.2 billion, and Trayport was sold to ICE in the fourth quarter of 2015 for $650 million, which was adjusted at closing. We expect the proportion of desks offering electronically traded products to continue to increase as we invest in technology to drive electronic trading over our platform. Over time, we expect the growth of FENICS to further improve this segment’s profitability and market share.
Real Estate Services:
Our Real Estate Services segment continued to show solid growth and generated 47.8% of our consolidated revenues for the year ended December 31, 2017. Real Estate brokerage revenues were $1.0 billion, up 19.5% year-over-year, which included growth in real estate capital markets of 18.5% and growth in leasing and other services revenue of 20.1%. The growth across our capital markets and leasing and other services was driven by strong double-digit organic growth. Our real estate management and other services were up by 18.4%. Gains from mortgage banking activities, net, increased by 6.5%. Servicing fees increased by 26.0%. Overall Newmark revenues improved by 18.3%. During the year ended December 31, 2017, U.S. industry-wide activity across investment sales was down 7%, according to Real Capital Analytics (“RCA”). According to an October 2017 forecast from the Mortgage Bankers Association (“MBA”), overall commercial mortgage origination volumes are expected to increase 5% year-over-year for the year ended December 31, 2017, while Freddie Mac estimates that multifamily mortgage origination volumes increased 8% to 9% in 2017. In addition, overall U.S. commercial leasing activity slowed down in 2017, according to NKF Research. We believe that Newmark continued to gain market share in 2017.
We continued to invest in the Real Estate Services segment by adding dozens of high profile and talented brokers and other revenue-generating professionals. Historically, newly hired commercial real estate brokers tend to achieve dramatically higher productivity in their second and third years with the Company, although we incur related expenses immediately. As our newly-hired brokers increase their production, we expect Newmark’s revenue and earnings growth to improve, thus demonstrating our operating leverage.
Over time, we expect the overall profitability of our Real Estate Services business to increase as we develop its size and scale. However, the pre-tax margins in the segment are also impacted by the mix of revenues generated by Newmark. For example, gains from mortgage banking activities, net, which includes revenues related to commercial mortgage origination, tends to have higher pre-tax margins than Newmark as a whole. In addition, real estate capital markets, which includes sales, commercial mortgage broking, and other real estate-related financial services, generally has larger transactions that occur with less frequency and more seasonality when compared with leasing advisory. Real estate capital markets transactions tend to have higher pre-tax margins than leasing advisory transactions, while leasing advisory revenues are generally more predictable than revenues from real estate capital markets. Property and facilities management, which are included “real estate management and other services,” generally have revenues that are more predictable and steady than leasing advisory, but with pre-tax earnings margins below those for Newmark as a whole. When property and facilities management clients agree to give us exclusive rights to provide real estate services for their facilities or properties, it is for an extended period of time, which provides us with stable and foreseeable sources of revenues.
In addition, our pre-tax income includes the net impact of non-cash GAAP gains attributable to originated mortgage servicing rights (“OMSRs”) and non-cash GAAP amortization of mortgage servicing rights (“MSRs”). We recognize OMSR gains equal to the fair value of servicing rights retained on mortgage loans originated and sold. MSRs are amortized in proportion to the net servicing revenue expected to be earned. Subsequent to the initial recording, MSRs are amortized and carried at the lower of amortized cost or fair value. For the years 2017, 2016, and 2015 Newmark’s GAAP pre-tax earnings therefore included approximately $48.5 million, $66.2 million, and $13.5 million of net non-cash GAAP gains, respectively, related to OMSR gains and MSR amortization. These net non-cash gains significantly increased Newmark’s GAAP pre-tax margin over the three year period.
Products and Services
Newmark offers a diverse array of integrated services and products designed to meet the full needs of both real estate investors/owners and occupiers. Our technology advantages, industry-leading talent, deep and diverse client relationships and suite of complementary services and products allow us to actively cross-sell our services and drive industry leading margins.
108
Leading Commercial Real Estate Technology Platform and Capabilities
We offer innovative real estate technology solutions for both investors/owners and occupiers that enable our clients to increase efficiency and realize additional profits. Our differentiated, value-added and client-facing technology platforms have been utilized by clients that occupy over 3.5 billion square feet of commercial real estate space globally. For real estate occupiers, investors and owners, our N360 platform is a powerful tool that provides instant access and comprehensive commercial real estate data in one place via mobile or desktop. This technology platform makes information, such as listings, historical leasing, tenant/owner information, investment sales, procurement, research, and debt on commercial real estate properties, accessible to investors and owners. N360 also integrates a Geographic Information Systems (which we refer to as “GIS”) platform with 3D mapping powered by Newmark’s Real Estate Data Warehouse. For our occupier clients, the VISION platform provides integrated business intelligence, reporting and analytics. Our clients use VISION to reduce cost, improve speed and supplement decision making in applications such as real estate transactions and asset administration, project management, building operations and facilities management, environmental and energy management, and workplace management. Our deep and growing real estate database and commitment to providing innovative technological solutions empower us to provide our clients with value-adding technology products and data-driven advice and analytics.
Real Estate Investor/Owner Services and Products
Capital Markets
We provide clients with strategic solutions to address their real estate capital concerns. We offer a broad range of real estate capital markets services. These services include asset sales, sale leasebacks, mortgage and entity-level financing, equity-raising, underwriting and due diligence. The transactions we broker involve vacant land, new real estate developments and existing buildings. We specialize in arranging financing for most types of value-added commercial real estate, including land, condominium conversions, subdivisions, office, retail, industrial, multifamily, student housing, hotels, data center, healthcare, self-storage and special use. Through both our investment sales brokers and our mortgage brokers, we are able to offer multiple debt and equity alternatives to fund capital markets transactions through third-party banks, insurance companies and other capital providers. RCA figures suggest U.S. commercial real estate sales volumes across the industry declined 7% year-over-year in 2017, while commercial mortgage origination volumes were estimated to increase 15% during the year ended December 31, 2017, according to a February 2018 MBA forecast, which included updated backwards looking numbers for 2017. In comparison, our capital markets revenues, which are more heavily weighted to investment sales than commercial mortgage brokerage, increased by 18.5% year-over-year in 2017 to $397.7 million.
Agency Leasing
We execute marketing and leasing programs on behalf of investors, developers, governments, property companies and other owners of real estate to secure tenants and negotiate leases. We understand the value of a creditworthy tenant to landlords and work to maximize the financing value of any leasing opportunity. Revenue is typically recognized when a lease is signed and/or a tenant occupies the space and is calculated as a percentage of the total revenue that the landlord is expected to derive from the lease over its term. In certain markets revenue is determined on a per square foot basis. Our leasing revenues, which include revenues from agency leasing and tenant representation leasing, increased by 20.1% year-over-year in 2017 to $617.0 million.
Valuation and Advisory
We operate a national valuation and advisory business. Our appraisal team executes projects of nearly every size and type, from single properties to large portfolios, existing and proposed facilities and mixed-use developments across the spectrum of asset values. Clients include banks, pension funds, insurance companies, developers, corporations, equity funds, REITs and institutional capital sources. These institutions utilize the advisory services we provide in their loan underwriting, construction financing, portfolio analytics, feasibility determination, acquisition structures, litigation support and financial reporting.
Property Management
We provide property management services on a contractual basis to owners and investors in office, industrial and retail properties. Property management services include building operations and maintenance, vendor and contract negotiation, project oversight and value engineering, labor relations, property inspection/quality control, property accounting and financial reporting, cash flow analysis, financial modeling, lease administration, due diligence and exit strategies. We have an opportunity to grow our property or facilities management contracts in connection with other high margin leasing or other contracts. We may provide services through our own employees or through contracts with third-party providers. We focus on maintaining high levels of occupancy and tenant satisfaction while lowering property operating costs using advanced work order management systems and sustainable practices. We typically receive monthly management fees based upon a percentage of monthly rental income generated from the property under management, or in some cases, the greater of such percentage or a minimum agreed upon fee. We are often reimbursed for our administrative and payroll costs, as well as certain out-of-pocket expenses, directly attributable to properties under management. Our
109
property management agreements may be terminated by either party with notice generally ranging between 30 to 90 days; however, we have developed long-term relationships with many of these clients and our typical contract has continued for many years. These businesses also give us better insight into our clients’ overall real estate needs. Our real estate management and other services revenues, which include revenues from property management and other non-brokerage sources, increased by 18.4% year-over-year in 2017 to $233.1 million.
Government Sponsored Enterprise Lending and Loan Servicing
As a low-risk intermediary, Berkeley Point originates loans guaranteed by government agencies or enterprises and pre-sells such loans prior to transaction closing. Berkeley Point is approved to participate in loan origination, sales and servicing programs operated by the GSEs, Fannie Mae and Freddie Mac. Berkeley Point also originates, sells and services loans under HUD’s FHA programs, and is an approved HUD MAP and HUD LEAN lender, as well as an approved Ginnie Mae issuer. In 2017, Berkeley Point was a top-five Fannie Mae and Freddie Mac lender according to the GSEs. For the year ended December 31, 2017, Berkeley Point’s GSE and FHA loan originations increased by 16% year-on-year to $8.9 billion.
Berkeley Point does not originate loans to be held for investment on Berkeley Point’s balance sheet. Substantially all of Berkeley Point’s originations are for GSE and HUD/FHA lending programs in which the loan is pre-sold via these programs to investors prior to the closing of the loan with the borrower, significantly reducing the distribution risk. Berkeley Point has established a strong credit culture over decades of originating loans and remains committed to disciplined risk management from the initial underwriting stage through loan payoff.
Berkeley Point finances its loan originations through collateralized financing agreements in the form of warehouse loan agreements (“WHAs”) with three lenders and an aggregate commitment as of December 31, 2017 of approximately $950 million and an uncommitted $325 million Fannie Mae loan repurchase facility. As of December 31, 2017, Berkeley Point had collateralized financing outstanding of approximately $360 million. Collateral includes the underlying originated loans and related collateral, the commitment to purchase the loans as well as credit enhancements from the applicable GSE or HUD. Berkeley Point typically completes the distribution of the loans it originates within 30 to 60 days of closing. Proceeds from the distribution are applied to reduce borrowings under the WHAs, thus restoring borrowing capacity for further loan originations.
Berkeley Point’s value driven, credit focused approach to underwriting and credit processes provides for clearly defined roles for senior management and carefully designed checks and balances to ensure appropriate quality control and borrower transparency. Preservation of capital and downside protection are fundamental to the loan origination thesis. Berkeley Point is subject to both its own and the GSEs’ and HUD’s rigorous underwriting requirements related to property, borrower, and market due diligence to identify risks associated with each loan and to ensure credit quality, satisfactory risk assessment and appropriate risk diversification for our portfolio. Berkeley Point believes that thorough underwriting is essential to generating and sustaining attractive risk adjusted returns for its investors.
In conjunction with our origination services, we sell the loans that we originate under GSE programs and retain the servicing of those loans. The servicing portfolio provides a stable, predictable recurring stream of revenue to us over the life of each loan. As of December 31, 2017, Berkeley Point’s total servicing portfolio was $58.0 billion and average remaining servicing term per loan was approximately eight years for its primary servicing portfolio. Berkeley Point’s special servicing portfolio made up less than approximately 6% of Berkeley Point’s total $58.0 billion servicing portfolio as of December 31, 2017. The combination of Berkeley Point and ARA brings together, respectively, a leading multifamily debt origination platform with a top-three multifamily investment sales business, which we believe will provide substantial cross-selling opportunities. In particular, we expect revenues to increase as Berkeley Point begins to capture a greater portion of the financings on ARA’s investment sales transactions.
The terms of Berkeley Point’s arrangements under the GSE and HUD programs enable it to service nearly all loans it originates under those programs, and thus it receives recurring servicing revenue for the duration of those loans. The typical multifamily loan that Berkeley Point originates and services under these programs is fixed rate, and includes significant prepayment penalties. These structural features generally offer prepayment protection and provide more stable, recurring fee income. Berkeley Point also services commercial real estate loans that it does not originate. Servicing includes primary servicing activity and also special servicing in the case of loans that are in default.
Berkeley Point is a Fitch and S&P rated commercial loan primary and special servicer, as well as a Kroll rated commercial loan primary and GSE special servicer. It has a team of over 70 professionals throughout various locations in the United States dedicated to primary and special servicing and asset management. These professionals focus on financial performance and risk management to anticipate potential property, borrower or market issues. Portfolio management conducted by these professionals is not only a risk management tool, but also leads to deeper relationships with borrowers, resulting in continued interaction with borrowers over the term of the loan, and potential additional financing opportunities.
110
Our revenues from gains from mortgage banking activities, net, which are related to GSE lending, increased by 6.5% year-over-year in 2017 to $206.0 million. In addition, our servicing fees revenue increased 26.0% year-over year in 2017 to $110.4 million.
Intercompany Referrals
CCRE (a subsidiary of Cantor) and BGC Partners, including Berkeley Point and Newmark, have entered into arrangements in respect of intercompany referrals. Pursuant to these arrangements, the respective parties refer, for customary fees, opportunities for commercial real estate loans to CCRE, opportunities for real estate investment, broker or leasing services to our Newmark business, and opportunities for government-sponsored loan originations to our Berkeley Point business.
Due Diligence and Underwriting
We provide commercial real estate due diligence consulting and advisory services to a variety of clients, including lenders, investment banks and investors. Our core competencies include underwriting, modeling, structuring, due diligence and asset management. We also offer clients cost-effective and flexible staffing solutions through both on-site and off-site teams. We believe that this business line gives us another way to cross-sell services to our clients.
Real Estate Occupier Services and Products
Tenant Representation Leasing
We represent commercial tenants in all aspects of the leasing process, including space acquisition and disposition, strategic planning, site selection, financial and market analysis, economic incentives analysis, lease negotiations, lease auditing and project management. Fees are generally earned when a lease is signed and/or the tenant takes occupancy of the space. In many cases, landlords are responsible for paying the fees. We use innovative technology and data to provide tenants with an advantage in negotiating leases, which has contributed to our market share gains. Our leasing revenues, which include tenant representation leasing and agency leasing, increased by 20.1% year-over-year in 2017 to $617.0 million.
Workplace and Occupancy Strategy
We provide services to help organizations understand their current workplace standards and develop plans and policies to optimize their real estate footprint. We offer a multifaceted consulting service underpinned by robust data and technology.
Global Corporate Services (“GCS”) and Consulting
GCS is our consulting and services business that focuses on reducing occupancy expense and improving efficiency for corporate real estate occupiers, with large, often multi-national presence. We provide beginning-to-end corporate real estate solutions for clients. GCS makes its clients more profitable by optimizing real estate usage, reducing overall corporate footprint, and improving work flow and human capital efficiency through large scale data analysis and our industry-leading technology. We offer global enterprise optimization, asset strategy, transaction services, information management, an operational technology product and transactional and operational consulting. Our consultants provide expertise in financial integration, portfolio strategy, location strategy and optimization, workplace strategies, workflow and business process improvement, merger and acquisition integration, and industrial consulting. We utilize a variety of advanced technology tools to facilitate the provision of transaction and management services to our clients. For example, our innovative VISION tool provides data integration, analysis and reporting, as well as the capability to analyze potential “what if” scenarios to support client decision making. VISION is a scalable and modular enterprise solution that serves as an integrated database and process flow tool supporting the commercial real estate cycle. Our VISION tool combines the best analytical tools available and allows the client to realize a highly accelerated implementation timeline at a reduced cost. We believe that we have achieved more than $3 billion in savings for our clients to date.
We provide real estate strategic consulting and systems integration services to our global clients including many Fortune 500 and Forbes Global 2000 companies, owner-occupiers, government agencies, healthcare and higher education clients. We also provide enterprise asset management information consulting and technology solutions which can yield hundreds of millions of dollars in cost-savings for its client base on an annual basis. The relationships developed through the software implementation at corporate clients lead to many opportunities for us to deliver additional services. We also provide consulting services through our GCS business. These services include operations consulting related to financial integration, portfolio strategy, location strategy and optimization, workplace strategies, workflow and business process improvement, merger and acquisition integration and industrial consulting. Fees for these services are on a negotiated basis and are often part of a multi-year services agreement. Fees may be contingent on meeting certain financial or savings objectives with incentives for exceeding agreed upon targets.
111
Recurring Revenue Streams. GCS provides a recurring revenue stream via entering into multi-year contracts that provide repeatable transaction work, as opposed to one-off engagements in specific markets and other recurring fees for ongoing services, such as facilities management and lease administration, over the course of the contract. Today’s clients are focused on corporate governance, consistency in service delivery, centralization of the real estate function and procurement. Clients are also less focused on transaction based outcomes and more focused on overall results, savings, efficiencies and optimization of their overall business objectives. GCS was specifically designed to meet these objectives. GCS is often hired to solve business problems, not “real estate” problems. GCS provides a unique lens into the corporate real estate (which we refer to as “CRE”) outsourcing industry and offers a unique way to win business. Whether a client currently manages its corporate real estate function in-house (insource) or has engaged an external provider (outsource), GCS drives value by securing accounts that are first generation outsource or by gaining outsourced market share.
Project Management
We provide a variety of services to tenants and owners of self-occupied spaces. These include conversion management, move management, construction management and strategic occupancy planning services. These services may be provided in connection with a discrete tenant representation lease or on a contractual basis across a corporate client’s portfolio. Fees are generally determined on a negotiated basis and earned when the project is complete.
Real Estate and Lease Administration. We manage leases for our clients for a fee, which is generally on a per lease basis. We also perform lease audits and certain accounting functions related to the leases. Our lease administration services include critical date management, rent processing and rent payments. These services provide additional insight into a client’s real estate portfolio, which allows us to deliver significant value back to the client through provision of additional services, such as tenant representation, project management and consulting assignments, to minimize leasing and occupancy costs. For large occupier clients, our real estate technology enables them to access and manage their complete portfolio of real estate assets. We offer clients a fully integrated user-focused technology product designed to help them efficiently manage their real estate costs and assets.
Facilities Management
We manage a broad range of properties on behalf of users of commercial real estate, including headquarters, facilities and office space, for a broad cross section of companies, including Fortune 500 and Forbes Global 2000 companies. We manage the day-to-day operations and maintenance for urban and suburban commercial properties of most types, including office, industrial, data centers, healthcare, retail, call centers, urban towers, suburban campuses, and landmark buildings. Facilities management services may also include facility audits and reviews, energy management services, janitorial services, mechanical services, bill payment, maintenance, project management, and moving management. While facility management contracts are typically three to five years in duration, they may be terminated on relatively short notice periods. Our real estate management and other services revenues, which include revenues from facilities management and other non-brokerage sources, increased by 18.4% year-over-year in 2017 to $233.1 million.
Growth Drivers
The key drivers of revenue growth for U.S. commercial real estate services companies include the overall health of the U.S. economy, including gross domestic product and employment trends in the U.S., which drives demand for various types of commercial leases, financing, and purchases, the institutional ownership of commercial real estate as an investible asset class; and the ability to attract and retain talent to our real estate services platform. In addition, in real estate sales, also known as real estate capital markets, growth is driven by the availability of credit to purchasers of and investors in commercial real estate.
Berkeley Point’s origination business is impacted by the lending caps imposed by the FHFA as well as by activity in multifamily commercial mortgages that are excluded from these lending caps. The FHFA announced on November 21st, 2017 that it had decreased the 2018 multifamily lending caps from $36.5 billion in 2017 to $35 billion at both Fannie Mae and Freddie Mac. This translated into total purchasing capabilities of $70 billion, excluding loans exempt from these caps. In 2017 multifamily loans exempt from the lending caps made up more than 50% of the multifamily financing volume at both Fannie Mae and Freddie Mac. According to a February 2018 forecast from the Mortgage Bankers Association, which included updated backwards looking numbers for 2017, commercial mortgage origination volumes for GSE and FHA loans were estimated to have increased 20% for the year ended December 31, 2017.
112
The U.S. economy expanded by 2.3% during 2017, according to a preliminary estimate from the U.S. Department of Commerce. This growth compares with an increase of 1.5% during 2016. The consensus is for U.S. GDP to expand by 2.6% in 2018 and 2.2% in 2019, according to a recent Bloomberg survey of economists. This moderate pace of growth should help keep interest rates and inflation low by historical standards.
The Bureau of Labor Statistics reported that employers added a monthly average of 181,000 net new payroll jobs during 2017, which was below the prior year period’s 195,000. U.S. employers added 160,000 jobs in December of 2017, versus the full-year, seasonally adjusted average of 181,000 per month. Despite the return to pre-recession unemployment rates (4.1% as of December 2017), the number of long-term unemployed and the labor force participation rate (the latter of which is near a 39-year low) remained disappointing for many economists, but these indicators are less important to commercial real estate than job creation.
The 10-year Treasury yield ended 2017 at 2.41%, down 3 basis points from the year-earlier date. In addition, 10-year Treasury yields have remained well below their 50-year average of approximately 6.32%, in large part due to market expectations that the Federal Open Market Committee (“FOMC”) will only moderately raise the federal funds rate over the next few years. Interest rates are also relatively low due to even lower or negative benchmark government interest rates in much of the rest of the developed world, which makes U.S. government bonds relatively more attractive.
The combination of moderate economic growth and low interest rates that has been in place since the recession ended has been a powerful stimulus for commercial real estate, delivering steady absorption of space and strong investor demand for the yields available through both direct ownership of assets and publicly traded funds. Steady economic growth and low interest rates have helped push vacancy rates down for the office, apartment, retail and industrial markets over the current economic expansion, now in its ninth year. Construction activity, though it is ramping up, remains low compared with prior expansion cycles and low relative to demand and absorption, which means that property leasing markets continue to tighten. Overall, demand for commercial real estate remains strong. While the vast majority of new supply is going to just the top 10-15 markets, there is healthy demand among investors for well positioned suburban value add assets in secondary and tertiary markets, according to NKF Research. Asking rental rates posted moderate gains across all property types during 2017.
The following key trends drove the commercial real estate market during 2017:
|
|
• |
Sustained U.S. employment growth and rising home values have fueled the economy and generated demand for commercial real estate space across all major sectors; |
|
|
• |
Technology, professional and business services and healthcare continued to power demand for office space, although technology occupiers have turned more cautious |
|
|
• |
Oil prices rose sharply in 2017, but Houston and other energy-focused office markets continued to deal with excess vacancies and generous lease concessions. |
|
|
• |
E-commerce and supply-chain optimization pushed 2017 industrial absorption to 31 consecutive quarters of positive net absorption, creating tenant and owner-user demand for warehouses and distribution centers; |
|
|
• |
Apartment rents benefited from sustained job growth, and underlying demographic trends towards urban living among two key age groups: millennials and baby boomers; and |
|
|
• |
Continued corporate employment growth, combined with increased leisure travel, generated demand for hotel room-nights. |
The recently enacted U.S. tax cuts could lift growth, along with leasing activity. Rising inflation and interest rates, a byproduct of faster growth, could deliver a mixed outcome: Rising interest rates could pressure cap rates, but stronger rent growth and sustained investor demand could support property values.
Market Statistics
Although overall industry metrics are not necessarily as correlated to our revenues in Real Estate Services as they are in Financial Services, they do provide some indication of the general direction of the business. The U.S commercial property market continues to display strength as commercial property prices continue to rise, as per CoStar. According to RCA, U.S. commercial real estate sales volumes decreased year-over-year for the second time since 2009. U.S. commercial real estate activity was impacted during the year largely due to political uncertainty at the beginning of the year and fluctuations in interest rates. However, spreads of institutional-grade U.S. commercial real estate capitalization rates over 10-year U.S. Treasuries were above their long-term average at approximately 340 basis points at the conclusion of 2017, well above the pre-recession low of 165 basis points. If the U.S. economy expands at the moderate pace envisioned by many economists, we would expect this to fuel the continued expansion of demand for
113
commercial real estate. The spread between local 10-year benchmark government bonds and U.S. cap rates was even wider with respect to major countries including Japan, Canada, Germany, the U.K. and France during 2017. This should continue to make U.S. commercial real estate a relatively attractive investment for non-U.S. investors.
According to RCA, average prices for commercial real estate were up by 7.1% year-over-year for the twelve months ended December 31, 2017. During the year, the dollar volume of significant property sales totaled approximately $464 billion in the U.S., down by 7% from the year ago period according to RCA. According to an October 2017 MBA forecast, originations of commercial/multifamily loans of all types were estimated to be up by approximately 5% year-over-year in terms of dollar volume for the year ended December 31, 2017. In addition, GSE multifamily financing volumes increased 24% to $139 billion in 2017. In comparison, our real estate capital markets businesses, which includes investment sales and commercial mortgage brokerage, increased its revenues by 19% year-over-year, primarily due to organic growth. In addition, our loan origination volume increased by 16%, while our revenues from mortgage banking activities increased by 7%.
According to NKF Research, the combined average vacancy rate for office, industrial, and retail properties ended the year at 8.2%, down from 8.3% a year earlier, only a modest 10 basis point drop over the past 12 months. Rents for all property types in the U.S. continued to improve slightly across all 3 sectors. NKF Research estimates that overall U.S. leasing activity in 2017 slowed down from a year ago, as the expansion has decelerated in recent quarters following consistent growth since the start of the current cycle. In comparison, revenues from our leasing and other services business increased by 20.1%.
REGULATORY ENVIRONMENT
See “Regulation” in Part I, Item 1 of this Annual Report on Form 10-K for information related to our regulatory environment.
LIQUIDITY
See “Liquidity and Capital Resources” herein for information related to our liquidity and capital resources.
HIRING AND ACQUISITIONS
Key drivers of our revenue are front-office producer headcount and average revenue per producer. We believe that our strong technology platform and unique partnership structure have enabled us to use both acquisitions and recruiting to profitably increase our front-office staff at a faster rate than our largest competitors since our formation in 2004.
We have invested significantly to capitalize on the current business environment through acquisitions, technology spending and the hiring of new brokers, salespeople, managers and other front-office personnel. The business climate for these acquisitions has been competitive, and it is expected that these conditions will persist for the foreseeable future. We have been able to attract businesses and brokers, salespeople, managers and other front-office personnel to our platform as we believe they recognize that we have the scale, technology, experience and expertise to succeed in the current business environment.
As of December 31, 2017, our front-office headcount was up slightly year-over-year at 4,045 brokers, salespeople, managers and other front-office personnel. For the year ended December 31, 2017, average revenue generated per front-office employee increased by 10% from a year ago to approximately $725 thousand. Within the Financial Services segment, front-office headcount was 2,491 brokers, salespeople, managers, and other front-office personnel at the end of the year, while average revenue generated per front-office employee increased 7% to $676 thousand. In Real Estate Services, front-office employee headcount increased to 1,554, while average revenue generated per front-office employee increased 14% to $806 thousand. Our average revenue per front-office employee has historically declined year-over-year for the period immediately following significant headcount increases, and the additional brokers and salespeople generally achieve significantly higher productivity levels in their second or third year with the Company.
The laws and regulations passed or proposed on both sides of the Atlantic concerning OTC trading seem likely to favor increased use of technology by all market participants, and are likely to accelerate the adoption of both hybrid and fully electronic trading. We believe these developments will favor the larger inter-dealer brokers over smaller, non-public local competitors, as the smaller players generally do not have the financial resources to invest the necessary amounts in technology. We believe this will lead to further consolidation across the wholesale financial brokerage industry, and thus allow us to profitably grow our front-office headcount.
Since 2015, our Financial Services acquisitions have included GFI, Perimeter Markets Inc. (“Perimeter Markets”), Lucera, Sunrise Brokers Group (“Sunrise Brokers”), Micromega Securities Proprietary Limited (“Micromega Securities”), Besso, and several smaller acquisitions.
114
On February 26, 2015, we announced the successful completion of our tender offer for the majority of GFI’s outstanding common shares. GFI is a leading intermediary in the global OTC and Listed markets, offering an array of sophisticated trading technologies and products. GFI generated more than $880 million in revenues in 2014, including revenues from its Trayport and Kyte businesses, which have since been sold. The acquisition of GFI represented the largest acquisition in our history. On January 12, 2016, we completed the merger with GFI by acquiring the remaining shares of GFI. This combination dramatically increases the scale and scope of the Company and the combined company is now the largest interdealer-broker and wholesale financial broker in the industry.
On December 11, 2015, we completed the sale of all of the equity interests in the entities that make up the Trayport business to ICE. At the closing, we received 2,527,658 shares of ICE common stock issued with respect to the $650 million purchase price, which was adjusted at closing. In 2015, we also completed the sale of all the equity interests of The Kyte Group Limited (which primarily included the Company’s clearing business) and Kyte Broking Limited.
On September 23, 2016, we completed the acquisition of Perimeter Markets, an independent provider of electronic fixed income and futures trading in Canada, through its CBID™ platforms.
On November 4, 2016, the Company acquired the 80% of the Lucera business (also known as “LFI Holdings, LLC” or “LFI”) not already owned by the Company. Lucera, a technology infrastructure provider tailored to the financial sector, is a limited liability company headquartered in New York.
On December 15, 2016, we completed the acquisition of the businesses of Sunrise Brokers, an independent financial brokerage specializing in worldwide equity derivatives. Based in London, and with offices in New York and Hong Kong, Sunrise Brokers was voted overall “Number One Equity Products Broker of the Year” by Risk Magazine for the past nine years, and the top broker in “Equity Exotic Derivatives” for 13 years running. Sunrise Brokers has approximately 135 brokers, generated approximately $90 million in revenues in 2015, and has grown its revenues and profits for each of the previous three years.
On January 4, 2017, we announced that we had entered into an agreement to acquire Besso Insurance Group Limited (“Besso”), an independent Lloyd’s of London insurance broker with a strong reputation across Property, Casualty, Marine, Aviation, Professional and Financial Risks and Reinsurance. Besso generated revenue of approximately £44 million in the financial year ended December 31, 2016. Completion of the transaction occurred on February 28, 2017.
On January 31, 2017, we completed the acquisition of Micromega Securities, which operates in the South African fixed income, rates and foreign exchange markets.
Since 2015, our Real Estate Services acquisitions have included Computerized Facilities Integration (“CFI”), Excess Space, Steffner Commercial Real Estate, Cincinnati Commercial Real Estate, Inc. (“CCR”), Rudesill-Pera Multifamily, LLC, CRE Group, certain assets of the John Buck Company, LLC and Buck Management Group LLC, Continental Realty, Newmark Grubb Mexico City, Walchle Lear Multifamily Advisors, Commercial Real Estate Consulting Firm and Berkeley Point.
Berkeley Point was acquired by a controlled affiliate of Cantor on April 10, 2014. BPF was sold by this affiliate to BGC on September 8, 2017. This transaction has been determined to be a combination of entities under common control that resulted in a change in the reporting entity. Accordingly, our financial results have been retrospectively adjusted to include the financial results of Berkley Point in the current and prior periods as if Berkley Point had always been consolidated.
On May 20, 2015, we completed the acquisition of CFI, a premier real estate strategic consulting and systems integration firm that services clients that occupy over three billion square feet globally for Fortune 500 companies, owner-occupiers, government agencies, healthcare and higher education clients. CFI provides corporate real estate, facilities management, and enterprise asset management information consulting and technology solutions that yield hundreds of millions of dollars in cost savings for its client base on an annual basis. The acquisition is expected to complement and drive future growth opportunities within NKF’s management services business and within CFI’s extensive client base.
On July 1, 2015, we completed the acquisition of Excess Space. Excess Space is a premier consulting and advisory firm dedicated to real estate disposition and lease restructuring for retailers throughout the U.S. and Canada. It advises some of the nation’s leading supermarkets, department stores, banks, drug stores and restaurants. Since its establishment in 1992, Excess Space has generated an estimated $4 billion in cost savings for clients. We are confident that the acquisition of Excess Space will enhance our business, strengthen the services within our global retail platform, and bring value to our clients.
On December 11, 2015, we completed the acquisition of Steffner Commercial Real Estate, which operates as Newmark Grubb Memphis, a full-service commercial real estate advisory practice in the metropolitan Memphis, Tennessee region. This acquisition represented the cornerstone in our plan to grow our presence across the Mid-South region, which includes Alabama, Arkansas, Kentucky, Louisiana, Mississippi, and Tennessee.
115
On December 28, 2015, we completed the acquisition of CCR, which is headquartered in Cincinnati, Ohio. CCR has a deep and successful track record in office, industrial and retail leasing and investment sales, representing a diversified client base that ranges from top Fortune 500 companies and institutions to privately owned firms. The acquisition bolsters our presence in the Midwest and will help drive growth opportunities for the firm’s existing Midwest operations.
On February 26, 2016, we completed the acquisition of Rudesill-Pera Multifamily, LLC (“Memphis Multifamily”). Memphis Multifamily is a multifamily brokerage firm operating in Memphis and the Mid-South Region.
On June 17, 2016, we completed the acquisition of CRE Group. CRE Group is a San Francisco Bay Area-based real estate services provider focused on project management, construction management and Leadership in Energy and Environmental Design (“LEED”) consulting.
On September 13, 2016, we acquired several management agreement contracts from the John Buck Company, LLC and Buck Management Group, LLC, which are expected to contribute to our commercial real estate leasing brokerage revenues.
On September 30, 2016 we completed our acquisition of Continental Realty LTD., (“Continental Realty”). Continental Realty is one of the largest commercial realty brokerage operations in Central Ohio. The firm has developed a team of real estate professionals with expertise in all aspects of commercial brokerage including office, industrial, retail, and land and investment sales.
On October 18, 2016, we announced that we have completed our acquisition of Newmark Grubb Mexico City. Newmark Grubb Mexico City is known as one of the premier tenant advisory firms in the Mexico City area. Mexico City represents the world’s twelfth largest metropolitan area by population.
On December 14, 2016, we completed the acquisition of Walchle Lear Multifamily Advisors. The acquired practice, a premier multifamily investment sales brokerage firm based in Jacksonville Beach, Florida, will operate under NKF’s ARA brand.
On February 8, 2017, we announced that we have completed the acquisition of the assets of Regency Capital Partners, a real estate capital advisory firm regarded for its specialized financing expertise, headquartered in San Francisco.
During September 2017, Newmark completed the acquisition of the assets of six Integra Realty Resources offices. The addition of these Integra offices bolstered Newmark’s Valuation & Advisory practice throughout the northeastern U.S and Atlanta.
FINANCIAL OVERVIEW
Revenues
Our revenues are derived primarily from brokerage commissions charged for either agency or matched principal transactions, revenues from real estate management services, fees from related parties, fees charged for market data, analytics and post-trade products, fees from software solutions, and interest income.
Brokerage
We earn revenues from our voice brokerage services on both an agency and matched principal basis. In agency transactions, we charge a commission for connecting buyers and sellers and assisting in the negotiation of the price and other material terms of the transaction. After all material terms of a transaction are agreed upon, we identify the buyer and seller to each other and leave them to settle the trade directly. Principal transaction revenues are primarily derived from matched principal transactions, whereby revenues are earned on the spread between the buy and the sell price of the brokered security, commodity or derivative. Customers either see the buy or sell price on a screen or are given this information over the phone. The brokerage fee is then added to the buy or sell price, which represents the spread we earn as principal transactions revenues. On a limited basis, we enter into unmatched principal transactions to facilitate a customer’s execution needs for transactions initiated by such customers. We also provide market data products for selected financial institutions.
116
We offer our brokerage services in seven broad product categories: rates, credit, FX, energy & commodities, equities, insurance, and other asset classes, leasing and other services, and real estate capital markets. The chart below details brokerage revenues by product category and by voice/hybrid versus fully electronic (in thousands):
|
|
|
For the Year Ended December 31, |
|
|||||||||
|
|
|
2017 |
|
|
2016 |
|
|
2015 |
|
|||
|
Brokerage revenue by product:1 |
|
|
|
|
|
|
|
|
|
|
|
|
|
Rates |
|
$ |
510,880 |
|
|
$ |
468,798 |
|
|
$ |
471,239 |
|
|
Credit |
|
|
284,551 |
|
|
|
291,760 |
|
|
|
271,601 |
|
|
Foreign exchange |
|
|
324,386 |
|
|
|
303,310 |
|
|
|
324,774 |
|
|
Energy and commodities |
|
|
204,016 |
|
|
|
222,876 |
|
|
|
196,190 |
|
|
Equities, insurance, and other asset classes |
|
|
327,390 |
|
|
|
174,985 |
|
|
|
172,320 |
|
|
Leasing and other services |
|
|
617,005 |
|
|
|
513,812 |
|
|
|
539,727 |
|
|
Real estate capital markets |
|
|
397,736 |
|
|
|
335,607 |
|
|
|
267,204 |
|
|
Total brokerage revenues |
|
$ |
2,665,964 |
|
|
$ |
2,311,148 |
|
|
$ |
2,243,055 |
|
|
Brokerage revenue by product (percentage): |
|
|
|
|
|
|
|
|
|
|
|
|
|
Rates |
|
|
19.2 |
% |
|
|
20.3 |
% |
|
|
21.0 |
% |
|
Credit |
|
|
10.7 |
|
|
|
12.6 |
|
|
|
12.1 |
|
|
Foreign exchange |
|
|
12.1 |
|
|
|
13.1 |
|
|
|
14.5 |
|
|
Energy and commodities |
|
|
7.7 |
|
|
|
9.6 |
|
|
|
8.7 |
|
|
Equities, insurance, and other asset classes |
|
|
12.3 |
|
|
|
7.6 |
|
|
|
7.7 |
|
|
Leasing and other services |
|
|
23.1 |
|
|
|
22.2 |
|
|
|
24.1 |
|
|
Real estate capital markets |
|
|
14.9 |
|
|
|
14.6 |
|
|
|
11.9 |
|
|
Total brokerage revenues |
|
|
100.0 |
% |
|
|
100.0 |
% |
|
|
100.0 |
% |
|
Brokerage revenue by type: |
|
|
|
|
|
|
|
|
|
|
|
|
|
Real estate |
|
$ |
1,014,741 |
|
|
$ |
849,419 |
|
|
$ |
806,931 |
|
|
Financial Services voice/hybrid |
|
|
1,482,929 |
|
|
|
1,307,406 |
|
|
|
1,287,826 |
|
|
Financial Services fully electronic |
|
|
168,294 |
|
|
|
154,323 |
|
|
|
148,298 |
|
|
Total brokerage revenues |
|
$ |
2,665,964 |
|
|
$ |
2,311,148 |
|
|
$ |
2,243,055 |
|
|
Brokerage revenue by type (percentage): |
|
|
|
|
|
|
|
|
|
|
|
|
|
Real estate |
|
|
38.1 |
% |
|
|
36.7 |
% |
|
|
36.0 |
% |
|
Financial Services voice/hybrid |
|
|
55.6 |
|
|
|
56.6 |
|
|
|
57.4 |
|
|
Financial Services fully electronic |
|
|
6.3 |
|
|
|
6.7 |
|
|
|
6.6 |
|
|
Total brokerage revenues |
|
|
100.0 |
% |
|
|
100.0 |
% |
|
|
100.0 |
% |
|
1 |
Reclassifications of revenues across product categories may be reflected retroactively. |
As the above table indicates, our brokerage operations in the rates product category produce a significant percentage of our total brokerage revenues. We expect that revenues from our rates product brokerage operations will increase in absolute terms, but decline as a percentage of revenues as we continue to invest in expanding in other asset classes.
Our position as a leading wholesale financial broker is enhanced by our hybrid brokerage platform. We believe that the more complex, less liquid markets on which we focus often require significant amounts of personal and attentive service from our brokers. In more mature markets, we offer fully electronic trading capabilities to our customers through our platforms including FENICS and BGC Trader. Our hybrid platform allows our customers to trade on a voice, hybrid or, where available, fully electronic basis, regardless of whether the trade is OTC or exchange-based, and to benefit from the experience and market intelligence of our worldwide brokerage network. Our electronic capabilities include clearing, settlement, post-trade, and other back-office services as well as straight-through processing for our customers across several products. Furthermore, we benefit from the operational leverage in our fully electronic platform. We believe our hybrid brokerage approach provides a competitive advantage over competitors who do not offer this full range of technology.
Rates
Our rates business is focused on government debt, futures and currency, and both listed and OTC interest rate derivatives, which are among the largest, most global and most actively traded markets. The main drivers of these markets are global macroeconomic forces such as growth, inflation, government budget policies and new issuances.
117
We provide our brokerage services in a wide range of credit instruments, including asset-backed securities, convertible bonds, corporate bonds, credit derivatives and high yield bonds.
Foreign Exchange
The foreign exchange market is one of the largest financial markets in the world. Foreign exchange transactions can either be undertaken in the spot market, in which one currency is sold and another is bought, or in the derivative market in which future settlement of the identical underlying currencies are traded. We provide full execution OTC brokerage services in most major currencies, including all G8 currencies, emerging market, cross and exotic options currencies.
Energy and Commodities
We provide brokerage services for most widely traded energy and commodities products, including futures and OTC products covering, refined and crude oil, liquid natural gas, coal, electricity, gold and other precious metals, base metals, emissions, and soft commodities.
Equities, Insurance, and Other Asset Classes
We provide brokerage services in a range of markets for equity products, including cash equities, equity derivatives (both listed and OTC), equity index futures and options on equity products as well as insurance products.
Leasing and Other Services
We offer a diverse range of commercial real estate brokerage and advisory services, including tenant and agency representation, which includes comprehensive lease negotiations, strategic planning, site selection, lease auditing, appraisal services and other financial and market analysis.
Real Estate Capital Markets
Our real estate capital markets business specializes in the arrangement of acquisitions and dispositions of commercial properties, as well as providing other financial services including the arrangement of debt and equity financing, and loan sale advisory.
Gains from Mortgage Banking Activities, Net
We are principally engaged in the origination, funding, and sale of multifamily and commercial mortgage loans. After sale, we generally retain the right to service the loans and may share in the risk of loss.
Real Estate Management and Other Services
We provide commercial property management services to tenants and landlords in several key U.S. markets. In this business, we provide property and facilities management services along with project management and other consulting services to customers who utilize our commercial real estate brokerage services and other property owners.
Servicing Fees
We earn servicing fees for servicing commercial mortgage loans. We receive servicing fees, including ancillary and prepayment related fees, as well as interest and replacement fees on escrow balances, as compensation for servicing loans.
Fees from Related Parties
We earn fees from related parties for technology services and software licenses and for certain administrative and back-office services we provide to affiliates, particularly from Cantor. These administrative and back-office services include office space, utilization of fixed assets, accounting services, operational support, human resources, legal services and information technology.
118
FENICS Market Data is a supplier of real-time, tradable, indicative, end-of-day and historical market data. Our market data product suite includes fixed income, interest rate derivatives, credit derivatives, foreign exchange, foreign exchange options, money markets, energy and equity derivatives and structured market data products and services. The data are sourced from the voice, hybrid and electronic broking operations, as well as the market data operations, including BGC, GFI and RP Martin, among others. It is made available to financial professionals, research analysts and other market participants via direct data feeds and BGC-hosted FTP environments, as well as via information vendors such as Bloomberg, Thomson Reuters, ICE Data Services, QUICK Corp., and other select specialist vendors.
Through our software solutions business, we provide customized software to broaden distribution capabilities and provide electronic solutions to financial market participants. The software solutions business leverages our global infrastructure, software, systems, portfolio of intellectual property, and electronic trading expertise to provide customers with electronic marketplaces and exchanges and real-time auctions to enhance debt issuance and to customize trading interfaces. We take advantage of the scalability, flexibility and functionality of our electronic trading system to enable our customers to distribute products to their customers through online offerings and auctions, including private and reverse auctions, via our trading platform and global network. Using screen-based market solutions, customers are able to develop a marketplace, trade with their customers, issue debt, trade odd lots, access program trading interfaces and access our network and intellectual property. We provide option pricing and analysis tools that deliver price discovery that is supported with market data sourced from both our BGC and GFI trading systems.
In the fourth quarter of 2017, Capitalab’s Initial Margin Optimisation ("IMO") service completed its largest G-4 Interest Rates IMO to date with more than 15 participating counterparties. The service enabled these counterparties to multilaterally shrink delta, vega and curvature bilateral counterparty risks and significantly reduce both non-cleared Initial Margin (IM) and cleared IM at the Central Clearing Counterparty (CCP). In January this year, Capitalab executed the first combined compression cycle in Swaptions, Caps, Floors and cleared interest rate Swaps due to its appointment as an Approved Compression Service Provider (ACSP) at LCH’s SwapClear.
Interest Income
We generate interest income primarily from the investment of our daily cash balances, interest earned on securities owned and reverse repurchase agreements. These investments and transactions are generally short-term in nature. We also earn interest income from employee loans, and we earn dividend income on certain marketable securities.
Other Revenues
We earn other revenues from various sources including underwriting and advisory fees.
Expenses
Compensation and Employee Benefits
The majority of our operating costs consist of cash and non-cash compensation expenses, which include base salaries, broker bonuses based on broker production, guaranteed bonuses, other discretionary bonuses, and all related employee benefits and taxes. Our employees consist of brokers, executives and other administrative support. The majority of our brokers receive a base salary and a formula bonus based primarily on a pool of brokers’ production for a particular product or sales desk, as well as on the individual broker’s performance. Members of our sales force receive either a base salary or a draw on commissions. Less experienced salespeople typically receive base salaries and bonuses.
As part of our compensation plans certain employees are granted limited partnership units in BGC Holdings and Newmark Holdings which generally receive quarterly allocations of net income, that are cash distributed on a quarterly basis and generally contingent upon services being provided by the unit holders. As prescribed in U.S. GAAP guidance, the quarterly allocations of net income on such limited partnership units are reflected as a component of compensation expense under “Allocations of net income and grant of exchangeability to limited partnership units and FPUs” in our consolidated statements of operations.
Certain of these limited partnership units entitle the holders to receive post-termination payments equal to the notional amount in four equal yearly installments after the holder’s termination. These limited partnership units are accounted for as post-termination liability awards under U.S. GAAP guidance, which requires that we record an expense for such awards based on the change in value at each reporting period and include the expense in our consolidated statements of operations as part of “Compensation and employee benefits.” The liability for limited partnership units with a post-termination payout amount is included in “Accrued compensation” on our consolidated statements of financial condition.
119
Certain limited partnership units are granted exchangeability into Class A common stock on a one-for-one basis (subject to adjustment). At the time exchangeability is granted, the Company recognizes an expense based on the fair value of the award on that date, which is included in “Allocations of net income and grants of exchangeability to limited partnership units and FPUs” in our consolidated statements of operations.
We have also awarded Preferred Units. Each quarter, the net profits of BGC Holdings and Newmark Holdings are allocated to such units at a rate of either 0.6875% (which is 2.75% per calendar year) or such other amount as set forth in the award documentation (the “Preferred Distribution”), which is deducted before the calculation and distribution of the quarterly partnership distribution for the remaining partnership units. The Preferred Units are not entitled to participate in partnership distributions other than with respect to the Preferred Distribution. Preferred Units may not be made exchangeable into our Class A common stock and are only entitled to the Preferred Distribution, and accordingly they are not included in our fully diluted share count. The quarterly allocations of net income on Preferred Units are reflected in compensation expense under “Allocations of net income and grants of exchangeability to limited partnership units and FPUs” in our consolidated statements of operations.
We have entered into various agreements with certain of our employees and partners whereby these individuals receive loans which may be either wholly or in part repaid from the distribution earnings that the individual receives on their limited partnership interests or may be forgiven over a period of time. The forgivable portion of these loans is recognized as compensation expense over the life of the loan. From time to time, we may also enter into agreements with employees and partners to grant bonus and salary advances or other types of loans. These advances and loans are repayable in the timeframes outlined in the underlying agreements.
In addition, we also enter into deferred compensation agreements with employees providing services to us. The costs associated with such plans are generally amortized over the period in which they vest. See Note 23—“Compensation” to our consolidated financial statements.
Other Operating Expenses
We have various other operating expenses. We incur leasing, equipment and maintenance expenses for our affiliates worldwide. We also incur selling and promotion expenses, which include entertainment, marketing and travel-related expenses. We incur communication expenses for voice and data connections with our clients, clearing agents and general usage; professional and consulting fees for legal, audit and other special projects; and interest expense related to short-term operational funding needs, and notes payable and collateralized borrowings.
Primarily in the U.S., we pay fees to Cantor for performing certain administrative and other support, including charges for occupancy of office space, utilization of fixed assets and accounting, operations, human resources, legal services and technology infrastructure support. Management believes that these charges are a reasonable reflection of the utilization of services rendered. However, the expenses for these services are not necessarily indicative of the expenses that would have been incurred if we had not obtained these services from Cantor. In addition, these charges may not reflect the costs of services we may receive from Cantor in the future. We incur commissions and floor brokerage fees for clearing, brokerage and other transactional expenses for clearing and settlement services. We also incur various other normal operating expenses.
Other Income (Losses), Net
Gain on Divestiture and Sale of Investments
Gain on divestiture and sale of investments represent the gain we recognize for the divestiture or sale of our investments.
Gains (Losses) on Equity Method Investments
Gains (losses) on equity method investments represent our pro rata share of the net gains (losses) on investments over which we have significant influence but which we do not control.
Other Income
Other income is comprised of the gains associated with the earn-out shares related to the Nasdaq transaction and the movements related to the mark-to-market and/or hedges on marketable securities that are classified as trading securities.
120
We incur income tax expenses based on the location, legal structure and jurisdictional taxing authorities of each of our subsidiaries. Certain of the Company’s entities are taxed as U.S. partnerships and are subject to the Unincorporated Business Tax (“UBT”) in New York City. U.S. federal and state income tax liability or benefit related to the partnership income or loss, with the exception of UBT, rests with the partners (see Note 2—“Limited Partnership Interests in BGC Holdings and Newmark Holdings” for discussion of partnership interests) rather than the partnership entity. The Company’s consolidated financial statements include U.S. federal, state and local income taxes on the Company’s allocable share of the U.S. results of operations. Outside of the U.S. we operate principally through subsidiary corporations subject to local income taxes.
FINANCIAL HIGHLIGHTS
For the year ended December 31, 2017, we had income (loss) from operations before income taxes of $232.0 million compared to income (loss) from operations before income taxes of $314.2 million in the year earlier period. Total revenues for the year ended December 31, 2017 increased approximately $445.3 million to $3,353.4 million led by Newmark and our Equities, insurance, and other asset classes, Rates, and Foreign Exchange businesses.
Revenues from Equities, insurance, and other asset classes improved by more than 87.1% mainly to the additions of Sunrise and Besso. Our rates revenues increased by 9.0% in 2017, led by 36.1% growth from our FENICS rates business. The strong performance generated by FENICS rates was a result of our continued investment in technology and the ongoing conversion of our businesses to more profitable fully electronic trading. Our Foreign Exchange revenues increased by 6.9% in 2017, which was primarily driven by improved global volumes and increased market volatility. As we continue to invest in our Financial Services business, we expect our revenues and earnings to outperform those of our competitors.
Our Real Estate Services business’ overall revenues grew by approximately 18.3%. This improvement was led by an almost entirely organic 20.1% and 18.5% increase in revenues from real estate leasing and other services and real estate capital markets brokerage, respectively. As we continue to hire profitably, acquire accretively, and increase revenue per producer, we expect Newmark’s growth to outpace the industry over time.
Total expenses increased approximately $524.3 million to $3,226.1 million, due to a $376.7 million increase in compensation expenses driven by an increase in grant of exchangeability to limited partnership units. These charges related to the Company’s long-term efforts to retain executives and partners across both Financial Services and Real Estate Services, with the Company extending and/or modifying the contracts of certain brokers, salespeople, and other key personnel in both segments. Compensation expenses also reflect the impact of higher revenues on variable compensation, recent acquisitions, and hires. Non-compensation expenses increased by $147.7 million, due to increased costs and interest charges related to the acquisition of Berkeley Point and costs associated with the Newmark IPO.
We anticipate receiving over time, approximately $746 million worth of additional Nasdaq shares (based on the February 8, 2018 closing price), which are not reflected on our balance sheet. We also expect our earnings to continue to grow as we continue to add revenues from our highly profitable fully electronic products, and benefit from the strength of our Real Estate Services business. On February 6, 2018, our Board declared an 18 cent dividend for the third quarter, which is up 12.5% year-on-year. We anticipate having substantial resources with which to pay dividends, repurchase shares and/or units, profitably hire, and make accretive acquisitions, all while maintaining or improving our investment grade rating.
121
The following table sets forth our consolidated statements of operations data expressed as a percentage of total revenues for the periods indicated (in thousands):
|
|
|
Year Ended December 31, |
|
|||||||||||||||||||||
|
|
|
2017 |
|
|
2016 |
|
|
2015 |
|
|||||||||||||||
|
|
|
Actual Results |
|
|
Percentage of Total Revenues |
|
|
Actual Results |
|
|
Percentage of Total Revenues |
|
|
Actual Results |
|
|
Percentage of Total Revenues |
|
||||||
|
Revenues: |
|
|
|
|
|
|
|
|
|
|
|
|
|
|
|
|
|
|
|
|
|
|
|
|
|
Commissions |
|
$ |
2,348,108 |
|
|
|
70.0 |
% |
|
$ |
1,985,667 |
|
|
|
68.3 |
% |
|
$ |
1,929,913 |
|
|
|
69.3 |
% |
|
Principal transactions |
|
|
317,856 |
|
|
|
9.5 |
|
|
|
325,481 |
|
|
|
11.2 |
|
|
|
313,142 |
|
|
|
11.2 |
|
|
Total brokerage revenues |
|
|
2,665,964 |
|
|
|
79.5 |
|
|
|
2,311,148 |
|
|
|
79.5 |
|
|
|
2,243,055 |
|
|
|
80.5 |
|
|
Gains from mortgage banking activities, net |
|
|
205,999 |
|
|
|
6.1 |
|
|
|
193,387 |
|
|
|
6.6 |
|
|
|
115,304 |
|
|
|
4.1 |
|
|
Real estate management and other services |
|
|
233,063 |
|
|
|
7.0 |
|
|
|
196,801 |
|
|
|
6.8 |
|
|
|
187,118 |
|
|
|
6.7 |
|
|
Servicing fees |
|
|
110,441 |
|
|
|
3.3 |
|
|
|
87,671 |
|
|
|
3.0 |
|
|
|
74,356 |
|
|
|
2.7 |
|
|
Fees from related parties |
|
|
28,467 |
|
|
|
0.8 |
|
|
|
25,570 |
|
|
|
0.9 |
|
|
|
26,843 |
|
|
|
1.0 |
|
|
Data, software and post-trade |
|
|
54,557 |
|
|
|
1.6 |
|
|
|
54,309 |
|
|
|
1.9 |
|
|
|
102,371 |
|
|
|
3.7 |
|
|
Interest income |
|
|
51,103 |
|
|
|
1.5 |
|
|
|
33,876 |
|
|
|
1.1 |
|
|
|
24,742 |
|
|
|
0.9 |
|
|
Other revenues |
|
|
3,762 |
|
|
|
0.2 |
|
|
|
5,334 |
|
|
|
0.2 |
|
|
|
9,957 |
|
|
|
0.4 |
|
|
Total revenues |
|
|
3,353,356 |
|
|
|
100.0 |
|
|
|
2,908,096 |
|
|
|
100.0 |
|
|
|
2,783,746 |
|
|
|
100.0 |
|
|
Expenses: |
|
|
|
|
|
|
|
|
|
|
|
|
|
|
|
|
|
|
|
|
|
|
|
|
|
Compensation and employee benefits |
|
|
2,016,180 |
|
|
|
60.1 |
|
|
|
1,733,207 |
|
|
|
59.6 |
|
|
|
1,759,855 |
|
|
|
63.2 |
|
|
Allocations of net income and grant of exchangeability to limited partnership units and FPUs |
|
|
286,628 |
|
|
|
8.6 |
|
|
|
192,934 |
|
|
|
6.6 |
|
|
|
259,639 |
|
|
|
9.3 |
|
|
Total compensation and employee benefits |
|
|
2,302,808 |
|
|
|
68.7 |
|
|
|
1,926,141 |
|
|
|
66.2 |
|
|
|
2,019,494 |
|
|
|
72.5 |
|
|
Occupancy and equipment |
|
|
205,332 |
|
|
|
6.1 |
|
|
|
203,947 |
|
|
|
7.0 |
|
|
|
221,786 |
|
|
|
8.0 |
|
|
Fees to related parties |
|
|
29,028 |
|
|
|
0.9 |
|
|
|
24,143 |
|
|
|
0.8 |
|
|
|
19,202 |
|
|
|
0.7 |
|
|
Professional and consulting fees |
|
|
97,639 |
|
|
|
2.9 |
|
|
|
67,208 |
|
|
|
2.3 |
|
|
|
73,584 |
|
|
|
2.6 |
|
|
Communications |
|
|
131,188 |
|
|
|
3.9 |
|
|
|
125,592 |
|
|
|
4.3 |
|
|
|
121,690 |
|
|
|
4.4 |
|
|
Selling and promotion |
|
|
114,906 |
|
|
|
3.4 |
|
|
|
100,602 |
|
|
|
3.5 |
|
|
|
100,047 |
|
|
|
3.6 |
|
|
Commissions and floor brokerage |
|
|
44,086 |
|
|
|
1.3 |
|
|
|
38,515 |
|
|
|
1.3 |
|
|
|
35,456 |
|
|
|
1.3 |
|
|
Interest expense |
|
|
102,504 |
|
|
|
3.1 |
|
|
|
71,365 |
|
|
|
2.5 |
|
|
|
79,029 |
|
|
|
2.8 |
|
|
Other expenses |
|
|
198,562 |
|
|
|
5.9 |
|
|
|
144,213 |
|
|
|
5.0 |
|
|
|
194,334 |
|
|
|
7.0 |
|
|
Total expenses |
|
|
3,226,053 |
|
|
|
96.2 |
|
|
|
2,701,726 |
|
|
|
92.9 |
|
|
|
2,864,622 |
|
|
|
102.9 |
|
|
Other income (losses), net: |
|
|
|
|
|
|
|
|
|
|
|
|
|
|
|
|
|
|
|
|
|
|
|
|
|
Gain (loss) on divestiture and sale of investments |
|
|
561 |
|
|
|
— |
|
|
|
7,044 |
|
|
|
0.2 |
|
|
|
394,347 |
|
|
|
14.2 |
|
|
Gains (losses) on equity method investments |
|
|
6,189 |
|
|
|
0.2 |
|
|
|
3,543 |
|
|
|
0.1 |
|
|
|
2,597 |
|
|
|
0.1 |
|
|
Other income (loss) |
|
|
97,944 |
|
|
|
2.9 |
|
|
|
97,213 |
|
|
|
3.4 |
|
|
|
122,708 |
|
|
|
4.4 |
|
|
Total other income (losses), net |
|
|
104,694 |
|
|
|
3.1 |
|
|
|
107,800 |
|
|
|
3.7 |
|
|
|
519,652 |
|
|
|
18.7 |
|
|
Income (loss) from operations before income taxes |
|
|
231,997 |
|
|
|
6.9 |
|
|
|
314,170 |
|
|
|
10.8 |
|
|
|
438,776 |
|
|
|
15.8 |
|
|
Provision (benefit) for income taxes |
|
|
150,268 |
|
|
|
4.5 |
|
|
|
60,332 |
|
|
|
2.1 |
|
|
|
120,619 |
|
|
|
4.3 |
|
|
Consolidated net income (loss) |
|
|
81,729 |
|
|
|
2.4 |
|
|
|
253,838 |
|
|
|
8.7 |
|
|
|
318,157 |
|
|
|
11.5 |
|
|
Less: Net income (loss) attributable to noncontrolling interest in subsidiaries |
|
|
30,254 |
|
|
|
0.9 |
|
|
|
68,816 |
|
|
|
2.4 |
|
|
|
158,198 |
|
|
|
5.7 |
|
|
Net income (loss) available to common stockholders |
|
$ |
51,475 |
|
|
|
1.5 |
% |
|
$ |
185,022 |
|
|
|
6.3 |
% |
|
$ |
159,959 |
|
|
|
5.8 |
% |
Year Ended December 31, 2017 Compared to Year Ended December 31, 2016
Revenues
Brokerage Revenues
Total brokerage revenues increased by $354.8 million, or 15.4%, to $2,666.0 million for the year ended December 31, 2017 as compared to the year ended December 31, 2016. Commission revenues increased by $362.4 million, or 18.3%, to $2,348.1 million for the year ended December 31, 2017 as compared to the year ended December 31, 2016. Principal transactions revenues decreased by $7.6 million, or 2.3%, to $317.9 million for the year ended December 31, 2017 as compared to the year ended December 31, 2016.
122
The increase in brokerage revenues was primarily driven by increases in revenues from equities, insurance, and other asset classes, rates and foreign exchange, leasing and other services, real estate capital markets brokerage, partially offset by lower revenues in energy & commodities and credit.
Our brokerage revenues from equities, insurance, and other asset classes increased by $152.4 million, or 87.1%, to $327.4 million for the year ended December 31, 2017. This increase was primarily driven by our acquisitions of Sunrise Brokers in December 2016 and Besso in February 2017.
Our rates revenues increased by $42.1 million, or 9.0%, to $510.9 million in the year ended December 31, 2017. The increase in rates revenues reflected strong improvement in our fully electronic rates business, which was a result of our continued investment in technology and the ongoing conversion of our businesses to more profitable fully electronic trading.
Our FX revenues increased by $21.1 million, or 6.9%, to $324.4 million for the year ended December 31, 2017. This increase was primarily driven by improved global volumes and increased market volatility.
Our brokerage revenues from energy and commodities decreased by $18.9 million, or 8.5%, to $204.0 million for the year ended December 31, 2017. This decrease was primarily driven by lower global volumes.
Our credit revenues decreased by $7.2 million, or 2.5%, to $284.6 million in the year ended December 31, 2017. This decrease was mainly due to lower global volumes and a decline in fully electronic credit brokerage .
Leasing and other services revenues increased by $103.2 million, or 20.1%, to $617.0 million for the year ended December 31, 2017 as compared to the prior year period. This increase was primarily driven by organic growth.
Real estate capital markets revenues increased by $62.1 million, or 18.5%, to $397.7 million for the year ended December 31, 2017 as compared to the prior year period. Growth across leasing and real estate capital markets was primarily due to organic growth.
Gains from Mortgage Banking Activities, Net
Gains from mortgage banking activities, net revenues increased by $12.6 million, or 6.5%, to $206.0 million for the year ended December 31, 2017. This increase was primarily due to stronger production in Berkeley Point’s multifamily agency loan originations business.
Real Estate Management and Other Services
Real estate management and other services revenue increased by $36.3 million, or 18.4%, to $233.1 million for the year ended December 31, 2017 primarily due to organic growth and acquisitions.
Servicing Fees
Servicing fees revenue increased by $22.8 million, or 26.0%, to $110.4 million for the year ended December 31, 2017 as compared to the year ended December 31, 2016. The increase was primarily due to growth in Berkeley Point’s primary servicing portfolio.
Fees from Related Parties
Fees from related parties increased by $2.9 million, or 11.3%, to $28.5 million for the year ended December 31, 2017 as compared to the year ended December 31, 2016.
Data, Software and Post-Trade
Data, software and post-trade revenues increased by $0.2 million, or 0.5%, to $54.6 million for the year ended December 31, 2017 as compared to the year ended December 31, 2016.
123
Interest income increased by $17.2 million, or 50.9%, to $51.1 million for the year ended December 31, 2017 as compared to the year ended December 31, 2016. This increase was primarily due to an increase in interest income from Loans held for sale on Berkeley Point, interest income on the $150.0 million Credit Facility loan to an affiliate of Cantor, dividends received, and interest income on deposits.
Other Revenues
Other revenues decreased by $1.6 million, or 29.5%, to $3.8 million for the year ended December 31, 2017 as compared to the year ended December 31, 2016. The decrease was primarily due to insurance recoveries related to Hurricane Sandy recorded in 2016.
Expenses
Compensation and Employee Benefits
Compensation and employee benefits expense increased by $283.0 million, or 16.3%, to $2,016.2 million for the year ended December 31, 2017 as compared to the year ended December 31, 2016. The main drivers of this increase were the impact of higher brokerage revenues on variable compensation, and the acquisitions of Sunrise Brokers and Besso Insurance.
Allocations of Net Income and Grant of Exchangeability to Limited Partnership Units and FPUs
Allocations of net income and grant of exchangeability to limited partnership units and FPUs increased by $93.7 million, or 48.6%, to $286.6 million for the year ended December 31, 2017 as compared to the year ended December 31, 2016. This increase was primarily driven by an increase in exchangeability charges related to the Company’s long-term efforts to retain executives and partners across both Financial Services and Real Estate Services. The Company extended and/or modified the contracts of certain brokers, salespeople, and other key personnel in both segments.
Occupancy and Equipment
Occupancy and equipment expense increased by $1.4 million, or 0.7%, to $205.3 million for the year ended December 31, 2017 as compared to the year ended December 31, 2016. This increase was primarily driven by an increases in rent, occupancy, and maintenance contracts.
Fees to Related Parties
Fees to related parties increased by $4.9 million, or 20.2%, to $29.0 million for the year ended December 31, 2017 as compared to the year ended December 31, 2016. Fees to related parties are allocations paid to Cantor for administrative and support services (such as accounting, occupancy, and legal).
Professional and Consulting Fees
Professional and consulting fees increased by $30.4 million, or 45.3%, to $97.6 million for the year ended December 31, 2017 as compared to the year ended December 31, 2016. This increase was primarily driven by increased consulting fees, notably with regards to MiFID II, and legal fees.
Communications
Communications expense increased by $5.6 million, or 4.5%, to $131.2 million for the year ended December 31, 2017 as compared to the year ended December 31, 2016, which was primarily related to the acquisition of Sunrise Brokers. As a percentage of total revenues, communications slightly decreased from the prior year period.
Selling and Promotion
Selling and promotion expense increased by $14.3 million, or 14.2%, to $114.9 million for the year ended December 31, 2017 as compared to the year ended December 31, 2016. This increase was primarily due to increased advertising, marketing, and other related expenses in our Real Estate Services segment, as well as our acquisitions of Sunrise and Besso. As a percentage of total revenues, selling and promotion remained relatively unchanged across the two periods.
124
Commissions and Floor Brokerage
Commissions and floor brokerage expense increased by $5.6 million, or 14.5%, to $44.1 million for the year ended December 31, 2017 as compared to the year ended December 31, 2016. This line item tends to move in line with Financial Services brokerage revenues (excluding Insurance related revenue).
Interest Expense
Interest expense increased by $31.1 million, or 43.6%, to $102.5 million for the year ended December 31, 2017 as compared to the year ended December 31, 2016. The increase was primarily driven by the $575.0 million senior term loan borrowing, the $400.0 million senior revolving credit facility, the $150.0 million credit facility, and an increase in interest expense on Warehouse notes payable.
Other Expenses
Other expenses increased by $54.3 million, or 37.7%, to $198.6 million for the year ended December 31, 2017 as compared to the year ended December 31, 2016, which was primarily related to impairment charges on intangible assets as well as costs associated with acquisitions, amortization expense on acquired intangibles, amortization expense related to mortgage servicing rights, and other provisions.
Other Income (Losses), net
Gain (Loss) on Divestiture and Sale of Investments
We had a gain on divestiture of $0.6 million in the year ended December 31, 2017, as a result of the sale of investments. For the year ended December 31, 2016, there was a gain on divestiture of $7.0 million primarily related to the sale of certain cost method investments.
Gains (Losses) on Equity Method Investments
Gains (losses) on equity method investments increased by $2.6 million, or 74.7%, to a gain of $6.2 million, for the year ended December 31, 2017 as compared to a gain of $3.5 million for the year ended December 31, 2016. Gains (losses) on equity method investments represent our pro rata share of the net gains or losses on investments over which we have significant influence but which we do not control.
Other Income (Loss)
Other income (loss) increased by $0.7 million, or 0.8%, to $97.9 million for the year ended December 31, 2017 as compared to the year ended December 31, 2016.
Provision (Benefit) for Income Taxes
Provision (benefit) for income taxes increased by $89.9 million, or 149.1%, to $150.3 million for the year ended December 31, 2017 as compared to the year ended December 31, 2016. This increase was primarily driven by the effect of the remeasurement of deferred tax assets and liabilities and the one-time transition tax on accumulated foreign earnings as a result of the enactment of the Tax Cut and Jobs Act. In general, our consolidated effective tax rate can vary from period to period depending on, among other factors, the geographic and business mix of our earnings. The Tax Act is expected to have a favorable impact on the Company’s effective tax rate and net income as reported under generally accepted accounting principles both in the first fiscal quarter of 2018 and subsequent reporting periods to which the Tax Act is effective.
Net Income (Loss) Attributable to Noncontrolling Interest in Subsidiaries
Net income (loss) attributable to noncontrolling interest in subsidiaries decreased by $38.6 million, or 56.0%, to $30.3 million, for the year ended December 31, 2017 as compared to the year ended December 31, 2016. This decrease was primarily driven by a decrease in earnings.
125
Year Ended December 31, 2016 Compared to Year Ended December 31, 2015
Revenues
Brokerage Revenues
Total brokerage revenues increased by $68.1 million, or 3.0%, to $2,311.1 million for the year ended December 31, 2016 as compared to the year ended December 31, 2015. Commission revenues increased by $55.8 million, or 2.9%, to $1,985.7 million for the year ended December 31, 2016 as compared to the year ended December 31, 2015. Principal transactions revenues increased by $12.3 million, or 3.9%, to $325.5 million for the year ended December 31, 2016 as compared to the year ended December 31, 2015.
The increase in brokerage revenues was primarily driven by increases in revenues from real estate capital markets brokerage, energy & commodities, credit and equities, insurance, and other asset classes, partially offset by lower revenues in leasing and other services, foreign exchange and rates.
Our rates revenues decreased by $2.4 million, or 0.5%, to $468.8 million in the year ended December 31, 2016. The decrease in rates revenues was primarily due to industry-wide declines in wholesale market activity.
Our credit revenues increased by $20.2 million, or 7.4%, to $291.8 million in the year ended December 31, 2016. This increase was mainly due to expansion of the business into new sectors and an uptick in fully electronic credit brokerage.
Our FX revenues decreased by $21.5 million, or 6.6%, to $303.3 million for the year ended December 31, 2016. This decrease was primarily driven by lower global volumes.
Our brokerage revenues from energy and commodities increased by $26.7 million, or 13.6%, to $222.9 million for the year ended December 31, 2016. This increase was primarily driven by our acquisition of GFI.
Our brokerage revenues from equities, insurance, and other asset classes increased by $2.7 million, or 1.5%, to $175.0 million for the year ended December 31, 2016.
Leasing and other services revenues decreased by $25.9 million, or 4.8%, to $513.8 million for the year ended December 31, 2016 as compared to the prior year period. This decrease was primarily driven by lower volumes. According to NKF Research, leasing activity during 2016 was down by more than 5% relative to prior year.
Real estate capital markets revenues increased by $68.4 million, or 25.6%, to $335.6 million for the year ended December 31, 2016 as compared to the prior year period. This increase was primarily driven by organic growth as recent new hires increased their productivity and came despite lower industry volumes.
Gains from Mortgage Banking Activities, Net
Gains from mortgage banking activities, net revenues increased by $78.1 million, or 67.7%, to $193.4 million for the year ended December 31, 2016. This increase was primarily driven by an increase in Berkeley Point loan origination volume.
Real Estate Management and Other Services
Real estate management and other services revenue increased by $9.7 million, or 5.2%, to $196.8 million for the year ended December 31, 2016 primarily due to organic growth.
Servicing Fees
Servicing fees revenue increased by $13.3 million, or 17.9%, to $87.7 million for the year ended December 31, 2016 as compared to the year ended December 31, 2015. The increase was primarily driven by an increase in Berkeley Point loan originations for which the servicing rights were retained.
Fees from Related Parties
Fees from related parties decreased by $1.3 million, or 4.7%, to $25.6 million for the year ended December 31, 2016 as compared to the year ended December 31, 2015.
126
Data, software and post-trade revenues decreased by $48.1 million, or 46.9%, to $54.3 million for the year ended December 31, 2016 as compared to the year ended December 31, 2015. The decrease was primarily driven by the sale of Trayport, which generated $58.6 million of net revenues in 2015.
Interest Income
Interest income increased by $9.1 million, or 36.9%, to $33.9 million for the year ended December 31, 2016 as compared to the year ended December 31, 2015. This increase was primarily due to an increase in interest income from Loans held for sale on Berkeley Point and employee loans.
Other Revenues
Other revenues decreased by $4.6 million, or 46.4%, to $5.3 million for the year ended December 31, 2016 as compared to the year ended December 31, 2015. The decrease was primarily due to decreases in dividends on investments and miscellaneous recoveries.
Expenses
Compensation and Employee Benefits
Compensation and employee benefits expense decreased by $26.6 million, or 1.5%, to $1,733.2 million for the year ended December 31, 2016 as compared to the year ended December 31, 2015. The main drivers of this decrease were cost savings associated with the GFI synergies.
Allocations of Net Income and Grant of Exchangeability to Limited Partnership Units and FPUs
Allocations of net income and grant of exchangeability to limited partnership units and FPUs decreased by $66.7 million, or 25.7%, to $192.9 million for the year ended December 31, 2016 as compared to the year ended December 31, 2015. This decrease was primarily driven by a decrease in exchangeability charges partially offset by an increase in allocation of net income to limited partnership units during the year ended December 31, 2016 as compared to the year ended December 31, 2015.
Occupancy and Equipment
Occupancy and equipment expense decreased by $17.8 million, or 8.0%, to $203.9 million for the year ended December 31, 2016 as compared to the year ended December 31, 2015. This decrease was primarily driven by a decrease in fixed asset impairment charges resulting from the synergies associated with the integration of GFI in 2015.
Fees to Related Parties
Fees to related parties increased by $4.9 million, or 25.7%, to $24.1 million for the year ended December 31, 2016 as compared to the year ended December 31, 2015. Fees to related parties are allocations paid to Cantor for administrative and support services (such as accounting, occupancy, and legal).
Professional and Consulting Fees
Professional and consulting fees decreased by $6.4 million, or 8.7%, to $67.2 million for the year ended December 31, 2016 as compared to the year ended December 31, 2015. In the year earlier period, there were increased expenses in this category with respect to the acquisition of GFI and the sale of Trayport.
Communications
Communications expense increased by $3.9 million, or 3.2%, to $125.6 million for the year ended December 31, 2016 as compared to the year ended December 31, 2015. As a percentage of total revenues, communications remained relatively unchanged across the two periods.
127
Selling and promotion expense increased by $0.6 million, or 0.6%, to $100.6 million for the year ended December 31, 2016 as compared to the year ended December 31, 2015. As a percentage of total revenues, selling and promotion remained relatively unchanged across the two periods.
Commissions and Floor Brokerage
Commissions and floor brokerage expense increased by $3.1 million, or 8.6%, to $38.5 million for the year ended December 31, 2016 as compared to the year ended December 31, 2015. This line item tends to move in line with Financial Services brokerage revenues.
Interest Expense
Interest expense decreased by $7.7 million, or 9.7%, to $71.4 million for the year ended December 31, 2016 as compared to the year ended December 31, 2015. The decrease was primarily driven by lower interest rates on the 8.375% Senior Notes due to the improved credit rating following the BGC Guarantee, as well as a decrease in interest expense due to the maturity of 4.50% Convertible Senior Notes, partially offset by the interest expense on the 5.125% Senior Notes issued on May 27, 2016 and an increase in interest expense on Warehouse notes payable.
Other Expenses
Other expenses decreased by $50.1 million, or 25.8%, to $144.2 million for the year ended December 31, 2016 as compared to the year ended December 31, 2015, primarily related to commitments during the year ended December 31, 2015 to make charitable contributions.
Other Income (Losses), net
Gain (Loss) on Divestiture and Sale of Investments
We had a gain on divestiture of $7.0 million in the year ended December 31, 2016, as a result of the sale of investments. For the year ended December 31, 2015, there was a gain on divestiture of $394.3 million primarily related to the disposition of the Trayport business, which was completed on December 11, 2015.
Gains (Losses) on Equity Method Investments
Gains (losses) on equity method investments increased by $0.9 million, or 36.4%, to a gain of $3.5 million, for the year ended December 31, 2016 as compared to a gain of $2.6 million for the year ended December 31, 2015. Gains (losses) on equity method investments represent our pro rata share of the net gains or losses on investments over which we have significant influence but which we do not control.
Other Income (Loss)
Other income (loss) decreased by $25.5 million, or 20.8%, to $97.2 million for the year ended December 31, 2016 as compared to the year ended December 31, 2015. The $25.5 million year-over-year decrease was primarily due to the $29.0 million gain recorded in 2015 on the GFI shares owned by us prior to the completion of the tender offer, the mark-to-market on ICE shares ($6.8 million in 2016 compared to $16.3 million in 2015), and other acquisition related adjustments partially offset by $18.3 million related to an adjustment of future earn-out payments that will no longer be required and the Nasdaq transaction earn-out and the related mark-to-market and/or hedging ($78.7 million in 2016 compared to $68.0 million in 2015).
Provision (Benefit) for Income Taxes
Provision (benefit) for income taxes decreased by $60.3 million, or 50.0%, to $60.3 million for the year ended December 31, 2016 as compared to the year ended December 31, 2015. This decrease was primarily driven by a decrease in pre-tax earnings as a result of the gain recognized on the Trayport Transaction for the year ended December 31, 2015. In general, our consolidated effective tax rate can vary from period to period depending on, among other factors, the geographic and business mix of our earnings.
128
Net Income (Loss) Attributable to Noncontrolling Interest in Subsidiaries
Net income (loss) attributable to noncontrolling interest in subsidiaries decreased by $89.4 million, or 56.5%, to $68.8 million, for the year ended December 31, 2016 as compared to the year ended December 31, 2015.
Business Segment Financial Results
The business segments are determined based on the products and services provided and reflect the manner in which financial information is evaluated by management. We evaluate the performance and review the results of the segments based on each segment’s “Income (loss) from operations before income taxes.”
Certain financial information for our segments is presented below. The amounts shown below for the Financial Services and Real Estate Services segments reflect the amounts that are used by management to allocate resources and assess performance, which is based on each segment’s “Income (loss) from operations before income taxes.” In addition to the two business segments, the tables below include a “Corporate Items” category. Corporate revenues include fees from related parties and interest income. Corporate expenses include non-cash compensation expenses (such as the grant of exchangeability to limited partnership units, redemption/exchange of partnership units, issuance of restricted shares and allocations of net income to founding/working partner units and limited partnership units), as well as unallocated expenses, such as certain professional and consulting fees, executive compensation and interest expense, which are managed separately at the corporate level. Corporate other income (losses), net includes gains that are not considered part of the Company’s ordinary, ongoing business, such as the realized gain related to the GFI shares owned by the Company prior to the completion of the tender offer to acquire GFI on February 26, 2015, the gain related to the disposition of the equity interests in the entities that make up the Trayport business, the mark-to-market on ICE common shares and any related hedging transactions when applicable, and the adjustment of future earn-out payments.
Year ended December 31, 2017 (in thousands):
|
|
|
Financial Services |
|
|
Real Estate Services |
|
|
Corporate Items |
|
|
Total |
|
||||
|
Total revenues |
|
$ |
1,711,824 |
|
|
$ |
1,601,420 |
|
|
$ |
40,112 |
|
|
$ |
3,353,356 |
|
|
Total expenses |
|
|
1,398,264 |
|
|
|
1,301,503 |
|
|
|
526,286 |
|
|
|
3,226,053 |
|
|
Total other income (losses), net |
|
|
19,727 |
|
|
|
76,332 |
|
|
|
8,635 |
|
|
|
104,694 |
|
|
Income (loss) from operations before income taxes |
|
$ |
333,287 |
|
|
$ |
376,249 |
|
|
$ |
(477,539 |
) |
|
$ |
231,997 |
|
Year ended December 31, 2016 (in thousands):
|
|
|
Financial Services |
|
|
Real Estate Services |
|
|
Corporate Items |
|
|
Total |
|
||||
|
Total revenues |
|
$ |
1,523,235 |
|
|
$ |
1,353,720 |
|
|
$ |
31,141 |
|
|
$ |
2,908,096 |
|
|
Total expenses |
|
|
1,275,397 |
|
|
|
1,099,196 |
|
|
|
327,133 |
|
|
|
2,701,726 |
|
|
Total other income (losses), net |
|
|
78,701 |
|
|
|
— |
|
|
|
29,099 |
|
|
|
107,800 |
|
|
Income (loss) from operations before income taxes |
|
$ |
326,539 |
|
|
$ |
254,524 |
|
|
$ |
(266,893 |
) |
|
$ |
314,170 |
|
Year ended December 31, 2015 (in thousands):
|
|
|
Financial Services |
|
|
Real Estate Services |
|
|
Corporate Items |
|
|
Total |
|
||||
|
Total revenues |
|
$ |
1,548,159 |
|
|
$ |
1,201,680 |
|
|
$ |
33,907 |
|
|
$ |
2,783,746 |
|
|
Total expenses |
|
|
1,331,309 |
|
|
|
1,011,377 |
|
|
|
521,936 |
|
|
|
2,864,622 |
|
|
Total other income (losses), net |
|
|
68,033 |
|
|
|
— |
|
|
|
451,619 |
|
|
|
519,652 |
|
|
Income (loss) from operations before income taxes |
|
$ |
284,883 |
|
|
$ |
190,303 |
|
|
$ |
(36,410 |
) |
|
$ |
438,776 |
|
Segment Results for the Year Ended December 31, 2017 Compared to Year Ended December 31, 2016
Revenues
|
|
• |
Revenues for Financial Services increased approximately $188.6 million, or 12.4%, to $1,711.8 million for the year ended December 31, 2017 from $1,523.2 million for the year ended December 31, 2016. BGC’s Financial Services revenues improved primarily due to the acquisitions of Sunrise Brokers and Besso. In addition, the segment’s revenues improved due to strong double-digit percentage growth from its fully electronic rates business, as well as nearly 14.1% improvement in our foreign exchange business compared to the prior year period. |
129
Expenses
|
|
• |
Total expenses for Financial Services increased approximately $122.9 million, or 9.6%, to $1,398.3 million for the year ended December 31, 2017 from $1,275.4 million for the year ended December 31, 2016. The increase in expenses for our Financial Services segment was primarily due to the impact of higher revenues on variable compensation and recent acquisitions. |
|
|
• |
Total expenses for Real Estate Services increased approximately $202.3 million, or 18.4%, to $1,301.5 million for the year ended December 31, 2017 from $1,099.2 million for the year ended December 31, 2016. The increase in expenses for our Real Estate Services segment was primarily due to the impact of higher revenues on variable compensation, in addition to increased compensation associated with acquisitions and new hires. |
|
|
• |
Total expenses for the Corporate Items category increased approximately $199.2 million, or 60.9%, to $526.3 million for the year ended December 31, 2017 from $327.1 million for the year ended December 31, 2016. This was primarily due to higher exchangeability charges and charges related to amortization of intangibles and impairment charges in the year ended December 31, 2016. |
Other income (losses), net
|
|
• |
Other income (losses), net, for Financial Services decreased approximately $59.0 million, or 74.9%, to a gain of $19.7 million for the year ended December 31, 2017 from a gain of $78.7 million for the year ended December 31, 2016. The decrease in other income (losses), net, in our Financial Services segment was primarily due to recording the receipt of the Nasdaq earn-out payment as part of our Real Estate Services segment beginning in the third quarter of 2017. |
|
|
• |
Other income (losses), net, for Real Estate Services increased approximately $76.3 million, to a gain of $76.3 million for the year ended December 31, 2017. Beginning with the third quarter of 2017, the Company recorded the receipt of Nasdaq earn-out payments as part of other income in Real Estate services. Nasdaq payments and the impact of related mark-to-market movements and/or hedging are still recorded within our Financial Services segment for all periods prior to the third quarter of 2017. |
|
|
• |
Other income (losses), net, for the Corporate Items category decreased approximately $20.5 million, or 70.3%, to a gain of $8.6 million for the year ended December 31, 2017 from a gain of $29.1 million for the year ended December 31, 2016. The decrease in other income (losses), net for the Corporate Items category was primarily due to $18.3 million of other income related to an adjustment of future earn-out payments that will no longer be required. |
Income (loss) from operations before income taxes
|
|
• |
Income (loss) from operations before income taxes for Financial Services increased approximately $6.8 million, or 2.1%, to $333.3 million for the year ended December 31, 2017 from $326.5 million for the year ended December 31, 2016. |
|
|
• |
Income (loss) from operations before income taxes for Real Estate Services increased $121.7 million, or 47.8%, to $376.2 million for the year ended December 31, 2017 from $254.5 million for the year ended December 31, 2016. |
Segment Results for the Year Ended December 31, 2016 Compared to Year Ended December 31, 2015
Revenues
|
|
• |
Revenues for Financial Services decreased approximately $24.9 million, or 1.6%, to $1,523.2 million for the year ended December 31, 2016 from $1,548.2 million for the year ended December 31, 2015. The decrease was primarily due to lower data, software and post-trade revenues due to the sale of Trayport as well as lower volumes across global foreign exchange markets, partially offset by the addition of GFI, as well as strong growth from fully electronic credit brokerage and the data, software and post-trade businesses. Additionally, the Company reduced the number of less productive brokers and salespeople in Financial Services by approximately 120 as compared to last year, reducing revenues but increasing profitability. |
130
Expenses
|
|
• |
Total expenses for Financial Services decreased approximately $55.9 million, or 4.2%, to $1,275.4 million for the year ended December 31, 2016 from $1,331.3 million for the year ended December 31, 2015. The decrease in expenses for our Financial Services segment was primarily due to continued cost savings related to GFI synergies, as well as lower compensation expense resulting from lower brokerage revenues. |
|
|
• |
Total expenses for Real Estate Services increased approximately $87.6 million, or 8.7%, to $1,099.2 million for the year ended December 31, 2016 from $1,011.6 million for the year ended December 31, 2015. The increase in expenses for our Real Estate Services segment was primarily due to increased compensation associated with acquisitions and new hires. |
|
|
• |
Total expenses for the Corporate Items category decreased approximately $194.6 million, or 37.3%, to $327.1 million for the year ended December 31, 2016 from $521.8 million for the year ended December 31, 2015. This was primarily due to higher exchangeability charges, a reserve related to a commitment to make charitable contributions, and charges related to amortization of intangibles and impairment charges in the year ended December 31, 2015. |
Other income (losses), net
|
|
• |
Other income (losses), net, for Financial Services increased approximately $10.7 million, or 15.7%, to a gain of $78.7 million for the year ended December 31, 2016 from a gain of $68.0 million for the year ended December 31, 2015. The increase in other income (losses), net, for our Financial Services segment was primarily due to the recognition of the earn-out on the Nasdaq transaction and the mark-to-market movements and/or hedging on the Nasdaq earn-out shares. |
|
|
• |
Other income (losses), net, for the Corporate Items category decreased approximately $422.5 million, or 93.6%, to a gain of $29.1 million for the year ended December 31, 2016 from a gain of $451.6 million for the year ended December 31, 2015. The other income (losses), net for the Corporate Items category for the year ended December 31, 2015 was primarily due to the disposition of the Trayport business, which was completed on December 11, 2015. |
Income (loss) from operations before income taxes
|
|
• |
Income (loss) from operations before income taxes for Financial Services increased approximately $41.7 million, or 14.6%, to $326.5 million for the year ended December 31, 2016 from $284.9 million for the year ended December 31, 2015. |
|
|
• |
Income (loss) from operations before income taxes for Real Estate Services increased $64.3 million, or 33.8%, to $254.5 million for the year ended December 31, 2016 from $190.2 million for the year ended December 31, 2015. |
131
QUARTERLY RESULTS OF OPERATIONS
The following table sets forth our unaudited quarterly results of operations for the indicated periods (in thousands). Results of any period are not necessarily indicative of results for a full year and may, in certain periods, be affected by seasonal fluctuations in our business. Certain reclassifications have been made to prior period amounts to conform to the current period’s presentation.
|
|
|
December 31, 2017 |
|
|
September 30, 2017 3 |
|
|
June 30, 2017 3 |
|
|
March 31, 2017 3 |
|
|
December 31, 2016 3 |
|
|
September 30, 20161,2,3 |
|
|
June 30, 20161,3 |
|
|
March 31, 20161,3 |
|
||||||||
|
Revenues: |
|
|
|
|
|
|
|
|
|
|
|
|
|
|
|
|
|
|
|
|
|
|
|
|
|
|
|
|
|
|
|
|
|
Commissions |
|
$ |
643,110 |
|
|
$ |
582,106 |
|
|
$ |
577,172 |
|
|
$ |
545,720 |
|
|
$ |
520,374 |
|
|
$ |
492,808 |
|
|
$ |
497,652 |
|
|
$ |
474,833 |
|
|
Principal transactions |
|
|
75,987 |
|
|
|
75,766 |
|
|
|
80,360 |
|
|
|
85,743 |
|
|
|
70,262 |
|
|
|
76,332 |
|
|
|
86,448 |
|
|
|
92,439 |
|
|
Gains from mortgage banking activities, net |
|
|
41,736 |
|
|
|
45,455 |
|
|
|
73,547 |
|
|
|
45,261 |
|
|
|
54,378 |
|
|
|
65,377 |
|
|
|
43,599 |
|
|
|
30,033 |
|
|
Real estate management and other services |
|
|
70,046 |
|
|
|
60,798 |
|
|
|
51,589 |
|
|
|
50,630 |
|
|
|
55,841 |
|
|
|
49,373 |
|
|
|
45,529 |
|
|
|
46,058 |
|
|
Servicing fees |
|
|
29,712 |
|
|
|
29,057 |
|
|
|
26,840 |
|
|
|
24,832 |
|
|
|
25,472 |
|
|
|
22,502 |
|
|
|
20,725 |
|
|
|
18,972 |
|
|
Fees from related parties |
|
|
8,338 |
|
|
|
7,173 |
|
|
|
6,018 |
|
|
|
6,938 |
|
|
|
6,484 |
|
|
|
6,354 |
|
|
|
5,262 |
|
|
|
7,470 |
|
|
Data, software and post-trade |
|
|
14,372 |
|
|
|
13,776 |
|
|
|
13,322 |
|
|
|
13,087 |
|
|
|
12,949 |
|
|
|
13,266 |
|
|
|
14,160 |
|
|
|
13,934 |
|
|
Interest income |
|
|
10,194 |
|
|
|
11,726 |
|
|
|
19,177 |
|
|
|
10,006 |
|
|
|
9,544 |
|
|
|
8,012 |
|
|
|
7,168 |
|
|
|
9,152 |
|
|
Other revenues |
|
|
739 |
|
|
|
1,171 |
|
|
|
876 |
|
|
|
976 |
|
|
|
454 |
|
|
|
796 |
|
|
|
402 |
|
|
|
3,682 |
|
|
Total revenues |
|
|
894,234 |
|
|
|
827,028 |
|
|
|
848,901 |
|
|
|
783,193 |
|
|
|
755,758 |
|
|
|
734,820 |
|
|
|
720,945 |
|
|
|
696,573 |
|
|
Expenses: |
|
|
|
|
|
|
|
|
|
|
|
|
|
|
|
|
|
|
|
|
|
|
|
|
|
|
|
|
|
|
|
|
|
Compensation and employee benefits |
|
|
578,051 |
|
|
|
495,145 |
|
|
|
482,353 |
|
|
|
460,631 |
|
|
|
426,458 |
|
|
|
439,384 |
|
|
|
439,101 |
|
|
|
428,264 |
|
|
Allocations of net income and grants of exchangeability to limited partnership units and FPUs |
|
|
124,752 |
|
|
|
48,446 |
|
|
|
50,237 |
|
|
|
63,193 |
|
|
|
60,264 |
|
|
|
58,771 |
|
|
|
40,975 |
|
|
|
32,924 |
|
|
Total compensation and employee benefits |
|
|
702,803 |
|
|
|
543,591 |
|
|
|
532,590 |
|
|
|
523,824 |
|
|
|
486,722 |
|
|
|
498,155 |
|
|
|
480,076 |
|
|
|
461,188 |
|
|
Occupancy and equipment |
|
|
52,230 |
|
|
|
51,962 |
|
|
|
50,311 |
|
|
|
50,829 |
|
|
|
50,255 |
|
|
|
49,032 |
|
|
|
51,999 |
|
|
|
52,661 |
|
|
Fees to related parties |
|
|
12,639 |
|
|
|
4,380 |
|
|
|
5,519 |
|
|
|
6,490 |
|
|
|
8,683 |
|
|
|
5,323 |
|
|
|
3,692 |
|
|
|
6,445 |
|
|
Professional and consulting fees |
|
|
28,592 |
|
|
|
24,486 |
|
|
|
22,891 |
|
|
|
21,670 |
|
|
|
17,176 |
|
|
|
17,624 |
|
|
|
15,741 |
|
|
|
16,667 |
|
|
Communications |
|
|
33,372 |
|
|
|
33,290 |
|
|
|
32,353 |
|
|
|
32,173 |
|
|
|
30,735 |
|
|
|
31,562 |
|
|
|
31,628 |
|
|
|
31,667 |
|
|
Selling and promotion |
|
|
33,403 |
|
|
|
26,828 |
|
|
|
30,034 |
|
|
|
24,641 |
|
|
|
24,989 |
|
|
|
23,139 |
|
|
|
26,175 |
|
|
|
26,299 |
|
|
Commissions and floor brokerage |
|
|
12,770 |
|
|
|
10,410 |
|
|
|
10,476 |
|
|
|
10,430 |
|
|
|
10,505 |
|
|
|
8,645 |
|
|
|
10,210 |
|
|
|
9,155 |
|
|
Interest expense |
|
|
32,826 |
|
|
|
24,425 |
|
|
|
26,490 |
|
|
|
18,763 |
|
|
|
17,595 |
|
|
|
18,831 |
|
|
|
16,622 |
|
|
|
18,317 |
|
|
Other expenses |
|
|
50,300 |
|
|
|
55,600 |
|
|
|
50,269 |
|
|
|
42,393 |
|
|
|
28,138 |
|
|
|
37,428 |
|
|
|
38,292 |
|
|
|
40,355 |
|
|
Total expenses |
|
|
958,935 |
|
|
|
774,972 |
|
|
|
760,933 |
|
|
|
731,213 |
|
|
|
674,798 |
|
|
|
689,739 |
|
|
|
674,435 |
|
|
|
662,754 |
|
|
Other income (losses), net: |
|
|
|
|
|
|
|
|
|
|
|
|
|
|
|
|
|
|
|
|
|
|
|
|
|
|
|
|
|
|
|
|
|
Gain (loss) on divestiture and sale of investments |
|
|
— |
|
|
|
4 |
|
|
|
— |
|
|
|
557 |
|
|
|
— |
|
|
|
7,044 |
|
|
|
— |
|
|
|
— |
|
|
Gains (losses) on equity method investments |
|
|
2,203 |
|
|
|
2,147 |
|
|
|
1,602 |
|
|
|
237 |
|
|
|
996 |
|
|
|
796 |
|
|
|
863 |
|
|
|
888 |
|
|
Other income (loss) |
|
|
16 |
|
|
|
88,195 |
|
|
|
4,713 |
|
|
|
5,020 |
|
|
|
(979 |
) |
|
|
91,655 |
|
|
|
9,831 |
|
|
|
(3,294 |
) |
|
Total other income (losses), net |
|
|
2,219 |
|
|
|
90,346 |
|
|
|
6,315 |
|
|
|
5,814 |
|
|
|
17 |
|
|
|
99,495 |
|
|
|
10,694 |
|
|
|
(2,406 |
) |
|
Income (loss) from operations before income taxes |
|
|
(62,482 |
) |
|
|
142,402 |
|
|
|
94,283 |
|
|
|
57,794 |
|
|
|
80,977 |
|
|
|
144,576 |
|
|
|
57,204 |
|
|
|
31,413 |
|
|
Provision (benefit) for income taxes |
|
|
95,184 |
|
|
|
31,854 |
|
|
|
16,552 |
|
|
|
6,678 |
|
|
|
14,614 |
|
|
|
30,273 |
|
|
|
10,571 |
|
|
|
4,874 |
|
|
Consolidated net income (loss) |
|
|
(157,666 |
) |
|
|
110,548 |
|
|
|
77,731 |
|
|
|
51,116 |
|
|
|
66,363 |
|
|
|
114,303 |
|
|
|
46,633 |
|
|
|
26,539 |
|
|
Less: Net income (loss) attributable to noncontrolling interest in subsidiaries |
|
|
(37,867 |
) |
|
|
29,019 |
|
|
|
24,811 |
|
|
|
14,291 |
|
|
|
21,924 |
|
|
|
27,092 |
|
|
|
13,713 |
|
|
|
6,087 |
|
|
Net income (loss) available to common stockholders |
|
$ |
(119,799 |
) |
|
$ |
81,529 |
|
|
$ |
52,920 |
|
|
$ |
36,825 |
|
|
$ |
44,439 |
|
|
$ |
87,211 |
|
|
$ |
32,920 |
|
|
$ |
20,452 |
|
|
1 |
Financial results have been retrospectively adjusted to include the financial results of Lucera. |
|
2 |
Amounts include the gains related to the earn-out associated with the Nasdaq transaction recorded in Other income (loss). |
|
3 |
Financial results have been retrospectively adjusted to include the financial results of Berkeley Point. See “Berkeley Point Acquisition and Related Transactions” herein for a summary of the impact on the Company’s quarterly and annual results of operations. |
132
The table below details our brokerage revenues by product category for the indicated periods (in thousands):
|
|
|
December 31, 2017 |
|
|
September 30, 2017 |
|
|
June 30, 2017 |
|
|
March 31, 2017 |
|
|
December 31, 2016 |
|
|
September 30, 2016 |
|
|
June 30, 2016 |
|
|
March 31, 2016 |
|
||||||||
|
Brokerage revenue by product: |
|
|
|
|
|
|
|
|
|
|
|
|
|
|
|
|
|
|
|
|
|
|
|
|
|
|
|
|
|
|
|
|
|
Rates |
|
$ |
118,618 |
|
|
$ |
123,041 |
|
|
$ |
133,469 |
|
|
$ |
135,752 |
|
|
$ |
116,117 |
|
|
$ |
112,384 |
|
|
$ |
120,678 |
|
|
$ |
119,619 |
|
|
Credit |
|
|
65,818 |
|
|
|
66,133 |
|
|
|
70,730 |
|
|
|
81,870 |
|
|
|
62,294 |
|
|
|
67,221 |
|
|
|
77,330 |
|
|
|
84,915 |
|
|
Foreign exchange |
|
|
80,780 |
|
|
|
83,899 |
|
|
|
79,681 |
|
|
|
80,026 |
|
|
|
70,816 |
|
|
|
73,191 |
|
|
|
76,835 |
|
|
|
82,468 |
|
|
Energy and commodities |
|
|
54,161 |
|
|
|
48,231 |
|
|
|
48,479 |
|
|
|
53,145 |
|
|
|
54,111 |
|
|
|
47,061 |
|
|
|
57,306 |
|
|
|
64,398 |
|
|
Equities, insurance, and other asset classes |
|
|
86,703 |
|
|
|
79,657 |
|
|
|
85,324 |
|
|
|
75,706 |
|
|
|
41,950 |
|
|
|
39,076 |
|
|
|
45,593 |
|
|
|
48,366 |
|
|
Leasing and other services |
|
|
186,146 |
|
|
|
158,604 |
|
|
|
144,681 |
|
|
|
127,574 |
|
|
|
144,521 |
|
|
|
139,109 |
|
|
|
124,555 |
|
|
|
105,627 |
|
|
Real estate capital markets |
|
|
126,871 |
|
|
|
98,307 |
|
|
|
95,168 |
|
|
|
77,390 |
|
|
|
100,827 |
|
|
|
91,098 |
|
|
|
81,803 |
|
|
|
61,879 |
|
|
Total brokerage revenues |
|
|
719,097 |
|
|
|
657,872 |
|
|
|
657,532 |
|
|
|
631,463 |
|
|
|
590,636 |
|
|
$ |
569,140 |
|
|
$ |
584,100 |
|
|
$ |
567,272 |
|
|
Brokerage revenue by product (percentage): |
|
|
|
|
|
|
|
|
|
|
|
|
|
|
|
|
|
|
|
|
|
|
|
|
|
|
|
|
|
|
|
|
|
Rates |
|
|
16.5 |
% |
|
|
18.7 |
% |
|
|
20.3 |
% |
|
|
21.5 |
% |
|
|
19.7 |
% |
|
|
19.7 |
% |
|
|
20.7 |
% |
|
|
21.1 |
% |
|
Credit |
|
|
9.2 |
|
|
|
10.1 |
|
|
|
10.8 |
|
|
|
13.0 |
|
|
|
10.5 |
|
|
|
11.8 |
|
|
|
13.2 |
|
|
|
15.0 |
|
|
Foreign exchange |
|
|
11.2 |
|
|
|
12.8 |
|
|
|
12.1 |
|
|
|
12.7 |
|
|
|
12.0 |
|
|
|
12.9 |
|
|
|
13.2 |
|
|
|
14.5 |
|
|
Energy and commodities |
|
|
7.5 |
|
|
|
7.3 |
|
|
|
7.4 |
|
|
|
8.4 |
|
|
|
9.1 |
|
|
|
8.3 |
|
|
|
9.8 |
|
|
|
11.4 |
|
|
Equities, insurance, and other asset classes |
|
|
12.1 |
|
|
|
12.1 |
|
|
|
13.0 |
|
|
|
12.0 |
|
|
|
7.1 |
|
|
|
6.9 |
|
|
|
7.8 |
|
|
|
8.5 |
|
|
Leasing and other services |
|
|
25.9 |
|
|
|
24.1 |
|
|
|
22.0 |
|
|
|
20.2 |
|
|
|
24.5 |
|
|
|
24.4 |
|
|
|
21.3 |
|
|
|
18.6 |
|
|
Real estate capital markets |
|
|
17.6 |
|
|
|
14.9 |
|
|
|
14.4 |
|
|
|
12.2 |
|
|
|
17.1 |
|
|
|
16.0 |
|
|
|
14.0 |
|
|
|
10.9 |
|
|
Total brokerage revenues |
|
|
100.0 |
% |
|
|
100.0 |
% |
|
|
100.0 |
% |
|
|
100.0 |
% |
|
|
100.0 |
% |
|
|
100.0 |
% |
|
|
100.0 |
% |
|
|
100.0 |
% |
|
Brokerage revenue by type: |
|
|
|
|
|
|
|
|
|
|
|
|
|
|
|
|
|
|
|
|
|
|
|
|
|
|
|
|
|
|
|
|
|
Real Estate |
|
$ |
313,017 |
|
|
$ |
256,911 |
|
|
$ |
239,849 |
|
|
$ |
204,964 |
|
|
$ |
245,348 |
|
|
$ |
230,207 |
|
|
$ |
206,358 |
|
|
$ |
167,506 |
|
|
Financial Services voice/hybrid |
|
|
368,196 |
|
|
|
361,312 |
|
|
|
373,161 |
|
|
|
380,260 |
|
|
|
310,313 |
|
|
|
303,364 |
|
|
|
336,658 |
|
|
|
357,071 |
|
|
Financial Services fully electronic |
|
|
37,884 |
|
|
|
39,649 |
|
|
|
44,522 |
|
|
|
46,239 |
|
|
|
34,975 |
|
|
|
35,569 |
|
|
|
41,084 |
|
|
|
42,695 |
|
|
Total brokerage revenues |
|
$ |
719,097 |
|
|
$ |
657,872 |
|
|
$ |
657,532 |
|
|
$ |
631,463 |
|
|
$ |
590,636 |
|
|
$ |
569,140 |
|
|
$ |
584,100 |
|
|
$ |
567,272 |
|
|
Brokerage revenue by type (percentage): |
|
|
|
|
|
|
|
|
|
|
|
|
|
|
|
|
|
|
|
|
|
|
|
|
|
|
|
|
|
|
|
|
|
Real Estate |
|
|
43.5 |
% |
|
|
39.1 |
% |
|
|
36.5 |
% |
|
|
32.5 |
% |
|
|
41.5 |
% |
|
|
40.5 |
% |
|
|
35.3 |
% |
|
|
29.5 |
% |
|
Financial Services voice/hybrid |
|
|
51.2 |
|
|
|
54.9 |
|
|
|
56.7 |
|
|
|
60.2 |
|
|
|
52.5 |
|
|
|
53.3 |
|
|
|
57.7 |
|
|
|
63.0 |
|
|
Financial Services fully electronic |
|
|
5.3 |
|
|
|
6.0 |
|
|
|
6.8 |
|
|
|
7.3 |
|
|
|
6.0 |
|
|
|
6.2 |
|
|
|
7.0 |
|
|
|
7.5 |
|
|
Total brokerage revenues |
|
|
100.0 |
% |
|
|
100.0 |
% |
|
|
100.0 |
% |
|
|
100.0 |
% |
|
|
100.0 |
% |
|
|
100.0 |
% |
|
|
100.0 |
% |
|
|
100.0 |
% |
LIQUIDITY AND CAPITAL RESOURCES
Balance Sheet
Our balance sheet and business model are not capital intensive. Our assets consist largely of cash, marketable securities, mortgage servicing rights, collateralized multifamily and commercial mortgage loans to be included in future sales, which are included in loans held for sale, collateralized and uncollateralized short-dated receivables and less liquid assets needed to support our business. Longer-term capital (equity and notes payable) is held to support the less liquid assets and potential capital intensive opportunities. Total assets at December 31, 2017 were $5.5 billion, an increase of 8.1% as compared to December 31, 2016. The increase in total assets was driven primarily by increases in cash, marketable securities, short-dated receivables, and less liquid assets, which were partially offset by a reduction in loans held for sale. We maintain a significant portion of our assets in cash and marketable securities, with our liquidity (which we define as Cash and cash equivalents, Reverse repurchase agreements, Marketable securities and Securities owned, less Securities loaned and Repurchase agreements) at December 31, 2017 of $673.2 million. See “Liquidity Analysis” below for a further discussion of our liquidity. Our Securities owned were $33.0 million at December 31, 2017, compared to $35.3 million at December 31, 2016. Our marketable securities increased to $208.2 million at December 31, 2017, compared to $164.8 million at December 31, 2016. The increase in marketable securities was primarily due to the recognition of $77.0 million in gains in
133
connections with the Nasdaq earn-out and $18.6 million of mark-to-market movement and/or hedging (as discussed in Note 10—“Marketable Securities.”), partially offset by sale of Marketable securities in the amount of $57.0 million. We did not have any Reverse repurchase agreements as of December 31, 2017, which was a decrease of $54.7 million from December 31, 2016. There were $202.3 million of Securities loaned as of December 31, 2017 and no Securities loaned as of December 31, 2016.
On June 23, 2015, the Audit Committee of the Company authorized management to enter into a revolving credit facility with Cantor of up to $150.0 million in aggregate principal amount pursuant to which Cantor or BGC would be entitled to borrow funds from each other from time to time. The outstanding balances would bear interest at the higher of the borrower’s or the lender’s short-term borrowing rate then in effect, plus 1%.
On April 21, 2017, pursuant to a previously disclosed authorization by the Audit Committee of BGC’s Board of Directors, the Company entered into a $150.0 million revolving credit facility (the “Credit Facility”) with an affiliate of Cantor. BGC agreed to lend $150.0 million under the Credit Facility to such affiliate (the “Loan”). On September 8, 2017, the outstanding balance of $150 million was repaid in its entirety. As of the date hereof, there were no borrowings outstanding under the credit facility. The Credit Facility has a maturity date of April 20, 2018, which may be extended from time to time on the terms set forth in the Credit Facility.
As part of our cash management process, we may enter into tri-party reverse repurchase agreements and other short-term investments, some of which may be with Cantor. As of December 31, 2017 there were no repurchase agreements outstanding.
Additionally, in August 2013, the Audit Committee authorized us to invest up to $350 million in an asset-backed commercial paper program for which certain Cantor entities serve as placement agent and referral agent. The program issues short-term notes to money market investors and is expected to be used from time to time as a liquidity management vehicle. The notes are backed by assets of highly rated banks. We are entitled to invest in the program so long as the program meets investment policy guidelines, including policies relating to ratings. Cantor will earn a spread between the rate it receives from the short-term note issuer and the rate it pays to us on any investments in this program. This spread will be no greater than the spread earned by Cantor for placement of any other commercial paper note in the program. As of December 31, 2017, we had no investments in the program.
Funding
Our funding base consists of longer-term capital (equity and notes payable), collateralized financings, shorter-term liabilities and accruals that are a natural outgrowth of specific assets and/or our business model, such as matched fails and accrued compensation. We have limited need for short-term unsecured funding in our regulated entities for their brokerage business. Our Real Estate Services business has the following ongoing cash needs: (i) ongoing short-term collateralized financing needs to fund loans held for sale; (ii) working capital to support daily operations, including servicing advances consisting of principal and interest advances for Fannie Mae loans that become delinquent, and advances on insurance and tax payments if escrow funds are insufficient; and (iii) working capital to satisfy collateral requirements for our Fannie Mae DUS risk-sharing obligations and to meet the operational liquidity requirements of Fannie Mae, Freddie Mac, HUD, Ginnie Mae, and our warehouse facility lenders. Contingent liquidity needs are largely limited to potential cash collateral that may be needed to meet clearing bank, clearinghouse, and exchange margins and/or to fund fails. Capital expenditures tend to be cash neutral and approximately in line with depreciation. Current cash balances significantly exceed our potential contingent liquidity needs. We believe that cash in and available to our largest regulated entities, inclusive of financing provided by clearing banks and cash segregated under regulatory requirements, is adequate for potential cash demands of normal operations, such as margin or fail financing. We expect our operating activities going forward to generate adequate cash flows to fund normal operations, including any dividends paid pursuant to our dividend policy. However, we believe that there are a significant number of capital intensive opportunities for us to maximize our growth and strategic position, including, among other things, acquisitions, strategic alliances and joint ventures potentially involving all types and combinations of equity, debt and acquisition alternatives. As a result, we may need to raise additional funds to:
|
|
• |
increase the regulatory net capital necessary to support operations; |
|
|
• |
support continued growth in our businesses; |
|
|
• |
effect acquisitions, strategic alliances joint ventures and other transactions; |
|
|
• |
develop new or enhanced products, services and markets; and |
|
|
• |
respond to competitive pressures. |
Acquisitions and financial reporting obligations related thereto may impact our ability to access capital markets on a timely basis and may necessitate greater short-term borrowings in the interim. This may impact our credit rating or the interest rates on our debt. We may need to access short-term capital sources to meet business needs from time to time, including, but not limited to, conducting operations; hiring or retaining brokers, salespeople, managers and other front-office personnel; financing acquisitions; and providing liquidity, including in situations where we may not be able to access the capital markets in a timely manner when desired by us. Accordingly, we cannot guarantee that we will be able to obtain additional financing when needed on terms that are acceptable to us, if at all.
134
On September 8, 2017, BGC completed the acquisition of Berkeley Point (the “Berkeley Point Acquisition”), a leading commercial real estate finance company focused on the origination and sale of multifamily and other commercial real estate loans through government-sponsored and government-funded loan programs, as well as the servicing of commercial real estate loans, including those it originates. BGC acquired all of the outstanding membership interests of Berkeley Point Financial LLC for an acquisition price of $875 million, with $3.2 million of the acquisition price paid with 247,099 partnership units in BGC Holdings, L.P., pursuant to a Transaction Agreement, dated as of July 17, 2017, with Cantor and certain Cantor’s affiliates, including CCRE and Cantor Commercial Real Estate Sponsor, L.P., the general partner of CCRE. In accordance with this Transaction Agreement, Berkeley Point made a distribution of $89.1 million to CCRE related to the Berkeley Point Acquisition, for the amount that Berkeley Point’s net assets, inclusive of certain fair value adjustments, exceeded $508.6 million. Contemporaneously with the Berkeley Point Acquisition, on September 8, 2017, the Company invested $100 million in a newly formed commercial real estate-related financial and investment business, Real Estate LP, which is controlled and managed by Cantor. Real Estate LP may conduct activities in any real estate related business or asset backed securities-related business or any extensions thereof and ancillary activities thereto. The Company’s investment is accounted for under the equity method. Berkeley Point and Real Estate LP are part of Newmark Knight Frank, the Company’s Real Estate Services segment. In connection with these aforementioned transactions, BGC entered into a $400 million two-year unsecured senior revolving credit facility and a $575 million unsecured senior term loan maturing on the second anniversary of the BPF acquisition closing date.
On October 23, 2017 Newmark Group, Inc. filed a registration statement on Form S-1 with the SEC relating to the proposed initial public offering (“IPO”) of the Class A common stock of BGC’s recently formed subsidiary, which will hold Newmark Knight Frank, the Company’s Real Estate Services business. The initial public offering is part of the Company’s plan to separate its Real Estate Services business into a separate public company. Following some period after the expected offering, the Company may, subject to market and other conditions, distribute the shares that the Company will hold of the newly formed subsidiary pro rata to the Company’s stockholders in a manner intended to qualify as tax-free for U.S. federal income tax purposes. On December 19, 2017 BGC Partners, Inc. and Newmark Group, Inc. announced the closing of New Public offering of 20 million shares of Newmark’s Class “A” common stock to public of $14.00 per share less underwriting discounts and commissions. On December 26, 2017 BGC Partners, Inc. and Newmark Group, Inc. announced that the underwriters of Newmark’s initial public offering have exercised in full their overallotment option to purchase an additional 3 million shares of Newmark’s class “A” common stock at the initial public offering price of $14.00 per share less underwriting discounts and commissions. As a result, Newmark has received aggregate net proceeds of $295.4 million from the initial public offering after deducting underwriting discounts and commissions and estimated offering expenses. The proceeds of the Newmark initial public offering were used to repay $304.3 million of the term loan.
On January 12, 2016, we completed our acquisition (the “JPI Merger”) of Jersey Partners, Inc. (“JPI”). The JPI Merger occurred pursuant to a merger agreement (the “Merger Agreement”), dated as of December 22, 2015. Shortly following the completion of the JPI Merger, a subsidiary of BGC merged with and into GFI pursuant to a short-form merger under Delaware law, with GFI continuing as the surviving entity. The Back-End Mergers allowed BGC to acquire the remaining approximately 33% of the outstanding shares of GFI common stock that BGC did not already own. Following the closing of the Back-End Mergers, BGC and its affiliates now own 100% of the outstanding shares of GFI’s common stock. In total, approximately 23.5 million shares of our Class A common stock and $89.9 million in cash were issued or paid with respect to the closing of the Back-End Mergers, inclusive of adjustments (we still expect to pay a total of $111.2 million in connection to the Back-End Mergers).
On June 28, 2013, upon completion of the Nasdaq transaction, we received cash consideration of $750 million paid at closing, plus an earn-out of up to 14,883,705 shares of Nasdaq common stock to be paid ratably in each of the fifteen years following the closing. As a result of the earn-out, we expect to receive approximately $746 million in additional Nasdaq stock over time (stock value based on the February 8, 2018 closing price), which is not reflected on our balance sheet.
As of December 31, 2017, our liquidity, which we define as cash and cash equivalents, reverse repurchase agreements, marketable securities and securities owned, less securities loaned and repurchase agreements, was approximately $673.2 million. This does not include the approximately $746 million in additional Nasdaq stock (stock value based on the February 8, 2018 closing price) that we expect to receive over time. We expect to use our considerable financial resources to repay debt, profitably hire, make accretive acquisitions, pay dividends, and/or repurchase shares and units of BGC, all while maintaining or improving our investment grade rating.
Long-term Debt, Collateralized Borrowings and Short-term Borrowings
Unsecured Senior Revolving Credit and Converted Term Loan Agreement
On September 8, 2017, the Company entered into a committed unsecured senior revolving credit agreement with Bank of America, N.A., as administrative agent, and a syndicate of lenders. The revolving credit agreement provides for revolving loans of up to $400.0 million. The maturity date of the facility is September 8, 2019. On November 22, 2017, the Company and Newmark entered into an amendment to the unsecured senior revolving credit agreement. Pursuant to the amendment, the then-outstanding borrowings of the Company under the revolving credit facility were converted into a term loan. There was no change in the maturity date or
135
interest rate. Effective December 13, 2017, Newmark assumed the obligations of the Company as borrower under the converted term loan. The Company remains a borrower under, and retains access to, the revolving credit facility for any future draws, subject to availability which increases as Newmark repays the converted term loan. Borrowings under the converted term loan bear interest at either LIBOR or a defined base rate plus an additional margin which ranges from 50 basis points to 325 basis points depending on the Company’s debt rating as determined by S&P and Fitch and whether such loan is a LIBOR loan or a base rate loan. If there are any amounts outstanding under the senior term loan as of December 31, 2017, the pricing shall increase by 50 basis points until the senior term loan is paid in full, and if there are any amounts outstanding under the senior term loan as of June 30, 2018, the pricing shall increase by an additional 75 basis points (125 basis points in the aggregate) until the senior term loan is paid in full. From and after the repayment in full of the senior term loan, the pricing shall return to the levels previously described. As of December 31, 2017, there were $400.0 million of borrowings outstanding under the converted term loan. The carrying value of the converted term loan as of December 31, 2017 was $397.3 million, net of deferred financing costs of $2.7 million. As of December 31, 2017, the interest rate on the converted term loan was 4.21%.
Unsecured Senior Term Loan Credit Agreement
On September 8, 2017, the Company entered into a committed unsecured senior term loan credit agreement with Bank of America, N.A., as administrative agent, and a syndicate of lenders. The term loan credit agreement provides for loans of up to $575.0 million. The maturity date of the agreement is September 8, 2019. On November 22, 2017, the Company and Newmark entered into an amendment to the unsecured senior term loan credit agreement. Pursuant to the term loan amendment and effective as of December 13, 2017, Newmark assumed the obligations of the Company as borrower under the senior term loan. There was no change in the maturity date or interest rate. Borrowings under the senior term loan bear interest at either LIBOR or a defined base rate plus an additional margin, which ranges from 50 basis points to 325 basis points depending on the Company’s debt rating as determined by S&P and Fitch and whether such loan is a LIBOR loan or a base rate loan. If there are any amounts outstanding under the senior term loan as of December 31, 2017, the pricing shall increase by 50 basis points until the senior term loan is paid in full and if there are any amounts outstanding under the senior term loan as of June 30, 2018, the pricing shall increase by an additional 75 basis points (125 basis points in the aggregate) until the senior term loan is paid in full. From and after the repayment in full of the senior term loan, the pricing shall return to the levels previously described. The senior term loan is also subject to mandatory prepayment from 100% of net cash proceeds of all material asset sales and debt and equity issuances by Newmark and its subsidiaries (subject to certain customary exceptions, including sales under the Company’s CEO sales program. The net proceeds from the Newmark initial public offering were used to partially repay $304.3 million of the senior term loan. As of December 31, 2017, there were $270.7 million of borrowings outstanding under the senior term loan. The carrying value of the senior term loan as of December 31, 2017 was $270.7 million. As of December 31, 2017, the interest rate on the senior term loan was 4.21%
8.125% Senior Notes
On June 26, 2012, we issued an aggregate of $112.5 million principal amount of 8.125% Senior Notes due 2042 (the “8.125% Senior Notes”). The 8.125% Senior Notes are our senior unsecured obligations. The 8.125% Senior Notes may be redeemed for cash, in whole or in part, on or after June 26, 2017, at our option, at any time and from time to time, until maturity at a redemption price equal to 100% of the principal amount to be redeemed, plus accrued but unpaid interest on the principal amount being redeemed to, but not including, the redemption date. The 8.125% Senior Notes are listed on the New York Stock Exchange under the symbol “BGCA.” We used the proceeds to repay short-term borrowings under our unsecured revolving credit facility and for general corporate purposes, including acquisitions. In connection with the issuance of the 8.125% senior notes, the Company lent the proceeds of the 8.125% senior notes to BGC U.S. OpCo, and BGC U.S. OpCo issued an amended and restated promissory note, effective as of June 26, 2012, with an aggregate principal amount of $112.5 million payable to the Company. On December 13, 2017, Newmark OpCo assumed all of the BGC U.S. OpCo’s rights and obligations under the promissory note. The initial carrying value of the 8.125% Senior Notes was $108.7 million, net of debt issuance costs of $3.8 million. The carrying value of the 8.125% Senior Notes as of December 31, 2017 was $109.4 million.
5.375% Senior Notes
On December 9, 2014, the Company issued an aggregate of $300.0 million principal amount of 5.375% Senior Notes due 2019 (the “5.375% Senior Notes”). The 5.375% Senior Notes are general senior unsecured obligations of the Company. These 5.375% Senior Notes bear interest at a rate of 5.375% per year, payable in cash on June 9 and December 9 of each year, commencing June 9, 2015. The interest rate payable on the notes will be subject to adjustments from time to time based on the debt rating assigned by specified rating agencies to the notes, as set forth in the indenture. The 5.375% Senior Notes will mature on December 9, 2019. The Company may redeem some or all of the notes at any time or from time to time for cash at certain “make-whole” redemption prices (as set forth in the indenture). If a “Change of Control Triggering Event” (as defined in the indenture) occurs, holders may require the Company to purchase all or a portion of their notes for cash at a price equal to 101% of the principal amount of the notes to be purchased plus any accrued and unpaid interest to, but excluding, the purchase date. In connection with the issuance of the 5.375% Senior Notes, the Company lent the proceeds of the 5.375% Senior Notes to BGC U.S. OpCo, and BGC U.S. OpCo issued an
136
amended and restated promissory note, effective as of December 9, 2014, with an aggregate principal amount of $300 million to the Company. On December 13, 2017, Newmark OpCo assumed all of BGC U.S. OpCo’s rights and obligations under the promissory note. The initial carrying value of the 5.375% Senior Notes was $295.1 million, net of the discount and debt issuance costs of $4.9 million. The carrying value of the 5.375% Senior Notes as of December 31, 2017 was $298.1 million.
8.375% Senior Notes
As part of the GFI acquisition, the Company assumed $240.0 million in aggregate principal amount of 8.375% Senior Notes due July 2018 (the “8.375% Senior Notes”). The carrying value of these notes as of December 31, 2017 was $242.5 million. Interest on these notes is payable, semi-annually in arrears on the 19th of January and July. Due to the cumulative effect of downgrades to the credit rating of GFI’s 8.375% Senior Notes were previously subjected to 200 basis points penalty interest. On April 28, 2015, a subsidiary of the Company purchased from GFI approximately 43.0 million newly issued shares of GFI’s common stock. This increased BGC’s ownership to approximately 67% of GFI’s outstanding common stock and gave us the ability to control the timing and process with respect to a full merger, which as discussed in Note 1—“Organization and Basis of Presentation” to our consolidated financial statements, was completed on January 12, 2016. Also on July 10, 2015, we guaranteed the obligations of GFI under these 8.375% Senior Notes. These actions resulted in upgrades of the credit ratings of the 8.375% Senior Notes by Moody’s Investors Service, Fitch Ratings Inc. and Standard & Poor’s, which reduced the penalty interest to 25 basis points effective July 19, 2015. On November 4, 2015, GFI, BGC and the Trustee entered into the First Supplemental Indenture supplementing the Indenture and incorporating BGC’s guarantee of the Notes (the “First Supplemental Indenture”). On January 13, 2016, Moody’s Investors Service further upgraded the credit rating on the 8.375% Senior Notes, eliminating the penalty interest.
On January 12, 2016, BGC Partners, Inc. entered into a second supplemental indenture, dated as of January 12, 2016 (the “Second Supplemental Indenture”), among GFI, BGC and The Bank of New York Mellon Trust Company, N.A., as trustee (the “Trustee”), supplementing the indenture, dated as of July 19, 2011, as supplemented by the First Supplemental Indenture thereto, dated as of November 4, 2015 (the “Indenture”), among GFI, BGC and the Trustee, which governs the 8.375% Senior Notes, issued by GFI and fully and unconditionally guaranteed by BGC. The Second Supplemental Indenture modifies the reporting covenant in the Indenture to provide that, for so long as BGC (or another publicly reporting company controlling GFI) guarantees the 8.375% Senior Notes, the reports that BGC (or such other publicly reporting company controlling GFI) files with the SEC will be furnished to the Trustee in lieu of any GFI SEC reports. The amendments contained in the Second Supplemental Indenture became operative on January 12, 2016, upon GFI’s payment of the consent fee described therein. The final amount of the consent fee was approximately $8.00 per $1,000 principal amount. As a result, effective January 15, 2016, GFI ceased filing annual, quarterly and other reports with the SEC.
5.125% Senior Notes
On May 27, 2016, the Company issued an aggregate of $300.0 million principal amount of 5.125% Senior Notes due 2021 (the “5.125% Senior Notes”). The 5.125% Senior Notes are general senior unsecured obligations of the Company. These 5.125% Senior Notes bear interest at a rate of 5.125% per year, payable in cash on May 27 and November 27 of each year, commencing November 27, 2016. The 5.125% Senior Notes will mature on May 27, 2021. The Company may redeem some or all of the notes at any time or from time to time for cash at certain “make-whole” redemption prices (as set forth in the indenture). If a “Change of Control Triggering Event” (as defined in the indenture) occurs, holders may require the Company to purchase all or a portion of their notes for cash at a price equal to 101% of the principal amount of the notes to be purchased plus any accrued and unpaid interest to, but excluding, the purchase date. Cantor purchased $15.0 million of such senior notes and still holds such notes as of December 31, 2017. The initial carrying value of the 5.125% Senior Notes was $295.8 million, net of the discount and debt issuance costs of $4.2 million. The carrying value of the 5.125% Senior Notes as of December 31, 2017 was $297.0 million.
4.50% Convertible Notes
On July 29, 2011, the Company issued an aggregate of $160.0 million principal amount of 4.50% Convertible Notes due July 15, 2016 (the “4.50% Convertible Notes”). On July 13, 2016, certain holders of the 4.50% Convertible Notes converted $68,000 in principal amount of notes, and, upon conversion, the Company delivered 6,909 shares of its Class A common stock to such holders. On July 15, 2016, the Company repaid the remaining approximately $159.9 million principal amount of its 4.50% Convertible Notes at maturity.
8.75% Convertible Notes
On April 1, 2010, BGC Holdings issued an aggregate of $150.0 million principal amount of the 8.75% Convertible Notes to Cantor in a private placement transaction. The 8.75% Convertible Notes were senior unsecured obligations and ranked equally and ratable with all existing and future senior unsecured obligations of the Company. The 8.75% Convertible Notes bore an annual interest rate of 8.75%, payable semi-annually in arrears on April 15 and October 15 of each year, beginning on October 15, 2010. On April 13, 2015, the Company’s 8.75% Convertible Notes were fully converted into 24,042,599 shares of the Company’s Class A common stock, par value $0.01 per share, issued to Cantor.
137
On March 13, 2015, the Company entered into a secured loan arrangement of $28.2 million under which it pledged certain fixed assets as security for a loan. This arrangement incurs interest at a fixed rate of 3.70% and matures on March 13, 2019. As of December 31, 2017, the Company had $9.2 million outstanding related to this secured loan arrangement, which includes $0.1 million of deferred financing costs. The value of the fixed assets pledged as of December 31, 2017 was $0.3 million.
On May 31, 2017, the Company entered into a secured loan arrangement of $29.9 million under which it pledged certain fixed assets as security for a loan. This arrangement incurs interest at a fixed rate of 3.44% and matures on May 31, 2021. As of December 31, 2017, the Company had $26.4 million outstanding related to this secured loan arrangement. The value of the fixed assets pledged as of December 31, 2017 was $17.3 million.
Warehouse Notes Payable
The Company uses its warehouse lines and a repurchase agreement to fund mortgage loans originated under its various lending programs. Outstanding borrowings against these lines are collateralized by an assignment of the underlying mortgages and third party purchase commitments. As of December 31, 2017, the Company had $950 million of warehouse lines and $325 million of uncommitted repurchase agreements (collectively, the “Agency Warehouse Facilities”). As of December 31, 2017, $360.4 million of the Agency Warehouse Facilities was drawn down.
Notes Payable to Related Party
On March 11, 2015, the Company and CCRE entered into a note receivable/payable that allows for advances to or from CCRE at an interest rate of 1 month LIBOR plus 1.0%. As of December 31, 2016, there was $690.0 million of outstanding advances due to CCRE on the note. On September 8, 2017, the note receivable/payable was terminated and all outstanding advances due were paid off.
Short-term Borrowings
As part of the GFI acquisition, the Company acquired a credit agreement as amended (the “GFI Credit Agreement”) with Bank of America, N.A. and certain other lenders, which provided for maximum revolving loans of up to $75.0 million. The amount outstanding was repaid by the Company on October 2, 2015, prior to the sale of the Company’s Trayport division.
On October 1, 2015, the Company entered into a previously authorized $150.0 million revolving credit facility (the “Facility”) with Cantor and borrowed $100.0 million under such facility (the “Cantor Loan”). The Cantor Loan bears interest at the rate of LIBOR plus 3.25% and may be adjusted based on Cantor’s short-term borrowing rate then in effect plus 1%. The Facility has a maturity date of August 10, 2017. The Cantor Loan was repaid on December 31, 2015.
On December 24, 2015, the Company entered into a committed unsecured credit agreement with Bank of America, N.A. The credit agreement provided for maximum revolving loans of $25.0 million through March 24, 2016. The interest rate on this facility was LIBOR plus 200 basis points.
On February 25, 2016, the Company entered into a committed unsecured revolving credit agreement with Bank of America, N.A., as administrative agent, and a syndicate of lenders. Several of our domestic non-regulated subsidiaries are parties to the credit agreement as guarantors. The credit agreement provides for revolving loans of $150.0 million, with the option to increase the aggregate loans to $200.0 million. Borrowings under this facility bear interest at either LIBOR or a defined base rate plus an additional margin which ranges from 50 basis points to 250 basis points depending on our debt rating as determined by S&P and Fitch and whether such loan is a LIBOR loan or a base rate loan. This facility was terminated on September 8, 2017, at which point the outstanding balance of $150.0 million was repaid. Contemporaneously with the closing of this credit agreement, the $25.0 million unsecured credit agreement entered into on December 24, 2015 with Bank of America, N.A. was terminated. There were no borrowings outstanding under either the $150.0 million facility or the terminated $25.0 million facility as of December 31, 2017 and 2016.
On August 22, 2017, the Company entered into a committed unsecured loan agreement with Itau Unibanco S.A. The credit agreement provides for short term loans up to $6.0 million (BRL 20.0 million). The maturity date of the agreement is February 19, 2018. Borrowings under this facility bear interest at the Brazilian Interbank offering rate plus 3.30%. As of December 31, 2017, there were $6.0 million of borrowings outstanding under the facility. As of December 31, 2017, the interest rate was 11.64%.
On August 23, 2017, the Company entered into a committed unsecured credit agreement with Itau Unibanco S.A. The credit agreement provides for an intra-day overdraft credit line of up to $15.8 million (BRL 50.0 million). The maturity date of the agreement is March 14, 2017. This facility bears a fee of 1.00% per year. As of December 31, 2017, there were no borrowings outstanding under this facility.
138
Our public long-term credit ratings and associated outlooks are as follows:
|
|
|
Rating |
|
Outlook |
|
Fitch Ratings Inc.1 |
|
BBB- |
|
Rating Watch Negative |
|
Standard & Poor’s2 |
|
BBB- |
|
CreditWatch Negative |
|
1 |
On December 19, 2017 Fitch Ratings Inc. placed its BBB- issuer default and senior debt ratings on Rating Watch Negative. |
|
2 |
On July 19, 2017 Standard & Poor’s placed its BBB- issuer credit and senior unsecured debt ratings on CreditWatch with negative implications. |
Credit ratings and associated outlooks are influenced by a number of factors, including but not limited to: operating environment, earnings and profitability trends, the prudence of funding and liquidity management practices, balance sheet size/composition and resulting leverage, cash flow coverage of interest, composition and size of the capital base, available liquidity, outstanding borrowing levels and the firm’s competitive position in the industry. A credit rating and/or the associated outlook can be revised upward or downward at any time by a rating agency if such rating agency decides that circumstances warrant such a change. Any reduction in our credit ratings and/or the associated outlook could adversely affect the availability of debt financing on terms acceptable to us, as well as the cost and other terms upon which we are able to obtain any such financing. In addition, credit ratings and associated outlooks may be important to customers or counterparties when we compete in certain markets and when we seek to engage in certain transactions. In connection with certain agreements, we may be required to provide additional collateral in the event of a credit ratings downgrade.
LIQUIDITY ANALYSIS
We consider our liquidity to be comprised of the sum of Cash and cash equivalents, Reverse repurchase agreements, Marketable securities, and Securities owned, less Securities loaned and Repurchase agreements. The discussion below describes the key components of our liquidity analysis, including earnings, dividends and distributions, net investing and funding activities, including repurchases and redemptions of Class A common stock and partnership units, security settlements, changes in securities held and marketable securities, and changes in our working capital.
We consider the following in analyzing changes in our liquidity.
Our liquidity analysis includes a comparison of our Consolidated net income (loss) adjusted for certain non-cash items (e.g., grants of exchangeability) as presented on the cash flow statement. Dividends and distributions are payments made to our holders of common shares and limited partnership interests and are related to earnings from prior periods. These timing differences will impact our cash flows in a given period.
Our investing and funding activities represent a combination of our capital raising activities, including short-term borrowings and repayments, warehouse notes payable borrowings and repayments, issuances of shares under our controlled equity offerings (net), Class A common stock repurchases and partnership unit redemptions, purchases and sales of securities, dispositions, and other investments (e.g. acquisitions, forgivable loans to new brokers and capital expenditures—all net of depreciation and amortization).
Our securities settlement activities primarily represent deposits with clearing organizations. In addition, when advantageous, we may elect to facilitate the settlement of matched principal transactions by funding failed trades, which results in a temporary secured use of cash and is economically beneficial to us.
Other changes in working capital represent changes primarily in loans held for sale, receivables and payables and accrued liabilities that impact our liquidity.
Changes in Reverse repurchase agreements, Securities owned and Marketable securities may result from additional cash investments or sales, which will be offset by a corresponding change in Cash and cash equivalents and accordingly will not result in a change in our liquidity. Conversely, changes in the market value of such securities and the receipt of the Nasdaq earn-out in the form of additional Nasdaq shares are reflected in our earnings or other comprehensive income (loss) and will result in changes in our liquidity.
139
As a result of the Tax Cuts and Jobs Act, the Company recorded a provisional amount for the one-time transition tax on deemed repatriated earnings of foreign subsidiaries net of foreign tax credits of $36.6 million for the year ended December 31, 2017. An installment election can be made to pay the taxes over eight years with 40% paid in equal installments over the first five years and the remaining 60% to be paid in installments of 15%, 20% and 25% in years six, seven and eight, respectively.
As of December 31, 2017, the Company had $634.3 million of Cash and cash equivalents, and included in this amount was $334.0 million of Cash and cash equivalents held by foreign subsidiaries.
Discussion of the year ended December 31, 2017
The table below presents our Liquidity Analysis as of December 31, 2017 and December 31, 2016:
|
|
|
December 31, 2017 |
|
|
December 31, 2016 |
|
||
|
(in millions) |
|
|
|
|
|
|
|
|
|
Cash and cash equivalents |
|
$ |
634.3 |
|
|
$ |
535.6 |
|
|
Reverse repurchase agreements |
|
|
— |
|
|
|
54.7 |
|
|
Securities owned |
|
|
33.0 |
|
|
|
35.3 |
|
|
Marketable securities1 |
|
|
5.9 |
|
|
|
164.8 |
|
|
Total |
|
$ |
673.2 |
|
|
$ |
790.4 |
|
|
1 |
As of December 31, 2017, $202.3 million of Marketable securities on our balance sheet had been lent in a Securities loaned transaction and therefore are not included in this Liquidity Analysis. |
The $117.2 million decrease in our liquidity position from $790.4 million as of December 31, 2016 to $673.2 million as of December 31, 2017 was primarily related to cash paid with respect to various acquisitions throughout the year. The acquisition of Berkeley Point for $875 million and the investment of $100 million in Real Estate LP were offset by the proceeds from $400.0 million unsecured senior revolving credit facility and $575.0 million unsecured senior term loan. The proceeds of the Newmark IPO repaid $304.3 million of the term loan. Also contributing to the decrease in liquidity was the previously described redemption and/or repurchase of shares and/or units, ordinary movements in working capital and our continued investment in revenue generating hires.
Discussion of the year ended December 31, 2016
The table below presents our Liquidity Analysis as of December 31, 2016 and December 31, 2015:
|
|
|
December 31, 2016 |
|
|
December 31, 2015 |
|
||
|
(in millions) |
|
|
|
|
|
|
|
|
|
Cash and cash equivalents |
|
$ |
535.6 |
|
|
$ |
563.0 |
|
|
Reverse repurchase agreements |
|
|
54.7 |
|
|
|
— |
|
|
Securities owned |
|
|
35.3 |
|
|
|
32.4 |
|
|
Marketable securities1 |
|
|
164.8 |
|
|
|
532.5 |
|
|
Total |
|
$ |
790.4 |
|
|
$ |
1,127.9 |
|
|
1 |
As of December 31, 2015, $117.9 million of Marketable securities on our balance sheet had been lent in a Securities loaned transaction and therefore are not included in this Liquidity Analysis. |
The $337.5 million decrease in our liquidity position from $1,127.9 million as of December 31, 2015 to $790.4 million as of December 31, 2016 was primarily related to repayment of $159.9 million used to retire BGC’s 4.50% Convertible Senior Notes; $89.9 million used with respect to the GFI back-end merger and related transactions (we still expect to pay a total of $111.2 million in cash with respect to the GFI back-end merger); the redemption and/or repurchase of 12.4 million shares and /or units, net, at a cost to BGC of $110.5 million; ordinary changes in working capital; and cash paid with respect to various acquisitions. The Company also continued to invest significant amounts with regard to new front-office hires in Real Estate Services. These items were partially offset by net proceeds from BGC’s offering of $300 million aggregate principal amount of 5.125% Senior Notes due May 27, 2021.
CLEARING CAPITAL
In November 2008, we entered into a clearing capital agreement with Cantor to clear U.S. Treasury and U.S. government agency securities transactions on our behalf. Pursuant to the terms of this agreement, so long as Cantor is providing clearing services to us, Cantor shall be entitled to request from us, and we shall post as soon as practicable, cash or other property acceptable to Cantor in the amount reasonably requested by Cantor under the clearing capital agreement. Cantor had not requested any cash or other property from us as collateral as of December 31, 2017.
140
Our liquidity and available cash resources are restricted by regulatory requirements of our Financial Services operating subsidiaries. Many of these regulators, including U.S. and non-U.S. government agencies and self-regulatory organizations, as well as state securities commissions in the U.S., are empowered to conduct administrative proceedings that can result in censure, fine, the issuance of cease-and-desist orders or the suspension or expulsion of a broker-dealer. In addition, self-regulatory organizations, such as the Financial Industry Regulatory Authority (“FINRA”) and the National Futures Association (“NFA”), along with statutory bodies such as the Financial Conduct Authority (“FCA”), the SEC, and the CFTC require strict compliance with their rules and regulations. The requirements imposed by regulators are designed to ensure the integrity of the financial markets and to protect customers and other third parties who deal with broker-dealers and are not designed to specifically protect stockholders. These regulations often serve to limit our activities, including through net capital, customer protection and market conduct requirements.
The FCA is the relevant statutory regulator in the United Kingdom. The FCA’s objectives are to protect customers, maintain the stability of the financial services industry and promote competition between financial services providers. It has broad rule-making, investigative and enforcement powers derived from the Financial Services and Markets Act 2000 and subsequent and derivative legislation and regulations.
In addition, the majority of our other foreign subsidiaries are subject to similar regulation by the relevant authorities in the countries in which they do business. Additionally, certain other of our foreign subsidiaries are required to maintain non-U.S. net capital requirements. For example, in Hong Kong, BGC Securities (Hong Kong), LLC and GFI (HK) Securities LLC are regulated by the Securities and Futures Commission. BGC Capital Markets (Hong Kong), Limited and GFI (HK) Brokers Ltd are regulated by The Hong Kong Monetary Authority. All are subject to Hong Kong net capital requirements. In France, Aurel BGC and BGC France Holdings; in Australia, BGC Partners (Australia) Pty Limited, BGC (Securities) Pty Limited and GFI Australia Pty Ltd.; in Japan, BGC Shoken Kaisha Limited’s Japanese branch; in Singapore, BGC Partners (Singapore) Limited, and GFI Group PTE Ltd; in Korea, BGC Capital Markets & Foreign Exchange Broker (Korea) Limited and GFI Korea Money Brokerage Limited; and in Turkey, BGC Partners Menkul Degerler AS, all have net capital requirements imposed upon them by local regulators. In addition, the LCH (LIFFE/LME) clearing organization, of which BGC Brokers L.P. is a member, also imposes minimum capital requirements. In Latin America, BGC Liquidez Distribuidora De Titulos E Valores Mobiliarios Ltda. (Brazil) has net capital requirements imposed upon it by local regulators.
In addition, these subsidiaries may be prohibited from repaying the borrowings of their parents or affiliates, paying cash dividends, making loans to their parent or affiliates or otherwise entering into transactions, in each case, that result in a significant reduction in their regulatory capital position without prior notification or approval from their principal regulator. See Note 29—“Regulatory Requirements,” to our consolidated financial statements for further details on our regulatory requirements.
As of December 31, 2017, $515.6 million of net assets were held by regulated subsidiaries. As of December 31, 2017, these subsidiaries had aggregate regulatory net capital, as defined, in excess of the aggregate regulatory requirements, as defined, of $255.6 million.
As a result of the Berkeley Point Acquisition, the Company is now subject to various capital requirements in connection with seller/servicer agreements that the Company has entered into with the various GSEs. Failure to maintain minimum capital requirements could result in the Company’s inability to originate and service loans for the respective GSEs and could have a direct material adverse effect on the Company’s consolidated financial statements. As of December 31, 2017, the Company has met all capital requirements. As of December 31, 2017, the most restrictive capital requirement was Fannie Mae’s net worth requirement. The Company exceeded the minimum requirement by $347.4 million.
Certain of the Company’s agreements with Fannie Mae allow the Company to originate and service loans under Fannie Mae’s DUS Program. These agreements require the Company to maintain sufficient collateral to meet Fannie Mae’s restricted and operational liquidity requirements based on a pre-established formula. Certain of the Company’s agreements with Freddie Mac allow the Company to service loans under Freddie Mac’s Targeted Affordable Housing Program (“TAH”). These agreements require the Company to pledge sufficient collateral to meet Freddie Mac’s liquidity requirement of 8% of the outstanding principal of TAH loans serviced by the Company. As of December 31, 2017 that the Company has met all liquidity requirements.
In addition, as a servicer for Fannie Mae, GNMA and FHA, the Company is required to advance to investors any uncollected principal and interest due from borrowers. As of December 31, 2017 and 2016 outstanding borrower advances were approximately $120 thousand and $106 thousand, respectively, and are included in “Other assets” in the accompanying consolidated statements of financial condition.
141
In April 2013, our Board of Directors and Audit Committee authorized management to enter into indemnification agreements with Cantor and its affiliates with respect to the provision of any guarantees provided by Cantor and its affiliates from time to time as required by regulators. These services may be provided from time to time at a reasonable and customary fee.
BGC Derivative Markets and GFI Swaps Exchange, our subsidiaries, began operating as SEFs on October 2, 2013. Both BGC Derivative Markets and GFI Swaps Exchange received permanent registration approval from the CFTC as SEFs on January 22, 2016. Mandatory Dodd-Frank Act compliant execution on SEFs by eligible U.S. persons commenced in February 2014 for “made available to trade” products, and a wide range of other rules relating to the execution and clearing of derivative products have been finalized with implementation periods in 2016 and beyond. We also own ELX, which became a dormant contract market on July 1, 2017.
Much of our global derivatives volumes continue to be executed by non-U.S. based clients outside the U.S. and subject to local prudential regulations. As such, we will continue to operate a number of EU regulated venues in accordance with EU directives and licensed by the FCA and other EU based national Competent Authorities. The second Markets in Financial Instruments Directive II (“MiFID II”) was published by the European Securities and Markets Authority (“ESMA”) in September 2015, and implementation is expected to commence in January 2018.
MiFID II requires a significant part of the market in these instruments to trade on trading venues subject to transparency regimes, not only in pre- and post-trade prices, but also in fee structures and access. In addition, it will have a particularly significant impact in a number of key areas, including corporate governance, transaction reporting, pre- and post-trade transparency, technology synchronization, best execution and investor protection. As was the case with the introduction of Dodd-Frank Act, including the ramification of Title VII across the financial markets, it is expected there will be a lengthy time period before all of the Regulatory Technical Standards are completely operative.
MiFID II is intended to help improve the functioning of the EU single market by achieving a greater consistency of regulatory standards. By design, therefore, it is intended that Member States should have very similar regulatory regimes related to the matters addressed to MiFID. MiFID II will also introduce a new regulated execution venue category known as the Organized Trading Facility (“OTF”) that will capture much of the voice and hybrid oriented trading in EU. Much of our existing EU derivatives and fixed income execution business will in the future take place on OTFs. Rules on public and non-discriminatory pricing structures of venues, and the related uncertainty of retaining traditional forms of revenue under the new regime, are expected to be a focus of our U.K. regulated entities. We currently anticipate operating one OTF for each such U.K. regulated entity. In addition, the June 23, 2016 U.K. referendum vote to leave the EU and the U.K. Government triggering Article 50 of the Lisbon Treaty (thereby setting in motion the timetable for the U.K. to leave the EU) may impact future market structure and MiFID II rulemaking and implementation due to potential changes in mutual passporting between the U.K. and EU Member States.
See “Regulation” in Part I, Item 1 of this Annual Report on Form 10-K for additional information related to our regulatory environment.
EQUITY
Class A Common Stock
On June 22, 2016, at our Annual Meeting of Stockholders of the Company, the stockholders approved an amendment to the BGC Partners, Inc. amended and restated certificate of incorporation to increase the number of authorized shares of BGC Class A common stock from 500 million shares to 750 million shares.
142
Changes in shares of the Company’s Class A common stock outstanding for the years ended December 31, 2017 and 2016 were as follows:
|
|
|
Year Ended December, |
|
|||||
|
|
|
2017 |
|
|
2016 |
|
||
|
Shares outstanding at beginning of period |
|
|
244,869,624 |
|
|
|
219,063,365 |
|
|
Share issuances: |
|
|
|
|
|
|
|
|
|
Exchanges of limited partnership interests¹ |
|
|
9,179,295 |
|
|
|
8,705,906 |
|
|
Issuance of Class A common stock for general corporate purposes |
|
|
1,781,328 |
|
|
|
1,648,000 |
|
|
Vesting of restricted stock units (RSUs) |
|
|
570,944 |
|
|
|
637,719 |
|
|
Acquisitions |
|
|
1,923,854 |
|
|
|
25,334,451 |
|
|
Exercise of stock options |
|
|
154,533 |
|
|
|
76,000 |
|
|
Other issuances of Class A common stock |
|
|
58,809 |
|
|
|
287,442 |
|
|
Treasury stock repurchases |
|
|
(1,386,769 |
) |
|
|
(10,823,942 |
) |
|
Forfeitures of restricted Class A common stock |
|
|
(183,246 |
) |
|
|
(59,317 |
) |
|
Shares outstanding at end of period |
|
|
256,968,372 |
|
|
|
244,869,624 |
|
|
1 |
Because they are included in the Company’s fully diluted share count, if dilutive, any exchange of limited partnership interests into Class A common shares would not impact the fully diluted number of shares and units outstanding. |
Class B Common Stock
On June 22, 2016, at our Annual Meeting of Stockholders of the Company, the stockholders approved an amendment to the BGC Partners, Inc. amended and restated certificate of incorporation to increase the number of authorized shares of BGC Class B common stock from 100 million shares to 150 million shares and to provide that BGC Class B common stock shall be issued only to certain affiliated entities or related persons.
The Company did not issue any shares of BGC Class B common stock during the year ended December 31, 2017 and 2016. As of December 31, 2017 and 2016, there were 34,848,107 shares of the Company’s Class B common stock outstanding.
Unit Redemptions and Share Repurchase Program
Our Board of Directors and Audit Committee have authorized repurchases of our Class A common stock and redemptions of limited partnership interests or other equity interests in our subsidiaries. In February 2014, our Audit Committee authorized such repurchases of stock or units from Cantor employees and partners. On October 27, 2015, our Board of Directors and Audit Committee increased the Company’s share repurchase and unit redemption authorization to $300 million, which may include purchases from Cantor, its partners or employees or other affiliated persons or entities. On February 7, 2017, the Company’s Board of Directors and Audit Committee again increased the Company’s share repurchase and unit redemption authorization to $300 million. From time to time, we may actively continue to repurchase shares or redeem units.
On February 23, 2016, we purchased from Cantor 5,000,000 shares of our Class A common stock at a price of $8.72 per share, the closing price on the date of the transaction. The transaction was included in our stock repurchase authorization. The transaction was approved by the Audit Committee of the Board of Directors. On February 23, 2016, we purchased from The Cantor Fitzgerald Relief Fund (the “Relief Fund”) 970,639 shares of our Class A common stock at a price of $8.72 per share, the closing price on the date of the transaction. On November 16, 2016, we purchased from the Relief Fund 166,238 shares of our Class A common stock at a price of $9.74 per share, the closing price on the date of the transaction.
143
The table below represents redemption of units in BGC Holdings and BGC share repurchase activity for the year ended December 31, 2016.
|
Period |
|
Total Number of Units Redeemed or Shares Repurchased |
|
|
Average Price Paid per Unit or Share |
|
|
Approximate Dollar Value of Units and Shares That May Yet Be Redeemed/Purchased Under the Plan |
|
|||
|
Redemptions1 |
|
|
|
|
|
|
|
|
|
|
|
|
|
January 1, 2017—March 31, 2017 |
|
|
2,927,758 |
|
|
$ |
10.84 |
|
|
|
|
|
|
April 1, 2017—June 30, 2017 |
|
|
1,908,867 |
|
|
$ |
11.14 |
|
|
|
|
|
|
July 1, 2017—September 30, 2017 |
|
|
1,675,330 |
|
|
$ |
12.58 |
|
|
|
|
|
|
October 1, 2017—December 31, 2017 |
|
|
1,984,933 |
|
|
$ |
15.00 |
|
|
|
|
|
|
Total Redemptions |
|
|
8,496,888 |
|
|
$ |
12.22 |
|
|
|
|
|
|
Repurchases2 |
|
|
|
|
|
|
|
|
|
|
|
|
|
January 1, 2017—March 31, 2017 |
|
|
552,955 |
|
|
$ |
11.07 |
|
|
|
|
|
|
April 1, 2017—June 30, 2017 |
|
|
397,539 |
|
|
$ |
11.25 |
|
|
|
|
|
|
July 1, 2017—September 30, 2017 |
|
|
295,871 |
|
|
$ |
13.41 |
|
|
|
|
|
|
October 1, 2017—December 31, 2017 |
|
|
140,404 |
|
|
$ |
15.78 |
|
|
|
|
|
|
Total Repurchases |
|
|
1,386,769 |
|
|
$ |
12.10 |
|
|
|
|
|
|
Total Redemptions and Repurchases |
|
|
9,883,657 |
|
|
$ |
12.21 |
|
|
$ |
196,577,825 |
|
|
1 |
During the year ended December 31, 2017, the Company redeemed approximately 7.6 million limited partnership units at an aggregate redemption price of approximately $94.5 million for an average price of $12.40 per unit and approximately 875.6 thousand FPUs at an aggregate redemption price of approximately $9.4 million for an average price of $10.70 per unit. During the year ended December 31, 2016, the Company redeemed approximately 7.2 million limited partnership units at an aggregate redemption price of approximately $65.7 million for an average price of $9.09 per unit and approximately 319.2 thousand FPUs at an aggregate redemption price of approximately $2.8 million for an average price of $8.64 per unit. |
|
2 |
During the year ended December 31, 2017, the Company repurchased approximately 1.4 million shares of its Class A common stock at an aggregate purchase price of approximately $16.8 million for an average price of $12.10 per share. During the year ended December 31, 2016, the Company repurchased approximately 10.8 million shares of its Class A common stock at an aggregate purchase price of approximately $96.0 million for an average price of $8.88 per share. |
The table above represents the gross unit in BGC Holdings redemptions and share repurchases of our Class A common stock during the year ended December 31, 2017. There were no units in Newmark Holdings redeemed during the year ended December 31, 2017. Approximately 7.0 million of the 8.5 million units above were redeemed using cash from our CEO program, and therefore did not impact the fully diluted number of shares and units outstanding or our liquidity position. The remaining redemptions along with the Class A common stock repurchases resulted in a 2.9 million reduction in the fully diluted share count. This net reduction cost the Company approximately $35.2 million (or $12.00 per share/unit) during the year ended December 31, 2017. This reduction partially offset the overall growth in the fully diluted share count which resulted from shares issued for general corporate purposes, acquisitions, equity-based compensation and front-office hires.
The fully diluted weighted-average share count for the three months and year ended December 31, 2017 was as follows (in thousands):
|
|
|
Three Months Ended December 31, 2017 |
|
|
Year Ended December 31, 2017 |
|
||
|
Common stock outstanding1 |
|
|
290,871 |
|
|
|
287,378 |
|
|
Partnership units2 |
|
|
— |
|
|
|
165,050 |
|
|
RSUs (Treasury stock method) |
|
|
— |
|
|
|
521 |
|
|
Other |
|
|
— |
|
|
|
1,307 |
|
|
Total3 |
|
|
290,871 |
|
|
|
454,256 |
|
|
1 |
Common stock consisted of Class A shares, Class B shares and contingent shares for which all necessary conditions have been satisfied except for the passage of time. For the quarter ended December 31, 2017, the weighted-average number of Class A shares was 256.0 million and Class B shares was 34.8 million. For the year ended December 31, 2017, the weighted-average number of Class A shares was 252.5 and Class B shares was 34.8 million. |
144
|
3 |
Given the net loss during the quarter ended December 31, 2017, approximately 172.0 million potentially dilutive securities were not included in the computation of fully diluted earnings per share because their effect would have been anti-dilutive. For the year ended December 31, 2017, approximately 0.1 million potentially dilutive securities were not included in the computation of fully diluted earnings per share because their effect would have been anti-dilutive. Anti-dilutive securities for the year ended December 31, 2017 included, on a weighted-average basis, approximately 0.1 million other securities or other contracts to issue shares of common stock. Also as of December 31, 2017, approximately 2.8 million shares of contingent Class A common stock and limited partnership units were excluded from fully diluted EPS computations because the conditions for issuance had not been met by the end of the period. |
In November 2013, we entered into the Ninth Amendment to the Agreement of Limited Partnership of the Partnership, which created new preferred partnership units that may not be made exchangeable into our Class A common stock and are only entitled to a distribution each quarter at a rate of either 0.6875% (which is 2.75% per calendar year) or such other amount as set forth in the award documentation, and accordingly they will not be included in the fully diluted share count. Going forward, we intend to continue to reduce our overall rate of fully diluted share count growth by utilizing these new preferred partnership units.
Similarly, in May 2014 we entered into the Tenth Amendment to the Agreement of Limited Partnership of BGC Holdings. Pursuant to this amendment, NPSUs may not be made exchangeable into shares of the Company’s Class A common stock and will not be allocated any items of profit or loss.
On June 5, 2015, we entered into an agreement with Cantor providing Cantor, CF Group Management, Inc. (“CFGM”) and other Cantor affiliates entitled to hold BGC Class B common stock the right to exchange from time to time, on a one-to-one basis, subject to adjustment, up to an aggregate of 34,649,693 shares of BGC Class A common stock now owned or subsequently acquired by such Cantor entities for up to an aggregate of 34,649,693 shares of BGC Class B common stock. Such shares of BGC Class B common stock, which currently can be acquired upon the exchange of exchangeable limited partnership units owned in BGC Holdings and Newmark Holdings (as a result of the Newmark IPO and the Separation and Distribution Agreement), are already included in our fully diluted share count and will not increase Cantor’s current maximum potential voting power in the common equity. The exchange agreement will enable the Cantor entities to acquire the same number of shares of Class B common stock that they are already entitled to acquire without having to exchange its exchangeable limited partnership units in BGC Holdings and Newmark Holdings. Our Audit Committee and full Board of Directors determined that it was in the best interests of us and our stockholders to approve the exchange agreement because it will help ensure that Cantor retains its exchangeable limited partnership units in BGC Holdings and Newmark Holdings, which is the same partnership in which our partner employees participate, thus continuing to align the interests of Cantor with those of the partner employees.
Under the exchange agreement, Cantor and CFGM have the right to exchange the 14,676,499 shares of BGC Class A common stock owned by them as of December 31, 2017 (including the remaining shares of BGC Class A common stock held by Cantor from the exchange of convertible notes for 24,042,599 shares of BGC Class A common stock on April 13, 2015) for the same number of shares of BGC Class B common stock. Cantor would also have the right to exchange any shares of BGC Class A common stock subsequently acquired by it for shares of BGC Class B common stock, up to 34,649,693 shares of BGC Class B common stock.
We and Cantor have agreed that any shares of BGC Class B common stock issued in connection with the exchange agreement would be deducted from the aggregate number of shares of BGC Class B common stock that may be issued to the Cantor entities upon exchange of exchangeable limited partnership units in BGC Holdings and Newmark Holdings. Accordingly, the Cantor entities will not be entitled to receive any more shares of BGC Class B Stock under this agreement than they were previously eligible to receive upon exchange of exchangeable limited partnership units.
In relation to the Newmark IPO, on December 13, 2017, Newmark entered into a similar exchange agreement with Cantor, CFGM, BGC and other Cantor affiliates entitled to hold Class B common stock, providing the right to exchange from time to time shares of Class A common stock of Newmark now owned or hereafter acquired, as applicable, on a one-for-one basis for shares of Class B common stock, up to the number of shares of Newmark Class B common stock that are authorized but unissued under Newmark’s certificate of incorporation. The Newmark Audit Committee and Board of Directors have determined that the exchange agreement is in the best interests of Newmark and its stockholders because, among other things, it will help ensure that Cantor retains its exchangeable limited partnership units in Newmark Holdings, which is the same partnership in which Newmark’s partner employees participate, thus continuing to align the interests of Cantor with those of the partner employees.
On November 4, 2015, partners of BGC Holdings created five new classes of non-distributing partnership units (collectively with the NPSUs, “N Units”). These new N Units carry the same name as the underlying unit with the insertion of an additional “N” to designate them as the N Unit type and are designated as NREUs, NPREUs, NLPUs, NPLPUs and NPPSUs. The N Units are not entitled to participate in partnership distributions, will not be allocated any items of profit or loss and may not be made
145
exchangeable into shares of the Company’s Class A common stock. The Eleventh Amendment was approved by the Audit Committee of the Board of Directors and by the full Board of Directors.
Subject to the approval of the Compensation Committee or its designee, certain N Units may be converted into the underlying unit type (i.e. an NREU will be converted into an REU) and will then participate in Partnership distributions, subject to terms and conditions determined by the general partner of BGC Holdings in its sole discretion, including that the recipient continue to provide substantial services to the Company and comply with his or her partnership obligations. Such N Units are not included in the fully diluted share count.
On December 14, 2016, partners of BGC Holdings amended certain terms and conditions of the Partnership’s N Units in order to provide flexibility to the Company and the Partnership in using such N Units in connection with compensation arrangements and practices. The amendment provides for a minimum $5 million gross revenue requirement in a given quarter as a condition for an N Unit to be replaced by another type of Partnership unit in accordance with the Partnership Agreement and the grant documentation. The amendment was approved by the Audit Committee of the Board of Directors of the Company.
On December 13, 2017, the Amended and Restated BGC Holdings Partnership Agreement was further amended and restated (the “Second Amended and Restated BGC Holdings Partnership Agreement”) to include prior standalone amendments and to make certain other changes related to the Separation. The Second Amended and Restated BGC Holdings Partnership Agreement, among other things, reflects changes resulting from the division in the Separation of BGC Holdings into BGC Holdings and Newmark Holdings, including:
|
|
• |
an apportionment of the existing economic attributes (including, among others, capital accounts and post-termination payments) of each BGC Holdings limited partnership unit outstanding immediately prior to the Separation (a “Legacy BGC Holdings Unit”) between such Legacy BGC Holdings Unit and the fraction of a Newmark Holdings limited partnership unit issued in the Separation in respect of such Legacy BGC Holdings Unit (a “Legacy Newmark Holdings Unit”), based on the relative value of BGC and Newmark as of after the Newmark IPO; |
|
|
• |
an adjustment of the exchange mechanism between the Newmark IPO and the Distribution so that one exchangeable BGC Holdings unit together with a number of exchangeable Newmark Holdings units equal to 0.4545 divided by the Newmark Holdings exchange ratio as of such time, must be exchanged in order to receive one share of BGC Class A common stock; and |
|
|
• |
a right of the employer of a partner (whether it be Newmark or BGC) to determine whether to grant exchangeability with respect to Legacy BGC Holdings Units or Legacy Newmark Holdings Units held by such partner. |
The Second Amended and Restated BGC Holdings Partnership Agreement also removes certain classes of BGC Holdings units that are no longer outstanding, and permits the general partner of BGC Holdings to determine the total number of authorized BGC Holdings units. The Second Amended and Restated BGC Holdings Limited Partnership Agreement was approved by the Audit Committee of the Board of Directors of the Company.
Stock Option Exercises
We issued 154,533 shares of our Class A common stock related to the exercise of stock options during the year ended December 31, 2017. We issued 76,000 shares of our Class A common stock related to the exercise of stock options during the year ended December 31, 2016.
Registration Statements
We currently have in place an effective equity shelf Registration Statement on Form S-3 (the “Form S-3 Registration Statement”) with respect to the issuance and sale of up to 20 million shares of our Class A common stock from time to time on a delayed or continuous basis. On November 20, 2014, we entered into a controlled equity offering sales agreement with CF&Co (the “November 2014 Sales Agreement”), pursuant to which we may offer and sell up to an aggregate of 20 million shares of our Class A common stock. On April 12, 2017, we entered into a controlled equity offering sales agreement with CF&Co (the “April 2017 Sales Agreement”), pursuant to which we may offer and sell up to an aggregate of 20 million shares of our Class A common stock. Shares of our Class A common stock sold under our controlled equity offering sales agreement are used for redemptions and exchanges of limited partnership interests in BGC Holdings and Newmark Holdings, as well as for general corporate purposes. CF&Co is a wholly-owned subsidiary of Cantor and an affiliate of us. Under the November 2014 Sales Agreement and April 2017 Sales Agreement, we have agreed to pay CF&Co 2% of the gross proceeds from the sale of shares.
As of December 31, 2017, we have issued and sold an aggregate of 20.0 million shares of BGC Class A common stock under the Form S-3 Registration Statement pursuant to the November 2014 Sales Agreement. As of December 31, 2017, we have issued and sold 2.8 million shares of BGC Class A common stock under the April 2017 Sales Agreement. We intend to use the net
146
proceeds of any shares of BGC Class A common stock sold for general corporate purposes, including potential acquisitions, redemptions of limited partnership units and founding/working partner units in BGC Holdings and Newmark Holdings and repurchases of shares of Class A common stock from partners, executive officers and other employees of ours or our subsidiaries and of Cantor and its affiliates. Certain of such partners will be expected to use the proceeds from such sales to repay outstanding loans issued by, or credit enhanced by, Cantor, BGC Holdings or Newmark Holdings. In addition to general corporate purposes, these sales along with our share buy-back authorization are designed as a planning device in order to facilitate the redemption process. Going forward, we may redeem units and reduce our fully diluted share count under our repurchase authorization or later sell Class A shares under this agreement.
Further, we have an effective registration statement on Form S-4 (the “Form S-4 Registration Statement”), with respect to the offer and sale of up to 20 million shares of Class A common stock from time to time in connection with business combination transactions, including acquisitions of other businesses, assets, properties or securities. As of December 31, 2017, we have issued an aggregate of 11.0 million shares of BGC Class A common stock under the Form S-4 Registration Statement. We also have an effective shelf Registration Statement on Form S-3 pursuant to which we can offer and sell up to 10 million shares of our Class A common stock under the BGC Partners, Inc. Dividend Reinvestment and Stock Purchase Plan. As of December 31, 2017, we have issued approximately 341.6 thousand shares of BGC Class A common stock under the Dividend Reinvestment and Stock Purchase Plan.
On June 15, 2015, we filed a resale registration statement on Form S-3 with respect to 24,042,599 shares of our Class A common stock that Cantor received on April 13, 2015 in the conversion of the 8.75% Convertible Notes. These shares may be sold from time to time by Cantor or by certain of its pledgees, donees, distributees, counterparties, transferees or other successors in interest of the shares, including banks or other financial institutions which may enter into stock pledge, stock loan or other financing transactions with Cantor or its affiliates, as well as by their respective pledgees, donees, distributees, counterparties, transferees or other successors in interest.
Our Compensation Committee may grant stock options, stock appreciation rights, deferred stock such as RSUs, bonus stock, performance awards, dividend equivalents and other equity-based awards, including to provide exchange rights for shares of our Class A common stock upon exchange of limited partnership units and founding/working partner units. On June 22, 2016, at our Annual Meeting of Stockholders, our stockholders approved our Seventh Amended and Restated Long Term Incentive Plan (the “Equity Plan”) to increase from 350 million to 400 million the aggregate number of shares of our Class A common stock that may be delivered or cash-settled pursuant to awards granted during the life of the Equity Plan. As of December 31, 2017, the limit on the aggregate number of shares authorized to be delivered allowed for the grant of future awards relating to 189.4 million shares of the Company’s Class A common stock. On June 6, 2017, at the Annual Meeting of Stockholders of the Company, the Company’s stockholders approved the Company’s Second Amended and Restated Incentive Bonus Compensation Plan (the “Incentive Plan”) to approve the material terms of the performance goals under the Incentive Plan for compliance with Section 162(m) of the Internal Revenue Code of 1986, as amended, including an amendment to those performance goals in order to broaden the stock price performance goal to include dividends and/or total stockholder return. In addition, as a result of the Newmark IPO, effective as of December 13, 2017, the Board of Directors of Newmark adopted the Newmark Long Term Incentive Plan, which was approved by Newmark’s sole stockholder, BGC, on December 13, 2017.
On October 9, 2015, we filed a registration statement on Form S-3 pursuant to which CF&Co may make offers and sales of our 8.125% Senior Notes and 5.375% Senior Notes in connection with ongoing market-making transactions which may occur from time to time. Such market-making transactions in these securities may occur in the open market or may be privately negotiated at prevailing market prices at a time of resale or at related or negotiated prices. Neither CF&Co, nor any other of our affiliates, has any obligation to make a market in our securities, and CF&Co or any such other affiliate may discontinue market-making activities at any time without notice.
On January 12, 2016, we filed a registration statement on Form S-3 with respect to the 23,481,192 shares of our Class A common stock that we issued to the stockholders of JPI in the Back-End Mergers on January 12, 2016. These shares may be offered and sold from time to time by the JPI stockholders for their own account or by certain pledgees, donees, transferees, or other successors in interest of the shares, including banks or other financial institutions which may enter into stock pledge or other financing transactions with the JPI stockholders.
On August 17, 2017, we filed a registration statement on Form S-3 pursuant to which CF&Co may make offers and sales of our 5.125% Senior Notes in connection with ongoing market-making transactions which may occur from time to time. Such market-making transactions in these securities may occur in the open market or may be privately negotiated at prevailing market prices at a time of resale or at related or negotiated prices. Neither CF&Co, nor any other of our affiliates, has any obligation to make a market in our securities, and CF&Co or any such other affiliate may discontinue market-making activities at any time without notice.
147
CONTINGENT PAYMENTS RELATED TO ACQUISITIONS
Since 2012, the Company has completed acquisitions whose purchase price included an aggregate of approximately 10.9 million shares of the Company’s Class A common stock (with an acquisition date fair value of approximately $64.1 million), 10.6 million limited partnership units (with an acquisition date fair value of approximately $69.5 million) and $83.8 million in cash that may be issued contingent on certain targets being met through 2021.
As of December 31, 2017, the Company has issued 7.9 million shares of its Class A common stock, 7.0 million limited partnership units and $39.9 million in cash related to such contingent payments.
As of December 31, 2017, 2.8 million shares of the Company’s Class A common stock, 2.9 million limited partnership units and $25.7 million in cash remain to be issued if the targets are met. As a result of the Newmark IPO and the related Separation and Distribution Agreement, the limited partnership units as of December 31, 2017 represent 2.9 million and 1.3 million limited partnership units in BGC Holdings and Newmark Holdings, respectively (see Note 2—“Limited Partnership Interests in BGC Holdings and Newmark Holdings” to our consolidated financial statements in Part II, Item 8 of this Annual Report on Form 10-K for further information on the Separation and Distribution Agreement).
PURCHASE OF LIMITED PARTNERSHIP INTERESTS
Cantor has the right to purchase limited partnership interests (Cantor units) from BGC Holdings and Newmark Holdings upon redemption of non-exchangeable founding/working partner units redeemed by BGC Holdings and Newmark Holdings upon termination or bankruptcy of the founding/working partner. In addition, pursuant to Article Eight, Section 8.08, of the Second Amended and Restated BGC Holdings Limited Partnership Agreement (previously the “Sixth Amendment”) and Article Eight, Section 8.08, of the Newmark Holdings Limited Partnership Agreement, where either current, terminating, or terminated partners are permitted by the Company to exchange any portion of their FPUs and Cantor consents to such exchangeability, the Company shall offer to Cantor the opportunity for Cantor to purchase the same number of new exchangeable limited partnership interests (Cantor units) in BGC Holdings and Newmark Holdings at the price that Cantor would have paid for the FPUs had the Company redeemed them. Any such Cantor units purchased by Cantor are currently exchangeable for up to 34,649,693 shares of BGC Class B common stock or, at Cantor’s election or if there are no such additional shares of BGC Class B common stock, shares of BGC Class A common stock, in each case on a one-for-one basis (subject to customary anti-dilution adjustments).
On November 4, 2015, the Company issued exchange rights with respect to, and Cantor purchased, in transactions exempt from registration pursuant to Section 4(a)(2) of the Securities Act, an aggregate of 1,775,481 exchangeable limited partnership units in BGC Holdings, as follows: In connection with the redemption by BGC Holdings of an aggregate of 588,356 non-exchangeable founding partner units from founding partners of BGC Holdings for an aggregate consideration of $2,296,801, Cantor purchased 554,196 exchangeable limited partnership units from BGC Holdings for an aggregate of $2,115,306 (after offset of a founding partner’s $46,289 debt due to Cantor). In addition, pursuant to the Sixth Amendment, on November 4, 2015, Cantor purchased 1,221,285 exchangeable limited partnership units from BGC Holdings for an aggregate consideration of $4,457,436 in connection with the grant of exchangeability and exchange of 1,221,285 founding partner units. As a result of the Newmark IPO and the related Separation and Distribution Agreement, the aggregate exchangeable limited partnership units represent 1,775,481 and 807,037 exchangeable limited partnership units in BGC Holdings and Newmark Holdings, respectively. Each exchangeable limited partnership unit in BGC Holdings and a corresponding exchangeable limited partnership unit in Newmark Holdings, equal to an exchangeable limited partnership unit in BGC Holdings multiplied by the contribution ratio and divided by the exchange ratio, held by Cantor are exchangeable by Cantor at any time on a one-for-one basis (subject to adjustment) for shares of BGC Class A common stock of the Company.
On November 7, 2016, the Company issued exchange rights with respect to, and Cantor purchased, in transactions exempt from registration pursuant to Section 4(a)(2) of the Securities Act, an aggregate of 624,762 exchangeable limited partnership units in BGC Holdings, as follows: In connection with the redemption by BGC Holdings of an aggregate of 141,523 non-exchangeable founding partner units from founding partners of BGC Holdings for an aggregate consideration of $560,190, Cantor purchased 141,523 exchangeable limited partnership units from BGC Holdings for an aggregate of $560,190. In addition, pursuant to the Sixth Amendment, on November 7, 2016, Cantor purchased 483,239 exchangeable limited partnership units from BGC Holdings for an aggregate consideration of $1,796,367 in connection with the grant of exchangeability and exchange for 483,239 founding partner units. As a result of the Newmark IPO and the related Separation and Distribution Agreement, the aggregate exchangeable limited partnership units represent 624,762 and 283,983 exchangeable limited partnership units in BGC Holdings and Newmark Holdings, respectively.
On November 7, 2017, the Company issued exchange rights with respect to, and Cantor purchased, in transactions exempt from registration pursuant to Section 4(a)(2) of the Securities Act, an aggregate of 1,179,788 exchangeable limited partnership units in BGC Holdings, as follows: In connection with the redemption by BGC Holdings of an aggregate of 823,178 non-exchangeable founding partner units from founding partners of BGC Holdings for an aggregate consideration of $2,828,629, Cantor purchased
148
823,178 exchangeable limited partnership units from BGC Holdings for an aggregate of $2,828,629. In addition, pursuant to the Sixth Amendment, on November 7, 2017, Cantor purchased 356,610 exchangeable limited partnership units from BGC Holdings for an aggregate consideration of $1,091,175 in connection with the grant of exchangeability and exchange for 356,610 founding partner units. As a result of the Newmark IPO and the related Separation and Distribution Agreement, the aggregate exchangeable limited partnership units represent 1,179,788 and 536,267 exchangeable limited partnership units in BGC Holdings and Newmark Holdings, respectively.
As of December 31, 2017, there were 418,606 founding/working partner units in BGC Holdings and 190,275 founding/working partner units in Newmark Holdings remaining, which the partnerships had the right to redeem or exchange and with respect to which Cantor had the right to purchase an equivalent number of Cantor units.
GUARANTEE AGREEMENT FROM CF&CO
Under rules adopted by the CFTC, all foreign introducing brokers engaging in transactions with U.S. persons are required to register with the NFA and either meet financial reporting and net capital requirements on an individual basis or obtain a guarantee agreement from a registered Futures Commission Merchant. Our European-based brokers engage from time to time in interest rate swap transactions with U.S.-based counterparties, and therefore we are subject to the CFTC requirements. CF&Co has entered into guarantees on our behalf (and on behalf of GFI), and we are required to indemnify CF&Co for the amounts, if any, paid by CF&Co on our behalf pursuant to this arrangement. During the years ended December 31, 2017 and 2016, the Company recorded fees of $125,000 with respect to these guarantees.
EQUITY METHOD INVESTMENTS
On June 3, 2014, the Company’s Board of Directors and Audit Committee authorized the purchase of 1,000 Class B Units of Lucera (also known as “LFI Holdings, LLC” or “LFI”), a subsidiary of Cantor, representing 10% of the issued and outstanding Class B Units of LFI after giving effect to the transaction. On the same day, the Company completed the acquisition for $6.5 million and was granted an option to purchase an additional 1,000 Class B Units of LFI for an additional $6.5 million. On August 5, 2015, the Board of Directors and Audit Committee authorized the Company’s exercise of the option to purchase additional Class B units of LFI in order to represent an ownership interest of 20% of LFI. On January 15, 2016, the Company closed on the exercise of its option to acquire additional Class B Units of LFI Holdings, LLC. At the closing, the Company made a payment of $6.5 million to LFI. As a result of the option exercise, the Company had a 20% ownership interest in LFI.
On October 25, 2016, the Company’s Board of Directors and Audit Committee authorized the purchase of 9,000 Class B Units of LFI, representing all of the issued and outstanding Class B Units of LFI not already owned by the Company. On November 4, 2016, the Company completed this transaction. As a result of this transaction, the Company owns 100% of the ownership interests in Lucera. Lucera, a technology infrastructure provider tailored to the financial sector, is a limited liability company headquartered in New York.
In the purchase agreement, Cantor agreed, subject to certain exceptions, not to solicit certain senior executives of LFI’s business and was granted the right to be a customer of LFI’s businesses on the best terms made available to any other customer. The aggregate purchase price paid by the Company to Cantor consisted of approximately $24.2 million in cash plus a $4.8 million post-closing adjustment. The Company previously had a 20% ownership interest in LFI and accounted for its investment using the equity method. The transaction has been accounted for as a transaction between entities under common control.
The Company was authorized to enter into loans, investments or other credit support arrangements for Aqua (see Note 18— “Related Party Transactions,” to our consolidated financial statements in Part II, Item 8 of this Annual Report on Form 10-K); such arrangements are proportionally and on the same terms as similar arrangements between Aqua and Cantor. On October 27, 2015, the Company’s Board of Directors and Audit Committee increased the authorized amount by an additional $4.0 million. The Company has been further authorized to provide counterparty or similar guarantees on behalf of Aqua from time to time, provided that liability for any such guarantees, as well as similar guarantees provided by Cantor, would be shared proportionally with Cantor.
STOCK TRANSACTIONS – EXECUTIVE OFFICERS
In July 2016, the Audit Committee authorized the purchase by Mr. Lutnick’s retirement plan of up to $350,000 in Class A common stock at the closing price on the date of purchase. 36,405 shares of Class A common stock were purchased by the plan on August 16, 2016, at $8.77 per share, the closing price on the date of purchase.
149
UNIT REDEMPTIONS AND EXCHANGES—EXECUTIVE OFFICERS
During 2013, our executive officers participated in the Global Partnership Restructuring Program. In connection with the program, Messrs. Lynn, Windeatt and Sadler received an aggregate of 283,206 newly-issued BGC Holdings limited partnership units (equivalent to 9.75% of their non-exchangeable units that were redeemed in the above transactions). Upon any sale or other transfer by such executive officers of shares of restricted stock, a proportional number of these units will be redeemed for zero by BGC Holdings. These units are not expected to be made exchangeable into shares of Class A common stock. In connection with the sale of certain shares of restricted stock, an aggregate of 91,703 of such units held by Messrs. Lynn, Windeatt and Sadler were redeemed for zero on February 5, 2014, 6,377 of such units were redeemed for zero on December 5, 2014, 87,410 of such units were redeemed for zero on January 30, 2015, 69,408 of such units were redeemed for zero on February 24, 2016, and 3,152 of such units were redeemed for zero on September 30, 2016.
EXECUTIVE COMPENSATION AND SHARE REPURCHASES FROM EXECUTIVE OFFICERS
On January 1, 2015, (i) 1,000,000 of Mr. Lutnick’s NPSUs converted into 550,000 PSUs and 450,000 PPSUs, with respect to which Mr. Lutnick was offered the right to exchange 239,739 PSUs and 196,150 PPSUs for shares and cash, which he waived at that time under our policy, and (ii) 142,857 of Mr. Merkel’s NPSUs converted into 78,571 PSUs and 64,286 PPSUs, of which 5,607 PSUs and 4,588 PPSUs were made exchangeable and repurchased by the Company at the average price of shares of Class A common stock sold under our controlled equity offering less 2%, or $91,558.
On January 30, 2015, the Compensation Committee granted 4,000,000 NPSUs to Mr. Lutnick and 1,000,000 NPSUs to Mr. Lynn. These awards convert 25% per year on January 1 of each year beginning January 1, 2016 such that 1,000,000 of Mr. Lutnick’s NPSUs and 250,000 of Mr. Lynn’s NPSUs may be converted into an equivalent number of non-exchangeable PSUs/PPSUs for Mr. Lutnick and non-exchangeable LPUs/PLPUs for Mr. Lynn on each conversion date, subject to the approval of the Compensation Committee for all such conversions beginning in 2016. The grant of exchange rights with respect to such PSUs/PPSUs and LPUs/PLPUs will be determined in accordance with the Company’s practices when determining discretionary bonuses or awards, and any grants of exchangeability shall be subject to the approval of the Compensation Committee. Upon the signing of any agreement that would result in a “Change in Control” (as defined in the Amended and Restated Change in Control Agreement entered into by Mr. Lutnick and the applicable Deed of Adherence entered into by Mr. Lynn), (1) any unvested NPSUs held by Mr. Lutnick or Mr. Lynn shall convert in full and automatically be converted into exchangeable PSUs/PPSUs or LPUs/PLPUs (i.e., such PSUs and LPUs shall be exchangeable for shares of Class A common stock and PPSUs and PLPUs shall be exchangeable for cash), and (2) any non-exchangeable PSUs/PPSUs held by Mr. Lutnick and non-exchangeable LPUs/PLPUs held by Mr. Lynn shall become immediately exchangeable, which exchangeability may be exercised in connection with such “Change in Control,” except that, with respect to (1) and (2), 9.75% of Mr. Lynn’s LPUs/PLPUs shall be deemed to be redeemed for zero in proportion to such exchanges of LPUs/PLPUs in accordance with the customary LPU/PLPU structure.
On January 30, 2015, the Compensation Committee approved the acceleration of the lapse of restrictions on transferability with respect to an aggregate of 598,904 shares of restricted stock held by our executive officers as follows: Mr. Lynn, 455,733 shares; Mr. Merkel, 16,354 shares; Mr. Windeatt, 95,148 shares; and Mr. Sadler, 31,669 shares. On January 30, 2015, these executives sold these shares to the Company at $7.83 per share. In connection with such sales, an aggregate of 87,410 of LPUs were redeemed for zero as follows: Mr. Lynn, 68,381 units; Mr. Windeatt, 14,277 units; and Mr. Sadler 4,752 units.
On July 27, 2015, the Compensation Committee granted exchange rights with respect to 8,536 PSUs and 6,983 PPSUs that were issued pursuant to converted NPSUs that were awarded to Mr. Merkel in May 2014. On October 29, 2015, the Company repurchased (i) the 8,536 PSUs at a price of $8.34 per share, the closing price of the Class A common stock on the date the Compensation Committee approved the transaction, and (ii) the 6,983 PPSUs at a price of $9.15 per share, the closing price of the Class A common stock on December 31, 2014.
On February 24, 2016, the Compensation Committee granted 1,500,000 NPSUs to Mr. Lutnick, 2,000,000 NPSUs to Mr. Lynn, 1,000,000 NPSUs to Mr. Merkel and 75,000 NPSUs to Mr. Windeatt. Conversion of NPSUs into PSUs/PPSUs for Messrs. Lutnick and Merkel and into LPUs/PLPUs for Messrs. Lynn and Windeatt may be (i) 25% per year with respect to NPSUs granted in 2016; (ii) 25% of the previously awarded NPSUs currently held by Messrs. Lutnick and Lynn based upon the original issuance date (the first 25% having already been converted); and (iii) 25% per year of the current balance of NPSUs previously awarded to Mr. Merkel, provided that, with respect to all of the foregoing, such future conversions are subject to the approval of the Compensation Committee each year. The grant of exchange rights with respect to such PSUs/PPSUs and LPUs/PLPUs will be determined in accordance with the Company’s practices when determining discretionary bonuses or awards, and any grants of exchangeability shall be subject to the approval of the Compensation Committee.
On February 24, 2016, the Compensation Committee granted 750,000 non-exchangeable PSUs and 291,667 PPSUs (which may not be made exchangeable) to Mr. Lutnick; 621,429 non-exchangeable LPUs and 241,667 PLPUs (which may not be made exchangeable) to Mr. Lynn; 114,583 non-exchangeable PSUs and 93,750 PPSUs (which may not be made exchangeable) to
150
Mr. Merkel; 105,188 non-exchangeable LPUs and 40,906 non-exchangeable PLPUs (which may not be made exchangeable) to Mr. Windeatt; and 55,688 non-exchangeable LPUs and 21,656 non-exchangeable PLPUs (which may not be made exchangeable) to Mr. Sadler.
On February 24, 2016, the Compensation Committee approved the acceleration of the lapse of restrictions on transferability with respect to 612,958 shares of restricted stock held by our executive officers as follows: Mr. Lynn, 431,782 shares; Mr. Merkel, 150,382 shares; and Mr. Sadler, 30,794 shares. On February 24, 2016, Messrs. Lynn and Sadler sold these shares to the Company at $8.40 per share, and Mr. Merkel sold 120,000 of such shares to the Company at $8.40 per share. In connection with such transaction, 64,787 of Mr. Lynn’s and 4,621 of Mr. Sadler’s partnership units were redeemed for zero.
In February 2016, the Company granted exchange rights and/or released transfer restrictions with respect to 2,127,648 rights available to Mr. Lutnick with respect to some of his non-exchangeable limited partnership units (which amount included the lapse of restrictions with respect to 235,357 shares of restricted stock held by him), which were all of such rights available to him at such time. Mr. Lutnick has not transferred or exchanged such shares or units as of the date hereof.
On November 29, 2017, Mr. Lutnick exercised an employee stock option with respect to 1,000,000 shares of Class A common stock at an exercise price of $16.24 per share. The net exercise of the option resulted in 147,448 shares of the Company’s Class A common stock being issued to Mr. Lutnick. On March 9, 2016, Mr. Lutnick exercised an employee stock option with respect to 250,000 shares of Class A common stock at an exercise price of $8.42 per share. The net exercise of the option resulted in 17,403 shares of the Company’s Class A common stock being issued to Mr. Lutnick. On November 11, 2016, Mr. Lutnick exercised an employee stock option with respect to 800,000 shares of Class A common stock at an exercise price of $8.80 per share. The net exercise of the option resulted in 51,064 shares of the Company’s Class A common stock being issued to Mr. Lutnick.
On April 4, 2016, Mr. McMurray commenced his employment with the Company as our Chief Financial Officer, and he executed a deed of adherence as a member of our U.K. Partnership, which we refer to as the “McMurray Deed.” Under the McMurray Deed, Mr. McMurray’s membership in the U.K. Partnership is terminable on six-months’ notice. Pursuant to the McMurray Deed, he is entitled to receive a base draw of £325,000 ($464,444 as of April 4, 2016). He is also entitled to an upfront payment of up to £100,000 ($142,905 as of April 4, 2016) in cash, which is subject to repayment under certain circumstances. Mr. McMurray will also be entitled to receive a bonus allocation of the U.K. Partnership’s profits payable in April 2017, absent his earlier termination for cause or resignation, in the amount of £425,000 ($607,346 as of April 4, 2016), which will be payable in the form of cash, non-cash (e.g., partnership units) or a combination thereof. Mr. McMurray will be eligible for a discretionary profit allocation, subject to the satisfactory achievement by Mr. McMurray of such performance goals as may be established by the Company’s Compensation Committee. Pursuant to the McMurray Deed, Mr. McMurray may (i) not compete with the U.K. Partnership or any affiliates or solicit clients or counterparties of the U.K. Partnership or any affiliate for 12 months after his termination, and (ii) not solicit members or employees of the U.K. Partnership or any affiliate to leave their employment with, or to discontinue the supply of their services to, the U.K. Partnership or any affiliate for 24 months after his termination.
On April 27, 2016, Mr. McMurray entered into an agreement with the Company providing for four future awards of partnership units in BGC Holdings L.P. having an aggregate notional value of £500,000 ($758,800 on April 27, 2016). Units having a notional value of £83,333 ($126,541 on April 27, 2016) will be granted on each of January 1, 2017, 2018 and 2019, and units having a notional value of £250,000 ($379,625 on April 27, 2016) will be granted on January 1, 2020, in each case in accordance with customary grant documentation, subject to applicable termination and other provisions of the U.K Partnership Agreement, and adjustments set forth in the applicable agreement. All such units will be immediately exchangeable into the Company’s Class A common stock on the date of grant and cash may be paid by the Company in lieu of the grant of such units. The number of units granted will be determined based on the closing price of the Company’s Class A common stock on the trading day prior to each of the foregoing grant dates.
On September 30, 2016, Mr. Merkel elected to sell, and the Company agreed to purchase, an aggregate of 16,634 shares of the Company’s Class A common stock at a price of $8.75 per share, the closing price of the Company’s Class A common stock on such date. On September 30, 2016, certain trusts for the benefit of Mr. Merkel’s immediate family, of which Mr. Merkel’s spouse is the sole trustee of each trust and Mr. Merkel has the power to remove and replace such trustee, elected to sell, and the Company agreed to purchase, an aggregate of 4,131 shares of the Company’s Class A common stock on the same terms. These transactions were included in the Company’s stock repurchase authorization and authorized by the Audit Committee of the Board of Directors.
On November 7, 2016, the Compensation Committee agreed to grant 200,000 non-exchangeable PSUs/PPSUs in replacement of 200,000 NPSUs previously granted to Mr. Merkel (which, upon replacement, shall no longer exist) on or about each of the following dates, provided that BGC Partners, Inc., inclusive of its affiliates thereof, earns, in aggregate, at least $25 million in gross revenues in the calendar quarter in which the PSUs/PPSUs are to be granted: (i) December 1, 2016 and (ii) each March 31 of 2017 through 2020 (for an aggregate total of 1 million non-exchangeable PSUs/PPSUs). In connection with the foregoing, Mr. Merkel agreed to surrender a total of 1,714,286 previously granted NPSUs.
151
Each grant of PSUs/PPSUs also is subject to Mr. Merkel’s continued employment and compliance with the BGC Holdings, L.P. partnership agreement (the “Holdings Agreement”) as of the applicable grant date. The number of PSUs and PPSUs issuable on each grant date shall be determined by reference to the then-applicable practices for U.S.-based partners when determining the proportionality of PSUs/PPSUs (currently 55% in PSUs and 45% in PPSUs). The determination price of the PPSUs upon grant shall be the closing price of the Company’s Class A common stock on the applicable grant dates. In addition to the foregoing grants of PSUs/PPSUs in replacement of NPSUs, the Compensation Committee granted: (i) effective November 7, 2016, exchange rights with respect to 110,000 of Mr. Merkel’s previously issued non-exchangeable PSUs and 90,000 of Mr. Merkel’s previously issued non-exchangeable PPSUs and (ii) effective on or about each February 28 of 2017 through 2020, exchange rights for 200,000 of Mr. Merkel’s then non-exchangeable PSU/PPSUs (the proportion of PSUs to PPSUs shall be in accordance with their issuance), subject to Mr. Merkel’s continued employment and compliance with the Holdings Agreement as of the applicable exchangeability date (for an aggregate total of 1 million exchangeable PSUs/PPSUs).
The Compensation Committee repurchased (i) the 110,000 exchangeable PSUs for an aggregate price of $952,600, based on the closing price of the Company’s Class A common stock on November 7, 2016 and (ii) the 90,000 exchangeable PPSUs for an aggregate price of $773,599 based on the average determination price for such PPSUs at the time of grant, which was $8.5955 per Unit.
In accordance with the foregoing approval, on February 28, 2017, Mr. Merkel received exchange rights with respect to 110,000 non-exchangeable PSUs and 90,000 non-exchangeable PPSUs. The Compensation Committee agreed to repurchase (i) the 110,000 exchangeable PSUs for an aggregate price of $1,216,911 based on the net proceeds of the sale of shares under our Controlled Equity Offering less 2%, or $11.0628 per share, and (ii) the associated 90,000 PPSUs for an aggregate price of $847,033 based on the average determination price for such PPSUs at the time of grant, which was $9.41 per PPSU.
On October 4, 2017, Mr. Dalton exercised a stock option with respect to 7,085 shares of Class A common stock at an exercise price of $15.30 per share. On November 10, 2016, Mr. Dalton exercised a stock option with respect to 7,534 shares of Class A common stock at an exercise price of $8.87 per share.
On December 14, 2016, Mr. Lynn entered into an amended and restated deed of adherence (the “New Lynn Deed”) with BGC Services (Holdings) LLP (the “U.K. Partnership”). The Compensation Committee of the Company’s Board of Directors approved the New Lynn Deed and a related letter agreement, dated December 14, 2016 (the “Letter Agreement”), providing for a grant to Mr. Lynn of 1,000,000 NPSUs and 3,500,000 LPUs in BGC Holdings, L.P. (the “Partnership”), effective as of October 1, 2016.
The New Lynn Deed provides for substantially similar terms to the amended and restated deed of adherence to the limited liability partnership agreement (the “LLP Agreement”) of the U.K. Partnership entered into by Mr. Lynn effective as of January 7, 2013 (as then amended and restated, the “Old Lynn Deed”), except that (i) the 52-week rolling notice period has been replaced with a fixed term contract expiring March 31, 2023, with a 24-month advance rolling notice period; (ii) the term of the restrictive covenants in the Old Lynn Deed has been extended from 18 months to two years; (iii) the profit allocation payable to Mr. Lynn in the event of a termination due to illness or injury will be based on a pro rata portion of the profit allocation for the prior year; and (iv) the profit allocation payable in the event of the death of Mr. Lynn will be payable to his estate all in cash, with the Compensation Committee taking into consideration the portion of the year served and the profit allocation which might have paid to Mr. Lynn in the event that he had survived.
Further, on or about each October 1 of 2017 through 2020, pursuant to the Letter Agreement, the Partnership shall grant an aggregate award of 250,000 non-exchangeable LPUs in replacement of 250,000 of the above-referenced NPSUs, provided that (i) the Company, inclusive of all affiliates thereof, earns, in the aggregate, at least $5 million in gross revenues in the calendar quarter in respect of which the applicable award of LPUs is to be granted, and (ii) except in the event of Mr. Lynn’s death prior to the applicable grant date, Mr. Lynn remains a member in the U.K. Partnership and has complied at all times with the New Lynn Deed and the Agreement of Limited Partnership of BGC Holdings, L.P., Amended and Restated as of March 31, 2008 (as further amended from time to time, the “Partnership Agreement”), as of the applicable grant date. The LPUs shall be subject to customary adjustments due to membership in the U.K. Partnership upon their exchange or redemption (e.g., 9.75% cancellation/forfeiture upon exchange).
In the event of a change of control of the U.K. Partnership at any time while Mr. Lynn is providing substantial services to the Company or an affiliate thereof (the date such event takes effect, the “Change in Control”), then the Partnership shall grant exchangeable LPUs in replacement of any of the above NPSUs then held by Mr. Lynn, and any of the above non-exchangeable LPUs then held by Mr. Lynn shall become exchangeable for shares of the Company’s Class A common stock as follows: (a) in a lump sum following (i) the third anniversary of the Change of Control if Mr. Lynn continuously provides substantial services (as an employee, member, partner, consultant, or otherwise) to the Company, any of the individual(s) or entity(ies) which acquire(s) control of the Company (the “Controller”), or any affiliate thereof for the three years after the Change of Control, or (ii) the date the Controller permanently terminates Mr. Lynn’s services in all capacities to the Company, the Controller, and all affiliates thereof prior to the third
152
anniversary of the Change of Control if the circumstances amount to a fundamental breach of contract by the Controller as determined by a court of competent jurisdiction, or (b) ratably on or about the first through third anniversaries following the Change of Control if the Controller permanently terminates Mr. Lynn’s services in all capacities to the Company, the Controller, and all affiliates thereof prior to the third anniversary of the Change of Control unless (a)(ii) above applies. These rights are subject to compliance by Mr. Lynn with certain terms and conditions set forth in the applicable agreements, including not engaging in Competitive Activity (as such term is defined under the Partnership Agreement) at any time prior to the applicable grant of exchangeability. The grant of exchangeability with respect to such LPUs will be determined in accordance with the Company’s practices when determining discretionary bonuses or awards, and any grants of exchangeability shall be subject to the approval of the Compensation Committee.
In addition, the Compensation Committee approved a separate consultancy agreement between Mr. Lynn and the U.K. Partnership dated December 14, 2016, under which Mr. Lynn will be paid a fee of $20,833.33 per month ($250,000 per year) for his services, commencing upon the termination of his membership in the U.K. Partnership until the earlier of five years following such termination or such time as the U.K. Partnership chooses to terminate the engagement (the “Consultancy Agreement”). The Consultancy Agreement subjects Mr. Lynn to substantially the same two-year restrictive covenants as in the New Lynn Deed subsequent to his consultancy termination.
On January 31, 2017, the Compensation Committee approved the acceleration of the lapse of restrictions on transferability with respect to 167,654 shares of restricted stock held by Mr. Lynn and the Company repurchased the shares from Mr. Lynn at $11.07 per share, the closing price of the Company’s Class A common stock on such date. In connection with such transaction, 25,156 of Mr. Lynn’s LPUs were redeemed for zero. In addition, the Company redeemed for cash 180,115 of Mr. Lynn’s LPUs at $10.87 per share based on the net proceeds of the sale of shares under our Controlled Equity Offering less 2%, or $1,958,641, and 70,045 PLPUs redeemed at the grant price of $6.51 per PLPU. In connection with the transactions, 9,480 LPUs and 3,687 PLPUs issued at the grant price of $6.51 were redeemed for zero. These transactions were included in the Company’s stock and unit repurchase authorization and were approved by the Compensation Committee of the Board of Directors.
On January 31, 2017, the Compensation Committee approved the redemption for cash of 46,469 of Mr. Windeatt’s LPUs at $10.87 per share based on the net proceeds of the sale of shares under our Controlled Equity Offering less 2%, or $505,322, 14,866 PLPUs were redeemed at the grant price of $6.51 per PLPU and 3,206 PLPUs were redeemed at the grant price of $7.83 per PLPU. In connection with the transactions, 2,902 LPUs, 782 PLPUs issued at the grant price of $6.51 and 347 PLPUs issued at the grant price of $7.38 were redeemed for zero. These transactions were included in the Company’s stock and unit repurchase authorization and were approved by the Compensation Committee of the Board of Directors.
On February 24, 2017, Mr. Windeatt entered into a deed of an amendment (the “Windeatt Amendment”) with BGC Services (Holdings) LLP (the “U.K. Partnership”). The Compensation Committee of the Company’s Board of Directors approved the Windeatt Amendment and a related letter agreement, dated February 24, 2017 (the “Letter Agreement”), providing for a grant to Mr. Windeatt of 400,000 NPSUs and 100,000 LPUs in BGC Holdings, L.P. (the “Partnership”), effective as of January 1, 2017.
The Windeatt Amendment provides for substantially similar terms to the amended and restated deed of adherence to the limited liability partnership agreement (the “LLP Agreement”) of the U.K. Partnership entered into by Mr. Windeatt effective as of January 22, 2014 (as then amended and restated, the “Windeatt Deed”), except that (i) the current term of the Windeatt Deed has been extended from December 31, 2018 to March 31, 2024, with a 12-month advance rolling notice period; and (ii) the term of the restrictive covenants in the Windeatt Deed has been replaced with a two year period.
Further, on or about each April 1 of 2018 through 2021, pursuant to the Letter Agreement, the Partnership shall grant an aggregate award of 100,000 non-exchangeable LPUs in replacement of 100,000 of the above-referenced NPSUs, provided that (i) the Company, inclusive of all affiliates thereof, earns, in aggregate, at least $5 million in gross revenues in the calendar quarter in respect of which the applicable award of LPUs is to be granted, and (ii) except in the event of Mr. Windeatt’s death prior to the applicable grant date, Mr. Windeatt remains a member in the U.K. Partnership and has complied at all times with the Windeatt Deed (as amended) and the Agreement of Limited Partnership of BGC Holdings, L.P. Amended and Restated as of March 31, 2008 (as further amended from time to time, the “Partnership Agreement”), as of the applicable grant date. The LPUs shall be subject to customary adjustments due to membership in the U.K. Partnership upon their exchange or redemption (e.g., 9.75% cancellation/forfeiture upon exchange).
In the event of a change of control of the U.K. Partnership at any time while Mr. Windeatt is providing substantial services to the Company or an affiliate thereof (the date such event takes effect, the “Change in Control”), then the Partnership shall grant exchangeable LPUs in replacement of any of the above NPSUs then held by Mr. Windeatt, and any of the above non-exchangeable LPUs then held by Mr. Windeatt shall become exchangeable for shares of the Company’s Class A common stock as follows: (a) in a lump sum following the third anniversary of the Change of Control if Mr. Windeatt continuously provides substantial services (as an employee, member, partner, consultant or otherwise) to the Company, any of the individual(s) or entity(ies) which acquire(s) control of the Company (the “Controller”), or any affiliate thereof for the three years after the Change of Control, or (b) ratably on or about the first through third anniversaries following the Change of Control if the Controller permanently terminates Mr.
153
Windeatt’s services in all capacities to the Company, the Controller, and all affiliates thereof prior to the third anniversary of the Change of Control (provided that, in the event of a termination between the first and third anniversaries of the Change of Control, the portion of the payment attributed to the anniversary(ies) that passed prior to such termination shall be delivered in a lump sum following such termination, with the outstanding portion to be delivered in accordance with the remaining anniversary(ies)). These rights are subject to compliance by Mr. Windeatt of certain terms and conditions set forth in the applicable agreements, including not engaging in Competitive Activity (as such term is defined under the Partnership Agreement) at any time prior to the applicable grant of exchangeability. The grant of exchangeability with respect to such LPUs will be determined in accordance with the Company’s practices when determining discretionary bonuses or awards, and any grants of exchangeability shall be subject to the approval of the Compensation Committee.
In addition, the Compensation Committee approved a separate consultancy agreement between Mr. Windeatt and the U.K. Partnership dated February 24, 2017, under which Mr. Windeatt will be paid a fee of £8,333.33 per month (£100,000 per year) for his services, commencing upon the termination of his membership in the U.K. Partnership until the earlier of two years following such termination or such time as the U.K. Partnership chooses to terminate the engagement (the “Consultancy Agreement”). The Consultancy Agreement subjects Mr. Windeatt to substantially the same two-year restrictive covenants as in the Windeatt Deed subsequent to his consultancy termination.
On June 6, 2017, at the Annual Meeting of Stockholders of the Company, the Company’s stockholders approved the Company’s Second Amended and Restated Incentive Bonus Compensation Plan (the “Incentive Plan”) to approve the material terms of the performance goals under the Incentive Plan for compliance with Section 162(m) of the Internal Revenue Code of 1986, as amended, including an amendment to those performance goals in order to broaden the stock price performance goal to include dividends and/or total stockholder return.
MARKET SUMMARY
The following table provides certain volume and transaction count information for the quarterly periods indicated:
|
|
|
December 31, 2017 |
|
|
September 30, 2017 |
|
|
June 30, 2017 |
|
|
March 31, 2017 |
|
|
December 31, 2016 |
|
|||||
|
Notional Volume (in billions) |
|
|
|
|
|
|
|
|
|
|
|
|
|
|
|
|
|
|
|
|
|
Total fully electronic volume |
|
$ |
4,503 |
|
|
$ |
4,609 |
|
|
$ |
4,432 |
|
|
$ |
4,782 |
|
|
$ |
4,482 |
|
|
Total hybrid volume¹ |
|
|
63,727 |
|
|
|
61,866 |
|
|
|
57,597 |
|
|
|
57,625 |
|
|
|
50,956 |
|
|
Total fully electronic and hybrid volume |
|
$ |
68,230 |
|
|
$ |
66,475 |
|
|
$ |
62,029 |
|
|
$ |
62,407 |
|
|
$ |
55,438 |
|
|
Transaction Count (in thousands, except for days) |
|
|
|
|
|
|
|
|
|
|
|
|
|
|
|
|
|
|
|
|
|
Total fully electronic transactions |
|
|
2,227 |
|
|
|
2,231 |
|
|
|
2,034 |
|
|
|
2,399 |
|
|
|
2,569 |
|
|
Total hybrid transactions |
|
|
1,289 |
|
|
|
1,313 |
|
|
|
1,247 |
|
|
|
1,011 |
|
|
|
888 |
|
|
Total transactions |
|
|
3,516 |
|
|
|
3,544 |
|
|
|
3,281 |
|
|
|
3,410 |
|
|
|
3,457 |
|
|
Trading days |
|
|
63 |
|
|
|
63 |
|
|
|
63 |
|
|
|
62 |
|
|
|
63 |
|
|
1 |
Hybrid is defined as transactions involving some element of electronic trading but executed by BGC’s brokers, exclusive of voice-only transactions. |
Fully electronic volume, including new products, was $18.3 trillion for the year ended December 31, 2017, compared to $18.4 trillion for the year ended December 31, 2016. Our hybrid volume for the year ended December 31, 2017 was $240.8 trillion, compared to $205.8 trillion for the year ended December 31, 2016.
154
CONTRACTUAL OBLIGATIONS AND COMMITMENTS
The following table summarizes certain of our contractual obligations at December 31, 2017 (in thousands):
|
|
|
Total |
|
|
Less Than 1 Year |
|
|
1-3 Years |
|
|
3-5 Years |
|
|
More Than 5 Years |
|
|||||
|
Long-term debt and collateralized borrowings1 |
|
$ |
1,658,267 |
|
|
$ |
254,619 |
|
|
$ |
987,840 |
|
|
$ |
303,308 |
|
|
$ |
112,500 |
|
|
Warehouse notes payable |
|
|
360,440 |
|
|
|
360,440 |
|
|
|
— |
|
|
|
— |
|
|
|
— |
|
|
Operating leases2 |
|
|
533,988 |
|
|
|
72,046 |
|
|
|
120,884 |
|
|
|
98,746 |
|
|
|
242,312 |
|
|
Interest on long-term debt and collateralized borrowings3,4 |
|
|
367,635 |
|
|
|
80,754 |
|
|
|
84,457 |
|
|
|
24,588 |
|
|
|
177,836 |
|
|
Short-term borrowings5 |
|
|
6,046 |
|
|
|
6,046 |
|
|
|
— |
|
|
|
— |
|
|
|
— |
|
|
Interest on Short-term borrowings |
|
|
131 |
|
|
|
131 |
|
|
|
— |
|
|
|
— |
|
|
|
— |
|
|
One-time transition tax6 |
|
|
36,566 |
|
|
|
— |
|
|
|
8,775 |
|
|
|
5,851 |
|
|
|
21,940 |
|
|
Other7 |
|
|
30,714 |
|
|
|
8,000 |
|
|
|
16,000 |
|
|
|
6,714 |
|
|
|
— |
|
|
Total contractual obligations |
|
$ |
2,993,787 |
|
|
$ |
782,036 |
|
|
$ |
1,217,956 |
|
|
$ |
439,207 |
|
|
$ |
554,588 |
|
|
1 |
Long-term debt and collateralized borrowings reflects long-term borrowings of $400.0 million under the Company’s committed unsecured senior revolving credit agreement and converted term loan agreement (the $400.0 million represents the principal amount of the loan; the carrying value of the loan as of December 31, 2017 was $397.3 million), $270.7 million of borrowings under the Company’s committed unsecured senior term loan credit agreement (the $270.7 million represents the principal amount of the loan; the carrying value of the loan as of December 31, 2017 was $270.7 million), the issuance of $112.5 million of the 8.125% Senior Notes due June 26, 2042 (the $112.5 million represents the principal amount of the debt; the carrying value of the 8.125% Senior Notes as of December 31, 2017 was approximately $109.4 million), $300.0 million of the 5.375% Senior Notes due December 9, 2019 (the $300.0 million represents the principal amount of the debt; the carrying value of the 5.375% Senior Notes as of December 31, 2017 was approximately $298.1 million), $240.0 million of the 8.375% Senior Notes due July 19, 2018 (the $240.0 million represents the principal amount of the debt; the carrying value of the 8.375% Senior Notes as of December 31, 2017 was approximately $242.5 million), $300.0 million of the 5.125% Senior Notes due on May 27, 2021 (the $300.0 million represents the principal amount of the debt; the carrying value of the 5.125% Senior Notes as of December 31, 2017 was approximately $297.0 million), $9.2 million of collateralized borrowings due March 13, 2019, and an additional $26.4 million of collateralized borrowings due May 31, 2021. See Note 22— “Long-term Debt, Collateralized and Short-term Borrowings,” for more information regarding these obligations, including timing of payments and compliance with debt covenants. |
|
2 |
Operating leases are related to rental payments under various non-cancelable leases, principally for office space, net of sublease payments to be received. The total amount of sublease payments to be received is approximately $3.2 million over the life of the agreement. |
|
3 |
Interest on the $400.0 million of borrowings and the $270.7 million of borrowings was projected by using the 1 month LIBOR rate plus 275 bps as of December 31, 2017 through the loans maturity date on September 8, 2019. |
|
4 |
The $177.8 million of interest on notes payable that are due in more than five years represents interest on the 8.125% Senior Notes. The 8.125% Senior Notes may be redeemed for cash, in whole or in part, on or after June 26, 2017, at the Company’s option, which may impact the actual interest paid. |
|
5 |
Short-term borrowings reflects approximately $6.0 million (BRL 20.0 million) of borrowing under the Company’s committed unsecured loan agreement. See Note 22— “Long-term Debt, Collateralized and Short-term Borrowings,” for more information regarding this obligation. |
|
6 |
The Company recorded a provisional amount for the one-time transition tax on deemed repatriated earnings of foreign subsidiaries net of foreign tax credits of $36.6 million with an election to pay the taxes over eight years, with 40% to be paid in equal installments over the first five years and the remaining 60% to be paid in installments of 15%, 20% and 25% in years six, seven and eight, respectively. The provisional amount is a reasonable estimate which may be revised as additional guidance is released and further information becomes available. |
|
7 |
Other contractual obligations reflect commitments to make charitable contributions, which are recorded as part of “Accounts payable, accrued and other liabilities” in the Company’s consolidated statements of financial condition. The amount payable each year reflects an estimate of future Charity Day obligations. |
OFF-BALANCE SHEET ARRANGEMENTS
In the ordinary course of business, we enter into arrangements with unconsolidated entities, including variable interest entities. See Note 19—“Investments” to our consolidated financial statements for additional information related to our investments in unconsolidated entities.
155
CRITICAL ACCOUNTING POLICIES and estimates
The preparation of our consolidated financial statements in conformity with U.S. GAAP requires management to make estimates and assumptions that affect the reported amounts of the assets and liabilities, revenues and expenses, and the disclosure of contingent assets and liabilities in our consolidated financial statements. These accounting estimates require the use of assumptions about matters, some of which are highly uncertain at the time of estimation. To the extent actual experience differs from the assumptions used, our consolidated statements of financial condition, consolidated statements of operations and consolidated statements of cash flows could be materially affected. We believe that the following accounting policies involve a higher degree of judgment and complexity.
Revenue Recognition
We derive our revenues primarily through commissions from brokerage services; the spread between the buy and sell prices on matched principal transactions; gains from mortgage banking activities; revenues from real estate management and other services; servicing fees; fees from related parties; fees for the provision of certain data, software and post-trade services; and other revenues.
We recognize revenue when four basic criteria have been met:
|
|
• |
Existence of persuasive evidence that an arrangement exists; |
|
|
• |
Delivery has occurred or services have been rendered; |
|
|
• |
The seller’s price to the buyer is fixed and determinable; and |
|
|
• |
Collectability is reasonably assured. |
The judgments involved in revenue recognition include determining the appropriate time to recognize revenue. In particular, within our Real Estate Services segment, we evaluate our transactions to determine whether contingencies exist that may impact the timing of revenue recognition.
Equity-Based and Other Compensation
Discretionary Bonus: A portion of our compensation and employee benefits expense is comprised of discretionary bonuses, which may be paid in cash, equity, partnership awards or a combination thereof. We accrue expense in a period based on revenues in that period and on the expected combination of cash, equity and partnership units. Given the assumptions used in estimating discretionary bonuses, actual results may differ.
Restricted Stock Units: We account for equity-based compensation under the fair value recognition provisions of the U.S. GAAP guidance. Restricted stock units (“RSUs”) provided to certain employees are accounted for as equity awards, and in accordance with the U.S. GAAP, we are required to record an expense for the portion of the RSUs that is ultimately expected to vest. Further, forfeitures are estimated at the time of grant and revised, if necessary, in subsequent periods if actual forfeitures differ from those estimates. Because significant assumptions are used in estimating employee turnover and associated forfeiture rates, actual results may differ from our estimates under different assumptions or conditions.
The fair value of RSU awards to employees is determined on the date of grant, based on the fair value of our Class A common stock. Generally, RSUs granted by us as employee compensation do not receive dividend equivalents; as such, we adjust the fair value of the RSUs for the present value of expected forgone dividends, which requires us to include an estimate of expected dividends as a valuation input. This grant-date fair value is amortized to expense ratably over the awards’ vesting periods. For RSUs with graded vesting features, we have made an accounting policy election to recognize compensation cost on a straight-line basis. The amortization is reflected as non-cash equity-based compensation expense in our consolidated statements of operations.
Restricted Stock: Restricted stock provided to certain employees is accounted for as an equity award, and as per the U.S. GAAP guidance, we are required to record an expense for the portion of the restricted stock that is ultimately expected to vest. We have granted restricted stock that is not subject to continued employment or service; however, transferability is subject to compliance with our and our affiliates’ customary noncompete obligations. Such shares of restricted stock are generally saleable by partners in five to ten years. Because the restricted stock is not subject to continued employment or service, the grant-date fair value of the restricted stock is expensed on the date of grant. The expense is reflected as non-cash equity-based compensation expense in our consolidated statements of operations.
Limited Partnership Units: Limited partnership units in BGC Holdings and Newmark Holdings are generally held by employees. Generally, such units receive quarterly allocations of net income, which are cash distributed on a quarterly basis and generally contingent upon services being provided by the unit holders. Our Preferred Units are not entitled to participate in partnership
156
distributions other than with respect to a distribution at a rate of either 0.6875% (which is 2.75% per calendar year) or such other amount as set forth in the award documentation. The quarterly allocations of net income to such limited partnership units are reflected as a component of compensation expense under “Allocations of net income and grants of exchangeability to limited partnership units and FPUs” in our consolidated statements of operations.
Certain of these limited partnership units entitle the holders to receive post-termination payments equal to the notional amount in four equal yearly installments after the holder’s termination. These limited partnership units are accounted for as post-termination liability awards under the U.S. GAAP. Accordingly, we recognize a liability for these units on our consolidated statements of financial condition as part of “Accrued compensation” for the amortized portion of the post-termination payment amount, based on the current fair value of the expected future cash payout. We amortize the post-termination payment amount, less an expected forfeiture rate, over the vesting period, and record an expense for such awards based on the change in value at each reporting period in our consolidated statements of operations as part of “Compensation and employee benefits.”
Certain limited partnership units are granted exchangeability into Class A common stock on a one-for-one basis (subject to adjustment). At the time exchangeability is granted, we recognize an expense based on the fair value of the award on that date, which is included in “Allocations of net income and grants of exchangeability to limited partnership units and FPUs” in our consolidated statements of operations. During the years ended December 31, 2017, 2016 and 2015, we incurred compensation expense of $235.6 million, $141.4 million and $231.4 million, respectively, related to the grant of exchangeability on partnership units. The 2015 amount includes a conversion of 90% of outstanding REUs and RPUs in December 2015 totaling $114.0 million.
Employee Loans: We have entered into various agreements with certain employees and partners, whereby these individuals receive loans that may be either wholly or in part repaid from distributions that the individuals receive on some or all of their limited partnership interests or may be forgiven over a period of time. Cash advance distribution loans are documented in formal agreements and are repayable in timeframes outlined in the underlying agreements. We intend for these advances to be repaid in full from the future distributions on existing and future awards granted. The distributions are treated as compensation expense when made and the proceeds are used to repay the loan. The forgivable portion of any loans is recognized as compensation expense in our consolidated statements of operations over the life of the loan. We review the loan balances each reporting period for collectability. If we determine that the collectability of a portion of the loan balances is not expected, we recognize a reserve against the loan balances. Actual collectability of loan balances may differ from our estimates.
As of December 31, 2017 and December 31, 2016, the aggregate balance of employee loans, net of reserve, was $335.7 million and $269.8 million, respectively, and is included as “Loans, forgivable loans and other receivables from employees and partners, net” in our consolidated statements of financial condition. Compensation expense for the above-mentioned employee loans for the years ended December 31, 2017, 2016 and 2015 was $61.4 million, $57.4 million and $87.2 million (including a $47.2 million reserve in 2015), respectively. The compensation expense related to these loans was included as part of “Compensation and employee benefits” in our consolidated statements of operations.
Goodwill
Goodwill is the excess of the purchase price over the fair value of identifiable net assets acquired in a business combination. As prescribed in the U.S. GAAP guidance, Intangibles – Goodwill and Other, goodwill is not amortized, but instead is periodically tested for impairment. We review goodwill for impairment on an annual basis during the fourth quarter of each fiscal year or whenever an event occurs or circumstances change that could reduce the fair value of a reporting unit below its carrying amount.
When reviewing goodwill for impairment, we first assess qualitative factors to determine whether it is more likely than not that the fair value of a reporting unit is less than its carrying amount, including goodwill. If the results of the qualitative assessment are not conclusive, or if we choose to bypass the qualitative assessment, we perform a goodwill impairment analysis using a two-step process as follows.
The first step involves comparing each reporting unit’s estimated fair value to its carrying value, including goodwill. To estimate the fair value of the reporting units, we use a discounted cash flow model and data regarding market comparables. The valuation process requires significant judgment and involves the use of significant estimates and assumptions. These assumptions include cash flow projections, estimated cost of capital and the selection of peer companies and relevant multiples. Because significant assumptions and estimates are used in projecting future cash flows, choosing peer companies and selecting relevant multiples, actual results may differ from our estimates under different assumptions or conditions. If the estimated fair value of a reporting unit exceeds its carrying value, goodwill is deemed not to be impaired. If the carrying value exceeds estimated fair value, there is an indication of potential impairment and the second step is performed to measure the amount of potential impairment.
157
The second step of the process involves the calculation of an implied fair value of goodwill for each reporting unit for which step one indicated a potential impairment may exist. The implied fair value of goodwill is determined by measuring the excess of the estimated fair value of the reporting unit, as calculated in step one, over the estimated fair values of the individual assets, liabilities and identified intangibles. Events such as economic weakness, significant declines in operating results of reporting units, or significant changes to critical inputs of the goodwill impairment test (e.g., estimates of cash flows or cost of capital) could cause the estimated fair value of our reporting units to decline, which could result in an impairment of goodwill in the future.
Income Taxes
We account for income taxes using the asset and liability method as prescribed in the U.S. GAAP guidance, Income Taxes. Deferred tax assets and liabilities are recognized for the future tax consequences attributable to basis differences between the consolidated financial statement carrying amounts of existing assets and liabilities and their respective tax basis. Certain of our entities are taxed as U.S. partnerships and are subject to the Unincorporated Business Tax (“UBT”) in the City of New York. Therefore, the tax liability or benefit related to the partnership income or loss except for UBT rests with the partners (see Note 2—“Limited Partnership Interests in BGC Holdings and Newmark Holdings” for a discussion of partnership interests), rather than the partnership entity. As such, the partners’ tax liability or benefit is not reflected in our consolidated financial statements. The tax-related assets, liabilities, provisions or benefits included in our consolidated financial statements also reflect the results of the entities that are taxed as corporations, either in the U.S. or in foreign jurisdictions. We provide for uncertain tax positions based upon management’s assessment of whether a tax benefit is more likely than not to be sustained upon examination by tax authorities. Management is required to determine whether a tax position is more likely than not to be sustained upon examination by tax authorities, including resolution of any related appeals or litigation processes, based on the technical merits of the position. Because significant assumptions are used in determining whether a tax benefit is more likely than not to be sustained upon examination by tax authorities, actual results may differ from our estimates under different assumptions or conditions. We recognize interest and penalties related to income tax matters in “Provision for income taxes” in our consolidated statements of operations.
A valuation allowance is recorded against deferred tax assets if it is deemed more likely than not that those assets will not be realized. In assessing the need for a valuation allowance, we consider all available evidence, including past operating results, the existence of cumulative losses in the most recent fiscal years, estimates of future taxable income and the feasibility of tax planning strategies.
The measurement of current and deferred income tax assets and liabilities is based on provisions of enacted tax laws and involves uncertainties in the application of tax regulations in the U.S. and other tax jurisdictions. Because our interpretation of complex tax law may impact the measurement of current and deferred income taxes, actual results may differ from these estimates under different assumptions regarding the application of tax law.
On December 22, 2017, the SEC issued Staff Accounting Bulletin (“SAB 118”), which provides guidance on accounting for tax effects of the Tax Act. SAB 118 provides a measurement period that should not extend beyond one year from the Tax Act enactment date for companies to complete the accounting under ASC 740. In accordance with SAB 118, a company must reflect the income tax effects of those aspects of the Tax Act for which the accounting under ASC 740 is complete. To the extent that a company’s accounting for certain income tax effects of the Tax Act is incomplete but it is able to determine a reasonable estimate, it must record a provisional estimate to be included in the financial statements. If a company cannot determine a provisional estimate to be included in the financial statements, it should continue to apply ASC 740 on the basis of the provision of the tax laws that were in effect immediately before the enactment of the Tax Act. While the Company is able to make reasonable estimates of the impact of the reduction in corporate rate and the deemed repatriation transition tax, the final impact of the Tax Act may differ from these estimates, due to, among other things, changes in interpretations, additional guidance that may be issued, unexpected negative changes in business and market conditions that could reduce certain tax benefits, and actions taken by the Company as a result of the Tax Act.
See Note 3—“Summary of Significant Accounting Policies” to our consolidated financial statements in Part II, Item 8 of this Annual Report on Form 10-K for additional information regarding these critical accounting policies and other significant accounting policies.
RECENT ACCOUNTING PRONOUNCEMENTS
See Note 1—“Organization and Basis of Presentation” to our consolidated financial statements in Part II, Item 8 of this Annual Report on Form 10-K for information regarding recent accounting pronouncements.
158
Credit Risk
Credit risk arises from potential non-performance by counterparties and customers. BGC Partners has established policies and procedures to manage its exposure to credit risk. BGC Partners maintains a thorough credit approval process to limit exposure to counterparty risk and employs stringent monitoring to control the counterparty risk from its matched principal and agency businesses. BGC Partners’ account opening and counterparty approval process includes verification of key customer identification, anti-money laundering verification checks and a credit review of financial and operating data. The credit review process includes establishing an internal credit rating and any other information deemed necessary to make an informed credit decision, which may include correspondence, due diligence calls and a visit to the entity’s premises, as necessary.
Credit approval is granted subject to certain trading limits and may be subject to additional conditions, such as the receipt of collateral or other credit support. Ongoing credit monitoring procedures include reviewing periodic financial statements and publicly available information on the client and collecting data from credit rating agencies, where available, to assess the ongoing financial condition of the client.
Through its subsidiaries, BGC Partners executes matched principal transactions in which it acts as a “middleman” by serving as counterparty to both a buyer and a seller in matching back-to-back trades. These transactions are then settled through a recognized settlement system or third-party clearing organization. Settlement typically occurs within one to three business days after the trade date. Cash settlement of the transaction occurs upon receipt or delivery of the underlying instrument that was traded. BGC Partners generally avoids settlement of principal transactions on a free-of-payment basis or by physical delivery of the underlying instrument. However, free-of-payment transactions may occur on a very limited basis.
The number of matched principal trades BGC Partners executes has continued to grow as compared to prior years. Receivables from broker-dealers, clearing organizations, customers and related broker-dealers and Payables to broker-dealers, clearing organizations, customers and related broker-dealers on the Company’s consolidated statements of financial condition primarily represent the simultaneous purchase and sale of the securities associated with those matched principal transactions that have not settled as of their stated settlement dates. BGC Partners’ experience has been that substantially all of these transactions ultimately settle at the contracted amounts.
In addition, BGC Partners incurs limited credit risk related to certain brokerage activities. The counterparty risk relates to the collectability of the outstanding brokerage fee receivables. The review process includes monitoring both the clients and the related brokerage receivables. The review includes an evaluation of the ongoing collection process and an aging analysis of the brokerage receivables.
Berkeley Point, under the Fannie Mae DUS program, originates and services multifamily loans for Fannie Mae without having to obtain Fannie Mae’s prior approval for certain loans, as long as the loans meet the underwriting guidelines set forth by Fannie Mae. In return for the delegated authority to make loans and the commitment to purchase loans by Fannie Mae, we must maintain minimum collateral and generally are required to share risk of loss on loans sold through Fannie Mae. With respect to most loans, we are generally required to absorb approximately one-third of any losses on the unpaid principal balance of a loan at the time of loss settlement. Some of the loans that we originate under the Fannie Mae DUS program are subject to reduced levels or no risk-sharing. However, we generally receive lower servicing fees with respect to such loans. Although our Berkeley Point business’s average annual losses from such risk-sharing programs have been a minimal percentage of the aggregate principal amount of such loans, if loan defaults increase, actual risk-sharing obligation payments under the Fannie Mae DUS program could increase, and such defaults could have a material adverse effect on our business, financial condition, results of operations and prospects. In addition, a material failure to pay its share of losses under the Fannie Mae DUS program could result in the revocation of Berkeley Point’s license from Fannie Mae and the exercise of various remedies available to Fannie Mae under the Fannie Mae DUS program.
Effective July, 17, 2017, BGC entered into a joint venture with Cantor Commercial Real Estate Investor, L.P., an affiliate of Cantor Fitzgerald. Investments under this agreement will be real estate related, including investments in debt and equity securities as well as financing of loans for related parties. These activities may expose the firm to credit risk.
Market Risk
Market risk refers to the risk that a change in the level of one or more market prices, rates, indices or other factors will result in losses for a specified position. BGC Partners may allow certain of its desks to enter into unmatched principal transactions in the ordinary course of business and hold long and short inventory positions. These transactions are primarily for the purpose of facilitating clients’ execution needs, adding liquidity to a market or attracting additional order flow. As a result, BGC Partners may have market risk exposure on these transactions. BGC Partners’ exposure varies based on the size of its overall positions, the risk characteristics of the instruments held and the amount of time the positions are held before they are disposed of. BGC Partners has
159
limited ability to track its exposure to market risk and unmatched positions on an intra-day basis; however, it attempts to mitigate its market risk on these positions by strict risk limits, extremely limited holding periods and hedging its exposure. These positions are intended to be held short term to facilitate customer transactions. However, due to a number of factors, including the nature of the position and access to the market on which it trades, BGC Partners may not be able to unwind the position and it may be forced to hold the position for a longer period than anticipated. All positions held longer than intra-day are marked to market.
We also have investments in marketable equity securities, which are publicly-traded, and which had a fair value of $208.2 million as of December 31, 2017. These include shares of common stock of Nasdaq that we received in exchange for a portion of our electronic benchmark Treasury platform and shares of common stock of ICE that we received in exchange for Trayport. Investments in marketable securities carry a degree of risk, as there can be no assurance that the marketable securities will not lose value and, in general, securities markets can be volatile and unpredictable. As a result of these different market risks, our holdings of marketable securities could be materially and adversely affected. We may seek to minimize the effect of price changes on a portion of our investments in marketable securities through the use of derivative contracts. However, there can be no assurance that our hedging activities will be adequate to protect us against price risks associated with our investments in marketable securities. See Note 10—“Marketable Securities” and Note 13—“Derivatives” to our consolidated financial statements in Part II, Item 8 of this Annual Report on Form 10-K for further information regarding these investments and related hedging activities.
Our risk management procedures and strict limits are designed to monitor and limit the risk of unintended loss and have been effective in the past. However, there is no assurance that these procedures and limits will be effective at limiting unanticipated losses in the future. Adverse movements in the securities positions or a downturn or disruption in the markets for these positions could result in a substantial loss. In addition, principal gains and losses resulting from these positions could on occasion have a disproportionate effect, positive or negative, on BGC Partners’ consolidated financial condition and results of operations for any particular reporting period.
Operational Risk
Our businesses are highly dependent on our ability to process a large number of transactions across numerous and diverse markets in many currencies on a daily basis. If any of our data processing systems do not operate properly or are disabled or if there are other shortcomings or failures in our internal processes, people or systems, we could suffer impairment to our liquidity, financial loss, a disruption of our businesses, liability to clients, regulatory intervention or reputational damage. These systems may fail to operate properly or become disabled as a result of events that are wholly or partially beyond our control, including cybersecurity incidents, a disruption of electrical or communications services or our inability to occupy one or more of our buildings. The inability of our systems to accommodate an increasing volume of transactions could also constrain our ability to expand our businesses.
In addition, despite our contingency plans, our ability to conduct business may be adversely impacted by a disruption in the infrastructure that supports our businesses and the communities in which they are located. This may include a disruption involving electrical, communications, transportation or other services used by us or third parties with whom we conduct business.
Further, our operations rely on the secure processing, storage and transmission of confidential and other information on our computer systems and networks. Although we take protective measures such as software programs, firewalls and similar technology to maintain the confidentiality, integrity and availability of our and our clients’ information, the nature of the threats continue to evolve. As a result, our computer systems, software and networks may be vulnerable to unauthorized access, loss or destruction of data (including confidential client information), account takeovers, unavailability or disruption of service, computer viruses, acts of vandalism, or other malicious code, cyber-attacks and other events that could have an adverse security impact. There have also been an increasing number of malicious cyber incidents in recent years in various industries, including ours. Any such cyber incidents involving our computer systems and networks, or those of third parties important to our businesses, could present risks to our operations.
Foreign Currency Risk
BGC Partners is exposed to risks associated with changes in foreign exchange rates. Changes in foreign exchange rates create volatility in the U.S. Dollar equivalent of the Company’s revenues and expenses. In addition, changes in the remeasurement of BGC Partners’ foreign currency denominated financial assets and liabilities are recorded as part of its results of operations and fluctuate with changes in foreign currency rates. BGC monitors the net exposure in foreign currencies on a daily basis and hedges its exposure as deemed appropriate with highly rated major financial institutions.
The majority of the Company’s foreign currency exposure is related to the U.S. Dollar versus the British Pound and the Euro. While our international results of operations, as measured in U.S. Dollars, are subject to foreign exchange fluctuations, we do not consider the related risk to be material to our results of operations. For the financial assets and liabilities denominated in the British Pound and Euro, including foreign currency hedge positions related to these currencies, we evaluated the effects of a 10% shift
160
in exchange rates between those currencies and the U.S. Dollar, holding all other assumptions constant. The analysis identified the worst case scenario as the U.S. Dollar weakening against the Euro and the British Pound. If as of December 31, 2017, the U.S. Dollar had weakened against the Euro and the British Pound by 10%, the currency movements would have had an aggregate negative impact on our net income of approximately $1.2 million.
Interest Rate Risk
BGC Partners had $982.5 million in fixed-rate debt outstanding as of December 31, 2017. These debt obligations are not currently subject to fluctuations in interest rates, although in the event of refinancing or issuance of new debt, such debt could be subject to changes in interest rates.
In our Real Estate Services business, Newmark assumed from us the Term Loan (defined below) and Converted Term Loan (defined below). Newmark OpCo (defined below) also assumed from BGC U.S. (defined below) certain note obligations owed to BGC Partners that have an outstanding principal amount of $412.5 million, plus accrued and unpaid interest thereon (which we refer to as the “BGC Notes”. See “Newmark IPO and Separation Transactions” contained in Part I, Item 1—“Business” of this Annual Report on Form 10-K. Following the Newmark IPO and the repayment of the Term Loan and the Converted Term Loan, in the event that any member of the Newmark group receives net proceeds from the incurrence of indebtedness for borrowed money (subject to certain exceptions), Newmark OpCo will be obligated to use such net proceeds to repay the BGC Notes. In addition, Newmark will be obligated to repay any remaining amounts under the Term Loan, Converted Term Loan, and BGC Notes prior to the Distribution. Subsequent to the Newmark IPO, Newmark intends to replace the financing provided by the BGC Notes that remain outstanding with new senior term loans (which may be secured or unsecured), new senior unsecured notes, other long- or short-term financing or a combination thereof in an aggregate principal amount of approximately $412.5 million. While the terms of these borrowings, including the interest rates, have not yet been determined, our interest expense could be exposed to changes in interest rates. In that event, Newmark may enter into interest rate swap agreements to attempt to hedge the variability of future interest payments due to changes in interest rates.
Berkeley Point is an intermediary that originates loans which are generally pre-sold prior to loan closing. Therefore, for loans held for sale to the GSEs and HUD, we are not currently exposed to unhedged interest rate risk. Prior to closing on loans with borrowers, we enter into agreements to sell the loans to investors, and originated loans are typically sold within 45 days of funding. The coupon rate for each loan is set concurrently with the establishment of the interest rate with the investor.
Some of our assets and liabilities are subject to changes in interest rates. Earnings from escrows are generally based on LIBOR. 30-day LIBOR as of December 31, 2017 and 2016 was 157 basis points and 77 basis points, respectively. A 100-basis point increase in the 30-day LIBOR would increase our annual earnings by approximately $8.1 million based on our escrow balance as of December 31, 2017 compared to $11.4 million based on our escrow balance as of December 31, 2016. A 100-basis point decrease in 30-day LIBOR would decrease our annual earnings by approximately $8.1 million based on the escrow balance as of December 31, 2017 compared to $8.8 million decrease based on a decrease in 30-day LIBOR to zero and our escrow balance as of December 31, 2016.
We use warehouse facilities, borrowings from related parties, and a repurchase agreement to fund loans we originate under our various lending programs. The borrowing costs of our warehouse facilities and the repurchase agreement is based on LIBOR. A 100-basis point increase in 30-day LIBOR would decrease our annual net interest income by approximately $3.6 million based on our outstanding balances as of December 31, 2017 compared to $7.3 million based on our outstanding balances as of December 31, 2016. A 100-basis point decrease in 30-day LIBOR would increase our annual earnings by approximately $3.6 million based on our outstanding warehouse balance as of December 31, 2017 compared to $7.3 million increase based on a decrease in 30-day LIBOR to zero as of December 31, 2016.
Disaster Recovery
Our processes address disaster recovery concerns. We operate most of our technology from dual-primary data centers at our two different London locations. Either site alone is capable of running all of our essential systems. In addition, we maintain technology operations from data centers in New Jersey and Connecticut. Replicated instances of this technology are maintained in our London data centers. All data centers are built and equipped to best-practice standards of physical security with appropriate environmental monitoring and safeguards. Failover for the majority of our systems is automated.
161
BGC Partners, Inc. and Subsidiaries
|
Consolidated Financial Statements for the years ended December 31, 2017, 2016 and 2015 |
|
|
|
|
|
Reports of Independent Registered Public Accounting Firm and Independent Auditor |
163 |
|
|
|
|
Consolidated Financial Statements— |
|
|
|
|
|
166 |
|
|
|
|
|
167 |
|
|
|
|
|
168 |
|
|
|
|
|
169 |
|
|
|
|
|
171 |
|
|
|
|
|
174 |
162
Report of Independent Registered Public Accounting Firm
To the Shareholders and the Board of Directors of BGC Partners, Inc.
Opinion on the Financial Statements
We have audited the accompanying consolidated statements of financial condition of BGC Partners, Inc. (the “Company”) as of December 31, 2017 and 2016, the related consolidated statements of operations, comprehensive income (loss), cash flows and changes in equity for each of the three years in the period ended December 31, 2017, and the related notes and the financial statement schedule listed in the Index at Item 15(a)(2) (collectively referred to as the “consolidated financial statements”). In our opinion, based on our audits and, for 2016 and 2015, the report of other auditors, the consolidated financial statements present fairly, in all material respects, the financial position of the Company at December 31, 2017 and 2016, and the results of its operations and its cash flows for each of the three years in the period ended December 31, 2017, in conformity with U.S. generally accepted accounting principles.
We did not audit the 2016 and 2015 consolidated financial statements of Berkeley Point Financial LLC, a subsidiary, which reflect total assets constituting 30% as of December 31, 2016 and total revenues constituting 10% and 7% for the year ended December 31, 2016 and 2015, respectively. Those statements were audited by other auditors whose report has been furnished to us, and our opinion, insofar as it relates to the amounts included for Berkeley Point Financial LLC for 2016 and 2015, is based solely on the report of the other auditors.
We also have audited, in accordance with the standards of the Public Company Accounting Oversight Board (United States) (PCAOB), the Company's internal control over financial reporting as of December 31, 2017, based on criteria established in Internal Control-Integrated Framework issued by the Committee of Sponsoring Organizations of the Treadway Commission (2013 framework), as applicable and our report dated February 22, 2018 expressed an unqualified opinion thereon.
Basis for Opinion
These consolidated financial statements are the responsibility of the Company's management. Our responsibility is to express an opinion on the Company’s consolidated financial statements based on our audits. We are a public accounting firm registered with the PCAOB and are required to be independent with respect to the Company in accordance with the U.S. federal securities laws and the applicable rules and regulations of the Securities and Exchange Commission and the PCAOB.
We conducted our audits in accordance with the standards of the PCAOB. Those standards require that we plan and perform the audit to obtain reasonable assurance about whether the consolidated financial statements are free of material misstatement, whether due to error or fraud. Our audits included performing procedures to assess the risks of material misstatement of the consolidated financial statements, whether due to error or fraud, and performing procedures that respond to those risks. Such procedures included examining, on a test basis, evidence regarding the amounts and disclosures in the consolidated financial statements. Our audits also included evaluating the accounting principles used and significant estimates made by management, as well as evaluating the overall presentation of the consolidated financial statements. We believe that our audits provide a reasonable basis for our opinion.
/s/ Ernst & Young LLP
We have served as the Company’s auditor since 2008.
New York, New York
February 22, 2018
163
Member
Berkeley Point Financial LLC:
We have audited the accompanying consolidated balance sheets of Berkeley Point Financial LLC and subsidiaries as of December 31, 2016, and the related consolidated statements of operations, changes in member’s capital, and cash flows for each of the years in the two-year period ended December 31, 2016. These consolidated financial statements are the responsibility of the Company’s management. Our responsibility is to express an opinion on these consolidated financial statements based on our audits.
We conducted our audits in accordance with generally accepted auditing standards as established by the Auditing Standards Board (United States) and in accordance with the auditing standards of the Public Company Accounting Oversight Board (United States). Those standards require that we plan and perform the audit to obtain reasonable assurance about whether the consolidated financial statements are free of material misstatement. The Company is not required to have, nor were we engaged to perform, an audit of its internal control over financial reporting. Our audit included consideration of internal control over financial reporting as a basis for designing audit procedures that are appropriate in the circumstances, but not for the purpose of expressing an opinion on the effectiveness of the Company’s internal control over financial reporting. Accordingly, we express no such opinion. An audit also includes examining, on a test basis, evidence supporting the amounts and disclosures in the financial statements, assessing the accounting principles used and significant estimates made by management, as well as evaluating the overall financial statement presentation. We believe that our audits provide a reasonable basis for our opinion.
In our opinion, the consolidated financial statements referred to above present fairly, in all material respects, the financial position of Berkeley Point Financial LLC and subsidiaries as of December 31, 2016, and the results of their operations and their cash flows for the years in each of the years in the two-year period ended December 31, 2016, in conformity with U.S. generally accepted accounting principles.
/s/ KPMG LLP
Boston, Massachusetts
August 23, 2017
164
Report of Independent Registered Public Accounting Firm
To the Shareholders and the Board of Directors of BGC Partners, Inc.
Opinion on Internal Control over Financial Reporting
We have audited BGC Partners, Inc.’s internal control over financial reporting as of December 31, 2017, based on criteria established in Internal Control Integrated Framework issued by the Committee of Sponsoring Organizations of the Treadway Commission (2013 framework), (the “COSO criteria”). In our opinion, BGC Partners, Inc. (the “Company”) maintained, in all material respects, effective internal control over financial reporting as of December 31, 2017, based on the COSO criteria.
As indicated in the accompanying Management’s Report on Internal Control over Financial Reporting, management’s assessment of and conclusion on the effectiveness of internal control over financial reporting did not include the internal controls of Besso Insurance Group Limited and Commercial Real Estate Consulting Firm, which is included in the 2017 consolidated financial statements of the Company and constituted 7% and 11% of total and net assets, respectively, as of December 31, 2017 and 2% and 7% of revenues and net income, respectively, for the year then ended. Our audit of internal control over financial reporting of the Company also did not include an evaluation of the internal control over financial reporting of Besso Insurance Group Limited and Commercial Real Estate Consulting Firm.
We also have audited, in accordance with the standards of the Public Company Accounting Oversight Board (United States) (PCAOB), the consolidated statements of financial condition of BGC Partners, Inc. as of December 31, 2017 and 2016, and the related consolidated statements of operations, comprehensive income (loss), cash flows and changes in equity for each of the three years in the period ended December 31, 2017, and the related notes and the financial statement schedule listed in the Index at Item 15(a)(2) of the Company and our report dated February 22, 2018 expressed an unqualified opinion thereon.
Basis for Opinion
The Company’s management is responsible for maintaining effective internal control over financial reporting and for its assessment of the effectiveness of internal control over financial reporting included in the accompanying Management’s Report on Internal Control over Financial Reporting. Our responsibility is to express an opinion on the Company’s internal control over financial reporting based on our audit. We are a public accounting firm registered with the PCAOB and are required to be independent with respect to the Company in accordance with the U.S. federal securities laws and the applicable rules and regulations of the Securities and Exchange Commission and the PCAOB.
We conducted our audit in accordance with the standards of the PCAOB. Those standards require that we plan and perform the audit to obtain reasonable assurance about whether effective internal control over financial reporting was maintained in all material respects.
Our audit included obtaining an understanding of internal control over financial reporting, assessing the risk that a material weakness exists, testing and evaluating the design and operating effectiveness of internal control based on the assessed risk, and performing such other procedures as we considered necessary in the circumstances. We believe that our audit provides a reasonable basis for our opinion.
Definition and Limitations of Internal Control Over Financial Reporting
A company’s internal control over financial reporting is a process designed to provide reasonable assurance regarding the reliability of financial reporting and the preparation of financial statements for external purposes in accordance with generally accepted accounting principles. A company’s internal control over financial reporting includes those policies and procedures that (1) pertain to the maintenance of records that, in reasonable detail, accurately and fairly reflect the transactions and dispositions of the assets of the company; (2) provide reasonable assurance that transactions are recorded as necessary to permit preparation of financial statements in accordance with generally accepted accounting principles, and that receipts and expenditures of the company are being made only in accordance with authorizations of management and directors of the company; and (3) provide reasonable assurance regarding prevention or timely detection of unauthorized acquisition, use, or disposition of the company’s assets that could have a material effect on the financial statements.
Because of its inherent limitations, internal control over financial reporting may not prevent or detect misstatements. Also, projections of any evaluation of effectiveness to future periods are subject to the risk that controls may become inadequate because of changes in conditions, or that the degree of compliance with the policies or procedures may deteriorate.
/s/ Ernst & Young LLP
New York, New York
February 22, 2018
165
CONSOLIDATED STATEMENTS OF FINANCIAL CONDITION
(in thousands, except per share data)
|
|
|
December 31, 2017 |
|
|
December 31, 2016 |
|
||
|
Assets |
|
|
|
|
|
|
|
|
|
Cash and cash equivalents |
|
$ |
634,333 |
|
|
$ |
535,613 |
|
|
Cash segregated under regulatory requirements |
|
|
162,457 |
|
|
|
57,822 |
|
|
Reverse repurchase agreements |
|
|
— |
|
|
|
54,659 |
|
|
Securities owned |
|
|
33,007 |
|
|
|
35,357 |
|
|
Marketable securities |
|
|
208,176 |
|
|
|
164,820 |
|
|
Loans held for sale, at fair value |
|
|
362,635 |
|
|
|
1,071,836 |
|
|
Receivables from broker-dealers, clearing organizations, customers and related broker-dealers |
|
|
772,820 |
|
|
|
517,481 |
|
|
Mortgage servicing rights, net |
|
|
392,626 |
|
|
|
339,816 |
|
|
Accrued commissions and other receivables, net |
|
|
620,039 |
|
|
|
385,810 |
|
|
Loans, forgivable loans and other receivables from employees and partners, net |
|
|
335,734 |
|
|
|
269,773 |
|
|
Fixed assets, net |
|
|
189,347 |
|
|
|
167,239 |
|
|
Investments |
|
|
141,788 |
|
|
|
33,439 |
|
|
Goodwill |
|
|
945,582 |
|
|
|
863,881 |
|
|
Other intangible assets, net |
|
|
311,021 |
|
|
|
253,163 |
|
|
Receivables from related parties |
|
|
3,739 |
|
|
|
6,956 |
|
|
Other assets |
|
|
343,826 |
|
|
|
289,921 |
|
|
Total assets |
|
$ |
5,457,130 |
|
|
$ |
5,047,586 |
|
|
Liabilities, Redeemable Partnership Interest, and Equity |
|
|
|
|
|
|
|
|
|
Short-term borrowings |
|
$ |
6,046 |
|
|
$ |
— |
|
|
Securities loaned |
|
|
202,343 |
|
|
|
— |
|
|
Warehouse notes payable, net |
|
|
360,440 |
|
|
|
257,969 |
|
|
Accrued compensation |
|
|
432,733 |
|
|
|
383,407 |
|
|
Payables to broker-dealers, clearing organizations, customers and related broker-dealers |
|
|
634,998 |
|
|
|
384,822 |
|
|
Payables to related parties |
|
|
40,988 |
|
|
|
30,475 |
|
|
Accounts payable, accrued and other liabilities |
|
|
942,917 |
|
|
|
649,029 |
|
|
Long-term debt and collateralized borrowings |
|
|
1,650,509 |
|
|
|
965,767 |
|
|
Notes payable to related parties |
|
|
— |
|
|
|
690,000 |
|
|
Total liabilities |
|
|
4,270,974 |
|
|
|
3,361,469 |
|
|
Commitments, contingencies and guarantees (Note 24) |
|
|
|
|
|
|
|
|
|
Redeemable partnership interest |
|
|
46,415 |
|
|
|
52,577 |
|
|
Equity |
|
|
|
|
|
|
|
|
|
Stockholders’ equity: |
|
|
|
|
|
|
|
|
|
Class A common stock, par value $0.01 per share; 750,000 shares authorized; 306,218 and 292,549 shares issued at December 31, 2017 and December 31, 2016, respectively; and 256,968 and 244,870 shares outstanding at December 31, 2017 and December 31, 2016, respectively |
|
|
3,063 |
|
|
|
2,925 |
|
|
Class B common stock, par value $0.01 per share; 150,000 shares authorized; 34,848 shares issued and outstanding at December 31, 2017 and December 31, 2016, convertible into Class A common stock |
|
|
348 |
|
|
|
348 |
|
|
Additional paid-in capital |
|
|
1,763,371 |
|
|
|
1,662,615 |
|
|
Contingent Class A common stock |
|
|
40,472 |
|
|
|
42,472 |
|
|
Treasury stock, at cost: 49,250 and 47,679 shares of Class A common stock at December 31, 2017 and December 31, 2016, respectively |
|
|
(303,873 |
) |
|
|
(288,743 |
) |
|
Retained deficit |
|
|
(859,009 |
) |
|
|
(212,858 |
) |
|
Accumulated other comprehensive income (loss) |
|
|
(10,486 |
) |
|
|
(23,199 |
) |
|
Total stockholders’ equity |
|
|
633,886 |
|
|
|
1,183,560 |
|
|
Noncontrolling interest in subsidiaries |
|
|
505,855 |
|
|
|
449,980 |
|
|
Total equity |
|
|
1,139,741 |
|
|
|
1,633,540 |
|
|
Total liabilities, redeemable partnership interest, and equity |
|
$ |
5,457,130 |
|
|
$ |
5,047,586 |
|
The accompanying Notes to the Consolidated Financial Statements are an integral part of these financial statements.
166
CONSOLIDATED STATEMENTS OF OPERATIONS
(in thousands, except per share data)
|
|
|
Year Ended December 31, |
|
|||||||||
|
|
|
2017 |
|
|
2016 |
|
|
2015 |
|
|||
|
Revenues: |
|
|
|
|
|
|
|
|
|
|
|
|
|
Commissions |
|
$ |
2,348,108 |
|
|
$ |
1,985,667 |
|
|
$ |
1,929,913 |
|
|
Principal transactions |
|
|
317,856 |
|
|
|
325,481 |
|
|
|
313,142 |
|
|
Gains from mortgage banking activities, net |
|
|
205,999 |
|
|
|
193,387 |
|
|
|
115,304 |
|
|
Real estate management and other services |
|
|
233,063 |
|
|
|
196,801 |
|
|
|
187,118 |
|
|
Servicing fees |
|
|
110,441 |
|
|
|
87,671 |
|
|
|
74,356 |
|
|
Fees from related parties |
|
|
28,467 |
|
|
|
25,570 |
|
|
|
26,843 |
|
|
Data, software and post-trade |
|
|
54,557 |
|
|
|
54,309 |
|
|
|
102,371 |
|
|
Interest income |
|
|
51,103 |
|
|
|
33,876 |
|
|
|
24,742 |
|
|
Other revenues |
|
|
3,762 |
|
|
|
5,334 |
|
|
|
9,957 |
|
|
Total revenues |
|
|
3,353,356 |
|
|
|
2,908,096 |
|
|
|
2,783,746 |
|
|
Expenses: |
|
|
|
|
|
|
|
|
|
|
|
|
|
Compensation and employee benefits |
|
|
2,016,180 |
|
|
|
1,733,207 |
|
|
|
1,759,855 |
|
|
Allocations of net income and grant of exchangeability to limited partnership units and FPUs |
|
|
286,628 |
|
|
|
192,934 |
|
|
|
259,639 |
|
|
Total compensation and employee benefits |
|
|
2,302,808 |
|
|
|
1,926,141 |
|
|
|
2,019,494 |
|
|
Occupancy and equipment |
|
|
205,332 |
|
|
|
203,947 |
|
|
|
221,786 |
|
|
Fees to related parties |
|
|
29,028 |
|
|
|
24,143 |
|
|
|
19,202 |
|
|
Professional and consulting fees |
|
|
97,639 |
|
|
|
67,208 |
|
|
|
73,584 |
|
|
Communications |
|
|
131,188 |
|
|
|
125,592 |
|
|
|
121,690 |
|
|
Selling and promotion |
|
|
114,906 |
|
|
|
100,602 |
|
|
|
100,047 |
|
|
Commissions and floor brokerage |
|
|
44,086 |
|
|
|
38,515 |
|
|
|
35,456 |
|
|
Interest expense |
|
|
102,504 |
|
|
|
71,365 |
|
|
|
79,029 |
|
|
Other expenses |
|
|
198,562 |
|
|
|
144,213 |
|
|
|
194,334 |
|
|
Total expenses |
|
|
3,226,053 |
|
|
|
2,701,726 |
|
|
|
2,864,622 |
|
|
Other income (losses) , net: |
|
|
|
|
|
|
|
|
|
|
|
|
|
Gain (loss) on divestiture and sale of investments |
|
|
561 |
|
|
|
7,044 |
|
|
|
394,347 |
|
|
Gains (losses) on equity method investments |
|
|
6,189 |
|
|
|
3,543 |
|
|
|
2,597 |
|
|
Other income (loss) |
|
|
97,944 |
|
|
|
97,213 |
|
|
|
122,708 |
|
|
Total other income (losses), net |
|
|
104,694 |
|
|
|
107,800 |
|
|
|
519,652 |
|
|
Income (loss) from operations before income taxes |
|
|
231,997 |
|
|
|
314,170 |
|
|
|
438,776 |
|
|
Provision (benefit) for income taxes |
|
|
150,268 |
|
|
|
60,332 |
|
|
|
120,619 |
|
|
Consolidated net income (loss) |
|
$ |
81,729 |
|
|
$ |
253,838 |
|
|
$ |
318,157 |
|
|
Less: Net income (loss) attributable to noncontrolling interest in subsidiaries |
|
|
30,254 |
|
|
|
68,816 |
|
|
|
158,198 |
|
|
Net income (loss) available to common stockholders |
|
$ |
51,475 |
|
|
$ |
185,022 |
|
|
$ |
159,959 |
|
|
Per share data: |
|
|
|
|
|
|
|
|
|
|
|
|
|
Basic earnings (loss) per share |
|
|
|
|
|
|
|
|
|
|
|
|
|
Net income (loss) available to common stockholders |
|
$ |
51,475 |
|
|
$ |
185,022 |
|
|
$ |
159,959 |
|
|
Basic earnings (loss) per share |
|
$ |
0.18 |
|
|
$ |
0.67 |
|
|
$ |
0.66 |
|
|
Basic weighted-average shares of common stock outstanding |
|
|
287,378 |
|
|
|
277,073 |
|
|
|
243,460 |
|
|
Fully diluted earnings (loss) per share |
|
|
|
|
|
|
|
|
|
|
|
|
|
Net income (loss) for fully diluted shares |
|
$ |
75,256 |
|
|
$ |
283,525 |
|
|
$ |
177,972 |
|
|
Fully diluted earnings (loss) per share |
|
$ |
0.17 |
|
|
$ |
0.65 |
|
|
$ |
0.62 |
|
|
Fully diluted weighted-average shares of common stock outstanding |
|
|
454,256 |
|
|
|
433,226 |
|
|
|
286,322 |
|
|
Dividends declared per share of common stock |
|
$ |
0.70 |
|
|
$ |
0.62 |
|
|
$ |
0.54 |
|
|
Dividends declared and paid per share of common stock |
|
$ |
0.70 |
|
|
$ |
0.62 |
|
|
$ |
0.54 |
|
The accompanying Notes to the Consolidated Financial Statements are an integral part of these financial statements.
167
CONSOLIDATED STATEMENTS OF COMPREHENSIVE INCOME (LOSS)
(in thousands)
|
|
|
Year Ended December 31, |
|
|||||||||
|
|
|
2017 |
|
|
2016 |
|
|
2015 |
|
|||
|
Consolidated net income (loss) |
|
$ |
81,729 |
|
|
$ |
253,838 |
|
|
$ |
318,157 |
|
|
Other comprehensive income (loss), net of tax: |
|
|
|
|
|
|
|
|
|
|
|
|
|
Foreign currency translation adjustments |
|
|
15,779 |
|
|
|
(889 |
) |
|
|
(15,421 |
) |
|
Available for sale securities |
|
|
(927 |
) |
|
|
2,013 |
|
|
|
(17,814 |
) |
|
Total other comprehensive income (loss), net of tax |
|
|
14,852 |
|
|
|
1,124 |
|
|
|
(33,235 |
) |
|
Comprehensive income (loss) |
|
|
96,581 |
|
|
|
254,962 |
|
|
|
284,922 |
|
|
Less: Comprehensive income (loss) attributable to noncontrolling interest in subsidiaries, net of tax |
|
|
32,393 |
|
|
|
68,083 |
|
|
|
154,322 |
|
|
Comprehensive income (loss) attributable to common stockholders |
|
$ |
64,188 |
|
|
$ |
186,879 |
|
|
$ |
130,600 |
|
The accompanying Notes to the Consolidated Financial Statements are an integral part of these financial statements.
168
CONSOLIDATED STATEMENTS OF CASH FLOWS
(in thousands)
|
|
|
Year Ended December 31, |
|
|||||||||
|
|
|
2017 |
|
|
2016 |
|
|
2015 |
|
|||
|
CASH FLOWS FROM OPERATING ACTIVITIES: |
|
|
|
|
|
|
|
|
|
|
|
|
|
Consolidated net income (loss) |
|
$ |
81,729 |
|
|
$ |
253,838 |
|
|
$ |
318,157 |
|
|
Adjustments to reconcile consolidated net income (loss) to net cash provided by (used in) operating activities: |
|
|
|
|
|
|
|
|
|
|
|
|
|
Fixed asset depreciation and intangible asset amortization |
|
|
82,341 |
|
|
|
76,607 |
|
|
|
84,089 |
|
|
Amortization of mortgage servicing rights, net |
|
|
73,147 |
|
|
|
57,961 |
|
|
|
54,573 |
|
|
Employee loan amortization and reserves on employee loans |
|
|
61,350 |
|
|
|
57,417 |
|
|
|
87,208 |
|
|
Equity-based compensation and allocations of net income to limited partnership units and FPUs |
|
|
314,880 |
|
|
|
216,874 |
|
|
|
278,684 |
|
|
Deferred compensation expense |
|
|
8,251 |
|
|
|
15,974 |
|
|
|
23,189 |
|
|
Gain on originated mortgage servicing rights |
|
|
(123,902 |
) |
|
|
(126,547 |
) |
|
|
(71,873 |
) |
|
Unrealized losses (gains) on loans held for sale |
|
|
(2,194 |
) |
|
|
1,537 |
|
|
|
2,458 |
|
|
Loan originations - loans held for sale |
|
|
(8,844,768 |
) |
|
|
(7,691,573 |
) |
|
|
(5,210,160 |
) |
|
Loan sales - loans held for sale |
|
|
9,556,163 |
|
|
|
6,977,308 |
|
|
|
5,633,773 |
|
|
Losses (gains) on equity method investments |
|
|
(6,189 |
) |
|
|
(3,543 |
) |
|
|
(2,597 |
) |
|
Amortization of discount (premium) on notes payable |
|
|
649 |
|
|
|
(2,784 |
) |
|
|
6,988 |
|
|
Unrealized (gain) loss on marketable securities |
|
|
(22,189 |
) |
|
|
(359 |
) |
|
|
(27,103 |
) |
|
Impairment of fixed assets, intangible assets and investments |
|
|
13,358 |
|
|
|
4,383 |
|
|
|
19,128 |
|
|
Deferred tax provision (benefit) |
|
|
64,260 |
|
|
|
(33,245 |
) |
|
|
60,015 |
|
|
Sublease provision adjustment |
|
|
— |
|
|
|
(807 |
) |
|
|
2,019 |
|
|
Recognition of earn-out and related hedges |
|
|
(76,969 |
) |
|
|
(67,016 |
) |
|
|
(52,917 |
) |
|
Realized losses (gains) on marketable securities |
|
|
(1,171 |
) |
|
|
(13,410 |
) |
|
|
(35,994 |
) |
|
Change in estimated acquisition earn-out payables |
|
|
7,299 |
|
|
|
(13,751 |
) |
|
|
74 |
|
|
Loss (gains) on sale of cost method investments |
|
|
— |
|
|
|
(7,051 |
) |
|
|
— |
|
|
Loss (gains) on divestitures |
|
|
— |
|
|
|
— |
|
|
|
(401,902 |
) |
|
Forfeitures of Class A common stock |
|
|
(1,153 |
) |
|
|
(374 |
) |
|
|
(1,701 |
) |
|
Other |
|
|
(557 |
) |
|
|
(213 |
) |
|
|
(5,515 |
) |
|
Consolidated net income (loss), adjusted for non-cash and non-operating items |
|
|
1,184,335 |
|
|
|
(298,774 |
) |
|
|
760,593 |
|
|
Decrease (increase) in operating assets: |
|
|
|
|
|
|
|
|
|
|
|
|
|
Cash segregated under regulatory requirements |
|
|
(18,958 |
) |
|
|
(5,879 |
) |
|
|
8,769 |
|
|
Reverse repurchase agreements |
|
|
54,659 |
|
|
|
(54,659 |
) |
|
|
— |
|
|
Securities owned |
|
|
2,350 |
|
|
|
(2,996 |
) |
|
|
4,248 |
|
|
Securities borrowed |
|
|
— |
|
|
|
— |
|
|
|
62,736 |
|
|
Receivables from broker-dealers, clearing organizations, customers and related broker-dealers |
|
|
(253,371 |
) |
|
|
312,567 |
|
|
|
541,606 |
|
|
Mortgage servicing rights, net |
|
|
(2,055 |
) |
|
|
(7,676 |
) |
|
|
(9,259 |
) |
|
Accrued commissions receivable, net |
|
|
(96,478 |
) |
|
|
541 |
|
|
|
27,550 |
|
|
Loans, forgivable loans and other receivables from employees and partners, net |
|
|
(125,432 |
) |
|
|
(139,134 |
) |
|
|
(101,209 |
) |
|
Receivables from related parties |
|
|
2,497 |
|
|
|
3,067 |
|
|
|
3,839 |
|
|
Other assets |
|
|
4,295 |
|
|
|
6,946 |
|
|
|
25,991 |
|
|
Increase (decrease) in operating liabilities: |
|
|
|
|
|
|
|
|
|
|
|
|
|
Securities loaned |
|
|
202,343 |
|
|
|
(117,967 |
) |
|
|
117,890 |
|
|
Securities sold, not yet purchased |
|
|
— |
|
|
|
— |
|
|
|
(1,545 |
) |
|
Accrued compensation |
|
|
(6,640 |
) |
|
|
(59,170 |
) |
|
|
(100,686 |
) |
|
Payables to broker-dealers, clearing organizations, customers and related broker-dealers |
|
|
246,558 |
|
|
|
(334,119 |
) |
|
|
(578,606 |
) |
|
Payables to related parties |
|
|
10,513 |
|
|
|
6,715 |
|
|
|
(1,084 |
) |
|
Accounts payable, accrued and other liabilities |
|
|
57,091 |
|
|
|
11,799 |
|
|
|
(74,908 |
) |
|
Net cash provided by (used in) operating activities |
|
$ |
1,261,707 |
|
|
$ |
(678,739 |
) |
|
$ |
685,925 |
|
|
CASH FLOWS FROM INVESTING ACTIVITIES: |
|
|
|
|
|
|
|
|
|
|
|
|
|
Purchases of fixed assets |
|
$ |
(35,951 |
) |
|
$ |
(53,524 |
) |
|
$ |
(39,000 |
) |
|
Capitalization of software development costs |
|
|
(39,897 |
) |
|
|
(24,956 |
) |
|
|
(18,496 |
) |
|
Purchase of equity method investments |
|
|
(106,823 |
) |
|
|
(1,235 |
) |
|
|
(1,268 |
) |
|
Proceeds from equity method investments |
|
|
243 |
|
|
|
1,080 |
|
|
|
— |
|
|
Payments for acquisitions, net of cash acquired |
|
|
(105,529 |
) |
|
|
(162,265 |
) |
|
|
(173,072 |
) |
|
Advances to related party |
|
|
(375,000 |
) |
|
|
(175,000 |
) |
|
|
(265,000 |
) |
|
Repayments from related party |
|
|
375,000 |
|
|
|
175,000 |
|
|
|
265,000 |
|
|
Proceeds from divestitures, net |
|
|
— |
|
|
|
— |
|
|
|
14,485 |
|
|
Purchase of marketable securities |
|
|
— |
|
|
|
(68,396 |
) |
|
|
(11,630 |
) |
|
Proceeds from sale of marketable securities |
|
|
56,966 |
|
|
|
635,646 |
|
|
|
129,183 |
|
|
Proceeds from sale of cost method investments |
|
|
— |
|
|
|
7,106 |
|
|
|
— |
|
|
Capitalization of trademarks, patent defense and registration costs |
|
|
(329 |
) |
|
|
(546 |
) |
|
|
(845 |
) |
|
Net cash provided by (used in) investing activities |
|
$ |
(231,320 |
) |
|
$ |
332,910 |
|
|
$ |
(100,643 |
) |
The accompanying Notes to the Consolidated Financial Statements are an integral part of these financial statements.
169
CONSOLIDATED STATEMENTS OF CASH FLOWS—(Continued)
(in thousands)
|
|
|
Year Ended December 31, |
|
|||||||||
|
|
|
2017 |
|
|
2016 |
|
|
2015 |
|
|||
|
CASH FLOWS FROM FINANCING ACTIVITIES: |
|
|
|
|
|
|
|
|
|
|
|
|
|
Repayments of long-term debt and collateralized borrowings |
|
$ |
(314,919 |
) |
|
$ |
(6,858 |
) |
|
$ |
(4,976 |
) |
|
Repayments of convertible notes |
|
|
— |
|
|
|
(159,932 |
) |
|
|
— |
|
|
Issuance of senior notes, net of deferred issuance costs |
|
|
— |
|
|
|
295,768 |
|
|
|
— |
|
|
Issuance of long-term debt and collateralized borrowings, net of deferred issuance costs |
|
|
998,817 |
|
|
|
— |
|
|
|
27,918 |
|
|
Proceeds from warehouse notes payable |
|
|
8,844,767 |
|
|
|
7,691,573 |
|
|
|
5,210,160 |
|
|
Repayments on warehouse notes payable |
|
|
(8,742,296 |
) |
|
|
(7,793,238 |
) |
|
|
(5,628,709 |
) |
|
Advances from related party |
|
|
291,000 |
|
|
|
1,506,000 |
|
|
|
440,000 |
|
|
Repayments to related party |
|
|
(981,000 |
) |
|
|
(816,000 |
) |
|
|
(440,000 |
) |
|
Earnings distributions |
|
|
(126,243 |
) |
|
|
(69,740 |
) |
|
|
(73,765 |
) |
|
Redemption and repurchase of limited partnership interests |
|
|
(44,588 |
) |
|
|
(51,992 |
) |
|
|
(34,287 |
) |
|
Dividends to stockholders |
|
|
(200,116 |
) |
|
|
(170,795 |
) |
|
|
(131,360 |
) |
|
Repurchase of Class A common stock |
|
|
(16,773 |
) |
|
|
(96,025 |
) |
|
|
(12,114 |
) |
|
Cancellation of restricted stock units in satisfaction of withholding tax requirements |
|
|
(865 |
) |
|
|
(1,542 |
) |
|
|
(615 |
) |
|
Proceeds from issuance of Class A common stock, net of costs |
|
|
26,606 |
|
|
|
15,280 |
|
|
|
— |
|
|
Proceeds from Newmark initial public offering, net of underwriting discounts and commissions |
|
|
304,290 |
|
|
|
— |
|
|
|
— |
|
|
Deemed contribution due to acquisition of Lucera |
|
|
— |
|
|
|
15,005 |
|
|
|
— |
|
|
Acquisition of Lucera |
|
|
— |
|
|
|
(29,037 |
) |
|
|
— |
|
|
Acquisition of Berkeley Point |
|
|
(871,816 |
) |
|
|
— |
|
|
|
— |
|
|
Acquisition related distribution from Berkeley Point to CCRE |
|
|
(89,149 |
) |
|
|
— |
|
|
|
— |
|
|
Proceeds from exercise of stock options |
|
|
72 |
|
|
|
421 |
|
|
|
701 |
|
|
Proceeds from short-term borrowings |
|
|
6,046 |
|
|
|
— |
|
|
|
100,000 |
|
|
Repayments of short-term borrowings |
|
|
— |
|
|
|
— |
|
|
|
(170,000 |
) |
|
Proceeds from sale of limited partnership interests |
|
|
— |
|
|
|
2,357 |
|
|
|
6,573 |
|
|
Payments on acquisition earn-outs |
|
|
(18,911 |
) |
|
|
(12,949 |
) |
|
|
(13,791 |
) |
|
Net cash provided by (used in) financing activities |
|
|
(935,078 |
) |
|
|
318,296 |
|
|
|
(724,265 |
) |
|
Effect of exchange rate changes on cash and cash equivalents |
|
|
3,411 |
|
|
|
118 |
|
|
|
(8,740 |
) |
|
Net increase (decrease) in cash and cash equivalents |
|
|
98,720 |
|
|
|
(27,415 |
) |
|
|
(147,723 |
) |
|
Cash and cash equivalents at beginning of period |
|
|
535,613 |
|
|
|
563,028 |
|
|
|
710,751 |
|
|
Cash and cash equivalents at end of period |
|
$ |
634,333 |
|
|
$ |
535,613 |
|
|
$ |
563,028 |
|
|
Supplemental cash information: |
|
|
|
|
|
|
|
|
|
|
|
|
|
Cash paid during the period for taxes |
|
$ |
78,648 |
|
|
$ |
94,757 |
|
|
$ |
43,792 |
|
|
Cash paid during the period for interest |
|
|
100,273 |
|
|
|
75,295 |
|
|
|
68,119 |
|
|
Supplemental non-cash information: |
|
|
|
|
|
|
|
|
|
|
|
|
|
Issuance of Class A common stock upon exchange of limited partnership interests |
|
$ |
106,698 |
|
|
$ |
75,423 |
|
|
$ |
79,309 |
|
|
Issuance of Class A and contingent Class A common stock and limited partnership interests for acquisitions |
|
|
14,232 |
|
|
|
20,930 |
|
|
|
39,635 |
|
|
Issuance of Class A common stock upon conversion of convertible notes |
|
|
— |
|
|
|
68 |
|
|
|
150,000 |
|
|
Shares received for Nasdaq earn-out |
|
|
76,969 |
|
|
|
67,016 |
|
|
|
52,917 |
|
|
Shares received in Trayport transaction |
|
|
— |
|
|
|
— |
|
|
|
629,084 |
|
The accompanying Notes to the Consolidated Financial Statements are an integral part of these financial statements.
170
CONSOLIDATED STATEMENTS OF CHANGES IN EQUITY
For the Year Ended December 31, 2015
(in thousands, except share amounts)
|
|
|
BGC Partners, Inc. Stockholders |
|
|
|
|
|
|
|
|
|
|||||||||||||||||||||||||
|
|
|
Class A Common Stock |
|
|
Class B Common Stock |
|
|
Additional Paid-in Capital |
|
|
Contingent Class A Common Stock |
|
|
Treasury Stock |
|
|
Retained Deficit |
|
|
Accumulated Other Comprehensive Income (Loss) |
|
|
Noncontrolling Interest in Subsidiaries |
|
|
Total |
|
|||||||||
|
Balance, January 1, 2015 |
|
$ |
2,202 |
|
|
$ |
348 |
|
|
$ |
1,013,187 |
|
|
$ |
47,383 |
|
|
$ |
(200,958 |
) |
|
$ |
(254,680 |
) |
|
$ |
4,303 |
|
|
$ |
265,147 |
|
|
$ |
876,932 |
|
|
Consolidated net income (loss) |
|
|
— |
|
|
|
— |
|
|
|
— |
|
|
|
— |
|
|
|
— |
|
|
|
159,959 |
|
|
|
— |
|
|
|
158,198 |
|
|
|
318,157 |
|
|
Other comprehensive gain, net of tax |
|
|
— |
|
|
|
— |
|
|
|
— |
|
|
|
— |
|
|
|
— |
|
|
|
— |
|
|
|
(29,359 |
) |
|
|
(3,876 |
) |
|
|
(33,235 |
) |
|
Equity-based compensation, 825,996 shares |
|
|
8 |
|
|
|
— |
|
|
|
2,909 |
|
|
|
— |
|
|
|
— |
|
|
|
— |
|
|
|
— |
|
|
|
1,454 |
|
|
|
4,371 |
|
|
Dividends to common stockholders |
|
|
— |
|
|
|
— |
|
|
|
— |
|
|
|
— |
|
|
|
— |
|
|
|
(131,360 |
) |
|
|
— |
|
|
|
— |
|
|
|
(131,360 |
) |
|
Earnings distributions to limited partnership interests and other noncontrolling interests |
|
|
— |
|
|
|
— |
|
|
|
— |
|
|
|
— |
|
|
|
— |
|
|
|
— |
|
|
|
— |
|
|
|
(70,538 |
) |
|
|
(70,538 |
) |
|
Grant of exchangeability and redemption of limited partnership interests, issuance of 9,445,664 shares |
|
|
94 |
|
|
|
— |
|
|
|
141,262 |
|
|
|
— |
|
|
|
— |
|
|
|
— |
|
|
|
— |
|
|
|
75,684 |
|
|
|
217,040 |
|
|
Issuance of Class A common stock(net of costs), 129,151 shares |
|
|
1 |
|
|
|
— |
|
|
|
860 |
|
|
|
— |
|
|
|
— |
|
|
|
— |
|
|
|
— |
|
|
|
247 |
|
|
|
1,108 |
|
|
Redemption of FPUs, 539,275 units |
|
|
— |
|
|
|
— |
|
|
|
— |
|
|
|
— |
|
|
|
— |
|
|
|
— |
|
|
|
— |
|
|
|
(835 |
) |
|
|
(835 |
) |
|
Repurchase of Class A common stock, 1,416,991 shares |
|
|
— |
|
|
|
— |
|
|
|
— |
|
|
|
— |
|
|
|
(9,371 |
) |
|
|
— |
|
|
|
— |
|
|
|
(2,743 |
) |
|
|
(12,114 |
) |
|
Forfeitures of restricted Class A common stock, 270,422 shares |
|
|
— |
|
|
|
— |
|
|
|
688 |
|
|
|
— |
|
|
|
(2,002 |
) |
|
|
— |
|
|
|
— |
|
|
|
(387 |
) |
|
|
(1,701 |
) |
|
Cantor purchase of Cantor units from BGC Holdings upon redemption of founding/working partner units, 1,775,481 units |
|
|
— |
|
|
|
— |
|
|
|
— |
|
|
|
— |
|
|
|
— |
|
|
|
— |
|
|
|
— |
|
|
|
6,573 |
|
|
|
6,573 |
|
|
Re-allocation of equity due to additional investment by founding/working partners |
|
|
— |
|
|
|
— |
|
|
|
— |
|
|
|
— |
|
|
|
— |
|
|
|
— |
|
|
|
— |
|
|
|
(80 |
) |
|
|
(80 |
) |
|
Issuance of Class A common stock for acquisitions, 1,199,052 shares |
|
|
12 |
|
|
|
— |
|
|
|
5,112 |
|
|
|
(4,579 |
) |
|
|
— |
|
|
|
— |
|
|
|
— |
|
|
|
— |
|
|
|
545 |
|
|
Issuance of contingent shares and limited partnership interests in connection with acquisitions |
|
|
— |
|
|
|
— |
|
|
|
23,104 |
|
|
|
7,291 |
|
|
|
— |
|
|
|
— |
|
|
|
— |
|
|
|
8,695 |
|
|
|
39,090 |
|
|
Conversion of 8.75% Convertible Notes to Class A common stock, 24,042,599 shares |
|
|
240 |
|
|
|
— |
|
|
|
117,178 |
|
|
|
— |
|
|
|
— |
|
|
|
— |
|
|
|
— |
|
|
|
32,582 |
|
|
|
150,000 |
|
|
Reclassification of Redeemable noncontrolling interest to noncontrolling interest for GFI Back-End Merger |
|
|
— |
|
|
|
— |
|
|
|
— |
|
|
|
— |
|
|
|
— |
|
|
|
— |
|
|
|
— |
|
|
|
222,148 |
|
|
|
222,148 |
|
|
Purchases of Newmark noncontrolling interest |
|
|
— |
|
|
|
— |
|
|
|
731 |
|
|
|
— |
|
|
|
— |
|
|
|
— |
|
|
|
— |
|
|
|
(1,219 |
) |
|
|
(488 |
) |
|
Other |
|
|
2 |
|
|
|
— |
|
|
|
(2 |
) |
|
|
— |
|
|
|
— |
|
|
|
(591 |
) |
|
|
— |
|
|
|
1,513 |
|
|
|
922 |
|
|
Balance, December 31, 2015 |
|
$ |
2,559 |
|
|
$ |
348 |
|
|
$ |
1,305,029 |
|
|
$ |
50,095 |
|
|
$ |
(212,331 |
) |
|
$ |
(226,672 |
) |
|
$ |
(25,056 |
) |
|
$ |
692,563 |
|
|
$ |
1,586,535 |
|
The accompanying Notes to the Consolidated Financial Statements are an integral part of these financial statements.
171
CONSOLIDATED STATEMENTS OF CHANGES IN EQUITY
For the Year Ended December 31, 2016
(in thousands, except share amounts)
|
|
|
BGC Partners, Inc. Stockholders |
|
|
|
|
|
|
|
|
|
|||||||||||||||||||||||||
|
|
|
Class A Common Stock |
|
|
Class B Common Stock |
|
|
Additional Paid-in Capital |
|
|
Contingent Class A Common Stock |
|
|
Treasury Stock |
|
|
Retained Deficit |
|
|
Accumulated Other Comprehensive Income (Loss) |
|
|
Noncontrolling Interest in Subsidiaries |
|
|
Total |
|
|||||||||
|
Balance, January 1, 2016 |
|
$ |
2,559 |
|
|
$ |
348 |
|
|
$ |
1,305,029 |
|
|
$ |
50,095 |
|
|
$ |
(212,331 |
) |
|
$ |
(226,672 |
) |
|
$ |
(25,056 |
) |
|
$ |
692,563 |
|
|
$ |
1,586,535 |
|
|
Consolidated net income (loss) |
|
|
— |
|
|
|
— |
|
|
|
— |
|
|
|
— |
|
|
|
— |
|
|
|
185,022 |
|
|
|
— |
|
|
|
68,816 |
|
|
|
253,838 |
|
|
Other comprehensive gain, net of tax |
|
|
— |
|
|
|
— |
|
|
|
— |
|
|
|
— |
|
|
|
— |
|
|
|
— |
|
|
|
1,857 |
|
|
|
(733 |
) |
|
|
1,124 |
|
|
Equity-based compensation, 637,719 shares |
|
|
6 |
|
|
|
— |
|
|
|
2,999 |
|
|
|
— |
|
|
|
— |
|
|
|
— |
|
|
|
— |
|
|
|
1,563 |
|
|
|
4,568 |
|
|
Dividends to common stockholders |
|
|
— |
|
|
|
— |
|
|
|
— |
|
|
|
— |
|
|
|
— |
|
|
|
(170,795 |
) |
|
|
— |
|
|
|
— |
|
|
|
(170,795 |
) |
|
Earnings distributions to limited partnership interests and other noncontrolling interests |
|
|
— |
|
|
|
— |
|
|
|
— |
|
|
|
— |
|
|
|
— |
|
|
|
— |
|
|
|
— |
|
|
|
(62,258 |
) |
|
|
(62,258 |
) |
|
Grant of exchangeability and redemption of limited partnership interests, issuance of 8,705,906 shares |
|
|
87 |
|
|
|
— |
|
|
|
58,751 |
|
|
|
— |
|
|
|
— |
|
|
|
— |
|
|
|
— |
|
|
|
36,844 |
|
|
|
95,682 |
|
|
Issuance of Class A common stock (net of costs), 2,004,533 shares |
|
|
20 |
|
|
|
— |
|
|
|
14,216 |
|
|
|
— |
|
|
|
— |
|
|
|
— |
|
|
|
— |
|
|
|
3,542 |
|
|
|
17,778 |
|
|
Redemption of FPUs, 460,690 units |
|
|
— |
|
|
|
— |
|
|
|
— |
|
|
|
— |
|
|
|
— |
|
|
|
— |
|
|
|
— |
|
|
|
(2,307 |
) |
|
|
(2,307 |
) |
|
Repurchase of Class A common stock, 10,823,942 shares |
|
|
— |
|
|
|
— |
|
|
|
— |
|
|
|
— |
|
|
|
(75,984 |
) |
|
|
— |
|
|
|
— |
|
|
|
(20,194 |
) |
|
|
(96,178 |
) |
|
Forfeitures of restricted Class A common stock, 59,317 shares |
|
|
— |
|
|
|
— |
|
|
|
132 |
|
|
|
— |
|
|
|
(428 |
) |
|
|
— |
|
|
|
— |
|
|
|
(78 |
) |
|
|
(374 |
) |
|
Cantor purchase of Cantor units from BGC Holdings upon redemption of founding/working partners units, 624,762 units |
|
|
— |
|
|
|
— |
|
|
|
— |
|
|
|
— |
|
|
|
— |
|
|
|
— |
|
|
|
— |
|
|
|
2,357 |
|
|
|
2,357 |
|
|
Issuance of Class A common stock for acquisitions, 1,853,259 shares |
|
|
18 |
|
|
|
— |
|
|
|
15,683 |
|
|
|
(9,301 |
) |
|
|
— |
|
|
|
— |
|
|
|
— |
|
|
|
1,728 |
|
|
|
8,128 |
|
|
Issuance of contingent shares and limited partnership interests in connection with acquisitions |
|
|
— |
|
|
|
— |
|
|
|
8,425 |
|
|
|
1,678 |
|
|
|
— |
|
|
|
— |
|
|
|
— |
|
|
|
2,699 |
|
|
|
12,802 |
|
|
Acquisition of Lucera |
|
|
— |
|
|
|
— |
|
|
|
— |
|
|
|
— |
|
|
|
— |
|
|
|
— |
|
|
|
— |
|
|
|
(29,037 |
) |
|
|
(29,037 |
) |
|
Deemed contribution due to acquisition of Lucera |
|
|
— |
|
|
|
— |
|
|
|
— |
|
|
|
— |
|
|
|
— |
|
|
|
— |
|
|
|
— |
|
|
|
15,005 |
|
|
|
15,005 |
|
|
Conversion of 4.50% Convertible Notes to Class A common stock, 6,909 shares |
|
|
— |
|
|
|
— |
|
|
|
54 |
|
|
|
— |
|
|
|
— |
|
|
|
— |
|
|
|
— |
|
|
|
14 |
|
|
|
68 |
|
|
Completion of GFI Back-End Mergers and Issuance of Class A common stock, 23,481,192 shares |
|
|
235 |
|
|
|
— |
|
|
|
258,440 |
|
|
|
— |
|
|
|
— |
|
|
|
— |
|
|
|
— |
|
|
|
(258,691 |
) |
|
|
(16 |
) |
|
Purchase of Newmark noncontrolling interest |
|
|
— |
|
|
|
— |
|
|
|
(451 |
) |
|
|
— |
|
|
|
— |
|
|
|
— |
|
|
|
— |
|
|
|
(1,608 |
) |
|
|
(2,059 |
) |
|
Purchase of ELX noncontrolling interest |
|
|
— |
|
|
|
— |
|
|
|
(11 |
) |
|
|
— |
|
|
|
— |
|
|
|
— |
|
|
|
— |
|
|
|
(3 |
) |
|
|
(14 |
) |
|
Other |
|
|
— |
|
|
|
— |
|
|
|
(652 |
) |
|
|
— |
|
|
|
— |
|
|
|
(413 |
) |
|
|
— |
|
|
|
(242 |
) |
|
|
(1,307 |
) |
|
Balance, December 31, 2016 |
|
$ |
2,925 |
|
|
$ |
348 |
|
|
$ |
1,662,615 |
|
|
$ |
42,472 |
|
|
$ |
(288,743 |
) |
|
$ |
(212,858 |
) |
|
$ |
(23,199 |
) |
|
$ |
449,980 |
|
|
$ |
1,633,540 |
|
The accompanying Notes to the Consolidated Financial Statements are an integral part of these financial statements.
172
CONSOLIDATED STATEMENTS OF CHANGES IN EQUITY
For the Year Ended December 31, 2017
(in thousands, except share amounts)
|
|
|
BGC Partners, Inc. Stockholders |
|
|
|
|
|
|
|
|
|
|||||||||||||||||||||||||
|
|
|
Class A Common Stock |
|
|
Class B Common Stock |
|
|
Additional Paid-in Capital |
|
|
Contingent Class A Common Stock |
|
|
Treasury Stock |
|
|
Retained Deficit |
|
|
Accumulated Other Comprehensive Income (Loss) |
|
|
Noncontrolling Interest in Subsidiaries |
|
|
Total |
|
|||||||||
|
Balance, January 1, 2017 |
|
$ |
2,925 |
|
|
$ |
348 |
|
|
$ |
1,662,615 |
|
|
$ |
42,472 |
|
|
$ |
(288,743 |
) |
|
$ |
(212,858 |
) |
|
$ |
(23,199 |
) |
|
$ |
449,980 |
|
|
$ |
1,633,540 |
|
|
Consolidated net income (loss) |
|
|
— |
|
|
|
— |
|
|
|
— |
|
|
|
— |
|
|
|
— |
|
|
|
51,475 |
|
|
|
— |
|
|
|
30,254 |
|
|
|
81,729 |
|
|
Other comprehensive gain, net of tax |
|
|
— |
|
|
|
— |
|
|
|
— |
|
|
|
— |
|
|
|
— |
|
|
|
— |
|
|
|
12,713 |
|
|
|
2,139 |
|
|
|
14,852 |
|
|
Equity-based compensation, 570,944 shares |
|
|
6 |
|
|
|
— |
|
|
|
1,370 |
|
|
|
— |
|
|
|
— |
|
|
|
— |
|
|
|
— |
|
|
|
761 |
|
|
|
2,137 |
|
|
Dividends to common stockholders |
|
|
— |
|
|
|
— |
|
|
|
— |
|
|
|
— |
|
|
|
— |
|
|
|
(200,116 |
) |
|
|
— |
|
|
|
— |
|
|
|
(200,116 |
) |
|
Earnings distributions to limited partnership interests and other noncontrolling interests |
|
|
— |
|
|
|
— |
|
|
|
— |
|
|
|
— |
|
|
|
— |
|
|
|
— |
|
|
|
— |
|
|
|
(118,795 |
) |
|
|
(118,795 |
) |
|
Grant of exchangeability and redemption of limited partnership interests, issuance of 9,179,295 shares |
|
|
92 |
|
|
|
— |
|
|
|
125,502 |
|
|
|
— |
|
|
|
— |
|
|
|
— |
|
|
|
— |
|
|
|
77,605 |
|
|
|
203,199 |
|
|
Issuance of Class A common stock (net of costs), 1,994,670 shares |
|
|
20 |
|
|
|
— |
|
|
|
45,101 |
|
|
|
— |
|
|
|
— |
|
|
|
— |
|
|
|
— |
|
|
|
12,600 |
|
|
|
57,721 |
|
|
Redemption of FPUs, 729,802 units |
|
|
— |
|
|
|
— |
|
|
|
— |
|
|
|
— |
|
|
|
— |
|
|
|
— |
|
|
|
— |
|
|
|
(6,665 |
) |
|
|
(6,665 |
) |
|
Repurchase of Class A common stock, 1,386,769 shares |
|
|
— |
|
|
|
— |
|
|
|
— |
|
|
|
— |
|
|
|
(13,164 |
) |
|
|
— |
|
|
|
— |
|
|
|
(3,609 |
) |
|
|
(16,773 |
) |
|
Forfeitures of restricted Class A common stock, 183,246 shares |
|
|
— |
|
|
|
— |
|
|
|
1,063 |
|
|
|
— |
|
|
|
(1,966 |
) |
|
|
— |
|
|
|
— |
|
|
|
(250 |
) |
|
|
(1,153 |
) |
|
Cantor purchase of Cantor units from BGC Holdings upon redemption of founding/working partners units, 1,179,788 units |
|
|
— |
|
|
|
— |
|
|
|
— |
|
|
|
— |
|
|
|
— |
|
|
|
— |
|
|
|
— |
|
|
|
3,920 |
|
|
|
3,920 |
|
|
Issuance of Class A common stock for acquisitions, 1,923,854 shares |
|
|
20 |
|
|
|
— |
|
|
|
8,037 |
|
|
|
(5,961 |
) |
|
|
— |
|
|
|
— |
|
|
|
— |
|
|
|
566 |
|
|
|
2,662 |
|
|
Issuance of contingent shares and limited partnership interests in connection with acquisitions |
|
|
— |
|
|
|
— |
|
|
|
5,121 |
|
|
|
3,961 |
|
|
|
— |
|
|
|
— |
|
|
|
— |
|
|
|
2,488 |
|
|
|
11,570 |
|
|
Acquisition related distribution from Berkeley Point to CCRE |
|
|
— |
|
|
|
— |
|
|
|
— |
|
|
|
— |
|
|
|
— |
|
|
|
(56,483 |
) |
|
|
— |
|
|
|
(32,666 |
) |
|
|
(89,149 |
) |
|
Acquisition of Berkeley Point |
|
|
— |
|
|
|
— |
|
|
|
(87,434 |
) |
|
|
— |
|
|
|
— |
|
|
|
(441,386 |
) |
|
|
— |
|
|
|
(237,586 |
) |
|
|
(766,406 |
) |
|
Newmark Group Inc. noncontrolling interest |
|
|
— |
|
|
|
— |
|
|
|
— |
|
|
|
— |
|
|
|
— |
|
|
|
— |
|
|
|
— |
|
|
|
305,420 |
|
|
|
305,420 |
|
|
Purchase of Newmark noncontrolling interest |
|
|
— |
|
|
|
— |
|
|
|
(175 |
) |
|
|
— |
|
|
|
— |
|
|
|
— |
|
|
|
— |
|
|
|
(140 |
) |
|
|
(315 |
) |
|
Noncontrolling interest in Commercial Real Estate Consulting Firm |
|
|
— |
|
|
|
— |
|
|
|
— |
|
|
|
— |
|
|
|
— |
|
|
|
— |
|
|
|
— |
|
|
|
18,056 |
|
|
|
18,056 |
|
|
Other |
|
|
— |
|
|
|
— |
|
|
|
2,171 |
|
|
|
— |
|
|
|
— |
|
|
|
359 |
|
|
|
— |
|
|
|
1,777 |
|
|
|
4,307 |
|
|
Balance, December 31, 2017 |
|
$ |
3,063 |
|
|
$ |
348 |
|
|
$ |
1,763,371 |
|
|
$ |
40,472 |
|
|
$ |
(303,873 |
) |
|
$ |
(859,009 |
) |
|
$ |
(10,486 |
) |
|
$ |
505,855 |
|
|
$ |
1,139,741 |
|
The accompanying Notes to the Consolidated Financial Statements are an integral part of these financial statements.
173
NOTES TO CONSOLIDATED FINANCIAL STATEMENTS
|
1. |
Organization and Basis of Presentation |
Business Overview
BGC Partners, Inc. (together with its subsidiaries, “BGC Partners,” “BGC” or the “Company”) is a leading global brokerage company servicing the financial and real estate markets through its two segments, Financial Services and Real Estate Services. Through the Company’s financial service brands, including BGC, GFI, Sunrise, Besso and R.P. Martin, among others, the Company’s Financial Services segment specializes in the brokerage of a broad range of products, including fixed income (rates and credit), foreign exchange, equities, energy and commodities, insurance, and futures. It also provides a wide range of services, including trade execution, broker-dealer services, clearing, trade compression, post trade, information, and other back-office services to a broad range of financial and non-financial institutions. BGC Partners’ integrated platform is designed to provide flexibility to customers with regard to price discovery, execution and processing of transactions, and enables them to use voice, hybrid, or in many markets, fully electronic brokerage services in connection with transactions executed either over-the-counter (“OTC”) or through an exchange. Through the Company’s electronic brands including FENICS, BGC Trader, BGC Market Data, Capitalab and Lucera, BGC Partners offers fully electronic brokerage, financial technology solutions, market data, post-trade services and analytics related to financial instruments and markets.
Newmark Group, Inc. (which may be referred to as “Newmark” or “NKF”) is a leading commercial real estate services firm. Newmark offers a full suite of services and products for both owners and occupiers across the entire commercial real estate industry. Our investor/owner services and products include capital markets, which consists of investment sales, debt and structured finance and loan sales, agency leasing, property management, valuation and advisory, diligence and underwriting and government sponsored entity (“GSE”) lending and loan servicing. Newmark’s occupier services and products include tenant representation, real estate management technology systems, workplace and occupancy strategy, global corporate consulting, project management, lease administration and facilities management. Newmark enhances these services and products through innovative real estate technology solutions and data analytics that enable our clients to increase their efficiency and profits. Newmark has relationships with many of the world’s largest commercial property owners, real estate developers and investors, as well as Fortune 500 and Forbes Global 2000 companies.
On September 8, 2017, the Company and one of its operating partnerships, BGC Partners, L.P., closed (the “Closing”) on the acquisition of Berkeley Point Financial LLC (“Berkeley Point”) pursuant to a Transaction Agreement, dated as of July 17, 2017, with Cantor Fitzgerald, L.P. (“Cantor”) and certain of Cantor’s affiliates, including Cantor Commercial Real Estate Company, L.P. (“CCRE”) and Cantor Commercial Real Estate Sponsor, L.P., the general partner of CCRE. Berkeley Point is a leading commercial real estate finance company focused on the origination and sale of multifamily and other commercial real estate loans through government-sponsored and government-funded loan programs, as well as the servicing of commercial real estate loans. At the Closing, the Company purchased and acquired from CCRE all of the outstanding membership interests of Berkeley Point, a wholly owned subsidiary of CCRE, for an acquisition price of $875.0 million, subject to a post-closing upward or downward adjustment to the extent that the net assets, inclusive of certain fair value adjustments, of Berkeley Point as of the Closing were greater than or less than $508.6 million, (the “Berkeley Point Acquisition”). BGC paid $3.2 million of the $875.0 million acquisition price with 247,099 limited partnership units of BGC Holdings, L.P. (“BGC Holdings”), which may be exchanged over time for shares of Class A common stock of the Company, with each BGC Holdings unit valued for these purposes at the volume weighted-average price of a share of Class A common stock for the three trading days prior to the Closing. The Berkeley Point Acquisition did not include the Special Asset Servicing Group of Berkeley Point; however, Berkeley Point will continue to hold the Special Asset Servicing Group’s assets until the servicing group is transferred to CCRE at a later date in a separate transaction. Accordingly, CCRE will continue to bear the benefits and burdens of the Special Asset Servicing Group from and after the Closing (the “Special Asset Servicing Arrangement”).
Concurrently with the Berkeley Point Acquisition, on September 8, 2017, the Company invested $100 million in a newly formed commercial real estate-related financial and investment business, CF Real Estate Finance Holdings, L.P. (“Real Estate LP”), which is controlled and managed by Cantor. Real Estate LP may conduct activities in any real estate related business or asset backed securities-related business or any extensions thereof and ancillary activities thereto. As of December 31, 2017, the Company’s investment is accounted for under the equity method.
174
On December 13, 2017, prior to the closing of the Newmark initial public offering (“IPO”), BGC, BGC Holdings, L.P. (“BGC Holdings”), BGC Partners, L.P. (“BGC U.S. OpCo”), Newmark, Newmark Holdings, L.P. (“Newmark Holdings”), Newmark Partners, L.P. (“Newmark OpCo”) and, solely for the provisions listed therein, Cantor Fitzgerald, L.P. (“Cantor”) and BGC Global Holdings, L.P. (“BGC Global OpCo”) entered into a Separation and Distribution Agreement (the “Separation and Distribution Agreement”). The Separation and Distribution Agreement sets forth the agreements among BGC, Cantor, Newmark and their respective subsidiaries regarding, among other things:
|
|
• |
the principal corporate transactions pursuant to which BGC, BGC Holdings and BGC U.S. OpCo and their respective subsidiaries (other than the Newmark Group (defined below), the “BGC Group”) transferred to Newmark, Newmark Holdings and Newmark OpCo and their respective subsidiaries (the “Newmark Group”) the assets and liabilities of the BGC Group relating to BGC’s Real Estate Services business (the “Separation”); |
|
|
• |
the proportional distribution of interests in Newmark Holdings to holders of interests in BGC Holdings; |
|
|
• |
the Newmark IPO; |
|
|
• |
the assumption and repayment of indebtedness by the BGC Group and the Newmark Group, as further described below; and |
|
|
• |
the pro rata distribution of the shares of Newmark Class A common stock and the shares of Newmark Class B common stock held by BGC, pursuant to which shares of Newmark Class A common stock held by BGC would be distributed to the holders of shares of Class A common stock of BGC and shares of Newmark Class B common stock held by BGC would be distributed to the holders of shares of Class B common stock of BGC (which are currently Cantor and another entity controlled by Howard W. Lutnick), which distribution is intended to qualify as generally tax-free for U.S. federal income tax purposes; provided that the determination of whether, when and how to proceed with the Distribution shall be entirely within the discretion of BGC. |
On December 15, 2017 Newmark announced the pricing of Newmark’s IPO of 20 million shares of Newmark’s Class A common stock at a price to the public of $14.00 per share, which was completed on December 19, 2017. Newmark’s Class A shares began trading on December 15, 2017 on the NASDAQ Global Select Market under the symbol “NMRK”. In addition, Newmark granted the underwriters a 30-day option to purchase up to an additional 3 million shares of Newmark’s Class A common stock at the IPO price, less underwriting discounts and commissions. On December 26, 2017 the underwriters of Newmark’s initial public offering exercised in full their overallotment option to purchase an additional 3 million shares of Newmark’s Class A common stock from Newmark at the initial public offering price, less underwriting discounts and commission (“the option”) . As a result, Newmark received aggregate net proceeds of approximately $295.4 million from the initial public offering, after deducting underwriting discounts and commissions and estimated offering expenses. Upon the closing of the option, Newmark’s public stockholders owned approximately 16.6% of the shares of Newmark’s Class A common stock. This is based on 138.6 million shares of Newmark’s Class A common stock outstanding following the closing of the option. Also upon the closing of the option, Newmark’s public stockholders owned approximately 9.8% of Newmark’s 234.2 million fully diluted shares outstanding. The amount owned by the Newmark public shareholders represents a noncontrolling interest and is recorded in “Noncontrolling interest in subsidiaries” on the Company’s consolidated statements of financial condition. In addition, the Newmark public shareholders receive allocations of net income (loss) in relation to their ownership in Newmark, which are reflected as a component of “Net income (loss) attributable to noncontrolling interest in subsidiaries” in the Company’s consolidated statements of operations.
As part of the Separation described above, BGC contributed its interests in both Berkeley Point and Real Estate LP to Newmark.
On June 26, 2012, BGC issued an aggregate of $112.5 million principal amount of its 8.125% Senior Notes due 2042 (the “8.125% BGC Senior Notes”). In connection with the issuance of the 8.125% BGC Senior Notes, BGC lent the proceeds of the 8.125% BGC Senior Notes to BGC U.S. OpCo, and BGC U.S. OpCo issued an amended and restated promissory note, effective as of June 26, 2012, with an aggregate principal amount of $112.5 million payable to BGC (the “2042 Promissory Note”). In connection with the Separation, on December 13, 2017, Newmark OpCo assumed all of BGC U.S. OpCo’s rights and obligations under the 2042 Promissory Note. The 2042 Promissory Note assumed by Newmark Opco payable to BGC represents an intercompany transaction, and is eliminated in the Company’s consolidated financial statements.
On December 9, 2014, BGC issued an aggregate of $300.0 million principal amount of its 5.375% Senior Notes due 2019 (the “5.375% BGC Senior Notes”). In connection with the issuance of the 5.375% BGC Senior Notes, BGC lent the proceeds of the 5.375% BGC Senior Notes to BGC U.S. OpCo, and BGC U.S. OpCo issued an amended and restated promissory note, effective as of December 9, 2014, with an aggregate principal amount of $300.0 million payable to BGC (the “2019 Promissory Note”). In connection with the Separation, on December 13, 2017, Newmark OpCo assumed all of BGC U.S. OpCo’s rights and obligations under the 2019 Promissory Note. The 2019 Promissory Note assumed by Newmark Opco payable to BGC represents an intercompany transaction, and is eliminated in the Company’s consolidated financial statements.
175
On November 22, 2017, BGC and Newmark entered into an amendment (the “Term Loan Amendment”) to the unsecured senior term loan credit agreement (the “Term Loan Credit Agreement”), dated as of September 8, 2017, with Bank of America, N.A., as administrative agent (the “Administrative Agent”), and a syndicate of lenders. The Term Loan Credit Agreement provides for a term loan of up to $575.0 million (the “Term Loan”), and as of the Separation this entire amount remained outstanding under the Term Loan Credit Agreement. Pursuant to the Term Loan Amendment and effective as of the Separation, Newmark assumed the obligations of BGC as borrower under the Term Loan. The net proceeds from the IPO have been used to partially repay $304.3 million of the Term Loan, which currently has $270.7 million outstanding.
On November 22, 2017, BGC and Newmark entered into an amendment (the “Revolver Amendment”) to the unsecured senior revolving credit agreement (the “Revolving Credit Agreement”), dated as of September 8, 2017, with the Administrative Agent and a syndicate of lenders. The Revolving Credit Agreement provides for revolving loans of up to $400.0 million (the “Revolving Credit Facility”). As of the date of the Revolver Amendment and as of the Separation, $400.0 million of borrowings were outstanding under the Revolving Credit Facility. Pursuant to the Revolver Amendment, the then-outstanding borrowings of BGC under the Revolving Credit Facility were converted into a term loan (the “Converted Term Loan”) and, effective upon the Separation, Newmark assumed the obligations of BGC as borrower under the Converted Term Loan. BGC remains a borrower under, and retains access to, the Revolving Credit Facility for any future draws, subject to availability which increases as Newmark repays the Converted Term Loan.
In connection with the Separation, on December 13, 2017, BGC entered into an unsecured senior revolving credit agreement (the “Intercompany Revolving Credit Agreement”) with Newmark. The Intercompany Revolving Credit Agreement provides for each party to issue revolving loans to the other party in the lender’s discretion. Any loans issued under this Intercompany Revolving Credit Agreement would represent intercompany transactions and would be eliminated in the Company’s consolidated financial statements.
BGC currently expects to pursue a distribution (or “spin-off”) to its common stockholders of all the Class A shares and Class B shares of Newmark common stock that it then owns in a manner intended to qualify as generally tax-free for U.S. federal income tax purposes. The Newmark common shares owned by BGC are subject to a 180-day “lock-up” restriction contained in the underwriting agreement for the Newmark IPO. The distribution is subject to a number of conditions, and BGC may determine not to proceed with the distribution if the BGC board of directors determines, in its sole discretion, that the distribution is not in the best interest of the Company and its stockholders. Accordingly, the distribution may not occur on the expected timeframe, or at all.
On February 26, 2015, the Company successfully completed a tender offer to acquire shares of common stock, par value $0.01 per share, of GFI Group Inc. (“GFI”) for $6.10 per share in cash and accepted for purchase 54.3 million shares (the “Tendered Shares”) tendered to the Company pursuant to its offer. The Tendered Shares, together with the 17.1 million shares already owned by the Company, represented approximately 56% of GFI’s outstanding shares. On April 28, 2015, a subsidiary of BGC purchased approximately 43.0 million newly issued shares of GFI’s common stock at the price of $5.81 per share for an aggregate purchase price of $250 million, which increased the Company’s ownership in GFI to approximately 67.0%. The purchase price was paid to GFI in the form of a note due on June 19, 2018 that bore an interest rate of LIBOR plus 200 basis points.
On January 12, 2016, the Company, Jersey Partners, Inc. (“JPI”), New JP Inc. (“New JPI”), Michael A. Gooch, Colin Heffron, and certain subsidiaries of JPI and the Company closed on a previously agreed upon merger. This merger provided for the acquisition of JPI by BGC (the “JPI Merger”) as provided for by a merger agreement dated December 22, 2015. Shortly following the completion of the JPI Merger, a subsidiary of the Company merged with and into GFI pursuant to a short-form merger under Delaware law, with GFI continuing as the surviving entity (the “GFI Merger” and, together with the JPI Merger, the “Back-End Mergers”). The Back-End Mergers allowed the Company to acquire the remaining approximately 33% of the outstanding shares of GFI common stock that it did not already own. Following the closing of the Back-End Mergers, the Company and its affiliates now own 100% of the outstanding shares of GFI’s common stock.
GFI is a leading intermediary and provider of trading technologies and support services to the global OTC and listed markets. GFI serves institutional clients in operating electronic and hybrid markets for cash and derivative products across multiple asset classes.
The Company’s customers include many of the world’s largest banks, broker-dealers, investment banks, trading firms, hedge funds, governments, corporations, property owners, real estate developers and investment firms. BGC Partners has more than 100 offices globally in major markets including New York and London, as well as in Atlanta, Beijing, Bogotá, Boston, Buenos Aires, Charlotte, Chicago, Copenhagen, Dallas, Denver, Dubai, Dublin, Geneva, Hong Kong, Houston, Istanbul, Johannesburg, Los Angeles, Madrid, Mexico City, Miami, Moscow, Nyon, Paris, Philadelphia, Rio de Janeiro, San Francisco, Santa Clara, Santiago, São Paulo, Seoul, Shanghai, Singapore, Sydney, Tel Aviv, Tokyo, Toronto, and Washington, D.C.
176
The Company’s consolidated financial statements have been prepared pursuant to the rules and regulations of the U.S. Securities and Exchange Commission (the “SEC”) and in conformity with accounting principles generally accepted in the U.S. (“U.S. GAAP”). The Company’s consolidated financial statements include the Company’s accounts and all subsidiaries in which the Company has a controlling interest. Intercompany balances and transactions have been eliminated in consolidation. Certain reclassifications have been made to previously reported amounts to conform to the current presentation.
During the year ended December 31, 2016, the Company changed the line item formerly known as “Market data and software solutions” to “Data, software and post-trade” in the Company’s consolidated statements of operations. In addition, as of December 31, 2016, the Company changed the line item formerly known as “Accrued commissions receivable, net” to “Accrued commissions and other receivables, net” in the Company’s consolidated statements of financial condition. Reclassifications have been made to previously reported amounts to conform to the current presentation.
The Berkeley Point Acquisition has been determined to be a combination of entities under common control that resulted in a change in the reporting entity. Accordingly, the financial results of the Company have been recast to include the financial results of Berkeley Point in the current and prior periods as if Berkeley Point had always been consolidated.
The following tables summarize the impact of the Berkeley Point Acquisition to the Company’s consolidated statement of financial condition as of December 31, 2016, and to the Company’s consolidated statements of operations for the years ended December 31, 2016 and 2015 (in thousands, except per share amounts):
|
|
|
December 31, 2016 |
|
|||||||||
|
|
|
As Previously Reported |
|
|
Retrospective Adjustments |
|
|
As Retrospectively Adjusted |
|
|||
|
Total assets |
|
$ |
3,508,400 |
|
|
$ |
1,539,186 |
|
|
$ |
5,047,586 |
|
|
Total liabilities |
|
|
2,302,085 |
|
|
|
1,059,384 |
|
|
|
3,361,469 |
|
|
Total equity |
|
|
1,153,738 |
|
|
|
479,802 |
|
|
|
1,633,540 |
|
|
Total liabilities, redeemable partnership interest, and equity |
|
|
3,508,400 |
|
|
|
1,539,186 |
|
|
|
5,047,586 |
|
|
|
|
Year Ended December 31, 2016 |
|
|
Year Ended December 31, 2015 |
|
||||||||||||||||||
|
|
|
As Previously Reported |
|
|
Retrospective Adjustments |
|
|
As Retrospectively Adjusted |
|
|
As Previously Reported |
|
|
Retrospective Adjustments |
|
|
As Retrospectively Adjusted |
|
||||||
|
Income (loss) from operations before income taxes |
|
$ |
188,260 |
|
|
$ |
125,910 |
|
|
$ |
314,170 |
|
|
$ |
380,611 |
|
|
$ |
58,165 |
|
|
$ |
438,776 |
|
|
Consolidated net income (loss) |
|
|
128,008 |
|
|
|
125,830 |
|
|
|
253,838 |
|
|
|
260,115 |
|
|
|
58,042 |
|
|
|
318,157 |
|
|
Net income (loss) attributable to noncontrolling interest in subsidiaries |
|
|
25,531 |
|
|
|
43,285 |
|
|
|
68,816 |
|
|
|
138,797 |
|
|
|
19,401 |
|
|
|
158,198 |
|
|
Net income (loss) available to common stockholders |
|
|
102,477 |
|
|
|
82,545 |
|
|
|
185,022 |
|
|
|
121,318 |
|
|
|
38,641 |
|
|
|
159,959 |
|
|
Basic earnings (loss) per share |
|
|
0.37 |
|
|
|
0.30 |
|
|
|
0.67 |
|
|
|
0.50 |
|
|
|
0.16 |
|
|
|
0.66 |
|
|
Diluted earnings (loss) per share |
|
|
0.36 |
|
|
|
0.29 |
|
|
|
0.65 |
|
|
|
0.48 |
|
|
|
0.14 |
|
|
|
0.62 |
|
Additionally, the consolidated statements of comprehensive income (loss), consolidated statements of cash flows and consolidated statements of changes in equity have been adjusted to reflect these retrospective adjustments.
On November 4, 2016, the Company acquired from Cantor the 80% of the Lucera business (also known as “LFI Holdings, LLC” or “LFI”) not already owned by the Company. Lucera is a technology infrastructure provider tailored to the financial sector headquartered in New York. This transaction has been determined to be a combination of entities under common control that resulted in a change in the reporting entity. Accordingly, the financial results of the Company have been recast to include the financial results of Lucera in the current and prior periods as if Lucera had always been consolidated.
The consolidated financial statements contain all normal and recurring adjustments that, in the opinion of management, are necessary for a fair presentation of the consolidated statements of financial condition, the consolidated statements of operations, the consolidated statements of comprehensive income (loss), the consolidated statements of cash flows and the consolidated statements of changes in equity of the Company for the periods presented.
177
Recently Adopted Accounting Pronouncements
In April 2014, the Financial Accounting Standards Board (“FASB”) issued Accounting Standards Update (“ASU”) No. 2014-08, Reporting Discontinued Operations and Disclosures of Disposals of Components of an Entity, which amends the requirements for reporting discontinued operations in ASC 205-20. The ASU includes changes in the criteria and required disclosures for disposals qualifying as discontinued operations, as well as additional required disclosures for disposals not considered discontinued operations. The amendments in this update were effective for the annual period beginning on January 1, 2015 for the Company. The adoption of this standard did not have a material impact on the Company’s consolidated financial statements.
In August 2014, the FASB issued ASU No. 2014-15, Presentation of Financial Statements—Going Concern (Subtopic 205-40): Disclosure of Uncertainties about an Entity’s Ability to Continue as a Going Concern. This ASU provides additional guidance on management’s responsibility to evaluate the condition of an entity and the required disclosures based on this assessment. This guidance was effective for the annual period ending after December 15, 2016. The adoption of this standard did not impact the Company’s consolidated financial statements.
In February 2015, the FASB issued ASU No. 2015-02, Consolidation (Topic 810): Amendments to the Consolidation Analysis. The amendment eliminates the deferral of certain consolidation standards for entities considered to be investment companies and modifies the consolidation analysis performed on certain types of legal entities. The guidance was effective beginning January 1, 2016. The adoption of this standard did not have a material impact on the Company’s consolidated financial statements.
In April 2015, the FASB issued ASU No. 2015-03, Interest—Imputation of Interest (Subtopic 835-30): Simplifying the Presentation of Debt Issuance Costs, which relates to simplifying the presentation of debt issuance costs. This ASU requires that debt issuance costs related to a recognized liability be presented in the balance sheet as a direct deduction from the carrying amount of that debt liability, consistent with debt discounts. The amendments in this update were effective for the annual period beginning January 1, 2016 for the Company. The adoption of this standard did not have a material impact on the Company’s consolidated financial statements.
In September 2015, the FASB issued ASU No. 2015-16, Business Combinations (Topic 805): Simplifying the Accounting for Measurement-Period Adjustments. This ASU requires adjustments to provisional amounts that are identified during the measurement period of a business combination to be recognized in the reporting period in which the adjustment amounts are determined. Acquirers are no longer required to revise comparative information for prior periods as if the accounting for the business combination had been completed as of the acquisition date. The guidance was effective beginning January 1, 2016. The adoption of this standard did not have a material impact on the Company’s consolidated financial statements.
In March 2016, the FASB issued ASU No. 2016-09, Compensation—Stock Compensation (Topic 718): Improvements to Employee Share-Based Payment Accounting, which simplifies several aspects of the accounting for employee share-based payment transactions, including the accounting for income taxes, forfeitures, and statutory tax withholding requirements, as well as classification of related amounts within the statement of cash flows. The new standard was effective for the Company beginning January 1, 2017, and early adoption was permitted. Under the guidance, previously unrecognized excess tax benefits should be recognized on a modified retrospective basis. As a result, the Company recorded a deferred tax asset for previously unrecognized tax benefits outstanding as of the beginning of the annual period of adoption, with an offsetting adjustment to retained deficit as of January 1, 2017. The adoption of this standard did not have a material impact on the Company’s consolidated financial statements.
New Accounting Pronouncements
In May 2014, the FASB issued ASU No. 2014-09, Revenue from Contracts with Customers (Topic 606), which relates to how an entity recognizes the revenue it expects to be entitled to for the transfer of promised goods and services to customers. The ASU will replace certain existing revenue recognition guidance. The guidance, as stated in ASU No. 2014-09, was initially effective beginning on January 1, 2017. In August 2015, the FASB issued ASU No. 2015-14, Revenue from Contracts with Customers (Topic 606): Deferral of Effective Date, which defers the effective date by one year, with early adoption permitted on the original effective date. The guidance in ASU 2014-09 permits the use of either the full retrospective or modified retrospective transition method. The FASB has subsequently issued several additional amendments to the standard, including ASU No. 2016-08, Revenue from Contracts with Customers (Topic 606): Principal versus Agent Considerations (Reporting Revenue Gross versus Net), which clarifies the guidance on principal versus agent analysis based on the notion of control and affects recognition of revenue on a gross or net basis. The amendment has the same effective date and transition requirements as the new standard. The Company plans to adopt the standard on its required effective date of January 1, 2018 using the modified retrospective transition method. The Company expects the most significant impact of this standard to be on its Real Estate Services segment, where revenue recognition is currently deferred when future contingencies exist. Based on the Company’s assessment, the adoption of the new revenue recognition guidance will result in an acceleration of certain Real Estate segment revenues that are based, in part, on future contingent events. For example, certain brokerage revenues from leasing commissions will be recognized earlier. Under current U.S. GAAP, a portion of these commissions is deferred until a future contingency is resolved (e.g., tenant move-in or payment of first month’s rent). Under the new revenue
178
recognition model, the Company’s performance obligation will be typically satisfied at lease signing and, therefore, the portion of the commission that is contingent on a future event will likely be recognized earlier, if deemed not subject to significant reversal. As a result, the Company expects the adoption of the standard will increase assets, liabilities, and noncontrolling interest in subsidiaries, and decrease retained deficit by approximately $64.4 million, $40.3 million, $2.5 million, and $21.6 million, respectively, as of January 1, 2018. These amounts are presented net of costs associated with obtaining and fulfilling contracts with customers. The tax effect of the impact of the adoption of the standard is estimated to be an increase to retained deficit of approximately $4.8 million. Further, the Company anticipates the adoption of the new guidance on principal versus agent considerations will impact its presentation of revenues versus expenses incurred on behalf of customers for certain management services within its Real Estate segment. The Company concluded that it controls the services provided by a third party on behalf of the customers and, therefore, acts as a principal under those contracts. As the result, upon adoption of the new revenue standard, for these service contracts the Company will present expenses incurred on behalf of customers along with a corresponding reimbursement revenue on a gross basis in the Company’s consolidated statements of operations, with no impact on net income (loss) available to common stockholders.
In January 2016, the FASB issued ASU No. 2016-01, Financial Instruments—Overall (Subtopic 825-10): Recognition and Measurement of Financial Assets and Financial Liabilities. This ASU requires entities to measure equity investments that do not result in consolidation and are not accounted for under the equity method at fair value and recognize any changes in fair value in net income (loss) unless the investments qualify for the new measurement alternative. Entities will also have to record changes in instrument-specific credit risk for financial liabilities measured under the fair value option in other comprehensive income (loss). In addition, entities will be required to present enhanced disclosures of financial assets and financial liabilities. The guidance is effective beginning January 1, 2018, with early adoption of certain provisions of the ASU permitted. In September 2017, the FASB issued a Proposed ASU, Technical Corrections and Improvements to Recently Issued Standards: Accounting Standards Update No. 2016-01, Financial Instruments—Overall (Subtopic 825-10): Recognition and Measurement of Financial Assets and Financial Liabilities, that clarified certain aspects of the guidance. Pending issuance of the amended final standard by the FASB, management is currently evaluating the impact of the new guidance on the Company’s consolidated financial statements.
In February 2016, the FASB issued ASU No. 2016-02, Leases (Topic 842). This standard requires lessees to recognize a right-of-use asset and lease liability for all leases with terms of more than 12 months. Recognition, measurement and presentation of expenses will depend on classification as a finance or operating lease. The amendments also require certain quantitative and qualitative disclosures. Accounting guidance for lessors is largely unchanged. The guidance is effective beginning January 1, 2019, with early adoption permitted. Management is currently evaluating the impact of the new guidance on the Company’s consolidated financial statements.
In June 2016, the FASB issued ASU No. 2016-13, Financial Instruments—Credit Losses (Topic 326): Measurement of Credit Losses on Financial Instruments, which requires financial assets that are measured at amortized cost to be presented, net of an allowance for credit losses, at the amount expected to be collected over their estimated life. Expected credit losses for newly recognized financial assets, as well as changes to credit losses during the period, are recognized in earnings. For certain purchased financial assets with deterioration in credit quality since origination, the initial allowance for expected credit losses will be recorded as an increase to the purchase price. Expected credit losses, including losses on off-balance-sheet exposures such as lending commitments, will be measured based on historical experience, current conditions, and reasonable and supportable forecasts that affect the collectability of the reported amount. The new standard will become effective for the Company beginning January 1, 2020, under a modified retrospective approach, and early adoption is permitted. Management is currently evaluating the impact of the new guidance on the Company’s consolidated financial statements.
In August 2016, the FASB issued ASU No. 2016-15, Statement of Cash Flows (Topic 230): Classification of Certain Cash Receipts and Cash Payments, which makes changes to how cash receipts and cash payments are presented and classified in the statement of cash flows. The new standard will become effective for the Company beginning January 1, 2018 and will require adoption on a retrospective basis. The adoption of this guidance will not have a material impact on the Company’s consolidated statements of cash flows.
In November 2016, the FASB issued ASU No. 2016-18, Statement of Cash Flows (Topic 230): Restricted Cash, which requires that the statement of cash flows present the change during the period in the total of cash, cash equivalents and amounts generally described as restricted cash or restricted cash equivalents. The new standard will become effective for the Company beginning January 1, 2018 and will require adoption on a retrospective basis. The adoption of this guidance will not have a material impact on the Company’s consolidated statements of cash flows.
179
In January 2017, the FASB issued ASU No. 2017-01, Business Combinations (Topic 805): Clarifying the Definition of a Business, which clarifies the definition of a business with the objective of providing additional guidance to assist entities with evaluating whether transactions should be accounted for as acquisitions (or disposals) of assets or businesses. The new standard will become effective for the Company beginning January 1, 2018 and will be applied on a prospective basis. The adoption of this guidance is not expected to have a material impact on the Company’s consolidated financial statements.
In January 2017, the FASB issued ASU No. 2017-04, Intangibles—Goodwill and Other (Topic 350): Simplifying the Test for Goodwill Impairment, which eliminates the requirement to determine the fair value of individual assets and liabilities of a reporting unit to measure goodwill impairment. Under the amendments in the new ASU, goodwill impairment testing will be performed by comparing the fair value of the reporting unit with its carrying amount and recognizing an impairment charge for the amount by which the carrying amount exceeds the reporting unit’s fair value. The new standard will become effective for the Company beginning January 1, 2020 and will be applied on a prospective basis, and early adoption is permitted. The adoption of this guidance is not expected to have a material impact on the Company’s consolidated financial statements.
In February 2017, the FASB issued ASU No. 2017-05, Other Income—Gains and Losses from the Derecognition of Nonfinancial Assets (Subtopic 610-20): Clarifying the Scope of Asset Derecognition Guidance and Accounting for Partial Sales of Nonfinancial Assets, which clarifies the scope and application of Accounting Standards Codification 610-20, Other Income—Gains and Losses from Derecognition of Nonfinancial Assets and defines in substance nonfinancial assets. The ASU will also impact the accounting for partial sales of nonfinancial assets (including in substance real estate). Under this guidance, when an entity transfers its controlling interest in a nonfinancial asset but retains a noncontrolling ownership interest, the entity will measure the retained interest at fair value, which will result in a full gain or loss recognition upon the sale of a controlling interest in a nonfinancial asset. The standard has the same effective date as the new revenue guidance, which is January 1, 2018, with early adoption permitted. The Company plans to adopt the standard on its required effective date of January 1, 2018. The adoption of this guidance is not expected to have a material effect on the Company’s consolidated financial statements.
In May 2017, the FASB issued ASU No. 2017-09, Compensation—Stock Compensation (Topic 718): Scope of Modification Accounting, which amends the scope of modification accounting for share-based payment arrangements and provides guidance on the types of changes to the terms or conditions of share-based payment awards to which an entity would be required to apply modification accounting. Under this guidance, an entity would not apply modification accounting if the fair value, the vesting conditions, and the classification of the awards (as equity or liability) are the same immediately before and after the modification. The new standard will become effective for the Company beginning January 1, 2018, with early adoption permitted, and will be applied on a prospective basis for awards modified on or after the adoption date. The Company plans to adopt the standard on its required effective date of January 1, 2018. The adoption of this guidance is not expected to have a material impact on the Company’s consolidated financial statements.
In August 2017, the FASB issued ASU No. 2017-12, Derivatives and Hedging (Topic 815): Targeted Improvements to Accounting for Hedging Activities. The guidance intends to better align an entity’s risk management activities and financial reporting for hedging relationships through changes to both the designation and measurement guidance for qualifying hedging relationships and the presentation of hedge results. To meet that objective, the amendments expand and refine hedge accounting for both nonfinancial and financial risk components and align the recognition and presentation of the effects of the hedging instrument and the hedged item in the financial statements. The new standard will become effective for the Company beginning January 1, 2019, with early adoption permitted, and will be applied on a prospective basis and modified retrospective basis. Management is currently evaluating the impact of the new guidance on the Company’s consolidated financial statements.
In February 2018, the FASB issued ASU No. 2018-02, Income Statement—Reporting Comprehensive Income (Topic 220): Reclassification of Certain Tax Effects from Accumulated Other Comprehensive Income. The guidance helps organizations address certain stranded income tax effects in accumulated other comprehensive income resulting from the Tax Cuts and Jobs Act by providing an option to reclassify these stranded tax effects to retained earnings in each period in which the effect of the change in the U.S. federal corporate income tax rate in the Tax Cuts and Jobs Act (or portion thereof) is recorded. The new standard will become effective for the Company beginning January 1, 2019, with early adoption permitted. The guidance should be applied either in the period of adoption or retrospectively to each period (or periods) in which the effect of the change in the U.S. federal corporate income tax rate in the Tax Cuts and Jobs Act is recognized. Management is currently evaluating the transition method and the adoption period of the ASU; however, the adoption of the new guidance is not expected to have a material effect on the Company’s consolidated financial statements.
180
The Company and Newmark are holding companies with no direct operations and conduct substantially all of their operations through their operating subsidiaries. Virtually all of the Company’s and Newmark’s consolidated net assets and net income are those of consolidated variable interest entities. BGC Holdings is a consolidated subsidiary of the Company for which the Company is the general partner. The Company and BGC Holdings jointly own BGC Partners, L.P. (“BGC U.S. OpCo”) and BGC Global Holdings L.P. (“BGC Global OpCo”), the two operating partnerships. In addition, Newmark Holdings, L.P. (“Newmark Holdings”) is a consolidated subsidiary of Newmark for which Newmark is the general partner. Newmark and Newmark Holdings jointly own Newmark Partners, L.P. (“Newmark OpCo”), the operating partnership. Listed below are the limited partnership interests in BGC Holdings and Newmark Holdings. The founding/working partner units, limited partnership units and limited partnership interests held by Cantor (“Cantor units”), each as described below, collectively represent all of the “limited partnership interests” in BGC Holdings and Newmark Holdings.
Immediately prior to the completion of the Newmark IPO, the Company entered into the Separation and Distribution Agreement with Cantor, Newmark, Newmark Holdings, Newmark OpCo, BGC Holdings, BGC U.S. OpCo, and BGC Global OpCo. As a result of the Separation and Distribution Agreement, the limited partnership interests in Newmark Holdings were distributed to the holders of limited partnership interests in BGC Holdings, whereby each holder of BGC Holdings limited partnership interests at that time will hold a BGC Holdings limited partnership interest and a corresponding Newmark Holdings limited partnership interest, which is equal to a BGC Holdings limited partnership interest multiplied by one divided by 2.2 (the “contribution ratio”), divided by the exchange ratio (which is the ratio by which a Newmark Holdings limited partnership interest can be exchanged for a number of Newmark Class A common stock). Initially, the exchange ratio will equal one, so that each Newmark Holdings limited partnership interest is exchangeable for one Newmark Class A common stock. For reinvestment, acquisition or other purposes, Newmark may determine on a quarterly basis to distribute to its stockholders a smaller percentage than Newmark Holdings distributes to its equity holders (excluding tax distributions from Newmark Holdings) of cash that it received from Newmark OpCo. In such circumstances, the Separation and Distribution Agreement provides that the exchange ratio will be reduced to reflect the amount of additional cash retained by Newmark as a result of the distribution of such smaller percentage, after the payment of taxes.
Founding/Working Partner Units
Founding/working partners have a limited partnership interest in BGC Holdings and Newmark Holdings. The Company accounts for founding/working partner units (“FPUs”) outside of permanent capital, as “Redeemable partnership interest,” in the Company’s consolidated statements of financial condition. This classification is applicable to founding/working partner units because these units are redeemable upon termination of a partner, including a termination of employment, which can be at the option of the partner and not within the control of the issuer.
Founding/working partner units are held by limited partners who are employees and generally receive quarterly allocations of net income. Upon termination of employment or otherwise ceasing to provide substantive services, the founding/working partner units are generally redeemed, and the unit holders are no longer entitled to participate in the quarterly allocations of net income. Since these allocations of net income are cash distributed on a quarterly basis and are contingent upon services being provided by the unit holder, they are reflected as a component of compensation expense under “Allocations of net income and grant of exchangeability to limited partnership units and FPUs” in the Company’s consolidated statements of operations.
Limited Partnership Units
Certain employees hold limited partnership interests in BGC Holdings and Newmark Holdings (e.g., REUs, RPUs, PSUs, PSIs and LPUs, collectively the “limited partnership units”). Generally, such units receive quarterly allocations of net income, which are cash distributed and generally are contingent upon services being provided by the unit holders. As prescribed in U.S. GAAP guidance, the quarterly allocations of net income on such limited partnership units are reflected as a component of compensation expense under “Allocations of net income and grant of exchangeability to limited partnership units and FPUs” in the Company’s consolidated statements of operations. From time to time, the Company issues limited partnership units as part of the consideration for acquisitions.
Certain of these limited partnership units entitle the holders to receive post-termination payments equal to the notional amount of the units in four equal yearly installments after the holder’s termination. These limited partnership units are accounted for as post-termination liability awards, and in accordance with U.S. GAAP guidance, the Company records compensation expense for the awards based on the change in value at each reporting date in the Company’s consolidated statements of operations as part of “Compensation and employee benefits.”
The Company has also awarded certain preferred partnership units (“Preferred Units”). Each quarter, the net profits of BGC Holdings and Newmark Holdings are allocated to such units at a rate of either 0.6875% (which is 2.75% per calendar year) or such other amount as set forth in the award documentation (the “Preferred Distribution”). These allocations are deducted before the calculation and distribution of the quarterly partnership distribution for the remaining partnership units and are generally contingent
181
upon services being provided by the unit holder. The Preferred Units are not entitled to participate in partnership distributions other than with respect to the Preferred Distribution. Preferred Units may not be made exchangeable into the Company’s Class A common stock and are only entitled to the Preferred Distribution, and accordingly they are not included in the Company’s fully diluted share count. The quarterly allocations of net income on Preferred Units are reflected in compensation expense under “Allocations of net income and grant of exchangeability to limited partnership units and FPUs” in the Company’s consolidated statements of operations. After deduction of the Preferred Distribution, the remaining partnership units generally receive quarterly allocations of net income based on their weighted-average pro rata share of economic ownership of the operating subsidiaries.
Cantor Units
Cantor holds limited partnership interests in BGC Holdings and Newmark Holdings. Cantor units are reflected as a component of “Noncontrolling interest in subsidiaries” in the Company’s consolidated statements of financial condition. Cantor receives allocations of net income (loss), which are cash distributed on a quarterly basis and are reflected as a component of “Net income (loss) attributable to noncontrolling interest in subsidiaries” in the Company’s consolidated statements of operations.
General
Certain of the limited partnership interests, described above, have been granted exchangeability into BGC Class A common stock, and additional limited partnership interests may become exchangeable for BGC and/or Newmark Class A common stock. In addition, limited partnership interests held by Cantor in BGC Holdings and Newamrk Holdings are generally exchangeable for up to 34.6 million shares of BGC Class B common stock and/or up to the authorized amount of Newmark Class B common stock. In order for a partner or Cantor to exchange a limited partnership interest in BGC Holdings or Newmark Holdings into a Class A or Class B common stock of BGC, such partner or Cantor must exchange both one BGC Holdings limited partnership interest and a number of Newmark Holdings limited partnership interest equal to a BGC Holdings limited partnership interest multiplied by the contribution ratio (which is one divided by 2.2), divided by the exchange ratio (which is the ratio by which a Newmark Holdings limited partnership interest can be exchanged for a number of Newmark Class A or Class B common stock). Because they are included in the Company’s fully diluted share count, if dilutive, any exchange of limited partnership interests into Class A or Class B common shares would not impact the fully diluted number of shares and units outstanding. Because these limited partnership interests generally receive quarterly allocations of net income, such exchange would have no significant impact on the cash flows or equity of the Company. Each quarter, net income (loss) is allocated between the limited partnership interests and the common stockholders. In quarterly periods in which the Company has a net loss, the loss allocation for FPUs, limited partnership units and Cantor units is allocated to Cantor and reflected as a component of “Net income (loss) attributable to noncontrolling interest in subsidiaries” in the Company’s consolidated statements of operations. In subsequent quarters in which the Company has net income, the initial allocation of income to the limited partnership interests is to “Net income (loss) attributable to noncontrolling interests in subsidiaries,” to recover any losses taken in earlier quarters, with the remaining income allocated to the limited partnership interests. This income (loss) allocation process has no impact on the net income (loss) allocated to common stockholders.
|
3. |
Summary of Significant Accounting Policies |
Use of Estimates:
The preparation of the Company’s consolidated financial statements in conformity with U.S. GAAP requires management to make estimates and assumptions that affect the reported amounts of the assets and liabilities, revenues and expenses, and the disclosure of contingent assets and liabilities in these consolidated financial statements. Management believes that the estimates utilized in preparing these consolidated financial statements are reasonable. Estimates, by their nature, are based on judgment and available information. Actual results could differ materially from the estimates included in the Company’s consolidated financial statements. Certain reclassifications have been made to previously reported amounts to conform to the current period presentation.
Revenue Recognition:
BGC Partners derives its revenues primarily through commissions from brokerage services, the spread between the buy and sell prices on matched principal transactions, gains from mortgage banking activities, revenues from real estate management and other services, servicing fees, fees from related parties, data, software and post-trade services, and other revenues.
Commissions:
BGC Partners derives its commission revenues from securities, commodities and real estate brokerage transactions. Commission revenues from securities and commodities agency brokerage transactions, whereby the Company connects buyers and sellers in the OTC and exchange markets and assists in the negotiation of the price and other material terms of transactions, are recognized on a trade-date basis along with related expenses. Commissions are recognized when earned. With respect to real estate
182
commissions, the existence of future contingencies, if any, results in the postponement of revenue recognition until the contingencies are satisfied.
Principal Transactions:
Principal transaction revenues are primarily derived from matched principal transactions, whereby the Company simultaneously agrees to buy securities from one customer and sell them to another customer. A very limited number of trading businesses are allowed to enter into unmatched principal transactions to facilitate a customer’s execution needs for transactions initiated by such customers. Revenues earned from principal transactions represent the spread between the buy and sell price of the brokered security, commodity or derivative. Principal transaction revenues and related expenses are recognized on a trade-date basis. Positions held as part of a principal transaction are marked-to-market on a daily basis.
Gains from Mortgage Banking Activities, Net:
Gains from mortgage banking activities, net, are recognized when a derivative asset or liability is recorded upon the commitment to originate a loan with a borrower and sell the loan to an investor. The derivative is recorded at fair value and includes loan origination fees, sales premiums and the estimated fair value of the expected net servicing cash flows. Gains from mortgage banking activities, net, are recognized net of related fees and commissions to affiliates or third party brokers. For loans the Company brokers, gains from mortgage banking activities are recognized when the loan is closed.
Real Estate Management and Other Services:
Real estate management and other services revenues include property management, facilities management and project management. Management fees are recognized at the time the related services have been performed, unless future contingencies exist. In addition, with regard to management and facility service contracts, the owner of the property will typically reimburse the Company for certain expenses that are incurred on behalf of the owner, which are comprised primarily of on-site employee salaries and related benefit costs. The amounts that are to be reimbursed per the terms of the services contract are recognized as revenue in the same period as the related expenses are incurred. In certain instances, the Company subcontracts property management services to independent property managers, in which case the Company passes a portion of their property management fee on to the subcontractor, and the Company retains the balance. Accordingly, the Company records these fees net of the amounts paid to subcontractors.
Servicing Fees:
Servicing fees are earned for servicing mortgage loans and are recognized on an accrual basis over the lives of the related mortgage loans. Also included in servicing fees are the fees earned on borrower prepayments, interest and placement fees on borrowers’ escrow accounts and other ancillary fees.
Fees from Related Parties:
Fees from related parties consist of charges for back-office services provided to Cantor and its affiliates, including occupancy of office space, utilization of fixed assets, accounting, operations, human resources and legal services and information technology. Revenues are recognized as earned on an accrual basis.
Data, Software and Post-trade:
Data revenues primarily consist of subscription fees and fees from customized one-time sales provided to customers either directly or through third-party vendors. Data revenues are recognized ratably over the contract term, except for revenues derived from customized one-time sales, which are recognized as services are rendered.
Through the Company’s software solutions business, the Company receives fees for providing customized software to broaden distribution capabilities and provide electronic solutions to financial market participants. Such fees are recognized as income ratably over the license period.
Other Revenues:
Other revenues are earned from various sources including litigation settlements and insurance recoveries.
183
Gain (Loss) on Divestiture and Sale of Investments:
Gain (loss) on divestiture and sale of investments is comprised of gains or losses recorded in connection with the divestiture of certain businesses or sale of investments (see Note 5—“Divestitures”).
Gains (Losses) on Equity Method Investments:
Gains (losses) on equity method investments represent the Company’s pro rata share of the net gains or losses on investments over which the Company has significant influence but which it does not control.
Other Income (Loss):
Other income (loss) is comprised of gains or losses associated with the earn-out shares related to the Nasdaq transaction and the movements related to the mark-to-market and/or hedges on marketable securities that are classified as trading securities (see Note 5—“Divestitures”).
Segments:
The Company divides its business into segments in accordance with the accounting guidance for segment reporting. The Company’s operations consist of two reportable segments, Financial Services and Real Estate Services. During the third quarter of 2017, the Company transferred the right to receive earn-out payments from Nasdaq from the Financial Services segment to the Real Estate Services segment. As a result, the Nasdaq payment for the third quarter of 2017 was recorded as “Other income (loss)” in the Real Estate Services segment.
Cash and Cash Equivalents:
The Company considers all highly liquid investments with maturities of 90 days or less at the date of acquisition that are not segregated under regulatory requirements, other than those used for trading purposes, to be cash equivalents. Cash and cash equivalents include money market funds, deposits with banks, certificates of deposit, commercial paper, and treasury securities.
Cash Segregated Under Regulatory Requirements:
Cash segregated under regulatory requirements represents funds received in connection with customer activities that the Company is obligated to segregate or set aside to comply with regulations mandated by authorities such as the SEC and the Financial Industry Regulatory Authority in the U.S. (“FINRA”) and the Financial Conduct Authority (“FCA”) in the United Kingdom (“U.K.”) that have been promulgated to protect customer assets. In addition, this item includes cash set aside for amounts pledged for the benefit of Fannie Mae and Freddie Mac to secure the Company’s financial guarantee liability.
Reverse Repurchase Agreements:
Securities purchased under agreements to resell (“reverse repurchase agreements”) are accounted for as collateralized financing transactions and are recorded at the contractual amount for which the securities will be resold, including accrued interest. It is the policy of the Company to obtain possession of collateral with a fair value equal to or in excess of the principal amount loaned under reverse repurchase agreements. Collateral is valued daily and the Company may require counterparties to deposit additional collateral or return collateral pledged, when appropriate.
Securities Owned:
Securities owned primarily consist of unencumbered U.S. Treasury bills held for liquidity purposes. Securities owned are classified as trading and marked-to-market daily based on current listed market prices (or, when applicable, broker quotes), with the resulting gains and losses included in operating income in the current period. Unrealized and realized gains and losses from securities owned are included as part of “Principal transactions” in the Company’s consolidated statements of operations.
184
U.S. GAAP defines fair value as the price received to sell an asset or paid to transfer a liability in an orderly transaction between market participants at the measurement date and further expands disclosures about such fair value measurements.
The guidance establishes a fair value hierarchy that prioritizes the inputs to valuation techniques used to measure fair value. The hierarchy gives the highest priority to unadjusted quoted prices in active markets for identical assets or liabilities (Level 1 measurements) and the lowest priority to unobservable inputs (Level 3 measurements). The three levels of the fair value hierarchy are as follows:
Level 1 measurements – Unadjusted quoted prices in active markets that are accessible at the measurement date for identical, unrestricted assets or liabilities.
Level 2 measurements – Quoted prices in markets that are not active or financial instruments for which all significant inputs are observable, either directly or indirectly.
Level 3 measurements – Prices or valuations that require inputs that are both significant to the fair value measurement and unobservable.
A financial instrument’s level within the fair value hierarchy is based on the lowest level of any input that is significant to the fair value measurement.
In determining fair value, the Company separates financial instruments owned and financial instruments sold, but not yet purchased into two categories: cash instruments and derivative contracts.
Cash Instruments – Cash instruments are generally classified within Level 1 or Level 2. The types of instruments generally classified within Level 1 include most U.S. government securities, certain sovereign government obligations, and actively traded listed equities. The Company does not adjust the quoted price for such instruments. The types of instruments generally classified within Level 2 include agency securities, most investment-grade and high-yield corporate bonds, certain sovereign government obligations, money market securities, and less liquid listed equities, state, municipal and provincial obligations.
Derivative Contracts – Derivative contracts can be exchange-traded or OTC. Exchange-traded derivatives typically fall within Level 1 or Level 2 of the fair value hierarchy depending on whether they are deemed to be actively traded or not. The Company generally values exchange-traded derivatives using the closing price of the exchange-traded derivatives. OTC derivatives are valued using market transactions and other market evidence whenever possible, including market-based inputs to models, broker or dealer quotations or alternative pricing sources with reasonable levels of price transparency. For OTC derivatives that trade in liquid markets, such as generic forwards, swaps and options, model inputs can generally be verified and model selection does not involve significant management judgment. Such instruments are typically classified within Level 2 of the fair value hierarchy.
In the normal course of business, the Company enters into contractual commitments to originate and sell loans at fixed prices with fixed expiration dates. The commitments become effective when the borrowers lock their interest rate within frames established by the Company (rate lock commitments). Borrowers are evaluated for creditworthiness prior to this commitment. Market risk arises if interest rates move adversely between the time of the rate lock by the borrower and the date the loan is sold to an investor.
To mitigate the effect of the interest rate risk inherent in providing rate lock commitments to borrowers, the Company enters into a sale commitment with an investor simultaneously with the rate lock commitment entered into with the borrower (forward sale contracts). The sale contract with the investor locks in an interest rate and price for the sale of the loan. The terms of the contract with the investor and the rate lock with the borrower are matched in substantially all respects, with the objective of eliminating interest rate risk to the extent practical. Sale commitments with the investors have an expiration date that is longer than our related commitments to the borrower to allow, among other things, for the closing of the loan and processing of paperwork to deliver the loan into the sale commitment.
Both the rate lock commitments to borrowers and the forward sale contracts to investors are derivatives and, accordingly, are marked to fair value through our consolidated statements of operations. These derivative contracts are valued by the Company using pricing models which utilize unobservable inputs, which are significant to the fair value measurement of the derivative contracts. Accordingly, the rate lock commitments and forward sale contracts are generally classified within Level 3 of the fair value hierarchy. The fair value of these derivative contracts and the related inputs include:
|
|
• |
The assumed gain/loss of the expected loan sale to the investor; |
185
|
|
• |
The effects of interest rate movements between the date of the rate lock and the balance sheet date; and |
|
|
• |
The nonperformance risk of both the counterparty and the Company. |
The fair value of the Company’s forward sale contracts to investors considers the effects of interest rate movements and the market price movement of the same type of security, between the trade date and the balance sheet date. The market price changes are multiplied by the notional amount of the forward sales contracts to measure the fair value.
The gain/loss of the expected loan sale to the investor, considers the amount that the Company has discounted the price to the borrower from par for competitive reasons, if at all, and the expected net cash flows from servicing to be received upon sale of the loan. The fair value of the expected net future cash flows associated with servicing the loan is calculated pursuant to the valuation techniques described in Note 17— “Mortgage servicing rights, net.”
To calculate the effects of interest rate movements, the Company uses applicable U.S. Treasury prices, and multiplies the price movement between the rate lock date and the balance sheet date by the notional loan commitment amount.
The fair value of the Company’s rate lock commitments and forward sale contracts is adjusted to reflect the risk that the agreement will not be fulfilled. The Company’s exposure to nonperformance in rate lock and forward sale contracts is represented by the contractual amount of those instruments. Given the credit quality of our counterparties, the short duration of rate lock commitments and forward sale contracts, and the Company’s historical experience with the agreements, management does not believe the risk of nonperformance by the Company’s counterparties to be significant.
Loans held for sale, at fair value – Loans held for sale are included in Level 2 of the fair value hierarchy. Loans are classified as Level 2 when the Company enters into an agreement to sell funded loans to third party investors at an observable price. The loans are collateralized by a single commercial real estate property or a portfolio of properties. The fair value of the Company’s Loans held for sale include the gain/loss for pricing discounts, the expected net future cash flows, and the effect of interest rate movements, as described above under Derivative contracts for rate lock commitments and forward sale contracts.
See Note 14— “Fair Value of Financial Assets and Liabilities,” for more information on the fair value of financial assets and liabilities.
Transfer of Financial Assets:
The Company distributes its commercial mortgage loans primarily through the government sponsored enterprises’ (“GSEs”) distribution channel which generally involves (a) Freddie Mac purchasing the Company’s loan for cash, (b) Fannie Mae securitizing the Company’s loan into a mortgage-backed security (“MBS”) guaranteed by Fannie Mae and the Company selling the MBS to a third party for cash, or (c) Federal Housing Authority (“FHA”) guaranteeing the credit risk of the Company’s loan, the Company issuing a Ginnie Mae MBS collateralized by the loan, and the Company selling the MBS for cash.
As part of its distribution activities, the Company accounts for the transfer of financial assets in accordance with the U.S. GAAP guidance for Transfers and Servicing. In accordance with this guidance, the transfer of financial assets between two entities must meet the following criteria for derecognition and sale accounting:
|
|
• |
The transfer must involve a financial asset, group of financial assets or a participating interest; |
|
|
• |
The financial assets must be isolated from the transferor and its consolidated affiliates as well as its creditors; |
|
|
• |
The transferee or beneficial interest holders must have the right to pledge or exchange the transferred financial assets; and |
|
|
• |
The transferor may not maintain effective control of the transferred assets. |
The Company determined that all loans sold during the periods presented met these specific conditions and accounted for all transfers of loans held for sale as completed sales.
Marketable Securities:
Marketable securities are comprised of securities held for investment purposes and are accounted for in accordance with the U.S. GAAP guidance, Investments—Debt and Equity Securities. Certain of the Company’s investment securities are classified as available-for-sale and accordingly reported at fair value. Unrealized gains and losses on marketable securities classified as available-for-sale are included as part of “Accumulated other comprehensive income (loss)” in the Company’s consolidated statements of
186
financial condition. When the fair value of an available-for-sale security is lower than its cost, the Company evaluates the security to determine whether the impairment is considered other-than-temporary. If the impairment is considered other-than-temporary, the Company records an impairment charge in the Company’s consolidated statements of operations. Certain Marketable securities are classified as trading securities and accordingly are measured at fair value with any changes in fair value recognized currently in earnings and included in “Other income (loss)” in the Company’s consolidated statements of operations.
Loans Held for Sale, at Fair Value (“LHFS”):
The Company maintains commercial mortgage loans for the purpose of sale to GSEs. Prior to funding, the Company enters into an agreement to sell the loans to third party investors at a fixed price. During the period prior to sale, interest income is calculated and recognized in accordance with the terms of the individual loan. LHFS are recorded at fair value, as the Company has elected the fair value option. The primary reason the Company has elected to account for loans backed by commercial real estate under the fair value option is to better offset the change in fair value of the loan and the change in fair value of the derivative instruments used as economic hedges.
Receivables from and Payables to Broker-Dealers, Clearing Organizations, Customers and Related Broker-Dealers:
Receivables from and payables to broker-dealers, clearing organizations, customers and related broker-dealers primarily represent principal transactions for which the stated settlement dates have not yet been reached and principal transactions which have not settled as of their stated settlement dates, cash held at clearing organizations and exchanges to facilitate settlement and clearance of matched principal transactions, and spreads on matched principal transactions that have not yet been remitted from/to clearing organizations and exchanges. Also included are amounts related to open derivative contracts, which are generally executed on behalf of the Company’s customers. A portion of the unsettled principal transactions and open derivative contracts that constitute receivables from and payables to broker-dealers, clearing organizations, customers and related broker-dealers are with related parties (see Note 18— “Related Party Transactions,” for more information regarding these receivables and payables).
Mortgage Servicing Rights, Net (“MSRs”):
The Company initially recognizes and measures the rights to service mortgage loans at fair value and subsequently measures them using the amortization method. The Company recognizes rights to service mortgage loans as separate assets at the time the underlying originated mortgage loan is sold and the value of those rights is included in the determination of the gain on loans held for sale.
Purchased MSRs, including MSRs purchased from CCRE, are initially recorded at fair value and subsequently measured using the amortization method.
The Company receives up to a 3 basis point servicing fee and/or up to a 1 basis point surveillance fee on certain Freddie Mac loans after the loan is securitized in a Freddie Mac pool (the “Freddie Mac Strip”). The Freddie Mac Strip is also recognized at fair value and subsequently measured using the amortization method, but is recognized as an MSR at the securitization date.
MSRs are assessed for impairment, at least on an annual basis, based upon the fair value of those rights as compared to the amortized cost. Fair values are estimated using a valuation model that calculates the present value of the future net servicing cash flows. In using this valuation method, the Company incorporates assumptions that management believes market participants would use in estimating future net servicing income. It is reasonably possible such estimates may change. The Company amortizes the MSRs in proportion to, and over the period of, the estimated net servicing income. For purposes of impairment evaluation and measurement, the Company stratifies MSRs based on predominant risk characteristics of the underlying loans, primarily by investor type (Fannie Mae/Freddie Mac, FHA/GNMA, CMBS, and other). To the extent that the carrying value exceeds fair value of a specific MSR strata, a valuation allowance is established, which is adjusted in the future as the fair value of MSRs increases or decreases. Reversals of valuation allowances cannot exceed the MSRs amortized cost.
Accrued Commissions and Other Receivables, Net:
The Company has accrued commissions receivable from securities, commodities and real estate brokerage transactions. Accrued commissions receivable are presented net of allowance for doubtful accounts of approximately $24.0 million and $16.3 million as of December 31, 2017 and 2016, respectively. The allowance is based on management’s estimate and is reviewed periodically based on the facts and circumstances of each outstanding receivable.
187
Loans, Forgivable Loans, and Other Receivables from Employees and Partners, Net:
The Company has entered into various agreements with certain of its employees and partners whereby these individuals receive loans which may be either wholly or in part repaid from the distribution earnings that the individual receives on some or all of their limited partnership interests or may be forgiven over a period of time. The forgivable portion of these loans is recognized as compensation expense over the life of the loan. From time to time, the Company may also enter into agreements with employees and partners to grant bonus and salary advances or other types of loans. These advances and loans are repayable in the timeframes outlined in the underlying agreements. The Company reviews the loan balances each reporting period for collectability. If the Company determines that the collectability of a portion of the loan balances is not expected, the Company recognizes a reserve against the loan balances.
Fixed Assets, Net:
Fixed assets are carried at cost net of accumulated depreciation and amortization. Depreciation is calculated on a straight-line basis over the estimated useful lives of the assets. Internal and external direct costs of developing applications and obtaining software for internal use are capitalized and amortized over three years on a straight-line basis. Computer equipment is depreciated over three to five years. Leasehold improvements are depreciated over the shorter of their estimated economic useful lives or the remaining lease term. Routine repairs and maintenance are expensed as incurred. When fixed assets are retired or otherwise disposed of, the related gain or loss is included in operating income. The Company has asset retirement obligations related to certain of its leasehold improvements, which it accounts for in accordance with U.S. GAAP guidance, Asset Retirement Obligations. The guidance requires that the fair value of a liability for an asset retirement obligation be recognized in the period in which it is incurred if a reasonable estimate of fair value can be made. The associated asset retirement cost is capitalized as part of the carrying amount of the long-lived asset. The liability is discounted and accretion expense is recognized using the credit-adjusted risk-free interest rate in effect when the liability was initially recognized.
Investments:
The Company’s investments in which it has a significant influence but not a controlling financial interest and of which it is not the primary beneficiary are accounted for under the equity method. When the Company does not have an ability to exercise significant influence over the operating and financial policies of an investee and does not have a controlling financial interest in the entity, it accounts for such investment using the cost method of accounting.
The Company’s consolidated financial statements include the accounts of the Company and its wholly-owned and majority-owned subsidiaries. The Company’s policy is to consolidate all entities of which it owns more than 50% unless it does not have control over the entity. In accordance with the U.S. GAAP guidance, Consolidation of Variable Interest Entities, the Company also consolidates any variable interest entities (“VIEs”) of which it is the primary beneficiary.
Long-Lived Assets:
The Company periodically evaluates potential impairment of long-lived assets and amortizable intangibles, when a change in circumstances occurs, by applying the U.S. GAAP guidance, Impairment or Disposal of Long-Lived Assets, and assessing whether the unamortized carrying amount can be recovered over the remaining life through undiscounted future expected cash flows generated by the underlying assets. If the undiscounted future cash flows were less than the carrying value of the asset, an impairment charge would be recorded. The impairment charge would be measured as the excess of the carrying value of the asset over the present value of estimated expected future cash flows using a discount rate commensurate with the risks involved.
Goodwill and Other Intangible Assets, Net:
Goodwill is the excess of the purchase price over the fair value of identifiable net assets acquired in a business combination. As prescribed in the U.S. GAAP guidance, Intangibles—Goodwill and Other, goodwill and other indefinite-lived intangible assets are not amortized, but instead are periodically tested for impairment. The Company reviews goodwill and other indefinite-lived intangible assets for impairment on an annual basis during the fourth quarter of each fiscal year or whenever an event occurs or circumstances change that could reduce the fair value of a reporting unit below its carrying amount. When reviewing goodwill for impairment, the Company first assesses qualitative factors to determine whether it is more likely than not that the fair value of a reporting unit is less than its carrying amount, including goodwill. The Company performed impairment evaluations for the years ended December 31, 2017, 2016 and 2015 and concluded that there was no impairment of its goodwill during any of these periods. There was a $6.3 million impairment charge recognized for the Company’s indefinite-lived intangible assets other than goodwill for the year ended December 31, 2017, and no impairment of indefinite-lived intangible assets other than goodwill was deemed necessary for the years ended December 31, 2016 and 2015.
188
Intangible assets with definite lives are amortized on a straight-line basis over their estimated useful lives. Definite-lived intangible assets arising from business combinations include customer relationships, internally developed software, and covenants not to compete. Also included in the definite-lived intangible assets are purchased patents. The costs of acquired patents are amortized over a period not to exceed the legal life or the remaining useful life of the patent, whichever is shorter, using the straight-line method.
Warehouse Notes Payable:
Warehouse notes payable are borrowings under warehouse line agreements. The carrying amounts approximate fair value due to the short-term maturity of these instruments. Outstanding borrowings against these lines are collateralized by an assignment of the underlying mortgages and third party purchase commitments. The borrowing rates on the warehouse lines are based on short-term LIBOR plus applicable margins. Accordingly, warehouse notes payable are typically classified within Level 2 of the fair value hierarchy.
Financial Guarantee Liability:
The Company recognizes a liability in connection with the guarantee provided to Fannie Mae under the Delegated Underwriting and Servicing Program (“DUS”) and Freddie Mac under the Targeted Affordable Housing Program (“TAH”). The financial guarantee liability requires the Company to make payments to the guaranteed party based on the borrower’s failure to meet its obligations. The liability is adjusted through provisions charged or reversed through operations.
Income Taxes:
The Company accounts for income taxes using the asset and liability method as prescribed in the U.S. GAAP guidance, Income Taxes. Deferred tax assets and liabilities are recognized for the future tax consequences attributable to differences between the consolidated financial statement carrying amounts of existing assets and liabilities and their respective tax basis. Certain of the Company’s entities are taxed as U.S. partnerships and are subject to the Unincorporated Business Tax (“UBT”) in New York City. Therefore, the tax liability or benefit related to the partnership income or loss except for UBT rests with the partners (see Note 2— “Limited Partnership Interests in BGC Holdings and Newmark Holdings” for a discussion of partnership interests), rather than the partnership entity. As such, the partners’ tax liability or benefit is not reflected in the Company’s consolidated financial statements. The tax-related assets, liabilities, provisions or benefits included in the Company’s consolidated financial statements also reflect the results of the entities that are taxed as corporations, either in the U.S. or in foreign jurisdictions. The Company provides for uncertain tax positions based upon management’s assessment of whether a tax benefit is more likely than not to be sustained upon examination by tax authorities. The Company recognizes interest and penalties related to income tax matters in “Provision for income taxes” in the Company’s consolidated statements of operations.
The Company files income tax returns in the United States federal jurisdiction and various states, local and foreign jurisdictions. The Company is currently open to examination by tax authorities for tax years beginning 2008 in United States federal, state and local jurisdictions and certain non-U.S. jurisdictions.
On December 22, 2017, “H.R.1”, formerly known as the “Tax Cuts and Jobs Act” (the “Tax Act”) was signed into law in the U.S. The Tax Act is expected to have a favorable impact on the Company’s effective tax rate and net income as reported under generally accepted accounting principles both in the first fiscal quarter of 2018 and subsequent reporting periods to which the Tax Act is effective. The final impact of the Tax Act may differ from our estimate for the provision for income taxes, possibly materially, due to, among other things, changes in interpretations, additional guidance that may be issued, unexpected negative changes in business and market conditions that could reduce certain tax benefits, and actions taken by the Company as a result of the Tax Act.
Because of the complexity of the new Global Intangible Low-Taxed Income (“GILTI”) tax rules, the Company continues to evaluate this provision of the Tax Act. Under U.S. GAAP, the Company can elect an accounting policy choice to either (a) treat future taxes related to GILTI as a current period expense when incurred (“period cost method”) or (b) factor amounts related to GILTI into the Company’s measurement of its deferred taxes (“deferred method”). The Company’s accounting for the effects of the GILTI tax law provisions is incomplete at this time, and, therefore, the Company is not yet able to reasonably estimate the effect of this provision of the Tax Act. Accordingly, the Company has not made any adjustments with respect to potential GILTI tax in its financial statements, nor has an accounting policy decision been made with respect to GILTI.
Equity-Based and Other Compensation:
The Company accounts for equity-based compensation under the fair value recognition provisions. Equity-based compensation expense recognized during the period is based on the value of the portion of equity-based payment awards that is ultimately expected to vest. The grant-date fair value of equity-based awards is amortized to expense ratably over the awards’ vesting periods. As equity-based compensation expense recognized in the Company’s consolidated statements of operations is based on
189
awards ultimately expected to vest, it has been reviewed for estimated forfeitures. Further, forfeitures are estimated at the time of grant and revised, if necessary, in subsequent periods if actual forfeitures differ from those estimates.
Restricted Stock Units:
Restricted stock units (“RSUs”) provided to certain employees by the Company are accounted for as equity awards, and in accordance with the U.S. GAAP, the Company is required to record an expense for the portion of the RSUs that is ultimately expected to vest. The grant-date fair value of RSUs is amortized to expense ratably over the awards’ vesting periods. The amortization is reflected as non-cash equity-based compensation expense in the Company’s consolidated statements of operations.
Restricted Stock:
Restricted stock provided to certain employees by the Company is accounted for as an equity award, and as per the U.S. GAAP guidance, the Company is required to record an expense for the portion of the restricted stock that is ultimately expected to vest. The Company has granted restricted stock that is fully vested and not subject to continued employment or service with the Company or any affiliate or subsidiary of the Company; however, transferability is subject to compliance with BGC Partners’ and its affiliates’ customary noncompete obligations. Such shares of restricted stock are generally saleable by partners in five to ten years. Because the restricted stock is not subject to continued employment or service, the grant-date fair value of the restricted stock is expensed on the date of grant. The expense is reflected as non-cash equity-based compensation expense in the Company’s consolidated statements of operations.
Limited Partnership Units:
Limited partnership units in BGC Holdings and Newmark Holdings generally are held by employees and receive quarterly allocations of net income, which are cash distributed on a quarterly basis and generally contingent upon services being provided by the unit holders. The quarterly allocations of net income on such limited partnership units are reflected as a component of compensation expense under “Allocations of net income and grant of exchangeability to limited partnership units and FPUs” in the Company’s consolidated statements of operations.
Certain of these limited partnership units entitle the holders to receive post-termination payments equal to the notional amount in four equal yearly installments after the holder’s termination. These limited partnership units are accounted for as post-termination liability awards under the U.S. GAAP guidance, which requires that the Company record an expense for such awards based on the change in value at each reporting period and include the expense in the Company’s consolidated statements of operations as part of “Compensation and employee benefits.” The liability for limited partnership units with a post-termination payout amount is included in “Accrued compensation” on the Company’s consolidated statements of financial condition.
Certain limited partnership units are granted exchangeability into Class A common stock on a one-for-one basis (subject to adjustment). At the time exchangeability is granted, the Company recognizes an expense based on the fair value of the award on that date, which is included in “Allocations of net income and grants of exchangeability to limited partnership units and FPUs” in the Company’s consolidated statements of operations.
The Company has also awarded Preferred Units. Each quarter, the net profits of BGC Holdings and Newmark Holdings are allocated to such units at a rate of either 0.6875% (which is 2.75% per calendar year) or such other amount as set forth in the award documentation (the “Preferred Distribution”), which is deducted before the calculation and distribution of the quarterly partnership distribution for the remaining partnership units. The Preferred Units are not entitled to participate in partnership distributions other than with respect to the Preferred Distribution. Preferred Units may not be made exchangeable into the Company’s Class A common stock and are only entitled to the Preferred Distribution, and accordingly they are not included in the Company’s fully diluted share count. The quarterly allocations of net income on Preferred Units are reflected in compensation expense under “Allocations of net income and grants of exchangeability to limited partnership units and FPUs” in the Company’s consolidated statements of operations.
Redeemable Partnership Interest:
Redeemable partnership interest represents limited partnership interests in BGC Holdings and Newmark Holdings held by founding/working partners. See Note 2—“Limited Partnership Interests in BGC Holdings and Newmark Holdings” for additional information related to the founding/working partner units.
190
Contingent Class A Common Stock:
In connection with certain acquisitions, the Company has committed to issue shares of the Company’s Class A common stock upon the achievement of certain performance targets. The contingent shares meet the criteria for equity classification and are recorded at acquisition date fair value in the Company’s consolidated statements of financial condition. The amount attributable to the Company is classified as “Contingent Class A Common Stock.”
The Company has also issued limited partnership units in BGC Holdings and Newmark Holdings (as a result of the Separation and Distribution Agreement) as part of purchase consideration. These units are accounted for as either equity or liability awards. Units that are accounted for as equity awards and are contingent upon the achievement of performance targets are classified as “Contingent Class A Common Stock” in the Company’s consolidated statements of financial condition.
Noncontrolling Interest in Subsidiaries:
Noncontrolling interest in subsidiaries represents equity interests in consolidated subsidiaries that are not attributable to the Company, such as Cantor’s limited partnership interest in BGC Holdings and Newmark Holdings as well as the noncontrolling interest holders’ proportionate share of the profit or loss associated with joint ownership of the Company’s administrative services company in the U.K. (Tower Bridge), the Company’s Real Estate affiliate entities, and the percentage of Newmark Group, Inc. owned by the public.
Foreign Currency Transactions:
Assets and liabilities denominated in non-U.S. currencies are translated at rates of exchange prevailing on the date of the Company’s consolidated statements of financial condition, and revenues and expenses are translated at average rates of exchange for the period. Gains or losses on remeasurement of the financial statements of a non-U.S. operation, when the functional currency is the U.S. dollar, are included in the Company’s consolidated statements of operations as part of “Other expenses.” Gains or losses upon translation of the financial statements of a non-U.S. operation, when the functional currency is other than the U.S. dollar, are included within “Other comprehensive income (loss), net of tax” in the Company’s consolidated statements of comprehensive income and as part of “Accumulated other comprehensive income (loss)” in the Company’s consolidated statements of financial condition.
Derivative Financial Instruments:
Derivative contracts are instruments, such as futures, forwards, options or swaps contracts that derive their value from underlying assets, indices, reference rates or a combination of these factors. Derivative instruments may be listed and traded on an exchange, or they may be privately negotiated contracts, which are often referred to as OTC derivatives. Derivatives may involve future commitments to purchase or sell financial instruments or commodities, or to exchange currency or interest payment streams. The amounts exchanged are based on the specific terms of the contract with reference to specified rates, securities, commodities, currencies or indices.
In addition, the Company has loan commitments to extend credit to third parties. The commitments to extend credit are for mortgage loans at a specific rate (rate lock commitments). These commitments generally have fixed expiration dates or other termination clauses and may require a fee. The Company is committed to extend credit to the counterparty as long as there is no violation of any condition established in the commitment contracts. For certain of these loan commitments, the Company simultaneously enters into an agreement to deliver such mortgages to third party investors at a fixed price (forward sale contracts). Both the origination and delivery commitment qualify as derivative financial instruments.
U.S. GAAP requires that an entity recognize all derivative contracts as either assets or liabilities in the consolidated statements of financial condition and measure those instruments at fair value. The fair value of all derivative contracts is recorded on a net-by-counterparty basis where a legal right of offset exists under an enforceable netting agreement. Derivative contracts are recorded as part of receivables from or payables to broker-dealers, clearing organizations, customers and related broker-dealers in the Company’s consolidated statements of financial condition.
|
4. |
Acquisitions |
Berkeley Point
On September 8, 2017, the Company completed the Berkeley Point Acquisition for an acquisition price of $875.0 million, with $3.2 million of the acquisition price paid in units of BGC Holdings. As the Company purchased and acquired Berkeley Point from CCRE, an affiliate of Cantor, this transaction has been determined to be a combination of entities under common control that resulted in a change in the reporting entity. Accordingly, the financial results of the Company have been recast to include the financial results of Berkeley Point in the current and prior periods presented.
191
The assets and liabilities of BPF have been recorded in the Company’s consolidated statements of financial condition at the seller’s historical carrying value. The excess of the purchase price over Berkeley Point’s net assets was accounted for as an equity transaction for the year ended December 31, 2017 (the period in which the transaction occurred). For additional information, see Note 1—“Organization and Basis of Presentation.”
Deferred tax assets and liabilities are recognized for the future tax consequences attributable to basis differences between the carrying amounts of existing assets and liabilities and their respective tax basis. Accordingly, a deferred tax asset of $108.6 million has been recorded against equity for the period ended December 31, 2017 for the basis difference between Berkeley Point’s net assets and its tax basis.
GFI
On February 26, 2015, the Company successfully completed its tender offer to acquire shares of common stock, par value $0.01 per share, of GFI for $6.10 per share in cash and accepted for purchase 54.3 million shares tendered to the Company pursuant to the offer. The Tendered Shares, together with the 17.1 million shares already owned by the Company, represented approximately 56% of the then-outstanding shares of GFI. The Company issued payment for the Tendered Shares on March 4, 2015 in the aggregate amount of $331.1 million. On April 28, 2015, a subsidiary of the Company purchased from GFI approximately 43.0 million new shares at that date’s closing price of $5.81 per share, for an aggregate purchase price of $250 million. The purchase price was paid to GFI in the form of a note due on June 19, 2018 that bears an interest rate of LIBOR plus 200 basis points. The new shares and the note eliminate in consolidation. Following the issuance of the new shares, the Company owned approximately 67% of GFI’s outstanding common stock. On January 12, 2016, the Company completed its acquisition of JPI. Shortly following the JPI Merger, a subsidiary of the Company merged with and into GFI pursuant to a short-form merger under Delaware law, with GFI continuing as the surviving entity. The Company issued approximately 23.5 million shares of its Class A common stock and will pay $111.2 million in cash in connection with the closing of the Back-End Mergers ($89.9 million has been paid as of December 31, 2016). Following the closing of the Back-End Mergers, the Company and its affiliates now own 100% of the outstanding shares of GFI common stock. The excess of total consideration over the fair value of the total net assets acquired, of approximately $450.0 million, has been recorded to goodwill and was allocated to the Company’s Financial Services segment. In addition, “Total revenues” in the Company’s consolidated statements of operations for the years ended December 31, 2016 and December 31, 2015 included $544.5 million and $551.5 million, respectively, related to GFI from the date of acquisition.
The following tables summarize the components of the purchase consideration transferred and the allocation of the assets acquired and liabilities assumed based on the fair values as of the acquisition date (in millions, except share and per share amounts).
Calculation of purchase consideration transferred
|
|
|
February 26, 2015 |
|
|
|
Cash |
|
$ |
331.1 |
|
|
Cost value of shares already owned (17,075,464 shares) |
|
|
75.1 |
|
|
Redeemable noncontrolling interest (56,435,876 shares at $6.10 per share) |
|
|
344.3 |
|
|
Total purchase consideration and noncontrolling interest (cost value) |
|
|
750.5 |
|
|
Appreciation of shares already owned (17,075,464 shares at $6.10 per share less cost value) |
|
|
29.0 |
|
|
Total purchase consideration and noncontrolling interest (fair value) |
|
$ |
779.5 |
|
192
Allocation of the assets acquired and the liabilities assumed
|
|
|
February 26, 2015 |
|
|
|
Cash and cash equivalents |
|
$ |
238.8 |
|
|
Receivables from broker-dealers, clearing organizations, customers and related-broker dealers |
|
|
704.8 |
|
|
Accrued commissions receivable, net |
|
|
93.6 |
|
|
Fixed assets, net |
|
|
58.4 |
|
|
Goodwill |
|
|
450.0 |
|
|
Finite-lived intangible assets: |
|
|
|
|
|
Non-compete agreement |
|
|
15.4 |
|
|
Technology |
|
|
39.2 |
|
|
Customer relationships |
|
|
133.8 |
|
|
Acquired intangibles |
|
|
6.7 |
|
|
Indefinite-lived intangible assets: |
|
|
|
|
|
Trade names |
|
|
92.1 |
|
|
Other assets |
|
|
194.2 |
|
|
Assets held for sale |
|
|
208.3 |
|
|
Short-term borrowings |
|
|
(70.0 |
) |
|
Accrued compensation |
|
|
(141.0 |
) |
|
Payables to broker-dealers, clearing organizations, customers and related broker-dealers |
|
|
(648.6 |
) |
|
Accounts payable, accrued and other liabilities |
|
|
(163.3 |
) |
|
Notes payable and collateralized borrowings |
|
|
(255.3 |
) |
|
Liabilities held for sale |
|
|
(175.5 |
) |
|
Pre-existing noncontrolling interest |
|
|
(2.1 |
) |
|
Total |
|
$ |
779.5 |
|
The following unaudited pro forma summary presents consolidated information of the Company as if the acquisition of GFI had occurred on January 1, 2014, and as if the Company owned 100% of GFI from the date of acquisition. The unaudited pro forma results are not indicative of operations that would have been achieved, nor are they indicative of future results of operations. The unaudited pro forma results do not reflect any potential cost savings or other operations efficiencies that could result from the acquisition. In addition, the unaudited pro forma condensed combined financial information does not include any adjustments in respect of certain expenses recorded in the GFI financial statements that were associated with non-recurring events unrelated to the acquisition and does not include any adjustments in respect of any potential future sales of assets. However, the unaudited pro forma results below for the year ended December 31, 2015 do include non-recurring pro forma adjustments directly related to the acquisition which mainly consisted of: (a) Prior to the acquisition, GFI had entered into an agreement with the CME Group Inc. (“CME”) for CME to acquire GFI. The CME transaction was terminated, and as a result, GFI incurred breakage costs of approximately $24.7 million; (b) Severance and compensation restructuring charges of $22.2 million incurred by GFI; (c) The aggregate of BGC’s and GFI’s professional fees incurred, which totaled $24.9 million; and (d) The $29.0 million gain recorded by the Company upon acquisition of GFI on the 17.1 million shares of GFI common stock owned prior to the completion of the acquisition.
In millions (unaudited)
|
|
|
Year Ended, |
|
|
|
|
|
2015 |
|
|
|
Pro forma revenues |
|
$ |
2,743.7 |
|
|
Pro forma consolidated net income (loss) |
|
$ |
258.5 |
|
Integra Realty Resources
On September 7, 2017, the Company announced that it had completed the acquisition of six Integra Realty Resources (“IRR”) offices (Washington DC, Baltimore, Wilmington DE, New York/New Jersey, Philadelphia and Atlanta). IRR provides commercial real estate valuation and advisory services.
193
Commercial Real Estate Consulting Firm
On July 26, 2017, the Company acquired an approximately 50% controlling interest, and Cantor owns a 25% noncontrolling interest, in a commercial real estate consulting and advisory services firm which services a variety of commercial real estate clients, including lenders, investment banks, and investors and is headquarters in New York, NY. Their core competencies include underwriting, modeling, structuring, due diligence and asset management.
Besso
On February 28, 2017, the Company announced that it had completed the acquisition of Besso Insurance Group Limited (“Besso”). Besso, based out of London is an independent insurance broker with a number of divisions including Property, Casualty, Marine, Aviation, Professional and Financial Risks and Reinsurance.
Sunrise Brokers
On December 15, 2016, the Company completed the acquisition of the business of Sunrise Brokers Group (“Sunrise Brokers”). Sunrise Brokers, based in London with offices in New York and Hong Kong, is an independent financial brokerage specializing in worldwide equity derivatives.
Lucera
On November 4, 2016, the Company acquired from Cantor the 80% of the Lucera business (also known as “LFI Holdings, LLC” or “LFI”) not already owned by the Company. This transaction has been determined to be a combination of entities under common control that resulted in a change in the reporting entity. Accordingly, the financial results of the Company have been retrospectively adjusted to include the financial results of Lucera in the current and prior periods.
The assets and liabilities of Lucera have been recorded in the Company’s consolidated statements of financial condition at the seller’s historical carrying value. The excess of the purchase price over Lucera’s net assets was accounted for as an equity transaction for the year ended December 31, 2016 (the period in which the transaction occurred). For additional information, see Note 1—“Organization and Basis of Presentation.”
Other Acquisitions
During the year ended December 31, 2017, and the year ended December 31, 2016, there were several smaller acquisitions in both the Financial Services and Real Estate Services segments. The aggregate consideration paid for these acquisitions was not material to the Company’s consolidated financial statements..
Total Consideration
The total consideration for all acquisitions during the year ended December 31, 2017 was approximately $1.0 billion in total fair value, comprised of cash, shares of BGC Class A common stock and BGC Holdings and Newmark Holdings limited partnership units, of which $14.7 million may be issued contingent on certain targets being met through 2021. Excluding the Berkeley Point Acquisition, the excess of the consideration over the fair value of the net assets acquired has been recorded as goodwill of approximately $93.8 million.
The total consideration for acquisitions during the year ended December 31, 2016 was approximately $139.0 million in total fair value, comprised of cash, shares of the Company’s Class A common stock and BGC Holdings and Newmark Holdings limited partnership units, of which $28.1 million may be issued contingent on certain targets being met through 2021. Excluding the acquisition of Lucera, the excess of the consideration over the fair value of the net assets acquired has been recorded as goodwill of approximately $37.1 million. The goodwill figure includes measurement period adjustments of approximately $16.7 million recorded during the year ended December 31, 2017.
During the year ended December 31, 2016, an agreement with the sellers of a prior acquisition was entered into, whereby certain consideration was reduced, which resulted in the return to the Company of 1.6 million partnership units (with an acquisition date fair value of $14.9 million), the reduction of future cash earn-outs of $17.3 million and a repayment to the Company of $1.0 million in cash. As a result, the Company recognized $18.3 million (comprised of $17.3 million earn-out reduction and $1.0 million cash received) in “Other income (loss)” in the Company’s consolidated statements of operations. These reductions were performance-based.
194
Except for Berkeley Point and Lucera, the results of operations of the Company’s acquisitions have been included in the Company’s consolidated financial statements subsequent to their respective dates of acquisition. The Company has made a preliminary allocation of the consideration to the assets acquired and liabilities assumed as of the acquisition date, and expects to finalize its analysis with respect to acquisitions within the first year after the completion of the transaction. Therefore, adjustments to preliminary allocations may occur.
|
5. |
Divestitures |
Sales of KGL and KBL
In connection with the successful completion of the tender offer to acquire GFI on February 26, 2015, the Company acquired Kyte Group Limited (“KGL”) which primarily included GFI’s clearing business, and Kyte Broking Limited (“KBL”).
On January 24, 2015, GFI entered into an agreement to sell its 100% equity ownership of KGL, and the transaction was completed in March 2015. The total cash consideration received by the Company was approximately $10.6 million. The loss incurred from the sale of KGL of $0.2 million is included within “Gain (loss) on divestiture and sale of investments” in the Company’s consolidated statements of operations.
On February 3, 2015, GFI entered into an agreement to sell 100% equity ownership of KBL. In May 2015, the Company completed the sale of KBL. The transaction included total cash consideration of $6.1 million and the Company recorded a gain on the sale of $0.8 million, which is included within “Gain (loss) on divestiture and sale of investments” in the Company’s consolidated statements of operations. KBL’s operations prior to the completion of the transaction were included in the Company’s consolidated statements of operations.
Sale of Trayport
In connection with the successful completion of the tender offer to acquire GFI, the Company also acquired GFI’s Trayport business. The Trayport business was GFI’s European electronic energy software business. On December 11, 2015, the Company completed the sale of its Trayport business to Intercontinental Exchange, Inc. (“Intercontinental Exchange” or “ICE”). Under the terms of the purchase agreement, Intercontinental Exchange acquired the Trayport business from the Company in exchange for 2,527,658 ICE common shares issued with respect to the $650.0 million purchase price, which was adjusted at closing. The Company recorded a pre-tax gain on the sale of $391.0 million, net of $10.4 million in fees, which was included within “Gain (loss) on divestiture and sale of investments” in the Company’s consolidated statements of operations for the year ended December 31, 2015. Trayport’s operations prior to the completion of the transaction were included in the Company’s consolidated statements of operations within the Financial Services segment.
Other Sales
During the year ended December 31, 2016, the Company sold investments that had a carrying value of $0.1 million for total proceeds of $7.1 million. As a result of this sale, the Company recognized a $7.0 million gain on the sale of these investments, which is included in “Gain (loss) on divestiture and sale of investments” in the Company’s consolidated statements of operations.
|
6. |
Earnings Per Share |
U.S. GAAP guidance on Earnings Per Share (“EPS”) establishes standards for computing and presenting EPS. Basic EPS excludes dilution and is computed by dividing net income (loss) available to common stockholders by the weighted-average number of shares of common stock outstanding and contingent shares for which all necessary conditions have been satisfied except for the passage of time. Net income (loss) is allocated to the Company’s outstanding common stock, FPUs, limited partnership units and Cantor units (see Note 2—“Limited Partnership Interests in BGC Holdings and Newmark Holdings”).
The following is the calculation of the Company’s basic EPS (in thousands, except per share data):
|
|
|
Year Ended December 31, |
|
|||||||||
|
|
|
2017 |
|
|
2016 |
|
|
2015 |
|
|||
|
Basic earnings (loss) per share: |
|
|
|
|
|
|
|
|
|
|
|
|
|
Net income (loss) available to common stockholders |
|
$ |
51,475 |
|
|
$ |
185,022 |
|
|
$ |
159,959 |
|
|
Basic weighted-average shares of common stock outstanding |
|
|
287,378 |
|
|
|
277,073 |
|
|
|
243,460 |
|
|
Basic earnings (loss) per share |
|
$ |
0.18 |
|
|
$ |
0.67 |
|
|
$ |
0.66 |
|
195
Fully diluted EPS is calculated utilizing net income (loss) available to common stockholders plus net income allocations to the limited partnership interests in BGC Holdings and Newmark Holdings, as well as adjustments related to the interest expense on convertible notes, if applicable (see Note 22—“Long-term Debt, Collateralized and Short-term Borrowings”), as the numerator. The denominator is comprised of the Company’s weighted-average number of outstanding BGC shares of common stock and, if dilutive, the weighted-average number of limited partnership interests and other contracts to issue shares of BGC common stock, including convertible notes, stock options and RSUs. The limited partnership interests generally are potentially exchangeable into shares of BGC Class A common stock (see Note 2—“Limited Partnership Interests in BGC Holdings and Newmark Holdings”) and are entitled to remaining earnings after the deduction for the Preferred Distribution; as a result, they are included in the fully diluted EPS computation to the extent that the effect would be dilutive.
The following is the calculation of the Company’s fully diluted EPS (in thousands, except per share data):
|
|
|
Year Ended December 31, |
|
|||||||||
|
|
|
2017 |
|
|
2016 |
|
|
2015 |
|
|||
|
Fully diluted (loss) earnings per share |
|
|
|
|
|
|
|
|
|
|
|
|
|
Net income (loss) available to common stockholders |
|
$ |
51,475 |
|
|
$ |
185,022 |
|
|
$ |
159,959 |
|
|
Allocations of net income (loss) to limited partnership interests in BGC Holdings and Newmark Holdings, net of tax |
|
|
23,781 |
|
|
|
95,206 |
|
|
|
9,955 |
|
|
Interest expense on convertible notes, net of tax |
|
|
— |
|
|
|
3,297 |
|
|
|
8,058 |
|
|
Net income (loss) for fully diluted shares |
|
$ |
75,256 |
|
|
$ |
283,525 |
|
|
$ |
177,972 |
|
|
Weighted-average shares: |
|
|
|
|
|
|
|
|
|
|
|
|
|
Common stock outstanding |
|
|
287,378 |
|
|
|
277,073 |
|
|
|
243,460 |
|
|
Partnership units¹ |
|
|
165,050 |
|
|
|
145,650 |
|
|
|
16,517 |
|
|
Convertible notes |
|
|
— |
|
|
|
8,598 |
|
|
|
23,034 |
|
|
RSUs (Treasury stock method) |
|
|
521 |
|
|
|
452 |
|
|
|
741 |
|
|
Other |
|
|
1,307 |
|
|
|
1,453 |
|
|
|
2,570 |
|
|
Fully diluted weighted-average shares of common stock outstanding |
|
|
454,256 |
|
|
|
433,226 |
|
|
|
286,322 |
|
|
Fully diluted earnings (loss) per share |
|
$ |
0.17 |
|
|
$ |
0.65 |
|
|
$ |
0.62 |
|
|
1 |
Partnership units collectively include founding/working partner units, limited partnership units, and Cantor units (see Note 2—“Limited Partnership Interests in BGC Holdings and Newmark Holdings” for more information). |
For the years ended December 31, 2017, 2016 and 2015, respectively, approximately 0.1 million, 1.2 million and 114.5 million of potentially dilutive securities were not included in the computation of fully diluted EPS because their effect would have been anti-dilutive. Anti-dilutive securities for the years ended December 31, 2017 and 2016 included, on a weighted-average basis, 0.1 million and 1.2 million, respectively, other securities or other contracts to issue shares of BGC common stock. Anti-dilutive securities for the year ended December 31, 2015 included, on a weighted-average basis, 105.9 million limited partnership interest and 8.6 million other securities or other contracts to issue shares of BGC common stock. These 8.6 million shares represented the weighted average of the 23.5 million shares that were to be issued for the completion of the Company’s acquisition of GFI.
Additionally, as of December 31, 2017, 2016 and 2015, respectively, approximately 2.8 million, 5.1 million and 6.6 million shares of contingent Class A common stock and limited partnership units were excluded from the fully diluted EPS computations because the conditions for issuance had not been met by the end of the respective periods.
|
7. |
Stock Transactions and Unit Redemptions |
Class A Common Stock
On June 22, 2016, at the Company’s 2016 Annual Meeting of Stockholders, the stockholders approved an amendment to the Company’s amended and restated certificate of incorporation to increase the number of authorized shares of BGC Class A common stock from 500 million shares to 750 million shares. The Company filed the certificate of amendment on June 23, 2016, and the amendment was effective on that date.
196
Changes in shares of the Company’s Class A common stock outstanding for the years ended December 31, 2017 and 2016 were as follows:
|
|
|
Year Ended December 31, |
|
|||||
|
|
|
2017 |
|
|
2016 |
|
||
|
Shares outstanding at beginning of period |
|
|
244,869,624 |
|
|
|
219,063,365 |
|
|
Share issuances: |
|
|
|
|
|
|
|
|
|
Exchanges of limited partnership interests¹ |
|
|
9,179,295 |
|
|
|
8,705,906 |
|
|
Issuance of Class A common stock for general corporate purposes |
|
|
1,781,328 |
|
|
|
1,648,000 |
|
|
Vesting of restricted stock units (RSUs) |
|
|
570,944 |
|
|
|
637,719 |
|
|
Acquisitions |
|
|
1,923,854 |
|
|
|
25,334,451 |
|
|
Exercise of stock options |
|
|
154,533 |
|
|
|
76,000 |
|
|
Other issuances of Class A common stock |
|
|
58,809 |
|
|
|
287,442 |
|
|
Treasury stock repurchases |
|
|
(1,386,769 |
) |
|
|
(10,823,942 |
) |
|
Forfeitures of restricted Class A common stock |
|
|
(183,246 |
) |
|
|
(59,317 |
) |
|
Shares outstanding at end of period |
|
|
256,968,372 |
|
|
|
244,869,624 |
|
|
1 |
Because they are included in the Company’s fully diluted share count, if dilutive, any exchange of limited partnership interests into Class A common shares would not impact the fully diluted number of shares and units outstanding. |
Class B Common Stock
On June 22, 2016, at the Company’s 2016 Annual Meeting of Stockholders, the stockholders approved an amendment to the Company’s amended and restated certificate of incorporation to increase the number of authorized shares of BGC Class B common stock from 100 million shares to 150 million shares and to provide that BGC Class B common stock shall be issued only to certain affiliated entities or related persons. The Company filed the certificate of amendment on June 23, 2016, and the amendment was effective on that date.
The Company did not issue any shares of BGC Class B common stock during the years ended December 31, 2017 and 2016. As of December 31, 2017 and 2016, there were 34,848,107 shares of the Company’s Class B common stock outstanding.
Controlled Equity Offering
The Company has entered into a controlled equity offering (“CEO”) sales agreement with CF&Co (“November 2014 Sales Agreement”), pursuant to which the Company may offer and sell up to an aggregate of 20 million shares of BGC Class A common stock. Shares of the Company’s Class A common stock sold under its CEO sales agreements are used for redemptions and exchanges of limited partnership interests in BGC Holdings and Newmark Holdings, as well as for general corporate purposes. CF&Co is a wholly owned subsidiary of Cantor and an affiliate of the Company. Under this agreement, the Company has agreed to pay CF&Co 2% of the gross proceeds from the sale of shares. As of December 31, 2017, the Company has sold 20,000,000 shares of BGC Class A common stock under the November 2014 Sales Agreement. For additional information, see Note 18—“Related Party Transactions.”
On April 12, 2017, the Company entered into a CEO sales agreement with CF&Co (“April 2017 Sales Agreement”) on the same terms as above, pursuant to which the Company may offer and sell up to an aggregate of 20 million shares of BGC Class A common stock. As of December 31, 2017, the Company has sold 2,775,485 shares of BGC Class A common stock under the April 2017 Sales Agreement. For additional information, see Note 18—“Related Party Transactions.
197
Unit Redemptions and Share Repurchase Program
The Company’s Board of Directors and Audit Committee have authorized repurchases of the Company’s Class A common stock and redemptions of limited partnership interests or other equity interests in the Company’s subsidiaries. In February 2014, the Company’s Audit Committee authorized such repurchases of stock or units from Cantor, employees and partners. On October 27, 2015, the Company’s Board of Directors and Audit Committee increased the BGC Partners share repurchase and unit redemption authorization to $300 million, which may include purchases from Cantor, its partners or employees or other affiliated persons or entities. As of December 31, 2017, the Company had approximately $196.6 million remaining from its share repurchase and unit redemption authorization. From time to time, the Company may actively continue to repurchase shares and/or redeem units. The table below represents redemption of units in BGC Holdings and BGC share repurchase activity for the year ended December 31, 2017:
|
Period |
|
Total Number of Units Redeemed or Shares Repurchased |
|
|
Average Price Paid per Unit or Share |
|
|
Approximate Dollar Value of Units and Shares That May Yet Be Redeemed/Purchased Under the Plan |
|
|||
|
Redemptions1 |
|
|
|
|
|
|
|
|
|
|
|
|
|
January 1, 2017—March 31, 2017 |
|
|
2,927,758 |
|
|
$ |
10.84 |
|
|
|
|
|
|
April 1, 2017—June 30, 2017 |
|
|
1,908,867 |
|
|
$ |
11.14 |
|
|
|
|
|
|
July 1, 2017—September 30, 2017 |
|
|
1,675,330 |
|
|
$ |
12.58 |
|
|
|
|
|
|
October 1, 2017—December 31, 2017 |
|
|
1,984,933 |
|
|
$ |
15.00 |
|
|
|
|
|
|
Total Redemptions |
|
|
8,496,888 |
|
|
$ |
12.22 |
|
|
|
|
|
|
Repurchases2 |
|
|
|
|
|
|
|
|
|
|
|
|
|
January 1, 2017—March 31, 2017 |
|
|
552,955 |
|
|
$ |
11.07 |
|
|
|
|
|
|
April 1, 2017—June 30, 2017 |
|
|
397,539 |
|
|
$ |
11.25 |
|
|
|
|
|
|
July 1, 2017—September 30, 2017 |
|
|
295,871 |
|
|
$ |
13.41 |
|
|
|
|
|
|
October 1, 2017—December 31, 2017 |
|
|
140,404 |
|
|
$ |
15.78 |
|
|
|
|
|
|
Total Repurchases |
|
|
1,386,769 |
|
|
$ |
12.10 |
|
|
|
|
|
|
Total Redemptions and Repurchases |
|
|
9,883,657 |
|
|
$ |
12.21 |
|
|
$ |
196,577,825 |
|
|
1 |
During the year ended December 31, 2017, the Company redeemed approximately 7.6 million limited partnership units at an aggregate redemption price of approximately $94.5 million for an average price of $12.40 per unit and approximately 875.6 thousand FPUs at an aggregate redemption price of approximately $9.4 million for an average price of $10.70 per unit. During the year ended December 31, 2016, the Company redeemed approximately 7.2 million limited partnership units at an aggregate redemption price of approximately $65.7 million for an average price of $9.09 per unit and approximately 319.2 thousand FPUs at an aggregate redemption price of approximately $2.8 million for an average price of $8.64 per unit. |
|
2 |
During the year ended December 31, 2017, the Company repurchased approximately 1.4 million shares of its Class A common stock at an aggregate purchase price of approximately $16.8 million for an average price of $12.10 per share. During the year ended December 31, 2016, the Company repurchased approximately 10.8 million shares of its Class A common stock at an aggregate purchase price of approximately $96.0 million for an average price of $8.88 per share. |
The table above represents the gross unit in BGC Holdings redemptions and share repurchases of the Company’s Class A common stock during the year ended December 31, 2017. There were no units in Newmark Holdings redeemed during the year ended December 31, 2017. Approximately 7.0 million of the 8.5 million units above were redeemed using cash from the Company’s CEO program, and therefore did not impact the fully diluted number of shares and units outstanding. The remaining redemptions along with the BGC Class A common stock repurchases resulted in a 2.9 million reduction in the fully diluted share count. This net reduction cost the Company approximately $35.2 million (or $12.00 per share/unit) during the year ended December 31, 2017. This reduction partially offset the overall growth in the fully diluted share count which resulted from shares issued for equity-based compensation, front office hires, acquisitions and general corporate purposes.
198
Redeemable Partnership Interest
The changes in the carrying amount of redeemable partnership interest for the years ended December 31, 2017 and 2016 were as follows (in thousands):
|
|
|
Year Ended December 31, |
|
|||||
|
|
|
2017 |
|
|
2016 |
|
||
|
Balance at beginning of period |
|
$ |
52,577 |
|
|
$ |
57,145 |
|
|
Consolidated net income allocated to FPUs |
|
|
6,014 |
|
|
|
7,023 |
|
|
Earnings distributions |
|
|
(7,449 |
) |
|
|
(7,482 |
) |
|
FPUs exchanged |
|
|
(1,770 |
) |
|
|
(3,128 |
) |
|
FPUs redeemed |
|
|
(2,957 |
) |
|
|
(981 |
) |
|
Balance at end of period |
|
$ |
46,415 |
|
|
$ |
52,577 |
|
|
8. |
Securities Owned |
Securities owned primarily consist of unencumbered U.S. Treasury bills held for liquidity purposes. Total Securities owned were $33.0 million as of December 31, 2017 and $35.4 million as of December 31, 2016. For additional information, see Note 14—“Fair Value of Financial Assets and Liabilities.”
|
9. |
Collateralized Transactions |
Reverse Repurchase Agreements
Securities purchased under agreements to resell (“Reverse Repurchase Agreements”) are accounted for as collateralized financing transactions and are recorded at the contractual amount for which the securities will be repurchased or resold, including accrued interest. It is the Company’s policy to obtain possession of collateral with a fair value equal to or in excess of the principal amount loaned under Reverse Repurchase Agreements. Collateral is valued daily and the Company may require counterparties to deposit additional collateral or return collateral pledged when appropriate.
As of December 31, 2017, the Company had no Reverse Repurchase Agreements. As of December 31, 2016, Cantor facilitated Reverse Repurchase Agreements between the Company and Cantor in the amount of $54.7 million as part of the Company’s cash management strategy. U.S. Treasury or other fixed income securities were received from Cantor as collateral for the fair value of the Reverse Repurchase Agreement.
Warehouse Notes Payable
The Company uses its warehouse lines and a repurchase agreement to fund mortgage loans originated under its various lending programs. Outstanding borrowings against these lines are collateralized by an assignment of the underlying mortgages and third party purchase commitments. As of December 31, 2017, the Company had the following lines available and borrowings outstanding (in thousands):
|
|
|
December 31, 2017 |
||||||||||||||
|
|
|
Committed Lines |
|
|
Uncommitted Lines |
|
|
Total |
|
|
Stated Spread to One Month LIBOR |
|
Rate Type |
|||
|
Warehouse line due June 20, 20181 |
|
$ |
450,000 |
|
|
$ |
— |
|
|
$ |
60,715 |
|
|
130 bps |
|
Variable |
|
Warehouse line due September 25, 2018 |
|
|
200,000 |
|
|
|
— |
|
|
|
107,383 |
|
|
130 bps |
|
Variable |
|
Warehouse line due October 11, 2018 |
|
|
300,000 |
|
|
|
— |
|
|
|
174,102 |
|
|
130 bps |
|
Variable |
|
Fannie Mae repurchase agreement, open maturity |
|
|
— |
|
|
|
325,000 |
|
|
|
18,240 |
|
|
120 bps |
|
Variable |
|
|
|
$ |
950,000 |
|
|
$ |
325,000 |
|
|
$ |
360,440 |
|
|
|
|
|
|
1 |
On October 18, 2017, the stated spread to One Month LIBOR was reduced to 130bps. |
199
As of December 31, 2016, the Company had the following lines available and borrowings outstanding (in thousands):
|
|
|
December 31, 2016 |
||||||||||||||
|
|
|
Committed Lines |
|
|
Uncommitted Lines |
|
|
Total |
|
|
Stated Spread to One Month LIBOR |
|
Rate Type |
|||
|
Warehouse line due April 21, 2017 |
|
$ |
450,000 |
|
|
$ |
— |
|
|
$ |
43,356 |
|
|
135 bps |
|
Variable |
|
Warehouse line due September 25, 2017 |
|
|
200,000 |
|
|
|
— |
|
|
|
34,628 |
|
|
135 bps |
|
Variable |
|
Warehouse line due October 12, 2017 |
|
|
300,000 |
|
|
|
— |
|
|
|
23,833 |
|
|
135 bps |
|
Variable |
|
Fannie Mae repurchase agreement, open maturity |
|
|
— |
|
|
|
325,000 |
|
|
|
156,152 |
|
|
120 bps |
|
Variable |
|
|
|
$ |
950,000 |
|
|
$ |
325,000 |
|
|
$ |
257,969 |
|
|
|
|
|
In connection with these warehouse notes payable, the Company is required to meet a number of financial covenants, including maintaining a minimum of $15.0 million of cash and cash equivalents. The Company was in compliance with all covenants as of December 31, 2017 and 2016 and for the years ended December 31, 2017, 2016, and 2015.
Securities Loaned
As of December 31, 2017, the Company had Securities loaned transactions of $202.3 million with Cantor. The fair value of the securities lent was $204.1 million. As of December 31, 2017, the cash collateral received from Cantor bore interest rates ranging from 1.9% to 4.3%. These transactions have no stated maturity date. As of December 31, 2016, the Company had no Securities loaned transactions. Securities loaned transactions are included in “Securities loaned” in the Company’s consolidated statements of financial condition.
|
10. |
Marketable Securities |
Marketable securities consist of the Company’s ownership of various investments. The investments had a fair value of $208.2 million and $164.8 million as of December 31, 2017 and December 31, 2016, respectively.
As of December 31, 2017 and December 31, 2016, the Company held marketable securities classified as trading securities with a market value of $198.3 million and $154.8 million, respectively. These securities are measured at fair value, with any changes in fair value recognized currently in earnings and included in “Other income (loss)” in the Company’s consolidated statements of operations. During the years ended December 31, 2017, 2016 and 2015, the Company recognized realized net gains of $1.2 million, $13.6 million, and $4.4 million, respectively, and unrealized net gains of $22.2 million, $0.3 million and $27.0 million, respectively, related to the mark-to-market on these shares and any related hedging transactions when applicable.
In connection with the Company’s sale of its on-the-run, electronic benchmark U.S. Treasury platform (“eSpeed”) to Nasdaq on June 28, 2013, the Company will receive a remaining earn-out of up to 9,922,470 shares of Nasdaq common stock ratably over the next approximately 10 years, provided that Nasdaq, as a whole, produces at least $25.0 million in gross revenues for each fiscal year beginning July 1. During the years ended December 31, 2017, 2016 and 2015, in connection with the Nasdaq earn-out, the Company recognized gains of $77.0 million, $67.0 million and $52.9 million, respectively, in “Other income (loss)” in the Company’s consolidated statements of operations.
As of December 31, 2017 and December 31, 2016, the Company held marketable securities classified as available-for-sale with a market value of $9.9 million and $10.0 million, respectively. These securities are measured at fair value, with unrealized gains or losses included as part of “Other comprehensive income (loss)” in the Company’s consolidated statements of comprehensive income (loss). During the years ended December 31, 2017, 2016 and 2015, the Company recognized a loss of $0.2 million, and gains of $0.7 million and $13.9 million, respectively, related to these marketable securities classified as available-for-sale. In addition, for the year ended December 31, 2015, the Company recorded a $29.0 million gain upon acquisition of GFI on the 17.1 million shares of GFI common stock owned prior to the completion of the acquisition, which were previously classified as available-for-sale marketable securities. The $29.0 million gain previously recorded in “Accumulated other comprehensive income (loss)” was recorded as a gain in “Other income (loss)” in the Company’s consolidated statements of operations.
During the year ended December 31, 2017, the Company sold marketable securities with a market value of $57.0 million at the time of sale. Of the marketable securities sold, $49.1 million during the year ended December 31, 2017 was related to the shares of NASDAQ that the Company received for the sale of eSpeed in June 2013, and $7.8 million was related to the share of ICE that the Company received for the sale of Trayport in December 2015. The Company did not purchase any marketable securities during the year ended December 31, 2017. During the year ended December 31, 2016, the Company purchased marketable securities with a market value of $53.0 million at the time of purchase and sold marketable securities with a market value of $516.8 million at the time of sale. The majority (or $468.5 million) of the marketable securities sold during the year ended December 31, 2016 was related to the shares of ICE that the Company received for the sale of Trayport in December 2015.
200
|
11. |
Loans Held for Sale, at Fair Value |
Loans held for sale represent originated loans that are typically sold within 45 days from the date that the mortgage loan is funded. The Company initially and subsequently measures all loans held for sale at fair value on the accompanying consolidated statement of financial condition. This fair value measurement falls within the definition of a Level 2 measurement (significant other observable inputs) within the fair value hierarchy. For additional information, see Note 14—“Fair Value of Financial Assets and Liabilities.” Electing to use fair value allows a better offset of the change in fair value of the loan and the change in fair value of the derivative instruments used as economic hedges. Loans held for sale had a cost basis and fair value as follows (in thousands):
|
|
|
December 31, 2017 |
|
|
December 31, 2016 |
|
||
|
Cost basis |
|
$ |
360,440 |
|
|
$ |
1,074,429 |
|
|
Fair value |
|
|
362,635 |
|
|
|
1,071,836 |
|
As of December 31, 2017 and 2016, respectively, there were no loans held for sale that were 90 days or more past due or in nonaccrual status.
During the period prior to its sale, interest income on a loan held for sale is calculated in accordance with the terms of the individual loan. Interest income on Loans held for sale was $30.6 million, $21.2 million, and $13.8 million for the years ended December 31, 2017, 2016, and 2015. Interest income on Loans held for sale is included as part of “Interest income” in the Company’s consolidated statements of operations. During the years ended December 31, 2017, 2016 and 2015, the Company recognized a gain of $2.2 million, a loss of $2.6 million, and a loss of $1.1 million, respectively, for the change in fair value on loans held for sale.
|
12. |
Receivables from and Payables to Broker-Dealers, Clearing Organizations, Customers and Related Broker-Dealers |
Receivables from and payables to broker-dealers, clearing organizations, customers and related broker-dealers primarily represent amounts due for undelivered securities, cash held at clearing organizations and exchanges to facilitate settlement and clearance of matched principal transactions, spreads on matched principal transactions that have not yet been remitted from/to clearing organizations and exchanges and amounts related to open derivative contracts, including derivative contracts into which the Company may enter to minimize the effect of price changes of the Company’s marketable securities (see Note 13—“Derivatives”). As of December 31, 2017 and December 31, 2016, Receivables from and payables to broker-dealers, clearing organizations, customers and related broker-dealers consisted of the following (in thousands):
|
|
|
December 31, 2017 |
|
|
December 31, 2016 |
|
||
|
Receivables from broker-dealers, clearing organizations, customers and related broker-dealers: |
|
|
|
|
|
|
|
|
|
Contract values of fails to deliver |
|
$ |
586,486 |
|
|
$ |
344,962 |
|
|
Receivables from clearing organizations |
|
|
133,682 |
|
|
|
135,175 |
|
|
Other receivables from broker-dealers and customers |
|
|
10,968 |
|
|
|
13,993 |
|
|
Net pending trades |
|
|
1,597 |
|
|
|
— |
|
|
Open derivative contracts |
|
|
40,087 |
|
|
|
23,351 |
|
|
Total |
|
$ |
772,820 |
|
|
$ |
517,481 |
|
|
Payables to broker-dealers, clearing organizations, customers and related broker-dealers: |
|
|
|
|
|
|
|
|
|
Contract values of fails to receive |
|
$ |
567,460 |
|
|
$ |
301,873 |
|
|
Payables to clearing organizations |
|
|
14,023 |
|
|
|
22,170 |
|
|
Other payables to broker-dealers and customers |
|
|
18,164 |
|
|
|
19,581 |
|
|
Net pending trades |
|
|
— |
|
|
|
29,962 |
|
|
Open derivative contracts |
|
|
35,351 |
|
|
|
11,236 |
|
|
Total |
|
$ |
634,998 |
|
|
$ |
384,822 |
|
A portion of these receivables and payables are with Cantor. See Note 18—“Related Party Transactions,” for additional information related to these receivables and payables.
Substantially all open fails to deliver, open fails to receive and pending trade transactions as of December 31, 2017 have subsequently settled at the contracted amounts.
201
The Company also enters into commitments to extend credit for mortgage loans at a specific rate (“Rate lock commitments”) and commitments to deliver these loans to third party investors at a fixed price. In the normal course of operations, the Company also enters into other derivative contracts. These derivative contracts primarily consist of foreign exchange swaps, foreign exchange/commodities options, and interest rate swaps. The Company enters into derivative contracts to facilitate client transactions, hedge principal positions and facilitate hedging activities of affiliated companies.
Derivative contracts can be exchange-traded or OTC. Exchange-traded derivatives typically fall within Level 1 or Level 2 of the fair value hierarchy depending on whether they are deemed to be actively traded or not. The Company generally values exchange-traded derivatives using their closing prices. OTC derivatives are valued using market transactions and other market evidence whenever possible, including market-based inputs to models, broker or dealer quotations or alternative pricing sources with reasonable levels of price transparency. For OTC derivatives that trade in liquid markets, such as generic forwards, swaps and options, model inputs can generally be verified and model selection does not involve significant management judgment. Such instruments are typically classified within Level 2 of the fair value hierarchy. However, some derivative contracts held by the Company, such as rate lock commitments and forwards related to mortgage loans, are valued by the Company using pricing models that entail unobservable inputs, which are significant to the fair value measurement of the derivative contracts. Accordingly, such derivative contracts are generally classified within Level 3 of the fair value hierarchy.
The Company does not designate any derivative contracts as hedges for accounting purposes. U.S. GAAP guidance requires that an entity recognize all derivative contracts as either assets or liabilities in the consolidated statements of financial condition and measure those instruments at fair value. The fair value of all derivative contracts is recorded on a net-by-counterparty basis where a legal right to offset exists under an enforceable netting agreement. Derivative contracts are recorded as part of “Receivables from broker-dealers, clearing organizations, customers and related broker-dealers” and “Payables to broker-dealers, clearing organizations, customers and related broker-dealers” in the Company’s consolidated statements of financial condition.
The fair value of derivative contracts, computed in accordance with the Company’s netting policy, is set forth below (in thousands):
|
|
|
December 31, 2017 |
|
|
December 31, 2016 |
|
||||||||||||||||||
|
Derivative contract |
|
Assets |
|
|
Liabilities |
|
|
Notional Amounts1 |
|
|
Assets |
|
|
Liabilities |
|
|
Notional Amounts1 |
|
||||||
|
Foreign exchange/commodities options |
|
$ |
31,834 |
|
|
$ |
27,548 |
|
|
$ |
2,442,200 |
|
|
$ |
244 |
|
|
$ |
41 |
|
|
$ |
827 |
|
|
Forwards |
|
|
4,262 |
|
|
|
1,483 |
|
|
|
642,802 |
|
|
|
17,859 |
|
|
|
36 |
|
|
|
1,288,722 |
|
|
Rate lock commitments |
|
|
2,923 |
|
|
|
2,390 |
|
|
|
180,918 |
|
|
|
2,100 |
|
|
|
9,670 |
|
|
|
201,603 |
|
|
Foreign exchange swaps |
|
|
801 |
|
|
|
2,846 |
|
|
|
407,600 |
|
|
|
2,946 |
|
|
|
977 |
|
|
|
464,466 |
|
|
Interest rate swaps |
|
|
242 |
|
|
|
— |
|
|
|
12,092 |
|
|
|
202 |
|
|
|
— |
|
|
|
12,273 |
|
|
Futures |
|
|
25 |
|
|
|
1,066 |
|
|
|
13,023,030 |
|
|
|
— |
|
|
|
512 |
|
|
|
11,624,772 |
|
|
Equity options |
|
|
— |
|
|
|
18 |
|
|
|
— |
|
|
|
— |
|
|
|
— |
|
|
|
— |
|
|
Total |
|
$ |
40,087 |
|
|
$ |
35,351 |
|
|
$ |
16,708,642 |
|
|
$ |
23,351 |
|
|
$ |
11,236 |
|
|
$ |
13,592,663 |
|
|
1 |
Notional amounts represent the sum of gross long and short derivative contracts, an indication of the volume of the Company’s derivative activity and does not represent anticipated losses. |
The interest rate swaps represent matched customer transactions settled through and guaranteed by a central clearing organization. Certain of the Company’s foreign exchange swaps are with Cantor. See Note 18—“Related Party Transactions,” for additional information related to these transactions.
The replacement cost of contracts in a gain position were $40.1 million and $23.4 million, as of December 31, 2017 and 2016, respectively.
The change in fair value of interest rate swaps, futures, foreign exchange/commodities options, foreign exchange swaps, and generic forwards is reported as part of “Principal transactions” in the Company’s consolidated statements of operations. The change in fair value of equity options related to marketable securities is included as part of “Other income (loss)” in the Company’s consolidated statements of operations. The change in fair value of rate lock commitments and forwards related to mortgage loans are reported as part of “Gains from mortgage banking activities, net” in the Company’s consolidated statements of operations. The change in fair value of rate lock commitments are disclosed net of $1.4 million, $0.7 million and $0.5 million of expenses for the years ended December 31, 2017, 2016 and 2015, respectively, which are reported as part of “Compensation and employee benefits” in the Company’s consolidated statements of operations.
202
The table below summarizes gains and losses on derivative contracts for the years ended December 31, 2017, 2016 and 2015 (in thousands):
|
|
|
Year Ended December 31, |
|
|||||||||
|
Derivative contract |
|
2017 |
|
|
2016 |
|
|
2015 |
|
|||
|
Foreign exchange/commodities options |
|
$ |
12,852 |
|
|
$ |
13,312 |
|
|
$ |
6,294 |
|
|
Futures |
|
|
8,306 |
|
|
|
8,436 |
|
|
|
11,261 |
|
|
Rate lock commitments and forwards |
|
|
3,591 |
|
|
|
7,813 |
|
|
|
5,752 |
|
|
Foreign exchange swaps |
|
|
1,332 |
|
|
|
987 |
|
|
|
(72 |
) |
|
Equity options |
|
|
591 |
|
|
|
4,551 |
|
|
|
— |
|
|
Interest rate swaps |
|
|
47 |
|
|
|
3 |
|
|
|
(48 |
) |
|
Gain |
|
$ |
26,719 |
|
|
$ |
35,102 |
|
|
$ |
23,187 |
|
As described in Note 22—“Long-term Debt, Collateralized and Short-term Borrowings,” on July 29, 2011, the Company issued an aggregate of $160.0 million principal amount of 4.50% Convertible Senior Notes due 2016 (the “4.50% Convertible Notes”) that contained an embedded conversion feature. The conversion feature met the requirements to be accounted for as an equity instrument, and the Company classified the conversion feature within “Additional paid-in capital” in the Company’s consolidated statements of financial condition as of December 31, 2016 and 2015. At the issuance of the 4.50% Convertible Notes, the embedded conversion feature was measured at approximately $19.0 million on a pre-tax basis ($16.1 million net of taxes and issuance costs) as the difference between the proceeds received and the fair value of a similar liability without the conversion feature and was not subsequently re-measured.
Also in connection with the issuance of the 4.50% Convertible Notes, the Company entered into capped call transactions. The capped call transactions met the requirements to be accounted for as equity instruments, and the Company classified the capped call transactions within “Additional paid-in capital” in the Company’s consolidated statements of financial condition. The purchase price of the capped call transactions resulted in a decrease to “Additional paid-in capital” of $11.4 million on a pre-tax basis ($9.9 million on an after-tax basis) at the issuance of the 4.50% Convertible Notes, and such capped call transactions were not subsequently remeasured. On July 15, 2016, upon maturity, the 4.50% Convertible Notes were repaid. The capped call transactions expired unexercised on July 13, 2016. The expiration of the capped call transactions had no financial statement impact.
|
14. |
Fair Value of Financial Assets and Liabilities |
U.S. GAAP guidance establishes a fair value hierarchy that prioritizes the inputs to valuation techniques used to measure fair value. The hierarchy gives the highest priority to unadjusted quoted prices in active markets for identical assets or liabilities (Level 1 measurements) and the lowest priority to unobservable inputs (Level 3 measurements). The three levels of the fair value hierarchy are as follows:
Level 1 measurements—Unadjusted quoted prices in active markets that are accessible at the measurement date for identical, unrestricted assets or liabilities.
Level 2 measurements—Quoted prices in markets that are not active or financial instruments for which all significant inputs are observable, either directly or indirectly.
Level 3 measurements—Prices or valuations that require inputs that are both significant to the fair value measurement and unobservable.
As required by U.S. GAAP guidance, financial assets and liabilities are classified in their entirety based on the lowest level of input that is significant to the fair value measurement.
203
The following tables set forth by level within the fair value hierarchy financial assets and liabilities accounted for at fair value under U.S. GAAP guidance at December 31, 2017 and December 31, 2016 (in thousands):
|
|
|
Assets at Fair Value at December 31, 2017 |
|
|||||||||||||||||
|
|
|
Level 1 |
|
|
Level 2 |
|
|
Level 3 |
|
|
Netting and Collateral |
|
|
Total |
|
|||||
|
Loans held for sale, at fair value |
|
$ |
— |
|
|
$ |
362,635 |
|
|
$ |
— |
|
|
$ |
— |
|
|
$ |
362,635 |
|
|
Marketable securities |
|
|
208,176 |
|
|
|
— |
|
|
|
— |
|
|
|
— |
|
|
|
208,176 |
|
|
Government debt |
|
|
32,744 |
|
|
|
— |
|
|
|
— |
|
|
|
— |
|
|
|
32,744 |
|
|
Securities owned—Equities |
|
|
263 |
|
|
|
— |
|
|
|
— |
|
|
|
— |
|
|
|
263 |
|
|
Foreign exchange/commodities options |
|
|
31,834 |
|
|
|
— |
|
|
|
— |
|
|
|
— |
|
|
|
31,834 |
|
|
Forwards |
|
|
— |
|
|
|
610 |
|
|
|
3,753 |
|
|
|
(101 |
) |
|
|
4,262 |
|
|
Rate lock commitments |
|
|
— |
|
|
|
— |
|
|
|
2,923 |
|
|
|
— |
|
|
|
2,923 |
|
|
Foreign exchange swaps |
|
|
— |
|
|
|
1,135 |
|
|
|
— |
|
|
|
(334 |
) |
|
|
801 |
|
|
Interest rate swaps |
|
|
— |
|
|
|
242 |
|
|
|
— |
|
|
|
— |
|
|
|
242 |
|
|
Futures |
|
|
— |
|
|
|
25 |
|
|
|
— |
|
|
|
— |
|
|
|
25 |
|
|
Total |
|
$ |
273,017 |
|
|
$ |
364,647 |
|
|
$ |
6,676 |
|
|
$ |
(435 |
) |
|
$ |
643,905 |
|
|
|
|
Liabilities at Fair Value at December 31, 2017 |
|
|||||||||||||||||
|
|
|
Level 1 |
|
|
Level 2 |
|
|
Level 3 |
|
|
Netting and Collateral |
|
|
Total |
|
|||||
|
Foreign exchange/commodities options |
|
$ |
27,548 |
|
|
$ |
— |
|
|
$ |
— |
|
|
$ |
— |
|
|
$ |
27,548 |
|
|
Foreign exchange swaps |
|
|
— |
|
|
|
3,180 |
|
|
|
— |
|
|
|
(334 |
) |
|
|
2,846 |
|
|
Rate lock commitments |
|
|
— |
|
|
|
— |
|
|
|
2,390 |
|
|
|
— |
|
|
|
2,390 |
|
|
Forwards |
|
|
— |
|
|
|
927 |
|
|
|
657 |
|
|
|
(101 |
) |
|
|
1,483 |
|
|
Futures |
|
|
— |
|
|
|
1,066 |
|
|
|
— |
|
|
|
— |
|
|
|
1,066 |
|
|
Equity options |
|
|
18 |
|
|
|
— |
|
|
|
— |
|
|
|
— |
|
|
|
18 |
|
|
Contingent consideration |
|
|
— |
|
|
|
— |
|
|
|
67,172 |
|
|
|
— |
|
|
|
67,172 |
|
|
Total |
|
$ |
27,566 |
|
|
$ |
5,173 |
|
|
$ |
70,219 |
|
|
$ |
(435 |
) |
|
$ |
102,523 |
|
|
|
|
Assets at Fair Value at December 31, 2016 |
|
|||||||||||||||||
|
|
|
Level 1 |
|
|
Level 2 |
|
|
Level 3 |
|
|
Netting and Collateral |
|
|
Total |
|
|||||
|
Loans held for sale, at fair value |
|
$ |
— |
|
|
$ |
1,071,836 |
|
|
$ |
— |
|
|
$ |
— |
|
|
$ |
1,071,836 |
|
|
Marketable securities |
|
|
164,820 |
|
|
|
— |
|
|
|
— |
|
|
|
— |
|
|
|
164,820 |
|
|
Government debt |
|
|
35,190 |
|
|
|
— |
|
|
|
— |
|
|
|
— |
|
|
|
35,190 |
|
|
Securities owned—Equities |
|
|
167 |
|
|
|
— |
|
|
|
— |
|
|
|
— |
|
|
|
167 |
|
|
Forwards |
|
|
— |
|
|
|
57 |
|
|
|
17,824 |
|
|
|
(22 |
) |
|
|
17,859 |
|
|
Foreign exchange swaps |
|
|
— |
|
|
|
3,441 |
|
|
|
— |
|
|
|
(495 |
) |
|
|
2,946 |
|
|
Rate lock commitments |
|
|
— |
|
|
|
— |
|
|
|
2,100 |
|
|
|
— |
|
|
|
2,100 |
|
|
Foreign exchange/commodities options |
|
|
244 |
|
|
|
— |
|
|
|
— |
|
|
|
— |
|
|
|
244 |
|
|
Interest rate swaps |
|
|
— |
|
|
|
202 |
|
|
|
— |
|
|
|
— |
|
|
|
202 |
|
|
Total |
|
$ |
200,421 |
|
|
$ |
1,075,536 |
|
|
$ |
19,924 |
|
|
$ |
(517 |
) |
|
$ |
1,295,364 |
|
|
|
|
Liabilities at Fair Value at December 31, 2016 |
|
|||||||||||||||||
|
|
|
Level 1 |
|
|
Level 2 |
|
|
Level 3 |
|
|
Netting and Collateral |
|
|
Total |
|
|||||
|
Rate lock commitments |
|
$ |
— |
|
|
$ |
— |
|
|
$ |
9,670 |
|
|
$ |
— |
|
|
$ |
9,670 |
|
|
Foreign exchange swaps |
|
|
— |
|
|
|
1,472 |
|
|
|
— |
|
|
|
(495 |
) |
|
|
977 |
|
|
Futures |
|
|
— |
|
|
|
512 |
|
|
|
— |
|
|
|
— |
|
|
|
512 |
|
|
Foreign exchange/commodities options |
|
|
41 |
|
|
|
— |
|
|
|
— |
|
|
|
— |
|
|
|
41 |
|
|
Forwards |
|
|
— |
|
|
|
58 |
|
|
|
— |
|
|
|
(22 |
) |
|
|
36 |
|
|
Contingent consideration |
|
|
— |
|
|
|
— |
|
|
|
65,838 |
|
|
|
— |
|
|
|
65,838 |
|
|
Total |
|
$ |
41 |
|
|
$ |
2,042 |
|
|
$ |
75,508 |
|
|
$ |
(517 |
) |
|
$ |
77,074 |
|
204
Level 3 Financial Assets and Liabilities
Changes in Level 3 rate lock commitments, forwards and contingent consideration measured at fair value on a recurring basis for the year ended December 31, 2017 were as follows (in thousands):
|
|
|
Opening Balance |
|
|
Total realized and unrealized gains (losses) included in Net income (loss) |
|
|
Unrealized gains (losses) included in Other comprehensive income (loss) |
|
|
Purchases/ Issuances |
|
|
Sales/ Settlements |
|
|
Closing Balance at December 31, 2017 |
|
|
Unrealized gains (losses) for Level 3 Assets / Liabilities Outstanding at December 31, 2017 |
|
|||||||
|
Assets |
|
|
|
|
|
|
|
|
|
|
|
|
|
|
|
|
|
|
|
|
|
|
|
|
|
|
|
|
|
Rate lock commitments and forwards, net |
|
$ |
10,254 |
|
|
$ |
3,629 |
|
|
$ |
— |
|
|
$ |
— |
|
|
$ |
(10,254 |
) |
|
$ |
3,629 |
|
|
$ |
3,629 |
|
|
Liabilities |
|
|
|
|
|
|
|
|
|
|
|
|
|
|
|
|
|
|
|
|
|
|
|
|
|
|
|
|
|
Contingent consideration1 |
|
$ |
65,838 |
|
|
$ |
(7,299 |
) |
|
$ |
(2,329 |
) |
|
$ |
10,616 |
|
|
$ |
(18,911 |
) |
|
$ |
67,172 |
|
|
$ |
(9,629 |
) |
|
1 |
Realized and unrealized gains (losses) included in Net income (loss) are reported in “Other expenses” and “Other income (loss),” as applicable, in the Company’s consolidated statements of operations. |
Changes in Level 3 rate lock commitments, forwards and contingent consideration measured at fair value on a recurring basis for the year ended December 31, 2016 were as follows (in thousands):
|
|
|
Opening Balance |
|
|
Total realized and unrealized gains (losses) included in Net income (loss) |
|
|
Unrealized gains (losses) included in Other comprehensive income (loss) |
|
|
Purchases/ Issuances |
|
|
Sales/ Settlements |
|
|
Closing Balance at December 31, 2016 |
|
|
Unrealized gains (losses) for Level 3 Assets / Liabilities Outstanding at December 31, 2016 |
|
|||||||
|
Assets |
|
|
|
|
|
|
|
|
|
|
|
|
|
|
|
|
|
|
|
|
|
|
|
|
|
|
|
|
|
Rate lock commitments and forwards, net |
|
$ |
6,300 |
|
|
$ |
10,254 |
|
|
$ |
— |
|
|
$ |
— |
|
|
$ |
(6,300 |
) |
|
$ |
10,254 |
|
|
$ |
10,254 |
|
|
Liabilities |
|
|
|
|
|
|
|
|
|
|
|
|
|
|
|
|
|
|
|
|
|
|
|
|
|
|
|
|
|
Contingent consideration1 |
|
$ |
75,061 |
|
|
$ |
13,379 |
|
|
$ |
361 |
|
|
$ |
23,573 |
|
|
$ |
(19,056 |
) |
|
$ |
65,838 |
|
|
$ |
(3,527 |
) |
|
1 |
Realized and unrealized gains (losses) included in Net income (loss) are reported in “Other expenses” and “Other income (loss),” as applicable, in the Company’s consolidated statements of operations. |
The following tables present information about the offsetting of derivative instruments and collateralized transactions as of December 31, 2017 and December 31, 2016 (in thousands):
|
|
|
December 31, 2017 |
|
|||||||||||||||||||||
|
|
|
|
|
|
|
|
|
|
|
Net Amounts |
|
|
Gross Amounts Not Offset |
|
|
|
|
|
||||||
|
|
|
Gross Amounts |
|
|
Gross Amounts Offset |
|
|
Presented in the Statements of Financial Condition |
|
|
Financial Instruments |
|
|
Cash Collateral Received |
|
|
Net Amount |
|
||||||
|
Assets |
|
|
|
|
|
|
|
|
|
|
|
|
|
|
|
|
|
|
|
|
|
|
|
|
|
Foreign exchange/commodities options |
|
$ |
31,834 |
|
|
$ |
— |
|
|
$ |
31,834 |
|
|
$ |
— |
|
|
$ |
— |
|
|
$ |
31,834 |
|
|
Forwards |
|
|
4,363 |
|
|
|
(101 |
) |
|
|
4,262 |
|
|
|
— |
|
|
|
— |
|
|
|
4,262 |
|
|
Rate lock commitments |
|
|
2,923 |
|
|
|
— |
|
|
|
2,923 |
|
|
|
— |
|
|
|
— |
|
|
|
2,923 |
|
|
Foreign exchange swaps |
|
|
1,135 |
|
|
|
(334 |
) |
|
|
801 |
|
|
|
— |
|
|
|
— |
|
|
|
801 |
|
|
Interest rate swaps |
|
|
242 |
|
|
|
— |
|
|
|
242 |
|
|
|
— |
|
|
|
— |
|
|
|
242 |
|
|
Futures |
|
|
25 |
|
|
|
— |
|
|
|
25 |
|
|
|
— |
|
|
|
— |
|
|
|
25 |
|
|
Total |
|
$ |
40,522 |
|
|
$ |
(435 |
) |
|
$ |
40,087 |
|
|
$ |
— |
|
|
$ |
— |
|
|
$ |
40,087 |
|
|
Liabilities |
|
|
|
|
|
|
|
|
|
|
|
|
|
|
|
|
|
|
|
|
|
|
|
|
|
Foreign exchange/commodities options |
|
$ |
27,548 |
|
|
$ |
— |
|
|
$ |
27,548 |
|
|
$ |
— |
|
|
$ |
— |
|
|
$ |
27,548 |
|
|
Foreign exchange swaps |
|
|
3,180 |
|
|
|
(334 |
) |
|
|
2,846 |
|
|
|
— |
|
|
|
— |
|
|
|
2,846 |
|
|
Rate lock commitments |
|
|
2,390 |
|
|
|
— |
|
|
|
2,390 |
|
|
|
— |
|
|
|
— |
|
|
|
2,390 |
|
|
Forwards |
|
|
1,584 |
|
|
|
(101 |
) |
|
|
1,483 |
|
|
|
— |
|
|
|
— |
|
|
|
1,483 |
|
|
Futures |
|
|
1,066 |
|
|
|
— |
|
|
|
1,066 |
|
|
|
|
|
|
|
|
|
|
|
1,066 |
|
|
Equity options |
|
|
18 |
|
|
|
— |
|
|
|
18 |
|
|
|
— |
|
|
|
— |
|
|
|
18 |
|
|
Total |
|
$ |
35,786 |
|
|
$ |
(435 |
) |
|
$ |
35,351 |
|
|
$ |
— |
|
|
$ |
— |
|
|
$ |
35,351 |
|
205
|
|
|
December 31, 2016 |
|
|||||||||||||||||||||
|
|
|
|
|
|
|
|
|
|
|
Net Amounts |
|
|
Gross Amounts Not Offset |
|
|
|
|
|
||||||
|
|
|
Gross Amounts |
|
|
Gross Amounts Offset |
|
|
Presented in the Statements of Financial Condition |
|
|
Financial Instruments |
|
|
Cash Collateral Received |
|
|
Net Amount |
|
||||||
|
Assets |
|
|
|
|
|
|
|
|
|
|
|
|
|
|
|
|
|
|
|
|
|
|
|
|
|
Forwards |
|
$ |
17,881 |
|
|
$ |
(22 |
) |
|
$ |
17,859 |
|
|
$ |
— |
|
|
$ |
— |
|
|
$ |
17,859 |
|
|
Foreign exchange swaps |
|
|
3,441 |
|
|
|
(495 |
) |
|
|
2,946 |
|
|
|
— |
|
|
|
— |
|
|
|
2,946 |
|
|
Rate lock commitments |
|
|
2,100 |
|
|
|
— |
|
|
|
2,100 |
|
|
|
— |
|
|
|
— |
|
|
|
2,100 |
|
|
Foreign exchange/commodities options |
|
|
244 |
|
|
|
— |
|
|
|
244 |
|
|
|
— |
|
|
|
— |
|
|
|
244 |
|
|
Interest rate swaps |
|
|
202 |
|
|
|
— |
|
|
|
202 |
|
|
|
— |
|
|
|
— |
|
|
|
202 |
|
|
Total |
|
$ |
23,868 |
|
|
$ |
(517 |
) |
|
$ |
23,351 |
|
|
$ |
— |
|
|
$ |
— |
|
|
$ |
23,351 |
|
|
Liabilities |
|
|
|
|
|
|
|
|
|
|
|
|
|
|
|
|
|
|
|
|
|
|
|
|
|
Rate lock commitments |
|
$ |
9,670 |
|
|
$ |
— |
|
|
$ |
9,670 |
|
|
$ |
— |
|
|
$ |
— |
|
|
$ |
9,670 |
|
|
Foreign exchange swaps |
|
|
1,472 |
|
|
|
(495 |
) |
|
|
977 |
|
|
|
— |
|
|
|
— |
|
|
|
977 |
|
|
Futures |
|
|
512 |
|
|
|
— |
|
|
|
512 |
|
|
|
— |
|
|
|
— |
|
|
|
512 |
|
|
Foreign exchange /commodities options |
|
|
41 |
|
|
|
— |
|
|
|
41 |
|
|
|
— |
|
|
|
— |
|
|
|
41 |
|
|
Forwards |
|
|
58 |
|
|
|
(22 |
) |
|
|
36 |
|
|
|
— |
|
|
|
— |
|
|
|
36 |
|
|
Total |
|
$ |
11,753 |
|
|
$ |
(517 |
) |
|
$ |
11,236 |
|
|
$ |
— |
|
|
$ |
— |
|
|
$ |
11,236 |
|
Certain of the Company’s foreign exchange swaps are with Cantor. See Note 18—“Related Party Transactions,” for additional information related to these transactions.
Quantitative Information About Level 3 Fair Value Measurements
The following tables present quantitative information about the significant unobservable inputs utilized by the Company in the fair value measurement of Level 3 financial assets and liabilities measured at fair value on a recurring basis (in thousands):
|
|
|
Fair Value as of December 31, 2017 |
|
|
|
|
|
|
|
|
|
|||||
|
|
|
Assets |
|
|
Liabilities |
|
|
Valuation Technique |
|
Unobservable Inputs |
|
Range |
|
Weighted Average |
||
|
Rate lock commitments |
|
$ |
2,923 |
|
|
$ |
2,390 |
|
|
Discounted cash flow model and other observable market data |
|
Counterparty credit risk |
|
N/A |
|
N/A |
|
Forwards |
|
$ |
3,753 |
|
|
$ |
657 |
|
|
Discounted cash flow model and other observable market data |
|
Counterparty credit risk |
|
N/A |
|
N/A |
|
Contingent consideration |
|
$ |
— |
|
|
$ |
67,172 |
|
|
Present value of expected payments |
|
Discount rate Probability of meeting earnout and contingencies |
|
3.3%-10.4% 75%-100% |
|
8.2% 97% (1) |
|
1 |
The probability of meeting the earnout targets as of December 31, 2017 was based on the acquired businesses’ projected future financial performance, including revenues. |
206
|
|
|
Fair Value as of December 31, 2016 |
|
|
|
|
|
|
|
|
|
|||||
|
|
|
Assets |
|
|
Liabilities |
|
|
Valuation Technique |
|
Unobservable Inputs |
|
Range |
|
Weighted Average |
||
|
Rate lock commitments |
|
$ |
2,100 |
|
|
$ |
9,670 |
|
|
Discounted cash flow model and other observable market data |
|
Counterparty credit risk |
|
N/A |
|
N/A |
|
Forwards |
|
$ |
17,824 |
|
|
$ |
— |
|
|
Discounted cash flow model and other observable market data |
|
Counterparty credit risk |
|
N/A |
|
N/A |
|
Contingent consideration |
|
$ |
— |
|
|
$ |
65,838 |
|
|
Present value of expected payments |
|
Discount rate Probability of meeting earnout and contingencies |
|
3.3%-9.6%
75%-100% |
|
6.5%
96% (1) |
|
1 |
The probability of meeting the earnout targets as of December 31, 2016 was based on the acquired businesses’ projected future financial performance, including revenues. |
Valuation Processes – Level 3 Measurements
Valuations for rate lock commitments, forwards, and contingent consideration are conducted by the Company. Each reporting period, the Company updates unobservable inputs. The Company has a formal process to review the material accuracy of changes in fair value.
Sensitivity Analysis – Level 3 Measurements
The significant unobservable input used in the fair value of the Company’s rate lock commitments and forwards is the counterparty credit risk. The significant unobservable inputs used in the fair value of the Company’s contingent consideration are the discount rate and forecasted financial information. Significant increases (decreases) in the discount rate would have resulted in a lower (higher) fair value measurement. Significant increases (decreases) in the forecasted financial information would have resulted in a higher (lower) fair value measurement. As of December 31, 2017 and December 31, 2016, the present value of expected payments related to the Company’s contingent consideration was $67.1 million and $65.8 million, respectively. The undiscounted value of the payments, assuming that all contingencies are met, would be $85.2 million and $81.3 million, respectively.
|
15. |
Credit Enhancement Receivable, Credit Enhancement Deposit, and Contingent Liability |
The Company is a party to a Credit Enhancement Agreement (“CEA”) dated March 9, 2012, with German American Capital Corporation and Deutsche Bank Americas Holding Corporation (together, “DB Entities”). On October 20, 2016, the DB Entities assigned the CEA to Deutsche Bank AG Cayman Island Branch, a Cayman Island Branch of Deutsche Bank AG (“DB Cayman”). Under the terms of these agreements, DB Cayman provides the Company with varying levels of ongoing credit protection, subject to certain limits, for Fannie Mae and Freddie Mac loans subject to loss sharing (see Note 26—“Financial Guarantee Liability”) in the Company’s servicing portfolio as of March 9, 2012. DB Cayman will also reimburse the Company for any losses incurred due to violation of underwriting and serving agreements that occurred prior to March 9, 2012. For the years ended December 31, 2017 and 2016, there were no reimbursements under this agreement. For the year ended December 31, 2015 there were two reimbursements under this agreement for $1.2 million.
Credit enhancement receivable
As of December 31, 2017, the Company had $18.8 billion of credit risk loans in its servicing portfolio with a maximum pre-credit enhancement loss exposure of $5.3 billion. The Company had a form of credit protection from DB Cayman on $4.2 billion of credit risk loans with a maximum loss exposure coverage of $1.2 billion. The amount of the maximum loss exposure without any form of credit protection from DB Cayman is $4.1 billion.
As of December 31, 2016, the Company had $16.9 billion of credit risk loans in its servicing portfolio with a maximum pre-credit enhancement loss exposure of $4.7 billion. The Company had a form of credit protection from DB Cayman on $5.5 billion of credit risk loans with a maximum loss exposure coverage of $1.6 billion. The amount of the maximum loss exposure without any form of credit protection from DB Cayman is $3.1 billion.
207
As of December 31, 2017 and December 31, 2016, the credit enhancement receivable was $10 thousand and $156 thousand, respectively, and is included as part of “Other assets” in the Company’s consolidated statements of financial condition.
Credit enhancement deposit
The CEA required the DB Entities to deposit $25 million into the Company’s Fannie Mae restricted liquidity account (see Note 29—“Regulatory Requirements” ), which the Company is required to return to DB Cayman, less any outstanding claims, on March 9, 2021. The $25 million deposit is included in “Cash segregated under regulatory requirements” and the offsetting liability in “Accounts payable, accrued and other liabilities” in the accompanying consolidated statements of financial condition.
Contingent liability
Under the CEA, the Company is required to pay DB Cayman on March 9, 2021, an amount equal to 50% of the positive difference, if any, between (a) $25 million, and (b) the Company’s unreimbursed loss sharing payments from March 9, 2012 through March 9, 2021 on the Company’s servicing portfolio as of March 9, 2012.
As of December 31, 2017 and December 31, 2016, the contingent liability was $10.7 million and $10.4 million, respectively, and is included as part of “Accounts payable, accrued and other liabilities” in the Company’s consolidated statements of financial condition.
|
16. |
Gains from Mortgage Banking Activities, Net |
Gains from mortgage banking activities, net consist of the following activity (in thousands):
|
|
|
Year Ended December 31, |
|
|||||||||
|
|
|
2017 |
|
|
2016 |
|
|
2015 |
|
|||
|
Loan origination related fees and sales premiums, net |
|
$ |
85,029 |
|
|
$ |
69,026 |
|
|
$ |
47,303 |
|
|
Fair value of expected net future cash flows from servicing recognized at commitment, net |
|
|
120,970 |
|
|
|
124,361 |
|
|
|
68,001 |
|
|
Gains from mortgage banking activities, net |
|
$ |
205,999 |
|
|
$ |
193,387 |
|
|
$ |
115,304 |
|
|
17. |
Mortgage Servicing Rights, Net |
The changes in the carrying amount of mortgage servicing rights for the Company for the years ended December 31, 2017, 2016, and 2015 were as follows (in thousands):
|
|
|
December 31, 2017 |
|
|
December 31, 2016 |
|
|
December 31, 2015 |
|
|||
|
Mortgage Servicing Rights |
|
|
|
|
|
|
|
|
|
|
|
|
|
Beginning Balance |
|
$ |
347,558 |
|
|
$ |
271,849 |
|
|
$ |
240,011 |
|
|
Additions |
|
|
123,902 |
|
|
|
126,547 |
|
|
|
71,873 |
|
|
Purchases from an affiliate |
|
|
2,055 |
|
|
|
3,905 |
|
|
|
9,259 |
|
|
Purchases from third parties |
|
|
— |
|
|
|
3,771 |
|
|
|
— |
|
|
Amortization |
|
|
(74,166 |
) |
|
|
(58,514 |
) |
|
|
(49,294 |
) |
|
Ending Balance |
|
$ |
399,349 |
|
|
$ |
347,558 |
|
|
$ |
271,849 |
|
|
Valuation Allowance |
|
|
|
|
|
|
|
|
|
|
|
|
|
Beginning Balance |
|
$ |
(7,742 |
) |
|
$ |
(7,936 |
) |
|
$ |
(2,657 |
) |
|
Decrease (increase) |
|
|
1,019 |
|
|
|
194 |
|
|
|
(5,279 |
) |
|
Ending Balance |
|
$ |
(6,723 |
) |
|
$ |
(7,742 |
) |
|
$ |
(7,936 |
) |
|
Net Balance |
|
$ |
392,626 |
|
|
$ |
339,816 |
|
|
$ |
263,913 |
|
On July 21, 2016, the Company purchased the mortgage servicing rights to a portfolio of FHA/GNMA construction loans from an unaffiliated third party for $3.8 million.
208
The amount of contractually specified servicing fees (including primary servicing fees and special servicing fees, in the case of loans that are in default) and ancillary fees (including yield maintenance fees) earned by the Company were as follows:
|
|
|
Year Ended December 31, |
|
|||||||||
|
|
|
2017 |
|
|
2016 |
|
|
2015 |
|
|||
|
Servicing fees |
|
$ |
95,373 |
|
|
$ |
78,527 |
|
|
$ |
66,211 |
|
|
Escrow interest and placement fees |
|
|
9,328 |
|
|
|
3,771 |
|
|
|
2,508 |
|
|
Ancillary fees |
|
|
5,740 |
|
|
|
5,373 |
|
|
|
5,637 |
|
|
Total Servicing fees |
|
$ |
110,441 |
|
|
$ |
87,671 |
|
|
$ |
74,356 |
|
The Company’s primary servicing portfolio as of December 31, 2017 and 2016 was approximately $54.2 billion and $50.6 billion, respectively. The Company’s special servicing portfolio as of December 31, 2017 and 2016 was $3.8 billion and $5.1 billion, respectively.
The estimated fair value of the Mortgage servicing rights, net as of December 31, 2017 and 2016 was $418.1 million and $344.9 million, respectively.
Fair values are estimated using a valuation model that calculates the present value of the future net servicing cash flows. The cash flows assumptions used are based on assumptions the Company believes market participants would use to value the portfolio. Significant assumptions include estimates of the cost of servicing per loan, discount rate, earnings rate on escrow deposits and prepayment speeds. An increase in discount rate of 100 bps or 200 bps would result in a decrease in fair value by $11.8 million and $23.0 million, respectively, as of December 31, 2017 and by $9.9 million and $19.3 million, respectively, as of December 31, 2016.
|
18. |
Related Party Transactions |
Service Agreements
Throughout Europe and Asia, the Company provides Cantor with administrative services, technology services and other support for which it charges Cantor based on the cost of providing such services plus a mark-up, generally 7.5%. In the U.K., the Company provides these services to Cantor through Tower Bridge International Services LP (“Tower Bridge”).. The Company owns 52% of Tower Bridge and consolidates it, and Cantor owns 48%. Cantor’s interest in Tower Bridge is reflected as a component of “Noncontrolling interest in subsidiaries” in the Company’s consolidated statements of financial condition, and the portion of Tower Bridge’s income attributable to Cantor is included as part of “Net income (loss) attributable to noncontrolling interest in subsidiaries” in the Company’s consolidated statements of operations. In the U.S., the Company provides Cantor with technology services for which it charges Cantor based on the cost of providing such services.
The administrative services agreement provides that direct costs incurred are charged back to the service recipient. Additionally, the service recipient generally indemnifies the service provider for liabilities that it incurs arising from the provision of services other than liabilities arising from fraud or willful misconduct of the service provider. In accordance with the administrative service agreement, the Company has not recognized any liabilities related to services provided to affiliates.
For the years ended December 31, 2017, 2016 and 2015, the Company recognized related party revenues of $28.5 million, $25.6 million and $26.8 million, respectively, for the services provided to Cantor, including fees related to the Special Asset Servicing Arrangement between Berkeley Point and CCRE. These revenues are included as part of “Fees from related parties” in the Company’s consolidated statements of operations.
In the U.S., Cantor and its affiliates provide the Company, including Newmark, with administrative services and other support for which Cantor charges the Company based on the cost of providing such services. In connection with the services Cantor provides, the Company and Cantor entered into an employee lease agreement whereby certain employees of Cantor are deemed leased employees of the Company. For the years ended December 31, 2017, 2016 and 2015, the Company was charged $64.3 million, $52.3 million and $44.8 million, respectively, for the services provided by Cantor and its affiliates, of which $35.3 million, $28.2 million and $25.6 million, respectively, were to cover compensation to leased employees for the years ended December 31, 2017, 2016 and 2015. The fees paid to Cantor for administrative and support services, other than those to cover the compensation costs of leased employees, are included as part of “Fees to related parties” in the Company’s consolidated statements of operations. The fees paid to Cantor to cover the compensation costs of leased employees are included as part of “Compensation and employee benefits” in the Company’s consolidated statements of operations.
209
For the years ended December 31, 2017, 2016 and 2015, Cantor’s share of the net profit in Tower Bridge was $0.5 million, $2.5 million and $2.0 million, respectively. Cantor’s noncontrolling interest is included as part of “Noncontrolling interest in subsidiaries” in the Company’s consolidated statements of financial condition.
Newmark IPO
On December 13, 2017, prior to the closing of the Newmark IPO, BGC, BGC Holdings, BGC U.S. OpCo, Newmark, Newmark Holdings, Newmark OpCo, Cantor, and BGC Global OpCo entered into the Separation and Distribution Agreement. The Separation and Distribution Agreement sets forth the agreements among BGC, Cantor, Newmark and their respective subsidiaries. For additional information, see Note 1— “Organization and Basis of Presentation.” In addition, in connection with the Separation and Newmark IPO, on December 13, 2017 a Registration Rights Agreement by and among Cantor, BGC and Newmark, an Amended and Restated Tax Receivable Agreement by and between Cantor and BGC, an Exchange Agreement by and among Cantor, BGC and Newmark (see “Other Agreements with Cantor” below), an Administrative Services Agreement by and between Cantor and Newmark (see “Service Agreements” above), and a Tax Receivable Agreement by and between Cantor and Newmark were entered into.
As a result of the Separation and Distribution Agreement, the limited partnership interests in Newmark Holdings were distributed to the holders of limited partnership interests in BGC Holdings, including Cantor, whereby each holder of BGC Holdings limited partnership interests at that time will hold a BGC Holdings limited partnership interest and a corresponding Newmark Holdings limited partnership interest, which is equal to a BGC Holdings limited partnership interest multiplied by the contribution ratio, divided by the exchange ratio. For additional information, see Note 2— “Limited Partnership Interests in BGC Holdings and Newmark Holdings.”
In addition, CF&Co, a wholly owned subsidiary of Cantor, was an underwriter of the Newmark IPO. Pursuant to the underwriting agreement, Newmark paid CF&Co 5.5% of the gross proceeds from the sale of shares of Newmark Class A common stock sold by Cantor in connection with the Newmark IPO.
CF Real Estate Finance Holdings, L.P.
Contemporaneously with the Berkeley Point Acquisition, on September 8, 2017, the Company invested $100.0 million in a newly formed commercial real estate-related financial and investment business, Real Estate LP, which is controlled and managed by Cantor. Real Estate LP may conduct activities in any real estate related business or asset backed securities-related business or any extensions thereof and ancillary activities thereto. As of December 31, 2017, the Company’s investment is accounted for under the equity method.
Lucera
On June 3, 2014, the Company’s Board of Directors and Audit Committee authorized the purchase of 1,000 Class B Units of Lucera, representing 10% of the issued and outstanding Class B Units of Lucera after giving effect to the transaction. On the same day, the Company completed the acquisition for $6.5 million and was granted an option to purchase an additional 1,000 Class B Units of Lucera for an additional $6.5 million. On January 15, 2016, the Company closed on the exercise of its option to acquire additional Class B Units of Lucera. At the closing, the Company made a payment of $6.5 million to Lucera. As a result of the option exercise, the Company had a 20% ownership interest in Lucera.
On October 25, 2016, the Company’s Board of Directors and Audit Committee authorized the purchase of 9,000 Class B Units of Lucera, representing all of the issued and outstanding Class B Units of Lucera not already owned by the Company. On November 4, 2016, the Company completed this transaction. As a result of this transaction, the Company owns 100% of the ownership interests in Lucera.
In the purchase agreement, Cantor agreed, subject to certain exceptions, not to solicit certain senior executives of Lucera’s business and was granted the right to be a customer of Lucera’s businesses on the best terms made available to any other customer. The aggregate purchase price paid by the Company to Cantor consisted of approximately $24.2 million in cash plus a $4.8 million post-closing adjustment determined after closing based on netting Lucera’s expenses paid by Cantor after May 1, 2016 against accounts receivable owed to Lucera by Cantor for access to Lucera’s business from May 1, 2016 through the closing date. The Company previously had a 20% ownership interest in Lucera and accounted for its investment using the equity method. The purchase has been accounted for as a transaction between entities under common control.
During the years ended December 31, 2017, 2016 and 2015, respectively, Lucera had $1.2 million, $2.9 million and $2.5 million in related party revenues from Cantor. These revenues are included in “Data, software and post-trade” in the Company’s consolidated statements of operations. Also during the year ended December 31, 2016, Cantor made capital contributions to Lucera of $15.0 million. Cantor made no capital contributions to Lucera during the years ended December 31, 2017 and 2015.
210
Clearing Agreement with Cantor
The Company receives certain clearing services from Cantor pursuant to its clearing agreement. These clearing services are provided in exchange for payment by the Company of third-party clearing costs and allocated costs. The costs associated with these payments are included as part of “Fees to related parties” in the Company’s consolidated statements of operations. The costs for these services for the year ended December 31, 2017 are included as part of the charges to BGC for services provided by Cantor and its affiliates as discussed in “Service Agreements” above.
Other Agreements with Cantor
The Company is authorized to enter into short-term arrangements with Cantor to cover any failed U.S. Treasury securities transactions and to share equally in any net income resulting from such transactions, as well as any similar clearing and settlement issues. As of December 31, 2017 and 2016, the Company had not entered into any arrangements to cover any failed U.S. Treasury transactions.
To more effectively manage the Company’s exposure to changes in foreign exchange rates, the Company and Cantor have agreed to jointly manage the exposure. As a result, the Company is authorized to divide the quarterly allocation of any profit or loss relating to foreign exchange currency hedging between Cantor and the Company. The amount allocated to each party is based on the total net exposure for the Company and Cantor. The ratio of gross exposures of Cantor and the Company is utilized to determine the shares of profit or loss allocated to each for the period. During the years ended December 31, 2017, 2016 and 2015, the Company recognized its share of foreign exchange losses of $2.3 million, losses of $4.2 million and gains of $0.5 million, respectively. These gains and losses are included as part of “Other expenses” in the Company’s consolidated statements of operations.
Pursuant to the separation agreement relating to the Company’s acquisition of certain BGC businesses from Cantor in 2008, Cantor has a right, subject to certain conditions, to be the Company’s customer and to pay the lowest commissions paid by any other customer, whether by volume, dollar or other applicable measure. In addition, Cantor has an unlimited right to internally use market data from the Company without any cost. Any future related-party transactions or arrangements between the Company and Cantor are subject to the prior approval by the Company’s Audit Committee. During the years ended December 31, 2017, 2016 and 2015, the Company recorded revenues from Cantor entities of $0.3 million, $0.1 million and $0.3 million, respectively, related to commissions paid to the Company by Cantor. These revenues are included as part of “Commissions” in the Company’s consolidated statements of operations.
The Company and Cantor are authorized to utilize each other’s brokers to provide brokerage services for securities not brokered by such entity, so long as, unless otherwise agreed, such brokerage services were provided in the ordinary course and on terms no less favorable to the receiving party than such services are provided to typical third-party customers.
In August 2013, the Audit Committee authorized the Company to invest up to $350 million in an asset-backed commercial paper program for which certain Cantor entities serve as placement agent and referral agent. The program issues short-term notes to money market investors and is expected to be used by the Company from time to time as a liquidity management vehicle. The notes are backed by assets of highly rated banks. The Company is entitled to invest in the program so long as the program meets investment policy guidelines, including policies related to ratings. Cantor will earn a spread between the rate it receives from the short-term note issuer and the rate it pays to the Company on any investments in this program. This spread will be no greater than the spread earned by Cantor for placement of any other commercial paper note in the program. As of December 31, 2017 and December 31, 2016, the Company did not have any investments in the program.
On June 5, 2015, the Company entered into an agreement with Cantor providing Cantor, CF Group Management, Inc. (“CFGM”) and other Cantor affiliates entitled to hold BGC Class B common stock the right to exchange from time to time, on a one-to-one basis, subject to adjustment, up to an aggregate of 34,649,693 shares of BGC Class A common stock now owned or subsequently acquired by such Cantor entities for up to an aggregate of 34,649,693 shares of BGC Class B common stock. Such shares of BGC Class B common stock, which currently can be acquired upon the exchange of exchangeable limited partnership units owned in BGC Holdings and Newmark Holdings (as a result of the Newmark IPO and the Separation and Distribution Agreement), are already included in the Company’s fully diluted share count and will not increase Cantor’s current maximum potential voting power in the common equity. The exchange agreement will enable the Cantor entities to acquire the same number of shares of Class B common stock that they are already entitled to acquire without having to exchange its exchangeable limited partnership units in BGC Holdings and Newmark Holdings. The Company’s Audit Committee and full Board of Directors determined that it was in the best interests of the Company and its stockholders to approve the exchange agreement because it will help ensure that Cantor retains its exchangeable limited partnership units in BGC Holdings and Newmark Holdings, which is the same partnership in which the Company’s partner employees participate, thus continuing to align the interests of Cantor with those of the partner employees.
211
Under the exchange agreement, Cantor and CFGM have the right to exchange 14,676,499 shares of BGC Class A common stock owned by them as of December 31, 2017 (including the remaining shares of BGC Class A common stock held by Cantor from the exchange of convertible notes for 24,042,599 shares of BGC Class A common stock on April 13, 2015) for the same number of shares of BGC Class B common stock. Cantor would also have the right to exchange any shares of BGC Class A common stock subsequently acquired by it for shares of BGC Class B common stock, up to 34,649,693 shares of BGC Class B common stock.
The Company and Cantor have agreed that any shares of BGC Class B common stock issued in connection with the exchange agreement would be deducted from the aggregate number of shares of BGC Class B common stock that may be issued to the Cantor entities upon exchange of exchangeable limited partnership units in BGC Holdings and Newmark Holdings. Accordingly, the Cantor entities will not be entitled to receive any more shares of BGC Class B common stock under this agreement than they were previously eligible to receive upon exchange of exchangeable limited partnership units.
In relation to the Newmark IPO, on December 13, 2017, Newmark entered into a similar exchange agreement with Cantor, CFGM, BGC and other Cantor affiliates entitled to hold Class B common stock, providing the right to exchange from time to time shares of Class A common stock of Newmark now owned or hereafter acquired, as applicable, on a one-for-one basis for shares of Class B common stock, up to the number of shares of Newmark Class B common stock that are authorized but unissued under Newmark’s certificate of incorporation. The Newmark Audit Committee and Board of Directors have determined that the exchange agreement is in the best interests of Newmark and its stockholders because, among other things, it will help ensure that Cantor retains its exchangeable limited partnership units in Newmark Holdings, which is the same partnership in which Newmark’s partner employees participate, thus continuing to align the interests of Cantor with those of the partner employees.
On June 23, 2015, the Audit Committee of the Company authorized management to enter into a revolving credit facility with Cantor of up to $150 million in aggregate principal amount pursuant to which Cantor or BGC would be entitled to borrow funds from each other from time to time. The outstanding balances would bear interest at the higher of the borrower’s or the lender’s short-term borrowing rate then in effect, plus 1%. On October 1, 2015, the Company borrowed $100.0 million under this facility (the “Cantor Loan”). The Company did not have any interest expense related to the Cantor Loan for the year ended December 31, 2016. The Company recorded interest expense related to the Cantor Loan of $0.8 million for the year ended December 31, 2015. The Cantor Loan was repaid on December 31, 2015. As of December 31, 2017, there were no borrowings outstanding under this facility.
On April 21, 2017, pursuant to the authorization, the Company entered into a $150.0 million revolving credit facility (the “Credit Facility”) with an affiliate of Cantor. BGC agreed to lend $150.0 million under the Credit Facility to such affiliate (the “Loan”). On September 8, 2017, the outstanding balance of $150.0 million was repaid in its entirety. As of December 31, 2017, there were no borrowings outstanding under the facility. The Credit Facility has a maturity date of April 20, 2018, which may be extended from time to time on the terms set forth in the Credit Facility. The Company recorded interest income related to the Loan of $2.6 million for year ended December 31, 2017.
As part of the Company’s cash management process, the Company may enter into tri-party reverse repurchase agreements and other short-term investments, some of which may be with Cantor. As of December 31, 2017, the Company had no reverse repurchase agreements. As of December 31, 2016, Cantor facilitated reverse repurchase agreements on the Company’s behalf, and consequently the Company had $54.7 million of reverse repurchase agreements outstanding with Cantor.
On February 9, 2016, the Audit Committee of the Board of Directors authorized the Company to enter into an arrangement with Cantor in which the Company would provide dedicated development services to Cantor at a cost to the Company not to exceed $1.4 million per year for the purpose of Cantor developing the capacity to provide quotations in certain securities from time to time. The services are terminable by either party at any time and will be provided on the terms and conditions set forth in the existing Administrative Services Agreement. The Company did not provide any development services to Cantor in the year ended December 31, 2017 under this arrangement. The cost of development services provided to Cantor for the year ended December 31, 2016 was approximately $1.2 million.
In July 2016, the Audit Committee of the Company authorized the Company to provide real estate and related services, including real estate advice, brokerage, property or facilities management, appraisals and valuations and other services, to Cantor on rates and terms no less favorable to the Company than those charged to third-party customers. The Company and Cantor expect to enter into these arrangements from time to time. The Company did not provide any such real estate and related services in the years ended December 31, 2017 and 2016.
Receivables from and Payables to Related Broker-Dealers
Amounts due to or from Cantor and Freedom International Brokerage, one of the Company’s equity method investments, are for transactional revenues under a technology and services agreement with Freedom International Brokerage as well as for open derivative contracts. These are included as part of “Receivables from broker-dealers, clearing organizations, customers and related
212
broker-dealers” or “Payables to broker-dealers, clearing organizations, customers and related broker-dealers” in the Company’s consolidated statements of financial condition. As of December 31, 2017 and December 31, 2016, the Company had receivables from Freedom International Brokerage of $1.3 million, respectively. As of December 31, 2017 and December 31, 2016, the Company had $0.8 million and $3.0 million, respectively, in receivables from Cantor related to open derivative contracts. As of December 31, 2017 and December 31, 2016, the Company had $2.8 million and $1.0 million, respectively, in payables to Cantor related to open derivative contracts. As of December 31, 2017, the Company had $0.5 million in receivables from Cantor related to fails and equity trades pending settlement. As of December 31, 2016, the Company did not have any payables to Cantor related to fails and pending trades.
Loans, Forgivable Loans and Other Receivables from Employees and Partners, Net
The Company has entered into various agreements with certain employees and partners whereby these individuals receive loans which may be either wholly or in part repaid from the distribution earnings that the individuals receive on some or all of their limited partnership interests or may be forgiven over a period of time. The forgivable portion of these loans is recognized as compensation expense over the life of the loan. From time to time, the Company may also enter into agreements with employees and partners to grant bonus and salary advances or other types of loans. These advances and loans are repayable in the timeframes outlined in the underlying agreements.
As of December 31, 2017 and December 31, 2016, the aggregate balance of employee loans, net, was $335.7 million and $269.8 million, respectively, and is included as “Loans, forgivable loans and other receivables from employees and partners, net” in the Company’s consolidated statements of financial condition. Compensation expense for the above-mentioned employee loans for the years ended December 31, 2017, 2016 and 2015 was $61.4 million, $57.4 million and $87.2 million, respectively. The compensation expense related to these employee loans is included as part of “Compensation and employee benefits” in the Company’s consolidated statements of operations.
Interest income on the above-mentioned employee loans for the years ended December 31, 2017, 2016 and 2015 was $6.5 million, $5.8 million and $3.9 million, respectively. The interest income related to these employee loans is included as part of “Interest income” in the Company’s consolidated statements of operations.
8.75% Convertible Notes
On April 13, 2015, the Company’s 8.75% Convertible Senior Notes (the “8.75% Convertible Notes”), due April 15, 2015, were fully converted into 24,042,599 shares of the Company’s Class A common stock, par value $0.01 per share, and the shares were issued to Cantor as settlement of the notes. The Company recorded interest expense related to the 8.75% Convertible Notes of $3.8 million for the year ended December 31, 2015, respectively. See Note 22—“Long-term Debt, Collateralized and Short-Term Borrowings,” for more information. On June 15, 2015, the Company filed a resale registration statement on Form S-3 pursuant to which 24,042,599 shares of Class A common stock may be sold from time to time by Cantor or by certain of its pledgees, donees, distributees, counterparties, transferees or other successors in interest of the shares, including banks or other financial institutions which may enter into stock pledge, stock loan or other financing transactions with Cantor or its affiliates, as well as by their respective pledgees, donees, distributees, counterparties, transferees or other successors in interest.
Share Repurchases from Cantor
On February 23, 2016, the Company purchased from Cantor 5,000,000 shares of the Company’s Class A common stock at a price of $8.72 per share, the closing price on the date of the transaction. This transaction was included in the Company’s stock repurchase authorization and was approved by the Audit Committee of the Board of Directors.
Controlled Equity Offerings and Other Transactions with CF&Co
As discussed in Note 7—“Stock Transactions and Unit Redemptions,” the Company has entered into the November 2014 Sales Agreement and the April 2017 Sales Agreement with CF&Co, as the Company’s sales agent. During the year ended December 31, 2017, the Company sold 6.0 million shares under its November 2014 Sales Agreement with CF&Co for aggregate proceeds of $71.5 million, at a weighted-average price of $12.01 per share. During the year ended December 31, 2016, the Company sold 7.6 million shares under its November 2014 Sales Agreement with CF&Co for aggregate proceeds of $70.4 million, at a weighted-average price of $9.28 per share. For the years ended December 31, 2017, 2016 and 2015, the Company was charged approximately $1.4 million, $1.4 million and $1.2 million, respectively, for services provided by CF&Co related to the Company’s November 2014 Sales Agreement with CF&Co. During the year ended December 31, 2017, the Company sold 2.8 million shares under its April 2017 Sales Agreement with CF&Co for aggregate proceeds of $42.8 million, at a weighted-average price of $15.42 per share. For the year ended December 31, 2017, the Company was charged approximately $0.9 million for services provided by CF&Co related to the Company’s April 2017 Sales Agreement. These expenses are included as part of “Professional and consulting fees” in the Company’s consolidated statements of operations.
213
The Company has engaged CF&Co and its affiliates to act as financial advisor in connection with one or more third-party business combination transactions as requested by the Company on behalf of its affiliates from time to time on specified terms, conditions and fees. The Company may pay finders’, investment banking or financial advisory fees to broker-dealers, including, but not limited to, CF&Co and its affiliates, from time to time in connection with certain business combination transactions, and, in some cases, the Company may issue shares of the Company’s Class A common stock in full or partial payment of such fees.
On October 3, 2014, management was granted approval by the Company’s Board of Directors and Audit Committee to enter into stock loan transactions with CF&Co utilizing shares of Nasdaq stock or other equities. Such stock loan transactions will bear market terms and rates. As of December 31, 2017, the Company had Securities loaned transactions of $202.3 million with Cantor. The market value of the securities lent was $204.1 million (see Note 9—“Collateralized Transactions”). As of December 31, 2017, the cash collateral received from CF&Co bore interest rates ranging from 1.9% to 4.3%. As of December 31, 2016, the Company had no Securities loaned transactions with CF&Co. Securities loaned transactions are included in “Securities loaned” in the Company’s consolidated statements of financial condition.
On February 26, 2015, the Company completed the tender offer for GFI shares. In connection with the acquisition of GFI, during the year ended December 31, 2015, the Company recorded advisory fees of $7.1 million payable to CF&Co. These fees were included in “Professional and Consulting Fees” in the Company’s consolidated statements of operations.
On May 7, 2015, GFI retained CF&Co to assist it in the sale of Trayport. During the year ended December 31, 2015, the Company recorded advisory fees of $5.1 million payable to CF&Co in connection with the sale of Trayport. These fees were netted against the gain on sale in “Gain (loss) on divestures and sale of investments” in the Company’s consolidated statements of operations.
On May 27, 2016, the Company issued an aggregate of $300.0 million principal amount of 5.125% Senior Notes due 2021 (the “5.125% Senior Notes”). In connection with this issuance of 5.125% Senior Notes, the Company recorded approximately $0.5 million in underwriting fees payable to CF&Co and $18 thousand to CastleOak Securities, L.P. These fees were recorded as a deduction from the carrying amount of the debt liability, which is amortized as interest expense over the term of the notes. Cantor, purchased $15.0 million of such senior notes and still holds such notes as of December 31, 2017.
Under rules adopted by the Commodity Futures Trading Commission (the “CFTC”), all foreign introducing brokers engaging in transactions with U.S. persons are required to register with the National Futures Association and either meet financial reporting and net capital requirements on an individual basis or obtain a guarantee agreement from a registered Futures Commission Merchant. From time to time, the Company’s foreign-based brokers engage in interest rate swap transactions with U.S.-based counterparties, and therefore the Company is subject to the CFTC requirements. CF&Co has entered into guarantees on behalf of the Company, and the Company is required to indemnify CF&Co for the amounts, if any, paid by CF&Co on behalf of the Company pursuant to this arrangement. During the years ended December 31, 2017, 2016 and 2015, the Company recorded fees of $0.1 million, $0.1 million and $0.2 million with respect to these guarantees. These fees were included in “Fees to related parties” in the Company’s consolidated statements of operations.
Transactions with Cantor Commercial Real Estate Company, L.P.
On October 29, 2013, the Audit Committee of the Board of Directors authorized the Company to enter into agreements from time to time with Cantor and/or its affiliates, including Cantor Commercial Real Estate Company, L.P. (“CCRE”), to provide services, including finding and reviewing suitable acquisition or partner candidates, structuring transactions, negotiating and due diligence services, in connection with the Company’s acquisition and other business strategies in commercial real estate and other businesses. Such services are provided at fees not to exceed the fully-allocated cost of such services, plus 10%. In connection with this agreement, the Company did not recognize any expense for the years ended December 31, 2017, 2016 and 2015.
The Company also has a referral agreement in place with CCRE, in which the Company’s brokers are incentivized to refer business to CCRE through a revenue-share agreement. In connection with this revenue-share agreement, the Company recognized revenues of $0.1 million, $1.1 million and $0.3 million for the years ended December 31, 2017, 2016 and 2015, respectively. This revenue was recorded as part of “Commissions” in the Company’s consolidated statements of operations.
The Company also has a revenue-share agreement with CCRE, in which the Company pays CCRE for referrals for leasing or other services. In connection with this agreement, the Company paid $0.4 million and $0.1 million to CCRE for the years ended December 31, 2016 and 2015, respectively. The Company did not make any payments under this agreement to CCRE for the year ended December 31, 2017.
In addition, the Company has a loan referral agreement in place with CCRE, in which either party can refer a loan to the other. Revenue from these referrals was $2.1 million, $7.5 million, and $5.7 million for the years ended December 31, 2017, 2016, and 2015, respectively, and was recognized in Gains from mortgage banking activities, net in our consolidated statements of operations. These referrals fees are net of the broker fees and commissions to CCRE of $0.8 million, $1.6 million, and $0.8 million for the years ended December 31, 2017, 2016, and 2015, respectively.
214
On September 8, 2017, the Company completed the Berkeley Point Acquisition, for an acquisition price of $875.0 million, with $3.2 million of the acquisition price paid in units of BGC Holdings, pursuant to a Transaction Agreement, dated as of July 17, 2017, with Cantor and certain of Cantor’s affiliates, including CCRE and Cantor Commercial Real Estate Sponsor, L.P., the general partner of CCRE. In accordance with this Transaction Agreement, Berkeley Point made a distribution of $89.1 million to CCRE related to the Berkeley Point Acquisition, for the amount that Berkeley Point’s net assets, inclusive of certain fair value adjustments, exceeded $508.6 million.
On March 11, 2015, the Company and CCRE entered into a note receivable/payable that allows for advances to or from CCRE at an interest rate of 1 month LIBOR plus 1.0%. On September 8, 2017 the note receivable/payable was terminated and all outstanding advances due were paid off. As of December 31, 2016, there was $690.0 million of outstanding advances due to CCRE on the note, and this balance is included in Notes payable to related parties in our consolidated statements of financial condition. The Company recognized interest income of $0.7 million, $0.1 million and $0.1 million for the years ended December 31, 2017, 2016 and 2015, respectively, and interest expense of $2.5 million, $2.3 million and $0.2 million for the years ended December 31, 2017, 2016 and 2015, respectively.
For the year ended December 31, 2017, the Company purchased the primary servicing rights for $1.2 billion of loans originated by CCRE for $2.1 million. For the year ended December 31, 2016, the Company purchased the primary servicing rights for $2.9 billion of loans originated by CCRE for $3.9 million. For the year ended December 31, 2015, the Company purchased primary servicing rights for $8.3 billion of loans originated by CCRE for $9.2 million. The Company also services loans for CCRE on a “fee for service” basis, generally prior to a loan’s sale or securitization, and for which no mortgage servicing right is recognized. Servicing revenue (excludes interest and placement fees) from loans purchased from CCRE or on a “fee for service” basis for the years ended December 31, 2017, 2016, and 2015 was $3.8 million, $3.6 million, and $2.7 million, respectively, and was recognized in Servicing fees in our consolidated statements of operations.
For information with respect to the Company’s $100 million investment in a newly formed joint venture with Cantor, see “CF Real Estate Finance Holdings, L.P.” above.
Cantor Rights to Purchase Limited Partnership Interests from BGC Holdings and Newmark Holdings
Cantor has the right to purchase limited partnership interests (Cantor units) from BGC Holdings and Newmark Holdings upon redemption of non-exchangeable FPUs redeemed by BGC Holdings and Newmark Holdings upon termination or bankruptcy of the founding/working partner. In addition, pursuant to Article Eight, Section 8.08, of the Second Amended and Restated BGC Holdings Limited Partnership Agreement (previously the “Sixth Amendment”) and Article Eight, Section 8.08, of the Amended and Restated Newmark Holdings Limited Partnership Agreement, where either current, terminating, or terminated partners are permitted by the Company to exchange any portion of their FPUs and Cantor consents to such exchangeability, the Company shall offer to Cantor the opportunity for Cantor to purchase the same number of new exchangeable limited partnership interests (Cantor units) in BGC Holdings and Newmark Holdings at the price that Cantor would have paid for the FPUs had the Company redeemed them. Any such Cantor units purchased by Cantor are currently exchangeable for up to 34,649,693 shares of BGC Class B common stock or, at Cantor’s election or if there are no such additional shares of BGC Class B common stock, shares of BGC Class A common stock, in each case on a one-for-one basis (subject to customary anti-dilution adjustments).
On November 4, 2015, the Company issued exchange rights with respect to, and Cantor purchased, in transactions exempt from registration pursuant to Section 4(a)(2) of the Securities Act, an aggregate of 1,775,481 exchangeable limited partnership units in BGC Holdings, as follows: In connection with the redemption by BGC Holdings of an aggregate of 588,356 non-exchangeable founding partner units from founding partners of BGC Holdings for an aggregate consideration of $2,296,801, Cantor purchased 554,196 exchangeable limited partnership units from BGC Holdings for an aggregate of $2,115,306 (after offset of a founding partner’s $46,289 debt due to Cantor). In addition, pursuant to the Sixth Amendment, on November 4, 2015, Cantor purchased 1,221,285 exchangeable limited partnership units from BGC Holdings for an aggregate consideration of $4,457,436 in connection with the grant of exchangeability and exchange of 1,221,285 founding partner units. As a result of the Newmark IPO and the related Separation and Distribution Agreement, the aggregate exchangeable limited partnership units represent 1,775,481 and 807,037 exchangeable limited partnership units in BGC Holdings and Newmark Holdings, respectively. Each exchangeable limited partnership unit in BGC Holdings and a corresponding exchangeable limited partnership unit in Newmark Holdings, equal to an exchangeable limited partnership unit in BGC Holdings multiplied by the contribution ratio and divided by the exchange ratio, held by Cantor are exchangeable by Cantor at any time on a one-for-one basis (subject to adjustment) for shares of BGC Class A common stock of the Company.
On November 7, 2016, the Company issued exchange rights with respect to, and Cantor purchased, in transactions exempt from registration pursuant to Section 4(a)(2) of the Securities Act, an aggregate of 624,762 exchangeable limited partnership units in BGC Holdings, as follows: In connection with the redemption by BGC Holdings of an aggregate of 141,523 non-exchangeable founding partner units from founding partners of BGC Holdings for an aggregate consideration of $560,190, Cantor purchased
215
141,523 exchangeable limited partnership units from BGC Holdings for an aggregate of $560,190. In addition, pursuant to the Sixth Amendment, on November 7, 2016, Cantor purchased 483,239 exchangeable limited partnership units from BGC Holdings for an aggregate consideration of $1,796,367 in connection with the grant of exchangeability and exchange for 483,239 founding partner units. As a result of the Newmark IPO and the related Separation and Distribution Agreement, the aggregate exchangeable limited partnership units represent 624,762 and 283,983 exchangeable limited partnership units in BGC Holdings and Newmark Holdings, respectively.
On November 7, 2017, the Company issued exchange rights with respect to, and Cantor purchased, in transactions exempt from registration pursuant to Section 4(a)(2) of the Securities Act, an aggregate of 1,179,788 exchangeable limited partnership units in BGC Holdings, as follows: In connection with the redemption by BGC Holdings of an aggregate of 823,178 non-exchangeable founding partner units from founding partners of BGC Holdings for an aggregate consideration of $2,828,629, Cantor purchased 823,178 exchangeable limited partnership units from BGC Holdings for an aggregate of $2,828,629. In addition, pursuant to the Sixth Amendment, on November 7, 2017, Cantor purchased 356,610 exchangeable limited partnership units from BGC Holdings for an aggregate consideration of $1,091,175 in connection with the grant of exchangeability and exchange for 356,610 founding partner units. As a result of the Newmark IPO and the related Separation and Distribution Agreement, the aggregate exchangeable limited partnership units represent 1,179,788 and 536,267 exchangeable limited partnership units in BGC Holdings and Newmark Holdings, respectively.
As of December 31, 2017, there were 418,606 FPUs in BGC Holdings and 190,275 FPUs in Newmark Holdings remaining, which the partnerships had the right to redeem or exchange and with respect to which Cantor had the right to purchase an equivalent number of Cantor units.
Transactions with Executive Officers and Directors
On May 9, 2014, partners of BGC Holdings approved the Tenth Amendment to the Agreement of Limited Partnership of BGC Holdings (the “Tenth Amendment”) effective as of May 9, 2014. In order to facilitate partner compensation and for other corporate purposes, the Tenth Amendment created a new class of partnership units (“NPSUs”).
On December 14, 2016, the Company entered into the Twelfth Amendment to the Agreement of Limited Partnership of the Partnership, effective as of October 1, 2016 (the “Twelfth Amendment”), which was entered into to amend certain terms and conditions of the Partnership’s N Units in order to provide flexibility to the Company and the Partnership in using such N Units in connection with compensation arrangements and practices. The Twelfth Amendment provides for a minimum $5 million gross revenue requirement in a given quarter as a condition for an N Unit to be replaced by another type of Partnership unit in accordance with the Partnership Agreement and the grant documentation. The Twelfth Amendment was approved by the Audit Committee of the Board of Directors of the Company.
NPSUs granted to Executive Officers are not entitled to participate in partnership distributions, will not be allocated any items of profit or loss, may not be made exchangeable into shares of the Company’s Class A common stock and will not be included in the fully diluted share count. Subject to the approval of the Compensation Committee or its designee, such N Units may be converted into the underlying unit type (i.e. an NREU will be converted into an REU) and will then participate in partnership distributions, subject to terms and conditions determined by the general partner of BGC Holdings in its sole discretion, including that the recipient continue to provide substantial services to the Company and comply with his or her partnership obligations. The Tenth Amendment was approved by the Audit Committee of the Board of Directors and by the full Board of Directors.
On January 1, 2015, (i) 1,000,000 of Mr. Lutnick’s NPSUs converted into 550,000 PSUs and 450,000 PPSUs, with respect to which Mr. Lutnick was offered the right to exchange 239,739 PSUs and 196,150 PPSUs for shares and cash, which he waived at that time under the Company’s policy, and (ii) 142,857 of Mr. Merkel’s NPSUs converted into 78,571 PSUs and 64,286 PPSUs, of which 5,607 PSUs and 4,588 PPSUs were made exchangeable and repurchased by the Company at the average price of shares of Class A common stock sold under the Company’s controlled equity offering less 2%, or $91,558.
On January 30, 2015, the Compensation Committee granted 4,000,000 NPSUs to Mr. Lutnick and 1,000,000 NPSUs to Mr. Lynn. These awards convert 25% per year on January 1 of each year beginning January 1, 2016 such that 1,000,000 of Mr. Lutnick’s NPSUs and 250,000 of Mr. Lynn’s NPSUs may be converted into an equivalent number of non-exchangeable PSUs/PPSUs for Mr. Lutnick and non-exchangeable LPUs/PLPUs for Mr. Lynn on each conversion date, subject to the approval of the Compensation Committee for all such conversions beginning in 2016. The grant of exchange rights with respect to such PSUs/PPSUs and LPUs/PLPUs will be determined in accordance with the Company’s practices when determining discretionary bonuses or awards, and any grants of exchangeability shall be subject to the approval of the Compensation Committee. Upon the signing of any agreement that would result in a “Change in Control” (as defined in the Amended and Restated Change in Control Agreement entered into by Mr. Lutnick and the applicable Deed of Adherence entered into by Mr. Lynn), (1) any unvested NPSUs held by Mr. Lutnick or Mr. Lynn shall convert in full and automatically be converted into exchangeable PSUs/PPSUs or LPUs/PLPUs (i.e., such PSUs and
216
LPUs shall be exchangeable for shares of Class A common stock and PPSUs and PLPUs shall be exchangeable for cash), and (2) any non-exchangeable PSUs/PPSUs held by Mr. Lutnick and non-exchangeable LPUs/PLPUs held by Mr. Lynn shall become immediately exchangeable, which exchangeability may be exercised in connection with such “Change in Control,” except that, with respect to (1) and (2), 9.75% of Mr. Lynn’s LPUs/PLPUs shall be deemed to be redeemed for zero in proportion to such exchanges of LPUs/PLPUs in accordance with the customary LPU/PLPU structure.
On January 30, 2015, the Compensation Committee approved the acceleration of the lapse of restrictions on transferability with respect to an aggregate of 598,904 shares of restricted stock held by the Company’s executive officers as follows: Mr. Lynn, 455,733 shares; Mr. Merkel, 16,354 shares; Mr. Windeatt, 95,148 shares; and Mr. Sadler, 31,669 shares. On January 30, 2015, these executives sold these shares to the Company at $7.83 per share. In connection with such sales, an aggregate of 87,410 of LPUs were redeemed for zero as follows: Mr. Lynn, 68,381 units; Mr. Windeatt, 14,277 units; and Mr. Sadler 4,752 units.
On July 27, 2015, the Compensation Committee granted exchange rights with respect to 8,536 PSUs and 6,983 PPSUs that were issued pursuant to converted NPSUs that were awarded to Mr. Merkel in May 2014. On October 29, 2015, the Company repurchased (i) the 8,536 PSUs at a price of $8.34 per share, the closing price of the Class A common stock on the date the Compensation Committee approved the transaction, and (ii) the 6,983 PPSUs at a price of $9.15 per share, the closing price of the Class A common stock on December 31, 2014.
On February 24, 2016, the Compensation Committee granted 1,500,000 NPSUs to Mr. Lutnick, 2,000,000 NPSUs to Mr. Lynn, 1,000,000 NPSUs to Mr. Merkel and 75,000 NPSUs to Mr. Windeatt. Conversion of NPSUs into PSUs/PPSUs for Messrs. Lutnick and Merkel and into LPUs/PLPUs for Messrs. Lynn and Windeatt may be (i) 25% per year with respect to NPSUs granted in 2016; (ii) 25% of the previously awarded NPSUs currently held by Messrs. Lutnick and Lynn based upon the original issuance date (the first 25% having already been converted); and (iii) 25% per year of the current balance of NPSUs previously awarded to Mr. Merkel, provided that, with respect to all of the foregoing, such future conversions are subject to the approval of the Compensation Committee each year. The grant of exchange rights with respect to such PSUs/PPSUs and LPUs/PLPUs will be determined in accordance with the Company’s practices when determining discretionary bonuses or awards, and any grants of exchangeability shall be subject to the approval of the Compensation Committee.
On February 24, 2016, the Compensation Committee granted 750,000 non-exchangeable PSUs and 291,667 PPSUs (which may not be made exchangeable) to Mr. Lutnick; 621,429 non-exchangeable LPUs and 241,667 PLPUs (which may not be made exchangeable) to Mr. Lynn; 114,583 non-exchangeable PSUs and 93,750 PPSUs (which may not be made exchangeable) to Mr. Merkel; 105,188 non-exchangeable LPUs and 40,906 non-exchangeable PLPUs (which may not be made exchangeable) to Mr. Windeatt; and 55,688 non-exchangeable LPUs and 21,656 non-exchangeable PLPUs (which may not be made exchangeable) to Mr. Sadler.
On February 24, 2016, the Compensation Committee approved the acceleration of the lapse of restrictions on transferability with respect to 612,958 shares of restricted stock held by the Company’s executive officers as follows: Mr. Lynn, 431,782 shares; Mr. Merkel, 150,382 shares; and Mr. Sadler, 30,794 shares. On February 24, 2016, Messrs. Lynn and Sadler sold these shares to the Company at $8.40 per share, and Mr. Merkel sold 120,000 of such shares to the Company at $8.40 per share. In connection with such transaction, 64,787 of Mr. Lynn’s and 4,621 of Mr. Sadler’s partnership units were redeemed for zero.
In February 2016, the Company granted exchange rights and/or released transfer restrictions with respect to 2,127,648 rights available to Mr. Lutnick with respect to some of his non-exchangeable limited partnership units (which amount included the lapse of restrictions with respect to 235,357 shares of restricted stock held by him), which were all of such rights available to him at such time. Mr. Lutnick has not transferred or exchanged such shares or units as of the date hereof.
On November 29, 2017, Mr. Lutnick exercised an employee stock option with respect to 1,000,000 shares of Class A common stock at an exercise price of $16.24 per share. The net exercise of the option resulted in 147,448 shares of the Company’s Class A common stock being issued to Mr. Lutnick. On March 9, 2016, Mr. Lutnick exercised an employee stock option with respect to 250,000 shares of Class A common stock at an exercise price of $8.42 per share. The net exercise of the option resulted in 17,403 shares of the Company’s Class A common stock being issued to Mr. Lutnick. On November 11, 2016, Mr. Lutnick exercised an employee stock option with respect to 800,000 shares of Class A common stock at an exercise price of $8.80 per share. The net exercise of the option resulted in 51,064 shares of the Company’s Class A common stock being issued to Mr. Lutnick.
In July 2016, the Audit Committee authorized the purchase by Mr. Lutnick’s retirement plan of up to $350,000 in Class A common stock at the closing price on the date of purchase. 36,405 shares of Class A common stock were purchased by the plan on August 16, 2016, at $8.77 per share, the closing price on the date of purchase.
217
On September 30, 2016, Mr. Merkel elected to sell, and the Company agreed to purchase, an aggregate of 16,634 shares of the Company’s Class A common stock at a price of $8.75 per share, the closing price of the Company’s Class A common stock on such date. On September 30, 2016, certain trusts for the benefit of Mr. Merkel’s immediate family, of which Mr. Merkel is the sole trustee of each trust, elected to sell, and the Company agreed to purchase, an aggregate of 4,131 shares of the Company’s Class A common stock on the same terms. These transactions were included in the Company’s stock repurchase authorization and authorized by the Audit Committee of the Board of Directors.
On November 7, 2016, the Compensation Committee approved a grant of 200,000 non-exchangeable PSUs/PPSUs to Mr. Merkel in replacement of 200,000 NPSUs previously granted to him on or about each of the following dates, provided that the Company and its affiliates earn, in aggregate, at least $25 million in gross revenues in the calendar quarter in which the PSUs/PPSUs are to be granted: (i) December 1, 2016 and (ii) each March 31 of 2017 through 2020 (for an aggregate total of 1,000,000 non-exchangeable PSUs/PPSUs). In connection with the foregoing, Mr. Merkel agreed to surrender a total of 1,714,826 previously granted NPSUs.
Each grant of such non-exchangeable PSUs/PPSUs is subject to Mr. Merkel’s continued employment and compliance with the Partnership Agreement as of the applicable grant date. The number of PSUs and PPSUs issuable on each grant date shall be determined by reference to the then-applicable practices for U.S.- based partners when determining the proportionality of PSUs/PPSUs (currently 55% in PSUs and 45% in PPSUs). The determination price of the PPSUs upon grant shall be the closing price of our Class A common stock on the applicable grant dates. In addition to the foregoing grants of PSUs/PPSUs in replacement of NPSUs, the Compensation Committee granted: (i) effective November 7, 2016, exchange rights with respect to 110,000 of Mr. Merkel’s previously issued nonexchangeable PSUs and 90,000 of Mr. Merkel’s previously issued non-exchangeable PPSUs, and (ii) effective on or about each February 28 of 2017 through 2020, exchange rights for 200,000 of Mr. Merkel’s then non-exchangeable PSU/PPSUs (the proportion of PSUs to PPSUs shall be in accordance with their issuance), subject to Mr. Merkel’s continued employment and compliance with the Partnership Agreement as of the applicable exchangeability date (for an aggregate total of 1 million exchangeable PSUs/PPSUs).
The Compensation Committee also agreed to the repurchase by the Company of (i) the 110,000 exchangeable PSUs for an aggregate of $952,600, based on the closing price of the Company’s Class A common stock on November 7, 2016, and (ii) the 90,000 exchangeable PPSUs for an aggregate of $773,599, at the weighted-average determination price for such PPSUs at the time of grant, which was $8.60 per unit.
As a result of the foregoing schedule, Mr. Merkel did not receive additional grants of exchange rights as part of his 2016 year-end compensation. Consistent with the previously approved schedule, effective February 28, 2017, the Compensation Committee approved (i) the grant of exchange rights with respect to 110,000 PSUs and 90,000 PPSUs held by Mr. Merkel; and (ii) the Company’s redemption for cash of such 110,000 PSUs at the average price that the Company received for sales of Class A common stock sold under the Controlled Equity Offering sales program on the date of approval, less 2%, for an aggregate of $1,216,911, and such 90,000 PPSUs at the applicable determination price of $9.41 per PPSU, for an aggregate of $847,033.
On October 4, 2017, Mr. Dalton exercised a stock option with respect to 7,085 shares of Class A common stock at an exercise price of $15.30 per share. On November 10, 2016, Mr. Dalton exercised a stock option with respect to 7,534 shares of Class A common stock at an exercise price of $8.87 per share.
On December 14, 2016, in connection with his execution of a new amended and restated deed of adherence to the U.K. Partnership and a related letter agreement, the Compensation Committee granted 1,000,000 NPSUs and 3,500,000 non-exchangeable LPUs to Mr. Lynn effective as of October 1, 2016. The 1,000,000 NPSUs shall be replaced by non-exchangeable LPUs ratably (in installments of 250,000 each) effective October 1 of 2017, 2018, 2019 and 2020, subject to the terms of the letter agreement, including the Revenue Requirement (as defined below).
In January 2017, the requirement of further approval of the Compensation Committee to replace the NPSUs as described above was amended and changed into the requirement that the Company, inclusive of affiliates thereof, earn, in aggregate, at least $5 million in gross revenues in the calendar quarter in which the applicable award of non-exchangeable PSUs/PPSUs/LPUs/PLPUs is to be granted, and such executive remaining an employee or member of an affiliate of BGC and having complied at all times with his applicable employment or membership agreement and the Partnership Agreement as of the applicable grant date (collectively, the “Revenue Requirement”).
On January 31, 2017, in connection with 2016 year-end compensation, certain previous awards of NPSUs vesting on January 1, 2017 were replaced with non-exchangeable PSUs/PPSUs (for Mr. Lutnick) and non-exchangeable LPUs/PLPUs (for Messrs. Lynn and Windeatt), all effective January 1, 2017, with the determination price of each PPSU and PLPU based on the closing price of our Class A common stock on December 30, 2016, which was $10.23. As a result, effective as of January 1, 2017, (a) 2,375,000 of Mr. Lutnick’s NPSUs were replaced with 1,710,000 non-exchangeable PSUs and 665,000 non-exchangeable PPSUs; (b) 750,000 of Mr. Lynn’s NPSUs were replaced with 540,000 non-exchangeable LPUs and 210,000 non-exchangeable PLPUs; and (c) 18,750 of Mr. Windeatt’s NPSUs were replaced with 13,500 non-exchangeable LPUs and 5,250 non-exchangeable PLPUs.
218
On January 31, 2017, in connection with his execution of an amendment to his amended and restated deed of adherence to the U.K. Partnership and a related letter agreement, the Compensation Committee granted 400,000 NPSUs and 100,000 LPSUs to Mr. Windeatt effective as of February 24, 2017. The 400,000 NPSUs shall be replaced by LPUs ratably (in installments of 100,000 each) on or about each April 1 of 2018, 2019, 2020, and 2021, subject to the terms of the letter agreement, including the Revenue Requirement.
On January 31, 2017, under the Company’s policy, the Compensation Committee granted exchange rights with respect to rights available to Mr. Lutnick with respect to some of his of his non-exchangeable PSUs/PPSUs. Mr. Lutnick elected to waive such rights as a one-time waiver that is not cumulative. Also pursuant to the policy, the Compensation Committee further approved a grant of 325,000 non-exchangeable PSUs to Mr. Lutnick, in replacement of 325,000 of his NPSUs, and a grant of 1,661,600 non-exchangeable PSUs in replacement of his 1,661,600 non-exchangeable PPSUs, for an aggregate total of 1,986,600 nonexchangeable PSUs, effective as of January 1, 2017, which were all of the rights available to him at such time.
On January 31, 2017, the Compensation Committee approved the acceleration of the lapse of restrictions on transferability with respect to 167,654 shares of restricted stock held by Mr. Lynn. On the same date, the Company repurchased the shares from Mr. Lynn at $11.07 per share, the closing price of our Class A common stock on such date.
In connection with such transaction, 25,156 of Mr. Lynn’s non-exchangeable LPUs were redeemed for zero. In addition, on January 31, 2017, the Compensation Committee redeemed for cash 180,115 of Mr. Lynn’s non-exchangeable LPUs at the average price that the Company received for sales of Class A common stock sold under the Controlled Equity Offering sales program on the date of approval, less 2%, for an aggregate of $1,958,641, and 70,045 nonexchangeable PLPUs at a determination price of $6.51, for an aggregate of $455,993. In connection with such redemptions from Mr. Lynn, 9,480 of his nonexchangeable LPUs and 3,687 of his non-exchangeable PLPUs at a determination price of $6.51 were redeemed for zero.
On the same date, the Compensation Committee approved the redemption for cash of 46,469 of Mr. Windeatt’s non-exchangeable LPUs at $10.87 per unit based on the average proceeds of the sale of shares under our Controlled Equity Offering less 2%, for an aggregate of $505,322, 14,866 non exchangeable PLPUs were redeemed at a determination price of $6.51 per PLPU, for an aggregate of $96,778, and 3,206 non-exchangeable PLPUs were redeemed at a determination price of $7.83 per unit, for an aggregate of $25,103. In connection with these transactions, 2,902 non-exchangeable LPUs, 782 non-exchangeable PLPUs with a determination price of $6.51, and 347 non-exchangeable PLPUs with a determination price of $7.38 were redeemed for zero.
On the same date, the Compensation Committee approved the redemption for cash of certain of Mr. McMurray’s non-exchangeable LPUs and nonexchangeable PLPUs effective April 1, 2017. On April 1, 2017, the Company redeemed 17,115 of Mr. McMurray’s non-exchangeable LPUs for an aggregate of $188,634, based on the average price that the Company received for sales of Class A common stock sold under the Controlled Equity Offering sales program on such date, less 2%. The Company also redeemed 6,656 non-exchangeable PLPUs at a determination price of $11.07 per unit, for an aggregate of $73,682. In connection with the redemption from Mr. McMurray, 1,849 of his non-exchangeable LPUs and 719 of his non-exchangeable PLPUs with a determination price of $11.07 were redeemed for zero.
Transactions with Relief Fund
During the year ended December 31, 2015, the Company made an interest-free loan to the Cantor Fitzgerald Relief Fund (the “Relief Fund”) for $1.0 million in connection with the Company’s annual Charity Day. As a result of the loan, the Relief Fund issued a promissory note to the Company in the aggregate principal amount of $1.0 million due on August 4, 2016. On March 2, 2016, the promissory note was canceled in connection with charitable contribution commitments related to the Company’s annual Charity Day.
During the year ended December 31, 2015, the Company committed to make charitable contributions to the Relief Fund in the amount of $40.0 million, which the Company recorded in “Other expenses” in the Company’s consolidated statements of operations for the year ended December 31, 2015. As of December 31, 2017 and 2016, the remaining liability associated with this commitment was $30.7 million, which is included in “Accounts payable, accrued and other liabilities” in the Company’s consolidated statements of financial condition.
On February 23, 2016, the Company purchased from the Relief Fund 970,639 shares of the Company’s Class A common stock at a price of $8.72 per share, the closing price on the date of the transaction. On November 16, 2016, the Company purchased from the Relief Fund 166,238 shares of the Company’s Class A common stock at a price of $9.74 per share, the closing price on the date of the transaction.
219
The Company is authorized to enter into loans, investments or other credit support arrangements for Aqua Securities L.P. (“Aqua”), an alternative electronic trading platform that offers new pools of block liquidity to the global equities markets; such arrangements are proportionally and on the same terms as similar arrangements between Aqua and Cantor. On October 27, 2015, the Company’s Board of Directors and Audit Committee increased the authorized amount by an additional $4.0 million, to $16.2 million. The Company has been further authorized to provide counterparty or similar guarantees on behalf of Aqua from time to time, provided that liability for any such guarantees, as well as similar guarantees provided by Cantor, would be shared proportionally with Cantor. Aqua is 51% owned by Cantor and 49% owned by the Company. Aqua is accounted for under the equity method of accounting. During the years ended December 31, 2017 and 2016, the Company made $1.5 million and $1.2 million, respectively, in cash contributions to Aqua. These contributions are recorded as part of “Investments” in the Company’s consolidated statements of financial condition.
The Company has also entered into a Subordinated Loan Agreement with Aqua, whereby the Company loaned Aqua the principal sum of $980 thousand. The scheduled maturity date on the subordinated loan is September 1, 2018, and the current rate of interest on the loan is three month LIBOR plus 600 basis points. The loan to Aqua is recorded as part of “Receivables from related parties” in the Company’s consolidated statements of financial condition.
|
19. |
Investments |
Equity Method and Cost Method Investments
|
(in thousands) |
|
Percent Ownership1 |
|
|
December 31, 2017 |
|
|
December 31, 2016 |
|
|||
|
Real Estate LP |
|
|
27 |
% |
|
$ |
101,562 |
|
|
$ |
— |
|
|
Advance Markets Holdings |
|
|
43 |
% |
|
|
12,741 |
|
|
|
11,051 |
|
|
China Credit BGC Money Broking Company Limited |
|
|
33 |
% |
|
|
9,644 |
|
|
|
6,361 |
|
|
Freedom International Brokerage |
|
|
45 |
% |
|
|
9,527 |
|
|
|
8,621 |
|
|
Qubed Derivatives |
|
|
50 |
% |
|
|
— |
|
|
|
1,889 |
|
|
Other |
|
|
|
|
|
|
2,117 |
|
|
|
2,922 |
|
|
Equity method investments |
|
|
|
|
|
$ |
135,591 |
|
|
$ |
30,844 |
|
|
Cost method investments |
|
|
|
|
|
|
6,197 |
|
|
|
2,595 |
|
|
Total equity method and cost method investments |
|
|
|
|
|
$ |
141,788 |
|
|
$ |
33,439 |
|
|
1 |
Represents the Company’s voting interest in the equity method investment as of December 31, 2017. |
The Company recognized net gains of $6.2 million, $3.5 million and $2.6 million related to its share of earnings from equity method investments for the years ended December 31, 2017, 2016 and 2015, respectively. The Company’s share of the gains and losses is reflected in “Gains (losses) on equity method investments” in the Company’s consolidated statements of operations. The sale of KBL (see Note 5–“Divestitures”) in May 2015 included equity method investments acquired as a result of the GFI transactions. Through the date of sale, the Company’s share of gain on these investments was $1.0 million.
On September 8, 2017 the Company invested $100.0 million in Real Estate LP, which is controlled and managed by Cantor. As of December 31, 2017, the Company’s investment is accounted for under the equity method, and the Company’s share of the gain recognized was $1.6 million for the year ended December 31, 2017.
On November 4, 2016, the Company acquired a controlling interest in Lucera, which had previously been accounted for using the equity method. This transaction resulted in the consolidation of the entity in the Company’s consolidated financial statements (see Note 18—“Related Party Transactions”) for more information.
During the year ended December 31, 2017, the Company invested $5.3 million in new investments which were accounted for under the cost method of accounting in accordance with U.S. GAAP guidance, Investments—Other. For the year ended December 31, 2017 the Company recorded an impairment charge of $1.9 million relating to existing cost method investments. The impairment was recorded in “Other expenses” in the Company’s consolidated statements of operations for the year ended December 31, 2017. There was no impairment recorded for the years ended December 31, 2016 and 2015.
220
Summarized financial information for the Company’s equity method investments was as follows (in thousands):
|
|
|
Year Ended December 31, |
|
|||||||||
|
|
|
2017 |
|
|
2016 |
|
|
2015 |
|
|||
|
Statements of operations: |
|
|
|
|
|
|
|
|
|
|
|
|
|
Total revenues |
|
$ |
92,061 |
|
|
$ |
78,539 |
|
|
$ |
60,889 |
|
|
Total expenses |
|
|
74,890 |
|
|
|
69,961 |
|
|
|
55,395 |
|
|
Net income |
|
$ |
17,171 |
|
|
$ |
8,578 |
|
|
$ |
5,494 |
|
|
|
|
December 31, |
|
|||||
|
|
|
2017 |
|
|
2016 |
|
||
|
Statements of financial condition: |
|
|
|
|
|
|
|
|
|
Cash and cash equivalents |
|
$ |
418,612 |
|
|
$ |
43,509 |
|
|
Fixed assets, net |
|
|
2,859 |
|
|
|
3,000 |
|
|
Other assets |
|
|
64,924 |
|
|
|
55,089 |
|
|
Total assets |
|
$ |
486,395 |
|
|
$ |
101,598 |
|
|
Payables to related parties |
|
|
2,733 |
|
|
|
3,071 |
|
|
Other liabilities |
|
|
72,787 |
|
|
|
65,011 |
|
|
Total partners’ capital |
|
|
410,875 |
|
|
|
33,516 |
|
|
Total liabilities and partners’ capital |
|
$ |
486,395 |
|
|
$ |
101,598 |
|
See Note 18—“Related Party Transactions,” for information regarding related party transactions with unconsolidated entities included in the Company’s consolidated financial statements.
Investments in Variable Interest Entities
Certain of the Company’s equity method investments included in the tables above are considered Variable Interest Entities (“VIEs”), as defined under the accounting guidance for consolidation. The Company is not considered the primary beneficiary of, and therefore does not consolidate these VIEs. The Company’s involvement with such entities is in the form of direct equity interests and related agreements. The Company’s maximum exposure to loss with respect to the VIEs is its investment in such entities as well as a credit facility and a subordinated loan.
The following table sets forth the Company’s investment in its unconsolidated VIEs and the maximum exposure to loss with respect to such entities as of December 31, 2017 and December 31, 2016. The amounts presented in the “Investment” column below are included in, and not in addition to, the equity method investment table above (in thousands):
|
|
|
December 31, 2017 |
|
|
December 31, 2016 |
|
||||||||||
|
|
|
Investment1 |
|
|
Maximum Exposure to Loss1,2 |
|
|
Investment |
|
|
Maximum Exposure to Loss2 |
|
||||
|
Variable interest entities |
|
$ |
103,892 |
|
|
$ |
104,872 |
|
|
$ |
4,608 |
|
|
$ |
5,588 |
|
|
1 |
Primarily attributable to the Company’s investment in Real Estate LP. |
|
2 |
The Company’s maximum exposure to loss with respect to its unconsolidated VIEs includes the sum of its equity investments in its unconsolidated VIEs and the $980 thousand subordinated loan to Aqua. |
221
Through the acquisition of GFI, the Company is invested in a limited liability company that is focused on developing a proprietary trading technology. The limited liability company is a VIE and it was determined that the Company is the primary beneficiary of this VIE because the Company, through GFI, was the provider of the majority of this VIE’s start-up capital and has the power to direct the activities of this VIE that most significantly impact its economic performance, primarily through its voting percentage and consent rights on the activities that would most significantly influence the entity. The consolidated VIE had total assets of $5.9 million and $6.8 million as of December 31, 2017 and 2016, respectively, which primarily consisted of clearing margin. There were no material restrictions on the consolidated VIE’s assets. The consolidated VIE had total liabilities of $1.6 million and $1.4 million as of December 31, 2017 and 2016, respectively. The Company’s exposure to economic loss on this VIE was approximately $2.4 million and $3.5 million as of December 31, 2017 and 2016, respectively.
|
20. |
Fixed Assets, Net |
Fixed assets, net consisted of the following (in thousands):
|
|
|
December 31, 2017 |
|
|
December 31, 2016 |
|
||
|
Computer and communications equipment |
|
$ |
151,499 |
|
|
$ |
133,470 |
|
|
Software, including software development costs |
|
|
164,011 |
|
|
|
130,397 |
|
|
Leasehold improvements and other fixed assets |
|
|
179,178 |
|
|
|
154,602 |
|
|
|
|
|
494,688 |
|
|
|
418,469 |
|
|
Less: accumulated depreciation and amortization |
|
|
(305,341 |
) |
|
|
(251,230 |
) |
|
Fixed assets, net |
|
$ |
189,347 |
|
|
$ |
167,239 |
|
Depreciation expense was $30.5 million, $29.7 million and $34.0 million for the years ended December 31, 2017, 2016 and 2015, respectively. Depreciation is included as part of “Occupancy and equipment” in the Company’s consolidated statements of operations.
The Company has approximately $6.9 million of asset retirement obligations related to certain of its leasehold improvements as of December 31, 2017. The associated asset retirement cost is capitalized as part of the carrying amount of the long-lived asset. The liability is discounted and accretion expense is recognized using the credit adjusted risk-free interest rate in effect when the liability was initially recognized.
For the years ended December 31, 2017, 2016 and 2015, software development costs totaling $39.8 million, $25.0 million and $18.5 million, respectively, were capitalized. Amortization of software development costs totaled $20.8 million, $26.8 million and $22.9 million for the years ended December 31, 2017, 2016 and 2015, respectively. Amortization of software development costs is included as part of “Occupancy and equipment” in the Company’s consolidated statements of operations.
Impairment charges of $4.2 million, $4.4 million and $19.1 million were recorded for the years ended December 31, 2017, 2016 and 2015, respectively, related to the evaluation of capitalized software projects for future benefit and for fixed assets no longer in service. In connection with the acquisition of GFI in 2015, the Company evaluated the combined portfolios of capitalized software projects and fixed assets and, as a result, identified certain redundancies and assets no longer in service which resulted in impairment charges taken in 2015. The impairment charges for the years ended December 31, 2017, 2016 and 2015 were primarily related to the Financial Services segment. Impairment charges related to capitalized software and fixed assets are reflected in “Occupancy and equipment” in the Company’s consolidated statements of operations.
222
The changes in the carrying amount of goodwill by reportable segment for the year ended December 31, 2017 and 2016 were as follows (in thousands):
|
|
|
Financial Services |
|
|
Real Estate Services |
|
|
Total |
|
|||
|
Balance at December 31, 2015 |
|
$ |
418,929 |
|
|
$ |
393,028 |
|
|
$ |
811,957 |
|
|
Acquisitions |
|
|
36,281 |
|
|
|
17,086 |
|
|
|
53,367 |
|
|
Measurement period adjustments |
|
|
(3,803 |
) |
|
|
2,732 |
|
|
|
(1,071 |
) |
|
Cumulative translation adjustment |
|
|
(372 |
) |
|
|
— |
|
|
|
(372 |
) |
|
Balance at December 31, 2016 |
|
$ |
451,035 |
|
|
$ |
412,846 |
|
|
$ |
863,881 |
|
|
Acquisitions |
|
|
29,529 |
|
|
|
64,291 |
|
|
|
93,820 |
|
|
Measurement period adjustments |
|
|
(17,057 |
) |
|
|
395 |
|
|
|
(16,662 |
) |
|
Cumulative translation adjustment |
|
|
4,543 |
|
|
|
— |
|
|
|
4,543 |
|
|
Balance at December 31, 2017 |
|
$ |
468,050 |
|
|
$ |
477,532 |
|
|
$ |
945,582 |
|
During the year ended December 31, 2017, the Company recognized additional goodwill of approximately $29.5 million which was allocated to the Company’s Financial Services segment, and $64.3 million which was allocated to the Company’s Real Estate Services segment. See Note 4—“Acquisitions” for more information.
During the year ended December 31, 2016, the Company recognized additional goodwill of approximately $36.3 million which was allocated to the Company’s Financial Services segment, and $17.1 million which was allocated to the Company’s Real Estate Services segment. See Note 4—“Acquisitions” for more information.
During the year ended December 31, 2017, the Company recognized measurement period adjustments of approximately $(17.1) million relating to Financial Services, and $0.4 million for Real Estate Services.
The Company completed its annual goodwill impairment testing during the fourth quarter of 2017, which did not result in any goodwill impairment. See Note 3—“Summary of Significant Accounting Policies” for more information.
Other intangible assets consisted of the following (in thousands, except weighted-average remaining life):
|
|
|
December 31, 2017 |
|
|||||||||||||
|
|
|
Gross Amount |
|
|
Accumulated Amortization |
|
|
Net Carrying Amount |
|
|
Weighted- Average Remaining Life (Years) |
|
||||
|
Definite life intangible assets: |
|
|
|
|
|
|
|
|
|
|
|
|
|
|
|
|
|
Customer-related |
|
$ |
203,743 |
|
|
$ |
27,820 |
|
|
$ |
175,923 |
|
|
|
13.7 |
|
|
Technology |
|
|
24,025 |
|
|
|
9,741 |
|
|
|
14,284 |
|
|
|
4.2 |
|
|
Noncompete agreements |
|
|
34,333 |
|
|
|
16,180 |
|
|
|
18,153 |
|
|
|
2.7 |
|
|
Patents |
|
|
10,629 |
|
|
|
10,049 |
|
|
|
580 |
|
|
|
3.6 |
|
|
All other |
|
|
19,795 |
|
|
|
9,691 |
|
|
|
10,104 |
|
|
|
9.2 |
|
|
Total definite life intangible assets |
|
|
292,525 |
|
|
|
73,481 |
|
|
|
219,044 |
|
|
|
11.9 |
|
|
Indefinite life intangible assets: |
|
|
|
|
|
|
|
|
|
|
|
|
|
|
|
|
|
Trade names |
|
|
84,048 |
|
|
— |
|
|
|
84,048 |
|
|
N/A |
|
||
|
Licenses |
|
|
7,929 |
|
|
— |
|
|
|
7,929 |
|
|
N/A |
|
||
|
Total indefinite life intangible assets |
|
|
91,977 |
|
|
— |
|
|
|
91,977 |
|
|
N/A |
|
||
|
Total |
|
$ |
384,502 |
|
|
$ |
73,481 |
|
|
$ |
311,021 |
|
|
|
11.9 |
|
223
|
|
|
December 31, 2016 |
|
|||||||||||||
|
|
|
Gross Amount |
|
|
Accumulated Amortization |
|
|
Net Carrying Amount |
|
|
Weighted- Average Remaining Life (Years) |
|
||||
|
Definite life intangible assets: |
|
|
|
|
|
|
|
|
|
|
|
|
|
|
|
|
|
Customer-related |
|
$ |
127,749 |
|
|
$ |
14,386 |
|
|
$ |
113,363 |
|
|
|
17.7 |
|
|
Technology |
|
|
24,570 |
|
|
|
6,275 |
|
|
|
18,295 |
|
|
|
5.2 |
|
|
Noncompete agreements |
|
|
16,478 |
|
|
|
7,597 |
|
|
|
8,881 |
|
|
|
2.7 |
|
|
Patents |
|
|
10,300 |
|
|
|
8,432 |
|
|
|
1,868 |
|
|
|
1.7 |
|
|
All other |
|
|
13,866 |
|
|
|
6,436 |
|
|
|
7,430 |
|
|
|
3.7 |
|
|
Total definite life intangible assets |
|
|
192,963 |
|
|
|
43,126 |
|
|
|
149,837 |
|
|
|
14.4 |
|
|
Indefinite life intangible assets: |
|
|
|
|
|
|
|
|
|
|
|
|
|
|
|
|
|
Trade names |
|
|
96,436 |
|
|
— |
|
|
|
96,436 |
|
|
N/A |
|
||
|
Licenses |
|
|
6,890 |
|
|
— |
|
|
|
6,890 |
|
|
N/A |
|
||
|
Total indefinite life intangible assets |
|
|
103,326 |
|
|
— |
|
|
|
103,326 |
|
|
N/A |
|
||
|
Total |
|
$ |
296,289 |
|
|
$ |
43,126 |
|
|
$ |
253,163 |
|
|
|
14.4 |
|
Intangible amortization expense was $31.0 million, $20.1 million and $27.2 million for the years ended December 31, 2017, 2016 and 2015, respectively. Intangible amortization is included as part of “Other expenses” in the Company’s consolidated statements of operations.
The Company completed its annual intangible impairment testing during the year ended December 31, 2017. There was a $6.3 million impairment charge for the Company’s indefinite life intangibles for the year ended December 31, 2017. There were no impairment charges for the Company’s definite and indefinite life intangibles for the years ended December 31, 2016 and 2015.
The estimated future amortization expense of definite life intangible assets as of December 31, 2017 is as follows (in millions):
|
2018 |
|
$ |
28.4 |
|
|
2019 |
|
|
27.1 |
|
|
2020 |
|
|
20.8 |
|
|
2021 |
|
|
18.5 |
|
|
2022 |
|
|
14.1 |
|
|
2023 and thereafter |
|
|
110.1 |
|
|
Total |
|
$ |
219.0 |
|
|
22. |
Long-term Debt, Collateralized and Short-Term Borrowings |
Long-term debt, collateralized and short-term borrowings consisted of the following (in thousands):
|
|
|
December 31, 2017 |
|
|
December 31, 2016 |
|
||
|
Unsecured senior converted term loan credit agreement |
|
$ |
397,310 |
|
|
$ |
— |
|
|
Unsecured senior term loan credit agreement |
|
|
270,710 |
|
|
|
— |
|
|
8.125% Senior Notes |
|
|
109,396 |
|
|
|
109,271 |
|
|
5.375% Senior Notes |
|
|
298,064 |
|
|
|
297,083 |
|
|
8.375% Senior Notes |
|
|
242,474 |
|
|
|
246,988 |
|
|
5.125% Senior Notes |
|
|
296,996 |
|
|
|
296,215 |
|
|
Collateralized borrowings |
|
|
35,559 |
|
|
|
16,210 |
|
|
Total Long-term debt and collateralized borrowings |
|
|
1,650,509 |
|
|
|
965,767 |
|
|
Short-term borrowings |
|
|
6,046 |
|
|
|
— |
|
|
Total Long-term debt, collateralized and short-term borrowings |
|
$ |
1,656,555 |
|
|
$ |
965,767 |
|
224
Unsecured Senior Revolving Credit and Converted Term Loan Agreement
On September 8, 2017, the Company entered into a committed unsecured senior revolving credit agreement with Bank of America, N.A., as administrative agent, and a syndicate of lenders. The revolving credit agreement provides for revolving loans of up to $400.0 million. The maturity date of the facility is September 8, 2019. On November 22, 2017, the Company and Newmark entered into an amendment to the unsecured senior revolving credit agreement. Pursuant to the amendment, the then-outstanding borrowings of the Company under the revolving credit facility were converted into a term loan. There was no change in the maturity date or interest rate. Effective December 13, 2017, Newmark assumed the obligations of the Company as borrower under the converted term loan. The Company remains a borrower under, and retains access to, the revolving credit facility for any future draws, subject to availability which increases as Newmark repays the converted term loan. Borrowings under the converted term loan bear interest at either LIBOR or a defined base rate plus an additional margin which ranges from 50 basis points to 325 basis points depending on the Company’s debt rating as determined by S&P and Fitch and whether such loan is a LIBOR loan or a base rate loan. If there are any amounts outstanding under the senior term loan as of December 31, 2017, the pricing shall increase by 50 basis points until the senior term loan is paid in full, and if there are any amounts outstanding under the senior term loan as of June 30, 2018, the pricing shall increase by an additional 75 basis points (125 basis points in the aggregate) until the senior term loan is paid in full. From and after the repayment in full of the senior term loan, the pricing shall return to the levels previously described. As of December 31, 2017, there were $400.0 million of borrowings outstanding under the converted term loan. The carrying value of the converted term loan as of December 31, 2017 was $397.3 million, net of deferred financing costs of $2.7 million. As of December 31, 2017, the interest rate on the converted term loan was 4.21%. The Company recorded interest expense related to the converted term loan of $5.1 million for the year ended December 31, 2017.
Unsecured Senior Term Loan Credit Agreement
On September 8, 2017, the Company entered into a committed unsecured senior term loan credit agreement with Bank of America, N.A., as administrative agent, and a syndicate of lenders. The term loan credit agreement provides for loans of up to $575.0 million. The maturity date of the agreement is September 8, 2019. On November 22, 2017, the Company and Newmark entered into an amendment to the unsecured senior term loan credit agreement. Pursuant to the term loan amendment and effective as of December 13, 2017, Newmark assumed the obligations of the Company as borrower under the senior term loan. There was no change in the maturity date or interest rate. Borrowings under the senior term loan bear interest at either LIBOR or a defined base rate plus an additional margin which ranges from 50 basis points to 325 basis points depending on the Company’s debt rating as determined by S&P and Fitch and whether such loan is a LIBOR loan or a base rate loan. If there are any amounts outstanding under the senior term loan as of December 31, 2017, the pricing shall increase by 50 basis points until the senior term loan is paid in full, and if there are any amounts outstanding under the senior term loan as of June 30, 2018, the pricing shall increase by an additional 75 basis points (125 basis points in the aggregate) until the senior term loan is paid in full. From and after the repayment in full of the senior term loan, the pricing shall return to the levels previously described. The senior term loan is also subject to mandatory prepayment from 100% of net cash proceeds of all material asset sales and debt and equity issuances by Newmark and its subsidiaries (subject to certain customary exceptions, including sales under the Company’s CEO sales program). The net proceeds from the Newmark initial public offering were used to partially repay $304.3 million of the senior term loan. As of December 31, 2017, there were $270.7 million of borrowings outstanding under the senior term loan. The carrying value of the senior term loan as of December 31, 2017 was $270.7 million. As of December 31, 2017, the interest rate on the senior term loan was 4.21%. The Company recorded interest expense related to the senior term loan of $9.1 million for the year ended December 31, 2017.
Senior Notes
The Company’s Senior Notes are recorded at amortized cost. As of December 31, 2017 and December 31, 2016, the carrying amounts and estimated fair values of the Company’s Senior Notes were as follows (in thousands):
|
|
|
December 31, 2017 |
|
|
December 31, 2016 |
|
||||||||||
|
|
|
Carrying Amount |
|
|
Fair Value |
|
|
Carrying Amount |
|
|
Fair Value |
|
||||
|
8.125% Senior Notes |
|
$ |
109,396 |
|
|
$ |
116,550 |
|
|
$ |
109,271 |
|
|
$ |
115,650 |
|
|
5.375% Senior Notes |
|
|
298,064 |
|
|
|
313,125 |
|
|
|
297,083 |
|
|
|
312,000 |
|
|
8.375% Senior Notes |
|
|
242,474 |
|
|
|
247,200 |
|
|
|
246,988 |
|
|
|
256,650 |
|
|
5.125% Senior Notes |
|
|
296,996 |
|
|
|
315,375 |
|
|
|
296,215 |
|
|
|
309,300 |
|
|
Total |
|
$ |
946,930 |
|
|
$ |
992,250 |
|
|
$ |
949,557 |
|
|
$ |
993,600 |
|
The fair values of the Senior Notes were determined using observable market prices as these securities are traded, and based on whether they are deemed to be actively traded, the 8.125% Senior Notes are considered Level 1 and the 5.375% Senior Notes, 8.375% Senior Notes, and 5.125% Senior Notes are considered Level 2 within the fair value hierarchy.
225
On April 1, 2010, BGC Holdings issued an aggregate of $150.0 million principal amount of the 8.75% Convertible Notes to Cantor in a private placement transaction. The 8.75% Convertible Notes were senior unsecured obligations and ranked equally and ratably with all existing and future senior unsecured obligations of the Company. The 8.75% Convertible Notes bore an annual interest rate of 8.75%, payable semi-annually in arrears on April 15 and October 15 of each year, beginning on October 15, 2010. On April 13, 2015, the Company’s 8.75% Convertible Notes were fully converted into 24,042,599 shares of the Company’s Class A common stock, par value $0.01 per share, issued to Cantor. The Company did not record any interest expense related to the 8.75% Convertible Notes for the years ended December 31, 2017 and December 31, 2016. The Company recorded interest expense related to the 8.75% Convertible Notes of $3.8 million for the years ended December 31, 2015.
On July 29, 2011, the Company issued an aggregate of $160.0 million principal amount of 4.50% Convertible Notes due July 15, 2016. The 4.50% Convertible Notes were general senior unsecured obligations of the Company. The 4.50% Convertible Notes paid interest semiannually at a rate of 4.50% per annum and were priced at par. The Company recorded interest expense related to the 4.50% Convertible Notes of $6.5 million and $12.0 million for the years ended December 31, 2016 and 2015, respectively. The Company did not record any interest expense related to the 4.50% Convertible Notes for the year ended December 31, 2017.
On July 13, 2016, certain holders of the 4.50% Convertible Notes converted $68,000 in principal amount of notes, and, upon conversion, the Company delivered 6,909 shares of its Class A common stock to such holders. On July 15, 2016, the Company repaid the remaining approximately $159.9 million principal amount of its 4.50% Convertible Notes that matured on July 15, 2016.
In connection with the offering of the 4.50% Convertible Notes, the Company entered into capped call transactions, which were expected to reduce the potential dilution of the Company’s Class A common stock upon any conversion of the 4.50% Convertible Notes in the event that the market value per share of the Company’s Class A common stock, as measured under the terms of the capped call transactions, was greater than the strike price of the capped call transactions. The capped call transactions expired unexercised on July 13, 2016. The expiration of the capped call transactions had no financial statement impact.
8.125% Senior Notes
On June 26, 2012, the Company issued an aggregate of $112.5 million principal amount of 8.125% Senior Notes due 2042 (the “8.125% Senior Notes”). The 8.125% Senior Notes are senior unsecured obligations of the Company. The 8.125% Senior Notes may be redeemed for cash, in whole or in part, on or after June 26, 2017, at the Company’s option, at any time and from time to time, until maturity at a redemption price equal to 100% of the principal amount to be redeemed, plus accrued but unpaid interest on the principal amount being redeemed to, but not including, the redemption date. The 8.125% Senior Notes are listed on the New York Stock Exchange under the symbol “BGCA.” The Company used the proceeds to repay short-term borrowings under its unsecured revolving credit facility and for general corporate purposes, including acquisitions.
The initial carrying value of the 8.125% Senior Notes was $108.7 million, net of debt issuance costs of $3.8 million. The issuance costs are amortized as interest cost, and the carrying value of the 8.125% Senior Notes will accrete up to the face amount over the term of the 8.125% Senior Notes. The Company recorded interest expense related to the 8.125% Senior Notes of $9.3 million for each of the years ended December 31, 2017, 2016 and 2015.
5.375% Senior Notes
On December 9, 2014, the Company issued an aggregate of $300.0 million principal amount of 5.375% Senior Notes due 2019 (the “5.375% Senior Notes”). The 5.375% Senior Notes are general senior unsecured obligations of the Company. These Senior Notes bear interest at a rate of 5.375% per year, payable in cash on June 9 and December 9 of each year, commencing June 9, 2015. The interest rate payable on the notes will be subject to adjustments from time to time based on the debt rating assigned by specified rating agencies to the notes, as set forth in the Indenture. The 5.375% Senior Notes will mature on December 9, 2019. The Company may redeem some or all of the notes at any time or from time to time for cash at certain “make-whole” redemption prices (as set forth in the Indenture). If a “Change of Control Triggering Event” (as defined in the Indenture) occurs, holders may require the Company to purchase all or a portion of their notes for cash at a price equal to 101% of the principal amount of the notes to be purchased plus any accrued and unpaid interest to, but excluding, the purchase date.
The initial carrying value of the 5.375% Senior Notes was $295.1 million, net of the discount and debt issuance costs of $4.9 million. The issuance costs are amortized as interest cost, and the carrying value of the 5.375% Senior Notes will accrete up to the face amount over the term of the notes. The Company recorded interest expense related to the 5.375% Senior Notes of $17.1 million for the years ended December 31, 2017, 2016 and 2015, respectively.
226
As part of the GFI acquisition, the Company assumed $240.0 million in aggregate principal amount of 8.375% Senior Notes due July 2018 (the “8.375% Senior Notes”). The carrying value of these notes as of December 31, 2017 was $242.5 million. Interest on these notes is payable, semi-annually in arrears on the 19th of January and July. Due to the cumulative effect of downgrades to the credit rating of GFI’s 8.375% Senior Notes, the 8.375% Senior Notes were subjected to 200 basis points penalty interest. On April 28, 2015, a subsidiary of the Company purchased from GFI approximately 43.0 million new shares of GFI common stock. This increased BGC’s ownership to approximately 67% of GFI’s outstanding common stock and gave the Company the ability to control the timing and process with respect to a full merger which was completed on January 12, 2016. Also on July 10, 2015, the Company guaranteed the obligations of GFI under the 8.375% Senior Notes. These actions resulted in upgrades of the credit ratings of GFI’s 8.375% Senior Notes by Moody’s Investors Service, Fitch Ratings Inc. and Standard & Poor’s, which reduced the penalty interest to 25 basis points effective July 19, 2015. In addition, on January 13, 2016, Moody’s further upgraded the credit rating on GFI’s 8.375% Senior Notes, eliminating the penalty interest. The Company recorded interest expense related to the 8.375% Senior Notes of $20.1 million, $20.1 million and $19.2 million for the years ended December 31, 2017, 2016 and 2015, respectively.
5.125% Senior Notes
On May 27, 2016, the Company issued an aggregate of $300.0 million principal amount of 5.125% Senior Notes due 2021 (the “5.125% Senior Notes”). The 5.125% Senior Notes are general senior unsecured obligations of the Company. These Senior Notes bear interest at a rate of 5.125% per year, payable in cash on May 27 and November 27 of each year, commencing November 27, 2016. The 5.125% Senior Notes will mature on May 27, 2021. The Company may redeem some or all of the notes at any time or from time to time for cash at certain “make-whole” redemption prices (as set forth in the Indenture). If a “Change of Control Triggering Event” (as defined in the Indenture) occurs, holders may require the Company to purchase all or a portion of their notes for cash at a price equal to 101% of the principal amount of the notes to be purchased plus any accrued and unpaid interest to, but excluding, the purchase date.
The initial carrying value of the 5.125% Senior Notes was $295.8 million, net of the discount and debt issuance costs of $4.2 million. The issuance costs are amortized as interest expense and the carrying value of the 5.125% Senior Notes will accrete up to the face amount over the term of the notes. The Company recorded interest expense related to the 5.125% Senior Notes of $16.2 million and $9.6 million for the years ended December 31, 2017 and 2016, respectively. The Company did not record any interest expense related to the 5.125% Senior Notes for the year ended December 31, 2015.
Collateralized Borrowings
On March 13, 2015, the Company entered into a secured loan arrangement of $28.2 million under which it pledged certain fixed assets as security for a loan. This arrangement incurs interest at a fixed rate of 3.70% and matures on March 13, 2019. As of December 31, 2017, the Company had $9.2 million outstanding related to this secured loan arrangement, which includes $0.1 million of deferred financing costs. The value of the fixed assets pledged as of December 31, 2017 was $0.3 million. The Company recorded interest expense related to this secured loan arrangement of $0.6 million, $0.8 million and $0.8 million for the years ended December 31, 2017 and 2016 and 2015, respectively.
On May 31, 2017, the Company entered into a secured loan arrangement of $29.9 million under which it pledged certain fixed assets as security for a loan. This arrangement incurs interest at a fixed rate of 3.44% and matures on May 31, 2021. As of December 31, 2017, the Company had $26.4 million outstanding related to this secured loan arrangement. The value of the fixed assets pledged as of December 31, 2017 was $17.3 million. The Company recorded interest expense related to this secured loan arrangement of $0.5 million for the year ended December 31, 2017. The Company did not record any interest expense related to this secured loan arrangement for the years ended December 31, 2016 and 2015.
Short-term Borrowings
As part of the GFI acquisition, the Company acquired a credit agreement as amended (the “GFI Credit Agreement”) with Bank of America, N.A. and certain other lenders, which provided for maximum revolving loans of up to $75.0 million. The amount outstanding was repaid by the Company on October 2, 2015, prior to the sale of the Company’s Trayport division. For the year ended December 31, 2015, the Company recorded interest expense related to the GFI Credit Agreement of $1.9 million.
On October 1, 2015, the Company entered into a previously authorized $150.0 million revolving credit facility (the “Facility”) with Cantor and borrowed $100.0 million under such facility (the “Cantor Loan”). The Cantor Loan bears interest at the rate of LIBOR plus 3.25% and may be adjusted based on Cantor’s short-term borrowing rate then in effect plus 1%. The Facility has a maturity date of August 10, 2017. The Company recorded interest expense related to the Cantor Loan of $0.8 million for the year ended December 31, 2015. The Cantor Loan was repaid on December 31, 2015.
227
On December 24, 2015, the Company entered into a committed unsecured credit agreement with Bank of America, N.A. The credit agreement provided for maximum revolving loans of $25.0 million through March 24, 2016. The interest rate on this facility was LIBOR plus 200 basis points.
On February 25, 2016, the Company entered into a committed unsecured credit agreement with Bank of America, N.A., as administrative agent, and a syndicate of lenders. Several of the Company’s domestic non-regulated subsidiaries are parties to the credit agreement as guarantors. The credit agreement provides for revolving loans of $150.0 million, with the option to increase the aggregate loans to $200.0 million. Borrowings under this facility bear interest at either LIBOR or a defined base rate plus an additional margin which ranges from 50 basis points to 250 basis points depending on the Company’s debt rating as determined by S&P and Fitch and whether such loan is a LIBOR loan or a base rate loan. This facility was terminated on September 8, 2017, at which point the outstanding balance of $150.0 million was repaid. Contemporaneously with the closing of this credit agreement, the $25.0 million unsecured credit agreement entered into on December 24, 2015 with Bank of America, N.A. was terminated. As of December 31, 2017, there were no borrowings outstanding under either the $150.0 million facility or the terminated $25.0 million facility. The Company recorded interest expense related to the credit facility of $2.4 million and $0.7 million for the years ended December 31, 2017 and 2016, respectively.
On August 22, 2017, the Company entered into a committed unsecured loan agreement with Itau Unibanco S.A. The credit agreement provides for short term loans of up to $6.0 million (BRL 20.0 million). The maturity date of the agreement is February 19, 2018. Borrowings under this facility bear interest at the Brazilian Interbank offering rate plus 3.30%. As of December 31, 2017, there were $6.0 million of borrowings outstanding under the facility. As of December 31, 2017, the interest rate was 11.64%. The Company recorded interest expense related to the loan of $0.3 million for the year ended December 31, 2017.
On August 23, 2017, the Company entered into a committed unsecured credit agreement with Itau Unibanco S.A. The credit agreement provides for an intra-day overdraft credit line up to $15.8 million (BRL 50.0 million). The maturity date of the agreement is March 14, 2018. This facility bears a fee of 1.00% per year. As of December 31, 2017, there were no borrowings outstanding under this facility. The Company recorded bank fees related to the agreement of $0.1 million for the year ended December 31, 2017.
|
23. |
Compensation |
The Company’s Compensation Committee may grant various equity-based and partnership awards, including restricted stock units, restricted stock, stock options, limited partnership units and exchange rights for shares of the Company’s Class A common stock upon exchange of limited partnership units. On June 22, 2016, at the Annual Meeting of Stockholders of the Company, the stockholders approved the Seventh Amended and Restated Long Term Incentive Plan (the “Equity Plan”) to increase from 350 million to 400 million the aggregate number of shares of Class A common stock of the Company that may be delivered or cash-settled pursuant to awards granted during the life of the Equity Plan. As of December 31, 2017, the limit on the aggregate number of shares authorized to be delivered allowed for the grant of future awards relating to 189.4 million shares. Upon vesting of RSUs, issuance of restricted stock, exercise of employee stock options and exchange of limited partnership units, the Company generally issues new shares of the Company’s Class A common stock. On June 6, 2017, at the Annual Meeting of Stockholders of the Company, the Company’s stockholders approved the Company’s Second Amended and Restated Incentive Bonus Compensation Plan (the “Incentive Plan”) to approve the material terms of the performance goals under the Incentive Plan for compliance with Section 162(m) of the Internal Revenue Code of 1986, as amended, including an amendment to those performance goals in order to broaden the stock price performance goal to include dividends and/or total stockholder return. In addition, as a result of the Newmark IPO, effective as of December 13, 2017, the Board of Directors of Newmark adopted the Newmark Long Term Incentive Plan, which was approved by Newmark’s sole stockholder, BGC, on December 13, 2017.
228
A summary of the activity associated with limited partnership units is as follows:
|
|
|
Number of Units |
|
|
|
Balance at December 31, 2014 |
|
|
53,561,990 |
|
|
Granted |
|
|
38,169,581 |
|
|
Redeemed/exchanged units |
|
|
(14,166,438 |
) |
|
Forfeited units |
|
|
(1,163,358 |
) |
|
Balance at December 31, 2015 |
|
|
76,401,775 |
|
|
Granted |
|
|
44,510,337 |
|
|
Redeemed/exchanged units |
|
|
(13,318,041 |
) |
|
Forfeited units |
|
|
(3,029,415 |
) |
|
Balance at December 31, 2016 |
|
|
104,564,656 |
|
|
Granted |
|
|
36,910,176 |
|
|
Redeemed/exchanged units |
|
|
(11,456,604 |
) |
|
Forfeited units |
|
|
(6,387,033 |
) |
|
Balance at December 31, 2017 |
|
|
123,631,195 |
|
As of December 31, 2017, the Company had 123.6 million limited partnership units outstanding. As a result of the Newmark IPO and the related Separation and Distribution Agreement, these units represent 123.6 million limited partnership units in BGC Holdings and 56.2 million limited partnership units in Newmark Holdings as of December 31, 2017 (see Note 2—“Limited Partnership Interests in BGC Holdings and Newmark Holdings” for further details on the Separation and Distribution Agreement).
During the years ended December 31, 2017, 2016 and 2015, the Company granted exchangeability on 19.6 million, 15.9 million and 26.9 million limited partnership units in BGC Holdings for which the Company incurred non-cash compensation expense of $235.6 million, $141.4 million and $231.4 million, respectively. The 2015 amounts include a conversion of 90% of outstanding REUs and RPUs in December 2015 totaling 11.8 million units and $114.0 million. This expense is included within “Allocations of net income and grant of exchangeability to limited partnership units and FPUs” in the Company’s consolidated statements of operations. For the years ended December 31, 2017, 2016 and 2015, there was no expense related to grants of exchangeability on limited partnership units in Newmark Holdings.
As of December 31, 2017, 2016 and 2015, the number of share-equivalent limited partnership units exchangeable into shares of BGC Class A common stock at the discretion of the unit holder was 20.0 million, 13.9 million and 5.4 million, respectively. The number of share-equivalent limited partnership units exchangeable into shares of BGC Class A common stock as of December 31, 2017 represent 20.0 million and 9.1 million of limited partnership units in BGC Holdings and Newmark Holdings, respectively, exchangeable together into 20.0 million shares of BGC Class A common stock.
As of December 31, 2017 and December 31, 2016, the notional value of the limited partnership units with a post-termination pay-out amount held by executives and non-executive employees, awarded in lieu of cash compensation for salaries, commissions and/or discretionary or guaranteed bonuses, was approximately $242.1 million and $155.6 million, respectively. As of December 31, 2017 and December 31, 2016, the aggregate estimated fair value of these limited partnership units was approximately $45.7 million and $26.2 million, respectively. The number of outstanding limited partnership units with a post-termination pay-out as of December 31, 2017 and December 31, 2016 was approximately 24.1 million and 17.0 million, respectively, of which approximately 13.3 million and 11.2 million were unvested. As of December 31, 2017, the number of outstanding limited partnership units with a post-termination pay-out represent 24.1 million and 11.0 million of limited partnership units in BGC Holdings and Newmark Holdings, respectively, of which approximately 13.3 million and 6.0 million units in BGC Holdings and Newmark Holdings, respectively, were unvested. The liability for limited partnership units with a post-termination payout is included in “Accrued compensation” on the Company’s consolidated statements of financial condition.
Certain of the limited partnership units with a post-termination pay-out have been granted in connection with the Company’s acquisitions. As of December 31, 2017 and December 31, 2016, the aggregate estimated fair value of these acquisition-related limited partnership units was $23.8 million and $20.3 million, respectively. The liability for such acquisition-related limited partnership units is included in “Accounts payable, accrued and other liabilities” on the Company’s consolidated statements of financial condition.
Compensation expense related to limited partnership units with a post-termination pay-out amount is recognized over the stated service period. These units generally vest between three and five years from the date of grant. The Company recognized compensation expense related to these limited partnership units of $22.5 million, $17.9 million and $13.7 million for the years ended December 31, 2017, 2016 and 2015, respectively. These are included in “Compensation and employee benefits” in the Company’s consolidated statements of operations.
229
Certain limited partnership units generally receive quarterly allocations of net income, which are cash distributed on a quarterly basis and generally contingent upon services being provided by the unit holders. The allocation of income to limited partnership units and FPUs was $51.0 million, $51.5 million and $28.3 million for the years ended December 31, 2017, 2016 and 2015, respectively. This expense is included within “Allocations of net income and grant of exchangeability to limited partnership units and FPUs” in the Company’s consolidated statements of operations.
Restricted Stock Units
A summary of the activity associated with RSUs is as follows:
|
|
|
Restricted Stock Units |
|
|
Weighted-Average Grant Date Fair Value |
|
|
Weighted-Average Remaining Contractual Term (Years) |
|
|||
|
Balance at December 31, 2014 |
|
|
2,140,932 |
|
|
$ |
4.70 |
|
|
|
1.74 |
|
|
Granted |
|
|
691,831 |
|
|
|
8.06 |
|
|
|
|
|
|
Delivered units |
|
|
(1,045,056 |
) |
|
|
5.00 |
|
|
|
|
|
|
Forfeited units |
|
|
(165,276 |
) |
|
|
5.75 |
|
|
|
|
|
|
Balance at December 31, 2015 |
|
|
1,622,431 |
|
|
$ |
5.83 |
|
|
|
1.53 |
|
|
Granted |
|
|
912,343 |
|
|
|
7.85 |
|
|
|
|
|
|
Delivered units |
|
|
(865,483 |
) |
|
|
5.92 |
|
|
|
|
|
|
Forfeited units |
|
|
(121,889 |
) |
|
|
7.16 |
|
|
|
|
|
|
Balance at December 31, 2016 |
|
|
1,547,402 |
|
|
$ |
6.86 |
|
|
|
1.63 |
|
|
Granted |
|
|
836,726 |
|
|
|
10.56 |
|
|
|
|
|
|
Delivered units |
|
|
(786,885 |
) |
|
|
6.97 |
|
|
|
|
|
|
Forfeited units |
|
|
(187,496 |
) |
|
|
8.66 |
|
|
|
|
|
|
Balance at December 31, 2017 |
|
|
1,409,747 |
|
|
$ |
8.76 |
|
|
|
1.68 |
|
The fair value of RSUs awarded to employees and directors is determined on the date of grant based on the market value of Class A common stock (adjusted if appropriate based upon the award’s eligibility to receive dividends), and is recognized, net of the effect of estimated forfeitures, ratably over the vesting period. The Company uses historical data, including historical forfeitures and turnover rates, to estimate expected forfeiture rates for both employee and director RSUs. Each RSU is settled in one share of Class A common stock upon completion of the vesting period.
During the years ended December 31, 2017 and 2016, the Company granted 0.8 million and 0.9 million, respectively, of RSUs with aggregate estimated grant date fair values of approximately $8.8 million and $7.2 million, respectively, to employees and directors. These RSUs were awarded in lieu of cash compensation for salaries, commissions and/or discretionary or guaranteed bonuses. RSUs granted to these individuals generally vest over a two- to four-year period.
For RSUs that vested during the years ended December 31, 2017 and 2016, the Company withheld shares valued at $2.6 million and $2.1 million to pay taxes due at the time of vesting.
As of December 31, 2017 and December 31, 2016, the aggregate estimated grant date fair value of outstanding RSUs was approximately $12.3 million and $10.6 million, respectively.
Compensation expense related to RSUs was approximately $5.8 million, $6.0 million and $5.3 million, respectively, for the years ended December 31, 2017, 2016 and 2015. As of December 31, 2017, there was approximately $10.6 million of total unrecognized compensation expense related to unvested RSUs.
Restricted Stock
The Company has granted restricted shares under its Equity Plan. Such restricted shares are generally saleable by partners in five to ten years. Partners who agree to extend the length of their employment agreements and/or other contractual modifications sought by the Company are expected to be able to sell their restricted shares over a shorter time period. Transferability of the shares of restricted stock is not subject to continued employment or service with the Company or any affiliate or subsidiary of the Company; however, transferability is subject to compliance with BGC Partners’ and its affiliates’ customary noncompete obligations. During the years ended December 31, 2017 and 2016, approximately 183 thousand BGC shares and 59 thousand BGC shares, respectively, were forfeited in connection with this clause. During the years ended December 31, 2017 and 2016, the Company released the restrictions with respect to approximately 2.7 million and 5.5 million of such BGC shares, respectively. As of December 31, 2017, there were 9.1 million of such restricted BGC shares outstanding.
230
During the year ended December 31, 2016, the Company granted approximately 0.4 million, respectively, restricted shares of the Company’s Class A common stock. In connection with those grants, an equivalent number of limited partnership units in BGC Holdings were surrendered. Such restricted shares are saleable ratably over a period of four years. Transferability of the shares is subject to compliance with BGC Partners’ and its affiliates’ customary noncompete obligations. For the year ended December 31, 2016, the Company recognized compensation expense of approximately $3.2 million, respectively, related to the grant of these restricted BGC shares.
Deferred Compensation
As part of the acquisition of GFI, the Company now maintains a Deferred Cash Award Program which was adopted by GFI on February 12, 2013, and provides for the grant of deferred cash incentive compensation to eligible employees. The Company may pay certain bonuses in the form of deferred cash compensation awards, which generally vest over a future service period. In addition, prior to the completion of the tender offer, GFI’s outstanding RSUs were converted into the right to receive an amount in cash equal to $6.10 per unit, with such cash payable on and subject to the terms and conditions of the original vesting schedule of each RSU. The total compensation expense recognized in relation to the deferred cash compensation awards for the years ended December 31, 2017 and 2016 was $8.0 million and $16.0 million, respectively. As of December 31, 2017, the total liability for the deferred cash compensation awards was $9.2 million, which is included in “Accrued compensation” on the Company’s consolidated statements of financial condition. Total unrecognized compensation cost related to deferred cash compensation, prior to the consideration of forfeitures, was approximately $6.4 million and is expected to be recognized over a weighted-average period of 1.97 years. The Company also maintains a similar deferred cash award program as part of the Berkeley Point Acquisition in which it pays certain bonuses in the form of deferred cash compensation awards, which also generally vest over a future service period. The total compensation expense recognized in relation to Berkeley Point’s deferred cash compensation awards was $0.3 million, $1.3 million, and $2.6 million for the years ended December 31, 2017, 2016, and 2015. As of December 31, 2017 and 2016, the total liability for the deferred cash compensation awards was $0.4 million and $2.6 million, respectively, which is included in “Accrued compensation” on the Company’s consolidated statements of financial condition.
In December 2017, the Company incurred an expense totaling $40.3 million in relation to deferred BGC and Newmark Class A common stock that the Chief Executive Officer and Chief Financial Officer are authorized to issue, as approved by the Board of Directors. The deferred stock to be issued based on the share price at the date of approval, consists of 2.0 million BGC Class A common stock and 0.6 million Newmark Class A common stock.
231
A summary of the activity associated with stock options is as follows:
|
|
|
Options |
|
|
Weighted-Average Exercise Price |
|
|
Weighted-Average Remaining Contractual Term (Years) |
|
|
Aggregate Intrinsic Value |
|
||||
|
Balance at December 31, 2014 |
|
|
2,184,238 |
|
|
$ |
9.66 |
|
|
|
2.3 |
|
|
$ |
569,979 |
|
|
Granted |
|
|
— |
|
|
|
— |
|
|
|
|
|
|
|
|
|
|
Exercised options |
|
|
(94,000 |
) |
|
|
8.09 |
|
|
|
|
|
|
|
|
|
|
Forfeited options |
|
|
(11,000 |
) |
|
|
9.03 |
|
|
|
|
|
|
|
|
|
|
Balance at December 31, 2015 |
|
|
2,079,238 |
|
|
$ |
9.73 |
|
|
|
1.4 |
|
|
$ |
1,169,664 |
|
|
Granted |
|
|
— |
|
|
|
— |
|
|
|
|
|
|
|
|
|
|
Exercised options |
|
|
(1,057,534 |
) |
|
|
9.32 |
|
|
|
|
|
|
|
|
|
|
Forfeited options |
|
|
(14,619 |
) |
|
|
9.53 |
|
|
|
|
|
|
|
|
|
|
Balance at December 31, 2016 |
|
|
1,007,085 |
|
|
$ |
10.82 |
|
|
|
1.0 |
|
|
$ |
— |
|
|
Exercised options |
|
|
(1,007,085 |
) |
|
|
10.82 |
|
|
|
|
|
|
|
|
|
|
Forfeited options |
|
|
— |
|
|
|
— |
|
|
|
|
|
|
|
|
|
|
Balance at December 31, 2017 |
|
|
— |
|
|
$ |
— |
|
|
|
— |
|
|
$ |
— |
|
|
Options exercisable at December 31, 2017 |
|
|
— |
|
|
$ |
— |
|
|
|
— |
|
|
$ |
— |
|
There were 1.0 million and 1.1 million stock options exercised during the years ended December 31, 2017 and 2016, respectively. The Company did not grant any stock options during the years ended December 31, 2017 and 2016.
The Company did not record any compensation expense related to stock options for the years ended December 31, 2017, 2016 or 2015, as all of these options had vested in prior years. As of December 31, 2017, all of the compensation expense related to stock options was fully recognized, and there were none outstanding.
|
24. |
Commitments, Contingencies and Guarantees |
Contractual Obligations and Commitments
The following table summarizes certain of the Company’s contractual obligations at December 31, 2017 (in thousands):
|
|
|
Total |
|
|
Less Than 1 Year |
|
|
1-3 Years |
|
|
3-5 Years |
|
|
More Than 5 Years |
|
|||||
|
Long-term debt and collateralized borrowings1 |
|
$ |
1,658,267 |
|
|
$ |
254,619 |
|
|
$ |
987,840 |
|
|
$ |
303,308 |
|
|
$ |
112,500 |
|
|
Warehouse notes payable |
|
|
360,440 |
|
|
|
360,440 |
|
|
|
— |
|
|
|
— |
|
|
|
— |
|
|
Operating leases2 |
|
|
533,988 |
|
|
|
72,046 |
|
|
|
120,884 |
|
|
|
98,746 |
|
|
|
242,312 |
|
|
Interest on long-term debt and collateralized borrowings3 4 |
|
|
367,635 |
|
|
|
80,754 |
|
|
|
84,457 |
|
|
|
24,588 |
|
|
|
177,836 |
|
|
Short-term borrowings5 |
|
|
6,046 |
|
|
|
6,046 |
|
|
|
— |
|
|
|
— |
|
|
|
— |
|
|
Interest on Short-term borrowings |
|
|
131 |
|
|
|
131 |
|
|
|
— |
|
|
|
— |
|
|
|
— |
|
|
One-time transition tax6 |
|
|
36,566 |
|
|
|
— |
|
|
|
8,775 |
|
|
|
5,851 |
|
|
|
21,940 |
|
|
Other7 |
|
|
30,714 |
|
|
|
8,000 |
|
|
|
16,000 |
|
|
|
6,714 |
|
|
|
— |
|
|
Total contractual obligations |
|
$ |
2,993,787 |
|
|
$ |
782,036 |
|
|
$ |
1,217,956 |
|
|
$ |
439,207 |
|
|
$ |
554,588 |
|
232
|
31, 2017 was approximately $297.0 million), $9.2 million of collateralized borrowings due March 13, 2019, and an additional $26.4 million of collateralized borrowings due May 31, 2021. See Note 22— “Long-term Debt, Collateralized and Short-term Borrowings,” for more information regarding these obligations, including timing of payments and compliance with debt covenants. |
|
2 |
Operating leases are related to rental payments under various non-cancelable leases, principally for office space, net of sublease payments to be received. The total amount of sublease payments to be received is approximately $3.2 million over the life of the agreement. |
|
3 |
Interest on the $400.0 million of borrowings and the $270.7 million of borrowings was projected by using the 1 month LIBOR rate plus 275 bps as of December 31, 2017 through the loans maturity date on September 8, 2019. |
|
4 |
The $177.8 million of interest on notes payable that are due in more than five years represents interest on the 8.125% Senior Notes. The 8.125% Senior Notes may be redeemed for cash, in whole or in part, on or after June 26, 2017, at the Company’s option, which may impact the actual interest paid. |
|
5 |
Short-term borrowings reflects approximately $6.0 million (BRL 20.0 million) of borrowing under the Company’s committed unsecured loan agreement. See Note 22— “Long-term Debt, Collateralized and Short-term Borrowings,” for more information regarding this obligation. |
|
6 |
The Company recorded a provisional amount for the one-time transition tax on deemed repatriated earnings of foreign subsidiaries net of foreign tax credits of $36.6 million with an election to pay the taxes over eight years, with 40% to be paid in equal installments over the first five years and the remaining 60% to be paid in installments of 15%, 20% and 25% in years six, seven and eight, respectively. The provisional amount is a reasonable estimate which may be revised as additional guidance is released and further information becomes available. |
|
7 |
Other contractual obligations reflect commitments to make charitable contributions, which are recorded as part of “Accounts payable, accrued and other liabilities” in the Company’s consolidated statements of financial condition. The amount payable each year reflects an estimate of future Charity Day obligations. |
The Company is obligated for minimum rental payments under various non-cancelable operating leases, principally for office space, expiring at various dates through 2030. Certain of the leases contain escalation clauses that require payment of additional rent to the extent of increases in certain operating or other costs.
As of December 31, 2017, minimum lease payments under these arrangements are as follows (in thousands):
|
|
|
Net Lease Commitment |
|
|
|
2018 |
|
$ |
71,547 |
|
|
2019 |
|
|
65,265 |
|
|
2020 |
|
|
56,118 |
|
|
2021 |
|
|
53,194 |
|
|
2022 |
|
|
45,552 |
|
|
2023 and thereafter |
|
|
242,312 |
|
|
Total |
|
$ |
533,988 |
|
The lease obligations shown above are presented net of payments to be received under a non-cancelable sublease. The total amount of sublease payments to be received is approximately $3.2 million over the life of the agreement.
In addition to the above obligations under non-cancelable operating leases, the Company is also obligated to Cantor for rental payments under Cantor’s various non-cancelable leases with third parties, principally for office space and computer equipment, expiring at various dates through 2030. Certain of these leases have renewal terms at the Company’s option and/or escalation clauses (primarily based on the Consumer Price Index). Cantor allocates a portion of the rental payments to the Company based on square footage used
The Company also allocates a portion of the rental payments for which it is obligated under non-cancelable operating leases to Cantor and its affiliates. These allocations are based on square footage used (see Note 18—“Related Party Transactions,” for more information).
Rent expense for the years ended December 31, 2017, 2016 and 2015 was $84.5 million, $75.5 million and $59.4 million, respectively. Rent expense is included as part of “Occupancy and equipment” in the Company’s consolidated statements of operations.
233
In the event the Company anticipates incurring costs under any of its leases that exceed anticipated sublease revenues, it recognizes a loss and records a liability for the present value of the excess lease obligations over the estimated sublease rental income. The liability for future lease payments associated with vacant space, net of anticipated sublease rental income, was approximately $0.1 million, as of December 31, 2017, and is included as part of “Accounts payable, accrued and other liabilities” in the Company’s consolidated statements of financial condition. There was no liability for future lease payments associated with vacant space as of December 31, 2016. The lease liability takes into consideration various assumptions, including prevailing rental rates.
Contingent Payments Related to Acquisitions
During the year ended December 31, 2017, the Company completed acquisitions, whose purchase price included approximately 0.4 million shares of the Company’s Class A common stock (with an acquisition date fair value of approximately $3.5 million), 0.5 million limited partnership units (with an acquisition date fair value of approximately $5.0 million) and $6.1 million in cash that may be issued contingent on certain targets being met through 2021.
During the year ended December 31, 2016, the Company completed acquisitions, whose purchase price included approximately 0.2 million shares of the Company’s Class A common stock (with an acquisition date fair value of approximately $1.6 million), 1.2 million limited partnership units (with an acquisition date fair value of approximately $8.0 million) and $18.5 million in cash that may be issued contingent on certain targets being met through 2021.
During the year ended December 31, 2015, the Company completed acquisitions, whose purchase price included approximately 0.5 million shares of the Company’s Class A common stock (with an acquisition date fair value of approximately $4.1 million), 1.8 million limited partnership units (with an acquisition date fair value of approximately $15.2 million) and $22.8 million in cash that may be issued contingent on certain targets being met through 2018.
As of December 31, 2017, the Company has issued 7.9 million shares of its Class A common stock, 7.0 million of its limited partnership units and $39.9 million in cash related to contingent payments.
As of December 31, 2017, 2.8 million shares of the Company’s Class A common stock, 2.9 million limited partnership units and $25.7 million in cash remain to be issued if the targets are met. As a result of the Newmark IPO and the related Separation and Distribution Agreement, the limited partnership units as of December 31, 2017 represent 2.9 million and 1.3 million limited partnership units in BGC Holdings and Newmark Holdings, respectively (see Note 2—“Limited Partnership Interests in BGC Holdings and Newmark Holdings” for further details on the Separation and Distribution Agreement).
Contingencies
In the ordinary course of business, various legal actions are brought and are pending against the Company and its subsidiaries in the U.S. and internationally. In some of these actions, substantial amounts are claimed. The Company is also involved, from time to time, in reviews, examinations, investigations and proceedings by governmental and self-regulatory agencies (both formal and informal) regarding the Company’s businesses, which may result in regulatory, civil and criminal judgments, settlements, fines, penalties, injunctions or other relief. The following generally does not include matters that the Company has pending against other parties which, if successful, would result in awards in favor of the Company or its subsidiaries.
Employment, Competitor-Related and Other Litigation
From time to time, the Company and its subsidiaries are involved in litigation, claims and arbitrations in the U.S. and internationally, relating to, inter alia, various employment matters, including with respect to termination of employment, hiring of employees currently or previously employed by competitors, terms and conditions of employment and other matters. In light of the competitive nature of the brokerage industry, litigation, claims and arbitration between competitors regarding employee hiring are not uncommon. The Company is also involved, from time to time, in other reviews, investigations and proceedings by governmental and self-regulatory agencies (both formal and informal) regarding the Company’s business. Any such actions may result in regulatory, civil or criminal judgments, settlements, fines, penalties, injunctions or other relief.
Legal reserves are established in accordance with U.S. GAAP guidance on Accounting for Contingencies, when a material legal liability is both probable and reasonably estimable. Once established, reserves are adjusted when there is more information available or when an event occurs requiring a change. The outcome of such items cannot be determined with certainty. The Company is unable to estimate a possible loss or range of loss in connection with specific matters beyond its current accrual and any other amounts disclosed. Management believes that, based on currently available information, the final outcome of these current pending matters will not have a material adverse effect on the Company’s consolidated financial statements and disclosures taken as a whole.
234
The Company has irrevocable uncollateralized letters of credit with various banks, where the beneficiaries are clearing organizations through which it transacted, that are used in lieu of margin and deposits with those clearing organizations. As of December 31, 2017 and December 31, 2016, the Company was contingently liable for $1.0 million and $1.6 million, respectively, under these letters of credit.
Risk and Uncertainties
The Company generates revenues by providing financial intermediary, securities trading and brokerage activities, and commercial real estate services to institutional customers and by executing and, in some cases, clearing transactions for institutional counterparties. Revenues for these services are transaction-based. As a result, revenues could vary based on the transaction volume of global financial and real estate markets. Additionally, financing is sensitive to interest rate fluctuations, which could have an impact on the Company’s overall profitability.
Insurance
The Company is self-insured for health care claims, up to a stop-loss amount for eligible participating employees and qualified dependents in the United States, subject to deductibles and limitations. The Company’s liability for claims incurred but not reported is determined based on an estimate of the ultimate aggregate liability for claims incurred. The estimate is calculated from actual claim rates and adjusted periodically as necessary. The Company has accrued $4.3 million in health care claims as of December 31, 2017. The Company does not expect the impact of the health care claims to have a material impact on its financial condition, results of operations or cash flows.
Guarantees
The Company provides guarantees to securities clearinghouses and exchanges which meet the definition of a guarantee under FASB interpretations. Under these standard securities clearinghouse and exchange membership agreements, members are required to guarantee, collectively, the performance of other members and, accordingly, if another member becomes unable to satisfy its obligations to the clearinghouse or exchange, all other members would be required to meet the shortfall. In the opinion of management, the Company’s liability under these agreements is not quantifiable and could exceed the cash and securities it has posted as collateral. However, the potential of being required to make payments under these arrangements is remote. Accordingly, no contingent liability has been recorded in the Company’s consolidated statements of financial condition for these agreements.
Indemnifications
In connection with the sale of eSpeed, the Company has indemnified Nasdaq for amounts over a defined threshold against damages arising from breaches of representations, warranties and covenants. In addition, in connection with the acquisition of GFI, the Company has indemnified the directors and officers of GFI. As of December 31, 2017, no contingent liability has been recorded in the Company’s consolidated statements of financial condition for these indemnifications, as the potential for being required to make payments under these indemnifications is remote.
Contractual Obligations
As of December 31, 2017 and 2016, the Company was committed to fund approximately $244 million and $207 million, respectively, which is the total remaining draws on construction loans originated by the Company under the HUD 221(d)4, 220 and 232 programs, rate locked loans that have not been funded, forward commitments, as well as the funding for credit facilities. In addition, the Company has corresponding commitments to sell these loans to various investors as they are funded.
|
25. |
Income Taxes |
The Company’s consolidated financial statements include U.S. federal, state and local income taxes on the Company’s allocable share of the U.S. results of operations, as well as taxes payable to jurisdictions outside the U.S. In addition, certain of the Company’s entities are taxed as U.S. partnerships and are subject to the Unincorporated Business Tax (“UBT”) in New York City. Therefore, the tax liability or benefit related to the partnership income or loss except for UBT rests with the partners (see Note 2—“Limited Partnership Interests in BGC Holdings and Newmark Holdings” for discussion of partnership interests) rather than the partnership entity.
235
The provision for income taxes consisted of the following (in thousands):
|
|
|
Year Ended December 31, |
|
|||||||||
|
|
|
2017 |
|
|
2016 |
|
|
2015 |
|
|||
|
Current: |
|
|
|
|
|
|
|
|
|
|
|
|
|
U.S. federal |
|
$ |
42,492 |
|
|
$ |
62,746 |
|
|
$ |
27,299 |
|
|
U.S. state and local |
|
|
3,730 |
|
|
|
736 |
|
|
|
8,114 |
|
|
Foreign |
|
|
35,477 |
|
|
|
26,644 |
|
|
|
22,249 |
|
|
UBT |
|
|
4,309 |
|
|
|
3,451 |
|
|
|
2,942 |
|
|
|
|
|
86,008 |
|
|
|
93,577 |
|
|
|
60,604 |
|
|
Deferred: |
|
|
|
|
|
|
|
|
|
|
|
|
|
U.S. federal |
|
|
76,225 |
|
|
|
(44,562 |
) |
|
|
76,539 |
|
|
U.S. state and local |
|
|
(12,242 |
) |
|
|
8,097 |
|
|
|
(25,118 |
) |
|
Foreign |
|
|
(353 |
) |
|
|
4,694 |
|
|
|
10,549 |
|
|
UBT |
|
|
630 |
|
|
|
(1,474 |
) |
|
|
(1,955 |
) |
|
|
|
|
64,260 |
|
|
|
(33,245 |
) |
|
|
60,015 |
|
|
Provision for income taxes |
|
$ |
150,268 |
|
|
$ |
60,332 |
|
|
$ |
120,619 |
|
The Company had pre-tax income of $232.0 million, $314.2 million and $438.8 million for the years ended December 31, 2017, 2016 and 2015, respectively. The pre-tax income for the year ended December 31, 2015 was primarily related to the sale of Trayport.
The Company had pre-tax income (loss) from domestic operations of $73.7 million, $139.6 million and $(70.0) million for the years ended December 31, 2017, 2016 and 2015, respectively. The Company’s pre-tax loss from domestic operations in the year ended December 31, 2015 was primarily related to the charges taken concurrently with the sale of Trayport. The Company had pre-tax income (loss) from foreign operations of $158.3 million, $174.6 million and $508.8 million for the years ended December 31, 2017, 2016 and 2015, respectively.
Differences between the Company’s actual income tax expense and the amount calculated utilizing the U.S. federal statutory rates were as follows (in thousands):
|
|
|
Year Ended December 31, |
|
|||||||||
|
|
|
2017 |
|
|
2016 |
|
|
2015 |
|
|||
|
Federal income tax expense at 35% statutory rate |
|
$ |
81,200 |
|
|
$ |
109,970 |
|
|
$ |
153,580 |
|
|
Non-controlling interest |
|
|
(3,857 |
) |
|
|
(8,958 |
) |
|
|
15,660 |
|
|
Incremental impact of foreign taxes compared to federal tax rate |
|
|
(20,886 |
) |
|
|
(19,851 |
) |
|
|
(5,037 |
) |
|
Income from recast periods |
|
|
(34,224 |
) |
|
|
(50,243 |
) |
|
|
(184,295 |
) |
|
Other permanent differences |
|
|
11,069 |
|
|
|
7,018 |
|
|
|
7,665 |
|
|
U.S. state and local taxes, net of U.S. federal benefit |
|
|
2,075 |
|
|
|
14,051 |
|
|
|
(3,870 |
) |
|
New York City UBT |
|
|
828 |
|
|
|
1,646 |
|
|
|
(1,081 |
) |
|
One-time transition tax related to tax reform |
|
|
36,566 |
|
|
|
— |
|
|
|
— |
|
|
Other rate changes |
|
|
(9,964 |
) |
|
|
1,912 |
|
|
|
3,511 |
|
|
Revaluation of deferred taxes related to tax reform |
|
|
84,340 |
|
|
|
— |
|
|
|
— |
|
|
Uncertain tax positions |
|
|
4,858 |
|
|
|
1,520 |
|
|
|
(6,425 |
) |
|
U.S. tax on foreign earnings, net of tax credits |
|
|
— |
|
|
|
— |
|
|
|
137,122 |
|
|
U.S. valuation allowance |
|
|
— |
|
|
|
(1,269 |
) |
|
|
(12,856 |
) |
|
Other |
|
|
(1,737 |
) |
|
|
4,536 |
|
|
|
16,645 |
|
|
Provision for income taxes |
|
$ |
150,268 |
|
|
$ |
60,332 |
|
|
$ |
120,619 |
|
The Tax Cut and Jobs Act was enacted on December 22, 2017. The Act reduces the US federal corporate tax rate from 35% to 21%, requires companies to pay a one-time transition tax on earnings of certain foreign subsidiaries that were previously tax deferred and creates new taxes on certain foreign sourced earnings. At December 31, 2017, the Company had not completed its accounting for the tax effects of enactment of the Act; however, as described below, it has made a reasonable estimate of the effects on our existing deferred tax balances and the one-time transition tax. For these items, it was able to determine a reasonable estimate for which it recognized a provisional amount of $120.9 million, which is included as a component of income tax expense from continuing operations. The Company will continue to make and refine its calculations as additional analysis is completed. In addition, the Company’s estimates may also be affected as additional guidance is released and better information becomes available.
236
The Company recorded a provisional amount of $84.3 million tax expense for the impact of the remeasurement of the Company’s deferred tax inventory. The Company remeasured the deferred tax balances based on the rates at which they are expected to reverse in the future, which is generally expected to be 21%. However, it is still analyzing certain aspects of the Act and refining its calculations, which could potentially affect the measurement of these balances or potentially give rise to new deferred tax amounts.
The Company recorded a provisional amount for the one-time transition tax on deemed repatriated earnings of foreign subsidiaries net of foreign tax credits of $36.6 million of tax expense for the year ended December 31, 2017. The Company has not yet completed our calculation of the total post-1986 E&P for these foreign subsidiaries. Further, the transition tax is based in part on the amount of those earnings held in cash and other specified assets. The provisional amount may change when it finalizes the calculation of post-1986 foreign E&P previously deferred from US federal taxation and finalize the amounts held in cash or other specified assets. As of December 31, 2017, except for the cash proceeds from the sale of Trayport, the Company’s intention to permanently reinvest these undistributed foreign pre-tax earnings in the Company’s foreign operations remains unchanged. However, this policy will be further re-evaluated and assessed based on the Company’s overall business needs and requirements.
Deferred tax assets and liabilities are recognized for the future tax consequences attributable to differences between the consolidated financial statement carrying amounts of existing assets and liabilities and their respective tax bases. Deferred tax assets and liabilities are measured using enacted tax rates expected to apply to taxable income in the years in which those temporary differences are expected to be recovered or settled. The effect on deferred tax assets and liabilities of a change in tax rates is recognized in income in the period that includes the enactment date. A valuation allowance is recorded against deferred tax assets if it is deemed more likely than not that those assets will not be realized.
Significant components of the Company’s deferred tax asset and liability consisted of the following (in thousands):
|
|
|
Year Ended December 31, |
|
|||||
|
|
|
2017 |
|
|
2016 |
|
||
|
Deferred tax asset |
|
|
|
|
|
|
|
|
|
Basis difference of investments |
|
|
75,125 |
|
|
|
5,024 |
|
|
Deferred compensation |
|
|
153,869 |
|
|
|
140,252 |
|
|
Other deferred and accrued expenses |
|
|
16,244 |
|
|
|
40,863 |
|
|
Net operating loss and credit carry-forwards |
|
|
54,588 |
|
|
|
84,214 |
|
|
Total deferred tax asset1 |
|
|
299,826 |
|
|
|
270,353 |
|
|
Valuation allowance |
|
|
(35,381 |
) |
|
|
(38,553 |
) |
|
Deferred tax asset, net of valuation allowance |
|
|
264,445 |
|
|
|
231,800 |
|
|
Deferred tax liability |
|
|
|
|
|
|
|
|
|
Depreciation and amortization |
|
|
32,976 |
|
|
|
6,925 |
|
|
U.S. tax on foreign earnings |
|
|
16,799 |
|
|
|
40,614 |
|
|
Other |
|
|
832 |
|
|
|
— |
|
|
Total deferred tax liability1 |
|
|
50,607 |
|
|
|
47,539 |
|
|
Net deferred tax asset |
|
$ |
213,838 |
|
|
$ |
184,261 |
|
|
1 |
Before netting within tax jurisdictions. |
Deferred tax assets and liabilities are recognized for the future tax consequences attributable to basis differences between the carrying amounts of existing assets and liabilities and their respective tax basis. Accordingly, a deferred tax asset of $108.6 million has been recorded against equity for the period ended December 31, 2017 for the basis difference between Berkeley Point’s net assets and its tax basis.
The Company has deferred tax assets associated with net operating losses in U.S. Federal, U.S. state and local, and non-U.S. jurisdictions of $3.2 million, $7.8 million and $40.3 million, respectively. These losses will begin to expire in 2019, 2025 and 2018, respectively. The Company’s deferred tax asset and liability are included in the Company’s consolidated statements of financial condition as components of “Other assets” and “Accounts payable, accrued and other liabilities,” respectively.
As a result of the adoption of ASU 2016-09, the Company recorded a deferred tax asset of $1.1 million with respect to U.S. Federal net operating losses related to previously unrecognized tax benefits outstanding as of January 1, 2017.
Pursuant to FASB guidance on Accounting for Uncertainty in Income Taxes, the Company provides for uncertain tax positions as a component of income tax expense based upon management’s assessment of whether a tax benefit is more likely than not to be sustained upon examination by tax authorities.
237
A reconciliation of the beginning to the ending amounts of gross unrecognized tax benefits for the years ended December 31, 2017 and 2016 is as follows (in thousands):
|
Balance, December 31, 2015 |
|
$ |
1,558 |
|
|
Increases for prior year tax positions |
|
|
1,503 |
|
|
Decreases for prior year tax positions |
|
|
— |
|
|
Increases for current year tax positions |
|
|
17 |
|
|
Decreases related to settlements with taxing authorities |
|
|
— |
|
|
Decreases related to a lapse of applicable statute of limitations |
|
|
— |
|
|
Balance, December 31, 2016 |
|
$ |
3,078 |
|
|
Increases for prior year tax positions |
|
|
3,855 |
|
|
Decreases for prior year tax positions |
|
|
— |
|
|
Increases for current year tax positions |
|
|
130 |
|
|
Decreases related to settlements with taxing authorities |
|
|
— |
|
|
Decreases related to a lapse of applicable statute of limitations |
|
|
— |
|
|
Balance, December 31, 2017 |
|
$ |
7,063 |
|
As of December 31, 2017, the Company’s unrecognized tax benefits, excluding related interest and penalties, were $7.1 million, of which $7.1 million, if recognized, would affect the effective tax rate. The Company is currently open to examination by tax authorities for tax years beginning 2008 in United States Federal, state and local jurisdictions and certain non-U.S. jurisdictions. The Company is currently under examination by tax authorities in the United States Federal and certain state and local jurisdictions. It is reasonably possible that over the next 12 months, the resolution of these examinations may decrease the balance of unrecognized tax benefits by as much as $3.0 million.
The Company recognizes interest and penalties related to unrecognized tax benefits in “Provision for income taxes”in the Company’s consolidated statements of operations. As of December 31, 2017, the Company accrued $2.7 million for income tax-related interest and penalties of which $2.4 million was accrued during 2017.
|
26. |
Financial Guarantee Liability |
The Company shares risk of loss for loans originated under the Fannie Mae DUS and Freddie TAH programs and could incur losses in the event of defaults under or foreclosure of these loans. Under the guarantee, the Company’s maximum contingent liability to the extent of actual losses incurred is approximately 33% of the outstanding principal balance on Fannie Mae DUS or Freddie TAH loans. Risk sharing percentages are established on a loan by loan basis when originated with most loans at 33% and “modified” loans at lower percentages. Under certain circumstances, risk sharing percentages can be revised subsequent to origination or the Company could be required to repurchase the loan. In the event of a loss resulting from a catastrophic event that is not required to be covered by borrowers’ insurance policies, the Company can recover the loss under its mortgage impairment insurance policy. Any potential recovery is subject to the policy’s deductibles and limits.
At December 31, 2017, the credit risk loans being serviced by the Company on behalf of Fannie Mae and Freddie Mac had outstanding principal balances of approximately $18.8 billion with a maximum potential loss of approximately $5.3 billion, of which $1.2 billion is covered by the Credit Enhancement Agreement (see Note 15—“Credit Enhancement Receivable, Credit Enhancement Deposit and Contingent Liability ” ).
At December 31, 2016, the credit risk loans being serviced by the Company on behalf of Fannie Mae and Freddie Mac had outstanding principal balances of approximately $16.9 billion with a maximum potential loss of approximately $4.7 billion, of which $1.6 billion is covered by the Credit Enhancement Agreement (see Note 15—“Credit Enhancement Receivable, Credit Enhancement Deposit and Contingent Liability ” ).
At December 31, 2017 and 2016, the estimated liability under the guarantee liability, included in “Accounts payable, accrued and other liabilities” in the consolidated statements of financial condition, was as follows (in thousands):
|
Balance at December 31, 2015 |
|
$ |
(288 |
) |
|
Increase to provision |
|
|
(125 |
) |
|
Balance at December 31, 2016 |
|
$ |
(413 |
) |
|
Reversal to provision |
|
|
359 |
|
|
Balance at December 31, 2017 |
|
$ |
(54 |
) |
238
In order to monitor and mitigate potential losses, the Company uses an internally developed loan rating scorecard for determining which loans meet the Company’s criteria to be placed on a watch list. The Company also calculates default probabilities based on internal ratings and expected losses on a loan by loan basis. This methodology uses a number of factors including, but not limited to, debt service coverage ratios, collateral valuation, the condition of the underlying assets, borrower strength and market conditions.
See Note 15—“Credit Enhancement Receivable, Credit Enhancement Deposit and Contingent Liability” for further explanation of credit protection provided by DB Cayman. The provisions for risk sharing, included in “Other expenses” in the accompanying consolidated statements of operations, was as follows (in thousands):
|
|
|
For the year ended December 31, |
|
|||||||||
|
|
|
2017 |
|
|
2016 |
|
|
2015 |
|
|||
|
Increase (decrease) to financial guarantee liability |
|
$ |
(359 |
) |
|
$ |
125 |
|
|
$ |
(1,178 |
) |
|
Decrease (increase) to credit enhancement asset |
|
|
147 |
|
|
|
101 |
|
|
|
1,043 |
|
|
Increase (decrease) to contingent liability |
|
|
6 |
|
|
|
5 |
|
|
|
54 |
|
|
Total provision for risk-sharing obligations |
|
$ |
(206 |
) |
|
$ |
231 |
|
|
$ |
(81 |
) |
|
27. |
Concentrations of Credit Risk |
The lending activities of the Company create credit risk in the event that counterparties do not fulfill their contractual payment obligations. In particular, the Company is exposed to credit risk related to the Fannie Mae DUS and Freddie Mac TAH loans. As of December 31, 2017, 26% of $5.3 billion of the maximum loss was for properties located in California. As of December 31, 2016, 29% of $4.7 billion of the maximum loss was for properties located in California. See Note 26—“Financial Guarantee Liability” for additional information.
|
28. |
Escrow and Custodial Funds |
In conjunction with the servicing of multifamily and commercial loans, the Company holds escrow and other custodial funds. Escrow funds are held at unaffiliated financial institutions generally in the form of cash and cash equivalents. These funds amounted to approximately $0.8 billion and $1.1 billion, as of December 31, 2017 and 2016, respectively. These funds are held for the benefit of the Company’s borrowers and are segregated in custodial bank accounts. These amounts are excluded from the assets and liabilities of the Company.
|
29. |
Regulatory Requirements |
Many of the Company’s businesses are subject to regulatory restrictions and minimum capital requirements. These regulatory restrictions and capital requirements may restrict the Company’s ability to withdraw capital from its subsidiaries.
Certain U.S. subsidiaries of the Company are registered as U.S. broker-dealers or Futures Commissions Merchants subject to Rule 15c3-1 of the SEC and Rule 1.17 of the Commodity Futures Trading Commission, which specify uniform minimum net capital requirements, as defined, for their registrants, and also require a significant part of the registrants’ assets be kept in relatively liquid form. As of December 31, 2017, the Company’s U.S. subsidiaries had net capital in excess of their minimum capital requirements.
Certain European subsidiaries of the Company are regulated by the Financial Conduct Authority (the “FCA”) and must maintain financial resources (as defined by the FCA) in excess of the total financial resources requirement of the FCA. As of December 31, 2017, the European subsidiaries had financial resources in excess of their requirements.
Certain other subsidiaries of the Company are subject to regulatory and other requirements of the jurisdictions in which they operate.
In addition, the Company’s Swap Execution Facilities (“SEFs”), BGC Derivative Markets and GFI Swaps Exchange, are required to maintain financial resources to cover operating costs for at least one year, keeping at least enough cash or highly liquid securities to cover six months’ operating costs.
The regulatory requirements referred to above may restrict the Company’s ability to withdraw capital from its regulated subsidiaries. As of December 31, 2017, $515.6 million of net assets were held by regulated subsidiaries. These subsidiaries had aggregate regulatory net capital, as defined, in excess of the aggregate regulatory requirements, as defined, of $255.6 million.
239
As a result of the Berkeley Point Acquisition, the Company is now subject to various capital requirements in connection with seller/servicer agreements that the Company has entered into with the various GSEs. Failure to maintain minimum capital requirements could result in the Company’s inability to originate and service loans for the respective GSEs and could have a direct material adverse effect on the Company’s consolidated financial statements. As of December 31, 2017 and 2016, the Company has met all capital requirements. As of December 31, 2017 the most restrictive capital requirement was Fannie Mae’s net worth requirement. The Company exceeded the minimum requirement by $347.4 million.
Certain of the Company’s agreements with Fannie Mae allow the Company to originate and service loans under Fannie Mae’s DUS Program. These agreements require the Company to maintain sufficient collateral to meet Fannie Mae’s restricted and operational liquidity requirements based on a pre-established formula. Certain of the Company’s agreements with Freddie Mac allow the Company to service loans under Freddie Mac’s TAH program. These agreements require the Company to pledge sufficient collateral to meet Freddie Mac’s liquidity requirement of 8% of the outstanding principal of TAH loans serviced by the Company. Management believes that as of December 31, 2017 and 2016, the Company has met all liquidity requirements.
In addition, as a servicer for Fannie Mae, GNMA and FHA, the Company is required to advance to investors any uncollected principal and interest due from borrowers. As of December 31, 2017 and 2016 outstanding borrower advances were approximately $120 thousand and $106 thousand, respectively, and are included in “Other assets” in the accompanying consolidated statements of financial condition.
|
30. |
Segment and Geographic Information |
Segment Information
The Company’s business segments are determined based on the products and services provided and reflect the manner in which financial information is evaluated by management. The Company’s operations consist of two reportable segments, Financial Services and Real Estate Services.
The Company’s Financial Services segment specializes in the brokerage of a broad range of products, including fixed income (rates and credit), foreign exchange, equities, insurance, energy and commodities, and futures. It also provides a wide range of services, including trade execution, broker-dealer services, clearing, trade compression, post trade, information, and other back-office services to a broad range of financial and non-financial institutions. The Company’s Real Estate Services segment offers commercial real estate tenants, owners, investors and developers a wide range of services, including leasing and corporate advisory, investment sales and real estate finance, consulting, project and development management, property and facilities management, and multifamily lending through government-sponsored and government-funded loan programs, as well as the servicing of the loans that it originates and other commercial real estate loans.
The Company evaluates the performance and reviews the results of the segments based on each segment’s “Income (loss) from operations before income taxes.”
The amounts shown below for the Financial Services and Real Estate Services segments reflect the amounts that are used by management to allocate resources and assess performance, which is based on each segment’s “Income (loss) from operations before income taxes.” In addition to the two business segments, the tables below include a “Corporate Items” category. Corporate revenues include fees from related parties and interest income. Corporate expenses include non-cash compensation expenses (such as the grant of exchangeability to limited partnership units; redemption/exchange of partnership units, issuance of restricted shares and a reserve on compensation-related partnership loans; and allocations of net income to limited partnership units and FPUs), as well as unallocated expenses, such as certain professional and consulting fees, executive compensation and interest expense, which are managed separately at the corporate level. Corporate other income (losses), net includes gains that are not considered part of the Company’s ordinary, ongoing business, such as the realized gain related to the GFI shares owned by the Company prior to the completion of the tender offer to acquire GFI on February 26, 2015, the gain related to the disposition of the equity interests in the entities that make up the Trayport business, the mark-to-market on ICE common shares and any related hedging transactions when applicable, and the adjustment of future earn-out payments.
During the third quarter of 2017, the Company transferred the right to receive earn-out payments from Nasdaq from the Financial Services segment to the Real Estate Services segment. As a result, the Nasdaq payment for the third quarter of 2017 was recorded as “Other income (loss)” in the Real Estate Services segment.
Certain financial information for the Company’s segments is presented below. Certain reclassifications have been made to previously reported amounts to conform to the current presentation. See Note 21—“Goodwill and Other Intangible Assets, Net,” for goodwill by reportable segment.
240
Year ended December 31, 2017 (in thousands):
|
|
|
Financial Services |
|
|
Real Estate Services |
|
|
Corporate Items |
|
|
Total |
|
||||
|
Brokerage revenues: |
|
|
|
|
|
|
|
|
|
|
|
|
|
|
|
|
|
Rates |
|
$ |
510,880 |
|
|
$ |
— |
|
|
$ |
— |
|
|
$ |
510,880 |
|
|
Credit |
|
|
284,551 |
|
|
|
— |
|
|
|
— |
|
|
|
284,551 |
|
|
Foreign exchange |
|
|
324,386 |
|
|
|
— |
|
|
|
— |
|
|
|
324,386 |
|
|
Energy and commodities |
|
|
204,016 |
|
|
|
— |
|
|
|
— |
|
|
|
204,016 |
|
|
Equities, insurance, and other asset classes |
|
|
327,390 |
|
|
|
— |
|
|
|
— |
|
|
|
327,390 |
|
|
Leasing and other services |
|
|
— |
|
|
|
617,005 |
|
|
|
— |
|
|
|
617,005 |
|
|
Real estate capital markets |
|
|
— |
|
|
|
397,736 |
|
|
|
— |
|
|
|
397,736 |
|
|
Gains from mortgage banking activities, net |
|
|
— |
|
|
|
205,999 |
|
|
|
— |
|
|
|
205,999 |
|
|
Real estate management and other services |
|
|
— |
|
|
|
233,063 |
|
|
|
— |
|
|
|
233,063 |
|
|
Servicing fees |
|
|
— |
|
|
|
110,441 |
|
|
|
— |
|
|
|
110,441 |
|
|
Fees from related parties |
|
|
— |
|
|
|
1,373 |
|
|
|
27,094 |
|
|
|
28,467 |
|
|
Data, software and post-trade |
|
|
54,557 |
|
|
|
— |
|
|
|
— |
|
|
|
54,557 |
|
|
Other revenues |
|
|
3,283 |
|
|
|
242 |
|
|
|
237 |
|
|
|
3,762 |
|
|
Total non-interest revenues |
|
|
1,709,063 |
|
|
|
1,565,859 |
|
|
|
27,331 |
|
|
|
3,302,253 |
|
|
Interest income |
|
|
2,761 |
|
|
|
35,561 |
|
|
|
12,781 |
|
|
|
51,103 |
|
|
Total revenues |
|
|
1,711,824 |
|
|
|
1,601,420 |
|
|
|
40,112 |
|
|
|
3,353,356 |
|
|
Interest expense |
|
|
— |
|
|
|
20,273 |
|
|
|
82,231 |
|
|
|
102,504 |
|
|
Non-interest expenses |
|
|
1,398,264 |
|
|
|
1,281,230 |
|
|
|
444,055 |
|
|
|
3,123,549 |
|
|
Total expenses |
|
|
1,398,264 |
|
|
|
1,301,503 |
|
|
|
526,286 |
|
|
|
3,226,053 |
|
|
Other income (losses), net: |
|
|
|
|
|
|
|
|
|
|
|
|
|
|
|
|
|
Gain (loss) on divestiture and sale of investments |
|
|
— |
|
|
|
— |
|
|
|
561 |
|
|
|
561 |
|
|
Gains (losses) on equity investments |
|
|
— |
|
|
|
— |
|
|
|
6,189 |
|
|
|
6,189 |
|
|
Other income (losses) |
|
|
19,727 |
|
|
|
76,332 |
|
|
|
1,885 |
|
|
|
97,944 |
|
|
Total other income (losses), net |
|
|
19,727 |
|
|
|
76,332 |
|
|
|
8,635 |
|
|
|
104,694 |
|
|
Income (loss) from operations before income taxes |
|
$ |
333,287 |
|
|
$ |
376,249 |
|
|
$ |
(477,539 |
) |
|
$ |
231,997 |
|
241
Year ended December 31, 2016 (in thousands):
|
|
|
Financial Services |
|
|
Real Estate Services |
|
|
Corporate Items |
|
|
Total |
|
||||
|
Brokerage revenues: |
|
|
|
|
|
|
|
|
|
|
|
|
|
|
|
|
|
Rates |
|
$ |
468,798 |
|
|
$ |
— |
|
|
$ |
— |
|
|
$ |
468,798 |
|
|
Credit |
|
|
291,760 |
|
|
|
— |
|
|
|
— |
|
|
|
291,760 |
|
|
Foreign exchange |
|
|
303,310 |
|
|
|
— |
|
|
|
— |
|
|
|
303,310 |
|
|
Energy and commodities |
|
|
222,876 |
|
|
|
— |
|
|
|
— |
|
|
|
222,876 |
|
|
Equities, insurance, and other asset classes |
|
|
174,985 |
|
|
|
— |
|
|
|
— |
|
|
|
174,985 |
|
|
Leasing and other services |
|
|
— |
|
|
|
513,812 |
|
|
|
— |
|
|
|
513,812 |
|
|
Real estate capital markets |
|
|
— |
|
|
|
335,607 |
|
|
|
— |
|
|
|
335,607 |
|
|
Gains from mortgage banking activities, net |
|
|
— |
|
|
|
193,387 |
|
|
|
— |
|
|
|
193,387 |
|
|
Real estate management and other services |
|
|
— |
|
|
|
196,801 |
|
|
|
— |
|
|
|
196,801 |
|
|
Servicing fees |
|
|
— |
|
|
|
87,671 |
|
|
|
— |
|
|
|
87,671 |
|
|
Fees from related parties |
|
|
— |
|
|
|
1,370 |
|
|
|
24,200 |
|
|
|
25,570 |
|
|
Data, software and post-trade |
|
|
54,309 |
|
|
|
— |
|
|
|
— |
|
|
|
54,309 |
|
|
Other revenues |
|
|
4,596 |
|
|
|
168 |
|
|
|
570 |
|
|
|
5,334 |
|
|
Total non-interest revenues |
|
|
1,520,634 |
|
|
|
1,328,816 |
|
|
|
24,770 |
|
|
|
2,874,220 |
|
|
Interest income |
|
|
2,601 |
|
|
|
24,904 |
|
|
|
6,371 |
|
|
|
33,876 |
|
|
Total revenues |
|
|
1,523,235 |
|
|
|
1,353,720 |
|
|
|
31,141 |
|
|
|
2,908,096 |
|
|
Interest expense |
|
|
— |
|
|
|
11,478 |
|
|
|
59,887 |
|
|
|
71,365 |
|
|
Non-interest expenses |
|
|
1,275,397 |
|
|
|
1,087,718 |
|
|
|
267,246 |
|
|
|
2,630,361 |
|
|
Total expenses |
|
|
1,275,397 |
|
|
|
1,099,196 |
|
|
|
327,133 |
|
|
|
2,701,726 |
|
|
Other income (losses), net: |
|
|
|
|
|
|
|
|
|
|
|
|
|
|
|
|
|
Gain (loss) on divestiture and sale of investments |
|
|
— |
|
|
|
— |
|
|
|
7,044 |
|
|
|
7,044 |
|
|
Gains (losses) on equity investments |
|
|
— |
|
|
|
— |
|
|
|
3,543 |
|
|
|
3,543 |
|
|
Other income (losses) |
|
|
78,701 |
|
|
|
— |
|
|
|
18,512 |
|
|
|
97,213 |
|
|
Total other income (losses), net |
|
|
78,701 |
|
|
|
— |
|
|
|
29,099 |
|
|
|
107,800 |
|
|
Income (loss) from operations before income taxes |
|
$ |
326,539 |
|
|
$ |
254,524 |
|
|
$ |
(266,893 |
) |
|
$ |
314,170 |
|
242
Year ended December 31, 2015 (in thousands):
|
|
|
Financial Services |
|
|
Real Estate Services |
|
|
Corporate Items |
|
|
Total |
|
||||
|
Brokerage revenues: |
|
|
|
|
|
|
|
|
|
|
|
|
|
|
|
|
|
Rates |
|
$ |
471,239 |
|
|
$ |
— |
|
|
$ |
— |
|
|
$ |
471,239 |
|
|
Credit |
|
|
271,601 |
|
|
|
— |
|
|
|
— |
|
|
|
271,601 |
|
|
Foreign exchange |
|
|
324,774 |
|
|
|
— |
|
|
|
— |
|
|
|
324,774 |
|
|
Energy and commodities |
|
|
196,190 |
|
|
|
— |
|
|
|
— |
|
|
|
196,190 |
|
|
Equities, insurance, and other asset classes |
|
|
172,320 |
|
|
|
— |
|
|
|
— |
|
|
|
172,320 |
|
|
Leasing and other services |
|
|
— |
|
|
|
539,727 |
|
|
|
— |
|
|
|
539,727 |
|
|
Real estate capital markets |
|
|
— |
|
|
|
267,204 |
|
|
|
— |
|
|
|
267,204 |
|
|
Gains from mortgage banking activities, net |
|
|
— |
|
|
|
115,304 |
|
|
|
— |
|
|
|
115,304 |
|
|
Real estate management and other services |
|
|
— |
|
|
|
187,118 |
|
|
|
— |
|
|
|
187,118 |
|
|
Servicing fees |
|
|
— |
|
|
|
74,356 |
|
|
|
— |
|
|
|
74,356 |
|
|
Fees from related parties |
|
|
108 |
|
|
|
1,495 |
|
|
|
25,240 |
|
|
|
26,843 |
|
|
Data, software and post-trade |
|
|
102,371 |
|
|
|
— |
|
|
|
— |
|
|
|
102,371 |
|
|
Other revenues |
|
|
8,174 |
|
|
|
1,270 |
|
|
|
513 |
|
|
|
9,957 |
|
|
Total non-interest revenues |
|
|
1,546,777 |
|
|
|
1,186,474 |
|
|
|
25,753 |
|
|
|
2,759,004 |
|
|
Interest income |
|
|
1,382 |
|
|
|
15,206 |
|
|
|
8,154 |
|
|
|
24,742 |
|
|
Total revenues |
|
|
1,548,159 |
|
|
|
1,201,680 |
|
|
|
33,907 |
|
|
|
2,783,746 |
|
|
Interest expense |
|
|
661 |
|
|
|
9,508 |
|
|
|
68,860 |
|
|
|
79,029 |
|
|
Non-interest expenses |
|
|
1,330,648 |
|
|
|
1,001,869 |
|
|
|
453,076 |
|
|
|
2,785,593 |
|
|
Total expenses |
|
|
1,331,309 |
|
|
|
1,011,377 |
|
|
|
521,936 |
|
|
|
2,864,622 |
|
|
Other income (losses), net: |
|
|
|
|
|
|
|
|
|
|
|
|
|
|
|
|
|
Gains (losses) on divestiture and sale of investments |
|
|
— |
|
|
|
— |
|
|
|
394,347 |
|
|
|
394,347 |
|
|
Gains (losses) on equity method investments |
|
|
— |
|
|
|
— |
|
|
|
2,597 |
|
|
|
2,597 |
|
|
Other income (losses) |
|
|
68,033 |
|
|
|
— |
|
|
|
54,675 |
|
|
|
122,708 |
|
|
Total other income (losses), net |
|
|
68,033 |
|
|
|
— |
|
|
|
451,619 |
|
|
|
519,652 |
|
|
Income (loss) from operations before income taxes |
|
$ |
284,883 |
|
|
$ |
190,303 |
|
|
$ |
(36,410 |
) |
|
$ |
438,776 |
|
Total assets by reportable segment (in thousands):
|
Total Assets1 |
|
Financial Services |
|
|
Real Estate Services |
|
|
Total |
|
|||
|
At December 31, 2017 |
|
$ |
3,173,441 |
|
|
$ |
2,283,689 |
|
|
$ |
5,457,130 |
|
|
At December 31, 2016 |
|
$ |
2,645,738 |
|
|
$ |
2,401,848 |
|
|
$ |
5,047,586 |
|
|
1 |
Corporate assets have been fully allocated to the Company’s business segments. |
Geographic Information
The Company offers products and services in the U.S., U.K., Asia (including Australia), France, Other Americas, Other Europe, and the Middle East and Africa region (defined as the “MEA” region). Information regarding revenues for the years ended December 31, 2017, 2016 and 2015, respectively, is as follows (in thousands):
|
|
|
Year Ended December 31, |
|
|||||||||
|
|
|
2017 |
|
|
2016 |
|
|
2015 |
|
|||
|
Revenues: |
|
|
|
|
|
|
|
|
|
|
|
|
|
United States |
|
$ |
2,100,876 |
|
|
$ |
1,826,929 |
|
|
$ |
1,709,118 |
|
|
United Kingdom |
|
|
723,913 |
|
|
|
620,100 |
|
|
|
634,336 |
|
|
Asia |
|
|
245,569 |
|
|
|
214,133 |
|
|
|
217,895 |
|
|
France |
|
|
85,729 |
|
|
|
92,154 |
|
|
|
85,905 |
|
|
Other Americas |
|
|
58,662 |
|
|
|
54,382 |
|
|
|
54,421 |
|
|
Other Europe/MEA |
|
|
138,607 |
|
|
|
100,398 |
|
|
|
82,071 |
|
|
Total revenues |
|
$ |
3,353,356 |
|
|
$ |
2,908,096 |
|
|
$ |
2,783,746 |
|
243
Information regarding long-lived assets (defined as loans, forgivable loans and other receivables from employees and partners, net; fixed assets, net; certain other investments; goodwill; other intangible assets, net of accumulated amortization; and rent and other deposits) in the geographic areas as of December 31, 2017 and December 31, 2016, respectively, is as follows (in thousands):
|
|
|
December 31, |
|
|||||
|
|
|
2017 |
|
|
2016 |
|
||
|
Long-lived assets: |
|
|
|
|
|
|
|
|
|
United States |
|
$ |
1,373,118 |
|
|
$ |
1,284,732 |
|
|
United Kingdom |
|
|
352,232 |
|
|
|
229,555 |
|
|
Asia |
|
|
32,603 |
|
|
|
23,154 |
|
|
France |
|
|
7,373 |
|
|
|
5,540 |
|
|
Other Americas |
|
|
27,050 |
|
|
|
22,246 |
|
|
Other Europe/MEA |
|
|
10,477 |
|
|
|
4,952 |
|
|
Total long-lived assets |
|
$ |
1,802,853 |
|
|
$ |
1,570,179 |
|
244
The components of certain balance sheet accounts are as follows (in thousands):
|
|
|
December 31, |
|
|||||
|
|
|
2017 |
|
|
2016 |
|
||
|
Other assets: |
|
|
|
|
|
|
|
|
|
Prepaid expenses |
|
$ |
35,423 |
|
|
$ |
30,192 |
|
|
Deferred tax asset |
|
|
223,960 |
|
|
|
186,966 |
|
|
Rent and other deposits |
|
|
16,290 |
|
|
|
18,208 |
|
|
Other taxes |
|
|
16,439 |
|
|
|
15,747 |
|
|
Other |
|
|
51,714 |
|
|
|
38,808 |
|
|
Total other assets |
|
$ |
343,826 |
|
|
$ |
289,921 |
|
|
|
|
December 31, |
|
|||||
|
|
|
2017 |
|
|
2016 |
|
||
|
Accounts payable, accrued and other liabilities: |
|
|
|
|
|
|
|
|
|
Accrued expenses and other liabilities1 |
|
$ |
628,728 |
|
|
$ |
389,746 |
|
|
Charitable contribution liability |
|
|
30,714 |
|
|
|
30,695 |
|
|
Deferred tax liability |
|
|
10,122 |
|
|
|
2,705 |
|
|
Taxes payable |
|
|
249,181 |
|
|
|
204,542 |
|
|
Back-End Merger liability |
|
|
24,172 |
|
|
|
21,341 |
|
|
Total accounts payable, accrued and other liabilities |
|
$ |
942,917 |
|
|
$ |
649,029 |
|
|
1 |
As of December 31, 2017, $204.4 million is attributable to Besso. |
|
32. |
Subsequent Events |
Fourth Quarter 2017 Dividend
On February 6, 2018, the Company’s Board of Directors declared a quarterly cash dividend of $0.18 per share for the fourth quarter of 2017, payable on March 13, 2018 to Class A and Class B common stockholders of record as of February 27, 2018.
Controlled Equity Offering
Since December 31, 2017, the Company has sold, pursuant to the April 2017 Sales Agreement, 14.5 million shares of BGC Class A common stock for general corporate purposes, as well as for redemptions and exchanges of limited partnership interests in BGC Holdings and Newmark Holdings.
245
None
Evaluation of Disclosure Controls and Procedures
BGC Partners maintains disclosure controls and procedures that are designed to ensure that information required to be disclosed by BGC Partners is recorded, processed, accumulated, summarized and communicated to its management, including its Chairman and Chief Executive Officer and its Chief Financial Officer, to allow timely decisions regarding required disclosures, and reported within the time periods specified in the SEC’s rules and forms. The Chairman and Chief Executive Officer and the Chief Financial Officer have performed an evaluation of the effectiveness of the design and operation of BGC Partners disclosure controls and procedures as of December 31, 2017. Based on that evaluation, the Chairman and Chief Executive Officer and the Chief Financial Officer concluded that BGC Partners’ disclosure controls and procedures were effective as of December 31, 2017.
Management’s Report on Internal Control over Financial Reporting
Our management is responsible for establishing and maintaining adequate internal control over financial reporting, as such term is defined in Exchange Act Rules 13a-15(f) and 15d-15(f). Under the supervision and with the participation of our management, including our Chairman, Chief Executive Officer, and Chief Financial Officer, we conducted an evaluation of the effectiveness of our internal control over financial reporting as of December 31, 2017 based upon criteria set forth in the Internal Control—Integrated Framework issued by the Committee of Sponsoring Organizations of the Treadway Commission (2013 framework) (COSO). Our internal control over financial reporting includes policies and procedures that provide reasonable assurance regarding the reliability of financial reporting and the preparation of financial statements for external reporting purposes in accordance with U.S. generally accepted accounting principles.
Based on the results of our 2018 evaluation, our management concluded that our internal control over financial reporting was effective as of December 31, 2017. We reviewed the results of management’s assessment with our Audit Committee.
Management has excluded BGC Partners’ acquisitions of Besso Insurance and Commercial Real Estate Consulting Firm, as these acquisitions were completed during the course of 2017, and did not have a material effect on our financial condition, results of operations or cash flows in 2017. However, we anticipate that these acquisitions will be included in management’s assessment of internal control over financial reporting and our audit of internal controls over financial reporting for 2018. The aggregate 2017 revenues, recognized from the dates of acquisition, represented approximately 2.0% or $66.2 million of the Company’s total revenues for the year ended December 31, 2017.
The effectiveness of our internal control over financial reporting as of December 31, 2017 has been audited by Ernst & Young, an independent registered public accounting firm, as stated in their report, which is included in this Annual Report on Form 10-K. Such report expresses an unqualified opinion on the effectiveness of the Company’s internal control over financial reporting as of December 31, 2017.
Changes in Internal Control over Financial Reporting
During the quarter ended December 31, 2017, there were no changes in our internal control over financial reporting that materially affect, or are reasonably likely to materially affect, our internal control over financial reporting.
Not Applicable
246
The information appearing under “Election of Directors,” “Executive Officers,” “Section 16(a) Beneficial Ownership Reporting Compliance” and “Code of Ethics and Whistleblower Procedures” in the definitive Proxy Statement for the Company’s 2018 Annual Meeting of Stockholders (the “2018 Proxy Statement”) is hereby incorporated by reference in response to this Item 10. We anticipate that we will file the 2018 Proxy Statement with the SEC on or before April 30, 2018.
The information appearing under “Compensation Discussion and Analysis,” “Compensation Committee Report,” “Executive Compensation” and “Compensation Committee Interlocks and Insider Participation” in the 2018 Proxy Statement is hereby incorporated by reference in response to this Item 11.
|
ITEM 12. |
SECURITY OWNERSHIP OF CERTAIN BENEFICIAL OWNERS AND MANAGEMENT AND RELATED STOCKHOLDER MATTERS |
The information appearing under “Security Ownership of Certain Beneficial Owners and Management” and “Equity Compensation Plan Information as of December 31, 2017” in the 2018 Proxy Statement is hereby incorporated by reference in response to this Item 12.
The information appearing under “Certain Relationships and Related Transactions and Director Independence” and “Election of Directors—Independence of Directors” in the 2018 Proxy Statement is hereby incorporated by reference in response to this Item 13.
The information appearing under “Independent Registered Public Accounting Firm Fees” and “Audit Committee Pre-Approval Policies and Procedures” in the 2018 Proxy Statement is hereby incorporated by reference in response to this Item 14.
247
(a) (1) Financial Statements. The consolidated financial statements required to be filed in this Annual Report on Form 10-K are included in Part II, Item 8 hereof.
(a) (2) Schedule I, Parent Company Only Financial Statements. All other schedules are omitted because they are not applicable or not required, or the required information is in the financial statements or the notes thereto.
(a) (3) The Exhibit Index set forth below is incorporated by reference in response to this Item 15.
The following Exhibits are filed as part of this Report as required by Regulation S-K. The Exhibits designated by an asterisk (*) are management contracts and compensation plans and arrangements required to be filed as Exhibits to this Report. Schedules and similar attachments to the exhibits designated by a double asterisk (**) have been omitted pursuant to Item 601(b)(2) of Regulation S-K. BGC Partners, Inc. will supplementally furnish a copy of them to the Securities and Exchange Commission (the “SEC”) upon request. Certain exhibits have been previously filed with the SEC pursuant to the Securities Exchange Act of 1934 (Commission File Numbers 0-28191 and 1-35591).
EXHIBIT INDEX
|
Exhibit Number |
|
Exhibit Title |
|
|
|
|
|
1.1 |
|
|
|
|
|
|
|
1.2 |
|
|
|
|
|
|
|
2.1 |
|
|
|
|
|
|
|
2.2 |
|
|
|
|
|
|
|
2.3 |
|
|
|
|
|
|
|
2.4 |
|
|
|
|
|
|
|
2.5 |
|
|
|
|
|
|
|
2.6 |
|
|
|
|
|
|
|
2.7 |
|
|
|
|
|
|
248
|
Exhibit Number |
|
Exhibit Title |
|
|
|
|
|
|
||
|
|
|
|
|
2.9 |
|
|
|
|
|
|
|
2.10 |
|
|
|
|
|
|
|
3.1 |
|
|
|
|
|
|
|
3.2 |
|
|
|
|
|
|
|
3.3 |
|
|
|
|
|
|
|
4.1 |
|
|
|
|
|
|
|
4.2 |
|
|
|
|
|
|
|
4.3 |
|
|
|
|
|
|
|
4.4 |
|
|
|
|
|
|
|
4.5 |
|
|
|
|
|
|
|
4.6 |
|
|
|
|
|
|
|
4.7 |
|
|
|
|
|
|
|
4.8 |
|
|
|
|
|
|
|
4.9 |
|
|
|
|
|
|
|
4.10 |
|
|
|
|
|
|
|
4.11 |
|
|
|
|
|
|
249
|
Exhibit Number |
|
Exhibit Title |
|
|
|
|
|
|
||
|
|
|
|
|
4.13 |
|
|
|
|
|
|
|
4.14 |
|
|
|
|
|
|
|
4.15 |
|
|
|
|
|
|
|
4.16 |
|
|
|
|
|
|
|
10.1 |
|
|
|
|
|
|
|
10.2 |
|
|
|
|
|
|
|
10.3 |
|
|
|
|
|
|
|
10.4 |
|
|
|
|
|
|
|
10.5 |
|
|
|
|
|
|
|
10.6 |
|
|
|
|
|
|
|
10.7 |
|
|
|
|
|
|
|
10.8 |
|
|
|
|
|
|
|
10.9 |
|
|
|
|
|
|
|
10.10 |
|
|
|
|
|
|
|
10.11 |
|
|
|
|
|
|
|
10.12 |
|
|
|
|
|
|
250
|
Exhibit Number |
|
Exhibit Title |
|
|
|
|
|
|
||
|
|
|
|
|
10.14 |
|
|
|
|
|
|
|
10.15 |
|
|
|
|
|
|
|
10.16 |
|
|
|
|
|
|
|
10.17 |
|
|
|
|
|
|
|
10.18 |
|
|
|
|
|
|
|
10.19 |
|
|
|
|
|
|
|
10.20 |
|
|
|
|
|
|
|
10.21 |
|
|
|
|
|
|
|
10.22 |
|
|
|
|
|
|
|
10.23 |
|
|
|
|
|
|
|
10.24 |
|
|
|
|
|
|
|
10.25 |
|
|
|
|
|
|
|
10.26 |
|
|
|
|
|
|
|
10.27 |
|
|
|
|
|
|
|
10.28 |
|
|
|
|
|
|
|
10.29 |
|
|
|
|
|
|
251
|
Exhibit Number |
|
Exhibit Title |
|
|
|
|
|
|
||
|
|
|
|
|
10.31 |
|
|
|
|
|
|
|
10.32 |
|
|
|
|
|
|
|
10.33 |
|
|
|
|
|
|
|
10.34 |
|
|
|
|
|
|
|
10.35 |
|
|
|
|
|
|
|
10.36 |
|
|
|
|
|
|
|
10.37 |
|
|
|
|
|
|
|
10.38 |
|
|
|
|
|
|
|
10.39 |
|
|
|
|
|
|
|
10.40 |
|
|
|
|
|
|
|
10.41 |
|
|
|
|
|
|
|
10.42 |
|
|
|
|
|
|
|
10.43 |
|
|
|
|
|
|
|
10.44 |
|
|
|
|
|
|
|
10.45 |
|
|
|
|
|
|
252
|
Exhibit Number |
|
Exhibit Title |
|
|
|
|
|
|
||
|
|
|
|
|
10.47 |
|
|
|
|
|
|
|
10.48 |
|
|
|
|
|
|
|
10.49 |
|
|
|
|
|
|
|
10.50 |
|
|
|
|
|
|
|
10.51 |
|
|
|
|
|
|
|
10.52 |
|
|
|
|
|
|
|
10.53 |
|
|
|
|
|
|
|
10.54 |
|
|
|
|
|
|
|
10.55 |
|
|
|
|
|
|
|
10.56 |
|
|
|
|
|
|
|
10.57 |
|
|
|
|
|
|
|
10.58 |
|
|
|
|
|
|
|
10.59 |
|
|
|
|
|
|
|
12.1 |
|
|
|
|
|
|
|
21.1 |
|
|
|
|
|
|
|
23.1 |
|
|
|
|
|
|
|
23.2 |
|
|
|
|
|
|
|
31.1 |
|
|
|
|
|
|
|
31.2 |
|
|
|
|
|
|
253
|
Exhibit Number |
|
Exhibit Title |
|
|
|
|
|
|
||
|
|
|
|
|
101 |
|
The following materials from BGC Partners’ Annual Report on Form 10-K for the period ended December 31, 2017 are formatted in eXtensible Business Reporting Language (XBRL): (i) the Consolidated Statements of Financial Condition, (ii) the Consolidated Statements of Operations, (iii) the Consolidated Statements of Comprehensive Income (Loss), (iv) the Consolidated Statements of Cash Flows, (v) the Consolidated Statements of Changes in Equity, (vi) Notes to the Consolidated Financial Statements, and (vii) Schedule I, Parent Company Only Financial Statements. |
254
Not Applicable
255
Pursuant to the requirements of Section 13 or 15(d) of the Securities Exchange Act of 1934, the registrant has duly caused this Annual Report on Form 10-K for the fiscal year ended December 31, 2017 to be signed on its behalf by the undersigned, thereunto duly authorized, on the 22nd day of February, 2018.
|
BGC Partners, Inc. |
||
|
|
|
|
|
By: |
|
/S/ HOWARD W. LUTNICK |
|
Name: |
|
Howard W. Lutnick |
|
Title: |
|
Chairman of the Board and Chief Executive Officer |
Pursuant to the requirements of the Securities Exchange Act of 1934, this Annual Report on Form 10-K has been signed below by the following persons on behalf of the registrant, BGC Partners, Inc., in the capacities and on the date or dates indicated.
|
Signature |
|
Capacity in Which Signed |
|
Date |
|
|
|
|
|
|
|
/S/ HOWARD W. LUTNICK |
|
Chairman of the Board and Chief Executive Officer |
|
February 22, 2018 |
|
Howard W. Lutnick |
|
(Principal Executive Officer) |
|
|
|
|
|
|
|
|
|
/S/ STEVEN R. MCMURRAY |
|
Chief Financial Officer |
|
February 22, 2018 |
|
Steven R. McMurray |
|
(Principal Financial and Accounting Officer) |
|
|
|
|
|
|
|
|
|
/S/ LINDA A. BELL |
|
Director |
|
February 22, 2018 |
|
Linda A. Bell |
|
|
|
|
|
|
|
|
|
|
|
/S/ STEPHEN T. CURWOOD |
|
Director |
|
February 22, 2018 |
|
Stephen T. Curwood |
|
|
|
|
|
|
|
|
|
|
|
/S/ WILLIAM J. MORAN |
|
Director |
|
February 22, 2018 |
|
William J. Moran |
|
|
|
|
|
|
|
|
|
|
|
/S/ DAVID RICHARDS |
|
Director |
|
February 22, 2018 |
|
David Richards |
|
|
|
|
256
(Parent Company Only)
STATEMENTS OF FINANCIAL CONDITION
(in thousands, except share and per share data)
|
|
|
December 31, 2017 |
|
|
December 31, 2016 |
|
||
|
Assets |
|
|
|
|
|
|
|
|
|
Cash and cash equivalents |
|
$ |
199 |
|
|
$ |
1,853 |
|
|
Investments in subsidiaries |
|
|
621,253 |
|
|
|
1,064,182 |
|
|
Receivables from related parties |
|
|
30,714 |
|
|
|
30,695 |
|
|
Note receivable from related party |
|
|
701,766 |
|
|
|
702,569 |
|
|
Other assets |
|
|
19,311 |
|
|
|
128,995 |
|
|
Total assets |
|
$ |
1,373,243 |
|
|
$ |
1,928,294 |
|
|
Liabilities and Stockholders’ Equity |
|
|
|
|
|
|
|
|
|
Accounts payable, accrued and other liabilities |
|
$ |
37,591 |
|
|
$ |
42,165 |
|
|
Notes payable |
|
|
701,766 |
|
|
|
702,569 |
|
|
Total liabilities |
|
|
739,357 |
|
|
|
744,734 |
|
|
Commitments and contingencies (Note 2) |
|
|
|
|
|
|
|
|
|
Total stockholders’ equity |
|
|
633,886 |
|
|
|
1,183,560 |
|
|
Total liabilities and stockholders’ equity |
|
$ |
1,373,243 |
|
|
$ |
1,928,294 |
|
See accompanying Notes to Financial Statements.
257
(Parent Company Only)
STATEMENTS OF OPERATIONS
(in thousands, except per share data)
|
|
|
Year Ended December 31, |
|
|||||||||
|
|
|
2017 |
|
|
2016 |
|
|
2015 |
|
|||
|
Revenues: |
|
|
|
|
|
|
|
|
|
|
|
|
|
Interest income |
|
$ |
98,819 |
|
|
$ |
62,196 |
|
|
$ |
58,663 |
|
|
Total revenue |
|
|
98,819 |
|
|
|
62,196 |
|
|
|
58,663 |
|
|
Expenses: |
|
|
|
|
|
|
|
|
|
|
|
|
|
Interest expense |
|
|
98,819 |
|
|
|
62,196 |
|
|
|
58,663 |
|
|
Other expenses |
|
|
— |
|
|
|
— |
|
|
|
— |
|
|
Total expenses |
|
|
98,819 |
|
|
|
62,196 |
|
|
|
58,663 |
|
|
Loss from operations before income taxes |
|
|
— |
|
|
|
— |
|
|
|
— |
|
|
Equity income of subsidiaries |
|
|
99,928 |
|
|
|
235,334 |
|
|
|
156,944 |
|
|
Provision (benefit) for income taxes |
|
|
48,453 |
|
|
|
50,312 |
|
|
|
(3,015 |
) |
|
Net income available to common stockholders |
|
$ |
51,475 |
|
|
$ |
185,022 |
|
|
$ |
159,959 |
|
|
Per share data: |
|
|
|
|
|
|
|
|
|
|
|
|
|
Net income available to common stockholders |
|
$ |
51,475 |
|
|
$ |
185,022 |
|
|
$ |
159,959 |
|
|
Basic earnings per share |
|
$ |
0.18 |
|
|
$ |
0.67 |
|
|
$ |
0.66 |
|
|
Basic weighted-average shares of common stock outstanding |
|
|
287,378 |
|
|
|
277,073 |
|
|
|
243,460 |
|
|
Net income for fully diluted shares |
|
$ |
75,256 |
|
|
$ |
283,525 |
|
|
$ |
177,972 |
|
|
Fully diluted earnings per share |
|
$ |
0.17 |
|
|
$ |
0.65 |
|
|
$ |
0.62 |
|
|
Fully diluted weighted-average shares of common stock outstanding |
|
|
454,256 |
|
|
|
433,226 |
|
|
|
286,322 |
|
See accompanying Notes to Financial Statements.
258
(Parent Company Only)
STATEMENTS OF COMPREHENSIVE INCOME
(in thousands)
|
|
|
Year Ended December 31, |
|
|||||||||
|
|
|
2017 |
|
|
2016 |
|
|
2015 |
|
|||
|
Net income |
|
$ |
51,475 |
|
|
$ |
185,022 |
|
|
$ |
159,959 |
|
|
Other comprehensive (loss) income, net of tax: |
|
|
|
|
|
|
|
|
|
|
|
|
|
Foreign currency translation adjustments |
|
|
13,536 |
|
|
|
88 |
|
|
|
(14,172 |
) |
|
Available for sale securities |
|
|
(823 |
) |
|
|
1,769 |
|
|
|
(15,187 |
) |
|
Total other comprehensive (loss) income, net of tax |
|
|
12,713 |
|
|
|
1,857 |
|
|
|
(29,359 |
) |
|
Comprehensive income attributable to common stockholders |
|
$ |
64,188 |
|
|
$ |
186,879 |
|
|
$ |
130,600 |
|
See accompanying Notes to Financial Statements.
259
(Parent Company Only)
STATEMENTS OF CASH FLOWS
(in thousands)
|
|
|
Year Ended December 31, |
|
|||||||||
|
|
|
2017 |
|
|
2016 |
|
|
2015 |
|
|||
|
CASH FLOWS FROM OPERATING ACTIVITIES: |
|
|
|
|
|
|
|
|
|
|
|
|
|
Net income available to common stockholders |
|
$ |
51,475 |
|
|
$ |
185,022 |
|
|
$ |
159,959 |
|
|
Adjustments to reconcile net income to net cash used in operating activities: |
|
|
|
|
|
|
|
|
|
|
|
|
|
Amortization of deferred financing costs |
|
|
5,287 |
|
|
|
4,219 |
|
|
|
5,879 |
|
|
Equity in net gains (losses) of unconsolidated investments |
|
|
(99,928 |
) |
|
|
(235,334 |
) |
|
|
(156,944 |
) |
|
Deferred tax (benefit) expense |
|
|
5,168 |
|
|
|
12,940 |
|
|
|
(37,457 |
) |
|
Decrease (increase) in operating assets: |
|
|
|
|
|
|
|
|
|
|
|
|
|
Investments in subsidiaries |
|
|
5,840 |
|
|
|
55,371 |
|
|
|
(48,177 |
) |
|
Receivables from related parties |
|
|
— |
|
|
|
23,428 |
|
|
|
(39,000 |
) |
|
Note receivable from related party |
|
|
(975,000 |
) |
|
|
(135,836 |
) |
|
|
— |
|
|
Other assets |
|
|
57 |
|
|
|
— |
|
|
|
— |
|
|
(Decrease) increase in operating liabilities: |
|
|
|
|
|
|
|
|
|
|
|
|
|
Accounts payable, accrued and other liabilities |
|
|
(7,044 |
) |
|
|
(26,699 |
) |
|
|
51,102 |
|
|
Net cash used in operating activities |
|
|
(1,014,145 |
) |
|
|
(116,889 |
) |
|
|
(64,638 |
) |
|
CASH FLOWS FROM INVESTING ACTIVITIES: |
|
|
|
|
|
|
|
|
|
|
|
|
|
Payments for acquisitions, net of cash acquired |
|
|
— |
|
|
|
— |
|
|
|
— |
|
|
Net cash used in investing activities |
|
|
— |
|
|
|
— |
|
|
|
— |
|
|
CASH FLOWS FROM FINANCING ACTIVITIES: |
|
|
|
|
|
|
|
|
|
|
|
|
|
Dividends to stockholders |
|
|
(200,116 |
) |
|
|
(170,795 |
) |
|
|
(131,360 |
) |
|
Repurchase of Class A common stock |
|
|
(16,773 |
) |
|
|
(96,025 |
) |
|
|
(12,114 |
) |
|
Issuance of senior notes, net of deferred issuance costs |
|
|
968,910 |
|
|
|
295,768 |
|
|
|
— |
|
|
Repayments of convertible notes |
|
|
— |
|
|
|
(159,932 |
) |
|
|
— |
|
|
Distributions from subsidiaries |
|
|
172,562 |
|
|
|
179,370 |
|
|
|
146,032 |
|
|
Proceeds from offering of Class A common stock, net |
|
|
87,836 |
|
|
|
69,775 |
|
|
|
61,527 |
|
|
Proceeds from exercises of stock options |
|
|
72 |
|
|
|
421 |
|
|
|
701 |
|
|
Net cash provided by financing activities |
|
|
1,012,491 |
|
|
|
118,582 |
|
|
|
64,786 |
|
|
Net increase (decrease) in cash and cash equivalents |
|
|
(1,654 |
) |
|
|
1,693 |
|
|
|
148 |
|
|
Cash and cash equivalents at beginning of period |
|
|
1,853 |
|
|
|
160 |
|
|
|
12 |
|
|
Cash and cash equivalents at end of period |
|
$ |
199 |
|
|
$ |
1,853 |
|
|
$ |
160 |
|
|
Supplemental cash information: |
|
|
|
|
|
|
|
|
|
|
|
|
|
Cash paid during the period for taxes |
|
$ |
47,419 |
|
|
$ |
37,545 |
|
|
$ |
21,488 |
|
|
Cash paid during the period for interest |
|
$ |
49,867 |
|
|
$ |
40,153 |
|
|
$ |
39,028 |
|
|
Supplemental non-cash information: |
|
|
|
|
|
|
|
|
|
|
|
|
|
Issuance of Class A common stock upon exchange of limited partnership interests |
|
$ |
106,699 |
|
|
$ |
75,423 |
|
|
$ |
79,309 |
|
|
Issuance of Class A and contingent Class A common stock and limited partnership interests for acquisitions |
|
|
14,231 |
|
|
|
20,930 |
|
|
|
39,635 |
|
|
Issuance of Class A common stock upon conversion of convertible notes |
|
|
— |
|
|
|
68 |
|
|
|
150,000 |
|
|
Contribution of unsecured senior term loan to Newmark Group, Inc. |
|
|
575,000 |
|
|
|
— |
|
|
|
— |
|
|
Contribution of converted term loan agreement to Newmark Group, Inc. |
|
|
400,000 |
|
|
|
— |
|
|
|
— |
|
|
Contribution of equity in
Newmark in exchange for 115.6 million Class A and 15.8 million Class B shares of Newmark Group, Inc. common stock |
|
|
1,618,471 |
|
|
|
— |
|
|
|
— |
|
See accompanying Notes to Financial Statements.
260
(Parent Company Only)
NOTES TO FINANCIAL STATEMENTS
|
1. |
Organization and Basis of Presentation |
The accompanying Parent Company Only Financial Statements of BGC Partners, Inc. (“BGC Partners” or the “Company”) should be read in conjunction with the consolidated financial statements of BGC Partners, Inc. and subsidiaries and the notes thereto. In addition, certain reclassifications have been made to previously reported amounts to conform to the current presentation.
On November 4, 2016, the Company acquired from Cantor the 80% of the Lucera business (also known as “LFI Holdings, LLC” or “LFI”) not already owned by the Company. This transaction has been determined to be a combination of entities under common control that resulted in a change in the reporting entity. Accordingly, the financial results of the Company have been retrospectively adjusted to include the financial results of Lucera in the current and prior periods.
On September 8, 2017, the Company completed the Berkeley Point Acquisition for an acquisition price of $875.0 million, with $3.2 million of the acquisition price paid in units of BGC Holdings. As the Company purchased and acquired Berkeley Point from CCRE, an affiliate of Cantor, this transaction has been determined to be a combination of entities under common control that resulted in a change in the reporting entity. Accordingly, the financial results of the Company have been recast to include the financial results of Berkeley Point in the current and prior periods presented.
|
2. |
Commitments, Contingencies and Guarantees |
On March 13, 2015, subsidiaries of the Company entered into a secured loan arrangement of $28.2 million, under which it pledged certain fixed assets as security for a loan. This arrangement incurs interest at a fixed rate of 3.70% and matures on March 13, 2019. As of December 31, 2017, the Company had $9.2 million outstanding related to this secured loan arrangement, which includes $0.1 million of deferred financing costs. The value of the fixed assets pledged as of December 31, 2017 was $0.3 million.
On July 10, 2015, the Company and GFI Group Inc. (“GFI”) entered into a guarantee (the “Guarantee”) pursuant to which the Company has guaranteed the obligations of GFI under GFI’s 8.375% Senior notes due 2018 in the remaining aggregate principal amount of $240 million (the “Notes”) and the indenture for the Notes, dated as of July 19, 2011 (the “Indenture”), between GFI and The Bank of New York Mellon Trust Company, N.A., as Trustee. Pursuant to the terms of the Indenture, the interest rate on the Notes was reduced effective July 19, 2015 as a result of prior ratings increases following the acquisition of GFI by BGC Partners. In addition, on January 13, 2016 the interest rate was further reduced as a result of another ratings increase. The Company and GFI will share any cost savings, including interest and other costs, resulting from the credit enhancement provided by BGC Partners.
On May 31, 2017, the Company entered into a secured loan arrangement of $29.9 million, under which it pledged certain field assets as security for a loan. This arrangement incurs interest at a fixed rate of 3.44% and matures on May 31, 2021. As of December 31, 2017, the Company had $26.4 million outstanding related to this secured loan arrangement. The value of fixed assets pledged as of December 31, 2017 was $17.3 million.
|
3. |
Long-Term Debt |
Unsecured Senior Revolving Credit and Converted Term Loan Agreement
On September 8, 2017, the Company entered into a committed unsecured senior revolving credit agreement with Bank of America, N.A., as administrative agent, and a syndicate of lenders. The revolving credit agreement provides for revolving loans of up to $400.0 million. The maturity date of the facility is September 8, 2019. On November 22, 2017 the Company and Newmark entered into an amendment to the unsecured senior revolving credit agreement. Pursuant to the amendment, the then-outstanding borrowings of the Company under the revolving credit facility were converted into a term loan. There was no change in the maturity date or interest rate. Effective December 13, 2017, Newmark assumed the obligations of the Company as borrower under the converted term loan. The Company remains a borrower under, and retains access to, the revolving credit facility for any future draws, subject to availability which increases as Newmark repays the converted term loan. Borrowings under the converted term loan bear interest at either LIBOR or a defined base rate plus an additional margin which ranges from 50 basis points to 325 basis points depending on the Company’s debt rating as determined by S&P and Fitch and whether such loan is a LIBOR loan or a base rate loan. If there are any amounts outstanding under the senior term loan as of December 31, 2017, the pricing shall increase by 50 basis points until the senior term loan is paid in full, and if there are any amounts outstanding under the senior term loan as of June 30, 2018, the pricing shall increase by an additional 75 basis points (125 basis points in the aggregate) until the senior term loan is paid in full. From and after the repayment in full of the senior term loan, the pricing shall return to the levels previously described. As of December 31, 2017, there were $400.0 million of borrowings outstanding under the converted term loan. The carrying value of the converted term loan as of December 31, 2017 was $397.3 million, net of deferred financing costs of $2.7 million. As of December 31, 2017, the interest rate
261
on the converted term loan was 4.21%. The Company recorded interest expense related to the converted term loan of $5.1 million for the year ended December 31, 2017.
Unsecured Senior Term Loan Credit Agreement
On September 8, 2017, the Company entered into a committed unsecured senior term loan credit agreement with Bank of America, N.A., as administrative agent, and a syndicate of lenders. The term loan credit agreement provides for loans of up to $575.0 million. The maturity date of the agreement is September 8, 2019. On November 22, 2017, the Company and Newmark entered into an amendment to the unsecured senior term loan credit agreement. Pursuant to the term loan amendment and effective as of December 13, 2017, Newmark assumed the obligations of the Company as borrower under the senior term loan. There were no change in the maturity date or interest rate. Borrowings under the senior term loan bear interest at either LIBOR or a defined base rate plus an additional margin which ranges from 50 basis points to 325 basis points depending on the Company’s debt rating as determined by S&P and Fitch and whether such loan is a LIBOR loan or a base rate loan. If there are any amounts outstanding under the senior term loan as of December 31, 2017, the pricing shall increase by 50 basis points until the senior term loan is paid in full, and if there are any amounts outstanding under the senior term loan as of June 30, 2018, the pricing shall increase by an additional 75 basis points (125 basis points in the aggregate) until the senior term loan is paid in full. From and after the repayment in full of the senior term loan, the pricing shall return to the levels previously described. The senior term loan is also subject to mandatory prepayment from 100% of net cash proceeds of all material asset sales and debt and equity issuances by Newmark and its subsidiaries (subject to certain customary exceptions, including sales under the Company’s CEO sales program). The net proceeds from the Newmark initial public offering were used to partially repay $304.3 million of the senior term loan. As of December 31, 2017, there were $270.7 million of borrowings outstanding under the senior term loan. The carrying value of the senior term loan as of December 31, 2017 was $270.7 million. As of December 31, 2017, the interest rate on the senior term loan was 4.21%. The Company recorded interest expense related to the senior term loan of $9.1 million for the year ended December 31, 2017.
Convertible Notes
On April 1, 2010, BGC Holdings issued an aggregate of $150.0 million principal amount of the 8.75% Convertible Notes to Cantor in a private placement transaction. The 8.75% Convertible Notes were senior unsecured obligations and ranked equally and ratably with all existing and future senior unsecured obligations of the Company.
The 8.75% Convertible Notes bore an annual interest rate of 8.75%, payable semi-annually in arrears on April 15 and October 15 of each year, beginning on October 15, 2010. On April 13, 2015, the Company’s 8.75% Convertible Notes were fully converted into 24,042,599 shares of the Company’s Class A common stock, par value $0.01 per share, issued to Cantor. The Company did not record any interest expense related to the 8.75% Convertible Notes for the years ended December 31, 2017 and December 31, 2016. The Company recorded interest expense related to the 8.75% Convertible Notes of $3.8 million for the years ended December 31, 2015.
On July 29, 2011, the Company issued an aggregate of $160.0 million principal amount of 4.50% Convertible Notes due July 15, 2016. The 4.50% Convertible Notes were general senior unsecured obligations of BGC Partners. The 4.50% Convertible Notes paid interest semiannually at a rate of 4.50% per annum and were priced at par. The Company recorded interest expense related to the 4.50% Convertible Notes of $6.5 million, $12.0 million for the years ended December 31, 2016 and 2015, respectively. There was no interest expense related to the 4.50% Convertible Notes recorded for the year ended December 31, 2017.
On July 13, 2016, certain holders of the 4.50% Convertible Notes converted $68,000 in principal amount of notes, and, upon conversion, the Company delivered 6,909 shares of its Class A common stock to such holders. On July 15, 2016, the Company repaid the remaining approximately $159.9 million principal amount of its 4.50% Convertible Notes that matured on July 15, 2016.
In connection with the offering of the 4.50% Convertible Notes, the Company entered into capped call transactions, which were expected to reduce the potential dilution of the Company’s Class A common stock upon any conversion of the 4.50% Convertible Notes in the event that the market value per share of the Company’s Class A common stock, as measured under the terms of the capped call transactions, was greater than the strike price of the capped call transactions. The capped call transactions expired unexercised on July 13, 2016. The expiration of the capped call transactions had no financial statement impact.
8.125% Senior Notes
On June 26, 2012, the Company issued an aggregate of $112.5 million principal amount of 8.125% Senior Notes due 2042 (the “8.125% Senior Notes”). The 8.125% Senior Notes are senior unsecured obligations of BGC Partners. The 8.125% Senior Notes may be redeemed for cash, in whole or in part, on or after June 26, 2017, at the Company’s option, at any time and from time to time, until maturity at a redemption price equal to 100% of the principal amount to be redeemed, plus accrued but unpaid interest on the principal amount being redeemed to, but not including, the redemption date. The 8.125% Senior Notes are listed on the New York Stock Exchange under the symbol “BGCA.” The Company used the proceeds to repay short-term borrowings under its unsecured revolving credit facility and for general corporate purposes, including acquisitions. In connection with the issuance of the 8.125% Senior Notes, the Company lent the proceeds of the 8.125% Senior Notes to BGC U.S. OpCo,, BGC U.S. OpCo issued an amended and restated promissory note, effective as of June 26, 2012, with an aggregate principal amount of $112.5 million payable to the
262
Company. On December 13, 2017, Newmark OpCo assumed all of BGC U.S. OpCo’s rights and obligations under the promissory note.
The initial carrying value of the 8.125% Senior Notes was $108.7 million, net of debt issuance costs of $3.8 million. The issuance costs are amortized as interest cost, and the carrying value of the 8.125% Senior Notes will accrete up to the face amount over the term of the 8.125% Senior Notes. The Company recorded interest expense related to the 8.125% Senior Notes of $9.3 million for each of the years ended December 31, 2017, 2016 and 2015.
5.375% Senior Notes
On December 9, 2014, the Company issued an aggregate of $300.0 million principal amount of 5.375% Senior Notes due 2019 (the “5.375% Senior Notes”). The 5.375% Senior Notes are general senior unsecured obligations of the Company. These Senior Notes bear interest at a rate of 5.375% per year, payable in cash on June 9 and December 9 of each year, commencing June 9, 2015. The interest rate payable on the notes will be subject to adjustments from time to time based on the debt rating assigned by specified rating agencies to the notes, as set forth in the Indenture. The 5.375% Senior Notes will mature on December 9, 2019. The Company may redeem some or all of the notes at any time or from time to time for cash at certain “make-whole” redemption prices (as set forth in the Indenture). If a “Change of Control Triggering Event” (as defined in the Indenture) occurs, holders may require the Company to purchase all or a portion of their notes for cash at a price equal to 101% of the principal amount of the notes to be purchased plus any accrued and unpaid interest to, but excluding, the purchase date. In connection the issuance of the 5.375% Senior Notes, the company lent the proceeds to BGC U.S. OpCo, BGC U.S. OpCo issued an amended and restated promissory note, effective as of December 9, 2014, with an aggregate principal amount of $300.0 million payable to the Company. On December 13, 2017, Newmark OpCo assumed all of BGC U.S. OpCo’s rights and obligations under the promissory note.
The initial carrying value of the 5.375% Senior Notes was $295.1 million, net of the discount and debt issuance costs of $4.9 million. The issuance costs are amortized as interest cost, and the carrying value of the 5.375% Senior Notes will accrete up to the face amount over the term of the notes. The Company recorded interest expense related to the 5.375% Senior Notes of $17.1 million for the years ended December 31, 2017, 2016 and 2015, respectively.
5.125% Senior Notes
On May 27, 2016, the Company issued an aggregate of $300.0 million principal amount of 5.125% Senior Notes due 2021 (the “5.125% Senior Notes”). The 5.125% Senior Notes are general senior unsecured obligations of the Company. These Senior Notes bear interest at a rate of 5.125% per year, payable in cash on May 27 and November 27 of each year, commencing November 27, 2016. The 5.125% Senior Notes will mature on May 27, 2021. The Company may redeem some or all of the notes at any time or from time to time for cash at certain “make-whole” redemption prices (as set forth in the Indenture). If a “Change of Control Triggering Event” (as defined in the Indenture) occurs, holders may require the Company to purchase all or a portion of their notes for cash at a price equal to 101% of the principal amount of the notes to be purchased plus any accrued and unpaid interest to, but excluding, the purchase date.
The initial carrying value of the 5.125% Senior Notes was $295.8 million, net of the discount and debt issuance costs of $4.2 million. The issuance costs are amortized as interest expense and the carrying value of the 5.125% Senior Notes will accrete up to the face amount over the term of the notes. The Company recorded interest expense related to the 5.125% Senior Notes of $16.2 million and $9.6 million for the years ended December 31, 2017 and 2016, respectively. The Company did not record any interest expense related to the 5.125% Senior Notes for the year ended December 31, 2015.
Short-term Borrowings
On December 24, 2015, the Company entered into a committed unsecured credit agreement with Bank of America, N.A. The credit agreement provided for maximum revolving loans of $25.0 million through March 24, 2016. The interest rate on this facility was LIBOR plus 200 basis points.
On February 25, 2016, the Company entered into a committed unsecured credit agreement with Bank of America, N.A., as administrative agent, and a syndicate of lenders. Several of the Company’s domestic non-regulated subsidiaries are parties to the credit agreement as guarantors. The credit agreement provides for revolving loans of $150.0 million, with the option to increase the aggregate loans to $200.0 million. Borrowings under this facility bear interest at either LIBOR or a defined base rate plus an additional margin which ranges from 50 basis points to 250 basis points depending on the Company’s debt rating as determined by S&P and Fitch and whether such loan is a LIBOR loan or a base rate loan. This facility was terminated on September 8, 2017, at which point the outstanding balance of $150.0 million was repaid. Contemporaneously with the closing of this credit agreement, the $25.0 million unsecured credit agreement entered into on December 24, 2015 with Bank of America, N.A. was terminated. As of December 31, 2017 and 2016 there were no borrowings outstanding under either the $150.0 million facility or the terminated $25.0
263
million facility. The Company recorded interest expense related to the credit facility of $2.4 million and $0.7 million for the years ended December 31, 2017 and 2016, respectively.
264
Similar companies
See also CME GROUP INC. - Annual report 2022 (10-K 2022-12-31) Annual report 2023 (10-Q 2023-09-30)See also Intercontinental Exchange, Inc. - Annual report 2022 (10-K/A 2022-12-31) Annual report 2023 (10-Q 2023-09-30)
See also LPL Financial Holdings Inc. - Annual report 2022 (10-K 2022-12-31) Annual report 2023 (10-Q 2023-09-30)
See also Tradeweb Markets Inc. - Annual report 2022 (10-K 2022-12-31) Annual report 2023 (10-Q 2023-09-30)
See also Cboe Global Markets, Inc. - Annual report 2022 (10-K 2022-12-31) Annual report 2023 (10-Q 2023-09-30)