Blackstone Inc. - Quarter Report: 2021 March (Form 10-Q)
UNITED STATES
SECURITIES AND EXCHANGE COMMISSION
WASHINGTON, D.C. 20549
FORM
10-Q
(Mark One)
☒ |
QUARTERLY REPORT PURSUANT TO SECTION 13 OR 15(d) OF THE SECURITIES EXCHANGE ACT OF 1934 FOR THE QUARTERLY PERIOD ENDED MARCH 31, 2021 |
OR
☐ |
TRANSITION REPORT PURSUANT TO SECTION 13 OR 15(d) OF THE SECURITIES EXCHANGE ACT OF 1934 FOR THE TRANSITION PERIOD FROM TO |
Commission File Number: 001-33551

The Blackstone Group Inc.
(Exact name of Registrant as specified in its charter)
| Delaware (State or other jurisdiction of incorporation or organization) |
20-8875684 (I.R.S. Employer Identification No.) |
345 Park Avenue
New York
, New York
10154
(Address of principal executive offices)(Zip Code)
(
212
) 583-5000
(Registrant’s telephone number, including area code)
Securities registered pursuant to Section 12(b) of the Act:
| Title of each class |
Trading Symbol(s) |
Name of each exchange on which registered | ||
Common Stock |
BX |
New York Stock Exchange |
Indicate by check mark whether the Registrant (1) has filed all reports required to be filed by Section 13 or 15(d) of the Securities Exchange Act of 1934 during the preceding 12 months (or for such shorter period that the Registrant was required to file such reports), and (2) has been subject to such filing requirements for the past 90 days.
Yes
☒
No ☐
Indicate by check mark whether the registrant has submitted electronically every Interactive Data File required to be submitted pursuant to Rule 405 of Regulation S-T (§232.405 of this chapter) during the preceding 12 months (or for such shorter period that the registrant was required to submit such files).
Yes
☒
No ☐
Indicate by check mark whether the Registrant is a large accelerated filer, an accelerated filer, a non-accelerated filer, a smaller reporting company, or an emerging growth company. See the definitions of “large accelerated filer,” “accelerated filer,” “smaller reporting company,” and “emerging growth company” in Rule 12b-2 of the Exchange Act.
| Large accelerated filer ☒ |
Accelerated filer ☐ | |||||
| Non-accelerated filer ☐ |
Smaller reporting company ☐ | |||||
| Emerging growth company ☐ | ||||||
If an emerging growth company, indicate by check mark if the registrant has elected not to use the extended transition period for complying with any new or revised financial accounting standards provided pursuant to Section 13(a) of the Exchange Act.
☐
Indicate by check mark whether the Registrant is a shell company (as defined in Rule 12b-2 of the Exchange Act). Yes
☐
No ☒
As of April 30, 2021, there were
684,230,922
shares of common stock of the registrant outstanding. Table of Contents
Page |
||||||
| Part I. |
||||||
| Item 1. |
6 |
|||||
Unaudited Condensed Consolidated Financial Statements: |
||||||
6 |
||||||
8 |
||||||
9 |
||||||
10 |
||||||
12 |
||||||
14 |
||||||
| Item 1A. |
58 |
|||||
| Item 2. |
60 |
|||||
| Item 3. |
120 |
|||||
| Item 4. |
120 |
|||||
| Part II. |
||||||
| Item 1. |
121 |
|||||
| Item 1A. |
121 |
|||||
| Item 2. |
121 |
|||||
| Item 3. |
122 |
|||||
| Item 4. |
122 |
|||||
| Item 5. |
122 |
|||||
| Item 6. |
123 |
|||||
125 |
||||||
1
Forward-Looking Statements
This report may contain forward-looking statements within the meaning of Section 27A of the U.S. Securities Act of 1933, as amended, and Section 21E of the U.S. Securities Exchange Act of 1934, as amended, which reflect our current views with respect to, among other things, our operations, taxes, earnings and financial performance, share repurchases and dividends. You can identify these forward-looking statements by the use of words such as “outlook,” “indicator,” “believes,” “expects,” “potential,” “continues,” “may,” “will,” “should,” “seeks,” “approximately,” “predicts,” “intends,” “plans,” “scheduled,” “estimates,” “anticipates” or the negative version of these words or other comparable words. Such forward-looking statements are subject to various risks and uncertainties. Accordingly, there are or will be important factors that could cause actual outcomes or results to differ materially from those indicated in these statements. We believe these factors include but are not limited to the impact of the novel coronavirus
(“COVID-19”),
as well as those described under the section entitled “Risk Factors” in our Annual Report on Form 10-K for the year ended December 31, 2020, as such factors may be updated from time to time in our periodic filings with the United States Securities and Exchange Commission (“SEC”), which are accessible on the SEC’s website at www.sec.gov. These factors should not be construed as exhaustive and should be read in conjunction with the other cautionary statements that are included in this report and in our other periodic filings. The forward-looking statements speak only as of the date of this report, and we undertake no obligation to publicly update or review any forward-looking statement, whether as a result of new information, future developments or otherwise. Website and Social Media Disclosure
We use our website (www.blackstone.com), Facebook page (www.facebook.com/blackstone), Twitter (www.twitter.com/blackstone), LinkedIn (www.linkedin.com/company/blackstonegroup), Instagram (www.instagram.com/blackstone), SoundCloud (www.soundcloud.com/blackstone-300250613), PodBean (www.blackstone.podbean.com), Spotify (https://spoti.fi/2LJ1tHG), YouTube (www.youtube.com/user/blackstonegroup) and Apple Podcast (https://apple.co/31Pe1Gg) accounts as channels of distribution of company information. The information we post through these channels may be deemed material. Accordingly, investors should monitor these channels, in addition to following our press releases, SEC filings and public conference calls and webcasts. In addition, you may automatically receive email alerts and other information about Blackstone when you enroll your email address by visiting the “Contact Us/Email Alerts” section of our website at http://ir.blackstone.com. The contents of our website, any alerts and social media channels are not, however, a part of this report.
In this report, references to “Blackstone,” the “Company,” “we,” “us” or “our” refer to The Blackstone Group Inc. and its consolidated subsidiaries.
Effective February 26, 2021, Blackstone effectuated changes to rename its Class A common stock as “common stock,” and to reclassify its Class B and Class C common stock into a new “Series I preferred stock” and “Series II preferred stock,” respectively (the “share reclassification”). Each new stock has the same rights and powers of its predecessor. All references to common stock, Series I preferred stock and Series II preferred stock prior to the share reclassification refer to Class A, Class B and Class C common stock, respectively. See “Part I. Item 2. Management’s Discussion and Analysis of Financial Condition and Results of Operations – Organizational Structure.”
“Series I Preferred Stockholder” refers to Blackstone Partners L.L.C., the holder of the sole outstanding share of our Series I preferred stock.
“Series II Preferred Stockholder” refers to Blackstone Group Management L.L.C., the holder of the sole outstanding share of our Series II preferred stock.
2
“Blackstone Funds,” “our funds” and “our investment funds” refer to the funds and other vehicles that are managed by Blackstone. “Our carry funds” refers to funds managed by Blackstone that have commitment-based multi-year drawdown structures that pay carry on the realization of an investment.
We refer to our flagship corporate private equity funds as Blackstone Capital Partners (“BCP”) funds, our energy-focused private equity funds as Blackstone Energy Partners (“BEP”) funds, our core private equity funds as Blackstone Core Equity Partners (“BCEP”), our opportunistic investment platform that invests globally across asset classes, industries and geographies as Blackstone Tactical Opportunities (“Tactical Opportunities”), our secondary fund of funds business as Strategic Partners Fund Solutions (“Strategic Partners”), our infrastructure-focused funds as Blackstone Infrastructure Partners (“BIP”), our life sciences private investment platform, Blackstone Life Sciences (“BXLS”), our growth equity investment platform, Blackstone Growth (“BXG”), our multi-asset investment program for eligible high net worth investors offering exposure to certain of our key illiquid investment strategies through a single commitment as Blackstone Total Alternatives Solution (“BTAS”) and our capital markets services business as Blackstone Capital Markets (“BXCM”).
We refer to our real estate opportunistic funds as Blackstone Real Estate Partners (“BREP”) funds and our real estate debt investment funds as Blackstone Real Estate Debt Strategies (“BREDS”) funds. We refer to our real estate investment trusts as “REITs,” to Blackstone Mortgage Trust, Inc., our NYSE-listed REIT, as “BXMT,” and to Blackstone Real Estate Income Trust, Inc., our non-listed REIT, as “BREIT.” We refer to our real estate funds which target substantially stabilized assets in prime markets, as Blackstone Property Partners (“BPP”) funds. We refer to BPP and BREIT collectively as our Core+ real estate strategies.
“Our hedge funds” refers to our funds of hedge funds, hedge funds, certain of our real estate debt investment funds, including a registered investment company, and certain other credit-focused funds which are managed by Blackstone.
We refer to our business development companies as “BDCs,” to Blackstone Private Credit Fund as “BCRED” and to Blackstone Secured Lending Fund as “BXSL.”
“BIS” refers to Blackstone Insurance Solutions, which partners with insurers to deliver bespoke, capital-efficient investments tailored to each insurer’s needs and risk profile.
We refer to our separately managed accounts as “SMAs.”
“Assets Under Management” refers to the assets we manage. Our Assets Under Management equals the sum of:
| (a) | the fair value of the investments held by our carry funds and our side-by-side and co-investment entities managed by us plus the capital that we are entitled to call from investors in those funds and entities pursuant to the terms of their respective capital commitments, including capital commitments to funds that have yet to commence their investment periods, |
| (b) | the net asset value of (1) our hedge funds, real estate debt carry funds, BPP, certain co-investments managed by us, certain credit-focused funds, and our Hedge Fund Solutions drawdown funds (plus, in each case, the capital that we are entitled to call from investors in those funds, including commitments yet to commence their investment periods), and (2) our funds of hedge funds, our Hedge Fund Solutions registered investment companies, and BREIT, |
| (c) | the invested capital, fair value or net asset value of assets we manage pursuant to separately managed accounts, |
| (d) | the amount of debt and equity outstanding for our collateralized loan obligations (“CLO”) during the reinvestment period, |
| (e) | the aggregate par amount of collateral assets, including principal cash, for our CLOs after the reinvestment period, |
3
| (f) | the gross or net amount of assets (including leverage where applicable) for our credit-focused registered investment companies, |
| (g) | the fair value of common stock, preferred stock, convertible debt, term loans or similar instruments issued by BXMT, and |
| (h) | borrowings under and any amounts available to be borrowed under certain credit facilities of our funds. |
Our carry funds are commitment-based drawdown structured funds that do not permit investors to redeem their interests at their election. Our funds of hedge funds, hedge funds, funds structured like hedge funds and other open-ended funds in our Real Estate, Hedge Fund Solutions and Credit & Insurance segments generally have structures that afford an investor the right to withdraw or redeem their interests on a periodic basis (for example, annually or quarterly), typically with 30 to 95 days’ notice, depending on the fund and the liquidity profile of the underlying assets. Investment advisory agreements related to certain separately managed accounts in our Hedge Fund Solutions and Credit & Insurance segments, excluding our BIS separately managed accounts, may generally be terminated by an investor on 30 to 90 days’ notice.
“Fee-Earning Assets Under Management” refers to the assets we manage on which we derive management fees and/or performance revenues. Our Fee-Earning Assets Under Management equals the sum of:
| (a) | for our Private Equity segment funds and Real Estate segment carry funds, including certain BREDS and Hedge Fund Solutions funds, the amount of capital commitments, remaining invested capital, fair value, net asset value or par value of assets held, depending on the fee terms of the fund, |
| (b) | for our credit-focused carry funds, the amount of remaining invested capital (which may include leverage) or net asset value, depending on the fee terms of the fund, |
| (c) | the remaining invested capital or fair value of assets held in co-investment vehicles managed by us on which we receive fees, |
| (d) | the net asset value of our funds of hedge funds, hedge funds, BPP, certain co-investments managed by us, certain registered investment companies, BREIT, and certain of our Hedge Fund Solutions drawdown funds, |
| (e) | the invested capital, fair value of assets or the net asset value we manage pursuant to separately managed accounts, |
| (f) | the net proceeds received from equity offerings and accumulated distributable earnings of BXMT, subject to certain adjustments, |
| (g) | the aggregate par amount of collateral assets, including principal cash, of our CLOs, and |
| (h) | the gross amount of assets (including leverage) or the net assets (plus leverage where applicable) for certain of our credit-focused registered investment companies. |
Each of our segments may include certain Fee-Earning Assets Under Management on which we earn performance revenues but not management fees.
Our calculations of assets under management and fee-earning assets under management may differ from the calculations of other asset managers, and as a result this measure may not be comparable to similar measures presented by other asset managers. In addition, our calculation of assets under management includes commitments to, and the fair value of, invested capital in our funds from Blackstone and our personnel, regardless of whether such commitments or invested capital are subject to fees. Our definitions of assets under management and fee-earning assets under management are not based on any definition of assets under management and fee-earning assets under management that is set forth in the agreements governing the investment funds that we manage.
4
For our carry funds, total assets under management includes the fair value of the investments held and uncalled capital commitments, whereas fee-earning assets under management may include the total amount of capital commitments or the remaining amount of invested capital at cost, depending on whether the investment period has expired or as specified by the fee terms of the fund. As such, in certain carry funds fee-earning assets under management may be greater than total assets under management when the aggregate fair value of the remaining investments is less than the cost of those investments.
“Perpetual Capital” refers to the component of assets under management with an indefinite term, that is not in liquidation, and for which there is no requirement to return capital to investors through redemption requests in the ordinary course of business, except where funded by new capital inflows. Perpetual Capital includes co-investment capital with an investor right to convert into Perpetual Capital.
This report does not constitute an offer of any Blackstone Fund.
5
Part I. Financial Information
Item 1. |
Financial Statements |
The Blackstone Group Inc.
Condensed Consolidated Statements of Financial Condition (Unaudited)
(Dollars in Thousands, Except Share Data)
March 31, |
December 31, | |||||||
2021 |
2020 | |||||||
Assets |
||||||||
Cash and Cash Equivalents |
$ |
2,862,422 |
$ |
1,999,484 |
||||
Cash Held by Blackstone Funds and Other |
109,285 |
64,972 |
||||||
Investments (including assets pledged of $83,538 and $110,835 at March 31, 2021 and December 31, 2020, respectively) |
17,943,309 |
15,617,142 |
||||||
Accounts Receivable |
975,610 |
866,158 |
||||||
Due from Affiliates |
3,015,318 |
3,221,515 |
||||||
Intangible Assets, Net |
340,478 |
347,955 |
||||||
Goodwill |
1,890,185 |
1,901,485 |
||||||
Other Assets |
434,475 |
481,022 |
||||||
Right-of-Use Assets |
736,633 |
526,943 |
||||||
Deferred Tax Assets |
1,402,271 |
1,242,576 |
||||||
Total Assets |
$ |
29,709,986 |
$ |
26,269,252 |
||||
Liabilities and Equity |
||||||||
Loans Payable |
$ |
5,573,965 |
$ |
5,644,653 |
||||
Due to Affiliates |
1,161,775 |
1,135,041 |
||||||
Accrued Compensation and Benefits |
4,376,226 |
3,433,260 |
||||||
Securities Sold, Not Yet Purchased |
33,160 |
51,033 |
||||||
Repurchase Agreements |
58,050 |
76,808 |
||||||
Operating Lease Liabilities |
842,692 |
620,844 |
||||||
Accounts Payable, Accrued Expenses and Other Liabilities |
838,930 |
717,104 |
||||||
Total Liabilities |
12,884,798 |
11,678,743 |
||||||
Commitments and Contingencies |
||||||||
Redeemable Non-Controlling Interests in Consolidated Entities |
65,546 |
65,161 |
||||||
Equity |
||||||||
Stockholders’ Equity of The Blackstone Group Inc. |
||||||||
Common Stock, $0.00001 par value, 90 billion shares authorized, (690,569,563 shares issued and outstanding as of March 31, 2021; 683,875,544 shares issued and outstanding as of December 31, 2020) |
7 |
7 |
||||||
Series I Preferred Stock, $0.00001 par value, 999,999,000 shares authorized, (1 share issued and outstanding as of March 31, 2021 and December 31, 2020) |
— |
— |
||||||
Series II Preferred Stock, $0.00001 par value, 1,000 shares authorized, (1 share issued and outstanding as of March 31, 2021 and December 31, 2020) |
— |
— |
||||||
Additional Paid-in-Capital |
6,446,829 |
6,332,105 |
||||||
Retained Earnings |
1,408,768 |
335,762 |
||||||
Accumulated Other Comprehensive Loss |
(11,454 |
) |
(15,831 |
) | ||||
Total Stockholders’ Equity of The Blackstone Group Inc. |
7,844,150 |
6,652,043 |
||||||
Non-Controlling Interests in Consolidated Entities |
4,390,594 |
4,042,157 |
||||||
Non-Controlling Interests in Blackstone Holdings |
4,524,898 |
3,831,148 |
||||||
Total Equity |
16,759,642 |
14,525,348 |
||||||
Total Liabilities and Equity |
$ |
29,709,986 |
$ |
26,269,252 |
||||
continued...
See notes to condensed consolidated financial statements.
6
The Blackstone Group Inc.
Condensed Consolidated Statements of Financial Condition (Unaudited)
(Dollars in Thousands)
The following presents the asset and liability portion of the consolidated balances presented in the Condensed Consolidated Statements of Financial Condition attributable to consolidated Blackstone Funds which are variable interest entities. The following assets may only be used to settle obligations of these consolidated Blackstone Funds and these liabilities are only the obligations of these consolidated Blackstone Funds and they do not have recourse to the general credit of Blackstone.
March 31, |
December 31, | |||||||
2021 |
2020 | |||||||
Assets |
||||||||
Cash Held by Blackstone Funds and Other |
$ |
109,285 |
$ |
64,972 |
||||
Investments |
1,459,804 |
1,455,008 |
||||||
Accounts Receivable |
88,560 |
120,099 |
||||||
Due from Affiliates |
9,813 |
8,676 |
||||||
Other Assets |
674 |
262 |
||||||
Total Assets |
$ |
1,668,136 |
$ |
1,649,017 |
||||
Liabilities |
||||||||
Loans Payable |
$ |
100 |
$ |
99 |
||||
Due to Affiliates |
87,087 |
65,429 |
||||||
Securities Sold, Not Yet Purchased |
23,936 |
41,709 |
||||||
Repurchase Agreements |
58,050 |
76,808 |
||||||
Accounts Payable, Accrued Expenses and Other Liabilities |
54,539 |
37,221 |
||||||
Total Liabilities |
$ |
223,712 |
$ |
221,266 |
||||
See notes to condensed consolidated financial statements.
7
The Blackstone Group Inc.
Condensed Consolidated Statements of Operations (Unaudited)
(Dollars in Thousands, Except Share and Per Share Data)
Three Months Ended | ||||||||
March 31, | ||||||||
2021 |
2020 | |||||||
| Revenues |
||||||||
| Management and Advisory Fees, Net |
$ |
1,177,815 |
$ |
934,832 |
||||
| |
|
|
|
|
| |||
| Incentive Fees |
36,124 |
12,161 |
||||||
| |
|
|
|
|
| |||
| Investment Income (Loss) |
||||||||
| Performance Allocations |
||||||||
| Realized |
534,367 |
167,530 |
||||||
| Unrealized |
2,464,497 |
(3,453,081 |
) | |||||
| Principal Investments |
||||||||
| Realized |
355,038 |
48,695 |
||||||
| Unrealized |
639,315 |
(959,365 |
) | |||||
| |
|
|
|
|
| |||
| Total Investment Income (Loss) |
3,993,217 |
(4,196,221 |
) | |||||
| |
|
|
|
|
| |||
| Interest and Dividend Revenue |
31,412 |
35,084 |
||||||
| Other |
60,304 |
138,180 |
||||||
| |
|
|
|
|
| |||
| Total Revenues |
5,298,872 |
(3,075,964 |
) | |||||
| |
|
|
|
|
| |||
| Expenses |
||||||||
| Compensation and Benefits |
||||||||
| Compensation |
542,638 |
476,543 |
||||||
| Incentive Fee Compensation |
13,325 |
6,522 |
||||||
| Performance Allocations Compensation |
||||||||
| Realized |
213,027 |
72,423 |
||||||
| Unrealized |
1,049,969 |
(1,397,378 |
) | |||||
| |
|
|
|
|
| |||
| Total Compensation and Benefits |
1,818,959 |
(841,890 |
) | |||||
| General, Administrative and Other |
185,122 |
157,566 |
||||||
| Interest Expense |
44,983 |
41,644 |
||||||
| Fund Expenses |
2,383 |
4,605 |
||||||
| |
|
|
|
|
| |||
| Total Expenses |
2,051,447 |
(638,075 |
) | |||||
| |
|
|
|
|
| |||
| Other Income (Loss) |
||||||||
| Change in Tax Receivable Agreement Liability |
2,910 |
(595 |
) | |||||
| Net Gains (Losses) from Fund Investment Activities |
120,353 |
(327,374 |
) | |||||
| |
|
|
|
|
| |||
| Total Other Income (Loss) |
123,263 |
(327,969 |
) | |||||
| |
|
|
|
|
| |||
| Income (Loss) Before Benefit for Taxes |
3,370,688 |
(2,765,858 |
) | |||||
| Benefit for Taxes |
(447 |
) |
(158,703 |
) | ||||
| |
|
|
|
|
| |||
| Net Income (Loss) |
3,371,135 |
(2,607,155 |
) | |||||
| Net Income (Loss) Attributable to Redeemable Non-Controlling Interests in Consolidated Entities |
629 |
(15,469 |
) | |||||
| Net Income (Loss) Attributable to Non-Controlling Interests in Consolidated Entities |
386,850 |
(645,077 |
) | |||||
| Net Income (Loss) Attributable to Non-Controlling Interests in Blackstone Holdings |
1,235,784 |
(880,117 |
) | |||||
| |
|
|
|
|
| |||
| Net Income (Loss) Attributable to The Blackstone Group Inc. |
$ |
1,747,872 |
$ |
(1,066,492 |
) | |||
| |
|
|
|
|
| |||
| Net Income (Loss) Per Share of Common Stock |
||||||||
| Basic |
$ |
2.47 |
$ |
(1.58 |
) | |||
| |
|
|
|
|
| |||
| Diluted |
$ |
2.46 |
$ |
(1.58 |
) | |||
| |
|
|
|
|
| |||
| Weighted-Average Shares of Common Stock Outstanding |
||||||||
| Basic |
709,033,212 |
676,305,359 |
||||||
| |
|
|
|
|
| |||
| Diluted |
709,912,344 |
676,305,359 |
||||||
| |
|
|
|
|
| |||
See notes to condensed consolidated financial statements.
8
The Blackstone Group Inc.
Condensed Consolidated Statements of Comprehensive Income (Unaudited)
(Dollars in Thousands)
Three Months Ended | ||||||||
March 31, | ||||||||
2021 |
2020 | |||||||
| Net Income (Loss) |
$ |
3,371,135 |
$ |
(2,607,155 |
) | |||
| Other Comprehensive Income (Loss) – Currency Translation Adjustment |
7,931 |
(20,219 |
) | |||||
| |
|
|
|
|
| |||
| Comprehensive Income (Loss) |
3,379,066 |
(2,627,374 |
) | |||||
| |
|
|
|
|
| |||
| Less: |
||||||||
| Comprehensive Income (Loss) Attributable to Redeemable Non-Controlling Interests in Consolidated Entitie s |
629 |
(15,469 |
) | |||||
| Comprehensive Income (Loss) Attributable to Non-Controlling Interests in Consolidated Entities |
386,850 |
(645,077 |
) | |||||
| Comprehensive Income (Loss) Attributable to Non-Controlling Interests in Blackstone Holdings |
1,239,338 |
(887,298 |
) | |||||
| |
|
|
|
|
| |||
| Comprehensive Income (Loss) Attributable to Non-Controlling Interests |
1,626,817 |
(1,547,844 |
) | |||||
| |
|
|
|
|
| |||
| Comprehensive Income (Loss) Attributable to The Blackstone Group Inc. |
$ |
1,752,249 |
$ (1,079,530 |
) | ||||
| |
|
|
|
|
| |||
See notes to condensed consolidated financial statements.
9
The Blackstone Group Inc.
Condensed Consolidated Statements of Changes in Equity (Unaudited)
(Dollars in Thousands, Except Share Data)
Shares of The Blackstone Group Inc. (a) |
The Blackstone Group Inc. (a) |
|||||||||||||||||||||||||||||||||||||||
Accumulated |
Redeemable | |||||||||||||||||||||||||||||||||||||||
Other |
Non- |
Non- |
Non- | |||||||||||||||||||||||||||||||||||||
Compre- |
Total |
Controlling |
Controlling |
Controlling | ||||||||||||||||||||||||||||||||||||
Additional |
Retained |
hensive |
Stock- |
Interests in |
Interests in |
Interests in | ||||||||||||||||||||||||||||||||||
Common |
Common |
Paid-in- |
Earnings |
Income |
holders’ |
Consolidated |
Blackstone |
Total |
Consolidated | |||||||||||||||||||||||||||||||
Stock |
Stock |
Capital |
(Deficit) |
(Loss) |
Equity |
Entities |
Holdings |
Equity |
Entities | |||||||||||||||||||||||||||||||
| Balance at December 31, 2020 |
683,875,544 |
$ |
7 |
$ |
6,332,105 |
$ |
335,762 |
$ |
(15,831 |
) |
$ |
6,652,043 |
$ |
4,042,157 |
$ |
3,831,148 |
$ |
14,525,348 |
$ |
65,161 |
||||||||||||||||||||
| Net Income |
— |
— |
— |
1,747,872 |
— |
1,747,872 |
386,850 |
1,235,784 |
3,370,506 |
629 |
||||||||||||||||||||||||||||||
| Currency Translation Adjustment |
— |
— |
— |
— |
4,377 |
4,377 |
— |
3,554 |
7,931 |
— |
||||||||||||||||||||||||||||||
| Capital Contributions |
— |
— |
— |
— |
— |
— |
207,297 |
2,708 |
210,005 |
— |
||||||||||||||||||||||||||||||
| Capital Distributions |
— |
— |
— |
(674,866 |
) |
— |
(674,866 |
) |
(242,200 |
) |
(582,970 |
) |
(1,500,036 |
) |
(244 |
) | ||||||||||||||||||||||||
| Transfer of Non-Controlling Interests in Consolidated Entities |
— |
— |
— |
— |
— |
— |
(3,510 |
) |
— |
(3,510 |
) |
— |
||||||||||||||||||||||||||||
| Deferred Tax Effects Resulting from Acquisition of Ownership Interests from Non-Controlling Interest Holders |
— |
— |
10,179 |
— |
— |
10,179 |
— |
— |
10,179 |
— |
||||||||||||||||||||||||||||||
| Equity-Based Compensation |
— |
— |
91,523 |
— |
— |
91,523 |
— |
65,895 |
157,418 |
— |
||||||||||||||||||||||||||||||
| Net Delivery of Vested Blackstone Holdings Partnership Units and Shares of Common Stock |
1,713,313 |
— |
(18,199 |
) |
— |
— |
(18,199 |
) |
— |
— |
(18,199 |
) |
— |
|||||||||||||||||||||||||||
| Repurchase of Shares of Common Stock and Blackstone Holdings Partnership Units |
— |
— |
— |
— |
— |
— |
— |
— |
— |
— |
||||||||||||||||||||||||||||||
| Change in The Blackstone Group Inc.’s Ownership Interest |
— |
— |
(7,445 |
) |
— |
— |
(7,445 |
) |
— |
7,445 |
— |
— |
||||||||||||||||||||||||||||
| Conversion of Blackstone Holdings Partnership Units to Shares of Common Stock |
4,980,706 |
— |
38,666 |
— |
— |
38,666 |
— |
(38,666 |
) |
— |
— |
|||||||||||||||||||||||||||||
| |
|
|
|
|
|
|
|
|
|
|
|
|
|
|
|
|
|
|
|
|
|
|
|
|
|
|
|
|
| |||||||||||
| Balance at March 31, 2021 |
690,569,563 |
$ |
7 |
$ |
6,446,829 |
$ |
1,408,768 |
$ |
(11,454 |
) |
$ |
7,844,150 |
$ |
4,390,594 |
$ |
4,524,898 |
$ |
16,759,642 |
$ |
65,546 |
||||||||||||||||||||
| |
|
|
|
|
|
|
|
|
|
|
|
|
|
|
|
|
|
|
|
|
|
|
|
|
|
|
|
|
| |||||||||||
| (a) | During the period presented, Blackstone also had one share outstanding of each of Series I and Series II preferred stock, with par value of each less than one cent. |
continued...
See notes to condensed consolidated financial statements.
10
The Blackstone Group Inc.
Condensed Consolidated Statements of Changes in Equity (Unaudited)
(Dollars in Thousands, Except Share Data)
| Shares of The Blackstone |
||||||||||||||||||||||||||||||||||||||||
Group Inc. (a) |
The Blackstone Group Inc. (a) |
|||||||||||||||||||||||||||||||||||||||
Accumulated |
Redeemable | |||||||||||||||||||||||||||||||||||||||
Other |
Non- |
Non- |
Non- | |||||||||||||||||||||||||||||||||||||
Compre- |
Total |
Controlling |
Controlling |
Controlling | ||||||||||||||||||||||||||||||||||||
Additional |
Retained |
hensive |
Stock- |
Interests in |
Interests in |
Interests in | ||||||||||||||||||||||||||||||||||
Common |
Common |
Paid-in- |
Earnings |
Income |
holders’ |
Consolidated |
Blackstone |
Total |
Consolidated | |||||||||||||||||||||||||||||||
Stock |
Stock |
Capital |
(Deficit) |
(Loss) |
Equity |
Entities |
Holdings |
Equity |
Entities | |||||||||||||||||||||||||||||||
| Balance at December 31, 2019 |
671,157,692 |
$ |
7 |
$ |
6,428,647 |
$ |
609,625 |
$ |
(28,495 |
) |
$ |
7,009,784 |
$ |
4,186,069 |
$ |
3,819,548 |
$ |
15,015,401 |
$ |
87,651 |
||||||||||||||||||||
| Net Income (Loss) |
— |
— |
— |
(1,066,492 |
) |
— |
(1,066,492 |
) |
(645,077 |
) |
(880,117 |
) |
(2,591,686 |
) |
(15,469 |
) | ||||||||||||||||||||||||
| Currency Translation Adjustment |
— |
— |
— |
— |
(13,038 |
) |
(13,038 |
) |
— |
(7,181 |
) |
(20,219 |
) |
— |
||||||||||||||||||||||||||
| Capital Contributions |
— |
— |
— |
— |
— |
— |
202,679 |
— |
202,679 |
— |
||||||||||||||||||||||||||||||
| Capital Distributions |
— |
— |
— |
(415,081 |
) |
— |
(415,081 |
) |
(150,272 |
) |
(365,701 |
) |
(931,054 |
) |
(116 |
) | ||||||||||||||||||||||||
| Transfer of Non-Controlling Interests in Consolidated Entities |
— |
— |
— |
— |
— |
— |
(2,239 |
) |
— |
(2,239 |
) |
— |
||||||||||||||||||||||||||||
| Deferred Tax Effects Resulting from Acquisition of Ownership Interests from Non-Controlling Interest Holder s |
— |
— |
12,394 |
— |
— |
12,394 |
— |
— |
12,394 |
— |
||||||||||||||||||||||||||||||
| Equity-Based Compensation |
— |
— |
50,824 |
— |
— |
50,824 |
— |
38,658 |
89,482 |
— |
||||||||||||||||||||||||||||||
| Net Delivery of Vested Blackstone Holdings Partnership Units and Shares of Common Stock |
1,683,494 |
— |
(15,241 |
) |
— |
— |
(15,241 |
) |
— |
(7 |
) |
(15,248 |
) |
— |
||||||||||||||||||||||||||
| Repurchase of Shares of Common Stock and Blackstone Holdings Partnership Units |
(4,969,237 |
) |
— |
(253,468 |
) |
— |
— |
(253,468 |
) |
— |
— |
(253,468 |
) |
— |
||||||||||||||||||||||||||
| Change in The Blackstone Group Inc.’s Ownership Interest |
— |
— |
9,779 |
— |
— |
9,779 |
— |
(9,779 |
) |
— |
— |
|||||||||||||||||||||||||||||
| Conversion of Blackstone Holdings Partnership Units to Shares of Common Stock |
8,758,540 |
— |
65,158 |
— |
— |
65,158 |
— |
(65,158 |
) |
— |
— |
|||||||||||||||||||||||||||||
| |
|
|
|
|
|
|
|
|
|
|
|
|
|
|
|
|
|
|
|
|
|
|
|
|
|
|
|
|
| |||||||||||
| Balance at March 31, 2020 |
676,630,489 |
$ |
7 |
$ |
6,298,093 |
$ |
(871,948 |
) |
$ |
(41,533 |
) |
$ |
5,384,619 |
$ |
3,591,160 |
$ |
2,530,263 |
$ |
11,506,042 |
$ |
72,066 |
|||||||||||||||||||
| |
|
|
|
|
|
|
|
|
|
|
|
|
|
|
|
|
|
|
|
|
|
|
|
|
|
|
|
|
| |||||||||||
| (a) | During the period presented, Blackstone also had one share outstanding of each of Series I and Series II preferred stock, with par value of each less than one cent. |
See notes to condensed consolidated financial statements.
11
The Blackstone Group Inc.
Condensed Consolidated Statements of Cash Flows (Unaudited)
(Dollars in Thousands)
Three Months Ended March 31, | ||||||||
2021 |
2020 | |||||||
Operating Activities |
||||||||
Net Income (Loss) |
$ |
3,371,135 |
$ |
(2,607,155 |
) | |||
Adjustments to Reconcile Net Income (Loss) to Net Cash Provided by Operating Activities |
||||||||
Blackstone Funds Related |
||||||||
Net Realized Gains on Investments |
(942,407 |
) |
(156,408 |
) | ||||
Changes in Unrealized (Gains) Losses on Investments |
(723,783 |
) |
1,292,707 |
|||||
Non-Cash Performance Allocations |
(2,464,497 |
) |
3,453,081 |
|||||
Non-Cash Performance Allocations and Incentive Fee Compensation |
1,276,321 |
(1,318,433 |
) | |||||
Equity-Based Compensation Expense |
163,867 |
118,812 |
||||||
Amortization of Intangibles |
18,778 |
17,750 |
||||||
Other Non-Cash Amounts Included in Net Income (Loss) |
(204,164 |
) |
(237,086 |
) | ||||
Cash Flows Due to Changes in Operating Assets and Liabilities Accounts Receivable |
(32,900 |
) |
496,348 |
|||||
Due from Affiliates |
265,981 |
(54,790 |
) | |||||
Other Assets |
70,339 |
(168,965 |
) | |||||
Accrued Compensation and Benefits |
(339,805 |
) |
(541,706 |
) | ||||
Securities Sold, Not Yet Purchased |
(17,600 |
) |
(26,840 |
) | ||||
Accounts Payable, Accrued Expenses and Other Liabilities |
49,029 |
(103,025 |
) | |||||
Repurchase Agreements |
(18,758 |
) |
(48,985 |
) | ||||
Due to Affiliates |
31,228 |
(5,498 |
) | |||||
Investments Purchased |
(916,378 |
) |
(2,065,680 |
) | ||||
Cash Proceeds from Sale of Investments |
2,710,298 |
2,955,340 |
||||||
Net Cash Provided by Operating Activities |
2,296,684 |
999,467 |
||||||
Investing Activities |
||||||||
Purchase of Furniture, Equipment and Leasehold Improvements |
(20,741 |
) |
(12,428 |
) | ||||
Net Cash Used in Investing Activities |
(20,741 |
) |
(12,428 |
) | ||||
Financing Activities |
||||||||
Distributions to Non-Controlling Interest Holders in Consolidated Entities |
(242,444 |
) |
(148,415 |
) | ||||
Contributions from Non-Controlling Interest Holders in Consolidated Entities |
204,691 |
154,914 |
||||||
Payments Under Tax Receivable Agreement |
(51,366 |
) |
(73,881 |
) | ||||
Net Settlement of Vested Common Stock and Repurchase of Common Stock and Blackstone Holdings Partnership Units |
(18,199 |
) |
(268,716 |
) | ||||
Proceeds from Loans Payable |
— |
102 |
||||||
continued...
See notes to condensed consolidated financial statements.
12
The Blackstone Group Inc.
Condensed Consolidated Statements of Cash Flows (Unaudited)
(Dollars in Thousands)
Three Months Ended March 31, | ||||||||
2021 |
2020 | |||||||
| Financing Activities (Continued) |
||||||||
| Repayment and Repurchase of Loans Payable |
$ |
— |
$ |
(938 |
) | |||
| Dividends/Distributions to Shareholders and Unitholders |
(1,255,128 |
) |
(780,782 |
) | ||||
| |
|
|
|
|
| |||
| Net Cash Used in Financing Activities |
(1,362,446 |
) |
(1,117,716 |
) | ||||
| |
|
|
|
|
| |||
| Effect of Exchange Rate Changes on Cash and Cash Equivalents and Cash Held by Blackstone Funds and Other |
(6,246 |
) |
(6,645 |
) | ||||
| |
|
|
|
|
| |||
| Cash and Cash Equivalents and Cash Held by Blackstone Funds and Other |
||||||||
| Net Increase (Decrease) |
907,251 |
(137,322 |
) | |||||
| Beginning of Period |
2,064,456 |
2,523,651 |
||||||
| |
|
|
|
|
| |||
| End of Period |
$ |
2,971,707 |
$ |
2,386,329 |
||||
| |
|
|
|
|
| |||
| Supplemental Disclosure of Cash Flows Information |
||||||||
| Payments for Interest |
$ |
51,368 |
$ |
42,440 |
||||
| |
|
|
|
|
| |||
| Payments for Income Taxes |
$ |
34,735 |
$ |
13,217 |
||||
| |
|
|
|
|
| |||
| Supplemental Disclosure of Non-Cash Investing and Financing Activities |
||||||||
| Non-Cash Contributions from Non-Controlling Interest Holders |
$ |
1,717 |
$ |
44,835 |
||||
| |
|
|
|
|
| |||
| Non-Cash Distributions to Non-Controlling Interest Holders |
$ |
— |
$ |
(1,973 |
) | |||
| |
|
|
|
|
| |||
| Transfer of Interests to Non-Controlling Interest Holders |
$ |
(3,510 |
) |
$ |
(2,239 |
) | ||
| |
|
|
|
|
| |||
| Change in The Blackstone Group Inc.’s Ownership Interest |
$ |
(7,445 |
) |
$ |
9,779 |
|||
| |
|
|
|
|
| |||
| Net Settlement of Vested Common Stock |
$ |
89,733 |
$ |
60,214 |
||||
| |
|
|
|
|
| |||
| Conversion of Blackstone Holdings Units to Common Stock |
$ |
38,666 |
$ |
65,158 |
||||
| |
|
|
|
|
| |||
| Acquisition of Ownership Interests from Non-Controlling Interest Holders |
||||||||
| Deferred Tax Asset |
$ |
(88,352 |
) |
$ |
(126,171 |
) | ||
| |
|
|
|
|
| |||
| Due to Affiliates |
$ |
78,173 |
$ |
113,777 |
||||
| |
|
|
|
|
| |||
| Equity |
$ |
10,179 |
$ |
12,394 |
||||
| |
|
|
|
|
| |||
The following table provides a reconciliation of Cash and Cash Equivalents and Cash Held by Blackstone Funds and Other reported within the Condensed Consolidated Statements of Financial Condition:
March 31, |
December 31, | |||||||
2021 |
2020 | |||||||
| Cash and Cash Equivalents |
$ |
2,862,422 |
$ |
1,999,484 |
||||
| Cash Held by Blackstone Funds and Other |
109,285 |
64,972 |
||||||
| |
|
|
|
|
| |||
$ |
2,971,707 |
$ |
2,064,456 |
|||||
| |
|
|
|
|
| |||
See notes to condensed consolidated financial statements.
13
The Blackstone Group Inc.
Notes to Condensed Consolidated Financial Statements (Unaudited)
(All Dollars are in Thousands, Except Share and Per Share Data, Except Where Noted)
1. Organization
The Blackstone Group Inc., together with its consolidated subsidiaries (“Blackstone” or the “Company”), is one of the world’s leading investment firms. Blackstone’s asset management business includes investment vehicles focused on real estate, private equity, public debt and equity, growth equity, opportunistic, non-investment grade credit, real assets and secondary funds, all on a global basis. “Blackstone Funds” refers to the funds and other vehicles that are managed by Blackstone. Blackstone’s business is organized into four segments: Real Estate, Private Equity, Hedge Fund Solutions and Credit & Insurance.
Blackstone was formed as The Blackstone Group L.P., a Delaware limited partnership, on March 12, 2007. Prior to its conversion (effective July 1, 2019) to a Delaware corporation (the “Conversion”), The Blackstone Group Inc., Blackstone was managed and operated by Blackstone Group Management L.L.C., which is in turn wholly owned by Blackstone’s senior managing directors and controlled by one
of Blackstone’s founders, Stephen A. Schwarzman (the “Founder”). Effective February 26, 2021, the Certificate of Incorporation of The Blackstone Group Inc. was amended and restated to rename Blackstone’s Class A Common stock as “common stock” and reclassify Blackstone’s Class B common stock and Class C common stock into a new Series I preferred stock and a new Series II preferred stock, respectively. All references to common stock, series I preferred stock and series II preferred stock prior to such date refer to Class A, Class B and Class C common stock, respectively. See Note 13. “Income Taxes” and Note 14. “Earnings Per Share and Stockholders’ Equity – Stockholders’ Equity.”
The activities of Blackstone are conducted through its holding partnerships: Blackstone Holdings I L.P., Blackstone Holdings AI L.P., Blackstone Holdings II L.P., Blackstone Holdings III L.P. and Blackstone Holdings IV L.P. (collectively, “Blackstone Holdings,” “Blackstone Holdings Partnerships” or the “Holding Partnerships”). Blackstone, through its wholly owned subsidiaries, is the sole general partner in each of these Holding Partnerships. Generally, holders of the limited partner interests in the Holding Partnerships may, four times each year, exchange their limited partnership interests (“Partnership Units”) for Blackstone common stock, on a one-to-one basis, exchanging one Partnership Unit from each of the Holding Partnerships for one share of Blackstone common stock.
2. Summary of Significant Accounting Policies
Basis of Presentation
The accompanying unaudited condensed consolidated financial statements of Blackstone have been prepared in accordance with accounting principles generally accepted in the United States of America (“GAAP”) for interim financial information and the instructions to Form 10-Q. The condensed consolidated financial statements, including these notes, are unaudited and exclude some of the disclosures required in audited financial statements. Management believes it has made all necessary adjustments (consisting of only normal recurring items) so that the condensed consolidated financial statements are presented fairly and that estimates made in preparing its condensed consolidated financial statements are reasonable and prudent. The operating results presented for interim periods are not necessarily indicative of the results that may be expected for any other interim period or for the entire year. These condensed consolidated financial statements should be read in conjunction with the audited consolidated financial statements included in Blackstone’s Annual Report on Form 10-K for the year ended December 31, 2020 filed with the Securities and Exchange Commission.
14
The Blackstone Group Inc.
Notes to Condensed Consolidated Financial Statements (Unaudited) - Continued
(All Dollars are in Thousands, Except Share and Per Share Data, Except Where Noted)
The condensed consolidated financial statements include the accounts of Blackstone, its wholly owned or majority owned subsidiaries, the consolidated entities which are considered to be variable interest entities and for which Blackstone is considered the primary beneficiary, and certain partnerships or similar entities which are not considered variable interest entities but in which the general partner is determined to have control.
All intercompany balances and transactions have been eliminated in consolidation.
Restructurings within consolidated collateralized loan obligations (“CLOs”) are treated as investment purchases or sales, as applicable, in the Condensed Consolidated Statements of Cash Flows.
COVID-19
and Global Economic Market Conditions The ongoing novel coronavirus (“COVID-19”) pandemic and restrictions on certain non-essential businesses have caused disruption in the U.S. and global economies. Although an economic recovery is partially underway, it continues to be gradual, uneven, and characterized by meaningful dispersion across sectors and regions. The estimates and assumptions underlying these consolidated financial statements are based on the information available as of March 31, 2021 for the current period and as of March 31, 2020 or December 31, 2020, as applicable. The estimates and assumptions include judgments about financial market and economic conditions which have changed, and may continue to change, over time.
Consolidation
Blackstone consolidates all entities that it controls through a majority voting interest or otherwise, including those Blackstone Funds in which the general partner has a controlling financial interest. Blackstone has a controlling financial interest in Blackstone Holdings because the limited partners do not have the right to dissolve the partnerships or have substantive kick-out rights or participating rights that would overcome the control held by Blackstone. Accordingly, Blackstone consolidates Blackstone Holdings and records non-controlling interests to reflect the economic interests of the limited partners of Blackstone Holdings.
In addition, Blackstone consolidates all variable interest entities (“VIE”) for which it is the primary beneficiary. An enterprise is determined to be the primary beneficiary if it holds a controlling financial interest. A controlling financial interest is defined as (a) the power to direct the activities of a VIE that most significantly impact the entity’s economic performance and (b) the obligation to absorb losses of the entity or the right to receive benefits from the entity that could potentially be significant to the VIE. The consolidation guidance requires an analysis to determine (a) whether an entity in which Blackstone holds a variable interest is a VIE and (b) whether Blackstone’s involvement, through holding interests directly or indirectly in the entity or contractually through other variable interests, would give it a controlling financial interest. Performance of that analysis requires the exercise of judgment.
Blackstone determines whether it is the primary beneficiary of a VIE at the time it becomes involved with a variable interest entity and continuously reconsiders that conclusion. In determining whether Blackstone is the primary beneficiary, Blackstone evaluates its control rights as well as economic interests in the entity held either directly or indirectly by Blackstone. The consolidation analysis can generally be performed qualitatively; however, if it is not readily apparent that Blackstone is not the primary beneficiary, a quantitative analysis may also be performed. Investments and redemptions (either by Blackstone, affiliates of Blackstone or third parties) or amendments to the governing documents of the respective Blackstone Funds could affect an entity’s status as a VIE or the determination of the primary beneficiary. At each reporting date, Blackstone assesses whether it is the primary beneficiary and will consolidate or deconsolidate accordingly.
Assets of consolidated VIEs that can only be used to settle obligations of the consolidated VIE and liabilities of a consolidated VIE for which creditors (or beneficial interest holders) do not have recourse to the general credit of Blackstone are presented in a separate section in the Condensed Consolidated Statements of Financial Condition.
15
The Blackstone Group Inc.
Notes to Condensed Consolidated Financial Statements (Unaudited) - Continued
(All Dollars are in Thousands, Except Share and Per Share Data, Except Where Noted)
Blackstone’s other disclosures regarding VIEs are discussed in Note 9. “Variable Interest Entities.”
Revenue Recognition
Revenues primarily consist of management and advisory fees, incentive fees, investment income, interest and dividend revenue and other.
Management and advisory fees and incentive fees are accounted for as contracts with customers. Under the guidance for contracts with customers, an entity is required to (a) identify the contract(s) with a customer, (b) identify the performance obligations in the contract, (c) determine the transaction price, (d) allocate the transaction price to the performance obligations in the contract, and (e) recognize revenue when (or as) the entity satisfies a performance obligation. In determining the transaction price, an entity may include variable consideration only to the extent that it is probable that a significant reversal in the amount of cumulative revenue recognized would not occur when the uncertainty associated with the variable consideration is resolved. See Note 18. “Segment Reporting” for a disaggregated presentation of revenues from contracts with customers.
Management and Advisory Fees, Net
Blackstone earns base management fees from limited partners of funds in each of its managed funds, at a fixed percentage of assets under management, net asset value, total assets, committed capital or invested capital. These customer contracts require Blackstone to provide investment management services, which represents a performance obligation that Blackstone satisfies over time. Management fees are a form of variable consideration because the fees Blackstone is entitled to vary based on fluctuations in the basis for the management fee. The amount recorded as revenue is generally determined at the end of the period because these management fees are payable on a regular basis (typically quarterly) and are not subject to clawback once paid.
Transaction, advisory and other fees are principally fees charged to the limited partners of funds indirectly through the managed funds and portfolio companies. The investment advisory agreements generally require that the investment adviser reduce the amount of management fees payable by the limited partners to Blackstone (“management fee reductions”) by an amount equal to a portion of the transaction and other fees paid to Blackstone by the portfolio companies. The amount of the reduction varies by fund, the type of fee paid by the portfolio company and the previously incurred expenses of the fund. These fees and associated management fee reductions are a component of the transaction price for Blackstone’s performance obligation to provide investment management services to the limited partners of funds and are recognized as changes to the transaction price in the period in which they are charged and the services are performed.
Management fee offsets are reductions to management fees payable by the limited partners of the Blackstone Funds, which are based on the amount such limited partners reimburse the Blackstone Funds or Blackstone primarily for placement fees. Providing investment management services requires Blackstone to arrange for services on behalf of its customers. In those situations where Blackstone is acting as an agent on behalf of the limited partners of funds, it presents the cost of services as net against management fee revenue. In all other situations, Blackstone is primarily responsible for fulfilling the services and is therefore acting as a principal for those arrangements. As a result, the cost of those services is presented as Compensation or General, Administrative and Other expense, as appropriate, with any reimbursement from the limited partners of the funds recorded as Management and Advisory Fees, Net. In cases where the limited partners of the funds are determined to be the customer in an arrangement, placement fees may be capitalized as a cost to acquire a customer contract. Capitalized placement fees are amortized over the life of the customer contract, are recorded within Other Assets in the Condensed Consolidated Statements of Financial Condition and amortization is recorded within General, Administrative and Other within the Condensed Consolidated Statements of Operations.
16
The Blackstone Group Inc.
Notes to Condensed Consolidated Financial Statements (Unaudited) - Continued
(All Dollars are in Thousands, Except Share and Per Share Data, Except Where Noted)
Accrued but unpaid Management and Advisory Fees, net of management fee reductions and management fee offsets, as of the reporting date are included in Accounts Receivable or Due from Affiliates in the Condensed Consolidated Statements of Financial Condition.
Incentive Fees
Investment Income (Loss)
In carry fund structures, Blackstone, through its subsidiaries, invests alongside its limited partners in a partnership and is entitled to its pro-rata share of the results of the fund (a “pro-rata allocation”). In addition to a pro-rata allocation, and assuming certain investment returns are achieved, Blackstone is entitled to a disproportionate allocation of the income otherwise allocable to the limited partners, commonly referred to as carried interest (“Performance Allocations”).
Performance Allocations are made to the general partner based on cumulative fund performance to date, subject to a preferred return to limited partners. At the end of each reporting period, Blackstone calculates the balance of accrued Performance Allocations (“Accrued Performance Allocations”) that would be due to Blackstone for each fund, pursuant to the fund agreements, as if the fair value of the underlying investments were realized as of such date, irrespective of whether such amounts have been realized. As the fair value of underlying investments varies between reporting periods, it is necessary to make adjustments to amounts recorded as Accrued Performance Allocations to reflect either (a) positive performance resulting in an increase in the Accrued Performance Allocation to the general partner or (b) negative performance that would cause the amount due to Blackstone to be less than the amount previously recognized as revenue, resulting in a negative adjustment to the Accrued Performance Allocation to the general partner. In each scenario, it is necessary to calculate the Accrued Performance Allocation on cumulative results compared to the Accrued Performance Allocation recorded to date and make the required positive or negative adjustments. Blackstone ceases to record negative Performance Allocations once previously Accrued Performance Allocations for such fund have been fully reversed. Blackstone is not obligated to pay guaranteed returns or hurdles, and therefore, cannot have negative Performance Allocations over the life of a fund. Accrued Performance Allocations as of the reporting date are reflected in Investments in the Condensed Consolidated Statements of Financial Condition.
Performance Allocations are realized when an underlying investment is profitably disposed of and the fund’s cumulative returns are in excess of the preferred return or, in limited instances, after certain thresholds for return of capital are met. Performance Allocations are subject to clawback to the extent that the Performance Allocation received to date exceeds the amount due to Blackstone based on cumulative results. As such, the accrual for potential repayment of previously received Performance Allocations, which is a component of Due to Affiliates, represents all amounts previously distributed to Blackstone Holdings and non-controlling interest holders that would need to be repaid to the Blackstone carry funds if the Blackstone carry funds were to be liquidated based on the current fair value of the underlying funds’ investments as of the reporting date. The actual clawback liability, however, generally does not become realized until the end of a fund’s life except for certain funds, including certain Blackstone real estate funds, multi-asset class investment funds and credit-focused funds, which may have an interim clawback liability.
17
The Blackstone Group Inc.
Notes to Condensed Consolidated Financial Statements (Unaudited) - Continued
(All Dollars are in Thousands, Except Share and Per Share Data, Except Where Noted)
Principal Investments include the unrealized and realized gains and losses on Blackstone’s principal investments, including its investments in Blackstone Funds that are not consolidated and receive pro-rata allocations, its equity method investments, and other principal investments. Income (Loss) on Principal Investments is realized when Blackstone redeems all or a portion of its investment or when Blackstone receives cash income, such as dividends or distributions. Unrealized Income (Loss) on Principal Investments results from changes in the fair value of the underlying investment as well as the reversal of unrealized gain (loss) at the time an investment is realized.
Interest and Dividend Revenue
Other Revenue
Fair Value of Financial Instruments
GAAP establishes a hierarchical disclosure framework which prioritizes and ranks the level of market price observability used in measuring financial instruments at fair value. Market price observability is affected by a number of factors, including the type of financial instrument, the characteristics specific to the financial instrument and the state of the marketplace, including the existence and transparency of transactions between market participants. Financial instruments with readily available quoted prices in active markets generally will have a higher degree of market price observability and a lesser degree of judgment used in measuring fair value.
Financial instruments measured and reported at fair value are classified and disclosed based on the observability of inputs used in the determination of fair values, as follows:
● |
Level I – Quoted prices are available in active markets for identical financial instruments as of the reporting date. The types of financial instruments in Level I include listed equities, listed derivatives and mutual funds with quoted prices. Blackstone does not adjust the quoted price for these investments, even in situations where Blackstone holds a large position and a sale could reasonably impact the quoted price. |
● |
Level II – Pricing inputs are other than quoted prices in active markets, which are either directly or indirectly observable as of the reporting date, and fair value is determined through the use of models or other valuation methodologies. Financial instruments which are generally included in this category include corporate bonds and loans, including corporate bonds and loans held within CLO vehicles, government and agency securities, less liquid and restricted equity securities, and certain over-the-counter derivatives where the fair value is based on observable inputs. Senior and subordinated notes issued by CLO vehicles are classified within Level II of the fair value hierarchy. |
● |
Level III – Pricing inputs are unobservable for the financial instruments and includes situations where there is little, if any, market activity for the financial instrument. The inputs into the determination of fair value require significant management judgment or estimation. Financial instruments that are included in this category generally include general and limited partnership interests in private equity and real estate funds, credit-focused funds, distressed debt and non-investment grade residual interests in securitizations, certain corporate bonds and loans held within CLO vehicles and certain over-the-counter derivatives where the fair value is based on unobservable inputs. |
In certain cases, the inputs used to measure fair value may fall into different levels of the fair value hierarchy. In such cases, the determination of which category within the fair value hierarchy is appropriate for any given financial instrument is based on the lowest level of input that is significant to the fair value measurement. Blackstone’s assessment of the significance of a particular input to the fair value measurement in its entirety requires judgment and considers factors specific to the financial instrument.
18
The Blackstone Group Inc.
Notes to Condensed Consolidated Financial Statements (Unaudited) - Continued
(All Dollars are in Thousands, Except Share and Per Share Data, Except Where Noted)
Level II Valuation Techniques
Financial instruments classified within Level II of the fair value hierarchy comprise debt instruments, including certain corporate loans and bonds held by Blackstone’s consolidated CLO vehicles and debt securities sold, not yet purchased. Certain equity securities and derivative instruments valued using observable inputs are also classified as Level II.
The valuation techniques used to value financial instruments classified within Level II of the fair value hierarchy are as follows:
● |
Debt Instruments and Equity Securities are valued on the basis of prices from an orderly transaction between market participants provided by reputable dealers or pricing services. In determining the value of a particular investment, pricing services may use certain information with respect to transactions in such investments, quotations from dealers, pricing matrices and market transactions in comparable investments and various relationships between investments. The valuation of certain equity securities is based on an observable price for an identical security adjusted for the effect of a restriction. |
● |
Freestanding Derivatives are valued using contractual cash flows and observable inputs comprising yield curves, foreign currency rates and credit spreads. |
● |
Senior and subordinate notes issued by CLO vehicles are classified based on the more observable fair value of CLO assets less (a) the fair value of any beneficial interests held by Blackstone, and (b) the carrying value of any beneficial interests that represent compensation for services. |
Level III Valuation Techniques
In the absence of observable market prices, Blackstone values its investments using valuation methodologies applied on a consistent basis. For some investments little market activity may exist; management’s determination of fair value is then based on the best information available in the circumstances, and may incorporate management’s own assumptions and involves a significant degree of judgment, taking into consideration a combination of internal and external factors, including the appropriate risk adjustments for non-performance and liquidity risks. Investments for which market prices are not observable include private investments in the equity of operating companies, real estate properties, certain funds of hedge funds and credit-focused investments.
Real Estate Investments –
Private Equity Investments –
19
The Blackstone Group Inc.
Notes to Condensed Consolidated Financial Statements (Unaudited) - Continued
(All Dollars are in Thousands, Except Share and Per Share Data, Except Where Noted)
Credit-Focused Investments
The market approach is generally used to determine the enterprise value of the issuer of a credit investment, and considers valuation multiples of comparable companies or transactions. The resulting enterprise value will dictate whether or not such credit investment has adequate enterprise value coverage. In cases of distressed credit instruments, the market approach may be used to estimate a recovery value in the event of a restructuring.
Investments, at Fair Value
The Blackstone Funds are accounted for as investment companies under the American Institute of Certified Public Accountants Accounting and Auditing Guide, , and in accordance with the GAAP guidance on investment companies and reflect their investments, including majority owned and controlled investments (the “Portfolio Companies”), at fair value. Such consolidated funds’ investments are reflected in Investments on the Condensed Consolidated Statements of Financial Condition at fair value, with unrealized gains and losses resulting from changes in fair value reflected as a component of Net Gains from Fund Investment Activities in the Condensed Consolidated Statements of Operations. Fair value is the amount that would be received to sell an asset or paid to transfer a liability, in an orderly transaction between market participants at the measurement date, at current market conditions (i.e., the exit price).
Investment Companies
Blackstone’s principal investments are presented at fair value with unrealized appreciation or depreciation and realized gains and losses recognized in the Condensed Consolidated Statements of Operations within Investment Income (Loss).
For certain instruments, Blackstone has elected the fair value option. Such election is irrevocable and is applied on an investment by investment basis at initial recognition. Blackstone has applied the fair value option for certain loans and receivables, unfunded loan commitments and certain investments in private debt securities that otherwise would not have been carried at fair value with gains and losses recorded in net income. The methodology for measuring the fair value of such investments is consistent with the methodology applied to private equity, real estate, credit-focused and funds of hedge funds investments. Changes in the fair value of such instruments are recognized in Investment Income (Loss) in the Condensed Consolidated Statements of Operations. Interest income on interest bearing loans and receivables and debt securities on which the fair value option has been elected is based on stated coupon rates adjusted for the accretion of purchase discounts and the amortization of purchase premiums. This interest income is recorded within Interest and Dividend Revenue.
Blackstone has elected the fair value option for the assets of consolidated CLO vehicles. As permitted under GAAP, Blackstone measures the liabilities of consolidated CLO vehicles as (a) the sum of the fair value of the consolidated CLO assets and the carrying value of any non-financial assets held temporarily, less (b) the sum of the fair value of any beneficial interests retained by Blackstone (other than those that represent compensation for services) and Blackstone’s carrying value of any beneficial interests that represent compensation for services. As a result of this measurement alternative, there is no attribution of amounts to Non-Controlling Interests for consolidated CLO vehicles. Assets of the consolidated CLOs are presented within Investments within the Condensed Consolidated Statements of Financial Condition and Liabilities within Loans Payable for the amounts due to unaffiliated third parties and Due to Affiliates for the amounts held by non-consolidated affiliates. Changes in the fair value of consolidated CLO assets and liabilities and related interest, dividend and other income are presented within Net Gains from Fund Investment Activities. Expenses of consolidated CLO vehicles are presented in Fund Expenses.
20
The Blackstone Group Inc.
Notes to Condensed Consolidated Financial Statements (Unaudited) - Continued
(All Dollars are in Thousands, Except Share and Per Share Data, Except Where Noted)
Blackstone has elected the fair value option for certain proprietary investments that would otherwise have been accounted for using the equity method of accounting. The fair value of such investments is based on quoted prices in an active market or using the discounted cash flow method. Changes in fair value are recognized in Investment Income (Loss) in the Condensed Consolidated Statements of Operations.
Further disclosure on instruments for which the fair value option has been elected is presented in Note 7. “Fair Value Option.”
The investments of consolidated Blackstone Funds in funds of hedge funds (“Investee Funds”) are valued at net asset value (“NAV”) per share of the Investee Fund. In limited circumstances, Blackstone may determine, based on its own due diligence and investment procedures, that NAV per share does not represent fair value. In such circumstances, Blackstone will estimate the fair value in good faith and in a manner that it reasonably chooses, in accordance with the requirements of GAAP.
Certain investments of Blackstone and of the consolidated Blackstone funds of hedge funds and credit-focused funds measure their investments in underlying funds at fair value using NAV per share without adjustment. The terms of the investee’s investment generally provide for minimum holding periods or lock-ups, the institution of gates on redemptions or the suspension of redemptions or an ability to side-pocket investments, at the discretion of the investee’s fund manager, and as a result, investments may not be redeemable at, or within three months of, the reporting date. A side-pocket is used by hedge funds and funds of hedge funds to separate investments that may lack a readily ascertainable value, are illiquid or are subject to liquidity restriction. Redemptions are generally not permitted until the investments within a side-pocket are liquidated or it is deemed that the conditions existing at the time that required the investment to be included in the side-pocket no longer exist. As the timing of either of these events is uncertain, the timing at which Blackstone may redeem an investment held in a side-pocket cannot be estimated. Further disclosure on instruments for which fair value is measured using NAV per share is presented in Note 5. “Net Asset Value as Fair Value.”
Security and loan transactions are recorded on a trade date basis.
Equity Method Investments
Investments in which Blackstone is deemed to exert significant influence, but not control, are accounted for using the equity method of accounting except in cases where the fair value option has been elected. Blackstone has significant influence over all Blackstone Funds in which it invests but does not consolidate. Therefore, its investments in such Blackstone Funds, which include both a proportionate and disproportionate allocation of the profits and losses (as is the case with carry funds that include a Performance Allocation), are accounted for under the equity method. Under the equity method of accounting, Blackstone’s share of earnings (losses) from equity method investments is included in Investment Income (Loss) in the Condensed Consolidated Statements of Operations.
In cases where Blackstone’s equity method investments provide for a disproportionate allocation of the profits and losses (as is the case with carry funds that include a Performance Allocation), Blackstone’s share of earnings (losses) from equity method investments is determined using a balance sheet approach referred to as the hypothetical liquidation at book value (“HLBV”) method. Under the HLBV method, at the end of each reporting period, Blackstone calculates the Accrued Performance Allocations that would be due to Blackstone for each fund pursuant to the fund agreements as if the fair value of the underlying investments were realized as of such date, irrespective of whether such amounts have been realized. As the fair value of underlying investments varies between reporting periods, it is necessary to make adjustments to amounts recorded as Accrued Performance Allocations to reflect either (a) positive performance resulting in an increase in the Accrued Performance
21
The Blackstone Group Inc.
Notes to Condensed Consolidated Financial Statements (Unaudited) - Continued
(All Dollars are in Thousands, Except Share and Per Share Data, Except Where Noted)
Allocation to the general partner, or (b) negative performance that would cause the amount due to Blackstone to be less than the amount previously recognized as revenue, resulting in a negative adjustment to the Accrued Performance Allocation to the general partner. In each scenario, it is necessary to calculate the Accrued Performance Allocation on cumulative results compared to the Accrued Performance Allocation recorded to date and make the required positive or negative adjustments. Blackstone ceases to record negative Performance Allocations once previously Accrued Performance Allocations for such fund have been fully reversed. Blackstone is not obligated to pay guaranteed returns or hurdles, and therefore, cannot have negative Performance Allocations over the life of a fund. The carrying amounts of equity method investments are reflected in Investments in the Condensed Consolidated Statements of Financial Condition.
Results for Strategic Partners are reported on a three month lag from the fund financial statements, which generally report based on a three month lag from the underlying fund investments unless information is available on a more timely basis. Therefore, results presented herein do not include the impact of economic and market activity in the quarter in which such events occur. Economic and market activity for the periods presented is expected to affect reported results in upcoming periods.
Compensation and Benefits
Compensation and Benefits
Compensation
Compensation and Benefits — Incentive Fee Compensation —
Compensation and Benefits — Performance Allocations Compensation —
Non-Controlling Interests in Consolidated Entities
Non-Controlling Interests in Consolidated Entities represent the component of Equity in consolidated Blackstone Funds held by third party investors and employees. The percentage interests held by third parties and employees is adjusted for general partner allocations and by subscriptions and redemptions in funds of hedge funds and certain credit-focused funds which occur during the reporting period. In addition, all non-controlling interests in consolidated Blackstone Funds are attributed a share of income (loss) arising from the respective funds and a share of other comprehensive income, if applicable. Income (Loss) is allocated to non-controlling interests in consolidated entities based on the relative ownership interests of third party investors and employees after considering any contractual arrangements that govern the allocation of income (loss) such as fees allocable to The Blackstone Group Inc.
22
The Blackstone Group Inc.
Notes to Condensed Consolidated Financial Statements (Unaudited) - Continued
(All Dollars are in Thousands, Except Share and Per Share Data, Except Where Noted)
Redeemable Non-Controlling Interests in Consolidated Entities
Non-controlling interests related to funds of hedge funds are subject to annual, semi-annual or quarterly redemption by investors in these funds following the expiration of a specified period of time, or may be withdrawn subject to a redemption fee during the period when capital may not be withdrawn. As limited partners in these types of funds have been granted redemption rights, amounts relating to third party interests in such consolidated funds are presented as Redeemable Non-Controlling Interests in Consolidated Entities within the Condensed Consolidated Statements of Financial Condition. When redeemable amounts become legally payable to investors, they are classified as a liability and included in Accounts Payable, Accrued Expenses and Other Liabilities in the Condensed Consolidated Statements of Financial Condition. For all consolidated funds in which redemption rights have not been granted, non-controlling interests are presented within Equity in the Condensed Consolidated Statements of Financial Condition as Non-Controlling Interests in Consolidated Entities.
Non-Controlling Interests in Blackstone Holdings
Non-Controlling Interests in Blackstone Holdings represent the component of Equity in the consolidated Blackstone Holdings Partnerships held by Blackstone personnel and others who are limited partners of the Blackstone Holdings Partnerships.
Certain costs and expenses are borne directly by the Holdings Partnerships. Income (Loss), excluding those costs directly borne by and attributable to the Holdings Partnerships, is attributable to Non-Controlling Interests in Blackstone Holdings. This residual attribution is based on the year to date average percentage of Blackstone Holdings Partnership Units and unvested participating Holdings Partnership Units held by Blackstone personnel and others who are limited partners of the Blackstone Holdings Partnerships. Unvested participating Holdings Partnership Units are excluded from the attribution in periods of loss as they are not contractually obligated to share in losses of the Holdings Partnerships.
Net Income (Loss) Per Share of Common Stock
Basic Income (Loss) Per Share of Common Stock is calculated by dividing Net Income (Loss) Attributable to The Blackstone Group Inc. by the weighted-average shares of common stock, unvested participating shares of common stock outstanding for the period and vested deferred restricted shares of common stock that have been earned for which issuance of the related shares of common stock is deferred until future periods. Diluted Income (Loss) Per Share of Common Stock reflects the impact of all dilutive securities. Unvested participating shares of common stock are excluded from the computation in periods of loss as they are not contractually obligated to share in losses.
Blackstone applies the treasury stock method to determine the dilutive weighted-average common shares outstanding for certain equity-based compensation awards. Blackstone applies the “if-converted” method to the Blackstone Holdings Partnership Units to determine the dilutive impact, if any, of the exchange right included in the Blackstone Holdings Partnership Units.
Reverse Repurchase and Repurchase Agreements
Securities purchased under agreements to resell (“reverse repurchase agreements”) and securities sold under agreements to repurchase (“repurchase agreements”), comprised primarily of U.S. and non-U.S. government and agency securities, asset-backed securities and corporate debt, represent collateralized financing transactions. Such transactions are recorded in the Condensed Consolidated Statements of Financial Condition at their contractual amounts and include accrued interest. The carrying value of reverse repurchase and repurchase agreements approximates fair value.
Blackstone manages credit exposure arising from reverse repurchase agreements and repurchase agreements by, in appropriate circumstances, entering into master netting agreements and collateral arrangements with counterparties that provide Blackstone, in the event of a counterparty default, the right to liquidate collateral and the right to offset a counterparty’s rights and obligations.
23
The Blackstone Group Inc.
Notes to Condensed Consolidated Financial Statements (Unaudited) - Continued
(All Dollars are in Thousands, Except Share and Per Share Data, Except Where Noted)
Blackstone takes possession of securities purchased under reverse repurchase agreements and is permitted to repledge, deliver or otherwise use such securities. Blackstone also pledges its financial instruments to counterparties to collateralize repurchase agreements. Financial instruments pledged that can be repledged, delivered or otherwise used by the counterparty are recorded in Investments in the Condensed Consolidated Statements of Financial Condition. Additional disclosures relating to repurchase agreements are discussed in Note 10. “Repurchase Agreements.”
Blackstone does not offset assets and liabilities relating to reverse repurchase agreements and repurchase agreements in its Condensed Consolidated Statements of Financial Condition. Additional disclosures relating to offsetting are discussed in Note 11. “Offsetting of Assets and Liabilities.”
Securities Sold, Not Yet Purchased
Securities Sold, Not Yet Purchased consist of equity and debt securities that Blackstone has borrowed and sold. Blackstone is required to “cover” its short sale in the future by purchasing the security at prevailing market prices and delivering it to the counterparty from which it borrowed the security. Blackstone is exposed to loss in the event that the price at which a security may have to be purchased to cover a short sale exceeds the price at which the borrowed security was sold short.
Securities Sold, Not Yet Purchased are recorded at fair value in the Condensed Consolidated Statements of Financial Condition.
Derivative Instruments
Blackstone recognizes all derivatives as assets or liabilities on its Condensed Consolidated Statements of Financial Condition at fair value. On the date Blackstone enters into a derivative contract, it designates and documents each derivative contract as one of the following: (a) a hedge of a recognized asset or liability (“fair value hedge”), (b) a hedge of a forecasted transaction or of the variability of cash flows to be received or paid related to a recognized asset or liability (“cash flow hedge”), (c) a hedge of a net investment in a foreign operation, or (d) a derivative instrument not designated as a hedging instrument (“freestanding derivative”). Gains or losses on a derivative instrument that is designated as, and is effective as, an economic hedge of a net investment in a foreign operation are reported in the cumulative translation adjustment section of other comprehensive income to the extent it is effective as a hedge. The ineffective portion of a net investment hedge is recognized in current period earnings.
Blackstone formally documents at inception its hedge relationships, including identification of the hedging instruments and the hedged items, its risk management objectives, strategy for undertaking the hedge transaction and Blackstone’s evaluation of effectiveness of its hedged transaction. At least monthly, Blackstone also formally assesses whether the derivative it designated in each hedging relationship is expected to be, and has been, highly effective in offsetting changes in estimated fair values or cash flows of the hedged items using either the regression analysis or the dollar offset method. For net investment hedges, Blackstone uses a method based on changes in spot rates to measure effectiveness. If it is determined that a derivative is not highly effective at hedging the designated exposure, hedge accounting is discontinued. The fair values of hedging derivative instruments are reflected within Other Assets in the Condensed Consolidated Statements of Financial Condition.
For freestanding derivative contracts, Blackstone presents changes in fair value in current period earnings. Changes in the fair value of derivative instruments held by consolidated Blackstone Funds are reflected in Net Gains from Fund Investment Activities or, where derivative instruments are held by Blackstone, within Investment Income (Loss) in the Condensed Consolidated Statements of Operations. The fair value of freestanding derivative assets of the consolidated Blackstone Funds are recorded within Investments, the fair value of freestanding derivative assets that are not part of the consolidated Blackstone Funds are recorded within Other Assets and the fair value of freestanding derivative liabilities are recorded within Accounts Payable, Accrued Expenses and Other Liabilities in the Condensed Consolidated Statements of Financial Condition.
24
The Blackstone Group Inc.
Notes to Condensed Consolidated Financial Statements (Unaudited) - Continued
(All Dollars are in Thousands, Except Share and Per Share Data, Except Where Noted)
Blackstone has elected to not offset derivative assets and liabilities or financial assets in its Condensed Consolidated Statements of Financial Condition, including cash, that may be received or paid as part of collateral arrangements, even when an enforceable master netting agreement is in place that provides Blackstone, in the event of counterparty default, the right to liquidate collateral and the right to offset a counterparty’s rights and obligations.
Blackstone’s other disclosures regarding derivative financial instruments are discussed in Note 6. “Derivative Financial Instruments.”
Blackstone’s disclosures regarding offsetting are discussed in Note 11. “Offsetting of Assets and Liabilities.”
Affiliates
Blackstone considers its Founder, senior managing directors, employees, the Blackstone Funds and the Portfolio Companies to be affiliates.
Dividends
Dividends are reflected in the condensed consolidated financial statements when declared.
3. Intangible Assets
Intangible Assets, Net consists of the following:
March 31, |
December 31, |
|||||||
2021 |
2020 |
|||||||
| Finite-Lived Intangible Assets/Contractual Rights |
$ | 1,745,376 | $ | 1,734,076 | ||||
| Accumulated Amortization |
(1,404,898) | (1,386,121) | ||||||
| |
|
|
|
|||||
| Intangible Assets, Net |
$ | 340,478 | $ | 347,955 | ||||
| |
|
|
|
|||||
Amortization expense associated with Blackstone’s intangible assets was $18.8 million and $17.7 million for the three months ended March 31, 2021 and 2020, respectively.
In December 2020, Blackstone acquired DCI LLC (“DCI”), a San Francisco based systematic credit investment firm. Provisional amounts of Intangible Assets and Goodwill for the acquisition of DCI were reported for the year ended December 31, 2020. During the three months ended March 31, 2021, Blackstone obtained additional information needed to identify and measure the acquired assets. This additional information resulted in a $11.3 million increase in Intangible Assets, related primarily to a $11.1 million increase in the contractual rights to earn future fee income, and a corresponding decrease in Goodwill of $11.3 million.
25
The Blackstone Group Inc.
Notes to Condensed Consolidated Financial Statements (Unaudited) - Continued
(All Dollars are in Thousands, Except Share and Per Share Data, Except Where Noted)
Amortization of Intangible Assets held at March 31, 2021 is expected to be $74.9 million, $67.1 million, $38.1 million, $30.5 million, and $30.5 million for each of the years ending December 31, 2021, 2022, 2023, 2024, and 2025, respectively. Blackstone’s Intangible Assets as of March 31, 2021 are expected to amortize over a weighted-average period of 7.4 years.
4. Investments
Investments consist of the following:
March 31, |
December 31, |
|||||||
2021 |
2020 |
|||||||
Investments of Consolidated Blackstone Funds |
$ | 1,459,804 | $ | 1,455,008 | ||||
Equity Method Investments |
||||||||
Partnership Investments |
4,676,341 | 4,353,234 | ||||||
Accrued Performance Allocations |
9,367,251 | 6,891,262 | ||||||
Corporate Treasury Investments |
1,726,285 | 2,579,716 | ||||||
Other Investments |
713,628 | 337,922 | ||||||
| $ | 17,943,309 | $ | 15,617,142 | |||||
Blackstone’s share of Investments of Consolidated Blackstone Funds totaled $290.5 million and $198.3 million at March 31, 2021 and December 31, 2020, respectively.
Where appropriate, the accounting for Blackstone’s investments incorporates the changes in fair value of those investments as determined under GAAP. The significant inputs and assumptions required to determine the change in fair value of the investments of Consolidated Blackstone Funds, Corporate Treasury Investments and Other Investments are discussed in more detail in Note 8. “Fair Value Measurements of Financial Instruments.”
Investments of Consolidated Blackstone Funds
The following table presents the Realized and Net Change in Unrealized Gains (Losses) on investments held by the consolidated Blackstone Funds and a reconciliation to Other Income (Loss) – Net Gains (Losses) from Fund Investment Activities in the Condensed Consolidated Statements of Operations:
Three Months Ended March 31, |
||||||||
2021 |
2020 |
|||||||
Realized Gains (Losses) |
$ | 28,994 | $ | (73,274) | ||||
Net Change in Unrealized Gains (Losses) |
84,467 | (333,342) | ||||||
Realized and Net Change in Unrealized Gains (Losses) from Consolidated Blackstone Funds |
113,461 | (406,616) | ||||||
Interest and Dividend Revenue Attributable to Consolidated Blackstone Funds |
6,892 | 79,242 | ||||||
Other Income (Loss) – Net Gains (Losses) from Fund Investment Activities |
$ | 120,353 | $ | (327,374) | ||||
26
The Blackstone Group Inc.
Notes to Condensed Consolidated Financial Statements (Unaudited) - Continued
(All Dollars are in Thousands, Except Share and Per Share Data, Except Where Noted)
Equity Method Investments
Blackstone’s equity method investments include Partnership Investments, which represent the pro-rata investments, and any associated Accrued Performance Allocations in private equity funds, real estate funds, funds of hedge funds and credit-focused funds. Prior to January 26, 2021, Partnership Investments also included the 40% non-controlling interest in Pátria Investments Limited and Pátria Investimentos Ltda. (collectively, “Pátria”).
On January 26, 2021, Pátria completed its initial public offering (“IPO”), pursuant to which Blackstone sold a portion of its interests and no longer has representatives or the right to designate representatives on Pátria’s board of directors. As a result of Pátria’s pre-IPO reorganization transactions (which included Blackstone’s sale of 10% of Pátria’s pre-IPO shares to Pátria’s controlling shareholder) and the consummation of the IPO, Blackstone is deemed to no longer have significant influence over Pátria due to Blackstone’s decreased ownership and lack of board representation. Following the IPO, Blackstone will account for its retained interest in Pátria at fair value in accordance with the GAAP guidance for investments in equity securities with a readily determinable fair value.
Blackstone evaluates each of its equity method investments, excluding Accrued Performance Allocations, to determine if any were significant as defined by guidance from the United States Securities and Exchange Commission (“SEC”). As of and for the three months ended March 31, 2021 and 2020, no individual equity method investment held by Blackstone met the significance criteria. As such, Blackstone is not required to present separate financial statements for any of its equity method investments.
Partnership Investments
Blackstone recognized net gains (losses) related to its Partnership Investments accounted for under the equity method of $694.4 million and $(566.5) million for the three months ended March 31, 2021 and 2020, respectively.
Accrued Performance Allocations
Accrued Performance Allocations to Blackstone were as follows:
Real |
Private |
Hedge Fund |
Credit & |
|||||||||||||||||
Estate |
Equity |
Solutions |
Insurance |
Total | ||||||||||||||||
Accrued Performance Allocations, December 31, 2020 |
$ |
3,033,462 |
$ |
3,487,206 |
$ |
42,293 |
$ |
328,301 |
$ |
6,891,262 |
||||||||||
Performance Allocations as a Result of Changes in Fund Fair Values |
757,150 |
1,849,012 |
283,485 |
105,673 |
2,995,320 |
|||||||||||||||
Foreign Exchange Loss |
(34,771 |
) |
— |
— |
— |
(34,771 |
) | |||||||||||||
Fund Distributions |
(266,397 |
) |
(180,887 |
) |
(13,279 |
) |
(23,997 |
) |
(484,560 |
) | ||||||||||
Accrued Performance Allocations, March 31, 2021 |
$ |
3,489,444 |
$ |
5,155,331 |
$ |
312,499 |
$ |
409,977 |
$ |
9,367,251 |
||||||||||
Corporate Treasury Investments
The portion of corporate treasury investments included in Investments represents Blackstone’s investments into primarily fixed income securities, mutual fund interests, and other fund interests. These strategies are managed by a combination of Blackstone personnel and third party advisors. The following table presents the Realized and Net Change in Unrealized Gains (Losses) on these investments:
27
The Blackstone Group Inc.
Notes to Condensed Consolidated Financial Statements (Unaudited) - Continued
(All Dollars are in Thousands, Except Share and Per Share Data, Except Where Noted)
Three Months Ended March 31, |
||||||||
2021 |
2020 |
|||||||
| Realized Gains |
$ | 6,934 | $ | 2,517 | ||||
| Net Change in Unrealized Gains (Losses) |
9,929 | (258,387) | ||||||
| |
|
|
|
|||||
| $ | 16,863 | $ | (255,870) | |||||
| |
|
|
|
|||||
Other Investments
Other Investments consist primarily of proprietary investment securities held by Blackstone, including subordinated notes in non-consolidated CLO vehicles and the retained interest in Pátria following Pátria’s IPO. Other Investments include equity investments without readily determinable fair values which have a carrying value of $107.1 million as of March 31, 2021. The following table presents Blackstone’s Realized and Net Change in Unrealized Gains (Losses) in Other Investments:
Three Months Ended March 31, |
||||||||
2021 |
2020 |
|||||||
| Realized Gains |
$ | 113 | $ | 6,985 | ||||
| Net Change in Unrealized Gains (Losses) |
284,502 | (99,937) | ||||||
| |
|
|
|
|||||
| $ | 284,615 | $ | (92,952) | |||||
| |
|
|
|
|||||
5. Net Asset Value as Fair Value
A summary of fair value by strategy type and ability to redeem such investments as of March 31, 2021 is presented below:
Redemption |
||||||||||||
Frequency |
Redemption | |||||||||||
| Strategy (a) |
Fair Value |
(if currently eligible) |
Notice Period | |||||||||
| Diversified Instruments |
$ |
4,502 |
(b) | (b) | ||||||||
| Credit Driven |
74,841 |
(c) | (c) | |||||||||
| Equity |
671 |
(d) | (d) | |||||||||
| Commodities |
912 |
(e) | (e) | |||||||||
| |
|
|
||||||||||
$ |
80,926 |
|||||||||||
| |
|
|
||||||||||
| (a) | As of March 31, 2021, Blackstone had no unfunded commitments. |
| (b) | Diversified Instruments include investments in funds that invest across multiple strategies. Investments representing 100% of the fair value of the investments in this category may not be redeemed at, or within three months of, the reporting date. |
| (c) | The Credit Driven category includes investments in hedge funds that invest primarily in domestic and international bonds. Investments representing 19% of the fair value of the investments in this category are in liquidation. The remaining 81% of investments in this category are redeemable as of the reporting date. |
| (d) | The Equity category includes investments in hedge funds that invest primarily in domestic and international equity securities. Investments representing 100% of the fair value of the investments in this category are in liquidation. As of the reporting date, the investee fund manager had elected to side-pocket 62% of Blackstone’s investments in the category. |
| (e) | The Commodities category includes investments in commodities-focused funds that primarily invest in futures and physical-based commodity driven strategies. Investments representing 100% of the fair value of the investments in this category may not be redeemed at, or within three months of, the reporting date. |
28
The Blackstone Group Inc.
Notes to Condensed Consolidated Financial Statements (Unaudited) - Continued
(All Dollars are in Thousands, Except Share and Per Share Data, Except Where Noted)
6. Derivative Financial Instruments
Blackstone and the consolidated Blackstone Funds enter into derivative contracts in the normal course of business to achieve certain risk management objectives and for general investment purposes. Blackstone may enter into derivative contracts in order to hedge its interest rate risk exposure against the effects of interest rate changes. Additionally, Blackstone may also enter into derivative contracts in order to hedge its foreign currency risk exposure against the effects of a portion of its non-U.S. dollar denominated currency net investments. As a result of the use of derivative contracts, Blackstone and the consolidated Blackstone Funds are exposed to the risk that counterparties will fail to fulfill their contractual obligations. To mitigate such counterparty risk, Blackstone and the consolidated Blackstone Funds enter into contracts with certain major financial institutions, all of which have investment grade ratings. Counterparty credit risk is evaluated in determining the fair value of derivative instruments.
Freestanding Derivatives
Freestanding derivatives are instruments that Blackstone and certain of the consolidated Blackstone Funds have entered into as part of their overall risk management and investment strategies. These derivative contracts are not designated as hedging instruments for accounting purposes. Such contracts may include interest rate swaps, foreign exchange contracts, equity swaps, options, futures and other derivative contracts.
The table below summarizes the aggregate notional amount and fair value of the derivative financial instruments. The notional amount represents the absolute value amount of all outstanding derivative contracts.
March 31, 2021 |
December 31, 2020 | |||||||||||||||||||||||||||||||
Assets |
Liabilities |
Assets |
Liabilities | |||||||||||||||||||||||||||||
Fair |
Fair |
Fair |
Fair | |||||||||||||||||||||||||||||
Notional |
Value |
Notional |
Value |
Notional |
Value |
Notional |
Value | |||||||||||||||||||||||||
| Freestanding Derivatives |
||||||||||||||||||||||||||||||||
| Blackstone |
||||||||||||||||||||||||||||||||
| Interest Rate Contracts |
$ |
1,075,051 |
$ |
66,877 |
$ |
459,072 |
$ |
138,740 |
$ |
684,320 |
$ |
113,072 |
$ |
862,887 |
$ |
190,342 |
||||||||||||||||
| Foreign Currency Contracts |
47,795 |
681 |
246,219 |
1,246 |
316,787 |
7,392 |
334,015 |
3,941 |
||||||||||||||||||||||||
| Credit Default Swaps |
2,706 |
315 |
10,186 |
1,345 |
2,706 |
331 |
9,158 |
1,350 |
||||||||||||||||||||||||
| Other |
— |
— |
— |
— |
5,000 |
5,227 |
— |
— |
||||||||||||||||||||||||
| |
|
|
|
|
|
|
|
|
|
|
|
|
|
|
|
|
|
|
|
|
|
|
| |||||||||
1,125,552 |
67,873 |
715,477 |
141,331 |
1,008,813 |
126,022 |
1,206,060 |
195,633 |
|||||||||||||||||||||||||
| |
|
|
|
|
|
|
|
|
|
|
|
|
|
|
|
|
|
|
|
|
|
|
| |||||||||
| Investments of Consolidated Blackstone Funds |
||||||||||||||||||||||||||||||||
| Foreign Currency Contracts |
57,192 |
2,057 |
14,294 |
821 |
— |
— |
66,431 |
2,651 |
||||||||||||||||||||||||
| Interest Rate Contracts |
— |
— |
14,000 |
1,073 |
— |
— |
14,000 |
1,485 |
||||||||||||||||||||||||
| Credit Default Swaps |
3,507 |
407 |
23,707 |
1,115 |
8,282 |
542 |
41,290 |
1,558 |
||||||||||||||||||||||||
| Total Return Swaps |
— |
— |
— |
— |
— |
— |
19,275 |
2,125 |
||||||||||||||||||||||||
| |
|
|
|
|
|
|
|
|
|
|
|
|
|
|
|
|
|
|
|
|
|
|
| |||||||||
60,699 |
2,464 |
52,001 |
3,009 |
8,282 |
542 |
140,996 |
7,819 |
|||||||||||||||||||||||||
| |
|
|
|
|
|
|
|
|
|
|
|
|
|
|
|
|
|
|
|
|
|
|
| |||||||||
$ |
1,186,251 |
$ |
70,337 |
$ |
767,478 |
$ |
144,340 |
$ |
1,017,095 |
$ |
126,564 |
$ |
1,347,056 |
$ |
203,452 |
|||||||||||||||||
| |
|
|
|
|
|
|
|
|
|
|
|
|
|
|
|
|
|
|
|
|
|
|
| |||||||||
29
The Blackstone Group Inc.
Notes to Condensed Consolidated Financial Statements (Unaudited) - Continued
(All Dollars are in Thousands, Except Share and Per Share Data, Except Where Noted)
The table below summarizes the impact to the Condensed Consolidated Statements of Operations from derivative financial instruments:
Three Months Ended March 31, |
||||||||
2021 |
2020 |
|||||||
| Freestanding Derivatives |
| |||||||
| Realized Gains (Losses) |
||||||||
| Interest Rate Contracts |
$ | 1,646 | $ | (5,301 | ) | |||
| Foreign Currency Contracts |
1,536 | (13,707 | ) | |||||
| Credit Default Swaps |
(982 | ) | (99 | ) | ||||
| Total Return Swaps |
(1,350 | ) | (749 | ) | ||||
| Other |
(40 | ) | (38 | ) | ||||
| |
|
|
|
|||||
| 810 | (19,894 | ) | ||||||
| |
|
|
|
|||||
| Net Change in Unrealized Gains (Losses) |
||||||||
| Interest Rate Contracts |
5,701 | 108,298 | ||||||
| Foreign Currency Contracts |
(128 | ) | 11,845 | |||||
| Credit Default Swaps |
842 | (1,389 | ) | |||||
| Total Return Swaps |
2,130 | (4,976 | ) | |||||
| Other |
(20 | ) | 36 | |||||
| |
|
|
|
|||||
| 8,525 | 113,814 | |||||||
| |
|
|
|
|||||
| $ | 9,335 | $ | 93,920 | |||||
| |
|
|
|
|||||
As of March 31, 2021 and December 31, 2020, Blackstone had not designated any derivatives as cash flow hedges.
7. Fair Value Option
The following table summarizes the financial instruments for which the fair value option has been elected:
March 31, |
December 31, |
|||||||
2021 |
2020 |
|||||||
| Assets |
||||||||
| Loans and Receivables |
$ | 604,611 | $ | 581,079 | ||||
| Equity and Preferred Securities |
565,840 | 532,790 | ||||||
| Debt Securities |
316,303 | 448,352 | ||||||
| |
|
|
|
|||||
| $ | 1,486,754 | $ | 1,562,221 | |||||
| |
|
|
|
|||||
| Liabilities |
||||||||
| Corporate Treasury Commitments |
$ | 453 | $ | 244 | ||||
| |
|
|
|
|||||
30
The Blackstone Group Inc.
Notes to Condensed Consolidated Financial Statements (Unaudited) - Continued
(All Dollars are in Thousands, Except Share and Per Share Data, Except Where Noted)
The following table presents the Realized and Net Change in Unrealized Gains (Losses) on financial instruments on which the fair value option was elected:
Three Months Ended March 31, | ||||||||||||||||
2021 |
2020 | |||||||||||||||
Net Change |
Net Change | |||||||||||||||
Realized |
in Unrealized |
Realized |
in Unrealized | |||||||||||||
Gains (Losses) |
Gains (Losses) |
Gains (Losses) |
Gains (Losses) | |||||||||||||
| Assets |
||||||||||||||||
| Loans and Receivables |
$ |
(4,831 |
) |
$ |
(1,929 |
) |
$ |
(3,521 |
) |
$ |
(13,369 |
) | ||||
| Equity and Preferred Securities |
— |
30,871 |
— |
(84,241 |
) | |||||||||||
| Debt Securities |
8,667 |
(6,158 |
) |
(11,616 |
) |
(70,117 |
) | |||||||||
| Assets of Consolidated CLO Vehicles (a) |
||||||||||||||||
| Corporate Loan s |
— |
— |
(43,901 |
) |
(764,909 |
) | ||||||||||
| Other |
— |
— |
— |
(325 |
) | |||||||||||
| |
|
|
|
|
|
|
|
|
|
|
| |||||
$ |
3,836 |
$ |
22,784 |
$ |
(59,038) |
$ |
(932,961) |
|||||||||
| |
|
|
|
|
|
|
|
|
|
|
| |||||
| Liabilities |
||||||||||||||||
| Liabilities of Consolidated CLO Vehicles (a) |
||||||||||||||||
| Senior Secured Notes |
$ |
— |
$ |
— |
$ |
— |
$ |
694,504 |
||||||||
| Subordinated Notes |
— |
— |
— |
(43,458 |
) | |||||||||||
| Corporate Treasury Commitments |
— |
(200 |
) |
— |
— |
|||||||||||
| |
|
|
|
|
|
|
|
|
|
|
| |||||
$ |
— |
$ |
(200 |
) |
$ |
— |
$ |
651,046 |
||||||||
| |
|
|
|
|
|
|
|
|
|
|
| |||||
| (a) | During the year ended December 31, 2020, Blackstone deconsolidated nine CLO vehicles. See Note 9. “Variable Interest Entities” for additional details. |
The following table presents information for those financial instruments for which the fair value option was elected:
March 31, 2021 |
December 31, 2020 | |||||||||||||||||||||||
For Financial Assets |
For Financial Assets | |||||||||||||||||||||||
Past Due |
Past Due | |||||||||||||||||||||||
(Deficiency) |
Excess |
(Deficiency) |
Excess | |||||||||||||||||||||
of Fair Value |
Fair |
of Fair Value |
of Fair Value |
Fair |
of Fair Value | |||||||||||||||||||
Over Principal |
Value |
Over Principal |
Over Principal |
Value |
Over Principal | |||||||||||||||||||
| Loans and Receivables |
$ |
(9,382 |
) |
$ |
— |
$ |
— |
$ |
(7,807 |
) |
$ |
— |
$ |
— |
||||||||||
| Debt Securities |
(33,237 |
) |
— |
— |
(29,359 |
) |
— |
— |
||||||||||||||||
| |
|
|
|
|
|
|
|
|
|
|
|
|
|
|
|
|
| |||||||
$ |
(42,619 |
) |
$ |
— |
$ |
— |
$ |
(37,166 |
) |
$ |
— |
$ |
— |
|||||||||||
| |
|
|
|
|
|
|
|
|
|
|
|
|
|
|
|
|
| |||||||
As of March 31, 2021 and December 31, 2020, no Loans and Receivables for which the fair value option was elected were past due or in non-accrual status.
31
The Blackstone Group Inc.
Notes to Condensed Consolidated Financial Statements (Unaudited) - Continued
(All Dollars are in Thousands, Except Share and Per Share Data, Except Where Noted)
8. Fair Value Measurements of Financial Instruments
The following tables summarize the valuation of Blackstone’s financial assets and liabilities by the fair value hierarchy:
March 31, 2021 | ||||||||||||||||||||
Level I |
Level II |
Level III |
NAV |
Total | ||||||||||||||||
| Assets |
||||||||||||||||||||
| Cash and Cash Equivalents |
$ |
887,332 |
$ |
6,800 |
$ |
— |
$ |
— |
$ |
894,132 |
||||||||||
| |
|
|
|
|
|
|
|
|
|
|
|
|
|
| ||||||
| Investments |
||||||||||||||||||||
| Investments of Consolidated Blackstone Funds |
||||||||||||||||||||
| Investment Funds |
— |
— |
— |
14,877 |
14,877 |
|||||||||||||||
| Equity Securities, Partnerships and LLC Interests |
47,637 |
129,035 |
827,489 |
— |
1,004,161 |
|||||||||||||||
| Debt Instruments |
1,015 |
379,548 |
57,739 |
— |
438,302 |
|||||||||||||||
| Freestanding Derivatives |
— |
2,464 |
— |
— |
2,464 |
|||||||||||||||
| |
|
|
|
|
|
|
|
|
|
|
|
|
|
| ||||||
| Total Investments of Consolidated Blackstone Funds |
48,652 |
511,047 |
885,228 |
14,877 |
1,459,804 |
|||||||||||||||
| Corporate Treasury Investments |
536,296 |
1,126,529 |
2,825 |
60,635 |
1,726,285 |
|||||||||||||||
| Other Investments |
555,523 |
— |
45,602 |
5,414 |
606,539 |
|||||||||||||||
| |
|
|
|
|
|
|
|
|
|
|
|
|
|
| ||||||
| Total Investments |
1,140,471 |
1,637,576 |
933,655 |
80,926 |
3,792,628 |
|||||||||||||||
| |
|
|
|
|
|
|
|
|
|
|
|
|
|
| ||||||
| Accounts Receivable - Loans and Receivables |
— |
— |
604,611 |
— |
604,611 |
|||||||||||||||
| |
|
|
|
|
|
|
|
|
|
|
|
|
|
| ||||||
| Other Assets - Freestanding Derivatives |
2,252 |
65,621 |
— |
— |
67,873 |
|||||||||||||||
| |
|
|
|
|
|
|
|
|
|
|
|
|
|
| ||||||
$ |
2,030,055 |
$ |
1,709,997 |
$ |
1,538,266 |
$ |
80,926 |
$ |
5,359,244 |
|||||||||||
| |
|
|
|
|
|
|
|
|
|
|
|
|
|
| ||||||
| Liabilities |
||||||||||||||||||||
| Securities Sold, Not Yet Purchased |
$ |
9,224 |
$ |
23,936 |
$ |
— |
$ |
— |
$ |
33,160 |
||||||||||
| |
|
|
|
|
|
|
|
|
|
|
|
|
|
| ||||||
| Accounts Payable, Accrued Expenses and Other Liabilities |
||||||||||||||||||||
| Consolidated Blackstone Funds - Freestanding Derivatives |
— |
3,009 |
— |
— |
3,009 |
|||||||||||||||
| Freestanding Derivatives |
148 |
141,183 |
— |
— |
141,331 |
|||||||||||||||
| Corporate Treasury Commitments (a) |
— |
— |
453 |
— |
453 |
|||||||||||||||
| |
|
|
|
|
|
|
|
|
|
|
|
|
|
| ||||||
| Total Accounts Payable, Accrued Expenses and Other Liabilities |
148 |
144,192 |
453 |
— |
144,793 |
|||||||||||||||
| |
|
|
|
|
|
|
|
|
|
|
|
|
|
| ||||||
$ |
9,372 |
$ |
168,128 |
$ |
453 |
$ |
— |
$ |
177,953 |
|||||||||||
| |
|
|
|
|
|
|
|
|
|
|
|
|
|
| ||||||
32
The Blackstone Group Inc.
Notes to Condensed Consolidated Financial Statements (Unaudited) - Continued
(All Dollars are in Thousands, Except Share and Per Share Data, Except Where Noted)
December 31, 2020 | ||||||||||||||||||||
Level I |
Level II |
Level III |
NAV |
Total | ||||||||||||||||
| Assets |
||||||||||||||||||||
| Cash and Cash Equivalents |
$ |
597,130 |
$ |
15,606 |
$ |
— |
$ |
— |
$ |
612,736 |
||||||||||
| |
|
|
|
|
|
|
|
|
|
|
|
|
|
| ||||||
| Investments |
||||||||||||||||||||
| Investments of Consolidated Blackstone Funds |
||||||||||||||||||||
| Investment Funds |
— |
— |
— |
15,711 |
15,711 |
|||||||||||||||
| Equity Securities, Partnerships and LLC Interests |
39,694 |
48,471 |
792,958 |
— |
881,123 |
|||||||||||||||
| Debt Instruments |
— |
492,280 |
65,352 |
— |
557,632 |
|||||||||||||||
| Freestanding Derivatives |
— |
542 |
— |
— |
542 |
|||||||||||||||
| |
|
|
|
|
|
|
|
|
|
|
|
|
|
| ||||||
| Total Investments of Consolidated Blackstone Funds |
39,694 |
541,293 |
858,310 |
15,711 |
1,455,008 |
|||||||||||||||
| Corporate Treasury Investments |
996,516 |
1,517,809 |
7,899 |
57,492 |
2,579,716 |
|||||||||||||||
| Other Investments |
187,089 |
— |
61,053 |
4,762 |
252,904 |
|||||||||||||||
| |
|
|
|
|
|
|
|
|
|
|
|
|
|
| ||||||
| Total Investments |
1,223,299 |
2,059,102 |
927,262 |
77,965 |
4,287,628 |
|||||||||||||||
| |
|
|
|
|
|
|
|
|
|
|
|
|
|
| ||||||
| Accounts Receivable - Loans and Receivables |
— |
— |
581,079 |
— |
581,079 |
|||||||||||||||
| |
|
|
|
|
|
|
|
|
|
|
|
|
|
| ||||||
| Other Assets - Freestanding Derivatives |
162 |
125,860 |
— |
— |
126,022 |
|||||||||||||||
| |
|
|
|
|
|
|
|
|
|
|
|
|
|
| ||||||
$ |
1,820,591 |
$ |
2,200,568 |
$ |
1,508,341 |
$ |
77,965 |
$ |
5,607,465 |
|||||||||||
| |
|
|
|
|
|
|
|
|
|
|
|
|
|
| ||||||
| Liabilities |
||||||||||||||||||||
| Securities Sold, Not Yet Purchased |
$ |
9,324 |
$ |
41,709 |
$ |
— |
$ |
— |
$ |
51,033 |
||||||||||
| |
|
|
|
|
|
|
|
|
|
|
|
|
|
| ||||||
| Accounts Payable, Accrued Expenses and Other Liabilities |
||||||||||||||||||||
| Consolidated Blackstone Funds - Freestanding Derivatives |
— |
7,819 |
— |
— |
7,819 |
|||||||||||||||
| Freestanding Derivatives |
373 |
195,260 |
— |
— |
195,633 |
|||||||||||||||
| Corporate Treasury Commitments (a) |
— |
— |
244 |
— |
244 |
|||||||||||||||
| |
|
|
|
|
|
|
|
|
|
|
|
|
|
| ||||||
| Total Accounts Payable, Accrued Expenses and Other Liabilities |
373 |
203,079 |
244 |
— |
203,696 |
|||||||||||||||
| |
|
|
|
|
|
|
|
|
|
|
|
|
|
| ||||||
$ |
9,697 |
$ |
244,788 |
$ |
244 |
$ |
— |
$ |
254,729 |
|||||||||||
| |
|
|
|
|
|
|
|
|
|
|
|
|
|
| ||||||
LLC Limited Liability Company.
| (a) | Corporate Treasury Commitments are measured using third party pricing. |
33
The Blackstone Group Inc.
Notes to Condensed Consolidated Financial Statements (Unaudited) - Continued
(All Dollars are in Thousands, Except Share and Per Share Data, Except Where Noted)
The following table summarizes the quantitative inputs and assumptions used for items categorized in Level III of the fair value hierarchy as of March 31, 2021:
Fair Value |
Valuation Techniques |
Unobservable Inputs |
Ranges |
Weighted- Average (a) |
Impact to Valuation from an Increase in Input | |||||||||||||||||||
| Financial Assets |
||||||||||||||||||||||||
| Investments of Consolidated Blackstone Funds |
||||||||||||||||||||||||
| Equity Securities, Partnership and LLC Interests |
$ |
827,489 |
Discounted Cash Flows |
Discount Rate |
3.8% - 42.1% |
10.8% |
Lower |
|||||||||||||||||
Exit Multiple - EBITDA |
3.7x - 27.0x |
13.0x |
Higher |
|||||||||||||||||||||
Exit Capitalization Rate |
2.7% - 15.1% |
5.3% |
Lower |
|||||||||||||||||||||
Transaction Price |
N/A |
|||||||||||||||||||||||
| Debt Instruments |
57,739 |
Discounted Cash Flows |
Discount Rate |
6.7% - 19.3% |
10.1% |
Lower |
||||||||||||||||||
Third Party Pricing |
N/A |
|||||||||||||||||||||||
| |
|
|
||||||||||||||||||||||
| Total Investments of Consolidated Blackstone Funds |
885,228 |
|||||||||||||||||||||||
| Corporate Treasury Investments |
2,825 |
Discounted Cash Flows |
Discount Rate |
0.9% - 6.8% |
4.7% |
Lower |
||||||||||||||||||
| Loans and Receivables |
604,611 |
Discounted Cash Flows |
Discount Rate |
6.5% - 10.3% |
7.7% |
Lower |
||||||||||||||||||
| Other Investment s |
45,602 |
Third Party Pricing |
N/A |
|||||||||||||||||||||
Transaction Price |
N/A |
|||||||||||||||||||||||
| |
|
|
||||||||||||||||||||||
$ |
1,538,266 |
|||||||||||||||||||||||
| |
|
|
||||||||||||||||||||||
34
The Blackstone Group Inc.
Notes to Condensed Consolidated Financial Statements (Unaudited) - Continued
(All Dollars are in Thousands, Except Share and Per Share Data, Except Where Noted)
The following table summarizes the quantitative inputs and assumptions used for items categorized in Level III of the fair value hierarchy as of December 31, 2020:
Fair Value |
Valuation Techniques |
Unobservable Inputs |
Ranges |
Weighted- Average (a) |
Impact to Valuation from an Increase in Input | |||||||||||||||||||
| Financial Assets |
||||||||||||||||||||||||
| Investments of Consolidated Blackstone Funds |
||||||||||||||||||||||||
| Equity Securities, Partnership and LLC Interests |
$ |
792,958 |
Discounted Cash Flows |
Discount Rate |
3.8% - 42.1% |
10.8% |
Lower |
|||||||||||||||||
Exit Multiple - EBITDA |
1.7x - 24.0x |
13.2x |
Higher |
|||||||||||||||||||||
Exit Capitalization Rate |
2.7% - 14.9% |
5.4% |
Lower |
|||||||||||||||||||||
Transaction Price |
N/A |
|||||||||||||||||||||||
Other |
N/A |
|||||||||||||||||||||||
| Debt Instruments |
65,352 |
Discounted Cash Flows |
Discount Rate |
6.3% - 19.3% |
8.6% |
Lower |
||||||||||||||||||
Third Party Pricing |
N/A |
|||||||||||||||||||||||
| |
|
|
||||||||||||||||||||||
| Total Investments of Consolidated Blackstone Funds |
858,310 |
|||||||||||||||||||||||
| Corporate Treasury Investments |
7,899 |
Discounted Cash Flows |
Discount Rate |
3.3% - 7.4% |
6.4% |
Lower |
||||||||||||||||||
Third Party Pricing |
N/A |
|||||||||||||||||||||||
| Loans and Receivables |
581,079 |
Discounted Cash Flows |
Discount Rate |
6.7% - 10.3% |
7.8% |
Lower |
||||||||||||||||||
| Other Investment s |
61,053 |
Third Party Pricing |
N/A |
|||||||||||||||||||||
Transaction Price |
N/A |
|||||||||||||||||||||||
Other |
N/A |
|||||||||||||||||||||||
| |
|
|
||||||||||||||||||||||
$ |
1,508,341 |
|||||||||||||||||||||||
| |
|
|
||||||||||||||||||||||
| N/A | Not applicable. | |
| EBITDA | Earnings before interest, taxes, depreciation and amortization. | |
| Exit Multiple | Ranges include the last twelve months EBITDA and forward EBITDA multiples. | |
| Third Party Pricing | Third Party Pricing is generally determined on the basis of unadjusted prices between market participants provided by reputable dealers or pricing services. | |
| Transaction Price | Includes recent acquisitions or transactions. | |
| (a) | Unobservable inputs were weighted based on the fair value of the investments included in the range. |
Since December 31, 2020, there have been no changes in valuation techniques within Level II and Level III that have had a material impact on the valuation of financial instruments.
The following tables summarize the changes in financial assets and liabilities measured at fair value for which Blackstone has used Level III inputs to determine fair value and does not include gains or losses that were reported in Level III in prior years or for instruments that were transferred out of Level III prior to the end of the respective reporting period. These tables also exclude financial assets and liabilities measured at fair value on a non-recurring basis. Total realized and unrealized gains and losses recorded for Level III investments are reported in either Investment Income (Loss) or Net Gains from Fund Investment Activities in the Condensed Consolidated Statements of Operations.
35
The Blackstone Group Inc.
Notes to Condensed Consolidated Financial Statements (Unaudited) - Continued
(All Dollars are in Thousands, Except Share and Per Share Data, Except Where Noted)
Level III Financial Assets at Fair Value | ||||||||||||||||||||||||||||||||
Three Months Ended March 31, | ||||||||||||||||||||||||||||||||
2021 |
2020 | |||||||||||||||||||||||||||||||
Investments |
Investments |
|||||||||||||||||||||||||||||||
of |
Loans |
Other |
of |
Loans |
Other |
|||||||||||||||||||||||||||
Consolidated |
and |
Investments |
Consolidated |
and |
Investments |
|||||||||||||||||||||||||||
Funds |
Receivables |
(a) |
Total |
Funds |
Receivables |
(a) |
Total | |||||||||||||||||||||||||
Balance, Beginning of Period |
$ |
858,310 |
$ |
581,079 |
$ |
46,158 |
$ |
1,485,547 |
$ |
1,050,272 |
$ |
500,751 |
$ |
29,289 |
$ |
1,580,312 |
||||||||||||||||
Transfer Into Level III (b) |
880 |
— |
— |
880 |
188,123 |
— |
26,719 |
214,842 |
||||||||||||||||||||||||
Transfer Out of Level III (b) |
(77,451 |
) |
— |
— |
(77,451 |
) |
(152,339 |
) |
— |
(12,144 |
) |
(164,483 |
) | |||||||||||||||||||
Purchases |
87,327 |
323,329 |
— |
410,656 |
96,651 |
163,739 |
1,212 |
261,602 |
||||||||||||||||||||||||
Sales |
(47,989 |
) |
(292,724 |
) |
(5,149 |
) |
(345,862 |
) |
(67,228 |
) |
(431,192 |
) |
(5,039 |
) |
(503,459 |
) | ||||||||||||||||
Issuances |
— |
6,746 |
— |
6,746 |
— |
— |
— |
— |
||||||||||||||||||||||||
Settlements |
— |
(17,400 |
) |
— |
(17,400 |
) |
— |
(2,013 |
) |
— |
(2,013 |
) | ||||||||||||||||||||
Changes in Gains (Losses) Included in Earnings |
64,151 |
3,581 |
151 |
67,883 |
(101,381 |
) |
(13,170 |
) |
7,872 |
(106,679 |
) | |||||||||||||||||||||
Balance, End of Period |
$ |
885,228 |
$ |
604,611 |
$ |
41,160 |
$ |
1,530,999 |
$ |
1,014,098 |
$ |
218,115 |
$ |
47,909 |
$ |
1,280,122 |
||||||||||||||||
Changes in Unrealized Gains (Losses) Included in Earnings Related to Financial Assets Still Held at the Reporting Date |
$ |
56,729 |
$ |
(3,856 |
) |
$ |
61 |
$ |
52,934 |
$ |
(87,972 |
) |
$ |
(19,902 |
) |
$ |
7,900 |
$ |
(99,974 |
) | ||||||||||||
| (a) | Represents corporate treasury investments and Other Investments. |
| (b) | Transfers in and out of Level III financial assets and liabilities were due to changes in the observability of inputs used in the valuation of such assets and liabilities. |
9. Variable Interest Entities
Pursuant to GAAP consolidation guidance, Blackstone consolidates certain VIEs for which it is the primary beneficiary either directly or indirectly, through a consolidated entity or affiliate. VIEs include certain private equity, real estate, credit-focused or funds of hedge funds entities and CLO vehicles. The purpose of such VIEs is to provide strategy specific investment opportunities for investors in exchange for management and performance-based fees. The investment strategies of the Blackstone Funds differ by product; however, the fundamental risks of the Blackstone Funds are similar, including loss of invested capital and loss of management fees and performance-based fees. In Blackstone’s role as general partner, collateral manager or investment adviser, it generally considers itself the sponsor of the applicable Blackstone Fund. Blackstone does not provide performance guarantees and has no other financial obligation to provide funding to consolidated VIEs other than its own capital commitments.
The assets of consolidated variable interest entities may only be used to settle obligations of these entities. In addition, there is no recourse to Blackstone for the consolidated VIEs’ liabilities.
During the year ended December 31, 2020, Blackstone determined that it was no longer the primary beneficiary and deconsolidated nine CLO vehicles as a result of an ownership reorganization and the ongoing decline in Blackstone’s economic exposure to these vehicles. Following the ownership reorganization, there are no remaining consolidated CLO vehicles. As of the date of deconsolidation, Blackstone’s Total Assets, Total Liabilities and Non-Controlling Interests in Consolidated Entities were reduced by $6.8 billion, $6.6 billion and $216.3 million, respectively. Blackstone will continue to receive management fees and Performance Allocations from these vehicles following the dilution of its ownership interests.
Blackstone holds variable interests in certain VIEs which are not consolidated as it is determined that Blackstone is not the primary beneficiary. Blackstone’s involvement with such entities is in the form of direct and indirect equity interests and fee arrangements. The maximum exposure to loss represents the loss of assets recognized by Blackstone relating to non-consolidated VIEs and any clawback obligation relating to previously distributed Performance Allocations. Blackstone’s maximum exposure to loss relating to non-consolidated VIEs were as follows:
36
The Blackstone Group Inc.
Notes to Condensed Consolidated Financial Statements (Unaudited) - Continued
(All Dollars are in Thousands, Except Share and Per Share Data, Except Where Noted)
March 31, |
December 31, |
|||||||
2021 |
2020 |
|||||||
Investments |
$ | 1,730,904 | $ | 1,307,292 | ||||
Due from Affiliates |
286,541 | 262,815 | ||||||
Potential Clawback Obligation |
44,810 | 38,679 | ||||||
Maximum Exposure to Loss |
$ | 2,062,255 | $ | 1,608,786 | ||||
Amounts Due to Non-Consolidated VIEs |
$ | 211 | $ | 241 | ||||
10. Repurchase Agreements
At March 31, 2021 and December 31, 2020, Blackstone pledged securities with a carrying value of $83.5 million and $110.8 million, respectively, and cash to collateralize its repurchase agreements. Such securities can be repledged, delivered or otherwise used by the counterparty.
The following tables provide information regarding Blackstone’s Repurchase Agreements obligation by type of collateral pledged:
March 31, 2021 | ||||||||||||||||||||
Remaining Contractual Maturity of the Agreements | ||||||||||||||||||||
Overnight |
Greater |
|||||||||||||||||||
and |
Up to |
30 - 90 |
than |
|||||||||||||||||
Continuous |
30 Days |
Days |
90 days |
Total | ||||||||||||||||
Repurchase Agreements |
||||||||||||||||||||
Asset-Backed Securities |
$ |
— |
$ |
10,791 |
$ |
45,641 |
$ |
1,618 |
$ |
58,050 |
||||||||||
Gross Amount of Recognized Liabilities for Repurchase Agreements in Note 11. “Offsetting of Assets and Liabilities” |
$ |
58,050 |
||||||||||||||||||
Amounts Related to Agreements Not Included in Offsetting Disclosure in Note 11. “Offsetting of Assets and Liabilities” |
$ |
— |
||||||||||||||||||
December 31, 2020 | ||||||||||||||||||||
Remaining Contractual Maturity of the Agreements | ||||||||||||||||||||
Overnight |
Greater |
|||||||||||||||||||
and |
Up to |
30 - 90 |
than |
|||||||||||||||||
Continuous |
30 Days |
Days |
90 days |
Total | ||||||||||||||||
Repurchase Agreements |
||||||||||||||||||||
Asset-Backed Securities |
$ |
— |
$ |
15,345 |
$ |
32,759 |
$ |
28,704 |
$ |
76,808 |
||||||||||
Gross Amount of Recognized Liabilities for Repurchase Agreements in Note 11. “Offsetting of Assets and Liabilities” |
$ |
76,808 |
||||||||||||||||||
Amounts Related to Agreements Not Included in Offsetting Disclosure in Note 11. “Offsetting of Assets and Liabilities” |
$ |
— |
||||||||||||||||||
37
The Blackstone Group Inc.
Notes to Condensed Consolidated Financial Statements (Unaudited) - Continued
(All Dollars are in Thousands, Except Share and Per Share Data, Except Where Noted)
11. Offsetting of Assets and Liabilities
The following tables present the offsetting of assets and liabilities as of March 31, 2021 and December 31, 2020:
March 31, 2021 | ||||||||||||||||
Gross and Net |
||||||||||||||||
Amounts of |
Gross Amounts Not Offset |
|||||||||||||||
Assets Presented |
in the Statement of |
|||||||||||||||
in the Statement |
Financial Condition |
|||||||||||||||
of Financial |
Financial |
Cash Collateral |
||||||||||||||
Condition |
Instruments (a) |
Received |
Net Amount | |||||||||||||
Assets |
||||||||||||||||
Freestanding Derivatives |
$ |
68,841 |
$ |
66,305 |
$ |
53 |
$ |
2,483 |
||||||||
March 31, 2021 | ||||||||||||||||
Gross and Net |
||||||||||||||||
Amounts of |
||||||||||||||||
Liabilities |
Gross Amounts Not Offset |
|||||||||||||||
Presented in the |
in the Statement of |
|||||||||||||||
Statement of |
Financial Condition |
|||||||||||||||
Financial |
Financial |
Cash Collateral |
||||||||||||||
Condition |
Instruments (a) |
Pledged |
Net Amount | |||||||||||||
Liabilities |
||||||||||||||||
Freestanding Derivatives |
$ |
144,340 |
$ |
125,667 |
$ |
14,118 |
$ |
4,555 |
||||||||
Repurchase Agreements |
58,050 |
58,050 |
— |
— |
||||||||||||
$ |
202,390 |
$ |
183,717 |
$ |
14,118 |
$ |
4,555 |
|||||||||
December 31, 2020 | ||||||||||||||||
Gross and Net |
||||||||||||||||
Amounts of |
Gross Amounts Not Offset |
|||||||||||||||
Assets Presented |
in the Statement of |
|||||||||||||||
in the Statement |
Financial Condition |
|||||||||||||||
of Financial |
Financial |
Cash Collateral |
||||||||||||||
Condition |
Instruments (a) |
Received |
Net Amount | |||||||||||||
Assets |
||||||||||||||||
Freestanding Derivatives |
$ |
126,564 |
$ |
114,673 |
$ |
53 |
$ |
11,838 |
||||||||
38
The Blackstone Group Inc.
Notes to Condensed Consolidated Financial Statements (Unaudited) - Continued
(All Dollars are in Thousands, Except Share and Per Share Data, Except Where Noted)
December 31, 2020 | ||||||||||||||||
Gross and Net |
||||||||||||||||
Amounts of |
||||||||||||||||
Liabilities |
Gross Amounts Not Offset |
|||||||||||||||
Presented in the |
in the Statement of |
|||||||||||||||
Statement of |
Financial Condition |
|||||||||||||||
Financial |
Financial |
Cash Collateral |
||||||||||||||
Condition |
Instruments (a) |
Pledged |
Net Amount | |||||||||||||
Liabilities |
||||||||||||||||
Freestanding Derivatives |
$ |
202,188 |
$ |
174,623 |
$ |
19,194 |
$ |
8,371 |
||||||||
Repurchase Agreements |
76,808 |
76,808 |
— |
— |
||||||||||||
$ |
278,996 |
$ |
251,431 |
$ |
19,194 |
$ |
8,371 |
|||||||||
| (a) | Amounts presented are inclusive of both legally enforceable master netting agreements, and financial instruments received or pledged as collateral. Financial instruments received or pledged as collateral offset derivative counterparty risk exposure, but do not reduce net balance sheet exposure. |
Repurchase Agreements are presented separately on the Condensed Consolidated Statements of Financial Condition. Freestanding Derivative assets are included in Other Assets in the Condensed Consolidated Statements of Financial Condition. The following table presents the components of Other Assets:
March 31, |
December 31, |
|||||||
2021 |
2020 |
|||||||
Furniture, Equipment and Leasehold Improvements, Net |
$ | 240,426 | $ | 231,807 | ||||
Prepaid Expenses |
110,803 | 105,248 | ||||||
Freestanding Derivatives |
67,873 | 126,022 | ||||||
Other |
15,373 | 17,945 | ||||||
| $ | 434,475 | $ | 481,022 | |||||
Freestanding Derivative liabilities are included in Accounts Payable, Accrued Expenses and Other Liabilities in the Condensed Consolidated Statements of Financial Condition and are not a significant component thereof.
Notional Pooling Arrangement
Blackstone has a notional cash pooling arrangement with a financial institution for cash management purposes. This arrangement allows for cash withdrawals based upon aggregate cash balances on deposit at the same financial institution. Cash withdrawals cannot exceed aggregate cash balances on deposit. The net balance of cash on deposit and overdrafts is used as a basis for calculating net interest expense or income. As of March 31, 2021, the aggregate cash balance on deposit relating to the cash pooling arrangement was $545.8 million, which was offset with an accompanying overdraft of $545.8 million.
12. Borrowings
The following table presents the general characteristics of each of Blackstone’s notes, as well as their carrying value and fair value. The notes are included in Loans Payable within the Condensed Consolidated Statements of Financial Condition. All of the notes were issued at a discount. All of the notes accrue interest from the issue date thereof and all pay interest in arrears on a semi-annual basis or annual basis.
39
The Blackstone Group Inc.
Notes to Condensed Consolidated Financial Statements (Unaudited) - Continued
(All Dollars are in Thousands, Except Share and Per Share Data, Except Where Noted)
March 31, 2021 |
December 31, 2020 |
|||||||||||||||
Carrying |
Fair |
Carrying |
Fair |
|||||||||||||
Senior Notes |
Value |
Value (a) |
Value |
Value (a) |
||||||||||||
4.750 %, Due 2/15/2023 |
$ | 397,678 | $ | 430,280 | $ | 397,385 | $ | 434,400 | ||||||||
2.000 %, Due 5/19/2025 |
348,493 | 380,193 | 362,947 | 398,620 | ||||||||||||
1.000 %, Due 10/5/2026 |
696,454 | 732,445 | 724,646 | 770,707 | ||||||||||||
3.150 %, Due 10/2/2027 |
297,473 | 324,930 | 297,387 | 332,370 | ||||||||||||
1.500 %, Due 4/10/2029 |
699,020 | 760,597 | 728,054 | 805,744 | ||||||||||||
2.500 %, Due 1/10/2030 |
490,972 | 505,750 | 490,745 | 538,200 | ||||||||||||
1.600 %, Due 3/30/2031 |
495,209 | 459,600 | 495,100 | 497,950 | ||||||||||||
6.250 %, Due 8/15/2042 |
238,728 | 345,000 | 238,668 | 372,250 | ||||||||||||
5.000 %, Due 6/15/2044 |
489,261 | 612,300 | 489,201 | 684,800 | ||||||||||||
4.450 %, Due 7/15/2045 |
344,315 | 402,324 | 344,282 | 449,645 | ||||||||||||
4.000 %, Due 10/2/2047 |
290,581 | 324,510 | 290,533 | 364,590 | ||||||||||||
3.500 %, Due 9/10/2049 |
391,966 | 402,280 | 391,925 | 460,120 | ||||||||||||
2.800 %, Due 9/30/2050 |
393,715 | 359,680 | 393,681 | 406,280 | ||||||||||||
| $ | 5,573,865 | $ | 6,039,889 | $ | 5,644,554 | $ | 6,515,676 | |||||||||
| (a) | Fair value is determined by broker quote and these notes would be classified as Level II within the fair value hierarchy. |
Scheduled principal payments for borrowings as of March 31, 2021 were as follows:
Operating |
Blackstone Fund |
Total |
||||||||||
Borrowings |
Facilities |
Borrowings |
||||||||||
2021 |
$ | — | $ | 100 | $ | 100 | ||||||
2022 |
— | — | — | |||||||||
2023 |
400,000 | — | 400,000 | |||||||||
2024 |
— | — | — | |||||||||
2025 |
351,900 | — | 351,900 | |||||||||
Thereafter |
4,907,600 | — | 4,907,600 | |||||||||
| $ | 5,659,500 | $ | 100 | $ | 5,659,600 | |||||||
13. Income Taxes
Prior to the Conversion, Blackstone and certain of its subsidiaries operated in the U.S. as partnerships for income tax purposes (partnerships generally are not subject to federal income taxes) and generally as corporate entities in non-U.S. jurisdictions. Subsequent to the Conversion, all income attributable to Blackstone is subject to U.S. corporate income taxes.
The Conversion resulted in a step-up in the tax basis of certain assets that will be recovered as those assets are sold or the basis is amortized.
Although Blackstone was a cash taxpayer for the three months ended March 31, 2021, Blackstone’s
effective tax rate was 0.0% and 5.7% for the three months ended March 31, 2021 and 2020, respectively. Blackstone’s income tax provision (benefit) was $(0.4) million and $(158.7) million for the three months ended March 31, 2021 and 2020, respectively. For both the three months ended March 31, 2021 and March 31, 2020, the effective tax rate differs from the statutory rate primarily because: (a) a portion of the reported net income (loss) before taxes is attributable to non-controlling interest holders and (b) of the net change to the valuation allowance related
40
The Blackstone Group Inc.
Notes to Condensed Consolidated Financial Statements (Unaudited) - Continued
(All Dollars are in Thousands, Except Share and Per Share Data, Except Where Noted)
to the step-up in the tax basis of investment tax assets.
14. Earnings Per Share and Stockholders’ Equity
Earnings Per Share
Basic and diluted net income per share of common stock for the three months ended March 31, 2021 and March 31, 2020 was calculated as follows:
Three Months Ended March 31, | ||||||||
2021 |
2020 | |||||||
Net Income (Loss) for Per Share of Common Stock Calculations |
||||||||
Net Income (Loss) Attributable to The Blackstone Group Inc., Basic and Diluted |
$ |
1,747,872 |
$ |
(1,066,492 |
) | |||
Share/Units Outstanding |
||||||||
Weighted-Average Shares of Common Stock Outstanding, Basic |
709,033,212 |
676,305,359 |
||||||
Weighted-Average Shares of Unvested Deferred Restricted Common Stock |
879,132 |
— |
||||||
Weighted-Average Shares of Common Stock Outstanding, Diluted |
709,912,344 |
676,305,359 |
||||||
Net Income (Loss) Per Share of Common Stock |
||||||||
Basic |
$ |
2.47 |
$ |
(1.58 |
) | |||
Diluted |
$ |
2.46 |
$ |
(1.58 |
) | |||
Dividends Declared Per Share of Common Stock (a) |
$ |
0.96 |
$ |
0.61 |
||||
| (a) | Dividends declared reflects the calendar date of the declaration for each dividend. |
In computing the dilutive effect that the exchange of Blackstone Holdings Partnership Units would have on Net Income Per Share of Common Stock, Blackstone considered that net income available to holders of shares of common stock would increase due to the elimination of non-controlling interests in Blackstone Holdings, inclusive of any tax impact. The hypothetical conversion may be dilutive to the extent there is activity at The Blackstone Group Inc. level that has not previously been attributed to the non-controlling interests or if there is a change in tax rate as a result of a hypothetical conversion.
The following table summarizes the anti-dilutive securities for the three months ended March 31, 2021 and 2020:
Three Months Ended March 31, |
||||||||
2021 |
2020 |
|||||||
Weighted-Average Shares of Unvested Deferred Restricted Common Stock |
— | 10,465,568 | ||||||
Weighted-Average Blackstone Holdings Partnership Units |
493,170,234 | 511,220,151 | ||||||
41
The Blackstone Group Inc.
Notes to Condensed Consolidated Financial Statements (Unaudited) - Continued
(All Dollars are in Thousands, Except Share and Per Share Data, Except Where Noted)
Stockholders’ Equity
In connection with the Conversion, effective July 1, 2019, each common unit of the Partnership outstanding immediately prior to the Conversion converted into
one issued and outstanding
, fully paid and nonassessable share of Class A common stock, $0.00001 par value per share, of the Company. The special voting unit of the Partnership outstanding immediately prior to the Conversion converted into one issued and outstanding
, fully paid and nonassessable share of Class B common stock, $0.00001 par value per share, of the Company. The general partner units of the Partnership outstanding immediately prior to the Conversion converted into one issued and outstanding
, fully paid and nonassessable share of Class C common stock, $0.00001 par value per share, of the Company. In connection with the share reclassification, effective February 26, 2021, the Certificate of Incorporation of The Blackstone Group Inc. was amended and restated to: (a) rename the Class A common stock as “common stock,” which has the same rights and powers (including, without limitation, with respect to voting) that Blackstone’s Class A common stock formerly had, (b) reclassify the “Class B common stock” into a new “Series I preferred stock,” which has the same rights and powers that the Class B common stock formerly had, and (c) reclassify the Class C common stock into a new “Series II preferred stock,” which has the same rights and powers that the Class C common stock formerly had. In connection with such share reclassification, the Company authorized
10
billion shares of preferred stock with a par value of $0.00001
, of which (a) 999,999,000
shares are designated as Series I
preferred stock and (b) 1,000
shares are designated as Series II preferred stock. The remaining 9
billion shares may be designated from time to time in accordance with Blackstone’s certificate of incorporation. There was 1 share of Series I preferred stock and 1 share of Series II preferred stock issued and outstanding as of March 31, 2021. Under Blackstone’s certificate of incorporation and Delaware law, holders of Blackstone’s common stock are entitled to vote, together with holders of Blackstone’s Series I preferred stock, voting as a single class, on a number of significant matters, including certain sales, exchanges or other dispositions of all or substantially all of Blackstone’s assets, a merger, consolidation or other business combination, the removal of the Series II Preferred Stockholder and forced transfer by the Series II Preferred Stockholder of its shares of Series II preferred stock and the designation of a successor Series II Preferred Stockholder. The Series II Preferred Stockholder elects the Company’s directors. Holders of Blackstone’s Series I preferred stock and Series II preferred stock are not entitled to dividends from the Company, or receipt of any of the Company’s assets in the event of any dissolution, liquidation or winding up. Blackstone Partners L.L.C. is the sole holder of the Series I preferred stock and Blackstone Group Management L.L.C. is the sole holder of the Series II preferred stock.
Share Repurchase Program
On July 16, 2019, Blackstone’s board of directors authorized the repurchase of up to
billion of common stock and Blackstone Holdings Partnership Units
$1.0 (
the “2019 Repurchase Authorization”). On May 6, 2021, Blackstone’s board of directors authorized the repurchase of up to billion of common stock and Blackstone Holdings Partnership Units, which authorization replaced the 2019 Repurchase Authorization. Under the repurchase program, repurchases may be made from time to time in open market transactions, in privately negotiated transactions or otherwise. The timing and the actual numbers repurchased will depend on a variety of factors, including legal requirements, price and economic and market conditions. The repurchase program may be changed, suspended or discontinued at any time and does not have a specified expiration date.
During the three months ended March 31, 2021,
no
shares of common stock were repurchased. During the three months ended March 31, 2020, Blackstone repurchased 5.0 million shares of common stock at a total cost of $253.5 million. As of March 31, 2021, the amount remaining available for repurchases under the program was $307.2 million. 42
The Blackstone Group Inc.
Notes to Condensed Consolidated Financial Statements (Unaudited) - Continued
(All Dollars are in Thousands, Except Share and Per Share Data, Except Where Noted)
Shares Eligible for Dividends and Distributions
As of March 31, 2021, the total shares of common stock and Blackstone Holdings Partnership Units entitled to participate in dividends and distributions were as follows:
Shares/Units |
||||
Common Stock Outstanding |
690,569,563 | |||
Unvested Participating Common Stock |
20,495,980 | |||
Total Participating Common Stock |
711,065,543 | |||
Participating Blackstone Holdings Partnership Units |
490,716,529 | |||
| 1,201,782,072 | ||||
15. Equity-Based Compensation
Blackstone has granted equity-based compensation awards to Blackstone’s senior managing directors, non-partner professionals, non-professionals and selected external advisers under Blackstone’s Amended and Restated 2007 Equity Incentive Plan (the “Equity Plan”). The Equity Plan allows for the granting of options, share appreciation rights or other share-based awards (shares, restricted shares, restricted shares of common stock, deferred restricted shares of common stock, phantom restricted shares of common stock or other share-based awards based in whole or in part on the fair value of shares of common stock or Blackstone Holdings Partnership Units) which may contain certain service or performance requirements. As of January 1, 2021, Blackstone had the ability to grant 171,130,080 shares under the Equity Plan.
For the three months ended March 31, 2021 and March 31, 2020, Blackstone recorded compensation expense of $163.9 million and $118.8 million, respectively, in relation to its equity-based awards with corresponding tax benefits of $21.9 million and $13.7 million, respectively.
As of March 31, 2021, there was $1.4 billion of estimated unrecognized compensation expense related to unvested awards. This cost is expected to be recognized over a weighted-average period of 3.5 years.
Total vested and unvested outstanding shares, including common stock, Blackstone Holdings Partnership Units and deferred restricted shares of common stock, were 1,201,928,645 as of March 31, 2021. Total outstanding phantom shares were 72,738 as of March 31, 2021.
A summary of the status of Blackstone’s unvested equity-based awards as of March 31, 2021 and of changes during the period January 1, 2021 through March 31, 2021 is presented below:
Blackstone Holdings |
The Blackstone Group Inc. | |||||||||||||||||||||||
Equity Settled Awards |
Cash Settled Awards | |||||||||||||||||||||||
Weighted- |
Weighted- |
Weighted- | ||||||||||||||||||||||
Average |
Deferred |
Average |
Average | |||||||||||||||||||||
Partnership |
Grant Date |
Restricted Shares |
Grant Date |
Phantom |
Grant Date | |||||||||||||||||||
Unvested Shares/Units |
Units |
Fair Value |
of Common Stock |
Fair Value |
Shares |
Fair Value | ||||||||||||||||||
Balance, December 31, 2020 |
23,771,136 |
$ |
36.33 |
19,512,034 |
$ |
42.60 |
65,284 |
$ |
60.42 |
|||||||||||||||
Granted |
— |
— |
2,491,254 |
64.59 |
2,687 |
69.96 |
||||||||||||||||||
Vested |
(1,084,770 |
) |
36.74 |
(1,977,694 |
) |
45.37 |
(1,211 |
) |
69.96 |
|||||||||||||||
Forfeited |
(523,549 |
) |
41.33 |
(214,904 |
) |
44.53 |
— |
— |
||||||||||||||||
Balance, March 31, 2021 |
22,162,817 |
$ |
36.47 |
19,810,690 |
$ |
45.07 |
66,760 |
$ |
69.96 |
|||||||||||||||
43
The Blackstone Group Inc.
Notes to Condensed Consolidated Financial Statements (Unaudited) - Continued
(All Dollars are in Thousands, Except Share and Per Share Data, Except Where Noted)
Shares/Units Expected to Vest
The following unvested shares and units, after expected forfeitures, as of March 31, 2021, are expected to vest:
Weighted- | ||||||
Average | ||||||
Service Period | ||||||
Shares/Units |
in Years | |||||
Blackstone Holdings Partnership Units |
19,349,603 | 2.5 | ||||
Deferred Restricted Shares of Common Stock |
16,881,420 | 3.2 | ||||
Total Equity-Based Awards |
36,231,023 | 2.8 | ||||
Phantom Shares |
54,690 | 2.8 | ||||
16. Related Party Transactions
Affiliate Receivables and Payables
Due from Affiliates and Due to Affiliates consisted of the following:
March 31, |
December 31, | |||||||
2021 |
2020 | |||||||
Due from Affiliates |
||||||||
Management Fees, Performance Revenues, Reimbursable Expenses and Other Receivables from Non-Consolidated Entities and Portfolio Companies |
$ |
2,365,997 |
$ |
2,637,055 |
||||
Due from Certain Non-Controlling Interest Holders and Blackstone Employees |
614,749 |
548,897 |
||||||
Accrual for Potential Clawback of Previously Distributed Performance Allocations |
34,572 |
35,563 |
||||||
$ |
3,015,318 |
$ |
3,221,515 |
|||||
March 31, |
December 31, | |||||||
2021 |
2020 | |||||||
Due to Affiliates |
||||||||
Due to Certain Non-Controlling Interest Holders in Connection with the Tax Receivable Agreements |
$ |
880,752 |
$ |
857,523 |
||||
Due to Non-Consolidated Entities |
135,043 |
107,410 |
||||||
Due to Certain Non-Controlling Interest Holders and Blackstone Employees |
64,619 |
61,539 |
||||||
Accrual for Potential Repayment of Previously Received Performance Allocations |
81,361 |
108,569 |
||||||
$ |
1,161,775 |
$ |
1,135,041 |
|||||
Interests of the Founder, Senior Managing Directors, Employees and Other Related Parties
The Founder, senior managing directors, employees and certain other related parties invest on a discretionary basis in the consolidated Blackstone Funds both directly and through consolidated entities. These investments generally are subject to preferential management fee and performance allocation or incentive fee arrangements. As of March 31, 2021 and December 31, 2020, such investments aggregated $1.3 billion and $1.1 billion, respectively. Their share of the Net Income Attributable to Redeemable Non-Controlling and Non-Controlling Interests in Consolidated Entities aggregated $117.4 million and $(178.4) million for the three months ended March 31, 2021 and 2020, respectively.
44
The Blackstone Group Inc.
Notes to Condensed Consolidated Financial Statements (Unaudited) - Continued
(All Dollars are in Thousands, Except Share and Per Share Data, Except Where Noted)
Loans to Affiliates
Loans to affiliates consist of interest bearing advances to certain Blackstone individuals to finance their investments in certain Blackstone Funds. These loans earn interest at Blackstone’s cost of borrowing and such interest totaled $2.2 million and $3.0 million for the three months ended March 31, 2021 and 2020, respectively.
Contingent Repayment Guarantee
Blackstone and its personnel who have received Performance Allocation distributions have guaranteed payment on a several basis (subject to a cap) to the carry funds of any clawback obligation with respect to the excess Performance Allocation allocated to the general partners of such funds and indirectly received thereby to the extent that either Blackstone or its personnel fails to fulfill its clawback obligation, if any. The Accrual for Potential Repayment of Previously Received Performance Allocations represents amounts previously paid to Blackstone Holdings and non-controlling interest holders that would need to be repaid to the Blackstone Funds if the carry funds were to be liquidated based on the fair value of their underlying investments as of March 31, 2021. See Note 17. “Commitments and Contingencies — Contingencies — Contingent Obligations (Clawback).”
Aircraft and Other Services
In the normal course of business, Blackstone makes use of aircraft owned by Stephen A. Schwarzman; aircraft owned by Jonathan D. Gray; and aircraft owned jointly by Joseph P. Baratta and two other individuals (each such aircraft, “Personal Aircraft”). Each of Messrs. Schwarzman, Gray and Baratta paid for his respective ownership interest in his Personal Aircraft himself and bears his respective share of all operating, personnel and maintenance costs associated with the operation of such Personal Aircraft. The payments Blackstone makes for the use of the Personal Aircraft are based on current market rates.
In addition, on occasion, certain of Blackstone’s executive officers and employee directors and their families may make personal use of aircraft in which Blackstone owns a fractional interest, as well as other assets of Blackstone. Any such personal use of Blackstone assets is charged to the executive officer or employee director based on market rates and usage. Personal use of Blackstone resources is also reimbursed to Blackstone based on market rates.
The transactions described herein are not material to the Condensed Consolidated Financial Statements.
Tax Receivable Agreements
Blackstone used a portion of the proceeds from the IPO and other sales of shares to purchase interests in the predecessor businesses from the predecessor owners. In addition, holders of Blackstone Holdings Partnership Units may exchange their Blackstone Holdings Partnership Units for shares of Blackstone common stock on a one-for-one basis. The purchase and subsequent exchanges are expected to result in increases in the tax basis of the tangible and intangible assets of Blackstone Holdings and therefore reduce the amount of tax that Blackstone would otherwise be required to pay in the future.
Blackstone has entered into tax receivable agreements with each of the predecessor owners and additional tax receivable agreements have been executed, and will continue to be executed, with newly-admitted senior managing directors and others who acquire Blackstone Holdings Partnership Units. The agreements provide for the payment by the corporate taxpayer to such owners of 85% of the amount of cash savings, if any, in U.S. federal, state and local income tax that the corporate taxpayers actually realize as a result of the aforementioned increases in tax basis and of certain other tax benefits related to entering into these tax receivable agreements. For purposes of the tax receivable agreements, cash savings in income tax will be computed by comparing the actual income tax liability of the corporate taxpayers to the amount of such taxes that the corporate taxpayers would have been required to pay had there been no increase to the tax basis of the tangible and intangible assets of Blackstone Holdings as a result of the exchanges and had the corporate taxpayers not entered into the tax receivable agreements.
45
The Blackstone Group Inc.
Notes to Condensed Consolidated Financial Statements (Unaudited) - Continued
(All Dollars are in Thousands, Except Share and Per Share Data, Except Where Noted)
Assuming no future material changes in the relevant tax law and that the corporate taxpayers earn sufficient taxable income to realize the full tax benefit of the increased amortization of the assets, the expected future payments under the tax receivable agreements (which are taxable to the recipients) will aggregate $880.7 million over the next 15 years. The after-tax net present value of these estimated payments totals $237.3 million assuming a 15% discount rate and using Blackstone’s most recent projections relating to the estimated timing of the benefit to be received. Future payments under the tax receivable agreements in respect of subsequent exchanges would be in addition to these amounts. The payments under the tax receivable agreements are not conditioned upon continued ownership of Blackstone equity interests by the pre-IPO owners and the others mentioned above.
Amounts related to the deferred tax asset resulting from the increase in tax basis from the exchange of Blackstone Holdings Partnership Units to shares of Blackstone common stock, the resulting remeasurement of net deferred tax assets at the Blackstone ownership percentage at the balance sheet date, the due to affiliates for the future payments resulting from the tax receivable agreements and resulting adjustment to partners’ capital are included as Acquisition of Ownership Interests from Non-Controlling Interest Holders in the Supplemental Disclosure of Non-Cash Investing and Financing Activities in the Condensed Consolidated Statements of Cash Flows.
Other
Blackstone does business with and on behalf of some of its Portfolio Companies; all such arrangements are on a negotiated basis.
Additionally, please see Note 17. “Commitments and Contingencies — Contingencies — Guarantees” for information regarding guarantees provided to a lending institution for certain loans held by employees.
17. Commitments and Contingencies
Commitments
Investment Commitments
Blackstone had $4.1 billion of investment commitments as of March 31, 2021 representing general partner capital funding commitments to the Blackstone Funds, limited partner capital funding to other funds and Blackstone principal investment commitments, including loan commitments. The consolidated Blackstone Funds had signed investment commitments of $102.9 million as of March 31, 2021, which includes $66.9 million of signed investment commitments for portfolio company acquisitions in the process of closing.
Contingencies
Guarantees
Certain of Blackstone’s consolidated real estate funds guarantee payments to third parties in connection with the ongoing business activities and/or acquisitions of their Portfolio Companies. There is no direct recourse to Blackstone to fulfill such obligations. To the extent that underlying funds are required to fulfill guarantee obligations, Blackstone’s invested capital in such funds is at risk. Total investments at risk in respect of guarantees extended by consolidated real estate funds was $22.5 million as of March 31, 2021.
The Blackstone Holdings Partnerships provided guarantees to a lending institution for certain loans held by employees either for investment in Blackstone Funds or for members’ capital contributions to The Blackstone Group International Partners LLP. The amount guaranteed as of March 31, 2021 was $222.0 million.
46
The Blackstone Group Inc.
Notes to Condensed Consolidated Financial Statements (Unaudited) - Continued
(All Dollars are in Thousands, Except Share and Per Share Data, Except Where Noted)
During the period ended December 31, 2020, Blackstone provided a short-term guarantee supporting the purchase of loans from warehousing provided by third party banks related to the launch of a non-consolidated credit fund. As of March 31, 2021, this warehousing vehicle purchased $128.2 million of loans with a fair value of $128.8 million, a $0.6 million gain. As of January 7, 2021, the product’s fundraising threshold under the warehouse had been met releasing Blackstone as primary obligor under the ongoing purchase guarantee. Blackstone will continue to be secondarily liable under the purchase guarantee through June 30, 2021.
Litigation
Blackstone may from time to time be involved in litigation and claims incidental to the conduct of its business. Blackstone’s businesses are also subject to extensive regulation, which may result in regulatory proceedings against Blackstone.
Blackstone accrues a liability for legal proceedings only when those matters present loss contingencies that are both probable and reasonably estimable. In such cases, there may be an exposure to loss in excess of any amounts accrued. Although there can be no assurance of the outcome of such legal actions, based on information known by management, Blackstone does not have a potential liability related to any current legal proceeding or claim that would individually or in the aggregate materially affect its results of operations, financial position or cash flows.
In December 2017, a purported derivative suit (Mayberry v. KKR & Co., L.P., et al.) was filed in the Commonwealth of Kentucky Franklin County Circuit Court on behalf of the Kentucky Retirement System (“KRS”) by eight of its members and beneficiaries alleging various breaches of fiduciary duty and other violations of Kentucky state law in connection with KRS’s investment in three hedge funds of funds, including a fund managed by Blackstone Alternative Asset Management L.P. (“BAAM L.P.”). The suit named more than 30 defendants, including The Blackstone Group L.P.; BAAM L.P.; Stephen A. Schwarzman, as Chairman and CEO of Blackstone; and J. Tomilson Hill, as then-Vice Chairman of Blackstone and CEO of BAAM L.P. (collectively, the “Blackstone Defendants”). Aside from the Blackstone Defendants, the action also named current and former KRS trustees and former KRS officers and various other service providers to KRS and their related persons.
The plaintiffs filed an amended complaint in January 2018. In November 2018, the Circuit Court granted one defendant’s motion to dismiss and denied all other defendants’ motions to dismiss, including those of the Blackstone Defendants. In January 2019, certain of the KRS trustee and officer defendants noticed appeals from the denial of the motions to dismiss to the Kentucky Court of Appeals, and also filed a motion to stay the Mayberry proceedings in Circuit Court pending the outcome of those appeals. In addition, several defendants, including the Blackstone Defendants, filed petitions in the Kentucky Court of Appeals for a writ of prohibition against the ongoing Mayberry proceedings on the ground that the plaintiffs lack standing. In April 2019, the KRS trustee and officer defendants’ appeals were transferred to the Kentucky Supreme Court.
On April 23, 2019, the Kentucky Court of Appeals granted the Blackstone Defendants’ petition for a writ of prohibition and vacated the Circuit Court’s November 30, 2018 Opinion and Order denying the motion to dismiss for lack of standing. On April 24, 2019, the Mayberry Plaintiffs filed a notice of appeal of that order to the Kentucky Supreme Court.
On July 9, 2020, the Kentucky Supreme Court unanimously held that the plaintiffs lack constitutional standing to bring their claims and remanded the case to the Circuit Court with direction to dismiss the complaint. On July 20, 2020, the Kentucky Attorney General filed a motion to intervene and a proposed intervening complaint in the Mayberry action on behalf of the Commonwealth of Kentucky. The Blackstone Defendants filed an objection to that motion on July 30, 2020. On July 21, 2020, the Kentucky Attorney General also filed a separate action in Franklin County Circuit Court that is nearly identical to its proposed intervening complaint. In addition, on July 29, 2020, counsel for certain of the Mayberry Plaintiffs filed a motion for leave to amend their complaint, purporting to remedy the standing defects identified by the Kentucky Supreme Court. On December 28, 2020, the Circuit Court dismissed the Mayberry Plaintiffs’ complaint for lack of standing, denied the Mayberry Plaintiffs’ motion for
47
The Blackstone Group Inc.
Notes to Condensed Consolidated Financial Statements (Unaudited) - Continued
(All Dollars are in Thousands, Except Share and Per Share Data, Except Where Noted)
leave to amend, and granted the Kentucky Attorney General’s motion to intervene over the defendants’ objections. On January 11, 2021, the Circuit Court ordered the Kentucky Attorney General to file an amended complaint in the purported derivative suit by February 1, 2021. On January 29, 2021, the Kentucky Attorney General moved for an extension of time to file its amended complaint, citing an ongoing investigation of the claims by KRS. On February 18, 2021, the Circuit Court granted the Kentucky Attorney General’s request and ordered the Kentucky Attorney General to file such amended complaint by April 12, 2021. On April 8, 2021 and April 22, 2021, the Circuit Court granted extensions of the Kentucky Attorney General’s deadline to file an amended complaint, again citing the ongoing investigation by KRS. The Kentucky Attorney General’s deadline to file an amended complaint is currently May 27, 2021.
On December 31, 2020, three potentially new derivative plaintiffs brought a motion in the Circuit Court for leave to file a third amended complaint. The new derivative plaintiffs allege they have standing and seek to press the Mayberry Plaintiffs’ case. On January 11, 2021, the Circuit Court concluded that the motion to amend was not ripe and ordered the three potentially new derivative plaintiffs to file a motion to intervene by no later than February 11, 2021. On February 1, 2021, the three potentially new derivative plaintiffs filed a motion to intervene in the purported derivative suit. On March 2, 2021, the Blackstone Defendants, certain other defendants, the Kentucky Attorney General, and KRS filed responses opposing the motion to intervene. The potentially new derivative plaintiffs filed their reply in support of the motion to intervene on March 8, 2021, and oral argument on the motion is currently scheduled for June 1, 2021.
On January 6, 2021, the three potentially new derivative plaintiffs also filed a separate derivative action that is substantially the same as the amended complaint they seek to file in the original derivative action. On February 12, 2021, the Circuit Court stayed the defendants’ response deadline pending resolution of the three potentially new derivative plaintiffs’ motion to intervene in the purported derivative action.
On April 28, 2021, the Kentucky Attorney General filed a declaratory judgment action in Franklin County Circuit Court on behalf of the Commonwealth of Kentucky. The Kentucky Attorney General’s complaint alleges that certain provisions in the subscription agreements between KRS and the managers of the three funds at issue in the Mayberry action violate the Kentucky Constitution. The Kentucky Attorney General’s suit names as defendants BAAM L.P., Blackstone, and five other defendants also named in the Mayberry action.
Blackstone continues to believe that these suits are totally without merit and intends to defend them vigorously.
Contingent Obligations (Clawback)
Performance Allocations are subject to clawback to the extent that the Performance Allocations received to date with respect to a fund exceeds the amount due to Blackstone based on cumulative results of that fund. The actual clawback liability, however, generally does not become realized until the end of a fund’s life except for certain Blackstone real estate funds, multi-asset class investment funds and credit-focused funds, which may have an interim clawback liability. The lives of the carry funds, including available contemplated extensions, for which a liability for potential clawback obligations has been recorded for financial reporting purposes, are currently anticipated to expire at various points through 2028. Further extensions of such terms may be implemented under given circumstances.
For financial reporting purposes, when applicable, the general partners record a liability for potential clawback obligations to the limited partners of some of the carry funds due to changes in the unrealized value of a fund’s remaining investments and where the fund’s general partner has previously received Performance Allocation distributions with respect to such fund’s realized investments.
48
The Blackstone Group Inc.
Notes to Condensed Consolidated Financial Statements (Unaudited) - Continued
(All Dollars are in Thousands, Except Share and Per Share Data, Except Where Noted)
The following table presents the clawback obligations by segment:
March 31, 2021 |
December 31, 2020 | |||||||||||||||||||||||
Current and |
Current and |
|||||||||||||||||||||||
Blackstone |
Former |
Blackstone |
Former |
|||||||||||||||||||||
Segment |
Holdings |
Personnel (a) |
Total |
Holdings |
Personnel (a) |
Total | ||||||||||||||||||
Real Estate |
$ |
27,433 |
$ |
16,568 |
$ |
44,001 |
$ |
28,283 |
$ |
17,102 |
$ |
45,385 |
||||||||||||
Private Equity |
5,548 |
2,002 |
7,550 |
41,722 |
(8,623 |
) |
33,099 |
|||||||||||||||||
Credit & Insurance |
13,808 |
16,002 |
29,810 |
13,935 |
16,150 |
30,085 |
||||||||||||||||||
$ |
46,789 |
$ |
34,572 |
$ |
81,361 |
$ |
83,940 |
$ |
24,629 |
$ |
108,569 |
|||||||||||||
| (a) | The split of clawback between Blackstone Holdings and Current and Former Personnel is based on the performance of individual investments held by a fund rather than on a fund by fund basis. |
For Private Equity, Real Estate, and certain Credit & Insurance Funds, a portion of the Performance Allocations paid to current and former Blackstone personnel is held in segregated accounts in the event of a cash clawback obligation. These segregated accounts are not included in the Condensed Consolidated Financial Statements of Blackstone, except to the extent a portion of the assets held in the segregated accounts may be allocated to a consolidated Blackstone fund of hedge funds. At March 31, 2021, $829.6 million was held in segregated accounts for the purpose of meeting any clawback obligations of current and former personnel if such payments are required.
In the Credit & Insurance segment, payment of Performance Allocations to Blackstone by the majority of the stressed/distressed, mezzanine and credit alpha strategies funds are substantially deferred under the terms of the partnership agreements. This deferral mitigates the need to hold funds in segregated accounts in the event of a cash clawback obligation.
If, at March 31, 2021, all of the investments held by Blackstone’s carry funds were deemed worthless, a possibility that management views as remote, the amount of Performance Allocations subject to potential clawback would be $4.3 billion, on an
after-tax
basis where applicable, of which Blackstone Holdings is potentially liable for $3.9 billion if current and former Blackstone personnel default on their share of the liability, a possibility that management also views as remote. 18. Segment Reporting
Blackstone transacts its primary business in the United States and substantially all of its revenues are generated domestically.
Blackstone conducts its alternative asset management businesses through four segments:
| • | Real Estate – Blackstone’s Real Estate segment primarily comprises its management of global, Europe and Asia-focused opportunistic real estate funds, high-yield and high-grade real estate debt funds, liquid real estate debt funds, Core+ real estate funds, which also include a non-listed REIT, and a NYSE-listed REIT. |
| • | Private Equity – Blackstone’s Private Equity segment includes its management of flagship corporate private equity funds, sector and geographically-focused corporate private equity funds, including energy and Asia-focused funds, core private equity funds, an opportunistic investment platform, a secondary fund of funds business, infrastructure-focused funds, a life sciences private investment platform, a growth equity investment platform, a multi-asset investment program for eligible high net worth investors and a capital markets services business. |
49
The Blackstone Group Inc.
Notes to Condensed Consolidated Financial Statements (Unaudited) - Continued
(All Dollars are in Thousands, Except Share and Per Share Data, Except Where Noted)
| • | Hedge Fund Solutions – The largest component of Blackstone’s Hedge Fund Solutions segment is Blackstone Alternative Asset Management, which manages a broad range of commingled and customized hedge fund of fund solutions. The segment also includes investment platforms that seed new hedge fund businesses, purchase minority interests in more established general partners and management companies of funds, invest in special situation opportunities, create alternative solutions in the form of daily liquidity products and invest directly. |
| • | Credit & Insurance – Blackstone’s Credit & Insurance segment consists principally of Blackstone Credit, formerly known as GSO Capital Partners LP, which is organized into two overarching strategies: private credit (which includes mezzanine lending funds, middle market direct lending funds, including Blackstone’s business development company, secured lending fund, structured products group, stressed/distressed strategies and energy strategies) and liquid credit (which consists of CLOs, closed-ended funds, open-ended funds and separately managed accounts). In addition, the segment includes a publicly traded master limited partnership investment platform, Harvest, and Blackstone’s insurer-focused platform, Blackstone Insurance Solutions. |
These business segments are differentiated by their various investment strategies. The Real Estate, Private Equity, Hedge Fund Solutions and Credit & Insurance segments primarily earn their income from management fees and investment returns on assets under management.
Segment Distributable Earnings is Blackstone’s segment profitability measure used to make operating decisions and assess performance across Blackstone’s four segments. Segment Distributable Earnings represents the net realized earnings of Blackstone’s segments and is the sum of Fee Related Earnings and Net Realizations for each segment. Blackstone’s segments are presented on a basis that deconsolidates Blackstone Funds, eliminates non-controlling ownership interests in Blackstone’s consolidated operating partnerships, removes the amortization of intangible assets and removes Transaction-Related Charges. Transaction-Related Charges arise from corporate actions including acquisitions, divestitures and Blackstone’s initial public offering. They consist primarily of equity-based compensation charges, gains and losses on contingent consideration arrangements, changes in the balance of the Tax Receivable Agreement resulting from a change in tax law or similar event, transaction costs and any gains or losses associated with these corporate actions.
For segment reporting purposes, Segment Distributable Earnings is presented along with its major components, Fee Related Earnings and Net Realizations. Fee Related Earnings is used to assess Blackstone’s ability to generate profits from revenues that are measured and received on a recurring basis and not subject to future realization events. Net Realizations is the sum of Realized Principal Investment Income and Realized Performance Revenues less Realized Performance Compensation. Performance Allocations and Incentive Fees are presented together and referred to collectively as Performance Revenues or Performance Compensation.
50
The Blackstone Group Inc.
Notes to Condensed Consolidated Financial Statements (Unaudited) - Continued
(All Dollars are in Thousands, Except Share and Per Share Data, Except Where Noted)
Segment Presentation
The following tables present the financial data for Blackstone’s four segments as of March 31, 2021 and for the three months ended March 31, 2021 and 2020.
March 31, 2021 and the Three Months Then Ended | ||||||||||||||||||||
Real |
Private |
Hedge Fund |
Credit & |
Total | ||||||||||||||||
Estate |
Equity |
Solutions |
Insurance |
Segments | ||||||||||||||||
| Management and Advisory Fees, Net |
||||||||||||||||||||
| Base Management Fees |
$ |
427,186 |
$ |
377,660 |
$ |
150,533 |
$ |
161,911 |
$ |
1,117,290 |
||||||||||
| Transaction, Advisory and Other Fees, Net |
26,019 |
42,707 |
4,346 |
5,568 |
78,640 |
|||||||||||||||
| Management Fee Offsets |
(1,623 |
) |
(13,919 |
) |
(58 |
) |
(2,125 |
) |
(17,725 |
) | ||||||||||
| |
|
|
|
|
|
|
|
|
|
|
|
|
|
| ||||||
| Total Management and Advisory Fees, Net |
451,582 |
406,448 |
154,821 |
165,354 |
1,178,205 |
|||||||||||||||
| Fee Related Performance Revenues |
155,392 |
— |
— |
13,776 |
169,168 |
|||||||||||||||
| Fee Related Compensation |
(188,492 |
) |
(140,597 |
) |
(38,850 |
) |
(77,171 |
) |
(445,110 |
) | ||||||||||
| Other Operating Expenses |
(44,362 |
) |
(51,055 |
) |
(19,172 |
) |
(46,835 |
) |
(161,424 |
) | ||||||||||
| |
|
|
|
|
|
|
|
|
|
|
|
|
|
| ||||||
| Fee Related Earnings |
374,120 |
214,796 |
96,799 |
55,124 |
740,839 |
|||||||||||||||
| |
|
|
|
|
|
|
|
|
|
|
|
|
|
| ||||||
| Realized Performance Revenues |
88,638 |
255,845 |
31,573 |
25,267 |
401,323 |
|||||||||||||||
| Realized Performance Compensation |
(22,762 |
) |
(111,209 |
) |
(6,908 |
) |
(10,045 |
) |
(150,924 |
) | ||||||||||
| Realized Principal Investment Income |
100,820 |
115,403 |
35,550 |
46,383 |
298,156 |
|||||||||||||||
| |
|
|
|
|
|
|
|
|
|
|
|
|
|
| ||||||
| Total Net Realizations |
166,696 |
260,039 |
60,215 |
61,605 |
548,555 |
|||||||||||||||
| |
|
|
|
|
|
|
|
|
|
|
|
|
|
| ||||||
| Total Segment Distributable Earnings |
$ |
540,816 |
$ |
474,835 |
$ |
157,014 |
$ |
116,729 |
$ |
1,289,394 |
||||||||||
| |
|
|
|
|
|
|
|
|
|
|
|
|
|
| ||||||
| Segment Assets |
$ |
9,382,360 |
$ |
12,585,484 |
$ |
2,524,669 |
$ |
3,837,509 |
$ |
28,330,022 |
||||||||||
| |
|
|
|
|
|
|
|
|
|
|
|
|
|
| ||||||
Three Months Ended March 31, 2020 | ||||||||||||||||||||
Real |
Private |
Hedge Fund |
Credit & |
Total | ||||||||||||||||
Estate |
Equity |
Solutions |
Insurance |
Segments | ||||||||||||||||
| Management and Advisory Fees, Net |
||||||||||||||||||||
| Base Management Fees |
$ |
371,438 |
$ |
253,974 |
$ |
139,656 |
$ |
145,328 |
$ |
910,396 |
||||||||||
| Transaction, Advisory and Other Fees, Net |
23,024 |
21,413 |
758 |
5,470 |
50,665 |
|||||||||||||||
| Management Fee Offsets |
(8,341 |
) |
(9,215 |
) |
(42 |
) |
(2,896 |
) |
(20,494 |
) | ||||||||||
| |
|
|
|
|
|
|
|
|
|
|
|
|
|
| ||||||
| Total Management and Advisory Fees, Net |
386,121 |
266,172 |
140,372 |
147,902 |
940,567 |
|||||||||||||||
| Fee Related Performance Revenues |
4,551 |
— |
— |
7,915 |
12,466 |
|||||||||||||||
| Fee Related Compensation |
(120,296 |
) |
(110,368 |
) |
(46,191 |
) |
(69,409 |
) |
(346,264 |
) | ||||||||||
| Other Operating Expenses |
(40,476 |
) |
(41,001 |
) |
(18,667 |
) |
(38,741 |
) |
(138,885 |
) | ||||||||||
| |
|
|
|
|
|
|
|
|
|
|
|
|
|
| ||||||
| Fee Related Earnings |
229,900 |
114,803 |
75,514 |
47,667 |
467,884 |
|||||||||||||||
| |
|
|
|
|
|
|
|
|
|
|
|
|
|
| ||||||
| Realized Performance Revenues |
43,720 |
112,076 |
1,767 |
9,670 |
167,233 |
|||||||||||||||
| Realized Performance Compensation |
(13,392 |
) |
(54,643 |
) |
(945 |
) |
(2,322 |
) |
(71,302 |
) | ||||||||||
| Realized Principal Investment Income |
7,300 |
10,347 |
(609 |
) |
3,252 |
20,290 |
||||||||||||||
| |
|
|
|
|
|
|
|
|
|
|
|
|
|
| ||||||
| Total Net Realizations |
37,628 |
67,780 |
213 |
10,600 |
116,221 |
|||||||||||||||
| |
|
|
|
|
|
|
|
|
|
|
|
|
|
| ||||||
| Total Segment Distributable Earnings |
$ |
267,528 |
$ |
182,583 |
$ |
75,727 |
$ |
58,267 |
$ |
584,105 |
||||||||||
| |
|
|
|
|
|
|
|
|
|
|
|
|
|
| ||||||
51
The Blackstone Group Inc.
Notes to Condensed Consolidated Financial Statements (Unaudited) - Continued
(All Dollars are in Thousands, Except Share and Per Share Data, Except Where Noted)
Reconciliations of Total Segment Amounts
The following tables reconcile the Total Segment Revenues, Expenses and Distributable Earnings to their equivalent GAAP measure for the three months ended March 31, 2021 and 2020 along with Total Assets as of March 31, 2021:
Three Months Ended | ||||||||
March 31, | ||||||||
2021 |
2020 | |||||||
Revenues |
||||||||
Total GAAP Revenues |
$ |
5,298,872 |
$ |
(3,075,964 |
) | |||
Less: Unrealized Performance Revenues (a) |
(2,464,497 |
) |
3,453,446 |
|||||
Less: Unrealized Principal Investment (Income) Loss (b) |
(423,934 |
) |
616,610 |
|||||
Less: Interest and Dividend Revenue (c) |
(31,412 |
) |
(37,599 |
) | ||||
Less: Other Revenue (d) |
(60,273 |
) |
(138,151 |
) | ||||
Impact of Consolidation (e) |
(269,316 |
) |
321,118 |
|||||
Amortization of Intangibles (f) |
— |
387 |
||||||
Transaction-Related Charges (g) |
(3,623 |
) |
(830 |
) | ||||
Intersegment Eliminations |
1,035 |
1,539 |
||||||
Total Segment Revenue (h) |
$ |
2,046,852 |
$ |
1,140,556 |
||||
Three Months Ended March 31, | ||||||||
2021 |
2020 | |||||||
Expenses |
||||||||
Total GAAP Expenses |
$ |
2,051,447 |
$ |
(638,075 |
) | |||
Less: Unrealized Performance Allocations Compensation (i) |
(1,049,969 |
) |
1,397,378 |
|||||
Less: Equity-Based Compensation (j) |
(144,272 |
) |
(87,472 |
) | ||||
Less: Interest Expense (k) |
(44,340 |
) |
(41,540 |
) | ||||
Impact of Consolidation (e) |
(5,100 |
) |
(11,459 |
) | ||||
Amortization of Intangibles (f) |
(17,124 |
) |
(16,096 |
) | ||||
Transaction-Related Charges (g) |
(31,511 |
) |
(47,824 |
) | ||||
Administrative Fee Adjustment (l) |
(2,708 |
) |
— |
|||||
Intersegment Eliminations |
1,035 |
1,539 |
||||||
Total Segment Expenses (m) |
$ |
757,458 |
$ |
556,451 |
||||
Three Months Ended March 31, | ||||||||
2021 |
2020 | |||||||
Other Income |
||||||||
Total GAAP Other Income |
$ |
123,263 |
$ |
(327,969 |
) | |||
Impact of Consolidation (e) |
(123,263 |
) |
327,969 |
|||||
Total Segment Other Income |
$ |
— |
$ |
— |
||||
52
The Blackstone Group Inc.
Notes to Condensed Consolidated Financial Statements (Unaudited) - Continued
(All Dollars are in Thousands, Except Share and Per Share Data, Except Where Noted)
Three Months Ended March 31, | ||||||||
2021 |
2020 | |||||||
Income (Loss) Before Benefit for Taxes |
||||||||
Total GAAP Income (Loss) Before Benefit for Taxes |
$ |
3,370,688 |
$ |
(2,765,858 |
) | |||
Less: Unrealized Performance Revenues (a) |
(2,464,497 |
) |
3,453,446 |
|||||
Less: Unrealized Principal Investment (Income) Loss (b) |
(423,934 |
) |
616,610 |
|||||
Less: Interest and Dividend Revenue (c) |
(31,412 |
) |
(37,599 |
) | ||||
Less: Other Revenue (d) |
(60,273 |
) |
(138,151 |
) | ||||
Plus: Unrealized Performance Allocations Compensation (i) |
1,049,969 |
(1,397,378 |
) | |||||
Plus: Equity-Based Compensation (j) |
144,272 |
87,472 |
||||||
Plus: Interest Expense (k) |
44,340 |
41,540 |
||||||
Impact of Consolidation (e) |
(387,479 |
) |
660,546 |
|||||
Amortization of Intangibles (f) |
17,124 |
16,483 |
||||||
Transaction-Related Charges (g) |
27,888 |
46,994 |
||||||
Administrative Fee Adjustment (l) |
2,708 |
— |
||||||
Total Segment Distributable Earnings |
$ |
1,289,394 |
$ |
584,105 |
||||
As of March 31, 2021 | ||||
Total Assets |
||||
Total GAAP Assets |
$ |
29,709,986 |
||
Impact of Consolidation (e) |
(1,379,964 |
) | ||
Total Segment Assets |
$ |
28,330,022 |
||
Segment basis presents revenues and expenses on a basis that deconsolidates the investment funds Blackstone manages and excludes the amortization of intangibles and Transaction-Related Charges.
| (a) | This adjustment removes Unrealized Performance Revenues on a segment basis. |
| (b) | This adjustment removes Unrealized Principal Investment Income (Loss) on a segment basis. |
| (c) | This adjustment removes Interest and Dividend Revenue on a segment basis. |
| (d) | This adjustment removes Other Revenue on a segment basis. For the three months ended March 31, 2021 and 2020, Other Revenue on a GAAP basis was $60.3 million and $138.2 million, and included $59.5 million and $136.9 million of foreign exchange gains (losses), respectively. |
| (e) | This adjustment reverses the effect of consolidating Blackstone Funds, which are excluded from Blackstone’s segment presentation. This adjustment includes the elimination of Blackstone’s interest in these funds, the removal of revenue from the reimbursement of certain expenses by the Blackstone Funds, which are presented gross under GAAP but netted against Management and Advisory Fees, Net in the Total Segment measures, and the removal of amounts associated with the ownership of Blackstone consolidated operating partnerships held by non-controlling interests. |
| (f) | This adjustment removes the amortization of transaction-related intangibles, which are excluded from Blackstone’s segment presentation. This amount includes amortization of intangibles associated with Blackstone’s investment in Pátria, which was historically accounted for under the equity method. As a result of Pátria’s IPO in January 2021, equity method has been discontinued and there will no longer be amortization of intangibles associated with the investment. |
53
The Blackstone Group Inc.
Notes to Condensed Consolidated Financial Statements (Unaudited) - Continued
(All Dollars are in Thousands, Except Share and Per Share Data, Except Where Noted)
| (g) | This adjustment removes Transaction-Related Charges, which are excluded from Blackstone’s segment presentation. Transaction-Related Charges arise from corporate actions including acquisitions, divestitures, and Blackstone’s initial public offering. They consist primarily of equity-based compensation charges, gains and losses on contingent consideration arrangements, changes in the balance of the Tax Receivable Agreement resulting from a change in tax law or similar event, transaction costs and any gains or losses associated with these corporate actions. |
| (h) | Total Segment Revenues is comprised of the following: |
Three Months Ended | ||||||||
March 31, | ||||||||
2021 |
2020 | |||||||
Total Segment Management and Advisory Fees, Net |
$ |
1,178,205 |
$ |
940,567 |
||||
Total Segment Fee Related Performance Revenues |
169,168 |
12,466 |
||||||
Total Segment Realized Performance Revenues |
401,323 |
167,233 |
||||||
Total Segment Realized Principal Investment Income |
298,156 |
20,290 |
||||||
Total Segment Revenues |
$ |
2,046,852 |
$ |
1,140,556 |
||||
| (i) | This adjustment removes Unrealized Performance Allocations Compensation. |
| (j) | This adjustment removes Equity-Based Compensation on a segment basis. |
| (k) | This adjustment adds back Interest Expense on a segment basis, excluding interest expense related to the Tax Receivable Agreement. |
| (l) | This adjustment adds an amount equal to an administrative fee collected on a quarterly basis from certain holders of Blackstone Holdings Partnership Units. The administrative fee is accounted for as a capital contribution under GAAP, but is reflected as a reduction of Other Operating Expenses in Blackstone’s segment presentation. |
| (m) | Total Segment Expenses is comprised of the following: |
Three Months Ended | ||||||||
March 31, | ||||||||
2021 |
2020 | |||||||
Total Segment Fee Related Compensation |
$ |
445,110 |
$ |
346,264 |
||||
Total Segment Realized Performance Compensation |
150,924 |
71,302 |
||||||
Total Segment Other Operating Expenses |
161,424 |
138,885 |
||||||
Total Segment Expenses |
$ |
757,458 |
$ |
556,451 |
||||
Reconciliations of Total Segment Components
The following tables reconcile the components of Total Segments to their equivalent GAAP measures, reported on the Condensed Consolidated Statement of Operations for the three months ended March 31, 2021 and 2020:
Three Months Ended | ||||||||
March 31, | ||||||||
2021 |
2020 | |||||||
Management and Advisory Fees, Net |
||||||||
GAAP |
$ |
1,177,815 |
$ |
934,832 |
||||
Segment Adjustment (a) |
390 |
5,735 |
||||||
Total Segment |
$ |
1,178,205 |
$ |
940,567 |
||||
54
The Blackstone Group Inc.
Notes to Condensed Consolidated Financial Statements (Unaudited) - Continued
(All Dollars are in Thousands, Except Share and Per Share Data, Except Where Noted)
Three Months Ended | ||||||||
March 31, | ||||||||
2021 |
2020 | |||||||
GAAP Realized Performance Revenues to Total Segment Fee Related Performance Revenues |
||||||||
GAAP |
||||||||
Incentive Fees |
$ |
36,124 |
$ |
12,161 |
||||
Investment Income - Realized Performance Allocations |
534,367 |
167,530 |
||||||
GAAP |
570,491 |
179,691 |
||||||
Total Segment |
||||||||
Less: Realized Performance Revenues |
(401,323 |
) |
(167,233 |
) | ||||
Segment Adjustment (b) |
— |
8 |
||||||
Total Segment |
$ |
169,168 |
$ |
12,466 |
||||
Three Months Ended | ||||||||
March 31, | ||||||||
2021 |
2020 | |||||||
GAAP Compensation to Total Segment Fee Related Compensation |
||||||||
GAAP |
||||||||
Compensation |
$ |
542,638 |
$ |
476,543 |
||||
Incentive Fee Compensation |
13,325 |
6,522 |
||||||
Realized Performance Allocations Compensation |
213,027 |
72,423 |
||||||
GAAP |
768,990 |
555,488 |
||||||
Total Segment |
||||||||
Less: Realized Performance Compensation |
(150,924 |
) |
(71,302 |
) | ||||
Less: Equity-Based Compensation - Operating Compensation |
(141,674 |
) |
(85,334 |
) | ||||
Less: Equity-Based Compensation - Performance Compensation |
(2,598 |
) |
(2,138 |
) | ||||
Segment Adjustment (c) |
(28,684 |
) |
(50,450 |
) | ||||
Total Segment |
$ |
445,110 |
$ |
346,264 |
||||
Three Months Ended | ||||||||
March 31, | ||||||||
2021 |
2020 | |||||||
GAAP General, Administrative and Other to Total Segment Other Operating Expenses |
||||||||
GAAP |
$ |
185,122 |
$ |
157,566 |
||||
Segment Adjustment (d) |
(23,698 |
) |
(18,681 |
) | ||||
Total Segment |
$ |
161,424 |
$ |
138,885 |
||||
55
The Blackstone Group Inc.
Notes to Condensed Consolidated Financial Statements (Unaudited) - Continued
(All Dollars are in Thousands, Except Share and Per Share Data, Except Where Noted)
Three Months Ended | ||||||||
March 31, | ||||||||
2021 |
2020 | |||||||
Realized Performance Revenues |
||||||||
GAAP |
||||||||
Incentive Fees |
$ |
36,124 |
$ |
12,161 |
||||
Investment Income - Realized Performance Allocations |
534,367 |
167,530 |
||||||
GAAP |
570,491 |
179,691 |
||||||
Total Segment |
||||||||
Less: Fee Related Performance Revenues |
(169,168 |
) |
(12,466 |
) | ||||
Segment Adjustment (b) |
— |
8 |
||||||
Total Segment |
$ |
401,323 |
$ |
167,233 |
||||
Three Months Ended | ||||||||
March 31, | ||||||||
2021 |
2020 | |||||||
Realized Performance Compensation |
||||||||
GAAP |
||||||||
Incentive Fee Compensation |
$ |
13,325 |
$ |
6,522 |
||||
Realized Performance Allocation Compensation |
213,027 |
72,423 |
||||||
GAAP |
226,352 |
78,945 |
||||||
Total Segment |
||||||||
Less: Fee Related Performance Compensation |
(72,830 |
) |
(5,505 |
) | ||||
Less: Equity-Based Compensation - Performance Compensation |
(2,598 |
) |
(2,138 |
) | ||||
Total Segment |
$ |
150,924 |
$ |
71,302 |
||||
Three Months Ended | ||||||||
March 31, | ||||||||
2021 |
2020 | |||||||
Realized Principal Investment Income |
||||||||
GAAP |
$ |
355,038 |
$ |
48,695 |
||||
Segment Adjustment (e) |
(56,882 |
) |
(28,405 |
) | ||||
Total Segment |
$ |
298,156 |
$ |
20,290 |
||||
Segment basis presents revenues and expenses on a basis that deconsolidates the investment funds Blackstone manages and excludes the amortization of intangibles, the expense of equity-based awards and Transaction-Related Charges.
| (a) | Represents (1) the add back of net management fees earned from consolidated Blackstone Funds which have been eliminated in consolidation, and (2) the removal of revenue from the reimbursement of certain expenses by the Blackstone Funds, which are presented gross under GAAP but netted against Management and Advisory Fees, Net in the Total Segment measures. |
| (b) | Represents the add back of Performance Revenues earned from consolidated Blackstone Funds which have been eliminated in consolidation. |
| (c) | Represents the removal of Transaction-Related Charges that are not recorded in the Total Segment measures. |
56
The Blackstone Group Inc.
Notes to Condensed Consolidated Financial Statements (Unaudited) - Continued
(All Dollars are in Thousands, Except Share and Per Share Data, Except Where Noted)
| (d) | Represents the removal of (1) the amortization of transaction-related intangibles, and (2) certain expenses reimbursed by the Blackstone Funds, which are presented gross under GAAP but netted against Management and Advisory Fees, Net in the Total Segment measures. The three months ended March 31, 2021 includes a reduction equal to an administrative fee collected on a quarterly basis from certain holders of Blackstone Holdings Partnership Units which is accounted for as a capital contribution under GAAP, but is reflected as a reduction of Other Operating Expenses in Blackstone’s segment presentation. |
| (e) | Represents (1) the add back of Principal Investment Income, including general partner income, earned from consolidated Blackstone Funds which have been eliminated in consolidation, and (2) the removal of amounts associated with the ownership of Blackstone consolidated operating partnerships held by non-controlling interests. |
19. Subsequent Events
There have been no events since March 31, 2021 that require recognition or disclosure in the Condensed Consolidated Financial Statements.
57
Item 1A. Unaudited Supplemental Presentation of Statements of Financial Condition
The Blackstone Group Inc.
Unaudited Consolidating Statements of Financial Condition
(Dollars in Thousands)
March 31, 2021 | ||||||||||||||||
Consolidated |
Consolidated |
|||||||||||||||
Operating |
Blackstone |
Reclasses and |
||||||||||||||
Partnerships |
Funds (a) |
Eliminations |
Consolidated | |||||||||||||
| Assets |
|
|||||||||||||||
| Cash and Cash Equivalents |
$ |
2,862,422 |
$ |
— |
$ |
— |
$ |
2,862,422 |
||||||||
| Cash Held by Blackstone Funds and Other |
— |
109,285 |
— |
109,285 |
||||||||||||
| Investments |
16,762,080 |
1,459,804 |
(278,575 |
) |
17,943,309 |
|||||||||||
| Accounts Receivable |
887,050 |
88,560 |
— |
975,610 |
||||||||||||
| Due from Affiliates |
3,015,102 |
11,139 |
(10,923 |
) |
3,015,318 |
|||||||||||
| Intangible Assets, Net |
340,478 |
— |
— |
340,478 |
||||||||||||
| Goodwill |
1,890,185 |
— |
— |
1,890,185 |
||||||||||||
| Other Assets |
433,801 |
674 |
— |
434,475 |
||||||||||||
| Right-of-Use Assets |
736,633 |
— |
— |
736,633 |
||||||||||||
| Deferred Tax Assets |
1,402,271 |
— |
— |
1,402,271 |
||||||||||||
| |
|
|
|
|
|
|
|
|
|
|
| |||||
| Total Assets |
$ |
28,330,022 |
$ |
1,669,462 |
$ |
(289,498 |
) |
$ |
29,709,986 |
|||||||
| |
|
|
|
|
|
|
|
|
|
|
| |||||
| Liabilities and Equity |
||||||||||||||||
| Loans Payable |
$ |
5,573,865 |
$ |
100 |
$ |
— |
$ |
5,573,965 |
||||||||
| Due to Affiliates |
1,076,037 |
96,660 |
(10,922 |
) |
1,161,775 |
|||||||||||
| Accrued Compensation and Benefits |
4,376,226 |
— |
— |
4,376,226 |
||||||||||||
| Securities Sold, Not Yet Purchased |
9,224 |
23,936 |
— |
33,160 |
||||||||||||
| Repurchase Agreements |
— |
58,050 |
— |
58,050 |
||||||||||||
| Operating Lease Liabilities |
842,692 |
— |
— |
842,692 |
||||||||||||
| Accounts Payable, Accrued Expenses and Other Liabilities |
784,391 |
54,539 |
— |
838,930 |
||||||||||||
| |
|
|
|
|
|
|
|
|
|
|
| |||||
| Total Liabilities |
12,662,435 |
233,285 |
(10,922 |
) |
12,884,798 |
|||||||||||
| |
|
|
|
|
|
|
|
|
|
|
| |||||
| Redeemable Non-Controlling Interests in Consolidated Entities |
22,000 |
43,546 |
— |
65,546 |
||||||||||||
| |
|
|
|
|
|
|
|
|
|
|
| |||||
| Equity |
||||||||||||||||
| Common Stock |
7 |
— |
— |
7 |
||||||||||||
| Series I Preferred Stock |
— |
— |
— |
— |
||||||||||||
| Series II Preferred Stock |
— |
— |
— |
— |
||||||||||||
| Additional Paid-in-Capital |
6,446,829 |
268,008 |
(268,008 |
) |
6,446,829 |
|||||||||||
| Retained Earnings |
1,408,768 |
10,568 |
(10,568 |
) |
1,408,768 |
|||||||||||
| Accumulated Other Comprehensive Loss |
(11,454 |
) |
— |
— |
(11,454 |
) | ||||||||||
| Non-Controlling Interests in Consolidated Entities |
3,276,539 |
1,114,055 |
— |
4,390,594 |
||||||||||||
| Non-Controlling Interests in Blackstone Holdings |
4,524,898 |
— |
— |
4,524,898 |
||||||||||||
| |
|
|
|
|
|
|
|
|
|
|
| |||||
| Total Equity |
15,645,587 |
1,392,631 |
(278,576 |
) |
16,759,642 |
|||||||||||
| |
|
|
|
|
|
|
|
|
|
|
| |||||
| Total Liabilities and Equity |
$ |
28,330,022 |
$ |
1,669,462 |
$ |
(289,498 |
) |
$ |
29,709,986 |
|||||||
| |
|
|
|
|
|
|
|
|
|
|
| |||||
58
The Blackstone Group Inc.
Unaudited Consolidating Statements of Financial Condition - Continued
(Dollars in Thousands)
December 31, 2020 | ||||||||||||||||
Consolidated |
Consolidated |
|||||||||||||||
Operating |
Blackstone |
Reclasses and |
||||||||||||||
Partnerships |
Funds (a) |
Eliminations |
Consolidated | |||||||||||||
| Assets |
||||||||||||||||
| Cash and Cash Equivalents |
$ |
1,999,484 |
$ |
— |
$ |
— |
$ |
1,999,484 |
||||||||
| Cash Held by Blackstone Funds and Other |
— |
64,972 |
— |
64,972 |
||||||||||||
| Investments |
14,425,035 |
1,455,008 |
(262,901 |
) |
15,617,142 |
|||||||||||
| Accounts Receivable |
746,059 |
120,099 |
— |
866,158 |
||||||||||||
| Due from Affiliates |
3,224,522 |
10,001 |
(13,008 |
) |
3,221,515 |
|||||||||||
| Intangible Assets, Net |
347,955 |
— |
— |
347,955 |
||||||||||||
| Goodwill |
1,901,485 |
— |
— |
1,901,485 |
||||||||||||
| Other Assets |
480,760 |
262 |
— |
481,022 |
||||||||||||
| Right-of-Use Assets |
526,943 |
— |
— |
526,943 |
||||||||||||
| Deferred Tax Assets |
1,242,576 |
— |
— |
1,242,576 |
||||||||||||
| |
|
|
|
|
|
|
|
|
|
|
| |||||
| Total Assets |
$ |
24,894,819 |
$ |
1,650,342 |
$ |
(275,909 |
) |
$ |
26,269,252 |
|||||||
| |
|
|
|
|
|
|
|
|
|
|
| |||||
| Liabilities and Equity |
||||||||||||||||
| Loans Payable |
$ |
5,644,554 |
$ |
99 |
$ |
— |
$ |
5,644,653 |
||||||||
| Due to Affiliates |
1,070,955 |
77,095 |
(13,009 |
) |
1,135,041 |
|||||||||||
| Accrued Compensation and Benefits |
3,433,260 |
— |
— |
3,433,260 |
||||||||||||
| Securities Sold, Not Yet Purchased |
9,324 |
41,709 |
— |
51,033 |
||||||||||||
| Repurchase Agreements |
— |
76,808 |
— |
76,808 |
||||||||||||
| Operating Lease Liabilities |
620,844 |
— |
— |
620,844 |
||||||||||||
| Accounts Payable, Accrued Expenses and Other Liabilities |
679,883 |
37,221 |
— |
717,104 |
||||||||||||
| |
|
|
|
|
|
|
|
|
|
|
| |||||
| Total Liabilities |
11,458,820 |
232,932 |
(13,009 |
) |
11,678,743 |
|||||||||||
| |
|
|
|
|
|
|
|
|
|
|
| |||||
| Redeemable Non-Controlling Interests in Consolidated Entities |
21,999 |
43,162 |
— |
65,161 |
||||||||||||
| |
|
|
|
|
|
|
|
|
|
|
| |||||
| Equity |
||||||||||||||||
| Common Stock |
7 |
— |
— |
7 |
||||||||||||
| Series I Preferred Stock |
— |
— |
— |
— |
||||||||||||
| Series II Preferred Stock |
— |
— |
— |
— |
||||||||||||
| Additional Paid-in-Capital |
6,332,105 |
269,235 |
(269,235 |
) |
6,332,105 |
|||||||||||
| Retained Earnings |
335,762 |
(6,335 |
) |
6,335 |
335,762 |
|||||||||||
| Accumulated Other Comprehensive Loss |
(15,831 |
) |
— |
— |
(15,831 |
) | ||||||||||
| Non-Controlling Interests in Consolidated Entities |
2,930,809 |
1,111,348 |
— |
4,042,157 |
||||||||||||
| Non-Controlling Interests in Blackstone Holdings |
3,831,148 |
— |
— |
3,831,148 |
||||||||||||
| |
|
|
|
|
|
|
|
|
|
|
| |||||
| Total Equity |
13,414,000 |
1,374,248 |
(262,900 |
) |
14,525,348 |
|||||||||||
| |
|
|
|
|
|
|
|
|
|
|
| |||||
| Total Liabilities and Equity |
$ |
24,894,819 |
$ |
1,650,342 |
$ |
(275,909 |
) |
$ |
26,269,252 |
|||||||
| |
|
|
|
|
|
|
|
|
|
|
| |||||
| (a) | The Consolidated Blackstone Funds consisted of the following: |
Blackstone / GSO Global Dynamic Credit Feeder Fund (Cayman) LP
Blackstone / GSO Global Dynamic Credit Funding Designated Activity Company
Blackstone / GSO Global Dynamic Credit Master Fund
59
Blackstone / GSO Global Dynamic Credit USD Feeder Fund (Ireland)
Blackstone Real Estate Special Situations Holdings L.P.
Blackstone Strategic Alliance Fund L.P.
BTD CP Holdings LP
Mezzanine side-by-side investment vehicles
Private equity side-by-side investment vehicles
Real estate side-by-side investment vehicles
Hedge Fund Solutions side-by-side investment vehicles.
Item 2. Management’s Discussion and Analysis of Financial Condition and Results of Operations
The following discussion and analysis should be read in conjunction with The Blackstone Group Inc.’s condensed consolidated financial statements and the related notes included in this Quarterly Report on
Form 10-Q.
In this report, references to “Blackstone,” the “Company,” “we,” “us” or “our” refer to The Blackstone Group Inc. and its consolidated subsidiaries.
Effective February 26, 2021, Blackstone effectuated changes to rename its Class A common stock as “common stock,” and to reclassify its Class B and Class C common stock into a new “Series I preferred stock” and “Series II preferred stock,” respectively (the “share reclassification”). Each new stock has the same rights and powers of its predecessor. All references to common stock, Series I preferred stock and Series II preferred stock prior to the share reclassification refer to Class A, Class B and Class C common stock, respectively. See “— Organizational Structure.”
Our Business
Blackstone is one of the world’s leading investment firms. Our business is organized into four segments:
| • | Real Estate. |
Our Blackstone Real Estate Partners (“BREP”) funds are geographically diversified and target a broad range of “opportunistic” real estate and real estate-related investments. The BREP funds include global funds as well as funds focused specifically on Europe or Asia investments. BREP seeks to invest thematically in high-quality assets, focusing where we see outsized growth potential driven by global economic and demographic trends. BREP has made significant investments in logistics, office, rental housing, hospitality and retail properties around the world, as well as a variety of real estate operating companies.
Our Blackstone Real Estate Debt Strategies (“BREDS”) vehicles primarily target real estate-related debt investment opportunities. BREDS’ scale and investment mandates enable it to provide a variety of lending and investment options including commercial real estate and mezzanine loans, residential mortgage loan pools and liquid real estate-related debt securities. The BREDS platform includes a number of high-yield real estate debt funds, liquid real estate debt funds and BXMT, a NYSE-listed real estate investment trust (“REIT”).
Blackstone Real Estate began its Core+ strategy in 2013. Blackstone’s Core+ strategy invests in substantially stabilized real estate globally through regional open-ended funds focused on high-quality assets, the Blackstone Property Partners funds (“BPP”), and Blackstone Real Estate Income Trust, Inc. (“BREIT”), a non-listed REIT which was launched in 2017 and invests in U.S. income-generating assets. In November 2020, we launched Blackstone BioMed Life Science Real Estate L.P. (“BPP Life Sciences”), a long-term, perpetual capital, core+ return fund that owns BioMed Realty and is focused on life science office investments primarily across the U.S.
60
| • | Private Equity. |
We are a global leader in private equity investing. Our corporate private equity business, established in 1987, pursues transactions across industries in both established and growth-oriented businesses across the globe. It strives to create value by investing in great businesses where our capital, strategic insight, global relationships and operational support can drive transformation. Our core private equity funds target control-oriented investments in high quality companies with durable businesses and seek to offer a lower level of risk and a longer hold period than traditional private equity.
Tactical Opportunities invests globally across asset classes, industries and geographies, seeking to identify and execute on attractive, differentiated investment opportunities, leveraging the intellectual capital across our various businesses while continuously optimizing its approach in the face of ever-changing market conditions. Strategic Partners is a total fund solutions provider that acquires interests in high-quality private funds from original holders seeking liquidity, makes primary investments and co-investments with financial sponsors and provides investment advisory services to clients investing in primary and secondary investments in private funds and co-investments. BIP focuses on investments across all infrastructure sectors, including energy infrastructure, transportation, digital infrastructure, and water and waste with a primary focus in the U.S. BXLS is our private investment platform with capabilities to invest across the life cycle of companies and products within the life sciences sector. BXG seeks to deliver attractive risk-adjusted returns by investing in dynamic, growth-stage businesses, with a focus on the consumer, enterprise solutions, financial services and healthcare sectors.
| • | Hedge Fund Solutions. |
| • | Credit & Insurance. |
BXC is organized into two overarching strategies: private credit and liquid credit. Private credit strategies include mezzanine lending funds, middle market direct lending funds (including Blackstone Secured Lending Fund (“BXSL”) and Blackstone Private Credit Fund (“BCRED”), both of which are business development companies (“BDCs”)), our structured products group, stressed/distressed strategies (including stressed/distressed funds and credit alpha strategies) and energy strategies. Liquid credit strategies consist of CLOs, closed-ended funds, open-ended funds and separately managed accounts.
61
Our Credit & Insurance segment includes our insurer-focused platform, Blackstone Insurance Solutions (“BIS”). BIS focuses on providing full investment management services for insurers’ general accounts, delivering customized and diversified portfolios that include allocations to Blackstone managed products and strategies across asset classes and Blackstone’s private credit origination capabilities. BIS provides its clients tailored portfolio construction and strategic asset allocation, seeking to generate risk-managed, capital-efficient returns, diversification and capital preservation that meets clients’ objectives. BIS also provides similar services to clients through separately managed accounts or by sub-managing assets for certain insurance-dedicated funds and special purpose vehicles.
Our Credit & Insurance segment also includes our publicly traded midstream energy infrastructure and master limited partnership (“MLP”) investment platform, which is managed by Harvest Fund Advisors LLC (“Harvest”). Harvest primarily invests capital raised from institutional investors in separately managed accounts and pooled vehicles, investing in publicly traded energy infrastructure and MLPs holding primarily midstream energy assets in North America.
We generate revenue from fees earned pursuant to contractual arrangements with funds, fund investors and fund portfolio companies (including management, transaction and monitoring fees), and from capital markets services. We also invest in the funds we manage and we are entitled to a pro-rata share of the results of the fund (a “pro-rata allocation”). In addition to a pro-rata allocation, and assuming certain investment returns are achieved, we are entitled to a disproportionate allocation of the income otherwise allocable to the limited partners, commonly referred to as carried interest (“Performance Allocations”). In certain structures, we receive a contractual incentive fee from an investment fund in the event that specified cumulative investment returns are achieved (an “Incentive Fee,” and together with Performance Allocations, “Performance Revenues”). The composition of our revenues will vary based on market conditions and the cyclicality of the different businesses in which we operate. Net investment gains and investment income generated by the Blackstone Funds are driven by value created by our operating and strategic initiatives as well as overall market conditions. Fair values are affected by changes in the fundamentals of our portfolio company and other investments, the industries in which they operate, the overall economy and other market conditions.
Our Response to
COVID-19
As the novel coronavirus (“COVID-19”) pandemic has continued to evolve, our primary focus has been the safety and wellbeing of our employees and their families, as well as the seamless functioning of the firm in serving our limited partner investors who have entrusted us with their capital, and our shareholders. In accordance with local government guidance and social distancing recommendations, the majority of our employees globally have been working remotely. Our technology infrastructure has proven to be robust and capable of supporting this model. We have implemented rigorous protocols for remote work across the firm, including increased cadence of group calls and updates, and frequent communication across leadership and working levels. We are leveraging technology to ensure our teams stay connected and productive, and that our culture remains strong even in these unusual circumstances. While we are generally not meeting with our clients in person, we continue to actively communicate with our clients through videoconference, teleconference and email. Investment committees continue to convene as needed, and the firm continues to operate across investment, asset management and corporate support functions.
Since July 2020, employees in our U.S. and European offices began returning to the office on a voluntary basis, consistent with local government guidelines, with testing, contact-tracing and social distancing and other safety protocols in place. We continue to closely monitor applicable public health and government guidance and plan for a more extensive return to office in light of continued progress on vaccine production and distribution.
Business Environment
Blackstone’s businesses are materially affected by conditions in the financial markets and economic conditions in the U.S., Europe, Asia and, to a lesser extent, elsewhere in the world.
62
While the global recovery has been uneven, in the U.S. the first quarter of 2021 was generally characterized by a continuing rebound in global equity and credit markets as meaningful progress on
COVID-19
vaccine production and distribution and previously-implemented fiscal and monetary stimulus provided support to markets. Major U.S. equity market sectors posted positive returns in the first quarter. The S&P 500 energy sector appreciated the most, ending the quarter up 31%, while the S&P 500 finished the quarter up 6%. The price of West Texas Intermediate crude oil increased 22% in the first quarter to $59 per barrel, up 189% since the first quarter of 2020. The Bloomberg Commodity Index rose 7% in the first quarter. With over 50% of adults in the U.S. now having received at least one vaccine dose, continued progress on vaccine production and distribution is likely to support further acceleration of economic activity and recovery in the U.S., albeit with continued dispersion across sectors. Volatility continued to decline in the first quarter of 2021, with the CBOE Volatility Index ending the quarter down 15% to 19.4, marking a 64% decline over the last twelve months. Global equity issuance was strong in the first quarter, increasing 67% compared to the fourth quarter of 2020. Merger and acquisition activity continued to improve, with overall announced volumes up 114% year-over-year, and private equity transaction volumes up 21% year-over-year.
In credit markets, U.S. leveraged loans and high yield bonds increased 1.8% and 1.3%, respectively, in the first quarter. High yield spreads compressed 33 basis points in the first quarter, while issuance increased 117% year-over-year. The Federal Reserve maintained the federal funds target range at 0.0%-0.25%, the range set by the Federal Reserve in March 2020 in response to the effects of the
COVID-19
pandemic weighing on economic activity. The Federal Reserve has expanded its balance sheet since mid-February 2020 by more than $3.6 trillion to support new credit and liquidity facilities and expects to maintain the current pace of purchasing in the coming months. Three month LIBOR declined 4 basis points in the first quarter to 0.19%, remaining near historical lows. The U.S. Treasury yield curve steepened significantly in the first quarter, with ten-year yields rising 83 basis points to 1.74%, but declined to 1.59% subsequent to quarter-end. The annual U.S. inflation rate increased to 2.6% in March 2021, its highest level since August 2018, and up from 1.7% in February. The U.S. unemployment rate continued to decrease, ending March 2021 at 6.0%, well below the April 2020 peak of 14.8%, but still at elevated levels. Wages grew, with average hourly earnings increasing 4.2% year-over-year based on the three month average for production and nonsupervisory employees. U.S. retail sales increased 14% in March 2021 compared to December 2020 on a seasonally adjusted basis, and increased 27% since March 2020. The Institute for Supply Management Purchasing Managers’ Index increased in the first quarter, rising to 64.7 from 60.7 in the fourth quarter of 2020, which is the highest level since June 1984, signaling expansion in the U.S. manufacturing sector.
Countries around the world are, with some notable exceptions such as India, on a path of recovery after more than a year since the onset of the
COVID-19
pandemic. Nonetheless, the recovery could remain uneven across the globe, particularly given varying rates of vaccination in certain geographies. Notable Transactions
On January 26, 2021, Pátria completed its initial public offering (“IPO”), pursuant to which we sold a portion of our interest. As a result of Pátria’s pre-IPO reorganization transactions and the consummation of the IPO (collectively, the “Pátria Sale Transactions”), Blackstone discontinued the application of equity method as we were deemed to no longer have significant influence over Pátria due to Blackstone’s decreased ownership and lack of board representation. For additional information, see Note 4. “Investments — Equity Method Investments” in the “Notes to Condensed Consolidated Financial Statements” in “Part I. Item 1. Financial Statements.”
Effective February 26, 2021, Blackstone effectuated changes to its common stock as described in the immediately following section “Organizational Structure.”
Organizational Structure
Effective July 1, 2019, The Blackstone Group L.P. converted from a Delaware limited partnership to a Delaware corporation, The Blackstone Group Inc. (the “Conversion”).
63
Effective February 26, 2021, Blackstone effectuated changes to rename its Class A common stock as “common stock,” and to reclassify its Class B and Class C common stock into a new “Series I preferred stock” and “Series II preferred stock,” respectively. Each new stock has the same rights and powers of its predecessor. For additional information, see Note 1. “Organization” and Note 14. “Earnings Per Share and Stockholders’ Equity — Stockholders’ Equity” in the “Notes to Condensed Consolidated Financial Statements” in “— Item 1. Financial Statements” of this filing.
The simplified diagram below depicts our current organizational structure. The diagram does not depict all of our subsidiaries, including intermediate holding companies through which certain of the subsidiaries depicted are held.

Key Financial Measures and Indicators
We manage our business using certain financial measures and key operating metrics since we believe these metrics measure the productivity of our investment activities. We prepare our Condensed Consolidated Financial Statements in accordance with accounting principles generally accepted in the United States of America (“GAAP”). See Note 2. “Summary of Significant Accounting Policies” in the “Notes to Condensed Consolidated Financial Statements” in “Part I. Item 1. Financial Statements” and “— Critical Accounting Policies.” Our key non-GAAP financial measures and operating indicators and metrics are discussed below.
Distributable Earnings
Distributable Earnings is derived from Blackstone’s segment reported results. Distributable Earnings is used to assess performance and amounts available for dividends to Blackstone shareholders, including Blackstone personnel and others who are limited partners of the Blackstone Holdings Partnerships. Distributable Earnings is the sum of Segment Distributable Earnings plus Net Interest Income (Loss) less Taxes and Related Payables. Distributable Earnings excludes unrealized activity and is derived from and reconciled to, but not equivalent to, its most directly comparable GAAP measure of Income (Loss) Before Provision (Benefit) for Taxes. See “— Non-GAAP Financial Measures” for our reconciliation of Distributable Earnings.
64
Net Interest Income (Loss) is presented on a segment basis and is equal to Interest and Dividend Revenue less Interest Expense, adjusted for the impact of consolidation of Blackstone Funds, and interest expense associated with the Tax Receivable Agreement.
Taxes and Related Payables represent the total GAAP tax provision adjusted to include only the current tax provision (benefit) calculated on Income (Loss) Before Provision (Benefit) for Taxes and including the Payable under the Tax Receivable Agreement. Further, the current tax provision utilized when calculating Taxes and Related Payables and Distributable Earnings reflects the benefit of deductions available to the company on certain expense items that are excluded from the underlying calculation of Segment Distributable Earnings and Total Segment Distributable Earnings, such as equity-based compensation charges and certain Transaction-Related Charges where there is a current tax provision or benefit. The economic assumptions and methodologies that impact the implied income tax provision are the same as those methodologies and assumptions used in calculating the current income tax provision for Blackstone’s Condensed Consolidated Statements of Operations under GAAP, excluding the impact of divestitures and accrued tax contingencies and refunds which are reflected when paid or received. Management believes that including the amount payable under the tax receivable agreement and utilizing the current income tax provision adjusted as described above when calculating Distributable Earnings is meaningful as it increases comparability between periods and more accurately reflects earnings that are available for distribution to shareholders.
Segment Distributable Earnings
Segment Distributable Earnings is Blackstone’s segment profitability measure used to make operating decisions and assess performance across Blackstone’s four segments. Segment Distributable Earnings represents the net realized earnings of Blackstone’s segments and is the sum of Fee Related Earnings and Net Realizations for each segment. Blackstone’s segments are presented on a basis that deconsolidates Blackstone Funds, eliminates non-controlling ownership interests in Blackstone’s consolidated operating partnerships, removes the amortization of intangible assets and removes Transaction-Related Charges. Transaction-Related Charges arise from corporate actions including acquisitions, divestitures and Blackstone’s initial public offering. They consist primarily of equity-based compensation charges, gains and losses on contingent consideration arrangements, changes in the balance of the Tax Receivable Agreement resulting from a change in tax law or similar event, transaction costs and any gains or losses associated with these corporate actions. Segment Distributable Earnings excludes unrealized activity and is derived from and reconciled to, but not equivalent to, its most directly comparable GAAP measure of Income (Loss) Before Provision (Benefit) for Taxes. See “— Non-GAAP Financial Measures” for our reconciliation of Segment Distributable Earnings.
Net Realizations is presented on a segment basis and is the sum of Realized Principal Investment Income and Realized Performance Revenues (which refers to Realized Performance Revenues excluding Fee Related Performance Revenues), less Realized Performance Compensation (which refers to Realized Performance Compensation excluding Fee Related Performance Compensation and Equity-Based Performance Compensation).
Fee Related Earnings
Fee Related Earnings is a performance measure used to assess Blackstone’s ability to generate profits from revenues that are measured and received on a recurring basis and not subject to future realization events. Fee Related Earnings equals management and advisory fees (net of management fee reductions and offsets) plus Fee Related Performance Revenues, less (a) Fee Related Compensation on a segment basis, and (b) Other Operating Expenses. Fee Related Earnings is derived from and reconciled to, but not equivalent to, its most directly comparable GAAP measure of Income (Loss) Before Provision (Benefit) for Taxes. See “— Non-GAAP Financial Measures” for our reconciliation of Fee Related Earnings.
Fee Related Compensation is presented on a segment basis and refers to the compensation expense, excluding Equity-Based Compensation, directly related to (a) Management and Advisory Fees, Net and (b) Fee Related Performance Revenues, referred to as Fee Related Performance Compensation.
65
Fee Related Performance Revenues refers to the realized portion of Performance Revenues from Perpetual Capital that are (a) measured and received on a recurring basis, and (b) not dependent on realization events from the underlying investments.
Other Operating Expenses is presented on a segment basis and is equal to General, Administrative and Other Expenses, adjusted to (a) remove the amortization of transaction-related intangibles, (b) remove certain expenses reimbursed by the Blackstone Funds which are netted against Management and Advisory Fees, Net in Blackstone’s segment presentation, and (c) give effect to an administrative fee collected on a quarterly basis from certain holders of Blackstone Holdings Partnership Units. The administrative fee is accounted for as a capital contribution under GAAP, but is reflected as a reduction of Other Operating Expenses in Blackstone’s segment presentation.
Adjusted Earnings Before Interest, Taxes and Depreciation and Amortization
Adjusted Earnings Before Interest, Taxes and Depreciation and Amortization (“Adjusted EBITDA”), is a supplemental measure used to assess performance derived from Blackstone’s segment results and may be used to assess its ability to service its borrowings. Adjusted EBITDA represents Distributable Earnings plus the addition of (a) Interest Expense on a segment basis, (b) Taxes and Related Payables, and (c) Depreciation and Amortization. Adjusted EBITDA is derived from and reconciled to, but not equivalent to, its most directly comparable GAAP measure of Income (Loss) Before Provision (Benefit) for Taxes. See “— Non-GAAP Financial Measures” for our reconciliation of Adjusted EBITDA.
Operating Metrics
The alternative asset management business is primarily based on managing third party capital and does not require substantial capital investment to support rapid growth. Since our inception, we have developed and used various key operating metrics to assess and monitor the operating performance of our various alternative asset management businesses in order to monitor the effectiveness of our value creating strategies.
Assets Under Management.
| (a) | the fair value of the investments held by our carry funds and our side-by-side and co-investment entities managed by us plus the capital that we are entitled to call from investors in those funds and entities pursuant to the terms of their respective capital commitments, including capital commitments to funds that have yet to commence their investment periods, |
| (b) | the net asset value of (1) our hedge funds, real estate debt carry funds, BPP, certain co-investments managed by us, certain credit-focused funds, and our Hedge Fund Solutions drawdown funds (plus, in each case, the capital that we are entitled to call from investors in those funds, including commitments yet to commence their investment periods), and (2) our funds of hedge funds, our Hedge Fund Solutions registered investment companies, and BREIT, |
| (c) | the invested capital, fair value or net asset value of assets we manage pursuant to separately managed accounts, |
| (d) | the amount of debt and equity outstanding for our CLOs during the reinvestment period, |
| (e) | the aggregate par amount of collateral assets, including principal cash, for our CLOs after the reinvestment period, |
| (f) | the gross or net amount of assets (including leverage where applicable) for our credit-focused registered investment companies, |
| (g) | the fair value of common stock, preferred stock, convertible debt, term loans or similar instruments issued by BXMT, and |
| (h) | borrowings under and any amounts available to be borrowed under certain credit facilities of our funds. |
66
Our carry funds are commitment-based drawdown structured funds that do not permit investors to redeem their interests at their election. Our funds of hedge funds, hedge funds, funds structured like hedge funds and other open-ended funds in our Real Estate, Hedge Fund Solutions and Credit & Insurance segments generally have structures that afford an investor the right to withdraw or redeem their interests on a periodic basis (for example, annually or quarterly), typically with 30 to 95 days’ notice, depending on the fund and the liquidity profile of the underlying assets. Investment advisory agreements related to certain separately managed accounts in our Hedge Fund Solutions and Credit & Insurance segments, excluding our BIS separately managed accounts, may generally be terminated by an investor on 30 to 90 days’ notice.
Fee-Earning Assets Under Management
| (a) | for our Private Equity segment funds and Real Estate segment carry funds, including certain BREDS and Hedge Fund Solutions funds, the amount of capital commitments, remaining invested capital, fair value, net asset value or par value of assets held, depending on the fee terms of the fund, |
| (b) | for our credit-focused carry funds, the amount of remaining invested capital (which may include leverage) or net asset value, depending on the fee terms of the fund, |
| (c) | the remaining invested capital or fair value of assets held in co-investment vehicles managed by us on which we receive fees, |
| (d) | the net asset value of our funds of hedge funds, hedge funds, BPP, certain co-investments managed by us, certain registered investment companies, BREIT, and certain of our Hedge Fund Solutions drawdown funds, |
| (e) | the invested capital, fair value of assets or the net asset value we manage pursuant to separately managed accounts, |
| (f) | the net proceeds received from equity offerings and accumulated distributable earnings of BXMT, subject to certain adjustments, |
| (g) | the aggregate par amount of collateral assets, including principal cash, of our CLOs, and |
| (h) | the gross amount of assets (including leverage) or the net assets (plus leverage where applicable) for certain of our credit-focused registered investment companies. |
Each of our segments may include certain Fee-Earning Assets Under Management on which we earn performance revenues but not management fees.
Our calculations of assets under management and fee-earning assets under management may differ from the calculations of other asset managers, and as a result this measure may not be comparable to similar measures presented by other asset managers. In addition, our calculation of assets under management includes commitments to, and the fair value of, invested capital in our funds from Blackstone and our personnel, regardless of whether such commitments or invested capital are subject to fees. Our definitions of assets under management and fee-earning assets under management are not based on any definition of assets under management and fee-earning assets under management that is set forth in the agreements governing the investment funds that we manage.
For our carry funds, total assets under management includes the fair value of the investments held and uncalled capital commitments, whereas fee-earning assets under management may include the total amount of capital commitments or the remaining amount of invested capital at cost, depending on whether the investment period has expired or as specified by the fee terms of the fund. As such, in certain carry funds fee-earning assets under management may be greater than total assets under management when the aggregate fair value of the remaining investments is less than the cost of those investments.
67
Perpetual Capital
Dry Powder
Performance Eligible Assets Under Management
Consolidated Results of Operations
Following is a discussion of our consolidated results of operations for the three months ended March 31, 2021 and 2020. For a more detailed discussion of the factors that affected the results of our four business segments (which are presented on a basis that deconsolidates the investment funds we manage) in these periods, see “ —Segment Analysis” below.
68
The following table sets forth information regarding our consolidated results of operations and certain key operating metrics for the three months ended March 31, 2021 and 2020:
Three Months Ended |
||||||||||||||||
March 31, |
2021 vs. 2020 | |||||||||||||||
2021 |
2020 |
$ |
% | |||||||||||||
(Dollars in Thousands) | ||||||||||||||||
| Revenues |
||||||||||||||||
| Management and Advisory Fees, Net |
$ | 1,177,815 | $ | 934,832 | $ | 242,983 | 26 | % | ||||||||
| |
|
|
|
|
|
|
|
|
|
|
| |||||
| Incentive Fees |
36,124 | 12,161 | 23,963 | 197 | % | |||||||||||
| |
|
|
|
|
|
|
|
|
|
|
| |||||
| Investment Income (Loss) |
||||||||||||||||
| Performance Allocations |
||||||||||||||||
| Realized |
534,367 | 167,530 | 366,837 | 219 | % | |||||||||||
| Unrealized |
2,464,497 | (3,453,081 | ) | 5,917,578 | N/M | |||||||||||
| Principal Investments |
||||||||||||||||
| Realized |
355,038 | 48,695 | 306,343 | 629 | % | |||||||||||
| Unrealized |
639,315 | (959,365 | ) | 1,598,680 | N/M | |||||||||||
| |
|
|
|
|
|
|
|
|
|
|
| |||||
| Total Investment Income (Loss) |
3,993,217 | (4,196,221 | ) | 8,189,438 | N/M | |||||||||||
| |
|
|
|
|
|
|
|
|
|
|
| |||||
| Interest and Dividend Revenue |
31,412 | 35,084 | (3,672 | ) | -10 | % | ||||||||||
| Other |
60,304 | 138,180 | (77,876 | ) | -56 | % | ||||||||||
| |
|
|
|
|
|
|
|
|
|
|
| |||||
| Total Revenues |
5,298,872 | (3,075,964 | ) | 8,374,836 | N/M | |||||||||||
| |
|
|
|
|
|
|
|
|
|
|
| |||||
| Expenses |
||||||||||||||||
| Compensation and Benefits |
||||||||||||||||
| Compensation |
542,638 | 476,543 | 66,095 | 14 | % | |||||||||||
| Incentive Fee Compensation |
13,325 | 6,522 | 6,803 | 104 | % | |||||||||||
| Performance Allocations Compensation |
||||||||||||||||
| Realized |
213,027 | 72,423 | 140,604 | 194 | % | |||||||||||
| Unrealized |
1,049,969 | (1,397,378 | ) | 2,447,347 | N/M | |||||||||||
| |
|
|
|
|
|
|
|
|
|
|
| |||||
| Total Compensation and Benefits |
1,818,959 | (841,890 | ) | 2,660,849 | N/M | |||||||||||
| General, Administrative and Other |
185,122 | 157,566 | 27,556 | 17 | % | |||||||||||
| Interest Expense |
44,983 | 41,644 | 3,339 | 8 | % | |||||||||||
| Fund Expenses |
2,383 | 4,605 | (2,222 | ) | -48 | % | ||||||||||
| |
|
|
|
|
|
|
|
|
|
|
| |||||
| Total Expenses |
2,051,447 | (638,075 | ) | 2,689,522 | N/M | |||||||||||
| |
|
|
|
|
|
|
|
|
|
|
| |||||
| Other Income (Loss) |
||||||||||||||||
| Change in Tax Receivable Agreement Liability |
2,910 | (595 | ) | 3,505 | N/M | |||||||||||
| Net Gains (Losses) from Fund Investment Activities |
120,353 | (327,374 | ) | 447,727 | N/M | |||||||||||
| |
|
|
|
|
|
|
|
|
|
|
| |||||
| Total Other Income (Loss) |
123,263 | (327,969 | ) | 451,232 | N/M | |||||||||||
| |
|
|
|
|
|
|
|
|
|
|
| |||||
| Income (Loss) Before Benefit for Taxes |
3,370,688 | (2,765,858 | ) | 6,136,546 | N/M | |||||||||||
| Benefit for Taxes |
(447 | ) | (158,703 | ) | 158,256 | -100 | % | |||||||||
| |
|
|
|
|
|
|
|
|
|
|
| |||||
| Net Income (Loss) |
3,371,135 | (2,607,155 | ) | 5,978,290 | N/M | |||||||||||
| Net Income (Loss) Attributable to Redeemable Non-Controlling Interests in Consolidated Entities |
629 | (15,469 | ) | 16,098 | N/M | |||||||||||
| Net Income (Loss) Attributable to Non-Controlling Interests in Consolidated Entities |
386,850 | (645,077 | ) | 1,031,927 | N/M | |||||||||||
| Net Income (Loss) Attributable to Non-Controlling Interests in Blackstone Holdings |
1,235,784 | (880,117 | ) | 2,115,901 | N/M | |||||||||||
| |
|
|
|
|
|
|
|
|
|
|
| |||||
| Net Income (Loss) Attributable to The Blackstone Group Inc. |
$ | 1,747,872 | $ | (1,066,492 | ) | $ | 2,814,364 | N/M | ||||||||
| |
|
|
|
|
|
|
|
|
|
|
| |||||
N/M Not meaningful.
69
Three Months Ended March 31, 2021 Compared to Three Months Ended March 31, 2020
Revenues
Revenues were $5.3 billion for the three months ended March 31, 2021, an increase of $8.4 billion compared to $(3.1) billion for the three months ended March 31, 2020. The increase in Revenues was primarily attributable to an increase of $8.2 billion in Investment Income (Loss), which is composed of increases of $7.5 billion and $673.2 million in Unrealized and Realized Investment Income (Loss), respectively.
The $7.5 billion increase in Unrealized Investment Income (Loss) was primarily attributable to net unrealized appreciation of investment holdings in the three months ended March 31, 2021 compared to net unrealized depreciation of investment holdings in the three months ended March 31, 2020. Unrealized Investment Income (Loss) in our Private Equity, Real Estate, Credit & Insurance and Hedge Fund Solutions segments increased $3.9 billion, $2.0 billion, $682.8 million and $413.6 million, respectively. Principal drivers of these increases were:
| • | The increase in our Private Equity segment was primarily attributable to higher net unrealized appreciation of investment holdings in corporate private equity and Tactical Opportunities in the three months ended March 31, 2021 compared to the three months ended March 31, 2020. Corporate private equity carrying value increased 15.3% in the three months ended March 31, 2021 compared to a decrease of 21.6% in the three months ended March 31, 2020. Tactical Opportunities carrying value increased 15.1% in the three months ended March 31, 2021 compared to a decrease of 15.9% in the three months ended March 31, 2020. |
| • | The increase in our Real Estate segment was primarily attributable to higher net unrealized appreciation of investment holdings in our BREP opportunistic funds in the three months ended March 31, 2021 compared to the three months ended March 31, 2020. The carrying value of investments for our BREP opportunistic funds increased 5.3% in the three months ended March 31, 2021 compared to a decrease of 8.8% in the three months ended March 31, 2020. |
| • | The increase in our Credit & Insurance segment was primary attributable to net unrealized appreciation of investments in our private credit strategies in the three months ended March 31, 2021 compared to net unrealized depreciation in the three months ended March 31, 2020. |
| • | The increase in our Hedge Fund Solutions segment was primarily due to the net unrealized appreciation of investments of which Blackstone owns a share in the three months ended March 31, 2021 compared to net unrealized depreciation in the three months ended March 31, 2020. |
The $673.2 million increase in Realized Investment Income (Loss) was primarily attributable to higher realized gains in our Real Estate and Private Equity segments and the gain recognized in the Pátria Sale Transactions. For additional information, see “— Notable Transactions.”
Expenses
Expenses were $2.1 billion for the three months ended March 31, 2021, an increase of $2.7 billion compared to $(638.1) million for the three months ended March 31, 2020. The increase was primarily attributable to an increase of $2.7 billion in Total Compensation and Benefits, of which $2.6 billion was Performance Allocations Compensation. The increase in Performance Allocations Compensation was primarily due to the increase in Investment Income (Loss) – Performance Allocations, on which a portion of the compensation is based.
Other Income (Loss)
Other Income (Loss) was $123.3 million for the three months ended March 31, 2021, an increase of $451.2 million compared to $(328.0) million for the three months ended March 31, 2020. The increase in Other Income (Loss) was due to an increase of $447.7 million in Net Gains (Losses) from Fund Investment Activities.
70
The increase in Other Income (Loss) — Net Gains (Losses) from Fund Investment Activities was principally driven by increases of $173.3 million in our Credit & Insurance segment, $167.5 million in our Private Equity segment and $103.8 million in our Real Estate segment. The increase in our Credit & Insurance segment was primarily driven by the deconsolidation of nine CLO vehicles during the year ended December 31, 2020, as well as appreciation in our consolidated credit funds. See Note 9. “Variable Interest Entities” in the “Notes to Condensed Consolidated Financial Statements” in “Part I. Item 1. Financial Statements.” The increase in our Private Equity segment was primarily due to appreciation of investments in our consolidated private equity funds. The increase in our Real Estate segment was primarily due to appreciation of investments in our consolidated real estate funds.
Provision (Benefit) for Taxes
The following table summarizes Blackstone’s tax position:
Three Months Ended |
||||||||
March 31, |
||||||||
2021 |
2020 |
|||||||
(Dollars in Thousands) |
||||||||
| Income (Loss) Before Benefit for Taxes |
$ | 3,370,688 | $ | (2,765,858) | ||||
| Benefit for Taxes |
$ | (447 | ) | $ | (158,703) | |||
| Effective Income Tax Rate |
— | 5.7% | ||||||
The following table reconciles the effective income tax rate to the U.S. federal statutory tax rate:
Three Months Ended |
2021 |
|||||||||||
March 31, |
vs. |
|||||||||||
2021 |
2020 |
2020 |
||||||||||
| Statutory U.S. Federal Income Tax Rate |
21.0 | % | 21.0 | % | — | |||||||
| Income Passed Through to Non-Controlling Interest Holders (a) |
-9.0 | % | -13.1 | % | 4.1 | % | ||||||
| State and Local Income Taxes |
2.1 | % | 1.4 | % | 0.7 | % | ||||||
| Change in Valuation Allowance |
-12.9 | % | -4.3 | % | -8.6 | % | ||||||
| Other |
-1.2 |
% | 0.7 | % | -1.9 |
% | ||||||
| |
|
|
|
|
|
|||||||
| Effective Income Tax Rate |
— | 5.7 | % | -5.7 | % | |||||||
| |
|
|
|
|
|
|||||||
| (a) | Includes income that was not taxable to Blackstone and its subsidiaries. Such income remains taxable to Blackstone’s non-controlling interest holders. |
Blackstone’s Provision (Benefit) for Taxes for the three months ended March 31, 2021 and 2020 was $(0.4) million and $(158.7) million, respectively. This resulted in an effective tax rate of 0.0% and 5.7%, respectively, based on our Income (Loss) Before Provision (Benefit) for Taxes of $3.4 billion and $(2.8) billion.
The decrease in Blackstone’s effective tax rate for the three months ended March 31, 2021, compared to the three months ended March 31, 2020, resulted primarily from the increase in net reductions to the valuation allowance related to the step-up in the tax basis of investment assets, partially offset by a decrease in the attribution of a portion of reported net income (loss) before taxes to non-controlling interest holders.
Although Blackstone was a cash taxpayer for the three months ended March 31, 2021, unrealized gains on Investments resulted in the reduction of a previously recorded valuation allowance against Blackstone’s deferred tax asset. The reduction in the valuation
71
allowance is recorded as an income tax benefit on the consolidated statement of operations and thereby reduces the effective tax rate in the current period.
Additional information regarding our income taxes can be found in Note 13. “Income Taxes” in the “Notes to Condensed Consolidated Financial Statements” in “Part I. Item 1. Financial Statements” of this filing.
Non-Controlling Interests in Consolidated Entities
The Net Income Attributable to Redeemable Non-Controlling Interests in Consolidated Entities and Net Income Attributable to Non-Controlling Interests in Consolidated Entities is attributable to the consolidated Blackstone Funds. The amounts of these items vary directly with the performance of the consolidated Blackstone Funds and largely eliminate the amount of Other Income (Loss) – Net Gains (Losses) from Fund Investment Activities from the Net Income (Loss) Attributable to The Blackstone Group Inc.
Net Income Attributable to Non-Controlling Interests in Blackstone Holdings is derived from the Income Before Provision (Benefit) for Taxes at the Blackstone Holdings level, excluding the Net Gains (Losses) from Fund Investment Activities and the percentage allocation of the income between Blackstone personnel and others who are limited partners of Blackstone Holdings and Blackstone after considering any contractual arrangements that govern the allocation of income such as fees allocable to Blackstone.
For the three months ended March 31, 2021 and 2020, the Net Income Before Taxes allocated to Blackstone personnel and others who are limited partners of Blackstone Holdings was 41.8% and 41.5%, respectively. The increase of 0.3% was primarily due to the exclusion of unvested participating Blackstone Holdings Partnership Units, which are not contractually obligated to share in losses, during the three months ended March 31, 2020.
The Other Income (Loss) — Change in Tax Receivable Agreement Liability was entirely allocated to The Blackstone Group Inc.
72
Operating Metrics
The following graphs and tables summarize the Fee-Earning Assets Under Management by Segment and Total Assets Under Management by Segment, followed by a rollforward of activity for the three months ended March 31, 2021 and 2020. For a description of how Assets Under Management and Fee-Earning Assets Under Management are determined, please see “— Key Financial Measures and Indicators — Operating Metrics — Assets Under Management and Fee-Earning Assets Under Management”:
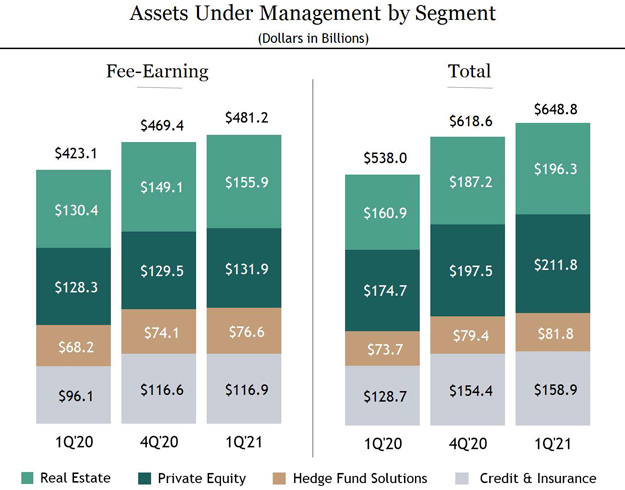
Note: Totals may not add due to rounding.
73
Three Months Ended | ||||||||||||||||||||||||||||||||||||||||
March 31, 2021 |
March 31, 2020 | |||||||||||||||||||||||||||||||||||||||
Private |
Hedge Fund |
Credit & |
Private |
Hedge Fund |
Credit & |
|||||||||||||||||||||||||||||||||||
Real Estate |
Equity |
Solutions |
Insurance |
Total |
Real Estate |
Equity |
Solutions |
Insurance |
Total | |||||||||||||||||||||||||||||||
(Dollars in Thousands) | ||||||||||||||||||||||||||||||||||||||||
| Fee-Earning Assets Under Management |
||||||||||||||||||||||||||||||||||||||||
| Balance, Beginning of Period |
$ | 149,121,461 | $ | 129,539,630 | $ | 74,126,610 | $ | 116,645,413 | $ | 469,433,114 | $ | 128,214,137 | $ | 97,773,964 | $ | 75,636,004 | $ | 106,450,747 | $ | 408,074,852 | ||||||||||||||||||||
| Inflows (a) |
8,561,177 | 4,468,621 | 2,005,986 | 8,186,651 | 23,222,435 | 9,428,789 | 35,326,030 | 2,366,963 | 3,635,845 | 50,757,627 | ||||||||||||||||||||||||||||||
| Outflows (b) |
(843,560 | ) | (608,021 | ) | (1,346,251 | ) | (5,115,877 | ) | (7,913,709 | ) | (1,010,896 | ) | (3,612,449 | ) | (2,651,992 | ) | (2,740,684 | ) | (10,016,021 | ) | ||||||||||||||||||||
| |
|
|
|
|
|
|
|
|
|
|
|
|
|
|
|
|
|
|
|
|
|
|
|
|
|
|
|
|
| |||||||||||
| Net Inflows (Outflows) |
7,717,617 | 3,860,600 | 659,735 | 3,070,774 | 15,308,726 | 8,417,893 | 31,713,581 | (285,029 | ) | 895,161 | 40,741,606 | |||||||||||||||||||||||||||||
| Realizations (c) |
(1,855,302 | ) | (3,071,179 | ) | (188,436 | ) | (3,247,204 | ) | (8,362,121 | ) | (2,697,761 | ) | (925,354 | ) | (134,730 | ) | (1,430,127 | ) | (5,187,972 | ) | ||||||||||||||||||||
| Market Activity (d)(g) |
868,018 | 1,574,296 | 2,016,297 | 387,077 | 4,845,688 | (3,509,807 | ) | (261,389 | ) | (7,001,810 | ) | (9,800,443 | ) | (20,573,449 | ) | |||||||||||||||||||||||||
| |
|
|
|
|
|
|
|
|
|
|
|
|
|
|
|
|
|
|
|
|
|
|
|
|
|
|
|
|
| |||||||||||
| Balance, End of Period (e) |
$ | 155,851,794 | $ | 131,903,347 | $ | 76,614,206 | $ | 116,856,060 | $ | 481,225,407 | $ | 130,424,462 | $ | 128,300,802 | $ | 68,214,435 | $ | 96,115,338 | $ | 423,055,037 | ||||||||||||||||||||
| |
|
|
|
|
|
|
|
|
|
|
|
|
|
|
|
|
|
|
|
|
|
|
|
|
|
|
|
|
| |||||||||||
| Increase (Decrease) |
$ | 6,730,333 | $ | 2,363,717 | $ | 2,487,596 | $ | 210,647 | $ | 11,792,293 | $ | 2,210,325 | $ | 30,526,838 | $ | (7,421,569 | ) | $ | (10,335,409 | ) | $ | 14,980,185 | ||||||||||||||||||
| Increase (Decrease) |
5 | % | 2 | % | 3 | % | — | 3 | % | 2 | % | 31 | % | -10 | % | -10 | % | 4 | % | |||||||||||||||||||||
| Annualized Base Management Fee Rate (f) |
1.12 | % | 1.16 | % | 0.80 | % | 0.55 | % | 0.94 | % | 1.15 | % | 0.90 | % | 0.78 | % | 0.57 | % | 0.88 | % | ||||||||||||||||||||
Three Months Ended | ||||||||||||||||||||||||||||||||||||||||
March 31, 2021 |
March 31, 2020 | |||||||||||||||||||||||||||||||||||||||
Private |
Hedge Fund |
Credit & |
Private |
Hedge Fund |
Credit & |
|||||||||||||||||||||||||||||||||||
Real Estate |
Equity |
Solutions |
Insurance |
Total |
Real Estate |
Equity |
Solutions |
Insurance |
Total | |||||||||||||||||||||||||||||||
(Dollars in Thousands) | ||||||||||||||||||||||||||||||||||||||||
| Total Assets Under Management |
||||||||||||||||||||||||||||||||||||||||
| Balance, Beginning of Period |
$ | 187,191,247 | $ | 197,549,222 | $ | 79,422,869 | $ | 154,393,590 | $ | 618,556,928 | $ | 163,156,064 | $ | 182,886,109 | $ | 80,738,112 | $ | 144,342,178 | $ | 571,122,463 | ||||||||||||||||||||
| Inflows (a) |
8,581,463 | 7,831,642 | 2,066,958 | 13,124,022 | 31,604,085 | 12,653,175 | 8,868,851 | 3,246,661 | 2,543,821 | 27,312,508 | ||||||||||||||||||||||||||||||
| Outflows (b) |
(1,809,101 | ) | (750,972 | ) | (1,623,328 | ) | (5,791,889 | ) | (9,975,290 | ) | (793,688 | ) | (398,476 | ) | (2,881,283 | ) | (2,841,299 | ) | (6,914,746 | ) | ||||||||||||||||||||
| |
|
|
|
|
|
|
|
|
|
|
|
|
|
|
|
|
|
|
|
|
|
|
|
|
|
|
|
|
| |||||||||||
| Net Inflows (Outflows) |
6,772,362 | 7,080,670 | 443,630 | 7,332,133 | 21,628,795 | 11,859,487 | 8,470,375 | 365,378 | (297,478 | ) | 20,397,762 | |||||||||||||||||||||||||||||
| Realizations (c) |
(1,953,532 | ) | (8,093,375 | ) | (194,347 | ) | (4,626,773 | ) | (14,868,027 | ) | (2,518,796 | ) | (2,031,106 | ) | (138,987 | ) | (1,699,805 | ) | (6,388,694 | ) | ||||||||||||||||||||
| Market Activity (d)(h) |
4,266,955 | 15,264,568 | 2,147,068 | 1,806,720 | 23,485,311 | (11,561,906 | ) | (14,629,495 | ) | (7,243,711 | ) | (13,689,134 | ) | (47,124,246 | ) | |||||||||||||||||||||||||
| |
|
|
|
|
|
|
|
|
|
|
|
|
|
|
|
|
|
|
|
|
|
|
|
|
|
|
|
|
| |||||||||||
| Balance, End of Period (e) |
$ | 196,277,032 | $ | 211,801,085 | $ | 81,819,220 | $ | 158,905,670 | $ | 648,803,007 | $ | 160,934,849 | $ | 174,695,883 | $ | 73,720,792 | $ | 128,655,761 | $ | 538,007,285 | ||||||||||||||||||||
| |
|
|
|
|
|
|
|
|
|
|
|
|
|
|
|
|
|
|
|
|
|
|
|
|
|
|
|
|
| |||||||||||
| Increase (Decrease) |
$ | 9,085,785 | $ | 14,251,863 | $ | 2,396,351 | $ | 4,512,080 | $ | 30,246,079 | $ | (2,221,215 | ) | $ | (8,190,226 | ) | $ | (7,017,320 | ) | $ | (15,686,417 | ) | $ | (33,115,178 | ) | |||||||||||||||
| Increase (Decrease) |
5 | % | 7 | % | 3 | % | 3 | % | 5 | % | -1 | % | -4 | % | -9 | % | -11 | % | -6 | % | ||||||||||||||||||||
74
| (a) | Inflows represent contributions, capital raised, other increases in available capital (recallable capital and increased side-by-side commitments), purchases, inter-segment allocations and acquisitions. |
| (b) | Outflows represent redemptions, client withdrawals and decreases in available capital (expired capital, expense drawdowns and decreased side-by-side commitments). |
| (c) | Realizations represent realization proceeds from the disposition or other monetization of assets, current income or capital returned to investors from CLOs. |
| (d) | Market activity includes realized and unrealized gains (losses) on portfolio investments and the impact of foreign exchange rate fluctuations. |
| (e) | Assets Under Management are reported in the segment where the assets are managed. |
| (f) | Annualized Base Management Fee Rate represents annualized year to date Base Management Fee divided by the average of the beginning of year and each quarter end’s Fee-Earning Assets Under Management in the reporting period. |
| (g) | For the three months ended March 31, 2021, the impact to Fee-Earning Assets Under Management due to foreign exchange rate fluctuations was $(1.1) billion, $(131.5) million and $(1.3) billion for the Real Estate, Credit & Insurance and Total segments, respectively. For the three months ended March 31, 2020, such impact was $(758.4) million, $(275.1) million and $(1.0) billion for the Real Estate, Credit & Insurance and Total segments, respectively. |
| (h) | For the three months ended March 31, 2021, the impact to Total Assets Under Management due to foreign exchange rate fluctuations was $(1.6) billion, $(330.6) million, $(246.3) million and $(2.2) billion for the Real Estate, Private Equity, Credit & Insurance and Total segments, respectively. For the three months ended March 31, 2020, such impact was $(1.5) billion, $(601.6) million, $(402.0) million and $(2.5) billion for the Real Estate, Private Equity, Credit & Insurance and Total segments, respectively. |
Fee-Earning Assets Under Management
Fee-Earning Assets Under Management were $481.2 billion at March 31, 2021, an increase of $11.8 billion, compared to $469.4 billion at December 31, 2020. The net increase was due to:
| • | Inflows of $23.2 billion related to: |
| o | $8.6 billion in our Real Estate segment driven by $3.1 billion from BREIT, $2.9 billion from BREDS, $1.9 billion from BPP Life Sciences, $254.2 million from BREP opportunistic funds and co-investment, $201.4 million from BPP U.S. and co-investment and $195.2 million from BPP Asia, |
| o | $8.2 billion in our Credit & Insurance segment driven by $3.4 billion from direct lending, $2.7 billion from BIS, $1.3 billion from certain liquid credit and MLP strategies, $434.2 million from mezzanine funds, $139.9 million from our structured products group, $115.4 million from energy strategies and $103.8 million from stressed/distressed strategies, |
| o | $4.5 billion in our Private Equity segment driven by $1.6 billion from corporate private equity, $1.3 billion from BXG, $795.0 million from multi-asset products and $683.7 million from Tactical Opportunities, and |
| o | $2.0 billion in our Hedge Fund Solutions segment driven by $1.4 billion from individual investor and specialized solutions, $417.7 million from customized solutions and $213.2 million from commingled products. |
| • | Market activity of $4.8 billion primarily attributable to: |
| o | $2.0 billion of market appreciation in our Hedge Fund Solutions segment driven by returns from BAAM’s Principal Solutions Composite of 2.5% gross (2.2% net), |
| o | $1.6 billion of market appreciation in our Private Equity segment driven by $811.7 million from BIP and $762.6 million from Strategic Partners, |
| o | $868.0 million of market appreciation in our Real Estate segment driven by appreciation of $2.0 billion from Core+ real estate, partially offset by foreign exchange depreciation of $599.6 million from Core+ real estate and $510.1 million from BREP opportunistic and co-investment, and |
75
| o | $387.1 million of market appreciation in our Credit & Insurance segment driven by appreciation of $345.8 million from certain liquid credit and MLP strategies, partially offset by $121.7 million of market depreciation from BIS, all of which included $131.5 million of foreign exchange depreciation across the segment. |
Offsetting these increases were:
| • | Realizations of $8.4 billion primarily driven by: |
| o | $3.2 billion in our Credit & Insurance segment driven by $1.2 billion from direct lending, $747.9 million from CLOs, $641.3 million from mezzanine funds, $372.0 million from stressed/distressed strategies, $160.0 million from certain liquid credit and MLP strategies and $158.4 million from energy strategies, |
| o | $3.1 billion in our Private Equity segment driven by $1.3 billion from corporate private equity, $913.1 million from Strategic Partners and $752.2 million from Tactical Opportunities, and |
| o | $1.9 billion in our Real Estate segment driven by $711.4 million from BREDS, $622.7 million from Core+ real estate and $521.2 million from BREP opportunistic funds and co-investment. |
| • | Outflows of $7.9 billion primarily attributable to: |
| o | $5.1 billion in our Credit & Insurance segment driven by $2.4 billion from certain liquid credit and MLP strategies, $2.3 billion from BIS and $199.5 million from stressed/distressed strategies, |
| o | $1.3 billion in our Hedge Fund Solutions segment driven by $961.0 million from individual investor and specialized solutions and $302.0 million from customized solutions, and |
| o | $843.6 million in our Real Estate segment driven by $633.1 million from BREIT and $155.1 million from BPP U.S. and co-investment. |
Total Assets Under Management
Total Assets Under Management were $648.8 billion at March 31, 2021, an increase of $30.2 billion, compared to $618.6 billion at December 31, 2020. The net increase was due to:
| • | Inflows of $31.6 billion primarily related to: |
| o | $13.1 billion in our Credit & Insurance segment driven by $7.1 billion from direct lending (which exceeds Fee-Earning Assets Under Management inflows principally due to certain funds charging fees on net assets versus gross assets), $2.4 billion from BIS, $1.8 billion from our structured products group, $945.6 million from certain liquid credit and MLP strategies, $510.5 million from mezzanine funds and $100.0 million from stressed/distressed strategies, |
| o | $8.6 billion in our Real Estate segment driven by $3.8 billion from BPP Life Sciences, $3.5 billion from BREIT, $361.4 million from BREDS, $357.5 million from BREP opportunistic funds, $202.1 million from BPP U.S. and co-investment, $160.9 million from BPP Asia and $131.4 million from BPP Europe and co-investment, |
| o | $7.8 billion in our Private Equity segment driven by $3.7 billion from corporate private equity, $1.9 billion from BXG, $1.2 billion from Tactical Opportunities, $583.6 million from Strategic Partners and $397.5 million from multi-asset products, and |
| o | $2.1 billion in our Hedge Fund Solutions segment driven by $1.6 billion from individual investor and specialized solutions, $298.1 million from customized solutions and $191.9 million from commingled products. |
76
| • | Market activity of $23.5 billion primarily driven by: |
| o | $15.3 billion of market appreciation in our Private Equity segment driven by carrying value increases in corporate private equity, Tactical Opportunities and Strategic Partners of 15.3%, 15.1% and 10.6%, respectively, which includes $330.6 million of foreign exchange depreciation across the segment, |
| o | $4.3 billion of market appreciation in our Real Estate segment driven by carrying value increases in opportunistic and Core+ real estate of 5.3% and 3.2%, during the year, respectively, which includes $1.6 billion of foreign exchange depreciation across the segment, |
| o | $2.1 billion of market appreciation in our Hedge Fund Solutions segment driven by reasons noted above in Fee-Earning Assets Under Management, and |
| o | $1.8 billion of market appreciation in our Credit & Insurance segment driven by appreciation of $567.5 million from certain liquid credit and MLP strategies, $424.7 million from mezzanine funds, $388.6 million from direct lending, $382.1 million from stressed/distressed strategies and $354.5 million from energy strategies, partially offset by market depreciation of $247.0 million from CLOs and $126.9 million from BIS, all of which included $246.3 million of foreign exchange depreciation across the segment. |
Total Assets Under Management market activity in our Real Estate and Private Equity segments generally represents the change in fair value of the investments held and typically exceeds the Fee-Earning Assets Under Management market activity.
Offsetting these increases were:
| • | Realizations of $14.9 billion primarily driven by: |
| o | $8.1 billion in our Private Equity segment driven by $3.8 billion from corporate private equity, $2.3 billion from Tactical Opportunities, $1.7 billion from Strategic Partners, $197.2 million from BXG and $108.2 million from BIP, |
| o | $4.6 billion in our Credit & Insurance segment driven by $1.6 billion from direct lending, $1.4 billion from mezzanine funds, $747.9 million from CLOs, $503.5 million from stressed/distressed strategies, $217.6 million from energy strategies and $174.4 million from certain liquid credit and MLP strategies, and |
| o | $2.0 billion in our Real Estate segment driven by $923.9 million from BREP opportunistic and co-investment, $645.7 million from Core+ real estate and $383.9 million from BREDS. |
Total Assets Under Management realizations in our Real Estate and Private Equity segments generally represents the total proceeds and typically exceeds the Fee-Earning Assets Under Management realizations which generally represents only the invested capital.
| • | Outflows of $10.0 billion primarily attributable to: |
| o | $5.8 billion in our Credit & Insurance segment driven by $2.5 billion from certain liquid credit and MLP strategies, $2.3 billion from BIS, $575.8 million from direct lending, $121.8 million from stressed/distressed strategies and $106.3 million from energy strategies, |
| o | $1.8 billion in our Real Estate segment driven by $804.4 million from Core+ real estate, $640.3 million from BREDS and $364.4 million from BREP opportunistic funds and co-investment, and |
| o | $1.6 billion in our Hedge Fund Solutions segment driven by $1.2 billion from individual investor and specialized solutions, $326.9 million from customized solutions and $103.4 million from commingled products. |
77
Dry Powder
The following presents our Dry Powder as of quarter end of each period:
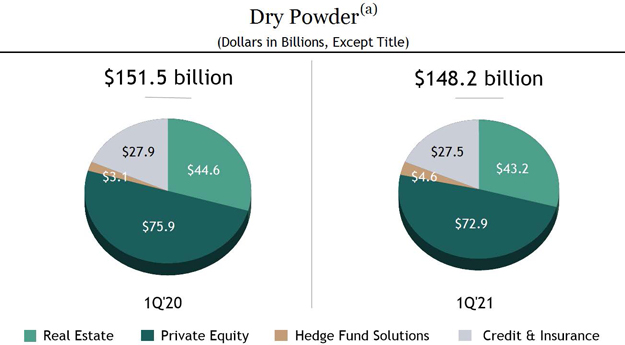
| Note: | Totals may not add due to rounding. |
| (a) | Represents illiquid drawdown funds, a component of Perpetual Capital and fee-paying co-investments; includes fee-paying third party capital as well as general partner and employee capital that does not earn fees. Amounts are reduced by outstanding capital commitments, for which capital has not yet been invested. |
Net Accrued Performance Revenues
The following table presents the Accrued Performance Revenues, net of performance compensation, of the Blackstone Funds as of March 31, 2021 and 2020. Net Accrued Performance Revenues excludes Performance Revenues realized but not yet distributed as of the respective quarter end and clawback amounts, if any, which are disclosed in Note 17. “Commitments and Contingencies — Contingencies — Contingent Obligations (Clawback)” in the “Notes to Condensed Consolidated Financial Statements” in “Part I. Item 1. Financial Statements” of this filing. See “— Non-GAAP Financial Measures” for our reconciliation of Net Accrued Performance Revenues.
78
March 31, |
||||||||
2021 |
2020 |
|||||||
(Dollars in Millions) |
||||||||
| Real Estate |
||||||||
| BREP IV |
$ | 18 | $ | 8 | ||||
| BREP V |
18 | — | ||||||
| BREP VI |
39 | 51 | ||||||
| BREP VII |
253 | 309 | ||||||
| BREP VIII |
519 | 517 | ||||||
| BREP IX |
198 | — | ||||||
| BREP Europe IV |
92 | 123 | ||||||
| BREP Europe V |
244 | 110 | ||||||
| BREP Asia I |
179 | 85 | ||||||
| BREP Asia II |
78 | — | ||||||
| BPP |
189 | 196 | ||||||
| BREIT |
82 | — | ||||||
| BREDS |
31 | 2 | ||||||
| BTAS |
1 | 45 | ||||||
| |
|
|
|
|||||
| Total Real Estate (a) |
1,941 | 1,446 | ||||||
| |
|
|
|
|||||
| Private Equity |
||||||||
| BCP IV |
9 | 23 | ||||||
| BCP V |
37 | — | ||||||
| BCP VI |
746 | 283 | ||||||
| BCP VII |
987 | 115 | ||||||
| BCP VIII |
41 | — | ||||||
| BCP Asia I |
105 | 14 | ||||||
| BEP I |
52 | — | ||||||
| BEP III |
34 | — | ||||||
| BCEP I |
147 | 33 | ||||||
| Tactical Opportunities (b) |
359 | 36 | ||||||
| Strategic Partners |
157 | 136 | ||||||
| BIP |
43 | — | ||||||
| BXLS |
19 | 7 | ||||||
| BTAS/Other |
93 | 73 | ||||||
| |
|
|
|
|||||
| Total Private Equity (a) |
2,831 | 720 | ||||||
| |
|
|
|
|||||
| Hedge Fund Solutions |
214 | 15 | ||||||
| |
|
|
|
|||||
| Credit & Insurance |
216 | 6 | ||||||
| |
|
|
|
|||||
| Total Blackstone Net Accrued Performance Revenues |
$ | 5,202 | $ | 2,187 | ||||
| |
|
|
|
|||||
| Note: | Totals may not add due to rounding. |
| (a) | Real Estate and Private Equity include co-investments, as applicable. |
| (b) | Tactical Opportunities includes Blackstone Growth. |
For the twelve months ended March 31, 2021, Net Accrued Performance Revenues receivable increased due to Net Performance Revenues of $4.6 billion offset by net realized distributions of $1.6 billion.
79
Invested Performance Eligible Assets Under Management
The following presents our Invested Performance Eligible Assets Under Management as of quarter end for each period:
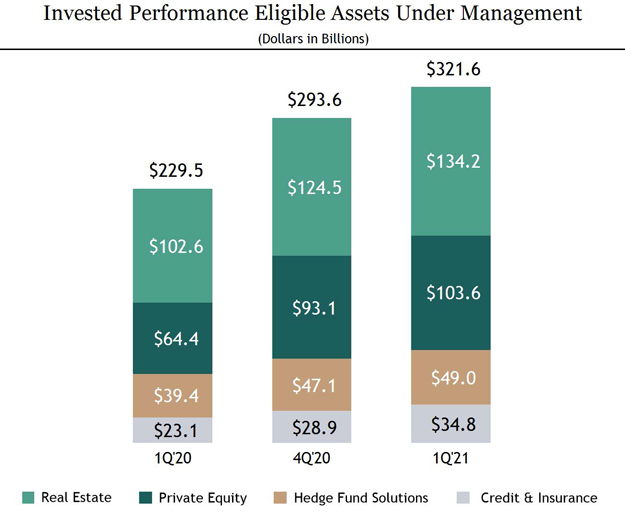
| Note: | Totals may not add due to rounding. |
80
Perpetual Capital
The following presents our Perpetual Capital Assets Under Management as of quarter end for each period:
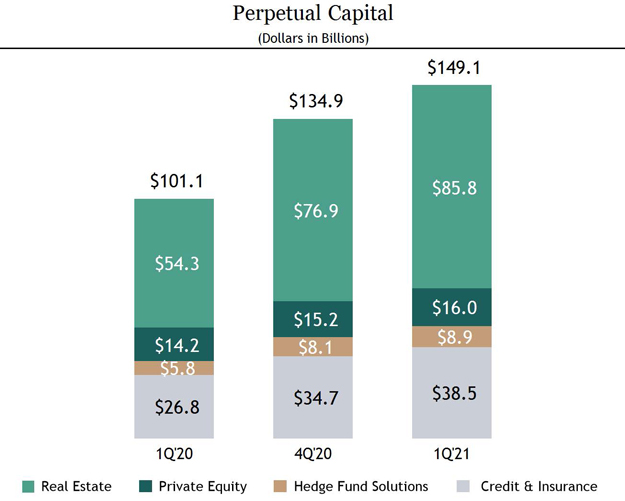
| Note: | Totals may not add due to rounding. |
Investment Record
Fund returns information for our significant funds is included throughout this discussion and analysis to facilitate an understanding of our results of operations for the periods presented. The fund returns information reflected in this discussion and analysis is not indicative of the financial performance of Blackstone and is also not necessarily indicative of the future performance of any particular fund. An investment in Blackstone is not an investment in any of our funds. There can be no assurance that any of our funds or our other existing and future funds will achieve similar returns.
The following table presents the investment record of our significant drawdown funds from inception through March 31, 2021:
81
| Unrealized Investments |
Realized Investments |
Total Investments |
||||||||||||||||||||||||||||||||
Fund (Investment Period |
Committed |
Available |
% |
Net IRRs (d) | ||||||||||||||||||||||||||||||
| Beginning Date / Ending Date) (a) |
Capital |
Capital (b) |
Value |
MOIC (c) |
Public |
Value |
MOIC (c) |
Value |
MOIC (c) |
Realized |
Total | |||||||||||||||||||||||
(Dollars/Euros in Thousands, Except Where Noted) | ||||||||||||||||||||||||||||||||||
| Real Estate |
| |||||||||||||||||||||||||||||||||
| Pre-BREP |
$ 140,714 | $ — | $ — | N/A | — | $ 345,190 | 2.5x | $ 345,190 | 2.5x | 33 | % | 33 | % | |||||||||||||||||||||
| BREP I (Sep 1994 / Oct 1996) |
380,708 | — | — | N/A | — | 1,327,708 | 2.8x | 1,327,708 | 2.8x | 40 | % | 40 | % | |||||||||||||||||||||
| BREP II (Oct 1996 / Mar 1999) |
1,198,339 | — | — | N/A | — | 2,531,614 | 2.1x | 2,531,614 | 2.1x | 19 | % | 19 | % | |||||||||||||||||||||
| BREP III (Apr 1999 / Apr 2003) |
1,522,708 | — | — | N/A | — | 3,330,406 | 2.4x | 3,330,406 | 2.4x | 21 | % | 21 | % | |||||||||||||||||||||
| BREP IV (Apr 2003 / Dec 2005) |
2,198,694 | — | 56,464 | 1.1x | 56 | % | 4,579,740 | 1.7x | 4,636,204 | 1.7x | 13 | % | 12 | % | ||||||||||||||||||||
| BREP V (Dec 2005 / Feb 2007) |
5,539,418 | 231,873 | 215,826 | 0.9x | 58 | % | 13,084,427 | 2.4x | 13,300,253 | 2.3x | 12 | % | 11 | % | ||||||||||||||||||||
| BREP VI (Feb 2007 / Aug 2011) |
11,060,444 | 550,710 | 472,084 | 2.1x | 76 | % | 27,242,899 | 2.5x | 27,714,983 | 2.5x | 13 | % | 13 | % | ||||||||||||||||||||
| BREP VII (Aug 2011 / Apr 2015) |
13,496,823 | 1,525,932 | 5,656,279 | 1.2x | 6 | % | 23,127,388 | 2.1x | 28,783,667 | 1.9x | 22 | % | 14 | % | ||||||||||||||||||||
| BREP VIII (Apr 2015 / Jun 2019) |
16,574,719 | 2,579,746 | 14,075,783 | 1.2x | — | 13,664,356 | 2.3x | 27,740,139 | 1.6x | 29 | % | 14 | % | |||||||||||||||||||||
| *BREP IX (Jun 2019 / Dec 2024) |
21,007,889 | 13,398,701 | 9,638,350 | 1.3x | 10 | % | 1,371,851 | 1.5x | 11,010,201 | 1.3x | N/M | 21 | % | |||||||||||||||||||||
| |
|
|
|
|
|
|
|
|
|
|
|
|
|
|
|
|
|
|
|
|
|
| ||||||||||||
| Total Global BREP |
$ 73,120,456 | $ 18,286,962 | $ 30,114,786 | 1.3x | 6 | % | $ 90,605,579 | 2.3x | $120,720,365 | 1.9x | 18 | % | 15 | % | ||||||||||||||||||||
| |
|
|
|
|
|
|
|
|
|
|
|
|
|
|
|
|
|
|
|
|
|
| ||||||||||||
| BREP Int’l (Jan 2001 / Sep 2005) |
€ 824,172 |
€ — |
€ — |
N/A | — | € 1,373,170 |
2.1x | € 1,373,170 |
2.1x | 23 | % | 23 | % | |||||||||||||||||||||
| BREP Int’l II (Sep 2005 / Jun 2008) (e) |
1,629,748 | — | — | N/A | — | 2,576,670 | 1.8x | 2,576,670 | 1.8x | 8 | % | 8 | % | |||||||||||||||||||||
| BREP Europe III (Jun 2008 / Sep 2013) |
3,205,167 | 461,661 | 360,225 | 0.5x | — | 5,738,120 | 2.5x | 6,098,345 | 2.1x | 20 | % | 14 | % | |||||||||||||||||||||
| BREP Europe IV (Sep 2013 / Dec 2016) |
6,710,146 | 1,336,401 | 2,333,250 | 1.4x | — | 9,147,085 | 1.9x | 11,480,335 | 1.8x | 20 | % | 14 | % | |||||||||||||||||||||
| BREP Europe V (Dec 2016 / Oct 2019) |
7,949,959 | 1,592,357 | 8,312,567 | 1.4x | — | 867,616 | 2.8x | 9,180,183 | 1.4x | 52 | % | 10 | % | |||||||||||||||||||||
| *BREP Europe VI (Oct 2019 / Apr 2025) |
9,836,400 | 6,583,540 | 3,418,851 | 1.1x | 2 | % | 6,800 | N/A | 3,425,651 | 1.1x | N/M | 6 | % | |||||||||||||||||||||
| |
|
|
|
|
|
|
|
|
|
|
|
|
|
|
|
|
|
|
|
|
|
| ||||||||||||
| Total BREP Europe |
€ 30,155,592 |
€ 9,973,959 |
€ 14,424,893 |
1.3x | 1 | % | € 19,709,461 |
2.1x | € 34,134,354 |
1.6x | 16 | % | 12 | % | ||||||||||||||||||||
| |
|
|
|
|
|
|
|
|
|
|
|
|
|
|
|
|
|
|
|
|
|
| ||||||||||||
continued...
82
| Unrealized Investments |
Realized Investments |
Total Investments |
||||||||||||||||||||||||||||||||
Fund (Investment Period |
Committed |
Available |
% |
Net IRRs (d) | ||||||||||||||||||||||||||||||
| Beginning Date / Ending Date) (a) |
Capital |
Capital (b) |
Value |
MOIC (c) |
Public |
Value |
MOIC (c) |
Value |
MOIC (c) |
Realized |
Total | |||||||||||||||||||||||
(Dollars/Euros in Thousands, Except Where Noted) | ||||||||||||||||||||||||||||||||||
| Real Estate (continued) |
| |||||||||||||||||||||||||||||||||
| BREP Asia I (Jun 2013 / Dec 2017) |
$ 4,261,983 | $ 917,283 | $ 3,554,880 | 1.6x | 12 | % | $ |
1.9x | $ 8,116,651 | 1.8x | 21 | % | 13 | % | ||||||||||||||||||||
| *BREP Asia II (Dec 2017 / Jun 2023) |
7,349,172 | 3,383,780 | 4,955,595 | 1.3x | 10 | % | 273,502 | 1.6x | 5,229,097 | 1.3x | 50 | % | 11 | % | ||||||||||||||||||||
| BREP Co-Investment (f) |
7,055,974 | 32,096 | 591,579 | 1.4x | 1 | % | 14,794,053 | 2.2x | 15,385,632 | 2.2x | 16 | % | 16 | % | ||||||||||||||||||||
| |
|
|
|
|
|
|
|
|
|
|
|
|
|
|
|
|
|
|
|
|
|
| ||||||||||||
| Total BREP |
$ 126,272,767 | $ 34,319,574 | $ 55,789,784 | 1.3x | 5 | % | $ 135,043,298 | 2.2x | $ 190,833,082 | 1.8x | 17 | % | 15 | % | ||||||||||||||||||||
| |
|
|
|
|
|
|
|
|
|
|
|
|
|
|
|
|
|
|
|
|
|
| ||||||||||||
| *Core+ BPP (Various) (g) |
$ N/A | $ N/A | $ 46,270,814 | N/A | — | $ 7,984,496 | N/A | $ 54,255,310 | N/A | N/M | 9 | % | ||||||||||||||||||||||
| *Core+ BREIT (Various) (h) |
N/A | N/A | 24,359,495 | N/A | — | 840,788 | N/A | 25,200,283 | N/A | N/A | 9 | % | ||||||||||||||||||||||
| *BREDS High-Yield (Various) (i) |
19,990,223 | 8,389,472 | 4,528,956 | 1.1x | — | 13,444,864 | 1.3x | 17,973,820 | 1.2x | 11 | % | 10 | % | |||||||||||||||||||||
| Private Equity |
| |||||||||||||||||||||||||||||||||
| Corporate Private Equity |
| |||||||||||||||||||||||||||||||||
| BCP I (Oct 1987 / Oct 1993) |
$ |
$ |
$ |
N/A | — | $ 1,741,738 | 2.6x | $ 1,741,738 | 2.6x | 19 | % | 19 | % | |||||||||||||||||||||
| BCP II (Oct 1993 / Aug 1997) |
1,361,100 | — | — | N/A | — | 3,256,819 | 2.5x | 3,256,819 | 2.5x | 32 | % | 32 | % | |||||||||||||||||||||
| BCP III (Aug 1997 / Nov 2002) |
3,967,422 | — | — | N/A | — | 9,184,688 | 2.3x | 9,184,688 | 2.3x | 14 | % | 14 | % | |||||||||||||||||||||
| BCOM (Jun 2000 / Jun 2006) |
2,137,330 | 24,575 | 18,179 | N/A | — | 2,953,649 | 1.4x | 2,971,828 | 1.4x | 6 | % | 6 | % | |||||||||||||||||||||
| BCP IV (Nov 2002 / Dec 2005) |
6,773,182 | 179,524 | 121,454 | 1.4x | — | 21,478,010 | 2.9x | 21,599,464 | 2.9x | 36 | % | 36 | % | |||||||||||||||||||||
| BCP V (Dec 2005 / Jan 2011) |
21,009,112 | 1,035,259 | 641,901 | N/M | 99 | % | 37,767,326 | 1.9x | 38,409,227 | 1.9x | 8 | % | 8 | % | ||||||||||||||||||||
| BCP VI (Jan 2011 / May 2016) |
15,202,400 | 1,164,970 | 11,232,537 | 2.0x | 54 | % | 19,429,252 | 2.1x | 30,661,789 | 2.1x | 17 | % | 13 | % | ||||||||||||||||||||
| BCP VII (May 2016 / Feb 2020) |
18,853,441 | 1,630,722 | 25,129,155 | 1.6x | 33 | % | 3,807,449 | 1.8x | 28,936,604 | 1.6x | 22 | % | 18 | % | ||||||||||||||||||||
| *BCP VIII (Feb 2020 / Feb 2026) |
24,884,732 | 22,132,923 | 3,481,571 | 1.3x | 8 | % | — | N/A | 3,481,571 | 1.3x | N/A | N/M | ||||||||||||||||||||||
| Energy I (Aug 2011 / Feb 2015) |
2,441,558 | 142,138 | 931,989 | 1.4x | 40 | % | 3,333,701 | 1.9x | 4,265,690 | 1.8x | 15 | % | 11 | % | ||||||||||||||||||||
| Energy II (Feb 2015 / Feb 2020) |
4,914,647 | 653,279 | 3,979,873 | 1.1x | 23 | % | 843,246 | 1.0x | 4,823,119 | 1.1x | -6 | % | -2 | % | ||||||||||||||||||||
| *Energy III (Feb 2020 / Feb 2026) |
4,267,583 | 3,683,594 | 972,483 | 1.8x | 81 | % | — | N/A | 972,483 | 1.8x | N/A | 106 | % | |||||||||||||||||||||
| *BCP Asia I (Dec 2017 / Dec 2023) |
2,410,749 | 1,317,473 | 2,209,965 | 2.1x | 8 | % | 160,023 | 2.2x | 2,369,988 | 2.1x | 145 | % | 40 | % | ||||||||||||||||||||
| BCP Asia II (TBD) |
3,114,699 | 3,114,699 | — | N/A | — | — | N/A | — | N/A | N/A | N/A | |||||||||||||||||||||||
| Core Private Equity I (Jan 2017 / Mar 2021) (j) |
4,756,127 | 1,740,129 | 5,897,426 | 1.9x | — | 1,077,112 | 1.9x | 6,974,538 | 1.9x | 28 | % | 23 | % | |||||||||||||||||||||
| *Core Private Equity II (Mar 2021 / Mar 2026) (j) |
8,165,403 | 8,157,699 | — | N/A | — | — | N/A | — | N/A | N/A | N/A | |||||||||||||||||||||||
| |
|
|
|
|
|
|
|
|
|
|
|
|
|
|
|
|
|
|
|
|
|
| ||||||||||||
| Total Corporate Private Equity |
$ 125,118,566 | $ 44,976,984 | $ 54,616,533 | 1.6x | 32 | % | $ 105,033,013 | 2.1x | $ 159,649,546 | 1.9x | 16 | % | 15 | % | ||||||||||||||||||||
| |
|
|
|
|
|
|
|
|
|
|
|
|
|
|
|
|
|
|
|
|
|
| ||||||||||||
continued...
83
| Unrealized Investments |
Realized Investments |
Total Investments |
||||||||||||||||||||||||||||||||
Fund (Investment Period |
Committed |
Available |
% |
Net IRRs (d) | ||||||||||||||||||||||||||||||
| Beginning Date / Ending Date) (a) |
Capital |
Capital (b) |
Value |
MOIC (c) |
Public |
Value |
MOIC (c) |
Value |
MOIC (c) |
Realized |
Total | |||||||||||||||||||||||
(Dollars/Euros in Thousands, Except Where Noted) | ||||||||||||||||||||||||||||||||||
| Private Equity (continued) |
| |||||||||||||||||||||||||||||||||
| Tactical Opportunities |
| |||||||||||||||||||||||||||||||||
| *Tactical Opportunities (Various) |
$ 23,035,391 | $ 9,071,275 | $ 15,169,008 | 1.4x | 16 | % | $ 12,916,194 | 1.8x | $28,085,202 | 1.6x | 17 | % | 13 | % | ||||||||||||||||||||
| *Tactical Opportunities Co-Investment and Other (Various) |
9,053,110 | 2,303,198 | 3,687,558 | 1.3x | 8 | % | 5,840,305 | 1.7x | 9,527,863 | 1.5x | 19 | % | 16 | % | ||||||||||||||||||||
| |
|
|
|
|
|
|
|
|
|
|
|
|
|
|
|
|
|
|
|
|
|
| ||||||||||||
| Total Tactical Opportunities |
$ 32,088,501 | $ 11,374,473 | $ 18,856,566 | 1.4x | 15 | % | $ 18,756,499 | 1.8x | $37,613,065 | 1.5x | 18 | % | 14 | % | ||||||||||||||||||||
| |
|
|
|
|
|
|
|
|
|
|
|
|
|
|
|
|
|
|
|
|
|
| ||||||||||||
| *Blackstone Growth (Jul 2020 / Jul 2025) |
$ 4,761,851 | $ 4,509,392 | $ 549,092 | 1.3x | — | $ 463,073 | 3.4x | $1,012,165 | 1.8x | N/M | N/M | |||||||||||||||||||||||
| Strategic Partners (Secondaries) |
||||||||||||||||||||||||||||||||||
| Strategic Partners I-V (Various) (k) |
11,863,351 | 1,048,166 | 742,256 | N/M | — | 17,133,750 | N/M | 17,876,006 | 1.5x | N/A | 13 | % | ||||||||||||||||||||||
| Strategic Partners VI (Apr 2014 / Apr 2016) (k) |
4,362,750 | 1,267,153 | 1,176,262 | N/M | — | 3,502,773 | N/M | 4,679,035 | 1.5x | N/A | 14 | % | ||||||||||||||||||||||
| Strategic Partners VII (May 2016 / Mar 2019) (k) |
7,489,970 | 2,154,869 | 4,634,275 | N/M | — | 2,977,641 | N/M | 7,611,916 | 1.4x | N/A | 15 | % | ||||||||||||||||||||||
| Strategic Partners Real Assets II (May 2017 / Jun 2020) (k) |
1,749,807 | 375,364 | 1,116,127 | N/M | — | 493,155 | N/M | 1,609,282 | 1.2x | N/A | 12 | % | ||||||||||||||||||||||
| *Strategic Partners VIII (Mar 2019 / Jul 2023) (k) |
10,763,600 | 5,256,997 | 4,474,528 | N/M | — | 376,726 | N/M | 4,851,254 | 1.4x | N/A | 32 | % | ||||||||||||||||||||||
| *Strategic Partners Real Estate, SMA and Other (Various) (k) |
7,678,498 | 2,510,678 | 2,826,383 | N/M | — | 1,760,069 | N/M | 4,586,452 | 1.3x | N/A | 14 | % | ||||||||||||||||||||||
| *Strategic Partners Infra III (Jun 2020 / Jul 2024) (k) |
3,250,100 | 2,775,629 | 90,848 | N/M | — | — | N/A | 90,848 | 1.8x | N/A | N/M | |||||||||||||||||||||||
| |
|
|
|
|
|
|
|
|
|
|
|
|
|
|
|
|
|
|
|
|
|
| ||||||||||||
| Total Strategic Partners (Secondaries) |
$ 47,158,076 | $15,388,856 | $ 15,060,679 | N/M | — | $ 26,244,114 | N/M | $41,304,793 | 1.5x | N/A | 14 | % | ||||||||||||||||||||||
| |
|
|
|
|
|
|
|
|
|
|
|
|
|
|
|
|
|
|
|
|
|
| ||||||||||||
| *Infrastructure (Various) |
$ 13,658,063 | $9,103,132 | $ 5,492,303 | 1.2x | 49 | % | $ — | N/A | $ 5,492,303 | 1.2x | N/A | 13 | % | |||||||||||||||||||||
| Life Sciences |
||||||||||||||||||||||||||||||||||
| Clarus IV (Jan 2018 / Jan 2020) |
910,000 | 372,990 | 694,759 | 1.5x | 2 | % | 29,630 | 1.3x | 724,389 | 1.5x | 15 | % | 15 | % | ||||||||||||||||||||
| *BXLS V (Jan 2020 / Jan 2025) |
4,739,681 | 4,132,098 | 731,761 | 1.4x | 13 | % | — | N/A | 731,761 | 1.4x | N/A | N/M | ||||||||||||||||||||||
continued...
84
| Unrealized Investments |
Realized Investments |
Total Investments |
||||||||||||||||||||||||||||||||
Fund (Investment Period |
Committed |
Available |
% |
Net IRRs (d) | ||||||||||||||||||||||||||||||
| Beginning Date / Ending Date) (a) |
Capital |
Capital (b) |
Value |
MOIC (c) |
Public |
Value |
MOIC (c) |
Value |
MOIC (c) |
Realized |
Total | |||||||||||||||||||||||
(Dollars/Euros in Thousands, Except Where Noted) | ||||||||||||||||||||||||||||||||||
| Credit |
||||||||||||||||||||||||||||||||||
| Mezzanine / Opportunistic I (Jul 2007 / Oct 2011) |
$ 2,000,000 | $ |
$ 21,828 | 1.1x | — | $ 4,774,747 | 1.6x | $ 4,796,575 | 1.6x | N/A | 17 | % | ||||||||||||||||||||||
| Mezzanine / Opportunistic II (Nov 2011 / Nov 2016) |
4,120,000 | 1,013,932 | 858,763 | 0.6x | — | 5,773,739 | 1.6x | 6,632,502 | 1.3x | N/A | 10 | % | ||||||||||||||||||||||
| Mezzanine / Opportunistic III (Sep 2016 / Jan 2021) |
6,639,133 | 1,252,742 | 5,102,629 | 1.1x | — | 3,390,488 | 1.7x | 8,493,117 | 1.3x | N/A | 11 | % | ||||||||||||||||||||||
| *Mezzanine / Opportunistic IV (Jan 2021 / Jan 2026) |
3,309,957 | 3,157,365 | 153,993 | 1.0x | — | 1,246 | N/A | 155,239 | 1.0x | N/A | N/A | |||||||||||||||||||||||
| Stressed / Distressed I (Sep 2009 / May 2013) |
3,253,143 | 76,000 | — | N/A | — | 5,775,571 | 1.3x | 5,775,571 | 1.3x | N/A | 9 | % | ||||||||||||||||||||||
| Stressed / Distressed II (Jun 2013 / Jun 2018) |
5,125,000 | 547,341 | 908,998 | 0.8x | — | 4,662,278 | 1.2x | 5,571,276 | 1.1x | N/A | 1 | % | ||||||||||||||||||||||
| *Stressed / Distressed III (Dec 2017 / Dec 2022) |
7,356,380 | 3,911,199 | 2,142,411 | 1.0x | — | 1,639,998 | 1.4x | 3,782,409 | 1.1x | N/A | 5 | % | ||||||||||||||||||||||
| Energy I (Nov 2015 / Nov 2018) |
2,856,867 | 994,239 | 1,584,612 | 1.0x | — | 1,299,843 | 1.6x | 2,884,455 | 1.2x | N/A | 7 | % | ||||||||||||||||||||||
| *Energy II (Feb 2019 / Feb 2024) |
3,616,081 | 2,777,742 | 961,310 | 1.1x | — | 314,985 | 1.6x | 1,276,295 | 1.2x | N/A | 29 | % | ||||||||||||||||||||||
| European Senior Debt I (Feb 2015 / Feb 2019) |
€ 1,964,689 |
€ |
€ 1,731,478 |
1.0x | 2 | % | € 1,452,345 |
1.5x | € 3,183,823 |
1.2x | N/A | 5 | % | |||||||||||||||||||||
| *European Senior Debt II (Jun 2019 / Jun 2024) |
€ 4,088,344 |
€ 3,144,414 |
€ |
1.0x | — | € |
1.2x | € |
1.1x | N/A | 21 | % | ||||||||||||||||||||||
| |
|
|
|
|
|
|
|
|
|
|
|
|
|
|
|
|
|
|
|
|
|
| ||||||||||||
| Total Credit Drawdown Funds (l) |
$ 45,182,219 | $ 17,831,492 | $ 14,876,214 | 1.0x | — | $ 29,959,526 | 1.4x | $44,835,740 | 1.3x | N/A | 10 | % | ||||||||||||||||||||||
| |
|
|
|
|
|
|
|
|
|
|
|
|
|
|
|
|
|
|
|
|
|
| ||||||||||||
| *Direct Lending BDC (Various) (m) |
$ 3,926,295 | $ 713,254 | $ 3,325,418 | N/A | — | $ 321,007 | N/A | $ 3,646,425 | N/A | N/A | 9 | % | ||||||||||||||||||||||
85
The returns presented herein represent those of the applicable Blackstone Funds and not those of Blackstone.
| N/M | Not meaningful generally due to the limited time since initial investment. |
| N/A | Not applicable. |
| SMA | Separately managed account. |
| * | Represents funds that are currently in their investment period and open-ended funds. |
| (a) | Excludes investment vehicles where Blackstone does not earn fees. |
| (b) | Available Capital represents total investable capital commitments, including side-by-side, adjusted for certain expenses and expired or recallable capital and may include leverage, less invested capital. This amount is not reduced by outstanding commitments to investments. |
| (c) | Multiple of Invested Capital (“MOIC”) represents carrying value, before management fees, expenses and Performance Revenues, divided by invested capital. |
| (d) | Unless otherwise indicated, Net Internal Rate of Return (“IRR”) represents the annualized inception to March 31, 2021 IRR on total invested capital based on realized proceeds and unrealized value, as applicable, after management fees, expenses and Performance Revenues. IRRs are calculated using actual timing of limited partner cash flows. Initial inception date of cash flows may differ from the Investment Period Beginning Date. |
| (e) | The 8% Realized Net IRR and 8% Total Net IRR exclude investors that opted out of the Hilton investment opportunity. Overall BREP International II performance reflects a 7% Realized Net IRR and a 7% Total Net IRR. |
| (f) | BREP Co-Investment represents co-investment capital raised for various BREP investments. The Net IRR reflected is calculated by aggregating each co-investment’s realized proceeds and unrealized value, as applicable, after management fees, expenses and Performance Revenues. |
| (g) | BPP represents the Core+ real estate funds which invest with a more modest risk profile and lower leverage. Committed Capital and Available Capital are not regularly reported to investors in our Core+ strategy and are not applicable in the context of these funds. |
| (h) | Unrealized Investment Value reflects BREIT’s net asset value as of March 31, 2021. Realized Investment Value represents BREIT’s cash distributions, net of servicing fees. The BREIT net return reflects a per share blended return, assuming BREIT had a single share class, reinvestment of all dividends received during the period, and no upfront selling commission, net of all fees and expenses incurred by BREIT. These returns are not representative of the returns experienced by any particular investor or share class. Inception to date net returns are presented on an annualized basis and are from January 1, 2017. Committed Capital and Available Capital are not regularly reported to investors in our Core+ strategy and are not applicable in the context of this vehicle. |
| (i) | BREDS High-Yield represents the flagship real estate debt drawdown funds only and excludes BREDS High-Grade. |
| (j) | Blackstone Core Equity Partners is a core private equity strategy which invests with a more modest risk profile and longer hold period than traditional private equity. |
| (k) | Realizations are treated as return of capital until fully recovered and therefore unrealized and realized MOICs are not meaningful. If information is not available on a timely basis, returns are calculated from results that are reported on a three month lag and therefore do not include the impact of economic and market activities in the quarter in which such events occur. |
| (l) | Funds presented represent the flagship credit drawdown funds only. The Total Credit Net IRR is the combined IRR of the credit drawdown funds presented. |
| (m) | Unrealized Investment Value reflects BXSL’s net asset value as of March 31, 2021. Realized Investment Value represents BXSL’s cash distributions. BXSL’s net return is annualized and calculated since inception starting on November 20, 2018, as the change in net asset value (“NAV”) per share during the period, plus distributions per share (assuming dividends and distributions are reinvested in accordance with the Company’s dividend reinvestment plan) divided by the beginning NAV per share. |
86
Segment Analysis
Discussed below is our Segment Distributable Earnings for each of our segments. This information is reflected in the manner utilized by our senior management to make operating decisions, assess performance and allocate resources. References to “our” sectors or investments may also refer to portfolio companies and investments of the underlying funds that we manage.
Real Estate
The following table presents the results of operations for our Real Estate segment:
Three Months Ended |
||||||||||||||||
March 31, |
2021 vs. 2020 | |||||||||||||||
2021 |
2020 |
$ |
% | |||||||||||||
(Dollars in Thousands) | ||||||||||||||||
| Management Fees, Net |
||||||||||||||||
| Base Management Fees |
$ |
427,186 |
$ |
371,438 |
$ |
55,748 |
15 |
% | ||||||||
| Transaction and Other Fees, Net |
26,019 |
23,024 |
2,995 |
13 |
% | |||||||||||
| Management Fee Offsets |
(1,623 |
) |
(8,341 |
) |
6,718 |
-81 |
% | |||||||||
| |
|
|
|
|
|
|
|
|
|
|
| |||||
| Total Management Fees, Net |
451,582 |
386,121 |
65,461 |
17 |
% | |||||||||||
| Fee Related Performance Revenues |
155,392 |
4,551 |
150,841 |
N/M |
||||||||||||
| Fee Related Compensation |
(188,492 |
) |
(120,296 |
) |
(68,196 |
) |
57 |
% | ||||||||
| Other Operating Expenses |
(44,362 |
) |
(40,476 |
) |
(3,886 |
) |
10 |
% | ||||||||
| |
|
|
|
|
|
|
|
|
|
|
| |||||
| Fee Related Earnings |
374,120 |
229,900 |
144,220 |
63 |
% | |||||||||||
| |
|
|
|
|
|
|
|
|
|
|
| |||||
| Realized Performance Revenues |
88,638 |
43,720 |
44,918 |
103 |
% | |||||||||||
| Realized Performance Compensation |
(22,762 |
) |
(13,392 |
) |
(9,370 |
) |
70 |
% | ||||||||
| Realized Principal Investment Income |
100,820 |
7,300 |
93,520 |
N/M |
||||||||||||
| |
|
|
|
|
|
|
|
|
|
|
| |||||
| Net Realizations |
166,696 |
37,628 |
129,068 |
343 |
% | |||||||||||
| |
|
|
|
|
|
|
|
|
|
|
| |||||
| Segment Distributable Earnings |
$ |
540,816 |
$ |
267,528 |
$ |
273,288 |
102 |
% | ||||||||
| |
|
|
|
|
|
|
|
|
|
|
| |||||
N/M Not meaningful.
Three Months Ended March 31, 2021 Compared to Three Months Ended March 31, 2020
Segment Distributable Earnings were $540.8 million for the three months ended March 31, 2021, an increase of $273.3 million, or 102%, compared to $267.5 million, for the three months ended March 31, 2020. The increase in Segment Distributable Earnings was attributable to increases of $144.2 million in Fee Related Earnings and $129.1 million in Net Realizations.
Segment Distributable Earnings in our Real Estate segment in the first quarter of 2021 were higher compared to the first quarter of 2020. This was primarily driven by increased Fee Related Earnings due to the crystallization of performance revenues for certain vehicles, by growth in Fee-Earning Assets Under Management in core+ real estate and by an increase in Net Realizations. Favorable market conditions have contributed to significant realizations. We have also benefited from fundraising momentum in perpetual capital strategies, which represent an increasing percentage of our total assets under management. Economic recovery and activity in the U.S. have accelerated following meaningful progress on
COVID-19
vaccine production and distribution and support from previously implemented fiscal and monetary stimulus. Although certain investments in our real estate portfolio, such as those in the hospitality and retail sectors and in select office and residential assets in urban locations, have been materially impacted and could continue to be adversely affected by the COVID-19
pandemic, the majority of our aggregate global real estate portfolio in BREP and core+ real estate businesses is in sectors that have demonstrated greater resiliency. Nevertheless, 87
the global economic recovery could remain uneven with dispersion across sectors and regions, particularly given continued uncertainty in certain geographies experiencing or with potential for an increase in
COVID-19
infection levels. Higher inflation would potentially negatively impact certain real estate assets, such as those with long-term leases that do not provide for short term rent increases. Our real estate strategies have, however, oriented their portfolios toward investments in markets where we see opportunities for stronger relative growth, with better insulation from inflation pressure. Segment Distributable Earnings in our Real Estate segment would potentially be negatively impacted if pressure on wages and other inputs increasingly pressure profit margins. In addition, the Presidential administration and the U.S. Congress may introduce new or enforce existing policies and regulations that may create uncertainty for our business and investment strategies and could have an adverse impact on us and our portfolio companies. Such conditions (which may be across industries, sectors or geographies) may contribute to adverse operating performance, including moderated rent growth in certain markets in our residential portfolio. See “Part I. Item 1A. Risk Factors — Risks Related to Our Business — The global outbreak of the novel coronavirus, or
COVID-19,
has caused severe disruptions in the U.S. and global economies and has adversely impacted, and may continue to adversely impact, our performance and results of operations,” “— Difficult market and geopolitical conditions can adversely affect our business in many ways, each of which could materially reduce our revenue, earnings and cash flow and adversely affect our financial prospects and condition” and “— A period of economic slowdown, which may be across one or more industries, sectors or geographies, has contributed and could in the future contribute to adverse operating performance for certain of our funds’ investments, which would adversely affect our operating results and cash flows” in our Annual Report on Form 10-K for the year ended December 31, 2020. Fee Related Earnings
Fee Related Earnings were $374.1 million for the three months ended March 31, 2021, an increase of $144.2 million, or 63%, compared to $229.9 million for the three months ended March 31, 2020. The increase in Fee Related Earnings was primarily attributable to increases of $150.8 million in Fee Related Performance Revenues and $65.5 million in Management Fees, Net, partially offset by an increase of $68.2 million in Fee Related Compensation.
Fee Related Performance Revenues were $155.4 million for the three months ended March 31, 2021, an increase of $150.8 million, compared to $4.6 million for the three months ended March 31, 2020. The increase was primarily due to crystallization events in the Logicor separately managed account and BPP Europe.
Management Fees, Net were $451.6 million for the three months ended March 31, 2021, an increase of $65.5 million, compared to $386.1 million for the three months ended March 31, 2020, primarily driven by an increase in Base Management Fees. Base Management Fees increased $55.7 million primarily due to Fee-Earning Assets Under Management growth in Core+ real estate and the end of BREP Europe VI’s fee holiday in the first quarter of 2020.
Fee Related Compensation was $188.5 million for the three months ended March 31, 2021, an increase of $68.2 million, compared to $120.3 million for the three months ended March 31, 2020. The increase was primarily due to an increase in Fee Related Performance Revenues, on which a portion of Fee Related Compensation is based.
Net Realizations
Net Realizations were $166.7 million for the three months ended March 31, 2021, an increase of $129.1 million, or 343%, compared to $37.6 million for the three months ended March 31, 2020. The increase in Net Realizations was primarily attributable to increases of $93.5 million in Realized Principal Investment Income and $44.9 million in Realized Performance Revenues, partially offset by an increase of $9.4 million in Realized Performance Compensation.
88
Realized Principal Investment Income was $100.8 million for the three months ended March 31, 2021, an increase of $93.5 million, compared to $7.3 million for the three months ended March 31, 2020. The increase was primarily due to the segment’s allocation of the gain recognized in the Pátria Sale Transactions. For additional information, see “— Notable Transactions.”
Realized Performance Revenues were $88.6 million for the three months ended March 31, 2021, an increase of $44.9 million, compared to $43.7 million for the three months ended March 31, 2020. The increase was primarily due to higher realized gains in the three months ended March 31, 2021 compared to the three months ended March 31, 2020.
Realized Performance Compensation was $22.8 million for the three months ended March 31, 2021, an increase of $9.4 million, compared to $13.4 million for the three months ended March 31, 2020. The increase was primarily due to the increase in Realized Performance Revenues.
Fund Returns
Fund return information for our significant funds is included throughout this discussion and analysis to facilitate an understanding of our results of operations for the periods presented. The fund returns information reflected in this discussion and analysis is not indicative of the financial performance of Blackstone and is also not necessarily indicative of the future performance of any particular fund. An investment in Blackstone is not an investment in any of our funds. There can be no assurance that any of our funds or our other existing and future funds will achieve similar returns.
The following table presents the internal rates of return, except where noted, of our significant real estate funds:
Three Months Ended |
March 31, 2021 | |||||||||||||||||||||||||||||||
March 31, |
Inception to Date | |||||||||||||||||||||||||||||||
2021 |
2020 |
Realized |
Total | |||||||||||||||||||||||||||||
| Fund (a) |
Gross |
Net |
Gross |
Net |
Gross |
Net |
Gross |
Net | ||||||||||||||||||||||||
| BREP VI |
-4% | -4% | -19% | -16% | 18% | 13% | 17% | 13% | ||||||||||||||||||||||||
| BREP VII |
3% | 2% | -15% | -13% | 30% | 22% | 21% | 14% | ||||||||||||||||||||||||
| BREP VIII |
4% | 3% | -8% | -7% | 36% | 29% | 20% | 14% | ||||||||||||||||||||||||
| BREP IX |
8% | 6% | N/M | N/M | N/M | N/M | 35% | 21% | ||||||||||||||||||||||||
| BREP Europe IV (b) |
— | — | -9% | -7% | 29% | 20% | 20% | 14% | ||||||||||||||||||||||||
| BREP Europe V (b) |
4% | 3% | -8% | -7% | 67% | 52% | 15% | 10% | ||||||||||||||||||||||||
| BREP Europe VI (b) |
6% | 5% | N/M | N/M | N/M | N/M | 16% | 6% | ||||||||||||||||||||||||
| BREP Asia I |
7% | 6% | -15% | -13% | 29% | 21% | 19% | 13% | ||||||||||||||||||||||||
| BREP Asia II |
8% | 8% | -8% | -8% | 77% | 50% | 20% | 11% | ||||||||||||||||||||||||
| BREP Co-Investment (c) |
4% | 3% | -2% | -2% | 18% | 16% | 18% | 16% | ||||||||||||||||||||||||
| BPP (d) |
2% | 2% | -2% | -2% | N/M | N/M | 10% | 9% | ||||||||||||||||||||||||
| BREDS High-Yield (e) |
5% | 4% | -12% | -11% | 15% | 11% | 14% | 10% | ||||||||||||||||||||||||
| BREDS Liquid (f) |
6% | 6% | -21% | -21% | N/A | N/A | 9% | 7% | ||||||||||||||||||||||||
| BXMT (g) |
N/A | 15% | N/A | -48% | N/A | N/A | N/A | 11% | ||||||||||||||||||||||||
| BREIT (h) |
N/A | 4% | N/A | -8% | N/A | N/A | N/A | 9% | ||||||||||||||||||||||||
89
The returns presented herein represent those of the applicable Blackstone Funds and not those of Blackstone.
| N/M | Not meaningful generally due to the limited time since initial investment. |
| N/A | Not applicable. |
| (a) | Net returns are based on the change in carrying value (realized and unrealized) after management fees, expenses and Performance Revenues. |
| (b) | Euro-based internal rates of return. |
| (c) | BREP Co-Investment represents co-investment capital raised for various BREP investments. The Net IRR reflected is calculated by aggregating each co-investment’s realized proceeds and unrealized value, as applicable, after management fees, expenses and Performance Revenues. |
| (d) | BPP represents the Core+ real estate funds which invest with a more modest risk profile and lower leverage. |
| (e) | BREDS High-Yield represents the flagship real estate debt drawdown funds and excludes the BREDS High-Grade drawdown fund, which has a different risk-return profile. Inception to date returns are from July 1, 2009. |
| (f) | BREDS Liquid represents BREDS funds that invest in liquid real estate debt securities, except funds in liquidation and insurance mandates with specific investment objectives. The returns presented represent summarized asset-weighted gross and net rates of return from August 1, 2008. Inception to Date returns are presented on an annualized basis. |
| (g) | Reflects annualized return of a shareholder invested in BXMT as of the beginning of each period presented, assuming reinvestment of all dividends received during the period, and net of all fees and expenses incurred by BXMT. Return incorporates the closing NYSE stock price as of each period end. Inception to date returns are from May 22, 2013. |
| (h) | Reflects a per share blended return for each respective period, assuming BREIT had a single share class, reinvestment of all dividends received during the period, and no upfront selling commission, net of all fees and expenses incurred by BREIT. These returns are not representative of the returns experienced by any particular investor or share class. Inception to date returns are presented on an annualized basis and are from January 1, 2017. |
Funds With Closed Investment Periods
The Real Estate segment has eleven funds with closed investment periods as of March 31, 2021: BREP VIII, BREP VII, BREP VI, BREP V, BREP IV, BREP Europe V, BREP Europe IV, BREP Europe Ill, BREP Asia I, BREDS Ill and BREDS II. As of March 31, 2021, BREP VII, BREP VI, BREP V, BREP IV, BREP Europe IV, BREP Europe Ill and BREDS II were above their carried interest thresholds and would have been above their carried interest thresholds even if all remaining investments were valued at zero. BREP VIII, BREP Europe V, BREP Asia I and BREDS III were above their carried interest thresholds.
90
Private Equity
The following table presents the results of operations for our Private Equity segment:
Three Months Ended |
||||||||||||||||
March 31, |
2021 vs. 2020 | |||||||||||||||
2021 |
2020 |
$ |
% | |||||||||||||
(Dollars in Thousands) | ||||||||||||||||
| Management and Advisory Fees, Net |
||||||||||||||||
| Base Management Fees |
$ |
377,660 |
$ |
253,974 |
$ |
123,686 |
49 |
% | ||||||||
| Transaction, Advisory and Other Fees, Net |
42,707 |
21,413 |
21,294 |
99 |
% | |||||||||||
| Management Fee Offsets |
(13,919 |
) |
(9,215 |
) |
(4,704 |
) |
51 |
% | ||||||||
| |
|
|
|
|
|
|
|
|
|
|
| |||||
| Total Management and Advisory Fees, Net |
406,448 |
266,172 |
140,276 |
53 |
% | |||||||||||
| Fee Related Compensation |
(140,597 |
) |
(110,368 |
) |
(30,229 |
) |
27 |
% | ||||||||
| Other Operating Expenses |
(51,055 |
) |
(41,001 |
) |
(10,054 |
) |
25 |
% | ||||||||
| |
|
|
|
|
|
|
|
|
|
|
| |||||
| Fee Related Earnings |
214,796 |
114,803 |
99,993 |
87 |
% | |||||||||||
| |
|
|
|
|
|
|
|
|
|
|
| |||||
| Realized Performance Revenues |
255,845 |
112,076 |
143,769 |
128 |
% | |||||||||||
| Realized Performance Compensation |
(111,209 |
) |
(54,643 |
) |
(56,566 |
) |
104 |
% | ||||||||
| Realized Principal Investment Income |
115,403 |
10,347 |
105,056 |
N/M |
||||||||||||
| |
|
|
|
|
|
|
|
|
|
|
| |||||
| Net Realizations |
260,039 |
67,780 |
192,259 |
284 |
% | |||||||||||
| |
|
|
|
|
|
|
|
|
|
|
| |||||
| Segment Distributable Earnings |
$ |
474,835 |
$ |
182,583 |
$ |
292,252 |
160 |
% | ||||||||
| |
|
|
|
|
|
|
|
|
|
|
| |||||
| N/M | Not meaningful. |
Three Months Ended March 31, 2021 Compared to Three Months Ended March 31, 2020
Segment Distributable Earnings were $474.8 million for the three months ended March 31, 2021, an increase of $292.3 million, or 160%, compared to $182.6 million for the three months ended March 31, 2020. The increase in Segment Distributable Earnings was attributable to increases of $100.0 million in Fee Related Earnings and $192.3 million in Net Realizations.
Segment Distributable Earnings in our Private Equity segment in the first quarter of 2021 were higher compared to the first quarter of 2020. This was primarily driven by an increase in Fee Related Earnings due to the conclusion of fee holidays and the commencement of investment periods in certain vehicles, as well as an increase in Net Realizations. Favorable market conditions in the first quarter of 2021 have contributed to significant realizations and fundraising momentum. Economic recovery and activity in the U.S. have accelerated following meaningful progress on
COVID-19
vaccine production and distribution and support from previously implemented fiscal and monetary stimulus. Although certain investments in our private equity portfolio, such as those in the travel, leisure and events sectors, have experienced material reductions in value and could continue to be adversely impacted by the COVID-19
pandemic, the majority of our aggregate portfolio in our corporate private equity funds is in sectors that have demonstrated greater resiliency. Nevertheless, the global economic recovery could remain uneven with dispersion across sectors and regions, particularly given continued uncertainty in certain geographies experiencing or with potential for an increase in COVID-19
infection levels. Higher inflation would potentially negatively impact Segment Distributable Earnings in our Private Equity segment, particularly if occurring against a backdrop of slow economic growth. Segment Distributable Earnings in the Private Equity segment would also potentially be negatively impacted if pressure on wages and other inputs increasingly pressure profit margins. 91
In energy, oil prices experienced further recovery in the first quarter of 2021, but weakened market fundamentals nonetheless continue to pose challenges, particularly in upstream energy. An increased focus on energy sustainability due to concerns about climate change and the impact of carbon emissions, including potential alternatives to fossil fuels, has also exacerbated the impact of such weakened market fundamentals. The persistence of these weakened market fundamentals would further negatively impact the performance of certain investments in our energy and corporate private equity funds.
In addition, the Presidential administration and the U.S. Congress may introduce new or enforce existing policies and regulations that may create uncertainty for our business and investment strategies and could have an adverse impact on us and our portfolio companies. See “Part I. Item 1A. Risk Factors — Risks Related to Our Business — The global outbreak of the novel coronavirus, or
COVID-19,
has caused severe disruptions in the U.S. and global economies and has adversely impacted, and may continue to adversely impact, our performance and results of operations,” “— Difficult market and geopolitical conditions can adversely affect our business in many ways, each of which could materially reduce our revenue, earnings and cash flow and adversely affect our financial prospects and condition” and “— A period of economic slowdown, which may be across one or more industries, sectors or geographies, has contributed and could in the future contribute to adverse operating performance for certain of our funds’ investments, which would adversely affect our operating results and cash flows” in our Annual Report on Form 10-K for the year ended December 31, 2020. Fee Related Earnings
Fee Related Earnings were $214.8 million for the three months ended March 31, 2021, an increase of $100.0 million, or 87%, compared to $114.8 million for the three months ended March 31, 2020. The increase in Fee Related Earnings was primarily attributable to an increase of $140.3 million in Management and Advisory Fees, Net, partially offset by increases of $30.2 million in Fee Related Compensation and $10.1 million in Other Operating Expenses.
Management and Advisory Fees, Net were $406.5 million for the three months ended March 31, 2021, an increase of $140.3 million, compared to $266.2 million for the three months ended March 31, 2020, primarily driven by an increase in Base Management Fees. Base Management Fees increased $123.7 million primarily due to BCP VIII, BEP III and BXLS V, all of which commenced their investment periods in the first quarter of 2020 and ended their fee holidays during the third quarter of2020, and the commencement of BXG’s investment period in the third quarter of 2020.
The annualized Base Management Fee Rate increased from 0.90% at March 31, 2020 to 1.16% at March 31,2021. The increase was principally due to BCP VIII, BEP III and BXLS V, all of which commenced their investment periods in the first quarter of 2020 and ended their fee holidays during the third quarter of 2020.
Fee Related Compensation was $140.6 million for the three months ended March 31, 2021, an increase of $30.2 million, compared to $110.4 million for the three months ended March 31, 2020. The increase was primarily due to an increase in Management and Advisory Fees, Net on which a portion of Fee Related Compensation is based.
Other Operating Expenses were $51.1 million for the three months ended March 31, 2021, an increase of $10.1 million, compared to $41.0 million for the three months ended March 31, 2020. The increase was primarily due to growth in our corporate private equity, BXG and Strategic Partners businesses.
Net Realizations
Net Realizations were $260.0 million for the three months ended March 31, 2021, an increase of $192.3 million, or 284%, compared to $67.8 million for the three months ended March 31, 2020. The increase in Net Realizations was primarily attributable to increases of $143.8 million in Realized Performance Revenues and $105.1 million in Realized Principal Investment Income, partially offset by an increase of $56.6 million in Realized Performance Compensation.
92
Realized Performance Revenues were $255.8 million for the three months ended March 31, 2021, an increase of $143.8 million, compared to $112.1 million for the three months ended March 31, 2020. The increase was primarily due to higher Realized Performance Revenues in Tactical Opportunities, corporate private equity and BXG.
Realized Principal Investment Income was $115.4 million for the three months ended March 31, 2021, an increase of $105.1 million, compared to $10.3 million for the three months ended March 31, 2020. The increase was primarily due to the segment’s allocation of the gain recognized in the Pátria Sale Transactions. For additional information, see “— Notable Transactions.”
Realized Performance Compensation was $111.2 million for the three months ended March 31, 2021, an increase of $56.6 million, compared to $54.6 million for the three months ended March 31, 2020. The increase was primarily due to the increase in Realized Performance Revenues.
Fund Returns
Fund returns information for our significant funds is included throughout this discussion and analysis to facilitate an understanding of our results of operations for the periods presented. The fund returns information reflected in this discussion and analysis is not indicative of the financial performance of Blackstone and is also not necessarily indicative of the future performance of any particular fund. An investment in Blackstone is not an investment in any of our funds. There can be no assurance that any of our funds or our other existing and future funds will achieve similar returns.
The following table presents the internal rates of return of our significant private equity funds:
Three Months Ended |
March 31, 2021 | |||||||||||||||||||||||||||||||
March 31, |
Inception to Date | |||||||||||||||||||||||||||||||
2021 |
2020 |
Realized |
Total | |||||||||||||||||||||||||||||
| Fund (a) |
Gross |
Net |
Gross |
Net |
Gross |
Net |
Gross |
Net | ||||||||||||||||||||||||
| BCP IV |
8% | 6% | 1% | 1% | 50% | 36% | 50% | 36% | ||||||||||||||||||||||||
| BCP V |
118% | 54% | -26% | -10% | 10% | 8% | 10% | 8% | ||||||||||||||||||||||||
| BCP VI |
10% | 9% | -27% | -23% | 22% | 17% | 17% | 13% | ||||||||||||||||||||||||
| BCP VII |
13% | 10% | -14% | -12% | 36% | 22% | 26% | 18% | ||||||||||||||||||||||||
| BCP Asia I |
17% | 15% | -1% | -2% | 292% | 145% | 61% | 40% | ||||||||||||||||||||||||
| BEP I |
32% | 28% | -47% | -40% | 19% | 15% | 14% | 11% | ||||||||||||||||||||||||
| BEP II |
21% | 21% | -50% | -51% | 1% | -6% | 2% | -2% | ||||||||||||||||||||||||
| BEP III |
28% | 23% | N/M | N/A | N/A | N/A | 188% | 106% | ||||||||||||||||||||||||
| BCOM |
41% | 41% | 1% | — | 13% | 6% | 13% | 6% | ||||||||||||||||||||||||
| BCEP I (b) |
16% | 15% | -6% | -5% | 35% | 28% | 27% | 23% | ||||||||||||||||||||||||
| BIP |
25% | 19% | -11% | -11% | N/A | N/A | 21% | 13% | ||||||||||||||||||||||||
| Clarus IV |
12% | 10% | 2% | 1% | 24% | 15% | 28% | 15% | ||||||||||||||||||||||||
| Tactical Opportunities |
17% | 14% | -20% | -18% | 22% | 17% | 17% | 13% | ||||||||||||||||||||||||
| Tactical Opportunities Co-Investment and Other |
13% | 11% | -11% | -10% | 21% | 19% | 19% | 16% | ||||||||||||||||||||||||
| Strategic Partners I-V (c) |
6% | 5% | 2% | 1% | N/A | N/A | 16% | 13% | ||||||||||||||||||||||||
| Strategic Partners VI (c) |
9% | 8% | -1% | -2% | N/A | N/A | 19% | 14% | ||||||||||||||||||||||||
| Strategic Partners VII (c) |
12% | 11% | — | — | N/A | N/A | 20% | 15% | ||||||||||||||||||||||||
| Strategic Partners Real Assets II (c) |
2% | 2% | 4% | 3% | N/A | N/A | 16% | 12% | ||||||||||||||||||||||||
| Strategic Partners VIII (c) |
19% | 15% | N/M | N/M | N/A | N/A | 46% | 32% | ||||||||||||||||||||||||
| Strategic Partners Real Estate, SMA and Other (c) |
6% | 6% | 2% | 1% | N/A | N/A | 16% | 14% | ||||||||||||||||||||||||
The returns presented herein represent those of the applicable Blackstone Funds and not those of Blackstone.
| N/M | Not meaningful generally due to the limited time since initial investment. |
93
| N/A | Not applicable. |
| SMA | Separately managed account. |
| (a) | Net returns are based on the change in carrying value (realized and unrealized) after management fees, expenses and Performance Revenues. |
| (b) | BCEP is a core private equity strategy which invests with a more modest risk profile and longer hold period than traditional private equity. |
| (c) | Realizations are treated as return of capital until fully recovered and therefore inception to date realized returns are not applicable. If information is not available on a timely basis, returns are calculated from results that are reported on a three month lag and therefore do not include the impact of economic and market activities in the quarter in which such events occur. |
Funds With Closed Investment Periods
The corporate private equity funds within the Private Equity segment have eight funds with closed investment periods: BCP IV, BCP V, BCP VI, BCP VII, BCOM, BEP I, BEP II and BCEP I. As of March 31, 2021, BCP IV was above its carried interest threshold (i.e., the preferred return payable to its limited partners before the general partner is eligible to receive carried interest) and would still be above its carried interest threshold even if all remaining investments were valued at zero. BCP V is comprised of two fund classes based on the timings of fund closings, the BCP V “main fund” and BCP V-AC fund. Within these fund classes, the general partner is subject to equalization such that (a) the general partner accrues carried interest when the respective carried interest for either fund class is positive and (b) the general partner realizes carried interest so long as clawback obligations, if any, for either of the respective fund classes are fully satisfied. BCP V, BCP VI, BCP VII, BCOM, BEP I and BCEP I were above their respective carried interest thresholds. We are entitled to retain previously realized carried interest up to 20% of BCOM’s net gains. As a result, Performance Revenues are recognized from BCOM on current period gains and losses. BEP II was below its carried interest threshold.
Hedge Fund Solutions
The following table presents the results of operations for our Hedge Fund Solutions segment:
Three Months Ended |
||||||||||||||||
March 31, |
2021 vs. 2020 | |||||||||||||||
2021 |
2020 |
$ |
% | |||||||||||||
(Dollars in Thousands) | ||||||||||||||||
| Management Fees, Net |
||||||||||||||||
| Base Management Fees |
$ |
150,533 |
$ |
139,656 |
$ |
10,877 |
8 |
% | ||||||||
| Transaction and Other Fees, Net |
4,346 |
758 |
3,588 |
473 |
% | |||||||||||
| Management Fee Offsets |
(58 |
) |
(42 |
) |
(16 |
) |
38 |
% | ||||||||
| |
|
|
|
|
|
|
|
|
|
|
| |||||
| Total Management Fees, Net |
154,821 |
140,372 |
14,449 |
10 |
% | |||||||||||
| Fee Related Compensation |
(38,850 |
) |
(46,191 |
) |
7,341 |
-16 |
% | |||||||||
| Other Operating Expenses |
(19,172 |
) |
(18,667 |
) |
(505 |
) |
3 |
% | ||||||||
| |
|
|
|
|
|
|
|
|
|
|
| |||||
| Fee Related Earnings |
96,799 |
75,514 |
21,285 |
28 |
% | |||||||||||
| |
|
|
|
|
|
|
|
|
|
|
| |||||
| Realized Performance Revenues |
31,573 |
1,767 |
29,806 |
N/M |
||||||||||||
| Realized Performance Compensation |
(6,908 |
) |
(945 |
) |
(5,963 |
) |
631 |
% | ||||||||
| Realized Principal Investment Income (Loss) |
35,550 |
(609 |
) |
36,159 |
N/M |
|||||||||||
| |
|
|
|
|
|
|
|
|
|
|
| |||||
| Net Realizations |
60,215 |
213 |
60,002 |
N/M |
||||||||||||
| |
|
|
|
|
|
|
|
|
|
|
| |||||
| Segment Distributable Earnings |
$ |
157,014 |
$ |
75,727 |
$ |
81,287 |
107 |
% | ||||||||
| |
|
|
|
|
|
|
|
|
|
|
| |||||
| N/M | Not meaningful. |
94
Three Months Ended March 31, 2021 Compared to Three Months Ended March 31, 2020
Segment Distributable Earnings were $157.0 million for the three months ended March 31, 2021, an increase of $81.3 million, or 107%, compared to $75.7 million for the three months ended March 31, 2020. The increase in Segment Distributable Earnings was attributable to increases of $21.3 million in Fee Related Earnings and $60.0 million in Net Realizations.
Segment Distributable Earnings in our Hedge Fund Solutions segment in the first quarter of 2021 were higher compared to the first quarter of 2020. This increase was primarily driven by an increase in Fee Related Earnings due to growth in Fee-Earning Assets Under Management, as well as by an increase in Net Realizations. Continued market rebounds across many asset classes have contributed to recovery from the losses in composite returns experienced in the first quarter of 2020, and the Hedge Fund Solutions segment had its highest ever fund appreciation for the last twelve months ended the first quarter of 2021. Economic recovery and activity have accelerated following meaningful progress on
COVID-19
vaccine production and distribution and support from previously implemented fiscal and monetary stimulus. The segment has also benefited from favorable liquidity conditions in recent quarters. Nevertheless, the recovery could remain uneven with meaningful dispersion across sectors and regions, particularly given continued uncertainty in certain geographies experiencing or with potential for an increase in COVID-19
infection levels. Another significant market downturn could pose material risks to our Hedge Fund Solutions segment, including by potentially causing investors to seek liquidity in the form of redemptions from our funds and adversely impacting management fees. In an equity market environment that generally has been characterized by relatively low volatility, investors may choose to reallocate capital away from traditional hedge fund strategies. Our Hedge Fund Solutions segment operates multiple business lines, manages strategies that are both long and short asset classes and generates a majority of its revenue through management fees. In that regard, the segment’s revenues will depend in part on our ability to successfully grow such existing diverse business lines and strategies, and identify new ones to meet evolving investor appetites. Over time we expect an increasing change in the mix of our product offerings to products whose performance-based fees represent a more significant proportion of the fees than has historically been the case for such products.
In addition, the Presidential administration and the U.S. Congress may introduce new or enforce existing policies and regulations that may create uncertainty for our business and investment strategies and may adversely affect the profitability of certain of our investments. See “Part I. Item 1A. Risk Factors — Risks Related to Our Business — The global outbreak of the novel coronavirus, or
COVID-19,
has caused severe disruptions in the U.S. and global economies and has adversely impacted, and may continue to adversely impact, our performance and results of operations,” “— Difficult market and geopolitical conditions can adversely affect our business in many ways, each of which could materially reduce our revenue, earnings and cash flow and adversely affect our financial prospects and condition” and “— A period of economic slowdown, which may be across one or more industries, sectors or geographies, has contributed and could in the future contribute to adverse operating performance for certain of our funds’ investments, which would adversely affect our operating results and cash flows” in our Annual Report on Form 10-K for the year ended December 31, 2020. Fee Related Earnings
Fee Related Earnings were $96.8 million for the three months ended March 31, 2021, an increase of $21.3 million, or 28%, compared to $75.5 million for the three months ended March 31, 2020. The increase in Fee Related Earnings was primarily attributable to an increase of $14.4 million in Management Fees, Net and a decrease of $7.3 million in Fee Related Compensation.
Management Fees, Net were $154.8 million for the three months ended March 31, 2021, an increase of $14.4 million, compared to $140.4 million for the three months ended March 31, 2020, primarily due to an increase in Base Management Fees. Base Management Fees increased $10.9 million primarily driven by an Fee-Earning Assets Under Management growth in our individual investor and specialized solutions platform.
95
Fee Related Compensation was $38.9 million for the three months ended March 31, 2021, a decrease of $7.3 million, compared to $46.2 million for the three months ended March 31, 2020. The decrease was primarily due to changes in compensation accruals.
Net Realizations
Net Realizations were $60.2 million for the three months ended March 31, 2021, an increase of $60.0 million, compared to $0.2 million for the three months ended March 31, 2020. The increase in Net Realizations was primarily attributable to increases of $36.2 million in Realized Principal Investment Income (Loss) and $29.8 million in Realized Performance Revenues.
Realized Principal Investment Income (Loss) was $35.6 million for the three months ended March 31, 2021, an increase of $36.2 million, compared to $(0.6) million for the three months ended March 31, 2020. The increase was primarily due to the segment’s allocation of the gain recognized in the Pátria Sale Transactions. For additional information, see “— Notable Transactions.”
Realized Performance Revenues were $31.6 million for the three months ended March 31, 2021, an increase of $29.8 million, compared to $1.8 million for the three months ended March 31, 2020. The increase was primarily driven by realizations and higher returns for the three months ended March 31, 2021 compared to the three months ended March 31, 2020, principally within customized solutions and commingled products.
Composite Returns
Composite returns information is included throughout this discussion and analysis to facilitate an understanding of our results of operations for the periods presented. The composite returns information reflected in this discussion and analysis is not indicative of the financial performance of Blackstone and is also not necessarily indicative of the future results of any particular fund or composite. An investment in Blackstone is not an investment in any of our funds or composites. There can be no assurance that any of our funds or composites or our other existing and future funds or composites will achieve similar returns.
The following table presents the return information of the BAAM Principal Solutions Composite:
Three |
Average Annual Returns (a) | |||||||||||||||||||||||||||||||||||||||||||||||
Months Ended |
Periods Ended | |||||||||||||||||||||||||||||||||||||||||||||||
March 31, |
March 31, 2021 | |||||||||||||||||||||||||||||||||||||||||||||||
2021 |
2020 |
One Year |
Three Year |
Five Year |
Historical | |||||||||||||||||||||||||||||||||||||||||||
| Composite |
Gross |
Net |
Gross |
Net |
Gross |
Net |
Gross |
Net |
Gross |
Net |
Gross |
Net | ||||||||||||||||||||||||||||||||||||
| BAAM Principal Solutions Composite (b) |
2 | % | 2 | % | -9 | % | -9 | % | 18 | % | 17 | % | 6 | % | 5 | % | 7 | % | 6 | % | 7 | % | 6 | % | ||||||||||||||||||||||||
The returns presented herein represent those of the applicable Blackstone Funds and not those of Blackstone.
| (a) | Composite returns present a summarized asset-weighted return measure to evaluate the overall performance of the applicable class of Blackstone Funds. |
| (b) | BAAM’s Principal Solutions (“BPS”) Composite covers the period from January 2000 to present, although BAAM’s inception date is September 1990. The BPS Composite includes only BAAM-managed commingled and customized multi-manager funds and accounts and does not include BAAM’s individual investor solutions (liquid alternatives), strategic capital (seeding and GP minority stakes), strategic opportunities (co-invests), and advisory (non-discretionary) platforms, except for investments by BPS funds directly into those platforms. BAAM-managed funds in liquidation and, in the case of net returns, non-fee-paying assets are also excluded. The funds/accounts that comprise the BPS Composite are not managed within a single fund or account and are managed with different mandates. There is no guarantee that BAAM would have made the same mix of investments in a stand-alone fund/account. The BPS Composite is not an investible product and, as such, the performance of the BPS Composite does not represent the performance of an actual fund or account. The historical return is from January 1, 2000. |
96
Operating Metrics
The following table presents information regarding our Invested Performance Eligible Assets Under Management:
Invested Performance |
Estimated % Above | |||||||||||||||
Eligible Assets Under |
High Water Mark/ | |||||||||||||||
Management |
Benchmark (a) | |||||||||||||||
As of March 31, |
As of March 31, | |||||||||||||||
2021 |
2020 |
2021 |
2020 | |||||||||||||
(Dollars in Thousands) |
||||||||||||||||
| Hedge Fund Solutions Managed Funds (b) |
$ |
49,017,154 |
$ |
39,406,514 |
91 |
% |
4 |
% | ||||||||
| (a) | Estimated % Above High Water Mark/Benchmark represents the percentage of Invested Performance Eligible Assets Under Management that as of the dates presented would earn performance fees when the applicable Hedge Fund Solutions managed fund has positive investment performance relative to a benchmark, where applicable. Incremental positive performance in the applicable Blackstone Funds may cause additional assets to reach their respective High Water Mark or clear a benchmark return, thereby resulting in an increase in Estimated % Above High Water Mark/Benchmark. |
| (b) | For the Hedge Fund Solutions managed funds, at March 31, 2021, the incremental appreciation needed for the 9% of Invested Performance Eligible Assets Under Management below their respective High Water Marks/Benchmarks to reach their respective High Water Marks/Benchmarks was $375.0 million, a decrease of $(4.3) billion, compared to $4.7 billion at March 31, 2020. Of the Invested Performance Eligible Assets Under Management below their respective High Water Marks/Benchmarks as of March 31, 2021, 45% were within 5% of reaching their respective High Water Mark. |
97
Credit & Insurance
The following table presents the results of operations for our Credit & Insurance segment:
Three Months Ended |
||||||||||||||||
March 31, |
2021 vs. 2020 | |||||||||||||||
2021 |
2020 |
$ |
% | |||||||||||||
(Dollars in Thousands) | ||||||||||||||||
| Management Fees, Net |
||||||||||||||||
| Base Management Fees |
$ |
161,911 |
$ |
145,328 |
$ |
16,583 |
11 |
% | ||||||||
| Transaction and Other Fees, Net |
5,568 |
5,470 |
98 |
2 |
% | |||||||||||
| Management Fee Offsets |
(2,125 |
) |
(2,896 |
) |
771 |
-27 |
% | |||||||||
| |
|
|
|
|
|
|
|
|
|
|
| |||||
| Total Management Fees, Net |
165,354 |
147,902 |
17,452 |
12 |
% | |||||||||||
| Fee Related Performance Revenues |
13,776 |
7,915 |
5,861 |
74 |
% | |||||||||||
| Fee Related Compensation |
(77,171 |
) |
(69,409 |
) |
(7,762 |
) |
11 |
% | ||||||||
| Other Operating Expenses |
(46,835 |
) |
(38,741 |
) |
(8,094 |
) |
21 |
% | ||||||||
| |
|
|
|
|
|
|
|
|
|
|
| |||||
| Fee Related Earnings |
55,124 |
47,667 |
7,457 |
16 |
% | |||||||||||
| |
|
|
|
|
|
|
|
|
|
|
| |||||
| Realized Performance Revenues |
25,267 |
9,670 |
15,597 |
161 |
% | |||||||||||
| Realized Performance Compensation |
(10,045 |
) |
(2,322 |
) |
(7,723 |
) |
333 |
% | ||||||||
| Realized Principal Investment Income |
46,383 |
3,252 |
43,131 |
N/M |
||||||||||||
| |
|
|
|
|
|
|
|
|
|
|
| |||||
| Net Realizations |
61,605 |
10,600 |
51,005 |
481 |
% | |||||||||||
| |
|
|
|
|
|
|
|
|
|
|
| |||||
| Segment Distributable Earnings |
$ |
116,729 |
$ |
58,267 |
$ |
58,462 |
100 |
% | ||||||||
| |
|
|
|
|
|
|
|
|
|
|
| |||||
| N/M | Not meaningful. |
Three Months Ended March 31, 2021 Compared to Three Months Ended March 31, 2020
Segment Distributable Earnings were $116.7 million for the three months ended March 31, 2021, an increase of $58.5 million, or 100%, compared to $58.3 million for the three months ended March 31, 2020. The increase in Segment Distributable Earnings was attributable to increases of $7.5 million in Fee Related Earnings and $51.0 million in Net Realizations.
Segment Distributable Earnings in our Credit & Insurance segment in the first quarter of 2021 were higher compared to the first quarter of 2020, driven by an increase in Fee Related Earnings due to capital deployment and fundraising activity, as well as by an increase in Net Realizations primarily due to an increase in Realized Principal Investment Income. Continued market rebounds across many asset classes have contributed to recovery from the losses in the composite returns experienced in the first quarter of 2020. Favorable market conditions in the first quarter have also contributed to significant realizations. We have also benefited from fundraising momentum in perpetual capital strategies, which represent an increasing percentage of our total assets under management. Economic recovery and activity in the U.S. have accelerated following meaningful progress on
COVID-19
vaccine production and distribution and support from previously implemented fiscal and monetary stimulus. Although the pandemic has adversely impacted and could continue to adversely impact the performance of our Credit & Insurance segment, the majority of the segment’s portfolio is in sectors that have demonstrated greater resiliency. The segment has also benefited from favorable liquidity conditions in recent quarters. Nevertheless, the recovery could remain uneven with meaningful dispersion across sectors and regions, particularly given continued uncertainty in certain geographies experiencing or with potential for an increase in COVID-19
infection levels. Another significant market downturn could create additional pressure for borrowers with respect to their ability to meet their debt payment obligations or increase their focus on deleveraging. Our Credit & Insurance funds have, however, continued to actively manage their portfolios in order to limit downside and protect capital. 98
In energy, oil prices experienced further recovery in the first quarter of 2021, but nonetheless, weakened market fundamentals continue to pose challenges, particularly in upstream energy. An increased focus on energy sustainability due to concerns about climate change and the impact of carbon emissions, including potential alternatives to fossil fuels, has also exacerbated the impact of such weakened market fundamentals. The persistence of these weakened market fundamentals in the energy sector or in the credit markets more broadly would further negatively impact the performance of certain investments in our credit funds.
In addition, the Presidential administration and the U.S. Congress may introduce new or enforce existing policies and regulations that may create uncertainty for our business and investment strategies and may adversely affect the profitability of certain of our investments. See “Part I. Item 1A. Risk Factors — Risks Related to Our Business — The global outbreak of the novel coronavirus, or COVID-19, has caused severe disruptions in the U.S. and global economies and has adversely impacted, and may continue to adversely impact, our performance and results of operations,” “— Difficult market and geopolitical conditions can adversely affect our business in many ways, each of which could materially reduce our revenue, earnings and cash flow and adversely affect our financial prospects and condition” and “— A period of economic slowdown, which may be across one or more industries, sectors or geographies, has contributed and could in the future contribute to adverse operating performance for certain of our funds’ investments, which would adversely affect our operating results and cash flows.” in our Annual Report on Form 10-K for the year ended December 31, 2020.
Fee Related Earnings
Fee Related Earnings were $55.1 million for the three months ended March 31, 2021, an increase of $7.5 million, or 16%, compared to $47.7 million for the three months ended March 31, 2020. The increase in Fee Related Earnings was primarily attributable to increases of $17.5 million in Management Fees, Net and $5.9 million in Fee Related Performance Revenues, partially offset by increases of $8.1 million in Other Operating Expenses and $7.8 million in Fee Related Compensation.
Management Fees, Net were $165.4 million for the three months ended March 31, 2021, an increase of $17.5 million, compared to $147.9 million for the three months ended March 31, 2020, primarily driven by an increase in Base Management Fees. Base Management Fees increased $16.6 million primarily due to increased capital deployed in our most recently launched credit funds and vehicles, including our BXSL, and inflows in our liquid credit business, partially offset by a decrease in Harvest.
Fee Related Performance Revenues were $13.8 million for the three months ended March 31, 2021, an increase of $5.9 million, compared to $7.9 million for the three months ended March 31, 2020. The increase was primarily due to performance and growth in assets in our BXSL.
Other Operating Expenses were $46.8 million for the three months ended March 31, 2021, an increase of $8.1 million, compared to $38.7 million for the three months ended March 31, 2020. The increase was primarily due to placement fees for new business initiatives as well as investments in technology.
Fee Related Compensation was $77.2 million for the three months ended March 31, 2021, an increase of $7.8 million, compared to $69.4 million for the three months ended March 31, 2020. The increase was primarily due to increases in Management Fees, Net and Fee Related Performance Revenues, on which a portion of Fee Related Compensation is based.
Net Realizations
Net Realizations were $61.6 million for the three months ended March 31, 2021, an increase of $51.0 million, or 481%, compared to $10.6 million for the three months ended March 31, 2020. The increase in Net Realizations was primarily attributable to increases of $43.1 million in Realized Principal Investment Income and $15.6 million in Realized Performance Revenues, partially offset by an increase of $7.7 million in Realized Performance Compensation.
99
Realized Principal Investment Income was $46.4 million for the three months ended March 31, 2021, an increase of $43.1 million, compared to $3.3 million for the three months ended March 31, 2020. The increase was primarily due to the segment’s allocation of the gain recognized in the Pátria Sale Transactions. For additional information, see “— Notable Transactions.”
Realized Performance Revenues were $25.3 million for the three months ended March 31, 2021, an increase of $15.6 million, compared to $9.7 million for the three months ended March 31, 2020. The increase was primarily attributable to an increase in realized carry compared to the three months ended March 31, 2020.
Realized Performance Compensation was $10.0 million for the three months ended March 31, 2021, an increase of $7.7 million, compared to $2.3 million for the three months ended March 31, 2020. The increase was primarily due to the increase in Realized Performance Revenues.
Composite Returns
Composite returns information is included throughout this discussion and analysis to facilitate an understanding of our results of operations for the periods presented. The composite returns information reflected in this discussion and analysis is not indicative of the financial performance of Blackstone and is also not necessarily indicative of the future results of any particular fund or composite. An investment in Blackstone is not an investment in any of our funds or composites. There can be no assurance that any of our funds or composites or our other existing and future funds or composites will achieve similar returns.
The following table presents the return information for the Private Credit and Liquid Credit composites:
Three Months Ended March 31, |
March 31, 2021 | |||||||||||||||||||||||
2021 |
2020 |
Inception to Date | ||||||||||||||||||||||
| Composite (a) |
Gross |
Net |
Gross |
Net |
Gross |
Net | ||||||||||||||||||
| Private Credit (b) |
7 |
% |
6 |
% |
-22 |
% |
-20 |
% |
11 |
% |
7 |
% | ||||||||||||
| Liquid Credit (b) |
2 |
% |
2 |
% |
-12 |
% |
-12 |
% |
5 |
% |
5 |
% | ||||||||||||
The returns presented herein represent those of the applicable Blackstone Funds and not those of Blackstone.
| (a) | Net returns are based on the change in carrying value (realized and unrealized) after management fees, expenses and Performance Allocations, net of tax advances. |
| (b) | Effective January 1, 2021, Credit returns are presented as separate returns for Private Credit and Liquid Credit instead of as a Credit Composite. Private Credit returns include mezzanine lending funds and middle market direct lending funds (including BXSL), stressed/distressed strategies (including stressed/distressed funds and credit alpha strategies) and energy strategies. Liquid Credit returns include CLOs, closed-ended funds, open-ended funds and separately managed accounts. Only fee-earning funds exceeding $100 million of fair value at the beginning of each respective quarter-end are included. Funds in liquidation, funds investing primarily in investment grade corporate credit and our structured products group are excluded. Blackstone Funds that were contributed to BXC as part of Blackstone’s acquisition of BXC in March 2008 and the pre-acquisition date performance for funds and vehicles acquired by BXC subsequent to March 2008, are also excluded. Private Credit and Liquid Credit’s inception to date returns are from December 31, 2005. Prior periods have been updated to reflect this presentation. Credit Composite gross returns were 2%, (14)% and 9% for the three months ended March 31, 2021, the three months ended March 31, 2020 and inception to date March 31, 2021, respectively. Credit Composite net returns were 1%, (13)% and 6% for the three months ended March 31, 2021, the three months ended March 31, 2020 and inception to date March 31, 2021, respectively. |
100
Operating Metrics
The following table presents information regarding our Invested Performance Eligible Assets Under Management:
Invested Performance |
Estimated % Above | |||||||||||||||
Eligible Assets Under |
High Water Mark/ | |||||||||||||||
Management |
Hurdle (a) | |||||||||||||||
As of March 31, |
As of March 31, | |||||||||||||||
2021 |
2020 |
2021 |
2020 | |||||||||||||
(Dollars in Thousands) |
||||||||||||||||
| Credit & Insurance (b) |
$ |
34,794,664 |
$ |
23,076,505 |
66 |
% |
20 |
% | ||||||||
| (a) | Estimated % Above High Water Mark/Hurdle represents the percentage of Invested Performance Eligible Assets Under Management that as of the dates presented would earn performance fees when the applicable Credit & Insurance managed fund has positive investment performance relative to a hurdle, where applicable. Incremental positive performance in the applicable Blackstone Funds may cause additional assets to reach their respective High Water Mark or clear a hurdle return, thereby resulting in an increase in Estimated % Above High Water Mark/Hurdle. |
| (b) | For the Credit & Insurance managed funds, at March 31, 2021, the incremental appreciation needed for the 34% of Invested Performance Eligible Assets Under Management below their respective High Water Marks/Hurdles to reach their respective High Water Marks/Hurdles was $2.6 billion, a decrease of $(2.5) billion, compared to $5.2 billion at March 31, 2020. Of the Invested Performance Eligible Assets Under Management below their respective High Water Marks/Hurdles as of March 31, 2021, 57% were within 5% of reaching their respective High Water Mark. |
Non-GAAP Financial Measures
These non-GAAP financial measures are presented without the consolidation of any Blackstone Funds that are consolidated into the Condensed Consolidated Financial Statements. Consequently, all non-GAAP financial measures exclude the assets, liabilities and operating results related to the Blackstone Funds. See “— Key Financial Measures and Indicators” for our definitions of Distributable Earnings, Segment Distributable Earnings, Fee Related Earnings and Adjusted EBITDA.
101
The following table is a reconciliation of Net Income Attributable to The Blackstone Group Inc. to Distributable Earnings, Total Segment Distributable Earnings, Fee Related Earnings and Adjusted EBITDA:
Three Months Ended |
||||||||
March 31, |
||||||||
2021 |
2020 |
|||||||
(Dollars in Thousands) |
||||||||
| Net Income (Loss) Attributable to The Blackstone Group Inc. |
$ | 1,747,872 | $ | (1,066,492 | ) | |||
| Net Income (Loss) Attributable to Non-Controlling Interests in Blackstone Holdings |
1,235,784 | (880,117 | ) | |||||
| Net Income (Loss) Attributable to Non-Controlling Interests in Consolidated Entities |
386,850 | (645,077 | ) | |||||
| Net Income (Loss) Attributable to Redeemable Non-Controlling Interests in Consolidated Entities |
629 | (15,469 | ) | |||||
| |
|
|
|
|||||
| Net Income (Loss) |
3,371,135 | (2,607,155 | ) | |||||
| Benefit for Taxes |
(447 | ) | (158,703 | ) | ||||
| |
|
|
|
|||||
| Net Income (Loss) Before Benefit for Taxes |
3,370,688 | (2,765,858 | ) | |||||
| Transaction-Related Charges (a) |
27,888 | 46,994 | ||||||
| Amortization of Intangibles (b) |
17,124 | 16,483 | ||||||
| Impact of Consolidation (c) |
(387,479 | ) | 660,546 | |||||
| Unrealized Performance Revenues (d) |
(2,464,497 | ) | 3,453,446 | |||||
| Unrealized Performance Allocations Compensation (e) |
1,049,969 | (1,397,378 | ) | |||||
| Unrealized Principal Investment (Income) Loss (f) |
(423,934 | ) | 616,610 | |||||
| Other Revenues (g) |
(60,273 | ) | (138,151 | ) | ||||
| Equity-Based Compensation (h) |
144,272 | 87,472 | ||||||
| Administrative Fee Adjustment (i) |
2,708 | — | ||||||
| Taxes and Related Payables (j) |
(84,222 | ) | (23,053 | ) | ||||
| |
|
|
|
|||||
| Distributable Earnings |
1,192,244 | 557,111 | ||||||
| Taxes and Related Payables (j) |
84,222 | 23,053 | ||||||
| Net Interest Loss (k) |
12,928 | 3,941 | ||||||
| |
|
|
|
|||||
| Total Segment Distributable Earnings |
1,289,394 | 584,105 | ||||||
| Realized Performance Revenues (l) |
(401,323 | ) | (167,233 | ) | ||||
| Realized Performance Compensation (m) |
150,924 | 71,302 | ||||||
| Realized Principal Investment Income (n) |
(298,156 | ) | (20,290 | ) | ||||
| |
|
|
|
|||||
| Fee Related Earnings |
$ | 740,839 | $ | 467,884 | ||||
| |
|
|
|
|||||
| Adjusted EBITDA Reconciliation |
||||||||
| Distributable Earnings |
$ | 1,192,244 | $ | 557,111 | ||||
| Interest Expense (o) |
44,340 | 41,540 | ||||||
| Taxes and Related Payables (j) |
84,222 | 23,053 | ||||||
| Depreciation and Amortization |
12,293 | 7,512 | ||||||
| |
|
|
|
|||||
| Adjusted EBITDA |
$ | 1,333,099 | $ | 629,216 | ||||
| |
|
|
|
|||||
| (a) | This adjustment removes Transaction-Related Charges, which are excluded from Blackstone’s segment presentation. Transaction-Related Charges arise from corporate actions including acquisitions, divestitures, and Blackstone’s initial public offering. They consist primarily of equity-based compensation charges, gains and losses on contingent consideration arrangements, changes in the balance of the Tax Receivable Agreement resulting from a change in tax law or similar event, transaction costs and any gains or losses associated with these corporate actions. |
102
| (b) | This adjustment removes the amortization of transaction-related intangibles, which are excluded from Blackstone’s segment presentation. This amount includes amortization of intangibles associated with Blackstone’s investment in Pátria, which was historically accounted for under the equity method. As a result of Pátria’s IPO in January 2021, equity method has been discontinued and there will no longer be amortization of intangibles associated with the investment. |
| (c) | This adjustment reverses the effect of consolidating Blackstone Funds, which are excluded from Blackstone’s segment presentation. This adjustment includes the elimination of Blackstone’s interest in these funds and the removal of amounts associated with the ownership of Blackstone consolidated operating partnerships held by non-controlling interests. |
| (d) | This adjustment removes Unrealized Performance Revenues on a segment basis. The Segment Adjustment represents the add back of performance revenues earned from consolidated Blackstone Funds which have been eliminated in consolidation. |
Three Months Ended |
||||||||
March 31, |
||||||||
2021 |
2020 |
|||||||
(Dollars in Thousands) |
||||||||
| GAAP Unrealized Performance Allocations |
$ | 2,464,497 | $ | (3,453,081 | ) | |||
| Segment Adjustment |
— | (365 | ) | |||||
| |
|
|
|
|||||
| Unrealized Performance Revenues |
$ | 2,464,497 | $ | (3,453,446 | ) | |||
| |
|
|
|
|||||
| (e) | This adjustment removes Unrealized Performance Allocations Compensation. |
| (f) | This adjustment removes Unrealized Principal Investment Income (Loss) on a segment basis. The Segment Adjustment represents (1) the add back of Principal Investment Income, including general partner income, earned from consolidated Blackstone Funds which have been eliminated in consolidation, and (2) the removal of amounts associated with the ownership of Blackstone consolidated operating partnerships held by non-controlling interests. |
Three Months Ended |
||||||||
March 31, |
||||||||
2021 |
2020 |
|||||||
(Dollars in Thousands) |
||||||||
| GAAP Unrealized Principal Investment Income (Loss) |
$ | 639,315 | $ | (959,365 | ) | |||
| Segment Adjustment |
(215,381 | ) | 342,755 | |||||
| |
|
|
|
|||||
| Unrealized Principal Investment Income (Loss) |
$ | 423,934 | $ | (616,610 | ) | |||
| |
|
|
|
|||||
103
| (g) | This adjustment removes Other Revenues on a segment basis. The Segment Adjustment represents (1) the add back of Other Revenues earned from consolidated Blackstone Funds which have been eliminated in consolidation, and (2) the removal of certain Transaction-Related Charges. |
Three Months Ended |
||||||||
March 31, |
||||||||
2021 |
2020 |
|||||||
(Dollars in Thousands) |
||||||||
| GAAP Other Revenue |
$ | 60,304 | $ | 138,180 | ||||
| Segment Adjustment |
(31) | (29) | ||||||
| |
|
|
|
|||||
| Other Revenues |
$ | 60,273 | $ | 138,151 | ||||
| |
|
|
|
|||||
| (h) | This adjustment removes Equity-Based Compensation on a segment basis. |
| (i) | This adjustment adds an amount equal to an administrative fee collected on a quarterly basis from certain holders of Blackstone Holdings Partnership Units. The administrative fee is accounted for as a capital contribution under GAAP, but is reflected as a reduction of Other Operating Expenses in Blackstone’s segment presentation. |
| (j) | Taxes represent the total GAAP tax provision adjusted to include only the current tax provision (benefit) calculated on Income (Loss) Before Provision (Benefit) for Taxes and adjusted to exclude the tax impact of any divestitures. Related Payables represent tax-related payables including the amount payable under the Tax Receivable Agreement. See “— Key Financial Measures and Indicators — Distributable Earnings” for the full definition of Taxes and Related Payables. |
Three Months Ended |
||||||||
March 31, |
||||||||
2021 |
2020 |
|||||||
(Dollars in Thousands) |
||||||||
| Taxes |
$ | 69,609 | $ | 16,274 | ||||
| Related Payables |
14,613 | 6,779 | ||||||
| |
|
|
|
|||||
| Taxes and Related Payables |
$ | 84,222 | $ | 23,053 | ||||
| |
|
|
|
|||||
| (k) | This adjustment removes Interest and Dividend Revenue less Interest Expense on a segment basis. The Segment Adjustment represents (1) the add back of Interest and Dividend Revenue earned from consolidated Blackstone Funds which have been eliminated in consolidation, and (2) the removal of interest expense associated with the Tax Receivable Agreement. |
Three Months Ended |
||||||||
March 31, |
||||||||
2021 |
2020 |
|||||||
(Dollars in Thousands) |
||||||||
| GAAP Interest and Dividend Revenue |
$ | 31,412 | $ | 35,084 | ||||
| Segment Adjustment |
— | 2,515 | ||||||
| |
|
|
|
|||||
| Interest and Dividend Revenue |
31,412 | 37,599 | ||||||
| |
|
|
|
|||||
| GAAP Interest Expense |
44,983 | 41,644 | ||||||
| Segment Adjustment |
(643) | (104) | ||||||
| |
|
|
|
|||||
| Interest Expense |
44,340 | 41,540 | ||||||
| |
|
|
|
|||||
| Net Interest Loss |
$ | (12,928) | $ | (3,941) | ||||
| |
|
|
|
|||||
| (l) | This adjustment removes the total segment amount of Realized Performance Revenues. |
104
| (m) | This adjustment removes the total segment amount of Realized Performance Compensation. |
| (n) | This adjustment removes the total segment amount of Realized Principal Investment Income. |
| (o) | This adjustment adds back Interest Expense on a segment basis, excluding interest expense related to the Tax Receivable Agreement. |
The following tables are a reconciliation of Total GAAP Investments to Net Accrued Performance Revenues. Total GAAP Investments and Net Accrued Performance Revenues consist of the following:
March 31, |
||||||||
2021 |
2020 |
|||||||
(Dollars in Thousands) |
||||||||
| Investments of Consolidated Blackstone Funds |
$ | 1,459,804 | $ | 7,275,752 | ||||
| Equity Method Investments |
||||||||
| Partnership Investments |
4,676,341 | 3,553,538 | ||||||
| Accrued Performance Allocations |
9,367,251 | 3,761,585 | ||||||
| Corporate Treasury Investments |
1,726,285 | 1,653,950 | ||||||
| Other Investments |
713,628 | 185,876 | ||||||
| |
|
|
|
|||||
| Total GAAP Investments |
$ | 17,943,309 | $ | 16,430,701 | ||||
| |
|
|
|
|||||
| Accrued Performance Allocations -GAAP |
$ | 9,367,251 | $ | 3,761,585 | ||||
| Impact of Consolidation (a) |
1 | 19 | ||||||
| Due from Affiliates - GAAP (b) |
56,274 | 20,910 | ||||||
| Less: Net Realized Performance Revenues (c) |
(269,426) | (31,719) | ||||||
| Less: Accrued Performance Compensation—GAAP (d) |
(3,952,253) | (1,563,672) | ||||||
| |
|
|
|
|||||
| Net Accrued Performance Revenues |
$ | 5,201,847 | $ | 2,187,123 | ||||
| |
|
|
|
|||||
| (a) | This adjustment adds back investments in consolidated Blackstone Funds which have been eliminated in consolidation. |
| (b) | Represents GAAP accrued performance revenue recorded within Due from Affiliates. |
| (c) | Represents Performance Revenues realized but not yet distributed as of the reporting date and are included in Distributable Earnings in the period they are realized. |
| (d) | Represents GAAP accrued performance compensation associated with Accrued Performance Allocations and is recorded within Accrued Compensation and Benefits and Due to Affiliates. |
Liquidity and Capital Resources
General
Blackstone’s business model derives revenue primarily from third party assets under management. Blackstone is not a capital or balance sheet intensive business and targets operating expense levels such that total management and advisory fees exceed total operating expenses each period. As a result, we require limited capital resources to support the working capital or operating needs of our businesses. We draw primarily on the long-term committed capital of our limited partner investors to fund the investment requirements of the Blackstone Funds and use our own realizations and cash flows to invest in growth initiatives, make commitments to our own funds, where our minimum general partner commitments are generally less than 5% of the limited partner commitments of a fund, and pay dividends to shareholders.
Fluctuations in our statement of financial condition result primarily from activities of the Blackstone Funds that are consolidated as well as business transactions, such as the issuance of senior notes described below. The majority economic ownership interests of the Blackstone Funds are reflected as Redeemable Non-Controlling Interests in Consolidated Entities and Non-Controlling Interests in Consolidated Entities in the Condensed
105
Consolidated Financial Statements. The consolidation of these Blackstone Funds has no net effect on Blackstone’s Net Income or Partners’ Capital. Additionally, fluctuations in our statement of financial condition also include appreciation or depreciation in Blackstone investments in the Blackstone Funds, additional investments and redemptions of such interests in the Blackstone Funds and the collection of receivables related to management and advisory fees.
Total Assets were $29.7 billion as of March 31, 2021, an increase of $3.4 billion, or 13%, from December 31, 2020. The increase in Total Assets was principally due to an increase of $3.4 billion in total assets attributable to consolidated operating partnerships. The increase in total assets attributable to consolidated operating partnerships was primarily due to an increase of $2.3 billion in Investments. The increase in Investments was primarily due to appreciation in the value of Blackstone’s interests in its private equity and real estate investments. The other net variances of the assets attributable to the consolidated operating partnerships were relatively unchanged.
Total Liabilities were $12.9 billion as of March 31, 2021, an increase of $1.2 billion, or 10%, from December 31, 2020. The increase in Total Liabilities was principally due to an increase of $1.2 billion in total liabilities attributable to consolidated operating partnerships. The increase in total liabilities attributable to the consolidated operating partnerships was primarily due to an increase of $943.0 million in Accrued Compensation and Benefits. The increase in Accrued Compensation and Benefits was primarily due to an increase in performance compensation. The other net variances of the liabilities attributable to the consolidated operating partnerships were relatively unchanged.
We have multiple sources of liquidity to meet our capital needs as described in “— Sources and Uses of Liquidity.” While our liquidity has not been materially impacted by the
COVID-19
pandemic to date, we continue to closely monitor developments in the impact of the COVID-19
pandemic and actively evaluate our sources and uses of liquidity in light of such developments. Sources and Uses of Liquidity
We have multiple sources of liquidity to meet our capital needs, including annual cash flows, accumulated earnings in our businesses, the proceeds from our issuances of senior notes, liquid investments we hold on our balance sheet and access to our $2.25 billion committed revolving credit facility. As of March 31, 2021, Blackstone had $2.9 billion in Cash and Cash Equivalents and $1.7 billion invested in Corporate Treasury Investments, against $5.7 billion in borrowings from our bond issuances, and no borrowings outstanding under our revolving credit facility.
In addition to the cash we received from our notes offerings and availability under our revolving credit facility, we expect to receive (a) cash generated from operating activities, (b) Performance Allocations and Incentive Fee realizations, and (c) realizations on the fund investments that we make. The amounts received from these three sources in particular may vary substantially from year to year and quarter to quarter depending on the frequency and size of realization events or net returns experienced by our investment funds. Our available capital could be adversely affected if there are prolonged periods of few substantial realizations from our investment funds accompanied by substantial capital calls for new investments from those investment funds. Therefore, Blackstone’s commitments to our funds are taken into consideration when managing our overall liquidity and cash position.
We expect that our primary liquidity needs will be cash to (a) provide capital to facilitate the growth of our existing businesses which principally includes funding our general partner and co-investment commitments to our funds, (b) provide capital to facilitate our expansion into new businesses, (c) pay operating expenses, including cash compensation to our employees and other obligations as they arise, (d) fund modest capital expenditures, (e) repay borrowings and related interest costs, (f) pay income taxes, (g) repurchase shares of our common stock and Blackstone Holdings Partnership Units pursuant to our repurchase program, and (h) pay dividends to our shareholders and distributions to the holders of Blackstone Holdings Partnership Units.
106
Our own capital commitments to our funds, the funds we invest in and our investment strategies as of March 31, 2021 consisted of the following:
Senior Managing Directors | ||||||||||||||||
Blackstone and |
and Certain Other | |||||||||||||||
General Partner |
Professionals (a) | |||||||||||||||
Original |
Remaining |
Original |
Remaining | |||||||||||||
| Fund |
Commitment |
Commitment |
Commitment |
Commitment | ||||||||||||
(Dollars in Thousands) | ||||||||||||||||
| Real Estate |
||||||||||||||||
| BREP V |
$ |
52,545 |
$ |
2,185 |
$ |
— |
$ |
— |
||||||||
| BREP VI |
750,000 |
36,809 |
150,000 |
12,270 |
||||||||||||
| BREP VII |
300,000 |
33,652 |
100,000 |
11,217 |
||||||||||||
| BREP VIII |
300,000 |
48,342 |
100,000 |
16,114 |
||||||||||||
| BREP IX |
300,000 |
192,463 |
100,000 |
64,154 |
||||||||||||
| BREP Europe III |
100,000 |
13,231 |
35,000 |
4,410 |
||||||||||||
| BREP Europe IV |
130,000 |
24,074 |
43,333 |
8,025 |
||||||||||||
| BREP Europe V |
150,000 |
32,133 |
43,333 |
9,283 |
||||||||||||
| BREP Europe VI |
130,000 |
89,112 |
43,333 |
29,704 |
||||||||||||
| BREP Asia I |
50,000 |
10,141 |
16,667 |
3,380 |
||||||||||||
| BREP Asia II |
70,707 |
32,797 |
23,569 |
10,932 |
||||||||||||
| BREDS II |
50,000 |
6,227 |
16,667 |
2,076 |
||||||||||||
| BREDS III |
50,000 |
17,659 |
16,667 |
5,886 |
||||||||||||
| BREDS IV |
50,000 |
37,180 |
— |
— |
||||||||||||
| BPP |
176,263 |
23,588 |
— |
— |
||||||||||||
| Other (b) |
25,598 |
12,292 |
— |
— |
||||||||||||
| |
|
|
|
|
|
|
|
|
|
|
| |||||
| Total Real Estate |
2,685,113 |
611,885 |
688,569 |
177,451 |
||||||||||||
| |
|
|
|
|
|
|
|
|
|
|
| |||||
continued...
107
Senior Managing Directors | ||||||||||||||||
Blackstone and |
and Certain Other | |||||||||||||||
General Partner |
Professionals (a) | |||||||||||||||
Original |
Remaining |
Original |
Remaining | |||||||||||||
| Fund |
Commitment |
Commitment |
Commitment |
Commitment | ||||||||||||
(Dollars in Thousands) | ||||||||||||||||
| Private Equity |
||||||||||||||||
| BCP V |
$ |
629,356 |
$ |
30,642 |
$ |
— |
$ |
— |
||||||||
| BCP VI |
719,718 |
82,829 |
250,000 |
28,771 |
||||||||||||
| BCP VII |
500,000 |
43,166 |
225,000 |
19,425 |
||||||||||||
| BCP VIII |
500,000 |
446,349 |
225,000 |
200,857 |
||||||||||||
| BEP I |
50,000 |
4,728 |
— |
— |
||||||||||||
| BEP II |
80,000 |
9,437 |
26,667 |
3,146 |
||||||||||||
| BEP III |
80,000 |
69,798 |
26,667 |
23,266 |
||||||||||||
| BCEP I |
120,000 |
45,305 |
18,992 |
7,170 |
||||||||||||
| BCEP II |
160,000 |
160,000 |
32,640 |
32,640 |
||||||||||||
| BCP Asia I |
40,000 |
21,962 |
13,333 |
7,321 |
||||||||||||
| BCP Asia II |
62,294 |
62,294 |
20,765 |
20,765 |
||||||||||||
| Tactical Opportunities |
410,746 |
157,934 |
136,554 |
52,645 |
||||||||||||
| Strategic Partners |
770,838 |
456,108 |
118,907 |
68,954 |
||||||||||||
| BIP |
168,632 |
105,655 |
— |
— |
||||||||||||
| BXLS |
110,000 |
85,376 |
26,667 |
23,752 |
||||||||||||
| BXG |
80,000 |
73,911 |
26,667 |
24,637 |
||||||||||||
| Other (b) |
278,669 |
34,127 |
— |
— |
||||||||||||
| |
|
|
|
|
|
|
|
|
|
|
| |||||
| Total Private Equity |
4,760,253 |
1,889,621 |
1,147,859 |
513,349 |
||||||||||||
| |
|
|
|
|
|
|
|
|
|
|
| |||||
| Hedge Fund Solutions |
||||||||||||||||
| Strategic Alliance I |
50,000 |
2,033 |
— |
— |
||||||||||||
| Strategic Alliance II |
50,000 |
1,482 |
— |
— |
||||||||||||
| Strategic Alliance III |
22,000 |
1,244 |
— |
— |
||||||||||||
| Strategic Holdings I |
154,610 |
53,117 |
— |
— |
||||||||||||
| Strategic Holdings II |
50,000 |
44,397 |
— |
— |
||||||||||||
| Other (b) |
19,179 |
9,631 |
— |
— |
||||||||||||
| |
|
|
|
|
|
|
|
|
|
|
| |||||
| Total Hedge Fund Solutions |
345,789 |
111,904 |
— |
— |
||||||||||||
| |
|
|
|
|
|
|
|
|
|
|
| |||||
continued...
108
Senior Managing Directors | ||||||||||||||||
Blackstone and |
and Certain Other | |||||||||||||||
General Partner |
Professionals (a) | |||||||||||||||
Original |
Remaining |
Original |
Remaining | |||||||||||||
| Fund |
Commitment |
Commitment |
Commitment |
Commitment | ||||||||||||
(Dollars in Thousands) | ||||||||||||||||
| Credit & Insurance |
||||||||||||||||
| Mezzanine / Opportunistic II |
$ |
120,000 |
$ |
29,658 |
$ |
110,101 |
$ |
27,212 |
||||||||
| Mezzanine / Opportunistic III |
130,783 |
41,343 |
31,125 |
9,839 |
||||||||||||
| Mezzanine / Opportunistic IV |
122,000 |
118,866 |
33,385 |
32,527 |
||||||||||||
| European Senior Debt I |
63,000 |
16,521 |
56,955 |
14,936 |
||||||||||||
| European Senior Debt II |
93,043 |
69,587 |
24,378 |
18,017 |
||||||||||||
| Stressed / Distressed I |
50,000 |
4,869 |
27,666 |
2,694 |
||||||||||||
| Stressed / Distressed II |
125,000 |
51,695 |
121,050 |
50,061 |
||||||||||||
| Stressed / Distressed III |
151,000 |
113,042 |
32,012 |
23,965 |
||||||||||||
| Energy I |
80,000 |
38,026 |
75,595 |
35,933 |
||||||||||||
| Energy II |
150,000 |
129,783 |
25,571 |
22,124 |
||||||||||||
| Credit Alpha Fund |
52,102 |
19,752 |
50,690 |
19,217 |
||||||||||||
| Credit Alpha Fund II |
25,500 |
8,257 |
6,133 |
1,986 |
||||||||||||
| BXSL |
80,000 |
8,000 |
— |
— |
||||||||||||
| Other (b) |
146,049 |
50,814 |
21,539 |
4,455 |
||||||||||||
| |
|
|
|
|
|
|
|
|
|
|
| |||||
| Total Credit & Insurance |
1,388,477 |
700,213 |
616,200 |
262,966 |
||||||||||||
| |
|
|
|
|
|
|
|
|
|
|
| |||||
| Other |
||||||||||||||||
| Treasury (c) |
1,262,508 |
791,192 |
— |
— |
||||||||||||
| |
|
|
|
|
|
|
|
|
|
|
| |||||
$ |
10,442,140 |
$ |
4,104,815 |
$ |
2,452,628 |
$ |
953,766 |
|||||||||
| |
|
|
|
|
|
|
|
|
|
|
| |||||
| (a) | For some of the general partner commitments shown in the table above, we require our senior managing directors and certain other professionals to fund a portion of the commitment even though the ultimate obligation to fund the aggregate commitment is ours pursuant to the governing agreements of the respective funds. The amounts of the aggregate applicable general partner original and remaining commitment are shown in the table above. In addition, certain senior managing directors and other professionals may be required to fund a de minimis amount of the commitment in certain carry funds. We expect our commitments to be drawn down over time and to be funded by available cash and cash generated from operations and realizations. Taking into account prevailing market conditions and both the liquidity and cash or liquid investment balances, we believe that the sources of liquidity described above will be more than sufficient to fund our working capital requirements. |
| (b) | Represents capital commitments to a number of other funds in each respective segment. |
| (c) | Represents loan origination commitments, revolver commitments and capital market commitments. |
109
As of March 31, 2021, Blackstone Holdings Finance Co. L.L.C. (the “Issuer”), an indirect subsidiary of Blackstone, had issued and outstanding the following senior notes (collectively the “Notes”):
Aggregate | ||||
Principal | ||||
Amount | ||||
(Dollars/Euros | ||||
| Senior Notes (a) |
in Thousands) | |||
| 4.750%, Due 2/15/2023 |
$ |
400,000 |
||
| 2.000%, Due 5/19/2025 |
€ |
300,000 |
||
| 1.000%, Due 10/5/2026 |
€ |
600,000 |
||
| 3.150%, Due 10/2/2027 |
$ |
300,000 |
||
| 1.500%, Due 4/10/2029 |
€ |
600,000 |
||
| 2.500%, Due 1/10/2030 |
$ |
500,000 |
||
| 1.600%, Due 3/30/2031 |
$ |
500,000 |
||
| 6.250%, Due 8/15/2042 |
$ |
250,000 |
||
| 5.000%, Due 6/15/2044 |
$ |
500,000 |
||
| 4.450%, Due 7/15/2045 |
$ |
350,000 |
||
| 4.000%, Due 10/2/2047 |
$ |
300,000 |
||
| 3.500%, Due 9/10/2049 |
$ |
400,000 |
||
| 2.800%, Due 9/30/2050 |
$ |
400,000 |
||
| |
|
| ||
$ |
5,659,500 |
|||
| |
|
| ||
| (a) | The Notes are unsecured and unsubordinated obligations of the Issuer and are fully and unconditionally guaranteed, jointly and severally, by The Blackstone Group Inc. and each of the Blackstone Holdings Partnerships. The Notes contain customary covenants and financial restrictions that, among other things, limit the Issuer and the guarantors’ ability, subject to certain exceptions, to incur indebtedness secured by liens on voting stock or profit participating equity interests of their subsidiaries or merge, consolidate or sell, transfer or lease assets. The Notes also contain customary events of default. All or a portion of the Notes may be redeemed at our option, in whole or in part, at any time and from time to time, prior to their stated maturity, at the make-whole redemption price set forth in the Notes. If a change of control repurchase event occurs, the Notes are subject to repurchase at the repurchase price as set forth in the Notes. |
Blackstone, through its indirect subsidiary Blackstone Holdings Finance Co. L.L.C., has a $2.25 billion unsecured revolving credit facility (the “Credit Facility”) with Citibank, N.A., as administrative agent with a maturity date of November 24, 2025. Borrowings may also be made in U.K. sterling, euros, Swiss francs, Japanese yen or Canadian dollars, in each case subject to certain sub-limits. The Credit Facility contains customary representations, covenants and events of default. Financial covenants consist of a maximum net leverage ratio and a requirement to keep a minimum amount of fee-earning assets under management, each tested quarterly.
Share Repurchase Program
On July 16, 2019, our board of directors authorized the repurchase of up to $1.0 billion of common stock and Blackstone Holdings Partnership Units (the “2019 Repurchase Authorization”). On May 6, 2021, Blackstone’s board of directors authorized the repurchase of up to $1.0 billion of common stock and Blackstone Holdings Partnership Units, which authorization replaced the 2019 Repurchase Authorization. Under the repurchase program, repurchases may be made from time to time in open market transactions, in privately negotiated transactions or otherwise. The timing and the actual number repurchased will depend on a variety of factors, including legal requirements, price and economic and market conditions. The repurchase program may be changed, suspended or discontinued at any time and does not have a specified expiration date.
During the three months ended March 31, 2021, no shares of common stock were repurchased. As of March 31, 2021, the amount remaining available for repurchases under the program was $307.2 million.
110
Dividends
Our intention is to pay to holders of common stock a quarterly dividend representing approximately 85% of The Blackstone Group Inc.’s share of Distributable Earnings, subject to adjustment by amounts determined by our board of directors to be necessary or appropriate to provide for the conduct of our business, to make appropriate investments in our business and funds, to comply with applicable law, any of our debt instruments or other agreements, or to provide for future cash requirements such as tax-related payments, clawback obligations and dividends to shareholders for any ensuing quarter. The dividend amount could also be adjusted upward in any one quarter.
For Blackstone’s definition of Distributable Earnings, see “— Key Financial Measures and Indicators.”
All of the foregoing is subject to the qualification that the declaration and payment of any dividends are at the sole discretion of our board of directors, and our board of directors may change our dividend policy at any time, including, without limitation, to reduce such quarterly dividends or even to eliminate such dividends entirely.
Because the publicly traded entity and/or its wholly owned subsidiaries must pay taxes and make payments under the tax receivable agreements, the amounts ultimately paid as dividends by The Blackstone Group Inc. to common shareholders in respect of each fiscal year are generally expected to be less, on a per share or per unit basis, than the amounts distributed by the Blackstone Holdings Partnerships to the Blackstone personnel and others who are limited partners of the Blackstone Holdings Partnerships in respect of their Blackstone Holdings Partnership Units. Following the Conversion, we expect to pay more corporate income taxes than we would have as a limited partnership, which will increase this difference between the per share dividend and per unit distribution amounts.
Dividends are treated as qualified dividends to the extent of Blackstone’s current and accumulated earnings and profits, with any excess dividends treated as a return of capital to the extent of the shareholder’s basis.
The following graph shows fiscal quarterly and annual per common shareholder dividends for 2021 and 2020. Dividends are declared and paid in the quarter subsequent to the quarter in which they are earned.
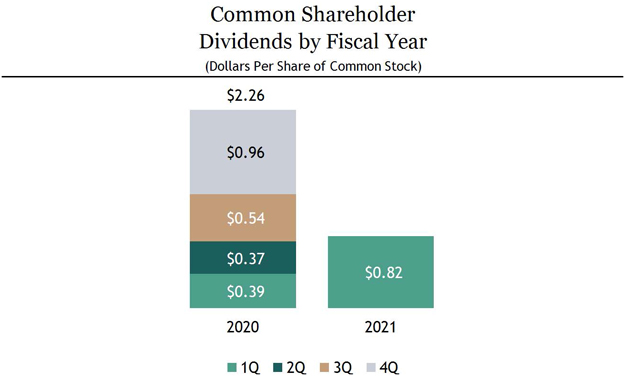
111
With respect to the first quarter of fiscal year 2021, we paid to shareholders of our common stock a dividend of $0.82 per share. With respect to fiscal year 2020, we paid shareholders aggregate dividends of $2.26 per share.
Leverage
We may under certain circumstances use leverage opportunistically and over time to create the most efficient capital structure for Blackstone and our shareholders. In addition to the borrowings from our notes issuances and our revolving credit facility, we may use reverse repurchase agreements, repurchase agreements and securities sold, not yet purchased. All of these positions are held in a separately managed portfolio. Reverse repurchase agreements are entered into primarily to take advantage of opportunistic yields otherwise absent in the overnight markets and also to use the collateral received to cover securities sold, not yet purchased. Repurchase agreements are entered into primarily to opportunistically yield higher spreads on purchased securities. The balances held in these financial instruments fluctuate based on Blackstone’s liquidity needs, market conditions and investment risk profiles.
The following table presents information regarding these financial instruments in our Condensed Consolidated Statements of Financial Condition:
Securities | ||||||||
Repurchase |
Sold, Not Yet | |||||||
Agreements |
Purchased | |||||||
(Dollars in Millions) | ||||||||
| Balance, March 31, 2021 |
$ |
58.1 |
$ |
33.2 |
||||
| Balance, December 31, 2020 |
$ |
76.8 |
$ |
51.0 |
||||
| Three Months Ended March 31, 2021 |
||||||||
| Average Daily Balance |
$ |
65.6 |
$ |
49.7 |
||||
| Maximum Daily Balance |
$ |
75.5 |
$ |
51.0 |
||||
112
Contractual Obligations, Commitments and Contingencies
The following table sets forth information relating to our contractual obligations as of March 31, 2021 on a consolidated basis and on a basis deconsolidating the Blackstone Funds:
April 1, 2021 to |
||||||||||||||||||||
| Contractual Obligations |
December 31, 2021 |
2022-2023 |
2024-2025 |
Thereafter |
Total | |||||||||||||||
(Dollars in Thousands) | ||||||||||||||||||||
| Operating Lease Obligations (a) |
$ |
83,511 |
$ |
243,741 |
$ |
207,498 |
$ |
373,536 |
$ |
908,286 |
||||||||||
| Purchase Obligations |
51,925 |
53,254 |
8,713 |
— |
113,892 |
|||||||||||||||
| Blackstone Issued Notes and Revolving Credit Facility (b) |
— |
400,000 |
351,900 |
4,907,600 |
5,659,500 |
|||||||||||||||
| Interest on Blackstone Issued Notes and Revolving Credit Facility (c) |
119,033 |
324,466 |
295,966 |
2,088,041 |
2,827,506 |
|||||||||||||||
| Blackstone Funds Debt Obligations Payable |
100 |
— |
— |
— |
100 |
|||||||||||||||
| Blackstone Funds Capital Commitments to Investee Funds (d) |
102,891 |
— |
— |
— |
102,891 |
|||||||||||||||
| Due to Certain Non-Controlling Interest Holders in Connection with Tax Receivable Agreements (e) |
— |
104,590 |
98,137 |
678,636 |
881,363 |
|||||||||||||||
| Unrecognized Tax Benefits, Including Interest and Penalties (f) |
1,076 |
— |
— |
— |
1,076 |
|||||||||||||||
| Blackstone Operating Entities Capital Commitments to Blackstone Funds and Other (g) |
4,104,815 |
— |
— |
— |
4,104,815 |
|||||||||||||||
| |
|
|
|
|
|
|
|
|
|
|
|
|
|
| ||||||
| Consolidated Contractual Obligations |
4,463,351 |
1,126,051 |
962,214 |
8,047,813 |
14,599,429 |
|||||||||||||||
| Blackstone Funds Debt Obligations Payable |
(100 |
) |
— |
— |
— |
(100 |
) | |||||||||||||
| Blackstone Funds Capital Commitments to Investee Funds (d) |
(102,891 |
) |
— |
— |
— |
(102,891 |
) | |||||||||||||
| |
|
|
|
|
|
|
|
|
|
|
|
|
|
| ||||||
| Blackstone Operating Entities Contractual Obligations |
$ |
4,360,360 |
$ |
1,126,051 |
$ |
962,214 |
$ |
8,047,813 |
$ |
14,496,438 |
||||||||||
| |
|
|
|
|
|
|
|
|
|
|
|
|
|
| ||||||
| (a) | We lease our primary office space and certain office equipment under agreements that expire through 2030. Occupancy lease agreements, in addition to contractual rent payments, generally include additional payments for certain costs incurred by the landlord, such as building expenses, and utilities. To the extent these are fixed or determinable they are included in the table above. The table above includes operating leases that are recognized as Operating Lease Liabilities, short-term leases that are not recorded as Operating Lease Liabilities and leases that have been signed but not yet commenced which are not recorded as Operating Lease Liabilities. The amounts in this table are presented net of contractual sublease commitments. |
| (b) | Represents the principal amount due on the senior notes we issued. As of March 31, 2021, we had no outstanding borrowings under our revolver. |
| (c) | Represents interest to be paid over the maturity of our senior notes and borrowings under our revolving credit facility which has been calculated assuming no pre-payments are made and debt is held until its final maturity date. These amounts exclude commitment fees for unutilized borrowings under our revolver. |
113
| (d) | These obligations represent commitments of the consolidated Blackstone Funds to make capital contributions to investee funds and portfolio companies. These amounts are generally due on demand and are therefore presented in the less than one year category. |
| (e) | Represents obligations by Blackstone’s corporate subsidiary to make payments under the Tax Receivable Agreements to certain non-controlling interest holders for the tax savings realized from the taxable purchases of their interests in connection with the reorganization at the time of Blackstone’s IPO in 2007 and subsequent purchases. The obligation represents the amount of the payments currently expected to be made, which are dependent on the tax savings actually realized as determined annually without discounting for the timing of the payments. As required by GAAP, the amount of the obligation included in the Condensed Consolidated Financial Statements and shown in Note 16. “Related Party Transactions” (see “Part I. Item 1. Financial Statements”) differs to reflect the net present value of the payments due to certain non-controlling interest holders. |
| (f) | The total represents gross unrecognized tax benefits of $0.5 million and interest and penalties of $0.6 million. In addition Blackstone is not able to make a reasonably reliable estimate of the timing of payments in individual years in connection with gross unrecognized benefits of $34.8 million and interest of $3.7 million, therefore, such amounts are not included in the above contractual obligations table. |
| (g) | These obligations represent commitments by us to provide general partner capital funding to the Blackstone Funds, limited partner capital funding to other funds and Blackstone principal investment commitments. These amounts are generally due on demand and are therefore presented in the less than one year category; however, a substantial amount of the capital commitments are expected to be called over the next three years. We expect to continue to make these general partner capital commitments as we raise additional amounts for our investment funds over time. |
Guarantees
Blackstone and certain of its consolidated funds provide financial guarantees. The amounts and nature of these guarantees are described in Note 17. “Commitments and Contingencies — Contingencies — Guarantees” in the “Notes to Condensed Consolidated Financial Statements” in “Part I. Item 1. Financial Statements” of this filing.
Indemnifications
In many of its service contracts, Blackstone agrees to indemnify the third party service provider under certain circumstances. The terms of the indemnities vary from contract to contract and the amount of indemnification liability, if any, cannot be determined and has not been included in the table above or recorded in our Condensed Consolidated Financial Statements as of March 31, 2021.
Clawback Obligations
Performance Allocations are subject to clawback to the extent that the Performance Allocations received to date with respect to a fund exceeds the amount due to Blackstone based on cumulative results of that fund. The actual clawback liability, however, generally does not become realized until the end of a fund’s life except for certain Blackstone real estate funds, multi-asset class investment funds and credit-focused funds, which may have an interim clawback liability. The lives of the carry funds, including available contemplated extensions, for which a liability for potential clawback obligations has been recorded for financial reporting purposes, are currently anticipated to expire at various points through 2028. Further extensions of such terms may be implemented under given circumstances.
For financial reporting purposes, when applicable, the general partners record a liability for potential clawback obligations to the limited partners of some of the carry funds due to changes in the unrealized value of a fund’s remaining investments and where the fund’s general partner has previously received Performance Allocation distributions with respect to such fund’s realized investments.
114
As of March 31, 2021, the total clawback obligations were $81.4 million, of which $46.8 million was related to Blackstone Holdings and $34.6 million was related to current and former Blackstone personnel. The split of clawback between Blackstone Holdings and current and former personnel is based on the performance of individual investments held by a fund rather than on a fund by fund basis.
If, at March 31, 2021, all of the investments held by our carry funds were deemed worthless, a possibility that management views as remote, the amount of Performance Allocations subject to potential clawback would be $4.3 billion, on an after-tax basis where applicable, of which Blackstone Holdings is potentially liable for $3.9 billion if current and former Blackstone personnel default on their share of the liability, a possibility that management also views as remote. See Note 16. “Related Party Transactions” and Note 17. “Commitments and Contingencies” in the “Notes to Condensed Consolidated Financial Statements” in “Part I. Item 1. Financial Statements” of this filing.
Critical Accounting Policies
We prepare our Condensed Consolidated Financial Statements in accordance with GAAP. In applying many of these accounting principles, we need to make assumptions, estimates and/or judgments that affect the reported amounts of assets, liabilities, revenues and expenses in our Condensed Consolidated Financial Statements. We base our estimates and judgments on historical experience and other assumptions that we believe are reasonable under the circumstances. These assumptions, estimates and/or judgments, however, are often subjective. Actual results may be affected negatively based on changing circumstances. If actual amounts are ultimately different from our estimates, the revisions are included in our results of operations for the period in which the actual amounts become known. We believe the following critical accounting policies could potentially produce materially different results if we were to change underlying assumptions, estimates and/or judgments. For a description of our accounting policies, see Note 2. “Summary of Significant Accounting Policies” in the “Notes to Condensed Consolidated Financial Statements” in “Part I. Item 1. Financial Statements” of this filing.
Principles of Consolidation
For a description of our accounting policy on consolidation, see Note 2. “Summary of Significant Accounting Policies — Consolidation” and Note 9. “Variable Interest Entities” in the “Notes to Condensed Consolidated Financial Statements” in “Part I. Item 1. Financial Statements” of this filing for detailed information on Blackstone’s involvement with VIEs. The following discussion is intended to provide supplemental information about how the application of consolidation principles impact our financial results, and management’s process for implementing those principles including areas of significant judgment.
The determination that Blackstone holds a controlling financial interest in a Blackstone Fund or investment vehicle significantly changes the presentation of our condensed consolidated financial statements. In our Condensed Consolidated Statements of Financial Position included in this filing, we present 100% of the assets and liabilities of consolidated VIEs along with a non-controlling interest which represents the portion of the consolidated vehicle’s interests held by third parties. However, assets of our consolidated VIEs can only be used to settle obligations of the consolidated VIE and are not available for general use by Blackstone. Further, the liabilities of our consolidated VIEs do not have recourse to the general credit of Blackstone. In the Condensed Consolidated Statements of Operations, we eliminate any management fees, Incentive Fees, or Performance Allocations received or accrued from consolidated VIEs as they are considered intercompany transactions. We recognize 100% of the consolidated VIE’s investment income (loss) and allocate the portion of that income (loss) attributable to third party ownership to non-controlling interests in arriving at Net Income Attributable to The Blackstone Group Inc.
The assessment of whether we consolidate a Blackstone Fund or investment vehicle we manage requires the application of significant judgment. These judgments are applied both at the time we become involved with the VIE and on an ongoing basis and include, but are not limited to:
115
| • | Determining whether our management fees, Incentive Fees or Performance Allocations represent variable interests – We make judgments as to whether the fees we earn are commensurate with the level of effort required for those fees and at market rates. In making this judgment, we consider, among other things, the extent of third party investment in the entity and the terms of any other interests we hold in the VIE. |
| • | Determining whether kick-out rights are substantive – We make judgments as to whether the third party investors in a partnership entity have the ability to remove the general partner, the investment manager or its equivalent, or to dissolve (liquidate) the partnership entity, through a simple majority vote. This includes an evaluation of whether barriers to exercise these rights exist. |
| • | Concluding whether Blackstone has an obligation to absorb losses or the right to receive benefits that could potentially be significant to the VIE – As there is no explicit threshold in GAAP to define “potentially significant,” management must apply judgment and evaluate both quantitative and qualitative factors to conclude whether this threshold is met. |
Revenue Recognition
For a description of our accounting policy on revenue recognition, see Note 2. “Summary of Significant Accounting Policies — Revenue Recognition” in the “Notes to Condensed Consolidated Financial Statements” in “Part I. Item 1. Financial Statements.” For additional description of the nature of our revenue arrangements, including how management fees, Incentive Fees, and Performance Allocations are generated, please refer to “Part I. Item 1. Business — Fee Structure/Incentive Arrangements” in our Annual Report on Form 10-K for the year ended December 31, 2020. The following discussion is intended to provide supplemental information about how the application of revenue recognition principles impact our financial results, and management’s process for implementing those principles including areas of significant judgment.
Management and Advisory Fees, Net
On private equity, real estate, and certain of our hedge fund solutions and credit-focused funds:
| • | 0.25% to 1.75% of committed capital or invested capital during the investment period, |
| • | 0.25% to 1.50% of invested capital, committed capital or investment fair value subsequent to the investment period for private equity and real estate funds, and |
| • | 0.75% to 1.50% of invested capital or net asset value subsequent to the investment period for certain of our hedge fund solutions and credit-focused funds. |
On real estate, credit and MLP-focused funds structured like hedge funds:
| • | 0.24% to 1.50% of net asset value. |
On credit and MLP-focused separately managed accounts:
| • | 0.20% to 1.50% of net asset value or total assets. |
On real estate separately managed accounts:
| • | 0.65% to 2.00% of invested capital, net operating income or net asset value. |
On funds of hedge funds, certain hedge funds and separately managed accounts invested in hedge funds:
| • | 0.25% to 1.50% of net asset value. |
116
On CLO vehicles:
| • | 0.40% to 0.50% of the aggregate par amount of collateral assets, including principal cash. |
On credit-focused registered and non-registered investment companies:
| • | 0.25% to 1.25% of total assets or net asset value. |
The investment adviser of BXMT receives annual management fees based on 1.50% of BXMT’s net proceeds received from equity offerings and accumulated “distributable earnings” (which is generally equal to its GAAP net income excluding certain non-cash and other items), subject to certain adjustments. The investment adviser of BREIT receives a management fee of 1.25% per annum of net asset value, payable monthly.
Management fee calculations based on committed capital or invested capital are mechanical in nature and therefore do not require the use of significant estimates or judgments. Management fee calculations based on net asset value, total assets, or investment fair value depend on the fair value of the underlying investments within the funds. Estimates and assumptions are made when determining the fair value of the underlying investments within the funds and could vary depending on the valuation methodology that is used as well as economic conditions. See “— Fair Value” below for further discussion of the judgment required for determining the fair value of the underlying investments.
Investment Income (Loss)
The change in the fair value of the investments held by certain Blackstone Funds is a significant input into the accrued Performance Allocation calculation and accrual for potential repayment of previously received Performance Allocations. Estimates and assumptions are made when determining the fair value of the underlying investments within the funds. See “— Fair Value” below for further discussion related to significant estimates and assumptions used for determining fair value of the underlying investments.
Fair Value
Blackstone uses fair value throughout the reporting process. For a description of our accounting policies related to valuation, see Note 2. “Summary of Significant Accounting Policies —
COVID-19
and Global Economic Market Conditions,” “Summary of Significant Accounting Policies — Fair Value of Financial Instruments” and “Summary of Significant Accounting Policies — Investments, at Fair Value” in the “Notes to Condensed Consolidated Financial Statements” in “Part I. Item 1. Financial Statements” of this filing. The following discussion is intended to provide supplemental information about how the application of fair value principles impact our financial results, and management’s process for implementing those principles including areas of significant judgment. The fair value of the investments held by Blackstone Funds is the primary input to the calculation of certain of our management fees, Incentive Fees, Performance Allocations and the related Compensation we recognize. The Blackstone Funds are accounted for as investment companies under the American Institute of Certified Public Accountants Accounting and Auditing Guide, , and in accordance with the GAAP guidance on investment companies and reflect their investments, including majority owned and controlled investments (the “Portfolio Companies”), at fair value. In the absence of observable market prices, we utilize valuation methodologies applied on a consistent basis and assumptions that we believe market participants would use to
Investment Companies
117
determine the fair value of the investments. For investments where little market activity exists management’s determination of fair value is based on the best information available in the circumstances, which may incorporate management’s own assumptions and involves a significant degree of judgment, and the consideration of a combination of internal and external factors, including the appropriate risk adjustments for non-performance and liquidity risks.
Blackstone has also elected the fair value option for certain instruments it owns directly, including loans and receivables and investments in private debt securities, the assets of consolidated CLO vehicles and other proprietary investments. Blackstone is required to measure certain financial instruments at fair value, including debt instruments, equity securities and freestanding derivatives.
Fair Value of Investments or Instruments that are Publicly Traded
Securities that are publicly traded and for which a quoted market exists will be valued at the closing price of such securities in the principal market in which the security trades, or in the absence of a principal market, in the most advantageous market on the valuation date. When a quoted price in an active market exists, no block discounts or control premiums are permitted regardless of the size of the public security held. In some cases, securities will include legal and contractual restrictions limiting their purchase and sale for a period of time, such as may be required under SEC Rule 144. A discount to publicly traded price may be appropriate in those cases; the amount of the discount, if taken, shall be determined based on the time period that must pass before the restricted security becomes unrestricted or otherwise available for sale.
Fair Value of Investments or Instruments that are not Publicly Traded
Investments for which market prices are not observable include private investments in the equity or debt of operating companies or real estate properties. Our primary methodology for determining the fair values of such investments is generally the income approach which provides an indication of fair value based on the present value of cash flows that a business, security, or property is expected to generate in the future. The most widely used methodology under the income approach is the discounted cash flow method which includes significant assumptions about the underlying investment’s projected net earnings or cash flows, discount rate, capitalization rate and exit multiple. Our secondary methodology, generally used to corroborate the results of the income approach, is typically the market approach. The most widely used methodology under the market approach relies upon valuations for comparable public companies, transactions, or assets, and includes making judgments about which companies, transactions, or assets are comparable. Depending on the facts and circumstances associated with the investment, different primary and secondary methodologies may be used including option value, contingent claims or scenario analysis, yield analysis, projected cash flow through maturity or expiration, probability weighted methods or recent round of financing.
In certain cases debt and equity securities are valued on the basis of prices from an orderly transaction between market participants provided by reputable dealers or pricing services. In determining the value of a particular investment, pricing services may use certain information with respect to transactions in such investments, quotations from dealers, pricing matrices and market transactions in comparable investments and various relationships between investments.
Management Process on Fair Value
Due to the importance of fair value throughout the condensed consolidated financial statements and the significant judgment required to be applied in arriving at those fair values, we have developed a process around valuation that incorporates several levels of approval and review from both internal and external sources. Investments held by Blackstone Funds and investment vehicles are valued on at least a quarterly basis by our internal valuation or asset management teams, which are independent from our investment teams.
118
For investments valued utilizing the income method, and where Blackstone has information rights, we generally have a direct line of communication with each of the Portfolio Company finance teams and collect financial data used to support projections used in a discounted cash flow analysis. The respective business unit’s valuation team then analyzes the data received and updates the valuation models reflecting any changes in the underlying cash flow projections, weighted-average cost of capital, exit multiple, and any other valuation input relevant economic conditions.
The results of all valuations of investments held by Blackstone Fund and investment vehicles are reviewed and approved by the relevant business unit’s valuation sub-committee, which is comprised of key personnel from the business unit, typically the chief investment officer, chief operating officer, chief financial officer, chief compliance officer (or their respective equivalents where applicable) and other senior managing directors in the business. To further corroborate results, each business unit also generally obtains either a positive assurance opinion or a range of value from an independent valuation party, at least annually for internally prepared valuations for investments that have been held by Blackstone Funds and investment vehicles for greater than a year and quarterly for certain investments. Our firmwide valuation committee, chaired by our Chief Financial Officer and comprised of senior members of our businesses and representatives from corporate functions, including legal and finance, reviews the valuation process for investments held by us and our investment vehicles, including the application of appropriate valuation standards on a consistent basis. Each quarter, the valuation process is also reviewed by the audit committee of our board of directors, which is comprised of our employee directors.
The global outbreak of
COVID-19
required management to make significant judgments about the ultimate adverse impact of COVID-19
on financial markets and economic conditions, which is uncertain and may change over time. These judgments and estimates were incorporated into the valuation process outlined herein. Management’s policies were unchanged and critical processes were executed in a remote working environment. Income Tax
For a description of our accounting policy on taxes and additional information on taxes see Note 2. “Summary of Significant Accounting Policies” in “Part II. Item 8. Financial Statements and Supplementary Data” in our Annual Report on Form
10-K
for the year ended December 31, 2020. For additional information on taxes see Note 13. “Income Taxes” in the “Notes to Consolidated Financial Statements” in “— Item 8. Financial Statements and Supplementary Data” of this filing and Note 15. “Income Taxes” in “Part II. Item 8. Financial Statements and Supplementary Data” in our Annual Report on Form 10-K for the year ended December 31, 2020. Our provision for income taxes is composed of current and deferred taxes. Current income taxes approximate taxes to be paid or refunded for the current period. Deferred income taxes reflect the net tax effects of temporary differences between the financial reporting and tax bases of assets and liabilities and are measured using the applicable enacted tax rates and laws that will be in effect when such differences are expected to reverse. The Conversion resulted in a step-up in the tax basis of certain assets that will be recovered as those assets are sold or the basis is amortized.
Additionally, significant judgment is required in estimating the provision for (benefit from) income taxes, current and deferred tax balances (including valuation allowance), accrued interest or penalties and uncertain tax positions. In evaluating these judgments, we consider, among other items, projections of taxable income (including the character of such income), beginning with historic results and incorporating assumptions of the amount of future pretax operating income. These assumptions about future taxable income require significant judgment and are consistent with the plans and estimates that Blackstone uses to manage its business. A portion of the deferred tax assets are not considered to be more likely than not to be realized due to the character of income necessary for recovery. For that portion of the deferred tax assets, a valuation allowance has been recorded.
119
Revisions in estimates and/or actual costs of a tax assessment may ultimately be materially different from the recorded accruals and unrecognized tax benefits, if any.
Off-Balance Sheet Arrangements
In the normal course of business, we engage in off-balance sheet arrangements, including transactions in derivatives, guarantees, commitments, indemnifications and potential contingent repayment obligations. We do not have any off-balance sheet arrangements that would require us to fund losses or guarantee target returns to investors in our funds.
Further disclosure on our off-balance sheet arrangements is presented in the “Notes to Condensed Consolidated Financial Statements” in “Part I. Item 1. Financial Statements” of this filing as follows:
| • | Note 9. “Variable Interest Entities,” and |
| • | Note 17. “Commitments and Contingencies — Commitments — Investment Commitments” and “— Contingencies — Guarantees.” |
Recent Accounting Developments
Information regarding recent accounting developments and their impact on Blackstone can be found in Note 2. “Summary of Significant Accounting Policies” in the “Notes to Condensed Consolidated Financial Statements” in “Part I. Item 1. Financial Statements” of this filing.
Interbank Offered Rates Transition
Certain jurisdictions are currently reforming or phasing out their benchmark interest rates, most notably the London Interbank Offered Rates (“LIBOR”) across multiple currencies. The timing of the anticipated reforms or phase-outs vary by jurisdiction, with most of the reforms or phase-outs currently scheduled to take effect by the end of calendar year 2021 and certain U.S. dollar LIBOR tenors persisting through June 2023. Blackstone is evaluating the impact of such changes on existing transactions and contractual arrangements and managing transition efforts. See “Part I. Item 1A. Risk Factors — Risks Related to Our Business — Interest rates on our and our portfolio companies’ outstanding financial instruments might be subject to change based on regulatory developments, which could adversely affect our revenue, expenses and the value of those financial instruments.” in our Annual Report on Form
10-K
for the year ended December 31, 2020. Item 3. Quantitative and Qualitative Disclosures About Market Risk
Our predominant exposure to market risk is related to our role as general partner or investment adviser to the Blackstone Funds and the sensitivities to movements in the fair value of their investments, including the effect on management fees, performance revenues and investment income. There were no material changes in our market risks as of March 31, 2021 as compared to December 31, 2020. For additional information, refer to our Annual Report on Form 10-K for the year ended December 31, 2020.
Item 4. Controls and Procedures
We maintain “disclosure controls and procedures,” as such term is defined in Rules 13a-15(e) and 15d-15(e) under the Securities Exchange Act of 1934, as amended (the “Exchange Act”), that are designed to ensure that information required to be disclosed by us in reports that we file or submit under the Exchange Act is recorded, processed, summarized and reported within the time periods specified in Securities and Exchange Commission rules and forms, and that such information is accumulated and communicated to our management, including our Chief Executive Officer and Chief Financial Officer, as appropriate, to allow timely decisions regarding required disclosure. In designing disclosure controls and procedures, our management necessarily was required to apply its judgment in evaluating the cost-benefit relationship of possible disclosure controls and procedures. The design of any disclosure controls and procedures also is based in part upon certain assumptions about the likelihood of future events, and there can be no assurance that any design will succeed in achieving its stated goals under all potential future conditions. Any controls and procedures, no matter how well designed and operated, can provide only reasonable assurance of achieving the desired objectives.
120
Our management, including our Chief Executive Officer and Chief Financial Officer, evaluated the effectiveness of our disclosure controls and procedures pursuant to Rule 13a-15 under the Exchange Act as of the end of the period covered by this report. Based on that evaluation, our Chief Executive Officer and Chief Financial Officer have concluded that, as of the end of the period covered by this report, our disclosure controls and procedures (as defined in Rule 13a-15(e) under the Exchange Act) are effective at the reasonable assurance level to accomplish their objectives of ensuring that information we are required to disclose in reports that we file or submit under the Exchange Act is recorded, processed, summarized and reported within the time periods specified in Securities and Exchange Commission rules and forms, and that such information is accumulated and communicated to our management, including our Chief Executive Officer and Chief Financial Officer, as appropriate, to allow timely decisions regarding required disclosure.
No change in our internal control over financial reporting (as such term is defined in Rules 13a-15(f) and 15d-15(f) under the Exchange Act) occurred during our most recent quarter, that has materially affected, or is reasonably likely to materially affect, our internal control over financial reporting.
Part II. Other Information
Item 1. Legal Proceedings
We may from time to time be involved in litigation and claims incidental to the conduct of our business. Our businesses are also subject to extensive regulation, which may result in regulatory proceedings against us. See “Part I. Item 1A. Risk Factors” in our Annual Report on Form 10-K for the year ended December 31, 2020. We are not currently subject to any pending legal (including judicial, regulatory, administrative or arbitration) proceedings that we expect to have a material impact on our consolidated financial statements. However, given the inherent unpredictability of these types of proceedings and the potentially large and/or indeterminate amounts that could be sought, an adverse outcome in certain matters could have a material effect on Blackstone’s financial results in any particular period. See “Part I. Item 1. Financial Statements — Notes to Condensed Consolidated Financial Statements — Note 17. Commitments and Contingencies — Contingencies — Litigation.”
Item 1A. Risk Factors
For a discussion of our potential risks and uncertainties, see the information under the heading “Risk Factors” in our Annual Report on Form 10-K for the year ended December 31, 2020 and in our subsequently filed periodic reports as such factors may be updated from time to time, all of which are accessible on the Securities and Exchange Commission’s website at www.sec.gov.
See “Part I. Item 2. Management’s Discussion and Analysis of Financial Condition and Results of Operations — Business Environment” in this report for a discussion of the conditions in the financial markets and economic conditions affecting our businesses. This discussion updates, and should be read together with, the risk factors entitled “The global outbreak of the novel coronavirus, or
COVID-19,
has caused severe disruptions in the U.S. and global economies and has adversely impacted, and may continue to adversely impact, our performance and results of operations” and “Difficult market and geopolitical conditions can adversely affect our business in many ways, each of which could materially reduce our revenue, earnings and cash flow and adversely affect our financial prospects and condition” in our Annual Report on Form 10-K for the year ended December 31, 2020. The risks described in our Annual Report on Form 10-K and in our subsequently filed periodic reports are not the only risks facing us. Additional risks and uncertainties not currently known to us or that we currently deem to be immaterial also may materially adversely affect our business, financial condition and/or operating results.
Item 2. Unregistered Sales of Equity Securities and Use of Proceeds
On July 16, 2019, our board of directors authorized the repurchase of up to $1.0 billion of common stock and Blackstone Holdings Partnership Units
(
the “2019 Repurchase Authorization”). On May 6, 2021, Blackstone’s board of directors authorized the repurchase of up to $1.0 billion of common stock and Blackstone Holdings Partnership Units, which authorization replaced the 2019 Repurchase Authorization. Under the repurchase program, repurchases may be made from time to time in open market transactions, in privately negotiated transactions or otherwise. The timing and the actual numbers repurchased will depend on a variety of factors, including legal requirements, price and economic and 121
market conditions. The repurchase program may be changed, suspended or discontinued at any time and does not have a specified expiration date. During the three months ended March 31, 2021, no shares of common stock were repurchased. As of March 31, 2021, the amount remaining available for repurchases under the program was $307.2 million. See “Part I. Item 1. Financial Statements – Notes to Condensed Consolidated Financial Statements – Note 14. Earnings Per Share and Stockholders’ Equity – Share Repurchase Program” and “Part I. Item 2. Management’s Discussion and Analysis of Financial Condition and Results of Operations – Liquidity and Capital Resources – Share Repurchase Program” for further information regarding this repurchase program.
As permitted by our policies and procedures governing transactions in our securities by our directors, executive officers and other employees, from time to time some of these persons may establish plans or arrangements complying with Rule 10b5-1 under the Exchange Act, and similar plans and arrangements relating to our common stock and Blackstone Holdings Partnership Units.
Item 3. Defaults Upon Senior Securities
Not applicable.
Item 4. Mine Safety Disclosures
Not applicable.
Item 5. Other Information
On May 6, 2021, David Payne, age 38, was appointed Chief Accounting Officer of the Company, effective May 10, 2021. Christopher Striano, who holds such title prior to the effective date of Mr. Payne’s appointment, has been named Chief Operating Officer for the Company’s global finance function, and continues to serve as a senior managing director of the Company.
Mr. Payne is a Managing Director at the Company and is Head of Corporate Development and Head of Financial Planning & Analysis. He oversees management reporting, financial planning and quarterly earnings preparation and has responsibility for strategic mergers and acquisitions, new business initiatives and special projects in support of the Company and its business units. Previously, Mr. Payne had additional responsibility for Blackstone’s corporate accounting functions and was chief financial officer of Blackstone’s previous advisory and restructuring and reorganization groups. Prior to that, Mr. Payne worked in Blackstone’s private equity group, where he was involved in the evaluation and execution of private equity investments across a range of industries. Before joining Blackstone in 2011, Mr. Payne worked in the North American buyout group at TPG Capital and in the mergers and acquisitions department at Morgan Stanley & Co. Mr. Payne received a BBA in Finance and Accounting from the University of Michigan, where he graduated with high distinction, and an MBA from Harvard Business School.
Like other Blackstone personnel, Mr. Payne invests in and alongside Blackstone’s funds as described in Blackstone’s Annual Report on Form 10-K for the year ended December 31, 2020.
122
Item 6. Exhibits
123
| * | Filed herewith. |
| + | Management contract or compensatory plan or arrangement in which directors or executive officers are eligible to participate. |
The agreements and other documents filed as exhibits to this report are not intended to provide factual information or other disclosure other than with respect to the terms of the agreements or other documents themselves, and you should not rely on them for that purpose. In particular, any representations and warranties made by us in these agreements or other documents were made solely within the specific context of the relevant agreement or document and may not describe the actual state of affairs as of the date they were made or at any other time.
124
Signatures
Pursuant to the requirements of the Securities Exchange Act of 1934, the Registrant has duly caused this report to be signed on its behalf by the undersigned thereunto duly authorized.
Date: May 7, 2021
| The Blackstone Group Inc. | ||
| /s/ Michael S. Chae | ||
| Name: | Michael S. Chae | |
| Title: | Chief Financial Officer | |
| (Principal Financial Officer and | ||
| Authorized Signatory) | ||
125
Similar companies
See also Apollo Global Management, Inc. - Annual report 2022 (10-K 2022-12-31) Annual report 2023 (10-Q 2023-09-30)See also AMERIPRISE FINANCIAL INC - Annual report 2022 (10-K 2022-12-31) Annual report 2023 (10-Q 2023-09-30)
See also KKR & Co. Inc. - Annual report 2022 (10-K 2022-12-31) Annual report 2023 (10-Q 2023-09-30)
See also PRICE T ROWE GROUP INC - Annual report 2022 (10-K 2022-12-31) Annual report 2023 (10-Q 2023-09-30)
See also Ares Management Corp - Annual report 2022 (10-K 2022-12-31) Annual report 2023 (10-Q 2023-09-30)