|
|
|
|
| Net loss | () | | | () | | | () | | | () | |
| Net income attributable to noncontrolling interests | () | | | () | | | () | | | () | |
| Net loss attributable to Caesars | $ | () | | | $ | () | | | $ | () | | | $ | () | |
| | | | | | | |
| Net loss per share - basic and diluted: | | | | | | | |
|
|
| Basic loss per share | $ | () | | | $ | () | | | $ | () | | | $ | () | |
|
|
| Diluted loss per share | $ | () | | | $ | () | | | $ | () | | | $ | () | |
| Weighted average basic shares outstanding | | | | | | | | | | | |
| Weighted average diluted shares outstanding | | | | | | | | | | | |
The accompanying notes are an integral part of these consolidated condensed financial statements.
CAESARS ENTERTAINMENT, INC.
CONSOLIDATED CONDENSED STATEMENTS OF COMPREHENSIVE INCOME (LOSS)
(UNAUDITED)
| | | | | | | | | | | | | | | | | | | | | | | |
| Three Months Ended June 30, | | Six Months Ended June 30, |
| (In millions) | 2025 | | 2024 | | 2025 | | 2024 |
| Net loss | $ | () | | | $ | () | | | $ | () | | | $ | () | |
|
|
| Other | | | | | | | | | | () | |
| Other comprehensive income (loss), net of tax | | | | | | | | | | () | |
| Comprehensive loss | () | | | () | | | () | | | () | |
| Comprehensive income attributable to noncontrolling interests | () | | | () | | | () | | | () | |
| Comprehensive loss attributable to Caesars | $ | () | | | $ | () | | | $ | () | | | $ | () | |
The accompanying notes are an integral part of these consolidated condensed financial statements.
CAESARS ENTERTAINMENT, INC.
CONSOLIDATED CONDENSED STATEMENTS OF STOCKHOLDERS’ EQUITY
(UNAUDITED)
| | | | | | | | | | | | | | | | | | | | | | | | | | | | | | | | | | | | | | | | | | | | | | | | | | | | | | | | | | | |
| Caesars Stockholders’ Equity | | | | |
| Preferred Stock | | Common Stock | | | | | | | | Treasury Stock | | | | |
| (In millions) | Shares | | Amount | | Shares | | Amount | | Paid-in Capital | | Accumulated Deficit | | Accumulated Other Comprehensive Income (Loss) | | Amount | | Noncontrolling Interests | | Total Stockholders’ Equity |
| Balance, December 31, 2024 | | | | $ | | | | | | | $ | | | | $ | | | | $ | () | | | $ | | | | $ | | | | $ | | | | $ | | |
| Stock-based compensation | — | | | — | | | | | | — | | | | | | — | | | — | | | — | | | — | | | | |
| Net income (loss) | — | | | — | | | — | | | — | | | — | | | () | | | — | | | — | | | | | | () | |
| | | | | | | | | | | |
| Shares withheld related to net share settlement of stock awards | — | | | — | | | — | | | — | | | () | | | — | | | — | | | — | | | — | | | () | |
| Transactions with noncontrolling interests | — | | | — | | | — | | | — | | | — | | | — | | | — | | | — | | | () | | | () | |
| Balance, March 31, 2025 | | | | | | | | | | | | | | | | () | | | | | | | | | | | | | |
| Stock-based compensation | — | | | — | | | — | | | — | | | | | | — | | | — | | | — | | | — | | | | |
| | | | | | | | | | | |
| Net income (loss) | — | | | — | | | — | | | — | | | — | | | () | | | — | | | — | | | | | | () | |
| Other comprehensive income, net of tax | — | | | — | | | — | | | — | | | — | | | — | | | | | | — | | | — | | | | |
| Shares withheld related to net share settlement of stock awards | — | | | — | | | — | | | — | | | () | | | — | | | — | | | — | | | — | | | () | |
| Repurchase of common stock | — | | | — | | | () | | | — | | | () | | | — | | | — | | | — | | | — | | | () | |
| Transactions with noncontrolling interests | — | | | — | | | — | | | — | | | — | | | — | | | — | | | — | | | () | | | () | |
| Balance, June 30, 2025 | | | | $ | | | | | | | $ | | | | $ | | | | $ | () | | | $ | | | | $ | | | | $ | | | | $ | | |
| | | | | | | | | | | |
| | | | | | | | | | | |
| | | | | | | | | | | |
| | | | | | | | | | | |
| | | | | | | | | | | |
| | | | | | | | | | | |
| | | | | | | | | | | |
| | | | | | | | | | | |
| | | | | | | | | | | |
| | | | | | | | | | | | | | | | | | | |
| Balance, December 31, 2023 | | | | $ | | | | | | | $ | | | | $ | | | | $ | () | | | $ | | | | $ | () | | | $ | | | | $ | | |
| Stock-based compensation | — | | | — | | | — | | | — | | | | | | — | | | — | | | — | | | — | | | | |
| Net income (loss) | — | | | — | | | — | | | — | | | — | | | () | | | — | | | — | | | | | | () | |
| Other comprehensive loss, net of tax | — | | | — | | | — | | | — | | | — | | | — | | | () | | | — | | | — | | | () | |
| Shares withheld related to net share settlement of stock awards | — | | | — | | | — | | | — | | | () | | | — | | | — | | | — | | | — | | | () | |
| | | | | | | | | | | |
| Balance, March 31, 2024 | | | | | | | | | | | | | | | | () | | | | | | () | | | | | | | |
| Stock-based compensation | — | | | — | | | — | | | — | | | | | | — | | | — | | | — | | | — | | | | |
| Net income (loss) | — | | | — | | | — | | | — | | | — | | | () | | | — | | | — | | | | | | () | |
| | | | | | | | | | | |
| Shares withheld related to net share settlement of stock awards | — | | | — | | | — | | | — | | | () | | | — | | | — | | | — | | | — | | | () | |
| Cancellation of shares issued | — | | | — | | | — | | | — | | | () | | | — | | | — | | | | | | — | | | | |
| Transactions with noncontrolling interests | — | | | — | | | — | | | — | | | — | | | — | | | — | | | — | | | () | | | () | |
| Balance, June 30, 2024 | | | | $ | | | | | | | $ | | | | $ | | | | $ | () | | | $ | | | | $ | () | | | $ | | | | $ | | |
| | | | | | | | | | | |
| | | | | | | | | | | |
| | | | | | | | | | | |
| | | | | | | | | | | |
| | | | | | | | | | | |
| | | | | | | | | | | |
|
|
|
|
|
Proceeds from sale of property and equipment | | | | | |
| Proceeds from the sale of investments | | | | | |
|
Distribution from unconsolidated affiliate | | | | | |
| Other | () | | | | |
| Net cash used in investing activities | () | | | () | |
| | | |
| CASH FLOWS FROM FINANCING ACTIVITIES: | | | |
| Proceeds from long-term debt and revolving credit facilities | | | | | |
| Repayments of long-term debt and revolving credit facilities | () | | | () | |
Repurchase of common stock | () | | | | |
| Financing obligation payments | () | | | () | |
| Debt issuance and extinguishment costs | | | | () | |
|
|
Distributions to noncontrolling interest owners | () | | | () | |
| Taxes paid related to net share settlement of equity awards | () | | | () | |
|
| Net cash used in financing activities | () | | | () | |
|
|
|
|
|
|
| | | |
|
|
| Increase (decrease) in cash, cash equivalents and restricted cash | | | | () | |
| Cash, cash equivalents and restricted cash, beginning of period | | | | | |
| Cash, cash equivalents and restricted cash, end of period | $ | | | | $ | | |
| | | |
| RECONCILIATION OF CASH, CASH EQUIVALENTS AND RESTRICTED CASH TO AMOUNTS REPORTED WITHIN THE CONSOLIDATED CONDENSED BALANCE SHEETS: | | | |
| Cash and cash equivalents | $ | | | | $ | | |
| Restricted cash | | | | | |
Restricted and escrow cash included in other long-term assets, net | | | | | |
|
| Total cash, cash equivalents and restricted cash | $ | | | | $ | | |
| | | |
| | | |
| | | | | | | | | | | |
| Six Months Ended June 30, |
| (In millions) | 2025 | | 2024 |
| SUPPLEMENTAL DISCLOSURE OF CASH FLOW INFORMATION: | | | |
| Cash interest paid for debt | $ | | | | $ | | |
| Cash interest paid for rent related to financing obligations | | | | | |
| Income taxes paid, net | | | | | |
| NON-CASH INVESTING AND FINANCING ACTIVITIES: | | | |
| Payables for capital expenditures | | | | | |
Acquisition of intangible assets | | | | | |
|
|
|
The accompanying notes are an integral part of these consolidated condensed financial statements.
CAESARS ENTERTAINMENT, INC.
NOTES TO CONSOLIDATED CONDENSED FINANCIAL STATEMENTS
(UNAUDITED)
The accompanying consolidated condensed financial statements include the accounts of Caesars Entertainment, Inc., a Delaware corporation, and its consolidated subsidiaries which may be referred to as the “Company,” “CEI,” “Caesars,” “we,” “our,” or “us” within these financial statements.
This Form 10-Q should be read in conjunction with our Annual Report on Form 10-K for the year ended December 31, 2024 (the “2024 Annual Report”). Capitalized terms used but not defined in this Form 10-Q have the same meanings as in the 2024 Annual Report.
We also refer to (i) our Consolidated Condensed Financial Statements as our “Financial Statements,” (ii) our Consolidated Condensed Balance Sheets as our “Balance Sheets,” (iii) our Consolidated Condensed Statements of Operations and Consolidated Condensed Statements of Comprehensive Income (Loss) as our “Statements of Operations,” and (iv) our Consolidated Condensed Statements of Cash Flows as our “Statements of Cash Flows.”
Note 1.
domestic properties in states with approximately slot machines, video lottery terminals and e-tables, approximately table games and approximately hotel rooms as of June 30, 2025. In addition, the Company has other properties in North America that are authorized to use the brands and marks of Caesars Entertainment, Inc., as well as other non-gaming properties. The Company’s primary source of revenue is generated by its gaming operations, which includes its casino properties, retail and online sports betting, and online gaming. Additionally, the Company utilizes its hotels, restaurants, bars, entertainment, racing, retail shops and other services to attract customers to its properties.The Company’s operations for retail and online sports betting, iGaming, horse racing and online poker are included under the Caesars Digital segment. The Company operates retail and online sports wagering in jurisdictions in North America, of which offer online sports betting, and operates iGaming in jurisdictions in North America as of June 30, 2025. The Company operates the Caesars Sportsbook app, the Caesars Racebook app, the Caesars Palace Online Casino app and the Horseshoe Online Casino app which initially launched in October 2024. The Company also expects to continue to grow its operations in the Caesars Digital segment as new jurisdictions legalize retail and online sports betting and iGaming.
Divestiture
The Company periodically divests assets that it may not consider core to its business to raise capital or, in some cases, to comply with conditions, terms, obligations or restrictions imposed by antitrust, gaming and other regulatory entities.
On December 12, 2024, the Company closed the sale of the LINQ Promenade to a joint venture between TPG Real Estate and the Investment Management Platform of Acadia Realty Trust for $ million. The LINQ Promenade was reported within the Las Vegas segment. For the three and six months ended June 30, 2024, the operations of the LINQ Promenade resulted in $ million and $ million of net revenues, respectively, and $ million and $ million of net income, respectively.
On October 29, 2024, the Company closed the sale of the World Series of Poker (“WSOP”) trademark to NSUS Group Inc. for total consideration of $ million, which included a $ million note receivable. In July 2025, the Company monetized $ million of notes receivable and applied the proceeds to the redemption of outstanding debt. See Note 6.
CAESARS ENTERTAINMENT, INC.
NOTES TO CONSOLIDATED CONDENSED FINANCIAL STATEMENTS (CONTINUED)
(UNAUDITED)
Note 2.
CAESARS ENTERTAINMENT, INC.
NOTES TO CONSOLIDATED CONDENSED FINANCIAL STATEMENTS (CONTINUED)
(UNAUDITED)
As of both June 30, 2025 and December 31, 2024, the Company held $ million in Level 1 securities.
As of June 30, 2025 and December 31, 2024, the Company did not hold any cash flow hedges or any derivative financial instruments for trading purposes.
Advertising costs for the three months ended June 30, 2025 and 2024 were $ million and $ million, respectively, and for the six months ended June 30, 2025 and 2024 totaled $ million and $ million, respectively, and are included within operating expenses.
| | $ | | | | $ | | | | $ | | | | Capitalized interest | () | | | () | | | () | | | () | |
| Interest income | () | | | () | | | () | | | () | |
| Total interest expense, net | $ | | | | $ | | | | $ | | | | $ | | |
CAESARS ENTERTAINMENT, INC.
NOTES TO CONSOLIDATED CONDENSED FINANCIAL STATEMENTS (CONTINUED)
(UNAUDITED)
Note 3.
| | $ | | | | Buildings, riverboats, and leasehold and land improvements | | | | | |
| Furniture, fixtures, and equipment | | | | | |
| Construction in progress | | | | | |
| Total property and equipment | | | | | |
| Less: accumulated depreciation | () | | | () | |
| Total property and equipment, net | $ | | | | $ | | |
A portion of our property and equipment is subject to various operating leases for which we are the lessor. Leased property includes our hotel rooms, convention space and retail space through various short-term and long-term operating leases.
| | $ | | | | $ | | | | $ | | | | | | | Depreciation is calculated using the straight-line method over the shorter of the estimated useful life of the asset or the related lease.
Note 4.
t recognize any impairment charges. During the three and six months ended June 30, 2024, the Company recognized impairment charges in our Regional segment related to trademarks, gaming rights and goodwill totaling $ million. | | $ | | | | $ | | |
| |
| Amortization expense | () | | | — | | | — | |
| Other | | | | | | | | |
| |
| |
Balances as of June 30, 2025 | $ | | | | $ | | | | $ | | |
CAESARS ENTERTAINMENT, INC.
NOTES TO CONSOLIDATED CONDENSED FINANCIAL STATEMENTS (CONTINUED)
(UNAUDITED)
| $ | | | | $ | () | | | $ | | | | $ | | | | $ | () | | | $ | | | | Gaming rights and other | - years | | | | | () | | | | | | | | | () | | | | |
| Trademarks | years | | | | | () | | | | | | | | | () | | | | |
| Reacquired rights | years | | | | | () | | | | | | | | | () | | | | |
| Technology | - years | | | | | () | | | | | | | | | () | | | | |
| | | $ | | | | $ | () | | | | | | $ | | | | $ | () | | | | |
| | | | | | | | | | | | | |
| Non-amortizing intangible assets other than Goodwill | | | | | | | | | | |
| Trademarks | | | | | | | | | | | | | | | |
| Gaming rights | | | | | | | | | | | | | | | |
| Caesars Rewards | | | | | | | | | | | | | | | |
| | | | | |
| | | | | | | | | | | | | | | |
| Total amortizing and non-amortizing intangible assets other than Goodwill, net | | $ | | | | | | | | $ | | |
Amortization expense with respect to intangible assets totaled $ million for both the three months ended June 30, 2025 and 2024, and for the six months ended June 30, 2025 and 2024 totaled $ million and $ million, respectively, which is included in Depreciation and amortization in the Statements of Operations.
| | $ | | | | $ | | | | $ | | | | $ | | | | $ | | | Note 5.
million and $ million, respectively, with contracts extending through 2040. These obligations are composed of various third-party agreements which have been entered into by the Company for certain of our Las Vegas and Regional properties, or our Caesars Digital segment. The agreements include leasing of event suites that are generally considered short-term leases for which the Company does not record a right of use asset or lease liability. The Company recognizes expenses in the period services are received in accordance with the various agreements. In addition, assets or liabilities may be recorded related to the timing of payments as required by the respective agreement.
CAESARS ENTERTAINMENT, INC.
NOTES TO CONSOLIDATED CONDENSED FINANCIAL STATEMENTS (CONTINUED)
(UNAUDITED)
The assumptions utilized by our actuaries are subject to significant uncertainty and if outcomes differ from these assumptions or events develop or progress in a negative manner, the Company could experience a material adverse effect and additional liabilities may be recorded in the future.
Note 6.
| | $ | | | | $ | | | | CEI Term Loan A | 2028 | | variable | | | | | | | | | |
| CVA Revolving Credit Facility | 2029 | | variable | | | | | | | | | |
| CVA Delayed Draw Term Loan | 2029 | | variable | | | | | | | | | |
| CEI Term Loan B | 2030 | | variable | | | | | | | | | |
| CEI Term Loan B-1 | 2031 | | variable | | | | | | | | | |
| CEI Senior Secured Notes due 2030 | 2030 | | % | | | | | | | | | |
| CEI Senior Secured Notes due 2032 | 2032 | | % | | | | | | | | | |
| Unsecured Debt | | | | | | | | | |
CEI Senior Notes due 2027 | 2027 | | % | | | | | | | | | |
| CEI Senior Notes due 2029 | 2029 | | % | | | | | | | | | |
| CEI Senior Notes due 2032 | 2032 | | % | | | | | | | | | |
| Special Improvement District Bonds | 2037 | | % | | | | | | | | | |
| Long-term notes and other payables | | | | | | | | | | | | |
| Total debt | | | | | | | | | |
| Current portion of long-term debt | | () | | | () | | | () | |
| Deferred finance charges associated with the CEI Revolving Credit Facility | | | | | () | | | () | |
| Long-term debt | | $ | | | | $ | | | | $ | | |
| | | | | | |
| Unamortized discounts and deferred finance charges | | | | $ | | | | $ | | |
| Fair value | | $ | | | | | | |
| | $ | | | | $ | | | | $ | | | | $ | | | | $ | | | | $ | | | | Estimated interest payments | | | | | | | | | | | | | | | | | | | | |
Total debt service obligation (b) | $ | | | | $ | | | | $ | | | | $ | | | | $ | | | | $ | | | | $ | | |
____________________
(a)Maturities of $ million in 2027 were repaid with borrowings under the CEI Revolving Credit Facility and proceeds received from the partial repayment and sale of notes receivable related to our previously disclosed WSOP trademark sale. See “CEI Senior Notes due 2027” below.
(b)Debt principal payments are estimated amounts based on contractual maturity and scheduled repayment dates. Interest payments are estimated based on the forward-looking SOFR curve, where applicable. Actual payments may differ from these estimates.
Current Portion of Long-Term Debt
The current portion of long-term debt as of June 30, 2025 includes the principal payments on the term loans, special improvement district bonds, and other unsecured borrowings that are contractually due within 12 months. The Company may, from time to time, seek to repurchase or prepay its outstanding indebtedness. Any such purchases or repayments may be funded by existing cash balances or the incurrence of debt. The amount and timing of any repurchase will be based on business and market conditions, capital availability, compliance with debt covenants and other considerations.
CAESARS ENTERTAINMENT, INC.
NOTES TO CONSOLIDATED CONDENSED FINANCIAL STATEMENTS (CONTINUED)
(UNAUDITED)
Fair Value
The fair value of debt has been calculated primarily based on the borrowing rates available as of June 30, 2025 and based on market quotes of our publicly traded debt. We classify the fair value of debt within Level 1 and Level 2 in the fair value hierarchy.
Terms of Outstanding Debt
CEI Term Loans and CEI Revolving Credit Facility
CEI is party to a credit agreement, dated as of July 20, 2020, with JPMorgan Chase Bank, N.A., as administrative agent, U.S. Bank National Association, as collateral agent, and certain banks and other financial institutions and lenders party thereto (the “CEI Credit Agreement”), which, as amended, provides for the CEI Revolving Credit Facility in an aggregate principal amount of $ billion (the “CEI Revolving Credit Facility”) and will mature on January 31, 2028. The CEI Revolving Credit Facility includes a letter of credit sub-facility of $ million and contains reserves of $ million which are available only for certain permitted uses.
On October 5, 2022, Caesars entered into an amendment to the CEI Credit Agreement pursuant to which the Company incurred a senior secured term loan in an aggregate principal amount of $ million (the “CEI Term Loan A”) as a new term loan under the credit agreement and made certain other amendments to the CEI Credit Agreement. The CEI Term Loan A will mature on January 31, 2028. The CEI Term Loan A requires scheduled quarterly payments in amounts equal to % of the original aggregate principal amount of the CEI Term Loan A, with the balance payable at maturity.
Borrowings under the CEI Revolving Credit Facility and the CEI Term Loan A bear interest, paid at least quarterly, at a rate equal to, at the Company’s option, either (a) a forward-looking term rate based on the Secured Overnight Financing Rate (“Term SOFR”) for the applicable interest period plus an adjustment of % per annum (the “Term SOFR Adjustment” and Term SOFR as so adjusted, “Adjusted Term SOFR”), subject to a floor of % or (b) a base rate (the “Base Rate”) determined by reference to the highest of (i) the rate of interest per annum last quoted by The Wall Street Journal as the “Prime Rate” in the United States, (ii) the federal funds rate plus % per annum and (iii) the one-month Term SOFR plus % per annum, plus, in the case of the CEI Revolving Credit Facility and the CEI Term Loan A only, the Term SOFR Adjustment, in each case, plus an applicable margin. Such applicable margin is % per annum in the case of any Adjusted Term SOFR loan and % per annum in the case of any Base Rate loan, subject to % step-downs based on the Company’s net total leverage ratio. In addition, on a quarterly basis, the Company is required to pay each lender under the CEI Revolving Credit Facility a commitment fee in respect of any unused commitments under the CEI Revolving Credit Facility in the amount of % per annum of the principal amount of the unused commitments of such lender, subject to % step-downs based on the Company’s net total leverage ratio.
On February 6, 2023, the Company entered into an Incremental Assumption Agreement No. 2 pursuant to which the Company incurred a new senior secured incremental term loan in an aggregate principal amount of $ billion (the “CEI Term Loan B”) under the CEI Credit Agreement. The CEI Term Loan B requires scheduled quarterly principal payments in amounts equal to % of the original aggregate principal amount of the CEI Term Loan B, with the balance payable at maturity. Borrowings under the CEI Term Loan B, as amended, bear interest, paid at least quarterly, at a rate equal to, at the Company’s option, either (a) Term SOFR, subject to a floor of % or (b) the Base Rate, in each case, plus an applicable margin. Such applicable margin is % per annum in the case of any Term SOFR loan and % per annum in the case of any Base Rate loan. The CEI Term Loan B will mature on February 6, 2030.
CAESARS ENTERTAINMENT, INC.
NOTES TO CONSOLIDATED CONDENSED FINANCIAL STATEMENTS (CONTINUED)
(UNAUDITED)
During the six months ended June 30, 2025, the Company utilized and fully repaid the CEI Revolving Credit Facility. Such activity is presented in the financing section in the Statements of Cash Flows. As of June 30, 2025, the Company had $ billion of available borrowing capacity under the CEI Revolving Credit Facility, after consideration of $ million in outstanding letters of credit, $ million committed for regulatory purposes, and the reserves described above.
Caesars Virginia Credit Facility due 2029
On April 26, 2024, Caesars Virginia, LLC entered into a credit agreement with Wells Fargo Bank, N.A., as administrative agent and collateral agent, and certain banks and other financial institutions and lenders party thereto, which provides for a senior secured first lien multi-draw term loan facility up to an aggregate principal amount of $ million (the “CVA Delayed Draw Term Loan”) and a senior secured first lien revolving credit facility in an aggregate principal amount of $ million (the “CVA Revolving Credit Facility”), both maturing on April 26, 2029.
The CVA Delayed Draw Term Loan requires quarterly principal payments which began on June 30, 2025. The CVA Revolving Credit Facility and the CVA Delayed Draw Term Loan are subject to a variable rate of interest based on Term SOFR plus an applicable margin. The CVA Revolving Credit Facility includes a $ million letter of credit sub-facility. As of June 30, 2025, there was $ million of remaining available borrowing capacity under the CVA Delayed Draw Term Loan and $ million of available borrowing capacity under the CVA Revolving Credit Facility.
CEI Senior Secured Notes due 2030
On February 6, 2023, the Company issued $ billion in aggregate principal amount of % senior secured notes (the “CEI Senior Secured Notes due 2030”) pursuant to an indenture by and among the Company, the subsidiary guarantors party thereto from time to time, U.S. Bank Trust Company, National Association, as trustee, and U.S. Bank National Association, as collateral agent. The CEI Senior Secured Notes due 2030 rank equally with all existing and future first-priority lien obligations of the Company and the subsidiary guarantors. The CEI Senior Secured Notes due 2030 will mature on February 15, 2030, with interest payable semi-annually on February 15 and August 15 of each year.
CEI Senior Secured Notes due 2032
On February 6, 2024, the Company issued $ billion in aggregate principal amount of % senior secured notes due 2032 (the “CEI Senior Secured Notes due 2032”) pursuant to an indenture by and among the Company, the subsidiary guarantors party thereto, U.S. Bank Trust Company, National Association, as trustee, and U.S. Bank National Association, as collateral agent. The CEI Senior Secured Notes due 2032 rank equally with all existing and future first-priority lien obligations of the Company and the subsidiary guarantors. The CEI Senior Secured Notes due 2032 will mature on February 15, 2032, with interest payable semi-annually on February 15 and August 15 of each year.
CEI Senior Notes due 2027
On July 6, 2020, Colt Merger Sub, Inc. (the “Escrow Issuer”) issued $ billion in aggregate principal amount of % Senior Notes due 2027 pursuant to an indenture, dated July 6, 2020 (the “CEI Senior Notes due 2027”), by and between the Escrow Issuer and U.S. Bank National Association, as trustee. The CEI Senior Notes due 2027 rank equally with all existing and future senior unsecured indebtedness of the Company and the subsidiary guarantors. The CEI Senior Notes due 2027 will mature on July 1, 2027, with interest payable semi-annually on January 1 and July 1 of each year.
On July 8, 2025, the Company fully redeemed all of the $ million outstanding principal amount of the CEI Senior Notes due 2027 and paid the related accrued interest and expenses with borrowings under the CEI Revolving Credit Facility and proceeds received from the partial repayment and sale of $ million of notes receivable related to the previously disclosed WSOP trademark sale. As a result of the early repayment, the Company recognized approximately $ million of loss on extinguishment of debt.
CAESARS ENTERTAINMENT, INC.
NOTES TO CONSOLIDATED CONDENSED FINANCIAL STATEMENTS (CONTINUED)
(UNAUDITED)
CEI Senior Notes due 2032
On October 17, 2024, the Company issued $ billion in aggregate principal amount of % Senior Notes due 2032 (the “CEI Senior Notes due 2032”) pursuant to an indenture dated as of October 17, 2024, by and among the Company, the subsidiary guarantors party thereto, and U.S. Bank Trust Company, National Association, as trustee. The CEI Senior Notes due 2032 rank equally with all existing and future senior unsecured indebtedness of the Company and the subsidiary guarantors. The CEI Senior Notes due 2032 will mature on October 15, 2032, with interest payable semi-annually on April 15 and October 15 of each year.
Debt Covenant Compliance
The CEI Revolving Credit Facility, the CEI Term Loan A, the CEI Term Loan B, the CEI Term Loan B-1 and the indentures governing the CEI Senior Secured Notes due 2030, the CEI Senior Secured Notes due 2032, the CEI Senior Notes due 2027, the CEI Senior Notes due 2029 and the CEI Senior Notes due 2032 contain covenants which are standard and customary for these types of agreements. These include negative covenants, which, subject to certain exceptions and baskets, limit the Company’s and its subsidiaries’ ability to (among other items) incur additional indebtedness, make investments, make restricted payments, including dividends, grant liens, sell assets and make acquisitions.
The CEI Revolving Credit Facility and the CEI Term Loan A include a maximum net total leverage ratio financial covenant of :1. In addition, the CEI Revolving Credit Facility and the CEI Term Loan A include a minimum fixed charge coverage ratio financial covenant of :1. From and after the repayment of the CEI Term Loan A, the financial covenants applicable to the CEI Revolving Credit Facility will be tested solely to the extent that certain testing conditions are satisfied. Failure to comply with such covenants could result in an acceleration of the maturity of indebtedness outstanding under the relevant debt agreement.
The CVA Revolving Credit Facility and the CVA Delayed Draw Term Loan contain covenants which are standard and customary for this type of agreement, including a maximum net total leverage ratio financial covenant of :1 and a minimum fixed charge coverage ratio financial covenant of :1, applicable to the operations of Caesars Virginia,.
As of June 30, 2025, the Company was in compliance with all of the applicable financial covenants described above.
Guarantees
The CEI Revolving Credit Facility, the CEI Term Loan A, the CEI Term Loan B, the CEI Term Loan B-1, the CEI Senior Secured Notes due 2030 and the CEI Senior Secured Notes due 2032 are guaranteed on a senior secured basis by each existing and future material wholly-owned domestic subsidiary of the Company and are secured by substantially all of the existing and future property and assets of the Company and its subsidiary guarantors (subject to certain exceptions). The CEI Senior Notes due 2027, the CEI Senior Notes due 2029 and the CEI Senior Notes due 2032 are guaranteed on a senior unsecured basis by such subsidiaries.
The CVA Revolving Credit Facility and the CVA Delayed Draw Term Loan are secured by substantially all material assets of Caesars Virginia, LLC and any newly formed wholly-owned subsidiary of Caesars Virginia, LLC. CEI does not provide a guarantee of these facilities.
Note 7.
CAESARS ENTERTAINMENT, INC.
NOTES TO CONSOLIDATED CONDENSED FINANCIAL STATEMENTS (CONTINUED)
(UNAUDITED)
| | $ | | | | $ | | | | $ | | | | $ | | | | $ | | | | Food and beverage | | | | | | | | | | | | | | | | | |
| Hotel | | | | | | | | | | | | | | | | | |
| Other | | | | | | | | | | | | | | | | | |
| | | |
| | | |
| Net revenues | $ | | | | $ | | | | $ | | | | $ | | | | $ | | | | $ | | |
| | | | | | | | | | | | | | | | | | | | | | | | | | | | | | | | | | | |
| Three Months Ended June 30, 2024 |
| (In millions) | Las Vegas | | Regional | | Caesars Digital | | Managed and Branded | | Corporate and Other | | Total |
| Casino | $ | | | | $ | | | | $ | | | | $ | | | | $ | () | | | $ | | |
| Food and beverage | | | | | | | | | | | | | | | | | |
| Hotel | | | | | | | | | | | | | | | | | |
| Other | | | | | | | | | | | | | | | | | |
| Net revenues | $ | | | | $ | | | | $ | | | | $ | | | | $ | () | | | $ | | |
| | | | | | | | | | | | | | | | | | | | | | | | | | | | | | | | | | | |
| Six Months Ended June 30, 2025 |
| (In millions) | Las Vegas | | Regional | | Caesars Digital | | Managed and Branded | | Corporate and Other | | Total |
| Casino | $ | | | | $ | | | | $ | | | | $ | | | | $ | () | | | $ | | |
| Food and beverage | | | | | | | | | | | | | | | | | |
| Hotel | | | | | | | | | | | | | | | | | |
| Other | | | | | | | | | | | | | | | | | |
| | | |
| | | |
| Net revenues | $ | | | | $ | | | | $ | | | | $ | | | | $ | | | | $ | | |
| | | | | | | | | | | | | | | | | | | | | | | | | | | | | | | | | | | |
| Six Months Ended June 30, 2024 |
| (In millions) | Las Vegas | | Regional | | Caesars Digital | | Managed and Branded | | Corporate and Other | | Total |
| Casino | $ | | | | $ | | | | $ | | | | $ | | | | $ | () | | | $ | | |
| Food and beverage | | | | | | | | | | | | | | | | | |
| Hotel | | | | | | | | | | | | | | | | | |
| Other | | | | | | | | | | | | | | | | | |
| Net revenues | $ | | | | $ | | | | $ | | | | $ | | | | $ | () | | | $ | | |
| | $ | | | | Food and beverage and hotel | | | | | |
| Other | | | | | |
| Accounts receivable, net | $ | | | | $ | | |
Contract and Contract Related Liabilities
The Company records contract or contract related liabilities related to differences between the timing of cash receipts from the customer and the recognition of revenue. The Company generally has three types of liabilities related to contracts with customers: (1) outstanding chip liability, which represents the amounts owed in exchange for gaming chips held by customers, (2) Caesars Rewards player loyalty program obligations, which represent the deferred allocation of revenue relating to reward credits granted to Caesars Rewards members based on certain types of customer spend, including online and retail gaming, hotel, dining, retail shopping, and player loyalty program incentives earned, and (3) customer deposits and other deferred revenue, which primarily represents funds deposited by customers related to gaming play and advance payments received for goods and services yet to be provided (such as advance ticket sales, deposits on rooms and convention space, unpaid wagers, iGaming deposits, or future sports bets). These liabilities are generally expected to be recognized as revenue within one year of being purchased, earned, or deposited and are recorded within Accrued other liabilities on the Company’s Balance Sheets.
CAESARS ENTERTAINMENT, INC.
NOTES TO CONSOLIDATED CONDENSED FINANCIAL STATEMENTS (CONTINUED)
(UNAUDITED)
| | $ | | | | $ | | | | $ | | | | $ | | | | $ | | | | Balance at June 30 | | | | | | | | | | | | | | | | | |
| Increase / (decrease) | $ | () | | | $ | () | | | $ | | | | $ | | | | $ | | | | $ | () | |
Lease Revenue
Lodging Arrangements
Lodging arrangements are considered short-term and generally consist of lease and nonlease components. The lease component is the predominant component of the arrangement and consists of the fees charged for lodging. The nonlease components primarily consist of resort fees and other miscellaneous items. As the timing and pattern of transfer of both the lease and nonlease components are over the course of the lease term, we have elected to combine the revenue generated from lease and nonlease components into a single lease component based on the predominant component in the arrangement. During the three months ended June 30, 2025 and 2024, we recognized lease revenue of approximately $ million and $ million, respectively, and during the six months ended June 30, 2025 and 2024, we recognized approximately $ million and $ billion, respectively, which is included in Hotel revenues in the Statements of Operations.
Conventions
Convention arrangements are considered short-term and generally consist of lease and nonlease components. The lease component is the predominant component of the arrangement and consists of fees charged for the use of meeting space. The nonlease components primarily consist of food and beverage and audio/visual services. Revenue from conventions is included in Food and beverage revenue in the Statements of Operations and during the three months ended June 30, 2025 and 2024, lease revenue related to conventions was approximately $ million and $ million, respectively, and during the six months ended June 30, 2025 and 2024, lease revenue related to conventions was approximately $ million and $ million, respectively.
Real Estate Operating Leases
Real estate lease revenue is included in Other revenue in the Statements of Operations. During the three months ended June 30, 2025 and 2024, we recognized approximately $ million and $ million, respectively, and during the six months ended June 30, 2025 and 2024, we recognized approximately $ million and $ million, respectively, of real estate lease revenue.
Real estate lease revenue includes $ million of variable rental income for both the three months ended June 30, 2025 and 2024, and $ million and $ million for the six months ended June 30, 2025 and 2024, respectively.
Note 8.
) | | $ | () | | | $ | () | | | $ | () | | | Shares outstanding: | | | | | | | |
| Weighted average shares outstanding – basic | | | | | | | | | | | |
|
|
|
| Weighted average shares outstanding – diluted | | | | | | | | | | | |
| | | | | | | |
|
|
| Net loss per common share attributable to common stockholders – basic: | $ | () | | | $ | () | | | $ | () | | | $ | () | |
|
|
|
| Net loss per common share attributable to common stockholders – diluted: | $ | () | | | $ | () | | | $ | () | | | $ | () | |
CAESARS ENTERTAINMENT, INC.
NOTES TO CONSOLIDATED CONDENSED FINANCIAL STATEMENTS (CONTINUED)
(UNAUDITED)
| | | | | | | | | | | Total anti-dilutive common stock | | | | | | | | | | | |
Note 9.
million during both the three months ended June 30, 2025 and 2024, and $ million and $ million during the six months ended June 30, 2025 and 2024, respectively. These amounts are included in Corporate expense in the Company’s Statements of Operations. 2015 Equity Incentive Plan (the “2015 Plan”)
During the six months ended June 30, 2025, as part of the annual incentive program, the Company granted million RSUs to eligible participants with an aggregate fair value of $ million and generally vest ratably on each anniversary over from the grant date. Each RSU represents the right to receive payment in respect of share of the Company’s Common Stock.
During the six months ended June 30, 2025, the Company also granted thousand PSUs to eligible participants with an aggregate fair value of $ million that are primarily scheduled to cliff vest after from the date of grant. On the vesting date, recipients will receive between % and % of the target number of PSUs granted, in the form of Company Common Stock, based on the achievement of specified performance and service conditions and terms of the underlying award granted. The fair value of the PSUs is based on the market price of our common stock when a mutual understanding of the key terms and conditions of the awards between the Company and recipient is achieved. The awards are remeasured each period until such an understanding is reached.
In addition, during the six months ended June 30, 2025, the Company granted thousand MSUs to eligible participants with an aggregate fair value of $ million that are primarily scheduled to cliff vest after from the date of grant. On the vesting date, recipients will receive between % and % of the target number of MSUs granted, in the form of Company Common Stock, based on the achievement of specified market and service conditions and terms of the underlying award granted. The grant date fair value of the MSUs was determined using a Monte-Carlo simulation model. Key assumptions for the Monte-Carlo simulation model are the risk-free interest rate, expected volatility, expected dividends and correlation coefficient. The effect of market conditions is considered in determining the grant date fair value, which is not subsequently revised based on actual performance.
During the six months ended June 30, 2025, million, thousand and thousand of RSUs, PSUs and MSUs, respectively, vested under the 2015 Plan.
CAESARS ENTERTAINMENT, INC.
NOTES TO CONSOLIDATED CONDENSED FINANCIAL STATEMENTS (CONTINUED)
(UNAUDITED)
| Foreign currency and other | | |
| Total other comprehensive income (loss), net of tax | | |
Balances as of March 31, 2025 | | |
| Foreign currency and other | | |
| Total other comprehensive income, net of tax | | |
Balances as of June 30, 2025 | $ | | |
|
|
Share Repurchase Program
On October 2, 2024, the Company announced that its Board authorized a $ million common stock repurchase program (the “2024 Share Repurchase Program”). Under the 2024 Share Repurchase Program, the Company may, from time to time, repurchase shares of common stock on the open market (either with or without a 10b5-1 plan) or through privately negotiated transactions. In April 2025, the Company acquired shares of our common stock at an aggregate value of $ million, at an average of $ per share, excluding commissions or applicable excise tax. As of June 30, 2025, we are authorized to repurchase up to $ million of common stock under the 2024 Share Repurchase Program. The 2024 Share Repurchase Program has no time limit and may be suspended or discontinued at any time without notice. There is no minimum number of shares of common stock that the Company is required to repurchase under the 2024 Share Repurchase Program. All share repurchases under the 2024 Share Repurchase Program are retired upon repurchase.
Note 10.
CAESARS ENTERTAINMENT, INC.
NOTES TO CONSOLIDATED CONDENSED FINANCIAL STATEMENTS (CONTINUED)
(UNAUDITED)
| | $ | () | | | $ | () | | | $ | () | |
| Provision for income taxes | () | | | () | | | () | | | () | |
| Effective tax rate | () | % | | () | % | | () | % | | () | % |
The Company classifies accruals for uncertain tax positions within Other long-term liabilities on the Balance Sheets, separate from any related income tax payable or deferred income taxes. Reserve amounts relate to any potential income tax liabilities resulting from uncertain tax positions as well as potential interest or penalties associated with those liabilities.
Management assesses the available positive and negative evidence to estimate if sufficient future taxable income will be generated to use existing deferred tax assets. The Company is carrying a valuation allowance on certain federal and state deferred tax assets that are not more likely than not to be realized in the future. The Company has assessed the changes to the valuation allowance, including realization of the disallowed interest expense deferred tax asset, using the integrated approach.
The income tax provision for the three and six months ended June 30, 2025 and 2024 differed from the expected income tax provision based on the federal tax rate of 21% primarily due to an increase in federal and state valuation allowances against the deferred tax assets for excess business interest expense.
The Company, including its subsidiaries, files tax returns with federal, state, and foreign jurisdictions. The Company does not have tax sharing agreements with the other members within its consolidated group. The Company is subject to exam by various state and foreign tax authorities. With few exceptions, the Company is no longer subject to US federal or state and local tax assessments by tax authorities for years before 2021, and it is possible that the amount of the liability for unrecognized tax benefits could change during the next 12 months.
Note 11.
square feet which is leased from C. S. & Y. Associates (“CSY”) (the “CSY Lease”). CSY is a general partnership in which a trust has an approximate % interest. The Company’s Executive Chairman of the Board, Gary L. Carano, and his siblings are direct or indirect beneficiaries of the trust. The CSY Lease expires on June 30, 2057. Annual rent pursuant to the CSY Lease is currently $ million, paid monthly. Annual rent is subject to periodic rent escalations of to percent through the term of the lease. Commensurate with its interest, the trust receives directly from the Company approximately % of the rent paid by the Company. As of June 30, 2025 and December 31, 2024, there were amounts due to or from CSY.CVA Holdco, LLC
In May 2023, the Company entered into a joint venture, CVA Holdco, LLC, with the Eastern Band of Cherokee Indians (“EBCI”) to construct, own and operate a gaming facility in Danville, Virginia (“Caesars Virginia”). Caesars Virginia opened in a temporary facility on May 15, 2023 followed by the completion of construction and opening of the permanent facility on December 17, 2024. As the managing member, the Company operates the business and has managed the development, construction, financing, marketing, leasing, maintenance and day-to-day operation of the various phases of the project. The Company holds a % variable interest in the joint venture and is the primary beneficiary; as such, the joint venture’s operations are included in the Financial Statements, with a minority interest recorded reflecting the operations attributed to the other partner. The Company participates ratably, based on ownership percentage, in the profits and losses of the joint venture. During the six months ended June 30, 2025, the Company made distributions totaling $ million to the partner.
CAESARS ENTERTAINMENT, INC.
NOTES TO CONSOLIDATED CONDENSED FINANCIAL STATEMENTS (CONTINUED)
(UNAUDITED)
| Distributions | () | |
Equity in earnings | | |
Balance as of June 30, 2025 | $ | | |
CAESARS ENTERTAINMENT, INC.
NOTES TO CONSOLIDATED CONDENSED FINANCIAL STATEMENTS (CONTINUED)
(UNAUDITED)
Note 12.
reportable segments. The reportable segments are based on the similar characteristics of the operating segments with the way management assesses these results and allocates resources, which is a consolidated view that adjusts for the effect of certain transactions between these reportable segments within Caesars: (1) Las Vegas, (2) Regional, (3) Caesars Digital, and (4) Managed and Branded, in addition to Corporate and Other. See table below for a summary of these segments. Certain of our properties operate off-track betting locations, including Harrah’s Hoosier Park Racing & Casino, which operates Winner’s Circle Indianapolis and Winner’s Circle New Haven, and Horseshoe Indianapolis, which operates Winner’s Circle Clarksville. On December 12, 2024, we sold the LINQ Promenade, which is an open-air dining, entertainment, and retail promenade next to The LINQ Hotel & Casino (the “LINQ”). We continue to operate the High Roller, a -foot observation wheel, and the Fly LINQ Zipline attraction, located on the east side of the Las Vegas Strip next to the LINQ. The CAESARS FORUM is a square feet conference center with square feet of flexible meeting space, of the largest pillarless ballrooms in the world and direct access to the LINQ.
Corporate and Other includes certain unallocated corporate overhead costs and other adjustments, including eliminations of transactions among segments, to reconcile to the Company’s consolidated results.
The Company’s Chief Operating Decision Maker (“CODM”) is the Chief Executive Officer. The CODM assesses segment performance by using Adjusted EBITDA, which is defined and reconciled to net income (loss) below.
The CODM uses Adjusted EBITDA during the annual budgeting process and evaluates budget-to-actual variances on a regular basis to make decisions about the allocation of operating and capital resources. Annual incentive awards have historically been based on the achievement of Adjusted EBITDA as a primary metric as the Company believes it most accurately reflects our results and represents a key metric in our industry.
CAESARS ENTERTAINMENT, INC.
NOTES TO CONSOLIDATED CONDENSED FINANCIAL STATEMENTS (CONTINUED)
(UNAUDITED)
| | | | | | | | | | | | | | | | | | | | | | | |
| Three Months Ended June 30, | | Six Months Ended June 30, |
| (In millions) | 2025 | | 2024 | | 2025 | | 2024 |
| Las Vegas: | | | | | | | |
| Net revenues | $ | | | | $ | | | | $ | | | | $ | | |
| Adjusted EBITDA | | | | | | | | | | | |
| Regional: | | | | | | | |
| Net revenues | | | | | | | | | | | |
| Adjusted EBITDA | | | | | | | | | | | |
| Caesars Digital: | | | | | | | |
| Net revenues | | | | | | | | | | | |
| Adjusted EBITDA | | | | | | | | | | | |
| Managed and Branded: | | | | | | | |
| Net revenues | | | | | | | | | | | |
| Adjusted EBITDA | | | | | | | | | | | |
| Corporate and Other: | | | | | | | |
| Net revenues | | | | () | | | | | | () | |
| Adjusted EBITDA | () | | | () | | | () | | | () | |
Disaggregation of Certain Significant Expenses by Segment
| | | | | | | | | | | | | | | | | | | | | | | | | | | | | | | | | | | |
| Three Months Ended June 30, 2025 |
| (In millions) | Las Vegas | | Regional | | Caesars Digital | | Managed and Branded | | Corporate and Other | | Total |
Net revenues | $ | | | | $ | | | | $ | | | | $ | | | | $ | | | | $ | | |
| | | | | | | | | | | |
Gaming taxes | () | | | () | | | () | | | | | | | | | |
| | | |
Labor expense | () | | | () | | | | | | | | | | | | |
| | | | | | | | | | | |
Other segment expenses (a) | () | | | () | | | () | | | () | | | () | | | |
| | | | | | | | | | | |
Adjusted EBITDA | $ | | | | $ | | | | $ | | | | $ | | | | $ | () | | | $ | | |
| | | | | | | | | | | | | | | | | | | | | | | | | | | | | | | | | | | |
| Three Months Ended June 30, 2024 |
| (In millions) | Las Vegas | | Regional | | Caesars Digital | | Managed and Branded | | Corporate and Other | | Total |
Net revenues | $ | | | | $ | | | | $ | | | | $ | | | | $ | () | | | $ | | |
| | | | | | | | | | | |
Gaming taxes | () | | | () | | | () | | | | | | | | | |
| | | |
| Labor expense | () | | | () | | | | | | | | | | | | |
| | | | | | | | | | | |
Other segment expenses (a) | () | | | () | | | () | | | () | | | () | | | |
| | | | | | | | | | | |
Adjusted EBITDA | $ | | | | $ | | | | $ | | | | $ | | | | $ | () | | | $ | | |
CAESARS ENTERTAINMENT, INC.
NOTES TO CONSOLIDATED CONDENSED FINANCIAL STATEMENTS (CONTINUED)
(UNAUDITED)
| | $ | | | | $ | | | | $ | | | | $ | | | | $ | | | | | | | | | | | | | | |
Gaming taxes | () | | | () | | | () | | | | | | | | | |
| | | |
Labor expense | () | | | () | | | | | | | | | | | | |
| | | | | | | | | | | |
Other segment expenses (a) | () | | | () | | | () | | | () | | | () | | | |
| | | | | | | | | | | |
Adjusted EBITDA | $ | | | | $ | | | | $ | | | | $ | | | | $ | () | | | $ | | |
| | | | | | | | | | | | | | | | | | | | | | | | | | | | | | | | | | | |
| Six Months Ended June 30, 2024 |
| (In millions) | Las Vegas | | Regional | | Caesars Digital | | Managed and Branded | | Corporate and Other | | Total |
Net revenues | $ | | | | $ | | | | $ | | | | $ | | | | $ | () | | | $ | | |
| | | | | | | | | | | |
Gaming taxes | () | | | () | | | () | | | | | | | | | |
| | | |
| Labor expense | () | | | () | | | | | | | | | | | | |
| | | | | | | | | | | |
Other segment expenses (a) | () | | | () | | | () | | | () | | | () | | | |
| | | | | | | | | | | |
Adjusted EBITDA | $ | | | | $ | | | | $ | | | | $ | | | | $ | () | | | $ | | |
____________________(a)The ‘Other segment expenses’ category for each of our reportable segments primarily includes:
•Las Vegas and Regional Segments - Cost of sales associated with food, beverage and retail offerings; commission fees, talent fees and ticketing expenses associated with entertainment offerings; utility costs; costs of supplies; repairs and maintenance charges; professional fees; marketing and advertising expenses; software and licensing expenses; rental costs; and insurance expense.
•Caesars Digital - Labor costs directly associated with the operation and maintenance of the digital platforms; professional fees; marketing and advertising expenses; and software and licenses expenses.
•Managed and Branded - Reimbursable expenses which are primarily payroll costs associated with our managed properties.
•Corporate and Other - Unallocated corporate payroll and overhead costs.
Reconciliation of Net Income (Loss) Attributable to Caesars to Adjusted EBITDA by Segment
Adjusted EBITDA is presented as a measure of the Company’s performance. Adjusted EBITDA is defined as revenues less certain operating expenses and is comprised of net income (loss) before (i) interest income and interest expense, net of interest capitalized, (ii) income tax (benefit) provision, (iii) depreciation and amortization, and (iv) certain items that we do not consider indicative of our ongoing operating performance at an operating property level.
In evaluating Adjusted EBITDA you should be aware that, in the future, we may incur expenses that are the same or similar to some of the adjustments in this presentation. The presentation of Adjusted EBITDA should not be construed as an inference that future results will be unaffected by unusual or unexpected items.
Adjusted EBITDA is a financial measure commonly used in our industry and should not be construed as an alternative to net income (loss) as an indicator of operating performance or as an alternative to cash flows provided by operating activities as a measure of liquidity (as determined in accordance with GAAP). Adjusted EBITDA may not be comparable to similarly titled measures reported by other companies within the industry. Adjusted EBITDA is included because management uses Adjusted EBITDA to measure performance and allocate resources, and believes that Adjusted EBITDA provides investors with additional information consistent with that used by management.
CAESARS ENTERTAINMENT, INC.
NOTES TO CONSOLIDATED CONDENSED FINANCIAL STATEMENTS (CONTINUED)
(UNAUDITED)
| | $ | () | | | $ | () | | | $ | () | | | Net income attributable to noncontrolling interests | | | | | | | | | | | |
|
Provision for income taxes | | | | | | | | | | | |
Other (income) loss (a) | () | | | | | | | | | () | |
| Loss on extinguishment of debt | | | | | | | | | | | |
| Interest expense, net | | | | | | | | | | | |
| Depreciation and amortization | | | | | | | | | | | |
Impairment charges (b) | | | | | | | | | | | |
Transaction costs and other, net (c) | | | | | | | | | | | |
| Stock-based compensation expense | | | | | | | | | | | |
| Adjusted EBITDA | $ | | | | $ | | | | $ | | | | $ | | |
| | | | | | | |
| Adjusted EBITDA by Segment: | | | | | | | |
| Las Vegas | $ | | | | $ | | | | $ | | | | $ | | |
| Regional | | | | | | | | | | | |
| Caesars Digital | | | | | | | | | | | |
| Managed and Branded | | | | | | | | | | | |
| Corporate and Other | () | | | () | | | () | | | () | |
____________________
(a)Other (income) loss for the six months ended June 30, 2024 primarily represents a change in the estimate of our disputed claims liability.
(b)Impairment charges for the three and six months ended June 30, 2024 includes impairment within our Regional segment as a result of a decrease in projected cash flows at certain properties primarily due to localized competition.
| | $ | | | | $ | | | | $ | | | | Regional | | | | | | | | | | | |
| Caesars Digital | | | | | | | | | | | |
Corporate and Other | | | | | | | | | | | |
| Total | $ | | | | $ | | | | $ | | | | $ | | |
| | $ | | | | Regional | | | | | |
| Caesars Digital | | | | | |
| Managed and Branded | | | | | |
Corporate and Other (a) | () | | | () | |
| Total | $ | | | | $ | | |
____________________
(a)Includes eliminations of transactions among segments, to reconcile to the Company’s consolidated results.
Item 2. Management’s Discussion and Analysis of Financial Condition and Results of Operations
The following discussion and analysis of the financial condition and operating results of Caesars Entertainment, Inc., a Delaware corporation, and its consolidated subsidiaries, which may be referred to as the “Company,” “CEI,” “Caesars,” “we,” “our,” or “us,” for the three and six months ended June 30, 2025 and 2024 should be read in conjunction with the unaudited consolidated condensed financial statements and the notes thereto and other financial information included elsewhere in this Form 10-Q as well as our Annual Report on Form 10-K for the fiscal year ended December 31, 2024 (the “2024 Annual Report”). Capitalized terms used but not defined in this Form 10-Q have the same meanings as in the 2024 Annual Report.
We refer to (i) our Consolidated Condensed Financial Statements as our “Financial Statements,” (ii) our Consolidated Condensed Balance Sheets as our “Balance Sheets,” (iii) our Consolidated Condensed Statements of Operations and Consolidated Condensed Statements of Comprehensive Income (Loss) as our “Statements of Operations,” and (iv) our Consolidated Condensed Statements of Cash Flows as our “Statements of Cash Flows.” References to numbered “Notes” refer to “Notes to Consolidated Condensed Financial Statements” included in Item 1, “Unaudited Financial Statements,” unless otherwise noted.
The statements in this discussion regarding our expectations of our future performance, liquidity and capital resources, and other non-historical statements are forward-looking statements. These forward-looking statements are subject to numerous risks and uncertainties. Our actual results may differ materially from those contained in or implied by any forward-looking statements. See “Cautionary Statements Regarding Forward-Looking Information” in this report.
Objective
Management’s Discussion and Analysis of Financial Condition and Results of Operations (“MD&A”) is intended to be a narrative explanation of the financial statements and other statistical data that should be read in conjunction with the accompanying financial statements to enhance an investor’s understanding of our financial condition, changes in financial condition and results of operations. Our objectives are: (i) to provide a narrative explanation of our financial statements that will enable investors to see the Company through the eyes of management; (ii) to enhance the overall financial disclosure and provide the context within which financial information should be analyzed; and (iii) to provide information about the quality of, and potential variability of, our earnings and cash flows so that investors can ascertain the likelihood of whether past performance is indicative of future performance.
Overview
We are a geographically diversified gaming and hospitality company that was founded in 1973 by the Carano family with the opening of the Eldorado Hotel Casino in Reno, Nevada. Beginning in 2005, we grew through a series of acquisitions, including the acquisition of MTR Gaming Group, Inc. in 2014, Isle of Capri Casinos, Inc. in 2017, Tropicana Entertainment, Inc. in 2018, Caesars Entertainment Corporation in 2020 and William Hill PLC in 2021. Our ticker symbol on the NASDAQ Stock Market is “CZR.”
We own, lease or manage an aggregate of 53 domestic properties in 18 states with approximately 51,900 slot machines, video lottery terminals and e-tables, approximately 2,800 table games and approximately 45,900 hotel rooms as of June 30, 2025. In addition, we have other properties in North America that are authorized to use the brands and marks of Caesars Entertainment, Inc., as well as other non-gaming properties. Our primary source of revenue is generated by our gaming operations, which includes our casino properties, retail and online sports betting, and online gaming. Additionally, we utilize our hotels, restaurants, bars, entertainment, racing, retail shops and other services to attract customers to our properties.
As of June 30, 2025, we owned 22 of our casinos and leased 24 casinos in the U.S. We lease 18 casinos from VICI Properties L.P., a Delaware limited partnership (“VICI”), pursuant to a regional lease, a Las Vegas lease and a Joliet lease (the “VICI Leases”). In addition, we lease six casinos from GLP Capital, L.P., the operating partnership of Gaming and Leisure Properties, Inc. (“GLPI”) pursuant to a Master Lease (as amended, the “GLPI Master Lease”) and a Lumière lease associated with our Horseshoe St. Louis property (together with the GLPI Master Lease, the “GLPI Leases”).
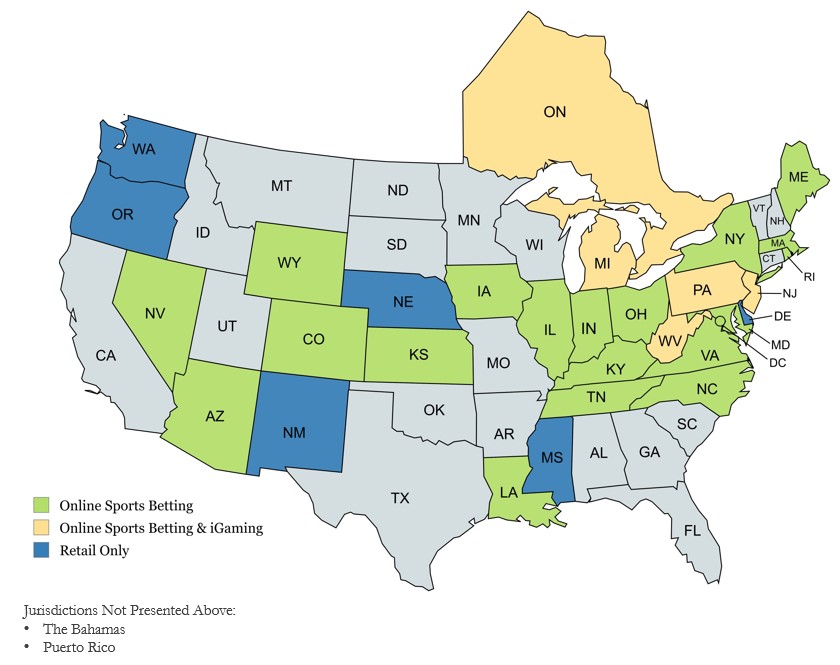
We operate and conduct retail and online sports wagering across 33 jurisdictions in North America, 26 of which offer online sports betting. Additionally, we operate iGaming in five jurisdictions in North America. The map below illustrates Caesars Digital’s presence as of June 30, 2025:
We have a partnership with NYRABets LLC, the official online wagering platform of the New York Racing Association, Inc., and operate the Caesars Racebook app in 22 states as of June 30, 2025. The Caesars Racebook app provides access for pari-mutuel wagering at over 300 racetracks around the world as well as livestreaming of races. Wagers placed can earn credits towards our Caesars Rewards loyalty program or points which can be redeemed for free wagering credits.
We continue to expand our Caesars Digital footprint into other states with the Caesars Sportsbook, Caesars Racebook and iGaming mobile apps as jurisdictions legalize or provide necessary approvals. No customers under 21 years old are allowed to wager on any of the Caesars Sportsbook, Caesars Racebook or iGaming mobile apps.
We periodically divest assets to raise capital or, in previous cases, to comply with conditions, terms, obligations or restrictions imposed by antitrust, gaming and other regulatory entities. The following is a summary of divestitures recently completed as of June 30, 2025:
| | | | | | | | | | | | | | | | | | | | |
| Segment | | Property/Assets | | Date Sold | | Sales Price |
| | |
| Caesars Digital | | World Series of Poker (“WSOP”) Trademark | | October 29, 2024 | | $500 million |
| Las Vegas | | The LINQ Promenade | | December 12, 2024 | | $275 million |
| | |
|
| | |
Investments and Partnerships
We have investments in unconsolidated affiliates accounted for under the equity method which are recorded in Investments in and advances to unconsolidated affiliates on the Balance Sheets.
Pompano Joint Venture
In April 2018, we entered into a joint venture with Cordish Companies (“Cordish”) to plan and develop a mixed-use entertainment and hospitality destination expected to be located on unused land adjacent to our Pompano property. As the managing member, Cordish will operate the business and manage the development, construction, financing, marketing, leasing, maintenance and day-to-day operation of the various phases of the project. Additionally, Cordish is responsible for the development of the master plan for the project with our input and will submit it for our review and approval. While we hold a 50% variable interest in the joint venture, we are not the primary beneficiary; as such, the investment in the joint venture is accounted for using the equity method. We participate evenly with Cordish in the profits and losses of the joint venture, which are included in Transaction and other costs, net on the Statements of Operations.
During the six months ended June 30, 2025, we received distributions totaling $23 million and recorded $1 million of income related to the joint venture. As of June 30, 2025 and December 31, 2024, our investment in the joint venture was $97 million and $119 million, respectively.
Reportable Segments
Segment results in this MD&A are presented consistent with the way our management reviews operating results, assesses performance and makes decisions on a “significant market” basis. Management views each of the Company’s casinos as an operating segment. Operating segments are aggregated based on their similar economic characteristics, types of customers, types of services and products provided, and their management and reporting structure. Our principal operating activities occur in four reportable segments: (1) Las Vegas, (2) Regional, (3) Caesars Digital, and (4) Managed and Branded, in addition to Corporate and Other.
Presentation of Financial Information
The presentation of financial information herein for the periods after our completed divestitures, described above, is not fully comparable to the periods prior to such divestitures.
This MD&A is intended to provide information to assist in better understanding and evaluating our financial condition and results of operations. Our historical operating results may not be indicative of our future results of operations because of the factor described in the preceding paragraph and the changing competitive landscape in each of our markets, including changes in market and societal trends, as well as by factors discussed elsewhere herein. We recommend that you read this MD&A in conjunction with our unaudited Financial Statements and the notes to those statements included in this Quarterly Report on Form 10-Q.
Key Performance Metrics
Our primary source of revenue is generated by our gaming operations, which includes our casino properties, retail and online sports betting, and online gaming. Additionally, we utilize our hotels, restaurants, bars, entertainment venues, retail shops, racing and other services to attract customers to our properties. Our operating results are highly dependent on the volume and quality of customers staying at, or visiting, our properties and using our sports betting, horse racing and iGaming applications.
Key performance metrics include volume indicators such as drop or handle, which refer to amounts wagered by our customers. The amount of volume we retain, which is not fully controllable by us, is recognized as casino revenues and is referred to as our win or hold. Slot win percentage is typically in the range of approximately 9% to 11% of slot handle. Table games hold percentage is typically in the range of approximately 16% to 23% of table games drop. Sports betting hold is typically in the range of 7% to 11% and iGaming hold typically ranges from 3% to 5%. In addition, hotel occupancy, which is the average percentage of available hotel rooms occupied during a period, is a key indicator for our hotel business in the Las Vegas segment. Complimentary and discounted rooms are treated as occupied rooms in our calculation of hotel occupancy. The key metrics we utilize to measure our profitability and performance are Adjusted EBITDA and Adjusted EBITDA margin. See “Results of Operations” section below.
Significant Factors Impacting Financial Results
The following summary highlights the significant factors impacting our financial results for the three and six months ended June 30, 2025 and 2024:
•Economic Factors Impacting Discretionary Spending – Gaming and other leisure activities we offer represent discretionary expenditures that may be sensitive to economic downturns, which impact the behavior among the components of our customer mix differently. We monitor current and recent trends, including inflation, interest rates, global hostilities, trade tension and related actions, such as the imposition of tariffs between the United States and other countries, and the associated effects, if any, on travel, visitation, our customers, and our operations.
•Debt Transactions – We refinanced and extended the maturities of outstanding debt in the amount of $4.4 billion in February 2024. We reduced interest rate margins for both the CEI Term Loan B and CEI Term Loan B-1 in May 2024. Refinancing activities resulted in loss on the early extinguishment of debt on the Statements of Operations of $3 million and $51 million for the three and six months ended June 30, 2024, respectively.
•Impairment Charges – During the three and six months ended June 30, 2025, we did not recognize any impairment charges. During the three and six months ended June 30, 2024, we recognized impairment charges in our Regional segment related to trademarks, gaming rights and goodwill totaling $118 million.
•Subsequent Event – On July 8, 2025, we fully redeemed all of the $546 million outstanding principal amount of the CEI Senior Notes due 2027 and paid the related accrued interest and expenses with borrowings under the CEI Revolving Credit Facility and proceeds received from the partial repayment and sale of $225 million of notes receivable related to the previously disclosed WSOP trademark sale.
Results of Operations
The following table highlights the results of our operations:
| | | | | | | | | | | | | | | | | | | | | | | |
| Three Months Ended June 30, | | Six Months Ended June 30, |
| (Dollars in millions) | 2025 | | 2024 | | 2025 | | 2024 |
| Net revenues: | | | | | | | |
| Las Vegas | $ | 1,054 | | | $ | 1,101 | | | $ | 2,057 | | | $ | 2,129 | |
| Regional | 1,435 | | | 1,385 | | | 2,823 | | | 2,750 | |
| Caesars Digital | 343 | | | 276 | | | 678 | | | 558 | |
| Managed and Branded | 74 | | | 70 | | | 141 | | | 138 | |
Corporate and Other (a) | 1 | | | (2) | | | 2 | | | (3) | |
| Total | $ | 2,907 | | | $ | 2,830 | | | $ | 5,701 | | | $ | 5,572 | |
| | | | | | | |
| Net loss | $ | (65) | | | $ | (102) | | | $ | (163) | | | $ | (244) | |
| | | | | | | |
Adjusted EBITDA (b): | | | | | | | |
Las Vegas | $ | 469 | | | $ | 514 | | | $ | 902 | | | $ | 954 | |
| Regional | 439 | | | 469 | | | 879 | | | 902 | |
| Caesars Digital | 80 | | | 40 | | | 123 | | | 45 | |
| Managed and Branded | 17 | | | 17 | | | 33 | | | 35 | |
Corporate and Other (a) | (50) | | | (40) | | | (98) | | | (83) | |
| Total | $ | 955 | | | $ | 1,000 | | | $ | 1,839 | | | $ | 1,853 | |
| | | | | | | |
| Net loss margin | (2.2) | % | | (3.6) | % | | (2.9) | % | | (4.4) | % |
| Adjusted EBITDA margin | 32.9 | % | | 35.3 | % | | 32.3 | % | | 33.3 | % |
____________________
(a)Corporate and Other includes revenues related to certain licensing arrangements and various revenue sharing agreements and includes eliminations of transactions among segments to reconcile to the Company’s consolidated results. Corporate and Other Adjusted EBITDA includes corporate overhead costs, which consist of certain expenses, such as: payroll, professional fees, cybersecurity and other general and administrative expenses.
(b)See the “Supplemental Unaudited Presentation of Consolidated Adjusted Earnings Before Interest, Taxes, Depreciation and Amortization (“Adjusted EBITDA”) for the three and six months ended June 30, 2025 and 2024” discussion later in this MD&A for a description of Adjusted EBITDA and a reconciliation of net income (loss) attributable to Caesars to Adjusted EBITDA.
Consolidated comparison of the three and six months ended June 30, 2025 and 2024
Net Revenues
Net revenues were as follows:
| | | | | | | | | | | | | | | | | | | | | | | | | | | | | | | | | | | | | | | | | | | | | | | |
| Three Months Ended June 30, | | | | Percent Change | | Six Months Ended June 30, | | | | Percent Change |
| (Dollars in millions) | 2025 | | 2024 | | Variance | | | 2025 | | 2024 | | Variance | |
| | | | | | | |
| Casino | $ | 1,668 | | | $ | 1,557 | | | $ | 111 | | | 7.1 | % | | $ | 3,262 | | | $ | 3,092 | | | $ | 170 | | | 5.5 | % |
| Food and beverage | 428 | | | 435 | | | (7) | | | (1.6) | % | | 863 | | | 857 | | | 6 | | | 0.7 | % |
| Hotel | 509 | | | 514 | | | (5) | | | (1.0) | % | | 991 | | | 1,007 | | | (16) | | | (1.6) | % |
| Other | 302 | | | 324 | | | (22) | | | (6.8) | % | | 585 | | | 616 | | | (31) | | | (5.0) | % |
| Net revenues | $ | 2,907 | | | $ | 2,830 | | | $ | 77 | | | 2.7 | % | | $ | 5,701 | | | $ | 5,572 | | | $ | 129 | | | 2.3 | % |
Consolidated net revenues increased for the three and six months ended June 30, 2025, as compared to the same prior year periods, due to a significant increase in iGaming handle coupled with improved iGaming hold and higher hold in sports betting in our Caesars Digital segment. Net revenues in the Las Vegas segment were down slightly primarily due to lower non-gaming revenue, consistent with visitation trends city-wide, as compared to the three and six months ended June 30, 2024. Net revenues in the Regional segment increased primarily due to increased visitation driven by the opening of expanded amenities at our recently completed development projects of Caesars Virginia and Caesars New Orleans.
Operating Expenses
Operating expenses were as follows:
| | | | | | | | | | | | | | | | | | | | | | | | | | | | | | | | | | | | | | | | | | | | | | | |
| Three Months Ended June 30, | | | | Percent Change | | Six Months Ended June 30, | | | | Percent Change |
| (Dollars in millions) | 2025 | | 2024 | | Variance | | | 2025 | | 2024 | | Variance | |
| Casino | $ | 887 | | | $ | 817 | | | $ | 70 | | | 8.6 | % | | $ | 1,748 | | | $ | 1,669 | | | $ | 79 | | | 4.7 | % |
| Food and beverage | 275 | | | 266 | | | 9 | | | 3.4 | % | | 550 | | | 529 | | | 21 | | | 4.0 | % |
| Hotel | 155 | | | 139 | | | 16 | | | 11.5 | % | | 306 | | | 276 | | | 30 | | | 10.9 | % |
| Other | 105 | | | 100 | | | 5 | | | 5.0 | % | | 200 | | | 194 | | | 6 | | | 3.1 | % |
| General and administrative | 477 | | | 465 | | | 12 | | | 2.6 | % | | 960 | | | 965 | | | (5) | | | (0.5) | % |
| Corporate | 84 | | | 80 | | | 4 | | | 5.0 | % | | 166 | | | 158 | | | 8 | | | 5.1 | % |
| Impairment charges | — | | | 118 | | | (118) | | | (100.0) | % | | — | | | 118 | | | (118) | | | (100.0) | % |
| Depreciation and amortization | 364 | | | 326 | | | 38 | | | 11.7 | % | | 721 | | | 653 | | | 68 | | | 10.4 | % |
| Transaction and other costs, net | 34 | | | 13 | | | 21 | | | 161.5 | % | | 36 | | | 19 | | | 17 | | | 89.5 | % |
| Total operating expenses | $ | 2,381 | | | $ | 2,324 | | | $ | 57 | | | 2.5 | % | | $ | 4,687 | | | $ | 4,581 | | | $ | 106 | | | 2.3 | % |
Casino expenses consist principally of salaries and wages associated with our gaming operations, gaming taxes and marketing and advertising costs attributable to our Caesars Digital segment. Food and beverage expenses consist principally of salaries and wages and costs of goods sold associated with our food and beverage operations. Hotel expenses consist principally of salaries and wages and supplies associated with our hotel operations. Other expenses consist principally of salaries and wages, costs of goods sold associated with our retail operations, entertainment costs, including professional talent fees, reimbursable management costs (described below) and other operations.
Casino expenses increased for the three and six months ended June 30, 2025, as compared to the same prior year periods. Casino expenses rose in connection with increased revenues in our Caesars Digital segment and targeted customer reinvestment in certain competitive markets in our Regional segment. Increased casino expenses were partially offset by decreased marketing expenses in our Las Vegas segment associated with the Super Bowl held in Las Vegas in the first quarter of 2024. Food and beverage and hotel expenses have increased due to incremental wages associated with the opening of Caesars Virginia’s permanent facility and the completed expansion of Caesars New Orleans, as well as higher union and non-union wages. We continue to focus on labor efficiencies across the enterprise to manage increased labor costs.
General and administrative expenses include items such as information technology, facility maintenance, utilities, property and liability insurance, expenses for administrative departments such as accounting, compliance, purchasing, human resources, legal, internal audit, property taxes and marketing expenses indirectly related to our gaming and non-gaming operations.
Corporate expenses include unallocated expenses such as payroll, inclusive of the annual bonus, stock-based compensation, professional fees, cybersecurity and other various expenses not directly related to the Company’s operations.
Impairment charges were recorded within our Regional segment in June 2024 as a result of a decrease in projected future cash flows at certain properties primarily due to localized competition.
Depreciation and amortization expenses increased for the three and six months ended June 30, 2025 as compared to the same prior year periods, primarily related to recently completed construction projects.
Transaction and other costs, net primarily includes non-cash losses on the write down and disposal of assets, certain non-recurring litigation reserves, professional services for transaction and integration costs, various contract exit or termination costs, pre-opening costs in connection with our new property openings and non-cash changes in equity method investments. Transaction and other costs, net increased for the three and six months ended June 30, 2025 as compared to the same prior year periods, primarily due to litigation reserves.
Other income (expenses)
Other income (expenses) were as follows:
| | | | | | | | | | | | | | | | | | | | | | | | | | | | | | | | | | | | | | | | | | | | | | | |
| Three Months Ended June 30, | | | | Percent Change | | Six Months Ended June 30, | | | | Percent Change |
| (Dollars in millions) | 2025 | | 2024 | | Variance | | | 2025 | | 2024 | | Variance | |
| Interest expense, net | $ | (579) | | | $ | (594) | | | $ | 15 | | | 2.5 | % | | $ | (1,153) | | | $ | (1,184) | | | $ | 31 | | | 2.6 | % |
| Loss on extinguishment of debt | — | | | (3) | | | 3 | | | 100.0 | % | | — | | | (51) | | | 51 | | | 100.0 | % |
| Other income (loss) | 1 | | | (1) | | | 2 | | | * | | — | | | 25 | | | (25) | | | (100.0) | % |
| Provision for income taxes | (13) | | | (10) | | | (3) | | | (30.0) | % | | (24) | | | (25) | | | 1 | | | 4.0 | % |
____________________
* Not meaningful.
Interest expense, net decreased for the three and six months ended June 30, 2025, as compared to the same prior year periods, primarily due a reduction in outstanding debt.
For the six months ended June 30, 2024, loss on extinguishment of debt was primarily related to the prepayments of the CEI Senior Secured Notes due 2025, the Caesars Resort Collection (“CRC”) Senior Secured Notes, and the partial prepayment of the CEI Term Loan B.
Other income (loss) for the six months ended June 30, 2024 primarily represents a change in the estimate of our disputed claims liability.
The income tax provision for the three and six months ended June 30, 2025 and 2024 differed from the expected income tax provision based on the federal tax rate of 21% primarily due to an increase in federal and state valuation allowances against the deferred tax assets for excess business interest expense. As a result of the enactment of a new tax policy on July 4, 2025, the Company expects a favorable impact to tax expense during the remainder of 2025, primarily related to changes in the business interest expense limitation. However, as our assessment is ongoing, the Company is not able to quantify the impact on the Financial Statements at this time.
Segment comparison of the three and six months ended June 30, 2025 and 2024
Las Vegas Segment
| | | | | | | | | | | | | | | | | | | | | | | | | | | | | | | | | | | | | | | | | | | | | | | |
| Three Months Ended June 30, | | | | Percent Change | | Six Months Ended June 30, | | | | Percent Change |
| (Dollars in millions) | 2025 | | 2024 | | Variance | | | 2025 | | 2024 | | Variance | |
| Net revenues: | | | | | | | | | | | | | | | |
| Casino | $ | 292 | | | $ | 296 | | | $ | (4) | | | (1.4) | % | | $ | 535 | | | $ | 535 | | | $ | — | | | — | % |
| Food and beverage | 278 | | | 296 | | | (18) | | | (6.1) | % | | 564 | | | 583 | | | (19) | | | (3.3) | % |
| Hotel | 346 | | | 357 | | | (11) | | | (3.1) | % | | 689 | | | 719 | | | (30) | | | (4.2) | % |
| Other | 138 | | | 152 | | | (14) | | | (9.2) | % | | 269 | | | 292 | | | (23) | | | (7.9) | % |
| Net revenues | $ | 1,054 | | | $ | 1,101 | | | $ | (47) | | | (4.3) | % | | $ | 2,057 | | | $ | 2,129 | | | $ | (72) | | | (3.4) | % |
| | | | | | | | | | | | | | | |
| Table games drop | $ | 740 | | | $ | 779 | | | $ | (39) | | | (5.0) | % | | $ | 1,484 | | | $ | 1,621 | | | $ | (137) | | | (8.5) | % |
Table games hold % | 21.1 | % | | 21.9 | % | | | | (0.8) pts | | 20.1 | % | | 20.0 | % | | | | 0.1 pts |
| Slot handle | $ | 2,538 | | | $ | 2,583 | | | $ | (45) | | | (1.7) | % | | $ | 5,110 | | | $ | 5,132 | | | $ | (22) | | | (0.4) | % |
| | | | | | | | | | | | | | | |
| Hotel occupancy | 96.8 | % | | 98.7 | % | | | | (1.9) pts | | 96.5 | % | | 98.2 | % | | | | (1.7) pts |
| | | | | | | | | | | | | | | |
| Adjusted EBITDA | $ | 469 | | | $ | 514 | | | $ | (45) | | | (8.8) | % | | $ | 902 | | | $ | 954 | | | $ | (52) | | | (5.5) | % |
| Adjusted EBITDA margin | 44.5 | % | | 46.7 | % | | | | (2.2) pts | | 43.9 | % | | 44.8 | % | | | | (0.9) pts |
| | | | | | | | | | | | | | | |
| Net income attributable to Caesars | $ | 212 | | | $ | 272 | | | $ | (60) | | | (22.1) | % | | $ | 389 | | | $ | 470 | | | $ | (81) | | | (17.2) | % |
Our Las Vegas segment’s net revenues, net income, Adjusted EBITDA and Adjusted EBITDA margin decreased for the three and six months ended June 30, 2025, as compared to the same prior year periods, primarily due to a decline in non-gaming revenues, consistent with visitation trends city-wide, as compared to the three and six months ended June 30, 2024. In addition, other revenue declined as compared to the same prior year periods primarily due to the sale of the LINQ Promenade during the fourth quarter of 2024.
Slot win percentage in the Las Vegas segment for the three and six months ended June 30, 2025 was within our typical range.
Regional Segment
| | | | | | | | | | | | | | | | | | | | | | | | | | | | | | | | | | | | | | | | | | | | | | | |
| Three Months Ended June 30, | | | | Percent Change | | Six Months Ended June 30, | | | | Percent Change |
| (Dollars in millions) | 2025 | | 2024 | | Variance | | | 2025 | | 2024 | | Variance | |
| Net revenues: | | | | | | | | | | | | | | | |
| Casino | $ | 1,045 | | | $ | 1,017 | | | $ | 28 | | | 2.8 | % | | $ | 2,075 | | | $ | 2,048 | | | $ | 27 | | | 1.3 | % |
| Food and beverage | 150 | | | 139 | | | 11 | | | 7.9 | % | | 299 | | | 274 | | | 25 | | | 9.1 | % |
| Hotel | 163 | | | 157 | | | 6 | | | 3.8 | % | | 302 | | | 288 | | | 14 | | | 4.9 | % |
| Other | 77 | | | 72 | | | 5 | | | 6.9 | % | | 147 | | | 140 | | | 7 | | | 5.0 | % |
| Net revenues | $ | 1,435 | | | $ | 1,385 | | | $ | 50 | | | 3.6 | % | | $ | 2,823 | | | $ | 2,750 | | | $ | 73 | | | 2.7 | % |
| | | | | | | | | | | | | | | |
Table games drop | $ | 1,063 | | | $ | 965 | | | $ | 98 | | | 10.2 | % | | $ | 2,156 | | | $ | 1,980 | | | $ | 176 | | | 8.9 | % |
Table games hold % | 20.8 | % | | 21.1 | % | | | | (0.3) pts | | 20.8 | % | | 21.2 | % | | | | (0.4) pts |
| Slot handle | $ | 10,917 | | | $ | 10,186 | | | $ | 731 | | | 7.2 | % | | $ | 21,361 | | | $ | 20,402 | | | $ | 959 | | | 4.7 | % |
| | | | | | | | | | | | | | | |
| Adjusted EBITDA | $ | 439 | | | $ | 469 | | | $ | (30) | | | (6.4) | % | | $ | 879 | | | $ | 902 | | | $ | (23) | | | (2.5) | % |
| Adjusted EBITDA margin | 30.6 | % | | 33.9 | % | | | | (3.3) pts | | 31.1 | % | | 32.8 | % | | | | (1.7) pts |
| | | | | | | | | | | | | | | |
| Net income (loss) attributable to Caesars | $ | (11) | | | $ | (51) | | | $ | 40 | | | 78.4 | % | | $ | 9 | | | $ | (10) | | | $ | 19 | | | * |
____________________
* Not meaningful.
Our Regional segment’s net revenues improved for the three and six months ended June 30, 2025, as compared to the same prior year periods, primarily due to the positive results driven by our recently completed Caesars Virginia and Caesars New Orleans development projects. These increases were partially offset by the continued impact of competition and inclement weather in several of our regional markets, as well as construction disruption in Lake Tahoe. Adjusted EBITDA and Adjusted EBITDA margin declined for the three and six months ended June 30, 2025, compared to the same prior year periods, primarily due to increased labor costs and additional targeted customer reinvestment in certain competitive markets. Net income (loss) increased primarily due to impairment charges in our Regional segment recognized in the second quarter of 2024, with no comparable charges in the current year.
Slot win percentage in the Regional segment for the three and six months ended June 30, 2025 was within our typical range.
Caesars Digital Segment
| | | | | | | | | | | | | | | | | | | | | | | | | | | | | | | | | | | | | | | | | | | | | | | |
| Three Months Ended June 30, | | | | Percent Change | | Six Months Ended June 30, | | | | Percent Change |
| (Dollars in millions) | 2025 | | 2024 | | Variance | | | 2025 | | 2024 | | Variance | |
| Net revenues: | | | | | | | | | | | | | | | |
Casino (a) | $ | 331 | | | $ | 246 | | | $ | 85 | | | 34.6 | % | | $ | 655 | | | $ | 512 | | | $ | 143 | | | 27.9 | % |
| | | | | | | |
| | | | | | | |
| Other | 12 | | | 30 | | | (18) | | | (60.0) | % | | 23 | | | 46 | | | (23) | | | (50.0) | % |
| Net revenues | $ | 343 | | | $ | 276 | | | $ | 67 | | | 24.3 | % | | $ | 678 | | | $ | 558 | | | $ | 120 | | | 21.5 | % |
| | | | | | | | | | | | | | | |
Sports betting handle (b) | $ | 2,493 | | | $ | 2,500 | | | $ | (7) | | | (0.3) | % | | $ | 5,621 | | | $ | 5,879 | | | $ | (258) | | | (4.4) | % |
| Sports betting hold % | 8.9 | % | | 7.2 | % | | | | 1.7 pts | | 8.0 | % | | 6.9 | % | | | | 1.1 pts |
| | | | | | | | | | | | | | | |
| iGaming handle | $ | 4,705 | | | $ | 3,537 | | | $ | 1,168 | | | 33.0 | % | | $ | 9,193 | | | $ | 7,035 | | | $ | 2,158 | | | 30.7 | % |
| iGaming hold % | 3.6 | % | | 3.3 | % | | | | 0.3 pts | | 3.6 | % | | 3.3 | % | | | | 0.3 pts |
| | | | | | | | | | | | | | | |
| Adjusted EBITDA | $ | 80 | | | $ | 40 | | | $ | 40 | | | 100.0 | % | | $ | 123 | | | $ | 45 | | | $ | 78 | | | 173.3 | % |
| Adjusted EBITDA margin | 23.3 | % | | 14.5 | % | | | | 8.8 pts | | 18.1 | % | | 8.1 | % | | | | 10 pts |
| | | | | | | | | | | | | | | |
| Net income (loss) attributable to Caesars | $ | 39 | | | $ | 4 | | | $ | 35 | | | * | | $ | 39 | | | $ | (30) | | | $ | 69 | | | * |
____________________
* Not meaningful.
(a)Includes total promotional and complimentary incentives related to sports betting, iGaming, and online poker of $72 million and $62 million for the three months ended June 30, 2025 and 2024, respectively, and $145 million and $148 million for the six months ended June 30, 2025 and 2024, respectively. Promotional and complimentary incentives for online poker were $5 million and $3 million for the three months ended June 30, 2025 and 2024, respectively, and $8 million and $6 million for the six months ended June 30, 2025 and 2024, respectively.
(b)Caesars Digital generated an additional $199 million of sports betting handle for both the three months ended June 30, 2025 and 2024 and $468 million and $478 million for the six months ended June 30, 2025 and 2024, respectively, which is not included in this table, for select wholly-owned and third-party operations for which Caesars Digital provides services and we receive all, or a share of, the net profits. Hold related to these operations was 11.2% and 9.4%, for the three months ended June 30, 2025 and 2024, respectively, and 11.1% and 9.6% for the six months ended June 30, 2025 and 2024, respectively. Sports betting handle includes $12 million and $11 million for the three months ended June 30, 2025 and 2024, respectively, and $22 million for both the six months ended June 30, 2025 and 2024 related to horse racing and pari-mutuel wagers.
Caesars Digital’s net revenues, net income (loss), Adjusted EBITDA, and Adjusted EBITDA margin improved significantly for the three and six months ended June 30, 2025, as compared to the same prior year periods, primarily due to higher iGaming handle and iGaming hold coupled with improved sports betting hold. The improved sports betting hold reflects the benefit of continued investment in our sports betting platform. Increases in both iGaming handle and iGaming hold are primarily attributed to the launch of Caesars Palace Online Casino in August 2023 and Horseshoe Online Casino app in October 2024.
As sports betting and online casinos expand through increased state or jurisdictional legalization, new product launches, and customer adoption, variations in hold percentages and increases in promotional and marketing expenses in highly competitive markets may negatively impact Caesars Digital’s net revenues, net income, Adjusted EBITDA and Adjusted EBITDA margin in comparison to current or prior periods.
Managed and Branded Segment
| | | | | | | | | | | | | | | | | | | | | | | | | | | | | | | | | | | | | | | | | | | | | | | |
| Three Months Ended June 30, | | | | Percent Change | | Six Months Ended June 30, | | | | Percent Change |
| (Dollars in millions) | 2025 | | 2024 | | Variance | | | 2025 | | 2024 | | Variance | |
| Net revenues: | | | | | | | | | | | | | | | |
| | | | | | | |
| Other | $ | 74 | | | $ | 70 | | | $ | 4 | | | 5.7 | % | | $ | 141 | | | $ | 138 | | | $ | 3 | | | 2.2 | % |
| Net revenues | $ | 74 | | | $ | 70 | | | $ | 4 | | | 5.7 | % | | $ | 141 | | | $ | 138 | | | $ | 3 | | | 2.2 | % |
| | | | | | | | | | | | | | | |
| Adjusted EBITDA | $ | 17 | | | $ | 17 | | | $ | — | | | — | % | | $ | 33 | | | $ | 35 | | | $ | (2) | | | (5.7) | % |
| Adjusted EBITDA margin | 23.0 | % | | 24.3 | % | | | | (1.3) pts | | 23.4 | % | | 25.4 | % | | | | (2) pts |
| | | | | | | | | | | | | | | |
| Net income attributable to Caesars | $ | 18 | | | $ | 17 | | | $ | 1 | | | 5.9 | % | | $ | 34 | | | $ | 35 | | | $ | (1) | | | (2.9) | % |
We manage several properties and license rights to the use of certain of our brands. These revenue agreements typically include reimbursement of certain costs that we incur directly. Such costs are primarily related to payroll costs incurred on behalf of the properties under management. The revenue related to these reimbursable management costs has a direct impact on our evaluation of Adjusted EBITDA margin which, when excluded, reflects margins typically realized from such agreements. The table below presents the amount included in net revenues and total operating expenses related to these reimbursable costs.
| | | | | | | | | | | | | | | | | | | | | | | | | | | | | | | | | | | | | | | | | | | | | | | |
| Three Months Ended June 30, | | | | Percent Change | | Six Months Ended June 30, | | | | Percent Change |
| (Dollars in millions) | 2025 | | 2024 | | Variance | | | 2025 | | 2024 | | Variance | |
| Reimbursable management revenue | $ | 55 | | | $ | 53 | | | $ | 2 | | | 3.8 | % | | $ | 106 | | | $ | 103 | | | $ | 3 | | | 2.9 | % |
Reimbursable management costs | 55 | | | 53 | | | 2 | | | 3.8 | % | | 106 | | | 103 | | | 3 | | | 2.9 | % |
Corporate & Other
| | | | | | | | | | | | | | | | | | | | | | | | | | | | | | | | | | | | | | | | | | | | | | | |
| Three Months Ended June 30, | | | | Percent Change | | Six Months Ended June 30, | | | | Percent Change |
| (Dollars in millions) | 2025 | | 2024 | | Variance | | | 2025 | | 2024 | | Variance | |
| Net revenues: | | | | | | | | | | | | | | | |
| Casino | $ | — | | | $ | (2) | | | $ | 2 | | | 100.0 | % | | $ | (3) | | | $ | (3) | | | $ | — | | | — | % |
| | | | | | | |
| | | | | | | |
| Other | 1 | | | — | | | 1 | | | * | | 5 | | | — | | | 5 | | | * |
| Net revenues | $ | 1 | | | $ | (2) | | | $ | 3 | | | * | | $ | 2 | | | $ | (3) | | | $ | 5 | | | * |
| | | | | | | | | | | | | | | |
| Adjusted EBITDA | $ | (50) | | | $ | (40) | | | $ | (10) | | | (25.0) | % | | $ | (98) | | | $ | (83) | | | $ | (15) | | | (18.1) | % |
| | | | | | | |
____________________* Not meaningful.
Supplemental Unaudited Presentation of Consolidated Adjusted Earnings Before Interest, Taxes, Depreciation and Amortization (“Adjusted EBITDA”) for the Three and Six Months Ended June 30, 2025 and 2024
Adjusted EBITDA (described below), a non-GAAP financial measure, has been presented as a supplemental disclosure because it is a widely used measure of performance and basis for valuation of companies in our industry and we believe that this non-GAAP supplemental information will be helpful in understanding our ongoing operating results. Management has historically used Adjusted EBITDA when evaluating operating performance because we believe that the inclusion or exclusion of certain recurring and non-recurring items is necessary to provide a full understanding of our core operating results and as a means to evaluate period-to-period results. Adjusted EBITDA represents net income (loss) before interest income and interest expense net of interest capitalized, (benefit) provision for income taxes, depreciation and amortization, stock-based compensation expense, (gain) loss on extinguishment of debt, impairment charges, other (income) loss, net income (loss) attributable to noncontrolling interests, transaction costs associated with our acquisitions, developments, and divestitures, and non-cash changes in equity method investments. Adjusted EBITDA also excludes the expense associated with certain of our leases as these transactions were accounted for as financing obligations and the associated expense is included in interest expense. Adjusted EBITDA is not a measure of performance or liquidity calculated in accordance with accounting principles generally accepted in the United States (“GAAP”). Adjusted EBITDA is unaudited and should not be considered an alternative to, or more meaningful than, net income (loss) as an indicator of our operating performance. Uses of cash flows that are not reflected
in Adjusted EBITDA include capital expenditures, interest payments, income taxes, debt principal repayments, distributions to our noncontrolling interest owners and payments under our leases with affiliates of VICI and GLPI, which can be significant. As a result, Adjusted EBITDA should not be considered as a measure of our liquidity. Other companies that provide Adjusted EBITDA information may calculate Adjusted EBITDA differently than we do. The definition of Adjusted EBITDA may not be the same as the definitions used in any of our debt agreements.
The following table summarizes our Adjusted EBITDA for the three and six months ended June 30, 2025 and 2024, respectively, in addition to reconciling net income (loss) attributable to Caesars to Adjusted EBITDA in accordance with GAAP (unaudited):
| | | | | | | | | | | | | | | | | | | | | | | |
| Three Months Ended June 30, | | Six Months Ended June 30, |
| (In millions) | 2025 | | 2024 | | 2025 | | 2024 |
| Net loss attributable to Caesars | $ | (82) | | | $ | (122) | | | $ | (197) | | | $ | (280) | |
| Net income attributable to noncontrolling interests | 17 | | | 20 | | | 34 | | | 36 | |
|
| Provision for income taxes | 13 | | | 10 | | | 24 | | | 25 | |
Other (income) loss (a) | (1) | | | 1 | | | — | | | (25) | |
| Loss on extinguishment of debt | — | | | 3 | | | — | | | 51 | |
| Interest expense, net | 579 | | | 594 | | | 1,153 | | | 1,184 | |
Impairment charges (b) | — | | | 118 | | | — | | | 118 | |
| Depreciation and amortization | 364 | | | 326 | | | 721 | | | 653 | |
Transaction costs and other, net (c) | 41 | | | 26 | | | 54 | | | 42 | |
| Stock-based compensation expense | 24 | | | 24 | | | 50 | | | 49 | |
| Adjusted EBITDA | 955 | | | 1,000 | | | 1,839 | | | 1,853 | |
Pre-disposition Adjusted EBITDA (d) | — | | | (4) | | | — | | | (8) | |
Total Adjusted EBITDA | $ | 955 | | | $ | 996 | | | $ | 1,839 | | | $ | 1,845 | |
____________________
(a)Other (income) loss for the six months ended June 30, 2024 primarily represents a change in the estimate of our disputed claims liability.
(b)Impairment charges for the three and six months ended June 30, 2024 includes impairment within our Regional segment as a result of a decrease in projected cash flows at certain properties primarily due to localized competition.
(c)Transaction costs and other, net primarily includes costs related to non-cash losses on the write down and disposal of assets, certain non-recurring litigation reserves, professional services for transaction and integration costs, various contract exit or termination costs, pre-opening costs in connection with our new property openings, and non-cash changes in equity method investments.
(d)Adjustment for pre-disposition results of operations reflecting the subtraction of results of operations for the LINQ Promenade prior to divestiture, for the relevant periods. Such figures are based on unaudited internal financial statements and have not been reviewed by the Company’s auditors for the periods presented. The additional financial information is included to enable the comparison of current results with results of prior periods.
Liquidity and Capital Resources
We are a holding company, and our only significant assets are ownership interests in our subsidiaries. Our ability to fund our obligations depends on existing cash on hand, cash flows from our subsidiaries and our ability to raise capital. Our primary sources of liquidity and capital resources are existing cash on hand, cash flows from operations, availability of borrowings under our CEI Revolving Credit Facility and proceeds from the issuance of debt and equity securities. We may, from time to time, seek to repurchase our common stock or prepay our outstanding indebtedness. Any such purchases or prepayments may be funded by existing cash balances or the incurrence of debt. The amount and timing of any repurchase of debt or common stock will be based on business and market conditions, capital availability, compliance with debt covenants and other considerations. Our cash requirements may fluctuate significantly depending on our decisions with respect to business acquisitions or divestitures and strategic capital and marketing investments.
As of June 30, 2025, our cash on hand and borrowing capacity was as follows:
| | | | | |
| (In millions) | June 30, 2025 |
| Cash and cash equivalents | $ | 982 | |
Revolver capacity (a) | 2,235 | |
| Revolver capacity committed to letters of credit | (90) | |
| Revolver capacity committed as regulatory requirement | (46) | |
Total (b) | $ | 3,081 | |
____________________
(a)Revolver capacity includes $2.25 billion under the CEI Revolving Credit Facility, maturing in January 2028, and $25 million under the CVA Revolving Credit Facility, maturing on April 26, 2029, less $40 million reserved for specific purposes.
(b)Excludes approximately $75 million of additional borrowing available under the CVA Delayed Draw Term Loan.
During the six months ended June 30, 2025, our operating activities generated operating cash inflows of $680 million, as compared to operating cash inflows of $534 million during the six months ended June 30, 2024, primarily due to changes in working capital, coupled with the results of operations described above.
On October 2, 2024, we announced that our Board of Directors (“Board”) authorized a $500 million common stock repurchase program (the “2024 Share Repurchase Program”). Under the 2024 Share Repurchase Program, we may, from time to time, repurchase shares of common stock on the open market (either with or without a 10b5-1 plan) or through privately negotiated transactions. In April 2025, we acquired 4,188,466 shares of our common stock at an aggregate value of $100 million, excluding commissions or applicable excise tax. As of June 30, 2025, we are authorized to repurchase up to $350 million of common stock under the 2024 Share Repurchase Program. See “Share Repurchase Program” below for details.
On July 8, 2025, we fully redeemed all of the $546 million outstanding principal amount of the CEI Senior Notes due 2027 and paid the related accrued interest and expenses with borrowings under the CEI Revolving Credit Facility and proceeds received from the partial repayment and sale of $225 million of notes receivable related to the previously disclosed WSOP trademark sale. As a result of the early repayment, we recognized approximately $4 million of loss on extinguishment of debt.
We expect that our primary capital requirements going forward will relate to servicing our outstanding indebtedness, rent payments under our GLPI Leases and VICI Leases, and the expansion and maintenance of our properties. Beginning in 2025 we have had, and expect to continue having, additional cash uses for operating activities as a result of federal and certain state income taxes.
A significant portion of our liquidity needs are for debt service and payments associated with our leases. Our estimated debt service (including principal and interest) is approximately $454 million for the remainder of 2025. We also lease certain real property assets from third parties, including VICI and GLPI. The VICI Leases are subject to annual escalations, that take effect in November of each year, based on the Consumer Price Index (“CPI”). In addition to the CPI escalator, our VICI Leases are also subject to a variable rent adjustment based on certain historical net revenues of our leased properties which began in November 2024. The next such lease year with a variable rent adjustment begins November 2027. We estimate our lease payments to VICI and GLPI to be approximately $673 million for the remainder of 2025.
We make capital expenditures and perform continuing refurbishment and maintenance at our properties to maintain our quality standards. Our capital expenditure requirements for the remainder of 2025 include the completion of expansion and rebranding projects and hotel renovations. In addition, we anticipate continued investment in our Caesars Sportsbook and iGaming applications.
Cash used for capital expenditures totaled $453 million and $593 million for the six months ended June 30, 2025 and 2024, respectively, related to our growth, renovation, maintenance, and other capital projects. The following table summarizes our capital expenditures for the six months ended June 30, 2025, and an estimated range of capital expenditures for the remainder of 2025.
| | | | | | | | | | | | | | | | | |
| Six Months Ended June 30, 2025 | | Estimate of Remaining Capital Expenditures for 2025 |
| (In millions) | Actual | | Low | | High |
| Growth and renovation projects | $ | 131 | | | $ | 50 | | | $ | 90 | |
| Caesars Digital | 43 | | | 35 | | | 45 | |
| Maintenance projects | 174 | | | 175 | | | 205 | |
| Total estimated capital expenditures from unrestricted cash | 348 | | | 260 | | | 340 | |
| | | | | |
Caesars Virginia (a) | 105 | | | 10 | | | 30 | |
| | | | | |
| Total | $ | 453 | | | $ | 270 | | | $ | 370 | |
___________________
(a)Capital expenditures associated with Caesars Virginia are expected to be funded from cash on-hand generated from the operations of Caesars Virginia, or through the Caesars Virginia, LLC Credit Agreement. The Caesars Virginia delayed draw term loan has $75 million of undrawn capacity and the Caesars Virginia revolving credit facility has $25 million of undrawn capacity.
We have agreements with certain professional sports leagues and teams, sporting event facilities and media companies for tickets, suites, advertising, marketing, promotional and sponsorship opportunities including communication with partner customer databases. Some of the agreements provide us with exclusivity to access the aforementioned rights within the casino and/or sports betting category. As of June 30, 2025 and December 31, 2024, obligations related to these agreements were $372 million and $421 million, respectively, with contracts extending through 2040. These obligations are composed of various third-party agreements which have been entered into by us for certain of our Las Vegas and Regional properties, or our Caesars Digital segment. The agreements include leasing of event suites that are generally considered short-term leases for which we do not record a right of use asset or lease liability. We recognize expenses in the period services are received in accordance with the various agreements. In addition, assets or liabilities may be recorded related to the timing of payments as required by the respective agreement.
We have periodically divested assets to raise capital or, in previous cases, to comply with conditions, terms, obligations or restrictions imposed by antitrust, gaming and other regulatory entities. If an agreed upon selling price for future divestitures does not exceed the carrying value of the assets, we may be required to record additional impairment charges in future periods which may be material.
We expect that our current liquidity, including availability of borrowings under our committed credit facility and cash flows from operations will be sufficient to fund our operations, capital requirements and service our outstanding indebtedness for the next twelve months and beyond.
Debt and Master Lease Covenant Compliance
The CEI Revolving Credit Facility, the CEI Term Loan A, the CEI Term Loan B, the CEI Term Loan B-1 and the indentures governing the CEI Senior Secured Notes due 2030, the CEI Senior Secured Notes due 2032, the CEI Senior Notes due 2027, the CEI Senior Notes due 2029 and the CEI Senior Notes due 2032 contain covenants which are standard and customary for these types of agreements. These include negative covenants, which, subject to certain exceptions and baskets, limit our ability to (among other items) incur additional indebtedness, make investments, make restricted payments, including dividends, grant liens, sell assets and make acquisitions.
The CEI Revolving Credit Facility and the CEI Term Loan A include a maximum net total leverage ratio financial covenant of 6.50:1. In addition, the CEI Revolving Credit Facility and the CEI Term Loan A include a minimum fixed charge coverage ratio financial covenant of 2.0:1. From and after the repayment of the CEI Term Loan A, the financial covenants applicable to the CEI Revolving Credit Facility will be tested solely to the extent that certain testing conditions are satisfied. Failure to comply with such covenants could result in an acceleration of the maturity of indebtedness outstanding under the relevant debt agreement.
The GLPI Leases and VICI Leases contain certain covenants requiring minimum capital expenditures based on a percentage of net revenues along with maintaining certain financial ratios. The GLPI Leases require the Company to maintain a minimum adjusted revenue to rent ratio of 1.20:1, applicable to the operations of the underlying leased properties.
The CVA Revolving Credit Facility and the CVA Delayed Draw Term Loan contain covenants, applicable to the operations of Caesars Virginia, which are standard and customary for this type of agreement, including a maximum net total leverage ratio financial covenant of 4:1 and a minimum fixed charge coverage ratio financial covenant of 1.05:1. Caesars Virginia LLC’s compliance requirements began on June 30, 2025.
As of June 30, 2025, we were in compliance with all of the applicable financial covenants described above.
Share Repurchase Program
On October 2, 2024, we announced that our Board authorized a $500 million common stock repurchase program. Under the 2024 Share Repurchase Program, we may, from time to time, repurchase shares of common stock on the open market (either with or without a 10b5-1 plan) or through privately negotiated transactions. In April 2025, we acquired 4,188,466 shares of our common stock at an aggregate value of $100 million, excluding commissions or applicable excise tax. As of June 30, 2025, we are authorized to repurchase up to $350 million of common stock under the 2024 Share Repurchase Program. The 2024 Share Repurchase Program has no time limit and may be suspended or discontinued at any time without notice. There is no minimum number of shares of common stock that we are required to repurchase under the 2024 Share Repurchase Program.
Contractual Obligations
There have been no other material changes during the six months ended June 30, 2025 to our contractual obligations as disclosed in Part II, Item 7 of the 2024 Annual Report. See Note 5 to our unaudited Financial Statements, which is included elsewhere in this report, for additional information regarding contractual obligations. Other Liquidity Matters
We are faced with certain contingencies, from time to time, involving litigation, claims, assessments, environmental remediation or compliance. These commitments and contingencies are discussed in greater detail, when applicable, in “Part II, Item 1. Legal Proceedings” and Note 5 to our unaudited Financial Statements, both of which are included elsewhere in this report. See also “Part I, Item 1A. Risk Factors—Risks Related to Our Business” which is included elsewhere in the 2024 Annual Report. Critical Accounting Policies and Estimates
Our critical accounting policies and estimates are included in the 2024 Annual Report. There have been no material changes since December 31, 2024. We have not substantively changed the application of our policies, and there have been no material changes in assumptions or estimation techniques used as compared to those described in the 2024 Annual Report.
Off-Balance Sheet Arrangements
We do not currently have any off-balance sheet arrangements.
Item 3. Quantitative and Qualitative Disclosures About Market Risk
Market risk is the risk of loss arising from adverse changes in market rates and prices, such as interest rates, foreign currency exchange rates and commodity prices. We are exposed to changes in interest rates primarily from variable rate long-term debt arrangements. We manage our interest rate risk by monitoring interest rates, including future projected rates, and adjusting our mix of fixed and variable rate borrowings.
As of June 30, 2025, long-term variable-rate borrowings totaled $5.9 billion under the CEI Term Loans and the CVA Delayed Draw Term Loan and no amounts were outstanding under the CEI Revolving Credit Facility or the CVA Revolving Credit Facility. As of June 30, 2025, long-term variable-rate borrowings under the CEI Term Loans and the CVA Delayed Draw Term Loan represented approximately 48% of consolidated long-term debt and the weighted average interest rates on our variable and fixed rate debt were 6.57% and 6.34%, respectively.
All of the variable rate debt instruments are subject to Term SOFR interest rates plus a margin.
We evaluate our exposure to market risk by monitoring interest rates in the marketplace and have, on occasion, utilized derivative financial instruments to help manage this risk. We do not utilize derivative financial instruments for trading purposes.
There have been no other material quantitative changes in our market risk exposure, or how such risks are managed from the information previously reported under Part II, Item 7A of the 2024 Annual Report.
Item 4. Controls and Procedures
(a)Evaluation of Disclosure Controls and Procedures
We have established and maintain disclosure controls and procedures that are designed to ensure that information required to be disclosed in our reports that we file under the Securities Exchange Act of 1934, as amended (the “Exchange Act”), is recorded, processed, summarized, evaluated and reported within the time periods specified in the rules and forms of the SEC, and that such information is accumulated and communicated to our management, including our principal executive officer and principal financial officer, as appropriate, to allow timely decisions regarding required disclosure.
We carried out an evaluation, under the supervision and with the participation of our Chief Executive Officer (principal executive officer) and Chief Financial Officer (principal financial officer), of the effectiveness of our disclosure controls and procedures (as defined in Exchange Act Rules 13a-15(e) and 15d-15(e)) as of the end of the period covered by this Quarterly Report on Form 10-Q. Based on this evaluation, our Chief Executive Officer and Chief Financial Officer have concluded that our disclosure controls and procedures as of the end of the period covered by this Quarterly Report on Form 10-Q are effective to ensure that the information required to be disclosed by us in the reports that we file under the Exchange Act is recorded, processed, summarized, evaluated and reported within the time periods specified in SEC rules and forms and that such information is accumulated and communicated to management, including our Chief Executive Officer and Chief Financial Officer, to allow timely decisions regarding required disclosure.
(b)Changes in Internal Controls
There were no significant changes in our internal control over financial reporting during the period covered by this Quarterly Report on Form 10‑Q that have materially affected, or are reasonably likely to materially affect, our internal control over financial reporting.
PART II - OTHER INFORMATION
Item 1. Legal Proceedings
For a discussion of our “Legal Proceedings,” refer to Note 5 of our Consolidated Condensed Financial Statements located elsewhere in this Quarterly Report on Form 10-Q and Note 8 to our Consolidated Financial Statements included in the 2024 Annual Report. Cautionary Statements Regarding Forward-Looking Information
This report includes “forward-looking statements” within the meaning of Section 27A of the Securities Act of 1933, as amended, and Section 21E of the Securities Exchange Act of 1934, as amended. Forward-looking statements include statements regarding our strategies, objectives and plans for future development or acquisitions of properties or operations, as well as expectations, future operating results, trends and other information that is not historical information. When used in this report, the terms or phrases such as “anticipates,” “believes,” “projects,” “plans,” “intends,” “expects,” “might,” “may,” “estimates,” “could,” “should,” “would,” “will likely continue,” and variations of such words or similar expressions and their negative forms are intended to identify forward-looking statements. These statements are made on the basis of management’s current views and assumptions regarding future events.
Forward-looking statements are based upon certain underlying assumptions, including any assumptions mentioned with the specific statements, as of the date such statements were made. Such assumptions are in turn based upon internal estimates and analyses of market conditions and trends, management plans and strategies, economic conditions and other factors. Such forward-looking statements are only predictions and involve known and unknown risks and uncertainties, many of which are beyond our control, and are subject to change. By their nature, forward-looking statements involve risks and uncertainties because they relate to events and depend upon future circumstances that may not occur. Actual results and trends may differ materially from any future results, trends, performance or achievements expressed or implied by such statements. Forward-looking statements speak only as of the date they are made, and we assume no duty to update forward-looking statements. Forward-looking statements should not be regarded as a representation by us or any other person that the forward-looking statements will be achieved. Undue reliance should not be placed on any forward-looking statements. Some of the contingencies and uncertainties to which any forward-looking statement contained herein are subject include, but are not limited to, the following:
•our sensitivity to reductions in discretionary consumer spending as a result of downturns in the economy and other factors outside our control;
•projections of future results of operations or financial condition;
•expectations regarding our business and results of operations of our existing casino properties and prospects for future development;
•the impact of economic trends, inflation, trade tensions and related actions, such as the imposition of tariffs between the United States and other countries and the threat of any additional tariffs, and public health emergencies on our business and financial condition;
•expectations regarding trends that will affect our market and the gaming industry generally, including expansion of internet betting and gaming, and the impact of those trends on our business and results of operations;
•our ability to comply with the covenants in the agreements governing our outstanding indebtedness and leases;
•our ability to meet our projected debt service obligations, operating expenses, and maintenance capital expenditures;
•expectations regarding availability of capital resources;
•our intention to pursue development opportunities and additional acquisitions and divestitures;
•our ability to complete dispositions and divestitures and effectively reinvest the proceeds thereof;
•the ability to identify suitable acquisition opportunities and realize growth and cost synergies from any future acquisitions;
•the impact of regulation on our business and our ability to receive and maintain necessary approvals for our existing properties, future projects and the operation of our online sportsbook, online poker and iGaming applications;
•the effect of disruptions or corruption to our information technology and other systems and infrastructure;
•potential compromises of our information systems or unauthorized access to confidential information and customer data;
•the impact of the Data Incident and any other future cybersecurity breaches on our business, financial conditions and results of operations;
•factors impacting our ability to successfully operate our digital betting and iGaming platform and expand its user base;
•our ability to adapt to the very competitive environments in which we operate, including the online market;
•the impact of win or hold rates and liability management risks on our results of operations;
•our reliance on third parties for strategic relationships and essential services;
•costs associated with investments in our online offerings and technological and strategic initiatives;
•risk relating to fraud, theft and cheating;
•our ability to collect gaming receivables from our credit customers;
•the impact of our substantial indebtedness and significant financial commitments, including our obligations under our lease arrangements;
•restrictions and limitations in agreements governing our debt and leased properties could significantly affect our ability to operate our business and our liquidity;
•financial, operational, regulatory or other potential challenges that may arise as a result of leasing of a number of our properties;
•the impact of governmental regulation on our business and the cost of complying or the impact of failing to comply with such regulations;
•changes in gaming taxes and fees in jurisdictions in which we operate;
•risks relating to pending claims or future claims that may be brought against us;
•changes in interest rates and capital and credit markets;
•the effect of seasonal fluctuations;
•our particular sensitivity to energy and water prices;
•deterioration in our reputation or the reputation of our brands;
•our reliance on information technology, particularly for our digital business;
•our ability to protect our intellectual property rights;
•our reliance on licenses to use the intellectual property of third parties and our ability to renew or extend our existing licenses;
•the effects of war, terrorist activity, acts of violence, natural disasters and other catastrophic events;
•increased scrutiny and changing expectations regarding our environmental, social and governance practices and reporting;
•our reliance on key personnel and the intense competition to attract and retain management and key employees in the gaming industry;
•work stoppages and other labor problems;
•our ability to secure and retain performers and other entertainment offerings on acceptable terms; and
•other factors described in “Risk Factors” and “Management’s Discussion and Analysis of Financial Condition and Results of Operations” contained in this Quarterly Report on Form 10-Q, our most recent Annual Report on Form 10-K and any subsequent Quarterly Reports on Form 10-Q filed with the SEC.
In light of these and other risks, uncertainties and assumptions, the forward-looking events discussed in this report might not occur. These forward-looking statements speak only as of the date on which this statement is made, even if subsequently made available on our website or otherwise, and we do not intend to update publicly any forward-looking statement to reflect events or circumstances that occur after the date on which the statement is made, except as may be required by law.
You should also be aware that while we, from time to time, communicate with securities analysts, we do not disclose to them any material non-public information, internal forecasts or other confidential business information. Therefore, you should not assume that we agree with any statement or report issued by any analyst, irrespective of the content of the statement or report.
To the extent that reports issued by securities analysts contain projections, forecasts or opinions, those reports are not our responsibility and are not endorsed by us.
Item 1A. Risk Factors
A description of our risk factors can be found in “Part I, Item 1A. Risk Factors” included in the 2024 Annual Report. There have been no material changes to those risk factors during the six months ended June 30, 2025.
Item 2. Unregistered Sales of Equity Securities and Use of Proceeds
Issuer Purchases of Equity Securities
| | | | | | | | | | | | | | | | | | | | | | | | | | |
| Period | | Total Number of Shares Purchased | | Average Price Paid per Share | | Total Number of Shares Purchased as Part of Publicly Announced Plans or Programs | | Approximate Dollar Value of Shares that May Yet Be Purchased Under the Plans or Programs (in millions) (a) |
| April 1, 2025 to April 30, 2025 | | 4,188,466 | | | $ | 23.84 | | | 4,188,466 | | $ | 350 | |
| May 1, 2025 to May 31, 2025 | | — | | | — | | | — | | | 350 | |
| June 1, 2025 to June 30, 2025 | | — | | | — | | | — | | | 350 | |
Total | | 4,188,466 | | $ | 23.84 | | | 4,188,466 | | $ | 350 | |
____________________(a)On October 2, 2024, we announced that our Board of Directors authorized a $500 million common stock repurchase program (the “2024 Share Repurchase Program”). Under the 2024 Share Repurchase Program, we may, from time to time, repurchase shares of common stock on the open market (either with or without a 10b5-1 plan) or through privately negotiated transactions. The 2024 Share Repurchase Program has no time limit and may be suspended or discontinued at any time without notice. There is no minimum number of shares of common stock that we are required to repurchase under the 2024 Share Repurchase Program. All share repurchases under the 2024 Share Repurchase Program are retired upon repurchase.
Item 3. Defaults Upon Senior Securities
None.
Item 4. Mine Safety Disclosures
Not applicable.
Item 5. Other Information
(a) None.
(b) None.
(c) Rule 10b5-1 Plans
, Recreational Enterprises, Inc. (“REI”) into a “Rule 10b5-1 trading arrangement” (as defined in Item 408(a) of Regulation S-K). REI’s plan provides for the potential sale by REI of up to shares of common stock between August 8, 2025 and . Our , , indirectly through various trusts holds a 10.1% ownership interest in, and is the President and a member of the board of directors of, REI. He does not hold voting power or dispositive power with respect to REI’s shares of our common stock and he disclaims beneficial ownership of REI’s shares of our common stock except to the extent of any pecuniary interest therein.The above trading plan activity occurred during open insider trading windows and is intended to satisfy the affirmative defense conditions of Rule 10b5-1(c) under the Securities Exchange Act of 1934, as amended, and Caesars’ policies regarding transactions in securities of the Company.
Item 6. Exhibits
| | | | | | | | | | | | | | |
Exhibit Number | | Description of Exhibit | | Method of Filing |
| | | | |
| 3.1 | | | | Previously filed on Form 8-K filed on June 16, 2023. |
| | | | |
| 3.2 | | | | Previously filed on Form 8-K filed on July 28, 2025. |
| | | | |
| 10.1 | | Amendment to Director Appointment and Nomination Agreement, dated May 2, 2025, by and between Caesars Entertainment, Inc., Carl C. Icahn, Jesse Lynn, Ted Papapostolou, Icahn Partners Master Fund LP, Icahn Offshore LP, Icahn Partners LP, Icahn Onshore LP, Icahn Capital LP, IPH GP LLC, Icahn Enterprises Holdings L.P., Icahn Enterprises G.P. Inc, Beckton Corp. and Nakatomi Trading, LLC | | Previously filed on Form 8-K filed on May 2, 2025. |
| | | | |
| 10.2 | | | | Filed herewith. |
| | | | |
| 31.1 | | | | Filed herewith. |
| | | | |
| 31.2 | | | | Filed herewith. |
| | | | |
| 32.1 | | | | Filed herewith. |
| | | | |
| 32.2 | | | | Filed herewith. |
| | | | |
| 101.1 | | Inline XBRL Instance Document | | Filed herewith. |
| | | | |
| 101.2 | | Inline XBRL Taxonomy Extension Schema Document | | Filed herewith. |
| | | | |
| 101.3 | | Inline XBRL Taxonomy Extension Calculation Linkbase Document | | Filed herewith. |
| | | | |
| 101.4 | | Inline XBRL Taxonomy Extension Definition Linkbase Document | | Filed herewith. |
| | | | |
| 101.5 | | Inline XBRL Taxonomy Extension Label Linkbase Document | | Filed herewith. |
| | | | |
| 101.6 | | Inline XBRL Taxonomy Extension Presentation Linkbase Document | | Filed herewith. |
| | | | |
| 104 | | Cover Page Interactive Data File (embedded within the Inline XBRL document) | | Filed herewith. |
SIGNATURES
Pursuant to the requirements of the Securities and Exchange Act of 1934, the registrant has duly caused this report to be signed on its behalf by the undersigned thereunto duly authorized.
| | | | | |
| CAESARS ENTERTAINMENT, INC. |
| |
| Date: July 29, 2025 | /s/ Thomas R. Reeg |
| Thomas R. Reeg Chief Executive Officer (Principal Executive Officer) |
| |
| Date: July 29, 2025 | /s/ Bret Yunker |
| Bret Yunker Chief Financial Officer (Principal Financial Officer) |

Similar companies
See also MARRIOTT INTERNATIONAL INC /MD/ -
Annual report 2023 (10-K 2023-12-31)
Annual report 2025 (10-Q 2025-06-30)
See also Hilton Worldwide Holdings Inc. -
Annual report 2022 (10-K 2022-12-31)
Annual report 2023 (10-Q 2023-09-30)
See also LAS VEGAS SANDS CORP -
Annual report 2022 (10-K 2022-12-31)
Annual report 2023 (10-Q 2023-09-30)
See also MGM Resorts International -
Annual report 2022 (10-K 2022-12-31)
Annual report 2023 (10-Q 2023-09-30)
See also H World Group Ltd
 Open main menu