Camping World Holdings, Inc. - Annual Report: 2017 (Form 10-K)
UNITED STATES
SECURITIES AND EXCHANGE COMMISSION
Washington, D.C. 20549
FORM 10-K
[X]ANNUAL REPORT PURSUANT TO SECTION 13 OR 15(d) OF THE SECURITIES EXCHANGE ACT OF 1934
For the fiscal year ended December 31, 2017
OR
[ ]TRANSITION REPORT PURSUANT TO SECTION 13 OR 15(d) OF THE SECURITIES EXCHANGE ACT OF 1934
For the transition period from _____ to_____
Commission file number: 001-37908
CAMPING WORLD HOLDINGS, INC.
(Exact name of registrant as specified in its charter)
|
Delaware |
81‑1737145 |
250 Parkway Drive, Suite 270
Lincolnshire, IL 60069
Telephone: (847) 808‑3000
(Address, including zip code, and telephone number, including
area code, of registrant’s principal executive offices)
|
Title of each class |
Name of each exchange on which registered |
|
Common Stock, Par Value $0.01 Per Share |
New York Stock Exchange |
Securities registered pursuant to Section 12(g) of the Act: None
Indicate by check mark if the registrant is a well-known seasoned issuer, as defined in Rule 405 of the Securities Act. Yes ☒ No ☐
Indicate by check mark if the registrant is not required to file reports pursuant to Section 13 or Section 15(d) of the Exchange Act. Yes ☐ No ☒
Indicate by check mark whether the registrant (1) has filed all reports required to be filed by Section 13 or 15(d) of the Securities Exchange Act of 1934 during the preceding 12 months (or for such shorter period that the registrant was required to file such reports), and (2) has been subject to such filing requirements for the past 90 days. Yes ☒ No ☐
Indicate by check mark whether the registrant has submitted electronically and posted on its corporate Web site, if any, every Interactive Data File required to be submitted and posted pursuant to Rule 405 of Regulation S-T (§232.405 of this chapter) during the preceding 12 months (or for such shorter period that the new registrant was required to submit and post such files). Yes ☒ No ☐
Indicate by check mark if disclosure of delinquent filers pursuant to Item 405 of Regulation S-K (§229.405 of this chapter) is not contained herein, and will not be contained, to the best of registrant’s knowledge, in definitive proxy or information statements incorporated by reference in Part III of this Form 10-K or any amendment to this Form 10-K. ☐
Indicate by check mark whether the registrant is a large accelerated filer, an accelerated filer, a non-accelerated filer, a smaller reporting company, or an emerging growth company. See the definitions of “large accelerated filer,” “accelerated filer,” “smaller reporting company,” and “emerging growth company” in Rule 12b-2 of the Exchange Act. (Check one):
|
Large accelerated filer ☒ |
Accelerated filer ☐ |
Non‑accelerated filer ☐ |
Smaller reporting company ☐
Emerging growth company ☐ |
If an emerging growth company, indicate by check mark if the registrant has elected not to use the extended transition period for complying with any new or revised financial accounting standards provided pursuant to Section 13(a) of the Exchange Act. ☐
Indicate by check mark whether the registrant is a shell company (as defined in Rule 12b-2 of the Exchange Act). Yes ☐ No ☒
The aggregate market value of the voting and non-voting stock held by non-affiliates of the Registrant, as of June 30, 2017, the last business day of the Registrant’s most recently completed second fiscal quarter, was approximately $720,383,000. Solely for purposes of this disclosure, shares of common stock held by executive officers and directors of the Registrant as of such date have been excluded because such persons may be deemed to be affiliates.
As of March 12, 2018, the registrant had 36,799,978 shares of Class A common stock outstanding, 50,836,629 shares of Class B common stock outstanding, and one share of Class C common stock outstanding.
DOCUMENTS INCORPORATED BY REFERENCE
Portions of the registrant’s Proxy Statement relating to its 2018 Annual Meeting of Stockholders to be filed with the SEC within 120 days after the end of the fiscal year ended December 31, 2017 are incorporated herein by reference in Part III.
Form 10-K
For the Fiscal Year Ended December 31, 2017
INDEX
|
|
Page |
|
| 8 | ||
| 29 | ||
| 65 | ||
| 66 | ||
| 67 | ||
| 67 | ||
|
|
||
| 72 | ||
| 75 | ||
|
Management’s Discussion and Analysis of Financial Condition and Results of Operations |
78 | |
| 116 | ||
| 118 | ||
|
Changes in and Disagreements With Accountants on Accounting and Financial Disclosure |
173 | |
| 173 | ||
| 177 | ||
|
|
|
|
|
|
|
|
| 178 | ||
| 178 | ||
|
Security Ownership of Certain Beneficial Owners and Management and Related Stockholder Matters |
178 | |
|
Certain Relationships and Related Transactions, and Director Independence |
178 | |
| 179 | ||
|
|
|
|
|
|
|
|
| 180 | ||
| 183 | ||
| 184 | ||
2
BASIS OF PRESENTATION
As used in this Annual Report on Form 10-K (this “Form 10-K”), unless the context otherwise requires, references to:
|
· |
“we,” “us,” “our,” the “Company,” “Camping World,” “Good Sam” and similar references refer to Camping World Holdings, Inc., and, unless otherwise stated, all of its subsidiaries, including CWGS Enterprises, LLC, which we refer to as “CWGS, LLC” and, unless otherwise stated, all of its subsidiaries. |
|
· |
“Continuing Equity Owners” refers collectively to ML Acquisition, funds controlled by Crestview Partners II GP, L.P. and the Former Profit Unit Holders and each of their permitted transferees that own common units in CWGS, LLC and who may redeem at each of their options their common units for, at our election (determined solely by our independent directors within the meaning of the rules of the New York Stock Exchange who are disinterested), cash or newly-issued shares of our Class A common stock. |
|
· |
“Crestview” refers to Crestview Advisors, L.L.C., a registered investment adviser to private equity funds, including funds affiliated with Crestview Partners II GP, L.P. |
|
· |
“CWGS LLC Agreement” refers to CWGS, LLC’s amended and restated limited liability company agreement, as amended. |
|
· |
“Former Equity Owners” refers to those Original Equity Owners controlled by Crestview Partners II GP, L.P. that have exchanged their direct or indirect ownership interests in CWGS, LLC for shares of our Class A common stock in connection with the consummation of our initial public offering (“IPO”). |
|
· |
“Former Profit Unit Holders” refers collectively to our named executive officers (excluding Marcus Lemonis), Andris A. Baltins and K. Dillon Schickli, who are members of our board of directors, and certain other current and former non executive employees and former directors, in each case, who held common units of CWGS, LLC pursuant to CWGS, LLC’s equity incentive plan that was in existence prior to our IPO and received common units of CWGS, LLC in exchange for their profit units in CWGS, LLC. |
|
· |
“ML Acquisition” refers to ML Acquisition Company, LLC, a Delaware limited liability company, indirectly owned by each of Stephen Adams and our Chairman and Chief Executive Officer, Marcus Lemonis. |
|
· |
“ML Related Parties” refers to ML Acquisition and its permitted transferees of common units. |
|
· |
“ML RV Group” refers to ML RV Group, LLC, a Delaware limited liability company, wholly owned by our Chairman and Chief Executive Officer, Marcus Lemonis. |
|
· |
“Original Equity Owners” refers to the direct and certain indirect owners of interests in CWGS, LLC, collectively, prior to the Reorganization Transactions and Recapitalization (as defined in Note 1 – Summary of Significant Accounting Policies and Note 18 – Stockholders’ Equity to our consolidated financial statements included in Part II, Item 8 of this Form 10-K, respectively) conducted in conjunction with our IPO, including ML Acquisition, funds controlled by Crestview Partners II GP, L.P. and the Former Profit Unit Holders. |
|
· |
“Tax Receivable Agreement” refers to the tax receivable agreement that the Company entered into with CWGS, LLC, each of the Continuing Equity Owners and Crestview Partners II GP, L.P. in connection with the Company’s IPO. |
3
CAUTIONARY NOTE REGARDING FORWARD‑LOOKING STATEMENTS
This Form 10-K contains forward-looking statements. We intend such forward-looking statements to be covered by the safe harbor provisions for forward-looking statements contained in Section 27A of the Securities Act of 1933 and Section 21E of the Securities Exchange Act of 1934. All statements other than statements of historical facts contained in this Form 10-K may be forward-looking statements. Statements regarding our future results of operations and financial position, business strategy and plans and objectives of management for future operations, including, among others, statements regarding expected new retail location openings, including greenfield locations and acquired locations, as well as Gander Outdoors locations; profitability of new retail locations; our working capital needs and the funding thereof; including our intent to increase borrowings in the near term to fund certain store openings and dealership acquisitions; use of proceeds from our borrowings under the Existing Senior Secured Credit Facilities (as defined below); sufficiency of our sources of liquidity and capital and potential need for additional financing; future capital expenditures and debt service obligations; refinancing, retirement or exchange of outstanding debt; our plans to increase product offerings and grow our businesses to enhance revenue and cash flow, and increase our overall profitability; expectations regarding consumer behavior and growth; our comparative advantages; our plans and ability to expand our consumer base; our ability to respond to changing business and economic conditions; volatility in sales and potential impact of miscalculating the demand for our products or our product mix; our ability to drive growth; capacity of our contact centers; anticipated impact of certain business acquisitions and opening and operation of the related retail locations; the number of Gander Outdoors locations the Company expects to open and operate and the anticipated timing of such store openings; anticipated timing of the completion of the accounting to reflect the effect of the 2017 Tax Act (as defined below); expectations regarding increase of certain expenses are forward-looking statements; the Company’s plan with regards to the disposition of its investments in CWGS, LLC and its expectations related to realization of a portion of certain outside basis deferred tax asset; the Company’s intent to complete the remediation process related to material weaknesses identified as promptly as possible and to not consider the material weaknesses remediated until our enhanced controls are operational for a sufficient period of time and tested; and the possibility that the Company’s management may decide to take additional measures to address the material weaknesses or modify its current remediation plan. In some cases, you can identify forward-looking statements by terms such as ‘‘may,’’ ‘‘will,’’ ‘‘should,’’ ‘‘expects,’’ ‘‘plans,’’ ‘‘anticipates,’’ ‘‘could,’’ ‘‘intends,’’ ‘‘targets,’’ ‘‘projects,’’ ‘‘contemplates,’’ ‘‘believes,’’ ‘‘estimates,’’ ‘‘predicts,’’ ‘‘potential’’ or ‘‘continue’’ or the negative of these terms or other similar expressions. Forward-looking statements involve known and unknown risks, uncertainties and other important factors that may cause our actual results, performance or achievements to be materially different from any future results, performance or achievements expressed or implied by the forward-looking statements. We believe that these important factors include, but are not limited to, the following:
|
· |
the availability of financing to us and our customers; |
|
· |
fuel shortages, or high prices for fuel; |
|
· |
the well-being, as well as the continued popularity and reputation for quality, of our manufacturers; |
|
· |
general economic conditions in our markets, and ongoing economic and financial uncertainties; |
|
· |
our ability to attract and retain customers; |
|
· |
competition in the market for services, protection plans, products and resources targeting the RV lifestyle or RV enthusiast; |
|
· |
our expansion into new, unfamiliar markets, businesses, or product lines or categories, as well as delays in opening or acquiring new retail locations; |
|
· |
unforeseen expenses, difficulties, and delays frequently encountered in connection with expansion through acquisitions; |
4
|
· |
our failure to maintain the strength and value of our brands; |
|
· |
our ability to successfully order and manage our inventory to reflect consumer demand in a volatile market and anticipate changing consumer preferences and buying trends; |
|
· |
fluctuations in our same store sales and whether they will be a meaningful indicator of future performance; |
|
· |
the cyclical and seasonal nature of our business; |
|
· |
our ability to operate and expand our business and to respond to changing business and economic conditions, which depends on the availability of adequate capital; |
|
· |
the restrictive covenants imposed by our Existing Senior Secured Credit Facilities and Floor Plan Facility; |
|
· |
our reliance on seven fulfillment and distribution centers for our retail, e-commerce and catalog businesses; |
|
· |
natural disasters, whether or not caused by climate change, unusual weather condition, epidemic outbreaks, terrorist acts and political events; |
|
· |
our dependence on our relationships with third-party providers of services, protection plans, products and resources and a disruption of these relationships or of these providers’ operations; |
|
· |
whether third-party lending institutions and insurance companies will continue to provide financing for RV purchases; |
|
· |
our inability to retain senior executives and attract and retain other qualified employees; |
|
· |
our ability to meet our labor needs; |
|
· |
risks associated with leasing substantial amounts of space, including our inability to maintain the leases for our retail locations or locate alternative sites for our stores in our target markets and on terms that are acceptable to us; |
|
· |
our business being subject to numerous federal, state and local regulations; |
|
· |
regulations applicable to the sale of extended service contracts; |
|
· |
our dealerships’ susceptibility to termination, non-renewal or renegotiation of dealer agreements if state dealer laws are repealed or weakened; |
|
· |
potential impact of material weaknesses in our internal control over financial reporting; |
|
· |
our failure to comply with certain environmental regulations; |
|
· |
climate change legislation or regulations restricting emission of ‘‘greenhouse gases;’’ |
|
· |
a failure in our e-commerce operations, security breaches and cybersecurity risks; |
|
· |
our inability to enforce our intellectual property rights and accusations of our infringement on the intellectual property rights of third parties; |
|
· |
our inability to maintain or upgrade our information technology systems or our inability to convert to alternate systems in an efficient and timely manner; |
|
· |
disruptions to our information technology systems or breaches of our network security; |
5
|
· |
feasibility, delays, and difficulties in opening of Gander Outdoors retail locations; |
|
· |
realization of anticipated benefits and cost savings related to recent acquisitions; |
|
· |
potential litigation relating to products we sell as a result of recent acquisitions, including firearms and ammunition; |
|
· |
Marcus Lemonis, through his beneficial ownership of our shares directly or indirectly held by ML Acquisition Company, LLC and ML RV Group, LLC, has substantial control over us and may approve or disapprove substantially all transactions and other matters requiring approval by our stockholders, including, but not limited to, the election of directors; |
|
· |
the exemptions from certain corporate governance requirements that we will qualify for, and intend to rely on, due to the fact that we are a ‘‘controlled company’’ within the meaning of the New York Stock Exchange, or NYSE, listing requirements; |
|
· |
whether we are able to realize any tax benefits that may arise from our organizational structure and any redemptions or exchanges of CWGS Enterprises, LLC common units for cash or stock; and |
|
· |
the other factors set forth under ‘‘Risk Factors’’ In Item 1A of Part I of this Form 10-K. |
We qualify all of our forward-looking statements by these cautionary statements. The forward-looking statements in this Form 10-K are only predictions. We have based these forward-looking statements largely on our current expectations and projections about future events and financial trends that we believe may affect our business, financial condition and results of operations. Because forward-looking statements are inherently subject to risks and uncertainties, some of which cannot be predicted or quantified, you should not rely on these forward-looking statements as predictions of future events. The events and circumstances reflected in our forward-looking statements may not be achieved or occur and actual results could differ materially from those projected in the forward-looking statements. Except as required by applicable law, we do not plan to publicly update or revise any forward-looking statements contained herein, whether as a result of any new information, future events, changed circumstances or otherwise. For a further discussion of the risks relating to our business, see “Item 1A—Risk Factors” in Part I of this Form 10-K.
EXPLANATORY NOTE
Restatement of Consolidated Financial Results
On March 10, 2018, the Audit Committee of our Board of Directors concluded that our previously issued consolidated financial statements as of and for the year ended December 31, 2016, and as of and for the three months ended March 31, 2017, three and six months ended June 30, 2017 and three and nine months ended September 30, 2017 (collectively, the “Affected Periods”), should no longer be relied upon. As a result, this Form 10-K includes the restatement of our consolidated financial statements and the related disclosures as of and for the year ended December 31, 2016. The Audit Committee reached this conclusion based on our review of our deferred tax asset related to our acquisition of our direct interest in CWGS, LLC through newly issued LLC units in connection with our IPO in October 2016 and our subsequent public offering of our Class A common stock in May 2017. Following the purchase of newly issued LLC units from CWGS, LLC in connection with these offerings, our deferred tax balances have reflected the differences in the book and tax basis of our investment in CWGS, LLC (i.e., outside basis). In connection with preparing our financial statements for the year ended December 31, 2017, including considerations for the provisional impact of the recently enacted U.S. tax reform legislation commonly referred to as the U.S. Tax Cuts and Jobs Act of 2017 (the “2017 Tax Act”), we determined that a portion of the outside basis deferred tax asset related to our acquisition of the direct interest in CWGS, LLC through newly issued LLC units is not expected to be realized unless we were to dispose of our investment in CWGS, LLC, which we have no current plan to
6
do. Accordingly, we have determined that we should have established a valuation allowance of $102.7 million against this portion of our deferred tax asset that was recorded through equity as of December 31, 2016.
In addition, along with restating our consolidated financial statements for the correction discussed above, we have adjusted for certain immaterial items with respect to the years ended December 31, 2016 and 2015 and each quarterly period within the years ended December 31, 2017 and 2016. Although the effect of these corrections was not material to the previously issued financial statements for the years ended December 31, 2016 and 2015, the interim quarterly periods therein or the interim quarterly periods in the year ended December 31, 2017. In conjunction with the restatement described above, we have determined it would be appropriate to also record these adjustments for the respective periods.
The following items of this Form 10-K include restated financial data: (i) Part II, Item 6—Selected Financial Data; (ii) Part II, Item 7—Management’s Discussion and Analysis of Financial Condition and Results of Operations; (iii) Part II, Item 8—Financial Statements and Supplementary Data and (iv) Part IV, Item 15—Exhibits and Financial Statement Schedules. Note 1 to our consolidated financial statements sets forth, in a comparative presentation, the previously reported, restatement adjustments and restated amounts for those line items in the 2016 and 2015 consolidated financial statements affected by the restatement and corrections of immaterial errors. This Form 10-K also includes disclosure regarding the impact of the restatement on the effectiveness of our internal control over financial reporting and disclosure controls and procedures in Part II, Item 9A.— Controls and Procedures.
We have not amended our previously-filed Annual Report on Form 10-K for the year ended December 31, 2016 (the “2016 Annual Report”), and the consolidated financial statements for the year ended December 31, 2016 contained in the 2016 Annual Report should no longer be relied upon. Instead, such financial statements are superseded in their entirety by the restated consolidated financial statements for the year ended December 31, 2016 contained in this Form 10-K.
7
For purposes of this Form 10-K, we define an "Active Customer" as a customer who has transacted with us in any of the eight most recently completed fiscal quarters prior to the date of measurement. Unless otherwise indicated, the date of measurement is December 31, 2017, our most recently completed fiscal quarter. Additionally, references herein to the approximately 9 million U.S. households that own a recreational vehicle are based on The RV Consumer in 2011, an industry report published by the University of Michigan in 2011 (the "RV Survey"), which we believe to be the most recent such survey.
Our Company
We believe we are the only provider of a comprehensive portfolio of services, protection plans, products and resources for recreational vehicle (“RV”) enthusiasts. Approximately 9 million households in the U.S. own an RV, and of that installed base, we have approximately 3.6 million Active Customers related to the RV industry. We generate recurring revenue by providing RV owners and enthusiasts the full spectrum of services, protection plans, products and resources that we believe are essential to operate, maintain and protect their RV and to enjoy the RV lifestyle. We provide these offerings through our two iconic brands: Good Sam and Camping World.
|
Good Sam Consumer Services and |
|
|
|
|
|
|
|
Plans |
|
Camping World Retail |
||||
|
Consumer Services |
|
New and Used |
|
Parts, Service |
|
Dealership Finance |
|
and Plans |
|
Vehicles |
|
and Other |
|
and Insurance |
|
|
|
|
|
|
|
|
|
•Extended vehicle service contracts •Emergency roadside assistance •Property and casualty insurance programs •Membership clubs •Vehicle financing and refinancing •Travel protection •Co‑branded credit cards •Consumer activities and resources: –Membership events and chapters –Consumer shows –Trip planning, travel directories and campground / fuel discounts –Consumer magazines –E‑commerce and social media –Contact centers and technical hotlines –Hosted online forums |
|
•New and used travel trailers •New and used fifth wheel trailers •New and used motorhomes |
|
•RV and auto repair and maintenance •Installation of parts and accessories •Collision repair •OEM and aftermarket parts •RV accessories, maintenance products and supplies –Outdoor lifestyle products –Generators and electrical –Satellite receivers and GPS –Towing and hitching –RV appliances –Essential supplies |
|
•Vehicle financing •Protection plans –Extended vehicle service contracts –Tire, wheel, paint and fabric protection –Gap protection –Travel protection –Emergency roadside assistance and alert notifications |
We believe our Good Sam branded offerings provide the industry’s broadest and deepest range of services, protection plans, products and resources, including: extended vehicle service contracts and insurance protection plans, roadside assistance, membership clubs and financing products. A majority of these programs are on a multi‑year or annually renewable basis. Across our extended vehicle service
8
contracts, emergency roadside assistance, property and casualty insurance programs and membership clubs, for each of the years ended December 31, 2017, 2016 and 2015, we experienced high annual retention rates that ranged between 64% and 71%, 65% and 74%, and 66% and 74%, respectively. We also operate the Good Sam Club, which we believe is the largest RV organization in the world, with approximately 1.8 million members as of December 31, 2017. Membership benefits include a variety of discounts, exclusive benefits, specialty publications and other membership benefits, all of which we believe enhance the RV experience, drive customer engagement and provide cross‑selling opportunities for our other services, protection plans and products.
Our Camping World brand operates the largest national network of RV‑centric retail locations in the United States through our 140 retail locations in 36 states, as of December 31, 2017, and through our e‑commerce platforms. We believe we are significantly larger in scale than our next largest competitor. We provide new and used RVs, repair parts, RV accessories and supplies, RV repair and maintenance services, protection plans, travel assistance plans, RV financing, and lifestyle products and services for new and existing RV owners. Our retail locations are staffed with knowledgeable local team members, providing customers access to extensive RV expertise. Our retail locations are strategically located in key national RV markets. In 2017, our network generated approximately 3.7 million transactions, continuing to build our Active Customer database.
We attract new customers primarily through our retail locations, e‑commerce platforms and direct marketing. Once we acquire our customers through a transaction, they become part of our customer database where we leverage customized customer relationship management (“CRM”) tools and analytics to actively engage, market and sell multiple products and services. Our goal is to consistently grow our customer database through our various channels to increasingly cross‑sell our products and services.
Our Strengths
Our Iconic Brands. With over fifty years of history dating back to 1966, we believe Camping World and Good Sam are iconic, industry defining brands that are synonymous with the RV lifestyle. Our consistent quality, breadth and depth of offerings, as well as our comprehensive range of RV lifestyle resources, have resulted in our customers having passionate loyalty to and enduring trust in our brands.
Comprehensive Portfolio of Services, Protection Plans and Products. We believe we are the only provider of a comprehensive portfolio of services, protection plans, products and resources for RV enthusiasts. We offer more than 10,000 products and services through our retail locations and membership clubs. Our offerings are based on over 50 years of experience and customer feedback from RV enthusiasts. Further, we evaluate new products and, through acquisitions or our supplier collaborations, offer certain unique products that are developed based on customer feedback, including private label products.
Customer Database. We have over 15.1 million unique RV contacts in our database of which approximately 3.6 million are Active Customers related to our RV products. We use a customized CRM system and database analytics to track customers and selectively market and cross‑sell our offerings. We believe our customer database is a competitive advantage and significant barrier to entry.
Leading Market Position and Scale. Camping World is the largest national RV retail network in the United States, and we believe Good Sam is the largest RV organization in the world, with each of our businesses having a distinct web presence through our e‑commerce platforms. Our scale and our long‑term stability make us attractive to our suppliers, financiers and real estate investors. The strong relationship with our suppliers enables us to negotiate attractive product pricing and availability. We also align with our suppliers on product development in which we leverage our customer base to provide feedback in exchange for exclusive early launch periods for new products. In recent years, we have also leveraged our supplier relationships to introduce private label products, which has improved our product availability.
Core of High Margin, Recurring Revenue. At the core of our offerings are certain high margin products and services targeting the installed base of RV households that generate recurring revenue streams. These offerings include certain Consumer Services and Plan offerings, which we believe are characterized by increased customer engagement, such as our extended vehicle service contracts, emergency roadside
9
assistance, property and casualty insurance programs and membership clubs. As of December 31, 2017, 2016, and 2015, we had 2.8 million, 2.6 million, and 2.5 million participants, respectively, across these Consumer Services and Plan offerings, including those who participated in more than one of our offerings. The increased engagement of our customers in these areas has led to high annual retention rates. Across our extended vehicle service contracts, emergency roadside assistance, property and casualty insurance programs and membership clubs, for each of the years ended December 31, 2017, 2016, and 2015, we experienced high annual retention rates that ranged between 64% and 71%, 65% and 74%, and 66% and 74%, respectively. These offerings also include our Retail parts, services and other offerings, which we believe to be stable and more consistent than the sale of new and used vehicles. Concentrating on our Consumer Services and Plans and Retail parts, services and other offerings has allowed us to grow a core of recurring revenue with gross margins of 58.2% and 44.1% respectively, for the year ended December 31, 2017, which is significantly higher than our consolidated gross margins of 29.1% for the year ended December 31, 2017.
Variable Cost Structure and Capital Efficient Model. Our decentralized and flat management structure coupled with incentive programs focused on profitability have allowed us to achieve a highly variable cost structure. Our database analytics provide us significant flexibility and meaningfully improve our marketing efficiency via nimble, targeted marketing programs. We believe our model leads to strong and stable margins through economic cycles, resulting in what we believe to be high cash flow generation, low capital expenditure requirements and impressive returns on invested capital. As a result, we have been successful in generating access to highly attractive real estate and floor plan financing terms, thereby reducing costs and significantly reducing our need for capital. This capital efficient model provides a large share of capital funding at attractive terms for new locations and acquisitions.
Experienced Team. Our management team has an average of 22 years of industry experience. We offer highly competitive compensation tightly tied to performance, which has allowed us to attract and retain our highly experienced management team. Since 2013, our team has increased total revenue from $2.3 billion to $4.3 billion for the year ended December 31, 2017, increased net income from $16.9 million to $233.0 million for the year ended December 31, 2017 and increased Adjusted EBITDA from $164.6 million to $399.6 million for the year ended December 31, 2017. Adjusted EBITDA is a non-GAAP measure. For a reconciliation of Adjusted EBITDA to net income, the most closely comparable GAAP measure, see “Non-GAAP Financial Measures” in Item 7 of Part II of this Form 10-K.
Our Growth Strategy
Outdoor and Active Sports Retail Strategy
While we have traditionally focused on the RV-centric outdoor enthusiasts, we believe there is significant opportunity for us to offer our comprehensive portfolio of services, protection plans, products and resources beyond the traditional RV enthusiasts to a broader group of outdoor and active sports enthusiasts who enjoy hunting, fishing, boating, non-RV camping, biking, snow skiing, snowboarding, sailboarding, skateboarding and other outdoor active sports and activities. By expanding our array of products and services to include outdoor products, apparel and gear and active sportswear and gear through several strategic acquisitions listed below (“Outdoor and Active Sports Retail”) to target this broader group of outdoor and active sports enthusiasts, and by enhancing the benefits of membership in our Good Sam Club to provide additional benefits and savings to this broader group of outdoor and active sports enthusiasts, we believe we have the opportunity to expand our base of Active Customers and enhance the long-term value of the Good Sam consumer services and plans. Consistent with this new strategy, we made several strategic acquisitions in the retail space in 2017 and early 2018.
10
Gander Mountain and Overton’s. On May 26, 2017, we acquired certain assets of Gander Mountain Company (“Gander Mountain”) and its Overton’s, Inc. (“Overton’s”) marine and watersports business through a bankruptcy auction. Prior to the bankruptcy, Gander Mountain operated 160 retail locations and an e-commerce business that serviced the hunting, camping, fishing, shooting sports, and outdoor markets. Following our acquisition, we rebranded the Gander Mountain business as Gander Outdoors. As of December 31, 2017, we were operating two Gander Outdoors stores, two Overton’s retail stores, and the Gander Outdoors and Overton’s online business and had 4.5 million unique contacts pertaining to these two brands. We plan to operate a total of 74 Gander Outdoors stores by May 2018.
Active Sports, Inc. On August 17, 2017, we acquired Active Sports, Inc. which included TheHouse.com, an online retail component of the business, specializing in bikes, sailboards, skateboards, wakeboards, snowboards and outdoor gear.
W82. On September 22, 2017, we acquired EIGHTEEN0THREE LLC, dba W82 (“W82”), which specializes in snowboarding, skateboarding, longboarding, swimwear, footwear, apparel and accessories.
Uncle Dan's Outfitters. On October 19, 2017, we acquired Uncle Dan's LTD, a specialty retailer of outdoor gear, apparel and camping supplies.
Erehwon Mountain Outfitter. On January 30, 2018, we acquired Erehwon Mountain Outfitter, a Midwest specialty retailer of outdoor gear and apparel, with three Chicagoland area locations and the flagship location in the Milwaukee area.
We believe that these recently acquired businesses will allow us to pursue our Outdoor and Active Sports Retail strategy, are complementary to our existing businesses, will enhance our product offerings, will allow us to expand our base of Active Customers, will enhance the long-term value of the Good Sam consumer services and plans, and will provide us with a strong foundation in the outdoor lifestyle market for future growth, with the goal for us to become a go-to destination for outdoor enthusiasts.
RV Growth Strategy
Grow Our Active Base of Customers. We believe our strong brands, leading market position, ongoing investment in our service platform, broad product portfolio and full suite of resources will continue to provide us with competitive advantages in targeting and capturing a larger share of consumers with whom we do not currently transact in addition to the growing number of new RV enthusiasts that will enter the market. We expect to continue to grow the Active Customer base primarily through three strategies:
|
· |
Targeted Marketing. We continuously work to attract new customers to our existing retail and online locations through targeted marketing, attractive introductory offerings and access to our wide array of resources for RV enthusiasts. We have focused specifically on marketing to the fast‑growing demographic of younger market entrants, and through our NASCAR Truck Series and participation at college athletic events and music festivals, we believe we attract an outsized share of younger RV owners to our platform. |
|
· |
Greenfield Retail Locations. We establish retail locations in new and existing markets to expand our customer base. Target markets and locations are identified by employing proprietary data and analytical tools. We believe there is ample white space for additional development opportunities which, consistent with most of our locations, have the benefit of what we believe to be low‑cost land acquisition prices. Since 2012, we have successfully opened 14 new greenfield locations. We intend to continue to open sites that will grow our Active Customer base and present attractive risk‑adjusted returns and significant value‑creation opportunities. Our greenfield locations typically reach profitability within three months. |
|
· |
Retail Location Acquisitions. The RV dealership industry is highly fragmented with a large number of independent RV dealers. We use acquisitions of independent dealers as a fast and capital efficient alternative to new retail location openings to expand our business and grow our customer base. While acquired sites typically remain open following an acquisition, in certain |
11
instances we may close a location following an acquisition for remodeling for a period of time generally not in excess of eight weeks. We believe our experience and scale allow us to operate these acquired locations more efficiently. Since 2012, we have successfully acquired and integrated 51 new retail locations, and in 2015, we sold two retail locations. Our acquisitions are typically profitable within two full calendar months after an acquisition, with the exception of acquisitions we consider turn‑around opportunities, which are typically profitable within two to four months. We intend to continue to pursue acquisitions that will grow our Active Customer base and present attractive risk‑adjusted returns and significant value‑creation opportunities. |
Cross‑Sell Growing Portfolio of Services, Protection Plans and Products. We believe our customer database of 15.1 million unique RV-related contacts, in addition to 4.5 million unique Outdoor and Active Sports Retail contacts, provides us with the opportunity to continue our growth through the cross‑selling of our products and services. We use our customized CRM system and database analytics to proactively market and cross‑sell to Active Customers. We also seek to increase the penetration of our customers who exhibit higher multi‑product attachment rates.
New Products and Vertical Acquisitions. Introduction of new products enhances our cross‑selling effort, both by catering to evolving customer demands and by bringing in new customers. Through relationships with existing suppliers and through acquisitions, we will look to increase the new products we can offer to our customers. Similarly, an opportunistic vertical acquisition strategy allows us to earn an increased margin on our services, protection plans and products, and we evaluate such acquisitions that can allow us to capture additional sales from our customers at attractive risk‑adjusted returns.
Our Services, Protection Plans, Products and Resources
We operate through two reportable segments: Consumer Services and Plans and Retail. See Note 22 — Segment Information to our consolidated financial statements for further information regarding our reportable segments. Through our retail locations, e commerce platforms and clubs, we offer RV owners and RV enthusiasts the full spectrum of services, protection plans, products and resources that we believe are essential to operate, maintain, protect and to enjoy the RV lifestyle, including, among others:
Good Sam Offerings
Consumer Services and Plans
Extended vehicle service contracts: We offer a mechanical breakdown insurance program developed and offered exclusively for the members of the Good Sam Club and underwritten and insured by QBE Europe Insurance Ltd (“QBE”). The contracts cover the cost of parts, labor and repairs to motorized and towable RVs as well as autos, pick-up trucks and SUVs. The contracts ensure the members will have continuous protection during the life of the contracts. QBE assumes full underwriting risk associated with the contracts and we are compensated on a commission basis. As of December 31, 2017, we had approximately 68,000 contracts in force underwritten by QBE.
Emergency roadside assistance: We offer roadside assistance for RVs, autos and motorcycles. Our roadside assistance services include towing, jump start, tire change, mobile mechanic and other services. Membership prices range from $70 to $160 per year depending on coverage, with our Good Sam Club members receiving a discount. We contract with Signature’s Nationwide Motor Club, Inc. to handle dispatch calls through its network of tow providers and we pay a fee per incident or call. As of December 31, 2017, we had approximately 643,000 members in our emergency roadside assistance plan.
Property and casualty insurance programs: We provide third-party auto, RV, motorcycle and boat specialty insurance and home insurance through arrangements with underwriters, including National General, Progressive, Nationwide and Safeco. For the year ended December 31, 2017, we sold, through third-party insurance providers, insurance policies with an aggregate net written premium of $241 million. We do not share the underwriting risk of the insurance programs and we receive a marketing fee based on the amount of premium paid to the insurance providers.
12
Membership clubs: We operate two membership clubs: The Good Sam Club and the Coast to Coast Club. The Good Sam Club members enjoy savings on purchases at Camping World retail locations, discounts on nightly rates at affiliated Good Sam RV parks and other benefits related to the RV lifestyle. We believe the Good Sam Club is the largest RV enthusiast organization in the world. The Coast to Coast Club provides access to, and savings at, private membership campgrounds and other travel related benefits. As of December 31, 2017, we had approximately 1.8 million members across our two clubs.
Vehicle financing and refinancing: We market third-party financing and refinancing solutions for new and used RVs and boats through an arrangement with Essex Credit, a Division of Bank of the West. Essex Credit provides the financing and assumes full underwriting and credit risk, and we receive a marketing fee based on the referred business.
Travel protection: We contract with On Call International to offer travel protection plans through Good Sam TravelAssist, where On Call International primarily assumes the underwriting risk through third-party underwriters. The plans provide 24/7 coverage for emergency medical evacuation, return-home services, emergency medical monitoring, as well as other travel assistance services. Prices range from $60 to $170 per policy per year depending on coverage. As of December 31, 2017, we had approximately 197,000 contracts in force primarily underwritten by On Call International’s underwriter, Inter Hannover.
Co-branded credit cards: We contract with Visa and Comenity Capital Bank to offer a Good Sam | Camping World Visa® branded credit card. Cardholders receive enhanced rewards points, which are referred to as REC rewards, for money spent at our retail locations, on our e-commerce platforms and at private campgrounds across the U.S. and Canada. As of December 31, 2017, we had approximately 153,000 issued and open co-branded credit card accounts.
Consumer activities and resources:
|
· |
Membership events and chapters: Our Good Sam Club collaborates with parks and campgrounds across the country to organize numerous events for its members. In addition, we have approximately 1,200 Good Sam Chapters across North America, which comprise smaller groups of members within the Good Sam Club that share common interests. Chapters hold campouts, plan social events and organize community volunteer opportunities. In 2017, our Good Sam Club and Chapters hosted 80 events, which provide the social interaction associated with the RV lifestyle. |
|
· |
Consumer shows: During 2017, we promoted and operated 23 separate consumer shows in 17 different cities across 11 different states. The primary focus of these consumer shows is to promote the RV lifestyle with the sales of new RVs, accessories and destination options. During 2017, the shows attracted in excess of 262,000 participants in total. Our consumer show division acquired three new shows in two cities in two states in the second quarter of 2017. These shows provide a strategic opportunity to expose first time buyers and existing RV enthusiasts to our products and services. To encourage participation by our Good Sam Club members, we offer members a 50% discount on admission fees. |
|
· |
Trip planning, travel directories and campground / fuel discount programs: We help RV enthusiasts with trip planning in a variety of ways. On our Good Sam website, www.goodsam.com, and through our printed travel and campground directory, Good Sam RV Travel and Savings Guide, RV enthusiasts can plan trips by, among other things, searching campgrounds based on destination or particular needs and reading reviews. Good Sam Club members can search for parks that offer the Good Sam Club discount. Our fuel discount program, Good Sam Club Swipe & Save, enables our members to purchase gas, diesel and propane at discounted prices. Currently, members enjoy a 5 cent discount per gallon of gas and diesel at select service stations. |
|
· |
Consumer magazines: We produce Trailer Life and MotorHome, two monthly consumer publications with an average monthly circulation in 2017 of 308,200 and 182,200, respectively. Both publications are produced in print and digitally and cater to the RV enthusiasts. Each |
13
publication is well recognized in the industry, with Trailer Life having celebrated its 75th anniversary in June 2016. In addition, we produce an annual RV Buyers Guide, which is sold on newsstands and distributed at most consumer shows free with the purchase of admission. |
|
· |
E-commerce and social media: We use digital media extensively to market, sell and communicate with our customers and members. Each of our businesses has a distinct Web presence where consumers can learn about the services we provide, get rate quotes (as applicable), make purchases and interact with us on an ongoing basis. We make use of cross-selling and on-site marketing to present additional products to consumers as they visit our websites and transact business with us. We are active on social media, including Facebook, to support and promote the RV lifestyle, to engage with our customers and to reach potential new customers on an ongoing basis. |
|
· |
Contact centers and technical hotline: We continue to operate two multi-channel, full-service contact centers with over 230 seats in total. RV enthusiasts call, email, internet chat and use social media to contact us regarding products, consumer services and protection plans, concerns and anything else related to the RV lifestyle. For the year ended December 31, 2017, these contact centers handled over 2.2 million calls and responded to over 350,000 emails and social media contacts. With the Gander/Overton’s acquisition, we added a third contact center in Greenville, North Carolina. This contact center has 100+ seats and will be able to handle over 500,000 inbound calls annually from outdoor enthusiasts for Gander Outdoors and Overton’s products and services. Our multiple contact center strategy gives us the opportunity to establish redundant systems and cross training. This provides back up in the event of a natural disaster, power outages or weather issues that can affect any individual location, and allows calls to be routed to another contact center to ensure our customer experience stays at a high level. |
|
· |
Hosted online forums: RV.net, an internet based hosted forum, experienced approximately 6.6 million visitor sessions in 2017. With volunteer moderators ensuring a positive user experience, RV owners use RV.net to share information about the RV lifestyle, for assistance with “do it yourself” projects and to otherwise discuss all matters associated with RVing. |
Camping World Offerings
New and Used Vehicles
New Vehicles: We offer a comprehensive selection of new RVs across a range of price points, classes and floor plans, from entry level travel trailers to Class A diesel pushers, at our retail locations and on our e-commerce platform. We have formed strategic alliances with leading RV manufacturers, including Thor Industries, Inc., Forest River, Inc., and Winnebago Industries, Inc. The table below sets forth certain information on our primary offerings for the year ended December 31, 2017.
14

Used Vehicles: We sell a comprehensive selection of used RVs at our retail locations, including the vehicle types listed in the table above. The primary source of used RVs is through trade-ins at the time of the sale of new and used RVs. Used RVs are generally reconditioned in our service departments prior to sale. Used RVs that do not meet our standards for retail sale are typically sold at wholesale auctions.
For the year ended December 31, 2017, we sold approximately 66,800 new and 30,300 used vehicles at our retail locations and through our e-commerce platforms.
Parts, Services and Other
Repair and Maintenance: We offer repair and maintenance services at our 140 retail locations nationwide as of December 31, 2017 and perform warranty repairs for RVs. With over 1,500 RV technicians, we are equipped to offer comprehensive repair and maintenance services for most RV components.
Installation of parts and accessories: Our full-service repair facilities enable us to install all parts and accessories that we sell in our retail locations, including, among other items, towing and hitching products, satellite systems, braking systems, leveling systems and appliances. While other RV dealerships may be able to install RV parts and accessories and other retailers may be able to sell certain parts and accessories, our ability to both sell and install necessary parts and accessories affords us a competitive advantage over online retailers and big box retailers that do not have service centers designed to accommodate RVs and over RV dealerships that do not offer a comprehensive inventory of parts and accessories.
Collision repair: We offer collision repair services at most of our service centers, and over 30% of our service facilities are equipped with full body paint booths. Our facilities are equipped to offer a wide selection of collision repair services, including fiberglass front and rear cap replacement, windshield replacement, interior remodel solutions and paint work. We perform collision repair services for a wide array of insurance carriers, including Progressive, National General and Nationwide.
OEM and aftermarket parts and accessories: Through our retail stores and e-commerce platform, we offer a comprehensive range of original and aftermarket RV parts, accessories and supplies, including towing and hitching, satellite and GPS systems, appliances and furniture, leveling systems, braking systems, generators and electrical products, supplies and other products necessary or desirable for the RV enthusiast and RV lifestyle.
Dealership Finance and Insurance
Vehicle financing: Through arrangements with third-party lenders, such as Bank of America, Bank of the West, US Bank, Ally Bank and M&T Bank, and other regional and local banks and credit unions, we are
15
able to provide financing for most new and used RVs we sell through our retail locations. Generally, our financing transactions are structured through long-term retail installment sales contracts (with terms of up to 20 years), which we enter into with our customers on behalf of our third-party lenders, which have provided initial, non-binding approval to assume our position as creditor. The retail installment sales contracts are assigned on a non-recourse basis, with the third-party lender assuming underwriting and credit risk. In 2017, we arranged financing transactions for approximately 71% of our total annual number of new and used units sold.
Protection Plans: We offer and sell a variety of protection plans and services to the purchasers of our RVs as part of the delivery process, including, among others, our Good Sam branded extended vehicle service contracts, emergency roadside assistance and travel assist plans, and gap, wheel, tire and fabric protection plans. These products are primarily underwritten and administered by independent third parties, and we are primarily compensated on a commission basis.
Customers and Markets
The estimated number of U.S. households that own an RV is approximately 9 million, which we believe has grown consistently over the past 20 years, including during the last economic downturn. We have approximately 3.6 million Active Customers throughout our RV product lines, and aim to market and sell our services, protection plans, products and resources to the growing number of new market entrants.
The recreational vehicle industry is characterized by RV enthusiasts’ investment in, and steadfast commitment to, the RV lifestyle. Owners spend on insurance, extended service contracts, roadside assistance and regular maintenance in order to protect and maintain their RV. They typically invest in new accessories and the necessary installation costs as they upgrade their RV. They also spend on services and resources as they plan, engage in, and return from their road trips. Furthermore, based on industry research and management’s estimates, we believe that RV owners typically trade-in to buy another RV every four to five years.
In 2017, approximately 505,000 new RVs were shipped by manufacturers. Overall, from 2012 to 2017, the number of RV shipments grew by 12% annually. There are two main categories of RVs: motorhomes (motorized units) and towables (units that are towed behind a car, van or pickup). Motorized units include Class C Motorhomes, with prices for new units typically ranging from $57,000 to $92,000, Class A Gas Motorhomes, with prices for new units typically ranging from $75,000 to $114,000, Class A Diesel Motorhomes, with prices for new units typically ranging from $128,000 to $318,000, and Class B Motorhomes, with prices for new units typically ranging from $64,000 to $104,000. Towable units include travel trailers with prices for new units typically ranging from $15,000 to $29,000 and fifth wheel trailers, with prices for new units typically ranging from $35,000 to $63,000. According to data gathered by Statistical Surveys, Inc., which tracks the number of RV registrations in every state except Hawaii and Alaska, from 2011 to 2017, the average annual new unit sales growth of diesel motorhomes, gas motorhomes and towables was 6.8%, 20.2% and 13.2%, respectively. RV manufacturers are now producing more innovative models, such as lightweight towables and smaller, fuel efficient motorhomes. In addition, green technologies, such as solar panels and energy efficient components are appearing on an increasing number of RVs.
Generally, used RVs are sold at a lower price level than comparable new RVs and the sale of used vehicles has historically been more stable through business cycles than the sale of new vehicles.
We believe RV trips remain the least expensive type of vacation and allow RV owners to travel more while spending less. RV trips offer savings on a variety of vacation costs, including, among others, airfare, lodging and dining. While fuel costs are a component of the overall vacation cost, we believe fluctuations in fuel prices are not a significant factor affecting a family’s decision to take RV trips. We believe the average annual mileage use of an RV is between 3,000 miles and 5,000 miles.
The RV owner installed base has benefited positively from the aging and the increased industry penetration of the baby boomer consumer demographic, those aged 52 to 70 years old. In addition to growth from baby boomers, the RVIA estimates the fastest growing RV owner age group includes Generation X consumers, those currently 35 to 54 years old. The U.S. Census Bureau estimates that approximately 83
16
million Americans were of the age 35 to 54 years old in 2016. Furthermore, according to the RV Survey, RV ownership is most concentrated among those 35 to 64 years old and the median age of an RV owner is 48 years old.
In addition to positive age trends, according to the RV Survey, the typical RV customer has, on average, a household income of approximately $75,000. This is approximately 50% higher than the median household income of the broader United States population at the time of the RV survey, according to the U.S. Census Bureau. The higher average income has resulted in a more resilient RV consumer with greater buying power across economic cycles.
Taken together, we believe the savings RVs offer on a variety of vacation costs, an increase in the pool of potential RV customers due to an aging baby boomer demographic, and the increased RV ownership among younger consumers should continue to grow the installed base of RV owners, and will have a positive impact on RV usage.
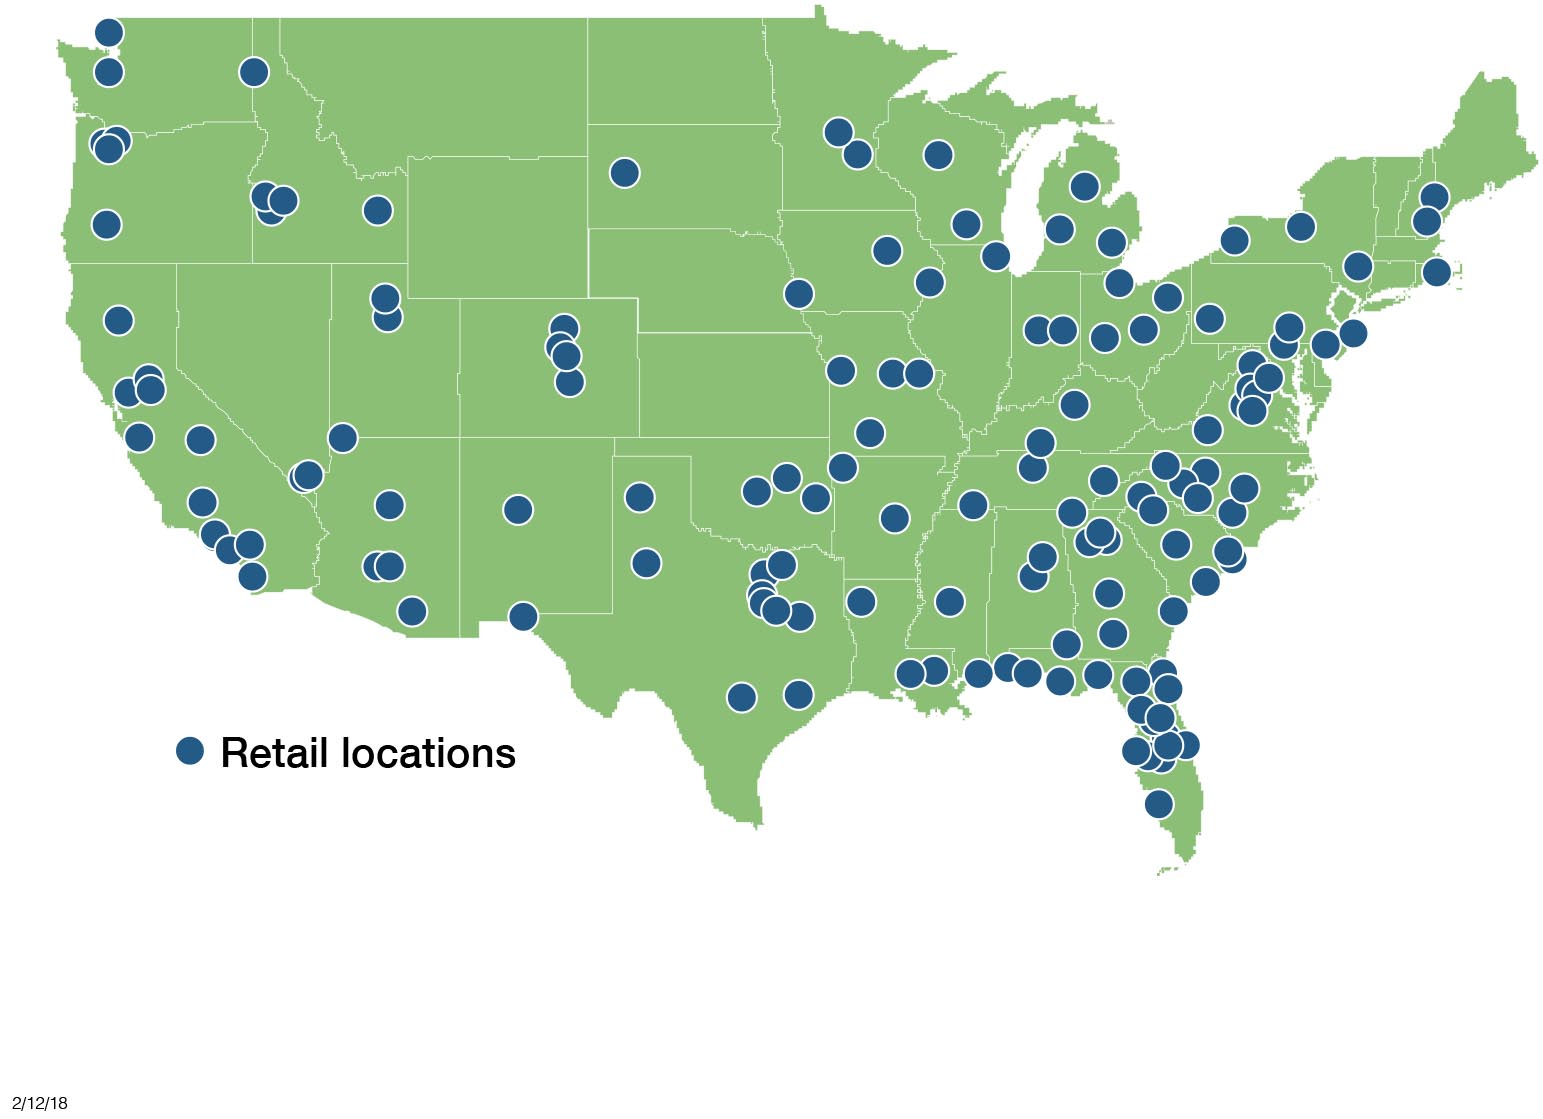
Our Camping World Stores
As of December 31, 2017, we operated 140 Camping World retail locations across 36 states. Our retail locations are strategically located in key RV markets. Generally, our retail locations provide repair and installation services, collision repair, parts, services and accessories for RVs and RV enthusiasts, and 124 of our locations sell new and used RVs. We believe our retail store strategy of offering a comprehensive range of parts, services, accessories, products, and in most instances, new and used RVs, generates powerful cross-selling opportunities. The following map shows our retail location footprint as of December 31, 2017:
Store Design and Layout
We present our broad and deep array of services, protection plans, products and resources in a convenient and engaging atmosphere to meet the everyday needs of RV enthusiasts. Our retail locations generally range in size from approximately 30,000 to 45,000 square feet and are typically situated on approximately eight to 18 acres. Approximately 15% of typical retail location floor space is devoted to a new and used RV sales area; approximately 25% is devoted to the sale of RV parts, services, accessories and products, a customer service area and a technical information counter; approximately 55% is comprised of a service, repair and installation facility, which generally contains 8 to 30 repair, installation and collision bays; and approximately 5% is allocated to office and warehouse space. Large parking areas provide sufficient space to facilitate maneuvering of RVs, and the area devoted to new and used RV inventory typically ranges from five to 12 acres.
17
Our retail locations feature service centers staffed with expert, in-house trained product specialists and are equipped with merchandise demonstrations to assist in educating customers about RV performance products. Our retail locations also provide opportunities to promote a more interactive and consultative selling environment. Our staff is trained to cross-sell and explain the benefits of our breadth of services, protection plans and products to which our customers have become accustomed, such as extended service contracts, emergency roadside assistance products, club memberships, discount camping and travel assistance.
We regularly refresh our retail locations to enhance the customers’ shopping experience and maximize product and service offerings. New products and services are introduced in order to capitalize on the advances of the RV industry and to satisfy our customers’ needs. Store dress, promotional signage and directional signage are also periodically refreshed to further enhance our customers’ shopping experience at our retail locations.
Expansion Opportunities and Site Selection
Our disciplined expansion and acquisition strategy focuses on growing our Active Customer base. We have developed a rigorous and flexible process that employs proprietary data and analytical tools to identify target markets for new store openings and acquisitions. We select sites for new locations or evaluate acquisition opportunities based on criteria such as local demographics, traffic patterns, proximity to RV parks and campgrounds, proximity to major interstates, analytics from our Active Customer database, RV sales and registrations, product availability and availability of attractive acquisition and/or lease terms. Members of our development team spend considerable time evaluating markets and prospective sites. Our prospective sites are typically located on major highways with convenient access and high visibility. Depending on market demographics, our prospective sites generally include eight to 18 acres and accommodate a 30,000 to 45,000 square foot retail footprint and five to 12 acres for RV inventory. Our greenfield locations typically reach profitability within three months. Acquisitions are typically profitable within two full calendar months after an acquisition, with the exception of acquisitions we consider turn-around opportunities, which are typically profitable within two to four months.
As the market leader, with a scalable cost structure, we have an established track record of successful acquisitions. Over the last three years ended December 31, 2017, we have spent over $290 million, net of financing under the floor plan facility (“Floor Plan Facility”), on 18 acquisitions that included 30 retail locations, at multiples of acquired EBITDA in the low to mid-single digit range. We expect most acquisitions to result in cash-on-cash payback periods of under a year, and have designed an identification, assessment, negotiation, acquisition, and closing set of processes and procedures that allow us to move quickly on opportunities.
Store Level Management and Training
Our President of Camping World oversees all retail operations. Our retail locations are each managed by a vice president of operations, each of whom is typically responsible for 13 to 34 retail locations. Depending on the number of retail locations managed by any vice president of operations, the vice president of operations may have one or more market managers responsible for a smaller number of retail locations. Our vice presidents of operations have, on average, 24 years of experience in the RV industry and have been employed by us for 13 years.
Each retail location employs a general manager or a general sales manager (in either case, the “GM”) that has responsibility for the daily operations of the retail location. Areas of responsibility include inventory management, hiring, associate training and development, maintenance of the facilities, customer service and customer satisfaction. A GM’s management team includes a sales manager, a parts and accessories manager, a service manager, and a finance and insurance manager to help oversee the operations of each retail location department. A typical retail location employs approximately 30 to 110 full-time equivalent employees.
We employ a national director of inventory and a centralized inventory management team to oversee our RV inventory and provide consistency and controls in the ordering, purchasing and distribution of RV
18
inventory. We also employ a national director of service, a national director of parts and accessories, and a national director of finance and insurance to assist in the management and training for the respective areas.
We actively seek to improve our ability to assess talent during the interview process and hire talented people and provide extensive training programs and opportunities for our employees, including, among others, new-hire training and orientations, e-learning and training modules, national training directors and certification programs for our RV technicians.
Product Sourcing and Distribution
Sourcing
New and Used RVs
We generally acquire new RVs for retail sale directly from the applicable manufacturer. We have strategic contractual arrangements with leading RV manufacturers, including Thor Industries, Inc., Forest River, Inc., and Winnebago Industries, Inc., with such manufacturers supplying approximately 78%, 12%, and 7%, respectively, of our new RV inventory as of December 31, 2017. According to each such company’s latest Form 10-K, we are the largest customer of Thor Industries, Inc., representing 20% of this suppliers’ latest fiscal year revenue, and the second largest customer of Winnebago Industries, Inc., representing 10% of this suppliers’ latest fiscal year revenue. We maintain a central inventory management and purchasing group to manage and maintain adequate inventory levels and mix. RVs are transported directly from a manufacturer’s facility to our retail locations via a third-party transportation company.
Our strategy is to partner with financially sound manufacturers that make quality products, have adequate manufacturing capacity and distribution, and maintain an appropriate product mix. In certain instances, our manufacturing partners produce private label products exclusively available at our retail locations and through our e-commerce platforms.
Our supply arrangements with manufacturers are typically governed by dealer agreements, which are customary in the RV industry. Our dealer agreements with manufacturers are generally made on a location-by-location basis. The terms of these dealer agreements are typically subject to, among other things, us meeting all the requirements and conditions of the manufacturer’s applicable programs, us maintaining certain minimum inventory requirements and meeting certain retail sales objectives, us performing services and repairs for all owners of the manufacturer’s RVs (regardless from whom the RV was purchased) that are still under warranty and us carrying the manufacturer’s parts and accessories needed to service and repair the manufacturer’s RVs in stock at all times, us actively advertising and promoting the manufacturer’s RVs and us indemnifying the manufacturer under certain circumstances. Our dealer agreements generally designate a specific geographical territory for us, which is often exclusive to us, provided that we are able to meet the material obligations of the applicable dealer agreement. In addition, many of our dealer agreements contain stocking level requirements and certain of our dealer agreements contain contractual provisions concerning minimum advertised product pricing for current model year units. Wholesale pricing is generally established on a model year basis and is subject to change in the manufacturer’s sole discretion. In certain cases, the manufacturer may also establish a suggested retail price, below which we cannot advertise that manufacturer’s RVs.
We generally acquire used RVs from customers, primarily through trade-ins, as well as through auctions and other sources, and we generally recondition used RVs acquired for retail sale in our parts and service departments. Used RVs that we do not sell at our retail locations generally are sold at wholesale prices through auctions.
We finance the purchase of substantially all of our new RV inventory from manufacturers through our Floor Plan Facility. Used vehicles may also be financed from time to time through our Floor Plan Facility. For more information on our Floor Plan Facility, see “Management's Discussion and Analysis of Financial Condition and Results of Operations—Liquidity and Capital Resources—Description of Senior Secured Credit Facilities and Floor Plan Facility” included in Part II, Item 7 of this Form 10-K and Note 3 — Inventories, net
19
and Notes Payable — Floor Plan, net to our audited consolidated financial statements included in Part II, Item 8 of this Form 10-K.
Parts and Accessories
The purchasing activities for our parts and accessories departments are focused on RV maintenance products, outdoor lifestyle products, RV parts and accessories, such as, among others, generators and electrical, satellite receivers and GPS, towing and hitching products and RV appliances, essential supplies and other products and services necessary or desirable for the RV lifestyle. We maintain central purchasing, replenishment and distribution functions to manage inventory planning, allocate merchandise to our retail locations and oversee the replenishment of basic merchandise to our distribution centers. We have no long-term purchase commitments. During the year ended December 31, 2017, we purchased merchandise from approximately 1,300 vendors with no vendor accounting for more than approximately 6% of total merchandise purchased. During the year ended December 31, 2017, approximately 5% of our RV-related merchandise was imported directly from vendors located in foreign countries, with a substantial portion of the imported merchandise being obtained directly from vendors in China. We have established long-standing, continuous relationships with our largest vendors. We believe that the volume of merchandise we purchase from domestic and international suppliers and our ability to buy direct from manufacturers enables us to obtain merchandise at costs which compare favorably to local RV dealers and retailers.
Our merchant team located in Bowling Green, Kentucky currently manages our parts and accessories sourcing. To ensure our product offerings are tailored to local market conditions and demand, our merchant team routinely meets one-on-one with vendors, attends trade shows, reviews trade periodicals and evaluates merchandise offered by other retail and online merchants. We also consistently gather feedback and new product reviews from our store management and employees, as well as from reviews submitted by our customers. We believe this feedback is valuable to our vendor-partners and improves our access to new models and technologies.
Distribution and Fulfillment
We distribute our RV merchandise from three leased distribution and fulfillment centers located in Franklin, Kentucky, Bakersfield, California, and Fort Worth, Texas, which are 250,000, 169,123, and 197,400 square feet, respectively. The three distribution centers support replenishment of parts and accessories for our 140 RV retail locations as of December 31, 2017 and manage the fulfillment of Camping World direct-to-consumer e-commerce and catalog orders. We use common carriers for replenishment of our retail locations and ship merchandise to our e-commerce customers via courier service. An experienced distribution management team leads a staff of approximately 110 full-time distribution center employees.
We distribute our Gander Outdoors, Overton’s and other Outdoor and Active Sports Retail merchandise from three leased and one owned distribution centers in Greenville, South Carolina, Lebanon, Indiana, St. Paul, Minnesota and Skokie, Illinois, which are 496,443, 707,952, 200,348 and 6,000 square feet, respectively. These four distribution centers support replenishment of Gander Outdoors, Overton’s and our other Outdoor and Active Sports Retail merchandise for our retail locations as of December 31, 2017 and manage the fulfillment of our Gander Outdoors, Overton’s and other outdoor and active sports direct-to-consumer e-commerce orders. We use common carriers for replenishment of our retail locations and ship merchandise to our e-commerce customers via courier service. Our experienced distribution management team leads a staff of approximately 160 full-time employees at these distribution centers.
Our distribution centers have scalable systems and processes that we believe can accommodate continued new store growth. We use an Oracle enterprise system to procure inventory, manage online customer and retail demand and fulfill orders through the warehouse management module. Additionally, we have customized an order packing and shipping software package to handle the specific requirements of the e-commerce and retail business. We have the capability to both case pick and item pick, which is designed to ensure our retail locations have sufficient quantities of product while also allowing us to maintain in inventory slow moving but necessary items. This balance allows us to stock the right products at the necessary locations, all at the right time and in the correct quantity.
20
Marketing and Advertising
We market our Good Sam branded offerings through retail point of sale, websites, e-mail, direct mail, inserts, paid search, space advertisements, promotional events, member-get-a-member campaigns, and telemarketing. In 2017, retail point of sale marketing efforts accounted for approximately 72% of new paid enrollments in our Good Sam Club. We generally use our internal proprietary database for marketing and advertising. We have over 15.1 million unique RV contacts in our database and 3.6 million Active Customers.
We market our Camping World brand through the strategic location of our retail stores in high traffic RV areas, in-store promotions, our websites, mail order catalogs, direct mail retail flyers, local TV and radio, RV and outdoor shows, billboards, newspaper, email, paid search, advertisements in national and regional industry publications, vendor co-op advertising programs, promotional events, and personal solicitations and referrals. Camping World’s principal marketing strategy is to capitalize on its broad name recognition among RV owners.
We currently operate an extensive network of RV lifestyle related websites, including www.goodsamclub.com, www.campingworld.com and www.goodsamcamping.com, that experienced more than 95 million visitor sessions in 2017. Our websites feature RV and RV lifestyle associated content, as well as the ability to purchase parts, services and accessories that enhance the RV lifestyle. We believe our network of websites provide RV owners and enthusiasts with the most expansive access to RV related content and e-commerce in the RV industry. Our websites also allow RV owners and enthusiasts to read about the RV lifestyle, make purchases and gather more information about RV parks and other RV-related entities.
In addition to websites, our digital presence includes apps and services that enable current and potential RV owners and enthusiasts to research RVs, read product reviews written by RV experts and other RV owners and enthusiasts, plan RV trips (including mapping routes and planning which RV parks to visit) and purchase thousands of products to support their RV lifestyle. We use various digital tools and services to foster the RV lifestyle and to introduce new and/or future RV owners and enthusiasts to our network of websites and the products and services we offer. Our wide reaching digital presence provides extensive marketing for the products and services we sell, while providing the RV community with access to valuable content and tools to enhance the RV lifestyle.
We also use promotional events as marketing tools. During 2017, we promoted and operated 23 consumer shows in 17 cities across 11 states which are primarily RV, boat, and sport shows. The total audience of RV, Boating, powersports and outdoor recreation enthusiasts who attended our shows during 2017 exceeded 262,000. Our consumer show division acquired three new shows in two cities in two states in the second quarter of 2017. In addition, we have sponsored sporting events such as Major League Baseball, the NASCAR Camping World Truck Series, the NASCAR Sprint Cup Series races, and the College Football Camping World Independence Bowl. Periodically we promote the opening of each new retail location through grand opening celebrations at which we may have special events and discounted prices.
E-Commerce Platform and Digital Strategy
We believe our websites and other digital marketing channels enable us to provide instant, on-demand access to the wide array of content, products and services we offer. Our content, such as RV park descriptions, ratings and user reviews, encourage RV owners and enthusiasts, whether or not current customers or members, to visit our websites.
We use a combination of targeted email, social media and e-newsletters to promote ongoing communication with our customers and members. We believe that by communicating with our customers and members on an ongoing basis, we build affinity and the likelihood of a continued consumer to business relationship.
We believe our websites help attract new customers who may not live near one of our retail locations, who desire to transact business online or who are discovering us for the first time. Additionally, we believe many people who transact at our retail locations visit our websites prior to visiting our retail locations. To
21
attract new customers to our websites we use a combination of online marketing methods, including social media, paid search, search engine optimization and other web-based marketing methods. We test new online marketing methods on an ongoing basis. Once a customer interacts with us online and elects to receive our e-newsletters and/or promotional emails, we offer ongoing email-based content delivery and promotions. We also use customer data to enable cross-selling of complementary products and services.
Our Camping World website works in concert with our retail locations and logistics operations, with orders for stocked inventory shipped from the same distribution centers that support our network of retail locations. We currently offer more than 20,000 products on www.campingworld.com and associated websites, which include products that are not available in our retail locations. To further support sales, we make use of various affiliate relationships, which helps us reach the RV community across a wide array of websites.
We continually invest in our network of websites and point of sale technology. Knowing our customers’ purchasing history provides us with the opportunity to have a greater understanding of the wants and needs of our customers. Our websites enable simplified access to all Good Sam content and services in an integrated fashion through www.goodsam.com. The Camping World website, www.campingworld.com, features access to product search and optimized product presentation, as well as shopping and checkout processes. We invest in our websites on an ongoing basis to continually improve our customers’ experience, and to increase visits and purchases by new and returning customers.
Customer Service
We believe customer service and access to a live person is a critical component of our digital marketing and sales operation. Our sales and customer service centers in Englewood, Colorado, and Bowling Green, Kentucky, are multi-channel, full-service contact centers. RV enthusiasts call, email, internet chat and use social media to contact us regarding products, consumer services and protection plans, concerns and anything else related to the RV lifestyle. RV enthusiasts can also speak with our customer service specialists for help with orders, to receive answers to questions and to make purchases for any product offered through our websites.
Our contact center in Englewood, Colorado is an approximately 230-seat contact center that is over 20,000 square feet. For the year ended December 31, 2017, the Englewood, Colorado contact center handled approximately 2.0 million calls and responded to over 250,000 emails and social media contacts. Our contact center in Bowling Green, Kentucky provides service and support to the Camping World internet and catalog product sales. This contact center also houses a retail support team that handles our retail location overflow calls. For the year ended December 31, 2017, this team handled over 200,000 calls. With the Gander/Overton’s acquisition, we added a third contact center in Greenville, North Carolina. This contact center has 100+ seats and will be able to handle over 500,000 inbound calls annually from Outdoor enthusiasts for Gander Outdoors and Overton’s products and services. Our multiple contact center strategy gives us the opportunity to establish redundant systems and cross training. This provides back up in the event of a natural disaster, power outages or weather issues that can affect any individual location, and allows calls to be routed to another contact center to ensure our customer experience stays at a high level.
Our contact center specialists are extensively trained to assist customers with complex orders and provide a level of service that leads to long-term customer relationships. In addition, our quality assurance team monitors contacts daily and provides the leadership team with tools to maintain sales and service standards. With low turnover, we retain our employees longer than the industry average, which we believe allows our callers to be assisted by experienced contact center agents who are familiar with the RV lifestyle and our services, protection plans and products.
22
Management Information Systems
We utilize sophisticated computer systems to support our operations, including a third-party dealer management system, point-of-sale registers (“POS”), enterprise resource planning system, supply chain management system, CRM, event business management system and marketing database. In addition, we utilize proprietary membership systems and data warehouses to provide analytical views of our data.
To support the applications, we have multiple data centers with advanced servers, storage and networking capabilities. We have a secure wide area network that facilitates communication within and between our offices and provides both voice and data services. Business critical systems are replicated in real time and all systems are protected with on and off site backups.
A database containing all customer activity across our various businesses and programs has been integrated into our websites and contact centers. Comprehensive information on each customer, including a profile of the purchasing activities, is made available to our CRM, POS and marketing database. We utilize information technology and analytics to actively market and sell multiple products and services to our Active Customers, including list segmentation and merge and purge programs, to select prospects for direct mail solicitations and other direct marketing efforts. We employ publishing software for publication makeup, content and advertising to support our publications operations.
Our management information systems and electronic data processing systems consist of an extensive range of retail, mail order, financial and merchandising systems, including purchasing, inventory distribution and logistics, sales reporting, accounts payable and merchandise management. Our POS and dealer management systems report comprehensive data in near real time to our data warehouses, including detailed sales volume, inventory information by product, merchandise transfers and receipts, special orders, supply orders and returns of product purchases to vendors. The registers capture Good Sam Club member numbers and associated sales and references to specific promotional campaigns. In conjunction with its nightly polling, our central computer sends price changes to registers at the point of sale. Management monitors the performance of each retail location and mail order operations to evaluate inventory levels, determine markdowns and analyze gross profit margins by product.
Competition
We face competition in all of our business segments. We believe that the principal competitive factors in our industry are breadth and depth of product selection, value pricing, convenient retail locations, technical services and customer service. Our competitors vary in size and breadth of their product offerings. We compete directly or indirectly with the following types of companies:
|
· |
major national insurance and warranty companies, providers of roadside assistance and providers of extended vehicle service contracts; |
|
· |
other dealers of new and used RVs for sale; |
|
· |
independent, local specialty stores, such as “mom & pops” |
|
· |
other large-format outdoor and active sports goods stores and chains, such as Academy Sports + Outdoors, REI, Bass Pro Shops (including Cabela’s) and Sportsman’s Warehouse; |
|
· |
multi-channel retailers and mass merchandisers, warehouse clubs, discount stores, department stores and online retailers, such as Amazon, Target and Wal-Mart; |
|
· |
other specialty retailers that compete with us across a significant portion of our merchandising categories through retail, catalog or e-commerce businesses, such as Bass Pro Shops (including Cabela’s), Sportsman’s Warehouse and REI; and online retailers. |
23
Additional competitors may enter the businesses in which we currently operate. Moreover, some of our mass merchandising competitors do not currently compete in many of the product categories we offer, but may choose to offer a broader array of competing products in the future.
Trademarks and Other Intellectual Property
We own a variety of registered trademarks and service marks related to our brands and our services, protection plans, products and resources, including Good Sam, Camping World, Gander Outdoors and Overton’s. We also own the copyrights to certain articles in our publications and numerous domain names, including www.goodsamclub.com, www.campingworld.com, www.ganderoutdoors.com, www.overtons.com, www.the-house.com, w82.com, and www.udans.com, among others. We believe that our trademarks and other intellectual property have significant value and are important to our marketing efforts. We do not know of any material pending claims of infringement or other challenges to our right to use our intellectual property in the United States or elsewhere.
Government Regulation
Our operations are subject to varying degrees of federal, state and local regulation, including our RV sales, firearm sales, vehicle financing, outbound telemarketing, direct mail, roadside assistance programs, extended vehicle service contracts and insurance activities. These laws and regulations include consumer protection laws, so-called “lemon laws,” privacy laws, escheatment laws, anti-money laundering laws and other extensive laws and regulations applicable to new and used vehicle dealers, as well as a variety of other laws and regulations. These laws also include federal and state wage and hour, anti-discrimination and other employment practices laws. Furthermore, new laws and regulations, particularly at the federal level, may be enacted that could also affect our business. See “Risk Factors — Risks Related to Our Business — Our business is subject to numerous federal, state and local regulations.” in Item 1A of Part I of this Form 10-K.
Motor Vehicle Laws and Regulations
Our operations are subject to the National Traffic and Motor Vehicle Safety Act, Federal Motor Vehicle Safety Standards promulgated by the United States Department of Transportation and the rules and regulations of various state motor vehicle regulatory agencies. We are also subject to federal and numerous state consumer protection and unfair trade practice laws and regulations relating to the sale, transportation and marketing of motor vehicles, including so-called “lemon laws.” Federal, state and local laws and regulations also impose upon vehicle operators various restrictions on the weight, length and width of motor vehicles that may be operated in certain jurisdictions or on certain roadways. Certain jurisdictions also prohibit the sale of vehicles exceeding length restrictions. Federal and state authorities also have various environmental control standards relating to air, water, noise pollution and hazardous waste generation and disposal.
Our financing activities with customers are subject to federal truth-in-lending, consumer leasing and equal credit opportunity laws and regulations as well as state and local motor vehicle finance laws, leasing laws, installment finance laws, usury laws and other installment sales and leasing laws and regulations, some of which regulate finance and other fees and charges that may be imposed or received in connection with motor vehicle retail installment sales. Claims arising out of actual or alleged violations of law may be asserted against us or our retail locations by individuals, a class of individuals, or governmental entities and may expose us to significant damages or other penalties, including revocation or suspension of our licenses to conduct retail operations and fines.
The Dodd-Frank Act, which was signed into law on July 21, 2010, established the CFPB, an independent federal agency funded by the United States Federal Reserve with broad regulatory powers and limited oversight from the United States Congress. Although automotive dealers are generally excluded, the Dodd-Frank Act could lead to additional, indirect regulation of automotive dealers, in particular, their sale and marketing of finance and insurance products, through its regulation of automotive finance companies and other financial institutions. In March 2013, the CFPB issued supervisory guidance highlighting its concern that the practice of automotive dealers being compensated for arranging customer financing through discretionary markup of wholesale rates offered by financial institutions (“dealer markup”) results in a significant risk of
24
pricing disparity in violation of the ECOA. The CFPB recommended that financial institutions under its jurisdiction take steps to address compliance with the ECOA, which may include imposing controls on dealer markup, monitoring and addressing the effects of dealer markup policies, and eliminating dealer discretion to markup buy rates and fairly compensating dealers using a different mechanism that does not result in disparate impact to certain groups of consumers.
Firearms Laws and Regulations
Regulation and Legislation
Because we sell firearms at certain of our retail stores, we are subject to regulation by the Bureau of Alcohol, Tobacco, Firearms and Explosives (the “ATF”). Each applicable store has a federal firearms license permitting the sale of firearms, and our applicable distribution centers have obtained federal firearms licenses to store and distribute firearms. Certain states require a state license to sell firearms, and we have obtained these licenses for the states in which we operate that have such a requirement.
We must comply with federal, state and local laws and regulations, including the National Firearms Act of 1934 (the “NFA”), and the Gun Control Act of 1968 (the “GCA”), all of which have been amended from time to time. The NFA and the GCA require our business to, among other things, maintain federal firearms licenses for our applicable locations and perform a pre-transfer background check in connection with all firearms purchases. We perform this background check using either the FBI-managed National Instant Criminal Background Check System (“NICS”) or, if required by state law, state government-managed system that relies on NICS and any additional information collected by the state. These background check systems either confirm that a transfer can be made, deny the transfer or require that the transfer be delayed for further review, and provide us with a transaction number for the proposed transfer. We are required to record the transaction number on an ATF Form 4473 and retain this form in our records for auditing purposes for 20 years for each approved transfer and five years for each denied or delayed transaction.
The federal categories of prohibited purchasers are the prevailing minimum for all states. States (and, in some cases, local governments) on occasion enact laws that further restrict permissible purchasers of firearms. We are also subject to numerous other federal, state and local laws and regulations regarding firearm sale procedures, record keeping, inspection and reporting, including adhering to minimum age restrictions regarding the purchase or possession of firearms or ammunition, residency requirements, applicable waiting periods, importation regulations and regulations pertaining to the shipment and transportation of firearms.
Over the past several years, bills have been introduced in the United States Congress that would restrict or prohibit the manufacture, transfer, importation or sale of certain calibers of handgun ammunition, impose a tax and import controls on bullets designed to penetrate bullet-proof vests, impose a special occupational tax and registration requirements on manufacturers of handgun ammunition and increase the tax on handgun ammunition in certain calibers. Recently, Congress has debated certain gun control measures that were supported by the prior administration.
In September 2004, Congress declined to renew the Assault Weapons Ban of 1994 (“AWB”), which prohibited the manufacture of certain firearms defined as “assault weapons” restricted the sale or possession of “assault weapons,” except those that were manufactured prior to the law’s enactment; and placed restrictions on the sale of new high capacity ammunition feeding devices. Various states and local jurisdictions, including Colorado, Maryland and New York, (states in which we operate or plan to operate applicable stores), have adopted their own versions of the AWB or high capacity ammunition feeding device restrictions, some of which restrictions apply to the products we sell in other states. If a statute similar to the AWB were to be enacted or re-enacted at the federal level, it would impact our ability to sell certain products. Additionally, state and local governments have proposed laws and regulations that, if enacted, would place additional restrictions on the manufacture, transfer, sale, purchase, possession and use of firearms, ammunition and shooting-related products. For example, several states, such as Colorado, Connecticut, Maryland, New Jersey, New York, and Washington have enacted laws and regulations that are more restrictive than federal laws and regulations that limit access to and sale of certain firearms. Additionally, Connecticut and New York impose mandatory screening of ammunition purchases; California and the District
25
of Columbia have requirements for microstamping (that is, engraving the handgun’s serial number on each cartridge) of new handguns; and some states prohibit the sale of guns without internal or external locking mechanisms. Other state or local governmental entities may also explore similar legislative or regulatory initiatives that may further restrict the manufacture, sale, purchase, possession or use of firearms, ammunition and shooting-related products.
The Protection of Lawful Commerce in Arms Act, which became effective in October 2005, prohibits civil liability actions from being brought or continued in any federal or state court against federally licensed manufacturers, distributors, dealers or importers of firearms or ammunition for damages, punitive damages, injunctive or declaratory relief, abatement, restitution, fines, penalties or other relief resulting from the criminal or unlawful misuse of a qualified product by third parties. The legislation does not preclude traditional product liability actions.
We are also subject to a variety of federal, state and local laws and regulations relating to, among other things, protection of the environment, human health and safety, advertising, pricing, weights and measures, product safety, and other matters. Some of these laws affect or restrict the manner in which we can sell certain items, such as handguns, smokeless powder, black powder substitutes, ammunition, bows, knives and other products. We believe that we are in substantial compliance with the terms of such laws and that we have no liabilities under such laws that we expect could have a material adverse effect on our business, results of operations or financial condition.
Compliance
We are routinely inspected by the ATF and various state agencies to ensure compliance with federal and local regulations with regards to the manufacture, transfer, importation or sale of firearms and related products. While we view such inspections as a starting point, we employ more thorough internal compliance inspections to help ensure we are in compliance with all applicable laws. We dedicate significant resources to ensure compliance with applicable federal, state and local regulations, including to in-store training and other training materials such as learning management system training modules, training manuals, and standard operating procedures. Our compliance department conducts random internal audits which modeled after those conducted by ATF inspectors. Our staff at retail locations are required to adhere to compliance direction from training materials. We utilize a database and application program to track acquisitions and dispositions of serialized inventory that are designed to meet all federal standards. Additionally, we use an internet-enabled application to assist in completing the federally required records and background checks for firearms.
We are also subject to a variety of state laws and regulations relating to, among other things, advertising and product restrictions, some of which prohibit or limit the sale, in certain states and locations, of certain items, such as black powder firearms, ammunition, bows, knives, and similar products. Our compliance department administers various restriction codes and other software tools to prevent the sale of such jurisdictionally restricted items.
Insurance Laws and Regulations
As a marketer of insurance programs, we are subject to state rules and regulations governing the business of insurance including, without limitation, laws governing the administration, underwriting, marketing, solicitation and/or sale of insurance programs. The insurance carriers that underwrite the programs that we sell are required to file their rates for approval by state regulators. Additionally, certain state laws and regulations govern the form and content of certain disclosures that must be made in connection with the sale, advertising or offer of any insurance program to a consumer. We review all marketing materials we disseminate to the public for compliance with applicable insurance regulations. We are required to maintain certain licenses and approvals in order to market insurance programs.
Marketing Laws and Regulations
The Federal Trade Commission (the “FTC”) and each of the states have enacted consumer protection statutes designed to ensure that consumers are protected from unfair and deceptive marketing
26
practices. We review all of our marketing materials for compliance with applicable FTC regulations and state marketing laws.
Our e-commerce business is subject to the Mail or Telephone Order Merchandise Rule and related regulations promulgated by the FTC which affect our catalog mail order operations. FTC regulations, in general, govern the solicitation of orders, the information provided to prospective customers, and the timeliness of shipments and refunds. In addition, the FTC has established guidelines for advertising and labeling many of the products we sell.
In 2003, the FTC amended its Telemarketing Sales Rule to establish a National “Do Not Call” Registry. As of September 2016, the “Do Not Call” Registry included approximately 226 million phone numbers. To comply with the rule, companies are required to match their call lists against the “Do Not Call” Registry prior to conducting outbound telemarketing and remove the names of consumers who have requested they not be called. In addition, the amended Telemarketing Sales Rule requires additional disclosures and sales practices for goods and services sold over the phone. We match our call lists with the “Do Not Call Registry” and implement telemarketing scripts to comply with this regulation.
On December 29, 2010, federal legislation entitled the “Restore Online Shoppers’ Confidence Act” was enacted (“ROSCA”). The legislation prohibits the acquisition of consumers’ credit or debit card account numbers automatically from our partners when a consumer enrolls in one of our programs immediately after making a purchase through one of our partners’ websites and requires additional disclosure relating to the online marketing of, and billing for, membership programs in the online post-transaction environment. We have put procedures in place to address compliance with ROSCA.
Effective October 2011, Florida passed legislation similar to ROSCA, but with some additional requirements, and effective January 2012, Oregon passed legislation regulating free trial offers. The Florida law, like ROSCA, requires that an online post-transaction third-party seller must obtain the express informed consent of the consumer to the sale by obtaining from the consumer the full account number of the account to be charged. The Florida law also requires that online post-transaction third-party sellers must send a written notice confirming the transaction to the consumer by first class U.S. mail or by email. The Oregon legislation prohibits a person from causing a consumer to incur a financial obligation as a result of accepting a free offer unless the person obtains the consumer’s billing information directly from the consumer. We have put procedures in place to address compliance with these laws.
In addition to the discussion of the Dodd-Frank Act above in connection with our automotive activities, see “— Motor Vehicle Laws and Regulations,” we are also subject to Dodd-Frank Act in connection with our various marketing efforts.
Environmental, Health and Safety Laws and Regulations
Our operations involve the use, handling, storage and contracting for recycling and/or disposal of materials such as motor oil and filters, transmission fluids, antifreeze, refrigerants, paints, thinners, batteries, cleaning products, lubricants, degreasing agents, tires and propane. Consequently, our business is subject to a complex variety of federal, state and local requirements that regulate the environment and public health and safety.
Most of our retail locations utilize aboveground storage tanks, and to a lesser extent underground storage tanks, primarily for petroleum-based products. Storage tanks are subject to periodic testing, containment, upgrading and removal requirements under the Resource Conservation and Recovery Act and its state law counterparts. Clean-up or other remedial action may be necessary in the event of leaks or other discharges from storage tanks or other sources. In addition, water quality protection programs under the federal Water Pollution Control Act (commonly known as the Clean Water Act), the Safe Drinking Water Act and comparable state and local programs govern certain discharges from some of our operations. Similarly, air emissions from our operations, such as RV painting, are subject to the federal Clean Air Act and related state and local laws. Certain health and safety standards promulgated by the Occupational Safety and Health Administration of the United States Department of Labor and related state agencies also apply.
27
Although we incur costs to comply with applicable environmental, health and safety laws and regulations in the ordinary course of our business, we do not presently anticipate that such costs will have a material adverse effect on our business, financial condition or results of operations. We do not have any material known environmental commitments or contingencies.
Insurance
We use a combination of insurance and self-insurance plans to provide for the potential liabilities for workers’ compensation, product liability, general liability, business interruption, property insurance, director and officers’ liability insurance, environmental, vehicle liability and employee health care benefits. Liabilities associated with the risks that are retained by us are estimated, in part, by considering historical claims experience, demographic factors, severity factors and other actuarial assumptions. Where we have retained risk through self-insurance or similar arrangements, we utilize third-party actuarial firms to assist management in assessing the financial impact of risk retention. Our results could be adversely affected by claims and other expenses related to such plans and policies if future occurrences and claims differ from these assumptions and historical trends.
Employees
As of December 31, 2017, we had 9,877 full-time and 699 part-time or seasonal employees. None of our employees are represented by a labor union or are party to a collective bargaining agreement, and we have had no labor-related work stoppages. We believe that our employee relations are good.
Seasonality
We have experienced, and expect to continue to experience, variability in revenues and net income as a result of annual seasonality in our business. Because RVs are used primarily by vacationers and campers, demand for services, protection plans, products and resources generally declines during the winter season, while sales and profits are generally highest during the spring and summer months. Conversely, we expect demand for non-RV-related outdoor and active sports products to generally decline during the first and second fiscal quarters and we expect sales and profits to generally be higher in the third and fourth fiscal quarters. In addition, unusually severe weather conditions in some geographic areas may impact demand. On average over the last three years ended December 31, 2017, we generated 30.4% and 28.9% of our annual revenues in the second and third fiscal quarters, respectively, which include the spring and summer months. Additionally, the average quarterly revenue percentage generated over the last three years ended December 31, 2017 from our Consumer Services and Plans segment was 25.1%, 24.5%, 23.9% and 26.5% for the first, second, third and fourth quarters, respectively, and the average quarterly revenue percentage generated over the last three years ended December 31, 2017 from our Retail segment was 21.2%, 30.4%, 28.9% and 19.5% for the first, second, third and fourth quarters, respectively. We have historically incurred additional expenses in the second and third fiscal quarters due to higher purchase volumes, increased staffing in our retail locations and program costs. For further discussion, see “Management’s Discussion and Analysis of Financial Condition and Results of Operations — Seasonality” in Item 7 of Part II of this Form 10-K.
Our Corporate Information
We were incorporated in the State of Delaware in 2016. Our principal executive offices are located at 250 Parkway Drive, Suite 270, Lincolnshire, IL 60069 and our telephone number is (847) 808 3000. We make available the following public filings with the Securities and Exchange Commission (the “SEC”) free of charge through our website at www.campingworld.com in the “Investor Relations” section under “Financial Info” as soon as reasonably practicable after we electronically file such material with, or furnish such material to, the SEC:
• our Annual Reports on Form 10-K and any amendments thereto;
• our Quarterly Reports on Form 10-Q and any amendments thereto; and
• our Current Reports on Form 8-K and any amendments thereto.
28
The information contained in, or accessible through, our website does not constitute a part of this annual report on Form 10-K. Any materials we file with the SEC are available at the SEC’s Public Reference Room at 100 F Street, NE, Washington, DC 20549. Additional information about the operation of the Public Reference Room can also be obtained by calling the SEC at 1-800-SEC-0330. In addition, the SEC maintains a web site at www.sec.gov that contains reports, proxy and information statements, and other information regarding issuers that file electronically with the SEC, including us.
RISK FACTORS
Investing in our common stock involves a high degree of risk. You should consider carefully the risks and uncertainties described below, together with the other information included in this Form 10-K. The occurrence of any of the following risks may materially and adversely affect our business, financial condition, results of operations and future prospects. In these circumstances, the market price of our Class A common stock could decline. Other events that we do not currently anticipate or that we currently deem immaterial may also affect our business, prospects, financial condition and results of operations.
Risks Related to Our Business
Our business is affected by the availability of financing to us and our customers.
Our business is affected by the availability of financing to us and our customers. Generally, RV dealers, including us, finance their purchases of inventory with financing provided by lending institutions. As of December 31, 2017, we had up to $1.415 billion in maximum borrowing capacity under the Floor Plan Facility of which $974.0 million was outstanding and, after deducting $77.1 million for approved purchases that were in process at the manufacturers and $31.3 million of borrowings included in accounts payable for sold inventory, the available line for future inventory purchases as of December 31, 2017 was $226.4 million. The Floor Plan Facility also provides a $35.0 million revolving line of credit. No borrowings were outstanding under the revolving line of credit as of December 31, 2017. As of December 31, 2017, approximately 89.0% of the invoice cost of new RV inventory and no used RV inventory was financed under the Floor Plan Facility. A decrease in the availability of this type of wholesale financing or an increase in the cost of such wholesale financing could prevent us from carrying adequate levels of inventory, which may limit product offerings and could lead to reduced sales and revenues.
Furthermore, many of our customers finance their RV purchases. Although consumer credit markets have improved, consumer credit market conditions continue to influence demand, especially for RVs, and may continue to do so. There continue to be fewer lenders, more stringent underwriting and loan approval criteria, and greater down payment requirements than in the past. If credit conditions or the credit worthiness of our customers worsen, and adversely affect the ability of consumers to finance potential purchases at acceptable terms and interest rates, it could result in a decrease in the sales of our products and have a material adverse effect on our business, financial condition and results of operations.
Fuel shortages, or high prices for fuel, could have a negative effect on our business.
Gasoline or diesel fuel is required for the operation of RVs. There can be no assurance that the supply of these petroleum products will continue uninterrupted, that rationing will not be imposed or that the price of or tax on these petroleum products will not significantly increase in the future. Shortages of gasoline and diesel fuel have had a material adverse effect on the RV industry as a whole in the past and any such shortages or substantial increases in the price of fuel could have a material adverse effect on our business, financial condition or results of operations.
29
Our success depends to a significant extent on the well‑being, as well as the continued popularity and reputation for quality, of our manufacturers, particularly Thor Industries, Inc., Forest River, Inc., and Winnebago Industries, Inc.
Thor Industries, Inc., Forest River, Inc., and Winnebago Industries, Inc. supplied approximately 77.8%, 11.9%, and 6.7%, respectively, of our new RV inventory as of December 31, 2017. We depend on our manufacturers to provide us with products that compare favorably with competing products in terms of quality, performance, safety and advanced features. Any adverse change in the production efficiency, product development efforts, technological advancement, marketplace acceptance, reputation, marketing capabilities or financial condition of our manufacturers, particularly Thor Industries, Inc., Forest River, Inc., and Winnebago Industries, Inc., could have a substantial adverse impact on our business. Any difficulties encountered by any of our manufacturers, particularly Thor Industries, Inc., Forest River, Inc., and Winnebago Industries, Inc., resulting from economic, financial, or other factors could adversely affect the quality and amount of products that they are able to supply to us and the services and support they provide to us.
The interruption or discontinuance of the operations of Thor Industries, Inc., Forest River, Inc., and Winnebago Industries, Inc. or other manufacturers could cause us to experience shortfalls, disruptions, or delays with respect to needed inventory. Although we believe that adequate alternate sources would be available that could replace any manufacturer as a product source, those alternate sources may not be available at the time of any interruption, and alternative products may not be available at comparable quality and prices.
Our supply arrangements with manufacturers are typically governed by dealer agreements, which are customary in the RV industry. Our dealer agreements with manufacturers are generally made on a location‑by‑location basis, and each retail location typically enters into multiple dealer agreements with multiple manufacturers. Our dealer agreements also generally provide for a one‑year term, which is typically renewed annually. The terms of our dealer agreements are typically subject to:
|
· |
us meeting all the requirements and conditions of the manufacturer’s applicable programs; |
|
· |
us maintaining certain minimum inventory requirements and meeting certain retail sales objectives; |
|
· |
us performing services and repairs for all owners of the manufacturer’s RVs (regardless from whom the RV was purchased) that are still under warranty and us carrying the manufacturer’s parts and accessories needed to service and repair the manufacturer’s RVs in stock at all times; |
|
· |
us actively advertising and promoting the manufacturer’s RVs; and |
|
· |
us indemnifying the manufacturer under certain circumstances. |
Our dealer agreements generally designate a specific geographical territory for us, which is often exclusive to us, provided that we are able to meet the material obligations of the applicable dealer agreement.
In addition, many of our dealer agreements contain stocking level requirements and certain of our dealer agreements contain contractual provisions concerning minimum advertised product pricing for current model year units. Wholesale pricing is generally established on a model year basis and is subject to change in the manufacturer’s sole discretion. In certain cases, the manufacturer may also establish a suggested retail price, below which we cannot advertise that manufacturer’s RVs. Any change, non‑renewal, unfavorable renegotiation or termination of these arrangements for any reason could adversely affect product availability and cost and our financial performance.
30
Our business model is impacted by general economic conditions in our markets, and ongoing economic and financial uncertainties may cause a decline in consumer spending that may adversely affect our business, financial condition and results of operations.
As a business that relies on consumer discretionary spending, we may be adversely affected if our customers reduce, delay or forego their purchases of our services, protection plans, products and resources as a result of:
|
· |
job losses; |
|
· |
bankruptcies; |
|
· |
higher consumer debt and interest rates; |
|
· |
reduced access to credit; |
|
· |
higher energy and fuel costs; |
|
· |
relative or perceived cost, availability and comfort of RV use versus other modes of travel, such as air travel and rail; |
|
· |
falling home prices; |
|
· |
lower consumer confidence; |
|
· |
uncertainty or changes in tax policies and tax rates; or |
|
· |
uncertainty due to national or international security concerns. |
We also rely on our retail locations to attract and retain customers and to build our customer database. If we close retail locations or are unable to open or acquire new retail locations due to general economic conditions or otherwise, our ability to maintain and grow our customer database and our Active Customers will be limited, which could have a material adverse effect on our business, financial condition and results of operation.
Decreases in Active Customers, average spend per customer or retention and renewal rates for our consumer services and plans would negatively affect our financial performance, and a prolonged period of depressed consumer spending could have a material adverse effect on our business. Promotional activities and decreased demand for consumer products could also affect our profitability and margins. In addition, adverse economic conditions may result in an increase in our operating expenses due to, among other things, higher costs of labor, energy, equipment and facilities. Due to recent fluctuations in the U.S. economy, our sales, operating and financial results for a particular period are difficult to predict, making it difficult to forecast results for future periods. Additionally, we are subject to economic fluctuations in local markets that may not reflect the economic conditions of the U.S. economy. Any of the foregoing factors could have a material adverse effect on our business, financial condition and results of operations.
In addition, the success of our recurring Good Sam consumer services and plans depends, in part, on our customers’ use of certain RV sites and/or the purchase of services, protection plans, products and resources through participating merchants. If general economic conditions worsen, our customers may perceive that they have less disposable income for leisure activities or they may not be able to obtain credit for discretionary purchases. As a result, they may travel less frequently, spend less when they travel and purchase and utilize our services, protection plans, products and resources less often, if at all, which could have a material adverse effect on our business, financial condition and results of operations. Furthermore, if we face increased competition from other businesses with similar product and service offerings, we may need to respond by establishing pricing, marketing and other programs or by seeking out additional strategic alliances or acquisitions that may be less favorable to us than we could otherwise establish or obtain in more
31
favorable economic environments. In addition, declines in the national economy could cause merchants who participate in our programs to go out of business. It is likely that, should the number of merchants entering bankruptcy rise, the number of uncollectible accounts would also rise. These factors could have a material adverse effect on our business, financial condition and results of operations.
We depend on our ability to attract and retain customers.
Our future success depends in large part upon our ability to attract and retain Active Customers for our services, protection plans, products and resources. The extent to which we achieve growth in our customer base and sustain high renewal rates of our recurring consumer services and plans materially influences our profitability. Any number of factors could affect our ability to grow our customer base and sustain high renewal rates of our recurring consumer services and plans. These factors include consumer preferences, the frequency with which customers utilize our services, protection plans, products and resources, general economic conditions, our ability to maintain our retail locations, weather conditions, the availability of alternative services, protection plans, products and resources, significant increases in gasoline prices, the disposable income of consumers available for discretionary expenditures and the external perception of our brands. Any significant decline in our customer base, the growth of our customer base or the usage of our services, protection plans, products or resources by our customers, including the renewal rates of our recurring consumer services and plans, could have a material adverse effect on our business, financial condition and results of operations.
Competition in the market for services, protection plans, products and resources targeting the RV lifestyle or RV enthusiast could reduce our revenues and profitability.
The markets for services, protection plans, products and resources targeting RV, outdoor and active sports enthusiasts are highly fragmented and competitive. Major competitive factors that drive the RV, outdoor and active sports markets are price, product and service features, technology, performance, reliability, quality, availability, variety, delivery and customer service. We compete directly or indirectly with the following types of companies:
|
· |
major national insurance and warranty companies, providers of roadside assistance and providers of extended service contracts; |
|
· |
other dealers of new and used RVs; |
|
· |
independent, local specialty stores, such as “mom & pops” |
|
· |
other large-format outdoor and active sports goods stores and chains, such as Academy Sports + Outdoors, REI, Bass Pro Shops (including Cabela’s) and Sportsman’s Warehouse; |
|
· |
multi-channel retailers and mass merchandisers, warehouse clubs, discount stores, department stores and online retailers, such as Amazon, Target and Wal-Mart; |
|
· |
other specialty retailers that compete with us across a significant portion of our merchandising categories through retail, catalog or e‑commerce businesses, such as Bass Pro Shops (including Cabela’s), Sportsman’s Warehouse and REI; and |
|
· |
online retailers. |
Additional competitors may enter the businesses in which we currently operate. Moreover, some of our mass merchandising competitors do not currently compete in many of the product categories we offer, but may choose to offer a broader array of competing products in the future. Particularly in the larger outdoor goods and services market outside the RV market, our competitors may have a larger number of stores and greater market presence, name recognition and financial, distribution and marketing resources than us. Moreover, some of our competitors may build new stores in or near our existing locations. In addition, an increase in the number of aggregator and price comparison sites for insurance products may negatively
32
impact our sales of these products. If any of our competitors successfully provides a broader, more efficient or attractive combination of services, protection plans, products and resources to our target customers, our business results could be materially adversely affected. Our inability to compete effectively with existing or potential competitors could have a material adverse effect on our business, financial condition and results of operations.
Our expansion into new, unfamiliar markets, businesses, products lines or categories presents increased risks that may prevent us from being profitable in these new markets, businesses, product lines or categories. Delays in opening or acquiring new retail locations could have a material adverse effect on our business, financial condition and results of operations.
We intend to continue to expand by building or acquiring new retail locations in new markets and may elect to acquire new business, product lines or categories. As a result, we may have less familiarity with local consumer preferences and less business, product or category knowledge with respect to new businesses, product lines or categories, and could encounter difficulties in attracting customers due to a reduced level of consumer familiarity with our brands or reduced product or category knowledge. Other factors that may impact our ability to open or acquire new retail locations in new markets and to operate them profitably or acquire new businesses, product lines or categories, many of which are beyond our control, include:
|
· |
our ability to identify suitable acquisition opportunities or new locations, including our ability to gather and assess demographic and marketing data to determine consumer demand for our products in the locations we select; |
|
· |
our ability to negotiate favorable lease agreements; |
|
· |
our ability to secure product lines; |
|
· |
the availability of construction materials and labor for new retail locations and significant construction delays or cost overruns; |
|
· |
our ability to accurately assess the profitability of potential acquisitions or new locations; |
|
· |
our ability to secure required governmental permits and approvals; |
|
· |
our ability to hire and train skilled store operating personnel, especially management personnel; |
|
· |
our ability to provide a satisfactory mix of merchandise that is responsive to the needs of our customers living in the geographic areas where new retail locations are built or acquired; |
|
· |
our ability to supply new retail locations with inventory in a timely manner; |
|
· |
our competitors building or leasing retail locations near our retail locations or in locations we have identified as targets; |
|
· |
regional economic and other factors in the geographic areas in which we expand; and |
|
· |
general economic and business conditions affecting consumer confidence and spending and the overall strength of our business. |
Once we decide on a new market and identify a suitable location or acquisition opportunity, any delays in opening or acquiring new retail locations could impact our financial results. It is possible that events, such as delays in the entitlements process or construction delays caused by permitting or licensing issues, material shortages, labor issues, weather delays or other acts of god, discovery of contaminants, accidents, deaths or injuries, could delay planned openings beyond their expected dates or force us to abandon planned openings altogether.
33
As we grow, we will face the risk that our existing resources and systems, including management resources, accounting and finance personnel and operating systems, may be inadequate to support our growth. We cannot assure you that we will be able to retain the personnel or make the changes in our systems that may be required to support our growth. Failure to secure these resources and implement these systems on a timely basis could have a material adverse effect on our results of operations. In addition, hiring additional personnel and implementing changes and enhancements to our systems will require capital expenditures and other increased costs that could also have a material adverse impact on our results of operations.
Our expansion into new markets, businesses, products or categories may also create new distribution and merchandising challenges, including additional strain on our distribution centers, an increase in information to be processed by our management information systems and diversion of management attention from existing operations. To the extent that we are not able to meet these additional challenges, our sales could decrease and our operating expenses could increase, which could have a material adverse effect on our business, financial condition and results of operations.
Finally, the size, timing, and integration of any future new retail location openings or acquisitions or the acquisition of new businesses, product lines or categories may cause substantial fluctuations in our results of operations from quarter to quarter. In particular, with respect to the additional 72 Gander Outdoors locations we plan to open by May 2018, given our lack of operating history of the store locations, we expect to be exposed to longer start up times to reach profitability than our traditional greenfield location openings. We anticipate that these new store locations will negatively impact our retail segment margins during this ramp up period. Consequently, our results of operations for any quarter may not be indicative of the results that may be achieved for any subsequent quarter or for a full fiscal year. These fluctuations could adversely affect the market price of our common stock.
As a result of the above factors, we cannot assure you that we will be successful in operating our retail locations in new markets or acquiring new businesses, product lines or categories on a profitable basis, and our failure to do so could have a material adverse effect on our business, financial condition and results of operations.
Unforeseen expenses, difficulties, and delays frequently encountered in connection with expansion through acquisitions could inhibit our growth and negatively impact our profitability.
Since January 1, 2012, we have acquired 51 Camping World retail locations, nine Outdoor and Active Sports Retail locations, and two Overton’s retail locations; opened two Gander Outdoors locations; and sold two Camping World retail locations. Each acquired retail location operated independently prior to its acquisition by us. Our success depends, in part, on our ability to continue to make successful acquisitions and to integrate the operations of acquired retail locations, including centralizing certain functions to achieve cost savings and pursuing programs and processes that promote cooperation and the sharing of opportunities and resources among our retail locations and consumer services and plans. Unforeseen expenses, difficulties and delays frequently encountered in connection with rapid expansion through acquisitions could inhibit our growth and negatively impact our profitability.
We also may be unable to identify suitable acquisition candidates or to complete the acquisitions of candidates that we identify. Increased competition for acquisition candidates or increased asking prices by acquisition candidates may increase purchase prices for acquisitions to levels beyond our financial capability or to levels that would not result in the returns required by our acquisition criteria. Acquisitions also may become more difficult or less attractive in the future as we continue to acquire the most attractive dealers and stores. In addition, we may encounter difficulties in integrating the operations of acquired dealers and stores with our own operations or managing acquired dealers and stores profitably without substantial costs, delays, or other operational or financial problems.
Our ability to continue to grow through the acquisition of additional retail locations will depend upon various factors, including the following:
|
· |
the availability of suitable acquisition candidates at attractive purchase prices; |
34
|
· |
the ability to compete effectively for available acquisition opportunities; |
|
· |
the availability of cash on hand, borrowed funds or Class A common stock with a sufficient market price to finance the acquisitions; |
|
· |
the ability to obtain any requisite third-party or governmental approvals; and |
|
· |
the absence of one or more third parties attempting to impose unsatisfactory restrictions on us in connection with their approval of acquisitions. |
As a part of our acquisition strategy, we frequently engage in discussions with various dealerships and other Outdoor and Active Sports Retail businesses regarding their potential acquisition by us. In connection with these discussions, we and each potential acquisition candidate exchange confidential operational and financial information, conduct due diligence inquiries, and consider the structure, terms, and conditions of the potential acquisition. Potential acquisition discussions frequently take place over a long period of time and involve difficult business integration and other issues, including in some cases, management succession and related matters. As a result of these and other factors, a number of potential acquisitions that from time to time appear likely to occur do not result in binding legal agreements and are not consummated. In addition, we may have disagreements with potential acquisition targets, which could lead to litigation. Any of these factors or outcomes could result in a material adverse effect on our business, financial condition and results of operations.
Failure to maintain the strength and value of our brands could have a material adverse effect on our business, financial condition and results of operations.
Our success depends on the value and strength of our key brands, including Good Sam, Camping World, Gander Outdoors and Overton’s. These brands are integral to our business as well as to the implementation of our strategies for expanding our business. Maintaining, enhancing, promoting and positioning our brands, particularly in new markets where we have limited brand recognition, will depend largely on the success of our marketing and merchandising efforts and our ability to provide high quality services, protection plans, products and resources and a consistent, high quality customer experience. Our brands could be adversely affected if we fail to achieve these objectives, if we fail to comply with local laws and regulations, if we are subject to publicized litigation or if our public image or reputation were to be tarnished by negative publicity. Some of these risks may be beyond our ability to control, such as the effects of negative publicity regarding our manufacturers, suppliers or third-party providers of services or negative publicity related to members of management. Any of these events could result in decreases in revenues. Further, maintaining, enhancing, promoting and positioning our brands image may require us to make substantial investments in areas such as merchandising, marketing, store operations, community relations, store graphics and employee training, which could adversely affect our cash flow and which may ultimately be unsuccessful. These factors could have a material adverse effect on our business, financial condition and results of operations.
Our failure to successfully order and manage our inventory to reflect consumer demand in a volatile market and anticipate changing consumer preferences and buying trends could have a material adverse effect on our business, financial condition and results of operations.
Our success depends upon our ability to successfully manage our inventory and to anticipate and respond to merchandise trends and consumer demands in a timely manner. Our products appeal to consumers who are, or could become, RV owners and/or outdoor and active sports enthusiasts across North America. The preferences of these consumers cannot be predicted with certainty and are subject to change. Further, the retail consumer industry, by its nature, is volatile and sensitive to numerous economic factors, including consumer preferences, competition, market conditions, general economic conditions and other factors outside of our control. We cannot predict consumer preferences with certainty, and consumer preferences often change over time. We typically order merchandise well in advance of the following selling season. The extended lead times for many of our purchases may make it difficult for us to respond rapidly to new or changing product trends, increases or decreases in consumer demand or changes in prices. If we misjudge either the market for our merchandise or our consumers’ purchasing habits in the future, our
35
revenues may decline significantly and we may not have sufficient quantities of merchandise to satisfy consumer demand or sales orders or we may be required to discount excess inventory, either of which could have a material adverse effect on our business, financial condition and results of operations.
Our same store sales may fluctuate and may not be a meaningful indicator of future performance.
Our same store sales may vary from quarter to quarter. A number of factors have historically affected, and will continue to affect, our same store sales results, including:
|
· |
changes or anticipated changes to regulations related to some of the products we sell; |
|
· |
consumer preferences, buying trends and overall economic trends; |
|
· |
our ability to identify and respond effectively to local and regional trends and customer preferences; |
|
· |
our ability to provide quality customer service that will increase our conversion of shoppers into paying customers; |
|
· |
competition in the regional market of a store; |
|
· |
atypical weather patterns; |
|
· |
changes in our product mix; |
|
· |
changes to local or regional regulations affecting our stores; |
|
· |
changes in sales of consumer services and plans and retention and renewal rates for our annually renewing consumer services and plans; and |
|
· |
changes in pricing and average unit sales. |
An unanticipated decline in revenues or same store sales may cause the price of our Class A common stock to fluctuate significantly.
The cyclical nature of our business has caused our sales and results of operations to fluctuate. These fluctuations may continue in the future, which could result in operating losses during downturns.
The RV, outdoor and active sports specialty retail industries are cyclical and are influenced by many national and regional economic and demographic factors, including:
|
· |
terms and availability of financing for retailers and consumers; |
|
· |
overall consumer confidence and the level of discretionary consumer spending; |
|
· |
population and employment trends; |
|
· |
income levels; and |
|
· |
general economic conditions, including inflation, deflation and recessions. |
As a result of the foregoing factors, our sales and results of operations have fluctuated, and we expect that they will continue to fluctuate in the future.
36
Our business is seasonal and this leads to fluctuations in sales and revenues.
We have experienced, and expect to continue to experience, variability in revenue, net income and cash flows as a result of annual seasonality in our business. Because RVs are used primarily by vacationers and campers, demand for services, protection plans, products and resources generally declines during the winter season, while sales and profits are generally highest during the spring and summer months. Conversely, we expect demand for non-RV related outdoor and active sports products to generally decline during the first and second fiscal quarters and we expect sales and profits for our outdoor and active sports products to generally be higher in the third and fourth fiscal quarters. In addition, unusually severe weather conditions in some geographic areas may impact demand.
On average, over the three years ended December 31, 2017, we have generated 30.1% and 28.6% of our annual revenue in the second and third fiscal quarters, respectively, which include the spring and summer months. We have historically incurred additional expenses in the second and third fiscal quarters due to higher purchase volumes, increased staffing in our retail locations and program costs. If, for any reason, we miscalculate the demand for our products or our product mix during the second and third fiscal quarters, our sales in these quarters could decline, resulting in higher labor costs as a percentage of sales, lower margins and excess inventory, which could have a material adverse effect on our business, financial condition and results of operations.
Additionally, SG&A expenses as a percentage of gross profit tend to be higher in the first and fourth quarters due to the timing of acquisitions and the seasonality of our business. We prefer to acquire new retail locations in the first and fourth quarters of each year in order to provide time for the location to be re-modeled and to ramp up operations ahead of the spring and summer months. The timing of our acquisitions in the first and fourth quarters, coupled with generally lower revenue in these quarters has resulted in SG&A expenses as a percentage of gross profit being higher in these quarters. In 2018, we plan to open 72 additional Gander Outdoors locations by May 2018, which we expect to further impact this trend.
Due to our seasonality, the possible adverse impact from other risks associated with our business, including atypical weather, consumer spending levels and general business conditions, is potentially greater if any such risks occur during our peak sales seasons.
Our ability to operate and expand our business and to respond to changing business and economic conditions will depend on the availability of adequate capital.
The operation of our business, the rate of our expansion and our ability to respond to changing business and economic conditions depend on the availability of adequate capital, which in turn depends on cash flow generated by our business and, if necessary, the availability of equity or debt capital. We also require sufficient cash flow to meet our obligations under our existing debt agreements. As of December 31, 2017, we had a credit agreement that included a $945.0 million term loan (the “Existing Term Loan Facility”) and $35.0 million of commitments for revolving loans and letters of credit (the “Existing Revolving Credit Facility” and, together with the Existing Term Loan Facility, the “Existing Senior Secured Credit Facilities”). Additionally, as of December 31, 2017, we also had up to $1.415 billion in maximum borrowing availability under the Floor Plan Facility. The Floor Plan Facility also provides a letter of credit commitment of $15.0 million and a $35.0 million revolving line of credit. As of December 31, 2017, we had $916.9 million of term loans outstanding under the Existing Senior Secured Credit Facilities, net of $6.0 million of unamortized original issue discount and $14.2 million of finance costs, no revolving borrowings outstanding under the Existing Senior Secured Credit Facilities aside from letters of credit in the aggregate amount of $3.2 million outstanding under the Existing Revolving Credit Facility, and $974.0 million in floor plan notes payable outstanding under the Floor Plan Facility, with $31.8 million of additional borrowing capacity under our Existing Revolving Credit Facility, $226.4 million of available line for future inventory purchases under our Floor Plan Facility, and no revolving borrowings outstanding under the Floor Plan Facility revolving line of credit. The proceeds from the Existing Term Loan Facility were used to repay the Company’s previous senior secured credit facilities (“Previous Senior Secured Credit Facilities”).
Our Existing Term Loan Facility, which we entered into on November 8, 2016, as amended on March 17, 2017 and October 6, 2017, requires us to make quarterly principal payments of $2.4 million. We paid total
37
cash interest on our Existing Term Facility of $37.6 million and $45,000 during the years ended December 31, 2017 and 2016, respectively. We also paid total cash interest on our Previous Senior Secured Credit Facilities of $41.6 million for the year ended December 31, 2016. We paid total floor plan interest on our Floor Plan Facility of $26.8 million and $18.9 million for the years ended December 31, 2017 and 2016, respectively. In addition to interest paid on our Existing Senior Credit Facilities, our Previous Senior Credit Facilities and our Floor Plan Facility, we paid cash interest of $0.8 million and $1.4 million for the years ended December 31, 2017 and 2016, respectively. The Existing Term Loan Facility also provides for an excess cash flow payment following the end of each fiscal year beginning with our fiscal year ending December 31, 2017 such that our indirect wholly-owned subsidiary, CWGS Group, LLC (the “Borrower”), will be required to prepay the term loan borrowings in an aggregate amount equal to 50% of excess cash flow for such fiscal year if the total leverage ratio is greater than 2.00 to 1.00. The required percentage of excess cash flow prepayment is reduced to 25% if the total leverage ratio is 1.50 to 1.00 or greater, but less than 2.00 to 1.00, and 0% if the total leverage ratio is less than 1.50 to 1.00. As of December 31, 2017, CWGS Group, LLC had no Excess Cash Flow, as defined. See “Management's Discussion and Analysis of Financial Condition and Results of Operations — Liquidity and Capital Resources — Description of Senior Secured Credit Facilities and Floor Plan Facility” in Item 7 of Part II of this Form 10-K and Note 7 — Long-Term Debt to our audited consolidated financial statements included in Item 8 of Part II of this Form 10-K. We are dependent to a significant extent on our ability to finance our new and certain of our used RV inventory under our Floor Plan Facility. Floor plan financing arrangements allow us to borrow money to buy a particular new RV from the manufacturer or a used RV on trade in or at auction and pay off the loan when we sell that particular RV. We may need to increase the capacity of our existing Floor Plan Facility in connection with our acquisition of dealerships and overall growth. In the event that we are unable to obtain such incremental financing, our ability to complete acquisitions could be limited.
We cannot assure you that our cash flow from operations or cash available under our Existing Revolving Credit Facility or our Floor Plan Facility will be sufficient to meet our needs. If we are unable to generate sufficient cash flows from operations in the future, and if availability under our Existing Revolving Credit Facility or our Floor Plan Facility is not sufficient, we may have to obtain additional financing. If we obtain additional capital by issuing equity, the interests of our existing stockholders will be diluted. If we incur additional indebtedness, that indebtedness may contain significant financial and other covenants that may significantly restrict our operations. We currently intend to increase our borrowings in the near term to fund our current plan to open an additional 72 Gander Outdoors stores by May 2018, and to provide working capital for dealership acquisition opportunities. We cannot assure you that we could obtain refinancing or additional financing on favorable terms or at all.
Our Existing Senior Secured Credit Facilities and our Floor Plan Facility contain restrictive covenants that may impair our ability to access sufficient capital and operate our business.
Our Existing Senior Secured Credit Facilities and our Floor Plan Facility contain various provisions that limit our ability to, among other things:
|
· |
incur additional indebtedness; |
|
· |
incur certain liens; |
|
· |
consolidate or merge; |
|
· |
alter the business conducted by us and our subsidiaries; |
|
· |
make investments, loans, advances, guarantees and acquisitions; |
|
· |
sell assets, including capital stock of our subsidiaries; |
|
· |
enter into certain sale and leaseback transactions; |
38
|
· |
pay dividends on capital stock or redeem, repurchase or retire capital stock or certain other indebtedness; |
|
· |
engage in transactions with affiliates; and |
|
· |
enter into agreements restricting our subsidiaries’ ability to pay dividends. |
In addition, the restrictive covenants in our Existing Senior Secured Credit Facilities and our Floor Plan Facility require us to maintain specified financial ratios. See “Management's Discussion and Analysis of Financial Condition and Results of Operations — Liquidity and Capital Resources — Description of Senior Secured Credit Facilities and Floor Plan Facility” in Item 7 of Part II of this Form 10-K and Note 7 — Long-Term Debt to our audited consolidated financial statements included in Item 8 of Part II of this Form 10-K. Our ability to comply with those financial ratios may be affected by events beyond our control, and our failure to comply with these ratios could result in an event of default.
These covenants may affect our ability to operate and finance our business as we deem appropriate. Our inability to meet obligations as they become due or to comply with various financial covenants contained in the instruments governing our current or future indebtedness could constitute an event of default under the instruments governing our indebtedness.
If there were an event of default under the instruments governing our indebtedness, the holders of the affected indebtedness could declare all of the affected indebtedness immediately due and payable, which, in turn, could cause the acceleration of the maturity of all our other indebtedness. We may not have sufficient funds available, or we may not have access to sufficient capital from other sources, to repay any accelerated debt. Even if we could obtain additional financing, the terms of the financing may not be favorable to us. In addition, substantially all of our assets are subject to liens securing our Existing Senior Secured Credit Facilities and our Floor Plan Facility. If amounts outstanding under our Existing Senior Secured Credit Facilities and our Floor Plan Facility were accelerated, our lenders could foreclose on these liens and we could lose substantially all of our assets. Any event of default under the instruments governing our indebtedness could have a material adverse effect on our business, financial condition and results of operations.
We primarily rely on seven fulfillment and distribution centers for our retail, e‑commerce and catalog businesses, and, if there is a natural disaster or other serious disruption at either facility, we may be unable to deliver merchandise effectively to our stores or customers.
We currently rely on seven distribution and fulfillment centers located in Franklin, Kentucky, Bakersfield, California, Fort Worth, Texas, Greenville, South Carolina, Lebanon, Indiana, St. Paul, Minnesota and Skokie, Illinois for our retail, e‑commerce and catalog businesses. We handle almost all of our e‑commerce and catalog orders and distribution to our retail stores through these seven facilities. Any natural disaster or other serious disruption at either facility due to fire, tornado, earthquake, flood or any other cause could damage our on‑site inventory or impair our ability to use such distribution and fulfillment center. While we maintain business interruption insurance, as well as general property insurance, the amount of insurance coverage may not be sufficient to cover our losses in such an event. Any of these occurrences could impair our ability to adequately stock our stores or fulfill customer orders and harm our results of operations.
Natural disasters, whether or not caused by climate change, unusual weather condition, epidemic outbreaks, terrorist acts and political events could disrupt business and result in lower sales and otherwise adversely affect our financial performance.
The occurrence of one or more natural disasters, such as tornadoes, hurricanes, fires, floods, hail storms and earthquakes, unusual weather conditions, epidemic outbreaks such as Ebola, Zika virus or measles, terrorist attacks or disruptive political events in certain regions where our stores are located could adversely affect our business and result in lower sales. Severe weather, such as heavy snowfall or extreme temperatures, may discourage or restrict customers in a particular region from traveling to our stores or utilizing our products, thereby reducing our sales and profitability. Natural disasters including tornadoes, hurricanes, floods, hail storms and earthquakes may damage our stores or other operations, which may
39
materially adversely affect our consolidated financial results. In addition to business interruption, our retailing business is subject to substantial risk of property loss due to the concentration of property at our retail locations. To the extent these events also impact one or more of our key suppliers or result in the closure of one or more of our distribution centers or our corporate headquarters, we may be unable to maintain inventory balances, maintain delivery schedules or provide other support functions to our stores. Any of these events could have a material adverse effect on our business, financial condition and results of operations.
We depend on our relationships with third-party providers of services, protection plans, products and resources and a disruption of these relationships or of these providers’ operations could have an adverse effect on our business and results of operations.
Our business depends in part on developing and maintaining productive relationships with third-party providers of services, protection plans, products and resources that we market to our customers. During the year ended December 31, 2017 we sourced our products from approximately 3,700 domestic and international vendors. Additionally, we rely on certain third-party providers to support our services, protection plans, products and resources, including insurance carriers for our property and casualty insurance and extended service contracts, banks and captive financing companies for vehicle financing and refinancing, Comenity Capital Bank as the issuer of our co‑branded credit card and a tow provider network for our roadside assistance programs. We cannot accurately predict when, or the extent to which, we will experience any disruption in the supply of products from our vendors or services from our third-party providers. Any such disruption could negatively impact our ability to market and sell our services, protection plans, products and resources, which could have a material adverse effect on our business, financial condition and results of operations. In addition, Comenity Capital Bank could decline to renew our services agreement or become insolvent and unable to perform our contract, and we may be unable to timely find a replacement bank to provide these services.
We depend on merchandise purchased from our vendors to obtain products for our retail locations. We have no contractual arrangements providing for continued supply from our key vendors, and our vendors may discontinue selling to us at any time. Changes in commercial practices of our key vendors or manufacturers, such as changes in vendor support and incentives or changes in credit or payment terms, could also negatively impact our results. If we lose one or more key vendors or are unable to promptly replace a vendor that is unwilling or unable to satisfy our requirements with a vendor providing equally appealing products at comparable prices, we may not be able to offer products that are important to our merchandise assortment.
Because certain of the products that we sell are manufactured abroad, we may face delays, and increased cost or quality control deficiencies in the importation of these products, which could reduce our net sales and profitability.
Like many other outdoor and active sports oriented retailers, a portion of the products that we purchase for resale, including those purchased from domestic suppliers, is manufactured abroad in China and other countries. In addition, we believe most of our private label merchandise is manufactured abroad. Foreign imports subject us to the risks of changes in, or the imposition of new, import tariffs, duties or quotas, new restrictions on imports, loss of “most favored nation” status with the United States for a particular foreign country, antidumping or countervailing duty orders, retaliatory actions in response to illegal trade practices, work stoppages, delays in shipment, freight expense increases, product cost increases due to foreign currency fluctuations or revaluations and economic uncertainties. If any of these or other factors were to cause a disruption of trade from the countries in which the suppliers of our vendors are located or impose additional costs in connection with the purchase of our products, we may be unable to obtain sufficient quantities of products to satisfy our requirements and our results of operations could be adversely affected.
To the extent that any foreign manufacturers which supply products to us directly or indirectly utilize quality control standards, labor practices or other practices that vary from those legally mandated or commonly accepted in the United States, we could be hurt by any resulting negative publicity or, in some cases, face potential liability.
40
In addition, instability in the political and economic environments of the countries in which our vendors or we obtain our products, or general international instability, could have an adverse effect on our operations. In the event of disruptions or delays in supply due to economic or political conditions in foreign countries, such disruptions or delays could adversely affect our results of operations unless and until alternative supply arrangements could be made. In addition, merchandise purchased from alternative sources may be of lesser quality or more expensive than the merchandise we currently purchase abroad.
We also are subject to risks, such as the price and availability of raw materials and fabrics, labor disputes, union organizing activity, strikes, inclement weather, natural disasters, war and terrorism and adverse general economic and political conditions that might limit our vendors’ ability to provide us with quality merchandise on a timely and cost‑efficient basis. We may not be able to develop relationships with new vendors, and products from alternative sources, if any, may be of a lesser quality and more expensive than those we currently purchase. Any delay or failure in offering quality products and services to our customers could have a material adverse effect on our business, financial condition and results of operations.
We offer emergency roadside assistance to our customers at a fixed price per year and we pay our tow provider network based on usage. If the amount of emergency roadside claims substantially exceeds our estimates or if our tow provider is unable to adequately respond to calls, it could have a material adverse effect on our business, financial condition or results of operations.
With respect to the insurance programs that we offer, we are dependent on the insurance carriers that underwrite the insurance to obtain appropriate regulatory approvals and maintain compliance with insurance regulations. If such carriers do not obtain appropriate state regulatory approvals or comply with such changing regulations, we may be required to use an alternative carrier or change our insurance products or cease marketing certain insurance related products in certain states, which could have a material adverse effect on our business, financial condition and results of operations. If we are required to use an alternative insurance carrier or change our insurance related products, it may materially increase the time required to bring an insurance related product to market. Any disruption in our service offerings could harm our reputation and result in customer dissatisfaction.
Additionally, we provide financing to qualified customers through a number of third-party financing providers. If one or more of these third-party providers ceases to provide financing to our customers, provides financing to fewer customers or no longer provides financing on competitive terms, or if we were unable to replace the current third-party providers upon the occurrence of one or more of the foregoing events, it could have a material adverse effect on our business, financial condition and results of operations.
We also offer a co‑branded credit card issued by Comenity Capital Bank, a third-party bank that manages and directly extends credit to our customers. The cardholders can earn promotional points on a variety of qualifying purchases, such as purchases at Camping World, Gander Outdoors, Overton’s, Uncle Dan’s and TheHouse.com on Good Sam purchases and at private campgrounds across the United States and Canada. We earn incentive payments from our card network partner based on the use of the credit card. A decrease in the popularity and use of our co‑branded credit card could reduce our ability to earn incentive payment income as part of the program and could have a material adverse effect on our business, financial condition and results of operations.
A portion of our net income is from financing, insurance and extended service contracts, which depend on third-party lenders and insurance companies. We cannot assure you third-party lending institutions will continue to provide financing for RV purchases.
A portion of our net income comes from the fees we receive from lending institutions and insurance companies for arranging financing and insurance coverage for our customers. The lending institution pays us a fee for each loan that we arrange. If these lenders were to lend to our customers directly rather than through us, we would not receive a fee. In addition, if customers prepay financing we arranged within a specified period (generally within six months of making the loan), we are required to rebate (or “chargeback”) all or a portion of the commissions paid to us by the lending institution. Our revenues from financing fees and vehicle service contract fees are recorded net of a reserve for estimated future chargebacks based on historical operating results. Lending institutions may change the criteria or terms they use to make loan
41
decisions, which could reduce the number of customers for whom we can arrange financing, or may elect to not continue to provide these products with respect to RVs. Our customers may also use the internet or other electronic methods to find financing alternatives. If any of these events occur, we could lose a significant portion of our income and profit.
Furthermore, new and used vehicles may be sold and financed through retail installment sales contracts entered into between us and third‑party purchasers. Prior to entering into a retail installment sales contract with a third‑party purchaser, we typically have a commitment from a third‑party lender for the assignment of such retail installment sales contract, subject to final review, approval and verification of the retail installment sales contract, related documentation and the information contained therein. Retail installment sales contracts are typically assigned by us to third‑party lenders simultaneously with the execution of the retail installment sales contracts. Contracts in transit represent amounts due from third‑party lenders from whom pre‑arranged assignment agreements have been determined, and to whom the retail installment sales contract have been assigned. We recognize revenue when the applicable new or used vehicle is delivered and we have assigned the retail installment sales contract to a third‑party lender and collectability is reasonably assured. Funding from the third‑party lender is provided upon receipt, final review, approval and verification of the retail installment sales contract, related documentation and the information contained therein. Retail installment sales contracts are typically funded within ten days of the initial approval of the retail installment sales contract by the third‑party lender. Contracts in transit are included in current assets in our consolidated financial statements included in Item 8 of Part II of this Form 10-K and totaled $46.2 million and $29.0 million as of December 31, 2017 and December 31, 2016, respectively. Any defaults on these retail installment sales contracts could have a material adverse effect on our business, financial condition and results of operations.
If we are unable to retain senior executives and attract and retain other qualified employees, our business might be adversely affected.
Our success depends in part on our ability to attract, hire, train and retain qualified managerial, sales and marketing personnel. Competition for these types of personnel is high. We may be unsuccessful in attracting and retaining the personnel we require to conduct our operations successfully and, in such an event, our business could be materially and adversely affected. Our success also depends to a significant extent on the continued service and performance of our senior management team, including our Chairman and Chief Executive Officer Marcus Lemonis. The loss of any member of our senior management team could impair our ability to execute our business plan and could therefore have a material adverse effect on our business, results of operations and financial condition. Additionally, certain members of our management team, including Mr. Lemonis, currently pursue and may continue to pursue other business ventures, which could divert their attention from executing on our business plan and objectives. We do not currently maintain key‑man life insurance policies on any member of our senior management team or other key employees. We have entered into employment agreements with Marcus A. Lemonis, our Chief Executive Officer, Thomas F. Wolfe, our Chief Financial Officer and Secretary, Brent L. Moody, our Chief Operating and Legal Officer, and Roger L. Nuttall, our President of Camping World.
Our business depends on our ability to meet our labor needs.
Our success depends in part upon our ability to attract, motivate and retain a sufficient number of qualified employees, including market managers, general managers, sales managers, department managers and sales associates. Qualified individuals of the requisite caliber and number needed to fill these positions may be in short supply in some areas, and the turnover rate in the retail industry is high. If we are unable to hire and retain sales associates capable of consistently providing a high level of customer service, as demonstrated by their enthusiasm for our culture and knowledge of our merchandise, our business could be materially adversely affected. Although none of our employees are currently covered by collective bargaining agreements, our employees may elect to be represented by labor unions in the future, which could increase our labor costs. Additionally, competition for qualified employees could require us to pay higher wages to attract a sufficient number of employees. An inability to recruit and retain a sufficient number of qualified individuals in the future may delay the planned openings of new stores. Any such delays, any material increases in employee turnover rates at existing stores or any increases in labor costs could have a material adverse effect on our business, financial condition or results of operations.
42
We are subject to risks associated with leasing substantial amounts of space.
We lease substantially all of the real properties where we have operations, including, as of December 31, 2017, 133 of our 140 of our Camping World retail locations in 36 states, two Gander Outdoors retail locations, two Overton’s locations, three Uncle Dan’s locations and our six RV retail distribution centers. Our leases generally provide for fixed monthly rentals with escalation clauses and range from five to twenty years. The profitability of our business is heavily dependent on operating our current store base with favorable margins, opening and operating new stores at reasonable profit, renewing leases for stores in desirable locations and, if necessary, identifying and closing underperforming stores or potentially relocating these stores to alternative locations in a cost-effective manner. Typically, a large portion of a store’s operating expense is the cost associated with leasing the location.
The operating leases for our retail properties, distribution centers and corporate offices expire at various dates through 2050. A number of leases have renewal options for various periods of time at our discretion. We are typically responsible for taxes, utilities, insurance, repairs, and maintenance for these properties. Rent expense for 2017 was $86.6 million and our future minimum rental commitments for 2018 for all operating leases in existence as of December 31, 2017 is approximately $101.3 million, which does not include rent for Gander Outdoors stores where the lease was signed in 2018. The rental commitment for the fiscal years 2018 through 2050 is approximately $1.2 billion. We expect that many of the new stores we open will also be leased to us under operating leases, which will further increase our operating lease expenditures and require significant capital expenditures. We depend on cash flows from operations to pay our lease expenses and to fulfill our other cash needs. If our business does not generate sufficient cashflow from operating activities, and sufficient funds are not otherwise available to us from borrowings under our Existing Senior Secured Credit Facility, we may not be able to service our lease expenses or fund our other liquidity and capital needs, which would materially affect our business. In addition, when leases for the stores in our ongoing operations expire, we may be unable to negotiate renewals, either on commercially acceptable terms, or at all, which could cause us to close stores in locations that may be desirable. We may be unable to relocate these stores cost-effectively or at all and there can be no assurance that any relocated stores will be successful.
Additionally, over time our current store locations may not continue to be desirable because of changes in demographics within the surrounding area or a decline in shopping traffic, including traffic generated by other nearby stores. Although we have the right to terminate some of our leases under specified conditions by making certain payments, we may not be able to terminate a particular lease if or when we would like to do so. If we decide to close stores, we are generally required to either continue to pay rent and operating expenses for the balance of the lease term or, for certain locations, pay exercise rights to terminate, which in either case could be expensive. Even if we are able to assign or sublease vacated locations where our lease cannot be terminated, we may remain liable on the lease obligations if the assignee or sublessee does not perform.
If we are unable to service our lease expenses or are unable to, on favorable terms, negotiate renewals of leases at desirable locations or identify and close underperforming locations, we may be forced to seek alternative sites in our target markets, which may be difficult and have a material adverse effect on our business, financial condition and results of operations.
Our business is subject to numerous federal, state and local regulations.
Our operations are subject to varying degrees of federal, state and local regulation, including our RV sales, firearms sales, RV financing, outbound telemarketing, direct mail, roadside assistance programs and insurance activities. New regulatory efforts may be proposed from time to time that have a material adverse effect on our ability to operate our businesses or our results of operations. For example, in the past a principal source of leads for our direct response marketing efforts was new vehicle registrations provided by motor vehicle departments in various states. Currently, all states restrict access to motor vehicle registration information.
We are also subject to federal and numerous state consumer protection and unfair trade practice laws and regulations relating to the sale, transportation and marketing of motor vehicles, including so‑called
43
“lemon laws.” Federal, state and local laws and regulations also impose upon vehicle operators various restrictions on the weight, length and width of motor vehicles that may be operated in certain jurisdictions or on certain roadways. Certain jurisdictions also prohibit the sale of vehicles exceeding length restrictions. Federal and state authorities also have various environmental control standards relating to air, water, noise pollution and hazardous waste generation and disposal which affect our business and operations.
Further, certain federal and state laws and regulations affect our activities. Areas of our business affected by such laws and regulations include, but are not limited to, labor, advertising, consumer protection, real estate, promotions, quality of services, intellectual property, tax, import and export, anti‑corruption, anti‑competition, environmental, health and safety. Compliance with these laws and others may be onerous and costly, at times, and may be inconsistent from jurisdiction to jurisdiction which further complicates compliance efforts.
The Dodd‑Frank Wall Street Reform and Consumer Protection Act (the “Dodd‑Frank Act”), which was signed into law on July 21, 2010, established the Consumer Financial Protection Bureau (the “CFPB”), an independent federal agency funded by the United States Federal Reserve with broad regulatory powers and limited oversight from the United States Congress. Although automotive dealers are generally excluded, the Dodd‑Frank Act could lead to additional, indirect regulation of automotive dealers, in particular, their sale and marketing of finance and insurance products, through its regulation of automotive finance companies and other financial institutions. In March 2013, the CFPB issued supervisory guidance highlighting its concern that the practice of automotive dealers being compensated for arranging customer financing through discretionary markup of wholesale rates offered by financial institutions (dealer markup) results in a significant risk of pricing disparity in violation of The Equal Credit Opportunity Act (the “ECOA”). The CFPB recommended that financial institutions under its jurisdiction take steps to address compliance with the ECOA, which may include imposing controls on dealer markup, monitoring and addressing the effects of dealer markup policies, and eliminating dealer discretion to markup buy rates and fairly compensating dealers using a different mechanism that does not result in disparate impact to certain groups of consumers.
In addition, the Patient Protection and Affordable Care Act (the “Affordable Care Act”), which was signed into law on March 23, 2010, may increase our annual employee health care costs that we fund and has increased our cost of compliance and compliance risk related to offering health care benefits.
Furthermore, our property and casualty insurance programs that we offer through third-party insurance carriers are subject to various state laws and regulations governing the business of insurance, including, without limitation, laws and regulations governing the administration, underwriting, marketing, solicitation or sale of insurance programs. Our third-party insurance carriers are required to apply for, renew, and maintain licenses issued by state, federal or foreign regulatory authorities. Such regulatory authorities have relatively broad discretion to grant, renew and revoke such licenses. Accordingly, any failure by such parties to comply with the then current licensing requirements, which may include any determination of financial instability by such regulatory authorities, could result in such regulators denying their initial or renewal applications for such licenses, modifying the terms of licenses or revoking licenses that they currently possess, which could severely inhibit our ability to market these products. Additionally, certain state laws and regulations govern the form and content of certain disclosures that must be made in connection with the sale, advertising or offer of any insurance program to a consumer. We review all marketing materials we disseminate to the public for compliance with applicable insurance regulations. We are required to maintain certain licenses and approvals in order to market insurance programs.
We are also subject to the rules and regulations of the ATF. If we fail to comply with ATF rules and regulations, the ATF may limit our growth or business activities, levy fines against us or, ultimately, revoke our license to do business. Our business, as well as the business of all producers and marketers of ammunition and firearms, is also subject to numerous federal, state, local and foreign laws, regulations and protocols. Applicable laws:
•require the licensing of all persons manufacturing, exporting, importing or selling firearms and ammunition as a business;
• require background checks for purchasers of firearms;
44
•impose waiting periods between the purchase of a firearm and delivery of a firearm;
•prohibit the sale of firearms to certain persons, such as those below a certain age and persons with criminal records; • regulate the use and storage of gun powder or other energetic materials;
•regulate the interstate sale of certain firearms;
•prohibit the interstate mail-order sale of firearms;
•regulate our employment of personnel with criminal convictions; and
•restrict access to firearm manufacturing facilities for individuals from other countries or with criminal convictions.
Several states currently have laws in effect that are similar to, and in certain cases, more restrictive than, these federal laws. Compliance with all of these regulations is costly and time-consuming. Inadvertent violation of any of these regulations could cause us to incur fines and penalties and may also lead to restrictions on our ability to manufacture and sell our products and services and to import or export the products we sell.
We have instituted various and comprehensive policies and procedures to address compliance. However, there can be no assurance that employees, contractors, vendors or our agents will not violate such laws and regulations or our policies and procedures. For more information on the various regulations applicable to our business, see “Item I. Business—Government Regulation” under Part I of this Form 10-K.
Regulations applicable to the sale of extended service contracts could materially impact our business and results of operations.
We offer extended service contracts that may be purchased as a supplement to the original purchaser’s warranty. These products are subject to complex federal and state laws and regulations. There can be no assurance that regulatory authorities in the jurisdictions in which these products are offered will not seek to regulate or restrict these products. Failure to comply with applicable laws and regulations could result in fines or other penalties including orders by state regulators to discontinue sales of the warranty products in one or more jurisdictions. Such a result could materially and adversely affect our business, results of operations and financial condition.
We currently transfer the majority of the administration and liability obligations associated with these extended service contracts to a third party upon purchase by the customer. State laws and regulations, however, may limit or condition our ability to transfer these administration and liability obligations to third parties, which could in turn impact the way revenue is recognized from these products. Failure to comply with these laws could result in fines or other penalties, including orders by state regulators to discontinue sales of these product offerings as currently structured. Such a result could materially and adversely affect our business, financial condition and results of operations.
If state dealer laws are repealed or weakened, our dealerships will be more susceptible to termination, non‑renewal or renegotiation of dealer agreements.
State dealer laws generally provide that a manufacturer may not terminate or refuse to renew a dealer agreement unless it has first provided the dealer with written notice setting forth good cause and stating the grounds for termination or non‑renewal. Some state dealer laws allow dealers to file protests or petitions or attempt to comply with the manufacturer’s criteria within the notice period to avoid the termination or non‑renewal. Though unsuccessful to date, manufacturers’ lobbying efforts may lead to the repeal or revision of state dealer laws. If dealer laws are repealed in the states in which we operate, manufacturers may be able to terminate our dealer agreements without providing advance notice, an opportunity to cure or a showing of good cause. Without the protection of state dealer laws, it may also be more difficult for our dealerships to renew their dealer agreements upon expiration.
45
The ability of a manufacturer to grant additional dealer agreements is based on several factors which are not within our control. If manufacturers grant new dealer agreements in areas near or within our existing markets, this could have a material adverse effect on our business, financial condition and results of operations.
Changes in government policies and firearms legislation could adversely affect our financial results.
The sale, purchase, ownership and use of firearms are subject to numerous and varied federal, state and local governmental regulations. Federal laws governing firearms include the National Firearms Act, the Federal Firearms Act, the Arms Export Control Act and the Gun Control Act of 1968. These laws generally govern the manufacture, import, export, sale and possession of firearms and ammunition.
Currently, some members of the federal legislature and several state legislatures are considering additional legislation relating to the regulation of firearms and ammunition. These proposed bills are extremely varied. If enacted, such legislation could effectively ban or severely limit the sale of affected firearms or ammunition. In addition, if such restrictions are enacted and are incongruent, we could find it difficult, expensive or even practically impossible to comply with them, which could impede new product development and the distribution of existing products. We cannot assure you that the regulation of our business activities will not become more restrictive in the future and that any such restriction will not have a material adverse effect on our business. For more information on the government policies and firearms legislation applicable to our business, see “Item I. Business—Government Regulation—Firearms Laws and Regulations” under Part I of this Form 10-K.
Our failure to comply with certain environmental regulations could adversely affect our business, financial condition and results of operations.
Our operations involve the use, handling, storage and contracting for recycling and/or disposal of materials such as motor oil and filters, transmission fluids, antifreeze, refrigerants, paints, thinners, batteries, cleaning products, lubricants, degreasing agents, tires and propane. Consequently, our business is subject to a complex variety of federal, state and local requirements that regulate the environment and public health and safety and we may incur significant costs to comply with such requirements. Our failure to comply with these regulations could cause us to become subject to fines and penalties or otherwise have an adverse impact on our business. In addition, we have indemnified certain of our landlords for any hazardous waste which may be found on or about property we lease. If any such hazardous waste were to be found on property that we occupy, a significant claim giving rise to our indemnity obligation could have a negative effect on our business, financial condition and results of operations.
Climate change legislation or regulations restricting emission of “greenhouse gases” could result in increased operating costs and reduced demand for the RVs we sell.
The United States Environmental Protection Agency has adopted rules under existing provisions of the federal Clean Air Act that require a reduction in emissions of greenhouse gases from motor vehicles. The adoption of any laws or regulations requiring significant increases in fuel economy requirements or new federal or state restrictions on vehicles and automotive fuels in the United States could adversely affect demand for those vehicles and could have a material adverse effect on our business, financial condition and results of operations.
A failure in our e‑commerce operations, security breaches and cybersecurity risks could disrupt our business and lead to reduced sales and growth prospects and reputational damage.
Our e‑commerce business is an important element of our brands and relationship with our customers, and we expect it to continue to grow. In addition to changing consumer preferences and shifting traffic patterns and buying trends in e‑commerce, we are vulnerable to additional risks and uncertainties associated with e‑commerce sales, including rapid changes in technology, website downtime and other technical failures, security breaches, cyber‑attacks, consumer privacy concerns, changes in state tax regimes and government regulation of internet activities. Our failure to successfully respond to these risks and uncertainties could
46
reduce our e‑commerce sales, increase our costs, diminish our growth prospects and damage our brands, which could negatively impact our results of operations and stock price.
In addition, there is no guarantee that we will be able to expand our e‑commerce business. Our competitors may have e‑commerce businesses that are substantially larger and more developed than ours, which places us at a competitive disadvantage. Although we continually update our websites, we may not be successful in implementing improved website features and there is no guarantee that such improvements will expand our e‑commerce business. If we are unable to expand our e‑commerce business, our growth plans will suffer and the price of our common stock could decline.
We may be unable to enforce our intellectual property rights and we may be accused of infringing the intellectual property rights of third parties which could have a material adverse effect on our business, financial condition and results of operations.
We own a variety of registered trademarks and service marks for the names of our clubs, magazines and other publications. We also own the copyrights to certain articles in our publications. We believe that our trademark and copyrights have significant value and are important to our marketing efforts. If we are unable to continue to protect the trademarks and service marks for our proprietary brands, if such marks become generic or if third parties adopt marks similar to our marks, our ability to differentiate our products and services may be diminished. In the event that our trademarks or service marks are successfully challenged by third parties, we could lose brand recognition and be forced to devote additional resources to advertising and marketing new brands for our products.
From time to time, we may be compelled to protect our intellectual property, which may involve litigation. Such litigation may be time‑consuming, expensive and distract our management from running the day‑to‑day operations of our business, and could result in the impairment or loss of the involved intellectual property. There is no guarantee that the steps we take to protect our intellectual property, including litigation when necessary, will be successful. The loss or reduction of any of our significant intellectual property rights could diminish our ability to distinguish our products from competitors’ products and retain our market share for our proprietary products. Our inability to effectively protect our proprietary intellectual property rights could have a material adverse effect on our business, results of operations and financial condition.
Other parties also may claim that we infringe their proprietary rights. Such claims, whether or not meritorious, may result in the expenditure of significant financial and managerial resources, injunctions against us or the payment of damages. These claims could have a material adverse effect on our business, financial condition and results of operations.
If we are unable to maintain or upgrade our information technology systems or if we are unable to convert to alternate systems in an efficient and timely manner, our operations may be disrupted or become less efficient.
We depend on a variety of information technology systems for the efficient functioning of our business. We rely on certain hardware, telecommunications and software vendors to maintain and periodically upgrade many of these systems so that we can continue to support our business. Various components of our information technology systems, including hardware, networks, and software, are licensed to us by third-party vendors. We rely extensively on our information technology systems to process transactions, summarize results and manage our business. Additionally, because we accept debit and credit cards for payment, we are subject to the Payment Card Industry Data Security Standard (the “PCI Standard”), issued by the Payment Card Industry Security Standards Council. The PCI Standard contains compliance guidelines with regard to our security surrounding the physical and electronic storage, processing and transmission of cardholder data. We are currently in compliance with the PCI Standard, however, complying with the PCI Standard and implementing related procedures, technology and information security measures requires significant resources and ongoing attention. Costs and potential problems and interruptions associated with the implementation of new or upgraded systems and technology such as those necessary to maintain compliance with the PCI Standard or with maintenance or adequate support of existing systems could also disrupt or reduce the efficiency of our operations. Any material interruptions or failures in our
47
payment‑related systems could have a material adverse effect on our business, financial condition and results of operations.
Any disruptions to our information technology systems or breaches of our network security could interrupt our operations, compromise our reputation, expose us to litigation, government enforcement actions and costly response measures and could have a material adverse effect on our business, financial condition and results of operations.
We rely on the integrity, security and successful functioning of our information technology systems and network infrastructure across our operations. We use information technology systems to support our consumer services and plans, manage procurement and our supply chain, track inventory information at our retail locations, communicate customer information and aggregate daily sales, margin and promotional information. We also use information systems to report and audit our operational results.
In connection with sales, we transmit encrypted confidential credit and debit card information. Although we are currently in compliance with the PCI Standard, there can be no assurance that in the future we will be able to continue to operate our facilities and our customer service and sales operations in accordance with PCI or other industry recommended or contractually required practices. Even if we continue to be compliant with such standards, we still may not be able to prevent security breaches.
We also have access to, collect or maintain private or confidential information regarding our customers, associates and suppliers, as well as our business. For example, we have over 15.1 million unique RV contacts in our database, plus an additional 4.5 million from the Gander Outdoors and Overton’s businesses, as of December 31, 2017. This customer database includes information about our approximately 1.8 million club members and our 3.6 million RV Active Customers as of December 31, 2017. In addition, the protection of our customer, club member, associate, supplier and company data is critical to us. The regulatory environment surrounding information security and privacy is increasingly demanding, with the frequent imposition of new and constantly changing requirements across our business. In addition, customers have a high expectation that we will adequately protect their personal information from cyber‑attack or other security breaches. We have procedures in place to safeguard such data and information. However, a significant breach of club member, customer, employee, supplier, or company data could attract a substantial amount of negative media attention, damage our club member, customer and supplier relationships and our reputation, and result in lost sales, fines and/or lawsuits.
An increasingly significant portion of our sales depends on the continuing operation of our information technology and communications systems, including but not limited to our point‑of‑sale system and our credit card processing systems. Our information technology, communication systems and electronic data may be vulnerable to damage or interruption from earthquakes, acts of war or terrorist attacks, floods, fires, tornadoes, hurricanes, power loss and outages, computer and telecommunications failures, computer viruses, loss of data, unauthorized data breaches, usage errors by our associates or our contractors or other attempts to harm our systems, including cyber‑security attacks, hacking by third parties, computer viruses or other breaches of cardholder data. Some of our systems are not fully redundant, and our disaster recovery planning cannot account for all eventualities. The occurrence of a natural disaster, intentional sabotage or other unanticipated problems could result in lengthy interruptions in our service. Any errors or vulnerabilities in our systems, or damage to or failure of our systems, could result in interruptions in our services and non‑compliance with certain regulations or expose us to risk of litigation and liability, which could have a material adverse effect on our business, financial condition and results of operations. Further, we have centralized the majority of our computer systems in our facilities in Englewood, Colorado and Bowling Green, Kentucky. It is possible that an event or disaster at our facilities in Englewood, Colorado and Bowling Green, Kentucky could materially and adversely affect the performance of our company and the ability of each of our stores to operate efficiently.
Increases in the minimum wage could adversely affect our financial results.
From time to time, legislative proposals are made to increase the federal minimum wage in the United States, as well as the minimum wage in a number of individual states. As federal or state minimum wage rates increase, we may be required to increase not only the wage rates of our minimum wage employees, but
48
also the wages paid to our other hourly employees as well. Any increase in the cost of our labor could have an adverse effect on our operating costs, financial condition and results of operations.
Increases in paper costs, postage costs and shipping costs may have an adverse impact on our future financial results.
The price of paper is a significant expense relating to our publications and direct mail solicitations. Postage for publication distribution and direct mail solicitations is also a significant expense. In addition, shipping costs are a significant expense for our business. Paper, postage and shipping costs have increased in the past and may be expected to increase in the future. Such increases could have an adverse effect on our business if we are unable to pass them on to our customers.
We may be subject to product liability claims if people or property are harmed by the products we sell.
Some of the products we sell may expose us to product liability claims relating to personal injury, death, or environmental or property damage, and may require product recalls or other actions. Although we maintain liability insurance, we cannot be certain that our coverage will be adequate for liabilities actually incurred or that insurance will continue to be available to us on economically reasonable terms, or at all. In addition, some of our agreements with our vendors and sellers do not indemnify us from product liability. In addition, even if a product liability claim is not successful or is not fully pursued, the negative publicity surrounding a product recall or any assertion that our products caused property damage or personal injury could damage our brand identity and our reputation with existing and potential consumers and have a material adverse effect on our business, financial condition and results of operations.
We have a self‑insured retention (“SIR”) for products liability and personal injury matters ranging from $25,000 to $500,000 depending on the product type and when the occurrence took place. Generally, any occurrence (as defined by our insurance policies) after June 1, 2007 is subject to the $500,000 SIR. Amounts above the SIR, up to a certain dollar amount, are covered by our excess insurance policy. Currently, we maintain excess liability insurance aggregating $150.0 million with outside insurance carriers to minimize our risks related to catastrophic claims in excess of our self‑insured positions for products liability and personal injury matters. Any material change in the aforementioned factors could have an adverse impact on our results of operations. Any increase in the frequency and size of these claims, as compared to our experience in prior years, may cause the premium that we are required to pay for insurance to increase significantly and may negatively impact future SIR levels. It may also increase the amounts we pay in punitive damages, not all of which are covered by our insurance.
We may be named in litigation, which may result in substantial costs and reputational harm and divert management’s attention and resources.
We face legal risks in our business, including claims from disputes with our employees and our former employees and claims associated with general commercial disputes, product liability and other matters. Risks associated with legal liability often are difficult to assess or quantify and their existence and magnitude can remain unknown for significant periods of time. While we maintain director and officer insurance, as well as general and product liability insurance, the amount of insurance coverage may not be sufficient to cover a claim and the continued availability of this insurance cannot be assured. We have been named in the past and may be named in the future as defendants of class action lawsuits. For example, we were named as a defendant in a class action lawsuit by Camp Coast to Coast club members, which alleged certain violations of California’s Unfair Competition Law at Business and Professions Code and other laws, relating to our sale of trip points and certain advertising and marketing materials. In addition, we were also named as a defendant in a putative class action lawsuit filed by former employees in the State of California, which alleged various wage and hour claims under the California Labor Code. We have since settled both actions. Regardless of their subject matter or merits, class action lawsuits may result in significant cost to us, which may not be covered by insurance, may divert the attention of management or may otherwise have an adverse effect on our business, financial condition and results of operations. Negative publicity from litigation, whether or not resulting in a substantial cost, could materially damage our reputation. We may in the future be the target of litigation and this litigation may result in substantial costs and reputational harm and divert
49
management’s attention and resources. Costs, harm to our reputation and diversion could have a material adverse effect on our business, financial condition and results of operations.
Our private brand offerings expose us to various risks.
We expect to continue to grow our exclusive private brand offerings through a combination of brands that we own and brands that we license from third parties. We have invested in our development and procurement resources and marketing efforts relating to these private brand offerings. Although we believe that our private brand products offer value to our customers at each price point and provide us with higher gross margins than comparable third-party branded products we sell, the expansion of our private brand offerings also subjects us to certain specific risks in addition to those discussed elsewhere in this section, such as:
|
· |
potential mandatory or voluntary product recalls; |
|
· |
our ability to successfully protect our proprietary rights (including defending against counterfeit, knock offs, grey‑market, infringing or otherwise unauthorized goods); |
|
· |
our ability to successfully navigate and avoid claims related to the proprietary rights of third parties; |
|
· |
our ability to successfully administer and comply with obligations under license agreements that we have with the licensors of brands, including, in some instances, certain minimum sales requirements that, if not met, could cause us to lose the licensing rights or pay damages; and |
|
· |
other risks generally encountered by entities that source, sell and market exclusive branded offerings for retail. |
An increase in sales of our private brands may also adversely affect sales of our vendors’ products, which may, in turn, adversely affect our relationship with our vendors. Our failure to adequately address some or all of these risks could have a material adverse effect on our business, results of operations and financial condition.
Political and economic uncertainty and unrest in foreign countries where some of our merchandise vendors are located and trade restrictions upon imports from these foreign countries could adversely affect our ability to source merchandise and our results of operations.
For the years ended December 31, 2017 and 2016, approximately 5% and 8%, respectively, of our merchandise was imported directly from vendors located in foreign countries, with a substantial portion of the imported merchandise being obtained directly from vendors in China. In addition, we believe that a significant portion of our domestic vendors obtain their products from foreign countries that may also be subject to political and economic uncertainty. We are subject to risks and uncertainties associated with changing economic, political and other conditions in foreign countries where our vendors are located, such as:
|
· |
increased import duties, tariffs, trade restrictions and quotas; |
|
· |
work stoppages; |
|
· |
economic uncertainties; |
|
· |
adverse foreign government regulations; |
|
· |
wars, fears of war and terrorist attacks and organizing activities; |
|
· |
adverse fluctuations of foreign currencies; |
50
|
· |
natural disasters; and |
|
· |
political unrest. |
We cannot predict when, or the extent to which, the countries in which our products are manufactured will experience any of the above events. Any event causing a disruption or delay of imports from foreign locations would likely increase the cost or reduce the supply of merchandise available to us and would adversely affect our results of operations.
In addition, trade restrictions, including increased tariffs or quotas, embargoes, safeguards and customs restrictions against clothing items, as well as U.S. or foreign labor strikes, work stoppages or boycotts could increase the cost or reduce the supply of merchandise available to us or may require us to modify our current business practices, any of which could have a material adverse effect on our business, financial condition and results of operations.
Our risk management policies and procedures may not be fully effective in achieving their purposes.
Our policies, procedures, controls and oversight to monitor and manage our enterprise risks may not be fully effective in achieving their purpose and may leave exposure to identified or unidentified risks. Past or future misconduct by our employees or vendors could result in violations of law by us, regulatory sanctions and/or serious reputational harm or financial harm. We monitor our policies, procedures and controls; however, there can be no assurance that our policies, procedures and controls will be sufficient to prevent all forms of misconduct. We review our compensation policies and practices as part of our overall enterprise risk management program, but it is possible that our compensation policies could incentivize inappropriate risk taking or misconduct. If such inappropriate risks or misconduct occurs, it is possible that it could have a material adverse effect on our business, financial condition and results of operations.
We could incur asset impairment charges for goodwill, intangible assets or other long‑lived assets.
We have a significant amount of goodwill, intangible assets and other long‑lived assets. At least annually, we review goodwill for impairment. Long‑lived assets, identifiable intangible assets and goodwill are also reviewed for impairment whenever events or changes in circumstances indicate the carrying amount of an asset may not be recoverable from future cash flows. These events or circumstances could include a significant change in the business climate, legal factors, operating performance indicators, competition, sale or disposition of a significant portion of the business or other factors. If the carrying value of a long‑lived asset is considered impaired, an impairment charge is recorded for the amount by which the carrying value of the long‑lived asset exceeds its fair value. Our determination of future cash flows, future recoverability and fair value of our long‑lived assets includes significant estimates and assumptions. Changes in those estimates or assumptions or lower than anticipated future financial performance may result in the identification of an impaired asset and a non‑cash impairment charge, which could be material. Any such charge could adversely affect our business, financial condition and results of operations.
As we continue to open and operate existing Gander Outdoors retail locations, we may be required to raise additional funds in order to fund such openings. We cannot assure you that the terms of any additional debt or equity financing we obtain to fund the openings will be favorable to us.
In addition to our two Gander Outdoors and two Overton’s stores that are already open as of December 31, 2017, contingent on our final lease negotiations, our current plan is to open an additional 72 Gander Outdoors stores by May 2018, with measured growth thereafter. As a result, we will begin to incur meaningful incremental expenses without the benefit of the full revenue as we further ramp the Gander Outdoors business and open additional stores. Given our lack of operating history of these store locations, we expect to be exposed to longer start up times to reach profitability than our traditional greenfield location openings. Additionally, there is no assurance that we will reach profitability with respect to these additional stores.
51
Based on our current plans, we currently expect to fund the opening and initial working capital needs of our Gander Outdoors stores and certain liabilities that we will assume in connection therewith with available cash on hand and proceeds from the Second Amendment to our Existing Senior Secured Credit Facilities. We may also be required to raise additional capital from equity or debt financing to finance the opening and operation of Gander Outdoors stores. We cannot assure you that we will be able to obtain such additional equity or debt financing on favorable terms or at all. Moreover, the issuance by us of Class A common stock in any future offerings may result in substantial dilution to our existing stockholders and may have a material adverse effect on the market price of our Class A common stock. Furthermore, to the extent that we need to incur additional debt financing in connection with the opening and operation of any Gander Outdoors retail locations, such debt financings may have an adverse effect on our financial condition and may limit our ability to obtain financing in the future.
Additionally, if we fail to realize the expected benefits from integrating Gander Outdoors and Overton’s brands with our pre-existing businesses and opening and operating related retail locations, or if the financial performance of Gander Outdoors or Overton’s does not meet our current expectations, it may make it more difficult for us to service our debt and our results of operations may fail to meet expectations.
We may not complete the opening of Gander Outdoors retail locations within the time frame we anticipate or at all, which could have a negative effect on our business and our results of operations.
In addition to our two Gander Outdoors and two Overton’s stores that are already open as of December 31, 2017, contingent on our final lease negotiations, our current plan is to open an additional 72 Gander Outdoors stores by May 2018, with measured growth thereafter. As a result, we will begin to incur meaningful incremental expenses without the benefit of the full revenue as we begin to further ramp the Gander Outdoors business and open additional stores. Additionally, given the liquidation of the Gander Outdoors inventory prior to opening these additional stores, we will need to supply each retail location that we determine to operate with new inventory in a timely manner, which may also require us to raise additional capital from equity or debt financings. If we are unable to negotiate lease terms with the landlords acceptable to us, order new inventory or raise additional capital, in each case, within the expected time frame, or at all, it could have a negative effect on our financial performance and our ability to execute on our operating strategy for Gander Outdoors.
Opening and operating Gander Outdoors and Overton's retail locations may be more difficult, costly or time consuming than expected and the anticipated benefits and cost savings of integrating Gander Outdoors and Overton’s brands into our pre-existing businesses may not be fully realized.
The success of Gander Outdoors and Overton’s brands, including the realization of anticipated benefits and cost savings from integrating the two brands with our pre-existing businesses, will depend, in part, on our ability to successfully integrate the businesses of Gander Outdoors and Overton's with our pre-existing businesses. The integration may be more difficult, costly or time consuming than expected. It is possible that the integration process could result in the loss of key employees or the disruption of each company's ongoing businesses or that the alignment of standards, controls, procedures and policies may adversely affect the combined company's ability to maintain relationships with clients, customers, suppliers and employees or to fully achieve the anticipated benefits and cost savings of the transaction. The loss of key employees could adversely affect our ability to successfully conduct our existing business in the markets in which Gander Outdoors and Overton's operate, which could have an adverse effect on our financial results and the market price of our Class A common stock. Other potential difficulties of integrating the businesses of Gander Outdoors and Overton's with our pre-existing businesses include unanticipated issues in integrating suppliers, logistics, distribution, retail operations, negotiation of lease terms with landlords on terms acceptable to us, information communications and other systems. We also expect to continue to incur non-recurring charges, including transaction costs, directly attributable to the integration of Gander Outdoors and Overton’s brands, as well as the opening of related retail locations.
52
If we experience difficulties with the integration process, the anticipated benefits of the opening and operating Gander Outdoors and Overton’s locations may not be realized fully or at all, or may take longer to realize than expected. Integration efforts between the companies may also divert management attention and resources. These integration matters could have an adverse effect on each of Gander Outdoors, Overton's and our pre-existing businesses during this transition period and on the combined company afterwards.
Moreover, in connection with the opening of the Gander Outdoors and Overton’s retail locations, we expect that we will continue to expand into numerous new markets and will be selling various new product lines or categories, including firearms. See "— We may incur costs from litigation relating to products that we currently sell as a result of opening and operating Gander Outdoors and Overton’s retail locations, particularly firearms and ammunition products, which could adversely affect our total revenue and profitability." As a result, opening retail locations may be more costly or time consuming than expected. Additionally, our unfamiliarity with the Gander Outdoors and Overton’s product lines and new markets may also impact our ability to operate these locations profitably once they are opened. Other factors that may impact the profitability of these retail locations include our ability to retain existing store personnel or hire and train new store personnel, especially management personnel, our ability to provide a satisfactory mix of merchandise, our ability to negotiate favorable lease agreements, our ability to supply retail locations with inventory in a timely manner and the other factors described under "— Risks Related to our Business — Our expansion into new, unfamiliar markets, products lines or categories presents increased risks that may prevent us from being profitable in these new markets, products lines or categories. Delays in opening or acquiring new retail locations could have a material adverse effect on our business, financial condition and results of operations" under ‘‘Risk Factors’’ in Item 1A of Part I of our Annual Report. As a result, we cannot assure you that we will be successful in operating the Gander Outdoors and Overton’s businesses on a profitable basis, and our failure to do so could have a material adverse effect on our business, financial condition and results of operations.
We may incur costs from litigation relating to products that we currently sell as a result of the Gander Mountain acquisition and the opening of retail locations, particularly firearms and ammunition, which could adversely affect our total revenue and profitability.
We may incur damages due to lawsuits relating to products we currently sell as a result of the Gander Mountain acquisition and the opening of the rebranded Gander Outdoors retail locations, including, but not limited to, lawsuits relating to firearms, ammunition, tree stands and archery equipment. We may incur losses due to lawsuits, including potential class actions, relating to our performance of background checks on firearms purchases and compliance with other sales laws as mandated by state and federal law. We may also incur losses from lawsuits relating to the improper use of firearms or ammunition sold by us, including lawsuits by municipalities or other organizations attempting to recover costs from manufacturers and retailers of firearms and ammunition. Our insurance coverage and the insurance provided by our vendors for certain products they sell to us may be inadequate to cover claims and liabilities related to products that we sell. In addition, claims or lawsuits related to products that we sell, or the unavailability of insurance for product liability claims, could result in the elimination of these products from our product line, thereby reducing total revenue. If one or more successful claims against us are not covered by or exceed our insurance coverage, or if insurance coverage is no longer available, our available working capital may be impaired and our operating results could be materially adversely affected. Even unsuccessful claims could result in the expenditure of funds and management time and could have a negative impact on our profitability and on future premiums we would be required to pay on our insurance policies.
Risks Relating to Our Organizational Structure
Marcus Lemonis, through his beneficial ownership of our shares directly or indirectly held by ML Acquisition and ML RV Group, has substantial control over us, including over decisions that require the approval of stockholders, and his interests, along with the interests of our other Continuing Equity Owners, in our business may conflict with yours.
Each share of our Class B common stock entitles its holders to one vote per share on all matters presented to our stockholders generally provided that, for as long as ML Acquisition Company, LLC, a Delaware limited liability company, indirectly owned by each of Stephen Adams and our Chairman and Chief
53
Executive Officer, Marcus Lemonis (“ML Acquisition”) and its permitted transferees of common units (the “ML Related Parties”), directly or indirectly, beneficially own in the aggregate 27.5% or more of all of the outstanding common units of CWGS, LLC, the shares of our Class B common stock held by the ML Related Parties entitle the ML Related Parties, and, through his beneficial ownership of our shares directly or indirectly held by ML Acquisition, Marcus Lemonis, to the number of votes necessary such that the ML Related Parties, in the aggregate, cast 47% of the total votes eligible to be cast by all of our stockholders on all matters presented to a vote of our stockholders generally. Additionally, our one share of Class C common stock entitles ML RV Group, LLC, a Delaware limited liability company, wholly-owned by our Chairman and Chief Executive Officer, Marcus Lemonis (“ML RV Group”) and, through his beneficial ownership of our shares directly or indirectly held by ML RV Group, Marcus Lemonis, to the number of votes necessary such that he casts 5% of the total votes eligible to be cast by all of our stockholders on all matters presented to a vote of our stockholders generally for as long as there is no Class C Change of Control (as defined in our amended and restated certificate of incorporation). Accordingly, subject to the voting agreement that we entered into with ML Acquisition, ML RV Group, CVRV Acquisition LLC and CVRV Acquisition II LLC in connection with our IPO (the “Voting Agreement”) as described below, Marcus Lemonis, through his beneficial ownership of our shares directly or indirectly held by ML Acquisition and ML RV Group, may approve or disapprove substantially all transactions and other matters requiring approval by our stockholders, such as a merger, consolidation, dissolution or sale of all or substantially all of our assets, the issuance or redemption of certain additional equity interests, and the election of directors. These voting and class approval rights may also enable Marcus Lemonis to approve transactions that may not be in the best interests of holders of our Class A common stock or, conversely, prevent the consummation of transactions that may be in the best interests of holders of our Class A common stock.
Additionally, the Continuing Equity Owners may receive payments from us under the Tax Receivable Agreement upon any redemption or exchange of their common units in CWGS, LLC, including the issuance of shares of our Class A common stock upon any such redemption or exchange. As a result, the interests of the Continuing Equity Owners may conflict with the interests of holders of our Class A common stock. For example, the Continuing Equity Owners may have different tax positions from us which could influence their decisions regarding whether and when to dispose of assets, whether and when to incur new or refinance existing indebtedness, especially in light of the existence of the Tax Receivable Agreement, and whether and when we should terminate the Tax Receivable Agreement and accelerate our obligations thereunder. In addition, the structuring of future transactions may take into consideration tax or other considerations of the Continuing Equity Owners even in situations where no similar considerations are relevant to us.
In addition, pursuant to the Voting Agreement, Crestview Advisors, L.L.C., a registered investment adviser to private equity funds, including funds affiliated with Crestview Partners II GP, L.P. (“Crestview”) has the right to designate certain of our directors (the “Crestview Directors”), which will be four Crestview Directors (unless Marcus Lemonis is no longer our Chief Executive Officer, in which case, Crestview will have the right to designate three Crestview Directors) for as long as Crestview Partners II GP, L.P. directly or indirectly, beneficially owns, in the aggregate, 32.5% or more of our Class A common stock, three Crestview Directors for so long as Crestview Partners II GP, L.P., directly or indirectly, beneficially owns, in the aggregate, less than 32.5% but 25% or more of our Class A common stock, two Crestview Directors for as long as Crestview Partners II GP, L.P., directly or indirectly, beneficially owns, in the aggregate, less than 25% but 15% or more of our Class A common stock and one Crestview Director for as long as Crestview Partners II GP, L.P., directly or indirectly, beneficially owns, in the aggregate, less than 15% but 7.5% or more of our Class A common stock (assuming in each such case that all outstanding common units in CWGS, LLC are redeemed for newly-issued shares of our Class A common stock on a one for one basis). Crestview currently has the right to designate two Crestview Directors. Each of ML Acquisition and ML RV Group has agreed to vote, or cause to vote, all of their outstanding shares of our Class A common stock, Class B common stock and Class C common stock at any annual or special meeting of stockholders in which directors are elected, so as to cause the election of the Crestview Directors. In addition, the ML Related Parties also have the right to designate certain of our directors (the “ML Acquisition Directors”), which will be four ML Acquisition Directors for as long as the ML Related Parties, directly or indirectly, beneficially own in the aggregate 27.5% or more of our Class A common stock, three ML Acquisition Directors for as long as the ML Related Parties, directly or indirectly, beneficially own, in the aggregate, less than 27.5% but 25% or more of our Class A common stock, two ML Acquisition Directors for as long as the ML Related Parties, directly or indirectly, beneficially own, in the aggregate, less than 25% but 15% or more of our Class A common stock
54
and one ML Acquisition Director for as long as the ML Related Parties, directly or indirectly, beneficially own, in the aggregate, less than 15% but 7.5% or more of our Class A common stock (assuming in each such case that all outstanding common units in CWGS, LLC are redeemed for newly-issued shares of our Class A common stock on a one for one basis). Moreover, ML RV Group has the right to designate one director for as long as it holds our one share of Class C common stock (the “ML RV Director”). Funds controlled by Crestview Partners II GP, L.P. have agreed to vote, or cause to vote, all of their outstanding shares of our Class A common stock and Class B common stock at any annual or special meeting of stockholders in which directors are elected, so as to cause the election of the ML Acquisition Directors and the ML RV Director. Additionally, pursuant to the Voting Agreement, we are required to take commercially reasonable action to cause (i) the board of directors to be comprised at least of nine directors; (ii) the individuals designated in accordance with the terms of the Voting Agreement to be included in the slate of nominees to be elected to the board of directors at the next annual or special meeting of stockholders of the Company at which directors are to be elected and at each annual meeting of stockholders of the Company thereafter at which a director’s term expires; (iii) the individuals designated in accordance with the terms of the Voting Agreement to fill the applicable vacancies on the board of directors; and (iv) a ML Acquisition Director or the ML RV Director to be the chairperson of the board of directors (as defined in our amended and restated bylaws). The Voting Agreement allows for the board of directors to reject the nomination, appointment or election of a particular director if such nomination, appointment or election would constitute a breach of the board of directors’ fiduciary duties to the Company’s stockholders or does not otherwise comply with any requirements of our amended and restated certificate of incorporation or our amended and restated bylaws or the charter for, or related guidelines of, the board of directors’ nominating and corporate governance committee.
The Voting Agreement further provides that, for so long as Crestview Partners II GP, L.P., directly or indirectly, beneficially owns, in the aggregate, 22.5% or more of our Class A common stock, or the ML Related Parties, directly or indirectly, beneficially own, in the aggregate, 22.5% or more of our Class A common stock (assuming in each such case that all outstanding common units in CWGS, LLC are redeemed for newly-issued shares of our Class A common stock on a one‑for‑one basis), the approval of Crestview Partners II GP, L.P. and the ML Related Parties, as applicable, will be required for certain corporate actions. These actions include: (1) a change of control; (2) acquisitions or dispositions of assets above $100 million; (3) the issuance of securities of Camping World Holdings, Inc. or any of its subsidiaries (other than under equity incentive plans that have received the prior approval of our board of directors); (4) material amendments to our certificate of incorporation or bylaws; and (5) any change in the size of the board of directors. The Voting Agreement also provides that, for so long as either Crestview Partners II GP, L.P., directly or indirectly, beneficially owns, in the aggregate, 28% or more of our Class A common stock, or the ML Related Parties, directly or indirectly, beneficially own, in the aggregate, 28% or more of our Class A common stock (assuming in each such case that all outstanding common units of CWGS, LLC are redeemed for newly-issued shares of our Class A common stock, on a one‑for‑one basis), the approval of Crestview Partners II GP, L.P. and the ML Related Parties, as applicable, will be required for the hiring and termination of our Chief Executive Officer; provided, however, that the approval of Crestview Partners II GP, L.P., and the ML Related Parties, as applicable, is only required at such time as Marcus Lemonis no longer serves as our Chief Executive Officer. These rights may prevent the consummation of transactions that may be in the best interests of holders of our Class A common stock.
Our amended and restated certificate of incorporation provides that the doctrine of “corporate opportunity” does not apply with respect to any director or stockholder who is not employed by us or our affiliates.
The doctrine of corporate opportunity generally provides that a corporate fiduciary may not develop an opportunity using corporate resources, acquire an interest adverse to that of the corporation or acquire property that is reasonably incident to the present or prospective business of the corporation or in which the corporation has a present or expectancy interest, unless that opportunity is first presented to the corporation and the corporation chooses not to pursue that opportunity. The doctrine of corporate opportunity is intended to preclude officers or directors or other fiduciaries from personally benefiting from opportunities that belong to the corporation. Our amended and restated certificate of incorporation provides that the doctrine of “corporate opportunity” does not apply with respect to any director or stockholder who is not employed by us or our affiliates. Any director or stockholder who is not employed by us or our affiliates therefore has no duty to communicate or present corporate opportunities to us, and has the right to either hold any corporate
55
opportunity for their (and their affiliates’) own account and benefit or to recommend, assign or otherwise transfer such corporate opportunity to persons other than us, including to any director or stockholder who is not employed by us or our affiliates.
As a result, certain of our stockholders, directors and their respective affiliates are not prohibited from operating or investing in competing businesses. We therefore may find ourselves in competition with certain of our stockholders, directors or their respective affiliates, and we may not have knowledge of, or be able to pursue, transactions that could potentially be beneficial to us. Accordingly, we may lose a corporate opportunity or suffer competitive harm, which could negatively impact our business or prospects.
We are a “controlled company” within the meaning of the NYSE listing requirements and, as a result, qualify for, and rely on, exemptions from certain corporate governance requirements. Our stockholders do not have the same protections afforded to stockholders of companies that are subject to such corporate governance requirements.
Pursuant to the terms of the Voting Agreement, Marcus Lemonis, through his beneficial ownership of our shares directly or indirectly held by ML Acquisition and ML RV Group, and certain funds controlled by Crestview Partners II GP, L.P., in the aggregate, have more than 50% of the voting power for the election of directors, and, as a result, we are considered a “controlled company” for the purposes of the New York Stock Exchange (the “NYSE”) listing requirements. As such, we qualify for, and rely on, exemptions from certain corporate governance requirements, including the requirements to have a majority of independent directors on our board of directors, an entirely independent nominating and corporate governance committee, an entirely independent compensation committee or to perform annual performance evaluation of the nominating and corporate governance and compensation committees.
The corporate governance requirements and specifically the independence standards are intended to ensure that directors who are considered independent are free of any conflicting interest that could influence their actions as directors. We have utilized, and intend to continue to utilize, certain exemptions afforded to a “controlled company.” As a result, we are not subject to certain corporate governance requirements, including that a majority of our board of directors consists of “independent directors,” as defined under the rules of the NYSE. In addition, we are not required to have a nominating and corporate governance committee or compensation committee that is composed entirely of independent directors with a written charter addressing the committee’s purpose and responsibilities or to conduct annual performance evaluations of the nominating and corporate governance and compensation committees and currently we do not have an entirely independent nominating and corporate governance committee. Accordingly, our stockholders do not have the same protections afforded to stockholders of companies that are subject to all of the corporate governance requirements of the NYSE.
Our principal asset is our interest in CWGS, LLC, and accordingly, we depend on distributions from CWGS, LLC to pay dividends, taxes and expenses, including payments under the Tax Receivable Agreement. CWGS, LLC’s ability to make such distributions may be subject to various limitations and restrictions.
We are a holding company and had no material assets as of December 31, 2017, other than our ownership of 36,749,072 common units, representing a 41.5% economic interest in the business of CWGS, LLC, and cash of $14.5 million. We have no independent means of generating revenue or cash flow, and our ability to pay dividends in the future, if any, will be dependent upon the financial results and cash flows of CWGS, LLC and its subsidiaries and distributions we receive from CWGS, LLC. There can be no assurance that our subsidiaries will generate sufficient cash flow to dividend or distribute funds to us or that applicable state law and contractual restrictions, including negative covenants in our debt instruments, will permit such dividends or distributions.
CWGS, LLC is treated as a partnership for U.S. federal income tax purposes and, as such, is not subject to any entity‑level U.S. federal income tax. Instead, taxable income is allocated to holders of its common units, including us. As a result, we incur income taxes on our allocable share of any net taxable income of CWGS, LLC. Under the terms of the CWGS LLC Agreement, CWGS, LLC is obligated to make tax distributions to holders of its common units, including us, except to the extent such distributions would render
56
CWGS, LLC insolvent or are otherwise prohibited by law or our Existing Senior Secured Credit Facilities, our Floor Plan Facility or any of our future debt agreements. In addition to tax expenses, we will also incur expenses related to our operations, our interests in CWGS, LLC and related party agreements, including payment obligations under the Tax Receivable Agreement, and expenses and costs of being a public company, all of which could be significant. We intend, as its managing member, to cause CWGS, LLC to make distributions in an amount sufficient to allow us to pay our taxes and operating expenses, including any ordinary course payments due under the Tax Receivable Agreement. However, CWGS, LLC’s ability to make such distributions may be subject to various limitations and restrictions including, but not limited to, restrictions on distributions that would either violate any contract or agreement to which CWGS, LLC is then a party, including debt agreements, or any applicable law, or that would have the effect of rendering CWGS, LLC insolvent. If CWGS, LLC does not have sufficient funds to pay tax distributions or other liabilities to fund our operations, we may have to borrow funds, which could materially adversely affect our liquidity and financial condition and subject us to various restrictions imposed by any such lenders. To the extent that we are unable to make payments under the Tax Receivable Agreement for any reason, such payments will be deferred and will accrue interest until paid; provided, however, that nonpayment for a specified period may constitute a material breach of a material obligation under the Tax Receivable Agreement and therefore may accelerate payments due under the Tax Receivable Agreement. If CWGS, LLC does not have sufficient funds to make distributions, our ability to declare and pay cash dividends may also be restricted or impaired. See “— Risks Relating to Ownership of Our Class A Common Stock.”
Our Tax Receivable Agreement with the Continuing Equity Owners and Crestview Partners II GP, L.P. requires us to make cash payments to them in respect of certain tax benefits to which we may become entitled, and the amounts that we may be required to pay could be significant.
In connection with our IPO, we entered into a Tax Receivable Agreement with CWGS, LLC, each of the Continuing Equity Owners and Crestview Partners II GP, L.P. Pursuant to the Tax Receivable Agreement, we are required to make cash payments to the Continuing Equity Owners and Crestview Partners II GP, L.P. equal to 85% of the tax benefits, if any, that we actually realize, or in some circumstances are deemed to realize as a result of (i) increases in tax basis resulting from the purchase of common units from Crestview Partners II GP, L.P. in exchange for Class A common stock in connection with the consummation of the IPO and the related corporate reorganization transactions and any future redemptions that are funded by Camping World Holdings, Inc. or exchanges of common units and (ii) certain other tax benefits attributable to payments under the Tax Receivable Agreement. The amount of the cash payments that we may be required to make under the Tax Receivable Agreement could be significant. Payments under the Tax Receivable Agreement will be based on the tax reporting positions that we determine, which tax reporting positions are subject to challenge by taxing authorities. Any payments made by us to the Continuing Equity Owners and Crestview Partners II GP, L.P. under the Tax Receivable Agreement will generally reduce the amount of overall cash flow that might have otherwise been available to us. To the extent that we are unable to make timely payments under the Tax Receivable Agreement for any reason, the unpaid amounts will be deferred and will accrue interest until paid by us. Nonpayment for a specified period may constitute a material breach of a material obligation under the Tax Receivable Agreement and therefore may accelerate payments due under the Tax Receivable Agreement. Furthermore, our future obligation to make payments under the Tax Receivable Agreement could make us a less attractive target for an acquisition, particularly in the case of an acquirer that cannot use some or all of the tax benefits that may be deemed realized under the Tax Receivable Agreement. The payments under the Tax Receivable Agreement are also not conditioned upon the Continuing Equity Owners or Crestview Partners II GP, L.P. maintaining a continued ownership interest in CWGS, LLC.
The amounts that we may be required to pay to the Continuing Equity Owners and Crestview Partners II GP, L.P. under the Tax Receivable Agreement may be accelerated in certain circumstances and may also significantly exceed the actual tax benefits that we ultimately realize.
The Tax Receivable Agreement provides that if certain mergers, asset sales, other forms of business combination, or other changes of control were to occur, if we materially breach any of our material obligations under the Tax Receivable Agreement or if, at any time, we elect an early termination of the Tax Receivable Agreement, then the Tax Receivable Agreement will terminate and our obligations, or our successor’s obligations, to make payments under the Tax Receivable Agreement would accelerate and become
57
immediately due and payable. The amount due and payable in those circumstances is determined based on certain assumptions, including an assumption that we would have sufficient taxable income to fully utilize all potential future tax benefits that are subject to the Tax Receivable Agreement. We may need to incur debt to finance payments under the Tax Receivable Agreement to the extent our cash resources are insufficient to meet our obligations under the Tax Receivable Agreement as a result of timing discrepancies or otherwise.
As a result of the foregoing, (i) we could be required to make cash payments to the Continuing Equity Owners and Crestview Partners II GP, L.P. that are greater than the specified percentage of the actual benefits we ultimately realize in respect of the tax benefits that are subject to the Tax Receivable Agreement and (ii) we would be required to make an immediate cash payment equal to the present value of the anticipated future tax benefits that are the subject of the Tax Receivable Agreement, which payment may be made significantly in advance of the actual realization, if any, of such future tax benefits. In these situations, our obligations under the Tax Receivable Agreement could have a substantial negative impact on our liquidity and could have the effect of delaying, deferring or preventing certain mergers, asset sales, other forms of business combination, or other changes of control. There can be no assurance that we will be able to finance our obligations under the Tax Receivable Agreement.
We will not be reimbursed for any payments made to the Continuing Equity Owners and Crestview Partners II GP, L.P. under the Tax Receivable Agreements in the event that any tax benefits are disallowed.
We will not be reimbursed for any cash payments previously made to the Continuing Equity Owners and Crestview Partners II GP, L.P. pursuant to the Tax Receivable Agreement if any tax benefits initially claimed by us are subsequently challenged by a taxing authority and are ultimately disallowed. Instead, any excess cash payments made by us to a Continuing Equity Owner or Crestview Partners II GP, L.P. will be netted against any future cash payments that we might otherwise be required to make under the terms of the Tax Receivable Agreement. However, a challenge to any tax benefits initially claimed by us may not arise for a number of years following the initial time of such payment or, even if challenged early, such excess cash payment may be greater than the amount of future cash payments that we might otherwise be required to make under the terms of the Tax Receivable Agreement and, as a result, there might not be future cash payments from which to net against. The applicable U.S. federal income tax rules are complex and factual in nature, and there can be no assurance that the IRS or a court will not disagree with our tax reporting positions. As a result, it is possible that we could make cash payments under the Tax Receivable Agreement that are substantially greater than our actual cash tax savings.
Unanticipated changes in effective tax rates or adverse outcomes resulting from examination of our income or other tax returns could adversely affect our operating results and financial condition.
We are subject to income taxes in the United States, and our tax liabilities will be subject to the allocation of expenses in differing jurisdictions. Our future effective tax rates could be subject to volatility or adversely affected by a number of factors, including:
|
· |
changes in the valuation of our deferred tax assets and liabilities; |
|
· |
expected timing and amount of the release of any tax valuation allowances; |
|
· |
expiration of, or detrimental changes in, research and development tax credit laws; |
|
· |
tax effects of equity‑based compensation; |
|
· |
costs related to intercompany restructurings; or |
|
· |
changes in tax laws, regulations or interpretations thereof. |
58
In addition, we may be subject to audits of our income, sales and other transaction taxes by U.S. federal and state authorities. Outcomes from these audits could have an adverse effect on our operating results and financial condition.
If we were deemed to be an investment company under the Investment Company Act of 1940, as amended (the “1940 Act”), as a result of our ownership of CWGS, LLC, applicable restrictions could make it impractical for us to continue our business as contemplated and could have a material adverse effect on our business, financial condition and results of operations.
Under Sections 3(a)(1)(A) and (C) of the 1940 Act, a company generally will be deemed to be an “investment company” for purposes of the 1940 Act if (i) it is, or holds itself out as being, engaged primarily, or proposes to engage primarily, in the business of investing, reinvesting or trading in securities or (ii) it engages, or proposes to engage, in the business of investing, reinvesting, owning, holding or trading in securities and it owns or proposes to acquire investment securities having a value exceeding 40% of the value of its total assets (exclusive of U.S. government securities and cash items) on an unconsolidated basis. We do not believe that we are an “investment company,” as such term is defined in either of those sections of the 1940 Act.
As the sole managing member of CWGS, LLC, we control and operate CWGS, LLC. On that basis, we believe that our interest in CWGS, LLC is not an “investment security” as that term is used in the 1940 Act. However, if we were to cease participation in the management of CWGS, LLC, our interest in CWGS, LLC could be deemed an “investment security” for purposes of the 1940 Act.
We and CWGS, LLC intend to conduct our operations so that we will not be deemed an investment company. However, if we were to be deemed an investment company, restrictions imposed by the 1940 Act, including limitations on our capital structure and our ability to transact with affiliates, could make it impractical for us to continue our business as contemplated and could have a material adverse effect on our business, financial condition and results of operations.
Our organizational structure, including the Tax Receivable Agreement, confers certain benefits upon the Continuing Equity Owners and Crestview Partners II GP, L.P. that do not benefit Class A common stockholders to the same extent as it benefits the Continuing Equity Owners and Crestview Partners II GP, L.P.
Our organizational structure, including the Tax Receivable Agreement, confers certain benefits upon the Continuing Equity Owners and Crestview Partners II GP, L.P. that do not benefit the holders of our Class A common stock to the same extent as it benefits such Continuing Equity Owners and Crestview Partners II GP, L.P. In connection with our IPO, we entered into the Tax Receivable Agreement with CWGS, LLC and such Continuing Equity Owners and Crestview Partners II GP, L.P. and it provides for the payment by Camping World Holdings, Inc. to the Continuing Equity Owners and Crestview Partners II GP, L.P. of 85% of the amount of tax benefits, if any, that Camping World Holdings, Inc. actually realizes, or in some circumstances is deemed to realize, as a result of (i) increases in tax basis resulting from the purchase of common units from Crestview Partners II GP, L.P. in exchange for Class A common stock in connection with the consummation of the IPO and the related corporate reorganization transactions and any future redemptions that are funded by Camping World Holdings, Inc. or exchanges of common units and (ii) certain other tax benefits attributable to payments under the Tax Receivable Agreement. Although Camping World Holdings, Inc. will retain 15% of the amount of such tax benefits, this and other aspects of our organizational structure may adversely impact the future trading market for the Class A common stock.
Risks Relating to Ownership of Our Class A Common Stock
The Continuing Equity Owners (through common units) own interests in CWGS, LLC, and the Continuing Equity Owners have the right to redeem their interests in CWGS, LLC pursuant to the terms of the CWGS LLC Agreement for newly-issued shares of Class A common stock or cash.
At December 31, 2017, we had an aggregate of 213,241,767 shares of Class A common stock authorized but unissued, including approximately 51,890,495 shares of Class A common stock issuable, at
59
our election, upon redemption of CWGS, LLC common units held by the Continuing Equity Owners. In connection with our IPO, CWGS, LLC entered into the CWGS LLC Agreement, and subject to certain restrictions set forth therein, the Continuing Equity Owners are entitled to have their common units redeemed from time to time at each of their options for, at our election (determined solely by our independent directors (within the meaning of the rules of the NYSE) who are disinterested), newly-issued shares of our Class A common stock on a one‑for‑one basis or a cash payment equal to a volume weighted average market price of one share of Class A common stock for each common unit redeemed, in each case in accordance with the terms of the CWGS LLC Agreement; provided that, at our election (determined solely by our independent directors (within the meaning of the rules of the NYSE) who are disinterested), we may effect a direct exchange of such Class A common stock or such cash, as applicable, for such common units. The Continuing Equity Owners may exercise such redemption right for as long as their common units remain outstanding. In connection with our IPO, we also entered into a Registration Rights Agreement pursuant to which the shares of Class A common stock issued upon such redemption and the shares of Class A common stock issued to the Former Equity Owners in connection with the corporate reorganization transactions entered into in connection therewith will be eligible for resale, subject to certain limitations set forth therein.
We cannot predict the size of future issuances of our Class A common stock or the effect, if any, that future issuances and sales of shares of our Class A common stock may have on the market price of our Class A common stock. Sales or distributions of substantial amounts of our Class A common stock, including shares issued in connection with an acquisition, or the perception that such sales or distributions could occur, may cause the market price of our Class A common stock to decline.
You may be diluted by future issuances of additional Class A common stock or common units in connection with our incentive plans, acquisitions or otherwise; future sales of such shares in the public market, or the expectations that such sales may occur, could lower our stock price.
Our amended and restated certificate of incorporation authorizes us to issue shares of our Class A common stock and options, rights, warrants and appreciation rights relating to our Class A common stock for the consideration and on the terms and conditions established by our board of directors in its sole discretion, whether in connection with acquisitions or otherwise. In addition, we, CWGS, LLC and the Continuing Equity Owners are party to the CWGS LLC Agreement under which the Continuing Equity Owners (or certain permitted transferees thereof) have the right (subject to the terms of the CWGS LLC Agreement) to have their common units redeemed from time to time at each of their options by CWGS, LLC in exchange for, at our election (determined solely by our independent directors (within the meaning of the rules of the NYSE) who are disinterested), newly-issued shares of our Class A common stock on a one‑for‑one basis or a cash payment equal to a volume weighted average market price of one share of Class A common stock for each common unit redeemed, in each case in accordance with the terms of the CWGS LLC Agreement; provided that, at our election (determined solely by our independent directors (within the meaning of the rules of the NYSE) who are disinterested), we may effect a direct exchange of such Class A common stock or such cash, as applicable, for such common units. The Continuing Equity Owners may exercise such redemption right for as long as their common units remain outstanding. The market price of shares of our Class A common stock could decline as a result of these redemptions or exchanges or the perception that a redemption could occur. These redemptions or exchanges, or the possibility that these redemptions or exchanges may occur, also might make it more difficult for holders of our Class A common stock to sell such stock in the future at a time and at a price that they deem appropriate.
We have reserved shares for issuance under our 2016 Incentive Award Plan (the “2016 Plan”) in an amount equal to 14,693,518 shares of Class A common stock, including, as of December 31, 2017, shares of Class A common stock issuable pursuant to 1,132,557 stock options and 1,290,552 restricted stock units that were granted to certain of our directors and certain of our employees. Any Class A common stock that we issue, including under our 2016 Plan or other equity incentive plans that we may adopt in the future, would dilute the percentage ownership of holders of our Class A common stock.
In connection with our IPO, we entered into a Registration Rights Agreement with the Original Equity Owners. Any sales in connection with the Registration Rights Agreement, or the prospect of any such sales, could materially impact the market price of our Class A common stock and could impair our ability to raise capital through future sales of equity securities.
60
In the future, we may also issue additional securities if we need to raise capital, including, but not limited to, in connection with acquisitions, which could constitute a material portion of our then‑outstanding shares of Class A common stock.
Our Class A common stock price may be volatile or may decline regardless of our operating performance.
Volatility in the market price of our Class A common stock may prevent you from being able to sell your shares at or above the price you paid for such shares. Many factors, which are outside our control, may cause the market price of our Class A common stock to fluctuate significantly, including those described elsewhere in this “Risk Factors” section and this Form 10-K, as well as the following:
|
· |
our operating and financial performance and prospects; |
|
· |
our quarterly or annual earnings or those of other companies in our industry compared to market expectations; |
|
· |
conditions that impact demand for our services; |
|
· |
future announcements concerning our business or our competitors’ businesses; |
|
· |
the public’s reaction to our press releases, other public announcements and filings with the SEC; |
|
· |
the size of our public float; |
|
· |
coverage by or changes in financial estimates by securities analysts or failure to meet their expectations; |
|
· |
market and industry perception of our success, or lack thereof, in pursuing our growth strategy; |
|
· |
strategic actions by us or our competitors, such as acquisitions or restructurings; |
|
· |
changes in laws or regulations which adversely affect our industry or us; |
|
· |
changes in accounting standards, policies, guidance, interpretations or principles; |
|
· |
changes in senior management or key personnel; |
|
· |
issuances, exchanges or sales, or expected issuances, exchanges or sales of our capital stock; |
|
· |
changes in our dividend policy; |
|
· |
adverse resolution of new or pending litigation against us; and |
|
· |
changes in general market, economic and political conditions in the United States and global economies or financial markets, including those resulting from natural disasters, terrorist attacks, acts of war and responses to such events. |
As a result, volatility in the market price of our Class A common stock may prevent investors from being able to sell their Class A common stock at or above the price they paid for such shares. These broad market and industry factors may materially reduce the market price of our Class A common stock, regardless of our operating performance. In addition, price volatility may be greater if the public float and trading volume of our Class A common stock is low. As a result, you may suffer a loss on your investment.
61
Our ability to pay regular and special dividends on our Class A common stock is subject to the discretion of our board of directors and may be limited by our structure and statutory restrictions and restrictions imposed by our Existing Senior Secured Credit Facilities and our Floor Plan Facility as well as any future agreements.
CWGS, LLC has in the past made a regular quarterly cash distribution to its common unit holders of approximately $0.08 per common unit, and CWGS, LLC intends to continue to make such quarterly cash distributions. We have used in the past, and intend to continue to use, all of the proceeds from such distributions on our common units to declare cash dividends on our Class A common stock.
CWGS, LLC is required to make cash distributions in accordance with the CWGS LLC Agreement in an amount sufficient for us to pay any expenses incurred by us in connection with the regular quarterly cash dividend, along with any of our other operating expenses and other obligations. In addition, we have paid, and currently intend to pay, a special cash dividend of all or a portion of the Excess Tax Distribution to the holders of our Class A common stock from time to time, subject to the discretion of our board of directors. However, the payment of future dividends on our Class A common stock will be subject to our discretion as the sole managing member of CWGS, LLC, the discretion of our board of directors and will depend on, among other things, our results of operations, financial condition, level of indebtedness, capital requirements, contractual restrictions, restrictions in our debt agreements and in any preferred stock, business prospects and other factors that our board of directors may deem relevant. Our Existing Senior Secured Credit Facilities and our Floor Plan Facility also effectively limit our ability to pay dividends. Additionally, our ability to distribute any Excess Tax Distribution will also be subject to no early termination or amendment of the Tax Receivable Agreement, as well as the amount of tax distributions actually paid to us and our actual tax liability. As a consequence of these limitations and restrictions, we may not be able to make, or may have to reduce or eliminate, the payment of dividends on our Class A common stock. Accordingly, you may have to sell some or all of your Class A common stock after price appreciation in order to generate cash flow from your investment. You may not receive a gain on your investment when you sell your Class A common stock and you may lose the entire amount of the investment. Additionally, any change in the level of our dividends or the suspension of the payment thereof could adversely affect the market price of our Class A common stock. For additional information on our payments of dividends, see "Item 5. Market for Registrant’s Common Equity, Related Stockholder Matters and Issuer Purchases of Equity Securities—Dividend Policy" under Part II of this Form 10-K.
Delaware law and certain provisions in our amended and restated certificate of incorporation may prevent efforts by our stockholders to change the direction or management of our company.
We are a Delaware corporation, and the anti‑takeover provisions of Delaware law impose various impediments to the ability of a third party to acquire control of us, even if a change of control would be beneficial to our existing stockholders. In addition, our amended and restated certificate of incorporation and our amended and restated bylaws contain provisions that may make the acquisition of our Company more difficult without the approval of our board of directors, including, but not limited to, the following:
|
· |
our board of directors is classified into three classes, each of which serves for a staggered three‑year term; |
|
· |
a majority of our stockholders or a majority of our board of directors may call special meetings of our stockholders, and at such time as the ML Related Parties, directly or indirectly, beneficially own in the aggregate, less than 27.5% of all of the outstanding common units of CWGS, LLC, only the chairperson of our board of directors or a majority of our board of directors may call special meetings of our stockholders; |
|
· |
we have authorized undesignated preferred stock, the terms of which may be established and shares of which may be issued without stockholder approval; |
|
· |
any action required or permitted to be taken by our stockholders at an annual meeting or special meeting of stockholders may be taken without a meeting, without prior notice and without a vote, if a written consent is signed by the holders of our outstanding shares of common stock |
62
representing not less than the minimum number of votes that would be necessary to authorize such action at a meeting at which all outstanding shares of common stock entitled to vote thereon, and at such time as the ML Related Parties, directly or indirectly, beneficially own in the aggregate, less than 27.5% of all of the outstanding common units of CWGS, LLC, any action required or permitted to be taken by our stockholders at an annual meeting or special meeting of stockholders may not be taken by written consent in lieu of a meeting; |
|
· |
our amended and restated certificate of incorporation may be amended or repealed by the affirmative vote of a majority of the votes which all our stockholders would be eligible to cast in an election of directors and our amended and restated bylaws may be amended or repealed by a majority vote of our board of directors or by the affirmative vote of a majority of the votes which all our stockholders would be eligible to cast in an election of directors, and at such time as the ML Related Parties, directly or indirectly, beneficially own in the aggregate, less than 27.5% of all of the outstanding common units of CWGS, LLC, our amended and restated certificate of incorporation and our amended and restated bylaws may be amended or repealed by the affirmative vote of the holders of at least 662/3% of the votes which all our stockholders would be entitled to cast in any annual election of directors and our amended and restated bylaws may also be amended or repealed by a majority vote of our board of directors; |
|
· |
we require advance notice and duration of ownership requirements for stockholder proposals; and |
|
· |
we have opted out of Section 203 of the Delaware General Corporation Law of the State of Delaware (the “DGCL”), however, our amended and restated certificate of incorporation contains provisions that are similar to Section 203 of the DGCL (except with respect to ML Acquisition and Crestview and any of their respective affiliates and any of their respective direct or indirect transferees of Class B common stock). |
These provisions could discourage, delay or prevent a transaction involving a change in control of our company. These provisions could also discourage proxy contests and make it more difficult for you and other stockholders to elect directors of your choosing and cause us to take other corporate actions you desire, including actions that you may deem advantageous, or negatively affect the trading price of our Class A common stock. In addition, because our board of directors is responsible for appointing the members of our management team, these provisions could in turn affect any attempt by our stockholders to replace current members of our management team.
Please see “— Risks Relating to Our Organizational Structure — Marcus Lemonis, through his beneficial ownership of our shares directly or indirectly held by ML Acquisition and ML RV Group, has substantial control over us, including over decisions that require the approval of stockholders, and his interests, along with the interests of our other Continuing Equity Owners, in our business may conflict with yours.”
Our amended and restated certificate of incorporation provides, subject to certain exceptions, that the Court of Chancery of the State of Delaware will be the sole and exclusive forum for certain stockholder litigation matters, which could limit our stockholders’ ability to obtain a favorable judicial forum for disputes with us or our directors, officers, employees or stockholders.
Our amended and restated certificate of incorporation provides, subject to limited exceptions, that the Court of Chancery of the State of Delaware will, to the fullest extent permitted by law, be the sole and exclusive forum for (i) any derivative action or proceeding brought on our behalf; (ii) any action asserting a claim of breach of a fiduciary duty owed by any of our directors, officers or other employees to us or our stockholders; (iii) any action asserting a claim against us, any director or our officers or employees arising pursuant to any provision of the DGCL, our amended and restated certificate of incorporation or our amended and restated bylaws; or (iv) any action asserting a claim against us, any director or our officers or employees that is governed by the internal affairs doctrine. Any person or entity purchasing or otherwise acquiring any interest in shares of our capital stock are deemed to have notice of and to have consented to the provisions of our amended and restated certificate of incorporation described above. This choice of forum provision may
63
limit a stockholder’s ability to bring a claim in a judicial forum that it finds favorable for disputes with us or any of our directors, officers, other employees or stockholders which may discourage lawsuits with respect to such claims. Alternatively, if a court were to find the choice of forum provision in our amended and restated certificate of incorporation to be inapplicable or unenforceable in an action, we may incur additional costs associated with resolving such action in other jurisdictions, which could materially adversely affect our business, financial condition and results of operations.
We may issue shares of preferred stock in the future, which could make it difficult for another company to acquire us or could otherwise adversely affect holders of our Class A common stock, which could depress the price of our Class A common stock.
Our amended and restated certificate of incorporation authorizes us to issue one or more series of preferred stock. Our board of directors will have the authority to determine the preferences, limitations and relative rights of the shares of preferred stock and to fix the number of shares constituting any series and the designation of such series, without any further vote or action by our stockholders. Our preferred stock could be issued with voting, liquidation, dividend and other rights superior to the rights of our Class A common stock. The potential issuance of preferred stock may delay or prevent a change in control of us, discouraging bids for our Class A common stock at a premium to the market price, and materially and adversely affect the market price and the voting and other rights of the holders of our Class A common stock.
The obligations associated with being a public company have required, and will continue to require, significant resources and management attention, which may divert from our business operations.
As a public company, we are subject to the reporting requirements of the Securities Exchange Act of 1934, as amended (the “Exchange Act”) and the Sarbanes‑Oxley Act of 2002, as amended (the “Sarbanes‑Oxley Act”). The Exchange Act requires that we file annual, quarterly and current reports with respect to our business and financial condition. The Sarbanes‑Oxley Act requires, among other things, that we establish and maintain effective internal control over financial reporting. As a result, we have incurred, and will continue to incur, significant legal, accounting and other expenses that we did not previously incur prior to our IPO.
Furthermore, as a public company, we will continue to incur additional legal, accounting and other expenses that have not been reflected in our historical financial statements for periods prior to the IPO included in Item 8 of Part II of this Form 10-K. In addition, rules implemented by the SEC and the NYSE have imposed various requirements on public companies, including establishment and maintenance of effective disclosure and financial controls and changes in corporate governance practices. Our management and other personnel have devoted, and will need to continue to devote, a substantial amount of time to these compliance initiatives. These rules and regulations result in our incurring legal and financial compliance costs and have made, and will continue to make, some activities more time‑consuming and costly. For example, we expect these rules and regulations to make it more difficult and more expensive for us to obtain director and officer liability insurance, and we may be required to accept reduced policy limits and coverage or incur substantially higher costs to obtain the same or similar coverage. As a result, it may be more difficult for us to attract and retain qualified people to serve on our board of directors, our board committees or as executive officers.
Recently identified material weaknesses in our internal control over financial reporting could have a significant adverse effect on our business and the price of our common stock.
As a public reporting company, we are subject to the rules and regulations established from time to time by the SEC and NYSE. These rules and regulations require, among other things, that we have, and periodically evaluate, procedures with respect to our internal control over financial reporting. Reporting obligations as a public company are likely to continue to place a considerable strain on our financial and management systems, processes and controls, as well as on our personnel.
In addition, as a public company we are required to document and test our internal control over financial reporting pursuant to Section 404 of the Sarbanes-Oxley Act so that our management can certify as to the effectiveness of our internal control over financial reporting, which requires us to document and make
64
significant changes to our internal control over financial reporting. Likewise, our independent registered public accounting firm is required to provide an attestation report on the effectiveness of our internal control over financial reporting.
In connection with the preparation of our financial statements and the audit of our financial results for 2017, material weaknesses in our internal controls relating to (i) insufficient analysis to correctly determine the portion of the deferred tax asset resulting from our direct investment in CWGS, LLC not expected to be realized, (ii) the insufficient documentation and/or execution of certain accounting policies and procedures within FreedomRoads, which operates the RV dealerships, and (iii) ineffective transaction level and management review controls over the valuation of trade-in unit inventory were identified. As a result, management concluded that our internal control over financial reporting as of December 31, 2017 was not effective. These material weaknesses have caused us to restate our previously issued consolidated financial statements as of and for the year ended December 31, 2016, and as of and for the three months ended March 31, 2017, three and six months ended June 30, 2017 and three and nine months ended September 30, 2017. As described in Part II, Item 9A of this Form 10-K, management is taking steps to remediate the material weaknesses in our internal controls. There can be no assurance that any measures we take will remediate the material weaknesses identified, nor can there be any assurance as to how quickly we will be able to remediate these material weaknesses.
In future periods, if our senior management is unable to conclude that we have effective internal control over financial reporting, or to certify the effectiveness of such controls, or if our independent registered public accounting firm cannot render an unqualified opinion on management’s assessment and the effectiveness of our internal control over financial reporting, or if additional material weaknesses in our internal control over financial reporting are identified, we may be required to again restate our financial statements and could be subject to regulatory scrutiny, a loss of public and investor confidence, and to litigation from investors and stockholders, which could have a material adverse effect on our business and the price of our Class A common stock.
Furthermore, the correction of any such material weaknesses, including the ones noted above, could require additional remedial measures including additional personnel which could be costly and time-consuming. In addition, we may encounter problems or delays in completing the implementation of any requested improvements and receiving a favorable attestation report from our independent registered public accounting firm. In addition, if we do not maintain adequate financial and management personnel, processes and controls, we may not be able to manage our business effectively or accurately report our financial performance on a timely basis, which could cause a decline in our common stock price and adversely affect our results of operations and financial condition. Failure to comply with the Sarbanes-Oxley Act could potentially subject us to sanctions or investigations by the SEC, the NYSE or other regulatory authorities, which would require additional financial and management resources.
If securities analysts do not publish research or reports about our company, or if they issue unfavorable commentary about us or our industry or downgrade our Class A common stock, the price of our Class A common stock could decline.
The trading market for our Class A common stock depends in part on the research and reports that third-party securities analysts publish about our company and our industry. If one or more analysts cease coverage of our company, we could lose visibility in the market. In addition, one or more of these analysts could downgrade our Class A common stock or issue other negative commentary about our company or our industry. As a result of one or more of these factors, the trading price of our Class A common stock could decline.
ITEM 1B. UNRESOLVED STAFF COMMENTS
None.
65
We typically lease the real properties where we have operations. Our real property leases generally provide for fixed monthly rentals with annual escalation clauses. The table below sets forth certain information concerning our offices and distribution centers and the lease expiration date includes all stated option periods.
|
|
|
Square Feet |
|
Acres |
|
Lease Expiration(1) |
|
Office Facilities: |
|
|
|
|
|
|
|
Lincolnshire, IL (Corporate headquarters and Dealership headquarters) |
|
25,900 |
|
|
|
2024 |
|
Denver, CO (Consumer services and plans operations, customer contact and service center and information system functions) |
|
60,000 |
|
|
|
2054 |
|
Bowling Green, KY (Retail administrative and information systems functions) |
|
33,947 |
|
|
|
2054 |
|
Oxnard, CA (Publishing and administrative) |
|
10,254 |
|
|
|
2024 |
|
Gander Outdoors (Retail administrative functions) |
|
24,511 |
|
|
|
2019 |
|
Overton's (Retail administrative and information systems functions) |
|
46,426 |
|
|
|
2027 |
|
Active Sports office (Retail administrative and information systems functions) |
|
19,364 |
|
|
|
2027 |
|
Uncle Dan's office (Retail administrative and information systems functions) |
|
4,000 |
|
|
|
2018 |
|
Distribution Centers: |
|
|
|
|
|
|
|
RV retail |
|
|
|
|
|
|
|
Bakersfield, California |
|
169,123 |
|
13.1 |
|
2053 |
|
Franklin, Kentucky |
|
250,000 |
|
33.0 |
|
2035 |
|
Fort Worth, Texas |
|
197,400 |
|
5.1 |
|
2036 |
|
Outdoor and Active Sports Retail |
|
|
|
|
|
|
|
Gander Outdoors - Lebanon, Indiana |
|
707,952 |
|
30.4 |
|
2040 |
|
Overton's - Greenville, NC |
|
496,443 |
|
39.9 |
|
2027 |
|
Active Sports - St. Paul, MN |
|
200,348 |
|
9.9 |
|
2027 |
|
Uncle Dan's - Skokie, IL |
|
6,000 |
|
0.2 |
|
2018 |
|
(1) |
Assumes exercise of applicable lease renewal options. |
As of December 31, 2017, we also leased 133 of our 140 RV retail locations in 36 states where we operate our retail locations. These retail locations generally range in size from approximately 30,000 to 45,000 square feet and are typically situated on approximately eight to 18 acres. The leases for our retail locations typically have terms of 15 to 20 years, with multiple renewal terms of five years each. These leases are typically “triple net leases” that require us to pay real estate taxes, insurance and maintenance costs.
66
The following table lists the location by state of our 140 retail locations open as of December 31, 2017:
|
|
|
Number of Retail |
|
|
|
Number of Retail |
|
|
|
|
Locations |
|
|
|
Locations |
|
|
Alabama |
|
4 |
|
Nevada |
|
2 |
|
|
Arizona |
|
4 |
|
New Hampshire |
|
2 |
|
|
Arkansas |
|
2 |
|
New Jersey |
|
2 |
|
|
California |
|
11 |
|
New Mexico |
|
1 |
|
|
Colorado |
|
4 |
|
New York |
|
3 |
|
|
Florida |
|
16 |
|
North Carolina |
|
7 |
|
|
Georgia |
|
6 |
|
Ohio |
|
4 |
|
|
Idaho |
|
4 |
|
Oklahoma |
|
3 |
|
|
Illinois |
|
1 |
|
Oregon |
|
4 |
|
|
Indiana |
|
2 |
|
Pennsylvania |
|
2 |
|
|
Iowa |
|
3 |
|
South Carolina |
|
5 |
|
|
Kentucky |
|
2 |
|
South Dakota |
|
1 |
|
|
Louisiana |
|
3 |
|
Tennessee |
|
3 |
|
|
Massachusetts |
|
1 |
|
Texas |
|
11 |
|
|
Michigan |
|
3 |
|
Utah |
|
3 |
|
|
Minnesota |
|
2 |
|
Virginia |
|
7 |
|
|
Mississippi |
|
3 |
|
Washington |
|
3 |
|
|
Missouri |
|
4 |
|
Wisconsin |
|
2 |
|
We also have thirteen Outdoor and Active Sports Retail locations including seven in Illinois, three in Minnesota, two in North Carolina, and one in Michigan.
We are engaged in various legal actions, claims and proceedings arising in the ordinary course of business, including claims related to employment-related matters, breach of contracts, products liabilities, consumer protection and intellectual property matters resulting from our business activities. We do not believe that the ultimate resolution of these pending claims will have a material adverse effect on our business, financial condition or results of operations. However, litigation is subject to many uncertainties, and the outcome of certain individual litigated matters may not be reasonably predictable and any related damages may not be estimable. Some litigation matters could result in an adverse outcome to us, and any such adverse outcome could have a material adverse effect on our business, financial condition and results of operations.
ITEM 4. MINE SAFETY DISCLOSURES
Not applicable.
Executive Officers and Directors of the Registrant
The following table provides information regarding the Company’s executive officers and directors (ages are as of March 13, 2018):
|
Name |
|
Age |
|
Position(s) |
|
Marcus A. Lemonis |
|
44 |
|
Chairman and Chief Executive Officer |
|
Thomas F. Wolfe |
|
56 |
|
Chief Financial Officer and Secretary |
|
Brent L. Moody |
|
56 |
|
Chief Operating and Legal Officer |
|
Roger L. Nuttall |
|
66 |
|
President of Camping World |
|
Stephen Adams |
|
80 |
|
Director |
|
Andris A. Baltins |
|
72 |
|
Director |
67
|
Name |
|
Age |
|
Position(s) |
|
Brian P. Cassidy |
|
44 |
|
Director |
|
Mary J. George |
|
67 |
|
Director |
|
Daniel G. Kilpatrick |
|
37 |
|
Director |
|
Howard A. Kosick |
|
64 |
|
Director |
|
Jeffrey A. Marcus |
|
71 |
|
Director |
|
K. Dillon Schickli |
|
64 |
|
Director |
Set forth below is a description of the background of each of the Company’s executive officers and directors.
Marcus A. Lemonis has served as Camping World Holdings, Inc.’s Chairman and Chief Executive Officer and on the board of directors of Camping World Holdings, Inc. since its formation, as the President and Chief Executive Officer and on the board of directors of CWGS, LLC since February 2011, as the Chief Executive Officer and on the board of directors of Good Sam Enterprises, LLC since January 2011, as President and Chief Executive Officer and on the board of directors of Camping World, Inc. since September 2006 and as the President and Chief Executive Officer and on the board of directors of FreedomRoads, LLC since May 1, 2003. Mr. Lemonis received a B.A. from Marquette University. Mr. Lemonis’ extensive experience in retail, RV and automotive, business operations and entrepreneurial ventures makes him well qualified to serve on our board of directors.
Thomas F. Wolfe has served as Camping World Holdings, Inc.’s Chief Financial Officer since its formation, as the Executive Vice President of Operations of Good Sam Enterprises, LLC from September 2011 through February 2015, the Chief Financial Officer of Good Sam Enterprises, LLC since January 2004 and as the Executive Vice President and Chief Financial officer of CWGS, LLC since January 2011. Previously, Mr. Wolfe served as Good Sam Enterprises, LLC’s Senior Vice President and Chief Financial Officer since January 2004. Prior to that time, Mr. Wolfe had been Vice President and Controller of Good Sam Enterprises, LLC since 1997. From 1991 to 1997, Mr. Wolfe was vice president of finance of Convenience Management Group, LLC, a privately-owned distributor of petroleum products and equipment. From 1989 to 1991, Mr. Wolfe was vice president and controller of First City Properties, Inc. From 1983 to 1988, Mr. Wolfe held a variety of staff and management positions at Deloitte & Touche LLP. Mr. Wolfe received a B.S. from California Polytechnic State University, San Luis Obispo.
Brent L. Moody has served as Camping World Holdings, Inc.’s Chief Operating and Legal Officer since its formation, as the Chief Operating and Legal Officer of CWGS, LLC and its subsidiaries since January 1, 2016, as the Executive Vice President and Chief Administrative and Legal Officer of CWGS, LLC from February 2011 to December 31, 2015, as the Executive Vice President and Chief Administrative and Legal Officer of Good Sam Enterprises, LLC from January 2011 to December 31, 2015, as the Executive Vice President and Chief Administrative and Legal Officer of FreedomRoads, LLC and Camping World, Inc. from 2010 until December 31, 2015, as Executive Vice President/General Counsel and Business Development of Camping World, Inc. and FreedomRoads, LLC from 2006 to 2010, as Senior Vice President/General Counsel and Business Development of Camping World, Inc. and Good Sam Enterprises, LLC from 2004 to 2006 and as Vice President and General Counsel of Camping World, Inc. from 2002 to 2004. From 1998 to 2002, Mr. Moody was a shareholder of the law firm of Greenberg Traurig, P.A. From 1996 to 1998, Mr. Moody served as vice president and assistant general counsel for Blockbuster, Inc. Mr. Moody received a J.D. from Nova Southeastern University, Shepard Broad Law Center and a B.S. from Western Kentucky University.
Roger L. Nuttall has served as President of Camping World, Inc. since January 2011, as Chief Operating Officer of FreedomRoads, LLC from January 2009 until January 2011 and as Executive Vice President and Chief Financial Officer of FreedomRoads, LLC from November 2003 until December 2015. From 1981 to 1983, Mr. Nuttall was a partner at McKay, Nuttall and Reid, a local accounting and consulting firm. Prior to that time, from 1974 to 1981, Mr. Nuttall held a variety of staff and management positions at Grant Thornton LLP. From 1983 until 2003, Mr. Nuttall served as chief financial officer and member of the board of directors of Blaine Jensen & Sons, Inc., a multi dealership RV company. Mr. Nuttall received a B.A. from Weber State University.
68
Stephen Adams has served on the board of directors of Camping World Holdings, Inc. since its formation, as the chairman of the board of directors of CWGS, LLC since February 2011, as the chairman of the board of directors of Good Sam Enterprises, LLC since December 1988, as the chairman of the board of directors of Camping World, Inc. since April 1997 and as the chairman of the board of directors of FreedomRoads Holding Company, LLC since February 3, 2005. In addition, Mr. Adams is the chairman of the board of directors and the controlling shareholder of Adams Outdoor Advertising, Inc., which operates an outdoor media advertising business. From November 2011 until April 2012, Mr. Adams inadvertently failed to timely file ownership reports on Forms 4 and 5 and as of the end of calendar year 2011, as of May 15, 2012 and as of the end of calendar year 2012, Mr. Adams mistakenly failed to timely file Schedule 13G amendments with respect to an entity in which he unknowingly accumulated an interest in excess of 5%. As a result, the Securities and Exchange Commission entered an order on September 10, 2014, pursuant to which Mr. Adams agreed to cease and desist from committing or causing any violations of the requirements of Section 13(d) and 16(a) of the Exchange Act and certain of the rules promulgated thereunder and paid a civil money penalty to the SEC without admitting or denying the findings therein. In August 2009, Affinity Bank, a California depositary institution in which Mr. Adams indirectly owned a controlling interest, was closed by the California Department of Financial Institutions and the Federal Deposit Insurance Corporation was appointed as the receiver. Mr. Adams received an M.B.A. from the Stanford Graduate School of Business and a B.S. from Yale University. Mr. Adams’ long association with the Company as a chairman of the board of directors of several of its subsidiaries since he acquired Good Sam Enterprises, LLC in 1988 and his current or former ownership of a variety of businesses with significant assets and operations during his over 40 year business career, during which time he has had substantial experience in providing management oversight and strategic direction, make him well qualified to serve on our board of directors.
Andris A. Baltins has served on the board of directors of Camping World Holdings, Inc. since its formation, on the board of directors of CWGS, LLC since February 2011 and on the board of directors of Good Sam Enterprises, LLC since February 2006. He has been a member of the law firm of Kaplan, Strangis and Kaplan, P.A. since 1979. Mr. Baltins serves as a director of various private and nonprofit corporations, including Adams Outdoor Advertising, Inc., which is controlled by Mr. Adams. Mr. Baltins previously served as a director of Polaris Industries, Inc. from 1995 until 2011. Mr. Baltins received a J.D. from the University of Minnesota Law School and a B.A. from Yale University. Mr. Baltins’ over 40 year legal career as an advisor to numerous public and private companies and his experience in the areas of complex business transactions, mergers and acquisitions and corporate law make him well qualified to serve on our board of directors.
Brian P. Cassidy has served on the board of directors of Camping World Holdings, Inc. since its formation and on the board of directors of CWGS, LLC since March 2011. Mr. Cassidy is a Partner at Crestview, which he joined in 2004, and currently serves as head of Crestview’s media and communications strategy. Mr. Cassidy has served as a director of WideOpenWest, Inc., a public company, since December 2015, and has served as a director of various private companies, including Congruex LLC since November 2017, NEG Parent LLC, the parent company of CORE Media Group, since October 2016, Interoute Communications Holdings since April 2015, and NEP Group, Inc. since December 2012. Mr. Cassidy previously served as a director of Cumulus Media, Inc., a public company, from May 2014 until March 2017, and served as a director of various private companies, including ValueOptions, Inc. from December 2007 until December 2014, and San Juan Cable LLC (d/b/a OneLink Communications) from May 2007 until November 2012. He was also involved with Crestview’s investments in Charter Communications, Inc. and Insight Communications, Inc. Prior to joining Crestview, Mr. Cassidy worked in private equity at Boston Ventures, where he invested in companies in the media and communications, entertainment and business services industries. Previously, he worked as the acting chief financial officer of one of Boston Ventures’ portfolio companies. Prior to that time, Mr. Cassidy was an investment banking analyst at Alex. Brown & Sons, where he completed a range of financing and mergers and acquisitions assignments for companies in the consumer and business services sectors. Mr. Cassidy received an M.B.A. from the Stanford Graduate School of Business and an A.B. in Physics from Harvard College. Mr. Cassidy’s private equity investment and company oversight experience and background with respect to acquisitions, debt financings and equity financings make him well qualified to serve on our board of directors.
69
Mary J. George has served on the board of directors of Camping World Holdings, Inc. since January 2017. Ms. George has also served as executive chairman of Ju-Ju-Be, a retailer of premium diaper bags and other baby products since January 2018. Ms. George has been a founding partner of Morningstar Capital Investments, LLC, an investment firm, since 2001. Ms. George served as chief executive officer and a director at Easton Hockey Holdings Inc., a private manufacturer of ice hockey equipment, from August 2014 to December 2016. From 2002 to 2015, Ms. George held various positions, including co-chairman (2002 to 2009) and vice chairman (2009 to 2015), at Bell Automotive Products, Inc., a private manufacturer of automotive accessories. From 1994 to 2004, Ms. George held various positions, including chief operating officer (1995 to 1998), chief executive officer (1998 to 2000), and chairman (2000 to 2004), at Bell Sports Inc., a formerly public helmet manufacturer. Ms. George also currently serves or previously served as a director of various public and private companies, including Image Entertainment, Inc., a formerly public independent distributor of home entertainment programming, from 2010 to 2012, Oakley, Inc., a public sports equipment and lifestyle accessories manufacturer, from 2004 to 2007, BRG Sports Inc. since 2013, 3 Day Blinds Inc. from 2007 to 2015, and Oreck Corporation. from 2008 to 2012. Ms. George’s experience in sales, marketing and general management in the consumer products industry, as well as success in the development of internationally renowned branded products, provides our board of directors with greater insight in the areas of product branding and strategic growth in the consumer products industry, and make her well-qualified to serve on our board of directors.
Daniel G. Kilpatrick has served on the board of directors of Camping World Holdings, Inc. since January 2017. Mr. Kilpatrick serves as a partner at Crestview Advisors, L.L.C., a private equity firm that he joined in 2009, where he has overseen investments in companies across a variety of industries, including media and financial services. Mr. Kilpatrick is currently on the board of directors of WideOpenWest, Inc., a public company, since December 2015, and has served on the board of directors of various private companies, including Congruex LLC since November 2017, and NEG Parent LLC, the parent company of CORE Media Group, since October 2016. He was previously a director of several private companies including NYDJ Corporation from January 2014 to February 2018, Accuride Group Holdings, Inc. from November 2016 to August 2017, and Symbion, Inc. from August 2012 to November 2014. Mr. Kilpatrick received an M.B.A. from the Stanford Graduate School of Business and a B.A. from Yale University. Mr. Kilpatrick's private equity investment and company oversight experience and background with respect to acquisitions, debt financings and equity financings make him well-qualified to serve on our board of directors.
Howard A. Kosick has served on the board of directors of Camping World Holdings, Inc. since October 1, 2017. Mr. Kosick has been an independent business advisor providing private strategic business advisory services since January 2015. Prior to January 2015, Mr. Kosick held various positions, including president, chief executive officer and director (June 2004 to June 2013) and chairman and merger integration officer (July 2013 to September 2014) at Tippmann Sports LLC, a private equity backed manufacturer of paintball markers and accessories, which was sold to a strategic buyer in December 2013. From 2000 to 2003, Mr. Kosick served as a director, president and chief operating officer at Bay Travelgear, Inc., a private luggage manufacturer and its affiliate Bell Automotive Products, Inc., a private manufacturer of automotive accessories. In 1999, Mr. Kosick served as chief financial officer, treasurer and secretary at Universal Technical Institute, a post-secondary education institution. From 1989 to 1998, Mr. Kosick held various positions, including executive vice president, chief financial officer, treasurer and secretary (1989 to 1997) and president of the U.S. group (1997-1998) at Bell Sports Corp., a formerly public bicycle helmet and accessories manufacturer. Mr. Kosick’s management, business advisory and operations experience and track record in various mergers and acquisitions and financing transactions provide the Board with greater insight in the areas of performance improvement, growth and brand building, and make him well-qualified to serve on the Board.
Jeffrey A. Marcus has served on the board of directors of Camping World Holdings, Inc. since its formation and on the board of directors of CWGS, LLC since March 2011. Mr. Marcus is a Vice Chairman at Crestview, which he joined in 2004 and is part of Crestview’s media team. Prior to joining Crestview, Mr. Marcus served in various positions in the media and communications industry, including as President and chief executive officer of AMFM Inc. (formerly Chancellor Media Corporation) from 1998 until 1999 and as founder and chief executive officer of Marcus Cable Company, a privately-held cable company, from 1989 until 1998. Mr. Marcus has served on the board of directors of public companies, including Cumulus Media, Inc. where he served as a director since September 2011 and as the chairman since April 2015, and
70
WideOpenWest, Inc. where he served as the chairman since December 2015. He has also served as a director of NEP Group, Inc., a private company, since December 2012. Mr. Marcus previously served as a director of Charter Communications, Inc., a public company, from September 2011 until November 2013, and served on the board of directors of various private companies, including as the chairman of the board of directors of DS Services of America, Inc. from September 2013 until December 2014, and as a director of San Juan Cable LLC (d/b/a OneLink Communications) from July 2011 until December 2012, and Insight Communications Company, Inc. from April 2010 until February 2012. Mr. Marcus received a B.A. from the University of California, Berkeley. Mr. Marcus’ extensive experience serving as a director of numerous public and private companies, operating experience as a chief executive officer in the cable television, broadcast and outdoor industries and his experience as a private equity investor with respect to acquisitions, debt financings, equity financings and public market sentiment make him well qualified to serve on our board of directors.
K. Dillon Schickli has served on the board of directors of Camping World Holdings, Inc. since its formation and on the board of directors of CWGS, LLC since August 2011. Mr. Schickli previously served on the board of directors of CWGS, LLC from 1990 until 1995 and was chief operating officer of Affinity Group, Inc., the predecessor of Good Sam Enterprises, LLC, from 1993 until 1995. Previously, Mr. Schickli was a co-investor with Crestview in DS Waters Group, Inc. (“DS Waters”) and served as vice chairman of its board of directors until it was sold to Cott Corporation in December 2014. Prior to that time, Mr. Schickli was the chief executive officer of DS Waters from June 2010 until February 2013 and subsequently led the buyout of the business by Crestview. Mr. Schickli also previously led the buyout of DS Waters from Danone Group & Suntory Ltd. in November 2005 and was also a co investor in DS Waters with Kelso & Company. Mr. Schickli served as co-chief executive officer and chief financial officer of DS Waters from November 2005 until June 2010, when he became the sole chief executive officer. Mr. Schickli started his business career in the capital planning and acquisitions group of the Pepsi Cola Company after he received his M.B.A. from the University of Chicago. Mr. Schickli received a B.A. from Carleton College in 1975. Mr. Schickli’s long association with, and knowledge of, the Company, extensive experience serving as a director of other businesses, operating experience as a chief executive officer and his experience as a private equity investor with respect to acquisitions, debt financings, equity and financings make him well qualified to serve on our board of directors.
71
ITEM 5. MARKET FOR REGISTRANT’S COMMON EQUITY, RELATED STOCKHOLDER MATTERS AND ISSUER PURCHASES OF EQUITY SECURITIES
Market Information
On October 7, 2016, our Class A common stock began trading on the New York Stock Exchange under the symbol “CWH.” Prior to that time, there was no public market for our stock. The following table sets forth the highest and lowest sales prices for our common stock on the NYSE for the periods indicated.
|
|
|
2017 |
|
2016 |
||||||||
|
|
|
High |
|
Low |
|
High |
|
Low |
||||
|
First quarter |
|
$ |
36.60 |
|
$ |
29.41 |
|
|
n/a |
|
|
n/a |
|
Second quarter |
|
|
32.73 |
|
|
26.30 |
|
|
n/a |
|
|
n/a |
|
Third quarter |
|
|
41.27 |
|
|
28.76 |
|
|
n/a |
|
|
n/a |
|
Fourth quarter |
|
|
47.62 |
|
|
39.15 |
|
$ |
33.59 |
|
$ |
20.45 |
Our Class B common stock and Class C common stock is neither listed nor traded on any stock exchange.
Holders of Record
As of February 23, 2018, there were 18,315 stockholders of record of our Class A common stock. As of February 23, 2018, there were two and one stockholders of record of our Class B common stock and Class C common stock, respectively.
Dividend Policy
CWGS, LLC has made a regular quarterly cash distribution to its common unit holders of approximately $0.08 per common unit, and CWGS, LLC intends to continue to make such quarterly cash distributions. We have used in the past, and intend to continue to use, all of the proceeds from such distribution on our common units to pay a regular quarterly cash dividend of approximately $0.08 per share on our Class A common stock, subject to our discretion as the sole managing member of CWGS, LLC and the discretion of our board of directors. Holders of our Class B common stock and Class C common stock are not entitled to participate in any dividends declared by our board of directors. We paid regular quarterly cash dividends of $0.08 per share of our Class A common stock, totaling $9.1 million and $1.5 million for the years ended December 31, 2017 and 2016, respectively. We paid special quarterly cash dividends to holders of our Class A common stock of $0.0732 per share, or $8.4 million, for the year ended December 31, 2017, and no special quarterly cash dividend for the year ended December 31, 2016. In addition, we paid a one-time cash dividend of $0.13 per share of our Class A common stock, or $4.8 million, during the quarter ended December 31, 2017.
CWGS, LLC is required to make cash distributions in accordance with the CWGS LLC Agreement in an amount sufficient for us to pay any expenses incurred by us in connection with the regular quarterly cash dividend, along with any of our other operating expenses and other obligations. We believe that our cash and cash equivalents and cash provided by operating activities will be sufficient for CWGS, LLC to make this regular quarterly cash distribution for at least the next twelve months.
In addition, the CWGS LLC Agreement requires tax distributions to be made by CWGS, LLC to its members, including us. In general, tax distributions are made on a quarterly basis, to each member of CWGS, LLC, including us, based on such member's allocable share of the taxable income of CWGS, LLC (which, in our case, will be determined without regard to any Basis Adjustments described in our Tax Receivable Agreement) and an assumed tax rate based on the highest combined federal, state, and local tax rate that may potentially apply to any one of CWGS, LLC's members (52.62% in 2017), regardless of the actual final tax liability of any such member. Based on the current applicable effective tax rates, we expect
72
that (i) the assumed tax rate that will be used for purposes of determining tax distributions from CWGS, LLC will exceed our actual combined federal, state and local tax rate (assuming no changes in corporate tax rates) and (ii) the annual amount of tax distributions paid to us will exceed the sum of (A) our actual annual tax liability and (B) the annual amount payable by us under the Tax Receivable Agreement (assuming no early termination of the Tax Receivable Agreement) (such excess in clauses (A) and (B), collectively referred to herein as the "Excess Tax Distribution"). We currently intend to pay a special cash dividend of all or a portion of the Excess Tax Distribution to the holders of our Class A common stock from time to time subject to the discretion of our board of directors.
Our ability to pay cash dividends on our Class A common stock depends on, among other things, our results of operations, financial condition, level of indebtedness, capital requirements, contractual restrictions, restrictions in our debt agreements and in any preferred stock, restrictions under applicable law, the extent to which such distributions would render CWGS, LLC insolvent, our business prospects and other factors that our board of directors may deem relevant. Additionally, our ability to distribute any Excess Tax Distribution will also be subject to no early termination or amendment of the Tax Receivable Agreement, as well as the amount of tax distributions actually paid to us and our actual tax liability. Furthermore, because we are a holding company, our ability to pay cash dividends on our Class A common stock depends on our receipt of cash distributions from CWGS, LLC and, through CWGS, LLC, cash distributions and dividends from its operating subsidiaries, which may further restrict our ability to pay dividends as a result of the laws of their jurisdiction of organization, agreements of our subsidiaries or covenants under any existing and future outstanding indebtedness we or our subsidiaries incur. In particular, our ability to pay any cash dividends on our Class A common stock is limited by restrictions on the ability of CWGS, LLC and our other subsidiaries and us to pay dividends or make distributions to us under the terms of our Existing Senior Secured Credit Facilities and Floor Plan Facility. We do not currently believe that the restrictions contained in our existing indebtedness will impair the ability of CWGS, LLC to make the distributions or pay the dividends as described above. Our dividend policy has certain risks and limitations, particularly with respect to liquidity, and we may not pay dividends according to our policy, or at all. See "Management's Discussion and Analysis of Financial Condition and Results of Operations—Liquidity and Capital Resources" and "Risk Factors—Risks Relating to Ownership of Our Class A Common Stock—Our ability to pay regular and special dividends on our Class A common stock is subject to the discretion of our board of directors and may be limited by our structure and statutory restrictions and restrictions imposed by our Existing Senior Secured Credit Facilities and our Floor Plan Facility as well as any future agreements" in this Form 10-K.
CWGS, LLC paid cash tax distributions to its members during the years ended December 31, 2017, 2016 and 2015 aggregating $176.3 million, $103.9 million and $83.1 million, respectively. CWGS, LLC also made quarterly preferred return payments to one of its members during the years ended December 31, 2016 and 2015 aggregating $6.4 million and $8.4 million, respectively. Additionally, CWGS, LLC paid special cash distributions to its members aggregating $39.5 million and $111.2 million during the years ended December 31, 2017 and 2016, respectively.
Stock Performance Graph
The following graph and table illustrate the total return from October 7, 2016 through December 31, 2017, for (i) our Class A common stock, (ii) the Standard and Poor’s (“S&P”) 500 Index, and (iii) the S&P 500 Retailing Index. The comparisons reflected in the graph and table are not intended to forecast the future performance of our stock and may not be indicative of future performance. The graph and table assume that
73
$100 was invested on October 7, 2016 in each of our Class A common stock, the S&P 500 Index, and S&P 500 Retailing Index and that any dividends were reinvested.

|
|
|
October 7, |
|
December 31, |
|
December 31, |
|||
|
|
|
2016 |
|
2016 |
|
2017 |
|||
|
Camping World Holdings, Inc. Class A common stock |
|
$ |
100.00 |
|
$ |
145.27 |
|
$ |
203.35 |
|
S&P 500 Index |
|
$ |
100.00 |
|
$ |
104.45 |
|
$ |
127.26 |
|
S&P 500 Retailing Index |
|
$ |
100.00 |
|
$ |
98.91 |
|
$ |
128.98 |
Recent Sales of Unregistered Securities
On May 31, 2017, certain selling stockholders completed a secondary public offering of 5,500,000 shares of our Class A common stock. Additionally, on June 9, 2017, certain selling stockholders sold an additional 825,000 shares of our Class A common stock pursuant to the underwriters' exercise of their option, in part, to purchase additional shares of our Class A common stock. In connection with the secondary offering, the continuing equity owners that participated in the offering as selling stockholders redeemed 4,971,545 common units for 4,971,545 newly-issued shares of our Class A common stock, including common units redeemed in connection with the underwriters' exercise of their option, in part, to purchase additional shares of our Class A common stock. Simultaneously, we cancelled 4,971,545 shares of Class B common stock surrendered by the continuing equity owners that participated in the offering as selling stockholders in connection with the exchange of their common units.
On July 26, 2017, Camping World Holdings, Inc. issued 164,277 shares of its Class A common stock to InnerHealth Corporation in connection with the acquisition of TheHouse.com.
On October 30, 2017, certain selling stockholders completed a secondary public offering of 6,700,000 shares of our Class A common stock. Additionally, on November 1, 2017, certain selling stockholders sold an additional 963,799 shares of our Class A common stock pursuant to the underwriters' exercise of their option, in part, to purchase additional shares of our Class A common stock. In connection with the secondary
74
offering, the continuing equity owners that participated in the offering as selling stockholders redeemed 6,194,555 common units for 6,194,655 newly-issued shares of our Class A common stock, including common units redeemed in connection with the underwriters' exercise of their option, in part, to purchase additional shares of our Class A common stock. Simultaneously, we cancelled 6,194,555 shares of Class B common stock surrendered by the continuing equity owners that participated in the offering as selling stockholders in connection with the exchange of their common units. The issuances of shares of Class A common stock described in the foregoing paragraphs were made in reliance on the exemption contained in Section 4(a)(2) of the Securities Act and Rule 506 promulgated thereunder, on the basis that the transactions described above did not involve any public offering.
ITEM 6. SELECTED FINANCIAL DATA
The following tables present the selected historical consolidated financial and other data for Camping World Holdings, Inc. The selected consolidated balance sheets data as of December 31, 2017 and 2016 and the selected consolidated statements of income and statements of cash flows data for each of the years in the three year period ended December 31, 2017 are derived from our audited consolidated financial statements contained in Part II, Item 8 of this Form 10-K. The selected consolidated balance sheet data as of December 31, 2015, 2014 and 2013 and the selected consolidated statement of income and statement of cash flows data for each of the years ended December 31, 2014 and 2013 have been derived from our audited consolidated financial statements not included herein.
As discussed in Note 1 — Summary of Significant Accounting Policies — Restatement to Prior Periods in Part II, Item 8 of this Form 10-K, the Company has restated its consolidated financial statements as of and for the year ended December 31, 2016 to reflect a partial valuation allowance against the portion of the deferred tax asset related to its outside basis difference in CWGS, LLC of $102.7 million. In addition, certain amounts as of and for the years ended December 31, 2016, 2015, 2014, and 2013 have been revised to correct for errors that were immaterial in prior periods as described in Note 1 — Summary of Significant Accounting Policies — Restatement to Prior Periods in Part II, Item 8 of this Form 10-K. In addition, our financial statements for the year ended December 31, 2017 reflect the provisional impact of the U.S. Tax Cuts and Jobs Act of 2017 (“2017 Tax Act”). See Note 10 — Income Taxes to our audited consolidated financial statements included in Part II, Item 8 of this Form 10-K for additional information.
Subsequent to the IPO and the related reorganization transactions, Camping World Holdings, Inc. has been a holding company whose principal asset is its equity interest in CWGS, LLC. As the sole managing member of CWGS, LLC, Camping World Holdings, Inc. operates and controls all of the business and affairs of CWGS, LLC, and, through CWGS, LLC, conducts its business. As a result, the Company consolidates CWGS, LLC’s financial results and reports a non-controlling interest related to the common units not owned by Camping World Holdings, Inc. Such consolidation has been reflected for all periods presented. Our selected historical consolidated financial and other data does not reflect what our financial position, results of operations and cash flows would have been had we been a separate, stand-alone public company during those periods.
75
Our selected historical consolidated financial and other data may not be indicative of our future results of operations or future cash flows. You should read the information set forth below in conjunction with our historical consolidated financial statements and the notes to those statements, “Item 1A. – Risk Factors,” and “Item 7. – Management’s Discussion and Analysis of Financial Condition and Results of Operations” included elsewhere in this Form 10-K.
|
|
|
Fiscal Year Ended |
|
|||||||||||||
|
|
|
December 31, |
|
December 31, |
|
December 31, |
|
December 31, |
|
December 31, |
|
|||||
|
|
|
2017 |
|
2016 |
|
2015 |
|
2014 |
|
2013 |
|
|||||
|
($ in thousands) |
|
|
|
Restated |
|
|
|
|
|
|
|
|||||
|
Consolidated Statements of Income Data: |
|
|
|
|
|
|
|
|
|
|
|
|
|
|
|
|
|
Revenue: |
|
|
|
|
|
|
|
|
|
|
|
|
|
|
|
|
|
Consumer Services and Plans |
|
$ |
195,614 |
|
$ |
184,773 |
|
$ |
174,600 |
|
$ |
162,598 |
|
$ |
166,231 |
|
|
Retail |
|
|
|
|
|
|
|
|
|
|
|
|
|
|
|
|
|
New vehicles |
|
|
2,435,928 |
|
|
1,862,195 |
|
|
1,603,258 |
|
|
1,172,744 |
|
|
1,029,019 |
|
|
Used vehicles |
|
|
668,860 |
|
|
703,326 |
|
|
803,879 |
|
|
678,035 |
|
|
567,838 |
|
|
Parts, services and other |
|
|
652,819 |
|
|
540,019 |
|
|
507,810 |
|
|
482,254 |
|
|
446,955 |
|
|
Finance and insurance, net |
|
|
332,034 |
|
|
228,684 |
|
|
189,270 |
|
|
133,247 |
|
|
104,708 |
|
|
Subtotal |
|
|
4,089,641 |
|
|
3,334,224 |
|
|
3,104,217 |
|
|
2,466,280 |
|
|
2,148,520 |
|
|
Total revenue |
|
|
4,285,255 |
|
|
3,518,997 |
|
|
3,278,817 |
|
|
2,628,878 |
|
|
2,314,751 |
|
|
Gross profit: |
|
|
|
|
|
|
|
|
|
|
|
|
|
|
|
|
|
Consumer Services and Plans |
|
|
113,792 |
|
|
105,501 |
|
|
92,851 |
|
|
88,533 |
|
|
84,103 |
|
|
Retail |
|
|
|
|
|
|
|
|
|
|
|
|
|
|
|
|
|
New vehicles |
|
|
349,699 |
|
|
265,332 |
|
|
228,095 |
|
|
169,385 |
|
|
146,698 |
|
|
Used vehicles |
|
|
162,767 |
|
|
146,073 |
|
|
155,990 |
|
|
132,350 |
|
|
114,295 |
|
|
Parts, services and other |
|
|
288,047 |
|
|
250,833 |
|
|
232,821 |
|
|
220,527 |
|
|
201,781 |
|
|
Finance and insurance, net |
|
|
332,034 |
|
|
228,684 |
|
|
189,270 |
|
|
133,247 |
|
|
104,708 |
|
|
Subtotal |
|
|
1,132,547 |
|
|
890,922 |
|
|
806,176 |
|
|
655,509 |
|
|
567,482 |
|
|
Total gross profit |
|
|
1,246,339 |
|
|
996,423 |
|
|
899,027 |
|
|
744,042 |
|
|
651,585 |
|
|
Operating expenses: |
|
|
|
|
|
|
|
|
|
|
|
|
|
|
|
|
|
Selling, general and administrative |
|
|
853,160 |
|
|
691,884 |
|
|
634,890 |
|
|
536,485 |
|
|
475,476 |
|
|
Debt restructure Expense |
|
|
387 |
|
|
1,218 |
|
|
— |
|
|
— |
|
|
— |
|
|
Depreciation and amortization |
|
|
31,545 |
|
|
24,695 |
|
|
24,101 |
|
|
24,601 |
|
|
21,183 |
|
|
(Gain) loss on asset sales |
|
|
(133) |
|
|
(564) |
|
|
(237) |
|
|
33 |
|
|
1,803 |
|
|
Total operating expenses |
|
|
884,959 |
|
|
717,233 |
|
|
658,754 |
|
|
561,119 |
|
|
498,462 |
|
|
Operating income |
|
|
361,380 |
|
|
279,190 |
|
|
240,273 |
|
|
182,923 |
|
|
153,123 |
|
|
Other income (expense): |
|
|
|
|
|
|
|
|
|
|
|
|
|
|
|
|
|
Floor plan interest expense |
|
|
(27,690) |
|
|
(18,854) |
|
|
(11,248) |
|
|
(10,675) |
|
|
(9,980) |
|
|
Other interest expense, net |
|
|
(42,959) |
|
|
(48,318) |
|
|
(53,377) |
|
|
(46,769) |
|
|
(74,728) |
|
|
Loss on debt restructure |
|
|
(462) |
|
|
(5,052) |
|
|
— |
|
|
(1,831) |
|
|
(49,450) |
|
|
Tax Receivable Agreement liability adjustment |
|
|
99,687 |
|
|
— |
|
|
— |
|
|
— |
|
|
— |
|
|
Other income (expense) |
|
|
— |
|
|
— |
|
|
1 |
|
|
(35) |
|
|
(59) |
|
|
Total other income (expense) |
|
|
28,576 |
|
|
(72,224) |
|
|
(64,624) |
|
|
(59,310) |
|
|
(134,217) |
|
|
Income before income taxes |
|
|
389,956 |
|
|
206,966 |
|
|
175,649 |
|
|
123,613 |
|
|
18,906 |
|
|
Income tax expense |
|
|
(156,982) |
|
|
(5,907) |
|
|
(1,356) |
|
|
(2,140) |
|
|
(1,988) |
|
|
Net income |
|
|
232,974 |
|
|
201,059 |
|
|
174,293 |
|
|
121,473 |
|
|
16,918 |
|
|
Less: net income attributable to non-controlling interests |
|
|
(204,612) |
|
|
(9,942) |
|
|
— |
|
|
— |
|
|
— |
|
|
Net income attributable to Camping World Holdings, Inc. |
|
$ |
28,362 |
|
$ |
191,117 |
|
$ |
174,293 |
|
$ |
121,473 |
|
$ |
16,918 |
|
|
Earnings per share of Class A common stock (1): |
|
|
|
|
|
|
|
|
|
|
|
|
|
|
|
|
|
Basic |
|
$ |
1.07 |
|
$ |
0.08 |
|
|
|
|
|
|
|
|
|
|
|
Diluted |
|
$ |
1.07 |
|
$ |
0.07 |
|
|
|
|
|
|
|
|
|
|
|
Cash dividends declared per share of Class A common stock |
|
$ |
0.74 |
|
$ |
0.08 |
|
|
|
|
|
|
|
|
|
|
|
Consolidated Statements of Cash Flows Data: |
|
|
|
|
|
|
|
|
|
|
|
|
|
|
|
|
|
Net cash provided by operating activities |
|
|
(9,094) |
|
|
215,691 |
|
|
112,143 |
|
|
44,064 |
|
|
14,623 |
|
|
Net cash used in investing activities |
|
|
(475,676) |
|
|
(115,703) |
|
|
(176,200) |
|
|
(50,225) |
|
|
(46,195) |
|
|
Net cash provided by (used in) financing activities |
|
|
594,737 |
|
|
(77,817) |
|
|
45,372 |
|
|
80,366 |
|
|
48,120 |
|
|
Selected Other Data: |
|
|
|
|
|
|
|
|
|
|
|
|
|
|
|
|
|
EBITDA (2) |
|
|
464,460 |
|
|
279,979 |
|
|
253,127 |
|
|
194,983 |
|
|
114,817 |
|
|
Adjusted EBITDA (2) |
|
|
399,612 |
|
|
289,157 |
|
|
249,481 |
|
|
194,872 |
|
|
164,582 |
|
|
Adjusted EBITDA margin (2) |
|
|
9.3% |
|
|
8.2% |
|
|
7.6% |
|
|
7.4% |
|
|
7.1% |
|
|
Selected Other Operating Data: |
|
|
|
|
|
|
|
|
|
|
|
|
|
|
|
|
|
Active Customers (3) |
|
|
3,637,195 |
|
|
3,344,959 |
|
|
3,131,961 |
|
|
2,845,612 |
|
|
2,645,503 |
|
76
|
|
|
Fiscal Year Ended |
||||||||
|
|
|
December 31, |
|
December 31, |
|
December 31, |
|
December 31, |
|
December 31, |
|
|
|
2017 |
|
2016 |
|
2015 |
|
2014 |
|
2013 |
|
($ in thousands) |
|
|
|
Restated |
|
|
|
|
|
|
|
Consolidated Balance sheets data (at period end): |
|
|
|
|
|
|
|
|
|
|
|
Cash and cash equivalents |
|
224,163 |
|
114,196 |
|
92,025 |
|
110,710 |
|
36,505 |
|
Total assets |
|
2,561,477 |
|
1,455,777 |
|
1,332,585 |
|
1,154,422 |
|
899,926 |
|
Total debt (4) |
|
916,902 |
|
626,753 |
|
725,393 |
|
613,185 |
|
589,214 |
|
Total noncurrent liabilities |
|
1,150,471 |
|
731,492 |
|
774,641 |
|
756,088 |
|
712,887 |
|
Total members'/stockholders' equity (deficit) |
|
90,837 |
|
(144,137) |
|
(307,159) |
|
(250,675) |
|
(385,430) |
|
(1) |
Basic and diluted earnings per Class A common stock is applicable only for periods after the Company’s IPO. See Note 21 — Earnings Per Share to our audited consolidated financial statements included in Part II, Item 8 of this Form 10-K for additional information. |
|
(2) |
EBITDA, Adjusted EBITDA, and Adjusted EBITDA Margin are supplemental measures of our performance that are not required by, or presented in accordance with, GAAP. EBITDA, Adjusted EBITDA, and Adjusted EBITDA Margin are not measurements of our financial performance under GAAP and should not be considered as an alternative to net income, net income margin, or any other performance measure derived in accordance with GAAP, or as an alternative to cash flows from operating activities as a measure of our liquidity. See “Non-GAAP Financial Measures” in Part II, Item 7 of this Form 10-K for additional information and a reconciliation to the most directly comparable GAAP financial measure. |
|
(3) |
We define an “Active Customer” as a customer who has transacted with us in any of the eight most recently completed fiscal quarters prior to the date of measurement. |
|
(4) |
Total debt consists of borrowings under our Existing Senior Secured Credit Facilities and Previous Senior Secured Credit Facilities, as applicable, net of unamortized original issue discount and capitalized finance costs as of December 31, 2017, 2016, 2015, 2014 and 2013 of $6.0 million and $14.2 million, $6.3 million and $11.9 million, $4.9 million and $11.1 million, $4.9 million and $10.0 million, and $5.2 million and $8.6 million, respectively, (as discussed under “Management’s Discussion and Analysis of Financial Condition and Results of Operations — Liquidity and Capital Resources” in Part II, Item 7 of this Form 10-K). See our audited consolidated financial statements included in Part II, Item 8 of this Form 10-K, which include all liabilities, including amounts outstanding under our Floor Plan Facility. |
77
ITEM 7. MANAGEMENT’S DISCUSSION AND ANALYSIS OF FINANCIAL CONDITION AND RESULTS OF OPERATIONS
You should read the following discussion and analysis of our financial condition and results of operations together with our Consolidated Financial Statements and notes thereto included in Part II, Item 8 of this Form 10-K. This discussion contains forward‑looking statements based upon current plans, expectations and beliefs involving risks and uncertainties. Our actual results may differ materially from those anticipated in these forward‑looking statements as a result of various important factors, including those set forth under “Risk Factors” include in Part I, Item 1A of this Form 10-K, “Cautionary Note Regarding Forward‑Looking Statements” and in other parts of this Form 10-K. Except to the extent that differences among reportable segments are material to an understanding of our business taken as a whole, we present the discussion in Management’s Discussion and Analysis of Financial Condition and Results of Operations on a consolidated basis.
Overview
We believe we are the only provider of a comprehensive portfolio of services, protection plans, products, and resources for RV enthusiasts. Approximately 9 million households in the United States own an RV, and of that installed base, we have approximately 3.6 million total Active Customers. We generate recurring revenue by providing RV owners and enthusiasts the full spectrum of services, protection plans, products, and resources that we believe are essential to operate, maintain, and protect their RV and to enjoy the RV lifestyle. We provide these offerings through our two iconic brands: Good Sam and Camping World.
We believe our Good Sam branded offerings provide the industry’s broadest and deepest range of services, protection plans, products, and resources, including: extended vehicle service contracts and insurance protection plans, roadside assistance, membership clubs, and financing products. A majority of these programs are on a multi‑year or annually renewable basis. Across our extended vehicle service contracts, emergency roadside assistance, property and casualty insurance programs and membership clubs, for each of the years ended December 31, 2017, 2016, and 2015, we experienced high annual retention rates that ranged between 64% and 71%, 65% and 74%, and 66% and 74%, respectively. We also operate the Good Sam Club, which we believe is the largest RV organization in the world, with 1.8 million members as of December 31, 2017. Membership benefits include a variety of discounts, exclusive benefits, specialty publications, and other membership benefits, all of which we believe enhance the RV experience, drive customer engagement, and provide cross‑selling opportunities for our other services, protection plans, and products.
Our Camping World brand operates the largest national network of RV‑centric retail locations in the United States through our 140 retail locations in 36 states, as of December 31, 2017, and through our e‑commerce platforms. We believe we are significantly larger in scale than our next largest competitor. We provide new and used RVs, repair parts, RV accessories and supplies, RV repair and maintenance services, protection plans, travel assistance plans, RV financing, and lifestyle products and services for new and existing RV owners. Our retail locations are staffed with knowledgeable local team members, providing customers access to extensive RV expertise. Our retail locations are strategically located in key national RV markets. In 2017, our RV network generated approximately 3.7 million transactions, continuing to build our Active Customer database.
In 2017, we expanded our products and services focus to outdoor sports and retail to include an array of outdoor products, apparel and gear and active sportswear and gear to target the broader group of outdoor and active sports enthusiasts. On May 26, 2017, we acquired certain assets of Gander Mountain Company (“Gander Mountain”), which specialized in the hunting, camping, fishing, shooting sports, and outdoor markets, and its Overton’s, Inc. (“Overton’s”) marine and watersports business through a bankruptcy auction. On August 17, 2017, we acquired Active Sports, Inc. which included TheHouse.com, (an online retail component of the business) specializing in bikes, sailboards, skateboards, wakeboards, snowboards and outdoor gear. On September 22, 2017, we acquired EIGHTEEN0THREE LLC, dba W82 (“W82”), which specializes in snowboarding, skateboarding, longboarding, swimwear, footwear, apparel and accessories. On October 19, 2017, we acquired Uncle Dan's LTD, a specialty retailer of outdoor gear, apparel and camping supplies. As of December 31, 2017, we were operating two Gander Outdoors stores, two Overton’s retail
78
stores, two Active Sports locations, two W82 locations, and five Uncle Dan’s locations. We plan to operate a total of 74 Gander Outdoors stores by May 2018. We attract new customers primarily through our retail locations, e‑commerce platforms, and direct marketing. Once we acquire our customers through a transaction, they become part of our customer database where we leverage customized CRM tools and analytics to actively engage, market, and sell multiple products and services. Our goal is to consistently grow our customer database through our various channels to increasingly cross‑sell our products and services.
Segments
We identify our reporting segments based on the organizational units used by management to monitor performance and make operating decisions. We have identified two reporting segments: (a) Consumer Services and Plans and (b) Retail. We provide our consumer services and plans offerings through our Good Sam brand and we provide our retail offerings through our Camping World, Gander Outdoors, Overton’s, TheHouse.com, W82 and Uncle Dan’s, LTD brands. Within the Consumer Services and Plans segment, we primarily derive revenue from the sale of the following offerings: emergency roadside assistance; property and casualty insurance programs; travel assist programs; extended vehicle service contracts; co‑branded credit cards; vehicle financing and refinancing; club memberships; and publications and directories. Within the Retail segment, we primarily derive revenue from the sale of the following products: new vehicles; used vehicles; parts and service, including RV accessories and supplies; and finance and insurance. For the years ended December 31, 2017, 2016, and 2015, we generated 4.6%, 5.2%, and 5.3% of our total revenue from our Consumer Services and Plans segment, respectively, and 95.4%, 94.8%, and 94.7% of our total revenue from our Retail segment, respectively. For the years ended December 31, 2017, 2016, and 2015, we generated 9.1%, 10.6%, and 10.3% of our gross profit from our Consumer Services and Plans segment, respectively, and 90.9%, 89.4%, and 89.7% of our gross profit from our Retail segment, respectively. See Note 22 — Segment Information to our audited consolidated financial statements included in Part II, Item 8 of this Form 10-K.
Growth Strategies and Outlook
We believe RV trips remain the least expensive type of vacation and allow RV owners to travel more while spending less. RV trips offer savings on a variety of vacation costs, including, among others, airfare, lodging and dining. While fuel costs are a component of the overall vacation cost, we believe fluctuations in fuel prices are not a significant factor affecting a family’s decision to take RV trips.
The RV owner installed base has benefited positively from the aging and the increased industry penetration of the baby boomer consumer demographic, those aged 52 to 70 years old. In addition to growth from baby boomers, the RVIA estimates the fastest growing RV owner age group includes Generation X consumers, those currently 35 to 54 years old. The U.S. Census Bureau estimates that approximately 83 million Americans were of the age 35 to 54 years old in 2016.
In addition to positive age trends, according to the RV Survey, the typical RV customer has, on average, a household income of approximately $75,000. This is approximately 50% higher than the median household income of the broader United States population at the time of the RV survey, according to the U.S. Census Bureau. The higher average income has resulted in a more resilient RV consumer with greater buying power across economic cycles.
Taken together, we believe the savings RVs offer on a variety of vacation costs, an increase in the pool of potential RV customers due to an aging baby boomer demographic, and the increased RV ownership among younger consumers should continue to grow the installed base of RV owners, and will have a positive impact on RV usage.
We plan to take advantage of these positive trends in RV usage to pursue the following strategies to continue to grow our revenue and profits:
|
· |
Grow our Active Base of Customers. We believe our strong brands, leading market position, ongoing investment in our service platform, broad product portfolio, and full suite of resources will continue to provide us with competitive advantages in targeting and capturing a larger share of |
79
consumers with whom we do not currently transact in addition to the growing number of new RV enthusiasts that will enter the market. We expect to continue to grow the Active Customer base primarily through three strategies: |
|
· |
Targeted Marketing: We continuously work to attract new customers to our existing retail and online locations through targeted marketing, attractive introductory offerings, and access to our wide array of resources for RV enthusiasts. |
|
· |
Greenfield Retail Locations: We establish retail locations in new and existing markets to expand our customer base. Target markets and locations are identified by employing proprietary data and analytical tools. |
|
· |
Retail Location Acquisitions: The RV dealership industry is highly fragmented with a large number of independent RV dealers. We use acquisitions of independent dealers as a fast and capital efficient alternative to new retail location openings to expand our business and grow our customer base. |
|
· |
Cross‑Sell Products and Services. We believe our customer database of over 15.1 million unique RV contacts provides us with the opportunity to continue our growth through the cross‑selling of our products and services. We use our customized CRM system and database analytics to proactively market and cross‑sell to Active Customers. We also seek to increase the penetration of our customers who exhibit higher multi‑product attachment rates. |
|
· |
New Products and Vertical Acquisitions. Introduction of new products enhances our cross‑selling effort, both by catering to evolving customer demands and by bringing in new customers. Through relationships with existing suppliers and through acquisitions, we will look to increase the new products we can offer to our customers. Similarly, an opportunistic vertical acquisition strategy allows us to earn an increased margin on our services, protection plans, and products, and we evaluate such acquisitions that can allow us to capture additional sales from our customers at attractive risk‑adjusted returns. |
As discussed above, while we have traditionally focused on the RV-centric outdoor enthusiasts, we believe there is significant opportunity for us to offer our comprehensive portfolio of services, protection plans, products and resources beyond the traditional RV enthusiasts to a broader group of outdoor and active sports enthusiasts who enjoy hunting, fishing, boating, non-RV camping, biking, snow skiing, snowboarding, sailboarding, skateboarding and other outdoor active sports and activities. By expanding our array of products and services to include outdoor products, apparel and gear, and active sportswear and gear to target this broader group of outdoor and active sports enthusiasts, and by enhancing the benefits of membership in our Good Sam Club to provide additional benefits and savings to this broader group of outdoor and active sports enthusiasts, we believe we have the opportunity to expand our base of Active Customers and enhance the long-term value of the Good Sam consumer services and plans. Consistent with this new strategy, we made several strategic acquisitions in the retail space in 2017 and early 2018, including Gander Mountain, and Overton’s, Active Sports, Inc., W82, Uncle Dan’s Outfitters and Erehwon Mountain Outfitter. As of December 31, 2017, we were operating two Gander Outdoors stores, two Overton’s retail stores, two Active Sports locations, two W82 locations, and five Uncle Dan’s locations. We plan to operate a total of 74 Gander Outdoors stores by May 2018.
As discussed below under “— Liquidity and Capital Resources,” we believe that our sources of liquidity and capital will be sufficient to take advantage of these positive trends in RV usage and finance our growth strategy. However, the operation of our business, the rate of our expansion, including our planned openings of Gander Outdoors stores in 2018, and our ability to respond to changing business and economic conditions depend on the availability of adequate capital, which in turn typically depends on cash flow generated by our business and, if necessary, the availability of equity or debt capital. In addition, as we grow, we will face the risk that our existing resources and systems, including management resources, accounting and finance personnel, and operating systems, may be inadequate to support our growth. Any inability to generate sufficient cash flows from operations or raise additional equity or debt capital or retain the personnel or make the other changes in our systems that may be required to support our growth could have a material
80
adverse effect on our business, financial condition and results of operations. See “Risk Factors — Risks Related to our Business — Our ability to operate and expand our business and to respond to changing business and economic conditions will depend on the availability of adequate capital” and “Risk Factors — Risks Related to our Business — Our expansion into new, unfamiliar markets presents increased risks that may prevent us from being profitable in these new markets. Delays in opening or acquiring new retail locations could have a material adverse effect on our business, financial condition and results of operations” included in Part I, Item 1A of this Form 10-K.
How We Generate Revenue
Revenue across each of our two reporting segments is impacted by the following key revenue drivers:
Number of Active Customers. We define an “Active Customer” as a customer who has transacted with us in any of the eight most recently completed fiscal quarters prior to the date of measurement. As of December 31, 2017, 2016, and 2015, we had approximately 3.6 million, 3.3 million, and 3.1 million Active Customers related to the RV industry, respectively, excluding the impact of the Gander Mountain acquisition. We estimate that the favorable impact on our Active Customer count from the Gander Mountain acquisition over time will be approximately 0.7 million to 1.5 million. Our Active Customer base is an integral part of our business model and has a significant effect on our revenue. We attract new customers to our business primarily through our retail locations. Once we acquire our customers through a transaction, they become part of our customer database where we use CRM tools to cross‑sell Active Customers additional products and services.
Consumer Services and Plans. The majority of our consumer services and plans, such as our roadside assistance, extended service contracts, insurance programs, travel assist, and our Good Sam and Coast to Coast clubs, are built on a recurring revenue model. A majority of these programs are on a multi‑year or annually renewable basis and have annualized fees typically ranging from $20 to $5,200. We believe that many of these products and services are essential for our customers to operate, maintain and protect their RVs, and to enjoy the RV lifestyle, resulting in attractive annual retention rates. As we continue to grow our consumer services and plans business, we expect to further enhance our visibility with respect to revenue and cash flow, and increase our overall profitability. As of December 31, 2017, 2016, and 2015 we had, respectively, 1.8 million, 1.8 million, and 1.7 million club members in our Good Sam and Coast to Coast clubs.
Retail Locations. We open new retail locations through organic growth and acquisitions. Our new retail locations are one of the primary ways in which we attract new customers to our business. Our retail locations typically offer our full array of products and services, including new and used RVs, RV financing, protection plans, a selection of OEM and aftermarket repair parts, RV accessories, RV maintenance products, supplies, and outdoor lifestyle products.
The total number of new retail location openings in any period, including the mix of greenfield locations and acquired locations, the geographic location of the openings, and the timing of the incurrence of pre‑opening costs, will continue to have an impact on our revenue and profitability. When we build or acquire new retail locations, we make capital investments in facilities, fixtures, and equipment, which we amortize over time. Before we open new retail locations organically or through acquisitions, we incur pre‑opening expenses, including advertising costs, payroll expenses, travel expenses, employee training costs, rent expenses, and setup costs. For the years ended December 31, 2017, 2016 and 2015, we incurred pre‑opening expenses of $1.2 million, $1.3 million, and $1.3 million, respectively, for RV greenfield locations and acquired locations. Additionally, for the year ended December 31, 2017, we incurred pre-opening expenses of $26.3 million related to the opening of Gander Outdoors locations and expect to incur approximately $30.0 million in incremental pre-opening expenses in 2018 related to these store openings. While acquired sites typically remain open following an acquisition, in certain instances we may close a location following an acquisition for remodeling for a period of time generally not in excess of eight weeks. Our acquisitions are typically profitable within two full calendar months after an acquisition, with the exception of acquisitions we consider turn‑around opportunities, which are typically profitable within two to four months. Our greenfield locations typically reach profitability within three months. When we enter new markets, we may
81
be exposed to start up times that are longer and store revenue and contribution margins that are lower than reflected in our average historical experience. With respect to the additional 72 Gander Outdoors locations we plan to open by May 2018, given our lack of operating history of these store locations, we expect to be exposed to longer start up times to reach profitability than our traditional greenfield location openings. We anticipate that these new store locations will negatively impact our Retail segment margins during the ramp-up period.
For the years ended December 31, 2017, 2016, and 2015, we opened one, one, and two greenfield locations, respectively, and acquired eighteen, six, and six retail locations, In addition, as a result of the acquisitions of the Gander Mountain, Active Sports, Inc., W82, and Uncle Dan’s LTD., we acquired two Overton’s, two TheHouse.com, two W82, and five Uncle Dan’s locations, and re-opened two Gander Outdoors locations, and our current plan is to open an additional 72 Gander Outdoors stores by May 2018.
Same store sales. Same store sales measures the performance of a retail location during the current reporting period against the performance of the same retail location in the corresponding period of the previous year. Same store sales calculations for a given period include only those stores that were open both at the end of corresponding period and at the beginning of the preceding fiscal year.
Same store sales growth is driven by increases in the number of transactions and the average transaction price. In addition to attracting new customers and cross‑selling our consumer services and plans, we also drive our sales through new product introductions, including our private label offerings. Although growth in same store sales drives our overall revenue, we have and will continue to experience volatility in same store sales from period to period, mainly due to changes in our product sales mix. Our product mix in any period is principally impacted by the number and mix of new or used RVs that we sell due to the high price points of these products compared to our other retail products and the range of price points among the types of RVs sold. See “Business” included in Part I, Item 1 of this Form 10-K for additional information regarding our retail locations and our products.
As discussed below, a decrease in same store sales resulting from product mix will not necessarily have a significant impact on our profitability because our product sales outside of new and used RVs typically carry higher margins and because margins vary among the different types of RVs sold. Through the sale of RVs, we are able to add members to our Active Customer base and increase our opportunities to cross‑sell our higher margin products and recurring consumer services and plans.
As of December 31, 2017, 2016 and 2015, we had, respectively, a base of 115, 107, and 98 same stores, of which same stores, respectively, 17, 17, and 17 did not include dealerships. For the years ended December 31, 2017, 2016 and 2015 our aggregate same store sales were $3.5 billion, $2.9 billion, and $2.5 billion, respectively. As of December 31, 2017, 2016, and 2015, we had, respectively, a total of 140, 122, and 115 retail locations, excluding the locations acquired through the acquisitions of Gander Mountain, Active Sports, Inc., W82 and Uncle Dan’s LTD, noted above.
Other Key Performance Indicators
Gross Profit and Gross Margins. Gross profit is our total revenue less our total costs applicable to revenue. Our total costs applicable to revenue primarily consists of the cost of goods and cost of sales. Gross margin is gross profit as a percentage of revenue.
Our gross profit is variable in nature and generally follows changes in our revenue. While gross margins for our Retail segment are lower than our gross margins for our Consumer Services and Plans segment, our Retail segment generates significant gross profit and is a primary means of acquiring new customers, to which we then cross‑sell our higher margin products and services with recurring revenue. We believe the overall growth of our Retail segment will allow us to continue to drive growth in gross profits due to our ability to cross‑sell our consumer services and plans to our increasing Active Customer base. For the years ended December 31, 2017, 2016, and 2015, gross profit was $113.8 million, $105.5 million, and $92.9 million, respectively, and gross margin was 58.2%, 57.1%, and 53.2% respectively, for our Consumer Services and Plans segment, and gross profit was $1.1 billion, $890.9 million, and $806.2 million, respectively, and gross margin was 27.7%, 26.7%, and 26.0%, respectively, for our Retail segment. As
82
discussed above, we expect our Retail gross margin to be impacted in 2018 due to our planned opening of 72 additional Gander Outdoors locations.
SG&A as a percentage of Gross Profit. Selling, general and administrative (“SG&A”) expenses as a percentage of gross profit allows us to monitor our expense control over a period of time. SG&A consists primarily of wage‑related expenses, selling expenses related to commissions and advertising, lease expenses and corporate overhead expenses. We calculate SG&A expenses as a percentage of gross profit by dividing SG&A expenses for the period by total gross profit. For the years ended December 31, 2017, 2016 and 2015, SG&A as a percentage of gross profit was 68.5%, 69.4%, and 70.6%, respectively. We expect SG&A expenses to increase as we open new retail locations through organic growth and acquisitions, which we also expect will drive increases in revenue and gross profit. SG&A expenses for the year ended December 31, 2017 included certain SG&A expenses related to Gander Outdoors, which we expect to increase going forward with the planned opening of 72 additional Gander Outdoors locations. We expect that these increases in SG&A expenses will drive increases in revenue and gross profit, although these increases may initially be slower than our historical greenfield locations due to longer ramp-up times, which may negatively impact our SG&A as a percentage of gross profit. Additionally, we expect that our SG&A expenses will increase in future periods in part due to additional legal, accounting, insurance and other expenses that we expect to incur as a result of being a public company, including compliance with the Sarbanes‑Oxley Act and the related rules and regulations.
Adjusted EBITDA Margin. Adjusted EBITDA is one of the primary metrics management uses to evaluate the financial performance of our business. Adjusted EBITDA is also frequently used by analysts, investors, and other interested parties to evaluate companies in our industry. We use Adjusted EBITDA and Adjusted EBITDA Margin to supplement GAAP measures of performance as follows:
|
· |
as a measurement of operating performance to assist us in comparing the operating performance of our business on a consistent basis, and remove the impact of items not directly resulting from our core operations; |
|
· |
for planning purposes, including the preparation of our internal annual operating budget and financial projections; |
|
· |
to evaluate the performance and effectiveness of our operational strategies; and |
|
· |
to evaluate our capacity to fund capital expenditures and expand our business. |
We define Adjusted EBITDA as net income before other interest expense (excluding floor plan interest expense), provision for income taxes, depreciation and amortization, loss (gain) on debt restructure, loss (gain) on sale of assets and disposition of stores, monitoring fees, equity-based compensation, an adjustment to rent on right to use assets and other unusual or one‑time items. We calculate Adjusted EBITDA Margin by dividing Adjusted EBITDA by total revenue for the period. Adjusted EBITDA is not a GAAP measure of our financial performance and should not be considered as an alternative to net income as a measure of financial performance, or any other performance measure derived in accordance with GAAP. Adjusted EBITDA should not be construed as an inference that our future results will be unaffected by unusual or non‑recurring items. Additionally, Adjusted EBITDA is not intended to be a measure of discretionary cash to invest in the growth of our business, as it does not reflect tax payments, debt service requirements, capital expenditures and certain other cash costs that may recur in the future, including, among other things, cash requirements for working capital needs and cash costs to replace assets being depreciated and amortized. Management compensates for these limitations by relying on our GAAP results in addition to using Adjusted EBITDA supplementally. Our measure of Adjusted EBITDA is not necessarily comparable to similarly titled captions of other companies due to different methods of calculation. For a reconciliation of Adjusted EBITDA to net income, a reconciliation of Adjusted EBITDA Margin to net income margin, and a further discussion of how we utilize this non-GAAP financial measure, see “Non-GAAP Financial Measures” below.
83
Results of Operations
The discussion in this Results of Operations gives effect to certain adjustments made to the previously reported audited consolidated financial statements for the year ended December 31, 2016 in connection with the restatement of such financial statements in Part II, Item 8 of this Form 10-K, as well as the correction of certain errors for the years ended December 31, 2016 and 2015 that were immaterial in prior periods. Refer to Note 1 — Summary of Significant Accounting Policies — Restatement to Prior Periods in Part II, Item 8 of this Form 10-K for additional details regarding the restatement.
Year Ended December 31, 2017 Compared to the Year Ended December 31, 2016
The following table sets forth information comparing the components of net income for the years ended December 31, 2017 and 2016.
|
|
|
Fiscal year ended |
|
|
|
|
|
|
||||||||
|
|
|
December 31, 2017 |
|
December 31, 2016 |
|
|
|
|||||||||
|
|
|
|
|
|
Percent of |
|
|
|
|
Percent of |
|
Favorable/ (Unfavorable) |
|
|||
|
($ in thousands) |
|
Amount |
|
Revenue |
|
Amount |
|
Revenue |
|
$ |
|
% |
|
|||
|
|
|
|
|
|
|
|
|
|
|
|
|
|
|
|
|
|
|
Revenue: |
|
|
|
|
|
|
|
|
|
|
|
|
|
|
|
|
|
Consumer Services and Plans |
|
$ |
195,614 |
|
4.6% |
|
$ |
184,773 |
|
5.3% |
|
$ |
10,841 |
|
5.9% |
|
|
Retail |
|
|
|
|
|
|
|
|
|
|
|
|
|
|
|
|
|
New vehicles |
|
|
2,435,928 |
|
56.8% |
|
|
1,862,195 |
|
52.9% |
|
|
573,733 |
|
30.8% |
|
|
Used vehicles |
|
|
668,860 |
|
15.6% |
|
|
703,326 |
|
20.0% |
|
|
(34,466) |
|
-4.9% |
|
|
Parts, services and other |
|
|
652,819 |
|
15.2% |
|
|
540,019 |
|
15.3% |
|
|
112,800 |
|
20.9% |
|
|
Finance and insurance, net |
|
|
332,034 |
|
7.7% |
|
|
228,684 |
|
6.5% |
|
|
103,350 |
|
45.2% |
|
|
Subtotal |
|
|
4,089,641 |
|
95.4% |
|
|
3,334,224 |
|
94.7% |
|
|
755,417 |
|
22.7% |
|
|
Total revenue |
|
|
4,285,255 |
|
100.0% |
|
|
3,518,997 |
|
100.0% |
|
|
766,258 |
|
21.8% |
|
|
|
|
|
|
|
|
|
|
|
|
|
|
|
|
|
|
|
|
Gross profit (exclusive of depreciation and amortization shown separately below): |
|
|
|
|
|
|
|
|
|
|
|
|
|
|
|
|
|
Consumer Services and Plans |
|
|
113,792 |
|
2.7% |
|
|
105,501 |
|
3.0% |
|
|
8,291 |
|
7.9% |
|
|
Retail |
|
|
|
|
|
|
|
|
|
|
|
|
|
|
|
|
|
New vehicles |
|
|
349,699 |
|
8.2% |
|
|
265,332 |
|
7.5% |
|
|
84,367 |
|
31.8% |
|
|
Used vehicles |
|
|
162,767 |
|
3.8% |
|
|
146,073 |
|
4.2% |
|
|
16,694 |
|
11.4% |
|
|
Parts, services and other |
|
|
288,047 |
|
6.7% |
|
|
250,833 |
|
7.1% |
|
|
37,214 |
|
14.8% |
|
|
Finance and insurance, net |
|
|
332,034 |
|
7.7% |
|
|
228,684 |
|
6.5% |
|
|
103,350 |
|
45.2% |
|
|
Subtotal |
|
|
1,132,547 |
|
26.4% |
|
|
890,922 |
|
25.3% |
|
|
241,625 |
|
27.1% |
|
|
Total gross profit |
|
|
1,246,339 |
|
29.1% |
|
|
996,423 |
|
28.3% |
|
|
249,916 |
|
25.1% |
|
|
|
|
|
|
|
|
|
|
|
|
|
|
|
|
|
|
|
|
Operating expenses: |
|
|
|
|
|
|
|
|
|
|
|
|
|
|
|
|
|
Selling, general and administrative expenses |
|
|
853,160 |
|
19.9% |
|
|
691,884 |
|
19.7% |
|
|
(161,276) |
|
-23.3% |
|
|
Debt restructure expense |
|
|
387 |
|
0.0% |
|
|
1,218 |
|
0.0% |
|
|
831 |
|
68.2% |
|
|
Depreciation and amortization |
|
|
31,545 |
|
0.7% |
|
|
24,695 |
|
0.7% |
|
|
(6,850) |
|
-27.7% |
|
|
Gain on asset sales |
|
|
(133) |
|
0.0% |
|
|
(564) |
|
0.0% |
|
|
(431) |
|
-76.4% |
|
|
Income from operations |
|
|
361,380 |
|
8.4% |
|
|
279,190 |
|
7.9% |
|
|
82,190 |
|
29.4% |
|
|
Other income (expense): |
|
|
|
|
|
|
|
|
|
|
|
|
|
|
|
|
|
Floor plan interest expense |
|
|
(27,690) |
|
-0.6% |
|
|
(18,854) |
|
-0.5% |
|
|
(8,836) |
|
-46.9% |
|
|
Other interest expense, net |
|
|
(42,959) |
|
-1.0% |
|
|
(48,318) |
|
-1.4% |
|
|
5,359 |
|
11.1% |
|
|
Tax Receivable Agreement liability adjustment |
|
|
99,687 |
|
2.3% |
|
|
— |
|
0.0% |
|
|
99,687 |
|
100.0% |
|
|
Loss on debt restructure |
|
|
(462) |
|
0.0% |
|
|
(5,052) |
|
-0.1% |
|
|
4,590 |
|
90.9% |
|
|
|
|
|
28,576 |
|
0.7% |
|
|
(72,224) |
|
-2.1% |
|
|
100,800 |
|
139.6% |
|
|
Income before income taxes |
|
|
389,956 |
|
9.1% |
|
|
206,966 |
|
5.9% |
|
|
182,990 |
|
88.4% |
|
|
Income tax expense |
|
|
(156,982) |
|
-3.7% |
|
|
(5,907) |
|
-0.2% |
|
|
(151,075) |
|
-2557.6% |
|
|
Net income |
|
|
232,974 |
|
5.4% |
|
|
201,059 |
|
5.7% |
|
|
31,915 |
|
15.9% |
|
|
Less: net income attributable to non-controlling interests |
|
|
(204,612) |
|
-4.8% |
|
|
(9,942) |
|
-0.3% |
|
|
(194,670) |
|
-1958.1% |
|
|
Net income attributable to Camping World Holdings, Inc. |
$ |
28,362 |
0.7% |
$ |
191,117 |
5.4% |
$ |
(162,755) |
-85.2% |
|||||||
84
Total Revenue
Total revenue was $4.3 billion for the year ended December 31, 2017, an increase of $766.3 million, or 21.8%, as compared to $3.5 billion for the year ended December 31, 2016. The increase was primarily driven by increases in our Retail segment consisting of a 37.2% increase in new vehicle unit sales, a 20.9% increase in parts, services and other revenue, and a 45.2% increase in finance and insurance revenue.
Consumer Services and Plans
Consumer Services and Plans revenue was $195.6 million for the year ended December 31, 2017, an increase of $10.8 million, or 5.9%, as compared to $184.8 million for the year ended December 31, 2016. The increased revenue was attributable to a $3.7 million increase from our clubs and roadside assistance programs primarily due to increased file size; a $3.6 million increase from our vehicle insurance and Good Sam TravelAssist programs primarily due to increased policies in force; a $2.1 million increase from the extended vehicle warranty programs primarily due to increased policies in force; and a $1.6 million increase from consumer show exhibit and admissions revenue resulting from the acquisition of five consumer shows in the fourth quarter of 2016 and our new Good Sam RV Super Show introduced in February 2017; partially offset by $0.2 million of other decreases.
Consumer Services and Plans gross profit was $113.8 million for the year ended December 31, 2017, an increase of $8.3 million, or 7.9%, as compared to $105.5 million for the year ended December 31, 2016. This increase was primarily due an increase from our vehicle insurance and Good Sam TravelAssist programs of $3.9 million primarily due to increased policies in force; increased roadside assistance contracts in force and reduced claims, together resulting in a gross profit increase of $2.4 million; increased Good Sam Club membership and reduced marketing costs, together resulting in a gross profit increase of $1.6 million; and an increase from the acquisition of five consumer shows and one new show of $0.7 million; partially offset by other decreases of $0.3 million.
Retail:
New Vehicles
|
|
|
Fiscal year ended |
|
|
|
|||||||||||
|
|
|
December 31, 2017 |
|
December 31, 2016 |
|
Favorable/ |
|
|||||||||
|
($ in thousands, |
|
|
|
Percent of |
|
|
|
Percent of |
|
(Unfavorable) |
|
|||||
|
except per vehicle data) |
|
Amount |
|
Revenue |
|
Amount |
|
Revenue |
|
$ |
|
% |
|
|||
|
|
|
|
|
|
|
|
|
|
|
|
|
|
|
|
|
|
|
Revenue |
|
$ |
2,435,928 |
|
100.0% |
|
$ |
1,862,195 |
|
100.0% |
|
$ |
573,733 |
|
30.8% |
|
|
|
|
|
|
|
|
|
|
|
|
|
|
|
|
|
|
|
|
Gross profit |
|
|
349,699 |
|
14.4% |
|
|
265,332 |
|
14.2% |
|
|
84,367 |
|
31.8% |
|
|
|
|
|
|
|
|
|
|
|
|
|
|
|
|
|
|
|
|
New vehicle unit sales |
|
|
66,813 |
|
|
|
|
48,704 |
|
|
|
|
18,109 |
|
37.2% |
|
New vehicle revenue was $2.4 billion for the year ended December 31, 2017, an increase of $573.7 million, or 30.8%, as compared to $1.9 billion for 2016. The increase was primarily due to a 37.2% increase in vehicle unit sales primarily attributable to a same store sales increase of 17.2% driven by increased consumer confidence and improved credit availability. The balance of the increase was from a total of 26 greenfield and acquired locations opened during 2016 and 2017.
New vehicle gross profit was $349.7 million for the year ended December 31, 2017, an increase of $84.4 million, or 31.8%, as compared to $265.3 million for the year ended December 31, 2016. The increase was primarily due to the 37.2% increase in new vehicle unit sales partially offset by a decrease in average gross profit per unit of 3.9%. Gross margin increased 11 basis points to 14.4%.
85
Used Vehicles
|
|
|
Fiscal year ended |
|
|
|
|||||||||||
|
|
|
December 31, 2017 |
|
December 31, 2016 |
|
Favorable/ |
|
|||||||||
|
($ in thousands, |
|
|
|
Percent of |
|
|
|
Percent of |
|
(Unfavorable) |
|
|||||
|
except per vehicle data) |
|
Amount |
|
Revenue |
|
Amount |
|
Revenue |
|
$ |
|
% |
|
|||
|
|
|
|
|
|
|
|
|
|
|
|
|
|
|
|
|
|
|
Revenue |
|
$ |
668,860 |
|
100.0% |
|
$ |
703,326 |
|
100.0% |
|
$ |
(34,466) |
|
-4.9% |
|
|
|
|
|
|
|
|
|
|
|
|
|
|
|
|
|
|
|
|
Gross profit |
|
|
162,767 |
|
24.3% |
|
|
146,073 |
|
20.8% |
|
|
16,694 |
|
11.4% |
|
|
|
|
|
|
|
|
|
|
|
|
|
|
|
|
|
|
|
|
Used vehicle unit sales |
|
|
30,250 |
|
|
|
|
31,248 |
|
|
|
|
(998) |
|
-3.2% |
|
Used vehicle revenue was $668.9 million for the year ended December 31, 2017, a decrease of $34.5 million, or 4.9%, as compared to $703.3 million for the year ended December 31, 2016. The decrease was primarily due to reduced levels of inventory, resulting from fewer trades on new unit sales, driving a 3.2% decrease in used vehicle unit sales, with an 8.7% decrease in same store sales.
Used vehicle gross profit was $162.8 million for the year ended December 31, 2017, an increase of $16.7 million, or 11.4%, as compared to $146.1 million for the year ended December 31, 2016. The increase was primarily due to a 15.1% increase in average gross profit per unit partially offset by a 3.2% decrease in vehicle unit sales. Gross margin increased 357 basis points to 24.3%.
Parts, Services and Other
|
|
|
Fiscal year ended |
|
|
|
|||||||||||
|
|
|
December 31, 2017 |
|
December 31, 2016 |
|
Favorable/ |
|
|||||||||
|
|
|
|
|
Percent of |
|
|
|
Percent of |
|
(Unfavorable) |
|
|||||
|
($ in thousands) |
|
Amount |
|
Revenue |
|
Amount |
|
Revenue |
|
$ |
|
% |
|
|||
|
|
|
|
|
|
|
|
|
|
|
|
|
|
|
|
|
|
|
Revenue |
|
$ |
652,819 |
|
100.0% |
|
$ |
540,019 |
|
100.0% |
|
$ |
112,800 |
|
20.9% |
|
|
|
|
|
|
|
|
|
|
|
|
|
|
|
|
|
|
|
|
Gross profit |
|
|
288,047 |
|
44.1% |
|
|
250,833 |
|
46.4% |
|
|
37,214 |
|
14.8% |
|
Parts, services and other revenue was $652.8 million for the year ended December 31, 2017, an increase of $112.8 million, or 20.9%, as compared to $540.0 million for the year ended December 31, 2016. The increase was primarily attributable to increases in revenues from Outdoor and Active Sports Retail locations of $64.2 million, and to a lesser extent, increases from increased new vehicle sales, and the greenfield and acquired locations that opened during 2016 and 2017.
Parts, services and other gross profit was $288.0 million for the year ended December 31, 2017, an increase of $37.2 million, or 14.8%, as compared to $250.8 million for the year ended December 31, 2016. The increase was primarily attributable to increased gross profit from the Outdoor and Active Sports Retail locations of $20.7 million, and to a lesser extent, greenfield and acquired locations opened during 2016 and 2017. Gross margin decreased 233 basis points to 44.1%, primarily due to merchandise markdowns in the e-commerce business, and increased distribution and supply costs.
Finance and Insurance, net
|
|
|
Fiscal year ended |
|
|
|
|||||||||||
|
|
|
December 31, 2017 |
|
December 31, 2016 |
|
Favorable/ |
|
|||||||||
|
|
|
|
|
Percent of |
|
|
|
Percent of |
|
(Unfavorable) |
|
|||||
|
($ in thousands) |
|
Amount |
|
Revenue |
|
Amount |
|
Revenue |
|
$ |
|
% |
|
|||
|
|
|
|
|
|
|
|
|
|
|
|
|
|
|
|
|
|
|
Revenue |
|
$ |
332,034 |
|
100.0% |
|
$ |
228,684 |
|
100.0% |
|
$ |
103,350 |
|
45.2% |
|
|
|
|
|
|
|
|
|
|
|
|
|
|
|
|
|
|
|
|
Gross profit |
|
|
332,034 |
|
100.0% |
|
|
228,684 |
|
100.0% |
|
|
103,350 |
|
45.2% |
|
Finance and insurance, net revenue and gross profit were each $332.0 million for the year ended December 31, 2017, an increase of $103.4 million, or 45.2%, as compared to $228.7 million for the year
86
ended December 31, 2016. The increase was primarily due to incremental vehicle finance contracts assigned due to higher vehicle unit sales, higher finance and insurance sales penetration rates, a 30.4% increase in same store sales, and the remainder from greenfield and acquired locations. Finance and insurance, net revenue as a percentage of total new and used vehicle revenue increased to 10.7% for 2017 from 8.9% for 2016.
Selling, general and administrative
SG&A expenses were $853.2 million for the year ended December 31, 2017, an increase of $161.3 million, or 23.3%, as compared to $691.9 million for the year ended December 31, 2016. The increase was due to increases of $89.6 million of wage-related expenses, primarily attributable to increased vehicle unit sales and the addition of nineteen greenfield and acquired locations in 2017; $28.8 million of variable selling expenses attributable to commissions and advertising expense; $11.4 million of additional lease expense primarily attributable to the new locations; $8.0 million of additional professional fees; $6.7 million of additional occupancy expenses; $5.6 million of additional real property expense; and $11.2 million of store and corporate overhead expenses, primarily related to the 19 greenfield and acquired locations opened in 2017. Included above are the impacts of the Gander Outdoors acquisition in the form of related SG&A wage-related expenses of $13.6 million, variable selling expenses of $0.7 million, lease expenses of $4.0 million, professional fees of $5.1 million, and other SG&A expenses of $3.4 million. SG&A expenses as a percentage of total gross profit was 68.5% for 2017, compared to 69.4% for 2016, a decrease of 98 basis points.
Debt restructure expense
Debt restructure expense was $0.4 million for the year ended December 31, 2017, a decrease of $0.8 million, or 68.2%, as compared to $1.2 million for the year ended December 31, 2016. This decrease resulted from the $1.2 million debt restructure expense relating to the Existing Senior Secured Credit Facilities entered into in November 2016 versus the $0.4 million debt restructure expense related to the Second Amendment to the Existing Senior Secured Credit Facilities in October 2017.
Depreciation and amortization
Depreciation and amortization was $31.5 million for the year ended December 31, 2017, an increase of $6.9 million, or 27.7%, as compared to $24.7 million for the year ended December 31, 2016. The increase reflects additional depreciation due to capital expenditures for new and existing dealership improvements.
Floor plan interest expense
Floor plan interest expense was $27.7 million for the year ended December 31, 2017, an increase of $8.8 million, or 46.9%, as compared to $18.9 million for the year ended December 31, 2016. The increase was primarily due to increased average outstanding amount payable under our Floor Plan Facility, primarily resulting from an increased inventory level due to new dealership locations, existing locations expecting higher unit sales, and a 48 basis point increase in the average floor plan borrowing rate.
Other interest expense, net
Other interest expense, net was $43.0 million for the year ended December 31, 2017, a decrease of $5.4 million, or 11.1%, as compared to $48.3 million for the year ended December 31, 2016. The decrease was primarily a 100 basis point decrease in the average interest rate.
Tax Receivable Agreement liability adjustment
The Tax Receivable Agreement liability adjustment, in the amount of $99.7 million for the year ended December 31, 2017, represents a gain on remeasurement in relation to the Tax Receivable Agreement primarily due to changes in our income tax rate. The Tax Receivable Agreement liability was created upon the Company’s acquisition of CWGS, LLC interest through exchanges of its Class A shares for CWGS, LLC common units. The 2017 Tax Act, among other things, reduced the federal statutory corporate rate from 35%
87
to 21%. Upon the enactment of the 2017 Tax Act, and to a lesser extent changes in state income tax rates, the Tax Receivable Agreement liability was remeasured and lowered by $99.7 million.
Income tax expense
The increase in the amount of income tax expense to $157.0 million for the year ended December 31, 2017 compared to $5.9 million for the year ended December 31, 2016 was primarily related to $118.4 million in deferred income tax expense recorded as a result of the 2017 Tax Act. The remaining increase in income tax expense is primarily attributable to the increased profitability of the Company, and its increased ownership in CWGS, LLC.
Segment results
The following table sets forth a reconciliation of total segment income to consolidated income from operations before income taxes for the period presented:
|
|
|
Fiscal Year Ended |
|
|
|
|||||||||||
|
|
|
December 31, 2017 |
|
December 31, 2016 |
|
Favorable/ |
|
|||||||||
|
|
|
|
|
Percent of |
|
|
|
Percent of |
|
(Unfavorable) |
|
|||||
|
($ in thousands) |
|
Amount |
|
Revenue |
|
Amount |
|
Revenue |
|
$ |
|
% |
|
|||
|
Revenue: |
|
|
|
|
|
|
|
|
|
|
|
|
|
|
|
|
|
Consumer Services and Plans |
|
$ |
195,614 |
|
4.6% |
|
$ |
184,773 |
|
5.3% |
|
$ |
10,841 |
|
5.9% |
|
|
Retail |
|
|
4,089,641 |
|
95.4% |
|
|
3,334,224 |
|
94.7% |
|
|
755,417 |
|
22.7% |
|
|
Total consolidated revenue |
|
|
4,285,255 |
|
100.0% |
|
|
3,518,997 |
|
100.0% |
|
|
766,258 |
|
21.8% |
|
|
Segment income:(1) |
|
|
|
|
|
|
|
|
|
|
|
|
|
|
|
|
|
Consumer Services and Plans |
|
|
98,371 |
|
2.3% |
|
|
89,046 |
|
2.5% |
|
|
9,325 |
|
10.5% |
|
|
Retail |
|
|
272,624 |
|
6.4% |
|
|
201,585 |
|
5.7% |
|
|
71,039 |
|
35.2% |
|
|
Total segment income |
|
|
370,995 |
|
8.7% |
|
|
290,631 |
|
8.3% |
|
|
80,364 |
|
27.7% |
|
|
Corporate & other |
|
|
(5,373) |
|
-0.1% |
|
|
(4,382) |
|
-0.1% |
|
|
(991) |
|
-22.6% |
|
|
Depreciation and amortization |
|
|
(31,545) |
|
-0.7% |
|
|
(24,695) |
|
-0.7% |
|
|
(6,850) |
|
-27.7% |
|
|
Tax Receivable Agreement liability adjustment |
|
|
99,687 |
|
2.3% |
|
|
— |
|
0.0% |
|
|
99,687 |
|
100.0% |
|
|
Other interest expense, net |
|
|
(42,959) |
|
-1.0% |
|
|
(48,318) |
|
-1.4% |
|
|
5,359 |
|
11.1% |
|
|
Loss and expense on debt restructure |
|
|
(849) |
|
0.0% |
|
|
(6,270) |
|
-0.2% |
|
|
5,421 |
|
86.5% |
|
|
Income from operations before income taxes |
|
$ |
389,956 |
|
9.1% |
|
$ |
206,966 |
|
5.9% |
|
$ |
182,990 |
|
88.4% |
|
|
(1) |
Segment income represents income for each of our reportable segments and is defined as income from operations before depreciation and amortization, plus floor plan interest expense. |
Consumer Services and Plans segment revenue
Consumer Services and Plans revenue was $195.6 million for the year ended December 31, 2017, an increase of $10.8 million, or 5.9%, as compared to $184.8 million for the year ended December 31, 2016. The increased revenue was attributable to a $3.7 million increase from our clubs and roadside assistance programs primarily due to increased file size; a $3.6 million increase from our vehicle insurance and Good Sam TravelAssist programs primarily due to increased policies in force; a $2.1 million increase from the extended vehicle warranty programs primarily due to increased policies in force; and a $1.6 million increase from consumer show exhibit and admissions revenue resulting from the acquisition of five consumer shows in the fourth quarter of 2016 and our new Good Sam RV Super Show introduced in February 2017; partially offset by $0.2 million of other decreases.
Retail segment revenue
Retail segment revenue was $4.1 billion for the year ended December 31, 2017, an increase of $755.4 million, or 22.7%, as compared to $3.3 billion for the year ended December 31, 2016. The increase was primarily due to a 17.2% increase in new vehicle same store sales and the balance primarily from the 26 greenfield and acquired locations opened during 2016 and 2017, as described above.
88
Same store sales
Same store sales were $3.5 billion for the year ended December 31, 2017, an increase of $320.8 million, or 10.2%, as compared to $3.1 billion for the year ended December 31, 2016. The increase was primarily due to increased volume of new towable units sold, and, to a lesser extent, revenue increases in finance and insurance, net, and parts, services and other, partially offset by a decrease in same store sales from used units sold.
Total segment income
Total segment income was $371.0 million for the year ended December 31, 2017, an increase of $80.4 million, or 27.7%, as compared to $290.6 million for the year ended December 31, 2016. The increase was primarily due to the increase in the sale of finance and insurance products and vehicle unit sales, as described below. Total segment income margin increased 40 basis points to 8.7%.
Consumer Services and Plans segment income
Consumer Services and Plans segment income was $98.4 million for the year ended December 31, 2017, an increase of $9.3 million, or 10.5%, as compared to $89.0 million for the year ended December 31, 2016. The increase was primarily attributable to an increase from our vehicle insurance and Good Sam TravelAssist programs of $3.9 million primarily due to increased policies in force; increased roadside assistance contracts in force and reduced claims, together resulting in a gross profit increase of $2.4 million; increased Good Sam Club membership and reduced marketing costs, together resulting in a gross profit increase of $1.6 million; and an increase from the acquisition of five consumer shows and one new show of $0.7 million; and a decrease in SG&A expenses of $1.0 million primarily due to reduced wage-related expenses, partially offset by a $0.3 million decrease from other products. Consumer Services and Plans segment income margin increased 210 basis points to 50.3%, primarily due to a 107 basis point increase in Consumer Services and Plans gross margin, and a $1.0 million reduction in SG&A expenses.
Retail segment income
Retail segment income was $272.6 million for the year ended December 31, 2017, an increase of $71.0 million, or 35.2%, as compared to $201.6 million for the year ended December 31, 2016. The increase was primarily due to increased gross profit of $241.6 million comprised primarily of higher revenue and sales penetration of finance and insurance products of $103.3 million, an increase of $82.0 million primarily from increased new unit volume of 37.2%, a $37.2 million increase from margin from parts, services and other, and a $19.1 million increase from used units relating to a 16.4% increase in gross profit per unit. In addition, SG&A expenses increased $161.4 million primarily relating to increased variable wages relating to increased revenue and store openings; store pre-opening costs of $26.8 million; increased variable selling expense; increased real property expenses relating to the 2017 store openings; floor plan interest expense increase of $8.8 million primarily relating to increased average floor plan balance; and reduced gain on asset sales by $0.5 million. Retail segment income margin increased 62 basis points primarily due to increased sales and penetration of the finance and insurance products, and increased volume of new units sold, partially offset by SG&A expense increases in variable wages, selling and real property expenses related increased revenues and nineteen new locations and pre-opening costs related to the opening of Gander Outdoors locations.
Corporate and other expenses
Corporate and other expenses were $5.4 million for the year ended December 31, 2017, an increase of 22.6%, as compared to $4.4 million for the year ended December 31, 2016. The increase was due to an increase in professional fees.
Tax Receivable Agreement liability adjustment
The Tax Receivable Agreements liability adjustment, in the amount of $99.7 million for the year ended December 31, 2017, represents a gain on remeasurement in relation to the Tax Receivable Agreement primarily due to changes in our income tax rate. The Tax Receivable Agreement liability was created upon the
89
Company’s acquisition of CWGS, LLC interest through exchanges of its Class A shares for CWGS, LLC common units. The 2017 Tax Act, among other things, reduced the federal statutory corporate rate from 35% to 21%. Upon the enactment of the 2017 Tax Act, and to a lesser extent changes in state income tax rates, the Tax Receivable Agreement liability was remeasured and lowered by $99.7 million.
For the Year Ended December 31, 2016 Compared to the Year Ended December 31, 2015
The following table sets forth information comparing the components of net income for the years ended December 31, 2016 and 2015.
|
|
|
Fiscal year ended |
|
|
|
|
|
||||||||
|
|
|
December 31, 2016 |
|
December 31, 2015 |
|
|
|||||||||
|
|
|
|
|
|
Percent of |
|
|
|
|
Percent of |
|
Favorable/ (Unfavorable) |
|||
|
($ in thousands) |
|
Amount |
|
Revenue |
|
Amount |
|
Revenue |
|
$ |
|
% |
|||
|
Revenue: |
|
|
|
|
|
|
|
|
|
|
|
|
|
|
|
|
Consumer Services and Plans |
|
$ |
184,773 |
|
5.3% |
|
$ |
174,600 |
|
5.3% |
|
$ |
10,173 |
|
5.8% |
|
Retail |
|
|
|
|
|
|
|
|
|
|
|
|
|
|
|
|
New vehicles |
|
|
1,862,195 |
|
52.9% |
|
|
1,603,258 |
|
48.9% |
|
|
258,937 |
|
16.2% |
|
Used vehicles |
|
|
703,326 |
|
20.0% |
|
|
803,879 |
|
24.5% |
|
|
(100,553) |
|
-12.5% |
|
Parts, services and other |
|
|
540,019 |
|
15.3% |
|
|
507,810 |
|
15.5% |
|
|
32,209 |
|
6.3% |
|
Finance and insurance, net |
|
|
228,684 |
|
6.5% |
|
|
189,270 |
|
5.8% |
|
|
39,414 |
|
20.8% |
|
Subtotal |
|
|
3,334,224 |
|
94.7% |
|
|
3,104,217 |
|
94.7% |
|
|
230,007 |
|
7.4% |
|
|
|
|
|
|
|
|
|
|
|
|
|
|
|
|
|
|
Total revenue |
|
|
3,518,997 |
|
100.0% |
|
|
3,278,817 |
|
100.0% |
|
|
240,180 |
|
7.3% |
|
|
|
|
|
|
|
|
|
|
|
|
|
|
|
|
|
|
Gross profit (exclusive of depreciation and amortization shown separately below): |
|
|
|
|
|
|
|
|
|
|
|
|
|
|
|
|
Consumer Services and Plans |
|
|
105,501 |
|
3.0% |
|
|
92,851 |
|
2.8% |
|
|
12,650 |
|
13.6% |
|
Retail |
|
|
|
|
|
|
|
|
|
|
|
|
|
|
|
|
New vehicles |
|
|
265,332 |
|
7.5% |
|
|
228,095 |
|
7.0% |
|
|
37,237 |
|
16.3% |
|
Used vehicles |
|
|
146,073 |
|
4.2% |
|
|
155,990 |
|
4.8% |
|
|
(9,917) |
|
-6.4% |
|
Parts, services and other |
|
|
250,833 |
|
7.1% |
|
|
232,821 |
|
7.1% |
|
|
18,012 |
|
7.7% |
|
Finance and insurance, net |
|
|
228,684 |
|
6.5% |
|
|
189,270 |
|
5.8% |
|
|
39,414 |
|
20.8% |
|
Subtotal |
|
|
890,922 |
|
25.3% |
|
|
806,176 |
|
24.6% |
|
|
84,746 |
|
10.5% |
|
|
|
|
|
|
|
|
|
|
|
|
|
|
|
|
|
|
Total gross profit |
|
|
996,423 |
|
28.3% |
|
|
899,027 |
|
27.4% |
|
|
97,396 |
|
10.8% |
|
|
|
|
|
|
|
|
|
|
|
|
|
|
|
|
|
|
Operating expenses: |
|
|
|
|
|
|
|
|
|
|
|
|
|
|
|
|
Selling, general and administrative expenses |
|
|
691,884 |
|
19.7% |
|
|
634,890 |
|
19.4% |
|
|
(56,994) |
|
-9.0% |
|
Debt restructure expense |
|
|
1,218 |
|
0.0% |
|
|
- |
|
0.0% |
|
|
(1,218) |
|
-100.0% |
|
Depreciation and amortization |
|
|
24,695 |
|
0.7% |
|
|
24,101 |
|
0.7% |
|
|
(594) |
|
-2.5% |
|
(Gain) loss on asset sales |
|
|
(564) |
|
0.0% |
|
|
(237) |
|
0.0% |
|
|
327 |
|
138.0% |
|
Income from operations |
|
|
279,190 |
|
7.9% |
|
|
240,273 |
|
7.3% |
|
|
38,917 |
|
16.2% |
|
|
|
|
|
|
|
|
|
|
|
|
|
|
|
|
|
|
Other income (expense): |
|
|
|
|
|
|
|
|
|
|
|
|
|
|
|
|
Floor plan interest expense |
|
|
(18,854) |
|
-0.5% |
|
|
(11,248) |
|
-0.3% |
|
|
(7,606) |
|
-67.6% |
|
Other interest expense, net |
|
|
(48,318) |
|
-1.4% |
|
|
(53,377) |
|
-1.6% |
|
|
5,059 |
|
9.5% |
|
Loss on debt restructure |
|
|
(5,052) |
|
-0.1% |
|
|
- |
|
0.0% |
|
|
(5,052) |
|
-100.0% |
|
Other income (expense), net |
|
|
- |
|
0.0% |
|
|
1 |
|
0.0% |
|
|
(1) |
|
-100.0% |
|
|
|
|
(72,224) |
|
-2.1% |
|
|
(64,624) |
|
-2.0% |
|
|
(7,600) |
|
-11.8% |
|
Income before income taxes |
|
|
206,966 |
|
5.9% |
|
|
175,649 |
|
5.4% |
|
|
31,317 |
|
17.8% |
|
Income tax expense |
|
|
(5,907) |
|
-0.2% |
|
|
(1,356) |
|
0.0% |
|
|
(4,551) |
|
-335.6% |
|
Net income |
|
|
201,059 |
|
5.7% |
|
|
174,293 |
|
5.3% |
|
|
26,766 |
|
15.4% |
|
Less: net income attributable to non-controlling interests |
|
|
(9,942) |
|
0.0% |
|
|
- |
|
0.0% |
|
|
(9,942) |
|
-100.0% |
|
Net income attributable to Camping World Holdings, Inc. |
|
$ |
191,117 |
|
5.4% |
|
$ |
174,293 |
|
5.3% |
|
$ |
16,824 |
|
9.7% |
Total revenue
Total revenue was $3.5 billion for the year ended December 31, 2016, an increase of $240.2 million, or 7.3%, as compared to $3.3 billion for the year ended December 31, 2015. The increase was primarily driven by the 21.1% increase in new vehicle unit sales in our Retail segment, partially offset by an 11.9% decrease in used vehicle unit sales, primarily due to reduced inventory availability, resulting from fewer trades on new unit sales.
90
Consumer Services and Plans
Consumer Services and Plans revenue was $184.8 million for the year ended December 31, 2016, an increase of $10.2 million, or 5.8%, as compared to $174.6 million for the year ended December 31, 2015. The increased revenue was attributable to increased contracts in force in the roadside assistance, Good Sam TravelAssist, and extended vehicle warranty programs resulting in an increase of $5.0 million; increased marketing fee revenue from our vehicle insurance and credit card programs of $3.5 million; increased average file size for the Good Sam Club and Coast to Coast Club resulting in an increase of $2.2 million; increased revenue from our annual campground directory of $0.4 million; and increases from other ancillary products of $0.8 million, partially offset by a $1.7 million reduction in member event revenue due to an RV rally event that occurred in 2015, but did not recur in 2016.
Consumer Services and Plans gross profit was $105.5 million for the year ended December 31, 2016, an increase of $12.7 million, or 13.6%, as compared to $92.9 million for the year ended December 31, 2015. This increase was primarily due to increased roadside assistance contracts in force and reduced claims, together resulting in a gross profit increase of $5.8 million; increased customer participation in our vehicle insurance and credit card programs resulting in an increase of $3.3 million; increased Good Sam Club and Coast to Coast Club average membership resulting in an increase of $2.1 million; increased annual campground directory gross profit of $0.5 million; and a $1.0 million increase from other ancillary products. Gross margin increased 392 basis points to 57.1% primarily due to increased file size and reduced program costs for roadside assistance and increases within the vehicle insurance programs.
Retail:
New Vehicles
|
|
|
Fiscal year ended |
|
|
|||||||||||
|
|
|
December 31, 2016 |
|
December 31, 2015 |
|
Favorable/ |
|||||||||
|
|
|
|
|
Percent of |
|
|
|
Percent of |
|
(Unfavorable) |
|||||
|
($ in thousands, except per vehicle data) |
|
Amount |
|
Revenue |
|
Amount |
|
Revenue |
|
$ |
|
% |
|||
|
|
|
|
|
|
|
|
|
|
|
|
|
|
|
|
|
|
Revenue |
|
$ |
1,862,195 |
|
100.0% |
|
$ |
1,603,258 |
|
100.0% |
|
$ |
258,937 |
|
16.2% |
|
|
|
|
|
|
|
|
|
|
|
|
|
|
|
|
|
|
Gross profit |
|
|
265,332 |
|
14.2% |
|
|
228,095 |
|
14.2% |
|
|
37,237 |
|
16.3% |
|
|
|
|
|
|
|
|
|
|
|
|
|
|
|
|
|
|
New vehicle unit sales |
|
|
48,704 |
|
|
|
|
40,229 |
|
|
|
|
8,475 |
|
21.1% |
New vehicle revenue was $1.9 billion for the year ended December 31, 2016, an increase of $258.9 million, or 16.2%, as compared to $1.6 billion for 2015. The increase was primarily due to a 21.1% increase in vehicle unit sales primarily attributable to a same store sales increase of 12.1% driven by increased consumer confidence and improved credit availability. The balance of the increase was from seven greenfield and acquired locations opened in 2016.
New vehicle gross profit was $265.3 million for the year ended December 31, 2016, an increase of $37.2 million, or 16.3%, as compared to $228.1 million for the year ended December 31, 2015. The increase was primarily due to the 21.1% increase in new vehicle unit sales partially offset by a decrease in average gross profit per unit of 3.9%. Gross margin decreased of 2 basis points to 14.2%.
91
Used Vehicles
|
|
|
Fiscal year ended |
|
|
|||||||||||
|
|
|
December 31, 2016 |
|
December 31, 2015 |
|
Favorable/ |
|||||||||
|
|
|
|
|
Percent of |
|
|
|
Percent of |
|
(Unfavorable) |
|||||
|
($ in thousands, except per vehicle data) |
|
Amount |
|
Revenue |
|
Amount |
|
Revenue |
|
$ |
|
% |
|||
|
|
|
|
|
|
|
|
|
|
|
|
|
|
|
|
|
|
Revenue |
|
$ |
703,326 |
|
100.0% |
|
$ |
803,879 |
|
100.0% |
|
$ |
(100,553) |
|
-12.5% |
|
|
|
|
|
|
|
|
|
|
|
|
|
|
|
|
|
|
Gross profit |
|
|
146,073 |
|
20.8% |
|
|
155,990 |
|
19.4% |
|
|
(9,917) |
|
-6.4% |
|
|
|
|
|
|
|
|
|
|
|
|
|
|
|
|
|
|
Used vehicle unit sales |
|
|
31,248 |
|
|
|
|
35,485 |
|
|
|
|
(4,237) |
|
-11.9% |
Used vehicle revenue was $703.3 million for the year ended December 31, 2016, a decrease of $100.6 million, or 12.5%, as compared to $803.9 million for the year ended December 31, 2015. The decrease was primarily due to reduced levels of inventory, resulting from fewer trades on new unit sales, driving an 11.9% decrease in used vehicle unit sales, with a 6.3% decrease in same store sales.
Used vehicle gross profit was $146.1 million for the year ended December 31, 2016, a decrease of $9.9 million, or 6.4%, as compared to $156.0 million for the year ended December 31, 2015. The decrease was primarily due to an 11.9% decrease in vehicle unit sales partially offset by a 6.3% increase in average gross profit per unit. Gross margin increased 136 basis points to 20.8%.
Parts, Services and Other
|
|
|
Fiscal year Ended |
|
|
|||||||||||
|
|
|
December 31, 2016 |
|
December 31, 2015 |
|
Favorable/ |
|||||||||
|
|
|
|
|
Percent of |
|
|
|
Percent of |
|
(Unfavorable) |
|||||
|
($ in thousands, except per vehicle data) |
|
Amount |
|
Revenue |
|
Amount |
|
Revenue |
|
$ |
|
% |
|||
|
|
|
|
|
|
|
|
|
|
|
|
|
|
|
|
|
|
Revenue |
|
$ |
540,019 |
|
100.0% |
|
$ |
507,810 |
|
100.0% |
|
$ |
32,209 |
|
6.3% |
|
|
|
|
|
|
|
|
|
|
|
|
|
|
|
|
|
|
Gross profit |
|
|
250,833 |
|
46.4% |
|
|
232,821 |
|
45.8% |
|
|
18,012 |
|
7.7% |
Parts, services and other revenue was $540.0 million for the year ended December 31, 2016, an increase of $32.2 million, or 6.3%, as compared to $507.8 million for the year ended December 31, 2015. The increase was primarily attributable to a same store sales increase of 4.2% resulting from increases in revenues across all parts, services, and other product categories as a result of increases in new vehicle sales. The balance of the increase was attributable to seven greenfield and acquired locations that opened in 2016.
Parts, services and other gross profit was $250.8 million for the year ended December 31, 2016, an increase of $18.0 million, or 7.7%, as compared to $232.8 million for the year ended December 31, 2015. The increase was primarily attributable to increases from warranty and customer pay service; a same store sales increase of 4.2%, primarily resulting from an increase in new vehicle sales; and the addition of seven greenfield and acquired locations opened in 2016. Gross margin increased 60 basis points to 46.4%, primarily due to a reduction in promotional discounts.
Finance and Insurance, net
|
|
|
Fiscal year ended |
|
|
|||||||||||
|
|
|
December 31, 2016 |
|
December 31, 2015 |
|
Favorable/ |
|||||||||
|
|
|
|
|
Percent of |
|
|
|
Percent of |
|
(Unfavorable) |
|||||
|
($ in thousands, except per vehicle data) |
|
Amount |
|
Revenue |
|
Amount |
|
Revenue |
|
$ |
|
% |
|||
|
|
|
|
|
|
|
|
|
|
|
|
|
|
|
|
|
|
Revenue |
|
$ |
228,684 |
|
100.0% |
|
$ |
189,270 |
|
100.0% |
|
$ |
39,414 |
|
20.8% |
|
|
|
|
|
|
|
|
|
|
|
|
|
|
|
|
|
|
Gross profit |
|
|
228,684 |
|
100.0% |
|
|
189,270 |
|
100.0% |
|
|
39,414 |
|
20.8% |
92
Finance and insurance, net revenue and gross profit were each $228.7 million for the year ended December 31, 2016, an increase of $39.4 million, or 20.8%, as compared to $189.3 million for the year ended December 31, 2015. The increase was primarily due to incremental vehicle finance contracts assigned due to higher vehicle unit sales and higher finance and insurance sales penetration rates of travel trailer buyers, resulting from a 17.8% increase in same store sales, and the remainder from seven greenfield and acquired locations. Finance and insurance, net revenue as a percentage of total new and used vehicle revenue increased to 8.9% for 2016 from 7.8% for 2015.
Selling, general and administrative
SG&A expenses were $691.9 million for the year ended December 31, 2016, an increase of $57.0 million, or 9.0%, as compared to $634.9 million for the year ended December 31, 2015. The increase was due to increases of $36.5 million of wage-related expenses, primarily attributable to increased vehicle unit sales and the addition of seven greenfield and acquired locations in 2016; $11.9 million of additional lease expense primarily attributable to the derecognition of certain right to use leases in the fourth quarter of 2015; $5.3 million of variable selling expenses attributable to commissions and selling expense; and $3.3 million of store and corporate overhead expenses, primarily related to the seven greenfield and acquired locations opened in 2016. SG&A expenses as a percentage of total gross profit was 69.4% for 2016, compared to 70.4% for 2015, a decrease of 104 basis points.
Debt restructure expense
Debt restructure expense was $1.2 million for the year ended December 31, 2016, primarily relating to the Existing Senior Secured Credit Facilities entered into in November 2016. There was no corresponding debt restructure expense for the year ended December 31, 2015.
Depreciation and amortization
Depreciation and amortization was $24.7 million for the year ended December 31, 2016, an increase of $0.6 million, or 2.5%, as compared to $24.1 million for the year ended December 31, 2015. The increase reflects additional depreciation due to capital expenditures for new and existing dealership improvements.
Floor plan interest expense
Floor plan interest expense was $18.9 million for the year ended December 31, 2016, an increase of $7.6 million, or 67.6%, as compared to $11.2 million for the year ended December 31, 2015. The increase was primarily due to increased average outstanding amount payable under our Floor Plan Facility, primarily resulting from an increased inventory level due to new dealership locations, existing locations expecting higher unit sales, and a 45 basis point increase in the average floor plan borrowing rate.
Other interest expense, net
Other interest expense, net was $48.3 million for the year ended December 31, 2016, a decrease of $5.1 million, or 9.5%, as compared to $53.4 million for the year ended December 31, 2015. The decrease was primarily due to a $7.0 million decrease in interest expense resulting from a decrease in right to use liabilities, and a $1.5 million decrease from other interest, partially offset by a $3.4 million increase in interest expense due to incremental borrowings under the Previous Term Loan Facility of $135.0 million in September, 2016 to pay distributions to the members of CWGS, LLC, a direct subsidiary of the Company, $55.0 million in December 2015 to acquire retail locations, and $95.0 million in June 2015 to pay distributions to the members of CWGS, LLC, and a 50 basis point increase in the borrowing margin under the aggregate Previous Term Loan Facility upon the December 17, 2015 incremental borrowing.
93
Segment results
The following table sets forth a reconciliation of total segment income to consolidated income from operations before income taxes for the period presented:
|
|
|
Fiscal Year Ended |
|
|
|||||||||||
|
|
|
December 31, 2016 |
|
December 31, 2015 |
|
Favorable/ |
|||||||||
|
|
|
|
|
Percent of |
|
|
|
Percent of |
|
(Unfavorable) |
|||||
|
($ in thousands) |
|
Amount |
|
Revenue |
|
Amount |
|
Revenue |
|
$ |
|
% |
|||
|
Revenue: |
|
|
|
|
|
|
|
|
|
|
|
|
|
|
|
|
Consumer Services and Plans |
|
$ |
184,773 |
|
5.3% |
|
$ |
174,600 |
|
5.3% |
|
$ |
10,173 |
|
5.8% |
|
Retail |
|
|
3,334,224 |
|
94.7% |
|
|
3,104,217 |
|
94.7% |
|
|
230,007 |
|
7.4% |
|
Total consolidated revenue |
|
|
3,518,997 |
|
100.0% |
|
|
3,278,817 |
|
100.0% |
|
|
240,180 |
|
7.3% |
|
Segment income:(1) |
|
|
|
|
|
|
|
|
|
|
|
|
|
|
|
|
Consumer Services and Plans |
|
|
89,046 |
|
2.5% |
|
|
80,522 |
|
2.5% |
|
|
8,524 |
|
10.6% |
|
Retail |
|
|
201,585 |
|
5.7% |
|
|
175,293 |
|
5.3% |
|
|
26,292 |
|
15.0% |
|
Total segment income |
|
|
290,631 |
|
8.3% |
|
|
255,815 |
|
7.8% |
|
|
34,816 |
|
13.6% |
|
Corporate & other |
|
|
(4,382) |
|
-0.1% |
|
|
(2,689) |
|
-0.1% |
|
|
(1,693) |
|
-63.0% |
|
Depreciation and amortization |
|
|
(24,695) |
|
-0.7% |
|
|
(24,101) |
|
-0.7% |
|
|
(594) |
|
-2.5% |
|
Other interest expense, net |
|
|
(48,318) |
|
-1.4% |
|
|
(53,377) |
|
-1.6% |
|
|
5,059 |
|
9.5% |
|
Loss on debt restructure |
|
|
(6,270) |
|
-0.2% |
|
|
— |
|
0.0% |
|
|
(6,270) |
|
-100.0% |
|
Other non-operating expense, net |
|
|
— |
|
0.0% |
|
|
1 |
|
0.0% |
|
|
(1) |
|
-100.0% |
|
Income from operations before income taxes |
|
$ |
206,966 |
|
5.9% |
|
$ |
175,649 |
|
5.4% |
|
$ |
31,317 |
|
17.8% |
|
(1) |
Segment income represents income for each of our reportable segments and is defined as income from operations before depreciation and amortization, plus floor plan interest expense. |
Consumer Services and Plans segment revenue
Consumer Services and Plans revenue was $184.8 million for the year ended December 31, 2016, an increase of $10.2 million, or 5.8%, as compared to $174.6 million for the year ended December 31, 2015. The increased revenue was attributable to increased contracts in force under our roadside assistance program, Good Sam TravelAssist, and extended vehicle warranty programs resulting in an increase of $5.0 million; increased marketing fee revenue from our vehicle insurance and credit card programs of $3.5 million; increased average file size for the Good Sam Club and Coast to Coast Club resulting in an increase of $2.2 million; increased revenue from our annual campground directory of $0.4 million; and increases from other ancillary products of $0.8 million, partially offset by a $1.7 million reduction in member event revenue due to an RV rally event that occurred in 2015, but did not recur in 2016.
Retail segment revenue
Retail segment revenue was $3.3 billion for the year ended December 31, 2016, an increase of $230.0 million, or 7.4%, as compared to $3.1 billion for the year ended December 31, 2015. The increase was primarily due to a 6.9% increase in same store sales and the balance primarily from seven greenfield and acquired locations opened in 2016, as described above.
Same store sales
Same store sales were $2.9 billion for the year ended December 31, 2016, an increase of $183.7 million, or 6.9%, as compared to $2.7 billion for the year ended December 31, 2015. The increase was primarily due to increased volume of new towable units sold, and, to a lesser extent, revenue increases in finance and insurance, net, and parts, services and other, partially offset by a decrease in same store sales from used units sold.
Total segment income
Total segment income was $290.6 million for the year ended December 31, 2016, an increase of $34.8 million, or 13.6%, as compared to $255.8 million for the year ended December 31, 2015. The increase
94
was primarily due to the increase in vehicle unit sales volume, as described below. Total segment income margin increased 46 basis points to 8.3%.
Consumer Services and Plans segment income
Consumer Services and Plans segment income was $89.0 million for the year ended December 31, 2016, an increase of $8.5 million, or 10.6%, as compared to $80.5 million for the year ended December 31, 2015. The increase was primarily attributable to $5.8 million from the roadside assistance programs resulting from increased average contracts in force and reduced claims costs, $3.3 million from our vehicle insurance and co-branded credit card programs, $2.1 million from increased average file size for the Good Sam Club and Coast to Coast Club, $0.5 million from increased annual campground directory gross profit, and $0.9 million from various other products, partially offset by increases in SG&A expenses of $4.1 million primarily due to increased wages and professional fees. Consumer Services and Plans segment income margin increased 207 basis points to 48.2%, primarily due to a 392 basis point increase in Consumer Services and Plans gross margin, partially offset by a $4.1 million increase in SG&A expenses.
Retail segment income
Retail segment income was $201.6 million for the year ended December 31, 2016, an increase of $26.3 million, or 15.0%, as compared to $175.3 million for the year ended December 31, 2015. The increase was primarily due to increased gross profit of $84.7 million comprised primarily of higher revenue and higher sales penetration of finance and insurance products of $39.4 million, an increase of $37.2 million primarily from increased new unit volume of 21.1%, and $18.0 million from increased margin from parts, services and other, partially offset by a $9.9 million gross profit reduction from used units relating to the reduced volume sold. In addition, SG&A expenses increased $51.2 million primarily relating to increased variable wages relating to increased revenue, and increased rent relating to the seven greenfield and acquired locations opened in 2016 and prior year capitalization of leases, floor plan interest increased expense of $7.6 million primarily relating to increased average floor plan balance, and an increase in gain on asset sales of $0.3 million. Retail segment income margin increased 34 basis points primarily due to increased sales and penetration of the finance and insurance products, and increased volume of new units sold, partially offset by SG&A expense increases in variable wages related to increased revenues, and rent expense, related to new locations.
Corporate and other expenses
Corporate and other expenses were $4.4 million for the year ended December 31, 2016, an increase of 63.0%, as compared to $2.7 million for the year ended December 31, 2015. The increase was due to an increase in professional fees.
Non-GAAP Financial Measures
To supplement our consolidated financial statements, which are prepared and presented in accordance with accounting principles generally accepted in the U.S. (“GAAP”), we use the following non-GAAP financial measures: EBITDA, Adjusted EBITDA, Adjusted Pro Forma Net Income, and Adjusted Pro Forma Earnings Per Fully Exchanged and Diluted Share (collectively the "Non-GAAP Financial Measures"). We believe that these Non-GAAP Financial Measures, when used in conjunction with GAAP financial measures, provide useful information about operating results, enhance the overall understanding of past financial performance and future prospects, and allow for greater transparency with respect to the key metrics we use in our financial and operational decision making. These non-GAAP measures are also frequently used by analysts, investors and other interested parties to evaluate companies in the Company’s industry. The presentation of this financial information is not intended to be considered in isolation or as a substitute for, or superior to, the financial information prepared and presented in accordance with GAAP, and they should not be construed as an inference that the Company’s future results will be unaffected by any items adjusted for in these non-GAAP measures. In evaluating these non-GAAP measures, you should be aware that in the future the Company may incur expenses that are the same as or similar to some of those adjusted in this
95
presentation. The Non-GAAP Financial Measures that we use are not necessarily comparable to similarly titled measures used by other companies due to different methods of calculation.
EBITDA, Adjusted EBITDA, and Adjusted EBITDA Margin
We define “EBITDA” as net income before other interest expense (excluding floor plan interest expense), provision for income taxes and depreciation and amortization. We define “Adjusted EBITDA” as EBITDA further adjusted for the impact of certain non‑cash and other items that we do not consider in our evaluation of ongoing operating performance. We define “Adjusted EBITDA Margin” as Adjusted EBITDA as a percentage of total revenue. These items include, among other things, loss and expense on debt restructure, loss (gain) on sale of assets and disposition of stores, monitoring fees, equity-based compensation, Tax Receivable Agreement liability adjustment, an adjustment to rent on right to use assets, acquisitions – transaction expense, acquisitions - pre-opening costs, and other unusual or one‑time items. We caution investors that amounts presented in accordance with our definitions of EBITDA, Adjusted EBITDA, and Adjusted EBITDA Margin may not be comparable to similar measures disclosed by our competitors, because not all companies and analysts calculate EBITDA, Adjusted EBITDA, and Adjusted EBITDA Margin in the same manner. We present EBITDA, Adjusted EBITDA, and Adjusted EBITDA Margin because we consider them to be important supplemental measures of our performance and believe they are frequently used by securities analysts, investors and other interested parties in the evaluation of companies in our industry. Management believes that investors’ understanding of our performance is enhanced by including these non‑GAAP Financial Measures as a reasonable basis for comparing our ongoing results of operations.
The following table reconciles EBITDA, Adjusted EBITDA, and Adjusted EBITDA Margin to the most directly comparable GAAP financial performance measures, which are net income, net income, and net income margin, respectively:
|
|
|
Fiscal Year Ended |
|
|||||||||||||
|
|
|
December 31, |
|
December 31, |
|
December 31, |
|
December 31, |
|
December 31, |
|
|||||
|
($ in thousands) |
|
2017 |
|
2016 |
|
2015 |
|
2014 |
|
2013 |
|
|||||
|
EBITDA: |
|
|
|
|
|
|
|
|
|
|
|
|
|
|
|
|
|
Net income |
|
$ |
232,974 |
|
$ |
201,059 |
|
$ |
174,293 |
|
$ |
121,473 |
|
$ |
16,918 |
|
|
Other interest expense, net |
|
|
42,959 |
|
|
48,318 |
|
|
53,377 |
|
|
46,769 |
|
|
74,728 |
|
|
Depreciation and amortization |
|
|
31,545 |
|
|
24,695 |
|
|
24,101 |
|
|
24,601 |
|
|
21,183 |
|
|
Income tax expense |
|
|
156,982 |
|
|
5,907 |
|
|
1,356 |
|
|
2,140 |
|
|
1,988 |
|
|
Subtotal EBITDA |
|
|
464,460 |
|
|
279,979 |
|
|
253,127 |
|
|
194,983 |
|
|
114,817 |
|
|
Loss and expense on debt restructure (a) |
|
|
849 |
|
|
6,270 |
|
|
— |
|
|
1,831 |
|
|
49,450 |
|
|
Loss (gain) on sale of assets and disposition of stores (b) |
|
|
(133) |
|
|
(564) |
|
|
1,452 |
|
|
2,689 |
|
|
2,147 |
|
|
Monitoring fee (c) |
|
|
— |
|
|
1,875 |
|
|
2,500 |
|
|
2,500 |
|
|
2,500 |
|
|
Equity-based compensation (d) |
|
|
5,109 |
|
|
1,597 |
|
|
— |
|
|
— |
|
|
— |
|
|
Tax Receivable Agreement liability adjustment (e) |
|
|
(99,687) |
|
|
— |
|
|
— |
|
|
— |
|
|
— |
|
|
Adjustment to normalize rent on right to use assets (f) |
|
|
— |
|
|
— |
|
|
(7,598) |
|
|
(7,131) |
|
|
(4,332) |
|
|
Acquisitions - transaction expense (g) |
|
|
2,662 |
|
|
— |
|
|
— |
|
|
— |
|
|
— |
|
|
Acquisitions - pre-opening costs (h) |
|
|
26,352 |
|
|
— |
|
|
— |
|
|
— |
|
|
— |
|
|
Adjusted EBITDA |
|
$ |
399,612 |
|
$ |
289,157 |
|
$ |
249,481 |
|
$ |
194,872 |
|
$ |
164,582 |
|
|
|
|
|
|
|
|
|
|
|
|
|
|
|
|
|
|
|
|
|
|
Fiscal Year Ended |
|
|||||||||||||
|
|
|
December 31, |
|
December 31, |
|
December 31, |
|
December 31, |
|
December 31, |
|
|||||
|
(as percentage of total revenue) |
|
2017 |
|
2016 |
|
2015 |
|
2014 |
|
2013 |
|
|||||
|
EBITDA margin: |
|
|
|
|
|
|
|
|
|
|
|
|
|
|
|
|
|
Net income margin |
|
|
5.4% |
|
|
5.7% |
|
|
5.3% |
|
|
4.6% |
|
|
0.7% |
|
|
Other interest expense, net |
|
|
1.0% |
|
|
1.4% |
|
|
1.6% |
|
|
1.8% |
|
|
3.2% |
|
|
Depreciation and amortization |
|
|
0.7% |
|
|
0.7% |
|
|
0.7% |
|
|
0.9% |
|
|
0.9% |
|
|
Income tax expense |
|
|
3.7% |
|
|
0.2% |
|
|
0.0% |
|
|
0.1% |
|
|
0.1% |
|
|
Subtotal EBITDA margin |
|
|
10.8% |
|
|
8.0% |
|
|
7.7% |
|
|
7.4% |
|
|
5.0% |
|
|
Loss and expense on debt restructure (a) |
|
|
0.0% |
|
|
0.2% |
|
|
— |
|
|
0.1% |
|
|
2.1% |
|
|
Loss (gain) on sale of assets and disposition of stores (b) |
|
|
(0.0%) |
|
|
(0.0%) |
|
|
0.0% |
|
|
0.1% |
|
|
0.1% |
|
|
Monitoring fee (c) |
|
|
— |
|
|
0.1% |
|
|
0.1% |
|
|
0.1% |
|
|
0.1% |
|
|
Equity-based compensation (d) |
|
|
0.1% |
|
|
0.0% |
|
|
— |
|
|
— |
|
|
— |
|
96
|
|
|
Fiscal Year Ended |
|
|||||||||||||
|
|
|
December 31, |
|
December 31, |
|
December 31, |
|
December 31, |
|
December 31, |
|
|||||
|
(as percentage of total revenue) |
|
2017 |
|
2016 |
|
2015 |
|
2014 |
|
2013 |
|
|||||
|
Tax Receivable Agreement liability adjustment (e) |
|
|
(2.3%) |
|
|
— |
|
|
— |
|
|
— |
|
|
— |
|
|
Adjustment to normalize rent on right to use assets (f) |
|
|
— |
|
|
— |
|
|
(0.2%) |
|
|
(0.3%) |
|
|
(0.2%) |
|
|
Acquisitions - transaction expense (g) |
|
|
0.1% |
|
|
— |
|
|
— |
|
|
— |
|
|
— |
|
|
Acquisitions - pre-opening costs (h) |
|
|
0.6% |
|
|
— |
|
|
— |
|
|
— |
|
|
— |
|
|
Adjusted EBITDA margin |
|
|
9.3% |
|
|
8.2% |
|
|
7.6% |
|
|
7.4% |
|
|
7.1% |
|
|
|
|
|
|
|
|
|
|
|
|
|
|
|
|
|
|
|
|
(a) |
Represents the loss and expense incurred on debt restructure and financing expense incurred from the First and Second Amendment to the Existing Senior Credit Facilities in 2017, the write-off of a portion of the original issue discount, capitalized finance costs from the Previous Term Loan Facilities, rating agency fees and legal expenses related to the Previous Term Loan Facilities in 2016, and the repayment of the 12.00% Series A Notes due 2018 in 2014 and the 11.50% Senior Secured Notes due 2016 in 2013. |
|
(b) |
Represents an adjustment to eliminate (i) the gains and losses on sales of various assets, including (a) a $1.8 million gain on the asset sale of seven outdoor power sports magazine titles, two power sports shows and two conferences in March 2013 and (b) the sale of the former FreedomRoads, LLC corporate office building at a loss of $3.5 million in November 2013; (ii) aggregate non‑recurring losses from two non‑performing locations that were sold in 2015; and (iii) a loss equal to the present value of the remaining net obligation under the non‑cancellable operating leases in locations with no operating business, which represented $0.8 million, $1.3 million and $0.3 million for the years ended December 31, 2015, 2014 and 2013, respectively. |
|
(c) |
Represents monitoring fees paid pursuant to a monitoring agreement to Crestview and Stephen Adams. The monitoring agreement was terminated on October 6, 2016 in connection with our IPO. |
|
(d) |
Represents non-cash equity-based compensation expense related to employees and directors of the Company. |
|
(e) |
Represents an adjustment to eliminate the gains on remeasurement of the Tax Receivable Agreement primarily due to changes in our effective income tax rate. |
|
(f) |
Represents an adjustment to rent expense for the periods presented for certain right to use assets that were derecognized in the fourth quarter of 2015 due to lease modifications that resulted in the leases meeting the requirements to be reported as operating leases. The adjustments represent additional rent expense that would have been incurred for the periods presented had the leases previously been classified as operating leases. See Note 9 — Right to Use Liability to our audited consolidated financial statements in Part II, Item 8 of this Form 10-K for additional information. |
|
(g) |
Represents transaction expenses, primarily legal costs, associated with acquisitions into new or complimentary markets, including the Gander Mountain acquisition. This amount excludes transaction expenses related to the acquisition of RV dealerships, consumer shows, Active Sports, Inc., and W82. |
|
(h) |
Represents pre-opening store costs, including payroll costs, associated with the Gander Mountain acquisition. |
Adjusted Pro Forma Net Income and Adjusted Pro Forma Earnings Per Fully Exchanged and Diluted Share
We define “Adjusted Pro Forma Net Income” as net income attributable to Camping World Holdings, Inc. adjusted for the reallocation of income attributable to non-controlling interests from the assumed exchange of all outstanding common units in CWGS, LLC (or the common unit equivalent of membership interests in CWGS, LLC for periods prior to the IPO) for shares of Class A common stock of Camping World Holdings, Inc. and further adjusted for the impact of certain non‑cash and other items that we do not consider in our evaluation of ongoing operating performance. These items include, among other things, loss and expense on debt restructure, loss (gain) on sale of assets and disposition of stores, monitoring fees, equity-based compensation, Tax Receivable Agreement liability adjustment, an adjustment to rent on right to use assets, interest expense on our Series B notes, acquisitions – transaction expense, acquisitions – pre-opening costs, revaluation of deferred tax assets from tax reform, and other unusual or one‑time items, and the income tax expense effect of (i) these adjustments and (ii) the pass-through entity taxable income as if the parent company was a subchapter C corporation in periods prior to the IPO. We define “Adjusted Pro Forma Earnings Per Fully Exchanged and Diluted Share” as Adjusted Pro Forma Net Income divided by the weighted-average shares of Class A common stock outstanding, assuming (i) the full exchange of all outstanding common units in CWGS, LLC (or the common unit equivalent of membership interests in CWGS, LLC for periods prior to the IPO) for shares of Class A common stock of Camping World Holdings, Inc., (ii) the Class A common stock issued in connection with the IPO was outstanding as of January 1 of each year presented, and (iii) the dilutive effect of stock options and restricted stock units, if any. We present Adjusted Pro Forma Net Income and Adjusted Pro Forma Earnings Per Fully Exchanged and Diluted Share because
97
we consider them to be important supplemental measures of our performance and we believe that investors’ understanding of our performance is enhanced by including these non‑GAAP financial measures as a reasonable basis for comparing our ongoing results of operations.
The following table reconciles Adjusted Pro Forma Net Income and Adjusted Pro Forma Earnings Per Fully Exchanged and Diluted Share to the most directly comparable GAAP financial performance measure, which is net income attributable to Camping World Holdings, Inc. and weighted-average shares of Class A common stock outstanding — diluted:
|
|
|
Fiscal Year Ended |
|
|||||||||||||
|
|
|
December 31, |
|
December 31, |
|
December 31, |
|
December 31, |
|
December 31, |
|
|||||
|
(In thousands except per share amounts) |
|
2017 |
|
2016 |
|
2015 |
|
2014 |
|
2013 |
|
|||||
|
Numerator: |
|
|
|
|
|
|
|
|
|
|
|
|
|
|
|
|
|
Net income (loss) attributable to Camping World Holdings, Inc. |
|
$ |
28,362 |
|
$ |
191,117 |
|
$ |
174,293 |
|
$ |
121,473 |
|
$ |
16,918 |
|
|
Adjustments: |
|
|
|
|
|
|
|
|
|
|
|
|
|
|
|
|
|
Reallocation of net income attributable to non-controlling interests from the assumed exchange of common units in CWGS, LLC (a) |
|
|
204,612 |
|
|
9,942 |
|
|
— |
|
|
— |
|
|
— |
|
|
Loss and expense on debt restructure (b) |
|
|
849 |
|
|
6,270 |
|
|
— |
|
|
1,831 |
|
|
49,450 |
|
|
Loss (gain) on sale of assets and disposition of stores (c) |
|
|
(133) |
|
|
(564) |
|
|
1,452 |
|
|
2,689 |
|
|
2,147 |
|
|
Monitoring fee (d) |
|
|
— |
|
|
1,875 |
|
|
2,500 |
|
|
2,500 |
|
|
2,500 |
|
|
Equity-based compensation (e) |
|
|
5,109 |
|
|
1,597 |
|
|
— |
|
|
— |
|
|
— |
|
|
Adjustment to rent on right to use assets (f) |
|
|
— |
|
|
— |
|
|
(7,598) |
|
|
(7,131) |
|
|
(4,332) |
|
|
Tax Receivable Agreement liability adjustment (g) |
|
|
(99,687) |
|
|
— |
|
|
— |
|
|
— |
|
|
— |
|
|
Interest expense on Series B notes (h) |
|
|
— |
|
|
— |
|
|
— |
|
|
1,784 |
|
|
2,379 |
|
|
Acquisitions - transaction expense (i) |
|
|
2,662 |
|
|
— |
|
|
— |
|
|
— |
|
|
— |
|
|
Acquisitions - pre-opening costs (j) |
|
|
26,352 |
|
|
— |
|
|
— |
|
|
— |
|
|
— |
|
|
Revaluation of deferred tax assets from tax reform (k) |
|
|
118,386 |
|
|
— |
|
|
— |
|
|
— |
|
|
— |
|
|
Income tax expense (l) |
|
|
(87,855) |
|
|
(78,703) |
|
|
(65,769) |
|
|
(46,292) |
|
|
(28,517) |
|
|
Adjusted pro forma net income |
|
$ |
198,657 |
|
$ |
131,534 |
|
$ |
104,878 |
|
$ |
76,854 |
|
$ |
40,545 |
|
|
Denominator: |
|
|
|
|
|
|
|
|
|
|
|
|
|
|
|
|
|
Weighted-average Class A common shares outstanding - diluted |
|
|
26,622 |
|
|
83,602 |
|
|
— |
|
|
— |
|
|
— |
|
|
Adjustments: |
|
|
|
|
|
|
|
|
|
|
|
|
|
|
|
|
|
Assumed exchange of post-IPO common units in CWGS, LLC for shares of Class A common stock (m) |
|
|
59,995 |
|
|
— |
|
|
— |
|
|
— |
|
|
— |
|
|
Assumed exchange of pre-IPO common unit equivalent of membership interests in CWGS, LLC (n) |
|
|
— |
|
|
193 |
|
|
72,651 |
|
|
47,563 |
|
|
38,999 |
|
|
Assumed issuance of Class A common stock in connection with IPO (o) |
|
|
— |
|
|
170 |
|
|
11,872 |
|
|
11,872 |
|
|
11,872 |
|
|
Assumed conversion of Series B notes for Class A common stock (h) |
|
|
— |
|
|
— |
|
|
— |
|
|
24,599 |
|
|
33,010 |
|
|
Dilutive options to purchase Class A common stock |
|
|
200 |
|
|
— |
|
|
— |
|
|
— |
|
|
— |
|
|
Dilutive restricted stock units |
|
|
112 |
|
|
6 |
|
|
— |
|
|
— |
|
|
— |
|
|
Adjusted pro forma fully exchanged weighted average Class A common shares outstanding - diluted |
|
|
86,929 |
|
|
83,971 |
|
|
84,523 |
|
|
84,034 |
|
|
83,881 |
|
|
Adjusted pro forma earnings per fully exchanged and diluted share |
|
$ |
2.29 |
|
$ |
1.57 |
|
$ |
1.24 |
|
$ |
0.91 |
|
$ |
0.48 |
|
|
(a) |
Represents the reallocation of net income attributable to non-controlling interests from the assumed exchange of common units of CWGS, LLC in periods in which income was attributable to non-controlling interests. |
|
(b) |
Represents the loss and expense incurred on debt restructure and financing expense incurred from the First and Second Amendment to the Existing Senior Credit Facilities in 2017, the write-off of a portion of the original issue discount, capitalized finance costs from the Previous Term Loan Facilities, rating agency fees and legal expenses related to the Previous Term Loan Facilities in 2016, and the repayment of the 12.00% Series A Notes due 2018 in 2014 and the 11.50% Senior Secured Notes due 2016 in 2013. |
|
(c) |
Represents an adjustment to eliminate (i) the gains and losses on sales of various assets, including (a) a $1.8 million gain on the asset sale of seven outdoor power sports magazine titles, two power sports shows and two conferences in March 2013 and (b) the sale of the former FreedomRoads, LLC corporate office building at a loss of $3.5 million in November 2013; (ii) aggregate non‑recurring losses from two non‑performing locations that were sold in 2015; and (iii) a loss equal to the present value of the |
98
remaining net obligation under the non‑cancellable operating leases in locations with no operating business, which represented $0.8 million, $1.3 million and $0.3 million for the years ended December 31, 2015, 2014 and 2013, respectively. |
|
(d) |
Represents monitoring fees paid pursuant to a monitoring agreement to Crestview and Stephen Adams. The monitoring agreement was terminated on October 6, 2016 in connection with our IPO. |
|
(e) |
Represents non-cash equity-based compensation expense related to employees and directors of the Company. |
|
(f) |
Represents an adjustment to rent expense for the periods presented for certain right to use assets that were derecognized in the fourth quarter of 2015 due to lease modifications that resulted in the leases meeting the requirements to be reported as operating leases. The adjustments represent additional rent expense that would have been incurred for the periods presented had the leases previously been classified as operating leases. See Note 9 — Right to Use Liability to our audited consolidated financial statements in Part II, Item 8 of this Form 10-K for additional information. |
|
(g) |
Represents an adjustment to eliminate the gains on remeasurement of the Tax Receivable Agreement primarily due to changes in our effective income tax rate. See Note 10 – Income Taxes. |
|
(h) |
Represents the assumed exchange of the common unit equivalent of the Series B notes if the notes were converted into membership interests in CWGS, LLC as of January 1 of each period for which the Series B notes were outstanding. The related interest expense is added back using the if-converted method. |
|
(i) |
Represents transaction expenses, primarily legal costs, associated with acquisitions into new or complimentary markets, including the Gander Mountain acquisition. This amount excludes transaction expenses related to the acquisition of RV dealerships, consumer shows, Active Sports, Inc., and W82. |
|
(j) |
Represents pre-opening store costs, including payroll costs, associated with the Gander Mountain acquisition. |
|
(k) |
This amount relates to the remeasurement of federal net deferred tax assets resulting from the permanent reduction in the U.S. statutory corporate tax rate to 21% from 35% under the 2017 Tax Act. See Note 10 – Income Taxes. |
|
(l) |
Represents the income tax expense effect of (i) the above adjustments and (ii) the pass-through entity taxable income as if the parent company was a subchapter C corporation in periods prior to the IPO. This assumption uses an effective tax rate of 38.5% for the adjustments and the pass-through entity taxable income. |
|
(m) |
Represents the assumed exchange of post-IPO common units in CWGS, LLC at their Class A common stock equivalent amount. |
|
(n) |
Represents the assumed exchange of pre-IPO membership interests in CWGS, LLC at their common unit equivalent amount. |
|
(o) |
Represents the assumption that the shares of Class A common stock issued in connection with the IPO were outstanding as of January 1 of each period. |
Uses and Limitations of Non-GAAP Financial Measures
Management and our board of directors use the Non-GAAP Financial Measures:
|
· |
as a measurement of operating performance because they assist us in comparing the operating performance of our business on a consistent basis, as they remove the impact of items not directly resulting from our core operations; |
|
· |
for planning purposes, including the preparation of our internal annual operating budget and financial projections; |
|
· |
to evaluate the performance and effectiveness of our operational strategies; and |
|
· |
to evaluate our capacity to fund capital expenditures and expand our business. |
By providing these Non‑GAAP Financial Measures, together with reconciliations, we believe we are enhancing investors’ understanding of our business and our results of operations, as well as assisting investors in evaluating how well we are executing our strategic initiatives. In addition, our Existing Senior Secured Credit Facilities use EBITDA to measure our compliance with covenants such as consolidated leverage ratio. The Non-GAAP Financial Measures have limitations as analytical tools, and should not be considered in isolation, or as an alternative to, or a substitute for net income or other financial statement data
99
presented in our consolidated financial statements included elsewhere in this Form 10-K as indicators of financial performance. Some of the limitations are:
|
· |
such measures do not reflect our cash expenditures, or future requirements for capital expenditures or contractual commitments; |
|
· |
such measures do not reflect changes in, or cash requirements for, our working capital needs; |
|
· |
some of such measures do not reflect the interest expense, or the cash requirements necessary to service interest or principal payments on our debt; |
|
· |
some of such measures do not reflect our tax expense or the cash requirements to pay our taxes; |
|
· |
although depreciation and amortization are non‑cash charges, the assets being depreciated and amortized will often have to be replaced in the future and such measures do not reflect any cash requirements for such replacements; and |
|
· |
other companies in our industry may calculate such measures differently than we do, limiting their usefulness as comparative measures. |
Due to these limitations, the Non-GAAP Financial Measures should not be considered as measures of discretionary cash available to us to invest in the growth of our business. We compensate for these limitations by relying primarily on our GAAP results and using these Non‑GAAP Financial Measures only supplementally. As noted in the tables above, certain of the Non-GAAP Financial Measures include adjustments for loss and expense on debt restructure, loss (gain) on sale of assets and disposition of stores, equity-based compensation, an adjustment to rent on right to use assets, and other unusual or one‑time items. It is reasonable to expect that these items will occur in future periods. However, we believe these adjustments are appropriate because the amounts recognized can vary significantly from period to period, do not directly relate to the ongoing operations of our business and complicate comparisons of our internal operating results and operating results of other companies over time. In addition, these certain Non-GAAP Financial Measures adjust for other items that we do not expect to regularly record in periods after the IPO, including monitoring fees. Each of the normal recurring adjustments and other adjustments described in this paragraph and in the reconciliation tables above help management with a measure of our core operating performance over time by removing items that are not related to day‑to‑day operations.
Liquidity and Capital Resources
General
Our primary requirements for liquidity and capital have been working capital, inventory management, acquiring and building new retail locations, including pre-opening expenses, the improvement and expansion of existing retail locations, debt service, distributions to holders of equity interests in CWGS, LLC and our Class A common stock, and general corporate needs. These cash requirements have been met through cash provided by operating activities, cash and cash equivalents, proceeds from our IPO, proceeds from the May 2017 Public Offering, borrowings under our Existing Senior Secured Credit Facilities, including incremental borrowings, or previously under our Previous Senior Secured Credit Facilities, and borrowings under our Floor Plan Facility.
As a public company, additional liquidity needs include public company costs, payment of regular and special cash dividends, any exercise of the redemption right by the Continuing Equity Owners from time to time (should we elect to exchange common units for a cash payment), payments under the Tax Receivable Agreement, and state and federal taxes to the extent not sheltered as a result of the Tax Receivable Agreement. The Continuing Equity Owners may exercise such redemption right for as long as their common units remain outstanding. Although the actual timing and amount of any payments that may be made under the Tax Receivable Agreement will vary, we expect that the payments that we will be required to make to the Continuing Equity Owners and Crestview Partners II GP, L.P. will be significant. Any payments made by us to Continuing Equity Owners and Crestview Partners II GP, L.P. under the Tax Receivable Agreement will
100
generally reduce the amount of overall cash flow that might have otherwise been available to us or to CWGS, LLC and, to the extent that we are unable to make payments under the Tax Receivable Agreement for any reason, the unpaid amounts generally will be deferred and will accrue interest until paid by us; provided, however, that nonpayment for a specified period may constitute a material breach of a material obligation under the Tax Receivable Agreement and therefore may accelerate payments due under the Tax Receivable Agreement. For a discussion of the Tax Receivable Agreement, see Note 10 — Income Taxes to our audited consolidated financial statements included in Part II, Item 8 of this Form 10-K.
CWGS, LLC has in the past made a regular quarterly cash distribution to its common unit holders, including us, of approximately $0.08 per common unit, and CWGS, LLC intends to continue to make such quarterly cash distributions. In addition, a special one-time quarterly cash dividend was paid to its common unit holders on December 29, 2017 in the amount of $0.13 per common unit. We have used in the past, and intend to continue to use all of the proceeds from such distributions on our common units to pay regular quarterly cash dividends of approximately $0.08 per share on our Class A common stock, subject to our discretion as the sole managing member of CWGS, LLC and the discretion of our board of directors. We paid regular quarterly cash dividends of $0.08 per share of our Class A common stock, or $1.5 million, $1.5 million, $2.3 million, $2.4 million, and $2.9 million, during the quarters ended December 31, 2016, March 31, 2017, June 30, 2017, September 30, 2017 and December 31, 2017, respectively.
CWGS, LLC is required to make cash distributions in accordance with the CWGS LLC Agreement in an amount sufficient for us to pay any expenses incurred by us in connection with the regular quarterly cash dividend, along with any of our other operating expenses and other obligations. In addition, we have paid, and currently intend to pay, a special cash dividend of all or a portion of the Excess Tax Distribution (as defined under “Dividend Policy” included in Part II, Item 5 of this Form 10-K) to the holders of our Class A common stock from time to time subject to the discretion of our board of directors as described under “Dividend Policy.” In the year ended December 31, 2017, we paid four special cash dividends of $0.0732 per share of our Class A common stock, and in the quarter ended December 31, 2017, we also paid a one-time dividend of $0.13 per share of our Class A common stock. Our dividend policy has certain risks and limitations, particularly with respect to liquidity, and we may not pay dividends according to our policy, or at all. See “Dividend Policy” included in Part II, Item 5 of this Form 10-K and “Risk Factors—Risks Relating to Ownership of Our Class A Common Stock—Our ability to pay regular and special dividends on our Class A common stock is subject to the discretion of our board of directors and may be limited by our structure and statutory restrictions and restrictions imposed by our Existing Senior Secured Credit Facilities and our Floor Plan Facility as well as any future agreements” included in Part I, Item 1A of this Form 10-K.
Notwithstanding our obligations under the Tax Receivable Agreement, we believe that our sources of liquidity and capital will be sufficient to finance our continued operations, growth strategy, including opening of Gander Outdoors stores, regular quarterly cash dividends (as described above) and additional expenses we expect to incur as a public company for at least the next twelve months. However, we cannot assure you that our cash provided by operating activities, cash and cash equivalents or cash available under our Existing Revolving Credit Facility or our Floor Plan Facility will be sufficient to meet our future needs. If we are unable to generate sufficient cash flows from operations in the future, and if availability under our Existing Revolving Credit Facility or our Floor Plan Facility is not sufficient, we may have to obtain additional financing. If we obtain additional capital by issuing equity, the interests of our existing stockholders will be diluted. If we incur additional indebtedness, that indebtedness may impose significant financial and other covenants that may significantly restrict our operations. We currently intend to increase our borrowings in the near term to fund our current plan to open additional Gander Outdoors stores by May 2018, and to provide working capital for dealership acquisition opportunities. We cannot assure you that we could obtain refinancing or additional financing on favorable terms or at all. See “Risk Factors — Risks Related to our Business — Our ability to operate and expand our business and to respond to changing business and economic conditions will depend on the availability of adequate capital” included in Part I, Item 1A of this Form 10-K.
As of December 31, 2017, we had working capital of $478.7 million, including $224.2 million of cash and cash equivalents. Our working capital reflects the cash provided by deferred revenue and gains reported under current liabilities of $77.7 million as of December 31, 2017, which reduces working capital. Deferred revenue primarily consists of cash collected for club memberships in advance of services to be provided,
101
which is deferred and recognized as revenue over the life of the membership. We use net proceeds from this deferred membership revenue to lower our long term borrowings and finance our working capital needs.
Seasonality
We have experienced, and expect to continue to experience, variability in revenue, net income, and cash flows as a result of annual seasonality in our business. Because RVs are used primarily by vacationers and campers, demand for services, protection plans, products, and resources generally declines during the winter season, while sales and profits are generally highest during the spring and summer months. Conversely, we expect demand for non-RV related outdoor and active sports products to generally decline during the first and second fiscal quarters and we expect sales and profits to generally be higher in the third and fourth fiscal quarters. In addition, unusually severe weather conditions in some geographic areas may impact demand.
On average, over the three years ended December 31, 2017, we have generated approximately 30.1% and 28.6% of our annual revenue in our second and third fiscal quarters, respectively, which include the spring and summer months. We have historically incurred additional expenses in the second and third fiscal quarters due to higher purchase volumes, increased staffing in our retail locations and program costs. If, for any reason, we miscalculate the demand for our products or our product mix during the second and third fiscal quarters, our sales in these quarters could decline, resulting in higher labor costs as a percentage of sales, lower margins and excess inventory, which could cause our annual results of operations to suffer and our stock price to decline.
Additionally, SG&A expenses as a percentage of gross profit tend to be higher in the first and fourth quarters due to the timing of acquisitions and the seasonality of our business. We prefer to acquire new retail locations in the first and fourth quarters of each year in order to provide time for the location to be re‑modeled and to ramp up operations ahead of the spring and summer months. The timing of our acquisitions in the first and fourth quarters, coupled with generally lower revenue in these quarters has resulted in SG&A expenses as a percentage of gross profit being higher in these quarters. In 2018, we plan to open 72 additional Gander Outdoors locations by May 2018, which we expect to further impact this trend.
Due to our seasonality, the possible adverse impact from other risks associated with our business, including atypical weather, consumer spending levels and general business conditions, is potentially greater if any such risks occur during our peak sales seasons. See “Risk Factors — Risks Related to our Business — Our business is seasonal and this leads to fluctuations in sales and revenues” included in Part I, Item 1A of this Form 10-K.
Quarterly Results of Operations
The following tables set forth selected unaudited quarterly statements of income data for each of the eight quarters in the period ended December 31, 2017, as well as the percentage each line item represents of total revenue for each quarter. Certain quarterly amounts have been revised to correct for errors that were immaterial in prior periods as described in Note 1 — Summary of Significant Accounting Policies — Restatement to Prior Periods and Note 23 — Quarterly Financial Information (unaudited) in Part II, Item 8 of this Form 10-K. The information for each of these quarters has been prepared on the same basis as our audited consolidated financial statements included in Part II, Item 8 of this Form 10-K and, in the opinion of management, includes all adjustments, which include only normal recurring adjustments, necessary for the fair presentation of the results of operations for these periods in accordance with GAAP. This data should be read in conjunction with our audited consolidated financial statements and related notes included in Part II, Item 8 of this Form 10-K. These quarterly operating results are not necessarily indicative of our operating results for a full year or any future period.
102
|
|
|
Three Months Ended |
||||||||||||||||||||||
|
|
|
December 31, |
|
September 30, |
|
June 30, |
|
March 31, |
|
December 31, |
|
September 30, |
|
June 30, |
|
March 31, |
||||||||
|
($ in thousands) |
|
2017 |
|
2017 |
|
2017 |
|
2017 |
|
2016 |
|
2016 |
|
2016 |
|
2016 |
||||||||
|
|
|
|
|
|
|
|
|
|
|
|
|
|
|
|
|
|
|
|
|
|
|
|
|
|
|
Revenue |
|
$ |
888,992 |
|
$ |
1,235,602 |
|
$ |
1,279,026 |
|
$ |
881,635 |
|
$ |
668,903 |
|
$ |
988,804 |
|
$ |
1,065,259 |
|
$ |
796,031 |
|
Gross profit |
|
|
266,615 |
|
|
355,215 |
|
|
372,580 |
|
|
251,929 |
|
|
194,478 |
|
|
280,067 |
|
|
300,186 |
|
|
221,692 |
|
Selling, general and administrative |
|
|
213,052 |
|
|
236,174 |
|
|
228,444 |
|
|
175,490 |
|
|
154,918 |
|
|
186,255 |
|
|
190,323 |
|
|
160,388 |
|
Net income (loss) |
|
|
(5,494) |
|
|
83,752 |
|
|
105,093 |
|
|
49,623 |
|
|
11,528 |
|
|
68,247 |
|
|
84,108 |
|
|
37,176 |
|
Net income (loss) attributable to Camping World Holdings, Inc. |
|
|
(18,093) |
|
|
19,589 |
|
|
19,344 |
|
|
7,522 |
|
|
1,586 |
|
|
68,247 |
|
|
84,108 |
|
|
37,176 |
|
Adjusted EBITDA (1) |
|
|
65,285 |
|
|
120,602 |
|
|
141,869 |
|
|
71,856 |
|
|
37,094 |
|
|
90,115 |
|
|
105,161 |
|
|
56,787 |
|
Adjusted pro forma net income (1) |
|
|
22,015 |
|
|
67,511 |
|
|
77,416 |
|
|
31,715 |
|
|
10,343 |
|
|
44,658 |
|
|
55,301 |
|
|
21,232 |
|
Adjusted pro forma earnings per fully exchanged and diluted share (1) |
|
$ |
0.25 |
|
$ |
0.76 |
|
$ |
0.90 |
|
$ |
0.38 |
|
$ |
0.12 |
|
$ |
0.53 |
|
$ |
0.66 |
|
$ |
0.25 |
|
|
|
Three Months Ended |
||||||||||||||||||||||
|
|
|
December 31, |
|
September 30, |
|
June 30, |
|
March 31, |
|
December 31, |
|
September 30, |
|
June 30, |
|
March 31, |
||||||||
|
(as percentage of total revenue) |
|
2017 |
|
2017 |
|
2017 |
|
2017 |
|
2016 |
|
2016 |
|
2016 |
|
2016 |
||||||||
|
|
|
|
|
|
|
|
|
|
|
|
|
|
|
|
|
|
|
|
|
|
|
|
|
|
|
Revenue |
|
|
100.0% |
|
|
100.0% |
|
|
100.0% |
|
|
100.0% |
|
|
100.0% |
|
|
100.0% |
|
|
100.0% |
|
|
100.0% |
|
Gross profit |
|
|
30.0% |
|
|
28.7% |
|
|
29.1% |
|
|
28.6% |
|
|
29.1% |
|
|
28.3% |
|
|
28.2% |
|
|
27.8% |
|
Selling, general and administrative |
|
|
24.0% |
|
|
19.1% |
|
|
17.9% |
|
|
19.9% |
|
|
23.2% |
|
|
18.8% |
|
|
17.9% |
|
|
20.1% |
|
Net income (loss) |
|
|
-0.6% |
|
|
6.8% |
|
|
8.2% |
|
|
5.6% |
|
|
1.7% |
|
|
6.9% |
|
|
7.9% |
|
|
4.7% |
|
Net income (loss) attributable to Camping World Holdings, Inc. |
|
|
-2.0% |
|
|
1.6% |
|
|
1.5% |
|
|
0.9% |
|
|
0.2% |
|
|
6.9% |
|
|
7.9% |
|
|
4.7% |
|
Adjusted EBITDA (1) |
|
|
7.3% |
|
|
9.8% |
|
|
11.1% |
|
|
8.2% |
|
|
5.5% |
|
|
9.1% |
|
|
9.9% |
|
|
7.1% |
|
Adjusted pro forma net income (1) |
|
|
2.5% |
|
|
5.5% |
|
|
6.1% |
|
|
3.6% |
|
|
1.5% |
|
|
4.5% |
|
|
5.2% |
|
|
2.7% |
|
(1) |
The following tables reconcile Adjusted EBITDA, Adjusted Pro Forma Net Income, and Adjusted Pro Forma Earnings Per Fully Exchanged and Diluted Share to the most directly comparable U.S. GAAP financial performance measure, which is net income, net income attributable to Camping World Holdings, Inc., and weighted-average shares of Class A common stock outstanding — diluted, respectively. Please see “Non-GAAP Financial Measures” in Part II, Item 7 of this Form 10-K for our definition of Adjusted EBITDA, Adjusted Pro Forma Net Income, and Adjusted Pro Forma Earnings Per Fully Exchanged and Diluted Share and why we consider it useful. |
|
|
|
Three Months Ended |
||||||||||||||||||||||
|
|
|
December 31, |
|
September 30, |
|
June 30, |
|
March 31, |
|
December 31, |
|
September 30, |
|
June 30, |
|
March 31, |
||||||||
|
($ in thousands) |
|
2017 |
|
2017 |
|
2017 |
|
2017 |
|
2016 |
|
2016 |
|
2016 |
|
2016 |
||||||||
|
|
|
|
|
|
|
|
|
|
|
|
|
|
|
|
|
|
|
|
|
|
|
|
|
|
|
Net income (loss) |
|
$ |
(5,494) |
|
$ |
83,752 |
|
$ |
105,093 |
|
$ |
49,623 |
|
$ |
11,528 |
|
$ |
68,247 |
|
$ |
84,108 |
|
$ |
37,176 |
|
Other interest expense, net |
|
|
11,986 |
|
|
11,012 |
|
|
10,557 |
|
|
9,404 |
|
|
10,278 |
|
|
12,715 |
|
|
12,577 |
|
|
12,748 |
|
Depreciation and amortization |
|
|
8,726 |
|
|
8,382 |
|
|
7,584 |
|
|
6,853 |
|
|
6,551 |
|
|
6,219 |
|
|
6,034 |
|
|
5,891 |
|
Income tax expense |
|
|
128,716 |
|
|
8,390 |
|
|
14,284 |
|
|
5,592 |
|
|
1,269 |
|
|
2,288 |
|
|
1,979 |
|
|
371 |
|
EBITDA |
|
|
143,934 |
|
|
111,536 |
|
|
137,518 |
|
|
71,472 |
|
|
29,626 |
|
|
89,469 |
|
|
104,698 |
|
|
56,186 |
|
Adjustments: |
|
|
|
|
|
|
|
|
|
|
|
|
|
|
|
|
|
|
|
|
|
|
|
|
|
Loss and expense on debt restructure (a) |
|
|
849 |
|
|
— |
|
|
— |
|
|
— |
|
|
6,270 |
|
|
— |
|
|
— |
|
|
— |
|
Loss (gain) on sale of assets (a) |
|
|
159 |
|
|
(5) |
|
|
31 |
|
|
(318) |
|
|
(339) |
|
|
21 |
|
|
(222) |
|
|
(24) |
|
Monitoring fee (a) |
|
|
— |
|
|
— |
|
|
— |
|
|
— |
|
|
— |
|
|
625 |
|
|
625 |
|
|
625 |
|
Equity-based compensation (a) |
|
|
2,317 |
|
|
1,204 |
|
|
869 |
|
|
719 |
|
|
1,537 |
|
|
— |
|
|
60 |
|
|
— |
|
Tax Receivable Agreement liability adjustment |
|
|
(99,766) |
|
|
96 |
|
|
— |
|
|
(17) |
|
|
— |
|
|
— |
|
|
— |
|
|
— |
|
Acquisitions - transaction expense |
|
|
109 |
|
|
453 |
|
|
2,100 |
|
|
— |
|
|
— |
|
|
— |
|
|
— |
|
|
— |
|
Acquisitions - pre-opening costs |
|
|
17,683 |
|
|
7,318 |
|
|
1,351 |
|
|
— |
|
|
— |
|
|
|
|
|
|
|
|
|
|
Adjusted EBITDA |
|
$ |
65,285 |
|
$ |
120,602 |
|
$ |
141,869 |
|
$ |
71,856 |
|
$ |
37,094 |
|
$ |
90,115 |
|
$ |
105,161 |
|
$ |
56,787 |
|
(a) |
See “Non-GAAP Financial Measures” in Part II, Item 7 of this Form 10-K for a more detailed description of the adjustments set forth above. |
103
|
|
|
Three Months Ended |
||||||||||||||||||||||
|
|
|
December 31, |
|
September 30, |
|
June 30, |
|
March 31, |
|
December 31, |
|
September 30, |
|
June 30, |
|
March 31, |
||||||||
|
(as percentage of total revenue) |
|
2017 |
|
2017 |
|
2017 |
|
2017 |
|
2016 |
|
2016 |
|
2016 |
|
2016 |
||||||||
|
|
|
|
|
|
|
|
|
|
|
|
|
|
|
|
|
|
|
|
|
|
|
|
|
|
|
Net income (loss) margin |
|
|
(0.6%) |
|
|
6.8% |
|
|
8.2% |
|
|
5.6% |
|
|
1.7% |
|
|
6.9% |
|
|
7.9% |
|
|
4.7% |
|
Other interest expense, net |
|
|
1.3% |
|
|
0.9% |
|
|
0.8% |
|
|
1.1% |
|
|
1.5% |
|
|
1.3% |
|
|
1.2% |
|
|
1.6% |
|
Depreciation and amortization |
|
|
1.0% |
|
|
0.7% |
|
|
0.6% |
|
|
0.8% |
|
|
1.0% |
|
|
0.6% |
|
|
0.6% |
|
|
0.7% |
|
Income tax expense |
|
|
14.5% |
|
|
0.7% |
|
|
1.1% |
|
|
0.6% |
|
|
0.2% |
|
|
0.2% |
|
|
0.2% |
|
|
0.0% |
|
EBITDA margin |
|
|
16.2% |
|
|
9.0% |
|
|
10.8% |
|
|
8.1% |
|
|
4.4% |
|
|
9.0% |
|
|
9.8% |
|
|
7.1% |
|
Adjustments: |
|
|
|
|
|
|
|
|
|
|
|
|
|
|
|
|
|
|
|
|
|
|
|
|
|
Loss and expense on debt restructure (a) |
|
|
0.1% |
|
|
— |
|
|
— |
|
|
— |
|
|
0.9% |
|
|
— |
|
|
— |
|
|
— |
|
Loss (gain) on sale of assets (a) |
|
|
0.0% |
|
|
(0.0%) |
|
|
0.0% |
|
|
(0.0%) |
|
|
(0.1%) |
|
|
0.0% |
|
|
(0.0%) |
|
|
(0.0%) |
|
Monitoring fee (a) |
|
|
— |
|
|
— |
|
|
— |
|
|
— |
|
|
— |
|
|
0.1% |
|
|
0.1% |
|
|
0.1% |
|
Equity-based compensation (a) |
|
|
0.3% |
|
|
0.1% |
|
|
0.1% |
|
|
0.1% |
|
|
0.2% |
|
|
— |
|
|
0.0% |
|
|
— |
|
Tax Receivable Agreement liability adjustment |
|
|
(11.2%) |
|
|
0.0% |
|
|
— |
|
|
(0.0%) |
|
|
— |
|
|
— |
|
|
— |
|
|
— |
|
Acquisitions - transaction expense |
|
|
0.0% |
|
|
0.0% |
|
|
0.2% |
|
|
— |
|
|
— |
|
|
— |
|
|
— |
|
|
— |
|
Acquisitions - pre-opening costs |
|
|
2.0% |
|
|
0.6% |
|
|
0.1% |
|
|
— |
|
|
— |
|
|
— |
|
|
— |
|
|
— |
|
Adjusted EBITDA margin |
|
|
7.3% |
|
|
9.8% |
|
|
11.1% |
|
|
8.2% |
|
|
5.5% |
|
|
9.1% |
|
|
9.9% |
|
|
7.1% |
|
(a) |
See “Non-GAAP Financial Measures” in Part II, Item 7 of this Form 10-K for a more detailed description of the adjustments set forth above. |
|
|
|
Three Months Ended |
||||||||||||||||||||||
|
($ in thousands except |
|
December 31, |
|
September 30, |
|
June 30, |
|
March 31, |
|
December 31, |
|
September 30, |
|
June 30, |
|
March 31, |
||||||||
|
per share amounts) |
|
2017 |
|
2017 |
|
2017 |
|
2017 |
|
2016 |
|
2016 |
|
2016 |
|
2016 |
||||||||
|
Numerator: |
|
|
|
|
|
|
|
|
|
|
|
|
|
|
|
|
|
|
|
|
|
|
|
|
|
Net income (loss) attributable to Camping World Holdings, Inc. |
|
$ |
(18,093) |
|
$ |
19,589 |
|
$ |
19,344 |
|
$ |
7,522 |
|
$ |
1,586 |
|
$ |
68,247 |
|
$ |
84,108 |
|
$ |
37,176 |
|
Adjustments: |
|
|
|
|
|
|
|
|
|
|
|
|
|
|
|
|
|
|
|
|
|
|
|
|
|
Reallocation of net income attributable to non-controlling interests from the assumed exchange of common units of CWGS, LLC (a) |
|
|
12,599 |
|
|
64,163 |
|
|
85,749 |
|
|
42,101 |
|
|
9,942 |
|
|
— |
|
|
— |
|
|
— |
|
Loss and expense on debt restructure (a) |
|
|
849 |
|
|
— |
|
|
— |
|
|
— |
|
|
6,270 |
|
|
— |
|
|
— |
|
|
— |
|
Loss (gain) on sale of assets (a) |
|
|
159 |
|
|
(5) |
|
|
31 |
|
|
(318) |
|
|
(339) |
|
|
21 |
|
|
(222) |
|
|
(24) |
|
Monitoring fee (a) |
|
|
— |
|
|
— |
|
|
— |
|
|
— |
|
|
— |
|
|
625 |
|
|
625 |
|
|
625 |
|
Equity-based compensation expense (a) |
|
|
2,317 |
|
|
1,204 |
|
|
869 |
|
|
719 |
|
|
1,537 |
|
|
— |
|
|
60 |
|
|
— |
|
Tax Receivable Agreement liability adjustment (a) |
|
|
(99,766) |
|
|
96 |
|
|
— |
|
|
(17) |
|
|
— |
|
|
— |
|
|
— |
|
|
— |
|
Acquisitions - transaction expense (a) |
|
|
109 |
|
|
453 |
|
|
2,100 |
|
|
— |
|
|
— |
|
|
— |
|
|
— |
|
|
— |
|
Acquisitions - pre-opening costs (a) |
|
|
17,683 |
|
|
7,318 |
|
|
1,351 |
|
|
— |
|
|
— |
|
|
— |
|
|
— |
|
|
— |
|
Revaluation of deferred tax assets from tax reform (a) |
|
|
118,386 |
|
|
— |
|
|
— |
|
|
— |
|
|
— |
|
|
— |
|
|
— |
|
|
— |
|
Income tax expense (a) |
|
|
(12,228) |
|
|
(25,307) |
|
|
(32,028) |
|
|
(18,292) |
|
|
(8,653) |
|
|
(24,235) |
|
|
(29,270) |
|
|
(16,545) |
|
Adjusted pro forma net income |
|
$ |
22,015 |
|
$ |
67,511 |
|
$ |
77,416 |
|
$ |
31,715 |
|
$ |
10,343 |
|
$ |
44,658 |
|
$ |
55,301 |
|
$ |
21,232 |
104
|
|
|
Three Months Ended |
||||||||||||||||||||||
|
($ in thousands except |
|
December 31, |
|
September 30, |
|
June 30, |
|
March 31, |
|
December 31, |
|
September 30, |
|
June 30, |
|
March 31, |
||||||||
|
per share amounts) |
|
2017 |
|
2017 |
|
2017 |
|
2017 |
|
2016 |
|
2016 |
|
2016 |
|
2016 |
||||||||
|
Denominator: |
|
|
|
|
|
|
|
|
|
|
|
|
|
|
|
|
|
|
|
|
|
|
|
|
|
Weighted-average Class A common shares outstanding - diluted |
|
|
34,837 |
|
|
29,522 |
|
|
22,977 |
|
|
83,772 |
|
|
83,602 |
|
|
— |
|
|
— |
|
|
— |
|
Adjustments: |
|
|
|
|
|
|
|
|
|
|
|
|
|
|
|
|
|
|
|
|
|
|
|
|
|
Assumed exchange of post-IPO common units in CWGS, LLC for shares of Class A common stock (a) |
|
|
53,772 |
|
|
58,930 |
|
|
62,586 |
|
|
— |
|
|
— |
|
|
— |
|
|
— |
|
|
— |
|
Assumed exchange of pre-IPO common unit equivalent of membership interests in CWGS, LLC (a) |
|
|
— |
|
|
— |
|
|
— |
|
|
— |
|
|
— |
|
|
71,900 |
|
|
71,924 |
|
|
72,651 |
|
Assumed issuance of Class A common stock in connection with IPO (a) |
|
|
— |
|
|
— |
|
|
— |
|
|
— |
|
|
170 |
|
|
11,872 |
|
|
11,872 |
|
|
11,872 |
|
Dilutive options to purchase Class A common stock |
|
|
376 |
|
|
219 |
|
|
56 |
|
|
146 |
|
|
— |
|
|
— |
|
|
— |
|
|
— |
|
Dilutive restricted stock units |
|
|
200 |
|
|
128 |
|
|
61 |
|
|
58 |
|
|
24 |
|
|
— |
|
|
— |
|
|
— |
|
Adjusted pro forma fully exchanged weighted average Class A common shares outstanding - diluted |
|
|
89,185 |
|
|
88,799 |
|
|
85,680 |
|
|
83,976 |
|
|
83,796 |
|
|
83,772 |
|
|
83,796 |
|
|
84,523 |
|
Adjusted pro forma earnings per fully exchanged and diluted share |
|
$ |
0.25 |
|
$ |
0.76 |
|
$ |
0.90 |
|
$ |
0.38 |
|
$ |
0.12 |
|
$ |
0.53 |
|
$ |
0.66 |
|
$ |
0.25 |
|
(a) |
See “Non-GAAP Financial Measures” in Part II, Item 7 of this Form 10-K for a more detailed description of the adjustments set forth above. |
Cash Flow
The following table shows summary cash flows information for the years ended December 31, 2017, 2016 and 2015, respectively:
|
|
|
Fiscal Year Ended |
|
|||||||
|
|
|
December 31, |
|
December 31, |
|
December 31, |
|
|||
|
(In thousands) |
|
2017 |
|
2016 |
|
2015 |
|
|||
|
Net cash (used in) provided by operating activities |
|
$ |
(9,094) |
|
$ |
215,691 |
|
$ |
112,143 |
|
|
Net cash used in investing activities |
|
|
(475,676) |
|
|
(115,703) |
|
|
(176,200) |
|
|
Net cash provided by (used in) financing activities |
|
|
594,737 |
|
|
(77,817) |
|
|
45,372 |
|
|
Net increase in cash and cash equivalents |
|
$ |
109,967 |
|
$ |
22,171 |
|
$ |
(18,685) |
|
Operating activities. Our cash flows from operating activities are primarily collections from contracts in transit and customers following the sale of new and used vehicles, as well as from the sale of retail parts, services and other. Contracts in transit represent amounts due from third‑party lenders from whom pre‑arranged agreements have been determined, and to whom the retail installment sales contract have been assigned. Our primary uses of cash from operating activities are repayments of vehicle floor plan payables, payments to retail product suppliers, personnel‑related expenditures, payments related to leased property, advertising, and various consumer services program costs.
Net cash used in operating activities was $9.1 million for the year ended December 31, 2017, a decrease of $224.8 million from net cash provided by operating activities of $215.7 million in the year ended December 31, 2016. The decrease in net cash (used in) provided by operating activities for the year ended December 31, 2017 was primarily due to $311.8 million from increased inventory growth in 2017 to meet
105
expected demand, a $99.7 million change in the Tax Receivable Agreement liability adjustment, and a $27.1 million growth in accounts receivables and contracts in transit, partially offset by a $120.9 million change in deferred taxes, a $55.4 million increase in the growth of accounts payable, other accrued liabilities and checks in excess of bank balance, a $31.9 million increase in net income, and $5.6 million from other increases.
Net cash provided by operating activities was $215.7 million for the year ended December 31, 2016, an increase of $103.5 million from $112.2 million in the year ended December 31, 2015. The increase for the year ended December 31, 2016 was primarily due to $77.9 million from slower inventory growth in 2016, and a $26.8 million increase in net income, partially offset by $1.2 million from other decreases.
Net cash provided by operating activities was $112.1 million for the year ended December 31, 2015, an increase of $68.1 million from $44.1 million in the year ended December 31, 2014. The increase for the year ended December 31, 2015 was primarily due to a $52.8 million increase in net income, a $7.0 million increase due to growth in accounts payable and accrued liabilities, a $7.1 million increase in checks held in excess of bank balance, a $6.4 million increase from a slightly lower growth in inventory in 2015 and $0.7 million of other increases, partially offset by a $5.9 million decrease in the growth of deferred revenues.
Investing activities. Our investment in business activities primarily consists of expanding our operations through organic growth and the acquisition of retail locations. Substantially all of our new retail locations and capital expenditures have been financed using cash provided by operating activities and borrowings under our Existing Senior Secured Credit Facilities and Previous Senior Secured Credit Facilities, as applicable.
Our capital expenditures consist primarily of investing in greenfield retail locations, existing retail locations, and information technology hardware and software. There are no material commitments for capital expenditures as of December 31, 2017. The table below summarizes our capital expenditures for the years ended December 31, 2017, 2016, and 2015, respectively:
|
|
|
Fiscal Year Ended |
|
|||||||
|
|
|
December 31, |
|
December 31, |
|
December 31, |
|
|||
|
(In thousands) |
|
2017 |
|
2016 |
|
2015 |
|
|||
|
IT hardware and software |
|
$ |
15,915 |
|
$ |
6,969 |
|
$ |
9,709 |
|
|
Greenfield and acquired retail locations |
|
|
35,228 |
|
|
6,625 |
|
|
16,577 |
|
|
Existing retail locations |
|
|
12,863 |
|
|
19,430 |
|
|
11,592 |
|
|
Corporate and other |
|
|
2,774 |
|
|
6,758 |
|
|
3,559 |
|
|
Total capital expenditures |
|
$ |
66,780 |
|
$ |
39,782 |
|
$ |
41,437 |
|
Net cash used in investing activities was $475.7 million for year ended December 31, 2017. The $475.7 million of cash used in investing activities included $393.0 million for the acquisition of RV retail and Outdoor and Active Sports Retail locations, capital expenditures of $66.8 million, purchase of real property of $21.2 million, and the purchase of intangible assets of $1.5 million, partially offset by proceeds from the sale and leaseback of real property and property and equipment of $6.0 million and $0.8 million, respectively.
Net cash used in investing activities was $115.7 million for year ended December 31, 2016. The $115.7 million of cash used in investing activities included $78.6 million for the acquisition of six retail locations, five consumer shows, and a wholesale parts dealer, comprised of $0.9 million of accounts receivable, $36.3 million of inventory, $2.8 million of intangible assets, $40.2 million of goodwill, $0.8 million of property and equipment and $0.2 million of other assets, less $2.6 million of accrued liabilities and customer deposits, in addition to $39.8 million of capital expenditures and $17.1 million for the purchase of real property, partially offset by proceeds from the sale and leaseback of real property and property and equipment of $15.9 million and $3.9 million, respectively.
Net cash used in investing activities was $176.2 million for the year ended December 31, 2015. The $176.2 million of cash used in investing activities included $125.2 million for the acquisition of six retail locations, comprised of $75.7 million of inventory, $51.9 million of goodwill, $0.8 million of property and equipment, less $1.7 million of accrued liabilities and customer deposits and a $1.5 million purchase price
106
holdback, in addition to $41.4 million of capital expenditures and $30.3 million for the purchase of real property, partially offset by proceeds from the sale and leaseback of real property and property and equipment of $19.4 million and $1.3 million, respectively.
Financing activities. Our financing activities primarily consist of proceeds from the issuance of debt and the repayment of principal and debt issuance costs.
Our net cash provided by financing activities was $594.7 million for the year ended December 31, 2017. The $594.7 million of cash provided by financing activities was primarily due to net borrowing under the Floor Plan Facility of $358.5 million, proceeds from long-term debt of $299.2 million, and proceeds from issuance of Class A common stock in a primary public offering of $121.4 million, partially offset by member distributions of $149.6 million and other financing uses of $34.8 million.
Our net cash used in financing activities was $77.8 million for the year ended December 31, 2016. The $77.8 million of cash used in financing activities was primarily due to payment of debt of $288.5 million, member distributions of $236.1 million, debt issuance costs of $7.1 million, and other financing uses of $3.2 million, partially offset by proceeds from long-term debt of $188.1 million, proceeds from issuance of Class A common stock sold in the IPO net of underwriter’s discounts and commissions of $234.2 million, and $34.8 million of net borrowings under the Floor Plan Facility. During 2016, we also borrowed and repaid $12.0 million under the Previous Revolving Credit Facility.
Our net cash provided by financing activities was $45.4 million for the year ended December 31, 2015. The $45.4 million of cash provided by financing activities was primarily due to borrowings of $148.9 million under the Previous Term Loan Facility and $167.4 million of net borrowings under the Floor Plan Facility, partially offset by member distributions of $228.9 million, principal payments under the Previous Term Loan Facility of $36.6 million, debt issuance costs totaling $3.3 million and other financing uses of $2.1 million.
Description of Senior Secured Credit Facilities and Floor Plan Facility
As of December 31, 2017, we had a credit agreement that included a $945.0 million term loan (the ‘‘Existing Term Loan Facility’’) and $35.0 million of commitments for revolving loans (the ‘‘Existing Revolving Credit Facility’’ and, together with the Existing Term Loan Facility, the ‘‘Existing Senior Secured Credit Facilities’’). We also had our floor plan financing facility with $1.415 billion in maximum borrowing availability, a $35.0 million revolving line of credit commitment, and a letter of credit commitment of $15.0 million (the “Floor Plan Facility”). We may from time to time seek to refinance, retire or exchange our outstanding debt. Such refinancings, repayments or exchanges, if any, will depend on prevailing market conditions, our liquidity requirements, contractual restrictions and other factors. The amounts involved may be material. In the past, we have used interest rate swap derivatives to diversify our debt portfolio between fixed and variable rate instruments. For additional information regarding our interest rate risk and interest rate hedging instruments, see “Quantitative and Qualitative Disclosures About Market Risk” in Part II, Item 7A of this Form 10-K.
Existing Senior Secured Credit Facilities
On November 8, 2016, CWGS Group, LLC, a wholly-owned subsidiary of CWGS, LLC (the “Borrower”) and CWGS, LLC (as parent guarantor) entered into a credit agreement (the “Existing Credit Agreement”) for the $680.0 million Existing Senior Secured Credit Facilities with Goldman Sachs Bank USA, as administrative agent, and the other lenders party thereto, and used the proceeds to repay the Previous Senior Secured Credit Facilities. See Note 7 — Long Term Debt to our consolidated financial statements more information on the Existing Senior Secured Credit Facilities and the Previous Senior Secured Credit Facilities. On March 17, 2017, CWGS Group, LLC entered into an First Amendment to the Existing Senior Secured Credit Facilities to increase the Existing Term Loan Facility by $95.0 million to $740.0 million. On October 6, 2017, CWGS Group, LLC entered into a Second Amendment (the “Second Amendment”) to the Existing Credit Agreement. The Second Amendment, among other things, (i) increased the Borrower’s Existing Term Loan Facility by $205.0 million to an outstanding principal amount of $939.5 million, (ii) amended the applicable margin to 2.00% from 2.75% per annum, in the case of base rate loans, and to 3.00% from 3.75% per annum, in the case of LIBOR loans, and (iii) increased the quarterly amortization
107
payment to $2.4 million. The Existing Senior Secured Credit Facilities consist of a seven-year $937.1 million Existing Term Loan Facility and a five-year $35.0 million Existing Revolving Credit Facility.
Borrowings under the Existing Term Loan Facility bear interest at a rate per annum equal to, at our option, either: (a) the London Interbank Offered Rate (‘‘LIBOR’’) multiplied by the statutory reserve rate (such product, the ‘‘Adjusted LIBOR Rate’’), subject to a 0.75% floor, plus an applicable margin of 3.00%, in the case of Eurocurrency loans or (b) an alternate base rate (determined by reference to the greatest of : (i) the prime rate published by The Wall Street Journal (the ‘‘WSJ Prime Rate’’), (ii) the federal funds effective rate plus 0.50% and (iii) the one-month Adjusted LIBOR Rate plus 1.00%), subject to a 1.75% floor, plus an applicable margin of 2.00%, in the case of alternate base rate loans.
Borrowings under the Existing Revolving Credit Facility bear interest at a rate per annum equal to, at our option, either: (a) the Adjusted LIBOR Rate plus an applicable margin based on the total leverage ratio, as set forth in the table below, in the case of Eurocurrency borrowings or (b) an alternate base rate (determined by reference to the greatest of : (i) the WSJ Prime Rate, (ii) the federal funds effective rate plus 0.50% and (iii) the one-month Adjusted LIBOR Rate plus 1.00%), plus an applicable margin based on the total leverage ratio, as set forth in the table below, in the case of alternate base rate borrowings.
|
Pricing Level |
|
Total Leverage Ratio |
|
Eurocurrency |
|
Alternate Base Rate |
|
1 |
|
≤ 1.75 : 1.00 |
|
3.25% |
|
2.25% |
|
2 |
|
> 1.75 : 1.00 |
|
3.50% |
|
2.50% |
In addition to paying interest on outstanding principal under the Existing Senior Secured Credit Facilities, we are required to pay a commitment fee to the lenders under the Existing Revolving Credit Facility in respect of the unutilized commitments thereunder at a rate of 0.50% per annum. We also pay customary letter of credit and agency fees.
Quarterly payments of $2.4 million are due under the Existing Term Loan Facility on the last day of each fiscal quarter. The remaining unpaid principal balance of the Existing Term Loan Facility along with all accrued and unpaid interest is due and payable on November 8, 2023. As of December 31, 2017, we had $916.9 million of term loans outstanding, net of $6.0 million of unamortized original issue discount and $14.2 million of finance costs. The Existing Term Loan Facility also provides for an excess cash flow payment following the end of each fiscal year, commencing with the fiscal year ending December 31, 2017, such that the Borrower is required to prepay the term loan borrowings in an aggregate amount equal to 50% of excess cash flow for such fiscal year if the total leverage ratio is greater than 2.00 to 1.00. The required percentage of excess cash flow prepayment is reduced to 25% if the total leverage ratio is 1.50 to 1.00 or greater, but less than 2.00 to 1.00, and 0% if the total leverage ratio is less than 1.50 to 1.00. As of December 31, 2017, CWGS Group, LLC had no excess cash flow, as defined.
The principal amount outstanding of loans under the Existing Revolving Credit Facility becomes due and payable on November 8, 2021. As of December 31, 2017, we had $31.8 million available for borrowing under our Existing Revolving Credit Facility, net of outstanding letters of credit in the aggregate amount of $3.2 million, and no outstanding borrowings thereunder. The following table details the outstanding amounts and available borrowings under our Existing Senior Secured Credit Facilities as of December 31, 2017 (in thousands):
|
|
|
Year Ended |
||||
|
|
|
December 31, |
|
December 31, |
||
|
|
|
2017 |
|
2016 |
||
|
Existing Senior Secured Credit Facility |
|
|
|
|
|
|
|
Existing Term Loan Facility |
|
|
|
|
|
|
|
Principal amount of borrowings |
|
$ |
945,000 |
|
$ |
645,000 |
|
Less: cumulative principal payments |
|
|
(7,916) |
|
|
– |
|
Less: unamortized original issue discount |
|
|
(6,029) |
|
|
(6,349) |
|
Less: unamortized finance costs |
|
|
(14,153) |
|
|
(11,898) |
|
|
|
|
916,902 |
|
|
626,753 |
108
|
|
|
Year Ended |
||||
|
|
|
December 31, |
|
December 31, |
||
|
|
|
2017 |
|
2016 |
||
|
Less: current portion |
|
|
(9,465) |
|
|
(6,450) |
|
Long-term debt, net of current portion |
|
$ |
907,437 |
|
$ |
620,303 |
|
|
|
|
|
|
|
|
|
Existing Credit Facility |
|
|
|
|
|
|
|
Total commitment |
|
$ |
35,000 |
|
$ |
35,000 |
|
Less: outstanding letters of credit |
|
|
(3,237) |
|
|
(3,237) |
|
Additional borrowing capacity |
|
$ |
31,763 |
|
$ |
31,763 |
The Existing Senior Secured Credit Facilities are collateralized by substantially all of the assets and equity of the Borrower and the subsidiary guarantors, which excludes FreedomRoads Intermediate Holdco, LLC and its subsidiaries, and contain financial covenants and certain business covenants, including restrictions on dividend payments. The Existing Senior Secured Credit Facilities restrict the ability of the Borrower and its subsidiaries to pay distributions or make other restricted payments. The Borrower is generally permitted to pay distributions (1) in an amount not to exceed a specified available amount (as defined in the Existing Credit Agreement), and calculated as the sum of, among other things, $40.0 million, plus net proceeds received by the Borrower in connection with the issuance of, or contribution of cash in respect of, certain existing equity interests, plus, if the total leverage ratio is not greater than 2.50 to 1, cumulative excess cash flow not otherwise applied, minus distributions, prepayments of debt and investments made in reliance of the available amount) as long as (A) after giving pro forma effect to the contemplated distribution, the Borrower would be in compliance with the maximum total leverage ratio covenant (as described below) and (B) no default or event of default has occurred or would result from the contemplated distribution; and (2) in an amount up to $30.0 million during any calendar year, with unused amounts in any calendar year carried over to the succeeding calendar year, to provide funds that are used by CWGS, LLC to pay regular quarterly distributions to its common unit holders, including us. In addition, the Existing Credit Agreement requires the Borrower and its subsidiaries to comply on a quarterly basis with a maximum total leverage ratio, which covenant is only for the benefit of the Existing Revolving Credit Facility, during certain periods in which the aggregate amount of borrowings under the Existing Revolving Credit Facility (including swingline loans), letters of credit and unreimbursed letter of credit disbursements outstanding at such time (minus the lesser of (a) $5.0 million and (b) letters of credit outstanding) is greater than $10.0 million. The maximum total leverage ratio is 3.00 to 1 stepping down to 2.75 to 1 on March 31, 2020. As of December 31, 2017, the Borrower, CWGS, LLC and the subsidiary guarantors were in compliance with our Existing Senior Secured Credit Facilities. To the extent that we are unable to comply with the maximum total leverage ratio in the future, we would be unable to borrow under the Existing Revolving Credit Facility and may need to seek alternative sources of financing in order to operate and finance our business as we deem appropriate. There is no guarantee that we would be able to incur additional indebtedness on acceptable terms or at all.
Floor Plan Facility
On December 12, 2017, FreedomRoads, LLC (the “Floor Plan Borrower”), an indirect subsidiary of the Company, Bank of America, N.A., as administrative agent and letter of credit issuer, and the other lenders party thereto, entered into a seventh amended and restated credit agreement (the “Floor Plan Facility Amendment”), which amended the previous credit agreement governing our floor plan facility (as amended, the “Floor Plan Facility”) entered into with Bank of America, N.A., as administrative agent, and other lenders party thereto, as amended from time to time. Pursuant to the Floor Plan Facility Amendment, the Floor Plan Facility allows the Floor Plan Borrower to borrow (a) up to $1.415 billion under a floor plan facility, (b) up to $15.0 million under a letter of credit facility and (c) up to a maximum amount outstanding of $35.0 million under the revolving line of credit, which maximum amount outstanding will decrease by $1.75 million on the last day of each fiscal quarter, commencing with the fiscal quarter ending March 31, 2019. In addition, the maturity of the Floor Plan Facility was extended to December 12, 2020. Borrowings under our Floor Plan Facility for Revolving Credit Loans bear interest at a rate per annum equal to, at our option, either: (a) a floating rate tied to the London Interbank Offered Rate (“LIBOR” and, together with the floating rate, the “Floating LIBOR Rate”), plus 2.40%, in the case of Floating LIBOR Rate loans, or (b) a base rate determined by reference to the greatest of: (i) the federal funds rate plus 0.50%, (ii) the prime rate published by Bank of
109
America, N.A. and (iii) the Floating LIBOR Rate plus 1.75%, plus 0.90%, in the case of base rate loans. As of December 31, 2017, $974.0 million in floor plan notes payable and $9.4 million of letters of credit were outstanding under the Floor Plan Facility. The following table details the outstanding amounts and available borrowings under our Floor Plan Facility as of December 31, 2017 (in thousands):
|
|
|
2017 |
|
2016 |
||
|
Floor Plan Facility |
|
|
|
|
|
|
|
Notes payable - floor plan: |
|
|
|
|
|
|
|
Total commitment |
|
$ |
1,415,000 |
|
$ |
1,165,000 |
|
Less: borrowings |
|
|
(974,043) |
|
|
(625,185) |
|
Less: flooring line aggregate interest reduction account |
|
|
(106,055) |
|
|
(68,469) |
|
Additional borrowing capacity |
|
|
334,902 |
|
|
471,346 |
|
Less: accounts payable for sold inventory |
|
|
(31,311) |
|
|
(21,692) |
|
Less: purchase commitments |
|
|
(77,144) |
|
|
(38,765) |
|
Unencumbered borrowing capacity |
|
$ |
226,447 |
|
$ |
410,889 |
Floor plan notes payable under our Floor Plan Facility bear interest at a rate per annum equal to, at our option, either: (a) a floating rate tied to the London Interbank Offered Rate (‘‘LIBOR’’ and, together with the floating rate, the ‘‘Floating LIBOR Rate’’), plus an applicable margin as set forth in the table below, in the case of Floating LIBOR Rate loans or (b) a base rate determined by reference to the greatest of: (i) the federal funds rate plus 0.50%, (ii) the prime rate published by Bank of America, N.A. (the ‘‘Boa Prime Rate’’), in the case of Floating LIBOR Rate borrowings and (iii) the Floating LIBOR Rate plus 1.75%, plus an applicable margin as set forth in the table below, in the case of base rate loans.
|
Pricing Level |
|
Consolidated Current Ratio |
|
Floating LIBOR Rate Loans |
|
Base Rate Loans |
|
I |
|
> 1.250 : 1.000 |
|
2.05% |
|
0.55% |
|
II |
|
> 1.220 : 1.000 but ≤ 1.250 : 1.000 |
|
2.15% |
|
0.65% |
|
III |
|
> 1.200 : 1.000 but ≤ 1.220 : 1.000 |
|
2.35% |
|
0.85% |
|
IV |
|
≤ 1.200 : 1.000 |
|
2.50% |
|
1.00% |
Borrowings under our Floor Plan Facility for letters of credit bear interest at a rate per annum equal to, at our option, either: (a) the Floating LIBOR Rate, plus 1.50%, in the case of Floating LIBOR Rate loans or (b) a base rate determined by reference to the greatest of: (i) the federal funds rate plus 0.50%, (ii) the Boa Prime Rate and (iii) the Floating LIBOR Rate plus 1.75%, plus 1.50%, in the case of base rate loans.
The Floor Plan Borrower and its subsidiary guarantors are required to pay commitment fees equal to: (i) 0.200% per annum times the actual daily amount by which the letter of credit facility exceeds the sum of the letter of credit obligations, and (ii) 0.200% per annum times the actual daily amount by which the Floor Plan Facility exceeds the sum of the outstanding amount of all floor plan loans. Letter of credit fees for each of letter of credit are equal to the higher of: (a) 2.25% times the daily amount available to be drawn under such letter of credit; and (b) $2,000 per annum.
In addition to other customary covenants, the credit agreement governing our Floor Plan Facility requires the Floor Plan Borrower and the subsidiary guarantors to comply on a monthly basis with a minimum consolidated current ratio of 1.180 to 1.000 and a minimum fixed charge coverage ratio of 1.250 to 1.000. As of December 31, 2017, the Floor Plan Borrower and the subsidiary guarantors were in compliance with each of these covenants.
Borrowings under the Floor Plan Facility are guaranteed by FreedomRoads Intermediate Holdco, LLC (the direct parent of the Floor Plan Borrower) and certain subsidiary guarantors (collectively, the ‘‘Guarantors’’). These floor plan arrangements grant the administrative agent a first priority security interest in all property of the floor plan Borrower and the Guarantors, the financed RVs and the related sales proceeds.”
110
Sale/Leaseback Arrangements
We have in the past and may in the future enter into sale‑leaseback transactions to finance certain property acquisitions and capital expenditures, pursuant to which we sell property and/or leasehold improvements to third parties and agree to lease those assets back for a certain period of time. Such sales generate proceeds which vary from period to period.
Deferred Revenue and Gains
Deferred revenue and gains consist of our sales for products not yet recognized as revenue at the end of a given period and deferred gains on sale‑leaseback and derecognition of right to use asset transactions. Our deferred revenue and deferred gains as of December 31, 2017 were $130.5 million and $11.2 million, respectively. Deferred revenue is expected to be recognized as revenue and deferred gains are expected to be recognized ratably over the lease terms as an offset to rent expense as set forth in the following table (in thousands):
|
|
|
2018 |
|
2019 |
|
2020 |
|
2021 |
|
2022 |
|
Thereafter |
|
Total |
|||||||
|
Deferred revenue |
|
$ |
76,522 |
|
$ |
26,349 |
|
$ |
12,222 |
|
$ |
5,687 |
|
$ |
2,910 |
|
$ |
6,820 |
|
$ |
130,510 |
|
Deferred gains |
|
|
1,147 |
|
|
1,147 |
|
|
1,147 |
|
|
1,147 |
|
|
1,147 |
|
|
5,485 |
|
|
11,220 |
|
Total |
|
$ |
77,669 |
|
$ |
27,496 |
|
$ |
13,369 |
|
$ |
6,834 |
|
$ |
4,057 |
|
$ |
12,305 |
|
$ |
141,730 |
Contractual Obligations
The following table sets forth our contractual obligations and commercial commitments as of December 31, 2017 (in thousands):
|
|
|
2018 |
|
2019 |
|
2020 |
|
2021 |
|
2022 |
|
Thereafter |
|
Total |
|||||||
|
Long-term debt, including current maturities |
|
$ |
9,465 |
|
$ |
9,465 |
|
$ |
9,465 |
|
$ |
9,465 |
|
$ |
9,465 |
|
$ |
889,758 |
|
$ |
937,083 |
|
Interest on long-term debt (1) |
|
|
41,895 |
|
|
42,317 |
|
|
42,855 |
|
|
43,160 |
|
|
43,581 |
|
|
37,590 |
|
|
251,398 |
|
Floor plan notes payable, net (2) |
|
|
974,043 |
|
|
— |
|
|
— |
|
|
— |
|
|
— |
|
|
— |
|
|
974,043 |
|
Operating leases |
|
|
101,271 |
|
|
98,374 |
|
|
91,460 |
|
|
87,771 |
|
|
83,844 |
|
|
712,155 |
|
|
1,174,875 |
|
Capital lease obligations |
|
|
844 |
|
|
23 |
|
|
— |
|
|
— |
|
|
— |
|
|
— |
|
|
867 |
|
Right to use liabilities (3) |
|
|
583 |
|
|
486 |
|
|
486 |
|
|
487 |
|
|
487 |
|
|
13,325 |
|
|
15,854 |
|
Purchase obligations (4) |
|
|
78,295 |
|
|
— |
|
|
— |
|
|
— |
|
|
— |
|
|
— |
|
|
78,295 |
|
Tax Receivable Agreement liability (5) |
|
|
8,093 |
|
|
10,335 |
|
|
7,013 |
|
|
7,128 |
|
|
7,278 |
|
|
97,842 |
|
|
137,689 |
|
Service agreements (6) |
|
|
4,071 |
|
|
4,315 |
|
|
4,557 |
|
|
4,801 |
|
|
4,170 |
|
|
— |
|
|
21,914 |
|
Marketing sponsorships (7) |
|
|
9,775 |
|
|
10,179 |
|
|
9,186 |
|
|
9,547 |
|
|
9,911 |
|
|
2,950 |
|
|
51,548 |
|
Total |
|
$ |
1,228,335 |
|
$ |
175,494 |
|
$ |
165,022 |
|
$ |
162,359 |
|
$ |
158,736 |
|
$ |
1,753,620 |
|
$ |
3,643,566 |
|
(1) |
We estimated interest payments through the maturity of our Existing Senior Secured Credit Facilities by applying the interest rate in effect as of December 31, 2017. See Note 7 — Long-Term Debt to our audited consolidated financial statements included in Part II, Item 8 of this Form 10-K for additional information. |
|
(2) |
Floor plan notes payable, net are revolving financing arrangements and the Floor Plan Facility matures on December 12, 2020. Payments are generally made as required pursuant to the Floor Plan Facility discussed above under “— Description of Senior Secured Credit Facilities and Floor Plan Facility — Floor Plan Facility.” |
|
(3) |
Amounts represent the future minimum lease payments under the right to use leases. See Note 9 — Right to Use Liability to our audited consolidated financial statements included in Part II, Item 8 of this Form 10-K for additional information. |
|
(4) |
Amount primarily represents purchase commitments relating to the procurement of RV inventories that have been approved by the Floor Plan Facility. See Note 3 — Inventories, net and Notes Payable — Floorplan to our audited consolidated financial statements included in Part II, Item 8 of this Form 10-K for additional information. |
|
(5) |
Amounts represent the estimated payments under the Tax Receivable Agreement. See Note 10 — Income Taxes to our audited consolidated financial statements included in Part II, Item 8 of this Form 10-K for additional information. |
|
(6) |
Service agreements are multi‑year agreements for services at agreed upon amounts for each year. See Note 12 — Commitments and Contingencies to our audited consolidated financial statements included in Part II, Item 8 of this Form 10-K for additional information. |
|
(7) |
Marketing sponsorship agreements are multi‑year sponsorship agreements at agreed upon amounts each year per the agreements. See Note 12 — Commitments and Contingencies to our audited consolidated financial statements included in Part II, Item 8 of this Form 10-K for additional information. |
111
Off‑Balance Sheet Arrangements
As of December 31, 2017, we did not have any off‑balance sheet arrangements, except for operating leases entered into in the normal course of business.
Recent Accounting Pronouncements
See discussion of recently adopted and recently issued accounting pronouncements in Note 1 — Summary of Significant Accounting Policies to our consolidated financial statements in Part II, Item 8 of this Form 10-K.
Critical Accounting Policies and Estimates
We prepare our consolidated financial statements in conformity with GAAP. The preparation of these financial statements requires us to make estimates and assumptions that affect the reported amounts of assets and liabilities and disclosure of contingent assets and liabilities at the date of the financial statements, and the reported amounts of revenue and expenses during the reporting period. Actual results could differ from those estimates. Critical accounting policies are those that management believes are both most important to the portrayal of our financial condition and operating results, and require management’s most difficult, subjective or complex judgments, often as a result of the need to make estimates about the effect of matters that are inherently uncertain. We base our estimates on historical experience, outside advice from parties believed to be experts in such matters, and on various other assumptions that are believed to be reasonable under the circumstances, the results of which form the basis for making judgments about the carrying value of assets and liabilities that are not readily apparent from other sources. Judgments and uncertainties affecting the application of those policies may result in materially different amounts being reported under different conditions or using different assumptions. Our significant accounting policies can be found in Note 1 — Summary of Significant Accounting Policies to our consolidated financial statements included in Part II, Item 8 of this Form 10-K. We consider the following policies to be the most critical in understanding the judgments that are involved in preparing our consolidated financial statements.
Revenue Recognition
Revenue is recognized when persuasive evidence of an arrangement exists, services or products have been provided to the customers, fees are fixed or determinable, and collectability is reasonably assured.
Consumer Services and Plans revenue consists of membership clubs, publications, consumer shows, and marketing and royalty fees from various Consumer Services and Plans. Certain Consumer Services and Plans revenue is generated from annual, multiyear and lifetime memberships. The revenue and expenses associated with these memberships are deferred and amortized over the membership period. Unearned revenue and profit are subject to revisions as the membership progresses to completion. Revisions to membership period estimates would change the amount of income and expense amortized in future accounting periods. For lifetime memberships, an 18‑year period is used, which is the actuarially determined estimated fulfillment period. Roadside Assistance (“RA”) revenues are deferred and recognized over the life of the membership. RA claim expenses are recognized when incurred.
Certain Consumer Services and Plans memberships may be sold bundled with a merchandise certificate to a Camping World retail location. The selling price of the membership is typically determined based on vendor specific objective evidence (“VSOE”) or, in the absence of VSOE, the selling price is determined by management's best estimate of selling price, which considers market and economic conditions, internal costs, pricing, and discounting practices. The selling price of the merchandise certificate is determined based management’s best estimated selling price, which considers the face value of the discount provided by the merchandise certificate and adjusts for the likelihood that the merchandise certificate will be redeemed. The bundled price is then allocated between the membership and merchandise certificate based on their relative selling prices.
112
Royalty revenue is earned under the terms of an arrangement with a third‑party credit card provider based on a percentage of our co‑branded credit card portfolio retail spend with such third‑party credit card provider.
Marketing fees for finance, insurance, extended service and other similar products are recognized, net of a reserve for estimated cancellations, if applicable, when a product contract payment has been received or financing has been arranged.
Promotional expenses, consisting primarily of direct‑mail advertising, are deferred and expensed over the period of expected future benefit, typically three months based on historical actual response rates. Renewal expenses are expensed at the time related materials are mailed.
Newsstand sales of publications and related expenses are recorded at the time of delivery, net of an estimated provision for returns. Subscription sales of publications are reflected in income over the lives of the subscriptions. The related selling expenses are expensed as incurred. Advertising revenues and related expenses are recorded at the time of delivery. Subscription and newsstand revenues and expenses related to annual publications are deferred until the publications are distributed.
Revenue and related expenses for consumer shows are recognized when the show occurs.
Retail revenue consists of sales of new and used vehicles, commissions on related finance and insurance contracts, and sales of parts, services and other products. Revenue from the sale of vehicles is recognized upon completion of the sale to the customer. Conditions to completing a sale include having an agreement with the customer, including pricing and the sales price must be reasonably expected to be collected and delivery has occurred.
Revenue from parts, services and other products sales is recognized when products are sold in the retail stores, shipped for mail and internet orders, or upon completion of the service.
Finance and insurance revenue is recognized when a finance and insurance product contract payment has been received or financing has been arranged. The proceeds we receive for arranging financing contracts, and selling insurance and service contracts, are subject to chargebacks if the customer terminates the respective contract earlier than a stated period. A reserve for chargebacks is recorded as a reduction of revenues in the period in which the related revenue is recognized.
Contracts in Transit
Contracts in transit consist of amounts due from non-affiliated financing institutions on retail finance contracts from vehicle sales for the portion of the vehicle sales price financed by our customers. Contracts in transit are included in current assets in our consolidated financial statements and totaled $46.2 million and $29.0 million as of December 31, 2017, and December 31, 2016, respectively.
Inventories, net
Retail inventories consist primarily of new and used vehicles held for sale valued using the specific‑identification method and valued at the lower of cost or net realizable value. Cost includes purchase costs, reconditioning costs, dealer‑installed accessories, and freight. For vehicles accepted in trades, the cost is the fair value of such used vehicles at the time of the trade‑in. Parts and accessories are valued at the lower of cost or net realizable value. Retail parts, accessories and other inventories primarily consist of retail travel and leisure specialty merchandise and are stated at lower of first‑in, first‑out cost or net realizable value.
In assessing lower of cost or net realizable value for inventory, we consider (i) the aging of the inventory item, (ii) historical sales experience of the inventory item, and (iii) current market conditions and trends for the inventory item. We also review and consider the following metrics related to sales of inventory items (both on a recent and longer‑term historical basis): (i) days of supply in our inventory, and (ii) average vehicle selling price if sold at less than original cost. We then determine the appropriate level of reserve
113
required to reduce our inventory to the lower of cost or market, and record the resulting adjustment in the period in which we determine a loss has occurred. If future demand or market conditions for our products are less favorable than forecasted or if unforeseen circumstances negatively impact the utility of inventory, we may be required to record additional write‑downs, which would negatively affect its results of operations in the period when the write‑downs are recorded.
Goodwill and Other Intangible Assets
Goodwill is reviewed at least annually for impairment, and more often when impairment indicators are present. We have the option to first assess qualitative factors to determine whether it is more likely than not that the fair value of a reporting unit is less than its net book value. The qualitative analysis used contains inherent uncertainties, including significant estimates and assumptions related to growth rates, projected earnings and cost of capital. We are subject to financial risk to the extent that our assets and goodwill become impaired due to deterioration of the underlying businesses. The risk of an asset impairment loss may increase to the extent the underlying businesses’ earnings or projected earnings decline. During the fourth quarter of 2017, we performed our annual impairment assessment of the carrying value of our goodwill. The fair value of our reporting units significantly exceeded the carrying value of its net assets. As a result, we were not required to conduct the second step of the impairment test for goodwill relating to our reporting units. See Note 5 — Goodwill and Intangible Assets to our audited consolidated financial statements included in Part II, Item 8 of this Form 10-K. Finite‑lived intangibles are recorded at cost, net of accumulated amortization and, if applicable, impairment charges. Finite lived intangible assets consist of membership and customer lists with weighted average useful lives of approximately 11.2 years, trademarks and trade names with weighted average useful lives of approximately 15.0 years, and websites with weighted-average useful lives of approximately 10.0 years. The weighted-average useful life of all our finite-lived intangible assists is approximately 12.4 years.
Long‑Lived Assets
Long‑lived assets included in property and equipment, including capitalized software costs to be held and used, are reviewed for impairment whenever events or changes in circumstances indicate that the carrying amount of an asset may not be recoverable. Impairment is recognized to the extent the sum of the discounted estimated future cash flows from the use of the asset is less than the carrying value. For our major software systems, such as our accounting and membership systems, our capitalized costs may include some internal or external costs to configure, install and test the software during the application development stage. We do not capitalize preliminary project costs, nor do we capitalize training, data conversion costs, maintenance or post‑development stage costs.
Self‑Insurance Program
Self‑insurance reserves represent amounts established as a result of insurance programs under which we self‑insure portions of the business risks. We carry substantial premium‑paid, traditional risk transfer insurance for various business risks. We self‑insure and establish reserves for the retention on workers’ compensation insurance, general liability, automobile liability, professional errors and omission liability, and employee health claims. The self‑insured claims liability was approximately $16.1 million and $11.3 million as of December 31, 2017 and 2016 respectively. The determination of such claims and expenses and the appropriateness of the related liability is reviewed on a periodic basis. The self‑insurance accruals are calculated by third-party actuaries and are based on claims filed and include estimates for claims incurred but not yet reported. Projections of losses, including incurred, but not reported losses, are inherently uncertain because of the random nature of insurance claims and could be substantially affected if occurrences and claims differ significantly from these assumptions and historical trends. In addition, we have obtained letters of credit as required by insurance carriers. As of December 31, 2017, 2016, and 2015, these letters of credit were approximately $12.2 million, $10.8 million and $10.4 million, respectively. This includes $8.9 million, $7.6 million and $6.8 million for the years ended December 31, 2017, 2016 and 2015, respectively, issued under the Floor Plan Facility (see Note 3 — Inventories, net and Notes Payable — Floor Plan, net to our audited consolidated financial statements included in Part II, Item 8 of this Form 10-K), and the balance issued under our Existing Senior Secured Credit Facilities and Previous Senior Secured Credit
114
Facilities, as applicable (see Note 7 — Long-Term Debt to our audited consolidated financial statements included in Part II, Item 8 of this Form 10-K).
Income Taxes
We apply the provisions of ASC Topic No. 740, “Income Taxes” (“ASC 740”). Under ASC 740, deferred tax assets and liabilities are determined based on differences between the financial reporting and tax bases of assets and liabilities and are measured using the enacted tax rates and laws that will be in effect when the differences are expected to reverse. We record a valuation allowance to reduce our deferred tax assets to the amount that is more likely than not to be realized. In evaluating our ability to recover our deferred tax assets, we consider all available positive and negative evidence, including our operating results, ongoing tax planning and forecasts of future taxable income on a jurisdiction-by-jurisdiction basis. In accordance with ASC 740, we recognize, in our consolidated financial statements, the impact of our tax positions that are more likely than not to be sustained upon examination based on the technical merits of the positions. The Company recognizes interest and penalties for uncertain tax positions in income tax expense.
We are subject to federal and state income taxes. Tax laws, regulations, and administrative practices in various jurisdictions may be subject to significant change, with or without notice, due to economic, political, and other conditions, and significant judgment is required in evaluating and estimating our provision and accruals for these taxes. In addition, a number of jurisdictions in which we are subject to tax are actively pursuing changes to their tax laws applicable to corporate taxpayers, such as the recently enacted 2017 Tax Act. The 2017 Tax Act was signed into law on December 22, 2017. The 2017 Tax Act significantly revises the U.S. corporate income tax by, among other things, lowering the statutory corporate tax rate from 35% to 21% and eliminating certain deductions. The 2017 Tax Act also enhanced and extended through 2026 the option to claim accelerated depreciation deductions on qualified property. As of December 31, 2017, we had not completed our accounting for the tax effects of the enactment of the 2017 Tax Act on our tax accruals. However, we have reasonably estimated the effects of the 2017 Tax Act and recorded provisional amounts in our financial statements as of December 31, 2017. The final impact of the 2017 Tax Act may differ from these estimates, due to, among other things, changes in interpretations, analysis and assumptions made by management, additional guidance that may be issued by the U.S. Department of the Treasury and the Internal Revenue Service, and any updates or changes to estimates the Company has utilized to calculate the transition impact. Therefore, the Company’s accounting for the elements of the 2017 Tax Act is incomplete. However, the Company was able to make reasonable estimates of the effects of the 2017 Tax Act. Pursuant to the SEC Staff Accounting Bulletin No. 118, the Company's measurement period for implementing the accounting changes required by the 2017 Tax Act will close before December 22, 2018 and the Company anticipates completing the accounting under ASC Topic 740, Income Taxes, in a subsequent reporting period within the measurement period.
We are subject to U.S. federal, state and local income taxes with respect to our allocable share of any taxable income of CWGS, LLC and are taxed at the prevailing corporate tax rates. CWGS, LLC is currently treated as a partnership for U.S. federal and most applicable state and local income tax purposes and, as such is generally not subject to any U.S. federal entity‑level income taxes with the exception of certain subsidiaries, which are Subchapter C corporations. Taxable income or loss of a partnership is passed through to and included in the taxable income of its owners for U.S. federal income tax purposes. However, CWGS, LLC may be liable for various other state and local taxes. Pursuant to the CWGS LLC Agreement, CWGS, LLC will generally make pro rata tax distributions to holders of common units in an amount sufficient to fund all or part of their tax obligations with respect to the taxable income of CWGS, LLC that is allocated to them.
Tax Receivable Agreement Liability
As described in Note 10 — Income Taxes to the consolidated financial statements included in Part II, Item 8 of this Form 10-K, we are a party to the Tax Receivable Agreement under which we are contractually committed to pay the Continuing Equity Owners 85% of the amount of any tax benefits that we actually realize, or in some cases are deemed to realize, as a result of certain transactions (the “TRA Payments”). Amounts payable under the Tax Receivable Agreement are contingent upon, among other things, (i) generation of future taxable income over the term of the Tax Receivable Agreement and (ii) future changes in
115
tax laws. If we do not generate sufficient taxable income in the aggregate over the term of the Tax Receivable Agreement to utilize the tax benefits, then we would not be required to make the related TRA Payments. Therefore, we would only recognize a liability for TRA Payments if we determine if it is probable that we will generate sufficient future taxable income over the term of the Tax Receivable Agreement to utilize the related tax benefits. Estimating future taxable income is inherently uncertain and requires judgment. In projecting future taxable income, we consider our historical results and incorporate certain assumptions, including projected retail location openings, revenue growth, and operating margins, among others. As of December 31, 2017, our Tax Receivable Agreement liability was recorded at $137.7 million after reducing the liability by $99.7 million to reflect our future tax benefit primarily as a result of the reduction in the federal tax rate due to the 2017 Tax Act and concluding it was probable that we would have sufficient future taxable income to utilize the related tax benefits. If we determine in the future that we will not be able to fully utilize all or part of the related tax benefits, we would derecognize the portion of the liability related the benefits not expected to be utilized.
Additionally, we estimate the amount of TRA Payments expected to be paid within the next 12 months and classify this amount as current on our Consolidated Balance Sheets. This determination is based on our estimate of taxable income for the next fiscal year. To the extent our estimate differs from actual results, we may be required reclassify portions of our liabilities under the Tax Receivable Agreement between current and non-current.
Vendor Allowances
As a component of our consolidated procurement program, we frequently enter into contracts with vendors that provide for payments of rebates or other allowances. These vendor payments are reflected in the carrying value of the inventory when earned or as progress is made toward earning the rebate or allowance and as a component of cost of sales as the inventory is sold. Certain of these vendor contracts provide for rebates and other allowances that are contingent upon our meeting specified performance measures such as a cumulative level of purchases over a specified period of time. Such contingent rebates and other allowances are given accounting recognition at the point at which achievement of the specified performance measures are deemed to be probable and reasonably estimable.
ITEM 7a. QUANTITATIVE AND QUALITATIVE DISCLOSURES OF MARKET RISK
We are exposed to market risk from changes in inflation and interest rates. All of these market risks arise in the normal course of business, as we do not engage in speculative trading activities. The following analysis provides quantitative information regarding these risks.
Impact of Inflation
We believe that inflation over the last three fiscal years has not had a significant impact on our operations; however, we cannot assure you there will be no such effect in the future. Our leases require us to pay taxes, maintenance, repairs, insurance and utilities, all of which are generally subject to inflationary increases. Additionally, the cost of remodeling acquired retail locations and constructing new retail locations is subject to inflationary increase in the costs of labor and material, which results in higher rent expense on new retail locations. Finally, we finance substantially all of our inventory through various revolving floor plan arrangements with interest rates that vary based on various benchmarks. Such rates have historically increased during periods of increasing inflation.
Interest Rate Risk
Our operating results are subject to risk from interest rate fluctuations on our Existing Senior Secured Credit Facilities and our Floor Plan Facility, which carries variable interest rates. Interest rate risk is the exposure to loss resulting from changes in the level of interest rates and the spread between different interest rates. Our Existing Senior Secured Credit Facilities includes the Existing Term Loan Facility and the Existing Revolving Credit Facility with advances tied to a borrowing base and which bear interest at variable rates. Additionally, under our Floor Plan Facilities we have the ability to draw on revolving floor plan arrangements, which bear interest at variable rates. Because our Existing Senior Secured Credit Facilities and Floor Plan
116
Facility bear interest at variable rates, we are exposed to market risks relating to changes in interest rates. Interest rate risk is highly sensitive due to many factors, including U.S. monetary and tax policies, U.S. and international economic factors and other factors beyond our control. As of December 31, 2017, we had no outstanding borrowings under our Existing Revolving Credit Facility aside from letters of credit in the aggregate amount of $3.2 million outstanding under the Existing Revolving Credit Facility, $916.9 million of variable rate debt outstanding under our Existing Term Loan Facility, net of $6.0 million of unamortized original issue discount and $14.2 million of finance costs, and $974.0 million in outstanding borrowings under our Floor Plan Facility. Based on December 31, 2017 debt levels, an increase or decrease of 1% in the effective interest rate would cause an increase or decrease in interest expense under our Existing Term Loan Facility of $9.5 million and $6.1 million (due to our interest rate floor), respectively, over the next 12 months and an increase or decrease of 1% in the effective rate would cause an increase or decrease in interest under our Floor Plan Facility of approximately $9.7 million over the next 12 months. We do not use derivative financial instruments for speculative or trading purposes, but this does not preclude our adoption of specific hedging strategies in the future.
117
ITEM 8. FINANCIAL STATEMENTS AND SUPPLEMENTARY DATA
Camping World Holdings, Inc. and Subsidiaries
Consolidated Financial Statements
Years Ended December 31, 2017, 2016, and 2015
Contents
| 119 | |
|
|
|
|
Consolidated Financial Statements |
|
| 120 | |
| 121 | |
|
Consolidated Statements of Stockholders’ and Members’ Equity (Deficit) |
122 |
| 124 | |
| 126 |
118
Report of Independent Registered Public Accounting Firm
To the Stockholders and the Board of Directors of Camping World Holdings, Inc. and subsidiaries
Opinion on the Financial Statements
We have audited the accompanying consolidated balance sheets of Camping World Holdings, Inc. and subsidiaries (the Company) as of December 31, 2017 and 2016 (Restated), the related consolidated statements of income, stockholders’ and members’ equity (deficit) and cash flows, for each of the three years in the period ended December 31, 2017, and the related notes and the financial statement schedules listed in the Index at Item 15(a)(2) (collectively referred to as the “consolidated financial statements”). In our opinion, the consolidated financial statements present fairly, in all material respects, the financial position of the Company at December 31, 2017 and 2016 (Restated), and the results of its operations and its cash flows for each of the three years in the period ended December 31, 2017, in conformity with U.S. generally accepted accounting principles.
We also have audited, in accordance with the standards of the Public Company Accounting Oversight Board (United States) (PCAOB), the Company's internal control over financial reporting as of December 31, 2017, based on criteria established in Internal Control-Integrated Framework issued by the Committee of Sponsoring Organizations of the Treadway Commission (2013 framework) and our report dated March 13, 2018 expressed an adverse opinion thereon.
Restatement of 2016 Financial Statements
As discussed in Note 1 to the consolidated financial statements, the 2016 consolidated financial statements have been restated to correct a misstatement.
Basis for Opinion
These financial statements are the responsibility of the Company's management. Our responsibility is to express an opinion on the Company’s financial statements based on our audits. We are a public accounting firm registered with the PCAOB and are required to be independent with respect to the Company in accordance with the U.S. federal securities laws and the applicable rules and regulations of the Securities and Exchange Commission and the PCAOB.
We conducted our audits in accordance with the standards of the PCAOB. Those standards require that we plan and perform the audit to obtain reasonable assurance about whether the financial statements are free of material misstatement, whether due to error or fraud. Our audits included performing procedures to assess the risks of material misstatement of the financial statements, whether due to error or fraud, and performing procedures that respond to those risks. Such procedures included examining, on a test basis, evidence regarding the amounts and disclosures in the financial statements. Our audits also included evaluating the accounting principles used and significant estimates made by management, as well as evaluating the overall presentation of the financial statements. We believe that our audits provide a reasonable basis for our opinion.
/s/ Ernst & Young LLP
We have served as the Company’s auditor since 2013.
Los Angeles, California
March 13, 2018
119
Camping World Holdings, Inc. and Subsidiaries
(In Thousands Except Share and Per Share Amounts)
|
|
|
December 31, |
|
December 31, |
||
|
|
|
2017 |
|
2016 |
||
|
|
|
|
|
Restated |
||
|
Assets |
|
|
|
|
|
|
|
Current assets: |
|
|
|
|
|
|
|
Cash and cash equivalents |
|
$ |
224,163 |
|
$ |
114,196 |
|
Contracts in transit |
|
|
46,227 |
|
|
29,012 |
|
Accounts receivable, less allowance for doubtful accounts of $2,700 and $2,920 in 2017 and 2016, respectively |
|
|
79,881 |
|
|
58,488 |
|
Inventories, net |
|
|
1,415,915 |
|
|
902,711 |
|
Prepaid expenses and other assets |
|
|
32,721 |
|
|
21,755 |
|
Total current assets |
|
|
1,798,907 |
|
|
1,126,162 |
|
Property and equipment, net |
|
|
198,022 |
|
|
130,760 |
|
Deferred tax assets, net |
|
|
155,551 |
|
|
24,433 |
|
Intangibles assets, net |
|
|
38,707 |
|
|
3,386 |
|
Goodwill |
|
|
348,387 |
|
|
153,105 |
|
Other assets |
|
|
21,903 |
|
|
17,931 |
|
Total assets |
|
$ |
2,561,477 |
|
$ |
1,455,777 |
|
Liabilities and stockholders' equity (deficit) |
|
|
|
|
|
|
|
Current liabilities: |
|
|
|
|
|
|
|
Accounts payable |
|
$ |
125,616 |
|
$ |
68,655 |
|
Accrued liabilities |
|
|
101,929 |
|
|
78,044 |
|
Deferred revenues and gains |
|
|
77,669 |
|
|
71,128 |
|
Current portion of capital lease obligations |
|
|
844 |
|
|
1,224 |
|
Current portion of Tax Receivable Agreement liability |
|
|
8,093 |
|
|
991 |
|
Current portion of long-term debt |
|
|
9,465 |
|
|
6,450 |
|
Notes payable – floor plan, net |
|
|
974,043 |
|
|
625,185 |
|
Other current liabilities |
|
|
22,510 |
|
|
16,745 |
|
Total current liabilities |
|
|
1,320,169 |
|
|
868,422 |
|
Capital lease obligations, net of current portion |
|
|
23 |
|
|
841 |
|
Right to use liability |
|
|
10,193 |
|
|
10,343 |
|
Tax Receivable Agreement liability, net of current portion |
|
|
129,596 |
|
|
18,190 |
|
Long-term debt, net of current portion |
|
|
907,437 |
|
|
620,303 |
|
Deferred revenues and gains |
|
|
64,061 |
|
|
57,659 |
|
Other long-term liabilities |
|
|
39,161 |
|
|
24,156 |
|
Total liabilities |
|
|
2,470,640 |
|
|
1,599,914 |
|
Commitments and contingencies |
|
|
|
|
|
|
|
Stockholders' equity (deficit): |
|
|
|
|
|
|
|
Preferred stock, par value $0.01 per share – 20,000,000 shares authorized; none issued and outstanding as of December 31, 2017 and December 31, 2016 |
|
|
— |
|
|
— |
|
Class A common stock, par value $0.01 per share – 250,000,000 shares authorized; 36,758,233 issued and 36,749,072 outstanding as of December 31, 2017 and 18,935,916 issued and outstanding as of December 31, 2016 |
|
|
367 |
|
|
189 |
|
Class B common stock, par value $0.0001 per share – 75,000,000 shares authorized; 69,066,445 issued; and 50,836,629 outstanding as of December 31, 2017 and 62,002,729 outstanding as of December 31, 2016 |
|
|
5 |
|
|
6 |
|
Class C common stock, par value $0.0001 per share – one share authorized, issued and outstanding as of December 31, 2017 and December 31, 2016 |
|
|
— |
|
|
— |
|
Additional paid-in capital |
|
|
49,941 |
|
|
(30,006) |
|
Retained earnings |
|
|
6,192 |
|
|
71 |
|
Total stockholders' equity (deficit) attributable to Camping World Holdings, Inc. |
|
|
56,505 |
|
|
(29,740) |
|
Non-controlling interests |
|
|
34,332 |
|
|
(114,397) |
|
Total stockholders' equity (deficit) |
|
|
90,837 |
|
|
(144,137) |
|
Total liabilities and stockholders' equity (deficit) |
|
$ |
2,561,477 |
|
$ |
1,455,777 |
See accompanying Notes to Consolidated Financial Statements
120
Camping World Holdings, Inc. and Subsidiaries
Consolidated Statements of Income
(In Thousands Except Per Share Amounts)
|
|
|
Year Ended December 31, |
|
|||||||
|
|
|
2017 |
|
2016 |
|
2015 |
|
|||
|
|
|
|
|
Restated |
|
|
|
|||
|
Revenue: |
|
|
|
|
|
|
|
|
|
|
|
Consumer services and plans |
|
$ |
195,614 |
|
$ |
184,773 |
|
$ |
174,600 |
|
|
Retail |
|
|
|
|
|
|
|
|
|
|
|
New vehicles |
|
|
2,435,928 |
|
|
1,862,195 |
|
|
1,603,258 |
|
|
Used vehicles |
|
|
668,860 |
|
|
703,326 |
|
|
803,879 |
|
|
Parts, services and other |
|
|
652,819 |
|
|
540,019 |
|
|
507,810 |
|
|
Finance and insurance, net |
|
|
332,034 |
|
|
228,684 |
|
|
189,270 |
|
|
Subtotal |
|
|
4,089,641 |
|
|
3,334,224 |
|
|
3,104,217 |
|
|
Total revenue |
|
|
4,285,255 |
|
|
3,518,997 |
|
|
3,278,817 |
|
|
Costs applicable to revenue (exclusive of depreciation and amortization shown separately below): |
|
|
|
|
|
|
|
|
|
|
|
Consumer services and plans |
|
|
81,822 |
|
|
79,272 |
|
|
81,749 |
|
|
Retail |
|
|
|
|
|
|
|
|
|
|
|
New vehicles |
|
|
2,086,229 |
|
|
1,596,863 |
|
|
1,375,163 |
|
|
Used vehicles |
|
|
506,093 |
|
|
557,253 |
|
|
647,889 |
|
|
Parts, services and other |
|
|
364,772 |
|
|
289,186 |
|
|
274,989 |
|
|
Subtotal |
|
|
2,957,094 |
|
|
2,443,302 |
|
|
2,298,041 |
|
|
Total costs applicable to revenue |
|
|
3,038,916 |
|
|
2,522,574 |
|
|
2,379,790 |
|
|
Operating expenses: |
|
|
|
|
|
|
|
|
|
|
|
Selling, general, and administrative |
|
|
853,160 |
|
|
691,884 |
|
|
634,890 |
|
|
Debt restructure expense |
|
|
387 |
|
|
1,218 |
|
|
— |
|
|
Depreciation and amortization |
|
|
31,545 |
|
|
24,695 |
|
|
24,101 |
|
|
Gain on sale of assets |
|
|
(133) |
|
|
(564) |
|
|
(237) |
|
|
Total operating expenses |
|
|
884,959 |
|
|
717,233 |
|
|
658,754 |
|
|
Income from operations |
|
|
361,380 |
|
|
279,190 |
|
|
240,273 |
|
|
Other income (expense): |
|
|
|
|
|
|
|
|
|
|
|
Floor plan interest expense |
|
|
(27,690) |
|
|
(18,854) |
|
|
(11,248) |
|
|
Other interest expense, net |
|
|
(42,959) |
|
|
(48,318) |
|
|
(53,377) |
|
|
Loss on debt restructure |
|
|
(462) |
|
|
(5,052) |
|
|
— |
|
|
Tax Receivable Agreement liability adjustment |
|
|
99,687 |
|
|
— |
|
|
— |
|
|
Other expense, net |
|
|
— |
|
|
— |
|
|
1 |
|
|
|
|
|
28,576 |
|
|
(72,224) |
|
|
(64,624) |
|
|
Income before income taxes |
|
|
389,956 |
|
|
206,966 |
|
|
175,649 |
|
|
Income tax expense |
|
|
(156,982) |
|
|
(5,907) |
|
|
(1,356) |
|
|
Net income |
|
|
232,974 |
|
|
201,059 |
|
|
174,293 |
|
|
Less: net income attributable to non-controlling interests |
|
|
(204,612) |
|
|
(9,942) |
|
|
— |
|
|
Net income attributable to Camping World Holdings, Inc. |
|
$ |
28,362 |
|
$ |
191,117 |
|
$ |
174,293 |
|
|
|
|
|
|
|
|
|
|
|
|
|
|
Earnings per share of Class A common stock (1): |
|
|
|
|
|
|
|
|
|
|
|
Basic |
|
$ |
1.07 |
|
$ |
0.08 |
|
|
|
|
|
Diluted |
|
$ |
1.07 |
|
$ |
0.07 |
|
|
|
|
|
Weighted average shares of Class A common stock outstanding (1): |
|
|
|
|
|
|
|
|
|
|
|
Basic |
|
|
26,622 |
|
|
18,766 |
|
|
|
|
|
Diluted |
|
|
26,622 |
|
|
83,602 |
|
|
|
|
|
|
|
|
|
|
|
|
|
|
|
|
|
Dividends declared per share |
|
|
0.74 |
|
|
0.08 |
|
|
|
|
|
(1) |
Basic and diluted earnings per Class A common stock is applicable only for periods after the Company’s IPO. See Note 21 — Earnings Per Share. |
See accompanying Notes to Consolidated Financial Statements
121
Camping World Holdings, Inc. and Subsidiaries
Consolidated Statements of Stockholders’ and Members’ Equity (Deficit)
(In Thousands Except Unit Amounts)
|
|
|
|
|
|
|
|
|
|
|
|
|
|
|
|
|
|
|
|
|
|
|
|
|
|
Additional |
|
Retained |
|
Non- |
|
|
|
|||
|
|
|
Member Units |
|
Members' |
|
Class A Common Stock |
|
Class B Common Stock |
|
Class C Common Stock |
|
Paid-In |
|
Earnings |
|
Controlling |
|
|
|
||||||||||||||||
|
|
|
Units |
|
Amounts |
|
Deficit |
|
Shares |
|
Amounts |
|
Shares |
|
Amounts |
|
Shares |
|
Amounts |
|
Capital |
|
(Deficit) |
|
Interest |
|
Total |
|||||||||
|
Balance at January 1, 2015 |
|
154,401 |
|
|
— |
|
|
(250,675) |
|
— |
|
|
— |
|
— |
|
|
— |
|
— |
|
|
— |
|
|
— |
|
|
— |
|
|
— |
|
$ |
(250,675) |
|
Net income |
|
— |
|
|
— |
|
|
174,293 |
|
— |
|
|
— |
|
— |
|
|
— |
|
— |
|
|
— |
|
|
— |
|
|
— |
|
|
— |
|
|
174,293 |
|
Membership units issued |
|
1,158 |
|
|
— |
|
|
— |
|
— |
|
|
— |
|
— |
|
|
— |
|
— |
|
|
— |
|
|
— |
|
|
— |
|
|
— |
|
|
— |
|
Members' distributions |
|
— |
|
|
— |
|
|
(230,777) |
|
— |
|
|
— |
|
— |
|
|
— |
|
— |
|
|
— |
|
|
— |
|
|
— |
|
|
— |
|
|
(230,777) |
|
Balance at December 31, 2015 |
|
155,559 |
|
|
— |
|
|
(307,159) |
|
— |
|
|
— |
|
— |
|
|
— |
|
— |
|
|
— |
|
|
— |
|
|
— |
|
|
— |
|
|
(307,159) |
|
Net income prior to the Reorganization Transactions (Restated) |
|
— |
|
|
— |
|
|
189,531 |
|
— |
|
|
— |
|
— |
|
|
— |
|
— |
|
|
— |
|
|
— |
|
|
— |
|
|
— |
|
|
189,531 |
|
Membership units redeemed prior to the Reorganization Transactions |
|
(1,763) |
|
|
— |
|
|
(17,000) |
|
— |
|
|
— |
|
— |
|
|
— |
|
— |
|
|
— |
|
|
— |
|
|
— |
|
|
— |
|
|
(17,000) |
|
Members' distributions prior to the Reorganization Transactions |
|
— |
|
|
— |
|
|
(197,922) |
|
— |
|
|
— |
|
— |
|
|
— |
|
— |
|
|
— |
|
|
— |
|
|
— |
|
|
— |
|
|
(197,922) |
|
Non-cash distributions prior to the Reorganization Transactions |
|
— |
|
|
— |
|
|
(38,838) |
|
— |
|
|
— |
|
— |
|
|
— |
|
— |
|
|
— |
|
|
— |
|
|
— |
|
|
— |
|
|
(38,838) |
|
Equity-based compensation recognized prior to the Reorganization Transactions |
|
— |
|
|
— |
|
|
949 |
|
— |
|
|
— |
|
— |
|
|
— |
|
— |
|
|
— |
|
|
— |
|
|
— |
|
|
— |
|
|
949 |
|
Effect of the Reorganization Transactions (Restated) |
|
(153,796) |
|
|
— |
|
|
370,439 |
|
7,064 |
|
|
71 |
|
62,003 |
|
|
6 |
|
— |
|
|
— |
|
|
(21,887) |
|
|
— |
|
|
(334,047) |
|
|
14,582 |
|
Issuance of Class A common stock sold in initial public offering, net of underwriting discounts, commissions and offering costs |
|
— |
|
|
— |
|
|
— |
|
11,872 |
|
|
118 |
|
— |
|
|
— |
|
— |
|
|
— |
|
|
233,958 |
|
|
— |
|
|
— |
|
|
234,076 |
|
Non-controlling interest adjustment for purchase of common units from CWGS, LLC with proceeds from initial public offering (Restated) |
|
— |
|
|
— |
|
|
— |
|
— |
|
|
— |
|
— |
|
|
— |
|
— |
|
|
— |
|
|
(234,486) |
|
|
— |
|
|
234,486 |
|
|
— |
|
Equity-based compensation recognized subsequent to Reorganization Transactions |
|
— |
|
|
— |
|
|
— |
|
— |
|
|
— |
|
— |
|
|
— |
|
— |
|
|
— |
|
|
648 |
|
|
— |
|
|
— |
|
|
648 |
|
Distributions to holders of LLC Units |
|
— |
|
|
— |
|
|
— |
|
— |
|
|
— |
|
— |
|
|
— |
|
— |
|
|
— |
|
|
— |
|
|
— |
|
|
(21,223) |
|
|
(21,223) |
|
Dividends subsequent to the Reorganization Transactions |
|
— |
|
|
— |
|
|
— |
|
— |
|
|
— |
|
— |
|
|
— |
|
— |
|
|
— |
|
|
— |
|
|
(1,515) |
|
|
— |
|
|
(1,515) |
|
Establishment of liabilities under the Tax Receivable Agreement and related changes to deferred tax assets associated with that liability |
|
— |
|
|
— |
|
|
— |
|
— |
|
|
— |
|
— |
|
|
— |
|
— |
|
|
— |
|
|
(11,794) |
|
|
— |
|
|
— |
|
|
(11,794) |
|
Non-controlling interest adjustment (Restated) |
|
— |
|
|
— |
|
|
— |
|
— |
|
|
— |
|
— |
|
|
— |
|
— |
|
|
— |
|
|
3,555 |
|
|
— |
|
|
(3,555) |
|
|
— |
|
Net income subsequent to the Reorganization Transactions (Restated) |
|
— |
|
|
— |
|
|
— |
|
— |
|
|
— |
|
— |
|
|
— |
|
— |
|
|
— |
|
|
— |
|
|
1,586 |
|
|
9,942 |
|
|
11,528 |
|
Balance at December 31, 2016 (Restated) |
|
— |
|
|
— |
|
|
— |
|
18,936 |
|
|
189 |
|
62,003 |
|
|
6 |
|
— |
|
|
— |
|
|
(30,006) |
|
|
71 |
|
|
(114,397) |
|
|
(144,137) |
|
Issuance of Class A common stock sold in a public offering, net of underwriting discounts, commissions and offering costs |
|
— |
|
|
— |
|
|
— |
|
4,600 |
|
|
46 |
|
— |
|
|
— |
|
— |
|
|
— |
|
|
121,203 |
|
|
— |
|
|
— |
|
|
121,249 |
|
Non-controlling interest adjustment for purchase of common units from CWGS, LLC with proceeds from a public offering |
|
— |
|
|
— |
|
|
— |
|
— |
|
|
— |
|
— |
|
|
— |
|
— |
|
|
— |
|
|
(87,203) |
|
|
— |
|
|
87,203 |
|
|
— |
|
Issuance of Class A common stock for an acquisition by a subsidiary |
|
— |
|
|
— |
|
|
— |
|
164 |
|
|
1 |
|
— |
|
|
— |
|
— |
|
|
— |
|
|
5,719 |
|
|
— |
|
|
— |
|
|
5,720 |
|
Non-controlling interest adjustment for capital contribution of Class A common stock for an acquisition by a subsidiary |
|
— |
|
|
— |
|
|
— |
|
— |
|
|
— |
|
— |
|
|
— |
|
— |
|
|
— |
|
|
(3,678) |
|
|
— |
|
|
3,678 |
|
|
— |
|
Equity-based compensation |
|
— |
|
|
— |
|
|
— |
|
— |
|
|
— |
|
— |
|
|
— |
|
— |
|
|
— |
|
|
5,109 |
|
|
— |
|
|
— |
|
|
5,109 |
|
Exercise of stock options |
|
— |
|
|
— |
|
|
— |
|
80 |
|
|
1 |
|
— |
|
|
— |
|
— |
|
|
— |
|
|
1,731 |
|
|
— |
|
|
— |
|
|
1,732 |
|
Non-controlling interest adjustment for capital contribution of proceeds from the exercise of stock options |
|
— |
|
|
— |
|
|
— |
|
— |
|
|
— |
|
— |
|
|
— |
|
— |
|
|
— |
|
|
(970) |
|
|
— |
|
|
970 |
|
|
— |
122
|
|
|
|
|
|
|
|
|
|
|
|
|
|
|
|
|
|
|
|
|
|
|
|
|
|
Additional |
|
Retained |
|
Non- |
|
|
|
|||
|
|
|
Member Units |
|
Members' |
|
Class A Common Stock |
|
Class B Common Stock |
|
Class C Common Stock |
|
Paid-In |
|
Earnings |
|
Controlling |
|
|
|
||||||||||||||||
|
|
|
Units |
|
Amounts |
|
Deficit |
|
Shares |
|
Amounts |
|
Shares |
|
Amounts |
|
Shares |
|
Amounts |
|
Capital |
|
(Deficit) |
|
Interest |
|
Total |
|||||||||
|
Vesting of restricted stock units |
|
— |
|
|
— |
|
|
— |
|
33 |
|
|
— |
|
— |
|
|
— |
|
— |
|
|
— |
|
|
257 |
|
|
— |
|
|
(257) |
|
|
— |
|
Repurchases of Class A common stock for withholding taxes on vested RSUs |
|
— |
|
|
— |
|
|
— |
|
(9) |
|
|
— |
|
— |
|
|
— |
|
— |
|
|
— |
|
|
(368) |
|
|
— |
|
|
— |
|
|
(368) |
|
Redemption of LLC common units for Class A common stock |
|
— |
|
|
— |
|
|
— |
|
12,945 |
|
|
130 |
|
(11,166) |
|
|
(1) |
|
— |
|
|
— |
|
|
175,487 |
|
|
— |
|
|
(881) |
|
|
174,735 |
|
Distributions to holders of LLC common units |
|
— |
|
|
— |
|
|
— |
|
— |
|
|
— |
|
— |
|
|
— |
|
— |
|
|
— |
|
|
— |
|
|
— |
|
|
(149,633) |
|
|
(149,633) |
|
Dividends |
|
— |
|
|
— |
|
|
— |
|
— |
|
|
— |
|
— |
|
|
— |
|
— |
|
|
— |
|
|
— |
|
|
(22,241) |
|
|
— |
|
|
(22,241) |
|
Establishment of liabilities under the Tax Receivable Agreement and related changes to deferred tax assets associated with that liability |
|
— |
|
|
— |
|
|
— |
|
— |
|
|
— |
|
— |
|
|
— |
|
— |
|
|
— |
|
|
(134,303) |
|
|
— |
|
|
— |
|
|
(134,303) |
|
Non-controlling interest adjustment |
|
— |
|
|
— |
|
|
— |
|
— |
|
|
— |
|
— |
|
|
— |
|
— |
|
|
— |
|
|
(3,037) |
|
|
— |
|
|
3,037 |
|
|
— |
|
Net income |
|
— |
|
|
— |
|
|
— |
|
— |
|
|
— |
|
— |
|
|
— |
|
— |
|
|
— |
|
|
— |
|
|
28,362 |
|
|
204,612 |
|
|
232,974 |
|
Balance at December 31, 2017 |
|
— |
|
$ |
— |
|
$ |
— |
|
36,749 |
|
$ |
367 |
|
50,837 |
|
$ |
5 |
|
— |
|
$ |
— |
|
$ |
49,941 |
|
$ |
6,192 |
|
$ |
34,332 |
|
$ |
90,837 |
See accompanying Notes to Consolidated Financial Statements
123
Camping World Holdings, Inc. and Subsidiaries
Consolidated Statements of Cash Flows
(In Thousands)
|
|
|
Year Ended December 31, |
|
|||||||
|
|
|
2017 |
|
2016 |
|
2015 |
|
|||
|
|
|
|
|
Restated |
|
|
|
|||
|
Operating activities |
|
|
|
|
|
|
|
|
|
|
|
Net income |
|
$ |
232,974 |
|
$ |
201,059 |
|
$ |
174,293 |
|
|
|
|
|
|
|
|
|
|
|
|
|
|
Adjustments to reconcile net income to net cash (used in) provided by operating activities: |
|
|
|
|
|
|
|
|
|
|
|
Depreciation and amortization |
|
|
31,545 |
|
|
24,695 |
|
|
24,101 |
|
|
Equity-based compensation |
|
|
5,109 |
|
|
1,597 |
|
|
— |
|
|
Loss on debt restructure |
|
|
462 |
|
|
5,052 |
|
|
— |
|
|
Gain on sale of assets |
|
|
(133) |
|
|
(564) |
|
|
(237) |
|
|
Provision for losses on accounts receivable |
|
|
839 |
|
|
1,332 |
|
|
2,180 |
|
|
Accretion of original issue discount |
|
|
942 |
|
|
1,127 |
|
|
1,010 |
|
|
Non-cash interest expense |
|
|
4,360 |
|
|
4,543 |
|
|
5,897 |
|
|
Deferred income taxes |
|
|
124,622 |
|
|
3,765 |
|
|
(181) |
|
|
Tax Receivable Agreement liability adjustment |
|
|
(99,687) |
|
|
— |
|
|
— |
|
|
Change in assets and liabilities, net of acquisitions: |
|
|
|
|
|
|
|
|
|
|
|
Receivables and contracts in transit |
|
|
(38,019) |
|
|
(10,932) |
|
|
(8,840) |
|
|
Inventories |
|
|
(342,780) |
|
|
(30,964) |
|
|
(108,899) |
|
|
Prepaid expenses and other assets |
|
|
(11,827) |
|
|
(4,625) |
|
|
(6,944) |
|
|
Checks in excess of bank balance |
|
|
6,585 |
|
|
(7,478) |
|
|
6,192 |
|
|
Accounts payable and other accrued expenses |
|
|
53,646 |
|
|
12,310 |
|
|
17,686 |
|
|
Payment pursuant to tax receivable agreement |
|
|
(203) |
|
|
— |
|
|
— |
|
|
Accrued rent for cease-use locations |
|
|
(91) |
|
|
945 |
|
|
420 |
|
|
Deferred revenue and gains |
|
|
12,943 |
|
|
6,143 |
|
|
5,397 |
|
|
Other, net |
|
|
9,619 |
|
|
7,686 |
|
|
68 |
|
|
Net cash (used in) provided by operating activities |
|
|
(9,094) |
|
|
215,691 |
|
|
112,143 |
|
|
|
|
|
|
|
|
|
|
|
|
|
|
Investing activities |
|
|
|
|
|
|
|
|
|
|
|
Purchases of property and equipment |
|
|
(66,780) |
|
|
(39,782) |
|
|
(41,437) |
|
|
Purchase of real property |
|
|
(21,212) |
|
|
(17,077) |
|
|
(30,272) |
|
|
Proceeds from the sale of real property |
|
|
6,000 |
|
|
15,892 |
|
|
19,425 |
|
|
Purchases of businesses, net of cash acquired |
|
|
(392,956) |
|
|
(78,606) |
|
|
(125,189) |
|
|
Proceeds from sale of property and equipment |
|
|
795 |
|
|
3,870 |
|
|
1,273 |
|
|
Purchase of intangible assets |
|
|
(1,523) |
|
|
— |
|
|
— |
|
|
Net cash used in investing activities |
|
$ |
(475,676) |
|
$ |
(115,703) |
|
$ |
(176,200) |
|
124
Camping World Holdings, Inc. and Subsidiaries
Consolidated Statements of Cash Flows (continued)
(In Thousands)
|
|
|
Year Ended December 31, |
|
|||||||
|
|
|
2017 |
|
2016 |
|
2015 |
|
|||
|
|
|
|
|
Restated |
|
|
|
|||
|
Financing activities |
|
|
|
|
|
|
|
|
|
|
|
Proceeds from long-term debt |
|
$ |
299,246 |
|
$ |
188,137 |
|
$ |
148,938 |
|
|
Payments on long-term debt |
|
|
(7,916) |
|
|
(288,520) |
|
|
(36,647) |
|
|
Net borrowings on notes payable – floor plan, net |
|
|
358,478 |
|
|
34,785 |
|
|
167,387 |
|
|
Borrowings on revolver |
|
|
— |
|
|
12,000 |
|
|
— |
|
|
Payments on revolver |
|
|
— |
|
|
(12,000) |
|
|
— |
|
|
Payments of principal on capital lease obligations |
|
|
(1,198) |
|
|
(1,465) |
|
|
(737) |
|
|
Payments of principal on right to use liability |
|
|
(150) |
|
|
(200) |
|
|
(1,351) |
|
|
Payment of debt issuance costs |
|
|
(4,604) |
|
|
(7,084) |
|
|
(3,324) |
|
|
Proceeds from issuance of Class A common stock sold in an initial public offering net of underwriter discounts and commissions |
|
|
— |
|
|
234,185 |
|
|
— |
|
|
Proceeds from issuance of Class A common stock sold in a public offering net of underwriter discounts, commissions and offering expenses |
|
|
121,395 |
|
|
— |
|
|
— |
|
|
Proceeds from issuance of Class B common stock |
|
|
— |
|
|
6 |
|
|
— |
|
|
Dividends on Class A common stock |
|
|
(22,241) |
|
|
(1,515) |
|
|
— |
|
|
Proceeds from exercise of stock options |
|
|
1,728 |
|
|
— |
|
|
— |
|
|
Repurchases of Class A common stock for withholding taxes on vested RSUs |
|
|
(368) |
|
|
— |
|
|
— |
|
|
Members' distributions |
|
|
(149,633) |
|
|
(236,146) |
|
|
(228,894) |
|
|
Net cash provided by (used in) financing activities |
|
|
594,737 |
|
|
(77,817) |
|
|
45,372 |
|
|
|
|
|
|
|
|
|
|
|
|
|
|
Increase in cash |
|
|
109,967 |
|
|
22,171 |
|
|
(18,685) |
|
|
Cash at beginning of the year |
|
|
114,196 |
|
|
92,025 |
|
|
110,710 |
|
|
Cash at end of the year |
|
$ |
224,163 |
|
$ |
114,196 |
|
$ |
92,025 |
|
See accompanying Notes to Consolidated Financial Statements
125
Camping World Holdings, Inc. and Subsidiaries
Notes to Consolidated Financial Statements
December 31, 2017
1. Summary of Significant Accounting Policies
Principles of Consolidation and Basis of Presentation
The consolidated financial statements include the accounts of Camping World Holdings, Inc. (“CWH”) and its subsidiaries (collectively, the “Company”), and are presented in accordance with accounting principles generally accepted in the United States (“GAAP”). CWH was formed on March 8, 2016 as a Delaware corporation for the purpose of facilitating an initial public offering (the “IPO”) and other related transactions in order to carry on the business of CWGS Enterprises, LLC (“CWGS, LLC”). CWGS, LLC was formed in March 2011 when it received, through contribution from its then parent company, all of the membership interests of Affinity Group Holding, LLC and FreedomRoads Holding Company, LLC (“FreedomRoads”). The IPO and related reorganization transactions (the “Reorganization Transactions”) that occurred on October 6, 2016 (see Note 18 — Stockholders’ Equity for a discussion of these transactions) resulted in CWH as the sole managing member of CWGS, LLC, with CWH having sole voting power in and control of the management of CWGS, LLC. Despite its position as sole managing member of CWGS, LLC, CWH has a minority economic interest in CWGS, LLC. As of December 31, 2017 and 2016, CWH owned 41.5% and 22.6%, respectively, of CWGS, LLC. Accordingly, the Company consolidates the financial results of CWGS, LLC and reports a non-controlling interest in its consolidated financial statements. As the Reorganization Transactions, discussed in Note 18 — Stockholders’ Equity, are considered transactions between entities under common control, the financial statements for the periods prior to the IPO and related Reorganization Transactions have been adjusted to combine the previously separate entities for presentation purposes.
All significant intercompany accounts and transactions of the Company and its subsidiaries have been eliminated in consolidation. Certain prior-period amounts have been reclassified to conform to the current period presentation.
The Company does not have any components of other comprehensive income recorded within its consolidated financial statements, and, therefore, does not separately present a statement of comprehensive income in its consolidated financial statements.
Description of the Business
CWH is a holding company and operates through its subsidiaries. The operations of the Company consist of two primary businesses: (i) Consumer Services and Plans, and (ii) Retail. The Company provides consumer services and plans offerings through its Good Sam brand and the Company primarily provides its retail offerings primarily through its Camping World, Gander Outdoors and Overton’s brands. Within the Consumer Services and Plans segment, the Company primarily derives revenue from the sale of the following offerings: emergency roadside assistance; property and casualty insurance programs; travel assist programs; extended vehicle service contracts; co-branded credit cards; vehicle financing and refinancing; club memberships; and publications and directories. Within the Retail segment, the Company primarily derives revenues from the sale of the following products: new and used recreational vehicles (“RV”); parts and service, including RV accessories and supplies; camping, hunting, fishing, skiing, snowboarding, bicycling, skateboarding, marine and watersport equipment and supplies; and finance and insurance. The Company primarily operates in various regions throughout the United States and markets its products and services to RV owners and outdoor enthusiasts. At December 31, 2017, the Company operated 140 Camping World retail locations, of which 124 locations sell new and used RV’s, and offer financing, and other ancillary services, protection plans, and products for the RV purchaser and outdoor enthusiasts; two Gander Outdoors locations offering outdoor products and services; two Overton’s locations offering marine and watersports products; two TheHouse.com locations offering skiing, snowboarding, bicycling, and skateboarding products; five Uncle Dan’s locations offering outdoor products and services, and one W82 location offering skiing, snowboarding, and skateboarding products.
126
Restatement to Prior Periods
Following the purchase of newly-issued common units from CWGS, LLC in connection with the IPO, the Company’s deferred tax balances have reflected the differences in the book and tax basis of its investment in CWGS, LLC (i.e., outside basis) (the “Outside Basis Deferred Tax Asset”). In connection with preparing its financial statements for the year ended December 31, 2017, the Company determined that a portion of the Outside Basis Deferred Tax Asset related to its acquisition of the direct interest in CWGS, LLC through newly issued LLC units is not expected to be realized unless the Company were to dispose of its investment in CWGS, LLC, which the Company has no current plan to do. Accordingly, the Company has determined that it should have established a valuation allowance of $102.7 million against this portion of its Outside Basis Deferred Tax Asset that was recorded through equity as of December 31, 2016. Following the establishment of the valuation allowance as of December 31, 2016, the Company recognizes subsequent changes to the valuation allowance through the provision for income taxes or equity, in accordance with generally accepted accounting principles, and at December 31, 2017 the valuation allowance was $89.5 million, which includes the provisional decrease of $47.0 million during the year ended December 31, 2017 for the remeasurement of this deferred tax asset under the U.S. Tax Cuts and jobs Act of 2017 (“2017 Tax Act”).
Because the Company’s consolidated financial statements as of and for the year ended December 31, 2016 included the Outside Basis Deferred Tax Asset, the Company has restated its consolidated financial statements as of and for the year ended December 31, 2016 to reflect a valuation allowance against the portion of the deferred tax asset related to the outside basis difference of $102.7 million (the “Restatement”). There was no impact on net income or cash flows for the related periods affected by the Restatement.
The Company also corrected for errors that were immaterial to previously-reported consolidated financial statements. These errors were also identified in connection with the preparation of the financial statements for the year ended December 31, 2017, and related to i) the lack of deferral of a portion of Good Sam roadside assistance policies sold through the finance and insurance process with the sale of new and used vehicles, ii) the application of a portion of certain vendor rebates against the related inventory balances, iii) the elimination of intercompany allocation of certain revenue from new and used vehicles to consumer services and plans, and iv) the allocation of the intercompany markup between costs applicable to new and used vehicles. To quantify these errors, management performed an analysis of deferred roadside assistance policies and vendor rebates applicable to ending inventory for the years ended December 31, 2016, 2015, 2014, and 2013 and the interim periods in 2017 and 2016. The Company evaluated the materiality of these errors both qualitatively and quantitatively in accordance with Staff Accounting Bulletin (“SAB”) No. 99, Materiality, and SAB No. 108 and, determined the effect of these corrections was not material to the previously issued financial statements as of and for the years ended December 31, 2016 and 2015. As a result of also correcting these errors, new vehicles revenue, used vehicles revenue, finance and insurance, net revenue, costs applicable to revenue – new vehicles, costs applicable to revenue – used vehicles, all within the retail segment, and net income attributable to non-controlling interests and earnings per share, basic and diluted have been revised (the “Immaterial Adjustments”). There was no effect on any per share amounts prior to the quarter ended December 31, 2016 as such periods were before the Company’s IPO, see Note 21 — Earnings Per Share.
Additionally, as a result of these errors, the cumulative effect of the change on stockholders’ /members’ deficit as of January 1, 2015, the earliest date presented in these consolidated financial statements, was $8.1 million from an as reported amount of $242.6 million to an as corrected amount of $250.7 million. The following table presents the effect of the Restatement and the Immaterial Adjustments on the Company’s consolidated balance sheets for the periods indicated:
|
|
|
As of December 31, 2016 |
|
As of December 31, 2015 |
||||||||||||||
|
($ in thousands) |
|
As Reported |
|
Adjustment |
|
As Corrected |
|
As Reported |
|
Adjustment |
|
As Corrected |
||||||
|
Inventories |
|
$ |
909,254 |
|
$ |
(6,543) |
|
$ |
902,711 |
|
$ |
861,847 |
|
$ |
(5,520) |
|
$ |
856,327 |
|
Total current assets |
|
|
1,132,705 |
|
|
(6,543) |
|
|
1,126,162 |
|
|
1,050,981 |
|
|
(5,520) |
|
|
1,045,461 |
|
Deferred tax asset |
|
|
125,878 |
|
|
(101,445) |
|
|
24,433 |
|
|
6,234 |
|
|
— |
|
|
6,234 |
|
Total assets |
|
|
1,563,765 |
|
|
(107,988) |
|
|
1,455,777 |
|
|
1,338,105 |
|
|
(5,520) |
|
|
1,332,585 |
|
Deferred revenues and gains, current portion |
|
|
68,643 |
|
|
2,485 |
|
|
71,128 |
|
|
63,616 |
|
|
2,005 |
|
|
65,621 |
|
Total current liabilities |
|
|
865,937 |
|
|
2,485 |
|
|
868,422 |
|
|
863,098 |
|
|
2,005 |
|
|
865,103 |
|
Deferred revenues and gains, long-term portion |
|
|
52,210 |
|
|
5,449 |
|
|
57,659 |
|
|
52,151 |
|
|
4,774 |
|
|
56,925 |
|
Total liabilities |
|
|
1,591,980 |
|
|
7,934 |
|
|
1,599,914 |
|
|
1,632,965 |
|
|
6,779 |
|
|
1,639,744 |
|
Additional paid-in capital |
|
|
74,239 |
|
|
(104,245) |
|
|
(30,006) |
|
|
— |
|
|
— |
|
|
— |
127
|
|
|
As of December 31, 2016 |
|
As of December 31, 2015 |
||||||||||||||
|
($ in thousands) |
|
As Reported |
|
Adjustment |
|
As Corrected |
|
As Reported |
|
Adjustment |
|
As Corrected |
||||||
|
Retained earnings |
|
|
544 |
|
|
(473) |
|
|
71 |
|
|
— |
|
|
— |
|
|
— |
|
Total stockholders' equity attributable to Camping World Holdings, Inc./ members' deficit |
|
|
74,978 |
|
|
(104,718) |
|
|
(29,740) |
|
|
(294,860) |
|
|
(12,299) |
|
|
(307,159) |
|
Non-controlling interest |
|
|
(103,193) |
|
|
(11,204) |
|
|
(114,397) |
|
|
— |
|
|
— |
|
|
— |
|
Stockholders'/ members' equity (deficit) |
|
|
(28,215) |
|
|
(115,922) |
|
|
(144,137) |
|
|
(294,860) |
|
|
(12,299) |
|
|
(307,159) |
|
Total liabilities and stockholders' / members' equity (deficit) |
|
|
1,563,765 |
|
|
(107,988) |
|
|
1,455,777 |
|
|
1,338,105 |
|
|
(5,520) |
|
|
1,332,585 |
The following table presents the effect of the Immaterial Adjustments on the Company’s consolidated statements of income for the periods indicated:
|
|
|
Year Ended December 31, 2016 |
|
Year Ended December 31, 2015 |
||||||||||||||
|
($ in thousands except per share amounts) |
|
As Reported |
|
Adjustment |
|
As Corrected |
|
As Reported |
|
Adjustment |
|
As Corrected |
||||||
|
Revenue: |
|
|
|
|
|
|
|
|
|
|
|
|
|
|
|
|
|
|
|
New vehicles |
|
$ |
1,866,182 |
|
$ |
(3,987) |
|
$ |
1,862,195 |
|
$ |
1,606,465 |
|
$ |
(3,207) |
|
$ |
1,603,258 |
|
Used vehicles |
|
|
705,893 |
|
|
(2,567) |
|
|
703,326 |
|
|
806,399 |
|
|
(2,520) |
|
|
803,879 |
|
Finance and insurance, net |
|
|
229,839 |
|
|
(1,155) |
|
|
228,684 |
|
|
190,820 |
|
|
(1,550) |
|
|
189,270 |
|
Retail segment revenues |
|
|
3,341,933 |
|
|
(7,709) |
|
|
3,334,224 |
|
|
3,111,494 |
|
|
(7,277) |
|
|
3,104,217 |
|
Total revenue |
|
|
3,526,706 |
|
|
(7,709) |
|
|
3,518,997 |
|
|
3,286,094 |
|
|
(7,277) |
|
|
3,278,817 |
|
Costs applicable to revenue- new vehicles |
|
|
1,604,534 |
|
|
(7,671) |
|
|
1,596,863 |
|
|
1,379,156 |
|
|
(3,993) |
|
|
1,375,163 |
|
Costs applicable to revenue- used vehicles |
|
|
555,113 |
|
|
2,140 |
|
|
557,253 |
|
|
646,936 |
|
|
953 |
|
|
647,889 |
|
Retail segment costs applicable to revenue |
|
|
2,448,833 |
|
|
(5,531) |
|
|
2,443,302 |
|
|
2,301,081 |
|
|
(3,040) |
|
|
2,298,041 |
|
Total costs applicable to revenue |
|
|
2,528,105 |
|
|
(5,531) |
|
|
2,522,574 |
|
|
2,382,830 |
|
|
(3,040) |
|
|
2,379,790 |
|
Income from operations |
|
|
281,368 |
|
|
(2,178) |
|
|
279,190 |
|
|
244,510 |
|
|
(4,237) |
|
|
240,273 |
|
Income before income taxes |
|
|
209,144 |
|
|
(2,178) |
|
|
206,966 |
|
|
179,886 |
|
|
(4,237) |
|
|
175,649 |
|
Net income |
|
|
203,237 |
|
|
(2,178) |
|
|
201,059 |
|
|
178,530 |
|
|
(4,237) |
|
|
174,293 |
|
Net income attributable to non-controlling interests |
|
|
(11,576) |
|
|
1,634 |
|
|
(9,942) |
|
|
— |
|
|
— |
|
|
— |
|
Net income attributable to Camping World Holdings, Inc. |
|
|
191,661 |
|
|
(544) |
|
|
191,117 |
|
|
178,530 |
|
|
(4,237) |
|
|
174,293 |
|
Earnings per share of Class A common stock: |
|
|
|
|
|
|
|
|
|
|
|
|
|
|
|
|
|
|
|
Basic |
|
$ |
0.11 |
|
$ |
(0.03) |
|
$ |
0.08 |
|
|
n/a |
|
|
n/a |
|
|
n/a |
|
Diluted |
|
$ |
0.09 |
|
$ |
(0.02) |
|
$ |
0.07 |
|
|
n/a |
|
|
n/a |
|
|
n/a |
While the error corrections did not have an impact on cash provided by or used in operating, investing, or financing activities, the applicable line items on the above tables within cash provided by operating activities on the consolidated statements of cash flows have been appropriately revised for the periods presented. The impact of these error corrections to relevant segment and quarterly financial information is presented in Notes 22 and 23 to these consolidated financial statements, respectively.
Use of Estimates
The preparation of financial statements in conformity with GAAP requires management to make estimates and assumptions that affect the reported amounts of assets and liabilities and disclosure of contingent assets and liabilities at the date of the financial statements and reported amounts of revenue and expenses during the reporting period. Actual results could differ from these estimates. In preparing these financial statements, management has made its best estimates and judgments of certain amounts included in the financial statements, giving due consideration to materiality. The Company bases its estimates and judgments on historical experience and other assumptions that management believes are reasonable. However, application of these accounting policies involves the exercise of judgment and use of assumptions as to future uncertainties and, as a result, actual results could differ materially from these estimates. The Company periodically evaluates estimates and assumptions used in the preparation of the financial statements and makes changes on a prospective basis when adjustments are necessary. Significant estimates made in the accompanying Consolidated Financial Statements include certain assumptions related to accounts receivable, inventory, goodwill, intangible assets, long‑lived assets, assets held for sale, program cancellation reserves, and accruals related to self‑insurance programs, estimated tax liabilities and other liabilities.
Cash and Cash Equivalents
The Company considers all short‑term, highly liquid investments purchased with a maturity date of three months or less to be cash equivalents. The carrying amount approximates fair value because of the short‑term maturity of these instruments. Outstanding checks that are in excess of the cash balances at certain banks are included in accrued liabilities in the Consolidated Balance Sheets, and changes in the amounts are reflected in operating cash flows in the accompanying Consolidated Statement of Cash Flows.
128
Restricted Cash
Restricted cash balances are pledged primarily in lieu of letters of credit. Restricted cash is expected to become available to the Company when the letters of credit are issued.
Contracts in Transit
Contracts in transit consist of amounts due from non-affiliated financing institutions on retail finance contracts from vehicle sales for the portion of the vehicle sales price financed by the Company’s customers.
Concentration of Credit Risk
The Company’s most significant industry concentration of credit risk is with financial institutions from which the Company has recorded receivables and contracts in transit. These financial institutions provide financing to Camping World’s customers for the purchase of a vehicle in the normal course of business. These receivables are short‑term in nature and are from various financial institutions located throughout the United States.
The Company has cash deposited in various financial institutions that is in excess of the insurance limits provided by the Federal Deposit Insurance Corporation. The amount in excess of FDIC limits at December 31, 2017 and 2016 was approximately $227.9 million and $119.0 million, respectively.
The Company is potentially subject to concentrations of credit risk in accounts receivable. Concentrations of credit risk with respect to accounts receivable are limited due to the large number of customers and their geographic dispersion.
Inventories, net
Retail inventories consist primarily of new and used recreational vehicles held for sale valued using the specific‑identification method and valued at the lower of cost or net realizable value. Cost includes purchase costs, reconditioning costs, dealer‑installed accessories, and freight. For vehicles accepted in trades, the cost is the fair value of such used vehicles at the time of the trade‑in. Parts and accessories are valued at the lower of cost or net realizable value. Retail parts, accessories, and other inventories primarily consist of retail travel and leisure specialty merchandise and are stated at lower of first‑in, first‑out cost or net realizable value.
Property and Equipment, net
Property and equipment is recorded at historical cost, net of accumulated depreciation and amortization, and, if applicable, impairment charges. Depreciation of property and equipment is provided using the straight‑line method over the following estimated useful lives of the assets:
|
|
|
Years |
|
Building and improvements |
|
40 |
|
Leasehold improvements |
|
3 - 40 |
|
Furniture, fixtures and equipment |
|
3-12 |
|
Software |
|
3-5 |
Leasehold improvements are amortized over the useful lives of the assets or the remaining term of the respective lease, whichever is shorter.
Goodwill and Other Intangible Assets
Goodwill is reviewed at least annually for impairment, and more often when impairment indicators are present (see Note 5 — Goodwill and Intangible Assets). Finite‑lived intangibles are recorded at cost, net of accumulated amortization and, if applicable, impairment charges. Finite‑lived intangible assets consist of
129
membership and customer lists with weighted‑average useful lives of approximately 11.2 years, trademarks and trade names with weighted average useful lives of approximately 15.0 years, and websites with weighted-average useful lives of approximately 10.0 years. The weighted-average useful life of all our finite-lived intangible assists is approximately 12.4 years.
Long‑Lived Assets
Long‑lived assets included in property and equipment, net, including capitalized software costs to be held and used, are reviewed for impairment whenever events or changes in circumstances indicate that the carrying amount of an asset may not be recoverable. Impairment is recognized to the extent the sum of the discounted estimated future cash flows from the use of the asset is less than the carrying value. For the Company’s major software systems, such as its accounting and membership systems, the Company’s capitalized costs may include some internal or external costs to configure, install and test the software during the application development stage. The Company does not capitalize preliminary project costs, nor does it capitalize training, data conversion costs, maintenance or post‑development stage costs.
Self‑Insurance Program
Self‑insurance reserves represent amounts established as a result of insurance programs under which the Company self‑insures portions of the business risks. The Company carries substantial premium‑paid, traditional risk transfer insurance for various business risks. The Company self‑insures and establishes reserves for the retention on workers’ compensation insurance, general liability, automobile liability, professional errors and omission liability, and employee health claims. The self‑insured claims liability was approximately $16.1 million and $11.3 million at December 31, 2017 and 2016, respectively. The determination of such claims and expenses and the appropriateness of the related liability are continually reviewed and updated. The self‑insurance accruals are calculated by actuaries and are based on claims filed and include estimates for claims incurred but not yet reported. Projections of future losses, including incurred but not reported losses, are inherently uncertain because of the random nature of insurance claims and could be substantially affected if occurrences and claims differ significantly from these assumptions and historical trends. In addition, the Company has obtained letters of credit as required by insurance carriers. As of December 31, 2017 and 2016, these letters of credit were approximately $12.2 million and $10.8 million, respectively. This includes $8.9 million and $7.6 million as of December 31, 2017 and 2016, respectively, issued under the FreedomRoads, LLC Floor Plan Facility (see Note 3 — Inventories and Notes Payable — Floor Plan, net), and the balance issued under the Company’s Senior Secured Credit Facilities (see Note 7 — Long‑Term Debt).
Long‑Term Debt
The fair value of the Company’s long‑term debt is estimated based on the quoted market prices for the same or similar issues or on the current rates offered for debt of the same or similar remaining maturities.
Revenue Recognition
Revenue is recognized when persuasive evidence of an arrangement exists, services or products have been provided to the customers, fees are fixed or determinable, and collectability is reasonably assured.
Consumer Services and Plans revenue consists of revenue from membership clubs, publications, consumer shows, and marketing and royalty fees from various consumer services and plans. Certain Consumer Services and Plans revenue is generated from annual, multiyear and lifetime memberships. The revenue and expenses associated with these memberships are deferred and amortized over the membership period. Unearned revenue and profit are subject to revisions as the membership progresses to completion. Revisions to membership period estimates would change the amount of income and expense amortized in future accounting periods. For lifetime memberships, an 18‑year period is used, which is the actuarially determined estimated fulfillment period. Roadside Assistance (“RA”) revenues are deferred and recognized over the life of the membership. RA claim expenses are recognized when incurred.
130
Certain Consumer Services and Plans memberships may be sold bundled with a merchandise certificate to a Camping World retail location. The selling price of the membership is typically determined based on vendor specific objective evidence (“VSOE”) or, in the absence of VSOE, the selling price is determined by management's best estimate of selling price, which considers market and economic conditions, internal costs, pricing, and discounting practices. The selling price of the merchandise certificate is determined based management’s best estimated selling price, which considers the face value of the discount provided by the merchandise certificate and adjusts for the likelihood that the merchandise certificate will be redeemed. The bundled price is then allocated between the membership and merchandise certificate based on their relative selling prices.
Royalty revenue is earned under the terms of an arrangement with a third‑party credit card provider based on a percentage of the Company’s co‑branded credit card portfolio retail spend with such third‑party credit card provider.
Marketing fees for finance, insurance, extended service and other similar products are recognized, net of a reserve for estimated cancellations, if applicable, when a product contract payment has been received or financing has been arranged.
Promotional expenses, consisting primarily of direct‑mail advertising, are deferred and expensed over the period of expected future benefit, typically three months based on historical actual response rates. Renewal expenses are expensed at the time related materials are mailed.
Newsstand sales of publications and related expenses are recorded at the time of delivery, net of an estimated provision for returns. Subscription sales of publications are reflected in income over the lives of the subscriptions. The related selling expenses are expensed as incurred. Advertising revenues and related expenses are recorded at the time of delivery. Subscription and newsstand revenues and expenses related to annual publications are deferred until the publications are distributed.
Revenue and related expenses for consumer shows are recognized when the show occurs.
Retail revenue consists of sales of new and used recreational vehicles, commissions on related finance and insurance contracts, and sales of parts, services and other products. Revenue from the sale of recreational vehicles is recognized upon completion of the sale to the customer. Conditions to completing a sale include having an agreement with the customer, including pricing, and the sales price must be reasonably expected to be collected and delivery has occurred. Revenue from parts, services and other products sales is recognized on the delivery of the part or completion of the service.
Finance and insurance revenue is recognized when a finance and insurance product contract payment has been received or financing has been arranged. The proceeds the Company receives for arranging financing contracts, and selling insurance and service contracts, are subject to chargebacks if the customer terminates the respective contract earlier than a stated period. A reserve for chargebacks is recorded as a reduction of revenues in the period in which the related revenue is recognized.
Parts and Service Internal Profit
The Company’s parts and service departments recondition the majority of used vehicles acquired by the Company’s used vehicle departments and perform minor preparatory work on new vehicles acquired by the Company’s new vehicle departments. The parts and service departments charge the new and used vehicle departments as if they were third parties in order to account for total activity performed by that department. The revenue and costs applicable to revenue associated with the internal work performed by the Company’s parts and service departments are eliminated in consolidation. Also in consolidation, the Company eliminates the internal profit on vehicles and parts inventory that have not been sold.
Advertising Expense
At December 31, 2017 and 2016, $6.5 million and $6.9 million, respectively, of advertising expenses were capitalized as direct‑response advertising, of which $5.2 million and $5.5 million, respectively, were
131
reported as assets and $1.2 million and $1.4 million, respectively, were reported net of related deferred revenue. Other advertising expenses are expensed as incurred. Advertising expenses for the years ended December 31, 2017, 2016, and 2015 were $86.6 million, $76.0 million, and $76.2 million, respectively.
Vendor Allowances
As a component of the Company’s consolidated procurement program, the Company frequently enters into contracts with vendors that provide for payments of rebates or other allowances. These vendor payments are reflected in the carrying value of the inventory when earned or as progress is made toward earning the rebate or allowance and as a component of cost of sales as the inventory is sold. Certain of these vendor contracts provide for rebates and other allowances that are contingent upon the Company meeting specified performance measures such as a cumulative level of purchases over a specified period of time. Such contingent rebates and other allowances are given accounting recognition at the point at which achievement of the specified performance measures are deemed to be probable and reasonably estimable.
Shipping and Handling Fees and Costs
The Company reports shipping and handling costs billed to customers as a component of revenues, and related costs are reported as a component of costs applicable to revenues. For the years ended December 31, 2017, 2016, and 2015, $4.1 million, $2.3 million, and $5.6 million of shipping and handling fees, respectively, were included in the Retail segment as revenue.
Income Taxes
The Company recognizes deferred tax assets and liabilities based on the liability method, which requires an adjustment to the deferred tax asset or liability to reflect income tax rates currently in effect. When income tax rates increase or decrease, a corresponding adjustment to income tax expense is recorded by applying the rate change to the cumulative temporary differences. The Company recognizes the tax benefit from an uncertain tax position in accordance with accounting guidance on accounting for uncertainty in income taxes. The Company classifies interest and penalties relating to income taxes as income tax expense. See Note 10 — Income Taxes.
Recently Adopted Accounting Pronouncements
In July 2015, the Financial Accounting Standards Board (“FASB”) issued Accounting Standards Update (“ASU”) No. 2015-11, Inventory (Topic 330): Simplifying the Measurement of Inventory (“ASU 2015-11”). The amendments in the accounting standard replace the lower of cost or market test with a lower of cost and net realizable value test. The amendments in this ASU should be applied prospectively and are effective for interim and annual periods beginning after December 15, 2016. The Company adopted the amendments of this ASU as of January 1, 2017 and the adoption did not materially impact its consolidated financial statements or results of operations.
In January 2016, the FASB issued ASU No. 2016-01, Recognition and Measurement of Financial Assets and Financial Liabilities (“ASU 2016-01”). This ASU amends guidance on the classification and measurement of financial instruments. Although ASU 2016-01 retains many current requirements, it significantly revises an entity’s accounting related to investments in equity securities, excluding those accounted for under the equity method of accounting or those that result in the consolidation of the investee. The guidance also amends certain disclosure requirements associated with the fair value of financial instruments. One of the amendments eliminates the requirement to disclose the methods and significant assumptions used to estimate the fair value that is required to be disclosed for financial instruments measured at amortized cost on the balance sheet. The standard will be effective for fiscal years beginning after December 15, 2017, and interim periods within those fiscal years. The Company early adopted the amendments of this ASU as of January 1, 2017, which eliminated the disclosure requirements discussed above, and the adoption did not materially impact its consolidated financial statements or results of operations.
132
In November 2016, the FASB issued ASU No. 2016-18, Statement of Cash Flows (Topic 230): Restricted Cash, a consensus of the FASB Emerging Issues Task Force (“ASU 2016-18”). The amendments require that a statement of cash flows explain the change during the period in the total of cash, cash equivalents, and amounts generally described as restricted cash or restricted cash equivalents. Therefore, amounts generally described as restricted cash and restricted cash equivalents should be included with cash and cash equivalents when reconciling the beginning-of-period and end-of-period total amounts shown on the statement of cash flows. The amendments in this ASU do not provide a definition of restricted cash or restricted cash equivalents. The standard will be effective for fiscal years beginning after December 15, 2017, and interim periods within those fiscal years. The Company early adopted the amendments of this ASU as of January 1, 2017 and the adoption did not materially impact its consolidated financial statements or results of operations.
In January 2017, the FASB issued ASU No. 2017-01, Business Combinations (Topic 805): Clarifying the Definition of a Business (“ASU 2017-01”). This ASU clarifies the definition of a business to exclude gross assets acquired (or disposed of) that have substantially all of their fair value concentrated in a single identifiable asset or group of similar identifiable assets. The ASU also updates the definition of the term “output” to be consistent with Accounting Standards Codification (“ASC”) Topic No. 606. The ASU is effective for annual reporting periods beginning after December 15, 2017 and interim periods within those annual periods. The Company early adopted the amendments of this ASU as of January 1, 2017 and the adoption did not materially impact its consolidated financial statements or results of operations.
In January 2017, the FASB issued ASU No. 2017-04, Intangibles - Goodwill and Other (Topic 350): Simplifying the Test for Goodwill Impairment (“ASU 2017-04”). This ASU eliminates Step 2 of the goodwill impairment test and requires a goodwill impairment to be measured as the amount by which a reporting unit’s carrying amount exceeds its fair value, not to exceed the carrying amount of its goodwill. The ASU is effective for annual or any interim goodwill impairment tests in fiscal years beginning after December 15, 2019 and must be applied prospectively. The Company early adopted the amendments of this ASU as of January 1, 2017 and the adoption did not materially impact its consolidated financial statements or results of operations.
In May 2017, the FASB issued ASU No. 2017-09, Compensation - Stock Compensation (Topic 718): Scope of Modification Accounting (“ASU 2017-09”). The amendments in ASU 2017-09 require entities to apply modification accounting in Topic 718 only when changes to the terms or conditions of a share-based payment award result in changes to fair value, vesting conditions or the classification of the award as equity or liability. The standard will be effective for fiscal years beginning after December 15, 2017, and interim periods within those fiscal years, with early adoption permitted. The guidance will be applied prospectively upon adoption. The Company does not expect the adoption will have a material impact on its consolidated financial statements or results of operations; however, the amount of the impact to equity-based compensation expense will depend on the terms specified in any new changes to the equity-based payment awards, if any. The Company early adopted the amendments of this ASU as of October 1, 2017 and the adoption did not materially impact its consolidated financial statements or results of operations.
Recently Issued Accounting Pronouncements
In May 2014, the FASB issued ASU 2014-09, Revenue from Contracts with Customers (Topic 606) (“ASU 2014-09”). The FASB has subsequently issued several related ASUs that clarified the implementation guidance for certain aspects of ASU 2014-09, which are effective upon the adoption of ASU 2014-09. This ASU sets forth a five-step model for determining when and how revenue is recognized. Under the model, an entity will be required to recognize revenue to depict the transfer of goods or services to a customer at an amount reflecting the consideration it expects to receive in exchange for those goods or services. The amendments in this accounting standard update are effective for interim and annual reporting periods beginning after December 15, 2017. The standard can be adopted either retrospectively to each reporting period presented or as a cumulative effect adjustment as of the date of adoption. To assess the impact of the ASU, the Company established an internal implementation team to review its current accounting policies and practices, identify all material revenue streams, assess the impact of the ASU on its material revenue streams and identify potential differences with current policies and practices. The team has identified the Company’s material revenue streams to be the sale of new and used vehicles; the sale of parts, RV accessories, and supplies; the performance of vehicle maintenance and repair services; the arrangement of associated vehicle
133
financing; the sale of insurance and emergency roadside assistance contracts; and the sale of club memberships.
The Company has utilized a comprehensive approach to assess the impact of the guidance on its contract portfolio by reviewing its current accounting policies and practices to identify potential differences that would result from applying the new requirements to its revenue contracts, including evaluation of its performance obligations, principal versus agent considerations and variable consideration. The Company is substantially complete with its contract and business process reviews and implemented changes to its controls to support recognition and disclosures under the new guidance. Based on the foregoing, the Company currently does not expect this guidance to have a material impact on its consolidated financial statements or results of operations.
In February 2016, the FASB issued ASU No. 2016-02, Leases (Topic 842) (“ASU 2016-02”). The FASB has subsequently issued ASU No. 2018-01 that provides a practical expedient relating to land easements, which is effective upon the adoption of ASU 2016-02. The amendments in this ASU relate to the accounting for leasing transactions. This standard requires a lessee to record on the balance sheet the assets and liabilities for the rights and obligations created by leases with lease terms of more than 12 months. In addition, this standard requires both lessees and lessors to disclose certain key information about lease transactions. This standard will be effective for fiscal years beginning after December 15, 2018, including interim periods within those fiscal years. The Company is in the process of evaluating the impact that adoption will have on its consolidated balance sheet and statement of income. However, the Company expects that the adoption of the provisions of the ASU will have a significant impact on its consolidated balance sheet by reporting a right-to-use lease asset and corresponding lease obligation, as currently most of its real estate is leased via operating leases. Adoption of this ASU is required to be done using a modified retrospective approach.
In August 2016, the FASB issued ASU No. 2016-15, Statement of Cash Flows (Topic 230): Classification of Certain Cash Receipts and Cash Payments (“ASU 2016-15”). The amendment addresses several specific cash flow issues with the objective of reducing the diversity in practice in how certain cash receipts and cash payments are presented and classified in the statement of cash flows. The standard will be effective for fiscal years beginning after December 15, 2017, and interim periods within those fiscal years. The Company is currently evaluating the impact that the adoption of the provisions of the ASU will have on its consolidated financial statements.
2. Receivables
Receivables consisted of the following at December 31, (in thousands):
|
|
|
2017 |
|
2016 |
|
||
|
Consumer Services and Plans |
|
$ |
28,130 |
|
$ |
26,653 |
|
|
New and used vehicles |
|
|
3,168 |
|
|
1,791 |
|
|
Parts, service and other |
|
|
11,261 |
|
|
12,912 |
|
|
Trade accounts receivable |
|
|
13,881 |
|
|
4,199 |
|
|
Due from manufacturers |
|
|
18,746 |
|
|
13,950 |
|
|
Other |
|
|
7,395 |
|
|
1,903 |
|
|
|
|
|
82,581 |
|
|
61,408 |
|
|
Allowance for doubtful accounts |
|
|
(2,700) |
|
|
(2,920) |
|
|
|
|
$ |
79,881 |
|
$ |
58,488 |
|
134
3. Inventories, net and Notes Payable — Floor Plan, net
Inventories consisted of the following at December 31, (in thousands):
|
|
|
December 31, |
|
December 31, |
||
|
|
|
2017 |
|
2016 |
||
|
New RV vehicles |
|
$ |
1,113,178 |
|
$ |
721,091 |
|
Used RV vehicles |
|
|
106,210 |
|
|
78,787 |
|
Parts, accessories and miscellaneous |
|
|
196,527 |
|
|
102,833 |
|
|
|
$ |
1,415,915 |
|
$ |
902,711 |
The RVs included in retail inventories are financed by floor plan arrangements through a syndication of banks. The floor plan notes are collateralized by substantially all of the assets of FreedomRoads, LLC (“FR”), a wholly owned subsidiary of FreedomRoads, which operates the Camping World dealerships, and bear interest at one month London Interbank Offered Rate (“LIBOR”) plus 2.15%, 2.05%, and 2.40%, for the years ended December 31, 2017, 2016, and 2015, respectively. LIBOR was 1.36%, 0.62%, and 0.36% as of December 31, 2017, 2016, and 2015, respectively. Principal is due upon the sale of the related vehicle.
In February 2012, FR entered into a Fifth Amended and Restated Credit Agreement for floor plan financing (“Floor Plan Facility”). In 2013, the Fifth Amended and Restated Credit Agreement was amended to extend the maturity date to October 2016. In 2014, the Fifth Amended and Restated Credit Agreement was amended to extend the maturity date to October 2017. In August 2015, FR entered into a Sixth Amended and Restated Credit Agreement for the Floor Plan Facility to extend the maturity date to August 2018. On July 1, 2016, FR entered into Amendment No. 1 to the Sixth Amended and Restated Credit Agreement for the Floor Plan Facility to, among other things, increase the available amount under the Floor Plan Facility from $880.0 million to $1.18 billion, amend the applicable borrowing rate margin on LIBOR and base rate loans ranging from 2.05% to 2.50% and 0.55% and 1.00%, respectively, based on the consolidated current ratio at FR, and extend the maturity date to June 30, 2019. The letter of credit commitment within the Floor Plan Facility remained at $15.0 million. On December 12, 2017, FR entered into a seventh amended and restated credit agreement (the “Floor Plan Facility Amendment”), which amended the previous credit agreement governing our Floor Plan Facility and allows the Floor Plan Borrower to borrow (a) up to $1.415 billion under a floor plan facility, (b) up to $15.0 million under a letter of credit facility and (c) up to a maximum amount outstanding of $35.0 million under the revolving line of credit, which maximum amount outstanding will decrease by $1.75 million on the last day of each fiscal quarter, commencing with the fiscal quarter ending March 31, 2019. In addition, the maturity of the Floor Plan Facility was extended to December 12, 2020. The Floor Plan Facility includes an offset account that allows the Company to transfer cash as an offset to the payable under the Floor Plan Facility. These transfers reduce the amount of liability outstanding under the floor plan notes payable that would otherwise accrue interest, while retaining the ability to transfer amounts from the offset account into the Company’s operating cash accounts. As a result of using the floor plan offset account, the Company experiences a reduction in floor plan interest expense in its consolidated statements of income. The credit agreement governing the Floor Plan Facility contains certain financial covenants. FR was in compliance with all debt covenants at December 31, 2017.
135
The following table details the outstanding amounts and available borrowings under the Floor Plan Facility as of December 31, (in thousands):
|
|
|
2017 |
|
2016 |
||
|
Floor Plan Facility |
|
|
|
|
|
|
|
Notes payable - floor plan: |
|
|
|
|
|
|
|
Total commitment |
|
$ |
1,415,000 |
|
$ |
1,165,000 |
|
Less: borrowings |
|
|
(974,043) |
|
|
(625,185) |
|
Less: flooring line aggregate interest reduction account |
|
|
(106,055) |
|
|
(68,469) |
|
Additional borrowing capacity |
|
|
334,902 |
|
|
471,346 |
|
Less: accounts payable for sold inventory |
|
|
(31,311) |
|
|
(21,692) |
|
Less: purchase commitments |
|
|
(77,144) |
|
|
(38,765) |
|
Unencumbered borrowing capacity |
|
$ |
226,447 |
|
$ |
410,889 |
4. Property and Equipment, net
Property and equipment consisted of the following at December 31, (in thousands):
|
|
|
2017 |
|
2016 |
|
||
|
Land |
|
$ |
12,243 |
|
$ |
6,248 |
|
|
Buildings and improvements |
|
|
17,791 |
|
|
7,669 |
|
|
Leasehold improvements - inclusive of right to use assets |
|
|
106,681 |
|
|
92,168 |
|
|
Furniture and equipment |
|
|
115,429 |
|
|
91,449 |
|
|
Software |
|
|
73,310 |
|
|
71,509 |
|
|
Systems development and construction in progress |
|
|
34,382 |
|
|
4,498 |
|
|
|
|
|
359,836 |
|
|
273,541 |
|
|
Less: accumulated depreciation and amortization |
|
|
(161,814) |
|
|
(142,781) |
|
|
Property and equipment, net |
|
$ |
198,022 |
|
$ |
130,760 |
|
In 2017 and 2016, unrelated landlords reimbursed the Company for tenant improvements constructed by the Company at various locations. In accordance with ASC 840 — Leases, the Company capitalized the tenant improvements as leasehold improvements and recorded a lease incentive in a like amount. The leasehold improvements are depreciated over the life of the lease and the lease incentives are amortized, as an offset to rent expense, over the life of the lease. Lease incentives for 2017 and 2016 were $24.7 million and $10.4 million, respectively, of which $0.5 million and $0.1 million, respectively, were amortized as an offset to rent.
Depreciation expense for the years ended December 31, 2017, 2016, and 2015 was $29.0 million, $23.7 million, and $23.3 million, respectively.
136
5. Goodwill and Intangible Assets
The following is a summary of changes in the Company’s goodwill by business line for the years ended December 31, 2017 and 2016 (in thousands):
|
|
|
Consumer |
|
|
|
|
|
|
|
|
|
|
Services and |
|
|
|
|
|
|
|
|
|
|
Plans |
|
Retail |
|
Consolidated |
|||
|
Balance as of January 1, 2016 |
|
$ |
49,944 |
|
$ |
62,996 |
|
$ |
112,940 |
|
Acquisitions |
|
|
— |
|
|
40,165 |
|
|
40,165 |
|
Balance as of December 31, 2016 |
|
|
49,944 |
|
|
103,161 |
|
|
153,105 |
|
Acquisitions |
|
|
— |
|
|
195,282 |
|
|
195,282 |
|
Balance as of December 31, 2017 |
|
$ |
49,944 |
|
$ |
298,443 |
|
$ |
348,387 |
Finite‑lived intangible assets and related accumulated amortization consisted of the following at December 31, (in thousands):
|
|
|
2017 |
|||||||
|
|
|
Cost or |
|
Accumulated |
|
|
|
||
|
|
|
Fair Value |
|
Amortization |
|
Net |
|||
|
Trademarks and trade names |
|
$ |
14,187 |
|
$ |
(312) |
|
$ |
13,875 |
|
Membership and customer lists |
|
|
28,988 |
|
|
(8,194) |
|
|
20,794 |
|
Websites |
|
|
4,174 |
|
|
(136) |
|
|
4,038 |
|
|
|
$ |
47,349 |
|
$ |
(8,642) |
|
$ |
38,707 |
|
|
|
|
|
|
|
|
|
|
|
|
|
|
2016 |
|||||||
|
|
|
Cost or |
|
Accumulated |
|
|
|
||
|
|
|
Fair Value |
|
Amortization |
|
Net |
|||
|
Membership and customer lists |
|
$ |
9,485 |
|
$ |
(6,099) |
|
$ |
3,386 |
|
|
|
$ |
9,485 |
|
$ |
(6,099) |
|
$ |
3,386 |
Amortization expense of finite-lived intangibles for the years ended December 31, 2017, 2016, and 2015 was $2.6 million, $1.0 million, and $0.8 million, respectively. The aggregate future five‑year amortization of finite‑lived intangibles at December 31, 2017, was as follows (in thousands):
|
2018 |
|
$ |
4,447 |
|
|
2019 |
|
|
4,366 |
|
|
2020 |
|
|
3,497 |
|
|
2021 |
|
|
3,076 |
|
|
2022 |
|
|
2,881 |
|
|
Thereafter |
|
|
20,440 |
|
|
|
|
$ |
38,707 |
|
The Company evaluates goodwill and indefinite‑lived intangible assets for impairment on an annual basis as of the beginning of the fourth quarter, or more frequently if events or changes in circumstances indicate that the Company’s goodwill or indefinite‑lived intangible assets might be impaired. The Company assesses qualitative factors to determine whether it is more likely than not that the fair value of a reporting unit is less than its carrying amount. If the Company determines it is more likely than not that the fair value of a reporting unit is less than its carrying amount, then it is required to perform the first step of a two‑step impairment test by calculating the fair value of the reporting unit and comparing the fair value with the carrying amount of the reporting unit. If the carrying amount of a reporting unit exceeds its fair value, then the Company is required to perform the second step of the two‑step goodwill impairment test to measure the amount of the impairment loss based on qualitative assessments. The Company determined that the fair value of its reporting units was greater than its carrying value.
137
6. Accrued Liabilities
Accrued liabilities consisted of the following at December 31, (in thousands):
|
|
|
2017 |
|
2016 |
||
|
Compensation and benefits |
|
$ |
45,875 |
|
$ |
24,036 |
|
Other accruals |
|
|
56,054 |
|
|
54,008 |
|
|
|
$ |
101,929 |
|
$ |
78,044 |
7. Long‑Term Debt
The following reflects outstanding long‑term debt as of December 31 (in thousands):
|
|
|
2017 |
|
2016 |
||
|
Term Loan Facility (1) |
|
$ |
916,902 |
|
$ |
626,753 |
|
Less: current portion |
|
|
(9,465) |
|
|
(6,450) |
|
|
|
$ |
907,437 |
|
$ |
620,303 |
|
(1) |
Net of $6.0 million and $6.3 million original issue discount at December 31, 2017 and 2016, respectively, and $14.2 million and $11.9 million of finance costs at December 2017 and 2016, respectively. |
The aggregate future maturities of long‑term debt at December 31, 2017, were as follows (in thousands):
|
2018 |
|
$ |
9,465 |
|
|
2019 |
|
|
9,465 |
|
|
2020 |
|
|
9,465 |
|
|
2021 |
|
|
9,465 |
|
|
2022 |
|
|
9,465 |
|
|
Thereafter |
|
|
889,758 |
|
|
Total |
|
$ |
937,083 |
|
Existing Senior Secured Credit Facilities
On November 8, 2016, CWGS Group, LLC, a wholly owned subsidiary of CWGS, LLC, entered into a new $680.0 million senior secured credit facility (“Existing Senior Secured Credit Facilities”) and used the proceeds to repay its previous senior secured credit facilities (“Previous Senior Secured Credit Facilities”). The Existing Senior Secured Credit Facilities consists of a seven-year $645.0 million Term Loan Facility (“Existing Term Loan Facility”) and a five-year $35.0 million revolving credit facility (“Existing Revolving Credit Facility”). On March 17, 2017, CWGS Group, LLC entered into an First Amendment to the Existing Senior Secured Credit Facilities to increase the Existing Term Loan Facility by $95.0 million to $740.0 million. On October 6, 2017, CWGS Group, LLC entered into a Second Amendment (the “Second Amendment”) to the Credit Agreement. The Second Amendment, among other things, (i) increased the Borrower’s term loan facility by $205.0 million to an outstanding principal amount of $939.5 million, (ii) amended the applicable margin to 2.00% from 2.75% per annum, in the case of base rate loans, and to 3.00% from 3.75% per annum, in the case of LIBOR loans, and (iii) increased the quarterly amortization payment to $2.4 million.
Interest on the Existing Term Loan Facility floated at the Company’s option at a) LIBOR multiplied by the statutory reserve rate (such product, the “Adjusted LIBOR Rate”), subject to a 0.75% floor, plus an applicable margin of 3.00%, or b) an Alternate Base Rate (“ABR”) equal to 2.00% per annum plus the greater of: (i) the prime rate published by The Wall Street Journal (the “WSJ Prime Rate”), (ii) federal funds effective rate plus 0.50%, or (iii) on-month Adjusted LIBOR Rate plus 1.00%, subject to a 1.75% floor. Interest on borrowings under the Existing Revolving Credit Facility is at the Company’s option of a) 3.25% to 3.50% per annum subject to a 0.75% floor in the case of a Eurocurrency loan, or b) 2.25% to 2.50% per annum plus the greater of the WSJ Prime Rate, federal funds effective rate plus 0.50%, or one-month Adjusted LIBOR Rate plus 1.00% in the case of an ABR loan, based on the Company’s total leverage ratio as defined in the
138
Existing Senior Secured Credit Facilities. The Company also pays a commitment fee of 0.5% per annum on the unused amount of the Existing Senior Secured Credit Facility. Reborrowings under the Existing Term Loan Facility are not permitted. The Existing Term Loan Facility, as amended, included mandatory principal payment in equal quarterly installments of $1.9 million, starting March 31, 2017 through September 30, 2017, and $2.4 million thereafter.
Following the end of each fiscal year, commencing with the fiscal year ending December 31, 2017, the Company is required to prepay the term loan borrowings in an aggregate amount equal to 50% of excess cash flow, as defined in the Existing Senior Secured Credit Facilities, for such fiscal year. The required percentage prepayment of excess cash flow is reduced to 25% if the total leverage ratio, as defined, is 1.50 to 1.00 or greater but less than 2.00 to 1.00. If the total leverage ratio is less than 1.50 to 1.00, no prepayment of excess cash flow is required. As of December 31, 2017, CWGS Group, LLC had no excess cash flows as defined.
The Existing Revolving Credit Facility matures on November 8, 2021, and the Existing Term Loan Facility matures on November 8, 2023. The funds available under the Existing Revolving Credit Facility may be utilized for borrowings or letters of credit; however, a maximum of $15.0 million may be allocated to such letters of credit. As of December 31, 2017, the interest rate on the term debt was 4.39%. As of December 31, 2017, the Company had available borrowings of $31.8 million and letters of credit in the aggregate amount of $3.2 million outstanding under the Existing Revolving Credit Facility. As of December 31, 2017, the principal balance of $937.1 million was outstanding under the Existing Term Loan Facility and no amounts were outstanding on the Existing Revolving Credit Facility.
CWGS, LLC and CWGS Group, LLC have no revenue-generating operations of their own. Their ability to meet the financial obligations associated with the Existing Senior Secured Credit Facilities is dependent on the earnings and cash flows of its operating subsidiaries, primarily Good Sam Enterprises, LLC and FR, and their ability to upstream dividends. The Existing Senior Secured Credit Facilities are fully and unconditionally guaranteed, jointly and severally, on a senior secured basis by each of the Company’s existing and future domestic restricted subsidiaries with the exception of FR and its subsidiaries. The Existing Senior Secured Credit Facilities contain certain restrictive covenants including, but not limited to, mergers, changes in the nature of the business, acquisitions, additional indebtedness, sales of assets, investments, and the prepayment of dividends subject to certain limitations and minimum operating covenants. Additionally, management has determined that the Existing Senior Secured Credit Facilities include subjective acceleration clauses which could impact debt classification. Management has determined that neither the Restatement (see Note 1 — Summary of Significant Accounting Policies — Restatement to Prior Periods) nor the internal control material weaknesses would trigger a subjective acceleration clause. The Company was in compliance with all debt covenants at December 31, 2017.
Previous Senior Secured Credit Facilities
On November 20, 2013, CWGS Group, LLC entered into the $545.0 million Previous Senior Secured Credit Facilities consisting of a $525.0 million term loan facility (the “Previous Term Loan Facility”), at an original issue discount of $5.3 million or 1.00%, and a $20.0 million revolving credit facility (the “Previous Revolving Credit Facility”). In December 2014 and December 2015, CWGS Group, LLC secured an additional $117.0 million and $55.0 million, respectively, of term loan borrowings under the Previous Senior Secured Credit Facilities for which the proceeds were primarily used to purchase dealerships within FreedomRoads. In June 2015, CWGS Group, LLC secured an additional $95.0 million of term loan borrowings under the Previous Senior Secured Credit Facilities for which the proceeds were primarily used to pay distributions to the CWGS, LLC members. On September 21, 2016, the Company amended the Previous Senior Secured Credit Facilities to, among other things, amend the change of control definition and other technical changes to facilitate its transition to a public company, provide additional borrowings of $135.0 million under the Previous Term Loan Facility, increasing the Previous Term Loan Facility to $828.2 million, net of original issue discount and finance costs totaling $16.5 million, and to permit a distribution of a portion of the proceeds to the members of CWGS, LLC. The net proceeds were used to fund a $100.0 million special cash distribution to the members of CWGS, LLC on September 21, 2016, and the remainder of the proceeds were to be used for general corporate purposes, including the potential acquisition of dealerships.
139
Interest on the Previous Term Loan Facility floated at the Company’s option at a) LIBOR, subject to a 1.00% floor, plus an applicable margin of 4.75%, or b) an ABR equal to 3.75% per annum plus the greater of the WSJ Prime Rate, federal funds effective rate plus 0.50%, LIBOR, or 2.00%. Interest on borrowings under the Previous Revolving Credit Facility was at the Company’s option of a) 4.25% to 4.50% per annum subject to a 1.00% floor in the case of a Eurocurrency loan, or b) 3.25% to 3.50% per annum plus the greater of the WSJ Prime Rate, federal funds effective rate plus 0.50%, LIBOR, or 2.00% in the case of an ABR loan, based on the Company’s ratio of net debt to consolidated earnings as defined in the Previous Senior Secured Credit Facilities. The Company also paid a commitment fee of 0.5% per annum on the unused amount of the Previous Revolving Credit Facility. Reborrowings under the Previous Term Loan Facility were not permitted. The quarterly scheduled principal prepayments on the term loan borrowings were $8.9 million. CWGS Group, LLC was required to prepay the term loan borrowings in an aggregate amount equal to 50% of excess cash flow, as defined in the Previous Senior Secured Credit Facilities, for such fiscal year. The required percentage prepayment of excess cash flow was reduced to 25% if the total leverage ratio, as defined, was 2.00 to 1.00 or greater but less than 2.50 to 1.00. If the total leverage ratio was less than 2.00 to 1.00, no prepayment of excess cash flow was required. As of December 31, 2015, CWGS Group, LLC’s excess cash flow offer, as defined, was $16.1 million and was presented to the term loan holders. The holders accepted $12.0 million of the prepayment offer and a principal payment in that amount was made on May 9, 2016.
On October 13, 2016, CWGS Group, LLC repaid $200.4 million of the then outstanding borrowings on the Previous Term Loan Facility from the proceeds of the capital contribution made by CWH with the proceeds from the Company’s IPO, see Note 18 — Stockholders’ Equity. On November 8, 2016, CWGS Group, LLC used the proceeds from the Existing Senior Secured Credit Facilities to repay and terminate the Previous Senior Secured Credit Facilities.
Enterprise Notes
On February 15, 2011, the Company entered into a securities purchase agreement under which CWGS, LLC issued $80.0 million of Series A Notes and a $70.0 million Series B Note due 2018 (the Enterprise Notes) to CVRV Acquisition, LLC, a Delaware limited liability company (“CVRV”) on March 2, 2011. Interest on the Enterprise Notes was due each March 31, June 30, September 30 and December 31 commencing June 30, 2011. On March 2, 2011, CVRV, the holder of the Series B Note, received an option from CWGS Holding, LLC, the direct parent of the Company, to purchase 70,000 preferred units of CWGS, LLC, which represented 44.999% of the Company’s equity interests, at an aggregate price of $70.0 million through the delivery to the Company of the Series B Note. The option could be exercised from and after the earlier of: (i) the fourth anniversary of the date of the agreement; (ii) the date on which the Company provides written notice that CVRV can exercise the option; or (iii) the tenth anniversary of the date of the agreement. The Series A Notes and the Series B Note were the two freestanding instruments issued in the securities purchase agreement entered into with CVRV. The option was not separately exercisable from the Series B Note and therefore has been included as an embedded feature in the Series B Note. The Company calculated the fair value of the respective Enterprise Notes on the issuance date and used the determined relative fair values to allocate the $150 million in proceeds between the Series A Notes and the Series B Note. The Enterprise Notes were subsequently measured at amortized cost using the effective interest method. The Company valued and recorded the Series A Notes at $68.1 million, a discount of $11.9 million, and the Series B Note at $81.9 million, a premium of $11.9 million.
Interest on the Series A Notes was 3.00% per quarter provided that, upon the occurrence and continuance of an event of default, the outstanding principal together with any overdue and unpaid interest would bear interest at a rate equal to 3.75% per quarter until the event of default is cured or waived. Interest on the Series B Note was 3.00% per quarter provided that the Company was entitled to elect to not pay the accrued interest on the Series B Note for up to twelve quarters in the aggregate. If the Company elected or otherwise failed to pay all accrued interest on the Series B Note in cash for any quarter, then the outstanding principal amount together with all accrued and unpaid interest would bear interest at a rate equal to 3.25%, provided that (i) if the Company elected not to or otherwise failed to pay all accrued interest on the Series B Note in cash for any quarter in excess of six quarters in the aggregate (whether or not consecutive), or (ii) upon the occurrence and continuance of an event of default, the outstanding principal together with any overdue and unpaid interest would bear interest at a rate equal to 3.75% per quarter until the event of default is cured or waived.
140
The Company used the net proceeds of $150.0 million from the issuance of the Enterprise Notes to: (i) permanently repay all of the outstanding indebtedness under FreedomRoads related party debt of $27.0 million, a term loan note payable of $27.0 million, a swap term loan of $4.6 million, and interest on debt of $0.3 million; (ii) make an $85.0 million distribution to its member, and (iii) pay related fees and expenses in connection with the foregoing transactions.
The Company elected not to pay the accrued interest on the Series B Note for the period from June 2011 to September 2013. In November 2013, the Company used the proceeds of the Previous Senior Secured Credit Facilities to pay the $31.4 million of outstanding accrued interest on the Series B Note. The Company elected to pay the quarterly interest each quarter beginning December 31, 2013. The Company repaid the $80.0 million Series A Notes in full on November 20, 2013 from the proceeds of the Previous Senior Secured Credit Facilities and the remaining unamortized discount of $5.4 million on the Series A Notes was written off and recorded to Loss on Debt Repayment.
On September 30, 2014, CVRV exercised their option and delivered the Series B Note to the Company for cancellation in exchange for the equity interest. Upon surrender and cancellation of the $70.0 million Series B Note, the remaining unamortized premium of $3.4 million was written off to Members’ Deficit.
Since the exchange of the Series B Note for the preferred equity interest in CWGS, LLC and continuing through October 6, 2016, CVRV, as the holder of the preferred equity interest, received a preferred return equal to 3.00% of CVRV’s unrecovered capital contribution in CWGS, LLC, which has been paid quarterly. Preferred return payments of $6.4 million, and $8.4 million were paid for the years ended December 31, 2016 and 2015, respectively.
8. Capital Lease Obligations
The Company leases various fixed assets under capital lease arrangements requiring payments through May 2019. For the year ended December 31, 2016, $2.0 million was funded by capital leases. For the years ended December 31, 2017 and 2015, there were no new third-party capital lease arrangements. The depreciation of the capital lease assets is included in depreciation. The Company has included these leases in property and equipment, net at December 31, as follows (in thousands):
|
|
|
2017 |
|
2016 |
||
|
Furniture and equipment |
|
$ |
5,741 |
|
$ |
5,741 |
|
Accumulated depreciation |
|
|
(4,379) |
|
|
(3,449) |
|
|
|
$ |
1,362 |
|
$ |
2,292 |
The following is a schedule by year of future minimum lease payments (in thousands) under the capitalized leases, together with the present value of net minimum lease payments at December 31, 2017 (including current portion of $0.8 million):
|
2018 |
|
$ |
863 |
|
2019 |
|
|
23 |
|
|
|
|
886 |
|
Interest |
|
|
(19) |
|
|
|
$ |
867 |
9. Right to Use Liability
The Company leases operating facilities throughout the United States. The Company analyzes all leases in accordance with Accounting Standards Codification (“ASC”) 840 — Leases. In the first quarter of 2016, two leases were accounted for as operating leases after completion of construction as they qualified for asset derecognition under the sales-leaseback accounting rules. In the third quarter of 2016, one lease was derecognized and accounted for as an operating lease after a reduction in the lease deposit to less than two months’ rent, as it qualifies for asset derecognition. The derecognitions in 2016 resulted in the removal of
141
$20.1 million of right to use assets, and $20.0 million of right to use liabilities, and $0.1 million of deferred gain which will be recognized ratably as an offset to rent expense over the term of the leases. In 2015, twenty-five of the leases had construction projects for which the Company was deemed to be the owner. Eighteen leases were accounted for as finance leases after completion of the construction as they did not qualify for sale accounting under the sale‑leaseback accounting rules. Seven leases were accounted for as operating leases after completion of construction as they qualified for asset derecognition under the sale‑leaseback accounting rules. An additional eighteen leases were accounted for as capital leases based on capital lease accounting rules. For both the financing and capital leases, the value of the real property, other than land was capitalized as a right to use asset with a corresponding right to use liability. To the extent land was less than twenty‑five percent of the value of the total real property, land was capitalized as a right to use asset with a corresponding right to use liability. In the fourth quarter of 2015, the Company modified the terms of certain leases. As a result of the modifications, thirty leases met the requirements to be reported as operating leases and therefore the right to use assets and corresponding right to use liabilities were derecognized in the fourth quarter of 2015. This derecognition resulted in the removal of $122.4 million of right to use assets, and $127.0 million of right to use liabilities and $4.6 million of deferred gain, which will be recognized ratably as an offset to rent expense over the term of the leases.
The Company has included the right to use assets in property and equipment, net at December 31, as follows (in thousands):
|
|
|
2017 |
|
2016 |
||
|
Right to use assets |
|
$ |
10,673 |
|
$ |
10,673 |
|
Accumulated depreciation |
|
|
(926) |
|
|
(667) |
|
|
|
$ |
9,747 |
|
$ |
10,006 |
The following is a schedule by year of the future changes in the right to use liability (in thousands):
|
2018 |
|
$ |
583 |
|
2019 |
|
|
486 |
|
2020 |
|
|
486 |
|
2021 |
|
|
487 |
|
2022 |
|
|
487 |
|
Thereafter (1) |
|
|
13,325 |
|
Total minimum lease payments |
|
|
15,854 |
|
Amounts representing interest |
|
|
(5,661) |
|
Present value of net minimum right to use liability payments |
|
$ |
10,193 |
(1) Includes $5.0 million of scheduled derecognition of right to use liability due to reductions in the lease deposit to less than two months’ rent.
10. Income Taxes
The components of the Company’s income tax expense from operations for the year ended December 31, consisted of (in thousands):
|
|
|
2017 |
|
2016 |
|
2015 |
|||
|
Current: |
|
|
|
|
|
|
|
|
|
|
Federal |
|
$ |
26,730 |
|
$ |
468 |
|
$ |
139 |
|
State |
|
|
5,632 |
|
|
1,259 |
|
|
1,398 |
|
Deferred: |
|
|
|
|
|
|
|
|
|
|
Federal |
|
|
92,441 |
|
|
4,045 |
|
|
(162) |
|
State |
|
|
32,179 |
|
|
135 |
|
|
(19) |
|
Income tax expense |
|
$ |
156,982 |
|
$ |
5,907 |
|
$ |
1,356 |
142
A reconciliation of income tax expense from operations to the federal statutory rate for the year ended December 31, is as follows (in thousands):
|
|
|
2017 |
|
2016 |
|
2015 |
|||
|
Income taxes computed at federal statutory rate(1) |
|
$ |
136,485 |
|
$ |
73,200 |
|
$ |
61,161 |
|
State income taxes – net of federal benefit(1) |
|
|
13,723 |
|
|
7,347 |
|
|
7,196 |
|
Other differences: |
|
|
|
|
|
|
|
|
|
|
Federal alternative minimum tax and state and local taxes on pass-through entities |
|
|
1,072 |
|
|
1,013 |
|
|
1,179 |
|
Income taxes computed at the effective federal and state statutory rate for pass-through entities not subject to tax for the Company (2) |
|
|
(86,200) |
|
|
(76,702) |
|
|
(68,940) |
|
Increase in valuation allowance |
|
|
11,194 |
|
|
1,049 |
|
|
735 |
|
Impact of 2017 Tax Act (3) |
|
|
79,987 |
|
|
— |
|
|
— |
|
Other |
|
|
721 |
|
|
— |
|
|
25 |
|
Income tax expense |
$ |
156,982 |
$ |
5,907 |
$ |
1,356 | |||
|
(1) |
Federal and state tax for 2017 include the tax effect of $38,399 relating to the reduction in the Tax Receivable Agreement liability. |
|
(2) |
The related income is taxable to the noncontrolling interest for periods after the Company’s IPO and taxable to the holders of membership units prior to the Company’s IPO. |
|
(3) |
Excludes the tax effect of $38,399 for 2017 relating to the reduction in the Tax Receivable Agreement liability, which is included in federal and state tax. |
Deferred income taxes reflect the net tax effects of temporary differences between the carrying amounts of assets and liabilities for financial reporting purposes and the amounts used for income tax purposes and operating loss and tax credit carryforwards. Significant items comprising the net deferred tax assets at December 31, were (in thousands):
|
|
|
2017 |
|
2016 |
|
||
|
|
|
|
|
|
Restated |
|
|
|
Deferred tax liabilities |
|
|
|
|
|
|
|
|
Accelerated depreciation |
|
$ |
(8,227) |
|
$ |
(4,655) |
|
|
Prepaid expenses |
|
|
(289) |
|
|
(358) |
|
|
Other |
|
|
(293) |
|
|
(57) |
|
|
|
|
|
(8,809) |
|
|
(5,070) |
|
|
Deferred tax assets |
|
|
|
|
|
|
|
|
Investment impairment |
|
|
20,674 |
|
|
30,680 |
|
|
Gift cards |
|
|
710 |
|
|
969 |
|
|
Deferred revenues |
|
|
304 |
|
|
355 |
|
|
Accrual for employee benefits and severance |
|
|
1,166 |
|
|
1,246 |
|
|
Stock option expense |
|
|
209 |
|
|
55 |
|
|
Investment in partnership |
|
|
208,167 |
|
|
116,318 |
|
|
Tax Receivable Agreement liability |
|
|
34,802 |
|
|
7,387 |
|
|
AMT credit |
|
|
584 |
|
|
1,049 |
|
|
Net operating loss carryforward |
|
|
16,733 |
|
|
8,512 |
|
|
Claims reserves |
|
|
420 |
|
|
547 |
|
|
Intangible assets |
|
|
108 |
|
|
70 |
|
|
Goodwill |
|
|
996 |
|
|
1,898 |
|
|
Deferred book gain |
|
|
813 |
|
|
1,337 |
|
|
Other reserves |
|
|
5,380 |
|
|
5,339 |
|
|
|
|
|
291,066 |
|
|
175,762 |
|
|
Valuation allowance |
|
|
(126,706) |
|
|
(146,259) |
|
|
Net deferred tax assets |
|
$ |
155,551 |
|
$ |
24,433 |
|
143
CWH is organized as a Subchapter C corporation and, on October 6, 2016, as part of the Company’s IPO, became a 22.6% owner of CWGS, LLC (see Note 18 — Stockholders’ Equity). At December 31, 2017, CWH owned 41.5% of CWGS, LLC. CWGS, LLC is organized as a limited liability company and treated as a partnership for federal tax purposes, with the exception of Americas Road and Travel Club, Inc., CW, and FreedomRoads RV, Inc. and their wholly-owned subsidiaries, which are Subchapter C corporations. At December 31, 2017, the Subchapter C corporations had federal net operating loss carryforwards of approximately $60.7 million, which will be able to offset future taxable income. If not used, the net operating loss carryforwards will expire between 2029 through 2037.
The Company is subject to federal and state income taxes. Tax laws, regulations, and administrative practices in various jurisdictions may be subject to significant change, with or without notice, due to economic, political, and other conditions, and significant judgment is required in evaluating and estimating the Company’s provision and accruals for these taxes. In addition, a number of jurisdictions in which the Company is subject to tax are actively pursuing changes to their tax laws applicable to corporate taxpayers, such as the recently enacted U.S. tax reform legislation commonly referred to as the U.S. Tax Cuts and Jobs Act of 2017 (the “2017 Tax Act”). The 2017 Tax Act was signed into law on December 22, 2017. The 2017 Tax Act significantly revises the U.S. corporate income tax by, among other things, lowering the statutory corporate tax rate from 35% to 21% and eliminating certain deductions. The 2017 Tax Act also enhanced and extended through 2026 the option to claim accelerated depreciation deductions on qualified property. As of December 31, 2017, the Company had not completed its accounting for the tax effects of the enactment of the 2017 Tax Act on its tax accruals. However, the Company has reasonably estimated the effects of the 2017 Tax Act and recorded provisional amounts in its financial statements as of December 31, 2017. The final impact of the 2017 Tax Act may differ from these estimates, due to, among other things, changes in interpretations, analysis and assumptions made by management, additional guidance that may be issued by the U.S. Department of the Treasury and the Internal Revenue Service, and any updates or changes to estimates the Company has utilized to calculate the transition impact. Therefore, the Company’s accounting for the elements of the 2017 Tax Act is incomplete. However, the Company was able to make reasonable estimates of the effects of the 2017 Tax Act. Pursuant to the SEC Staff Accounting Bulletin No. 118 (“SAB 118”), the Company's measurement period for implementing the accounting changes required by the 2017 Tax Act will close before December 22, 2018 and the Company anticipates completing the accounting under ASC Topic 740, Income Taxes, in a subsequent reporting period within the measurement period.
On December 22, 2017, SAB 118 was issued to address the application of US GAAP in situations when a registrant does not have the necessary information available, prepared, or analyzed (including computations) in reasonable detail to complete the accounting for certain income tax effects of the 2017 Tax Act. In accordance with SAB 118, the Company has determined that the $118.4 million of the deferred tax expense recorded in connection with the remeasurement of certain deferred tax assets and liabilities was a provisional amount and a reasonable estimate at December 31, 2017. As the Company completes its analysis of the 2017 Tax Act, collect and prepare necessary data, and interpret any additional guidance issued by the U.S. Treasury Department, the IRS, and other standard-setting bodies, the Company may make adjustments to the provisional amounts. Any subsequent adjustment to these amounts will be recorded to current tax expense in the quarter of 2018 when the analysis is complete.
The increase in the amount of income tax expense in 2017 compared to 2016 is primarily due the impact of the 2017 Tax Act described above, the increased profitability of the Company, and its increased ownership in CWGS, LLC.
The increase in the net deferred tax assets in 2017 is primarily due to an increase in the Company’s Outside Basis Deferred Tax Asset from the redemption of common units in CWGS, LLC for shares of Class A common stock, an increase in the liability for payments due under the tax receivable agreement discussed below, and an increase in net operating losses from its Subchapter C corporations. The Company evaluates its deferred tax assets on a quarterly basis to determine if they can be realized and establishes valuation allowances when it is more likely than not that all or a portion of the deferred tax assets may not be realized. At December 31, 2017, the Company determined that all of its deferred tax assets (except those of CW and the Outside Basis Deferred Tax Asset discussed below) are more likely than not to be realized. The valuation allowance for CW and its subsidiaries after remeasurement under the 2017 Tax Act decreased by $6.4 million in the year ended December 31, 2017, compared to an increase of $1.0 million in the year ended December
144
31, 2016. CW’s net deferred tax assets increased during those years, but since it was determined CW would not have sufficient taxable income in the current or carryforward periods under the tax laws to realize the future tax benefits of its deferred tax assets, it continues to maintain a full valuation allowance. The Company maintains a partial valuation allowance against the portion of the Outside Basis Deferred Tax Asset that is not amortizable for tax purposes, since the Company would likely only realize the non-amortizable portion of the Outside Basis Deferred Tax Asset if the investment in CWGS, LLC was divested. The partial valuation allowance for the Outside Basis Deferred Tax Asset decreased $13.2 million in the year ended December 31, 2017 primarily as a result of the remeasurement under the 2017 Tax Act of $47.0 million, which was partially offset by an increase in the valuation allowance for additional outside basis in CWGS, LLC for the public offering in May 2017 (see Note 18 — Stockholders’ Equity) that was not amortizable for tax purposes.
During the year ended December 31, 2017, CW was notified by the Internal Revenue Service of their intention to audit the 2014 income tax returns. The 2014 audit concluded with no adjustments. Also during the year ended December 31, 2017, CWGS, LLC was notified by a state revenue department of their intention to audit the 2014 and 2015 state income tax returns. The Company does not expect to receive any material tax adjustments as a result of this pending audit. The Company and its subsidiaries file U.S. federal income tax returns and tax returns in various states. With few exceptions, the Company is no longer subject to U.S. federal, state, and local income tax examinations by tax authorities for years before 2014.
The provision for income tax for the entities subject to federal income tax has been included in the consolidated financial statements. The income tax is based on the amount of taxes due on their tax returns plus deferred taxes computed based on the expected future tax consequences of temporary differences between the carrying amounts and tax basis of assets and liabilities, using expected tax rates.
The Company recognizes the tax benefit from an uncertain tax position only if it is more likely than not that the tax position will be sustained on examination by the taxing authorities based on the technical merits of the position. The tax benefits recognized in the consolidated financial statements on a particular tax position are measured based on the largest benefit that has a greater than a 50% likelihood of being realized upon settlement. The amount of unrecognized tax benefits is adjusted as appropriate for changes in facts and circumstances, such as significant amendments to existing tax law, new regulations or interpretations by the taxing authorities, new information obtained during a tax examination, or resolution of an examination. As of December 31, 2017 and 2016, the Company had no uncertain tax positions. The Company did not recognize any interest or penalties relating to income taxes for the years ended December 31, 2017, 2016, and 2015.
On October 6, 2016, the Company entered into a tax receivable agreement (the “Tax Receivable Agreement”) that provides for the payment by the Company to the Continuing Equity Owners and Crestview Partners II GP, L.P. of 85% of the amount of tax benefits, if any, the Company actually realizes, or in some circumstances is deemed to realize, as a result of (i) increases in the tax basis from the purchase of common units from Crestview Partners II GP, L.P. in exchange for Class A common stock in connection with the consummation of the IPO and the related transactions and any future redemptions that are funded by the Company and any future redemptions or exchanges of common units by Continuing Equity Owners as described above and (ii) certain other tax benefits attributable to payments made under the Tax Receivable Agreement. CWGS intends to make Section 754 of the Internal Revenue Code effective for each tax year in which a redemption or exchange (including a deemed exchange) of common units for cash or stock occur. These tax benefit payments are not conditioned upon one or more of the Continuing Equity Owners or Crestview Partners II GP, L.P. maintaining a continued ownership interest in CWGS, LLC. In general, the Continuing Equity Owners’ or Crestview Partners II GP, L.P.’s rights under the Tax Receivable Agreement are assignable, including to transferees of its common units in CWGS, LLC (other than the Company as transferee pursuant to a redemption or exchange of common units in CWGS, LLC). The Company expects to benefit from the remaining 15% of the tax benefits, if any, which may be realized.
During the year ended December 31, 2016 and as part of the initial IPO, 1,698,763 common units in CWGS, LLC were exchanged for Class A common stock of the Company by Crestview Partners II GP, L.P. subject to the provisions of the Tax Receivable Agreement. Further, during the year ended December 31, 2017, 12,945,419 common units in CWGS, LLC were exchanged for Class A common stock of the Company by certain of the Continuing Equity Owners, subject to the provisions of the Tax Receivable Agreement. During 2017 and 2016, the Company recognized a liability for the Tax Receivable Agreement payments due
145
to the Continuing Equity Owners and Crestview Partners II GP, L.P., representing 85% of the aggregate tax benefits the Company expects to realize from the tax basis increases related to the exchange, after concluding it was probable that the Tax Receivable Agreement payments would be paid based on estimates of future taxable income. As of December 31, 2017, the amount of Tax Receivable payments due Crestview Partners II GP, L.P. and certain Continuing Equity Owners under the Tax Receivable Agreement increased to $137.7 million, of which $8.1 million was included in current portion of the tax receivable agreement liability in the Consolidated Balance Sheets.
The 2017 Tax Act had a significant impact on the future tax rates incorporated in the estimated values of the Tax Receivable Agreement liability and the Company’s deferred tax assets. For the year ended December 31, 2017, these changes in estimate had no impact on income from operations, decreased net income to a net loss by $18.6 million, and decreased basic and diluted earnings per share by $0.69.
11. Fair Value Measurements
Accounting guidance for fair value measurements establishes a three‑tier fair value hierarchy, which prioritizes the inputs used in measuring fair value. These tiers include Level 1, defined as observable inputs such as quoted prices in active markets; Level 2, defined as inputs other than quoted prices in active markets that are either directly or indirectly observable; and Level 3, defined as unobservable inputs in which little or no market data exists, therefore requiring an entity to develop its own assumptions.
For cash and cash equivalents; accounts receivable; other current assets; accounts payable; notes payable — floor plan, net; and other current liabilities the amounts reported in the accompanying Consolidated Balance Sheets approximate fair value due to their short-term nature or the existence of variable interest rates that approximate prevailing market rates.
There have been no transfers of assets or liabilities between the fair value measurement levels and there were no material re‑measurements to fair value during 2017 and 2016 of assets and liabilities that are not measured at fair value on a recurring basis.
The following table presents the reported carrying value and fair value information for the Company’s debt instruments. The fair values shown below for the Existing Term Loan Facility and Previous Term Loan Facility, as applicable, are based on quoted prices in the inactive market for identical assets (Level 2).
|
|
|
Fair Value |
|
12/31/2017 |
|
12/31/2016 |
||||||||
|
($ in thousands) |
|
Measurement |
|
Carrying Value |
|
Fair Value |
|
Carrying Value |
|
Fair Value |
||||
|
Term Loan Facility |
|
Level 2 |
|
$ |
916,902 |
|
$ |
953,269 |
|
$ |
626,753 |
|
$ |
649,838 |
12. Commitments and Contingencies
Leases
The Company holds certain property and equipment under rental agreements and operating leases that have varying expiration dates. A majority of its operating facilities are leased from unrelated parties throughout the United States. Future minimum annual fixed rentals under operating leases having an original term of more than one year as of December 31, 2017, were as follows (in thousands):
|
|
|
Third Party |
|
Related Party |
|
Total |
|||
|
2018 |
|
$ |
99,145 |
|
$ |
2,126 |
|
$ |
101,271 |
|
2019 |
|
|
96,248 |
|
|
2,126 |
|
|
98,374 |
|
2020 |
|
|
89,334 |
|
|
2,126 |
|
|
91,460 |
|
2021 |
|
|
85,644 |
|
|
2,127 |
|
|
87,771 |
|
2022 |
|
|
81,820 |
|
|
2,024 |
|
|
83,844 |
|
Thereafter |
|
|
691,385 |
|
|
20,770 |
|
|
712,155 |
|
Total |
|
$ |
1,143,576 |
|
$ |
31,299 |
|
$ |
1,174,875 |
146
For the years ended December 31, 2017, 2016, and 2015, $86.5 million, $74.5 million, and $61.5 million, of rent expense, respectively, was charged to costs and expenses.
A subsidiary of FreedomRoads has letters of credit of $0.4 million, which were required by certain leases. The letters of credit expire in August 2018. These letters of credit are issued under the Floor Plan Facility.
On December 5, 2001, GSE sold 11 real estate properties to 11 separate wholly owned subsidiaries of AGRP Holding Corp., a wholly owned subsidiary of the Company’s ultimate parent, AGI Holding Corp., for $52.3 million in cash and a note receivable. The properties were leased back to the Company on a triple‑net basis. Both the sales price and lease rates were based on market rates determined by third‑party independent appraisers engaged by the mortgage lender and approved by the Previous Senior Secured Credit Facilities agent bank. These leases had an initial term of 25 to 27 years with two 5‑year renewal options at the then‑current market rent. The leases were classified as operating leases in accordance with accounting guidance for accounting for leases. Land and buildings with a net book value totaling $45.8 million were removed from the balance sheet. The transaction resulted in a net gain of $6.1 million consisting of a $12.1 million gain on certain properties and a $6.0 million loss on other properties. In accordance with accounting principles generally accepted in the United States, the $6.0 million loss was recognized upon the date of sale in 2001 and the $12.1 million gain was deferred and will be credited to income as rent expense adjustments over the lease terms. The average net annual lease payments over the lives of the leases were $3.4 million.
On December 29, 2011, AGRP Holding Corp. sold 6 of the 11 real estate properties to a third party. In 2012, AGRP Holding Corp. sold two real estate properties to a third party (one on January 9, 2012, and one on December 28, 2012). The leases on the real estate properties sold in 2012 were terminated. In June 2013, AGRP Holding Corp. sold an additional real estate property to a third party. In February 2014, AGRP Holding Corp. sold the remaining two real estate properties to a third party. As of December 31, 2017 and 2016, $4.6 million and $5.1 million, respectively, of deferred gain remains and will be recognized over the remaining lease terms.
In 2006, a subsidiary of FreedomRoads entered into sale‑leaseback arrangements. Under these arrangements, FreedomRoads sold real property and leased it back for a period of 20 years. The leasebacks have been accounted for as operating leases. The gain of $6.4 million is being recognized ratably over the term of the leases. The income recognition (offset to rent expense) of the deferred credits totaled $0.3 million for each of the years ended December 31, 2017, 2016, and 2015.
In 2017, 2016 and 2015, a subsidiary of FreedomRoads entered into sale leaseback arrangements resulting in a loss of less than $0.1 million in 2017 and gains of $0.1 million and $0.4 million in 2016 and 2015, respectively. The real properties were originally purchased by FreedomRoads from third parties. In 2017, the Company sold real property of $6.0 million that were originally purchased in 2017 for $6.0 million. In 2016, the Company sold real property of $13.2 million that was originally purchased in 2016 for $11.9 million, in 2015 for $1.2 million and in 2014 for $0.1 million. In 2015, the Company sold real properties of $19.0 million that were originally purchased in 2015 for $18.1 million, and in 2014 for $0.9 million. Under the sale‑leaseback arrangements, the real properties were leased back under operating leases for a period of 20 years. The properties are being used as part of the Company’s ongoing operations.
Sponsorship and Other Agreements
The Company enters into sponsorship agreements from time to time. Current sponsorship agreements run through 2024. The agreements consist of annual fees payable in aggregate of $9.8 million in 2018, $10.2 million in 2019, $9.2 million in 2020, $9.5 million in 2021, $9.9 million in 2022, $1.5 million in 2023, and $1.5 million in 2024.
The Company entered into a subscription agreement in 2014. The subscription agreement consisted of total fees of $9.4 million payable as follows: $1.7 million in 2014, $1.6 million in 2015, $1.8 million in 2016, $2.1 million in 2017, and $2.2 million in 2018. The agreement was amended on October 28, 2016. The
147
amended subscription agreement consists of annual fees payable as follows: $4.0 million in 2017, $4.3 million in 2018, $4.5 million in 2019, $4.8 million in 2020, and $5.0 million in 2021.
Litigation
From time to time, the Company is involved in litigation arising in the normal course of business operations. The Company does not believe it is involved in any litigation that will have a material adverse effect on its results of operations or financial position.
Employment Agreements
The Company has employment agreements with certain officers. The agreements include, among other things, an annual bonus based on earnings before interest, taxes, depreciation and amortization, and up to one year’s severance pay beyond termination date.
13. Related Party Transactions
Monitoring Agreement
Crestview Advisors, L.L.C. and Stephen Adams (together, the “Managers” and each, a “Manager”) and the Company are parties to a monitoring agreement relating to each Manager’s monitoring of its (or its affiliate’s) investment in the Company. Pursuant to the monitoring agreement, the Company agreed to pay each of the Managers an aggregate per annum monitoring fee equal to $1.0 million, payable in quarterly installments of $250,000. In addition, the Company agreed to reimburse each Manager and its affiliates, employees and agents for up to an aggregate per annum amount of $250,000 for all reasonable fees and expenses incurred in connection with such Manager’s monitoring of its (or its affiliate’s) investment in the Company. The Company also agreed to indemnify each Manager and its respective affiliates from and against all losses, claims, damages and liabilities arising out of the performance by such Managers’ monitoring of its (or its affiliate’s) investment in the Company. The monitoring agreement was terminated in connection with the Company’s IPO on October 6, 2016.
Pursuant to the monitoring agreement, the Company incurred monitoring fees of $1.7 million and $2.0 million in the years ended December 31, 2016 and 2015, respectively. In addition, the Company recorded an expense for the Managers’ reimbursable expenses, totaling $0.2 million and $0.5 million for the years ended December 31, 2016 and 2015, respectively.
Transactions with Directors, Equity Holders and Executive Officers
Over the period from 2007 to 2011, various subsidiaries of FreedomRoads and certain entities owned by Stephen Adams conveyed real properties between each other resulting in a net receivable of $0.9 million due to FreedomRoads. In 2015, this receivable was distributed to CWGS Holding, LLC in the form of a non‑cash distribution.
FreedomRoads leases various retail locations from managers and officers. During 2017, 2016 and 2015, the related party lease expense for these locations was $2.0 million, $1.2 million, and $2.0 million, respectively.
In January 2012, FreedomRoads entered into a lease (the “Original Lease”) with respect to the Company’s Lincolnshire, Illinois offices, which has since been amended as of March 2013 in connection with the Company’s leasing of additional premises within the same office building (the “Expansion Lease”). The Original Lease is payable in 132 monthly payments of base rent equal to approximately $29,000, commencing April 2013, subject to annual increases. The Expansion Lease is payable in 132 monthly payments of base rent equal to approximately $2,500, commencing May 2013, subject to annual increases. Marcus Lemonis, the Company’s Chairman and Chief Executive Officer, has personally guaranteed both leases.
148
In September 2014, Marcus Lemonis, individually and as trustee of the Marcus Lemonis Revocable Trust (“MLRT”), entered into a revolving loan with The Privatebank and Trust Company (“Privatebank”). In connection with the revolving loan, Mr. Lemonis and MLRT entered into a profits unit pledge agreement (the Pledge Agreement) with Privatebank under which Mr. Lemonis pledged 4,667 Profits Units in the Company to secure the revolving loan (See Note 20 — Equity-based Compensation). The Company also entered into a purchase, sale and put agreement (the “Put Agreement”) with Privatebank that granted Privatebank the right to put the loan to the Company upon the occurrence of an event of default pursuant to the Pledge Agreement. Prior to exercising any rights under the Put Agreement, Privatebank was required to provide notice to the Company and the Company had the right to purchase the pledged Profits Units for an amount equal to the lesser of (a) $12.0 million or (b) the outstanding principal amount of the revolving loan. On April 4, 2016, the Pledge Agreement and the Put Agreement were terminated.
Until December 31, 2015, the Company had use of an aircraft owned by Adams Offices, LLC, an entity owned by AGI Holding Corp., an entity controlled by Stephen Adams, in which he has a 100% economic interest, for the purpose of operating flights incidental to the Company’s business. The Company incurred expenses for the aircraft of $1.0 million for the year ended December 31, 2015.
On June 13, 2016, the board of directors of CWGS, LLC declared a $42.7 million distribution comprising of (i) the assignment of its equity interest in AutoMatch USA, LLC (‘‘AutoMatch’’), an indirect wholly-owned subsidiary of CWGS, LLC, to CWGS Holding, LLC and CVRV Acquisition LLC, each a member of CWGS, LLC, in the form of a $38.8 million non-cash distribution, and (ii) a $3.8 million cash distribution to the Profits Units of which $3.6 million was paid on June 17, 2016 and $0.2 million was paid on September 7, 2016. In connection with the AutoMatch distribution, AutoMatch and FreedomRoads, LLC, an indirect wholly-owned subsidiary of CWGS, LLC, entered into a Transition Services Agreement (the "Transition Services Agreement") whereby, for a period of up to one hundred twenty days following the distribution of AutoMatch, FreedomRoads, LLC will continue to provide administrative, employee and operational support to AutoMatch in the same manner as provided prior to such distribution and AutoMatch will be operated and managed by employees of FreedomRoads, LLC, in exchange for reimbursement by AutoMatch of all expenses incurred by FreedomRoads, LLC in connection therewith. On September 7, 2016, the board of directors of CWGS, LLC declared a $1.6 million distribution, representing the final net settlement amount under the Transition Services Agreement, which was paid on the same day.
See also Note 7 — Long‑Term Debt for private placement of securities (Enterprise Notes).
Other Transactions
Cumulus Media Inc. (“Cumulus Media”) has provided radio advertising for the Company through Cumulus Media’s subsidiary, Westwood One, Inc. Crestview Partners II GP, L.P., an affiliate of CVRV, is the beneficial owner of Cumulus Media’s Class A common stock, according to Crestview Partners II GP, L.P.’s most recently filed Schedule 13D amendment with respect to the company. For the years ended December 31, 2017, 2016 and 2015, the Company incurred Cumulus Media expenses of $0.4 million, $0, and $0.6 million for the aforementioned advertising services.
On July 1, 2010, Camping World and Adams Outdoor Advertising Marketing Company (Adams Outdoor), an entity controlled by Stephen Adams, entered into an agreement pursuant to which Camping World has the right to use Adams Outdoors’ outdoor advertising space at cost on billboards that become available because the billboards would otherwise be vacant. Camping World made a deposit of $1.0 million with Adams Outdoor in an account controlled by Adams Outdoor on July 1, 2010 and as vacant billboards are utilized by Camping World, the usage cost is applied against the deposit. No vacant billboard space was used by Camping World. In December 2015, the agreement was assigned to AGI Holding Corp., an entity controlled by Stephen Adams, in which he has a 100% economic interest, and the Company distributed the $1.0 million deposit in the form of a non‑cash distribution.
The Company does business with certain companies in which Mr. Lemonis has a direct or indirect material interest. From time to time the Company has arranged for temporary staffing and consulting services from eNET IT Group, LLC (“eNET IT Group”). Mr. Lemonis had a 51% economic interest with eNET IT Group as of December 31, 2016, and has subsequently dissolved his relationship with them. The Company paid
149
eNET IT Group approximately $0.1 million, and $0.6 million for the years ended December 31, 2016, and 2015, respectively, primarily for third-party temporary staffing arranged by eNET IT Group. eNET IT Group, in turn, paid the third-party temporary staffing directly. Additionally, the Company purchased fixtures for interior store sets at the Company’s retail locations from Precise Graphix. Mr. Lemonis has a 33% economic interest in Precise Graphix and the Company incurred expenses from Precise Graphix $2.7 million, $3.3 million and $1.7 million for the years ended December 31, 2017, 2016 and 2015, respectively.
14. Acquisitions
In 2017, 2016 and 2015, subsidiaries of the Company acquired the assets or stock of multiple dealership and retail locations and consumer shows that constituted businesses under accounting rules. The Company used a combination of cash, floor plan financing, proceeds from the May 2017 Public Offering (defined and described in Note 18 — Stockholders’ Equity), and additional borrowing on the Existing Term Loan Facility in March 2017 (see Note 7 — Long-term Debt) to complete the acquisitions. The acquired businesses were recorded at their estimated fair values under the acquisition method of accounting. The balance of the purchase prices in excess of the fair values of net assets acquired were recorded as goodwill.
For the years ended December 31, 2017 and 2016, concurrent with the acquisition of dealership businesses, the Company purchased real properties for $17.1 million and $15.3 million, respectively, from parties related to the sellers of the dealership businesses. For the years ended December 31, 2017 and 2016, the Company sold other real properties to a third party in sale-leaseback transactions for $6.0 million and $15.9 million, respectively (See Note 12 – Commitments and Contingencies – Leases).
The estimated fair values of the assets acquired and liabilities assumed for the acquisitions of dealerships and consumer shows consist of the following:
|
|
|
Year Ended December 31, |
|
Estimated |
|||||
|
($ in thousands) |
|
2017 |
|
2016 |
|
Life |
|||
|
Tangible assets (liabilities) acquired (assumed): |
|
|
|
|
|
|
|
|
|
|
Accounts receivable |
|
$ |
1,250 |
|
$ |
944 |
|
|
|
|
Inventory |
|
|
121,808 |
|
|
36,285 |
|
|
|
|
Property and equipment |
|
|
1,450 |
|
|
823 |
|
|
|
|
Other assets |
|
|
164 |
|
|
175 |
|
|
|
|
Accounts payable |
|
|
(569) |
|
|
(2,231) |
|
|
|
|
Accrued liabilities |
|
|
(2,480) |
|
|
(329) |
|
|
|
|
Total tangible net assets acquired |
|
|
121,623 |
|
|
35,667 |
|
|
|
|
Intangible assets acquired: |
|
|
|
|
|
|
|
|
|
|
Membership and customer lists |
|
|
793 |
|
|
2,774 |
|
4-7 years |
|
|
Total intangible assets acquired |
|
|
793 |
|
|
2,774 |
|
|
|
|
Goodwill |
|
|
158,815 |
|
|
40,165 |
|
|
|
|
Purchase price |
|
|
281,231 |
|
|
78,606 |
|
|
|
|
Inventory purchases financed via floor plan |
|
|
(99,451) |
|
|
(28,942) |
|
|
|
|
Cash payment net of floor plan financing |
|
$ |
181,780 |
|
$ |
49,664 |
|
|
|
The fair values above are preliminary as they are subject to measurement period adjustments for up to one year from the date of acquisition as new information is obtained about facts and circumstances that existed as of the acquisition date. All of the acquired goodwill for the years ended December 31, 2017 and 2016 is expected to be deductible for tax purposes. Included in the years ended December 31, 2017 and 2016 consolidated financial results were $300.8 million and $75.1 million of revenue, respectively, and $14.2 million and $2.7 million of pre-tax income, respectively, of the acquired dealerships from the applicable acquisition dates.
150
Gander Mountain and Overton’s
On May 26, 2017, CWI, Inc. (“CWI”), an indirect subsidiary of the Company, completed the acquisition of certain assets of the Gander Mountain Company (“Gander Mountain”) and its Overton’s, Inc. (“Overton’s”) boating business through a bankruptcy auction that took place in April 2017 for $35.4 million in cash and $1.1 million of contingent consideration. Prior to the acquisition, Gander Mountain operated 160 retail locations and an e-commerce business that serviced the hunting, camping, fishing, shooting sports, and outdoor markets. Overton’s operates two retail locations and an e-commerce business that services the marine and watersports markets. The Company believes these businesses are complementary to its existing businesses and will allow for cross marketing of the Company’s consumer services and plans to a wider customer base.
The assets acquired included the right to designate any real estate leases for assignment to CWI or other third parties (the “Designation Rights”), other agreements CWI could elect to assume, intellectual property rights, operating systems and platforms, certain distribution center equipment, Overton’s inventory, the Gander Mountain and Overton’s e-commerce businesses, and fixtures and equipment for Overton’s two retail locations and corporate operations. Furthermore, CWI had committed to exercise Designation Rights and take an assignment of no fewer than 15 Gander Mountain retail leases on or before October 6, 2017, in addition to the two Overton’s retail leases assumed at the closing of the acquisition. The Designation Rights expired on October 6, 2017, immediately after CWI assumed the minimum 15 additional Gander Mountain retail leases. CWI also assumed certain liabilities, such as cure costs for leases and other agreements it elected to assume, accrued time off for employees retained by CWI and retention bonuses payable to certain key Gander Mountain employees retained by CWI. The cure costs for the minimum 15 Gander Mountain leases assumed under the Designation Rights were $1.1 million and recorded as contingent consideration.
The estimated fair values of the assets acquired and liabilities assumed for the acquisition of Gander Mountain and Overton’s consist of the following:
|
|
|
Estimated |
|
Estimated |
||
|
($ in thousands) |
|
Fair Value |
|
Life |
||
|
Tangible assets (liabilities) acquired (assumed): |
|
|
|
|
|
|
|
Inventory |
|
$ |
9,965 |
|
|
|
|
Prepaid expenses and other assets |
|
|
42 |
|
|
|
|
Property and equipment |
|
|
8,436 |
|
|
|
|
Accrued liabilities |
|
|
(373) |
|
|
|
|
Total tangible net assets acquired |
|
|
18,070 |
|
|
|
|
Intangible assets acquired: |
|
|
|
|
|
|
|
Trademarks and trade names |
|
|
14,800 |
|
15 years |
|
|
Membership and customer lists |
|
|
500 |
|
6 years |
|
|
Websites |
|
|
1,900 |
|
10 years |
|
|
Total intangible assets acquired |
|
|
17,200 |
|
|
|
|
Goodwill |
|
|
1,329 |
|
|
|
|
Purchase price and cash paid for acquisition |
|
$ |
36,599 |
|
|
|
The fair values above are preliminary as they are subject to measurement period adjustments for up to one year from the date of acquisition as new information is obtained about facts and circumstances that existed as of the acquisition date. All of the acquired goodwill from this acquisition is expected to be deductible for tax purposes. Included in the year ended December 31, 2017 consolidated financial results were $27.5 million of revenue and $33.8 million of pre-tax loss of Gander Mountain and Overton’s from the acquisition date.
151
Active Sports, Inc.
On August 17, 2017, Camping World, Inc. (“CW”), an indirect subsidiary of the Company, completed the acquisition of all of the outstanding capital stock and outstanding debt of Active Sports, Inc. (“TheHouse.com”), which specializes in bikes, sailboards, skateboards, wakeboards, snowboards, and outdoor gear. TheHouse.com is primarily an online retailer and operates two retail locations. The Company believes this business is complementary to its existing businesses and enhances the product offerings from its earlier acquisition of Gander Mountain. The purchase price consisted of $30.0 million in cash, $5.7 million in restricted shares of Class A common stock of the Company, and the purchase or extinguishment of $35.3 million of TheHouse.com’s debt, including accrued interest.
The estimated fair values of the assets acquired and liabilities assumed for the acquisition of TheHouse.com consist of the following:
|
|
|
Estimated |
|
Estimated |
||
|
($ in thousands) |
|
Fair Value |
|
Life |
||
|
Tangible assets (liabilities) acquired (assumed): |
|
|
|
|
|
|
|
Cash and cash equivalents |
|
$ |
501 |
|
|
|
|
Accounts receivable |
|
|
159 |
|
|
|
|
Inventory |
|
|
36,320 |
|
|
|
|
Prepaid expenses and other assets |
|
|
1,120 |
|
|
|
|
Property and equipment |
|
|
548 |
|
|
|
|
Accounts payable |
|
|
(7,585) |
|
|
|
|
Accrued liabilities |
|
|
(827) |
|
|
|
|
Deferred tax liabilities |
|
|
(4,011) |
|
|
|
|
Total tangible net assets acquired |
|
|
26,225 |
|
|
|
|
Intangible assets acquired: |
|
|
|
|
|
|
|
Trademarks and trade names |
|
|
14,039 |
|
15 years |
|
|
Websites |
|
|
4,090 |
|
10 years |
|
|
Total intangible assets acquired |
|
|
18,129 |
|
|
|
|
Goodwill |
|
|
26,678 |
|
|
|
|
Purchase price |
|
|
71,032 |
|
|
|
|
Cash and cash equivalents acquired |
|
|
(501) |
|
|
|
|
Non-cash consideration - Class A shares issued |
|
|
(5,720) |
|
|
|
|
Cash paid for acquisition, net of cash acquired |
|
$ |
64,811 |
|
|
|
The fair values above are preliminary as they are subject to measurement period adjustments for up to one year from the date of acquisition as new information is obtained about facts and circumstances that existed as of the acquisition date. None of the acquired goodwill is expected to be deductible for tax purposes. Included in the year ended December 31, 2017 consolidated financial results were $32.7 million of revenue and $4.7 million of pre-tax income of TheHouse.com from the acquisition date.
Other Retail Acquisitions
On September 22, 2017, W82, LLC, an indirect subsidiary of the Company, completed the acquisition of substantially all of the assets of EIGHTEEN0THREE LLC, dba W82 (“W82”), which specializes in snowboarding, skateboarding, longboarding, swimwear, footwear, apparel and accessories. The Company believes this business is complementary to its existing businesses and enhances the product offerings from its earlier acquisition of Gander Mountain. The purchase price consisted in $0.6 million in cash and the extinguishment of $1.5 million of W82’s debt, including accrued interest.
On October 19, 2017, CW, an indirect subsidiary of the Company, completed the acquisition of all of the outstanding capital stock and outstanding debt of Uncle Dan’s LTD. (“Uncle Dan’s”), which specializes in outdoor apparel. The Company believes this business is complementary to its existing businesses and
152
enhances the product offerings from its earlier acquisition of Gander Mountain. The purchase price consisted in $7.5 million in cash, the extinguishment of $0.7 million of Uncle Dan’s debt, and $0.1 to replace the collateral on Uncle Dan’s letter of credit.
The estimated fair values of the assets acquired and liabilities assumed for the acquisitions of W82 and Uncle Dan’s consist of the following:
|
|
|
Estimated |
|
Estimated |
||
|
($ in thousands) |
|
Fair Value |
|
Life |
||
|
Tangible assets (liabilities) acquired (assumed): |
|
|
|
|
|
|
|
Cash and cash equivalents |
|
$ |
90 |
|
|
|
|
Accounts receivable |
|
|
15 |
|
|
|
|
Inventory |
|
|
3,886 |
|
|
|
|
Prepaid expenses and other assets |
|
|
100 |
|
|
|
|
Property and equipment |
|
|
1,327 |
|
|
|
|
Accounts payable |
|
|
(2,380) |
|
|
|
|
Accrued liabilities |
|
|
(1,238) |
|
|
|
|
Other liabilities |
|
|
(87) |
|
|
|
|
Total tangible net assets acquired |
|
|
1,713 |
|
|
|
|
Intangible assets acquired: |
|
|
|
|
|
|
|
Trademarks and trade names |
|
|
148 |
|
15 years |
|
|
Websites |
|
|
84 |
|
10 years |
|
|
Total intangible assets acquired |
|
|
232 |
|
|
|
|
Goodwill |
|
|
8,460 |
|
|
|
|
Purchase price |
|
|
10,405 |
|
|
|
|
Cash and cash equivalents acquired |
|
|
(90) |
|
|
|
|
Cash paid for acquisition, net of cash acquired |
|
$ |
10,315 |
|
|
|
The fair values above are preliminary as they are subject to measurement period adjustments for up to one year from the date of acquisition as new information is obtained about facts and circumstances that existed as of the acquisition date. All of the acquired goodwill from this acquisition is expected to be deductible for tax purposes. Included in the year ended December 31, 2017 consolidated financial results were $4.3 million of revenue and $0.3 million of pre-tax income of W82 and Uncle Dan’s from the respective acquisition dates.
15. Exit Activities
The Company closed certain retail locations in previous periods and, in March 2017, the Company subleased a portion of a lease that is adjacent to an existing retail location. The Company remains obligated under the terms of these leases for rent and other costs associated with these leases, and has no plans to occupy them in the future. In accordance with ASC 420, Accounting for Costs Associated with Exit or Disposal Activities, the Company recorded a charge to rent expense to recognize the costs of exiting the space. The liability was equal to the fair value of rent less the fair value of the amount of rent received by the Company from a tenant under a sublease over the remainder of the lease terms, which expire on various dates through 2033. The change in the estimated fair value of these amounts was recognized in income as part of income from operations. The current portion of the liability was $0.3 million, and $0.3 million as of December 31, 2017 and 2016, respectively, and is included in other current liabilities. The liability outstanding was $2.8 million and $2.8 million as of December 31, 2017 and 2016, respectively. The total of minimum rental payments to be received in the future under noncancelable subleases was $12.3 million as of December 31, 2017.
153
16. Statements of Cash Flows
Supplemental disclosures of cash flow information for the years ended December 31, are as follows (in thousands):
|
|
|
Year Ended |
|||||||
|
|
|
December 31, |
|
December 31, |
|
December 31, |
|||
|
|
|
2017 |
|
2016 |
|
2015 |
|||
|
Cash paid (received) during the period for: |
|
|
|
|
|
|
|
|
|
|
Interest |
|
$ |
65,202 |
|
$ |
61,889 |
|
$ |
54,843 |
|
Income taxes |
|
|
35,432 |
|
|
1,622 |
|
|
1,119 |
|
Non-cash investing activities: |
|
|
|
|
|
|
|
|
|
|
Property and equipment for leases capitalized as a right to use asset |
|
|
— |
|
|
— |
|
|
50,587 |
|
Derecognized property and equipment for leases that qualified as operating leases after completion of construction |
|
|
— |
|
|
(19,958) |
|
|
(122,360) |
|
Property and equipment acquired through third-party capital lease arrangements |
|
|
— |
|
|
2,007 |
|
|
— |
|
Leasehold improvements paid by lessor |
|
|
857 |
|
|
— |
|
|
— |
|
Vehicles transferred to property and equipment from inventory |
|
|
1,555 |
|
|
530 |
|
|
3,703 |
|
Portion of acquisition purchase price paid through issuance of Class A common stock |
|
|
5,720 |
|
|
— |
|
|
— |
|
Landlord paid tenant improvements on behalf of the Company |
|
|
749 |
|
|
— |
|
|
— |
|
Non-cash financing activities: |
|
|
|
|
|
|
|
|
|
|
Lease obligations recognized as right to use liabilities |
|
|
— |
|
|
— |
|
|
50,587 |
|
Derecognized right to use liabilities for leases that qualified as operating leases after completion of construction |
|
|
— |
|
|
(20,056) |
|
|
(126,971) |
|
Third-party capital lease arrangements to acquire property and equipment |
|
|
— |
|
|
2,007 |
|
|
— |
|
Non-cash distribution of equity interest in AutoMatch USA, LLC, an indirect wholly-owned subsidiary of the Company |
|
|
— |
|
|
(38,838) |
|
|
— |
|
Non-cash distribution of a prepaid marketing deposit with Adams Outdoor Advertising Marketing Company |
|
|
— |
|
|
— |
|
|
(1,000) |
|
Non-cash distribution of receivable due to CWGS Holding, LLC |
|
|
— |
|
|
— |
|
|
(883) |
|
Par value of Class A common stock issued in exchange for common units in CWGS, LLC |
|
|
130 |
|
|
— |
|
|
— |
|
Par value of Class A common stock issued for vested restricted stock units |
|
|
— |
|
|
— |
|
|
— |
|
Par value of Class A common stock issued for acquisition |
|
|
1 |
|
|
— |
|
|
— |
17. Benefit Plan
The Freedom Roads 401(k) Defined Contribution Plan (“FreedomRewards 401(k) Plan”) is qualified under Sections 401(a) and 401(k) of the Internal Revenue Service Code of 1986, as amended. Effective January 1, 2012, the GSE 401(k) Plan was merged with the FreedomRewards 401(k) Plan. Effective January 1, 2007, Camping World elected to begin participating in the FreedomRewards 401(k) Plan. All employees over age 18, including the executive officers, are eligible to participate in the Freedom Rewards 401(k) Plan. Any favorable vesting was grandfathered for any affected participants pursuant to FreedomRewards 401(k) Plan Amendment No. 3 signed December 15, 2011, and effective January 1, 2012. Non‑highly compensated employees may defer up to 75% of their eligible compensation up to the Internal Revenue Service limits. Highly compensated employees may defer up to 15% of their eligible compensation up to the Internal Revenue Service limits. In 2016 and 2015 the Company expensed $0.9 million, and $1.0 million, respectively, for its contribution to the FreedomRewards 401(k) Plan, which were paid in the following year.
154
18. Stockholders’ Equity
Reorganization Transactions
In connection with the IPO on October 6, 2016, the Company completed the following Reorganization Transactions:
|
· |
The Company amended and restated its certificate of incorporation (see “Amendment and Restatement of Certificate of Incorporation” below); |
|
· |
CWGS, LLC amended and restated the limited liability company agreement of CWGS, LLC (the “LLC Agreement”) (see “CWGS, LLC Recapitalization” below); and |
|
· |
The Company acquired, by merger, an entity that was owned by former indirect members of CWGS, LLC (the “Former Equity Owners”), for which the Company issued 7,063,716 shares of Class A common stock as merger consideration (the “CWH BR Merger”). The only significant asset held by the merged entity prior to the CWH BR Merger was 7,063,716 common units of CWGS, LLC and a corresponding number of shares of CWH Class B common stock. Upon consummation of the CWH BR Merger, the Company canceled the 7,063,716 shares of Class B common stock and recognized the 7,063,716 of common units of CWGS, LLC at carrying value, as the CWH BR Merger was considered to be a transaction between entities under common control. |
Following the completion of the Reorganization Transactions and IPO, CWH owned 22.6% of CWGS, LLC. The remaining 77.4% of CWGS, LLC was held by the “Continuing Equity Owners,” whom the Company defines as collectively, ML Acquisition Company, a Delaware limited liability company, indirectly owned by each of Stephen Adams and the Company’s Chairman and Chief Executive Officer, Marcus Lemonis ("ML Acquisition”), funds controlled by Crestview Partners II GP, L.P. and, collectively, the Company’s named executive officers (excluding Marcus Lemonis), Andris A. Baltins and K. Dillon Schickli, who are members of the Company’s board of directors, and certain other current and former non-executive employees and former directors, in each case, who held profit units in CWGS, LLC pursuant to CWGS, LLC’s equity incentive plan that was in existence prior to the Company’s IPO and who received common units of CWGS, LLC in exchange for their profit units in connection with the Reorganization Transactions (collectively, the “Former Profit Unit Holders”) and each of their permitted transferees that own common units in CWGS, LLC and who may redeem at each of their options their common units for, at the Company’s election (determined solely by the Company’s independent directors (within the meaning of the rules of the New York Stock Exchange) who are disinterested), cash or newly issued shares of the Company’s Class A common stock. As a result of the Reorganization Transactions, CWH became the sole managing member of CWGS, LLC and, although CWH had a minority economic interest in CWGS, LLC, CWH had the sole voting power in, and controlled the management of, CWGS, LLC. Accordingly, the Company consolidated the financial results of CWGS, LLC and reported a non-controlling interest in its consolidated financial statements.
As the Reorganization Transactions are considered transactions between entities under common control, the financial statements for periods prior to the IPO and Reorganization Transactions have been adjusted to combine the previously separate entities for presentation purposes.
Amendment and Restatement of Certificate of Incorporation
On October 6, 2016, the Company amended and restated its certificate of incorporation to, among other things, provide for the (i) authorization of 250,000,000 shares of Class A common stock with a par value of $0.01 per share; (ii) authorization of 75,000,000 shares of Class B common stock with a par value of $0.0001 per share; (iii) authorization of one share of Class C common stock with a par value of $0.0001 per share; (iv) authorization of 20,000,000 shares of undesignated preferred stock that may be issued from time to time by the Company’s Board of Directors in one or more series; and (v) establishment of a classified board of directors, divided into three classes, each of whose members will serve for staggered three -year terms.
155
Each share of the Company’s Class A common stock and Class B common stock entitles its holders to one vote per share on all matters presented to the Company’s stockholders generally; provided that, for as long as ML Acquisition Company, LLC, a Delaware limited liability company, indirectly owned by each of Stephen Adams and the Company’s Chairman and Chief Executive Officer, Marcus Lemonis, and its permitted transferees of common units (collectively, the “ML Related Parties”), directly or indirectly, beneficially own in the aggregate 27.5% or more of all of the outstanding common units of CWGS, LLC, the shares of Class B common stock held by the ML Related Parties will entitle the ML Related Parties to the number of votes necessary such that the ML Related Parties, in the aggregate, cast 47% of the total votes eligible to be cast by all of the Company’s stockholders on all matters presented to a vote of the Company’s stockholders generally. Additionally, the one share of Class C common stock entitles its holder to the number of votes necessary such that the holder casts 5% of the total votes eligible to be cast by all of the Company’s stockholders on all matters presented to a vote of the Company’s stockholders generally. The one share of Class C common stock is owned by ML RV Group, LLC, a Delaware limited liability company, wholly owned by the Company’s Chairman and Chief Executive Officer, Marcus Lemonis.
Holders of the Company’s Class B and Class C common stock are not entitled to receive dividends and will not be entitled to receive any distributions upon the liquidation, dissolution or winding up of the Company. Shares of Class B common stock may only be issued to the extent necessary to maintain the one-to-one ratio between the number of common units of CWGS, LLC held by funds controlled by Crestview Partners II GP, L.P. and the ML Related Parties (the “Class B Common Owners”) and the number of shares of Class B common stock held by the Class B Common Owners. Shares of Class B common stock are transferable only together with an equal number of common units of CWGS, LLC. Only permitted transferees of common units held by the Class B Common Owners will be permitted transferees of Class B common stock. Shares of Class B common stock will be canceled on a one-for-one basis upon the redemption or exchange any of the outstanding common units of CWGS, LLC held by the Class B Common Owners. Upon the occurrence of certain change in control events, the Class C common stock would no longer have any voting rights, such share of the Company’s Class C common stock will be cancelled for no consideration and will be retired, and the Company will not reissue such share of Class C common stock.
The Company must, at all times, maintain a one-to-one ratio between the number of outstanding shares of Class A common stock and the number of common units of CWGS, LLC owned by CWH (subject to certain exceptions for treasury shares and shares underlying certain convertible or exchangeable securities).
Initial Public Offering
On October 13, 2016, the Company completed an IPO of 11,363,636 shares of the Company’s Class A common stock at a public offering price of $22.00 per share. The Company received $233.4 million in proceeds, net of underwriting discounts and commissions, which were used to purchase 11,363,636 newly-issued common units from CWGS, LLC at a price per unit equal to the initial public offering price per share of Class A common stock in the IPO less underwriting discounts and commissions. In addition, on November 4, 2016, the underwriters exercised their option, in part, to purchase an additional 508,564 shares of Class A common stock. On November 9, 2016, the Company closed on the purchase of the additional 508,564 shares of Class A common stock and received $10.4 million in additional proceeds, net of underwriting discounts and commissions, which were used to purchase 508,564 newly-issued common units from CWGS, LLC at a price per unit equal to the initial public offering price per share of Class A common stock in the IPO less underwriting discounts and commissions.
Immediately following the completion of the IPO and the underwriters’ exercise of their option to purchase additional shares of Class A common stock, there were 62,002,729 shares of Class B common stock outstanding, one share of Class C common stock outstanding, and 18,935,916 shares of Class A common stock outstanding, comprised of 11,872,200 shares issued as part of the IPO and the underwriters’ exercise of their option to purchase additional shares of Class A common stock and 7,063,716 shares issued in connection with the CWH BR Merger described above.
156
May 2017 Public Offering
On May 31, 2017, the Company completed a public offering (the “May 2017 Public Offering”) in which the Company sold 4,000,000 shares of the Company’s Class A common stock at a public offering price of $27.75 per share. The Company received $106.6 million in proceeds, net of underwriting discounts and commissions, which were used to purchase 4,000,000 newly-issued common units from CWGS, LLC at a price per unit equal to the public offering price per share of Class A common stock in the May 2017 Public Offering, less underwriting discounts and commissions. In addition, on June 5, 2017, the underwriters exercised their option to purchase an additional 600,000 shares of Class A common stock. On June 9, 2017, the Company closed on the purchase of the additional 600,000 shares of Class A common stock and received $16.0 million in additional proceeds, net of underwriting discounts and commissions, which were used to purchase 600,000 newly-issued common units from CWGS, LLC at a price per unit equal to the public offering price per share of Class A common stock in the May 2017 Public Offering, less underwriting discounts and commissions.
In connection with the May 2017 Public Offering, CVRV Acquisition LLC and CVRV Acquisition II LLC (the “May 2017 Selling Stockholders”), each affiliates of Crestview, sold 5,500,000 shares of the Company’s Class A common stock at the same public offering price of $27.75 per share. CVRV Acquisition LLC redeemed 4,323,083 common units of CWGS, LLC for 4,323,083 newly-issued shares of Class A common stock, which it sold in the May 2017 Public Offering along with 1,176,917 shares of Class A shares that CVRV Acquisition II LLC already held as a result of the Reorganization Transactions. Pursuant to the terms of the LLC Agreement, 4,323,083 shares of the Company’s Class B common stock registered in the name of CVRV Acquisition LLC were cancelled for no consideration on a one-for-one basis with the number of common units redeemed. In addition, on June 5, 2017, the underwriters exercised their option to purchase an additional 825,000 shares of Class A common stock from the May 2017 Selling Stockholders, in conjunction with their exercise of their option to purchase the additional 600,000 shares from the Company as described above. On June 9, 2017, the May 2017 Selling Stockholders closed on the sale of the additional 825,000 shares of Class A common stock. CVRV Acquisition LLC redeemed 648,462 common units of CWGS, LLC for 648,462 shares of Class A common stock, which it sold in the May 2017 Public Offering along with 176,538 newly-issued shares of Class A shares that CVRV Acquisition II LLC already held as a result of the Reorganization Transactions. Pursuant to the terms of the LLC Agreement, 648,462 shares of the Company’s Class B common stock registered in the name of CVRV Acquisition LLC were cancelled for no consideration on a one-for-one basis with the number of common units redeemed. The Company did not receive any proceeds relating to the sale of the May 2017 Selling Stockholders’ shares.
October 2017 Public Offering
On October 30, 2017, the Company completed a public offering (the “October 2017 Public Offering”) in which, CVRV Acquisition LLC, CVRV Acquisition II LLC and Crestview Advisors, LLC, each affiliates of Crestview, and CWGS Holding, LLC, a wholly owned subsidiary of ML Acquisition Company, LLC, which is indirectly owned by each of Stephen Adams, a member of Camping World’s board of directors, and Marcus Lemonis, Camping World’s Chairman and Chief Executive Officer (“October 2017 Selling Stockholders”) sold 6,700,000 shares of the Company’s Class A common stock at a public offering price of $40.50 per share. CVRV Acquisition LLC redeemed 4,715,529 common units of CWGS, LLC for 4,715,529 newly-issued shares of Class A common stock, which it sold in the October 2017 Public Offering along with 1,283,756 and 715 shares of Class A shares that CVRV Acquisition II LLC and Crestview Advisors, LLC, respectively, already held as a result of the Reorganization Transactions. Additionally, CWGS Holding, LLC redeemed 700,000 common units of CWGS, LLC for 700,000 shares of Class A common stock, which it sold in the October 2017 Public Offering. Pursuant to the terms of the LLC Agreement, 4,715,529 and 700,000 shares of the Company’s Class B common stock registered in the names of CVRV Acquisition LLC and CWGS Holding, LLC, respectively, were cancelled for no consideration on a one-for-one basis with the number of common units redeemed. In addition, the underwriters exercised their option to purchase an additional 963,799 shares of Class A common stock from the October 2017 Selling Stockholders, in conjunction with their exercise of their option to purchase up to an additional 1,005,000 shares from the October 2017 Selling Stockholders. On November 1, 2017, the October 2017 Selling Stockholders closed on the sale of the additional 963,799 shares of Class A common stock. CVRV Acquisition LLC and CWGS Holding, LLC redeemed 678,331 and 100,695 common units of CWGS, LLC, for 678,331 and 100,695 newly issued shares of Class A common
157
stock, respectively, which they sold in the October 2017 Public Offering along with 184,669 and 104 shares of Class A shares that CVRV Acquisition II LLC and Crestview Advisors, LLC, respectively, already held as a result of the Reorganization Transactions. Pursuant to the terms of the LLC Agreement, 678,331 and 100,695 shares of the Company’s Class B common stock registered in the names of CVRV Acquisition LLC and CWGS Holding, LLC, respectively, were cancelled for no consideration on a one-for-one basis with the number of common units redeemed. The Company did not receive any proceeds relating to the October 2017 Public Offering.
CWGS, LLC Recapitalization
On October 6, 2016, CWGS, LLC amended and restated the LLC Agreement (the “Recapitalization”) to, among other things, (i) provide for a new single class of common membership interests in CWGS, LLC, the common units, and (ii) exchange all of the then-existing membership interests of ML Acquisition, funds controlled by Crestview Partners II GP, L.P. and the Former Profit Unit Holders (collectively, the “Original Equity Owners”) for common units of CWGS, LLC.
The LLC Agreement also provides that the Continuing Equity Owners may from time to time at each of their options require CWGS, LLC to redeem all or a portion of their common units in exchange for, at the Company’s election (determined solely by the Company’s independent directors (within the meaning of the rules of the New York Stock Exchange (the “NYSE”) who are disinterested), newly-issued shares of the Company’s Class A common stock on a one-for-one basis or a cash payment equal to a volume weighted average market price of one share of Class A common stock for each common unit redeemed, in each case in accordance with the terms of the CWGS LLC Agreement; provided that, at the Company’s election (determined solely by the Company’s independent directors (within the meaning of the rules of the NYSE) who are disinterested), the Company may effect a direct exchange of such Class A common stock or such cash, as applicable, for such common units. The Continuing Equity Owners may exercise such redemption right for as long as their common units remain outstanding. Simultaneously with the payment of cash or shares of Class A common stock, as applicable, in connection with a redemption or exchange of common units pursuant to the terms of the CWGS LLC Agreement, a number of shares of the Company’s Class B common stock registered in the name of the redeeming or exchanging Class B Common Owners will be cancelled for no consideration on a one-for-one basis with the number of common units so redeemed or exchanged.
The amendment also requires that CWGS, LLC, at all times, maintain (i) a one-to-one ratio between the number of outstanding shares of Class A common stock and the number of common units of CWGS, LLC owned by CWH and (ii) a one-to-one ratio between the number of shares of Class B common stock owned by the Class B Common Owners and the number of common units of CWGS, LLC owned by the Class B Common Owners.
19. Non-Controlling Interests
In connection with the Reorganization Transactions described in Note 18 — Stockholders’ Equity, CWH became the sole managing member of CWGS, LLC and, as a result, consolidate the financial results of CWGS, LLC. The Company reports a non-controlling interest representing the common units of CWGS, LLC held by Continuing Equity Owners. Changes in the CWH’s ownership interest in CWGS, LLC while CWH retains its controlling interest in CWGS, LLC will be accounted for as equity transactions. As such, future redemptions or direct exchanges of common units of CWGS, LLC by the Continuing Equity Owners will result in a change in ownership and reduce or increase the amount recorded as non-controlling interest and increase or decrease additional paid-in capital when CWGS, LLC has positive or negative net assets, respectively. At December 31, 2017 and 2016, CWGS, LLC had positive and negative net assets, respectively, which resulted in positive and negative non-controlling interest amounts, respectively, on the Consolidated Balance Sheets.
As of December 31, 2017 and December 31, 2016, there were 88,639,567 and 83,771,830 common units of CWGS, LLC interests outstanding, respectively, of which CWH owned 36,749,072 and 18,935,916 common units of CWGS, LLC, respectively, representing 41.5% and 22.6% ownership interest in CWGS,
158
LLC., respectively, and the Continuing Equity Owners owned 51,890,495 and 64,835,914 common units of CWGS, LLC, respectively, representing 58.5% and 77.4% ownership interests in CWGS, LLC, respectively.
The following table summarizes the effects of changes in ownership in CWGS, LLC on the Company’s equity:
|
|
|
|
|
|
|
|
|
|
|
|
|
|
|
Year Ended December 31, |
|
|||||||
|
($ in thousands) |
|
2017 |
|
2016 |
|
2015 |
|
|||
|
|
|
|
|
Restated |
|
|
|
|||
|
Net income (loss) attributable to Camping World Holdings, Inc. |
|
$ |
28,362 |
|
$ |
191,117 |
|
$ |
174,293 |
|
|
Transfers to non-controlling interests: |
|
|
|
|
|
|
|
|
|
|
|
Decrease in additional paid-in capital as a result of the Reorganization Transactions |
|
|
— |
|
|
(21,887) |
|
|
— |
|
|
Decrease in additional paid-in capital as a result of the purchase of common units from CWGS, LLC with proceeds from a public offering |
|
|
(87,203) |
|
|
(234,486) |
|
|
— |
|
|
Decrease in additional paid-in capital as a result of the contribution of Class A common stock to CWGS, LLC for an acquisition by a subsidiary |
|
|
(3,678) |
|
|
— |
|
|
— |
|
|
Decrease in additional paid-in capital as a result of the purchase of common units from CWGS, LLC with proceeds from the exercise of stock options |
|
|
(970) |
|
|
— |
|
|
— |
|
|
Increase in additional paid-in capital as a result of the vesting of restricted stock units |
|
|
257 |
|
|
— |
|
|
— |
|
|
Increase in additional paid-in capital as a result of the redemption of common units of CWGS, LLC |
|
|
175,487 |
|
|
— |
|
|
— |
|
|
Change from net income (loss) attributable to Camping World Holdings, Inc. and transfers to non-controlling interests |
|
$ |
112,255 |
|
$ |
(65,256) |
|
$ |
174,293 |
|
20. Equity-based Compensation Plans
The following table summarizes the equity-based compensation that has been included in the following line items within the consolidated statements of operations during:
|
|
|
|
|
|
|
|
|
|
|
|
|
|
|
Year Ended December 31, |
|
|||||||
|
($ in thousands) |
|
2017 |
|
2016 |
|
2015 |
|
|||
|
Equity-based compensation expense: |
|
|
|
|
|
|
|
|
|
|
|
Costs applicable to revenue |
|
$ |
386 |
|
$ |
90 |
|
$ |
— |
|
|
Selling, general, and administrative |
|
|
4,723 |
|
|
1,507 |
|
|
— |
|
|
Total equity-based compensation expense |
|
$ |
5,109 |
|
$ |
1,597 |
|
$ |
— |
|
|
Total income tax benefit recognized related to equity-based compensation |
|
$ |
619 |
|
$ |
125 |
|
$ |
— |
|
CWGS Enterprises, LLC Equity Incentive Plan
In 2012, CWGS, LLC entered into the CWGS Enterprises, LLC Equity Incentive Plan (the “CWGS LLC Plan”), as defined in CWGS, LLC’s Limited Liability Agreement, with certain employees and directors of the Company, who, in the judgment of the Company, had played a meaningful role in enhancing the value of CWGS, LLC. Such employees and directors had been granted awards (“Profits Units”) under the CWGS LLC Plan which entitled them to receive, in aggregate, up to 10% of the increase in the value of the Company above certain thresholds, if any, realized in such sale of CWGS, LLC or other liquidity event. CWGS, LLC began making grants of these Profits Units pursuant to the CWGS LLC Plan effective for the year ended December 31, 2012. Generally, so long as the Unit holder is employed or remains a member of the board of managers of the Company, these Profits Units vest over time (generally a four‑year period), but do not
159
become exercisable or fully vested until a liquidity event occurs. All unvested Profits Units become exercisable and fully vested upon a liquidity event. Any unvested Profits Units are forfeited if the Unit holder ceases to be an employee of the Company or remain on the board of managers of the Company.
As of December 31, 2015, there were 15,556 Profits Units authorized, issued and outstanding pursuant to the CWGS LLC Plan. During the year ended December 31, 2015, no equity-based compensation expense was recorded relating to the Profits Units because the Company determined, as of the period end, it was not probable that a sale of CWGS, LLC or other liquidity event would occur.
On April 4, 2016, CWGS, LLC's board of directors approved a Profits Units redemption by Mr. Lemonis in the amount of 1,763 Profits Units for $17.0 million. CWGS, LLC remitted the proceeds to Mr. Lemonis through a cash distribution in the amount of $13.0 million and a $4.0 million note. The note bore interest at 3.00% per annum and had scheduled principal amortization of (i) $1.5 million, plus all accrued and unpaid interest on May 1, 2016, (ii) $1.5 million, plus all accrued and unpaid interest on June 1, 2016 and (iii) all outstanding principal, plus all accrued and unpaid interest on July 1, 2016. The largest aggregate amount of principal outstanding since the note was issued on April 4, 2016 was $4.0 million and the Company paid $6,250 of interest on the note prior to its repayment in full in April 2016. The Company recorded an equity-based compensation charge of $60,000 relating to this redemption during the year ended December 31, 2016 based on the grant date fair value.
On October 6, 2016, in connection with the Company’s IPO, the remaining 13,793 outstanding Profits Units fully vested and converted to 5,877,513 common units of CWGS, LLC. These common units were exchangeable for shares of the Company’s Class A common stock on a one-to-one basis. The Company recorded an equity-based compensation charge of $0.9 million relating to this conversion during the year ended December 31, 2016 based on the grant date fair value.
The weighted-average grant date fair value of Profits Units granted during the year ended December 31, 2015 was $317 per unit. No Profits Units were granted during the year ended December 31, 2016. As of December 31, 2016, there were no Profits Units outstanding and no further Profits Units were available for grant under the CWGS LLC Plan.
2016 Incentive Award Plan
In October 2016, the Company adopted the 2016 Incentive Award Plan (the “2016 Plan”) under which the Company may grant up to 14,693,518 stock options, restricted stock units, and other types of equity-based awards to employees, consultants or non-employee directors of the Company. The Company does not intend to use cash to settle any of its equity-based awards. Upon the exercise of a stock option award, the vesting of a restricted stock unit or the award of common stock or restricted stock, shares of Class A common stock are issued from authorized but unissued shares. Stock options and restricted stock units granted to employees vest in equal annual installments over a three to five- year period and are canceled upon termination of employment. Stock options are granted with an exercise price equal to the fair market value of the Company’s Class A common stock on the date of grant. Stock option grants expire after ten years unless canceled earlier due to termination of employment. Restricted stock units granted to non-employee directors vest in equal annual installments over a three-year period subject to voluntary deferral elections made at the time of grant.
The Company did not grant any stock options during the years ended December 31, 2017 or 2015. The fair value of the stock option awards was determined on the grant date using the Black-Scholes valuation model based on the following weighted-average assumptions for the year ended December 31,:
|
|
|
2016 |
|
|
Expected term (years) (1) |
|
6.3 |
|
|
Expected volatility (2) |
|
36.1 |
% |
|
Risk-free interest rate (3) |
|
1.5 |
% |
|
Dividend yield (4) |
|
1.1 |
% |
160
|
(1) |
Expected term represents the estimated period of time until an award is exercised and was determined using the simplified method. |
|
(2) |
Expected volatility is based on the historical volatility of a selected peer group over a period equivalent to the expected term. |
|
(3) |
The risk-free rate is an interpolation of yields on U.S. Treasury securities with maturities equivalent to the expected term. |
|
(4) |
The dividend yield was based on the Company’s expectation at the time of grant to declare quarterly dividends of $0.06 per share. |
A summary of stock option activity for the year ended December 31, 2017 is as follows:
|
|
|
|
|
|
|
|
|
Weighted Average |
||||
|
|
|
|
|
|
|
Aggregate |
|
Remaining |
||||
|
|
|
Stock Options |
|
Weighted Average |
|
Intrinsic Value |
|
Contractual Life |
||||
|
|
|
(in thousands) |
|
Exercise Price |
|
(in thousands) |
|
(years) |
||||
|
Outstanding at December 31, 2016 |
|
|
1,118 |
|
$ |
21.86 |
|
|
|
|
|
|
|
Granted |
|
|
— |
|
|
|
|
|
|
|
|
|
|
Exercised |
|
|
(80) |
|
$ |
21.70 |
|
|
|
|
|
|
|
Forfeited |
|
|
(85) |
|
$ |
22.00 |
|
|
|
|
|
|
|
Cancelled |
|
|
— |
|
|
|
|
|
|
|
|
|
|
Outstanding at December 31, 2017 |
|
|
953 |
|
$ |
21.86 |
|
$ |
21,789 |
|
|
8.7 |
|
Options exercisable at December 31, 2017 |
|
|
185 |
|
$ |
21.91 |
|
$ |
4,232 |
|
|
8.5 |
The weighted-average grant date fair value of stock options granted during the year ended December 31, 2016 was $7.24. At December 31, 2017, total unrecognized compensation cost related to unvested stock options was $5.1 million and is expected to be recognized over a weighted-average period of 2.8 years.
The intrinsic value of stock options exercised was $1.7 million for the year ended December 31, 2017. The actual tax benefit for the tax deductions from the exercise of stock options was $0.3 million for the year ended December 31, 2017. There were no exercises of stock options during the year ended December 31, 2016.
A summary of restricted stock unit activity for the year ended December 31, 2017 is as follows:
|
|
|
Restricted |
|
Weighted Average |
||
|
|
|
Stock Units |
|
Grant Date |
||
|
|
|
(in thousands) |
|
Fair Value |
||
|
Outstanding at December 31, 2016 |
|
|
144 |
|
$ |
21.37 |
|
Granted |
|
|
1,145 |
|
$ |
39.10 |
|
Vested |
|
|
(33) |
|
$ |
21.37 |
|
Forfeited |
|
|
(9) |
|
$ |
21.40 |
|
Outstanding at December 31, 2017 |
|
|
1,247 |
|
$ |
37.65 |
The weighted-average grant date fair value of restricted stock units granted during the years ended December 31, 2017 and 2016 were $39.10 and $21.37, respectively. At December 31, 2017, the intrinsic value of unvested restricted stock units was $55.8 million. At December 31, 2017, total unrecognized compensation cost related to unvested restricted stock units was $44.3 million and is expected to be recognized over a weighted-average period of 4.0 years.
The fair value of restricted stock units that vested during the year ended December 31, 2017 was $1.3 million. The actual tax benefit for the tax deductions from the vesting of restricted stock units was $0.3 million for the year ended December 31, 2017. There were no restricted stock units that vested during the year ended December 31, 2016. The restricted stock units that vested were net share settled such that the Company withheld shares with value equivalent to the employees’ minimum statutory obligation for the applicable income and other employment taxes, and remitted the cash to the appropriate taxing authorities. The total shares withheld were based on the value of the restricted stock units on their respective vesting
161
dates as determined by the Company’s closing stock price. Total payments for the employees’ tax obligations to taxing authorities are reflected as a financing activity within the Consolidated Statements of Cash Flows. These net share settlements had the effect of share repurchases by the Company as they reduced the number of shares that would have otherwise been issued as a result of the vesting and did not represent an expense to the Company.
21. Earnings Per Share
Basic and Diluted Earnings Per Share
Basic earnings per share of Class A common stock is computed by dividing net income (loss) available to Camping World Holdings, Inc. by the weighted-average number of shares of Class A common stock outstanding during the period. Diluted earnings per share of Class A common stock is computed by dividing net income (loss) available to Camping World Holdings, Inc. by the weighted-average number of shares of Class A common stock outstanding adjusted to give effect to potentially dilutive securities.
As described in Note 18 — Stockholders’ Equity, on October 6, 2016, the LLC Agreement was amended and restated to, among other things, (i) provide for a new single class of common membership interests, the common units of CWGS, LLC, and (ii) exchange all of the then-existing membership interests of the Original Equity Owners for common units of CWGS, LLC. This Recapitalization changed the relative membership rights of the Original Equity Owners such that retroactive application of the Recapitalization to periods prior to the IPO for the purposes of calculating earnings per share would not be appropriate.
Prior to the IPO, the CWGS, LLC membership structure included membership units, preferred units, and Profits Units. During the period of September 30, 2014 to October 6, 2016, there were 70,000 preferred units outstanding that received a total preferred return of $2.1 million per quarter in addition to their proportionate share of distributions made to all members of CWGS, LLC. The Company analyzed the calculation of earnings per unit for periods prior to the IPO using the two-class method and determined that it resulted in values that would not be meaningful to the users of these consolidated financial statements. Therefore, earnings per share information has not been presented for periods prior to the IPO on October 6, 2016. The basic and diluted earnings per share period for the year ended December 31, 2016 represents only the period of October 6, 2016 to December 31, 2016.
The following table sets forth reconciliations of the numerators and denominators used to compute basic and diluted earnings per share of Class A common stock:
|
|
|
Year Ended December 31, |
|
||||
|
(In thousands except per share amounts) |
|
2017 |
|
2016 |
|
||
|
Numerator: |
|
|
|
|
|
|
|
|
Net income |
|
$ |
232,974 |
|
$ |
11,528 |
|
|
Less: net income attributable to non-controlling interests |
|
|
(204,612) |
|
|
(9,942) |
|
|
Net income (loss) attributable to Camping World Holdings, Inc. — basic |
|
|
28,362 |
|
|
1,586 |
|
|
Add: Reallocation of net income attributable to non-controlling interests from the assumed exchange of common units of CWGS, LLC for Class A common stock |
|
|
— |
|
|
4,164 |
|
|
Net income (loss) attributable to Camping World Holdings, Inc. — diluted |
|
$ |
28,362 |
|
$ |
5,750 |
|
|
Denominator: |
|
|
|
|
|
|
|
|
Weighted-average shares of Class A common stock outstanding — basic |
|
|
26,622 |
|
|
18,766 |
|
|
Dilutive common units of CWGS, LLC that are convertible into Class A common stock |
|
|
— |
|
|
64,836 |
|
|
Weighted-average shares of Class A common stock outstanding — diluted |
|
|
26,622 |
|
|
83,602 |
|
|
|
|
|
|
|
|
|
|
|
Earnings (loss) per share of Class A common stock — basic |
|
$ |
1.07 |
|
$ |
0.08 |
|
|
Earnings (loss) per share of Class A common stock — diluted |
|
$ |
1.07 |
|
$ |
0.07 |
|
For the years ended December 31, 2017 and 2016, 1.1 million stock options and 0.4 and 0.1 million restricted stock units, respectively, were excluded from the weighted-average in the computation of diluted earnings per share of Class A common stock because the effect would have been anti-dilutive. For the year ended December 31, 2017, 60.0 million common units of CWGS, LLC were also excluded from the weighted-average in the computation of diluted earnings per share of Class A common stock because the effect would have been anti-dilutive.
162
Shares of the Company’s Class B and Class C common stock do not share in the earnings or losses of the Company and are therefore not participating securities. As such, separate presentation of basic and diluted earnings per share of Class B or Class C common stock under the two-class method has not been presented.
22. Segment Information
At December 31, 2017, 2016, and 2015, the Company had two reportable segments: (1) Consumer Services and Plans, and (2) Retail. The Company’s Consumer Services and Plans segment is comprised of emergency roadside assistance; property and casualty insurance programs; travel assist programs; extended vehicle service contracts; co‑branded credit cards; vehicle financing and refinancing; membership clubs; and publications and directories. The Company’s Retail segment is comprised of new and used RVs; parts and service; finance and insurance; and skiing, snowboarding, bicycling, skateboarding, marine and watersports products. Corporate and other is comprised of the corporate operations of the Company.
The reportable segments identified above are the business activities of the Company for which discrete financial information is available and for which operating results are regularly reviewed by the Company’s chief operating decision maker to allocate resources and assess performance. The Company’s chief operating decision maker is its Chief Executive Officer.
Reportable segment revenue, segment income, floor plan interest expense, depreciation and amortization, other interest expense, net, total assets, and capital expenditures are as follows:
|
|
|
|
|
|
|
|
|
|
|
|
|
|
|
Year Ended December 31, |
|
|||||||
|
($ in thousands) |
|
2017 |
|
2016 |
|
2015 |
|
|||
|
Revenue: |
|
|
|
|
|
|
|
|
|
|
|
Consumer Services and Plans |
|
$ |
195,614 |
|
$ |
184,773 |
|
$ |
174,600 |
|
|
Retail (1) |
|
|
4,089,641 |
|
|
3,334,224 |
|
|
3,104,217 |
|
|
Total consolidated revenue |
|
$ |
4,285,255 |
|
$ |
3,518,997 |
|
$ |
3,278,817 |
|
|
(1) |
The Company has adjusted certain prior period amounts for the correction of errors. See Note 1 — Summary of Significant Accounting Policies — Restatement to Prior Periods. |
|
|
|
|
|
|
|
|
|
|
|
|
|
|
|
Year Ended December 31, |
|
|||||||
|
($ in thousands) |
|
2017 |
|
2016 |
|
2015 |
|
|||
|
Segment income (1): |
|
|
|
|
|
|
|
|
|
|
|
Consumer Services and Plans |
|
$ |
98,371 |
|
$ |
89,046 |
|
$ |
80,522 |
|
|
Retail (2) |
|
|
272,624 |
|
|
201,585 |
|
|
175,293 |
|
|
Total segment income |
|
|
370,995 |
|
|
290,631 |
|
|
255,815 |
|
|
Corporate & other |
|
|
(5,373) |
|
|
(4,382) |
|
|
(2,689) |
|
|
Depreciation and amortization |
|
|
(31,545) |
|
|
(24,695) |
|
|
(24,101) |
|
|
Other interest expense, net |
|
|
(42,959) |
|
|
(48,318) |
|
|
(53,377) |
|
|
Tax Receivable Agreement liability adjustment |
|
|
99,687 |
|
|
— |
|
|
— |
|
|
Loss and expense on debt restructure |
|
|
(849) |
|
|
(6,270) |
|
|
— |
|
|
Other expense, net |
|
|
— |
|
|
— |
|
|
1 |
|
|
Income from operations before income taxes |
|
$ |
389,956 |
|
$ |
206,966 |
|
$ |
175,649 |
|
|
(1) |
Segment income is defined as income from operations before depreciation and amortization plus floor plan interest expense. |
|
(2) |
The Company has adjusted certain prior period amounts for the correction of errors. For the years ended December 31, 2016 and 2015, segment income for the Company’s Retail segment was originally reported as $203.8 million and $179.5 million, respectively. After correction of the errors totaling $2.2 million and $4.2 million for the years ended December 31, 2016 and 2015, respectively, segment income |
163
for the Company’s Retail segment was $201.6 million and $175.3 million, respectively. See Note 1 — Summary of Significant Accounting Policies — Restatement to Prior Periods. |
|
|
|
|
|
|
|
|
|
|
|
|
|
|
|
Year Ended December 31, |
|
|||||||
|
($ in thousands) |
|
2017 |
|
2016 |
|
2015 |
|
|||
|
Depreciation and amortization: |
|
|
|
|
|
|
|
|
|
|
|
Consumer Services and Plans |
|
$ |
3,688 |
|
$ |
3,780 |
|
$ |
3,627 |
|
|
Retail |
|
|
27,857 |
|
|
20,915 |
|
|
18,243 |
|
|
Total |
|
|
31,545 |
|
|
24,695 |
|
|
21,870 |
|
|
Corporate & other |
|
|
— |
|
|
— |
|
|
2,231 |
|
|
Total depreciation and amortization |
|
$ |
31,545 |
|
$ |
24,695 |
|
$ |
24,101 |
|
|
|
|
Years ended December 31, |
|
|||||||
|
($ in thousands) |
|
2017 |
|
2016 |
|
2015 |
|
|||
|
Other interest expense, net: |
|
|
|
|
|
|
|
|
|
|
|
Consumer Services and Plans |
|
$ |
(2) |
|
$ |
19 |
|
$ |
32 |
|
|
Retail |
|
|
5,883 |
|
|
5,395 |
|
|
16,015 |
|
|
Total |
|
|
5,881 |
|
|
5,414 |
|
|
16,047 |
|
|
Corporate & other |
|
|
37,078 |
|
|
42,904 |
|
|
37,330 |
|
|
Total interest expense |
|
$ |
42,959 |
|
$ |
48,318 |
|
$ |
53,377 |
|
|
|
|
As of December 31, |
|
|||||||
|
($ in thousands) |
|
2017 |
|
2016 |
|
2015 |
|
|||
|
|
|
|
|
|
Restated |
|
|
|
|
|
|
Assets: |
|
|
|
|
|
|
|
|
|
|
|
Consumer Services and Plans |
|
$ |
180,295 |
|
$ |
152,689 |
|
$ |
139,064 |
|
|
Retail (1) |
|
|
2,078,535 |
|
|
1,228,707 |
|
|
1,138,396 |
|
|
Total |
|
|
2,258,830 |
|
|
1,381,396 |
|
|
1,277,460 |
|
|
Corporate & other |
|
|
302,647 |
|
|
74,381 |
|
|
55,125 |
|
|
Total assets |
|
$ |
2,561,477 |
|
$ |
1,455,777 |
|
$ |
1,332,585 |
|
|
(1) |
The Company has adjusted certain prior period amounts for the correction of errors. Retail segment assets decreased $5.3 million and $5.5 million as of December 31, 2016 and 2015, respectively. See Note 1 — Summary of Significant Accounting Policies — Restatement to Prior Periods. |
|
|
|
Year Ended December 31, |
|
|||||||
|
($ in thousands) |
|
2017 |
|
2016 |
|
2015 |
|
|||
|
Capital expenditures: |
|
|
|
|
|
|
|
|
|
|
|
Consumer Services and Plans |
|
$ |
3,366 |
|
$ |
2,951 |
|
$ |
2,870 |
|
|
Retail |
|
|
63,414 |
|
|
36,831 |
|
|
38,567 |
|
|
Total capital expenditures |
|
$ |
66,780 |
|
$ |
39,782 |
|
$ |
41,437 |
|
164
23. Quarterly Financial Information (Unaudited)
|
|
|
Three Months Ended |
||||||||||||||||||||||
|
|
|
December 31, |
|
September 30, |
|
June 30, |
|
March 31, |
|
December 31, |
|
September 30, |
|
June 30, |
|
March 31, |
||||||||
|
($ in thousands) |
|
2017 |
|
2017 |
|
2017 |
|
2017 |
|
2016 |
|
2016 |
|
2016 |
|
2016 |
||||||||
|
Revenue (1) |
|
$ |
888,992 |
|
$ |
1,235,602 |
|
$ |
1,279,026 |
|
$ |
881,635 |
|
$ |
668,903 |
|
$ |
988,804 |
|
$ |
1,065,259 |
|
$ |
796,031 |
|
Income from operations (1) |
|
|
44,291 |
|
|
110,664 |
|
|
136,521 |
|
|
69,904 |
|
|
32,128 |
|
|
87,572 |
|
|
104,053 |
|
|
55,437 |
|
Net income (loss) (1) |
|
|
(5,494) |
|
|
83,752 |
|
|
105,093 |
|
|
49,623 |
|
|
11,528 |
|
|
68,247 |
|
|
84,108 |
|
|
37,176 |
|
Net income (loss) attributable to Camping World Holdings, Inc. (1) |
|
|
(18,093) |
|
|
19,589 |
|
|
19,344 |
|
|
7,522 |
|
|
1,586 |
|
|
68,247 |
|
|
84,108 |
|
|
37,176 |
|
Earnings (loss) per share of Class A common stock (1) (2): |
|
|
|
|
|
|
|
|
|
|
|
|
|
|
|
|
|
|
|
|
|
|
|
|
|
Basic |
|
$ |
(0.52) |
|
|
0.66 |
|
|
0.84 |
|
|
0.40 |
|
$ |
0.08 |
|
$ |
— |
|
$ |
— |
|
$ |
— |
|
Diluted |
|
$ |
(0.52) |
|
|
0.66 |
|
|
0.84 |
|
|
0.38 |
|
$ |
0.07 |
|
$ |
— |
|
$ |
— |
|
$ |
— |
|
(1) |
The Company has adjusted certain prior period amounts for the correction of errors. See Note 1 — Summary of Significant Accounting Policies — Restatement to Prior Periods. |
|
(2) |
Basic and diluted earnings per Class A common stock is applicable only for periods after the Company’s IPO. See Note 21 — Earnings Per Share. |
165
Schedule I: Condensed Financial Information of Registrant
Camping World Holdings, Inc.
Condensed Balance Sheet
(Parent Company Only)
(In Thousands Except Share Amounts)
|
|
|
December 31, |
|
December 31, |
||
|
|
|
2017 |
|
2016 |
||
|
|
|
|
|
|
Restated |
|
|
Assets |
|
|
|
|
|
|
|
Current assets: |
|
|
|
|
|
|
|
Cash and cash equivalents |
|
$ |
14,503 |
|
$ |
2,232 |
|
Prepaid income taxes and other |
|
|
2,244 |
|
|
— |
|
Total current assets |
|
|
16,747 |
|
|
2,232 |
|
|
|
|
|
|
|
|
|
Deferred tax asset |
|
|
153,445 |
|
|
20,998 |
|
Investment in subsidiaries |
|
|
24,315 |
|
|
(33,411) |
|
Total assets |
|
$ |
194,507 |
|
$ |
(10,181) |
|
|
|
|
|
|
|
|
|
Liabilities and stockholders' equity |
|
|
|
|
|
|
|
Current liabilities: |
|
|
|
|
|
|
|
Accrued liabilities |
|
$ |
313 |
|
$ |
110 |
|
Income tax payable |
|
|
— |
|
|
268 |
|
Current portion of liabilities under Tax Receivable Agreement |
|
|
8,093 |
|
|
991 |
|
Total current liabilities |
|
|
8,406 |
|
|
1,369 |
|
|
|
|
|
|
|
|
|
Liabilities under Tax Receivable Agreement, net of current portion |
|
|
129,596 |
|
|
18,190 |
|
Total liabilities |
|
|
138,002 |
|
|
19,559 |
|
|
|
|
|
|
|
|
|
Commitments and contingencies |
|
|
— |
|
|
— |
|
|
|
|
|
|
|
|
|
Stockholders' equity: |
|
|
|
|
|
|
|
Preferred stock, par value $0.01 per share – 20,000,000 shares authorized; none issued and outstanding as of December 31, 2017 and December 31, 2016 |
|
|
— |
|
|
— |
|
Class A common stock, par value $0.01 per share – 250,000,000 shares authorized; 36,758,233 issued and 36,749,072 outstanding as of December 31, 2017 and 18,935,916 issued and outstanding as of December 31, 2016 |
|
|
367 |
|
|
189 |
|
Class B common stock, par value $0.0001 per share – 75,000,000 shares authorized; 69,066,445 issued; and 50,836,629 outstanding as of December 31, 2017 and 62,002,729 outstanding as of December 31, 2016 |
|
|
5 |
|
|
6 |
|
Class C common stock, par value $0.0001 per share – one share authorized, issued and outstanding as of December 31, 2017 and December 31, 2016 |
|
|
— |
|
|
— |
|
Additional paid-in capital |
|
|
49,941 |
|
|
(30,006) |
|
Retained earnings |
|
|
6,192 |
|
|
71 |
|
Total stockholders' equity (deficit) |
|
|
56,505 |
|
|
(29,740) |
|
Total liabilities and stockholders' equity (deficit) |
|
$ |
194,507 |
|
$ |
(10,181) |
See accompanying Notes to Condensed Financial Statements
166
Schedule I: Condensed Financial Information of Registrant (continued)
Camping World Holdings, Inc.
Condensed Statement of Income
(Parent Company Only)
(In Thousands)
|
|
|
Year Ended |
|
Year Ended |
||
|
|
|
December 31, |
|
December 31, |
||
|
|
|
2017 |
|
2016 |
||
|
|
|
|
|
Restated |
||
|
Revenue: |
|
|
|
|
|
|
|
Intercompany revenue |
|
$ |
4,768 |
|
$ |
1,564 |
|
Total revenue |
|
|
4,768 |
|
|
1,564 |
|
|
|
|
|
|
|
|
|
Operating expenses: |
|
|
|
|
|
|
|
Selling, general, and administrative |
|
|
4,770 |
|
|
1,564 |
|
Total operating expenses |
|
|
4,770 |
|
|
1,564 |
|
|
|
|
|
|
|
|
|
Loss from operations |
|
|
(2) |
|
|
— |
|
|
|
|
|
|
|
|
|
Tax Receivable Agreement liability adjustment |
|
|
99,687 |
|
|
— |
|
Equity in net income of subsidiaries |
|
|
84,092 |
|
|
2,877 |
|
|
|
|
|
|
|
|
|
Income before income taxes |
|
|
183,777 |
|
|
2,877 |
|
Income tax expense |
|
|
(155,415) |
|
|
(1,291) |
|
Net income |
|
$ |
28,362 |
|
$ |
1,586 |
See accompanying Notes to Condensed Financial Statements
167
Schedule I: Condensed Financial Information of Registrant (continued)
Camping World Holdings, Inc.
Condensed Statement of Cash Flows
(Parent Company Only)
(In Thousands)
|
|
|
Year Ended |
|
Year Ended |
||
|
|
|
December 31, |
|
December 31, |
||
|
|
|
2017 |
|
2016 |
||
|
|
|
|
|
Restated |
||
|
Operating activities |
|
|
|
|
|
|
|
Net income |
|
$ |
28,362 |
|
$ |
1,586 |
|
|
|
|
|
|
|
|
|
Adjustments to reconcile net income to net cash used in operating activities: |
|
|
|
|
|
|
|
Equity in net income of subsidiaries |
|
|
(84,092) |
|
|
(2,877) |
|
Deferred tax expense |
|
|
127,305 |
|
|
965 |
|
Tax receivable agreements liability adjustment |
|
|
(99,687) |
|
|
— |
|
Change in assets and liabilities, net of acquisitions: |
|
|
|
|
|
|
|
Prepaid income taxes and other assets |
|
|
(2,240) |
|
|
— |
|
Accounts payable and other accrued assets |
|
|
(1,798) |
|
|
(471) |
|
Payment pursuant to Tax Receivable Agreement |
|
|
(203) |
|
|
— |
|
Income taxes payable |
|
|
651 |
|
|
684 |
|
Net cash used in operating activities |
|
|
(31,702) |
|
|
(113) |
|
|
|
|
|
|
|
|
|
Investing activities |
|
|
|
|
|
|
|
Purchases of LLC Interest from CWGS, LLC |
|
|
(124,150) |
|
|
(243,845) |
|
Distributions received from CWGS, LLC |
|
|
66,092 |
|
|
3,889 |
|
Net cash used in investing activities |
|
|
(58,058) |
|
|
(239,956) |
|
|
|
|
|
|
|
|
|
Financing activities |
|
|
|
|
|
|
|
Proceeds from issuance of Class A common stock sold in an initial public offering net of underwriter discounts and commissions |
|
|
— |
|
|
243,809 |
|
Proceeds from issuance of Class A common stock sold in a public offering net of underwriter discounts and commissions |
|
|
122,544 |
|
|
— |
|
Proceeds from issuance of Class B common stock |
|
|
— |
|
|
7 |
|
Dividends paid to Class A common stockholders |
|
|
(22,241) |
|
|
(1,515) |
|
Proceeds from exercise of stock options |
|
|
1,728 |
|
|
— |
|
|
|
|
|
|
|
|
|
Net cash provided by financing activities |
|
|
102,031 |
|
|
242,301 |
|
|
|
|
|
|
|
|
|
Increase in cash |
|
|
12,271 |
|
|
2,232 |
|
Cash at beginning of year |
|
|
2,232 |
|
|
— |
|
Cash at end of the year |
|
$ |
14,503 |
|
$ |
2,232 |
See accompanying Notes to Condensed Financial Statements
168
Schedule I: Condensed Financial Information of Registrant (continued)
Camping World Holdings, Inc.
Notes to Condensed Financial Statements
(Parent Company Only)
December 31, 2017
1. Organization
Camping World Holdings, Inc. (the “Parent Company”) was formed on March 8, 2016 as a Delaware corporation and is a holding company with no direct operations. The Parent Company's assets consist primarily of cash and cash equivalents, its equity interest in CWGS Enterprises, LLC ("CWGS, LLC”), and certain deferred tax assets
On October 13, 2016, the Parent Company completed an initial public offering ("IPO") of 11,872,200 shares of its Class A common stock at a public offering price of $22.00 per share, which includes 508,564 shares issued pursuant to the underwriters' over-allotment option on November 4, 2016. The Parent Company received $243.8 million in proceeds, net of underwriting discounts and commissions, which it used to purchase newly-issued common units from CWGS, LLC at a price per interest equal to the IPO price of its Class A common stock.
The Parent Company's cash inflows are primarily from cash dividends or distributions and other transfers from CWGS, LLC. The amounts available to the Parent Company to fulfill cash commitments and pay cash dividends on its common stock are subject to certain restrictions in CWGS, LLC’s Senior Secured Credit Facilities. See Note 7 to the consolidated financial statements.
2. Basis of Presentation
These condensed parent company financial statements should be read in conjunction with the consolidated financial statements of Camping World Holdings, Inc. and the accompanying notes thereto, included in this Form 10-K. For purposes of these condensed financial statements, the Parent Company's interest in CWGS, LLC is recorded based upon its proportionate share of CWGS, LLC's net assets (similar to presenting them on the equity method).
The Parent Company is the sole managing member of CWGS, LLC, and pursuant to the Amended and Restated LLC Agreement of CWGS, LLC (the “LLC Agreement”), receives compensation in the form of reimbursements for all costs associated with being a public company. Intercompany revenue consists of these reimbursement payments and is recognized when the corresponding expense to which it relates is recognized.
Certain intercompany balances presented in these condensed Parent Company financial statements are eliminated in the consolidated financial statements. $4.8 million and $84.1 million of intercompany revenue and equity in net income of subsidiaries, respectively, was eliminated in consolidation for the year ended December 31, 2017. $1.6 million and $2.9 million of intercompany revenue and equity in net income of subsidiaries, respectively, was eliminated in consolidation for the year ended December 31, 2016. $0.1 million of an intercompany payable to CWGS, LLC was included in accrued liabilities at December 31, 2017. Related party amounts that were not eliminated in the consolidated financial statements include the Parent Company's liabilities under the tax receivable agreement, which totaled $137.7 million and $19.2 million as of December 31, 2017 and 2016, respectively.
3. Restatement to Prior Periods
Following the purchase of newly-issued common units from CWGS, LLC in connection with the IPO, the Parent Company’s deferred tax balances have reflected the differences in the book and tax basis of its investment in CWGS, LLC (i.e., outside basis) (the “Outside Basis Deferred Tax Asset”). In connection with preparing its financial statements for the year ended December 31, 2017, the Parent Company determined that a portion of the Outside Basis Deferred Tax Asset related to its acquisition of its direct interest in CWGS, LLC through newly issued LLC units is not expected to be realized unless the Parent Company were to dispose of its investment in CWGS, LLC, which the Parent Company has no current plan to do. Accordingly, the Parent Company has determined that it should have established a valuation allowance of $102.7 million
169
against this portion of its deferred tax asset that was recorded through equity as of December 31, 2016. Following the establishment of the valuation allowance as of December 31, 2016, the Parent Company recognizes subsequent changes to the valuation allowance through the provision for income taxes or equity, in accordance with generally accepted accounting principles, and at December 31, 2017 the valuation allowance was $89.5 million, which includes the decrease of $47.0 million during the year ended December 31, 2017 for the remeasurement of this deferred tax asset under the U.S. Tax Cuts and Jobs Act of 2017 (the “2017 Tax Act”).
Because the Parent Company’s consolidated financial statements as of and for the year ended December 31, 2016 included the Outside Basis Deferred Tax Asset, the Parent Company has restated its condensed financial statements as of and for the year ended December 31, 2016 to reflect a valuation allowance against the portion of the deferred tax asset related to the outside basis difference of $102.7 million (the “Restatement”). There was no impact on net income or cash flows resulting from the Restatement.
The Parent Company also corrected for errors that were immaterial to previously-reported condensed financial statements. These errors were also identified in connection with the preparation of the financial statements for the year ended December 31, 2017, and related to i) the lack of deferral of a portion of Good Sam roadside assistance policies sold through the finance and insurance process with the sale of new and used vehicles and ii) the application of a portion of certain vendor rebates against the related inventory balances. To quantify these errors, management performed an analysis of deferred roadside assistance policies and vendor rebates applicable to ending inventory for each period presented. The Parent Company evaluated the materiality of these errors both qualitatively and quantitatively in accordance with Staff Accounting Bulletin (“SAB”) No. 99, Materiality, and SAB No. 108 and, determined the effect of these corrections was not material to the previously issued financial statements as of and for the year ended December 31, 2016. As a result of also correcting these errors, equity in net income of subsidiaries and net income have been revised (the “Immaterial Adjustments”).
The following table presents the effect on the Parent Company’s condensed balance sheet for the period indicated.
|
|
|
At December 31, 2016 |
|||||||
|
($ in thousands) |
|
As Reported |
|
Adjustment |
|
As Corrected |
|||
|
Deferred tax asset |
|
$ |
122,444 |
|
$ |
(101,446) |
|
$ |
20,998 |
|
Investment in subsidiaries |
|
|
(30,139) |
|
|
(3,272) |
|
|
(33,411) |
|
Total assets |
|
|
94,537 |
|
|
(104,718) |
|
|
(10,181) |
|
Additional paid-in capital |
|
|
74,239 |
|
|
(104,245) |
|
|
(30,006) |
|
Retained earnings |
|
|
544 |
|
|
(473) |
|
|
71 |
|
Total stockholders' equity |
|
|
74,978 |
|
|
(104,718) |
|
|
(29,740) |
|
Total liabilities and stockholders' equity |
|
|
94,537 |
|
|
(104,718) |
|
|
(10,181) |
The following table presents the effect on the Parent Company’s condensed statement of income for the period indicated.
|
|
|
Year Ended December 31, 2016 |
|||||||
|
($ in thousands except per share amounts) |
|
As Reported |
|
Adjustment |
|
As Corrected |
|||
|
Equity in net income of subsidiaries |
|
$ |
3,350 |
|
$ |
(473) |
|
$ |
2,877 |
|
Net income |
|
|
2,059 |
|
|
(473) |
|
|
1,586 |
4. Commitments and Contingencies
On October 6, 2016, the Parent Company entered into a tax receivable agreement with certain holders of common units in CWGS, LLC (the "Continuing Equity Owners") that provides for the payment by the Parent Company to the Continuing Equity Owners of 85% of the amount of any tax benefits that the Parent Company actually realizes, or in some cases are deemed to realize, as a result of certain transactions. See Note 10 to the consolidated financial statements for more information regarding the Parent Company's tax receivable agreement. As described in Note 10 to the consolidated financial statements, amounts payable under the tax receivable agreement are contingent upon, among other things, (i) generation of future taxable income of Camping World Holdings, Inc. over the term of the tax receivable agreement and (ii) future changes
170
in tax laws. As of December 31, 2017 and 2016, liabilities under the tax receivable agreement totaled $137.7 million and $19.2 million, respectively.
5. Statements of Cash Flows
Supplemental disclosures of cash flow information for the years ended December 31, are as follows (in thousands):
|
|
|
Year Ended |
|
Year Ended |
||
|
|
|
December 31, |
|
December 31, |
||
|
|
|
2017 |
|
2016 |
||
|
Cash paid during the period for: |
|
|
|
|
|
|
|
Interest |
|
$ |
— |
|
$ |
— |
|
Income taxes |
|
|
31,543 |
|
|
58 |
|
Non-cash investing activities: |
|
|
|
|
|
|
|
Portion of subsidiary's acquisition purchase price paid through issuance of Class A common stock |
|
|
5,720 |
|
|
— |
|
Non-cash financing activities: |
|
|
|
|
|
|
|
Par value of Class A common stock issued in exchange for common units in CWGS, LLC |
|
|
130 |
|
|
— |
|
Par value of Class A common stock issued for vested restricted stock units |
|
|
— |
|
|
— |
|
Par value of Class A common stock issued for acquisition |
|
|
1 |
|
|
— |
171
Schedule II: Valuation and Qualifying Accounts
|
|
|
Balance at |
|
Additions |
|
Charged |
|
Charges |
|
Balance |
|||||
|
|
|
Beginning |
|
Charged to |
|
to Other |
|
Utilized |
|
at End |
|||||
|
(In Thousands) |
|
of Period |
|
Expense (1) |
|
Accounts (2) |
|
(Write-offs) |
|
of Period |
|||||
|
Accounts receivable allowance (3): |
|
|
|
|
|
|
|
|
|
|
|
|
|
|
|
|
Year ended December 31, 2017 |
|
$ |
8,753 |
|
$ |
838 |
|
$ |
9,658 |
|
$ |
(10,590) |
|
$ |
8,659 |
|
Year ended December 31, 2016 |
|
$ |
8,370 |
|
$ |
1,332 |
|
$ |
12,960 |
|
$ |
(13,909) |
|
$ |
8,753 |
|
Year ended December 31, 2015 |
|
$ |
5,748 |
|
$ |
2,180 |
|
$ |
13,505 |
|
$ |
(13,063) |
|
$ |
8,370 |
|
(1) |
Additions to allowance for doubtful accounts are charged to expense. |
|
(2) |
Additions to cancellations/returns allowances are credited against revenue. |
|
(3) |
Accounts receivable allowance includes the allowance for doubtful accounts and the allowance for cancellations /returns. |
|
|
|
Balance at |
|
Additions |
|
Charged |
|
Charges |
|
Balance |
|||||
|
|
|
Beginning |
|
Charged to |
|
to Other |
|
Utilized |
|
at End |
|||||
|
(In Thousands) |
|
of Period |
|
Expense |
|
Accounts (1) |
|
(Write-offs) |
|
of Period |
|||||
|
Noncurrent other assets allowance: |
|
|
|
|
|
|
|
|
|
|
|
|
|
|
|
|
Year ended December 31, 2017 |
|
$ |
5,737 |
|
$ |
— |
|
$ |
6,918 |
|
$ |
(5,468) |
|
$ |
7,187 |
|
Year ended December 31, 2016 |
|
$ |
4,554 |
|
$ |
— |
|
$ |
3,209 |
|
$ |
(2,026) |
|
$ |
5,737 |
|
Year ended December 31, 2015 |
|
$ |
3,081 |
|
$ |
— |
|
$ |
2,826 |
|
$ |
(1,353) |
|
$ |
4,554 |
|
(1) |
Additions to cancellations /returns allowances are credited against revenue. |
|
|
|
|
|
|
Tax Valuation |
|
Tax Valuation |
|
|
|
|
|
|
||
|
|
|
|
|
|
Allowance |
|
Allowance |
|
|
|
|
|
|
||
|
|
|
Balance at |
|
Charged to |
|
Credited to |
|
Charged |
|
Balance |
|||||
|
|
|
Beginning |
|
Income Tax |
|
Income Tax |
|
to Other |
|
at End |
|||||
|
(In Thousands) |
|
of Period |
|
Provision |
|
Provision |
|
Accounts (1) |
|
of Period |
|||||
|
Valuation allowance for deferred tax assets: |
|
|
|
|
|
|
|
|
|
|
|
|
|
|
|
|
Year ended December 31, 2017 |
|
$ |
146,259 |
|
$ |
11,194 |
|
$ |
(64,535) |
|
$ |
33,788 |
|
$ |
126,706 |
|
Year ended December 31, 2016 (Restated) |
|
$ |
42,504 |
|
$ |
1,049 |
|
$ |
— |
|
$ |
102,706 |
|
$ |
146,259 |
|
Year ended December 31, 2015 |
|
$ |
41,769 |
|
$ |
735 |
|
$ |
— |
|
$ |
— |
|
$ |
42,504 |
|
(1) |
Amounts charged to additional paid-in capital relating to the outside basis in the investment in CWGS, LLC. |
172
ITEM 9. Changes in and Disagreements with Accountants on Accounting and Financial Disclosure
None
ITEM 9A. Controls and Procedures
Limitations on Effectiveness of Controls and Procedures
In designing and evaluating our disclosure controls and procedures, management recognizes that any controls and procedures, no matter how well designed and operated, can provide only reasonable assurance of achieving the desired control objectives. In addition, the design of disclosure controls and procedures must reflect the fact that there are resource constraints and that management is required to apply judgment in evaluating the benefits of possible controls and procedures relative to their costs.
Evaluation of Disclosure Controls and Procedures
Our management, with the participation of our chief executive officer and chief financial officer, has evaluated the effectiveness of our disclosure controls and procedures (as defined in Rules 13a-15(e) and 15d-15(e) under the Securities Exchange Act of 1934, as amended, or the "Exchange Act,") as of the end of the period covered by this Annual Report on Form 10-K.
Based on this evaluation, our chief executive officer and chief financial officer concluded that, as of December 31, 2017, our disclosure controls and procedures were not effective at the reasonable assurance level as a result of the material weaknesses discussed below.
However, after giving full consideration to these material weaknesses, and the additional analyses and other procedures that we performed to ensure that our consolidated financial statements included in this Annual Report on Form 10-K were prepared in accordance with U.S. GAAP, our management has concluded that our consolidated financial statements present fairly, in all material respects, our financial position, results of operations and cash flows for the periods disclosed in conformity with U.S. GAAP.
Management’s Annual Report on Internal Control over Financial Reporting
Our management is responsible for establishing and maintaining adequate internal control over financial reporting, as defined in Rule 13a-15(f) under the Exchange Act. Management conducted an assessment of the effectiveness of our internal control over financial reporting based on the criteria set forth in Internal Control – Integrated Framework issued by the Committee of Sponsoring Organizations of the Treadway Commission (2013 framework).
Our management has excluded from its assessment of internal control over financial reporting at December 31, 2017 the internal control over financial reporting of several of the Company’s recently acquired businesses in 2017, comprised of 11 dealerships, Gander Mountain and Overton’s, TheHouse.com, W82, and Uncle Dan’s (collectively the “Excluded Acquisitions”). The Excluded Acquisitions constituted $321.7 million and $139.1 million of total and net assets, respectively, as of December 31, 2017 and $239.3 million and $(22.8) million of revenues and net income (loss), respectively, for the year then ended.
Based on our assessment, our management concluded that our internal control over financial reporting was not effective as of December 31, 2017 as a result of the material weaknesses discussed below. Ernst & Young LLP, the independent registered public accounting firm that audited the financial statements included in this annual report, has issued an attestation report on our internal control over financial reporting, as stated in their report which is included in this Item 9A on page 176.
A “material weakness” is a deficiency, or combination of deficiencies, in internal control over financial reporting, such that there is a reasonable possibility that a material misstatement of our annual or interim financial statements will not be prevented or detected on a timely basis.
173
In connection with the preparation of our consolidated financial statements for the year ended December 31, 2017, errors were identified relating to i) the incorrect assessment of the ability to realize deferred tax assets related to our direct investment in CWGS, LLC, ii) the lack of deferral of a portion of Good Sam roadside assistance policies sold through the finance and insurance process with the sale of new and used vehicles, iii) the application of a portion of certain vendor rebates against the related inventory balances, iv) the elimination of intercompany allocation of certain revenue from new and used vehicles to consumer services and plans, and v) the allocation of the intercompany markup between costs applicable to new and used vehicles. These errors were primarily the result of material weaknesses in internal controls that had not yet been designed to address new activity or have arisen over time because of growth of the Company organically and from acquisitions, increases in employee headcount to support growth, and changes in organizational responsibilities that were not adequately supported by elements of our internal control over financial reporting.
Specifically, the following material weaknesses have been identified:
|
· |
Our tax control related to the realization of deferred tax assets was ineffective as we did not perform sufficient analysis to correctly determine the portion of the deferred tax asset resulting from our direct investment in CWGS, LLC that is not expected to be realized unless we dispose of our investment in CWGS, LLC. Accordingly, as part of the Company’s IPO in October 2016, the Company should have established a partial valuation allowance offsetting a portion of this deferred tax asset, that was initially recorded as part of an equity transaction resulting from its direct investment in CWGS, LLC, which was not expected to be realized in the foreseeable future. This material weakness resulted in the restatement of our consolidated financial statements for the year ended December 31, 2016 as described in Note 1 to the consolidated financial statements contained in this Annual Report on Form 10-K. |
|
· |
Certain accounting policies and procedures related to corporate accounting functions within FreedomRoads, which operates our RV dealerships, were not sufficiently documented and/or executed to be considered effective in providing reasonable assurance that accounting transactions are consistently recorded in accordance with generally accepted accounting principles. Communication to those executing transactions and performing corporate review functions at FreedomRoads was not sufficiently performed to ensure internal control responsibilities were properly reinforced. This led to the inconsistent accounting treatment of certain transactions of similar business activity, an error in accounting for one dealership acquisition, and improper intercompany elimination and/or classification related to specific accounting transactions, which resulted in immaterial adjustments to the financial statements. |
|
· |
Certain of our transaction level and management review controls over the valuation of trade-in unit inventory were not effective. Specifically, some of the information used by FreedomRoads to analyze trade-in inventory included inaccurate or incomplete data. The transaction and management review controls using this information did not operate at a sufficient level of precision to prevent and detect potential errors; no adjustments to the financial statements resulted from this material weakness. |
Management’s Remediation Plan
We have identified and begun to implement several steps, as further described below, designed to remediate the material weaknesses described in this Item 9A and to enhance our overall control environment. Although we intend to complete the remediation process as promptly as possible, we cannot at this time estimate how long it will take to remediate these material weaknesses, and our remediation plan may not prove to be successful. We will not consider the material weaknesses remediated until our enhanced controls are operational for a sufficient period of time and tested, enabling management to conclude that the enhanced controls are operating effectively.
Our remediation plan includes, but is not limited to, the following measures:
174
|
· |
Improving our existing tax controls to include additional analysis of the ability to realize deferred tax assets. This will include an assessment of the sources of income necessary to result in the realization or impairment of those assets. The analysis will also verify that the positive evidence being relied upon is allowed to be considered under the authoritative accounting guidance contained within ASC 740 related to the recognition and measurement of deferred tax assets. The reviewer will also perform additional review procedures when a tax-planning strategy is involved in the determination of the amount of valuation allowance, if any, applied against deferred tax assets; |
|
· |
Improving documentation of accounting policies and procedures to support our internal control infrastructure; |
|
· |
Communicating policy and procedure updates to new and existing personnel to ensure internal control responsibilities assigned and/or delegated are properly reinforced; and |
|
· |
Enhancing our procedures surrounding information produced by the entity within used trade-in unit inventory valuation monitoring controls. This will include testing completeness and accuracy of key inputs and spreadsheets used to monitor and manage used trade-in inventory valuation. |
While the foregoing measures are intended to effectively remediate the material weaknesses described in this Item 9A, it is possible that additional remediation steps will be necessary. As such, as we continue to evaluate and implement our plan to remediate the material weaknesses, our management may decide to take additional measures to address the material weaknesses or modify the remediation steps described above. Until these material weaknesses are remediated, we plan to continue to perform additional analyses and other procedures to help ensure that our consolidated financial statements are prepared in accordance with GAAP.
Changes in Internal Control over Financial Reporting
Other than described above in this Item 9A, there was no change in our internal control over financial reporting (as defined in Rules 13a-15(f) and 15d-15(f) under the Exchange Act) identified in connection with the evaluation of our internal control performed during the fiscal quarter ended December 31, 2017, that has materially affected, or is reasonably likely to materially affect, our internal control over financial reporting.
175
Report of Independent Registered Public Accounting Firm
To the Stockholders and the Board of Directors of Camping World Holdings, Inc. and subsidiaries
Opinion on Internal Control over Financial Reporting
We have audited Camping World Holdings, Inc. and subsidiaries’ internal control over financial reporting as of December 31, 2017, based on criteria established in Internal Control—Integrated Framework issued by the Committee of Sponsoring Organizations of the Treadway Commission (2013 framework) (the COSO criteria). In our opinion, because of the effect of the material weaknesses described below on the achievement of the objectives of the control criteria, Camping World Holdings, Inc. and subsidiaries (the Company) has not maintained effective internal control over financial reporting as of December 31, 2017, based on the COSO criteria.
A material weakness is a deficiency, or combination of deficiencies, in internal control over financial reporting, such that there is a reasonable possibility that a material misstatement of the company’s annual or interim financial statements will not be prevented or detected on a timely basis. The following material weaknesses have been identified and included in management’s assessment. Management has identified material weaknesses in controls related to i) sufficient analysis to correctly determine the portion of the deferred tax asset resulting from the Company’s direct investment in CWGS, LLC not expected to be realized, ii) documentation and/or execution of certain accounting policies and procedures related to corporate accounting functions within FreedomRoads, which operates the RV dealerships, and iii) transaction level and management review controls over the valuation of trade-in unit inventory.
As indicated in the accompanying Management’s Annual Report on Internal Control over Financial Reporting, management’s assessment of and conclusion on the effectiveness of internal control over financial reporting did not include the internal controls of recently acquired businesses in 2017, comprised of 11 dealerships, Gander Mountain and Overton’s, TheHouse.com, W82, and Uncle Dan’s which are included in the 2017 consolidated financial statements of the Company and constituted $321.7 million and $139.1 million of total and net assets, respectively, as of December 31, 2017 and $239.3 million and $(22.8) million of revenues and net income (loss), respectively, for the year then ended. Our audit of internal control over financial reporting of the Company also did not include an evaluation of the internal control over financial reporting of the 11 dealerships, Gander Mountain and Overton’s, TheHouse.com, W82, and Uncle Dan’s.
We also have audited, in accordance with the standards of the Public Company Accounting Oversight Board (United States) (PCAOB), the consolidated balance sheets of Camping World Holdings, Inc. and subsidiaries as of December 31, 2017 and 2016 (Restated), the related consolidated statements of income, stockholders‘ and members’ equity (deficit) and cash flows, for each of the three years in the period ended December 31, 2017, and the related notes and the financial statement schedules listed in the Index at Item 15(a)(2) of the Company. These material weaknesses were considered in determining the nature, timing and extent of audit tests applied in our audit of the 2017 consolidated financial statements, and this report does not affect our report dated March 13, 2018, which expressed an unqualified opinion thereon.
Basis for Opinion
The Company’s management is responsible for maintaining effective internal control over financial reporting and for its assessment of the effectiveness of internal control over financial reporting included in the accompanying Management’s Annual Report on Internal Control over Financial Reporting. Our responsibility is to express an opinion on the Company’s internal control over financial reporting based on our audit. We are a public accounting firm registered with the PCAOB and are required to be independent with respect to the Company in accordance with the U.S. federal securities laws and the applicable rules and regulations of the Securities and Exchange Commission and the PCAOB.
We conducted our audit in accordance with the standards of the PCAOB. Those standards require that we plan and perform the audit to obtain reasonable assurance about whether effective internal control over financial reporting was maintained in all material respects.
176
Our audit included obtaining an understanding of internal control over financial reporting, assessing the risk that a material weakness exists, testing and evaluating the design and operating effectiveness of internal control based on the assessed risk, and performing such other procedures as we considered necessary in the circumstances. We believe that our audit provides a reasonable basis for our opinion.
Definition and Limitations of Internal Control over Financial Reporting
A company’s internal control over financial reporting is a process designed to provide reasonable assurance regarding the reliability of financial reporting and the preparation of financial statements for external purposes in accordance with generally accepted accounting principles. A company’s internal control over financial reporting includes those policies and procedures that (1) pertain to the maintenance of records that, in reasonable detail, accurately and fairly reflect the transactions and dispositions of the assets of the company; (2) provide reasonable assurance that transactions are recorded as necessary to permit preparation of financial statements in accordance with generally accepted accounting principles, and that receipts and expenditures of the company are being made only in accordance with authorizations of management and directors of the company; and (3) provide reasonable assurance regarding prevention or timely detection of unauthorized acquisition, use, or disposition of the company’s assets that could have a material effect on the financial statements.
Because of its inherent limitations, internal control over financial reporting may not prevent or detect misstatements. Also, projections of any evaluation of effectiveness to future periods are subject to the risk that controls may become inadequate because of changes in conditions, or that the degree of compliance with the policies or procedures may deteriorate.
/s/ Ernst & Young LLP
Los Angeles, California
March 13, 2018
Not applicable
177
ITEM 10. Directors, Executive Officers and Corporate Governance
We have adopted a written code of business conduct and ethics, which applies to all of our directors, officers and employees, including our principal executive officer and our principal financial and accounting officer. Our Code of Business Conduct and Ethics is available on our website www.campingworld.com in the “Investor Relations” section under “Governance.” In addition, we intend to post on our website all disclosures that are required by law or New York Stock Exchange listing rules concerning any amendments to, or waivers from, any provision of our Code of Business Conduct and Ethics. The information contained on our website is not incorporated by reference into this Form 10-K.
The information concerning our executive officers and directors in response to this item is contained above in part under the caption “Executive Officers and Directors of the Registrant” at the end of Part I of this Form 10-K. Other Information required by this item will be included under the captions “Proposal 1: Election of Directors”, “Corporate Governance”, “Committees of the Board”, and “Section 16(a) Beneficial Ownership Reporting Compliance” in our Proxy Statement for our 2018 Annual Meeting of Shareholders and, upon filing, is incorporated herein by reference.
ITEM 11. Executive Compensation
The information required by this item will be included under the captions “Executive Compensation”, ”Director Compensation”, “Compensation Committee Report”, and “Compensation Committee Interlocks and Insider Participation” in our Proxy Statement for our 2018 Annual Meeting of Shareholders and, upon filing, is incorporated herein by reference.
ITEM 12. Security Ownership of Certain Beneficial Owners and Management and Related Stockholder Matters
The following table provides information about our compensation plans under which our Class A common stock is authorized for issuance, as of December 31, 2017:
|
Plan Category |
|
Number of securities to be issued upon exercise of outstanding options, warrants and rights |
|
Weighted-average exercise price of outstanding options, warrants and rights |
|
Number of securities remaining available for future issuances under equity compensation plans |
|
Equity compensation plans approved by security holders (1) |
|
2,199,626 |
|
$21.86 |
|
12,381,271 |
|
Equity compensation plans not approved by security holders |
|
— |
|
— |
|
— |
|
Total |
|
2,199,626 |
|
$21.86 |
|
12,381,271 |
|
(1) |
Includes awards granted and available to be granted under our 2016 Incentive Award Plan. |
Other information required by this item with respect to security ownership of certain beneficial owners and management will be included under the caption “Security Ownership of Certain Beneficial Owners and Management” and “Equity Compensation Plan Information” in our Proxy Statement for our 2018 Annual Meeting of Shareholders and, upon filing, is incorporated herein by reference.
ITEM 13. Certain Relationships and Related Transactions, and Director Independence
The information required by this item will be included under the captions “Certain Relationships and Related Person Transactions” and “Corporate Governance—Director Independence” in our Proxy Statement for our 2018 Annual Meeting of Shareholders and, upon filing, is incorporated herein by reference.
178
ITEM 14. Principal Accounting Fees and Services
The information required by this item will be included under the caption “Independent Registered Public Accounting Firm Fees and Other Matters” in our Proxy Statement for our 2018 Annual Meeting of Shareholders and, upon filing, is incorporated herein by reference.
179
ITEM 15. Exhibits, Financial Statements and Schedules
(a)(1) Financial Statements.
See the table of contents under “Item 8. Financial Statements and Supplementary Data” in Part II of this Form 10-K above for the list of financial statements filed as part of this report.
(a)(2) Financial Statement Schedules.
| 166 | |
| 172 |
All other schedules have been omitted because they are not required or because the required information is given in the Consolidated Financial Statements or Notes thereto set forth above under “Item 8. Financial Statements and Supplementary Data” in Part II of this Form 10-K, beginning on page 118.
(a)(3) Exhibits.
INDEX TO EXHIBITS
|
|
|
|
|
Incorporated by Reference |
|
|
||||||
|
Exhibit Number |
|
Exhibit Description |
|
Form |
|
File No. |
|
Exhibit |
|
Filing Date |
|
Filed/ Furnished Herewith |
|
3.1 |
|
Amended and Restated Certificate of Incorporation of Camping World Holdings, Inc. |
|
10-Q |
|
001-37908 |
|
3.1 |
|
11/10/16 |
|
|
|
3.2 |
|
|
10-Q |
|
001-37908 |
|
3.2 |
|
11/10/16 |
|
|
|
|
4.1 |
|
Specimen Stock Certificate evidencing the shares of Class A common stock |
|
S-1/A |
|
333-211977 |
|
10.10 |
|
8/29/16 |
|
|
|
10.1 |
|
|
10-K |
|
001-37908 |
|
10.1 |
|
3/13/17 |
|
|
|
|
10.2 |
|
|
10-K |
|
001-37908 |
|
10.2 |
|
3/13/17 |
|
|
|
|
10.3 |
|
Amended and Restated LLC Agreement of CWGS Enterprises, LLC, dated October 6, 2016 |
|
10-K |
|
001-37908 |
|
10.3 |
|
3/13/17 |
|
|
|
10.4 |
|
|
10-K |
|
001-37908 |
|
10.4 |
|
3/13/17 |
|
|
|
|
10.5 |
|
|
8-K |
|
001-37908 |
|
10.1 |
|
12/22/17 |
|
|
|
180
|
|
|
|
|
Incorporated by Reference |
|
|
||||||
|
Exhibit Number |
|
Exhibit Description |
|
Form |
|
File No. |
|
Exhibit |
|
Filing Date |
|
Filed/ Furnished Herewith |
|
#10.6 |
|
|
S-1/A |
|
333-211977 |
|
10.11 |
|
9/20/16 |
|
|
|
|
#10.7 |
|
|
S-1/A |
|
333-211977 |
|
10.12 |
|
9/20/16 |
|
|
|
|
#10.8 |
|
|
S-1/A |
|
333-211977 |
|
10.13 |
|
9/20/16 |
|
|
|
|
#10.9 |
|
|
S-1/A |
|
333-211977 |
|
10.14 |
|
9/20/16 |
|
|
|
|
#10.10 |
|
|
S-1/A |
|
333-211977 |
|
10.15 |
|
9/20/16 |
|
|
|
|
#10.11 |
|
Employment Agreement, dated December 1, 2012, by and between FreedomRoads, LLC and Roger Nuttall |
|
S-1/A |
|
333-211977 |
|
10.16 |
|
9/20/16 |
|
|
|
#10.12 |
|
|
S-1/A |
|
333-211977 |
|
10.17 |
|
9/20/16 |
|
|
|
|
#10.13 |
|
|
S-1/A |
|
333-211977 |
|
10.18 |
|
9/20/16 |
|
|
|
|
#10.14 |
|
|
S-1/A |
|
333-211977 |
|
10.19 |
|
9/20/16 |
|
|
|
|
#10.15 |
|
|
S-1/A |
|
333-211977 |
|
10.20 |
|
9/20/16 |
|
|
|
|
#10.16 |
|
|
S-1/A |
|
333-211977 |
|
10.21 |
|
9/20/16 |
|
|
|
|
#10.17 |
|
|
S-8 |
|
333-214040 |
|
4.4 |
|
10/11/16 |
|
|
|
|
#10.18 |
|
Camping World Holdings, Inc. 2016 Senior Executive Bonus Plan |
|
10-K |
|
001-37908 |
|
10.19 |
|
3/13/17 |
|
|
|
#10.19 |
|
Camping World Holdings, Inc. Non Employee Director Compensation Policy |
|
S-1/A |
|
333-211977 |
|
10.25 |
|
9/20/16 |
|
|
|
#10.20 |
|
Camping World Holdings, Inc. Director Stock Ownership Guidelines |
|
10-K |
|
001-37908 |
|
10.21 |
|
3/13/17 |
|
|
181
|
|
|
|
|
Incorporated by Reference |
|
|
||||||
|
Exhibit Number |
|
Exhibit Description |
|
Form |
|
File No. |
|
Exhibit |
|
Filing Date |
|
Filed/ Furnished Herewith |
|
#10.21 |
|
Camping World Holdings, Inc. Executive Stock Ownership Guidelines |
|
10-K |
|
001-37908 |
|
10.22 |
|
3/13/17 |
|
|
|
#10.22 |
|
|
S-1/A |
|
333-211977 |
|
10.28 |
|
9/20/16 |
|
|
|
|
#10.23 |
|
|
10-Q |
|
001-37908 |
|
10.2 |
|
8/10/17 |
|
|
|
|
#10.24 |
|
|
10-Q |
|
001-37908 |
|
10.3 |
|
8/10/17 |
|
|
|
|
#10.25 |
|
|
S-1/A |
|
333-211977 |
|
10.31 |
|
9/26/16 |
|
|
|
|
10.26 |
|
|
10-Q |
|
001-37908 |
|
10.3 |
|
11/10/16 |
|
|
|
|
10.27 |
|
|
8-K |
|
001-37908 |
|
10.1 |
|
3/17/17 |
|
|
|
|
10.28 |
|
|
8-K |
|
001-37908 |
|
10.1 |
|
10/10/17 |
|
|
|
|
10.29 |
|
|
8-K |
|
001-37908 |
|
10.1 |
|
5/8/17 |
|
|
|
|
21.1 |
|
|
|
|
|
|
|
|
|
|
* |
|
|
23.1 |
|
|
|
|
|
|
|
|
|
|
* |
|
|
24.1 |
|
|
|
|
|
|
|
|
|
|
* |
|
|
31.1 |
|
Rule 13a-14(a) / 15d-14(a) Certification of Chief Executive Officer |
|
|
|
|
|
|
|
|
|
* |
|
31.2 |
|
Rule 13a-14(a) / 15d-14(a) Certification of Chief Financial Officer |
|
|
|
|
|
|
|
|
|
* |
|
32.1 |
|
|
|
|
|
|
|
|
|
|
** |
|
|
32.2 |
|
|
|
|
|
|
|
|
|
|
** |
|
|
101.INS |
|
XBRL Instance Document |
|
|
|
|
|
|
|
|
|
*** |
|
101.SCH |
|
XBRL Taxonomy Extension Schema Document |
|
|
|
|
|
|
|
|
|
*** |
|
101.CAL |
|
XBRL Taxonomy Extension Calculation Linkbase Document |
|
|
|
|
|
|
|
|
|
*** |
|
101.DEF |
|
XBRL Extension Definition Linkbase Document |
|
|
|
|
|
|
|
|
|
*** |
182
|
|
|
|
|
Incorporated by Reference |
|
|
||||||
|
Exhibit Number |
|
Exhibit Description |
|
Form |
|
File No. |
|
Exhibit |
|
Filing Date |
|
Filed/ Furnished Herewith |
|
101.LAB |
|
XBRL Taxonomy Label Linkbase Document |
|
|
|
|
|
|
|
|
|
*** |
|
101.PRE |
|
XBRL Taxonomy Extension Presentation Linkbase Document |
|
|
|
|
|
|
|
|
|
*** |
*Filed herewith
**Furnished herewith
***Submitted electronically herewith
#Indicates management contract or compensatory plan
None
183
Pursuant to the requirements of Section 13 or 15(d) of the Securities Exchange Act of 1934, the registrant has duly caused this report to be signed on its behalf by the undersigned, thereunto duly authorized.
|
|
Camping World Holdings, Inc. |
|
|
|
|
|
|
Date: March 13, 2018 |
By: |
/s/ MARCUS A. LEMONIS |
|
|
|
Marcus A. Lemonis |
Pursuant to the requirements of the Securities Exchange Act of 1934, as amended, this report has been signed below by the following persons on behalf of the registrant and in the capacities set forth opposite to their names and on the dates indicated.
|
Signature |
|
Title |
|
Date |
|
|
|
|
|
|
|
|
|
/s/ MARCUS A. LEMONIS |
|
Chairman, Chief Executive Officer and Director (Principal Executive Officer) |
|
March 13, 2018 |
|
|
Marcus A. Lemonis |
|
|
|||
|
|
|
|
|
|
|
|
/s/ THOMAS F. WOLFE |
|
Chief Financial Officer (Principal Financial Officer and Principal Accounting Officer) |
|
March 13, 2018 |
|
|
Thomas F. Wolfe |
|
|
|||
|
|
|
|
|
|
|
|
* |
|
Director |
|
|
|
|
Stephen Adams |
|
|
|||
|
|
|
|
|
|
|
|
* |
|
Director |
|
|
|
|
Andris A. Baltins |
|
|
|||
|
|
|
|
|
|
|
|
* |
|
Director |
|
|
|
|
Brian P. Cassidy |
|
|
|||
|
|
|
|
|
|
|
|
* |
|
Director |
|
|
|
|
Mary J. George |
|
|
|||
|
|
|
|
|
|
|
|
* |
|
Director |
|
|
|
|
Daniel G. Kilpatrick |
|
|
|||
|
|
|
|
|
|
|
|
* |
|
Director |
|
|
|
|
Howard A. Kosick |
|
|
|
||
|
|
|
|
|
|
|
|
* |
|
Director |
|
|
|
|
Jeffrey A. Marcus |
|
|
|||
|
|
|
|
|
|
|
|
* |
|
Director |
|
|
|
|
K. Dillon Schickli |
|
|
|||
|
|
|
|
|
|
|
|
*By: |
/s/ MARCUS A. LEMONIS |
|
|
|
March 13, 2018 |
|
Marcus A. Lemonis |
|
|
|
||
184
Similar companies
See also COPART INC - Annual report 2023 (10-K 2023-07-31) Annual report 2023 (10-Q 2023-04-30)See also CARMAX INC - Annual report 2023 (10-K 2023-02-28) Annual report 2023 (10-Q 2023-11-30)
See also PENSKE AUTOMOTIVE GROUP, INC. - Annual report 2022 (10-K 2022-12-31) Annual report 2023 (10-Q 2023-09-30)
See also CASEYS GENERAL STORES INC - Annual report 2023 (10-K 2023-04-30) Annual report 2023 (10-Q 2023-07-31)
See also LITHIA MOTORS INC - Annual report 2022 (10-K 2022-12-31) Annual report 2023 (10-Q 2023-09-30)