Cigna Group - Annual Report: 2019 (Form 10-K)
UNITED STATES
SECURITIES AND EXCHANGE COMMISSION
Washington, D.C. 20549

FORM 10-K
(Mark One)
☒ | ANNUAL REPORT PURSUANT TO SECTION 13 OR 15(d) OF THE SECURITIES EXCHANGE ACT OF 1934 |
For the fiscal year ended December 31, 2019 | |
OR | |
☐ | TRANSITION REPORT PURSUANT TO SECTION 13 OR 15(d) OF THE SECURITIES EXCHANGE ACT OF 1934 |
For the transition period from ______________ to ______________
Commission file number 001-38769
Cigna Corporation
(Exact name of registrant as specified in its charter)
|
|
Delaware | 82-4991898 |
(State or other jurisdiction of incorporation or organization) | (I.R.S. Employer Identification No.) |
900 Cottage Grove Road, Bloomfield, Connecticut | 06002 |
(Address of principal executive offices) | (Zip Code) |
(860) 226-6000 | |
Registrant’s telephone number, including area code | |
Securities registered pursuant to Section 12(b) of the Act: | ||
Title of each class | Trading Symbol(s) | Name of each exchange on which registered |
Common Stock, Par Value $0.01 | CI | |
Securities registered pursuant to Section 12(g) of the Act: |
NONE |
Indicate by check mark | Yes | No | ||||
if the registrant is a well-known seasoned issuer, as defined in Rule 405 of the Securities Act. | ☐ | |||||
if the registrant is not required to file reports pursuant to Section 13 or Section 15(d) of the Act | ☐ | |||||
whether the registrant (1) has filed all reports required to be filed by Section 13 or 15(d) of the Securities Exchange Act of 1934 during the preceding 12 months (or for such shorter period that the registrant was required to file such reports), and (2) has been subject to such filing requirements for the past 90 days | ☐ | |||||
whether the registrant has submitted electronically every Interactive Data File required to be submitted pursuant to Rule 405 of Regulation S-T during the preceding 12 months (or for such shorter period that the registrant was required to submit such files) | ☐ | |||||
whether the registrant is a large accelerated filer, an accelerated filer, a non-accelerated filer, a smaller reporting company or an emerging growth company. See definitions of “large accelerated filer,” “accelerated filer,” “smaller reporting company” and “emerging growth company” in Rule 12b-2 of the Exchange Act. | ||||||
Large accelerated filer | ☒ | Accelerated filer | ☐ | Non-accelerated filer | ☐ | |
| Smaller reporting company | ☐ | Emerging growth company | ☐ | ||
If an emerging growth company, indicate by check mark if the registrant has elected not to use the extended transition period for complying with any new or revised financial accounting standards provided pursuant to Section 13(a) of the Exchange Act. | ☐ |
| ||||
whether the registrant is a shell company (as defined in Rule 12b-2 of the Act). | ☐ | ☒ | ||||
The aggregate market value of the voting stock held by non-affiliates of the registrant as of June 28, 2019 was approximately $59.4 billion.
As of January 31, 2020, 372,043,094 shares of the registrant’s Common Stock were outstanding.
DOCUMENTS INCORPORATED BY REFERENCE
Part III of this Form 10-K incorporates by reference information from the registrant’s definitive proxy statement related to the 2020 annual meeting of shareholders.
TABLE OF CONTENTS
FREQUENTLY REQUESTED 10-K INFORMATION | |
| Page |
Industry Developments and Other Matters | |
|
| Page |
|
| |
|
| |
| ||
| ||
| ||
| ||
| ||
| ||
| ||
| ||
| ||
|
| |
CAUTIONARY NOTE REGARDING FORWARD-LOOKING STATEMENTS
This Annual Report on Form 10-K contains forward-looking statements within the meaning of the Private Securities Litigation Reform Act of 1995. Forward-looking statements are based on Cigna’s current expectations and projections about future trends, events and uncertainties. These statements are not historical facts. Forward-looking statements may include, among others, statements concerning future financial or operating performance, including our ability to deliver affordable, personalized and innovative solutions for our customers and clients; future growth, business strategy, strategic or operational initiatives, including our organizational efficiency plan; economic, regulatory or competitive environments, particularly with respect to the pace and extent of change in these areas; financing or capital deployment plans and amounts available for future deployment; our prospects for growth in the coming years; strategic transactions, including the merger (“Merger”) with Express Scripts Holding Company and the sale of our Group Disability and Life business; and other statements regarding Cigna’s future beliefs, expectations, plans, intentions, financial condition or performance. You may identify forward-looking statements by the use of words such as “believe,” “expect,” “plan,” “intend,” “anticipate,” “estimate,” “predict,” “potential,” “may,” “should,” “will” or other words or expressions of similar meaning, although not all forward-looking statements contain such terms.
Forward-looking statements are subject to risks and uncertainties, both known and unknown, that could cause actual results to differ materially from those expressed or implied in forward-looking statements. Such risks and uncertainties include, but are not limited to: our ability to achieve our financial, strategic and operational plans or initiatives; our ability to predict and manage medical and pharmacy costs and price effectively; our ability to adapt to changes or trends in an evolving and rapidly changing industry; our ability to effectively differentiate our products and services from those of our competitors and maintain or increase market share; our ability to develop and maintain good relationships with physicians, hospitals, other health care providers, producers, consultants and pharmaceutical manufacturers; changes in the pharmacy provider marketplace or pharmacy networks; changes in drug pricing; the impact of modifications to our operations and processes; our ability to identify potential strategic acquisitions or transactions and realize the expected benefits (including anticipated synergies) of such transactions in full or within the anticipated time frame, including with respect to the Merger and sale of our Group Disability and Life business, as well as our ability to integrate or separate operations, resources and systems; the substantial level of government regulation over our business and the potential effects of new laws or regulations or changes in existing laws or regulations; the outcome of litigation, regulatory audits, investigations, actions or guaranty fund assessments; uncertainties surrounding participation in government-sponsored programs such as Medicare; the effectiveness and security of our information technology and other business systems and those of our key suppliers or other third parties; the impact of our debt service obligations on the availability of funds for other business purposes; unfavorable industry, economic or political conditions, including foreign currency movements; acts of civil unrest, war, terrorism, natural disasters or pandemics; reinsurance credit risk; as well as more specific risks and uncertainties discussed in Part I, Item 1A – Risk Factors and Part II, Item 7 – Management’s Discussion and Analysis of Financial Condition and Results of Operations of this Form 10-K and as described from time to time in our future reports filed with the Securities and Exchange Commission (the “SEC”).
You should not place undue reliance on forward-looking statements, which speak only as of the date they are made, are not guarantees of future performance or results, and are subject to risks, uncertainties and assumptions that are difficult to predict or quantify. Cigna undertakes no obligation to update or revise any forward-looking statement, whether as a result of new information, future events or otherwise, except as may be required by law.
PART I
Item 1. BUSINESS
OVERVIEW
Cigna Corporation, together with its subsidiaries (either individually or collectively referred to as “Cigna,” the “Company,” “we,” “our” or “us”) is a global health service organization.
| Our Mission To improve the health, well-being and peace of mind of those we serve |
|
| Our Strategy |
|
Go Deeper: To expand and deepen our customer, client and partner relationships and create depth in targeted sub-segments and geographies | ||
| Go Local: To ensure our solution suite and services meet customer, client and partner needs at a local market level |
|
| Go Beyond: To innovate and further differentiate our businesses, the experiences we deliver and our overall social impact |
|
| How We Win
|
|

Cigna is an enterprise uniquely capable of delivering affordability, predictability and simplicity of health care to those we serve. We have broad and deep capabilities that accelerate our strategy to achieve our mission of improving the health, well-being and peace of mind of those we serve. Cigna’s employees are champions for the people we serve and over the past decade, our focus has shifted to helping people thrive by offering solutions to prevent and better manage health challenges. When sickness or disability do occur, we support our customers’ ability to have broad choices in how they best access high quality, affordable care. We see three primary ways to help individuals maintain, improve or recover their physical or mental health: 1) behavioral and lifestyle changes – with over 1,000 health coaches helping individuals set and meet health goals; 2) pharmaceutical interventions – with our leading pharmacy services improving health and driving affordability; and 3) medical and surgical interventions – with a clear and proven strategy around partnerships and value-based care programs, powered by applied informatics and aligned incentives. We maximize use of evidence-based care, while delivering best-in-class quality of care for our customers with acute and chronic conditions through enhanced real-time data across an expanded platform with industry-leading solutions to support care decisions.
We offer a differentiated set of pharmacy, medical, behavioral, dental, disability, life and accident insurance and related products and services. Our capabilities include: 1) a broad portfolio of specialty services, some of which can be offered on a stand-alone basis; 2) integrated behavioral, medical and pharmacy management services; 3) leading specialty pharmacy expertise; and 4) advanced analytics that help us engage more meaningfully with individuals, plan sponsors we serve and our provider partners. These capabilities enhance Cigna’s ability to drive improved cost affordability, quality of care and predictability.
We put medicine within reach for patients and help providers improve access to prescription drugs by making them more affordable. We improve patient outcomes and better manage the cost of the pharmacy benefit by:
Identifying products and offering innovative solutions that improve patient outcomes and control costs
Evaluating medicines for efficacy, value and price to assist clients in selecting a cost-effective formulary
1
Offering home delivery and specialty services that save money for clients and customers while providing better and specialized clinical care
Leveraging purchasing volume to deliver discounts drive risk-sharing and value-based care across the pharmaceutical supply chain
Promoting the use of generics and lowest cost, clinically effective brands of medications
We work with key stakeholders across the health care system to improve health outcomes and patient satisfaction, increase efficiency in drug distribution and manage costs of the pharmacy benefit. In 2019, we launched three major initiatives: 1) the Patient AssuranceSM program that offers diabetic customers a low, fixed monthly out-of-pocket cost for insulin; 2) the Embarc Benefit ProtectionSM program that improves care, access and affordability for potentially life-changing medicines that are extremely costly and 3) our Digital Health Formulary that helps clients and customers get the most value from innovative digital health products. Plan sponsors and participants can achieve the best health and financial outcomes when they use our comprehensive set of solutions to manage drug spend.
We present the financial results of our businesses in the following segments:
Health Services includes pharmacy benefits management, specialty pharmacy services, clinical solutions, home delivery and health management services.
Integrated Medical offers a variety of health care solutions to employers and individuals.
The Commercial operating segment serves employers (also referred to as “clients”) and their employees (also referred to as “customers”) and other groups. This segment provides deeply integrated medical and specialty offerings including medical, pharmacy, behavioral health, dental, vision, health advocacy programs and other products and services to insured and self-insured clients.
The Government operating segment offers Medicare Advantage, Medicare Supplement, and Medicare Part D plans (including the acquired Express Scripts’ Medicare Part D business) for seniors, Medicaid plans and individual health insurance coverage both on and off the public exchanges.
International Markets includes supplemental health, life and accident insurance products and health care coverage in our international markets as well as health care benefits to globally mobile employees of multinational organizations.
Group Disability and Other contains the remainder of our business operations, consisting of the following:
Group Disability and Life provides group long-term and short-term disability, group life, accident, voluntary and specialty insurance products and related services.
Corporate-Owned Life Insurance (“COLI”) offers permanent insurance contracts sold to corporations to provide coverage on the lives of certain employees for financing employer-paid future benefit obligations.
Run-off businesses:
Reinsurance: predominantly comprised of guaranteed minimum death benefit (“GMDB”) and guaranteed minimum income benefit (“GMIB”) business effectively exited through reinsurance with Berkshire Hathaway Life Insurance Company of Nebraska (“Berkshire”) in 2013.
Settlement Annuity business in run-off.
Individual Life Insurance and Annuity and Retirement Benefits Businesses: comprised of deferred gains from the sales of these businesses.
Other Information
The financial information included in this Form 10-K for the fiscal year ended December 31, 2019 is in conformity with accounting principles generally accepted in the United States of America (“GAAP”) unless otherwise indicated. In the segment discussions that follow, we use the terms “adjusted revenues” and “pre-tax adjusted income from operations” to describe segment results. See the introduction to the Management Discussion and Analysis section of this Form 10-K for definitions of those terms. Industry rankings and percentages set forth herein are for the year ended December 31, 2019 unless otherwise indicated. In addition, statements set forth in this document concerning our rank or position in an industry or particular line of business have been developed internally based on publicly available information unless otherwise noted.
2
Cigna Holding Company (formerly Cigna Corporation) was incorporated in Delaware in 1981. Halfmoon Parent, Inc. was incorporated in Delaware in March 2018. Halfmoon Parent, Inc. was renamed Cigna Corporation concurrent with the consummation of the combination with Express Scripts on December 20, 2018.
You can access our website at http://www.cigna.com to learn more about our company. We make annual, quarterly and current reports and proxy statements and amendments to those reports available, free of charge through our website (http://www.cigna.com, under the “Investors—Quarterly Reports and SEC Filings” captions) as soon as reasonably practicable after we electronically file these materials with, or furnish them to, the Securities and Exchange Commission (the “SEC”). We also use our website as a means of disclosing material information and for complying with our disclosure obligations under the SEC’s Regulation FD (Fair Disclosure). Important information, including news releases, analyst presentations and financial information regarding Cigna is routinely posted on and accessible at http://www.cigna.com. Accordingly, investors should monitor the Investor Relations portion of our website, in addition to following our press releases, SEC filings and public conference calls and webcasts. The information contained on, or that may be accessed through, our website is neither incorporated by reference into nor a part of this report. See also “Code of Ethics and Other Corporate Governance Disclosures” in Part III, Item 10 of this Form 10-K for additional information regarding the availability of our Codes of Ethics on our website.
HEALTH SERVICES
This segment consists of pharmacy benefit management, home delivery and specialty pharmacy and certain health management services. In 2019, Health Services reported adjusted revenues of $96.4 billion and pre-tax adjusted income from operations of $5.1 billion.
HOW WE WIN |
Creating innovative solutions that improve patient outcomes and control costs Evaluating medicines for efficacy, value and price to assist clients in selecting a cost-effective formulary Offering home delivery and specialty services that save money for clients and customers, while providing better and specialized clinical care Leveraging purchasing volume to deliver discounts and drive risk-sharing and value-based care across the pharmaceutical supply chain Promoting the use of generics and lowest-cost, clinically effective brands of medications |
3
The following chart depicts a high-level summary of our principal products and services in this segment with definitions on subsequent pages.
Principal Products & Services | Brands/ Subsidiaries | Key Relationships | Primary Competitors |
Pharmacy Dispensing | Accredo®, Therapeutic Resource Centers®, Express Scripts Pharmacy SM, Cigna Home Delivery Pharmacy | Clients, Customers, Providers | Independent Pharmacy Benefit Managers (“PBMs”), Managed Care PBMs, Retail Pharmacies, Specialty Pharmacies |
Supply Chain Administration and Management | Express Scripts, Smart90®, SmartShareRx®, Ascent Health Services, Econdisc | Clients, Customers | Independent PBMs, Managed Care PBMs, Third Party Benefit Administrators, Group Purchasing Organizations |
Clinical Solutions | Health Connect 360SM, Advanced Utilization Management, Express Scripts Digital Health Formulary, Fraud, Waste & Abuse | Clients, Customers | Independent PBMs, Managed Care PBMs, Third-Party Benefit Administrators |
Value-Based Programs | SafeGuardRx®, Express Scripts Patient AssuranceSM,Embarc Benefit Protection SM | Clients, Customers | Independent PBMs, Managed Care PBMs |
Provider Services | CuraScript SD® | Health Care Providers, Clinics, Hospitals | Specialty Drug Distributors |
Health Benefit Management Services | eviCore | Health Plans, Commercial and Government Payors | Health Plans, Third-Party Benefits Administrators, Clinical Solutions and Health Care Data Analytics Companies |
Principal Products & Services
Pharmacy Benefit Management Services: Our services drive high-quality, cost-effective care through prescription drug utilization and cost management. We support our clients’ plan design selections to deliver balanced affordability, choice, simplicity and convenience. We focus our solutions to align with our clients’ needs across care, cost and service. As a result, we believe we deliver better outcomes, higher customer satisfaction and a more affordable prescription drug benefit. The home delivery pharmacy operations of our Health Services segment consist of eight order processing pharmacies, eight patient contact centers and four high-volume automated home delivery dispensing pharmacies located throughout the United States. Health Services’ home delivery dispensing pharmacies are located in Arizona, Indiana, Missouri and New Jersey. Health Services also has seven specialty home delivery pharmacies and 38 specialty branch pharmacies.
Pharmacy Dispensing:
oHome Delivery Pharmacy Services: In addition to the order processing that occurs at our home delivery pharmacies, we operate several non-dispensing prescription processing facilities and customer contact centers. Our pharmacies provide greater safety and accuracy than retail pharmacies, convenient access to maintenance medications and better management of our clients’ drug costs through operating efficiencies. We are directly involved with the prescriber and customer through our home delivery pharmacies and our research shows that we achieve a higher level of generic substitutions, therapeutic interventions and better adherence than is achieved through retail pharmacy networks.
oSpecialty Pharmacy Services: Specialty medications are used primarily for the treatment of complex diseases. These medications are broadly characterized to include those with frequent dosing adjustments, intensive clinical monitoring, the need for customer training, specialized product administration requirements or medications limited to certain specialty pharmacy networks by manufacturers. Through a combination of assets and capabilities, we provide an enhanced level of predictable care and therapy management for customers taking specialty medications and increased visibility and improved outcomes for payors, as well as custom programs for biopharmaceutical manufacturers. Accredo Health Group (“Accredo”) is focused on dispensing injectable, infused, oral or inhaled drugs that require a higher level of clinical service and support than traditional pharmacies typically offer. Accredo supports successful outcomes for c
4
ustomers and reduces waste for clients through specialty trained clinicians, a nationwide footprint, and a network of in-home nursing services, reimbursement and customer assistance programs and biopharmaceutical services.
oDrug Claim Adjudication: We process drug claims for home delivery, specialty, or retail networks by integrating retail network pharmacy administration, benefit design consultation, drug utilization review, drug formulary management and pharmacy fulfillment services. We administer payments to retail networks and bill benefits costs to our clients through our end-to-end adjudication services.
oDrug Utilization Review program: When pharmacies submit claims for prescription drugs to us, we review them electronically in real time for health and safety. We then alert the dispensing pharmacy of any detected issues. Clients may also choose to enroll in programs that result in communications about potential therapy concerns being sent to prescribers after the initial claim submission.
Supply Chain Administration and Management:
oRetail Network Pharmacy Administration: We contract with retail pharmacies to provide prescription drugs to customers of the pharmacy benefit plans we manage. In the United States, Puerto Rico and the Virgin Islands, we negotiate with pharmacies to discount drug prices provided to customers and manage national and regional networks responsive to client preferences related to cost containment, convenience of access for customers and network performance. We also manage networks of pharmacies customized for or under direct contract with specific clients and have contracted with pharmacy provider networks to comply with the Center for Medicare and Medicaid Services (“CMS”) access requirements for the federal Medicare Part D prescription drug program (“Medicare Part D”). All retail pharmacies in our network communicate with us online and in real-time to process prescription drug claims. When a plan customer presents their identification card at a network pharmacy, the pharmacy sends specific customer, prescriber and prescription information in an industry-standard format through our systems, which process the claim and respond to the pharmacy with relevant information to process the prescription.
oBenefits Design Consultation: We consult with our clients on how best to structure and leverage the pharmacy benefit to meet plan objectives for affordable access to the prescription medications people need to stay healthy, and ensure the safe and effective use of those medications.
oDrug Formulary Management: Formularies are lists of drugs with designations that may be used to determine drug coverage, customer out-of-pocket costs and communicate plan preferences in competitive drug categories. Our formulary management services support clients in establishing formularies that assist customers and physicians in choosing clinically-appropriate, cost-effective drugs and prioritize access, safety and affordability. We administer specific formularies on behalf of our clients, including standard formularies developed and offered by Express Scripts and custom formularies in which we play a more limited role. Most of our clients select standard formularies, governed by our National Pharmacy & Therapeutics Committee comprised of a panel of independent physicians and pharmacists in active clinical practice representing a variety of specialties and practice settings, typically with major academic affiliations. In making formulary recommendations, this committee considers only the drug’s safety and efficacy and not the cost of the drug, including any negotiated manufacturer discount or rebate arrangement. This process is designed to ensure the clinical recommendation is not affected by our financial arrangements. We fully comply with this committee’s clinical recommendations regarding drugs that must be included or excluded from the formulary based on their assessment of safety and efficacy.
oAdministration of Group Purchasing Organizations: Express Scripts operates various group purchasing organizations that negotiate pricing for the purchase of pharmaceuticals, fees and formulary rebates with pharmaceutical manufacturers on behalf of their participants. They also provide various administrative services to their participants including management and reporting.
Clinical Solutions: We offer innovative clinical programs to help our clients drive better health outcomes at a lower cost by identifying and addressing potentially unsafe or wasteful prescribing, dispensing and use of prescription drugs and communicating with, or supporting communications with, physicians, pharmacies and customers.
oOur Health Connect 360 SM offering is a transformational, outcomes based clinical management program that bridges pharmacy, medical, lab and patient engagement data to develop insights and deliver personalized health care interventions. Clinical outcomes and quality metrics are tailored to client needs and guaranteed.
oThrough the Express Scripts Digital Health FormularySM offering, we evaluate digital health solutions available on the market, providing a list to clients of solutions that provide clinical effectiveness, data security, user-friendly experience and financial value.
oAdvanced Utilization Management programs are the number-one tool for decreasing client spend on pharmacy. These include prior authorization, drug quantity management, step therapy and preferred specialty management.
oEnhanced Fraud, Waste & Abuse is an investigative service program that helps plan sponsors identify potential problem customers and prescribers with unusual or excessive utilization patterns. The program is designed to help identify outliers and situations of abnormal use or prescribing patterns by analyzing types of prescriptions, refill patterns and pharmacy utilization.
5
Other solutions include RationalMed®, ScreenRx®, ExpressAlliance®, Advanced Opioid Management®, and OnePASM offerings, as well as Medication Therapy and Medical Benefit Drug Management.
Value-Based Programs:
oSafeGuardRx®: We offer a solution platform aimed at therapy classes that pose significant budgetary threats and clinical challenges to patients. Our solutions are designed to keep our clients ahead of the cost curve while providing customers the personalized care and access they need. These solutions are offered throughout our pharmacy benefit management services and include, but are not limited to care for: cardiovascular, diabetes, hepatitis, inflammatory conditions, migraine, multiple sclerosis, oncology, pulmonary, and rare conditions. Innovative programs, such as our SafeGuardRx program, combine utilization management controls with formulary management, the specialized care model of our Therapeutic Resource Center® program and comprehensive guarantees, and help us to change the market in key categories. Through our Therapeutic Resource Center® offering, we provide caring for customers with the most complex and costly chronic conditions including cardiovascular disease, diabetes, cancer, HIV, asthma, depression and other rare and specialty conditions. These services optimize the safe and appropriate dispensing of therapeutic agents, minimize waste and improve clinical and financial outcomes. Through these services, specialist pharmacists provide the expert, personalized care that customers increasingly demand. Notably, our programs covering oncology and inflammatory conditions have introduced a value-based contracting approach with payments now tied to a product’s effectiveness.
oPatient Assurance ProgramSM: This program addresses the need for greater affordability and access to insulin by providing a fixed out-of-pocket cost to customers in non-government funded benefit plans.
oEmbarc Benefit ProtectionSM: This program combines health benefit management, health services and specialty pharmacy capabilities to make emerging gene therapy treatments more affordable for the payor, the employer and the patient.
Provider Services: CuraScript SD is a specialty distributor of pharmaceuticals and medical supplies (including injectable and infusible pharmaceuticals and medications to treat specialty and rare or orphan diseases) directly to health care providers, clinics and hospitals in the United States for office or clinic administration. Through this business, we provide distribution services primarily to office and clinic-based physicians who treat customers with chronic diseases and regularly order costly specialty pharmaceuticals. This business provides competitive pricing on pharmaceuticals and medical supplies, operates three distribution centers and ships most products overnight within the United States; it also provides distribution capabilities to Puerto Rico and Guam. It is a contracted supplier with most major group purchasing organizations and leverages our distribution platform to operate as a third-party logistics provider for several pharmaceutical companies.
Health Benefit Management Services: eviCore is a leading provider of integrated health benefit management solutions that focus on driving adherence to evidence-based guidelines, improving the quality of patient outcomes and reducing the cost of care for our clients. eviCore manages: diagnostic imaging, comprehensive musculoskeletal disorders, sleep disorders, post-acute care, genetic lab, specialty pharmacy and medical oncology. eviCore contracts with health plans and other commercial and government payors to promote the appropriate use of health care services by the customers they serve. In certain instances, this occurs through capitated risk arrangements, when we assume the financial obligation for the cost of health care services provided to eligible customers covered by eviCore health care management programs.
Customers
Clients: We provide services to managed care organizations, health insurers, third-party administrators, employers, union-sponsored benefit plans, workers’ compensation plans, government health programs, providers, clinics, hospitals and others.
Patients: Prescription drugs are dispensed to patients connected to the service offerings we provide to clients. Prescription drugs are dispensed primarily through networks of retail pharmacies under non-exclusive contracts with us and through our home delivery and specialty drug fulfillment pharmacies.
The Department of Defense’s TRICARE® Pharmacy Program is the military health care program serving active-duty service customers, National Guard and Reserve customers and retirees, as well as their dependents. Under this contract, we provide online claims adjudication, home delivery services, specialty pharmacy clinical services, claims processing and contact center support and other services critical to managing pharmacy trend. In 2019, revenues from this contract were significant to the segment.
On January 30, 2019, Anthem, Inc. (“Anthem”) exercised its right to early termination of its pharmacy benefit management services agreement, effective March 1, 2019. As of December 31, 2019, the transition of customers is substantially complete. For further discussion of our Anthem relationship, see the “Executive Summary – Key Transactions and Business Developments” section of our MD&A located in Part II, Item 7 of the Form 10-K. In 2019, Anthem revenues were significant to the segment.
In December 2019, Express Scripts and Prime Therapeutics LLC (“Prime”) announced a three-year agreement designed to deliver care for Prime’s clients and their patients by enhancing pharmacy networks and pharmaceutical manufacturer value.
6
Competition
The health care industry has undergone periods of substantial consolidation and may continue to consolidate in the future. We believe the primary competitive factors in the industry include the ability to: negotiate with retail pharmacies to ensure our retail pharmacy networks meet the needs of our clients and customers; provide home delivery and specialty pharmacy services; negotiate discounts and rebates on prescription drugs with drug manufacturers; navigate the complexities of government-reimbursed business including Medicare, Medicaid and the public exchanges; manage cost and quality of specialty drugs; use the information we obtain about drug utilization patterns and consumer behavior to reduce costs for our clients and customers and the level of service we provide.
Managed Care PBMs: CVS Caremark (owned by CVS Health Corporation), Envision Rx (owned by Rite Aid Corporation), Humana, IngenioRx (owned by Anthem), Optum (owned by UnitedHealth Group Inc.) and Prime Therapeutics (owned by a collection of Blue Cross / Blue Shield Plans) compete with us on a variety of products and in various regions throughout the United States.
Independent PBMs: MedImpact and Navitus Health Solutions compete with us on a variety of products and in various regions throughout the United States.
Retail Pharmacies: CVS Caremark, Walgreens Boots Alliance, Inc. and WalMart, Inc.
Third-Party Benefits Administrators: Third parties that specialize in claim adjudication and benefit administration, such as Argus, are direct competitors. With the emergence of alternative benefit models through Private Exchanges, the competitive landscape also includes brokers, health plans and consultants. Some of these competitors may deploy greater financial, marketing and technological resources than we do and new market entrants, including strategic alliances aimed at modifying the current health care delivery models or entering the prescription drug sector from another sector of the health care industry, may increase competition as barriers to entry are relatively low.
Clinical Solutions and Health Care Data Analytics Companies: OptumRx (owned by UnitedHealth Group Inc.), Anthem, Magellan Health, HealthHelp, Cotiviti, and Inovalon are among the companies that compete with us in this market.
Operations
Sales and Account Management: Our sales and account management teams market and sell pharmacy benefit management solutions and are supported by client service representatives, clinical pharmacy managers and benefit analysis consultants. These teams work with clients to develop innovative strategies that put medicine within reach of customers while helping health benefit providers improve access to and affordability of prescription drugs.
Supply Chain: Our supply chain contracting and strategy teams negotiate and manage pharmacy network contracts, pharmaceutical and wholesaler purchasing contracts and manufacturer rebate contracts. As our clients continue to experience increased cost trends, our supply chain teams develop innovative solutions such as our SafeGuardRx program and narrow networks to combat these cost increases. In addition, our Formulary Consulting team, consisting of pharmacists and financial analysts, provides services to our clients to support formulary decisions, benefit design consultation and utilization management programs.
Clinical Support: Our staff of highly trained health care professionals provides clinical support for our pharmacy benefit management and health benefit management services, including more specialized care for customers with select chronic and complex conditions. We operate condition-specific Therapeutic Resource Center facilities staffed with specialist pharmacists, nurses and other clinicians who provide personal and specialized customer care. Our clinical solutions staff of pharmacists and physicians provides clinical development and operational support for our pharmacy benefit management services. These health care providers conduct a wide range of activities including identifying emerging medication-related safety issues and alerting physicians, clients, and customers (as appropriate); providing drug information services; managing formulary; and developing utilization management, safety (drug utilization review) and other clinical interventions.
Suppliers
We maintain an inventory of brand-name and generic pharmaceuticals in our home delivery and specialty pharmacies. Our specialty pharmacies also carry biopharmaceutical products to meet the needs of our customers, including pharmaceuticals for the treatment of rare or chronic diseases; if a drug is not in our inventory, we can generally obtain it from a supplier within one business day.
We purchase pharmaceuticals either directly from manufacturers or through authorized wholesalers. Health Services uses one wholesaler more than others in the industry, but holds contracts with other wholesalers if needs for an alternate source arise. Generic pharmaceuticals are generally purchased directly from manufacturers.
7
Industry Developments
See the “Industry Developments” section of the MD&A in this Form 10-K for discussion of key industry developments impacting this segment.
Intellectual Property Rights
Our Company’s Health Services-related trademark and service marks include, but are not limited to, the following: EXPRESS SCRIPTS®, MEDCO®, ACCREDO®, CURASCRIPTSD®, EVICORE HEALTHCARE®, FREEDOM FERTILITY PHARMACY®, RATIONALMED®, SCREENRX®, EXPRESSALLIANCE®, THERAPEUTIC RESOURCE CENTER®, ADVANCED OPIOID MANAGEMENT®, SAFEGUARDRX®, CARDIOVASCULAR CARE VALUESM, HEPATITIS CURE VALUESM, MARKET EVENTS PROTECTIONSM, ONCOLOGY CARE VALUESM, DIABETES CARE VALUESM, INFLAMMATORY CONDITIONS CARE VALUESM, INFLATION PROTECTIONSM, PULMONARY CARE VALUESM, MULTIPLE SCLEROSIS CARE VALUESM, HEALTH CONNECT 360SM, EMBARC BENEFIT PROTECTIONSM, EXPRESS SCRIPTS PATIENT ASSURANCESM and INSIDE RX®. We, or our affiliated companies, own trademark registrations for these and other company marks. Other names and marks referenced herein are the property of their respective owners.
We also hold a portfolio of patents and pending patent applications. We are not substantially dependent on any single patent or group of related patents.
INTEGRATED MEDICAL
Integrated Medical consists of a Commercial operating segment that includes our employer-sponsored medical coverage and a Government operating segment that includes Medicare offerings for seniors and individual insurance offerings both on and off the public health insurance exchanges. In 2019, Integrated Medical reported adjusted revenues of $36.5 billion and pre-tax adjusted income from operations of $3.8 billion.
HOW WE WIN |
Broad and deep portfolio of solutions across Commercial and Government operating segments Commitment to highest-quality health outcomes and customer experiences Collaborative physician engagement models emphasizing value over volume of services Integrated benefit solutions that deliver value for our customers, clients and partners Technology and data analytics powering actionable insights and affordable, predictable solutions Talented and caring people embracing change and putting customers at the center of all we do |
We differentiate ourselves by providing innovative, personalized, and affordable health care benefit solutions based on the unique needs of the individuals and clients we serve. We increase value through our integrated approach and use of technology and data analytics to enhance patient engagement and health care outcomes, underscoring our strategic focus on delivering an industry-leading customer experience. We continue to strengthen our collaborative relationships with providers as we accelerate our transition to a value-based reimbursement system.
We offer a mix of core health insurance products and services to employers, other groups and individuals along with specialty products and services designed to improve the quality of care, lower cost and help customers achieve better health outcomes. Many of these products are available on a standalone basis, but we believe they create additional value when integrated with a Cigna-administered health plan. Our products are available through several distribution channels including brokers, direct sales and public and private exchanges. Our three funding solutions (i.e., insured – experience-rated (“ER”), insured – guaranteed cost (“GC”), and administrative services only (“ASO”) arrangements) enable us to customize the amount of risk taken by, and lower costs for, our customers and clients.
8
The following chart depicts a high-level summary of our principal products and services in this segment, with definitions on subsequent pages.
Principal Products & Services | Major Brand(s) | Geography | Funding Solution(s) | Market Segment(s) | Primary Distribution Channel(s) | Primary Competitors | |
Commercial Medical | |||||||
Managed Care | Cigna HealthCare | Nationwide | GC, ER, ASO | Commercial | Brokers, Private Exchanges, Direct | National Insurers, Local Healthplans, Third-Party Administrators (“TPAs”) | |
Preferred Provider Organization (“PPO”) | Cigna | Nationwide | National Insurers, TPAs | ||||
Consumer-Driven | Cigna | Nationwide | National Insurers, Local Health Maintenance Organizations (“HMOs”) | ||||
Government Medical | |||||||
Individual and Family Plans | Cigna Connect | 9 states(1) | GC | Individual | Public and Private Exchanges | Local Healthplans, Start-ups, National Insurers | |
Medicare Advantage | Cigna | 16 states(2) & District of Columbia | GC | Government | Direct, Brokers | National Insurers, Local Healthplans | |
Medicare Stand –Alone PDPs | Cigna, Express Scripts | Nationwide | GC | Government | Direct, Brokers | National Insurers | |
Medicare Supplement | Cigna | 48 states(3) & District of Columbia | GC | Government | Brokers, Direct, Private Exchanges | National Insurers | |
Specialty Products and Services |
| ||||||
Stop-Loss | Cigna | Nationwide | GC | Commercial | Brokers, Direct | National Insurers, Specialty Companies | |
Cost-Containment | Cigna | Nationwide | GC, ER, ASO | Commercial | Direct | National Insurers, Specialty Companies | |
Consumer Health Engagement | Cigna | Nationwide | GC, ER, ASO | Commercial, Government | Brokers, Direct | National Insurers, Specialty Companies | |
Pharmacy Management | Cigna | Nationwide | GC, ER, ASO | Commercial, Government | Brokers, Direct | National PBMs | |
Behavioral Health | Cigna Behavioral Health | Nationwide | GC, ER, ASO | Commercial | Brokers, Direct | National Insurers, Specialty Companies | |
Dental | Cigna Dental HealthCare | Nationwide | GC, ER, ASO | Commercial, Government | Brokers, Direct | Dental Insurers, National Insurers | |
(1)AZ, CO, FL, IL, MO, NC, TN, TX, VA
(2)AL, AZ, AR, DE, FL, GA, IL, KS, MD, MS, MO, NC, PA, SC, TN, TX
(3)All states except MA and NY
9
Principal Products & Services
Commercial Medical
Managed Care Plans are offered through our insurance companies, HMOs and TPA companies. HMO, LocalPlus®, Network Open Access and Open Access Plus plans use meaningful cost-sharing incentives to encourage the use of “in-network” versus “out-of-network” health care providers. The national provider network for Managed Care Plans is somewhat smaller than the national network used with the PPO plan product line.
PPO Plans feature a network with broader provider access than the Managed Care Plans.
Consumer-Driven Products are typically paired with a high-deductible medical plan and offer customers a tax-advantaged way to pay for eligible health care expenses. These products, consisting of health savings accounts, health reimbursement accounts and flexible spending accounts, encourage customers to play an active role in managing their health and health care costs.
Government Medical
Individual and Family Plans feature an insurance policy coupled with a network of health care providers in a geographic area who have been selected with cost and quality in mind.
Medicare Advantage Plans allow Medicare-eligible beneficiaries to receive health care benefits, including prescription drugs, through a managed care health plan such as our coordinated care plans. Our Medicare Advantage Plans are primarily HMO plans marketed to individuals. A significant portion of our Medicare Advantage customers receive medical care from our value-based models that focus on developing highly engaged physician networks, aligning payment incentives to improved health outcomes and using timely and transparent data sharing.
Medicare Stand-Alone Prescription Drug Products provide a number of prescription drug plan options, as well as service and information support, to Medicare and Medicaid eligible customers. Our stand-alone plans offer the savings of Medicare combined with the flexibility to provide enhanced benefits and a drug list tailored to an individual’s specific needs. Eligible beneficiaries benefit from broad network access and value-added services intended to promote wellness and affordability for our eligible beneficiaries.
Medicare Supplement Plans provide Medicare-eligible beneficiaries with federally standardized Medigap-style plans. Beneficiaries may select among the various plans with specific plan options to meet their unique needs and may visit, without the need for a referral, any health care provider or facility that accepts Medicare throughout the United States.
Specialty Products and Services
Stop-Loss insurance coverage is offered to self-insured clients whose group health plans are administered by Cigna. Stop-loss insurance provides reimbursement for claims in excess of a predetermined amount for individuals, the entire group, or both.
Cost-Containment Programs are designed to contain the cost of covered health care services and supplies. These programs reduce out-of-network utilization and costs, protect customers from balance billing and educate customers regarding the availability of lower cost in-network services. In addition, under these programs we negotiate discounts with out-of-network providers, review provider bills and recover overpayments. We charge fees for providing or arranging for these services. These programs may be administered by third-party vendors that have contracted with Cigna.
Consumer Health Engagement services are offered to customers covered under plans administered by Cigna or by third-party administrators. These services consist of an array of health management, disease management and wellness services. Our Medical Management programs include case, specialty and utilization management and a Health Information line. Our Health Advocacy program services include early intervention in the treatment of chronic conditions and an array of health and wellness coaching. Additionally, we administer incentives programs designed to encourage customers to engage in health improvement activities.
Pharmacy Management services and benefits can be combined with our medical offerings. The comprehensive suite of pharmacy management services available to clients and customers includes benefits management, specialty pharmacy services, clinical solutions, home delivery and certain health management services.
Behavioral Health services consist of behavioral health care case management, employee assistance programs (“EAP”) and work/life programs. We focus on integrating our programs and services with medical, pharmacy and disability programs to facilitate customized, holistic care.
10
Dental solutions include dental health maintenance organization plans, dental preferred provider organization plans, exclusive dental provider organization plans, traditional dental indemnity plans and a dental discount program. Employers and other groups can purchase our products on either an insured or self-insured basis as standalone products or in conjunction with medical products. Additionally, individual customers can purchase insured dental preferred provider organization plans as standalone products or in conjunction with individual medical policies.
Funding Solutions
ASO. Plan sponsors (i.e., employers, unions and other groups) self-fund all claims, but may purchase stop-loss insurance to limit exposure. We collect fees from plan sponsors for providing access to our participating provider network and for other services and programs including: claims administration; behavioral health services; disease management; utilization management; cost containment; dental and pharmacy benefit management. Approximately 85% of our commercial medical customers are in ASO arrangements.
Experience-rated Insurance. Premium rates are established at the beginning of a policy period and are typically based on prior claim experience of the policyholder. When claims and expenses are less than the premium charged (an “experience surplus” or “margin”), the policyholder may be credited for a portion of this experience surplus or margin. If claims and expenses exceed the premium charged (an “experience deficit”), we bear these costs. In certain cases, experience deficits incurred while the policy is in effect are accumulated and may be recovered through future policy year experience surpluses or margins. Approximately 6% of commercial medical customers are in experience-rated arrangements.
Guaranteed Cost Insurance. Premium rates are established at the beginning of a policy period and, depending on group size, may be based in whole or in part on prior experience of the policyholder or on a pool of similar policyholders. We generally cannot subsequently adjust premiums to reflect actual claim experience until the next annual renewal. The policyholder does not participate, or share in, actual claim experience. We keep any experience surplus or margin if costs are less than the premium charged (subject to minimum medical loss ratio rebate requirements discussed below) and bear the risk for actual costs in excess of the premium charged. Approximately 9% of commercial medical customers are in guaranteed cost arrangements.
In most states, individual and group insurance premium rates must be approved by the applicable state regulatory agency (typically department of insurance) and state or federal laws may restrict or limit the use of rating methods. Premium rates for groups and individuals are subject to state review to determine whether they are adequate, not excessive and not unfairly discriminatory. In addition, the Patient Protection and Affordable Care Act (“ACA”) subjects individual and small group policy rate increases above an identified threshold to review by the United States Department of Health and Human Services (“HHS”) and requires payment of premium refunds on individual and group medical insurance products if minimum medical loss ratio (“MLR”) requirements are not met. The MLR represents the percentage of premiums used to pay medical claims and expenses for activities that improve the quality of care. In our individual business, premiums may also be adjusted as a result of the government risk adjustment program that accounts for the relative health status of our customers. See the “Business - Regulation” section of this Form 10-K for additional information about commercial MLR requirements and risk mitigation programs of the ACA.
Market Segments
Commercial comprises employers from the following market segments:
oNational. Multistate employers with 5,000 or more U.S.-based, full-time employees. We offer primarily ASO funding solutions in this market segment.
oMiddle Market. Employers generally with 500 to 4,999 U.S.-based, full-time employees. This segment also includes single-site employers with more than 5,000 employees and Taft-Hartley plans and other groups. We offer ASO, experience-rated and guaranteed cost insured funding solutions in this market segment.
oSelect. Employers generally with 51-499 eligible employees. We usually offer ASO with stop-loss insurance coverage and guaranteed cost insured funding solutions in this market segment.
oSmall Group Employers generally with 2-50 eligible employees. Pending regulatory approvals, we expect to launch a small group offering in select markets in 2020 with a strategic partner.
Individual. Consistent with the regulations for Individual ACA compliant plans, we offer only guaranteed cost plans in this market segment.
Government includes individuals who are Medicare-eligible beneficiaries, as well as employer group sponsored pre- and post-65 retirees. We also have dual-eligible customers who receive both Medicare and Medicaid benefits. We receive revenue from the Centers for Medicare and Medicaid Services (“CMS”) based on customer demographic data and health risk factors. In 2019, revenues from CMS were significant to the segment.
11
Primary Distribution Channels
Brokers. Sales representatives distribute our products and services to a broad group of insurance brokers and consultants across the United States.
Direct. Cigna sales representatives distribute our products and services directly to employers, unions and other groups or individuals across the United States. Various products may also be sold directly to insurance companies, HMOs and third-party administrators. This may take the form of in-person contact, telephone or group selling venues.
Private Exchanges. We partner with select companies that have created private exchanges where individuals and organizations can acquire health insurance. We actively evaluate private exchange participation opportunities as they emerge in the market and target our participation to those models that best align with our mission and value proposition.
Public Exchanges. Public health insurance exchanges for ACA compliant plans on which Cigna may offer individual policies.
Competition
The primary competitive factors affecting our business are quality and cost effectiveness of service and provider networks; effectiveness of medical care management; products that meet the needs of employers and their employees; total cost management; technology; and effectiveness of marketing and sales. Financial strength, as indicated by ratings issued by nationally recognized rating agencies, is also a competitive factor. Our health advocacy capabilities, holistic approach to consumer engagement, breadth of product offerings, clinical care and health management capabilities and array of product funding options are competitive advantages. We believe our focus on improving the health, well-being and peace of mind of those we serve, and how we deliver better affordability, predictability and simplicity in health care will allow us to further differentiate ourselves.
National Insurers. United HealthGroup Inc., Aetna Inc. (owned by CVS Health Corporation), Anthem, Humana and Blue Cross Blue Shield plans compete with us in a variety of products and regions throughout the United States.
Local Healthplans. Blue Cross Blue Shield plans, local affiliates of major insurance companies and hospitals and regional stand-alone managed care and specialty companies compete with us in the states in which we offer managed care products. Additionally, plan sponsors may contract directly with providers.
TPAs. Third-party administrators compete with us for ASO business.
Start-ups. Emerging participants including alternative health service models, consortiums and other health plans seeking to disrupt, often through competitive technology.
Dental Insurers. Various companies offering primarily dental insurance compete with us on these products.
Specialty Companies. Specialty insurance or service companies that offer niche products and services compete with us.
Partnering to Deliver on the Promise of More Affordable, Predictable, Simple Health Care
Cigna’s Connected Care strategy engages customers in their health, collaborates with providers to help them improve their performance, and connects customers and providers through aligned health goals, incentives and actionable information to enable better decisions and outcomes. Our delivery strategy is designed to ensure our customers have access to the right care and in the preferred and appropriate setting at the right time. Fueled by advanced insights and predictive analytics, Cigna is committed to developing innovative solutions that span the health care delivery system and can be applied to different types of providers. Currently we have numerous collaborative arrangements with our participating health care providers that reach 3.9 million customers and are actively developing new arrangements to support our Connected Care strategy.
Accountable Care Program. We have 257 collaborative care arrangements with primary care groups built on the patient-centered medical home and accountable care organization (“ACO”) models. Our arrangements span more than 34 states and reach over 3 million customers. We are committed to increasing the number of groups over the next several years, as well as deepening existing relationships, with a goal of reaching over 270 programs by the end of 2020.
Hospital Quality Program. We have contracts with over 500 hospitals with reimbursements tied to quality metrics. We expect to grow this number to over 600 hospitals by the end of 2020.
Specialist Programs. We have 290 arrangements with specialist groups in value-based reimbursement arrangements. Our goal is to reach approximately 380 arrangements by the end of 2020. Programs include nationwide arrangements with several types of specialist groups including orthopedics, obstetrics and gynecology, cardiology, gastroenterology, oncology, nephrology and neurology. Arrangements include care coordination and episodes of care reimbursements for meeting cost and quality goals.
Independent Practice Associations. We have value-based physician engagement models in our Medicare Advantage business that allow physician groups to share financial outcomes with us. This clinical model also includes outreach to new and at-risk patients to ensure they are accessing their primary care physician.
12
Participating Provider Network. We provide our customers with an extensive network of participating health care providers, hospitals and other facilities, pharmacies and providers of health care services and supplies. In most instances, we contract with them directly; however, in some instances, we contract with third parties for access to their provider networks and care management services. In addition, we have entered into strategic alliances with several regional managed care organizations (e.g., Tufts Health Plan, HealthPartners, Inc., Health Alliance Plan and MVP Health Plan) to gain access to their provider networks and discounts.
INTERNATIONAL MARKETS
Cigna’s International Markets segment has operations in over 30 countries or jurisdictions providing a full range of comprehensive medical and supplemental health, life, and accident benefits to individuals and employers. Products and services include comprehensive health coverage, hospitalization, dental, critical illness, personal accident, term life, and variable universal life. In 2019, International Markets reported adjusted revenues of $5.6 billion and pre-tax adjusted income from operations of $762 million.
HOW WE WIN |
Offering a broad range of health and protection-related solutions to meet the needs of the growing middle class and globally mobile Leveraging deep consumer insights to drive product and service innovation Maintaining leading innovative, direct-to-consumer distribution capabilities Providing access to quality, affordable care through one of the largest global provider networks Implementing locally-licensed and compliant solutions managed by strong, locally-developed talent
|
Demand for our products and services is driven by the growing global middle class, aging populations, increasing prevalence of chronic conditions and rising global health care costs. Our focus on product and service innovation means we continue to deliver solutions that meet the evolving needs of individual and group customers. Our products, distribution channels and funding sources range by customer and geography.
13
International Markets is well positioned to address the growing demand for access to quality, affordable care and supplemental health and life protection that fill gaps in public and private care. We distinguish ourselves through differentiated direct-to-consumer distribution, customer insights, product innovation, a leading provider network and compliant solutions. We identify and pursue attractive market opportunities to bring health and protection solutions and tailor those solutions to the market and customer needs. Over the past several years, we have extended our product offerings and geographic reach. The chart below provides a high-level summary of our principal products and services in this segment with definitions on subsequent pages.
Principal Products & Services | Major Brand(s) | Geography | Funding Solution(s) | Key Relationships | Primary Distribution Channel(s) | Primary Competitors |
Global Health Care | Cigna Global Health Benefits | Worldwide (except as limited by applicable law) | ER, GC, ASO | Multinational Companies, Inter-governmental and Non-governmental Organizations | Brokers, Agents, Direct-to-Consumer | Global insurers |
Local Health Care | Cigna
ManipalCigna
CignaCMB | United Kingdom, Spain, Hong Kong, India, China, Singapore | ER, GC, ASO | Employer Groups
Individuals | Brokers, Agents, Direct-to-Consumer | Global insurers and local non-U.S. insurers |
Supplemental Health, Life, & Accident | Cigna LINA Korea CignaCMB
ManipalCigna
CignaFinans | Asia Pacific, India, Turkey | GC | Individuals | Affinity, Bancassurance, Brokers, Agents, Direct-to-Consumer | Global insurers and local non-U.S. insurers |
Principal Products & Services
Global Health Care products and services include insurance and administrative services for medical, dental, pharmacy, vision and life, accidental death and dismemberment and disability risks. We are leading providers of products and services that meet the needs of multinational employers, intergovernmental and nongovernmental organizations and globally mobile individuals with a focus on keeping employees healthy and productive. The employer benefits products and services are offered through guaranteed cost, experience-rated and administrative services only funding solutions, while individuals purchase guaranteed cost coverage. For definitions of funding solutions, see “Funding Solutions” in the “Integrated Medical” description of business section of this Form 10-K.
Local Health Care products and services include medical, dental, pharmacy and vision as well as life coverage. The customers of local health care businesses are employers and individuals located in specific countries where the products and services are purchased. These employer services can similarly be funded through a range of options; individuals purchase on a guaranteed cost basis.
Supplemental Health, Life and Accident Insurance products and services generally provide simple, affordable coverage of risks for the health and financial security of individuals. Supplemental health products provide stated benefit payments for certain specified health risks and include personal accident, accidental death, critical illness, hospitalization, travel, dental, dementia, cancer and other dread disease coverages. We also offer customers term and variable universal life insurance and certain savings products in select markets.
14
Competition
We anticipate that the competitive environment will intensify as insurance and financial services providers more aggressively pursue expansion opportunities across geographies, particularly Asia. We believe competitive factors will include speed-to-market, customer insights, branding, product, distribution and service innovation, underwriting and pricing, efficient management of marketing and operating processes, commission levels paid to distribution partners, the quality of compliance functions, claims, network coverage and medical cost management, and talent acquisition and retention. Additionally, in most overseas markets, perception of commitment to the market and financial strength will likely be an important competitive factor.
Pricing and Reinsurance
Premium rates and fees for our global and local health care products reflect assumptions about future claims, expenses, customer demographics, investment returns and profit margins. For products using networks of contracted health care providers and facilities, premiums reflect assumptions about the impact of these contracts and utilization management on future claims. Most contracts permit rate changes at least annually.
The profitability of health care products is dependent upon the accuracy of projections for health care inflation (unit cost, location of delivery of care, currency of incurral and utilization), customer demographics, the adequacy of fees charged for administration and effective medical cost management.
Premium rates for our supplemental benefits products are based on assumptions about mortality, morbidity, customer acquisition and retention, customer demographics, expenses and capital requirements, as well as interest rates. Variable universal life insurance products fees consist of mortality, administrative, asset management and surrender charges assessed against the contractholder’s fund balance. Mortality charges on variable universal life may be adjusted prospectively to reflect expected mortality experience. Most contracts permit premium rate changes at least annually.
A global approach to underwriting risk management allows each local business to underwrite and accept risk within specified limits. Retentions are centrally managed through cost-effective use of external reinsurance to limit our liability on per life, per risk and per event (catastrophe) bases.
Industry Developments and Other Items Affecting International Markets
South Korea represents our single largest geographic market for International Markets. For information on this concentration of risk for the International Markets segment's business in South Korea, see "Other Items Affecting Results of International Markets" in the International Markets section of the MD&A of this Form 10-K.
Pressure on social health care systems, a rapidly aging population and increased wealth and education in developing insurance markets are leading to higher demand for health insurance and financial security products. In the supplemental health, life and accident business, direct marketing channels continue to grow and attract new competitors with industry consolidation among financial institutions and other affinity partners.
Data privacy regulation has tightened in all markets in the wake of high-profile data privacy incidents, impacting affinity partner and customer attitudes toward direct marketing of insurance and other financial services. It has also placed an added emphasis on the importance of operational compliance.
15
GROUP DISABILITY AND OTHER
As explained further in the introduction to this Form 10-K, Group Disability and Other consists of our Group Disability and Life operating segment, along with COLI and certain run-off businesses reported together in Other Operations. In 2019, Group Disability and Other reported adjusted revenues of $5.2 billion and pre-tax adjusted income from operations of $501 million.
In December 2019, Cigna entered into a definitive agreement to sell the Group Disability and Life business to New York Life Insurance Company for $6.3 billion. The sale is expected to close in the third quarter of 2020 subject to applicable regulatory approvals and other customary closing conditions. Until the transaction is finalized, we continue to operate our business as usual and serve our customers.
HOW WE WIN |
Disability absence management model that reduces overall costs to employers Integration of disability products with medical and specialty offerings, promoting health and wellness and optimizing employee productivity Complementary portfolio of group disability, life and accident offerings Disciplined underwriting, pricing and investment strategies supporting profitable long-term growth |
Group Disability and Life
Our Group Disability and Life operating segment includes our commercial long- and short-term disability products and our term life group insurance products. We also offer personal accident insurance and voluntary products and services. These products and services are distributed through brokers and direct sales and are available in guaranteed cost, experience-rated and ASO arrangements. The following chart depicts a high-level summary of our Principal Products and Services in this segment with definitions on subsequent pages.
Principal Products & Services | Payor | Premium Rates | Funding Solution(s) | Market Segment(s) | Primary Distribution Channel(s) | Primary Competitors |
Group Disability | ||||||
Long-term Disability | Employer, Employee | Preset, guaranteed | ER, GC, ASO | Commercial | Brokers, Direct | National Insurers, Regional Insurers |
Short-term Disability | Employer, Employee | Preset, guaranteed | ER, GC, ASO | Commercial | Brokers, Direct | National Insurers, Regional Insurers |
Group Life | ||||||
Term Life | Employer, Employee | Preset, guaranteed | ER, GC | Commercial | Brokers, Direct | National Insurers, Regional Insurers |
Group Accident and Voluntary | ||||||
Personal Accident Insurance | Employer, Employee | Preset, guaranteed | ER, GC | Commercial | Brokers, Direct | National Insurers, Regional Insurers |
Voluntary Products and Services | Employee | Preset, guaranteed | GC | Commercial | Brokers, Direct | National Insurers, Regional Insurers |
Principal Products & Services
Group Disability
Group Long-term and Short-term Disability insurance products generally provide a fixed level of income to replace a portion of wages lost due to disability. As part of our group disability insurance products, we also assist employees in returning to work and employers with resources to manage the cost of employee disability
Leave Administration solutions help customers effectively manage workforce absence and provide coverage for paid leave.
16
Group Life Insurance
Group Term Life insurance may be employer-paid basic life insurance, employee-paid supplemental life insurance or a combination thereof.
Group Accident and Voluntary
Personal Accident Insurance coverage consists primarily of accidental death and dismemberment and travel accident insurance to employers.
Voluntary Products and Services include plans that provide employers with administrative solutions designed to provide a complete and simple way to manage their benefits program. These voluntary offerings include accidental injury insurance, critical illness coverage and hospital care coverage, and provide additional dollar payouts to employees for unexpected accidents, hospitalization or more serious illnesses.
Pricing
Premiums charged for disability and term life insurance products are usually established in advance of the policy period and are generally guaranteed for one to three years, but selectively guaranteed for up to five years. Policies are generally subject to termination by the policyholder or by the insurance company annually. Premium rates reflect assumptions about future claims, expenses, credit risk, investment returns and profit margins. These assumptions may be based in whole or in part on prior experience of the account or on a pool of accounts, depending on the group size and the statistical credibility of the experience that varies by product.
Market Segments
Commercial. Commercial market segments are as follows:
oNational. Multistate employers with 5,000 or more U.S.-based, full-time employees.
oMiddle Market. Employers generally with 250 to 4,999 U.S.-based, full-time employees.
oSelect. Employers generally with up to 249 eligible employees.
Primary Distribution Channels
Insurance Broker and Consultants. Sales representatives distribute our products and services to a broad group of insurance brokers and consultants across the United States.
Direct. Sales representatives distribute our products and services directly to employers, unions and other groups or individuals across the United States. This may take the form of in-person contact, telephone or group selling venues.
Competition
The principal competitive factors that affect the Group Disability and Life segment are underwriting and pricing, the quality and effectiveness of claims management, relative operating efficiency, investment and risk management, distribution methodologies and producer relations, the breadth and variety of products and services offered, the quality of customer service and, more importantly, the state of the tools and technology available for customers, clients, consultants and producers. For certain products with longer-term liabilities, such as group long-term disability insurance, the financial strength of the insurer, as indicated by ratings issued by nationally recognized rating agencies, is also a competitive factor.
National Insurers. Unum, The Hartford, Prudential Financial, Lincoln Financial Group and MetLife compete with us on a variety of products and regions throughout the United States.
Industry Developments
Employers have expressed a growing interest in employee wellness, absence management and productivity and recognize a strong link between employee health productivity and profitability.
17
The group insurance market remains highly competitive as the rising cost of medical coverage has forced companies to re-evaluate their overall employee benefit spending, resulting in lower volumes of group disability and life insurance business and more competitive pricing.
Over the past few years, there has been heightened review by state regulators of the claims handling practices within the disability and life insurance industry. This has resulted in an increase in coordinated, multistate examinations that target specific market practices in addition to regularly recurring examinations of an insurer’s overall operations conducted by an individual state’s regulators. We have been subject to such an examination over the past several years.
The lower level of interest rates in the United States over the last several years has constrained earnings growth in this segment due to lower yields on our fixed-income investments and higher benefit expenses resulting from the discounting of future claim payments at lower interest rates.
Other Operations
Other Operations includes the following:
Corporate-owned Life Insurance
The principal products of the COLI business are permanent insurance contracts sold to corporations to provide coverage on the lives of certain employees for financing employer-paid future benefit obligations. Permanent life insurance provides coverage that, when adequately funded, does not expire after a term of years. The contracts are primarily non-participating universal life policies. Fees for universal life insurance products consist primarily of mortality and administrative charges assessed against the policyholder’s fund balance. Interest credited and mortality charges for universal life and mortality charges on variable universal life may be adjusted prospectively to reflect expected interest and mortality experience. To reduce our exposure to large individual and catastrophe losses, we purchase reinsurance from unaffiliated reinsurers.
Run-off Settlement Annuity Business
Our settlement annuity business is a closed, run-off block of single premium annuity contracts. These contracts are primarily liability settlements with approximately 20% of the liabilities associated with guaranteed payments not contingent on survivorship. Non-guaranteed payments are contingent on the survival of one or more parties involved in the settlement.
Run-off Reinsurance
Our reinsurance operations are an inactive business in run-off.
In February 2013, we effectively exited the guaranteed minimum death benefit (“GMDB”) and guaranteed minimum income benefit (“GMIB”) business by reinsuring 100% of our future exposures, net of retrocessional arrangements in place at that time, up to a specified limit. For additional information regarding this reinsurance transaction and the arrangements that secure our reinsurance recoverables, see Note 10 to the Consolidated Financial Statements.
Individual Life Insurance and Annuity and Retirement Benefits Businesses
This business includes deferred gains recognized from the 1998 sale of the individual life insurance and annuity business and the 2004 sale of the retirement benefits business. For more information regarding the arrangements that secure our reinsurance recoverables for the retirement benefits business, see Note 10 to the Consolidated Financial Statements.
TECHNOLOGY
Cigna Technology Services supports our business strategy by focusing first and foremost on strong foundational technology services, delivery of a business-aligned technology project portfolio and focused strategic innovation that creates technology solutions to differentiate us in the market. Our innovation continues to focus on three strategic areas: insights and analytics; digital health and care delivery and management. Our technology strategy drives improved customer experience, increases engagement and advances population health with data driven insights and using advanced analytics and predictive intelligence to provide key areas of competitive advantage. Innovation is core to the way we do business and will be a critical factor to our success in the highly dynamic health care industry. Our business strategy is based upon providing customers with differentiated, easy-to-use, seamless and secure products and solutions that use insights from advanced analytics to exceed their expectations.
18
Our technology team, powered by approximately 7,000 employees and several thousand external resources contracted with our partners, supports the various information systems essential to our operations including the health benefit claims processing systems and specialty and home delivery pharmacy systems. Uninterrupted point-of-sale electronic retail pharmacy claims processing is a significant operational requirement for our business. We believe we have substantial capacity for growth in our United States claims processing facilities. Our pharmacy technology platform allows us to safely, rapidly and accurately adjudicate over one billion adjusted prescriptions annually. Our technology helps retail pharmacies focus on patient care and our real-time safety checks help avoid hundreds of thousands of medication errors annually.
We anticipate needs and meet customers where they are, from predicting and preventing chronic diseases, to using data to reduce payment and claims fraud, optimizing whole person health and leveraging the data from wearable devices and the Internet of Things to optimize population health status. Innovation is at the center of what differentiates Cigna. Cigna innovations improve patient outcomes while eliminating waste in the health care system. The Cigna companies hold more than 190 United States patents. We use these patents to protect our proprietary technological advances and to differentiate ourselves in the market.
We continue to bring new technology-enabled products and services to the market, including biometric stress prediction and focused insights in spaces such as women’s health and opioid addiction. Our digital health focus has shown value across the enterprise by creating engaging experiences that give customers the right information at the right time. This includes an enhanced MyCigna.com experience with new features, including refill and payment options, without leaving the mobile application. Cybersecurity protections, such as multi-factor authentication, have been launched across Cigna’s digital offerings providing better peace of mind and a stronger sense of security.
During 2019, significant technology integration, including with the acquired Express Scripts platform, delivered cost synergies, drove differentiated innovation and facilitated the transition to Express Scripts capabilities in areas such as supply chain, specialty pharmacy and retail networks. In the future, we expect continued integration and value realization with focus on customer-facing system integration and opportunities for enhanced value in specialty, claims and retail. With the combined strengths and capabilities of Cigna and Express Scripts, we see greater opportunities to create novel, highly-tailored customer insights as we mine data and use sophisticated advanced analytics and predictive intelligence to build better models that help us find solutions to complex questions and improve health care outcomes.
ANALYTICS
Cigna’s investments in data and analytics enable affordability, simplicity, predictability and growth across all of our business platforms. We create value for our customers and stakeholders by enabling better insights and actionable intelligence, developing new solutions and digitally-enabled value propositions and creating innovative data and analytics driven services. We leverage advanced analytics and predictive intelligence to design more affordable benefit plans and services, serve our customers and clients, and improve care costs and health outcomes.
Our teams conduct timely, rigorous and objective research and analysis that informs evidence-based medical and pharmacy benefit management and evaluates the clinical, economic and individual impact of enhanced benefit designs and programs.
Our commitment to innovation generates new and more effective ways to close care gaps, optimize treatment and improve outcomes.
Our data and analytics talent empowers these capabilities through deep expertise in data management, business analysis, intelligence and data science, with ongoing investments in talent development, analytic and big data technologies, as well as innovative third party partnerships while ensuring controls are in place to protect sensitive client and customer information.
19
INVESTMENT MANAGEMENT
Our investment operations provide investment management and related services for our various businesses, including the insurance-related invested assets in our General Account (“General Account Invested Assets”). We acquire or originate, directly or through intermediaries, a broad range of investments including private placement and public securities, commercial mortgage loans, real estate, mezzanine, private equity partnerships and short-term investments. Invested assets also include policy loans that are fully collateralized by insurance policy cash values. We also enter into derivative financial instruments, primarily to minimize the risk of changes in foreign currency exchange rates on our investments. Invested assets are managed primarily by our subsidiaries and, to a lesser extent, external managers with whom our subsidiaries contract. Net investment income is included as a component of adjusted income from operations for each of our segments and Corporate. Realized investment gains (losses) are reported by segment but excluded from adjusted income from operations. For additional information about invested assets, see the “Investment Assets” section of the MD&A and Notes 11 and 12 to the Consolidated Financial Statements.
We manage our investment portfolios to reflect the underlying characteristics of related insurance and contractholder liabilities and capital requirements, as well as regulatory and tax considerations pertaining to those liabilities and state investment laws. Insurance and contractholder liabilities range from short duration health care products to longer-term obligations associated with disability and life insurance products and the run-off settlement annuity business. Assets supporting these liabilities are managed in segregated investment portfolios to facilitate matching of asset durations and cash flows to those of corresponding liabilities. Investment results are affected by the amount and timing of cash available for investment, economic and market conditions and asset allocation decisions. We routinely monitor and evaluate the status of our investments, obtaining and analyzing relevant investment-specific information and assessing current economic conditions, trends in capital markets and other factors such as industry sector, geographic and property-specific information.
Separate Accounts
Our subsidiaries or external advisors manage invested assets of Separate Accounts on behalf of contractholders, including the Cigna Pension Plan, variable universal life products sold through our corporate-owned life insurance business and other life insurance products. These assets are legally segregated from our other businesses and are not included in General Account Invested Assets. Income, gains and losses generally accrue directly to the contractholders.
Investing in Innovation
In addition to the portfolio investments in our general and separate accounts discussed above that support our insurance operations, we do targeted investing within the health care industry specifically. Our Cigna Ventures unit has been allotted $250 million to invest in promising startups and growth-stage companies that create new growth possibilities in health care. These targeted investments bring improved care quality, affordability, choice and greater simplicity to customers, patients and clients by harnessing transformative ideas in: 1) insights and analytics; 2) digital health and retail and 3) care delivery and management.
MISCELLANEOUS
We are not dependent on business from one or a few clients. No one client accounted for 10% or more of our consolidated revenues in 2019. We are not dependent on business from one or a few brokers or agents. In addition, our insurance businesses are generally not committed to accept a fixed portion of the business submitted by independent brokers and agents and generally all such business is subject to approval and acceptance.
We had approximately 73,700 employees as of December 31, 2019.
REGULATION
The laws and regulations governing our business continue to increase each year and are subject to frequent change. We are regulated by federal, state and international legislative bodies and agencies, which generally have discretion to issue regulations and interpret and enforce laws and rules. These regulations can vary significantly from jurisdiction to jurisdiction, and the interpretation of existing laws and rules also may change periodically. Domestic and international governments continue to enact and consider various legislative and regulatory proposals, which could materially impact the health care system. The U.S. 2020 presidential and state elections likely will fuel continued legislative and regulatory debate of issues related to our businesses.
20
Many aspects of our business are directly regulated by federal and state laws and administrative agencies, such as the Department of Health and Human Services (“HHS”), Centers for Medicare and Medicaid Services (“CMS”), the Internal Revenue Service (“IRS”), the U.S. Departments of Labor (“DOL”), the Office of Personnel Management (“OPM”) Treasury and Justice (“DOJ”), the Federal Trade Commission (“FTC”), the U.S. Securities and Exchange Commission (“SEC”), the Office of the National Coordinator for Health Information Technology, state departments of insurance and state boards of pharmacy. Our business practices may also be shaped by judicial decisions.
In addition, aspects of our business are subject to indirect regulation. The self-funded benefit plans sponsored by our U.S. employer clients are regulated under federal law. These self-funded clients expect us to assure that our administration of their plans complies with the regulatory requirements applicable to them.
Our business operations and the books and records of our regulated businesses are routinely subject to examination and audit at regular intervals by state insurance and HMO regulatory agencies, state boards of pharmacy, CMS, DOL, IRS, OPM and comparable international regulators to assess compliance with applicable laws and regulations. Our operations are also subject to nonroutine examinations, audits and investigations by various state and federal regulatory agencies, generally as the result of a complaint. In addition, we may be implicated in investigations of our clients whose group benefit plans we administer on their behalf. As a result, we routinely receive subpoenas and other demands or requests for information from various state insurance and HMO regulatory agencies, state attorneys general, the Office of Inspector General (“OIG”), the DOJ, the DOL and other state, federal and international authorities. We may also be called upon by members of the U.S. Congress to provide information, including testifying before congressional committees and subcommittees, regarding certain of our business practices. If Cigna is determined to have failed to comply with applicable laws or regulations, these examinations, investigations, reviews, subpoenas and demands may:
•result in fines, penalties, injunctions, consent orders or loss of licensure;
•suspend or exclude from participation in government programs or limit our ability to sell or market our products;
•require changes in business practices;
•damage relationships with the agencies that regulate us and affect our ability to secure regulatory approvals necessary for the operation of our business; or
•damage our brand and reputation.
Our international subsidiaries are subject to regulations in international jurisdictions, including in certain case many regulations similar to the federal and state regulations described below, which are complex and where foreign insurers may face more rigorous regulations than their domestic competitors and may also be affected by geopolitical developments or tensions.
The laws and regulations governing our business, as well as the related interpretations, are subject to frequent change and can be inconsistent or in conflict with each other. Changes in our business environment are likely to continue as elected and appointed officials at the national and state levels continue to propose and enact significant modifications to existing laws and regulations. Even where we believe that we are in compliance with the various laws and regulations, any enforcement actions by federal, state or international government officials alleging non-compliance with these rules and regulations could subject us to penalties or restructuring or reorganization of our business. For a discussion of the risks related to our compliance with these laws and regulations see the Risk Factors section located in Part 1, Item 1A of this Form 10-K. Management continues to be actively engaged with regulators and policymakers with respect to legislation and rulemaking. See the “Executive Overview – Health Care Industry Developments and Other Matters Affecting our Integrated Medical and Health Services Segments” section of our MD&A located in Part II, Item 7 of this Form 10-K for a discussion of the anticipated impact of certain recent industry developments.
Patient Protection and the Affordable Care Act (“ACA”)
The Patient Protection and Affordable Care Act (“ACA”) mandated broad changes to the U.S. health care system, including insured and self-insured health benefit plans and pharmacy benefit managers. Our business model is impacted by the ACA, including our relationships with current and future producers and health care providers, products, service providers and technologies. Key provisions of the ACA include the imposition of a non-tax deductible health insurance industry fee and other assessments on health insurers, and the creation of health insurance exchanges for individuals and small group employers to purchase insurance coverage. The ACA also implemented minimum medical loss ratios (“MLRs”) for our Medicare and commercial businesses. Certain states have adopted MLR requirements applicable to our commercial businesses that are more stringent than those established by the ACA. Other provisions of the ACA in effect include reduced Medicare Advantage premium rates, the requirement to cover preventive services with no enrollee cost-sharing, banning the use of lifetime and annual limits on the dollar amount of essential health benefits, increasing restrictions on rescinding coverage, extending coverage of dependents up to age 26, restrictions on differential pricing, enforcement mechanisms and rules related to health care fraud and abuse enforcement activities and certain pharmacy benefit transparency requirements. The employer mandate requires employers with 50 or more full-time employees to offer affordable health insurance that provides minimum value (each as defined under the ACA) to full-time employees and their dependents, including
21
children up to age 26, or be subject to penalties based on employer size. The ACA also changed certain tax laws to effectively limit tax deductions for certain employee compensation paid by health insurers. In December 2019, the federal government repealed the non-deductible health insurance industry fee effective for 2021, as well as repealing the enacted but never implemented 40% excise tax on certain employer-sponsored coverage (known as the “Cadillac Tax”) and the medical device tax.
Since its adoption, there have been several attempts to repeal or limit the utility of the ACA. Certain insurers have sued the federal government for failure to pay cost-sharing subsidies under the ACA. The matter remains unresolved and we continue to monitor developments. In December 2017, U.S. tax reform legislation was signed into law that, among other things, reduced the “individual mandate” penalty for individuals without health insurance to zero dollars, effective January 1, 2019. As a result of this change, a federal district court has ruled that the “individual mandate” is unconstitutional. On appeal, the Court of Appeals for the Fifth Circuit agreed that the “individual mandate” is unconstitutional but ordered the district court to reexamine whether the other provisions of the ACA can remain in effect, thereby leaving in doubt whether the entire ACA is unconstitutional until there is a final judicial determination on appeal.
Additionally, in 2017, the current administration issued an executive order asking the DOL to revise the Employee Retirement Income Security Act of 1974, as amended (“ERISA”) regulations to make it easier for employers, particularly small employers, to associate for the purpose of sponsoring large group health plans and thereby avoid the ACA’s small group market reform (e.g., community-rating and mandated coverage of essential health benefits) that impaired the affordability of providing health coverage to their employees. In the spring of 2018, the DOL issued final rules that revised the definition of “employer” in the ERISA rules to make it easier for employers, including self-employed individuals, to form bona fide employer groups, all of whose employees would be counted in determining whether they were small or large groups for purposes of the ACA. While the regulation of these groupings by state insurance departments is not affected by the DOL’s final association health plan rules, the final rules have resulted in an increase in interest among employers, associations, producers and benefit consultants in forming new groupings for purposes of offering insured or self-funded group health plans.
See also the “Executive Overview” section of our MD&A of this Form 10-K for more information. Additionally, see Note 2 to the Consolidated Financial Statements for more information regarding accounting policies around the risk mitigation programs under the ACA.
Medicare and Medicaid Regulations
Through our subsidiaries, we offer individual and group Medicare Advantage, Medicare Pharmacy (“Part D”) and Medicare Supplement products. We also provide Medicare Part D-related products and services to other Medicare Part D sponsors, Medicare Advantage Prescription Drug Plans and employers and clients offering Medicare Part D benefits to Medicare Part D eligible beneficiaries. As part of our Medicare Advantage and Medicare Part D business, we contract with CMS to provide services to Medicare beneficiaries. As a result, our ability to obtain payment (and the determination of the amount of such payments), market to, enroll and retain customers and expand into new service areas is subject to compliance with CMS’ numerous and complex regulations and requirements that are frequently modified and subject to administrative discretion, review and enforcement. We offer Medicaid and dual-eligible products and participate in state Medicaid programs directly or indirectly through our clients who are Medicaid managed care contractors. We also perform certain Medicaid subrogation services and certain delegated services, including utilization management, for clients, which are regulated by federal and state laws. Our Medicaid and dual-eligible products are regulated by CMS and state Medicaid agencies audit our performance to determine compliance with contracts and regulations.
CMS evaluates Medicare Advantage plans and Part D plans under its “Star Rating” system. The Star Rating system considers various measures adopted by CMS, including, for example, quality of care, preventive services, chronic illness management, coverage determinations and appeals and customer satisfaction. A plan’s Star Rating affects its image in the market and plans that perform very well are able to offer enhanced benefits and market more effectively and for longer periods of time than other plans. Medicare Advantage plans’ quality-bonus payments are determined by the Star Rating, with plans receiving a rating of four or more stars eligible for such payments. The Star Rating system is subject to change annually by CMS, which may make it more difficult to achieve and maintain four stars or greater.
CMS uses a risk-adjustment model which adjusts premiums paid to Medicare Advantage plans according to customers’ health status. The risk-adjustment model generally pays more where a plan's membership has higher than expected costs. Under this model, rates paid to Medicare Advantage plans are based on actuarially determined bids, which include a process whereby our prospective payments are based on our estimated cost of providing standard Medicare-covered benefits to an enrollee with a “national average risk profile.” That baseline payment amount is adjusted to reflect the health status of our enrolled membership. Under the risk-adjustment methodology, Medicare Advantage plans must collect and submit the necessary diagnosis code information from hospital inpatient, hospital outpatient, and physician providers to CMS within prescribed deadlines. We generally rely on providers, including certain providers in our network who are employees, to code their claim submission with appropriate diagnoses which we send to CMS as the
22
basis for our payments received under the actuarial risk-adjustment model. The CMS risk-adjustment model uses the diagnosis data to calculate the risk-adjusted premium payment to the plans, which CMS adjusts for coding pattern differences between the health plans and the government fee-for-service program. In 2012, CMS released a payment methodology that provided for sample audit error rates to be extrapolated to the entire Medicare Advantage contract after comparing audit results with a similar audit of Medicare Fee for Service (the “FFS Adjuster”) and applying an FFS Adjuster to establish actuarial equivalency in payment rates as required by the Medicare statute. However, a methodology to calculate the FFS Adjuster was not finalized and CMS has, to date, not completed any Risk Adjustment Data Validation (“RADV”) audits using extrapolation. See below under “Federal and State Oversight of Government-Sponsored Health Care Programs” for a discussion of RADV audits.
On November 1, 2018, CMS released a proposed rule titled “Proposed Rule on Changes to MA and Part D Programs for CY 2020 and 2021” that would revise its RADV methodology for RADV audits of contract year 2011 and all subsequent years by, among other things, extrapolating RADV results at the contract level without applying the FFS Adjuster. The Company, along with other Medicare Advantage organizations and additional interested parties, submitted comments to CMS on the proposed rule as part of the notice-and-comment rulemaking process. The comment period concluded on August 28, 2019. It is uncertain whether CMS will finalize the rule as proposed.
Coverage of prescription drugs under Medicare Part D is also regulated by CMS and our contracts with CMS contain provisions for risk sharing and certain payments for prescription drug costs for which we are not at risk. These provisions affect our ultimate payments from CMS. For example, premiums from CMS are subject to risk corridor payments which compare costs targeted in our annual bids with actual prescription costs, limited to actual costs that would have been incurred under the standard coverage as defined by CMS. Variances exceeding certain thresholds may result in CMS making additional payments to us or require us to refund to CMS a portion of the payments we received (known as a risk corridor).
In February 2019, CMS proposed rules to support the seamless and secure access, exchange and use of electronic health information. In the proposed rules, CMS proposes requirements that Medicaid, the Children’s Health Insurance Program, Medicare Advantage plans and qualified health plans in the federally-facilitated exchanges provide enrollees with immediate electronic access to medical claims and other health information electronically by 2020. This proposed rule is subject to revision through a comment process. The Company submitted comments to CMS on the proposed rule as part of the notice-and-comment rulemaking process and the comment period concluded on June 3, 2019.
On February 5, 2020, CMS released a proposed rule titled “Medicare and Medicaid Programs: Contract Year 2021 and 2022 Policy and Technical Changes to the Medicare Advantage Program, Medicare Prescription Drug Benefit Program, Medicaid Program, Medicare Cost Plan Program, and Programs of All-Inclusive Care for the Elderly” that proposes changes to special needs plans, flexibility in the use of specialty tiers in Medicare Part D, creation of a beneficiary real-time benefit tool, and modification of certain network adequacy rules. The proposed rule also includes several changes to the Stars Rating system, including creation of several new measures, retirement of one existing measure, changes to the relative measure weighting, and revision of the methodology for assigning individual measure ratings. The proposed rule is subject to revision through the comment process.
We expect CMS, OIG, DOJ and other federal agencies to continue to closely scrutinize each component of the Medicare Advantage program and modify the terms and requirements of the program. Noncompliance with these laws and regulations may result in significant consequences, including fines and penalties, enrollment sanctions, exclusion from the Medicare and Medicaid programs, limitations on expansion, and criminal penalties.
See also the “Executive Overview” section of our MD&A of this Form 10-K for more information.
False Claims Act and Anti-Kickback Laws
Our products and services are also subject to the federal False Claims Act (the “False Claims Act”) and federal and state anti-kickback laws. Additionally, the federal government has made investigating and prosecuting health care fraud, waste and abuse a priority. Fraud, waste and abuse prohibitions encompass a wide range of activities, including kickbacks in return for customer referrals, billing for unnecessary medical services, upcoding and improper marketing. The regulations and contractual requirements in this area are complex, frequently modified, and subject to administrative discretion and judicial interpretation.
False Claims Act and Related Criminal Provisions. The False Claims Act imposes civil penalties on any person who makes or causes to be made claims or records or statements that he or she knows or should know are false with respect to governmental programs, such as Medicare and Medicaid, to obtain reimbursement or for failure to return overpayments. Private individuals may bring qui tam or “whistleblower” suits against providers under the False Claims Act, which authorizes the payment of a portion of any recovery to the individual bringing suit. The ACA amended the federal anti-kickback laws to state any claim submitted to a federal or state health care program that violates the anti-kickback laws is also a false claim under the False Claims Act. The False Claims Act generally
23
provides for the imposition of civil penalties and for treble damages, creating the possibility of substantial financial liabilities. Criminal statutes similar to the False Claims Act provide that if a corporation is convicted of presenting a claim or making a statement it knows to be false, fictitious or fraudulent to any federal agency, the corporation may be fined. Conviction under these statutes may also result in exclusion from participation in federal and state health care programs. Many states have also enacted laws similar to the False Claims Act, some of which may include criminal penalties, substantial fines and treble damages.
Anti-Kickback and Referral Laws. Subject to certain exceptions and “safe harbors,” the federal anti-kickback statute generally prohibits, among other things, knowingly and willfully paying, receiving or offering any payment or other remuneration to induce a person to purchase, lease, order or arrange for items (including prescription drugs) or services reimbursable in whole or in part under Medicare, Medicaid or another federal health care program. Many states have similar laws, some of which are not limited to items or services paid for with government funds. Sanctions for violating these federal and state anti-kickback laws may include criminal and civil fines and exclusion from participation in federal and state health care programs.
Anti-kickback laws have been cited as a partial basis, along with state consumer protection laws described below, for investigations and multistate settlements relating to financial incentives provided by drug manufacturers to pharmacies or payors in connection with “product conversion” or promotion programs. Other anti-kickback laws may be applicable to arrangements with pharmaceutical manufacturers, such as the Public Contracts Anti-Kickback Act, the ERISA Health Plan Anti-Kickback Statute, the federal “Stark Law” and various state anti-kickback restrictions.
Federal Civil Monetary Penalties Law. The federal civil monetary penalty statute provides for civil monetary penalties against any person who gives something of value to a Medicare or Medicaid program beneficiary that the person knows or should know is likely to influence the beneficiary’s selection of a particular provider for Medicare or Medicaid items or services. Under this law, our wholly-owned home delivery pharmacies, specialty pharmacies and home health providers are restricted from offering certain items of value to influence a Medicare or Medicaid patient’s use of services. The ACA also includes several civil monetary provisions, such as penalties for the failure to report and return a known overpayment and failure to grant timely access to the OIG under certain circumstances.
Federal and State Oversight of Government-Sponsored Health Care Programs
Participation in government-sponsored health care programs subjects us to a variety of federal and state laws and regulations and risks associated with audits conducted under these programs. These audits may occur years after the provision of services. Risks include potential fines and penalties, restrictions on our ability to participate or expand our presence in certain programs and restrictions on marketing our plans. For example, with respect to our Medicare Advantage business, CMS and the OIG perform audits to determine a health plan’s compliance with federal regulations and contractual obligations, including program audits and Risk Adjustment Data Validation Audits (or “RADV audits”), which focus on compliance with proper coding practices. Certain of our contracts are currently subject to RADV audits by CMS and the OIG. CMS has announced its intent to use third-party auditors to audit all Medicare Advantage contracts by either a comprehensive or a targeted RADV review for each contract year. The DOJ is also currently conducting an industry-wide investigation of the risk adjustment data submission practices and business processes, including review of medical charts, of Cigna and a number of other Medicare Advantage organizations under Medicare Parts C and D. See Note 22 to the Consolidated Financial Statements for more information.
For our Medicare Part D business, compliance with fraud and abuse enforcement practices is monitored through Recovery Audit Contractor audits in which third-party contractors conduct post-payment reviews on a contingency fee basis to detect and correct improper payments.
Government Procurement Regulations
We have a contract with the U.S. Department of Defense (“DoD”), which subjects us to applicable Federal Acquisition Regulations (“FAR”) and the DoD FAR Supplement, which govern federal government contracts. Further, there are other federal and state laws applicable to our DoD arrangement and our arrangements with other clients that may be subject to government procurement regulations. In addition, certain of our clients participate as contracting carriers in the Federal Employees Health Benefits Program administered by the Office of Personnel Management, which includes various pharmacy benefit management standards.
Employee Retirement Income Security Act
Our domestic subsidiaries sell most of their products and services to sponsors of employee benefit plans that are governed by ERISA. ERISA is a complex set of federal laws and regulations enforced by the IRS and the DOL, as well as the courts. ERISA regulates certain aspects of the relationship between us, the employers that maintain employee welfare benefit plans subject to ERISA and participants in such plans. Certain of our domestic subsidiaries are also subject to requirements imposed by ERISA affecting claim
24
payment and appeals procedures for individual health insurance and insured and self-insured group health plans and for the insured dental, disability, life and accident plans we administer. Certain of our domestic subsidiaries also may contractually agree to comply with these requirements on behalf of the self-insured dental, disability, life and accident plans they administer. We believe the conduct of our pharmacy benefit management business is not generally subject to the fiduciary obligations of ERISA. However, there can be no assurances that the DOL may not assert that pharmacy benefit managers are fiduciaries. From time to time, states have considered legislation to declare a pharmacy benefit manager or health benefit manager a fiduciary with respect to its clients.
Plans subject to ERISA can also be subject to state laws and the legal question of whether and to what extent ERISA preempts a state law will continue to be subject to court interpretation.
Privacy, Security and Data Standards Regulations
Many of our activities involve the receipt or use of confidential health and other personal information. In addition, we use aggregated and de-identified data for our own research and analysis purposes and, in some cases, provide access to such data to pharmaceutical manufacturers and third-party data aggregators. There are also industry standards for handling credit card data known as the Payment Card Industry Data Security Standard, which are a set of requirements designed to help ensure that entities that process, store or transmit credit card information maintain a secure environment. Certain states have incorporated these requirements into state laws or enacted other requirements for using and disclosing personal information.
The federal Health Insurance Portability and Accountability Act of 1996 and its implementing regulations (“HIPAA”) impose minimum standards on health insurers, pharmacy benefit managers, HMOs, health plans, health care providers and clearinghouses for the privacy and security of protected health information. HIPAA regulations may also hold us liable for violations by our business associates (e.g., entities that provide services to health plans and providers). HIPAA also established rules that standardize the format and content of certain electronic transactions, including, but not limited to, eligibility and claims.
The Health Information Technology for Economic and Clinical Health Act (“HITECH”) imposes additional contracting requirements for covered entities, the extension of privacy and security provisions to business associates, the requirement to provide notification to various parties in the event of a data breach of protected health information, and enhanced financial penalties for HIPAA violations, including potential criminal penalties for individuals. In the conduct of our business, depending on the circumstances, we may act as either a covered entity or a business associate.
The federal Gramm-Leach-Bliley Act and its implementing regulations generally places restrictions on the disclosure of nonpublic information to nonaffiliated third parties, and requires financial institutions, including insurers, to provide customers with notice regarding how their nonpublic personal information is used, including an opportunity to “opt out” of certain disclosures. State departments of insurance and certain federal agencies adopted implementing regulations as required by federal law.
State and local authorities are increasingly focused on protecting individuals from identity theft and a number of states have adopted data security laws and regulations requiring certain minimum data security standards and security breach notifications that may apply to us in certain circumstances. Neither HIPAA nor the Gramm-Leach-Bliley privacy regulations preempt more stringent state laws and regulations. The California Consumer Privacy Act (“CCPA”), which went into effect in January 2020, provides additional privacy rights for California residents although it generally does not apply to certain regulated data such as information covered by HIPAA.
The Cybersecurity Information Sharing Act of 2015 (“CISA”) encourages organizations to share cyber threat indicators with the federal government and, among other things, directs HHS to develop a set of voluntary cybersecurity best practices for organizations in the health care industry. States have also begun to issue regulations specifically related to cybersecurity, which may differ or conflict from state to state. In October 2017, the National Association of Insurance Commissioners (“NAIC”), an organization of state insurance regulators, adopted the Insurance Data Security Model Law that creates rules for insurers and other covered entities addressing data security, investigation and notification of breaches. This includes maintaining an information security program based on ongoing risk assessment, overseeing third-party service providers, investigating data breaches and notifying regulators of a cybersecurity event. As the model law is intended to serve as model legislation only, states will need to enact legislation for the model law to become mandatory and enforceable. We will continue to monitor states’ activity regarding cybersecurity regulation.
In addition, international laws, rules and regulations governing the use and disclosure of personal information can be more stringent than in the United States, and they vary from jurisdiction to jurisdiction. The European Union’s General Data Protection Regulation (“GDPR”), which became effective May 2018, enhanced or created obligations regarding the handling of personal data relating to European residents, such as regarding notices, data protection impact assessments, and individual rights, and provides for greater penalties for noncompliance than the previous European Directive or laws. In addition, many countries outside of Europe where we
25
conduct business have implemented or may implement data protection laws and regulations, some of which include requirements modeled after those in the GDPR.
See Part 1. Item 1A, “Risk Factors” for a discussion of the risks related to compliance with privacy and security regulations.
Consumer Protection Laws
We engage in direct-to-consumer activities and are increasingly offering mobile and web-based solutions to our customers. We are therefore subject to federal and state regulations applicable to electronic communications and other consumer protection laws and regulations, such as the Telephone Consumer Protection Act and the CAN-SPAM Act. The FTC is also increasingly exercising its enforcement authority in the areas of consumer privacy and data security, with a focus on web-based, mobile data and “big data.” Federal consumer protection laws may also apply in some instances to privacy and security practices related to personally identifiable information.
Most states have consumer protection laws that have been the basis for investigations and multistate settlements relating to financial incentives provided by drug manufacturers to retail pharmacies in connection with product conversion programs. Such statutes have also been cited as the basis for claims or investigations by state attorneys general relative to privacy and data security.
Office of Foreign Assets Control Sanctions and Anti-Money Laundering
We are also subject to regulation by the Office of Foreign Assets Control of the U.S. Department of the Treasury that administers and enforces economic and trade sanctions against targeted foreign countries and regimes based on U.S. foreign policy and national security goals. Certain of our products are subject to the Department of the Treasury anti-money laundering regulations under the Bank Secrecy Act. In addition, we are subject to similar regulations in non-U.S. jurisdictions in which we operate.
Corporate Practice of Medicine and Other Laws
Many states in which our subsidiaries operate limit the practice of medicine to licensed individuals or professional organizations comprised of licensed individuals, and business corporations generally may not exercise control over the medical decisions of physicians. Statutes and regulations relating to the practice of medicine, fee-splitting between physicians and referral sources, and similar issues vary widely from state to state. Under management agreements between certain of our subsidiaries and physician-owned professional groups, these groups retain sole responsibility for all medical decisions, as well as for hiring and managing physicians and other licensed health care providers, developing operating policies and procedures, implementing professional standards and controls, and maintaining malpractice insurance. We believe that our health services operations comply with applicable state statutes regarding corporate practice of medicine, fee-splitting, and similar issues. However, any enforcement actions by governmental officials alleging noncompliance with these statutes could subject us to penalties or restructuring or reorganization of our business.
Laws and Legislation Affecting Plan Design and Pharmacy Network Access
Some states have enacted laws that prohibit managed care plan sponsors from implementing certain restrictive benefit plan design features, and many states have laws or have introduced legislation to regulate various aspects of managed care plans, including provisions relating to the pharmacy benefit. For example, some states, under so-called “freedom of choice” legislation, provide customers of the plan may not be required to use network providers, but must instead be provided with benefits even if they choose to use non-network providers. Some states have also enacted legislation that can negatively impact the use of cost-saving network configurations for plan sponsors. Other states have enacted legislation purporting to prohibit health plans from offering customers financial incentives for use of home delivery pharmacies. Medicare and some states have issued guidance and regulations that limit our ability to fill or refill prescriptions electronically submitted by a physician to our home delivery pharmacy without first obtaining consent from the patient. Such restrictions generate additional costs and limit our ability to maximize efficiencies, which could otherwise be gained through the electronic prescription and automatic refill processes. Legislation has been introduced in some states to prohibit or restrict therapeutic intervention, or to require coverage of all Food and Drug Administration approved drugs. Other states mandate coverage of certain benefits or conditions, and require health plan coverage of specific drugs if deemed medically necessary by the prescribing physician. States are also standardizing the process for, and restricting the use of, utilization management rules and shortening the time frames within which prescription drug prior authorization determinations must be made. Even where states do not regulate pharmacy benefit or utilization management companies directly, these laws will apply to many of our clients, including managed care organizations and health insurers.
Additionally, Medicare Part D and a majority of states now have laws, regulations or some form of legislation affecting our ability, or our clients’ ability, to limit access to a pharmacy provider network or remove a provider from a network. Such laws, regulations or
26
legislation may require us or our clients to admit any retail pharmacy or provider willing to meet the plan’s terms and conditions for network participation (“any willing provider”) or may direct that a provider may not be removed from a network except in compliance with certain procedures (“due process”).
Certain states have laws prohibiting certain pharmacy benefit management clients from imposing additional co-payments, deductibles, limitations on benefits, or other conditions on covered individuals utilizing a retail pharmacy when the same conditions are not otherwise imposed on covered individuals utilizing home delivery pharmacies. However, the laws require the retail pharmacy to agree to the same reimbursement amounts and terms and conditions as are imposed on the home delivery pharmacies. An increase in the number of prescriptions filled at retail pharmacies may have a negative impact on the number of prescriptions filled through home delivery.
Pharmacy Benefit Management and Drug Pricing Regulation
Our pharmacy benefit management services are subject to numerous laws and regulations. These laws and regulations govern, and proposed legislation and regulations may govern, critical practices, including disclosure, receipt and retention of rebates and other payments received from pharmaceutical manufacturers; the receipt and retention of transmission fees from contracted pharmacies; use of, administration of, or changes to drug formularies, the use and disclosure of maximum allowable cost pricing, or clinical programs; “most favored nation” pricing, which provides that a pharmacy participating in a specific government program must give the program the best price the pharmacy makes available to any third-party plan; disclosure of data to third parties; drug utilization management practices; the level of duty a pharmacy benefit manager owes its clients or customers; configuration of pharmacy networks; the operations of our subsidiary pharmacies; disclosure of negotiated provider reimbursement rates; disclosure of negotiated drug rebates, calculation of customer cost-share for prescription drug claims; pricing that includes differential or spread (i.e., a difference between the drug price charged to the plan sponsor by a pharmacy benefit manager and the price paid by the manager to the dispensing provider); disclosure of fees associated with administrative service agreements and patient care programs that are attributable to customers’ drug utilization; and registration or licensing of pharmacy benefit managers.
The U.S. Congress, current administration, and states will continue to prioritize, means of addressing out-of-pocket costs for consumers, particularly related to prescription drug costs. Policy proposals vary broadly in their approaches to achieve that goal, and range from proposing the creation of an international pricing index to which U.S. drug pricing would be benchmarked; reforming the U.S. Food and Drug Administration regulatory processes and patent laws in order to accelerate the arrival of generics, biosimilars and clinically equivalent competition to the market; enabling states to import lower priced prescription drugs into the United States; or expanding the role of the federal or state governments to negotiate pricing of prescription drugs directly with manufacturers. Additionally, proposals at the federal and state levels consider increased regulation of pharmacy benefit managers and health plans as a means to limit consumer out of pocket costs, including proposing to limit the use of various pharmacy benefit management tools; mandating the treatment of fees, discounts or financing mechanisms that otherwise are set in private contractual terms; increasing supply chain transparency; expanding regulatory requirements or definitions of fiduciaries; or mandating plan benefit designs that cap consumer out-of-pocket expense.
Prescription drug pricing and the role of pharmacy benefit managers have been a focus of the current administration. In May 2018, the current administration announced a blueprint, titled “American Patients First,” which outlines a variety of approaches that could be adopted to lower prescription drug costs in the United States. Proposed rules regarding revisions to the federal anti-kickback safe harbor were rescinded in July 2019. In October 2018, Congress enacted laws that prohibited pharmacy benefit managers and insurers from restricting pharmacies from providing drug pricing information to a plan enrollee when there is a difference between the cost of the drug under insurance and the cost of the drug when purchased without insurance. While the other issues raised in the blueprint continue to be the subject of legislative and regulatory discussion, formal policies and requirements have not been finalized in any form.
Some states have enacted statutes regulating the use of maximum allowable cost (“MAC”) pricing. These statutes, referred to as “MAC Transparency Laws,” generally require pharmacy benefit managers to disclose specific information related to MAC pricing to pharmacies and provide certain appeal rights for pharmacies. MAC Transparency Laws also restrict the application of MAC and may require operational changes to maintain compliance with the law. Some states have also enacted laws regulating pharmacy pricing and protecting the profitability of pharmacies for dispensing certain MAC-priced drugs. Some states have enacted laws requiring that the customer cost-share for a prescription drug claim not exceed certain price points, such as the pharmacy’s usual and customary charge or its contracted reimbursement for the drug.
In March 2018, the NAIC adopted changes to the Health Carrier Prescription Drug Benefit Management Model Act. The changes address issues relating to (i) transparency, accuracy and disclosure regarding prescription drug formularies and formulary changes during a policy year; (ii) accessibility of prescription drug benefits using a variety of pharmacy options; and (iii) tiered prescription drug formularies and discriminatory benefit design. While the actions of the NAIC do not have the force of law, they are used as a
27
template to influence states to adopt laws based on the model legislation. We are expecting an enhanced NAIC model act on pharmacy benefit manager licensure and regulation to be adopted by the NAIC in late 2020.
The federal Medicaid Drug Rebate Program requires participating drug manufacturers to provide rebates on all drugs reimbursed through state Medicaid programs, including through Medicaid managed care organizations. Manufacturers of brand-name products must provide a rebate equivalent to the greater of (a) 23.1% of the average manufacturer price (“AMP”) paid by retail community pharmacies or by wholesalers for certain drugs distributed to retail community pharmacies, or (b) the difference between AMP and the “best price” available to essentially any customer other than the Medicaid program and certain other government programs, with certain exceptions. We negotiate rebates with drug manufacturers and, in certain circumstances, sell services to drug manufacturers. Investigations are being and have been conducted by certain government entities which call into question whether a drug’s “best price” was properly calculated and reported with respect to rebates paid by the manufacturers to the Medicaid programs. We are not responsible for such calculations, reports or payments.
Pharmacy Regulation
Our home delivery and specialty pharmacies also subject us to extensive federal, state and local regulation. The practice of pharmacy is generally regulated at the state level by state boards of pharmacy. We are licensed to do business as a pharmacy in the states in which our pharmacies are located. Most of the states into which we deliver pharmaceuticals have laws that require out-of-state home delivery pharmacies to register with, or be licensed by, the board of pharmacy or a similar regulatory body in the state. These states generally permit the pharmacy to follow the laws of the state where the pharmacy is located, although some states require compliance with certain laws in that state as it impacts or relates to drugs distributed or dispensed into those states.
Our various pharmacy facilities also provide services under certain Medicare and state Medicaid programs. Participation in these programs requires our pharmacies to comply with the applicable Medicare and Medicaid provider rules and regulations, and exposes the pharmacies to various changes the federal and state governments may impose regarding reimbursement methodologies and amounts to be paid to participating providers under these programs. In addition, several of our pharmacy facilities are participating providers under Medicare Part D and are required to adhere to certain requirements applicable to Medicare Part D. Additionally, we are subject to CMS rules regarding the administration of our Medicare plans and intercompany pricing between our plans and our pharmacy business.
Other statutes and regulations affect our home delivery and specialty pharmacy operations, including the federal and state anti-kickback laws and the federal civil monetary penalty law described above. Federal and state statutes and regulations govern the labeling, packaging, advertising, adulteration and security of prescription drugs and the dispensing of controlled substances and certain of our pharmacies must register with the U.S. Drug Enforcement Administration and individual state controlled substance authorities. The FTC requires mail order sellers of goods generally to engage in truthful advertising, to stock a reasonable supply of the product to be sold, to fill mail orders within thirty days and to provide clients with refunds when appropriate. The United States Postal Service also has significant statutory authority to restrict the delivery of drugs and medicines through the mail.
Financial Reporting, Internal Control and Corporate Governance
Regulators closely monitor the financial condition of licensed insurance companies and HMOs. States regulate the form and content of statutory financial statements, the type and concentration of permitted investments, and corporate governance over financial reporting. Our insurance and HMO subsidiaries are required to file periodic financial reports and schedules with regulators in most of the jurisdictions in which they do business as well as annual financial statements audited by independent registered public accounting firms. Certain insurance and HMO subsidiaries are required to file an annual report of internal control over financial reporting with most jurisdictions in which they do business. Insurance and HMO subsidiaries’ operations and financial statements are subject to examination by such agencies. Many states have expanded regulations relating to corporate governance and internal control activities of insurance and HMO subsidiaries as a result of model regulations adopted by the NAIC with elements similar to corporate governance and risk oversight disclosure requirements under federal securities laws.
Guaranty Associations, Indemnity Funds, Risk Pools and Administrative Funds
Most states and certain non-U.S. jurisdictions require insurance companies to support guaranty associations or indemnity funds that are established to pay claims on behalf of insolvent insurance companies. Some states have similar laws relating to HMOs and other payors, such as consumer operated and oriented plans (co-ops) established under the ACA. In the United States, these associations levy assessments on member insurers licensed in a particular state to pay such claims. Certain states require HMOs to participate in guaranty funds, special risk pools and administrative funds. For additional information about guaranty funds and other assessments, see Note 22 to the Consolidated Financial Statements.
28
Certain states continue to require health insurers and HMOs to participate in assigned risk plans, joint underwriting authorities, pools or other residual market mechanisms to cover risks not acceptable under normal underwriting standards, although some states have eliminated these requirements as a result of the ACA.
Solvency and Capital Requirements
Many states have adopted some form of the NAIC model solvency-related laws and risk-based capital (“RBC”) rules for life and health insurance companies and HMOs. The RBC rules recommend a minimum level of capital depending on the types and quality of investments held, the types of business written and the types of liabilities incurred. If the ratio of the insurer’s adjusted surplus to its RBC falls below statutorily required minimums, the insurer could be subject to regulatory actions ranging from increased scrutiny to conservatorship.
In addition, various non-U.S. jurisdictions prescribe minimum surplus requirements that are based upon solvency, liquidity and reserve coverage measures. Our HMOs and life and health insurance subsidiaries, as well as non-U.S. insurance subsidiaries, are compliant with applicable RBC and non-U.S. surplus rules.
The Risk Management and Own Risk and Solvency Assessment Model Act (“ORSA”), adopted by the NAIC, provides requirements and principles for maintaining a group solvency assessment and a risk management framework and reflects a broader approach to U.S. insurance regulation. ORSA includes a requirement to file an annual ORSA Summary Report in the lead state of domicile. To date, an overwhelming majority of the states have adopted the same or similar versions of ORSA. We file our ORSA report annually as required.
Holding Company Laws
Our domestic insurance companies and certain of our HMOs are subject to state laws regulating subsidiaries of insurance holding companies. Under such laws, certain dividends, distributions and other transactions between an insurance company or an HMO subsidiary and its affiliates may require notification to, or approval by, one or more state insurance commissioners. In addition, the holding company acts of states in which our subsidiaries are domiciled restrict the ability of any person to obtain control of an insurance company or HMO subsidiary without prior regulatory approval. State holding company laws and regulations also subject our insurance companies and certain HMO subsidiaries to additional regulatory scrutiny related to their oversight of affiliates performing regulated services on behalf of the insurance company or HMO and require the Company to file an annual Enterprise Risk Report, which summarizes material risks that could pose enterprise risk to the insurance company subsidiaries.
Marketing, Advertising and Products
In most states, our insurance companies and HMO subsidiaries are required to certify compliance with applicable advertising regulations on an annual basis. Our insurance companies and HMO subsidiaries are also required by most states to file and secure regulatory approval of products prior to the marketing, advertising, and sale of such products.
Licensing and Registration Requirements
Our insurance companies and HMO subsidiaries must be licensed by the jurisdictions in which they conduct business. Additionally, certain subsidiaries contract to provide claim administration, utilization management and other related services for the administration of self-insured benefit plans. These subsidiaries may be subject to state third-party administration and other licensing requirements and regulation, as well as third-party accreditation requirements.
We have received full accreditation for Utilization Review Accreditation Commission Pharmacy Benefit Management version 2.2 Standards, which includes quality standards for drug utilization management, and select subsidiaries have received full accreditation for Utilization Review Accreditation Commission for Health Utilization Management version 7.2, which includes quality standards for medical utilization management.
Certain states have adopted pharmacy benefit management registration or disclosure laws. In addition to registration laws, some states have adopted legislation mandating disclosure of various aspects of our financial practices, including those concerning pharmaceutical company revenue, as well as prescribing processes for prescription switching programs and client and provider audit terms.
Our international subsidiaries are often required to be licensed when entering new markets or starting new operations in certain jurisdictions. The licensure requirements for these subsidiaries vary by country and are subject to change.
29
International Regulations
Our operations outside the United States expose us to laws of multiple jurisdictions and the rules and regulations of various governing bodies and regulators, including those related to the provision of insurance, financial and other disclosures, the provision of health care-related services, corporate governance, privacy, data protection, data mining, data transfer, intellectual property, labor and employment, consumer protection, direct-to-consumer communications activities, tax, anti-corruption and anti-money laundering. Foreign laws and rules may include requirements that are different from, or more stringent than, similar requirements in the United States.
Our operations in countries outside the United States:
•are subject to local regulations of the jurisdictions where we operate;
•in some cases, are subject to regulations in the jurisdictions where customers reside; and
•in all cases, are subject to the Foreign Corrupt Practices Act (“FCPA”).
In particular, in South Korea, regulators are focused on protecting the rights of individual customers by enforcing “Treating Customers Fairly” concepts. This regulatory focus has resulted in rigorous data localization requirements, network separation obligations, and system monitoring restrictions, as well as obligations to closely monitor marketing communications and sales scripts. Anti-money laundering requirements in South Korea and other countries where we do business also may impose obligations to collect certain information about each customer at time of sale or to risk rank each customer to determine possible future money laundering risk.
The FCPA prohibits offering, promising, providing or authorizing others to give anything of value to a foreign government official or employee to obtain or retain business or otherwise secure a business advantage. Outside of the United States, we may interact with government officials in several different capacities: as regulators of our insurance business; as clients or partners who are state-owned or partially state-owned; as health care providers who are employed by the government; as hospitals that are state-owned; and as officials issuing permits in connection with real estate transactions. Violations of the FCPA and other anti-corruption laws may result in severe criminal and civil sanctions as well as other penalties, and the SEC and DOJ have increased their enforcement activities with respect to FCPA. The UK Bribery Act of 2010 applies to all companies with a nexus to the United Kingdom. Under this act, any voluntary disclosures of FCPA violations may be shared with United Kingdom authorities, thus potentially exposing companies to liability and potential penalties in multiple jurisdictions.
30
Item 1A. RISK FACTORS
As a large global health service company operating in a complex industry, we encounter a variety of risks and uncertainties, which could have a material adverse effect on our business, liquidity, results of operations, financial condition or the trading price of our securities. You should carefully consider each of the risks and uncertainties discussed below, together with other information contained in this Annual Report on Form 10-K, including Management’s Discussion and Analysis of Results of Operations and Financial Condition. These risks and uncertainties are not the only ones we face. Additional risks and uncertainties not presently known to us or that we currently believe to be immaterial may also adversely affect us. The following risk factors have been organized by category for ease of use; however many of the risks may have impacts in more than one category. These categories, therefore, should be viewed as a starting point for understanding the significant risks facing us and not as a limitation on the potential impact of the matters discussed. Risk factors are not necessarily listed in order of importance.
Strategic and Operational Risks
Future performance of our business will depend on our ability to execute our strategic and operational initiatives effectively.
The future performance of our business will depend in large part on our ability to effectively implement and execute our strategic and operational initiatives. Successfully executing on these initiatives depends on a number of factors, including our ability to:
•differentiate our products and services from those of our competitors;
•develop and introduce new and innovative products, solutions or programs that focus on improving patient outcomes and assist in controlling costs or are in response to government regulation and the increased focus on consumer-directed products;
•grow our product portfolio and identify and introduce the proper mix or integration of products that will be accepted by the marketplace;
•evaluate drugs for efficacy, value and price to assist clients in selecting a cost-effective formulary;
•offer cost-effective home delivery pharmacy and specialty services;
•access or continue accessing key drugs and successfully penetrate key treatment categories in our specialty business;
•leverage purchase volume to deliver discounts to health benefit providers;
•attract and retain sufficient numbers of qualified employees;
•attract, develop and maintain collaborative relationships with a sufficient number of qualified partners;
•attract new and maintain existing customer and client relationships;
•transition health care providers from volume-based fee-for-service arrangements to a value-based system;
•improve medical cost competitiveness in our targeted markets;
•manage our medical, pharmacy, administrative, and other operating costs effectively; and
•contract with pharmaceutical manufacturers and pharmacy providers on favorable terms.
For our strategic initiatives to succeed, we must effectively integrate our operations, including with Express Scripts and other acquired businesses, actively work to ensure consistency throughout the organization, and promote a global mind-set along with a focus on individual customers and clients. If we fail to do so, our business may be unable to grow as planned, or the result of expansion may be unsatisfactory. We will be unable to rapidly respond to competitive, economic and regulatory changes if we do not make important strategic and operational decisions quickly, define our appetite for risk, implement new governance, managerial and organizational processes smoothly and communicate roles and responsibilities clearly. If these initiatives fail or are not executed effectively, our consolidated financial position and results of operations could be negatively affected.
31
We operate in a highly competitive, evolving and rapidly changing industry and our failure to adapt could negatively impact our business.
The health service industry continues to be dynamic and rapidly evolving. Any significant shifts in the structure of the industry could alter industry dynamics and adversely affect our ability to attract or retain clients and customers. Industry shifts could result (and have resulted) from, among other things:
•a large intra- or inter-industry merger or industry consolidation;
•strategic alliances;
•new or alternative business models;
•continuing consolidation among physicians, hospitals and other health care providers, as well as changes in the organizational structures chosen by physicians, hospitals and health care providers;
•new market entrants, including those not traditionally in the health service industry;
•the ability of larger employers and clients to contract directly with providers;
•technological changes and rapid shifts in the use of technology, such as telemedicine;
•the impact or consequences of legislation or regulatory changes;
•changes in the United States Postal Service or the consolidation of shipping carriers;
•increased drug acquisition cost or unexpected changes to drug pricing trend;
•change in the generic drug market or the failure of new generic drugs to come to market;
•a change in drug utilization; or
•a change in utilization under risk-based contracts in the health benefit management market.
Our failure to anticipate or appropriately adapt to changes in the industry could negatively impact our competitive position and adversely affect our business and results of operations.
Our failure to compete effectively to differentiate our products and services from those of our competitors and maintain or increase market share could materially adversely affect our results of operations, financial position and cash flows.
We operate in a highly competitive environment and an industry subject to significant market pressures brought about by customer and client needs, legislative and regulatory developments and other market factors. In particular markets, our competitors may have greater, better or more established capabilities, resources, market share, reputation or business relationships, or lower profit margin or financial return expectations. Our clients are well informed and organized and can easily move between our competitors and us. Our Express Scripts client contracts generally have three-year terms. As described in greater detail in the description of our business in Item 1 of this Form 10-K, one of our key clients in the Health Services segment is the United States Department of Defense. If one or more of our large clients terminates or does not renew a contract for any reason, including as a result of being acquired, or if the provisions of a contract with a large client are modified, renewed or otherwise changed with terms less favorable to us, our results of operations could be adversely affected and we could experience a negative reaction in the investment community resulting in decreases in the trading price of our securities or other adverse effects.
Our success depends, in part, on our ability to compete effectively in our markets, set prices appropriately in highly competitive markets to keep or increase our market share, increase customers as planned, differentiate our business offerings by innovating and delivering products and services that provide enhanced value to our customers, provide quality and satisfactory levels of service, and retain accounts with favorable medical cost experience or more profitable products versus retaining or increasing our customer base in accounts with unfavorable medical cost experience or less profitable products.
We must remain competitive to attract new customers, retain existing customers, and further integrate additional product and service offerings. To succeed in this highly competitive marketplace, it is imperative that we maintain a strong reputation. The negative
32
reputational impact of a significant event, including a failure to execute on customer or client contracts or strategic or operational initiatives, failure to comply with applicable laws or regulations, or failure to innovate and deliver products and services that demonstrate greater value to our customers, could affect our ability to grow and retain profitable arrangements, which could have a material adverse effect on our business, results of operations, financial position and cash flows.
We face price competition and other pressures that could compress our margins or result in premiums that are insufficient to cover the cost of services delivered to our customers.
While we compete on the basis of many service and quality-related factors, we expect that price will continue to be a significant basis of competition. Our client contracts are subject to negotiation as clients seek to contain their costs, including by reducing benefits offered. Increasingly, our clients seek to negotiate performance guarantees that require us to pay penalties if the guaranteed performance standard is not met. Clients can easily move between our competitors and us. Our clients are well informed and typically have knowledgeable consultants that seek competing bids from our competitors before contract renewal. In addition, as brokers and benefit consultants seek to enhance their revenue streams, they look to take on services that we typically provide. Each of these events could negatively impact our financial results.
Further, federal and state regulatory agencies may restrict our ability to implement changes in premium rates. Fiscal or other concerns related to the government-sponsored programs in which we participate, such as Medicare, may cause decreasing reimbursement rates, delays in premium payments, restrictions on implementing changes in premium rates or insufficient increases in reimbursement rates. Any limitation on our ability to maintain or increase our premium or reimbursement levels, or a significant loss of customers or clients resulting from our need to increase or maintain premium or reimbursement levels, could adversely affect our business, cash flows, financial condition and results of operations.
Premiums in the Integrated Medical segment are generally set for one-year periods and are priced well in advance of the date on which the contract commences or renews. Our revenue on Individual and Family Plans (“IFP”) and Medicare policies is based on bids submitted midyear in the year before the contract year. Although we base the premiums we charge and our IFP and Medicare bids on our estimate of future health care costs over the contract period, actual costs may exceed what we estimate in setting premiums. Our health care costs also are affected by external events that we cannot forecast or project and over which we have little or no control, as well as changes in customers’ health care utilization patterns and provider billing practices. Our profitability depends, in part, on our ability to accurately predict, price for and effectively manage future health care costs. Relatively small differences between predicted and actual medical costs or utilization rates as a percentage of revenue can result in significant changes in our financial results.
Strong competition within the pharmacy benefit business has also generated greater demand for lower product and service pricing, increased revenue sharing and enhanced product and service offerings. These competitive factors have historically applied pressure on our operating margins and caused many companies, including us, to reduce the prices charged for products and services while sharing with clients a greater portion of the formulary fees and related rebates received from pharmaceutical manufacturers. Our inability to maintain positive trends, or failure to identify and implement new ways to mitigate pricing pressures, could negatively impact our ability to attract or retain clients or sell additional services, which could negatively impact our margins and have a material adverse effect on our business and results of operations.
The reserves we hold for expected medical claims are based on estimates that involve an extensive degree of judgment and are inherently variable. If actual claims exceed our estimates, our operating results could be materially adversely affected, and our ability to take timely corrective actions to contain future costs may be limited.
We maintain and record medical claims reserves on our balance sheet for estimated future payments. Our estimates of health care costs payable are based on a number of factors, including historical claim experience, but this estimation process requires extensive judgment. Considerable variability is inherent in such estimates, and the accuracy of the estimates is highly sensitive to changes in medical claims submission and processing patterns or procedures, changes in customer base and product mix, changes in the utilization of prescription drugs, medical or other covered items or services, changes in medical cost trends, changes in our health management practices and the introduction of new benefits and products. If we are not able to accurately and promptly anticipate and detect medical cost trends, our ability to take timely corrective actions to limit future costs and reflect our current benefit cost experience in our pricing process may be limited. Additionally, we must estimate the amount of rebates payable by us under the ACA’s and CMS’s minimum loss ratio rules and the amounts payable by us to, and receivable by us from, the United States federal government under the ACA’s remaining premium stabilization program. Because establishing reserves is an inherently uncertain process involving estimates of future losses, there can be no certainty that ultimate losses will not exceed existing reserves.
33
If we fail to develop and maintain satisfactory relationships with physicians, hospitals and other health service providers and with producers and consultants, our business and results of operations may be adversely affected.
We contract with or employ physicians, hospitals and other health service providers and facilities to provide health services to our customers. Our results of operations are substantially dependent on our ability to contract for these services at competitive prices. In any particular market, physicians, hospitals and health service providers may enter into exclusive arrangements with competitors or simply refuse to contract with us, demand higher payments or take other actions that could result in higher medical costs or less desirable products or services for our customers. In some markets, certain providers, particularly hospitals, physician/hospital organizations and multispecialty physician groups, may have significant or controlling market positions that could result in a diminished bargaining position for us. If providers refuse to contract with us, use their market position to negotiate more favorable contracts or place us at a competitive disadvantage, our ability to market products or to be profitable in those areas could be materially adversely affected. Establishing collaborative arrangements with physician groups, specialist groups, independent practice associations, hospitals and health care delivery systems is key to our strategic focus to transition from volume-based fee-for-service arrangements to a value-based health care system. If such collaborative arrangements do not result in the lower medical costs that we project or if we fail to attract health care providers to such arrangements, or are less successful at implementing such arrangements than our competitors, our attractiveness to customers may be reduced and our ability to profitably grow our business may be adversely affected.
Our ability to develop and maintain satisfactory relationships with providers may also be negatively impacted by other factors not associated with us, such as changes in Medicare or Medicaid reimbursement levels, increasing pressure on revenue and other pressures on health care providers and increasing consolidation activity among hospitals, physician groups and providers. Continuing consolidation among physicians, hospitals and other providers, the emergence of accountable care organizations, vertical integration of providers and other entities, changes in the organizational structures chosen by physicians, hospitals and providers and new market entrants, including those not traditionally in the health care industry, may affect the way providers interact with us and may change the competitive landscape in which we operate. In some instances, these organizations may compete directly with us, potentially affecting the way we price our products and services or causing us to incur increased costs if we change our operations to be more competitive.
Out-of-network providers are not limited by any agreement with us in the amounts they bill. While benefit plans place limits on the amount of charges that will be considered for reimbursement and state regulations seek to establish methodologies and dispute resolution processes, out-of-network providers are increasingly sophisticated and aggressive. As a result, the outcome of disputes where we do not have a provider contract may cause us to pay higher medical or other benefit costs than we projected.
Additionally, certain of our products and services are sold in part through nonexclusive producers and consultants for whose services and allegiance we compete. Our sales could be materially adversely affected if we were are unable to attract, retain and support such independent producers and consultants or if our sales strategy is not appropriately aligned across distribution channels.
If we lose our relationship with one or more key pharmaceutical manufacturers, or if the payments made or discounts provided by pharmaceutical manufacturers decline, our business and results of operations could be adversely affected.
We maintain contractual relationships with numerous pharmaceutical manufacturers, which provide us with, among other things:
•discounts for drugs we purchase to be dispensed from our home delivery and specialty pharmacies;
•discounts, in the form of rebates, for drug utilization;
•fees for administering rebate programs, including invoicing, allocating and collecting rebates;
•fees for services provided to pharmaceutical manufacturers by our specialty pharmacies; and
•access to limited distribution specialty pharmaceuticals by our specialty pharmacies.
Our contracts with pharmaceutical manufacturers are typically nonexclusive and terminable on relatively short notice by either party. The consolidation of pharmaceutical manufacturers, the termination or material alteration of our contractual relationships, or our failure to renew such contracts on favorable terms could have a material adverse effect on our business and results of operations. In addition, arrangements between payors and pharmaceutical manufacturers have been the subject of debate in federal and state legislatures and various other public and governmental forums. Adoption of new laws, rules or regulations or changes in, or new interpretations of, existing laws, rules or regulations, relating to any of these programs could materially adversely affect our business and results of operations.
34
If significant changes occur within the pharmacy provider marketplace, or if other issues arise with respect to our pharmacy networks, including the loss of or adverse change in our relationship with one or more key pharmacy providers, our business and financial results could be impaired.
More than 67,700 retail pharmacies, which represent over 99% of all United States retail pharmacies, participated in one or more of our networks as of December 31, 2019. The ten largest retail pharmacy chains represent approximately 65% of the total number of stores in our largest network. In certain geographic areas of the United States, our networks may be comprised of higher concentrations of one or more large pharmacy chains. Contracts with retail pharmacies are generally nonexclusive and are terminable on relatively short notice by either party. If one or more of the larger pharmacy chains terminates its relationship with us, or is able to renegotiate terms substantially less favorable to us, our customers’ access to retail pharmacies or our business could be materially adversely affected. The entry of one or more additional large pharmacy chains into the pharmacy benefit management business, the consolidation of existing pharmacy chains or increased leverage or market share by the largest pharmacy providers could increase the likelihood of negative changes in our relationship with such pharmacies. Changes in the overall composition of our pharmacy networks, or reduced pharmacy access under our networks, could have a negative impact on our claims volume or our competitiveness in the marketplace, which could cause us to fall short of certain guarantees in our contracts with clients or otherwise impair our business or results of operations.
Changes in drug pricing or industry pricing benchmarks could materially impact our financial performance.
Contracts in the prescription drug industry, including our contracts with retail pharmacy networks and our pharmacy and specialty pharmacy clients, generally use pricing metrics published by third parties as benchmarks to establish pricing for prescription drugs. If these benchmarks are no longer published by third parties, we, or our contractual partners, adopt other pricing benchmarks for establishing prices within the industry, legislation or regulation requires the use of other pricing benchmarks, or future changes in drug prices substantially deviate from our expectations, the short- or long-term impacts may have a material adverse effect on our business and results of operations.
As a global company, we face political, legal, operational, regulatory, economic and other risks that present challenges and could negatively affect our multinational operations or our long-term growth.
As a global company, our business is increasingly exposed to risks inherent in foreign operations. These risks can vary substantially by market, and include political, legal, operational, regulatory, economic and other risks, including government intervention that we do not face in our U.S. operations. The global nature of our business and operations may present challenges including, but not limited to, those arising from:
•geopolitical business conditions and demands, including the United Kingdom’s withdrawal from the European Union;
•regulation that may discriminate against U.S. companies, favor nationalization or expropriate assets;
•price controls or other pricing issues and exchange controls; restrictions that prevent us from transferring funds out of the countries in which we operate; foreign currency exchange rates and fluctuations and restrictions on converting currencies from foreign operations into other currencies; uncertainty with respect to the interpretation of tax positions;
•reliance on local employees and interpretations of labor laws in foreign jurisdictions;
•managing our partner relationships in countries outside of the United States;
•providing data protection on a global basis and sufficient levels of technical support in different locations;
•the global trend for companies to enact local data residency requirements;
•acts of civil unrest, war, terrorism, natural disasters or pandemics, such as the recent coronavirus outbreak, in locations where we operate; and
•general economic and political conditions.
These factors may increase in significance as we continue to expand globally and operating in new foreign markets may require considerable management time before operations generate any significant revenues and earnings. Any one of these challenges could negatively affect our operations or long-term growth. For example, due to the concentration of our international business in South Korea, the International Markets segment is exposed to potential losses resulting from economic and regulatory changes in that
35
country and the geopolitical climate in the Korean Peninsula, as well as foreign currency movements affecting the South Korean currency, that could have a significant impact on the segment’s results and our consolidated financial results.
International operations also require us to devote significant resources to implement controls and systems in new markets to comply with, and to ensure that our vendors and partners comply with, U.S. and foreign laws prohibiting bribery, corruption and money laundering, in addition to other regulations regarding, among other things, our products, direct-to-consumer communications, customer privacy, data protection and data residency. Violations of these laws and regulations could result in fines, criminal sanctions against us, our officers or employees, restrictions or outright prohibitions on the conduct of our business and significant reputational harm. Our success depends, in part, on our ability to anticipate these risks and manage these challenges. Our failure to comply with laws and regulations governing our conduct outside the United States or to establish constructive relations with non-U.S. regulators could have a material adverse effect on our business, results of operations, financial condition, liquidity and long-term growth.
Strategic transactions, including our acquisition of Express Scripts, involve risks and we may not realize the expected benefits because of integration difficulties, underperformance relative to our expectations and other challenges.
As part of our strategy, we regularly consider and enter into strategic transactions, including mergers, acquisitions, joint ventures, licensing arrangements, divestitures and other relationships (collectively referred to as “strategic transactions”). There is significant competition for attractive targets and opportunities and we may be unable to identify and successfully complete strategic transactions in the future. In addition, from time to time, we evaluate alternatives for our businesses that do not meet our strategic, growth or profitability objectives, and we may divest or wind down such businesses. We may be unable to complete any such divestiture on terms favorable to us, within the expected timeframes, or at all. We may have continued financial exposure to divested businesses following the completion of any such transaction, including increased costs due to potential litigation, contingent liabilities and indemnification of the buyer related to, among other things, lawsuits, regulatory matters or tax liabilities.
Our ability to achieve the anticipated benefits of strategic transactions is subject to numerous uncertainties and risks, including our ability to integrate or separate operations, resources and systems, including data security systems, in an efficient and effective manner. For example, the continued success of the Express Scripts acquisition will depend, in part, on our ability to continue to successfully combine the businesses of Cigna and Express Scripts and realize the anticipated benefits, including synergies, cost savings, innovation and operational efficiencies, from the combination.
Key risks of the Express Scripts integration include, but are not limited to, retaining existing clients and attracting new clients on profitable terms; maintaining employee morale and retaining key management and other employees; consolidating corporate and administrative infrastructures and realizing operational synergies; integrating information technology, communications programs, financial procedures and operations, and other systems, procedures and policies; coordinating geographically separate organizations; and on-going modifications to internal financial control standards.
Integration and separation activities may result in additional and unforeseen expenses, and the anticipated benefits, including with respect to the Express Scripts integration, may not be fully realized or may take longer to realize than expected. These activities are complex, costly and time-consuming and may divert management’s attention from ongoing business concerns. Delays or issues encountered in these activities could have a material adverse effect on the revenues, expenses, operating results and financial condition of the combined company.
Strategic transactions could result in increased costs, including facilities and systems consolidation costs and costs to retain key employees, decreases in expected revenues, earnings or cash flows, and goodwill or other intangible asset impairment charges. Additional unanticipated costs may be incurred in the integration of Express Scripts’ businesses. Although we expect that the elimination of duplicative costs, as well as the realization of other efficiencies related to the integration of those businesses, should allow us to more than offset incremental transaction and merger-related costs over time, this net benefit may not be achieved in the near term, or at all. As of December 31, 2019, our goodwill and other intangible assets had a carrying value of approximately $81 billion, representing 52% of our total consolidated assets. The value of our goodwill may be materially and adversely impacted if the businesses we acquire do not perform in a manner consistent with our assumptions. Future evaluations requiring an impairment to goodwill and other intangible assets could materially affect our results of operations and shareholders’ equity in the period in which the impairment occurs. A material decrease in shareholders’ equity could negatively impact our debt ratings or potentially impact our compliance with existing debt covenants. In addition, the trading price of our securities may decline if, among other things, we are unable to achieve our estimates of earnings growth and operational cost savings, or the transaction costs related to the acquisition and integration are greater than expected. The trading price also may decline if we do not achieve the perceived benefits of the acquisition as rapidly or to the extent anticipated by financial or industry analysts.
Additionally, joint ventures and equity investments present risks that are different from acquisitions, including risks related to: specific operations and finances of the businesses we invest in, selection of appropriate parties, differing objectives of the various
36
parties, competition between and among parties, compliance activities (including compliance with applicable CMS requirements), growing the business in a manner acceptable to all the parties, maintaining positive relationships among the parties, clients and customers, initial and ongoing governance of joint ventures, and customer and business disruption that may occur upon a joint venture termination.
Further, we may finance strategic transactions by issuing common stock for some or all of the purchase price that could dilute the ownership interests of our shareholders, or by incurring additional debt that could increase costs and impact our ability to access capital in the future.
In addition, effective internal controls are necessary to provide reliable and accurate financial reports and to mitigate the risk of fraud. The integration of businesses is likely to cause increasing complexity in our systems and internal controls and make them more difficult to manage. Any difficulties in assimilating businesses into our control system could cause us to fail to meet our financial reporting obligations. We also rely on the internal controls and financial reporting controls of joint venture entities and other entities in which we invest and their failure to maintain effectiveness or comply with applicable standards may materially and adversely affect us. Ineffective internal controls could also cause investors to lose confidence in our reported financial information that could negatively impact the trading price of our securities and our access to capital.
We are dependent on the success of our relationships with third parties for various services and functions.
To improve operating costs, productivity and efficiencies, we contract with third parties for the provision of specific services. Our operations may be adversely affected if a third party fails to satisfy its obligations to us, if the arrangement is terminated in whole or in part or if there is a contractual dispute between us and the third party. Even though contracts are intended to provide certain protections, we have limited control over the actions of third parties. For example, noncompliance with any privacy or security laws and regulations, any security breach involving one of our third-party vendors or a dispute between us and a third-party vendor related to our arrangement could have a material adverse effect on our business, results of operations, financial condition, liquidity and reputation.
Outsourcing also may require us to change our existing operations, adopt new processes for managing these service providers or redistribute responsibilities to realize the potential productivity and operational efficiencies. If there are delays or difficulties in changing business processes or our third-party vendors do not perform as expected, we may not realize, or not realize on a timely basis, the anticipated economic and other benefits of these relationships. This could result in additional costs or regulatory compliance issues or create other operational or financial problems for us. Terminating or transitioning, in whole or in part, arrangements with key vendors could result in additional costs or penalties, risks of operational delays or potential errors and control issues during the termination or transition phase. We may not be able to find an alternative vendor in a timely manner or on acceptable terms. If there is an interruption in business or loss of access to data resulting from a security breach, termination or transition in services, we may not be able to meet the demands of our customers and, in turn, our business and results of operations could be adversely impacted.
A significant disruption in service within our operations or among our key suppliers or other third parties could materially adversely affect our business and results of operations.
Our business is highly dependent upon our ability to perform, in an efficient and uninterrupted fashion, necessary business functions, such as claims processing and payment, internet support and customer call centers, data centers and corporate facilities, processing new and renewal business, maintaining appropriate shipment and storage conditions for prescriptions (such as temperature and protection from contamination) and home delivery processing. In some instances, our ability to provide services or products (including processing and dispensing prescriptions) depends on the availability of services and products provided by suppliers, pharmaceutical manufacturers, vendors or shipping carriers. A disruption in our supply chain, including, as a result of the recent coronavirus outbreak, or inability to access or deliver products that meet requisite quality safety standards in a timely and efficient manner could adversely impact our business. Additionally, any failure or disruption of our performance of, or our ability to perform, key business functions, including through unavailability or cyberattack of our information technology systems or those of third parties, could cause slower response times, decreased levels of service satisfaction and harm to our reputation. Our information technology and other systems interface with and depend on third-party systems and we could experience service denials if demand for such service exceeds capacity or a third-party system fails or experiences an interruption. Our failure to implement adequate business continuity and disaster recovery strategies could significantly reduce our ability to provide products and services to our customers and clients, which could have material adverse effects on our business and results of operations.
37
Our business depends on our ability to effectively invest in, implement improvements to and properly maintain the uninterrupted operation and data integrity of our information technology and other business systems.
Our business is highly dependent on maintaining effective information systems as well as the integrity and timeliness of the data we use to serve our customers and health care providers and to operate our business. If our data were found to be inaccurate or unreliable due to fraud or other error, or if we, or any of the third-party service providers we engage, were to fail to maintain information systems and data integrity effectively, we could experience operational disruptions that may impact our clients, customers and health care providers and hinder our ability to provide services and products, establish appropriate pricing for products and services, retain and attract clients and customers, establish reserves and report financial results timely and accurately and maintain regulatory compliance, among other things.
Our information technology strategy and execution are critical to our continued success. We must continue to invest in long-term solutions that will enable us to anticipate customer needs and expectations, enhance the customer experience, act as a differentiator in the market and protect against cybersecurity risks and threats. Our success is dependent, in large part, on maintaining the effectiveness of existing technology systems and continuing to deliver and enhance technology systems that support our business processes in a cost-efficient and resource-efficient manner. Increasing regulatory and legislative changes will place additional demands on our information technology infrastructure that could have a direct impact on resources available for other projects tied to our strategic initiatives. In addition, recent trends toward greater consumer engagement in health care require new and enhanced technologies, including more sophisticated applications for mobile devices. Connectivity among technologies is becoming increasingly important. We must also develop new systems to meet current market standards and keep pace with continuing changes in information processing technology, evolving industry and regulatory standards and customer needs. Failure to do so may present compliance challenges and impede our ability to deliver services in a competitive manner. Further, because system development projects are long term in nature, they may be more costly than expected to complete and may not deliver the expected benefits upon completion. Our failure to effectively invest in, implement improvements to and properly maintain the uninterrupted operation and data integrity of our information technology and other business systems could adversely affect our results of operations, financial position and cash flow.
As a large health service company, we are subject to cyberattacks or other privacy or data security incidents. If we are unable to prevent or contain the effects of any such attacks, we may suffer exposure to substantial liability, reputational harm, loss of revenue or other damages.
Our business depends on our clients’ and customers’ willingness to entrust us with their health-related and other sensitive personal information. Computer systems may be vulnerable to physical break-ins, computer viruses or malware, programming errors, attacks by third parties or similar disruptive problems. We have been, and will likely continue to be, the target of computer viruses or other malicious codes, unauthorized access, cyberattacks or other computer-related penetrations. There have been, and will likely continue to be, large scale cyberattacks within the health service industry. Additionally, hardware, software or applications we develop or procure from third parties may contain defects in design, manufacturer defects or other problems that could unexpectedly compromise information technology. Human or technological error has and could in the future result in, for example, unauthorized access to, disclosure, modification, misuse, loss, or destruction of company, customer, or other third-party data or systems; theft of sensitive, regulated, or confidential data including personal information and intellectual property; the loss of access to critical data or systems through ransomware, destructive attacks or other means; and business delays, service or system disruptions or denials of service.
As we increase the amount of personal information that we store and share digitally, our exposure to unintended disclosures, data security and related cybersecurity risks increases, including the risk of undetected attacks, damage, loss or unauthorized access or misappropriation of proprietary or personal information, and the cost of attempting to protect against these risks also increases. If disruptions, disclosures or breaches are not detected quickly, their effect could be compounded. We have implemented security technologies, processes and procedures to protect consumer identity and provide employee awareness training around phishing, malware and other cyber risks; however, there are no assurances that such measures will be effective against all types of breaches.
Cybersecurity threats are rapidly evolving and those threats and the means for obtaining access to our proprietary systems are becoming increasingly sophisticated. Cyberattacks can originate from a wide variety of sources including third parties, such as external service providers, and the techniques used change frequently or are often not recognized until after they have been launched. Those parties may also attempt to fraudulently induce employees, customers or other users of our systems to disclose sensitive information in order to gain access to our data or that of our customers. In addition, while we have certain standards for all vendors that provide us services, our vendors, and in turn, their own service providers, may become subject to the same types of security breaches. Finally, our offices may be vulnerable to security incidents or security attacks, acts of vandalism or theft, misplaced or lost data, human error or similar events that could negatively affect our systems and our customers’ and clients’ data.
38
The costs to eliminate or address security threats and vulnerabilities before or after a cyber-incident could be significant. Our remediation efforts may not be successful and could result in interruptions, delays, or cessation of service and loss of existing or potential customers.
In addition, breaches of our security measures and the unauthorized dissemination of sensitive personal information, proprietary information or confidential information about us, our customers or other third parties could expose our customers' private information and our customers to the risk of financial or medical identity theft. Unauthorized dissemination of confidential and proprietary information about our business and strategy could also negatively affect the achievement of our strategic initiatives. Such events could cause us to breach our contractual confidentiality obligations and violate applicable laws. These events would negatively affect our ability to compete, others’ trust in us, our reputation, customer base and revenues and expose us to mandatory disclosure requirements, litigation and other enforcement proceedings, material fines, penalties or remediation costs, and compensatory, special, punitive and statutory damages, consent orders and other adverse actions, any of which could adversely affect our business, results of operations, financial condition or liquidity.
In managing medical practices and operating pharmacies, onsite clinics and other types of medical facilities, we may be subject to additional liability that could result in significant time and expense.
In addition to contracting with physicians and other health care providers for services, we employ physicians, pharmacists, nurses and other health care providers at our home delivery and specialty pharmacies, onsite low acuity and primary care practices and infusion clinics that we manage and operate for our customers, as well as certain clinics for our employees. We also provide in-home care through health care providers that we employ, as well as, through third-party contractors. As such, we may be subject to liability for certain acts, omissions, or injuries caused by our employees or agents, or occurring at one of these practices, pharmacies or clinics. The defense of any actions may result in significant expenses that could have a material adverse effect on our business, results of operations, financial condition, liquidity and reputation.
Legal and Compliance Risks
Our business is subject to substantial government regulation, as well as new laws or regulations or changes in existing laws or regulations that could have a material adverse effect on our business, results of operations, financial condition and liquidity.
Our business is regulated at the federal, state, local and international levels. The laws and rules governing our business and related interpretations are increasing in number and complexity, are subject to frequent change and can be inconsistent or in conflict with each other. Noncompliance with applicable regulations by us or our third-party vendors could have material adverse effects on our business, results of operations, financial condition, liquidity and reputation.
We must identify, assess and respond to new trends in the legislative and regulatory environment, as well as comply with the various existing regulations applicable to our business. There are currently pending, and in the future there will likely be, legislative or regulatory proposals which seek to manage the health care industry, including managing prescription drug costs and health records, as well as regulating drug distribution. We expect federal and state governments to continue to enact and seriously consider many broad-based legislative and regulatory proposals that will or could materially impact various aspects of the health care and related benefits system. The trading price of our securities may react to the announcement of such proposals. We are unable to predict whether any such proposals will be enacted, or the specific terms thereof, including their effect on our operations; however, certain of these proposals could, if enacted, adversely impact our business and results of operations.
Existing or future laws, rules, regulatory interpretations or judgments could force us to change how we conduct our business, affect the products and services we offer, restrict revenue and enrollment growth, increase our costs, including operating, health care technology and administrative costs, and require enhancements to our compliance infrastructure and internal controls environment. For example, a decision invalidating the ACA or portions thereof could result in material changes to the way we conduct our business, as well as the loss of subsidies related to our IFP offerings. We are required to obtain and maintain insurance and other regulatory approvals to, among other things, market many of our products, expand into additional geographic or product markets, increase prices for certain regulated products and consummate some of our acquisitions and dispositions. Delays in obtaining or failure to obtain or maintain these approvals could reduce our revenue or increase our costs. Existing or future laws and rules could also require or lead us to take other actions such as changing our business practices, and could increase our liability.
Further, failure to effectively implement or adjust our strategic and operational initiatives, such as by reducing operating costs, adjusting premium pricing or benefit design or transforming our business model in response to regulatory changes may have a material adverse effect on our results of operations, financial condition and cash flows, including, but not limited to, our ability to maintain the value of our goodwill and other intangible assets.
39
For more information on regulations affecting our business, see “Business – Regulation” in Part I, Item 1 of this Form 10-K.
There are various risks associated with participating in government-sponsored programs, such as Medicare, including dependence upon government funding, compliance with government contracts and increased regulatory oversight and enforcement.
Through our Government business, we contract with CMS and various state governmental agencies to provide managed health care services including Medicare Advantage plans and Medicare Part D plans. Additionally, our Health Services business provides services to government entities and payers participating in government health care programs.
Our revenues from government funded programs, including our Medicare programs and our government clients, are dependent, in whole or in part, upon annual funding from the federal government or applicable state or local governments. Funding for these programs is dependent on many factors outside our control, including general economic conditions, continuing government efforts to contain health care costs and budgetary constraints at the federal or applicable state or local level and general political issues and priorities. These entities generally have the right to not renew or cancel their contracts with us on short notice without cause or if funds are not available. Unanticipated changes in funding, such as the application of sequestration by the federal or state governments or the failure to provide for continued appropriations or regular ongoing scheduled payments to us, could substantially reduce our revenues and profitability.
The Medicare program has been the subject of regulatory reform initiatives. The premium rates paid to Medicare Advantage plans and Medicare Part D plans are established by contract, although the rates differ depending on a combination of factors, some of which are outside our control. For example, a portion of each Medicare Advantage plan’s reimbursement is tied to the plan’s Star Rating, with those plans receiving a rating of four or more stars eligible for quality-based bonus payments. A plan’s Star Rating affects its image in the market and plans that perform well are able to offer enhanced benefits, market more effectively and for longer periods of time than other plans. The Star Rating system is subject to change annually by CMS, which may make it more difficult to achieve four stars or greater. Our Medicare Advantage plans’ and Medicare Part D plans’ operating results, premium revenue and benefit offerings are likely to continue to be significantly determined by their Star Ratings. There can be no assurances that we will be successful in maintaining or improving our Star Ratings in future years. In addition, audits of our performance for past or future periods may result in downgrades to our Star Ratings. Accordingly, our plans may not be eligible for full level quality bonuses, which could adversely affect the benefits such plans can offer, reduce membership or impact our financial performance. See Part II, Item 7 – Management’s Discussion and Analysis of Financial Condition and Results of Information – Industry Developments and Other Matters Affecting our Health Services and Integrated Medical Segments for additional information on our Star Ratings.
Additionally, if we fail to comply with CMS’s contractual requirements, including data submission, enrollment and marketing, provider network adequacy, provider directory accuracy, quality measures, claims payment, continuity of care and call center performance, we may be subject to administrative actions, including enrollment sanctions or contract termination, fines or other penalties that could impact our profitability. As described under “Business – Regulation” in Part I, Item 1 of this Form 10-K, on November 1, 2018, CMS released a proposed rule that would revise its RADV methodology by, among other things, excluding an adjustment for underlying fee-for-service data errors and extrapolating RADV results at the contract level for RADV audits of contract year 2011 and all subsequent years. If adopted in its current form, the rule could result in some combination of degraded plan benefits, higher monthly premiums or reduced choice for the population served by all Medicare Advantage insurers. The Company, along with other Medicare Advantage organizations and additional interested parties, submitted comments to CMS on the proposed rule as part of the notice-and-comment rulemaking process. The comment period concluded on August 28, 2019. While it is uncertain that CMS will finalize the rule as proposed, if adopted, it could have a material impact on the Company’s future results of operations.
Our participation in health insurance exchanges for individuals and small employers through our IFP offerings involves uncertainties associated with mix and volume of business and could adversely affect our results of operations, financial position and cash flows. The executive order signed in October 2017 that halted payment of the cost-sharing reduction subsidies under the ACA has created additional uncertainty regarding the future of public health insurance exchanges.
Any failure to comply with various state and federal health care laws and regulations, including those directed at preventing fraud and abuse in government funded programs, could result in investigations or litigation, such as actions under the federal False Claims Act and similar whistleblower statutes under state laws. This could subject us to damage awards, including treble damages, fines, penalties or other enforcement actions, restrictions on our ability to market or enroll new customers, limits on expansion, restrictions or exclusions from programs or other agreements with federal or state governmental agencies, which could adversely impact our business, cash flows, financial condition, results of operations and reputation.
40
We face risks related to litigation, regulatory audits and investigations.
We are routinely involved in numerous claims, lawsuits, regulatory audits, investigations and other legal matters arising, for the most part, in the ordinary course of business. These legal matters could include benefit claims, breach of contract actions, tort claims, claims arising from consumer protection laws, false claims act laws, claims disputes under federal or state laws and disputes regarding reinsurance arrangements, employment and employment discrimination-related suits, antitrust claims, employee benefit claims, wage and hour claims, tax, privacy, intellectual property and whistleblower claims, shareholder suits and other securities law claims, real estate disputes, claims related to disclosure of certain business practices and claims arising from customer audits and contract performance, including government contracts. In addition, we have incurred and likely will continue to incur liability for practices and claims related to our health care business, such as marketing misconduct, failure to timely or appropriately pay for or provide health care, provider network structure, poor outcomes for care delivered or arranged, provider disputes including disputes over compensation or contractual provisions, ERISA claims, allegations related to calculations of cost sharing and claims related to our administration of self-funded business. We are also routinely involved in legal matters arising from our health services business, including without limitation claims related to the dispensing of pharmaceutical products by our home delivery and specialty pharmacies, pharmacy benefit management services, such as formulary management services, health benefit management services and provider services. There are currently, and may be in the future, attempts to bring class action lawsuits against the company and other companies in our industry; individual plaintiffs also may bring multiple claims regarding the same subject matter against us and other companies in our industry.
Court decisions and legislative activity may increase our exposure for any of these types of claims. In some cases, substantial noneconomic or punitive damages may be sought. We seek to procure insurance coverage to cover some of these potential liabilities. However, certain potential liabilities may not be covered by insurance, insurers may dispute coverage or the amount of insurance may be insufficient to cover the entire damages awarded. In addition, certain types of damages, such as punitive damages, may not be covered by insurance, and insurance coverage for all or certain forms of liability may become unavailable or prohibitively expensive in the future. Resolving disputes is often expensive and disruptive, regardless of the outcome. Additionally, it is possible that the resolution of current or future legal matters and claims could result in changes to our industry and business practices, losses material to our results of operations, financial condition and liquidity or damage to our reputation.
We are frequently the subject of regulatory market conduct and other reviews, audits and investigations by state insurance and health and welfare and pharmacy departments, attorneys general, CMS, DOL and the OIG and comparable authorities in foreign jurisdictions. With respect to our Medicare Advantage and Medicare Part D businesses, CMS and OIG perform audits to determine a health plan's compliance with federal regulations and contractual obligations, including compliance with proper coding practices and fraud and abuse enforcement practices through audits designed to detect and correct improper payments. Certain of our contracts are currently subject to RADV audits by CMS and the OIG. The DOJ is conducting an industry-wide investigation of the risk adjustment data submission practices and business processes, including review of medical charts, of Cigna and a number of other Medicare Advantage organizations under Medicare Parts C and D. There also continues to be heightened review by federal and state regulators of business and reporting practices within the health service, disability and life insurance industries, including with respect to claims payment and related escheat practices, and increased scrutiny by other federal and state governmental agencies (such as state attorneys general) empowered to bring criminal actions in circumstances that could have previously given rise only to civil or administrative proceedings.
In addition, various government agencies have conducted investigations and audits into certain pharmacy benefit management practices. Many of these investigations and audits have resulted in other companies agreeing to civil penalties, including the payment of money and corporate integrity agreements. We cannot predict what effect, if any, such government investigations and audits may ultimately have on us or on the industry in general. However, we will likely continue to experience government scrutiny and audit activity, which has and may in the future result in civil penalties.
Regulatory audits, investigations or reviews or actions by other government agencies could result in changes to our business practices, retroactive adjustments to certain premiums, significant fines, penalties, civil liabilities, criminal liabilities or other sanctions, including corporate integrity agreements, restrictions on our ability to participate in government programs, market certain products or engage in business-related activities, that could have a material adverse effect on our business, results of operation, financial condition and liquidity. In addition, disclosure of an adverse investigation or audit or the imposition of fines or other sanctions could negatively affect our reputation in certain markets and make it more difficult for us to sell our products and services.
A description of material pending legal actions and other legal and regulatory matters is included in Note 22 to the Consolidated Financial Statements included in this Form 10-K. The outcome of litigation and other legal or regulatory matters is always uncertain.
41
If we fail to comply with applicable privacy, security and data laws, regulations and standards, our business and reputation could be materially adversely affected.
Most of our activities involve the receipt, use, storage or transmission of a substantial amount of individuals’ protected health information and personally identifiable information. We also use aggregated and anonymized data for research and analysis purposes, and in some cases, provide access to such data to pharmaceutical manufacturers and third-party data aggregators and analysts. The collection, maintenance, protection, use, transmission, disclosure and disposal of sensitive personal information are regulated at the federal, state, international and industry levels and requirements are imposed on us by contracts with clients. In some cases, such laws, rules, regulations and contractual requirements also apply to our vendors and require us to obtain written assurances of their compliance with such requirements. We are also subject to various other consumer protection laws that regulate our communications with customers. Certain of our businesses are also subject to the Payment Card Industry Data Security Standard, which is designed to protect credit card account data as mandated by payment card industry entities. International laws, rules and regulations governing the use and disclosure of such information, such as the GDPR, can be more stringent than in the United States, and they vary across jurisdictions. In addition, more jurisdictions are regulating the transfer of data across borders and domestic privacy and data protection laws are generally becoming more onerous.
These laws, rules and contractual requirements are subject to change and the regulatory environment surrounding data security and privacy is increasingly demanding. Compliance with new privacy, security and data laws, regulations and requirements may result in increased operating costs, and may constrain or require us to alter our business model or operations. For more information on privacy regulations to which we are subject, see “Business – Regulation” in Part I, Item 1 of this Form 10-K.
HIPAA requires covered entities to comply with the HIPAA privacy, security and breach rules. In addition, business associates must comply with the HIPAA security and breach requirements. While we endeavor to provide appropriate protections through our contracts with our third-party service providers and in certain cases assess their security controls, we have limited oversight or control over their actions and practices. Several of our businesses act as business associates to their covered entity customers and, as a result, collect, use, disclose and maintain sensitive personal information in order to provide services to these customers. HHS has continued its audit program to assess HIPAA compliance efforts by covered entities and has expanded it to include business associates. In addition, HHS continues to exercise its enforcement authority, such as enforcement actions resulting from investigations brought on by notification to HHS of a breach. An audit resulting in findings or allegations of noncompliance or the implementation of an enforcement action could have an adverse effect on our results of operations, financial position, cash flows and reputation.
Noncompliance or findings of noncompliance with applicable laws, regulations or requirements, or the occurrence of any privacy or security breach involving the misappropriation, loss or other unauthorized disclosure of protected personal information, whether by us or by one of our third-party service providers, could materially adversely affect our business and reputation, including our results of operations, financial position, and cash flows.
Effective prevention, detection and control systems are critical to maintain regulatory compliance and prevent fraud and failure of these systems could adversely affect us.
Federal and state governments have made investigating and prosecuting health care and other insurance fraud and abuse a priority. Fraud and abuse prohibitions encompass a wide range of activities including kickbacks for referral of customers, billing for unnecessary medical services, improper marketing and violations of patient privacy rights. The regulations and contractual requirements applicable to us are complex and subject to change. In addition, ongoing vigorous law enforcement, a highly technical regulatory scheme and the Dodd-Frank Act and related regulations enhance regulators’ enforcement powers and whistleblower incentives and protections. Our compliance efforts in this area will continue to require significant resources. Failure of our prevention, detection or control systems related to regulatory compliance or the failure of employees to comply with our internal policies including data systems security or unethical conduct by managers and employees, could adversely affect our reputation and also expose us to litigation and other proceedings, fines and penalties.
In addition, provider or customer fraud that is not prevented or detected could impact our medical costs or those of our self-insured clients. Further, during an economic downturn, we may experience increased fraudulent claims volume that may lead to additional costs due to an increase in disputed claims and litigation.
Economic Risks
Economic and market conditions affect the value of our financial instruments and the value of particular assets and liabilities.
As an insurer, we have substantial investment assets that support insurance and contractholder deposit liabilities. The market value of our investments vary depending on economic and market conditions. For example, generally low levels of interest rates on
42
investments, such as those experienced in U.S. and foreign financial markets during recent years, have negatively impacted our level of investment income earned in recent periods.
A substantial portion of our investment assets are in fixed interest-yielding debt securities of varying maturities, fixed redeemable preferred securities and commercial mortgage loans. The value of these investment assets can fluctuate significantly with changes in market conditions. A rise in interest rates would likely reduce the value of our investment portfolio and increase interest expense if we were to access our available lines of credit. In addition, a delay in payment of principal or interest by issuers, or defaults by issuers, could reduce our investment income and require us to write down the value of our investments.
Significant stock market or interest rate declines could result in additional unfunded pension obligations resulting in the need for additional plan funding by us and increased pension expenses.
We currently have unfunded obligations in our frozen pension plans. A significant decline in the value of the plans’ equity and fixed income investments or unfavorable changes in applicable laws or regulations could materially increase our expenses and change the timing and amount of required plan funding. This could reduce the cash available to us, including our subsidiaries. We are also exposed to interest rate and equity risk associated with our pension obligations. Sustained declines in interest rates could have an adverse impact on the funded status of our pension plans and our reinvestment yield on new investments. See Note 16 to the Consolidated Financial Statements for more information on our obligations under the pension plans.
A downgrade in the financial strength ratings of our insurance subsidiaries could adversely affect new sales and retention of current business, and a downgrade in our debt ratings would increase the cost of borrowed funds and could negatively affect our ability to access capital.
Financial strength, claims paying ability and debt ratings by recognized rating organizations are each important factors in establishing the competitive position of insurance and health benefits companies. Ratings information by nationally recognized ratings agencies is broadly disseminated and generally used throughout the industry. We believe that the claims paying ability and financial strength ratings of our principal insurance subsidiaries are important factors in marketing our products to certain customers. Our debt ratings impact both the cost and availability of future borrowings and, accordingly, our cost of capital. Each of the rating agencies reviews ratings periodically and there can be no assurance that current ratings will be maintained in the future. A downgrade of any of these ratings in the future could make it more difficult to either market our products successfully or raise capital to support business growth within our insurance subsidiaries.
Global market, economic and geopolitical conditions may cause fluctuations in equity market prices, interest rates and credit spreads that could impact our ability to raise or deploy capital and affect our overall liquidity.
If the equity and credit markets experience extreme volatility and disruption, there could be downward pressure on stock prices and restricted access to capital for certain issuers without regard to those issuers’ underlying financial strength. Extreme disruption in the credit markets could adversely impact our access to, and cost of, capital in the future.
In the event of adverse economic and industry conditions, we may be required to dedicate a greater percentage of our cash flow from operations to the payment of principal and interest on our debt, thereby reducing the funds we have available for other purposes, such as investments and other expenditures in ongoing businesses, acquisitions, dividends and stock repurchases. In these circumstances, our ability to execute our strategy may be limited, our flexibility in planning for or reacting to changes in business and market conditions may be reduced, or our access to capital markets may be limited such that additional capital may not be available or may be available only on unfavorable terms.
In connection with the combination with Express Scripts, we have considerably higher levels of indebtedness than Cigna and Express Scripts previously carried, which will result in higher relative debt service costs and less cash flow from operations available to fund growth, stock repurchases and other corporate purposes.
The long-term indebtedness of Cigna was approximately $31.9 billion as of December 31, 2019. This level of indebtedness:
•requires us to dedicate a greater percentage of our cash flow from operations to debt payments, thereby reducing the availability of cash flow to fund capital expenditures, pursue other acquisitions or investments in new technologies, make stock repurchases, pay dividends and for general corporate purposes;
•increases our vulnerability to general adverse economic conditions, including increases in interest rates for our borrowings that bear interest at variable rates and are in a greater amount than floating rate assets held, or if such indebtedness is refinanced at a time when interest rates are higher; and
43
•limits our flexibility in planning for, or reacting to, changes in or challenges relating to our business and industry.
The covenants to which we have agreed in connection with the financing, and our indebtedness and higher debt-to-equity ratio in comparison with that of Cigna or Express Scripts on a recent historical basis, may have the effect, among other things, of restricting our financial and operating flexibility to respond to changing business and economic conditions, creating competitive disadvantages compared with other competitors with lower debt levels during the deleveraging process. If our cash flow and capital resources are insufficient to service our debt obligations, we may be forced to seek additional dividends from our subsidiaries, sell assets, seek additional equity or debt capital or restructure our debt.
Unfavorable developments in economic conditions may adversely affect our business, results of operations and financial condition.
Many factors, including geopolitical issues, future economic downturns, availability and cost of credit and other capital and consumer spending can negatively impact the U.S. and global economies. Our results of operations could be materially adversely affected by the impact of unfavorable economic conditions on our clients and customers (both employers and individuals), health care providers, pharmacy manufacturers, pharmacy providers and third-party vendors. For example:
•Employers may take action to reduce their operating costs by modifying, delaying or canceling plans to purchase our products or making changes in the mix of products purchased that are unfavorable to us.
•Higher unemployment rates and workforce reductions could result in lower enrollment in our employer-based plans (including an increase in the number of employees who opt out of employer-based plans) or our individual plans.
•Because of unfavorable economic conditions or the ACA, employers may stop offering health care coverage to employees or elect to offer this coverage on a voluntary, employee-funded basis as a means to reduce their operating costs.
•Our historical disability claim experience and industry data indicate that submitted disability claims rise under adverse economic conditions.
•If clients are not successful in generating sufficient funds or are precluded from securing financing, they may not be able to pay, or may delay payment of, accounts receivable that are owed to us.
•Our clients or potential clients may force us to compete more vigorously on factors such as price and service to retain or obtain their business.
•Our clients may be acquired, consolidated, or otherwise fail to successfully maintain or grow their business or workforce, which could reduce the number of customers we serve or otherwise result in lower than anticipated utilization of our services.
•A prolonged unfavorable economic environment could adversely impact the financial position of hospitals and other health care providers, potentially increasing our medical costs as these providers attempt to maintain revenue levels in their efforts to adjust to their own economic challenges.
•Our third-party vendors could significantly and quickly increase their prices or reduce their output to reduce their operating costs. Our business depends on our ability to perform necessary business functions in an efficient and uninterrupted fashion.
These factors could lead to a decrease in our customer base, revenues or margins or an increase in our operating costs.
In addition, during and following a prolonged unfavorable economic environment, federal and state budgets could be materially adversely affected, resulting in reduced or delayed reimbursements or payments in federal and state government programs such as Medicare and Social Security or under contracts with government entities. These federal and state budgetary pressures also could cause the government to impose new or a higher level of taxes or assessments on us, such as premium taxes on insurance companies and HMOs and surcharges or fees on select fee-for-service and capitated medical claims. Although we could attempt to mitigate or cover our exposure from such increased costs through, among other things, increases in premiums, there can be no assurance that we will be able to mitigate or cover all of such costs, which may have a material adverse effect on our business, results of operations, financial condition and liquidity.
44
We are subject to the credit risk of our reinsurers.
We enter into reinsurance arrangements with other insurance companies, primarily to limit losses from large exposures or to permit recovery of a portion of direct losses. We also may enter into reinsurance arrangements in connection with acquisition or divestiture transactions when the underwriting company is not being acquired or sold.
Under all reinsurance arrangements, reinsurers assume insured losses, subject to certain limitations or exceptions that may include a loss limit. These arrangements also subject us to various obligations, representations and warranties with the reinsurers. Reinsurance does not relieve us of liability as the originating insurer. We remain liable to the underlying policyholders if a reinsurer defaults on obligations under the reinsurance arrangement. Although we regularly evaluate the financial condition of reinsurers to minimize exposure to significant losses from reinsurer insolvencies, reinsurers may become financially unsound. If a reinsurer fails to meet its obligations under the reinsurance contract or if the liabilities exceed any applicable loss limit, we will be forced to cover the claims on the reinsured policies.
The collectability of amounts due from reinsurers is subject to uncertainty arising from a number of factors, including whether the insured losses meet the qualifying conditions of the reinsurance contract, whether reinsurers or their affiliates have the financial capacity and willingness to make payments under the terms of the reinsurance contract and the magnitude and type of collateral supporting our reinsurance recoverable, such as holding sufficient qualifying assets in trusts or letters of credit issued. Although a portion of our reinsurance exposures are secured, the inability to collect a material recovery from a reinsurer could have a material adverse effect on our results of operations, financial condition and liquidity.
45
Item 1B. UNRESOLVED STAFF COMMENTS
None.
Item 2. PROPERTIES
Our global real estate portfolio consists of approximately 12.9 million square feet of owned and leased properties. Our domestic portfolio has approximately 10.9 million square feet in 43 states, the District of Columbia, Puerto Rico and the U.S. Virgin Islands. Our international properties contain approximately 2.0 million square feet located throughout the following countries: Australia, Bahrain, Belgium, Canada, China, France, Germany, Hong Kong, India, Indonesia, Kenya, Kuwait, Lebanon, Malaysia, New Zealand, Oman, Singapore, South Korea, Spain, Switzerland, Taiwan, Thailand, Turkey, United Arab Emirates, and the United Kingdom.
Our principal domestic office locations include the Wilde Building located at 900 Cottage Grove Road in Bloomfield, Connecticut (our corporate headquarters), Two Liberty Place located at 1601 Chestnut Street in Philadelphia, Pennsylvania, and Express Scripts’ corporate offices located at and around One Express Way in St. Louis, Missouri. The Wilde Building measures approximately 893,000 square feet and is owned. Express Scripts’ campus measures approximately 1.2 million square feet of leased space and Two Liberty Place measures approximately 322,000 square feet and is leased space.
The home delivery pharmacy operations of our Health Services segment consist of eight order processing pharmacies, eight patient contact centers and four high-volume automated home delivery dispensing pharmacies located throughout the United States. Health Services’ home delivery dispensing pharmacies are located in Arizona, Indiana, Missouri and New Jersey. Health Services also has seven specialty home delivery pharmacies and 38 specialty branch pharmacies.
We believe our properties are adequate and suitable for our business as presently conducted. The foregoing does not include information on investment properties.
Item 3. LEGAL PROCEEDINGS
The information contained under Litigation Matters and Regulatory Matters in Note 22 to the Financial Statements of this Form 10-K, is incorporated herein by reference.
Item 4. MINE SAFETY DISCLOSURES
Not Applicable.
46
Information about our Executive Officers
All officers are elected to serve for a one-year term or until their successors are elected. Principal occupations and employment histories are listed below.
MARK L. BOXER, 60, Executive Vice President and Chief Information Officer of Cigna beginning April 2011; Deputy Chief Information Officer, Xerox Corporation; and Group President, Government Health Care, for Xerox Corporation/Affiliated Computer Services from March 2009 until April 2011.
DAVID M. CORDANI, 54, Chief Executive Officer of Cigna beginning December 2009; Director since October 2009; President beginning June 2008; and Chief Operating Officer from June 2008 until December 2009.
BRIAN C. EVANKO, 43, President, Government Business beginning November 2017; President, U.S. Individual Business from August 2013 to November 2017; Business Financial Officer, Cigna Global Individual, Health, Life and Accident from September 2012 to August 2013; Chief Actuary, Cigna Global Individual, Health, Life and Accident from December 2008 to September 2012.
NICOLE S. JONES, 49, Executive Vice President and General Counsel of Cigna beginning June 2011; Senior Vice President and General Counsel of Lincoln Financial Group from May 2010 until June 2011; Vice President and Deputy General Counsel of Cigna from April 2008 until May 2010; and Corporate Secretary of Cigna from September 2006 until April 2010.
MATTHEW G. MANDERS, 58, President, Strategy and Solutions beginning November 2018; President, Government & Individual Programs and Group Insurance from February 2017 through November 2017; President, U.S. Markets from June 2014 until February 2017; President, Regional and Operations from November 2011 until June 2014; President, U.S. Service, Clinical and Specialty from January 2010 until November 2011; and President, Cigna HealthCare, Total Health, Productivity, Network & Middle Market from June 2009 until January 2010.
STEVEN B. MILLER, MD, 62, Executive Vice President and Chief Clinical Officer beginning December 2018; Senior Vice President and Chief Medical Officer, of Express Scripts from October 2007 through December 2018.
JOHN M. MURABITO, 61, Executive Vice President, Human Resources and Services of Cigna beginning August 2003.
ERIC P. PALMER, 43, Executive Vice President and Chief Financial Officer beginning June 2017; Deputy Chief Financial Officer from February 2017 until June 2017; Senior Vice President, Chief Business Financial Officer from November 2015 to February 2017; Vice President, Business Financial Officer, Health Care from April 2012 to November 2015; and Vice President, Business Financial Officer, U.S. Commercial Markets from June 2010 to April 2012.
JASON D. SADLER, 51, President, International Markets beginning June 2014; President, Global Individual Health, Life and Accident from July 2010 until June 2014; and Managing Director Insurance Business Hong Kong, HSBC Insurance Asia Limited from January 2007 until July 2010.
MICHAEL W. TRIPLETT, 58, President, U.S. Markets beginning February 2017; Regional Segment Lead from June 2009 to February 2017.
TIMOTHY C. WENTWORTH, 59, President, Health Services beginning February 2020; President, Express Scripts and Cigna Services from December 2018 until February 2020; Chief Executive Officer of Express Scripts from May 2016 until December 2018; President from February 2014 through December 2018; and Senior Vice President and President, Sales and Account Management from April 2012 until February 2014.
47
PART II
ITEM 5. Market for registrant’s common equity, related stockholder matters and issuer purchases of equity securities
The information under the caption “Quarterly Financial Data – Stock and Dividend Data” appears on page 147 of this Form 10-K. As of December 31, 2019, the number of shareholders of record was 35,727. Cigna’s common stock is listed with, and trades on, the New York Stock Exchange under the symbol “CI”.
Issuer Purchases of Equity Securities
The following table provides information about Cigna’s share repurchase activity for the quarter ended December 31, 2019:
|
| Total # of shares purchased (1) | Average price paid per share | Total # of shares purchased as part of publicly announced program (2) | Approximate dollar value of shares that may yet be purchased as part of publicly announced program (3) | ||
Period |
| ||||||
October 1-31, 2019 |
| 1,542,086 | $ | 157.84 | 1,540,917 | $ | 1,159,327,593 |
November 1-30, 2019 | 522,214 | $ | 192.32 | 519,770 | $ | 1,059,361,992 | |
December 1-31, 2019 | 488,296 | $ | 202.16 | 482,318 | $ | 3,961,834,531 | |
Total |
| 2,552,596 | $ | 173.37 | 2,543,005 |
| N/A |
(1) Represents shares tendered by employees under the Company’s equity compensation plans as follows: 1) payment of taxes on vesting of restricted stock (grants and units) and strategic performance shares and 2) payment of the exercise price and taxes for certain stock options exercised. Employees tendered 1,169 shares in October, 2,444 shares in November and 5,978 shares in December 2019.
(2) Additionally, the Company maintains a share repurchase program, authorized by the Board of Directors. Under this program, the Company may repurchase shares from time to time, depending on market conditions and alternate uses of capital. The timing and actual number of shares repurchased will depend on a variety of factors, including price, general business and market conditions and alternate uses of capital. The share repurchase program may be effected through Rule 10b5-1 plans, open market purchases or privately negotiated transactions, each in compliance with Rule 10b-18 under the Exchange Act. The program may be suspended or discontinued at any time. In the fourth quarter of 2019, the Board increased repurchase authority by an additional $4.0 billion. The program does not have an expiration date. From January 1, 2020 through February 26, 2020, the Company repurchased 2.0 million shares for approximately $425 million, leaving repurchase authority at $3.5 billion as of February 26, 2020.
(3) Approximate dollar value of shares is as of the last date of the applicable month.
48
Stock Price Performance Graph
The graph below compares the cumulative total shareholder return on our common stock for the five years ended December 31, 2019 with the cumulative total return of the Standard & Poor’s 500 Index, the Standard & Poor’s 500 Health Care Providers & Services Index and the Standard & Poor’s Managed Health Care, Life & Health Insurance Indexes. The stock performance shown in the graph is not intended to forecast or be indicative of future performance.
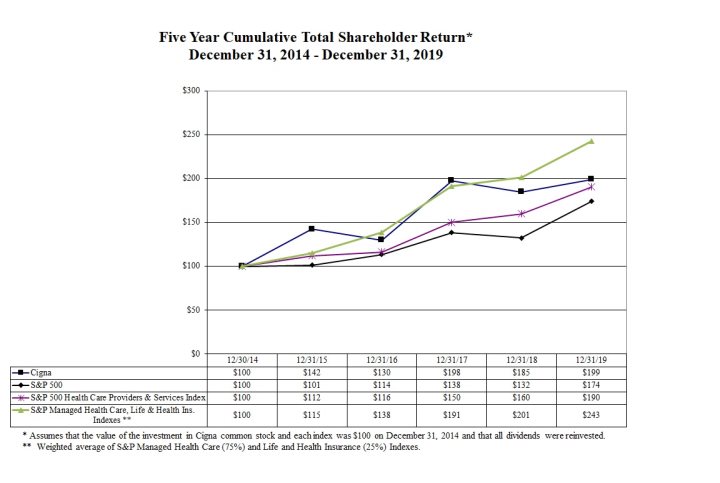
49
Item 6. SELECTED FINANCIAL DATA
The selected financial data should be read in conjunction with Management’s Discussion and Analysis of Financial Condition and Results of Operations and the Consolidated Financial Statements and accompanying notes included elsewhere herein.
Highlights |
|
|
|
|
|
|
|
|
|
|
|
|
|
|
|
|
|
|
|
|
|
(Dollars in millions, except per share amounts) |
| 2019 |
| 2018 |
| 2017 |
| 2016 |
| 2015 |
Total revenues | $ | 153,566 | $ | 48,650 | $ | 41,806 | $ | 39,838 | $ | 38,098 |
Shareholders' net income | $ | 5,104 | $ | 2,637 | $ | 2,237 | $ | 1,867 | $ | 2,094 |
Net income | $ | 5,120 | $ | 2,646 | $ | 2,232 | $ | 1,843 | $ | 2,077 |
Shareholders’ net income per share |
|
|
|
|
|
|
|
|
|
|
Basic | $ | 13.58 | $ | 10.69 | $ | 8.92 | $ | 7.31 | $ | 8.17 |
Diluted | $ | 13.44 | $ | 10.54 | $ | 8.77 | $ | 7.19 | $ | 8.04 |
Common dividends declared per share | $ | 0.04 | $ | 0.04 | $ | 0.04 | $ | 0.04 | $ | 0.04 |
Cash and investments | $ | 27,098 | $ | 32,829 | $ | 31,591 | $ | 30,000 | $ | 26,681 |
Total assets | $ | 155,774 | $ | 153,226 | $ | 61,759 | $ | 59,366 | $ | 57,094 |
Long-term debt | $ | 31,893 | $ | 39,523 | $ | 5,199 | $ | 4,756 | $ | 5,020 |
Total liabilities | $ | 110,395 | $ | 112,154 | $ | 47,999 | $ | 45,605 | $ | 45,005 |
Shareholders’ equity | $ | 45,338 | $ | 41,028 | $ | 13,711 | $ | 13,699 | $ | 12,011 |
50
Item 7. MANAGEMENT’S DISCUSSION AND ANALYSIS OF FINANCIAL CONDITION AND RESULTS OF OPERATIONS
| PAGE |
|
|
Management’s Discussion and Analysis of Financial Condition and Results of Operations (“MD&A”) is intended to provide information to assist you in better understanding and evaluating our financial condition as of December 31, 2019 compared with December 31, 2018 and our results of operations for the year ended December 31, 2019 compared with 2018 and 2017. We encourage you to read this MD&A in conjunction with our Consolidated Financial Statements included in Part II, Item 8 of this Annual Report on Form 10-K (“Form 10-K”) and the Risk Factors contained in Part 1A of this Form 10-K. For comparisons of our results of operations for the year ended December 31, 2018 with 2017 please refer to the previously filed MD&A included in Part II, Item 7 of our Annual Report on Form 10-K for the fiscal year ended December 31, 2018.
Unless otherwise indicated, financial information in the MD&A is presented in accordance with accounting principles generally accepted in the United States of America (“GAAP”). See Note 2 to the Consolidated Financial Statements included in this Form 10-K for additional information regarding the Company’s significant accounting policies. In some of our financial tables in this MD&A, we present either percentage changes or “N/M” when those changes are so large as to become not meaningful. Changes in percentages are expressed in basis points (“bps”).
In this MD&A, our consolidated measures “adjusted income from operations,” earnings per share on that same basis, and “adjusted revenues” are not determined in accordance with GAAP and should not be viewed as substitutes for the most directly comparable GAAP measures of “shareholders’ net income,” “earnings per share” and “total revenues.” We also use pre-tax adjusted income from operations and adjusted revenues to measure the results of our segments.
We use adjusted income from operations as our principal financial measure of operating performance because management believes it best reflects the underlying results of our business operations and permits analysis of trends in underlying revenue, expenses and profitability. We define adjusted income from operations as shareholders’ net income (or income before taxes for the segment metric) excluding realized investment gains and losses, amortization of acquired intangible assets, results of Anthem and Coventry Health Care Inc. (“Coventry”) (collectively, the “transitioning clients”) (see the “Key Transactions and Developments” section of the MD&A for further discussion of transitioning clients) and special items. Cigna’s share of certain realized investment results of its joint ventures reported in the International Markets segment using the equity method of accounting are also excluded. Income or expense amounts excluded from adjusted income from operations because they are not indicative of underlying performance or the responsibility of operating segment management include:
Realized investment gains (losses) including changes in market values of certain financial instruments between balance sheet dates, as well as gains and losses associated with invested asset sales.
Amortization of acquired intangible assets because these relate to costs incurred for acquisitions.
Results of transitioning clients because those results are not indicative of ongoing results.
Special items, if any, that management believes are not representative of the underlying results of operations due to the nature or size of these matters. See Note 23 to the Consolidated Financial Statements for descriptions of special items.
The term “Adjusted revenues” is defined as total revenues excluding the following adjustments: revenue contributions from transitioning clients, special items and Cigna’s share of certain realized investment results of its joint ventures reported in the International Markets segment using the equity method of accounting. We exclude these items from this measure because management believes they are not indicative of past or future underlying performance of the business.
51
EXECUTIVE OVERVIEW
Cigna Corporation, together with its subsidiaries (either individually or collectively referred to as “Cigna,” the “Company,” “we,” “our” or “us”) is a global health service organization dedicated to a mission of helping those we serve improve their health, well-being and peace of mind. Our evolved strategy in support of our mission is Go Deeper, Go Local, Go Beyond using a differentiated set of pharmacy, medical, dental, disability, life and accident insurance and related products and services offered by our subsidiaries. For further information on our business and strategy, see Item 1, “Business” in this Form 10-K.
Results for the year ended December 31, 2019 included the results of Express Scripts’ business, whereas results for 2018 only reflected Express Scripts’ results for the period following the acquisition on December 20, 2018 and were not included in 2017. As discussed in Note 23 to the Consolidated Financial Statements, effective in the first quarter of 2019, compensation cost for stock options is now recorded by our segments. Prior year segment information has not been restated for this change.
Financial Summary
Summarized below are certain key measures of our performance for the years ended December 31:
|
| For the Years Ended December 31, |
| Increase (Decrease) |
| Increase (Decrease) | |||||||
(Dollars in millions, except per share amounts) |
|
| 2019 |
| 2018 |
| 2017 |
| 2019 vs. 2018 |
| 2018 vs. 2017 | ||
Revenues |
|
|
|
|
|
|
|
|
|
|
|
|
|
Adjusted revenues by segment |
|
|
|
|
|
|
|
|
|
|
|
|
|
Health Services |
| $ | 96,447 | $ | 6,606 | $ | 4,241 |
| N/M |
|
| 56 | % |
Integrated Medical |
|
| 36,519 |
| 32,791 |
| 29,035 |
| 11 | % |
| 13 |
|
International Markets |
|
| 5,615 |
| 5,366 |
| 4,901 |
| 5 |
|
| 9 |
|
Group Disability and Other |
|
| 5,182 |
| 5,061 |
| 5,075 |
| 2 |
|
| - |
|
Corporate, net eliminations |
|
| (3,588) |
| (1,713) |
| (1,446) |
| (109) |
|
| (18) |
|
Adjusted revenues |
|
| 140,175 |
| 48,111 |
| 41,806 |
| 191 |
|
| 15 |
|
Revenue contributions from transitioning clients |
|
| 13,347 |
| 459 |
| - |
| N/M |
|
| N/M |
|
Net realized investment results from certain equity method investments |
|
| 44 |
| (43) |
| - |
| N/M |
|
| N/M |
|
Special items reported in integration and transaction-related costs (1) |
|
| - |
| 123 |
| - |
| N/M |
|
| N/M |
|
Total revenues |
| $ | 153,566 | $ | 48,650 | $ | 41,806 |
| 216 | % |
| 16 | % |
Shareholders’ net income |
| $ | 5,104 | $ | 2,637 | $ | 2,237 |
| 94 | % |
| 18 | % |
Adjusted income from operations |
| $ | 6,476 | $ | 3,557 | $ | 2,668 |
| 82 | % |
| 33 | % |
Earnings per share (diluted) |
|
|
|
|
|
|
|
|
|
|
|
|
|
Shareholders’ net income |
| $ | 13.44 | $ | 10.54 | $ | 8.77 |
| 28 | % |
| 20 | % |
Adjusted income from operations |
| $ | 17.05 | $ | 14.22 | $ | 10.46 |
| 20 | % |
| 36 | % |
Pre-tax adjusted income from operations by segment |
|
|
|
|
|
|
|
| |||||
Health Services |
| $ | 5,092 | $ | 380 | $ | 288 |
| N/M |
|
| 32 | % |
Integrated Medical |
|
| 3,831 |
| 3,502 |
| 2,922 |
| 9 | % |
| 20 |
|
International Markets |
|
| 762 |
| 735 |
| 654 |
| 4 |
|
| 12 |
|
Group Disability and Other |
|
| 501 |
| 529 |
| 517 |
| (5) |
|
| 2 |
|
Corporate, net eliminations |
|
| (1,824) |
| (403) |
| (375) |
| N/M |
|
| (7) |
|
Consolidated pre-tax adjusted income from operations |
|
| 8,362 |
| 4,743 |
| 4,006 |
| 76 |
|
| 18 |
|
Adjustment for transitioning clients |
|
| 1,726 |
| 62 |
| - |
| N/M |
|
| N/M |
|
Income (loss) attributable to noncontrolling interests |
|
| 20 |
| 14 |
| (2) |
| 43 |
|
| N/M |
|
Realized investment gains (losses) |
|
| 221 |
| (124) |
| 237 |
| N/M |
|
| (152) |
|
Amortization of acquired intangible assets |
|
| (2,949) |
| (235) |
| (115) |
| N/M |
|
| (104) |
|
Special items |
|
| (810) |
| (879) |
| (520) |
| 8 |
|
| (69) |
|
Income before income taxes |
| $ | 6,570 | $ | 3,581 | $ | 3,606 |
| 83 | % |
| (1) | % |
|
|
|
|
|
|
|
|
|
|
|
|
|
|
(1) Comprised of net investment income included in integration and transaction-related costs; please refer to Note 4 to the Consolidated Financial Statements in this Form 10-K for additional information. | |||||||||||||
52
Consolidated Results of Operations (GAAP Basis)
|
| For the Years Ended December 31, |
| Increase (Decrease) |
| Increase (Decrease) | |||||||||||
(in millions) |
| 2019 | 2018 | 2017 |
| 2019 vs. 2018 |
| 2018 vs. 2017 | |||||||||
Pharmacy revenues |
| $ | 103,099 | $ | 5,479 | $ | 2,979 |
| $ | 97,620 | N/M |
|
| $ | 2,500 | 84 | % |
Premiums |
|
| 39,714 |
| 36,113 |
| 32,491 |
|
| 3,601 | 10 | % |
|
| 3,622 | 11 |
|
Fees and other revenues |
|
| 9,363 |
| 5,578 |
| 5,110 |
|
| 3,785 | 68 |
|
|
| 468 | 9 |
|
Net investment income |
|
| 1,390 |
| 1,480 |
| 1,226 |
|
| (90) | (6) |
|
|
| 254 | 21 |
|
Total revenues |
|
| 153,566 |
| 48,650 |
| 41,806 |
|
| 104,916 | 216 |
|
|
| 6,844 | 16 |
|
Pharmacy and other service costs |
|
| 97,668 |
| 4,793 |
| 2,456 |
|
| 92,875 | N/M |
|
|
| 2,337 | 95 |
|
Medical costs and other benefit expenses |
|
| 30,819 |
| 27,528 |
| 25,263 |
|
| 3,291 | 12 |
|
|
| 2,265 | 9 |
|
Selling, general and administrative expenses |
|
| 14,053 |
| 11,934 |
| 10,030 |
|
| 2,119 | 18 |
|
|
| 1,904 | 19 |
|
Amortization of acquired intangible assets |
|
| 2,949 |
| 235 |
| 115 |
|
| 2,714 | N/M |
|
|
| 120 | 104 |
|
Total benefits and expenses |
|
| 145,489 |
| 44,490 |
| 37,864 |
|
| 100,999 | 227 |
|
|
| 6,626 | 17 |
|
Income from operations |
|
| 8,077 |
| 4,160 |
| 3,942 |
|
| 3,917 | 94 |
|
|
| 218 | 6 |
|
Interest expense and other |
|
| (1,682) |
| (498) |
| (252) |
|
| (1,184) | (238) |
|
|
| (246) | (98) |
|
Debt extinguishment costs |
|
| (2) |
| - |
| (321) |
|
| (2) | N/M |
|
|
| 321 | 100 |
|
Net realized investment gains (losses) |
|
| 177 |
| (81) |
| 237 |
|
| 258 | N/M |
|
|
| (318) | (134) |
|
Income before income taxes |
|
| 6,570 |
| 3,581 |
| 3,606 |
|
| 2,989 | 83 |
|
|
| (25) | (1) |
|
Income taxes |
|
| 1,450 |
| 935 |
| 1,374 |
|
| 515 | 55 |
|
|
| (439) | (32) |
|
Net income |
|
| 5,120 |
| 2,646 |
| 2,232 |
|
| 2,474 | 93 |
|
|
| 414 | 19 |
|
Less: net income (loss) attributable to noncontrolling interests |
|
| 16 |
| 9 |
| (5) |
|
| 7 | 78 |
|
|
| 14 | 280 |
|
Shareholders’ net income |
| $ | 5,104 | $ | 2,637 | $ | 2,237 |
| $ | 2,467 | 94 | % |
| $ | 400 | 18 | % |
Consolidated effective tax rate |
|
| 22.1% |
| 26.1% |
| 38.1% |
|
| (400) | bps |
|
|
| (1,200) | bps |
|
Medical customers (in thousands) |
|
|
|
|
|
|
|
|
|
|
|
|
|
|
|
|
|
Integrated Medical |
|
| 15,548 |
| 15,389 |
| 14,828 |
|
| 159 | 1 | % |
|
| 561 | 4 | % |
International Markets |
| 1,597 |
| 1,572 |
| 1,549 |
|
| 25 | 2 |
|
|
| 23 | 1 |
| |
Total |
|
| 17,145 |
| 16,961 |
| 16,377 |
|
| 184 | 1 | % |
|
| 584 | 4 | % |
Reconciliation of Shareholders’ Net Income (GAAP) to Adjusted Income from Operations (non-GAAP): | |||||||||||||||
|
|
|
|
|
|
|
|
|
|
|
|
|
|
|
|
|
|
| Dollars in Millions |
| Diluted Earnings Per Share |
| |||||||||
|
| For the Years Ended December 31, |
| For the Years Ended December 31, |
| ||||||||||
|
| 2019 | 2018 | 2017 |
| 2019 | 2018 | 2017 |
| ||||||
Shareholders’ net income |
| $ | 5,104 | $ | 2,637 | $ | 2,237 |
| $ | 13.44 | $ | 10.54 | $ | 8.77 |
|
- Adjustment for transitioning clients |
|
| (1,316) |
| (47) |
| - |
|
| (3.46) |
| (0.19) |
| - |
|
- Net realized investment (gains) losses |
|
| (190) |
| 104 |
| (156) |
|
| (0.50) |
| 0.42 |
| (0.61) |
|
- Amortization of acquired intangible assets |
|
| 2,248 |
| 177 |
| 66 |
|
| 5.92 |
| 0.71 |
| 0.26 |
|
Special items |
|
|
|
|
|
|
|
|
|
|
|
|
|
|
|
- Integration and transaction-related costs |
|
| 427 |
| 669 |
| 33 |
|
| 1.11 |
| 2.67 |
| 0.13 |
|
- Charge for organizational efficiency plan |
|
| 162 |
| - |
| - |
|
| 0.43 |
| - |
| - |
|
- Charges associated with litigation matters |
|
| 41 |
| 19 |
| - |
|
| 0.11 |
| 0.08 |
| - |
|
- Charges (benefits) associated with U.S. tax reform |
|
| - |
| (2) |
| 196 |
|
| - |
| (0.01) |
| 0.77 |
|
- Debt extinguishment costs |
|
| - |
| - |
| 209 |
|
| - |
| - |
| 0.82 |
|
- Long-term care guaranty fund assessment |
|
| - |
| - |
| 83 |
|
| - |
| - |
| 0.32 |
|
Adjusted income from operations |
| $ | 6,476 | $ | 3,557 | $ | 2,668 |
| $ | 17.05 | $ | 14.22 | $ | 10.46 |
|
53
Commentary: 2019 versus 2018
Unless indicated otherwise, the commentary presented below, and in the segment discussions that follow, compare results for the year ended December 31, 2019 with results for the year ended December 31, 2018.
Earnings and Revenue
Shareholders’ net income increased, primarily driven by the earnings contribution from Express Scripts and improved results in the Integrated Medical segment partially offset by interest expense on debt issued to finance the Express Scripts acquisition. Earnings per share also increased, but at a significantly lower rate, reflecting dilution from the shares issued in connection with the Express Scripts acquisition.
Adjusted income from operations increased, primarily driven by earnings from Express Scripts’ pharmacy benefits and health management businesses reported in the Health Services segment and improved results in Integrated Medical. These favorable results were partially offset by higher interest expense reported in Corporate from both debt issued to finance the acquisition and debt assumed from Express Scripts. Adjusted income from operations per share also increased, but at a significantly lower rate, reflecting dilution from the shares issued to acquire Express Scripts.
Medical customers increased, primarily attributable to growth in the Select and Middle Market segments, partially offset by a decline in the National Accounts and Individual market segments.
Revenue growth primarily reflected the addition of Express Scripts and, to a lesser extent, business growth in the Integrated Medical segment. Detailed revenue items are discussed further below.
oPharmacy revenues in 2019 reflected the Express Scripts pharmacy benefit management business. In 2018, we reported pharmacy revenues from Express Scripts for the period following the acquisition on December 20, 2018. See the Health Services Segment section of this MD&A for further discussion of pharmacy revenues.
oPremiums increased, primarily resulting from: 1) customer growth across all segments, predominantly Integrated Medical 2) rate increases in Integrated Medical reflecting underlying medical cost trends and 3) the addition of Express Scripts’ Medicare Part D business.
oFees and other revenues increased primarily driven by contributions from Express Scripts’ health management business reported in the Health Services segment. Higher fees in our Integrated Medical segment primarily driven by growth in our specialty businesses also contributed to the increase.
oNet investment income decreased, primarily reflecting the absence of investment income earned in the fourth quarter of 2018 on debt proceeds used to acquire Express Scripts in December 2018.
Other Components of Consolidated Results of Operations
Pharmacy and other service costs. In 2019, this amount was primarily comprised of the Express Scripts’ pharmacy benefits and health management businesses reported in the Health Services segment. In 2018, we reported activity from Express Scripts for the period following the acquisition on December 20, 2018.
Medical costs and other benefit expenses increased, primarily due to medical cost inflation in Integrated Medical, customer growth in the insured business and the addition of Express Scripts’ Medicare Part D business.
Selling, general and administrative expenses increased, primarily due to the addition of Express Scripts and, to a lesser extent, volume-related expenses in Integrated Medical. These increases were partially offset by suspension of the health insurance industry tax in 2019.
Amortization of acquired intangible assets in 2019 primarily reflected the impact of the Express Scripts acquisition.
Interest expense and other increased significantly, primarily due to interest incurred on debt issued in the third quarter of 2018 to finance the Express Scripts acquisition and interest incurred on Express Scripts’ debt assumed upon closing of the acquisition.
Realized investment gains (losses). We reported realized investment gains in 2019, compared with losses in 2018. The improvement primarily resulted from gains on sales of real estate joint ventures, higher gains on sales of debt securities and favorable market value adjustments on equity securities.
54
The consolidated effective tax rate declined, primarily due to suspension of the nondeductible health insurance industry tax in 2019 and recognition of incremental state tax benefits in the second quarter of 2019.
Key Transactions and Business Developments
Merger with Express Scripts
As discussed in Note 4 to the Consolidated Financial Statements, Cigna acquired Express Scripts on December 20, 2018 in a cash and stock transaction valued at $52.8 billion. The “Liquidity” section of this MD&A provides further discussion of the impact of the acquisition on our liquidity and capital resources.
We continue to incur costs related to this transaction, including costs to integrate the Cigna and Express Scripts operations. These costs are being reported in “integration and transaction-related costs” as a special item and excluded from adjusted income from operations because they are not indicative of future underlying performance of the business.
On January 30, 2019, Anthem exercised its early termination right and terminated their pharmacy benefit management services agreement with us, effective March 1, 2019. There is a twelve-month transition period ending March 1, 2020. The transition of Anthem’s customers occurred at various dates, as informed by Anthem’s technology platform migration schedule. In 2019 and 2018, we excluded the results of Express Scripts’ contract with Anthem (and also Coventry) from our non-GAAP reporting metrics “adjusted revenues” and “adjusted income from operations” and referred to these clients as “transitioning clients.” As of December 31, 2019, the transition of customers was substantially complete; therefore, beginning in 2020, we will no longer exclude results of transitioning clients from our reported adjusted revenues and adjusted income from operations.
Agreement to sell Group Disability and Life business
As discussed in Note 5 to the Consolidated Financial Statements, in December 2019, Cigna entered into a definitive agreement to sell the Group Disability and Life business to New York Life Insurance Company for $6.3 billion. The “Liquidity” section of this MD&A provides further discussion of the impact of the pending divestiture on our liquidity and capital resources.
Organizational Efficiency Plan
As discussed in Note 15 to the Consolidated Financial Statements, during the fourth quarter of 2019 the Company committed to a plan to increase our organizational alignment and operational efficiency and reduce costs. As a result we recognized a charge in selling, general and administrative expenses of $207 million, pre-tax ($162 million, after-tax) in the fourth quarter of 2019. We expect to realize annualized after-tax savings of approximately $180 million. A substantial portion of the savings is expected to be realized in 2020.
55
Industry Developments and Other Matters
The “Business - Regulation” section of this Form 10-K provides a detailed description of The Patient Protection and Affordable Care Act (“ACA”) provisions and other legislative initiatives that impact our health care and pharmacy services businesses, including regulations issued by the Centers for Medicare & Medicaid Services (“CMS”) and the Departments of the Treasury and Health and Human Services (“HHS”). The health care and pharmacy services businesses continue to operate in a dynamic environment, and the laws and regulations applicable to these businesses, including the ACA, continue to be subject to legislative, regulatory and judicial challenges. The table presented below provides an update on the expected impact of these items and other matters as of December 31, 2019.
Item |
Description |
Medicare Advantage | Medicare Star Quality Ratings (“Star Ratings”): CMS uses a Star Rating system to measure how well Medicare Advantage (“MA”) plans perform, scoring how well plans perform in several categories, including quality of care and customer service. Star Ratings range from one to five stars. CMS recognizes plans with Star Ratings of four stars or greater with quality bonus payments and the ability to offer enhanced benefits. Approximately 73% of our MA customers were in four star or greater plans for bonus payments received in 2019. We expect this percentage to increase to 77% for bonus payments to be received in 2020 and 87% for bonus payments to be received in 2021. |
MA Rates: Final MA reimbursement rates for 2020 were published by CMS in April 2019. Preliminary MA reimbursement rates for 2021 were published by CMS in February 2020. We do not expect the new rates to have a material impact on our consolidated results of operations in 2020 and 2021.
Risk Adjustment: As discussed in the “Regulation” and “Risk Factors” sections of this Form 10-K, our MA business is subject to reviews, including risk adjustment data validation (“RADV”) audits by CMS and the Office of the Inspector General (“OIG”). We expect that CMS, OIG and other federal agencies will continue to closely scrutinize components of the Medicare program.
The “Regulation” section of this Form 10-K also discusses a proposed rule issued by CMS in 2018 for RADV audits of contract year 2011 and all subsequent years that included, among other things, extrapolation of the error rate related to RADV audit findings without applying the adjustment for underlying fee-for-service data errors as currently contemplated by CMS’s RADV audit methodology. RADV audits for our contract years 2011 through 2015 are currently in process. CMS has announced its intent to use third-party auditors to audit all Medicare Advantage contracts by either a comprehensive or a targeted RADV review for each contract year. If the proposed rule is adopted in its current form, it could result in some combination of degraded plan benefits, higher monthly premiums or reduced choice for the population served by all MA insurers. The Company, along with other MA organizations and additional interested parties, submitted comments to CMS on the proposed rule as part of the notice-and-comment rulemaking process. The comment period concluded on August 28, 2019. If CMS adopts the rule as proposed, there could be a material impact on the Company’s future results of operations, though we expect the rule would be subject to legal challenges.
In addition, the Company is subject to OIG RADV audits that are in process. The U.S. Department of Justice also is currently conducting an industry-wide investigation of risk adjustment data submission practices and business processes, as described in Note 22 to the Consolidated Financial Statements.
|
56
Item |
Description |
Health Insurance Industry Tax
| Health Insurance Industry Tax: Federal legislation suspended the health insurance industry tax for 2019 and our premium rates for 2019 reflect this suspension. We recorded $370 million in taxes related to the health insurance industry tax in 2018. Under current legislation, the industry tax is reinstated in 2020 and we expect to incur approximately $460 million for this tax in 2020. The reinstatement of the industry tax in 2020 is contemplated in our premium rates and benefits for the affected products and will increase our effective tax rate in 2020. In addition, as a result of the passage of the Further Consolidated Appropriations Act of 2020 in December 2019, the health insurance industry tax will be repealed effective 2021.
|
Public Health Exchanges | Market Participation: In 2019, we offered individual coverage on the public health insurance exchanges in Arizona, Colorado, Illinois, Missouri, North Carolina, Tennessee and Virginia. For 2020, we are expanding individual exchange offerings into Kansas, Utah and Florida, as well as new counties in Tennessee and Virginia. |
ACA Cost-Sharing Reduction Subsidies: The ACA provides for cost-sharing reductions that offset the amount that qualifying customers pay for deductibles, copays and coinsurance. The federal government stopped funding insurers for the cost-sharing reduction subsidies in 2017. Certain insurers have sued the federal government for failure to pay cost-sharing reduction subsidies and the matter remains unresolved. To date, judges in six of those actions have ruled in favor of the insurers, five of which are presently under appeal. The Court of Appeals for the Federal Circuit heard oral argument in the first set of consolidated appeals on January 9, 2020. We will continue to monitor developments. Our premium rates for the 2019 and 2020 plan years reflected a lack of government funding for cost-sharing reduction subsidies. | |
Affordable Care Act | As described in the “Business - Regulation” section of this Form 10-K, a federal district court ruled that the “individual mandate” in the ACA is unconstitutional. On appeal, the Court of Appeals for the Fifth Circuit agreed that the “individual mandate” is unconstitutional but ordered the district court to reexamine whether the other provisions of the ACA can remain in effect, thereby leaving in doubt whether the entire ACA is unconstitutional until there is a final judicial determination on appeal. The U.S. Supreme Court issued an order denying motions from the California-led states’ and the U.S. House of Representatives’ seeking fast-track review of the appellate court decision. The Supreme Court order is not a ruling on the parties’ petitions seeking the Supreme Court’s review of the case. Those petitions remain under consideration and are subject to briefing under the Supreme Court’s normal schedule. As a result, if the Supreme Court decides to review the case, it may not be able to hear and decide the case until its next term, which begins in October 2020. |
57
Risk Mitigation Programs – Individual ACA Business
In 2016, we recorded an allowance for the entire balance of our ACA risk corridor receivable based on court decisions and the large program deficit. During 2018, the U.S. Court of Appeals for the Federal Circuit ruled that health insurers are not entitled to receive amounts due under the risk corridor program that have been withheld by Congress. The plaintiffs petitioned the U.S. Supreme Court to review this unfavorable decision. During the second quarter of 2019, the U.S. Supreme Court agreed to review the unfavorable lower court rulings in the risk corridor cases, and heard oral arguments on December 10, 2019. We now await a decision, which is expected by June 2020. We continue to carry an allowance for the balance of our ACA risk corridor receivables of $109 million. No other significant updates occurred in 2019 related to the risk corridor legal matters.
Risk adjustment balances are subject to audit adjustment by CMS following each program year. In April 2019, CMS published the final Notice of Benefit and Payment Parameters for the 2020 plan year that clarified the 2017 benefit year RADV program. CMS released the 2017 benefit year data validation error rates in May and published the preliminary RADV transfers in August 2019. Based on the information currently available, we adjusted our risk adjustment balance to reflect the expected outcome of the RADV program.
The following table presents our balances associated with the risk adjustment program as of December 31, 2019 and December 31, 2018, inclusive of the RADV adjustments recorded in 2019.
|
| |||
|
| December 31, |
| December 31, |
(In millions) |
| 2019 |
| 2018 |
Risk Adjustment |
|
|
|
|
Receivables (1) | $ | 47 | $ | 32 |
Payables (2) |
| (213) |
| (187) |
Total risk adjustment balance | $ | (166) | $ | (155) |
|
|
|
|
|
(1) Receivables, net of allowances, are reported in accounts receivable in the Consolidated Balance Sheets. | ||||
(2) Payables are reported in accrued expenses and other liabilities (current) in the Consolidated Balance Sheets. | ||||
Charges for the ongoing risk adjustment program and RADV audit adjustments were $162 million pre-tax ($126 million after-tax) in 2019, $147 million pre-tax ($116 million after-tax) in 2018 and $162 million ($105 million after-tax) in 2017.
LIQUIDITY AND CAPITAL RESOURCES
(In millions) |
|
|
|
|
|
|
Financial Summary | 2019 | 2018 | 2017 | |||
Short-term investments | $ | 423 | $ | 316 | $ | 199 |
Cash and cash equivalents | $ | 4,619 | $ | 3,855 | $ | 2,972 |
Short-term debt | $ | 5,514 | $ | 2,955 | $ | 240 |
Long-term debt | $ | 31,893 | $ | 39,523 | $ | 5,199 |
Shareholders’ equity | $ | 45,338 | $ | 41,028 | $ | 13,711 |
Liquidity
We maintain liquidity at two levels: the subsidiary level and the parent company level.
Liquidity requirements at the subsidiary level generally consist of:
·medical costs, pharmacy and other benefit payments;
·expense requirements, primarily for employee compensation and benefits, information technology and facilities costs;
income taxes; and
debt service.
58
Our subsidiaries normally meet their liquidity requirements by:
·maintaining appropriate levels of cash, cash equivalents and short-term investments;
·using cash flows from operating activities;
matching investment durations to those estimated for the related insurance and contractholder liabilities;
selling investments; and
borrowing from affiliates, subject to applicable regulatory limits.
Liquidity requirements at the parent company level generally consist of:
·debt service and dividend payments to shareholders;
·lending to subsidiaries as needed; and
pension plan funding.
The parent company normally meets its liquidity requirements by:
·maintaining appropriate levels of cash and various types of marketable investments;
·collecting dividends from its subsidiaries;
·using proceeds from issuance of debt and common stock; and
borrowing from its subsidiaries, subject to applicable regulatory limits.
Dividends from our insurance, Health Maintenance Organization (“HMO”) and foreign subsidiaries are subject to regulatory restrictions. See Note 20 to the Consolidated Financial Statements for additional discussion of these restrictions. Most of Express Scripts’ subsidiaries provide significant financial flexibility to Cigna because they are not subject to regulatory restrictions on paying dividends.
Cash flows for the years ended December 31, were as follows
(In millions) |
| 2019 | 2018 | 2017 | |||
Net cash provided by operating activities |
| $ | 9,485 | $ | 3,770 | $ | 4,086 |
Net cash (used in) investing activities: |
|
|
|
|
|
|
|
Cash used to acquire Express Scripts, net of cash acquired |
|
| - |
| (24,062) |
| - |
Other acquisitions |
|
| (153) |
| (393) |
| (209) |
Net investment sales (purchases) |
|
| 480 |
| (1,383) |
| (1,023) |
Purchases of property and equipment and other |
|
| (1,061) |
| (540) |
| (471) |
Net investing activities |
|
| (734) |
| (26,378) |
| (1,703) |
Net cash (used in) provided by financing activities |
|
|
|
|
|
|
|
Debt (repayments) issuances |
|
| (5,175) |
| 24,212 |
| 98 |
Stock repurchase |
|
| (1,987) |
| (342) |
| (2,725) |
Other, net |
|
| (25) |
| (355) |
| (24) |
Net financing activities |
|
| (7,187) |
| 23,515 |
| (2,651) |
Foreign currency effect on cash |
|
| (8) |
| (24) |
| 55 |
Change in cash, cash equivalents and restricted cash (1) |
| $ | 1,556 | $ | 883 | $ | (213) |
| |||||||
(1) Includes restricted cash of $26 million reported in Other noncurrent assets and $23 million reported in Long-term investments as of December 31, 2019. | |||||||
The following discussion explains variances in the various categories of cash flows in 2019 compared with 2018.
Operating activities
Cash flows from operating activities consist principally of cash receipts and disbursements for pharmacy revenues and costs, premiums, fees, investment income, taxes, benefit costs and other expenses.
Cash flows from operating activities increased, primarily driven by higher net income adjusted for depreciation and amortization and the settlement timing of payables and accrued liabilities. These increases were partially offset by the timing of accounts receivable collections.
59
Investing and Financing activities
Our most significant investing and financing activities in 2018 related to acquiring Express Scripts. See Note 4 to the Consolidated Financial Statements for additional information on the acquisition. Cigna financed a portion of the acquisition in cash, primarily with debt financing as shown above and described more fully in Note 7 to the Consolidated Financial Statements, with the remaining required cash coming from cash on hand. In 2018, Cigna also acquired OnePath Life for approximately $480 million, largely with cash held in our foreign operations.
Cash used for investing activities decreased, primarily due to the absence of cash paid to acquire Express Scripts in 2018 and lower net investment purchases, partially offset by higher property and equipment purchases.
Cash used for financing activities increased, primarily due to the absence of the Express Scripts acquisition debt financing activities in 2018, higher repayments of long-term debt and share repurchases.
We maintain a share repurchase program authorized by our Board of Directors. Under this program, we may repurchase shares from time to time, depending on market conditions and alternate uses of capital. The timing and actual number of shares repurchased will depend on a variety of factors including price, general business and market conditions and alternate uses of capital. The share repurchase program may be effected through open market purchases or privately negotiated transactions in compliance with Rule 10b-18 under the Securities Exchange Act of 1934, as amended, including through Rule 10b5-1 trading plans. The program may be suspended or discontinued at any time.
In 2019, we repurchased 11.8 million shares for approximately $2.0 billion. From January 1, 2020 through February 26, 2020 we repurchased 2.0 million shares for approximately $425 million. Share repurchase authority was $3.5 billion as of February 26, 2020.
Capital Resources
Our capital resources (primarily cash flows from operating activities and proceeds from the issuance of debt and equity securities) provide protection for policyholders, furnish the financial strength to underwrite insurance risks and facilitate continued business growth.
Our acquisition of Express Scripts increased our debt and shareholders’ equity in 2018 as follows:
Stock. Express Scripts’ shareholders received 0.2434 of a share of common stock of Cigna for every one share of Express Scripts’ common stock. Cigna issued 137.6 million additional shares to Express Scripts’ shareholders.
Debt. See Note 7 to the Consolidated Financial Statements for further description of the debt issued to finance the acquisition.
Assumption of Express Scripts’ Senior Notes. See Note 7 to the Consolidated Financial Statements for further description of the notes assumed in the acquisition of Express Scripts.
At December 31, 2019, our debt-to-capitalization ratio was 45.2%, a decline from 50.9% at December 31, 2018. We have a near-term focus on accelerated debt repayment and expect to continue to deleverage into the upper 30%s by the end of 2020 using cash flows from operating activities.
In December 2019, Cigna entered into a definitive agreement to sell the Group Disability and Life business to New York Life Insurance Company for $6.3 billion. The sale is expected to close by the third quarter of 2020 subject to applicable regulatory approvals and other customary closing conditions. Cigna estimates to receive approximately $5.3 billion of net after-tax proceeds from this transaction and expects to use these proceeds for share repurchase and repayment of debt in 2020.
In 2018, Cigna entered into a new Revolving Credit Agreement and Term Loan Credit Agreement in financing the Express Scripts acquisition. Cigna had $10 million of letters of credit outstanding under the Revolving Credit Agreement as of December 31, 2019. In 2019, Cigna entered into an additional 364-day revolving credit agreement that matures in October 2020. See Note 7 to the Consolidated Financial Statements for further information on our revolving credit agreements.
Management, guided by regulatory requirements and rating agency capital guidelines, determines the amount of capital resources that we maintain. Management allocates resources to new long-term business commitments when returns, considering the risks, look promising and when the resources available to support existing business are adequate.
60
We prioritize our use of capital resources to:
provide the capital necessary to support growth and maintain or improve the financial strength ratings of subsidiaries and to fund pension obligations;
consider acquisitions that are strategically and economically advantageous; and
return capital to investors primarily through share repurchases.
Our capital management strategy to support the liquidity and regulatory capital requirements of our foreign operations and certain international growth initiatives is to retain overseas a significant portion of the earnings generated by our foreign operations. This strategy does not materially limit our ability to meet our liquidity and capital needs in the United States.
Liquidity and Capital Resources Outlook
We maintain sufficient liquidity to meet our cash needs through our cash and cash equivalents balances, cash flows from operations, commercial paper program, credit agreements, and the issuance of long-term debt. As of December 31, 2019, we had approximately $5 billion in cash and short-term investments, approximately $1.1 billion of which was held by the parent company or nonregulated subsidiaries. We actively monitor our debt obligations and engage in issuance or redemption activities as needed in accordance with our capital management strategy. A description of our outstanding debt can be found in Note 7 to the Consolidated Financial Statements.
As of December 31, 2019, our unfunded pension liability was $873 million, reflecting an increase of $ 283 million from December 31, 2018, primarily attributable to a decrease in discount rates of approximately 90 basis points and an update to mortality assumptions. We currently expect 2020 and 2021 required contributions to be immaterial. See Note 16 to the Consolidated Financial Statements for additional information regarding our pension plans.
Our cash projections may not be realized and the demand for funds could exceed available cash if our ongoing businesses experience unexpected shortfalls in earnings or we experience material adverse effects from one or more risks or uncertainties described more fully in the Risk Factors section in this Form 10-K. Though we believe we have adequate sources of liquidity, significant disruption or volatility in the capital and credit markets could increase costs or affect our ability to access those markets for additional borrowings. In addition to the sources of liquidity discussed above, the parent company can borrow an additional $1.0 billion from its insurance subsidiaries without further state approval.
Guarantees and Contractual Obligations
We are contingently liable for various contractual obligations entered into in the ordinary course of business. See the “Liquidity and Capital Resources” section of this MD&A for additional background on how we manage our liquidity requirements related to these obligations. The maturities of our primary contractual cash obligations are as follows as of December 31, 2019:
|
|
|
| Less than 1 |
| 1-3 |
| 4-5 |
| After 5 |
(In millions, on an undiscounted basis) |
| Total |
| year |
| years |
| years |
| years |
On-Balance Sheet |
|
|
|
|
|
|
|
|
|
|
Insurance liabilities |
|
|
|
|
|
|
|
|
|
|
Contractholder deposit funds | $ | 6,608 | $ | 516 | $ | 730 | $ | 598 | $ | 4,764 |
Future policy benefits |
| 11,552 |
| 553 |
| 1,046 |
| 1,012 |
| 8,941 |
Health Care Medical claims payable |
| 2,741 |
| 2,741 |
|
|
|
|
|
|
Unpaid claims and claim expenses |
| 6,777 |
| 2,591 |
| 1,211 |
| 782 |
| 2,193 |
Long-term debt |
| 52,261 |
| 6,025 |
| 9,104 |
| 7,893 |
| 29,239 |
Other noncurrent liabilities |
| 575 |
| 149 |
| 89 |
| 91 |
| 246 |
Operating leases |
| 695 |
| 177 |
| 292 |
| 152 |
| 74 |
Off-Balance Sheet |
|
|
|
|
|
|
|
|
|
|
Purchase obligations |
| 2,858 |
| 1,093 |
| 1,295 |
| 334 |
| 136 |
|
|
|
|
|
|
|
|
|
|
|
Total | $ | 84,067 | $ | 13,845 | $ | 13,767 | $ | 10,862 | $ | 45,593 |
| ||||||||||
The table above includes commitments associated with the Group Disability and Life business.
| ||||||||||
61
On balance sheet:
Insurance liabilities. Excluded from the table above are $4 billion of insurance liabilities ($3 billion in contractholder deposit funds; $1 billion in future policy benefits) associated with the sold retirement benefits and individual life insurance and annuity businesses, as well as the reinsured workers’ compensation, personal accident and supplemental benefits businesses as their related net cash flows are not expected to impact our cash flows. Excluding these amounts, the sum of the obligations presented above exceeds the corresponding insurance and contractholder liabilities of $23 billion recorded on the balance sheet (including $6 billion reported in liabilities held for sale) because some of the recorded insurance liabilities reflect discounting for interest and the recorded contractholder liabilities exclude future interest crediting, charges and fees. The timing and amount of actual future cash flows may differ from those presented above.
oContractholder deposit funds: see Note 9 to the Consolidated Financial Statements for our accounting policy for this liability. Expected future cash flows presented above also include estimated future interest crediting on current fund balances based on current investment yields less the estimated cost of insurance charges and mortality and administrative fees for universal life policies.
oFuture policy benefits and unpaid claims and claim expenses: see Note 9 to the Consolidated Financial Statements for our accounting policies for these liabilities. Expected future cash flows for these liabilities presented in the table above are undiscounted. The expected future cash flows for guaranteed minimum death benefit (“GMDB,” reported in future policy benefits) do not consider any of the related reinsurance arrangements.
Long-term debt includes scheduled interest payments and current maturities of long-term debt. See Note 7 to the Consolidated Financial Statements for information regarding long-term debt. Finance leases are included in long-term debt and primarily represent obligations for information technology network storage, servers and equipment. See Note 19 to the Consolidated Financial Statements for information regarding finance leases.
Operating leases: See Note 19 to the Consolidated Financial Statements for additional information.
Other noncurrent liabilities include estimated payments for guaranteed minimum income benefit (“GMIB”) contracts (without considering any related reinsurance arrangements), pension and other postretirement and postemployment benefit obligations, supplemental and deferred compensation plans, interest rate and foreign currency swap contracts and reinsurance liabilities. Estimated payments of $91 million for deferred compensation, non-qualified and international pension plans and other postretirement and postemployment benefit plans are expected to be paid in less than one year and are included in the table above. We expect to make immaterial contributions to the qualified domestic pension plans during 2020 and they are reflected in the above table. We expect to make payments subsequent to 2020 for these obligations; however, subsequent payments have been excluded from the table as their timing is based on plan assumptions that may materially differ from actual activities. See Note 16 to the Consolidated Financial Statements for further information on pension obligations.
The table above excludes the liabilities for uncertain tax positions because we cannot reasonably estimate the timing of such future payments. In the event we are unable to sustain all of our $1 billion of uncertain tax positions it could result in future tax payments of approximately $760 million. See Note 21 to the Consolidated Financial Statements for additional information on uncertain tax positions.
Off-Balance Sheet:
Purchase obligations. As of December 31, 2019, purchase obligations consisted of estimated payments required under contractual arrangements for future services and investment commitments as follows:
(In millions) |
| |
Debt Securities | $ | 98 |
Commercial mortgage loans |
| 10 |
Limited liability entities (other long-term investments) (1) |
| 1,954 |
Total investment commitments |
| 2,062 |
Future service commitments |
| 796 |
Total purchase obligations | $ | 2,858 |
(1) See Note 11 to the Consolidated Financial Statements for additional information. |
|
|
62
Our estimated future service commitments primarily represent contracts for certain outsourced business processes and information technology maintenance and support. We generally have the ability to terminate these agreements, but do not anticipate doing so at this time. Purchase obligations exclude contracts that are cancelable without penalty and those that do not contractually require minimum levels of goods or services to be purchased.
Guarantees
We are contingently liable for various financial and other guarantees provided in the ordinary course of business. See Note 22 to the Consolidated Financial Statements for additional information on guarantees.
CRITICAL ACCOUNTING ESTIMATES
The preparation of Consolidated Financial Statements in accordance with GAAP requires management to make estimates and assumptions that affect reported amounts and related disclosures in the Consolidated Financial Statements. Management considers an accounting estimate to be critical if:
it requires assumptions to be made that were uncertain at the time the estimate was made; and
changes in the estimate or different estimates that could have been selected could have a material effect on our consolidated results of operations or financial condition.
Management has discussed how critical accounting estimates are developed and selected with the Audit Committee of our Board of Directors and the Audit Committee has reviewed the disclosures presented below. We regularly evaluate items that may impact critical accounting estimates.
In addition to the estimates presented in the following tables, there are other accounting estimates used in preparing our Consolidated Financial Statements, including estimates of liabilities for future policy benefits, as well as estimates with respect to pension and postretirement benefits other than pensions and certain compensation accruals.
Management believes the current assumptions used to estimate amounts reflected in our Consolidated Financial Statements are appropriate. However, if actual experience significantly differs from the assumptions used in estimating amounts reflected in our Consolidated Financial Statements, the resulting changes could have a material adverse effect on our consolidated results of operations and in certain situations, could have a material adverse effect on liquidity and our financial condition. The tables below present the adverse impacts of certain possible changes in assumptions. The effect of assumption changes in the opposite direction would be a positive impact to our consolidated results of operations, liquidity or financial condition, except for assessing impairment of goodwill and debt securities carried at fair value below cost.
63
Balance Sheet Caption / Nature of Critical Accounting Estimate | Effect if Different Assumptions Used |
Goodwill and other intangible assets
Goodwill represents the excess of the cost of businesses acquired over the fair value of their net assets at the acquisition date. Intangible assets primarily reflect the value of customer relationships and other intangibles acquired in business combinations.
Fair values of reporting units are estimated using models and assumptions that we believe a hypothetical market participant would use to determine a current transaction price. The significant assumptions and estimates used in determining fair value include the discount rate and future cash flows. A discount rate is selected to correspond with each reporting unit’s weighted average cost of capital, consistent with that used for investment decisions considering the specific and detailed operating plans and strategies within each reporting unit. Projections of future cash flows for each reporting unit are consistent with our annual planning process for revenues, pharmacy costs, benefits expenses, operating expenses, taxes, capital levels and long-term growth rates. In addition to these assumptions, we consider market data to evaluate the fair value of each reporting unit. The fair value of intangibles and the amortization method were determined using an income approach that relies on projected future cash flows including key assumptions for customer attrition and discount rates. Management revises amortization periods if it believes there has been a change in the length of time that an intangible asset will continue to have value.
We completed our normal annual evaluations for impairment of goodwill and intangible assets during the third quarter of 2019. The evaluations indicated that the fair value estimates of our reporting units exceed their carrying values by sufficient margins and no impairments were required.
Goodwill and other intangibles as of December 31 were as follows (in millions):
2019 – Goodwill $44,602; Other intangible assets $36,562 2018 – Goodwill $44,505; Other intangible assets $39,003
See Note 18 to the Consolidated Financial Statements for additional discussion of our goodwill and other intangible assets.
|
If we do not achieve our earnings and cash flow projections or our cost of capital rises significantly, the assumptions and estimates underlying the goodwill and intangible asset impairment evaluations could be adversely affected and result in future impairment charges that would negatively impact our operating results and financial position.
Specific to the Government reporting unit, future changes in the funding for our Medicare programs by the federal government could materially reduce revenues and profitability and have a significant impact on its fair value.
|
Balance Sheet Caption / Nature of Critical Accounting Estimate | Effect if Different Assumptions Used |
Income taxes – uncertain tax positions
We evaluate tax positions to determine whether the benefits are more likely than not to be sustained on audit based on their technical merits. If not, we establish a liability for unrecognized tax benefits. These amounts primarily relate to federal and state uncertain positions of the value and timing of deductions and uncertain positions of attributing taxable income to states. Balances that are included in the Consolidated Balance Sheets are as follows:
2019 – $1.0 billion 2018 – $928 million
See Note 21 to the Consolidated Financial Statements for additional discussion around uncertain tax positions and the Liquidity and Capital Resources section of this MD&A for a discussion of their potential impact on liquidity.
|
The factors that could impact our estimates of uncertain tax positions include the likelihood of being sustained upon audit based on the technical merits of the tax position and related assumed interest and penalties. If our positions are upheld upon audit, our net income would increase. |
64
Balance Sheet Caption / Nature of Critical Accounting Estimate | Effect if Different Assumptions Used |
Unpaid claims and claim expenses – Integrated Medical
Unpaid claims and claim expenses include both reported claims and estimates for losses incurred but not yet reported.
Unpaid claims and claim expenses in Integrated Medical are primarily impacted by assumptions related to completion factors and medical cost trend. Variation of actual results from either assumption could impact the unpaid claims balance as noted below. A large number of factors may cause the medical cost trend to vary from the Company’s estimates, including: changes in health management practices, changes in the level and mix of benefits offered and services utilized, and changes in medical practices. Completion factors may be affected if actual claims submission rates from providers differ from estimates (that can be influenced by a number of factors, including provider mix and electronic versus manual submissions), or if changes to the Company’s internal claims processing patterns occur.
Unpaid claims and claim expenses for the Integrated Medical segment as of December 31 were as follows (in millions):
2019 – gross $2,892; net $2,589 2018 – gross $2,697; net $2,433
These liabilities are presented above both gross and net of reinsurance and other recoverables.
See Note 9 to the Consolidated Financial Statements for additional information regarding assumptions and methods used to estimate this liability.
|
Based on studies of our claim experience, it is reasonably possible that a 100 basis point change in the medical cost trend and a 50 basis point change in completion factors could occur in the near term.
A 100 basis point increase in the medical cost trend rate would increase this liability by approximately $40 million, resulting in a decrease in net income of approximately $35 million after-tax, and a 50 basis point decrease in completion factors would increase this liability by approximately $85 million, resulting in a decrease in net income of approximately $70 million after-tax. |
Balance Sheet Caption / Nature of Critical Accounting Estimate | Effect if Different Assumptions Used |
Unpaid claims and claim expenses – long-term disability reserves
The liability for long-term disability reserves is the present value of estimated future benefits payments over the expected disability period and includes estimates for both reported claims and for claims incurred but not yet reported.
Key assumptions in the calculation of long-term disability reserves include the discount rate and claim resolution rates, both of which are reviewed annually and updated when experience or future expectations would indicate a necessary change. The discount rate is the interest rate used to discount the projected future benefit payments to their present value. The discount rate assumption is based on the projected investment yield of the assets supporting the reserves. Claim resolution rate assumptions involve many factors including claimant demographics, the type of contractual benefit provided and the time since initially becoming disabled. The Company uses its own historical experience to develop its claim resolution rates.
Long-term disability reserves as of December 31 were as follows (in millions):
2019 – gross $4,308; net $4,191 2018 – gross $4,069; net $3,975
These liabilities are presented above both gross and net of reinsurance recoverables and are included in liabilities held for sale in the Consolidated Balance Sheet.
See Note 9C. to the Consolidated Financial Statements for additional information regarding assumptions and methods used to estimate this liability.
|
Based on recent and historical resolution rate patterns and changes in investment portfolio yields, it is reasonably possible that a five percent change in claim resolution rates and a 25 basis point change in the discount rate could occur.
A five percent decrease in the claim resolution rate would increase long-term disability reserves by approximately $95 million and decrease net income by approximately $75 million after-tax.
A 25 basis point decrease in the discount rate would increase long-term disability reserves by approximately $45 million and decrease net income by approximately $35 million after-tax.
|
65
|
|
|
|
Balance Sheet Caption / Nature of Critical Accounting Estimate | Effect if Different Assumptions Used |
Valuation of debt security investments
Most debt securities are classified as available for sale and are carried at fair value with changes in fair value recorded in accumulated other comprehensive income (loss) within shareholders’ equity.
Fair value is defined as the price at which an asset could be exchanged in an orderly transaction between market participants at the balance sheet date.
Determining fair value for a financial instrument requires management judgment. The degree of judgment involved generally correlates to the level of pricing readily observable in the markets. Financial instruments with quoted prices in active markets or with market observable inputs to determine fair value, such as public securities, generally require less judgment. Conversely, private placements including more complex securities that are traded infrequently are typically measured using pricing models that require more judgment as to the inputs and assumptions used to estimate fair value. There may be a number of alternative inputs to select based on an understanding of the issuer, the structure of the security and overall market conditions. In addition, these factors are inherently variable in nature as they change frequently in response to market conditions. Approximately two-thirds of our debt securities are public securities, and one-third are private placement securities.
Typically, the most significant input in the measurement of fair value is the market interest rate used to discount the estimated future cash flows of the instrument. Such market rates are derived by calculating the appropriate spreads over comparable U.S. Treasury securities, based on the credit quality, industry and structure of the asset.
See Notes 11A. and 12 to the Consolidated Financial Statements for a discussion of our fair value measurements, the procedures performed by management to determine that the amounts represent appropriate estimates and our accounting policy regarding unrealized appreciation on debt securities.
|
If the derived interest rates used to calculate fair value increased by 100 basis points, the fair value of the total debt security portfolio of $24 billion would decrease by approximately $1.5 billion, resulting in an after-tax decrease to shareholders’ equity of approximately $0.9 billion. |
|
|
Balance Sheet Caption / Nature of Critical Accounting Estimate | Effect if Different Assumptions Used |
Assessment of “other-than-temporary” impairments on debt securities
Certain debt securities with a fair value below amortized cost are carried at fair value with changes in fair value recorded in accumulated other comprehensive income. For these investments, we have determined that the decline in fair value below its amortized cost is temporary. To make this determination, we evaluate the expected recovery in value and our intent to sell or the likelihood of a required sale of the debt security prior to an expected recovery. In making this evaluation, we consider a number of general and specific factors including the regulatory, economic and market environments, length of time and severity of the decline, and the financial health and specific near term prospects of the issuer.
The after-tax amounts as of December 31 in accumulated other comprehensive income for debt securities in an unrealized loss position were as follows (in millions):
2019 – ($25) 2018 – ($370)
See Note 11 to the Consolidated Financial Statements for additional discussion of our review of declines in fair value, including information regarding our accounting policies for debt securities.
|
If we subsequently determine that the excess of amortized cost over fair value is other-than-temporary for any or all of these debt securities, the amount recorded in accumulated other comprehensive income would be reclassified to shareholders’ net income as an impairment loss.
|
|
|
66
SEGMENT REPORTING
The following section of this MD&A discusses the results of each of our segments. See Note 1 to the Consolidated Financial Statements for a description of our segments.
In segment discussions, we present adjusted revenues and “pre-tax adjusted income from operations,” defined as income before taxes excluding realized investment gains (losses), amortization of acquired intangible assets, results of transitioning clients, (income) loss attributable to noncontrolling interests and special items. Ratios presented in this segment discussion exclude the same items as pre-tax adjusted income from operations. See Note 23 to the Consolidated Financial Statements for additional discussion of these metrics and a reconciliation of income before income taxes to pre-tax adjusted income from operations, as well as a reconciliation of total revenues to adjusted revenues. Note 23 to the Consolidated Financial Statements also explains two additional items that are important in understanding our segment results: 1) segment revenues include both external revenues and sales between segments that are eliminated in Corporate and 2) beginning in the first quarter of 2019, compensation cost for stock options is recorded by the segments. Prior year segment information was not restated for this change in stock option reporting.
In these segment discussions, we also present “pre-tax adjusted margin,” defined as pre-tax adjusted income from operations divided by adjusted revenues.
See the MD&A Executive Overview for summarized financial results of each of our segments.
Health Services Segment
The Health Services segment includes pharmacy benefits management, specialty pharmacy services, clinical solutions, home delivery and health management services. This segment includes Express Scripts’ business from the December 20, 2018 date of acquisition except for Express Scripts’ Medicare Part D business that is reported in the Government operating segment of our Integrated Medical segment. This segment also includes Cigna’s legacy home delivery pharmacy business. Due to the timing of the acquisition, results of operations in 2018 only included results from the Express Scripts’ business for the period following the acquisition on December 20, 2018. The main driver of period over period increases in the financial information presented below was the results from the Express Scripts’ business in 2019. As described in the introduction to Segment Reporting, performance of the Health Services segment is measured using pre-tax adjusted income from operations.
The key factors that impact Health Services revenues and costs of revenues are volume, mix and price. These key factors are discussed further below. See Note 2 to the Consolidated Financial Statements for additional information on revenue and cost recognition policies for this segment.
As our clients’ claim volumes increase or decrease, our resulting revenues and cost of revenues correspondingly increase or decrease. Our gross profit could also increase or decrease as a result of changes in purchasing discounts.
The mix of claims generally considers the type of drug and distribution method used for dispensing and fulfilling. As our mix of drugs changes, our resulting pharmacy revenues and cost of revenues correspondingly may increase or decrease. The primary driver of fluctuations within our mix of claims is the generic fill rate. Generally, higher generic fill rates reduce revenues, as generic drugs are typically priced lower than the branded drugs they replace. However, as ingredient cost paid to pharmacies on generic drugs is incrementally lower than the price charged to our clients, higher generic fill rates generally have a favorable impact on our gross profit. The home delivery generic fill rate is currently lower than the network generic fill rate as fewer generic substitutions are available among maintenance medications (such as therapies for chronic conditions) commonly dispensed from home delivery pharmacies as compared to acute medications that are primarily dispensed by pharmacies in our retail networks.
Our client contract pricing is impacted by our ability to negotiate supply chain contracts for pharmacy network, pharmaceutical and wholesaler purchasing and manufacturer rebates. As we seek to improve the effectiveness of our integrated solutions for the benefit of our clients, we are continuously innovating and optimizing the supply chain. Our gross profit could also increase or decrease as a result of supply chain initiatives implemented. Inflation also impacts our pricing because most of our contracts provide that we bill clients and pay pharmacies based on a generally recognized price index for pharmaceuticals. Therefore, the rate of inflation for prescription drugs and our efforts to manage this inflation for our clients can affect our revenues and cost of revenues.
In this MD&A, we present revenues and gross profit “excluding transitioning clients” in addition to those metrics including transitioning clients. Pre-tax adjusted income from operations and pre-tax adjusted margin exclude contributions from transitioning
67
clients. See the “Key Transactions and Business Developments” section of this MD&A for further discussion of transitioning clients and why we present this information.
Results of Operations
Financial Summary |
| For the Years Ended December 31, |
| Change Favorable (Unfavorable) |
| Change Favorable (Unfavorable) | |||||||||||
(In millions) |
| 2019 | 2018 | 2017 |
| 2019 vs. 2018 |
| 2018 vs. 2017 | |||||||||
Total revenues |
| $ | 109,794 | $ | 7,065 | $ | 4,241 |
| $ | 102,729 | N/M | % |
| $ | 2,824 | 67 | % |
Less: revenue contributions from transitioning clients |
|
| (13,347) |
| (459) |
| - |
|
| (12,888) | N/M |
|
|
| (459) | N/M |
|
Adjusted revenues |
| $ | 96,447 | $ | 6,606 | $ | 4,241 |
| $ | 89,841 | N/M |
|
| $ | 2,365 | 56 |
|
Gross profit |
| $ | 8,908 | $ | 604 | $ | 371 |
| $ | 8,304 | N/M |
|
| $ | 233 | 63 |
|
Gross profit excluding transitioning clients |
| $ | 6,984 | $ | 531 | $ | 371 |
| $ | 6,453 | N/M |
|
| $ | 160 | 43 |
|
Pre-tax adjusted income from operations |
| $ | 5,092 | $ | 380 | $ | 288 |
| $ | 4,712 | N/M | % |
| $ | 92 | 32 | % |
Pre-tax adjusted margin |
|
| 5.3 | % | 5.8 | % | 6.8 | % |
| (50) | bps |
|
|
| (100) | bps |
|
|
|
|
| Year Ended December 31, |
(Dollars and adjusted scripts in millions) |
|
|
| 2019 |
Selected Financial Information(1) |
|
|
|
|
Pharmacy revenue by distribution channel |
|
|
|
|
Network revenues |
|
| $ | 41,483 |
Home delivery and specialty revenues |
|
|
| 45,836 |
Other revenues |
|
|
| 4,900 |
Total pharmacy revenues |
|
| $ | 92,219 |
Pharmacy script volume |
|
|
|
|
Adjusted network scripts(2) |
|
|
| 941 |
Adjusted home delivery and specialty scripts(2) |
|
|
| 283 |
Total adjusted scripts(2) |
|
|
| 1,224 |
Generic fill rate |
|
|
|
|
Network |
|
|
| 87.1% |
Home delivery |
|
|
| 84.3% |
Overall generic fill rate |
|
|
| 86.8% |
(1)Amounts exclude contributions from transitioning clients.
(2)Non-specialty network scripts filled through 90-day programs and home delivery scripts are multiplied by three. All other network and specialty scripts are counted as one script.
2019 versus 2018
This segment includes Express Scripts’ business from the date of acquisition by the Company on December 20, 2018 with the exception of Express Scripts’ Medicare Part D business that is reported in the Government operating segment. In the third quarter of 2019, Integrated Medical’s Commercial customers transitioned to Express Scripts’ retail pharmacy network. Results of operations for 2018 reflected the results for the period following the acquisition of Express Scripts on December 20, 2018 along with the legacy Cigna home delivery business.
Adjusted revenues. The increase reflected a full year of results from the Express Scripts’ business in 2019. Adjusted revenues in 2019 for the Health Services segment reflected strong performance, including customer growth, adjusted pharmacy scripts volume, specialty pharmacy care and management of supply chain.
Pre-tax adjusted income from operations. The increase reflected a full year of results from the Express Scripts’ business in 2019. Results in the Health Services segment in 2019 reflected strong performance, including customer growth, adjusted pharmacy scripts volumes and benefits from the effective management of the supply chain.
68
Integrated Medical Segment
The business section of this Form 10-K (see the “Integrated Medical” section) describes the various products and funding solutions offered by this segment, including the various revenue sources. As described in the introduction to Segment Reporting, performance of the Integrated Medical segment is measured using pre-tax adjusted income from operations. Key factors affecting profitability for this segment include:
customer growth;
revenues from integrated specialty products, including pharmacy services sold to clients and customers across all funding solutions;
percentage of Medicare Advantage customers in plans eligible for quality bonus payments;
benefit expenses as a percentage of premiums (medical care ratio or “MCR”) for our insured commercial and government businesses; and
selling, general and administrative expense as a percentage of adjusted revenues (expense ratio).
Results of Operations
Financial Summary |
| For the Years Ended December 31, |
| Change Favorable (Unfavorable) |
| Change Favorable (Unfavorable) | |||||||||||
(In millions) |
| 2019 | 2018 | 2017 |
| 2019 vs. 2018 |
| 2018 vs. 2017 | |||||||||
Adjusted revenues |
| $ | 36,519 | $ | 32,791 | $ | 29,035 |
| $ | 3,728 | 11 | % |
| $ | 3,756 | 13 | % |
Pre-tax adjusted income from operations |
| $ | 3,831 | $ | 3,502 | $ | 2,922 |
| $ | 329 | 9 | % |
| $ | 580 | 20 | % |
Pre-tax adjusted margin |
|
| 10.5 | % | 10.7 | % | 10.1 | % |
| (20) | bps |
|
|
| 60 | bps |
|
Medical care ratio |
|
| 80.8 | % | 78.9 | % | 81.0 | % |
| (190) | bps |
|
|
| 210 | bps |
|
Expense ratio |
|
| 22.9 | % | 24.7 | % | 24.1 | % |
| 180 | bps |
|
|
| (60) | bps |
|
|
|
|
|
|
|
|
|
|
|
|
|
|
|
|
|
|
|
|
| As of December 31, |
| Increase (Decrease) |
| Increase (Decrease) | |||||||||||
(Dollars in millions, customers in thousands) |
| 2019 | 2018 | 2017 |
| 2019 vs. 2018 |
| 2018 vs. 2017 | |||||||||
Unpaid claims and claim expenses – Integrated Medical |
| $ | 2,892 | $ | 2,697 | $ | 2,420 |
| $ | 195 | 7 | % |
| $ | 277 | 11 | % |
Integrated Medical Customers |
|
|
|
|
|
|
|
|
|
|
|
|
|
|
|
|
|
Commercial |
|
| 2,114 |
| 1,911 |
| 1,792 |
|
| 203 | 11 | % |
|
| 119 | 7 | % |
Government |
|
| 1,361 |
| 1,407 |
| 1,235 |
|
| (46) | (3) | % |
|
| 172 | 14 | % |
Insured |
|
| 3,475 |
| 3,318 |
| 3,027 |
|
| 157 | 5 | % |
|
| 291 | 10 | % |
Service |
|
| 12,073 |
| 12,071 |
| 11,801 |
|
| 2 | - | % |
|
| 270 | 2 | % |
Total |
|
| 15,548 |
| 15,389 |
| 14,828 |
|
| 159 | 1 | % |
|
| 561 | 4 | % |
|
|
|
|
|
|
|
|
|
|
|
|
|
|
|
|
|
|
2019 versus 2018
Adjusted revenues. The increase reflected Commercial customer growth in our insured business as well as higher premium rates due to underlying medical cost trend and the addition of Express Scripts’ Medicare Part D business.
Pre-tax adjusted income from operations. The increase reflected strong ongoing performance in our Commercial segment, including increased contributions from our commercial health insurance business and specialty products, partially offset by lower margins in our Individual business.
Medical care ratio. As expected, the medical care ratio increased, reflecting a reduction in premiums from the pricing impact of the suspension of the health insurance industry tax in 2019 and business mix related to the addition of Express Scripts’ Medicare Part D business, as well as a higher Individual medical care ratio.
Expense ratio. The expense ratio decreased primarily reflecting higher revenues in our insurance business and the suspension of the health insurance industry tax in 2019.
69
Other Items Affecting Integrated Medical Results
Unpaid Claims and Claim Expenses
Our unpaid claims and claim expenses liability was higher as of December 31, 2019 compared with December 31, 2018, primarily due to customer growth.
Medical Customers
Our medical customer base was higher at December 31, 2019 compared with the same period in 2018, primarily reflecting growth in our Select and Middle Market segments partially offset by a lower customer base in our National Accounts and Individual market segments.
A medical customer is defined as a person meeting any one of the following criteria:
is covered under a medical insurance policy, managed care arrangement or service agreement issued by us;
has access to our provider network for covered services under their medical plan; or
has medical claims that are administered by us.
International Markets Segment
As described in the introduction to Segment Reporting, performance of the International Markets segment is measured using pre-tax adjusted income from operations. Key factors affecting pre-tax adjusted income from operations for this segment are:
premium growth, including new business and customer retention;
benefit expenses as a percentage of premiums (loss ratio);
selling, general and administrative expense and acquisition expense as a percentage of revenues (expense ratio and acquisition cost ratio); and
the impact of foreign currency movements.
Results of Operations
Financial Summary |
| For the Years Ended December 31, |
| Change Favorable (Unfavorable) |
| Change Favorable (Unfavorable) | |||||||||||
(In millions) |
| 2019 | 2018 | 2017 |
| 2019 vs. 2018 |
| 2018 vs. 2017 | |||||||||
Adjusted revenues |
| $ | 5,615 | $ | 5,366 | $ | 4,901 |
| $ | 249 | 5 | % |
| $ | 465 | 9 | % |
Pre-tax adjusted income from operations |
| $ | 762 | $ | 735 | $ | 654 |
| $ | 27 | 4 | % |
| $ | 81 | 12 | % |
Pre-tax adjusted margin |
|
| 13.6 | % | 13.7 | % | 13.3 | % |
| (10) | bps |
|
|
| 40 | bps |
|
Loss ratio |
|
| 57.3 | % | 57.4 | % | 57.5 | % |
| 10 | bps |
|
|
| 10 | bps |
|
Acquisition cost ratio |
|
| 12.9 | % | 13.1 | % | 12.8 | % |
| 20 | bps |
|
|
| (30) | bps |
|
Expense ratio (excluding acquisition costs) |
|
| 19.5 | % | 18.9 | % | 19.7 | % |
| (60) | bps |
|
|
| 80 | bps |
|
70
2019 versus 2018
Adjusted revenues. The increase reflected business growth in Asia, Europe, and the Middle East and the acquisition of OnePath Life in New Zealand in the fourth quarter of 2018. These increases were partially offset by unfavorable foreign currency movements.
Pre-tax adjusted income from operations. The increase reflected business growth in Asia and the acquisition of OnePath Life, partially offset by unfavorable foreign currency movements.
The segment’s loss ratio was essentially flat.
The acquisition cost ratio decreased due to lower spending in certain markets and the acquisition of OnePath Life, partially offset by higher acquisition expenses in South Korea and Taiwan.
The increase in the expense ratio (excluding acquisition costs) was driven primarily by strategic investments for long-term growth and integration of OnePath Life.
Other Items Affecting International Markets Results
South Korea is the single largest geographic market for our International Markets segment. In 2019, South Korea generated 37% of the segment’s adjusted revenues and 63% of the segment’s pre-tax adjusted income from operations.
Group Disability and Other
As described in the introduction of Segment Reporting, performance of Group Disability and Other is measured using pre-tax adjusted income from operations. Key factors affecting pre-tax adjusted income from operations are:
premium growth, including new business and customer retention;
net investment income;
benefit expenses as a percentage of premiums (loss ratio); and
selling, general and administrative expense as a percentage of revenues excluding net investment income (expense ratio).
Results of Operations
Financial Summary |
| For the Years Ended December 31, |
| Change Favorable (Unfavorable) |
| Change Favorable (Unfavorable) | |||||||||||
(In millions) |
| 2019 | 2018 | 2017 |
| 2019 vs. 2018 |
| 2018 vs. 2017 | |||||||||
Adjusted revenues |
| $ | 5,182 | $ | 5,061 | $ | 5,075 |
| $ | 121 | 2 | % |
| $ | (14) | - | % |
Pre-tax adjusted income from operations |
| $ | 501 | $ | 529 | $ | 517 |
| $ | (28) | (5) | % |
| $ | 12 | 2 | % |
Pre-tax adjusted margin |
|
| 9.7 | % | 10.5 | % | 10.2 | % |
| (80) | bps |
|
|
| 30 | bps |
|
2019 versus 2018
Adjusted revenues. The increase reflected business growth in the group disability, life and voluntary businesses, partially offset by the continued run-off of international business and lower investment income.
Pre-tax adjusted income from operations and Pre-tax adjusted margin. The decreases resulted from unfavorable disability claims experience.
71
Corporate
Corporate reflects amounts not allocated to operating segments, including net interest expense (defined as interest on corporate debt less net investment income on investments not supporting segment and other operations), certain litigation matters, expense associated with our frozen pension plans, charitable contributions, severance, certain overhead and project costs and intersegment eliminations for products and services sold between segments. As discussed in the introduction to Segment Reporting, beginning in the first quarter of 2019, compensation cost for stock options is now recorded by the segments. Prior year results for Corporate were not restated to reflect this change.
Financial Summary |
| For the Years Ended December 31, |
| Change Favorable (Unfavorable) |
| Change Favorable (Unfavorable) | |||||||||||
(In millions) |
| 2019 | 2018 | 2017 |
| 2019 vs. 2018 |
| 2018 vs. 2017 | |||||||||
Pre-tax adjusted loss from operations |
| $ | (1,824) | $ | (403) | $ | (375) |
| $ | (1,421) | (353) | % |
| $ | (28) | (7) | % |
2019 versus 2018
Pre-tax adjusted loss from operations. The increase reflected higher interest expense on debt issued in the third quarter of 2018 to finance the Express Scripts acquisition and debt assumed from Express Scripts.
INVESTMENT ASSETS
The following table presents our investment asset portfolio excluding separate account assets as of December 31, 2019 and 2018. Additional information regarding our investment assets is included in Notes 11, 12, 13 and 14 to the Consolidated Financial Statements.
| December 31, | December 31, | ||
(In millions) | 2019 (1) | 2018 | ||
Debt securities | $ | 23,755 | $ | 22,928 |
Equity securities |
| 303 |
| 548 |
Commercial mortgage loans |
| 1,947 |
| 1,858 |
Policy loans |
| 1,357 |
| 1,423 |
Other long-term investments |
| 2,403 |
| 1,901 |
Short-term investments |
| 423 |
| 316 |
Total |
| 30,188 |
| 28,974 |
Investments classified as assets held for sale |
| (7,709) |
| - |
Investments per Consolidated Balance Sheets | $ | 22,479 | $ | 28,974 |
(1) The table above includes $7.7 billion of investments associated with the Group Disability and Life business that is held for sale to New York Life. Under the terms of the definitive agreement, some of the assets currently associated with the Group Disability and Life business can be substituted for other assets. The assets that will transfer to New York Life will be primarily debt securities and to a lesser extent commercial mortgage loans and short-term investments. | ||||
Debt Securities
Investments in debt securities include publicly-traded and privately-placed bonds, mortgage and other asset-backed securities and preferred stocks redeemable by the investor. These investments are classified as available for sale and are carried at fair value on our balance sheet. Additional information regarding valuation methodologies, key inputs and controls is included in Note 12 to the Consolidated Financial Statements. More detailed information about debt securities by type of issuer and maturity dates is included in Note 11 to the Consolidated Financial Statements.
72
The following table reflects our portfolio of debt securities by type of issuer as of December 31, 2019 and 2018. The table below includes investments held for sale as of December 31, 2019.
| December 31, | December 31, | ||
(In millions) | 2019 | 2018 | ||
Federal government and agency | $ | 733 | $ | 710 |
State and local government |
| 810 |
| 985 |
Foreign government |
| 2,256 |
| 2,362 |
Corporate |
| 19,420 |
| 18,361 |
Mortgage and other asset-backed |
| 536 |
| 510 |
Total | $ | 23,755 | $ | 22,928 |
Our debt securities portfolio increased during 2019 reflecting increased valuations due to decreases in market yields, partially offset by net sales and maturities. As of December 31, 2019, $21.2 billion, or 90% of the debt securities in our investment portfolio were investment grade (Baa and above, or equivalent) and the remaining $2.5 billion were below investment grade. The majority of the bonds that are below investment grade are rated at the higher end of the non-investment grade spectrum. These quality characteristics have not materially changed from the prior year and are consistent with our investment strategy. Investments in debt securities are diversified by issuer, geography and industry as appropriate.
Foreign government obligations are concentrated in Asia, primarily South Korea, consistent with our risk management practice and local regulatory requirements of our international business operations. Corporate debt securities include private placement assets of $7.5 billion. These investments are generally less marketable than publicly-traded bonds; however yields on these investments tend to be higher than yields on publicly-traded bonds with comparable credit risk. We perform a credit analysis of each issuer and require financial and other covenants that allow us to monitor issuers for deteriorating financial strength and pursue remedial actions, if warranted.
In addition to amounts classified as debt securities in our Consolidated Balance Sheets, we participate in an insurance joint venture in China with a 50% ownership interest. This entity had an investment portfolio of approximately $8.1 billion supporting its business that is primarily invested in Chinese corporate and government debt securities. We account for this joint venture on the equity method of accounting and report it in other assets. There were no investments with a material unrealized loss as of December 31, 2019.
Commercial Mortgage Loans
Our commercial mortgage loans are fixed rate loans, diversified by property type, location and borrower. Loans are secured by high quality commercial properties and are generally made at less than 70% of the property’s value at origination of the loan. Property value, debt service coverage, quality, building tenancy and stability of cash flows are all important financial underwriting considerations. We hold no direct residential mortgage loans and do not originate or service securitized mortgage loans.
Commercial real estate capital markets remain very active for well-leased, quality commercial real estate located in strong institutional investment markets. The vast majority of properties securing the mortgages in our mortgage loan portfolio possess these characteristics.
As of December 31, 2019, the $1.9 billion commercial mortgage loan portfolio consisted of approximately 65 loans that are in good standing. Given the quality and diversity of the underlying real estate, positive debt service coverage and significant borrower cash investment generally ranging between 30 and 40%, we remain confident that borrowers will continue to perform as expected under their contract terms.
Other Long-term Investments
Other long-term investments of $ 2.4 billion as of December 31, 2019 included investments in securities limited partnerships and real estate limited partnerships as well as direct investments in real estate joint ventures. These entities typically invest in mezzanine debt or equity of privately-held companies (securities partnerships) and equity real estate. Given our subordinate position in the capital structure of these underlying entities, we assume a higher level of risk for higher expected returns. To mitigate risk, these investments are diversified across approximately 160 separate partnerships and approximately 80 general partners who manage one or more of these partnerships. Also, the underlying investments are diversified by industry sector or property type and geographic region. No single partnership investment exceeded 5% of our securities and real estate partnership portfolio.
73
Problem and Potential Problem Investments
“Problem” bonds and commercial mortgage loans are either delinquent by 60 days or more or have been restructured as to terms, including concessions by us for modification of interest rate, principal payment or maturity date. “Potential problem” bonds and commercial mortgage loans are considered current (no payment is more than 59 days past due), but management believes they have certain characteristics that increase the likelihood that they may become problems.
The amount of problem or potential problem investments as of December 31, 2019 and 2018 was not material.
Investment Outlook
Public equity markets rallied during 2019, reflecting the continued strength of the U.S. economy. However, concerns related to trade and tariffs continue to contribute to financial market volatility. We continue to closely monitor global macroeconomic conditions and trends, including uncertainty caused by the United Kingdom’s process of exiting the European Union, and their potential impact on our investment portfolio. We expect continued volatility in certain sectors, such as retail, energy and natural gas. Future realized and unrealized investment results will be driven largely by market conditions that exist when a transaction occurs or at the reporting date. These future conditions are not reasonably predictable; however, we believe that the vast majority of our investments will continue to perform under their contractual terms. Based on our strategy to match the duration of invested assets to the duration of insurance and contractholder liabilities, we expect to hold a significant portion of these assets for the long term. Although future impairment losses resulting from interest rate movements and credit deterioration due to both investment-specific and the global economic uncertainties discussed above remain possible, we do not expect these losses to have a material adverse effect on our financial condition or liquidity.
MARKET RISK
Financial Instruments
Our assets and liabilities include financial instruments subject to the risk of potential losses from adverse changes in market rates and prices. Consistent with disclosure requirements, the following items have been excluded from this consideration of market risk for financial instruments:
changes in the fair values of insurance-related assets and liabilities because their primary risks are insurance rather than market risk;
changes in the fair values of investments recorded using the equity method of accounting and liabilities for pension and other postretirement and postemployment benefit plans (and related assets); and
changes in the fair values of other significant assets and liabilities such as goodwill, deferred policy acquisition costs, taxes, and various accrued liabilities. Because they are not financial instruments, their primary risks are other than market risk.
Excluding these items, our primary market risk exposures from financial instruments are:
Interest-rate risk on fixed-rate, medium-term instruments. Changes in market interest rates affect the value of instruments that promise a fixed return.
Foreign currency exchange rate risk of the U.S. dollar primarily to the South Korean won, Chinese yuan renminbi, New Zealand dollar, and Taiwan dollar. An unfavorable change in exchange rates reduces the carrying value of net assets denominated in foreign currencies.
Our Management of Market Risks
We predominantly rely on three techniques to manage our exposure to market risk:
Investment/liability matching. We generally select investment assets with characteristics (such as duration, yield, currency and liquidity) that correspond to the underlying characteristics of our related insurance and contractholder liabilities so that we can match the investments to our obligations. Shorter-term investments generally support shorter-term life and health liabilities. Medium-term, fixed-rate investments support interest-sensitive and health liabilities. Longer-term investments generally support products with longer pay out periods such as annuities and long-term disability liabilities.
Use of local currencies for foreign operations. We generally conduct our international business through foreign operating entities that maintain assets and liabilities in local currencies. This technique limits exchange rate risk to our net assets.
Use of derivatives. We use derivative financial instruments to reduce our primary market risks. See Note 11 to the Consolidated Financial Statements for additional information about derivative financial instruments.
74
Effect of Market Fluctuations
Assuming a 100 basis point increase in interest rates and 10% strengthening in the U.S. dollar to foreign currencies, the effect of hypothetical changes in market rates or prices on the fair value of certain financial instruments, subject to the exclusions noted above (particularly insurance liabilities), would have been as follows as of December 31:
Market scenario for certain non-insurance financial instruments | Loss in fair value | |
(in billions) | 2019 | 2018 |
100 basis point increase in interest rates (excluding long-term debt) | $ 1.6 | $ 1.6 |
10% strengthening in U.S. dollar to foreign currencies | $ 0.3 | $ 0.4 |
The effect of a hypothetical increase in interest rates, primarily on debt securities and commercial mortgage loans, was determined by estimating the present value of future cash flows using various models, primarily duration modeling.
In the event of a hypothetical 100 basis point increase in interest rates, the fair value of the Company’s long-term debt would decrease approximately $2.5 billion at December 31, 2019 and $2.4 billion at December 31, 2018. Changes in the fair value of our long-term debt do not impact our financial position or operating results. See Note 7 to the Consolidated Financial Statements for additional information about the Company’s debt.
The effect of a hypothetical strengthening of the U.S. dollar relative to the foreign currencies of certain financial instruments held by us was estimated to be 10% of the U.S. dollar equivalent fair value. Our foreign operations hold investment assets, such as debt securities, cash, and cash equivalents that are generally invested in the currency of the related liabilities.
75
Item 7A. QUANTITATIVE AND QUALITATIVE DISCLOSURES ABOUT MARKET RISK
The information contained under the caption “Market Risk” in the MD&A section of this Form 10-K is incorporated by reference.
76
Item 8. FINANCIAL STATEMENTS AND SUPPLEMENTARY DATA
Report of Independent Registered Public Accounting Firm
To the Board of Directors and Shareholders of Cigna Corporation
Opinions on the Financial Statements and Internal Control over Financial Reporting
We have audited the accompanying consolidated balance sheets of Cigna Corporation and its subsidiaries (the “Company”) as of December 31, 2019 and 2018, and the related consolidated statements of income, comprehensive income, changes in total equity and cash flows for each of the three years in the period ended December 31, 2019, including the related notes (collectively referred to as the “consolidated financial statements”). We also have audited the Company's internal control over financial reporting as of December 31, 2019, based on criteria established in Internal Control - Integrated Framework (2013) issued by the Committee of Sponsoring Organizations of the Treadway Commission (COSO).
In our opinion, the consolidated financial statements referred to above present fairly, in all material respects, the financial position of the Company as of December 31, 2019 and 2018, and the results of its operations and its cash flows for each of the three years in the period ended December 31, 2019 in conformity with accounting principles generally accepted in the United States of America. Also in our opinion, the Company maintained, in all material respects, effective internal control over financial reporting as of December 31, 2019, based on criteria established in Internal Control - Integrated Framework (2013) issued by the COSO.
Basis for Opinions
The Company's management is responsible for these consolidated financial statements, for maintaining effective internal control over financial reporting, and for its assessment of the effectiveness of internal control over financial reporting, included in Management’s Annual Report on Internal Control over Financial Reporting appearing under Item 9A. Our responsibility is to express opinions on the Company’s consolidated financial statements and on the Company's internal control over financial reporting based on our audits. We are a public accounting firm registered with the Public Company Accounting Oversight Board (United States) (PCAOB) and are required to be independent with respect to the Company in accordance with the U.S. federal securities laws and the applicable rules and regulations of the Securities and Exchange Commission and the PCAOB.
We conducted our audits in accordance with the standards of the PCAOB. Those standards require that we plan and perform the audits to obtain reasonable assurance about whether the consolidated financial statements are free of material misstatement, whether due to error or fraud, and whether effective internal control over financial reporting was maintained in all material respects.
Our audits of the consolidated financial statements included performing procedures to assess the risks of material misstatement of the consolidated financial statements, whether due to error or fraud, and performing procedures that respond to those risks. Such procedures included examining, on a test basis, evidence regarding the amounts and disclosures in the consolidated financial statements. Our audits also included evaluating the accounting principles used and significant estimates made by management, as well as evaluating the overall presentation of the consolidated financial statements. Our audit of internal control over financial reporting included obtaining an understanding of internal control over financial reporting, assessing the risk that a material weakness exists, and testing and evaluating the design and operating effectiveness of internal control based on the assessed risk. Our audits also included performing such other procedures as we considered necessary in the circumstances. We believe that our audits provide a reasonable basis for our opinions.
Definition and Limitations of Internal Control over Financial Reporting
A company’s internal control over financial reporting is a process designed to provide reasonable assurance regarding the reliability of financial reporting and the preparation of financial statements for external purposes in accordance with generally accepted accounting principles. A company’s internal control over financial reporting includes those policies and procedures that (i) pertain to the maintenance of records that, in reasonable detail, accurately and fairly reflect the transactions and dispositions of the assets of the company; (ii) provide reasonable assurance that transactions are recorded as necessary to permit preparation of financial statements in accordance with generally accepted accounting principles, and that receipts and expenditures of the company are being made only in accordance with authorizations of management and directors of the company; and (iii) provide reasonable assurance regarding prevention or timely detection of unauthorized acquisition, use, or disposition of the company’s assets that could have a material effect on the financial statements.
77
Because of its inherent limitations, internal control over financial reporting may not prevent or detect misstatements. Also, projections of any evaluation of effectiveness to future periods are subject to the risk that controls may become inadequate because of changes in conditions, or that the degree of compliance with the policies or procedures may deteriorate.
Critical Audit Matters
The critical audit matters communicated below are matters arising from the current period audit of the consolidated financial statements that were communicated or required to be communicated to the audit committee and that (i) relate to accounts or disclosures that are material to the consolidated financial statements and (ii) involved our especially challenging, subjective, or complex judgments. The communication of critical audit matters does not alter in any way our opinion on the consolidated financial statements, taken as a whole, and we are not, by communicating the critical audit matters below, providing separate opinions on the critical audit matters or on the accounts or disclosures to which they relate.
Goodwill Impairment Assessment
As described in Note 18 to the consolidated financial statements, as of December 31, 2019, goodwill is primarily reported in the Health Services segment ($33.7 billion), the Integrated Medical segment ($10.5 billion) and, to a lesser extent, the International Markets segment ($0.4 billion). Management evaluates goodwill for impairment at least annually during the third quarter at the reporting unit level and writes the goodwill balance down through shareholders’ net income if impaired. Fair value of a reporting unit is generally estimated based on either a market approach or a discounted cash flow analysis using assumptions that management believes a hypothetical market participant would use to determine a current transaction price. The significant assumptions and estimates used in determining fair value include the discount rate and future cash flows. A discount rate is selected to correspond with each reporting unit's weighted average cost of capital, consistent with that used for investment decisions considering the specific and detailed operating plans and strategies within that reporting unit. Projections of future cash flows for each reporting unit are consistent with management’s annual planning process for revenues, pharmacy costs, benefits expenses, operating expenses, taxes, capital levels and long-term growth rates.
The principal considerations for our determination that performing procedures relating to the goodwill impairment assessment is a critical audit matter are there was significant judgment by management when determining the fair value measurement of the reporting units. This in turn led to a high degree of auditor judgment, subjectivity, and effort in performing procedures and evaluating management’s estimate of the reporting units’ fair value including the assumptions for the discount rate and projection of future cash flows. In addition, the audit effort involved the use of professionals with specialized skill and knowledge to assist in performing these procedures and evaluating the audit evidence obtained.
Addressing the matter involved performing procedures and evaluating audit evidence in connection with forming our overall opinion on the consolidated financial statements. These procedures included testing the effectiveness of controls relating to management’s goodwill impairment assessment, including controls over management’s methodology, inputs and assumptions used in its goodwill impairment assessment. These procedures also included, among others, testing management’s process for determining the fair value estimate of the reporting units; evaluating the appropriateness of the discounted cash flow analysis; testing the completeness and accuracy of underlying data used in the discounted cash flow analysis; and evaluating the key inputs and significant assumptions, including the discount rate and the projections of future cash flows. The underlying inputs and assumptions used in the development of the discount rate and the projections of future cash flows that were evaluated included the weighted average cost of capital, revenues, pharmacy costs, benefits expenses, operating expenses, capital levels and long-term growth rates. Evaluating the reasonableness of management’s inputs and assumptions involved considering (i) the current and past performance of the reporting unit, (ii) the consistency of the discount rate and long-term growth rates with external market and industry data, and (iii) whether these assumptions were consistent with evidence obtained in other areas of the audit. Professionals with specialized skill and knowledge were used to assist in the evaluation of certain significant assumptions, including the discount rate.
Valuation of Long-term Disability Disabled Life Reserves
As described in Note 9 to the consolidated financial statements, the majority of the Company's liability for disability claims consists of “disabled life reserves”, measured as the present value of estimated future benefit payments, including expected development, for each reported claim that is currently receiving benefit payments over the expected disability period or pending a decision on eligibility for benefits. As of December 31, 2019, the long-term disability disabled life reserves were $3.5 billion. Management projects the expected disability period by using historical resolution rates combined with an analysis of current trends and operational factors to develop current estimates of resolution rates. Expected claim resolution rates may vary based upon management’s experience for the anticipated disability period, the covered benefit period, the cause of disability, the benefit design and the claimant’s age, gender and income level. The gross monthly benefit is reduced (offset) by disability income received under other benefit programs, most commonly Social Security Disability Income, workers' compensation, statutory disability or other group benefit plans. Management
78
estimates the probability and amount of future offset awards and lapses based on management’s experience for certain offsets not yet finalized.
The principal considerations for our determination that performing procedures relating to the valuation of long-term disability disabled life reserves is a critical audit matter are there was significant judgment by management when determining the reserves. This in turn led to a high degree of auditor judgment, subjectivity and effort in performing procedures and evaluating audit evidence relating to the actuarial methodologies and assumptions including the discount rate, resolution rates, offset awards, and adequacy utilized to estimate the reserves. In addition, the audit effort involved the use of professionals with specialized skill and knowledge to assist in performing these procedures and evaluating the audit evidence obtained.
Addressing the matter involved performing procedures and evaluating audit evidence in connection with forming our overall opinion on the consolidated financial statements. These procedures included testing the effectiveness of controls relating to the valuation of long-term disability disabled life reserves, including controls over management’s actuarial methodologies and the development of significant assumptions including the discount rate, resolution rates, offset awards, and adequacy. These procedures also included, among others, the involvement of professionals with specialized skill and knowledge to assist in testing management’s process for determining the reserves which included evaluating the appropriateness of management’s actuarial methodologies and the reasonableness of the aforementioned assumptions utilized in determining the reserves balances and recalculating the reserves for a sample of long-term disability disabled life reserves utilizing management’s actuarial methodologies and assumptions. The professionals with specialized skill and knowledge also recalculated a sample of long-term disability disabled life reserves utilizing an independent model and management’s assumptions. Performing these procedures involved testing the completeness and accuracy of the data provided by management.
/s/ PricewaterhouseCoopers LLP
Hartford, Connecticut
February 27, 2020
We have served as the Company’s auditor since 1983.
79
Cigna Corporation |
|
|
|
|
|
|
Consolidated Statements of Income |
|
|
|
|
|
|
| For the years ended December 31, | |||||
(In millions, except per share amounts) | 2019 | 2018 | 2017 | |||
Revenues |
|
|
|
|
|
|
Pharmacy revenues | $ | 103,099 | $ | 5,479 | $ | 2,979 |
Premiums |
| 39,714 |
| 36,113 |
| 32,491 |
Fees and other revenues |
| 9,363 |
| 5,578 |
| 5,110 |
Net investment income |
| 1,390 |
| 1,480 |
| 1,226 |
TOTAL REVENUES |
| 153,566 |
| 48,650 |
| 41,806 |
Benefits and expenses |
|
|
|
|
|
|
Pharmacy and other service costs |
| 97,668 |
| 4,793 |
| 2,456 |
Medical costs and other benefit expenses |
| 30,819 |
| 27,528 |
| 25,263 |
Selling, general and administrative expenses |
| 14,053 |
| 11,934 |
| 10,030 |
Amortization of acquired intangible assets |
| 2,949 |
| 235 |
| 115 |
TOTAL BENEFITS AND EXPENSES |
| 145,489 |
| 44,490 |
| 37,864 |
Income from operations |
| 8,077 |
| 4,160 |
| 3,942 |
Interest expense and other |
| (1,682) |
| (498) |
| (252) |
Debt extinguishment costs |
| (2) |
| - |
| (321) |
Net realized investment gains (losses) |
| 177 |
| (81) |
| 237 |
Income before income taxes |
| 6,570 |
| 3,581 |
| 3,606 |
TOTAL INCOME TAXES |
| 1,450 |
| 935 |
| 1,374 |
Net income |
| 5,120 |
| 2,646 |
| 2,232 |
Less: net income (loss) attributable to noncontrolling interests |
| 16 |
| 9 |
| (5) |
SHAREHOLDERS’ NET INCOME | $ | 5,104 | $ | 2,637 | $ | 2,237 |
Shareholders’ net income per share |
|
|
|
|
|
|
Basic | $ | 13.58 | $ | 10.69 | $ | 8.92 |
Diluted | $ | 13.44 | $ | 10.54 | $ | 8.77 |
The accompanying Notes to the Consolidated Financial Statements are an integral part of these statements. | ||||||
80
Cigna Corporation |
|
|
|
|
|
|
|
|
|
Consolidated Statements of Comprehensive Income |
|
|
|
|
|
|
|
|
|
|
| For the years ended December 31, | |||||||
(In millions) |
|
| 2019 |
|
| 2018 |
|
| 2017 |
Net Income |
| $ | 5,120 |
| $ | 2,646 |
| $ | 2,232 |
Other comprehensive income (loss), net of tax |
|
|
|
|
|
|
|
|
|
Net unrealized appreciation (depreciation) on securities and derivatives |
|
| 957 |
|
| (365) |
|
| (37) |
Net translation (losses) gains on foreign currencies |
|
| (59) |
|
| (167) |
|
| 301 |
Postretirement benefits liability adjustment |
|
| (133) |
|
| 127 |
|
| 33 |
Other comprehensive income (loss), net of tax |
|
| 765 |
|
| (405) |
|
| 297 |
Total comprehensive income |
|
| 5,885 |
|
| 2,241 |
|
| 2,529 |
|
|
|
|
|
|
|
|
|
|
Comprehensive income (loss) attributable to noncontrolling interests |
|
|
|
|
|
|
|
|
|
Net income attributable to redeemable noncontrolling interest |
|
| 11 |
|
| 9 |
|
| - |
Net income (loss) attributable to other noncontrolling interests |
|
| 5 |
|
| - |
|
| (5) |
Other comprehensive (loss) attributable to redeemable noncontrolling interest |
|
| (5) |
|
| (15) |
|
| (3) |
Total comprehensive income (loss) attributable to noncontrolling interests |
|
| 11 |
|
| (6) |
|
| (8) |
SHAREHOLDERS' COMPREHENSIVE INCOME |
| $ | 5,874 |
| $ | 2,247 |
| $ | 2,537 |
The accompanying Notes to the Consolidated Financial Statements are an integral part of these statements. | |||||||||
81
Cigna Corporation |
|
|
|
|
Consolidated Balance Sheets |
|
|
|
|
| As of December 31, | |||
(Dollars in millions) | 2019 | 2018 | ||
Assets |
|
|
|
|
Cash and cash equivalents | $ | 4,619 | $ | 3,855 |
Investments |
| 937 |
| 2,045 |
Accounts receivable, net |
| 10,716 |
| 10,473 |
Inventories |
| 2,661 |
| 2,821 |
Other current assets |
| 1,400 |
| 1,236 |
Assets of business held for sale |
| 9,512 |
| - |
Total current assets |
| 29,845 |
| 20,430 |
Long-term investments |
| 21,542 |
| 26,929 |
Reinsurance recoverables |
| 5,100 |
| 5,507 |
Deferred policy acquisition costs |
| 2,958 |
| 2,821 |
Property and equipment |
| 4,417 |
| 4,562 |
Goodwill |
| 44,602 |
| 44,505 |
Other intangible assets |
| 36,562 |
| 39,003 |
Other assets |
| 2,283 |
| 1,630 |
Separate account assets |
| 8,465 |
| 7,839 |
TOTAL ASSETS | $ | 155,774 | $ | 153,226 |
Liabilities |
|
|
|
|
Current insurance and contractholder liabilities | $ | 4,921 | $ | 6,801 |
Pharmacy and service costs payable |
| 10,454 |
| 10,702 |
Accounts payable |
| 5,090 |
| 4,366 |
Accrued expenses and other liabilities |
| 7,347 |
| 7,071 |
Short-term debt |
| 5,514 |
| 2,955 |
Liabilities of business held for sale |
| 6,812 |
| - |
Total current liabilities |
| 40,138 |
| 31,895 |
Non-current insurance and contractholder liabilities |
| 16,052 |
| 19,974 |
Deferred tax liabilities, net |
| 9,387 |
| 9,453 |
Other non-current liabilities |
| 4,460 |
| 3,470 |
Long-term debt |
| 31,893 |
| 39,523 |
Separate account liabilities |
| 8,465 |
| 7,839 |
TOTAL LIABILITIES |
| 110,395 |
| 112,154 |
Contingencies — Note 22 |
|
| ||
Redeemable noncontrolling interests |
| 35 |
| 37 |
Shareholders’ equity |
|
|
|
|
Common stock (1) |
| 4 |
| 4 |
Additional paid-in capital |
| 28,306 |
| 27,751 |
Accumulated other comprehensive loss |
| (941) |
| (1,711) |
Retained earnings |
| 20,162 |
| 15,088 |
Less: treasury stock, at cost |
| (2,193) |
| (104) |
TOTAL SHAREHOLDERS’ EQUITY |
| 45,338 |
| 41,028 |
Other noncontrolling interests |
| 6 |
| 7 |
Total equity |
| 45,344 |
| 41,035 |
Total liabilities and equity | $ | 155,774 | $ | 153,226 |
(1) Par value per share, $0.01; shares issued, 386 million as of December 31, 2019 and 381 million as of December 31, 2018; authorized shares; 600 million. | ||||
The accompanying Notes to the Consolidated Financial Statements are an integral part of these statements. | ||||
82
Cigna Corporation |
|
|
|
|
|
|
|
|
|
|
|
|
| ||||||
Consolidated Statements of Changes in Total Equity |
|
|
|
|
|
|
| ||||||||||||
|
|
|
|
|
|
|
|
|
|
|
|
|
|
|
|
|
|
|
|
(In millions, except per share amounts) | Common Stock | Additional Paid-in Capital | Accumulated Other Comprehensive Loss | Retained Earnings | Treasury Stock | Shareholders’ Equity | Non- controlling Interests | Total Equity | Redeemable Non- controlling Interest |
| |||||||||
Balance at December 31, 2016 | $ | 74 | $ | 2,892 | $ | (1,382) | $ | 13,831 | $ | (1,716) | $ | 13,699 | $ | 4 | $ | 13,703 | $ | 58 |
|
2017 Activity |
|
|
|
|
|
|
|
|
|
|
|
|
|
|
|
|
|
|
|
Effect of issuing stock for employee benefit plans |
|
|
| 51 |
|
|
| (258) |
| 455 |
| 248 |
|
|
| 248 |
|
|
|
Other comprehensive income (loss) |
|
|
|
|
| 300 |
|
|
|
|
| 300 |
|
|
| 300 |
| (3) |
|
Net income (loss) |
|
|
|
|
|
|
| 2,237 |
|
|
| 2,237 |
| (5) |
| 2,232 |
| - |
|
Common dividends declared (per share: $0.04) |
|
|
|
|
|
|
| (10) |
|
|
| (10) |
|
|
| (10) |
|
|
|
Repurchase of common stock |
|
|
|
|
|
|
|
|
| (2,760) |
| (2,760) |
|
|
| (2,760) |
|
|
|
Other transactions impacting noncontrolling interests |
|
|
| (3) |
|
|
|
|
|
|
| (3) |
| 1 |
| (2) |
| (6) |
|
Balance at December 31, 2017 |
| 74 |
| 2,940 |
| (1,082) |
| 15,800 |
| (4,021) |
| 13,711 |
| - |
| 13,711 |
| 49 |
|
2018 Activity |
|
|
|
|
|
|
|
|
|
|
|
|
|
|
|
|
|
|
|
Cumulative effect of accounting for financial instruments and hedging |
|
|
|
|
| (10) |
| 68 |
|
|
| 58 |
|
|
| 58 |
|
|
|
Reclassification adjustment related to U.S. tax reform legislation |
|
|
|
|
| (229) |
| 229 |
|
|
| - |
|
|
| - |
|
|
|
Retirement of treasury stock |
| (13) |
| (529) |
|
|
| (3,498) |
| 4,040 |
| - |
|
|
| - |
|
|
|
Exchange of Old Cigna common stock |
| (58) |
| 58 |
|
|
|
|
|
|
| - |
|
|
| - |
|
|
|
Acquisition of Express Scripts (see Note 4) |
| 1 |
| 25,223 |
|
|
|
|
|
|
| 25,224 |
| 7 |
| 25,231 |
|
|
|
Effect of issuing stock for employee benefit plans |
|
|
| 59 |
|
|
| (138) |
| 206 |
| 127 |
|
|
| 127 |
|
|
|
Other comprehensive (loss) |
|
|
|
|
| (390) |
|
|
|
|
| (390) |
|
|
| (390) |
| (15) |
|
Net income |
|
|
|
|
|
|
| 2,637 |
|
|
| 2,637 |
|
|
| 2,637 |
| 9 |
|
Common dividends declared (per share: $0.04) |
|
|
|
|
|
|
| (10) |
|
|
| (10) |
|
|
| (10) |
|
|
|
Repurchase of common stock |
|
|
|
|
|
|
|
|
| (329) |
| (329) |
|
|
| (329) |
|
|
|
Other transactions impacting noncontrolling interests |
|
|
|
|
|
|
|
|
|
|
| - |
|
|
| - |
| (6) |
|
Balance at December 31, 2018 |
| 4 |
| 27,751 |
| (1,711) |
| 15,088 |
| (104) |
| 41,028 |
| 7 |
| 41,035 |
| 37 |
|
2019 Activity |
|
|
|
|
|
|
|
|
|
|
|
|
|
|
|
|
|
|
|
Cumulative effect of adopting new lease accounting guidance (ASU 2016-02) (1) |
|
|
|
|
|
|
| (15) |
|
|
| (15) |
|
|
| (15) |
|
|
|
Effects of issuing stock for employee benefit plans |
|
|
| 555 |
|
|
|
|
| (104) |
| 451 |
|
|
| 451 |
|
|
|
Other comprehensive income (loss) |
|
|
|
|
| 770 |
|
|
|
|
| 770 |
|
|
| 770 |
| (5) |
|
Net income |
|
|
|
|
|
|
| 5,104 |
|
|
| 5,104 |
| 5 |
| 5,109 |
| 11 |
|
Common dividends declared (per share: $0.04) |
|
|
|
|
|
|
| (15) |
|
|
| (15) |
|
|
| (15) |
|
|
|
Repurchase of common stock |
|
|
|
|
|
|
|
|
| (1,985) |
| (1,985) |
|
|
| (1,985) |
|
|
|
Other transactions impacting noncontrolling interests |
|
|
|
|
|
|
|
|
|
|
| - |
| (6) |
| (6) |
| (8) |
|
Balance at December 31, 2019 | $ | 4 | $ | 28,306 | $ | (941) | $ | 20,162 | $ | (2,193) | $ | 45,338 | $ | 6 | $ | 45,344 | $ | 35 |
|
(1) See Note 2 for further information about the Company's adoption of new lease accounting guidance (ASU 2016-02) |
| ||||||||||||||||||
The accompanying Notes to the Consolidated Financial Statements are an integral part of these statements. |
| ||||||||||||||||||
|
|
|
|
|
|
|
|
|
|
|
|
|
|
|
|
|
|
| |
83
Cigna Corporation |
|
|
|
|
|
|
Consolidated Statements of Cash Flows |
|
|
|
|
|
|
| For the years ended December 31, | |||||
(In millions) | 2019 | 2018 | 2017 | |||
Cash Flows from Operating Activities |
|
|
|
|
|
|
Net income | $ | 5,120 | $ | 2,646 | $ | 2,232 |
Adjustments to reconcile net income to net cash provided by operating activities: |
|
|
|
|
|
|
Depreciation and amortization |
| 3,651 |
| 695 |
| 566 |
Realized investment (gains) losses, net |
| (177) |
| 81 |
| (237) |
Deferred income tax (benefit) expense |
| (313) |
| (101) |
| 242 |
Debt extinguishment costs |
| 2 |
| - |
| 321 |
Net changes in assets and liabilities, net of non-operating effects: |
|
|
|
|
|
|
Accounts receivable |
| (713) |
| 705 |
| (233) |
Inventories |
| 149 |
| (107) |
| (72) |
Deferred policy acquisition costs |
| (242) |
| (237) |
| (282) |
Reinsurance recoverable and Other assets |
| (277) |
| (234) |
| 115 |
Insurance liabilities |
| 575 |
| 560 |
| 506 |
Pharmacy and service costs payable |
| (192) |
| (842) |
| 35 |
Accounts payable and Accrued expenses and other liabilities |
| 1,343 |
| 332 |
| 696 |
Other, net |
| 559 |
| 272 |
| 197 |
NET CASH PROVIDED BY OPERATING ACTIVITIES |
| 9,485 |
| 3,770 |
| 4,086 |
Cash Flows from Investing Activities |
|
|
|
|
|
|
Proceeds from investments sold: |
|
|
|
|
|
|
Debt securities and equity securities |
| 3,487 |
| 2,655 |
| 2,012 |
Investment maturities and repayments: |
|
|
|
|
|
|
Debt securities and equity securities |
| 1,825 |
| 2,151 |
| 2,051 |
Commercial mortgage loans |
| 199 |
| 215 |
| 335 |
Other sales, maturities and repayments (primarily short-term and other long-term investments) |
| 1,311 |
| 734 |
| 1,702 |
Investments purchased or originated: |
|
|
|
|
|
|
Debt securities and equity securities |
| (4,282) |
| (5,637) |
| (5,628) |
Commercial mortgage loans |
| (307) |
| (312) |
| (430) |
Other (primarily short-term and other long-term investments) |
| (1,753) |
| (1,189) |
| (1,065) |
Property and equipment purchases, net |
| (1,050) |
| (528) |
| (471) |
Acquisitions, net of cash acquired |
| (153) |
| (24,455) |
| (209) |
Other, net |
| (11) |
| (12) |
| - |
NET CASH (USED IN) INVESTING ACTIVITIES |
| (734) |
| (26,378) |
| (1,703) |
Cash Flows from Financing Activities |
|
|
|
|
|
|
Deposits and interest credited to contractholder deposit funds |
| 955 |
| 1,040 |
| 1,230 |
Withdrawals and benefit payments from contractholder deposit funds |
| (1,097) |
| (1,151) |
| (1,363) |
Net change in short-term debt |
| (681) |
| 1,487 |
| 80 |
Payments for debt extinguishment |
| (3) |
| - |
| (313) |
Repayment of long-term debt |
| (4,491) |
| (131) |
| (1,250) |
Net proceeds on issuance of long-term debt |
| - |
| 22,856 |
| 1,581 |
Repurchase of common stock |
| (1,987) |
| (342) |
| (2,725) |
Issuance of common stock |
| 224 |
| 68 |
| 131 |
Other, net |
| (107) |
| (312) |
| (22) |
NET CASH (USED IN) PROVIDED BY FINANCING ACTIVITIES |
| (7,187) |
| 23,515 |
| (2,651) |
Effect of foreign currency rate changes on cash and cash equivalents |
| (8) |
| (24) |
| 55 |
Net increase (decrease) in cash, cash equivalents, and restricted cash |
| 1,556 |
| 883 |
| (213) |
Cash, cash equivalents, and restricted cash January 1, |
| 3,855 |
| 2,972 |
| 3,185 |
Cash, cash equivalents, and restricted cash December 31, |
| 5,411 |
| 3,855 |
| 2,972 |
Cash reclassified to assets held for sale |
| (743) |
| - |
| - |
Cash, cash equivalents, and restricted cash December 31, per Consolidated Balance Sheets (1) | $ | 4,668 | $ | 3,855 | $ | 2,972 |
Supplemental Disclosure of Cash Information: |
|
|
|
|
|
|
Income taxes paid, net of refunds | $ | 1,776 | $ | 1,019 | $ | 1,036 |
Interest paid | $ | 1,645 | $ | 267 | $ | 240 |
(1) Includes restricted cash of $ 26 million reported in Other noncurrent assets and $ 23 million reported in Long-term investments as of December 31, 2019. | ||||||
|
|
|
|
|
|
|
The accompanying Notes to the Consolidated Financial Statements are an integral part of these statements. | ||||||
84
Notes to the Consolidated Financial Statements
TABLE OF CONTENTS
|
|
|
Note Number | Footnote | Page |
|
|
|
Business and Capital Structure |
| |
Insurance Information |
| |
Investments |
| |
Workforce Management and Compensation |
| |
Property, Leases and Other Asset Balances |
| |
Compliance, Regulation and Contingencies |
| |
Results Details |
| |
| ||
85
Note 1 – Description of Business
Cigna Corporation, together with its subsidiaries (either individually or collectively referred to as “Cigna,” the “Company,” “we,” “our” or “us”) is a global health service organization dedicated to a mission of helping those we serve improve their health, well-being and peace of mind. Our evolved strategy in support of our mission is Go Deeper, Go Local, Go Beyond using a differentiated set of pharmacy, medical, dental, disability, life and accident insurance and related products and services offered by our subsidiaries.
The majority of these products are offered through employers and other groups such as governmental and non-governmental organizations, unions and associations. Cigna also offers commercial health and dental insurance, Medicare and Medicaid products and health, life and accident insurance coverages to individuals in the United States and selected international markets. In addition to these ongoing operations, Cigna also has certain run-off operations.
The Company reports its results in the following segments.
Health Services includes pharmacy benefits management, specialty pharmacy services, clinical solutions, home delivery and health management services.
Integrated Medical offers a variety of health care solutions to employers and individuals.
The Commercial operating segment serves employers (also referred to as “clients”) and their employees (also referred to as “customers”) and other groups. This segment provides deeply integrated medical and specialty offerings including medical, pharmacy, dental, behavioral health, vision, health advocacy programs and other products and services to insured and self-insured clients.
The Government operating segment offers Medicare Advantage, Medicare Supplement and Medicare Part D plans (including the acquired Express Scripts’ Medicare Part D business) for seniors, Medicaid plans, and individual health insurance coverage both on and off the public exchanges.
International Markets includes supplemental health, life and accident insurance products and health care coverage in our international markets as well as health care benefits to globally mobile employees of multinational organizations.
The remainder of our business operations are reported in Group Disability and Other, consisting of the following:
Group Disability and Life provides group long-term and short-term disability, group life, accident, voluntary and specialty insurance products and related services. In December 2019, Cigna entered into a definitive agreement to sell the Group Disability and Life insurance business to New York Life Insurance Company. See Note 5 for further information on the classification of this business as held for sale.
Corporate-Owned Life Insurance (“COLI”) offers permanent insurance contracts sold to corporations to provide coverage on the lives of certain employees for financing employer-paid future benefit obligations.
Run-off businesses:
Reinsurance: predominantly comprised of guaranteed minimum death benefit (“GMDB”) and guaranteed minimum income benefit (“GMIB”) business effectively exited through reinsurance with Berkshire Hathaway Life Insurance Company of Nebraska (“Berkshire”) in 2013.
Settlement Annuity business in run-off.
Individual Life Insurance and Annuity and Retirement Benefits Businesses: deferred gains from the sales of these businesses.
Corporate reflects amounts not allocated to operating segments, including interest expense, net investment income on investments not supporting segment and other operations, interest on uncertain tax positions, certain litigation matters, expense associated with our frozen pension plans, severance, certain enterprise-wide projects and intersegment eliminations for products and services sold between segments. Prior to 2019, compensation cost for stock options was also included in Corporate. Beginning in the first quarter of 2019, this cost is allocated and reported by the segments.
86
Note 2 – Summary of Significant Accounting Policies
Basis of Presentation
The Consolidated Financial Statements include the accounts of Cigna Corporation and its consolidated subsidiaries. Intercompany transactions and accounts have been eliminated in consolidation. These Consolidated Financial Statements were prepared in conformity with accounting principles generally accepted in the United States of America (“GAAP”).
Amounts recorded in the Consolidated Financial Statements necessarily reflect management’s estimates and assumptions about medical costs, investment and receivable valuations, interest rates and other factors. Significant estimates are discussed throughout these Notes; however, actual results could differ from those estimates. The impact of a change in estimate is generally included in earnings in the period of adjustment.
Recently Adopted Accounting Guidance
The Company adopted Accounting Standards Update (“ASU”) 2016-02, Leases¸ as of January 1, 2019 (the adoption date) on a modified retrospective basis for leases in effect as of and after the adoption date. This new guidance requires balance sheet recognition of assets and liabilities arising from leases, as well as additional disclosures regarding the amount, timing and uncertainty of cash flows from leases. We implemented a new lease system and corresponding internal controls to administer our leases and facilitate compliance with this new standard.
The Company elected the practical expedient package, allowing us to carry forward the assessment of 1) whether our contracts contain or are leases, 2) lease classification and 3) whether previously capitalized costs continue to qualify as initial direct costs. Upon adoption, we recognized new right-of-use assets and lease liabilities related only to our operating leases, as finance (capital) leases were already reflected on the Company’s Consolidated Balance Sheets. The impact of adoption on our net assets and retained earnings was not material, nor was there a material impact on our Consolidated Statements of Income or Cash Flows. See Note 19 for additional disclosures about the Company’s leases.
87
Accounting Guidance Not Yet Adopted
Accounting Standard and Effective Date |
| Requirements and Expected Effects of New Guidance Not Yet Adopted |
Measurement of Credit Losses on Financial Instruments (ASU 2016-13)
Required as of January 1, 2020 | Requires: | |
• | A new approach using expected credit losses to estimate and recognize credit losses for certain financial instruments (such as mortgage loans, reinsurance recoverables and other receivables) when such instruments are first originated or acquired, compared with the incurred loss model currently used. Upon adoption, the Company will record an allowance for estimated credit losses on the balance sheet. Subsequent changes in the allowance will be reported in current period earnings. | |
• | Changes in the criteria for impairment of available-for-sale debt securities | |
• | Adoption using a modified retrospective approach with a cumulative-effect adjustment recorded in retained earnings | |
Expected effects: | ||
• | The Company has completed its evaluation of this new standard and its expected effects on our financial statements and disclosures. We will adopt the standard as of January 1, 2020. | |
• | An additional allowance for future expected credit losses under the new model of approximately $50 million after-tax will be required, primarily for reinsurance recoverables. | |
Simplifying the Test for Goodwill Impairment (ASU 2017-04)
Required as of January 1, 2020 | Guidance: | ||
• | Simplifies the accounting for goodwill impairment by eliminating the need to determine the fair value of individual assets and liabilities of a reporting unit to measure a goodwill impairment | ||
• | Redefines the amount of goodwill impairment to equal the amount by which a reporting unit’s carrying value exceeds its fair value, limited to the total amount of goodwill of the reporting unit | ||
• | Requires prospective adoption
| ||
Expected effects: | |||
• | The Company will adopt this new standard effective January 1, 2020, and we do not expect its impact to be significant. | ||
|
|
|
|
88
Accounting Standard and Effective Date |
| Requirements and Expected Effects of New Guidance Not Yet Adopted | |
Targeted Improvements to the Accounting for Long-Duration Contracts (ASU 2018-12)
Required as of January 1, 2022 (early adoption permitted) | Requires (for insurance entities that issue long-duration contracts): | ||
• | Changes in measuring our future policy benefits liability for traditional and limited-pay insurance contracts: | ||
| - | Assumptions used to measure cash flows (such as mortality, morbidity and lapse assumptions) to be updated at least annually with the effect of changes in those assumptions remeasured retrospectively and reflected in current period net income. | |
| - | Discount rate assumptions to be updated quarterly based on an upper-medium grade fixed-income instrument yield that maximizes the use of observable market inputs with any changes reflected in other comprehensive income. | |
• | Deferred policy acquisition costs (DAC) related to long-duration insurance contracts to be amortized on a constant-level basis over the expected term of the contracts. Other related deferred or capitalized balances (such as unearned revenue liability and value of business acquired) may use this simplified amortization method. | ||
• | Market risk benefits (defined as protecting the contractholder from other-than-nominal capital market risk and exposing the insurer to that risk) to be measured at fair value with changes in fair value recognized in net income each period, except for the effect of changes in the insurance entity’s credit risk to be recognized in other comprehensive income. | ||
• | Additional disclosures, including disaggregated rollforwards for the liability for future policy benefits, market risk benefits, separate account liabilities and deferred acquisition costs, as well as information about significant inputs, judgments, assumptions and methods used in measurement. | ||
• | Transition methods at adoption vary: | ||
| - | Changes to the liability for future policy benefits to use a modified retrospective approach applied to all outstanding contracts on the basis of their carrying amounts as of the beginning of the earliest period presented, with an option to elect a full retrospective transition under certain criteria. Remeasuring the future policy benefits liability for the discount rate to be recorded through accumulated other comprehensive income at transition. | |
| - | Deferred policy acquisition costs to follow the transition method used for future policyholder benefits. | |
| - | Market risk benefits to be transitioned retrospectively and measured at fair value at the beginning of the earliest period presented. The difference between this fair value and carrying value to be recognized in the opening balance of retained earnings, excluding the effect of credit risk changes that are to be recognized in accumulated other comprehensive income. | |
Expected effects: | |||
• | The new guidance will apply to our long-duration insurance products predominantly within the International Markets and Group Disability and Other segments. | ||
• | The Company is evaluating the impact of this guidance and expects to have significant changes to our processes, systems, controls, financial results and disclosures. We continue to monitor developing implementation guidance, particularly with respect to reinsured blocks of business. | ||
• | Although we continue to evaluate the new requirements and model their impacts across various products, we are not yet able to project or estimate the magnitude or frequency of expected changes to our financial results. However, it is possible that the Company's income recognition pattern could change for several reasons: | ||
| - | Applying periodic assumption updates, versus the current locked-in model, may change our timing of profit or loss recognition. | |
| - | Amortizing DAC on a constant-level basis over the expected term of the related contracts, versus being tied to the emergence of profit for such contracts. | |
| - | Measuring market-risk benefit features, such as those provided in our GMDB product, at fair value will subject these liabilities and related reinsurance recoverables to market sensitivity, notably to interest rates. | |
|
| ||
|
|
|
|
89
Significant Accounting Policies
The Company’s accounting policies are described either in this Note or in the applicable Notes to the Consolidated Financial Statements as listed in the table of contents.
A.Cash and Cash Equivalents
Cash and cash equivalents are carried at cost that approximates fair value. Cash equivalents consist of short-term investments with maturities of three months or less from the time of purchase. The Company reclassifies cash overdraft positions to liabilities when the legal right of offset does not exist.
B.Inventories
Inventories consist of prescription drugs and medical supplies and are stated at the lower of first-in-first-out cost or net realizable value.
C.Reinsurance Recoverables
Reinsurance recoverables represent amounts due from reinsurers for both paid and unpaid claims of the Company’s insurance businesses and are presented net of allowances for uncollectible reinsurance. The allowances were as of December 31, 2019 and December 31, 2018. Most reinsurance recoverables are classified as non-current assets. The current portion of reinsurance recoverables is reported in other current assets and consists primarily of recoverables on paid claims expected to be settled within one year.
D.Deferred Policy Acquisition Costs
Costs eligible for deferral include incremental, direct costs of acquiring new or renewal insurance and investment contracts and other costs directly related to successful contract acquisition. Examples of deferrable costs include commissions, sales compensation and benefits, policy issuance and underwriting costs. The Company records acquisition costs differently depending on the product line. Acquisition costs for:
Supplemental health, life and accident insurance products (primarily individual products) that comprise the majority of the Company’s deferred policy acquisition costs and group health and accident insurance products are deferred and amortized, generally in proportion to the ratio of periodic revenue to the estimated total revenues over the contract periods.
Universal life products are deferred and amortized in proportion to the present value of total estimated gross profits over the expected lives of the contracts.
Other products are expensed as incurred.
Deferred policy acquisition costs also include the value of business acquired (“VOBA”) for certain acquisitions with material long-duration insurance contracts. The Company recorded amortization of deferred policy acquisition costs of $483 million in 2019, $406 million in 2018 and $322 million in 2017 primarily in selling, general and administrative expenses.
Each year, deferred policy acquisition costs are tested for recoverability. For universal life and other individual products, management estimates the present value of future revenues less expected payments. For group health and accident insurance products, management estimates the sum of unearned premiums and anticipated net investment income less future expected claims and related costs. If management’s estimates of these sums are less than the deferred costs, the Company reduces deferred policy acquisition costs and records an additional expense.
E.Other Assets (Current and Non-Current)
Other current assets consist primarily of prepaid expenses, accrued investment income and the current portion of reinsurance recoverables. Other non-current assets consist primarily of GMIB assets and various other insurance-related assets. See Note 10 for the Company’s accounting policy for GMIB assets. Additionally, other non-current assets include the carrying value of our equity-method investments in joint ventures in China, India, the U.S. and other foreign jurisdictions.
90
F.Redeemable Noncontrolling Interest
Products and services are offered in Turkey through our joint venture. The Company is the majority equity holder of this joint venture, owning 51%, and accordingly, it is consolidated.
Redeemable noncontrolling interest on our Consolidated Balance Sheets represents the Turkey joint venture partner’s preferred and common stock interests in the entity as of December 31, 2019 and 2018. Our joint venture partner may choose to require the Company to purchase their redeemable noncontrolling interest. We also have the right to require our joint venture partner to sell their redeemable noncontrolling interest to us. The redeemable noncontrolling interest was recorded at fair value as of the date of purchase. When the estimated redemption value for a redeemable noncontrolling interest exceeds its carrying value, an adjustment to increase the redeemable noncontrolling interest is recorded with an offsetting reduction to additional paid-in capital. When an adjustment is made to the carrying value of the redeemable noncontrolling interest, the calculation of shareholders’ net income per share will be adjusted if the redemption value exceeds the greater of the carrying value or fair value.
G.Accrued Expenses and Other Current and Non-Current Liabilities
Accrued expenses (current) includes financial and performance guarantee liabilities under pharmacy contracts (see section I), management compensation and various insurance-related liabilities, including experience-rated refunds, reinsurance contracts and the risk adjustment and minimum medical loss ratio rebate accruals under The Patient Protection and Affordable Care Act (the “ACA”). Other non-current liabilities include obligations for pension (see Note 16), other postretirement and postemployment benefits, GMIB contract liabilities (see Note 10) and self-insured exposures not expected to be settled within one year.
The Company accrues for legal and regulatory matters when a loss contingency is both probable and estimable. The estimated loss is generally recorded in selling, general and administrative expenses and represents the Company’s best estimate of the loss contingency. If the loss estimate is a range, the Company accrues the minimum amount in the range if no amount is better than any other estimated amount in the range. Legal costs to defend the Company’s litigation and arbitration matters are expensed as incurred in cases that the Company cannot reasonably estimate the ultimate cost to defend. If the Company can reasonably estimate the cost to defend, a liability for these costs is accrued when the claim is reported. Litigation and legal or regulatory matters that the Company has identified with a reasonable possibility of material loss are described in Note 22 to the Consolidated Financial Statements.
H.Translation of Foreign Currencies
The Company generally conducts its international business through foreign operating entities that maintain assets and liabilities in local currencies that are their functional currencies. The Company uses exchange rates as of the balance sheet date to translate assets and liabilities into U.S. dollars. Translation gains or losses on functional currencies, net of applicable taxes, are recorded in accumulated other comprehensive income (loss). The Company uses average monthly exchange rates during the year to translate revenues and expenses into U.S. dollars.
I. Pharmacy Revenues and Costs
Pharmacy revenues. Pharmacy revenues are primarily derived from providing pharmacy benefit management services to clients and customers. Pharmacy revenues are recognized when control of the promised goods or services is transferred to clients and customers, in an amount that reflects the consideration the Company expects to receive for those goods or services.
The Company provides or makes available various services supporting benefit management and claims administration and is generally obligated to provide prescription drugs to clients’ members using multiple distribution methods including retail networks, home delivery and specialty pharmacies. These goods and services are integrated into a single performance obligation to process claims, dispense prescription drugs and provide other services over the contract period (generally three years). This performance obligation is satisfied as the business stands ready to fulfill its obligation.
Revenues for dispensing prescription drugs through retail pharmacies are reported gross and consist of the prescription price (ingredient cost and dispensing fee) contracted with clients, including the customer copayment, and any associated fees for services because the Company acts as the principal in these arrangements. When a prescription is presented to a retail network pharmacy, the Company is solely responsible for customer eligibility, drug utilization review, drug-to-drug interaction review, any required clinical intervention, plan provision information, payment to the pharmacy and client billing. These revenues are recognized based on the full prescription price when the pharmacy claim is processed and approved for payment. The Company also provides benefit design and formulary consultation services to clients and negotiates separate contractual relationships with clients and network pharmacies. These factors indicate that the Company has control over these transactions until the prescription is processed. Revenues are billed,
91
due and recognized at contract rates either on a periodic basis or as services are provided (such as based on volume of claims processed). This recognition pattern aligns with the benefits from services provided.
Home delivery and specialty pharmacy revenues are due and recognized as each prescription is shipped, net of reserves for discounts and contractual allowances estimated based on historical experience. Any differences between estimates and actual collections are reflected in operations when payments are received. Historically, adjustments to original estimates and returns have not been material. The Company has elected the practical expedient to account for shipping and handling as a fulfillment activity.
We may also provide certain financial and performance guarantees, including a minimum level of discounts a client may receive, generic utilization rates and various service levels. Clients may be entitled to receive compensation if we fail to meet the guarantees. Actual performance is compared to the contractual guarantee for each measure throughout the period and the Company defers revenue for any estimated payouts within accrued expenses and other liabilities (current). These estimates are adjusted at the end of the guarantee period. Historically, adjustments to original estimates have not been material. The performance guarantee liability was $1.0 billion as of December 31, 2019 and $895 million as of December 31, 2018.
The Company administers programs through which we may receive rebates and other vendor consideration from pharmaceutical manufacturers. The amounts of such rebates or other vendor consideration shared with pharmacy benefit management services clients vary based on the contractual arrangement with the client and in some cases the type of consideration received from the pharmaceutical manufacturer. Rebates and other vendor consideration payable to pharmacy benefit management services clients are recorded as a reduction of pharmacy revenues. Estimated amounts payable to clients are based on sharing percentages in contractual arrangements between the Company and the client, and are typically adjusted when amounts are collected from pharmaceutical manufacturers. Historically, these adjustments have not been material.
Other pharmacy service revenues are earned by distributing specialty pharmaceuticals and medical supplies to providers, clinics and hospitals and services to specialty pharmacy manufacturers. These revenues are recognized as prescriptions and supplies are shipped and services are provided.
Pharmacy costs. Pharmacy costs include the cost of prescriptions sold, network pharmacy claim costs and copayments. Also included are direct costs of dispensing prescriptions including supplies, shipping and handling, and direct costs associated with clinical programs, such as drug utilization management and medication adherence counseling. Home delivery and specialty pharmacy costs are recognized when the drug is shipped and retail network costs are recognized when the drug is processed and approved for payment. Rebates and other vendor consideration received when providing pharmacy benefit management services are recorded as a reduction of pharmacy costs. Rebates are recognized as prescriptions are shipped or processed and approved for payment. The Company maintains reimbursement guarantees with certain retail network pharmacies. For each such guarantee, the Company records a pharmacy and service costs payable or prepaid asset for applicable retail network claims based on our actual performance throughout the period against the contractual reimbursement rate. The Company’s contracts with certain retail pharmacies give the Company the right to adjust reimbursement rates during the annual guarantee period.
Other. Incremental costs of obtaining service and pharmacy contracts for short-term arrangements are expensed as incurred.
J.Premiums and Related Expenses
Premiums for group life, accident and health insurance and managed care coverages are recognized as revenue on a pro rata basis over the contract period. Benefits and expenses are recognized when incurred and, for our Integrated Medical insured business, are presented net of pharmaceutical manufacturer rebates. For experience-rated contracts, premium revenue includes an adjustment for experience-rated refunds based on contract terms and calculated using the customer’s experience (including estimates of incurred but not reported claims).
Premium revenue also includes an adjustment to reflect the estimated effect of rebates due to customers under the commercial minimum medical loss ratio provisions of the ACA. These rebates are settled in the year following the policy year.
Premiums received for the Company’s Medicare Advantage plans and Medicare Part D products from the Centers for Medicare and Medicaid Services (“CMS”) and customers are recognized as revenue ratably over the contract period. CMS provides risk-adjusted premium payments for Medicare Advantage Plans and Medicare Part D products based on our customer demographics and wellness. The Company recognizes periodic changes to risk-adjusted premiums as revenue when the amounts are determinable and collection is reasonably assured. Additionally, Medicare Part D premiums include payments from CMS for risk-sharing adjustments. These adjustments are estimated quarterly based on claim experience by comparing actual incurred drug benefit costs to estimated costs submitted in original contracts. These adjustments may result in more or less revenue from CMS. Final revenue adjustments are determined and settled with CMS in the year following the contract year. Premium revenue may also include an adjustment to reflect
92
the estimated effect of rebates due to CMS under the Medicare Advantage and Medicare Part D minimum medical loss ratio provisions of the ACA.
The ACA prescribed three programs to mitigate the risk for participating health insurance companies selling coverage on the public exchanges: risk adjustment, reinsurance and risk corridor. The reinsurance and ACA risk corridor programs expired at the end of 2016, while the permanent risk-adjustment program continues.
The risk-adjustment program reallocates funds from insurers with lower risk populations to insurers with higher risk populations based on the relative risk scores of participants in non-grandfathered plans in the individual and small group markets, both on and off the exchanges. We estimate our receivable or payable based on the risk of our customers compared to the risk of other customers in the same state and market, considering data obtained from industry studies and the United States Department of Health and Human Services (“HHS”). Receivables or payables are recorded as adjustments to premium revenue based on our year-to-date experience when the amounts are reasonably estimable and collection is reasonably assured. Final revenue adjustments are determined by HHS in the year following the policy year.
Premiums for individual life, accident and supplemental health insurance and annuity products, excluding universal life and investment-related products, are recognized as revenue when due. Benefits and expenses are matched with premiums.
Revenue for universal life products is recognized as follows:
Investment income on assets supporting universal life products is recognized in net investment income as earned.
Charges for mortality, administration and policy surrender are recognized in premiums as earned. Administrative fees are considered earned when services are provided.
Benefits and expenses for universal life products consist of benefit claims in excess of policyholder account balances and income earned by policyholders. Expenses are recognized when claims are incurred, and income is credited to policyholders in accordance with contract provisions.
The unrecognized portion of premiums received is recorded as unearned premiums included in insurance and contractholder liabilities (see Note 9 for further information).
K.Fees and Related Expenses
The majority of the Company’s service fees are derived from administrative services only (“ASO”) arrangements, fee-for-service clinical solutions and health benefit management services.
ASO arrangements allow plan sponsors to self-fund claims and assume the risk of medical or other benefit costs. Most of the Company’s ASO arrangements are for medical and specialty services, including pharmacy benefits. Generally, the Company’s ASO arrangements are short-term. Contract modifications typically occur on renewal and are prospective in nature.
In return for fees from these clients, the Company provides access to our participating provider networks and other services supporting benefit management, including claims administration, behavioral health services, disease management, utilization management and cost containment programs. In general, the Company considers these services to be a combined performance obligation to provide cost effective administration of plan benefits over the contract period. Fees are billed, due and recognized monthly at contracted rates based on current membership or utilization. This recognition pattern aligns with the benefits from services provided to clients. These revenues are reported in fees and other revenues in the Consolidated Statements of Income.
The Company may also provide performance guarantees that provide potential refunds to clients if certain service standards, clinical outcomes or financial metrics are not met. If these standards, outcomes and metrics are not met, the Company may be financially at risk up to a stated percentage of the contracted fee or a stated dollar amount. The Company defers revenue by recording a liability for estimated payouts associated with these guarantees within accrued expenses and other liabilities. The amount of revenue deferred is estimated for each type of guarantee using either a most likely amount or expected value method depending on the nature of the guarantee and the information available to estimate refunds. Estimates are refined each reporting period as additional information on the Company’s performance becomes available and upon final reconciliation and settlement at the end of the guarantee period. Amounts accrued and paid for these performance guarantees during the reporting periods were .
Rebates from pharmaceutical manufacturers for ASO client purchases at retail pharmacies, net of amounts payable to ASO clients, were considered compensation for use of the manufacturer’s products and recorded in fees and other revenues prior to transitioning
93
Integrated Medical’s Commercial customers to Express Scripts’ retail pharmacy network in the third quarter of 2019. After this transition, these rebates are reflected as a reduction to pharmacy costs (See “Pharmacy Costs” above).
Expenses associated with administrative programs and services are recognized as incurred in selling, general and administrative expenses.
The Company also earns revenue, as part of its integrated pharmacy benefits performance obligation, by offering fee-for-service clinical solutions to our clients, such as drug utilization management and medication adherence counseling. These clinical programs help clients to drive better health outcomes at a lower cost by identifying and addressing potentially unsafe or wasteful prescribing, dispensing and utilization of prescription drugs, and communicating with, or supporting communications with physicians, pharmacies and patients. Fees are billed, due and recognized at contracted rates either on a periodic basis or as services are provided. This recognition pattern aligns with the benefits from services provided. These revenues are reported in fees and other revenues in the Consolidated Statements of Income. Direct costs associated with these programs are recognized in pharmacy and other service costs, and other related expenses are recorded as incurred in selling, general and administrative expenses.
The Company also earns fees by providing health benefit management solutions that drive cost reductions and improve quality outcomes. Clients are primarily sponsors of health benefit plans and fees may be stated as a per-member-per-month fee or as a per-claim fee. The Company considers the services to be a single performance obligation to stand ready to provide utilization management services over the contract period (generally three years). In certain arrangements, the Company assumes the financial obligation for third-party provider costs for medical services provided to the health plan’s customers. Fees are recorded gross in fees and other revenues in the Consolidated Statements of Income because the Company is acting as a principal in arranging for and controlling the services provided by third-party network providers. Contractual fees vary based on enrollment and provider costs and are billed, due and recognized monthly. Direct costs associated with these programs are recognized in pharmacy and other service costs, and other related expenses are recorded in selling, general and administrative expenses as incurred.
Certain health benefit management contracts require the Company to share the results of medical cost experience that differ from specified targets. This variable consideration is estimated at contract inception and adjusted through the contract period. The estimated profits and costs are recognized net in fees and other revenues.
Note 3 - Accounts Receivable, Net
Accounting policy. The Company’s accounts receivable balances primarily include amounts due from clients, third-party payors, customers and pharmaceutical manufacturers, and are presented net of allowances. Allowances for doubtful accounts are based on the current status of each customer’s receivable balance as well as current economic and market conditions and a variety of other factors including the length of time the receivables are past due, the financial health of customers and our past experience. We bill pharmaceutical manufacturers based on management’s interpretation of contractual terms and estimate a contractual allowance at the time a claim is processed based on the best information available. Contractual allowances for certain rebates receivable from pharmaceutical manufacturers are determined by reviewing payment experience and specific known items that could be adjusted under contract terms. The Company’s estimation process for contractual allowances for pharmaceutical manufacturer receivables generally results in an allowance for balances outstanding greater than 90 days. Contractual allowances for certain receivables from third-party payors are based on the contractual terms and are estimated based on the Company’s best information available at the time revenue is recognized. Receivables are written off against allowances only when such amounts are determined unrecoverable and all collection attempts have failed. We regularly review the adequacy of these allowances based on a variety of factors, including age of the outstanding receivable and collection history. When circumstances related to specific collection patterns change, estimates of the recoverability of receivables are adjusted.
The following amounts were included within accounts receivable, net:
(In millions) | 2019 | 2018 | ||
Noninsurance customer receivables | $ | 5,143 | $ | 4,988 |
Pharmaceutical manufacturers receivable (1) |
| 3,439 |
| 3,321 |
Insurance customer receivables |
| 2,321 |
| 1,888 |
Other receivables |
| 334 |
| 276 |
Total |
| 11,237 |
| 10,473 |
Accounts receivable, net classified as assets held for sale |
| (521) |
|
|
Accounts receivable, net per Consolidated Balance Sheets | $ | 10,716 | $ | 10,473 |
(1) Includes receivables from service contracts with customers of $285 million at December 31, 2019 and $406 million at December 31, 2018. | ||||
94
The receivable balances above are reported net of allowances of $778 million as of December 31, 2019 and $217 million as of December 31, 2018. Reported within these allowances as of December 31, 2019 are contractual allowances for certain rebates receivable from manufacturers of $343 million and contractual allowances from third-party payors of $135 million based upon the contractual payment terms. See the “Pharmacy Revenues and Costs” section within Note 2 for more information regarding these estimates that reduce revenue. The remaining allowances of $300 million include allowances for doubtful accounts based on the factors described above in our Accounting Policy and discounts and claims adjustments issued to customers in the form of client credits.
As part of purchase accounting, Express Scripts’ receivables were recorded at their estimated fair values with no allowances as of December 31, 2018.
Note 4 – Mergers, Acquisitions and Dispositions
A.Acquisition of Express Scripts
On December 20, 2018, Cigna acquired Express Scripts through a series of mergers (collectively, the “Merger”). Cigna Holding Company (formerly named Cigna Corporation and referred to as “Old Cigna”) and Express Scripts each merged with and into a wholly-owned subsidiary of Cigna. As a result of these transactions, Cigna became the parent of the combined company. The acquired Express Scripts business accelerates Cigna’s strategy by greatly increasing the Company’s ability to put medicine within reach of customers and also making health care more affordable, predictable and simple.
Old Cigna shareholders received one share of Cigna common stock in exchange for each share of Old Cigna common stock held immediately prior to the Merger. Express Scripts shareholders received (1) 0.2434 of a share of Cigna common stock and (2) cash of $48.75, without interest, subject to applicable withholding taxes (the “Merger Consideration”), in exchange for each share of Express Scripts common stock held immediately prior to the Merger. Cash consideration was funded primarily through a combination of cash available and debt financing discussed further in Note 7. After completing the Merger, shares of Cigna common stock were listed for trading on the New York Stock Exchange.
Merger consideration: Total merger consideration of $52.8 billion was calculated as follows:
(Dollars and shares in millions, except per share amounts) |
|
|
| ||
Cash consideration |
|
|
|
|
|
Express Scripts common stock outstanding |
|
|
|
| 564.3 |
Cash consideration per share |
|
|
| $ | 48.75 |
Cash consideration paid to Express Scripts common stockholders |
|
|
| $ | 27,510 |
Cash paid in lieu of fractional shares |
|
|
| $ | 4 |
Cash consideration paid to Express Scripts performance shareholders |
|
|
| $ | 65 |
Total cash consideration |
|
|
| $ | 27,579 |
Stock consideration |
|
|
|
|
|
Express Scripts common stock outstanding |
|
|
|
| 564.3 |
Per share exchange ratio |
|
|
|
| 0.2434 |
Shares of Cigna issued to Express Scripts common stockholders |
|
|
|
| 137.3 |
Shares of Cigna issued to Express Scripts performance shareholders and other equity holders |
|
|
|
| 0.3 |
Shares of Cigna issued to Express Scripts shareholders |
|
|
|
| 137.6 |
Closing price of Cigna common stock on December 20, 2018 |
|
|
| $ | 179.80 |
Total stock consideration |
|
|
| $ | 24,745 |
Noncontrolling interest |
|
|
| $ | 7 |
Fair value of other share-based compensation awards |
|
|
| $ | 479 |
Total merger consideration |
|
|
| $ | 52,810 |
Fair value of share-based compensation award. Express Scripts employees’ awards of options and restricted stock units of Express Scripts stock were rolled over to Cigna stock options and restricted stock units on the date of the acquisition. Each holder of an Express Scripts stock option or restricted stock unit received 0.4802 of a Cigna stock option or restricted stock award. The Cigna stock option exercise price was determined using this same conversion ratio. Vesting periods and the remaining life of the options remained consistent with the original Express Scripts awards.
95
The Company valued the restricted stock units at Cigna’s stock price and stock options using a Black-Scholes pricing model as of the acquisition date. The assumptions used were generally consistent with the 2018 assumptions disclosed in Note 17, except the expected life of these options averaged 4.3 years and the exercise price did not equal the market value at the date of grant.
The fair value of these options and restricted stock unit awards was included in the purchase price for services that had been provided prior to the acquisition based on the grant date of the original Express Scripts award and vesting period. The remaining fair value not included in the purchase price will be recorded as compensation expense in future periods over the remaining vesting periods. Most of the expense was recognized in 2019 with the balance expected in 2020.
Purchase price allocation: In accordance with GAAP, the total purchase price has been allocated to the tangible and intangible net assets acquired based on management’s final estimates of their fair values. During 2019 the Company made immaterial measurement period adjustments to the preliminary purchase price allocation. The impact to any financial statement line item of these measurement period adjustments was not material. The following table summarizes management’s final allocation of fair values of assets acquired and liabilities assumed at the closing date.
|
|
| |
(In millions) |
|
| |
Cash and cash equivalents |
| $ | 3,517 |
Receivables |
|
| 7,832 |
Inventories |
|
| 2,472 |
Other current assets |
|
| 600 |
Property and equipment |
|
| 2,924 |
Goodwill |
|
| 38,364 |
Other identifiable intangible assets |
|
| 38,725 |
Other assets acquired, non-current |
|
| 314 |
Total assets acquired |
|
| 94,748 |
Other current liabilities |
|
| 18,479 |
Long-term debt, including current portion |
|
| 12,816 |
Deferred income tax liabilities |
|
| 9,558 |
Other liabilities, non-current |
|
| 1,085 |
Total liabilities acquired |
|
| 41,938 |
Net assets acquired |
| $ | 52,810 |
Most of the goodwill ($33.7 billion) is assigned to the Health Services segment, with the remainder to the Integrated Medical segment and is not deductible for federal income tax purposes. In addition, a portion of the purchase price has been allocated to intangible assets that are presented and discussed below.
|
|
| Estimated |
| Estimated Useful |
| Amortization |
(In millions) |
|
| Fair Value |
| Life in Years |
| Method |
Customer relationships |
| $ | 30,210 |
| 14-29 |
| Cash flow trended |
Internal-use software (1) |
|
| 2,443 |
| 3-7 |
| Straight Line |
Trade name - Express Scripts |
|
| 8,400 |
| N/A |
| Indefinite |
Trade name - Other |
|
| 115 |
| 10 |
| Straight Line |
Total |
| $ | 41,168 |
|
|
|
|
|
|
|
|
|
|
|
|
(1) Reported in property and equipment. | |||||||
The fair value of the customer relationships and their amortization periods and method were determined using an income approach that relied heavily on projected future net cash flows including key assumptions for customer attrition, margins, and discount rates. The estimated useful lives reflect the time periods and pattern that Cigna expects to receive the benefits of the related cash flows.
The results of Express Scripts have been included in the Company’s Consolidated Financial Statements from the date of the acquisition. Revenues of Express Scripts included in the Company’s results for 2018 approximated $2.6 billion and Express Scripts’ results of operations were to Cigna's net income.
96
Unaudited pro forma information. The following table presents selected unaudited pro forma information for the Company assuming the acquisition of Express Scripts had occurred on January 1, 2017. The primary adjustments reflected in the pro forma results relate to the interest expense on the debt issued to fund the Merger, the amortization of the acquired intangible assets and the presentation of transaction related costs. Transaction related costs incurred by the Company and Express Scripts in 2018 have been presented as if they had been incurred on January 1, 2017. The pro forma information does not purport to represent what the Company’s actual results would have been if the acquisition had occurred as of the date indicated or what such results would be for any future periods.
|
| Unaudited | |||
|
| Year Ended December 31, | |||
(In millions) |
|
| 2018 |
| 2017 |
Total revenues |
| $ | 149,544 | $ | 143,288 |
Shareholders’ net income |
| $ | 5,632 | $ | 4,435 |
Pro forma shareholders’ net income for the year ended December 31, 2017 includes $1.2 billion in integration and transaction-related costs incurred in connection with the acquisition.
B.Integration and Transaction-related Costs
The Company has incurred costs detailed in the table below related to the acquisition and integration of Express Scripts, the terminated merger with Anthem, Inc. (“Anthem”) and other transactions. These costs consisted primarily of certain projects to integrate the Company’s systems, products and services, fees for legal, advisory and other professional services and certain employment-related costs. Costs in 2018 also included charitable contributions and amortization of certain financing fees and interest expense on the debt issued in the third quarter of 2018 to fund the Express Scripts merger, net of investment income earned on proceeds of the debt issuance.
|
| 2019 | 2018 | 2017 | |||||||||
(In millions) |
| Before-tax | After-tax | Before-tax | After-tax | Before-tax | After-tax | ||||||
Integration costs |
| $ |
| $ |
| $ |
| $ |
| $ |
| $ |
|
Interest expense on newly-issued debt |
|
| - |
| - |
| 227 |
| 179 |
| - |
| - |
Net investment income on debt proceeds |
|
| - |
| - |
| (123) |
| (97) |
| - |
| - |
Charitable contributions |
|
| - |
| - |
| 200 |
| 158 |
| - |
| - |
Legal and advisory fees |
|
| 53 |
| 41 |
| 204 |
| 185 |
| 36 |
| 23 |
Bridge facility fees |
|
| - |
| - |
| 140 |
| 111 |
| - |
| - |
All other transaction-related costs |
|
| 499 |
| 386 |
| 204 |
| 133 |
| 90 |
| 69 |
Tax (benefit) - previously non-deductible costs |
|
|
|
| - |
|
|
| - |
|
|
| (59) |
Integration and transaction-related costs, net |
| $ | 552 | $ | 427 | $ | 852 | $ | 669 | $ | 126 | $ | 33 |
|
|
|
|
|
|
|
|
|
|
|
|
|
|
Note 5 – Assets and Liabilities of Business Held for Sale
Accounting Policy. The Company classifies assets and liabilities as held for sale (“disposal group”) when management commits to a plan to sell the disposal group, the sale is probable within one year and the disposal group is available for immediate sale in its present condition. The Company considers various factors, particularly whether actions required to complete the plan indicate it is unlikely that significant changes to the plan will be made or the plan will be withdrawn. Assets held for sale are measured at the lower of carrying value or fair value less costs to sell. Any loss resulting from the measurement is recognized in the period the held-for-sale criteria are met. Conversely, gains are not recognized until the date of the sale. When the disposal group is classified as held for sale, depreciation and amortization ceases and the Company tests the assets for impairment.
97
In December 2019, Cigna entered into a definitive agreement to sell its Group Disability and Life insurance business to New York Life Insurance Company for $6.3 billion. The sale is expected to close in the third quarter of 2020 following applicable regulatory approvals and other customary closing conditions. The Company believes this sale is probable and has aggregated and classified the assets and liabilities directly associated with the pending sale of its Group Disability and Life insurance business as held for sale and has reported them separately on our Consolidated Balance Sheet as of December 31, 2019. The assets and liabilities held for sale were as follows:
(In millions) |
| December 31, 2019 | |
Cash and cash equivalents |
| $ | 743 |
Accounts receivable, net |
|
| 521 |
Investments |
|
| 7,709 |
Other assets |
|
| 539 |
Total assets held for sale |
| $ | 9,512 |
Insurance and contractholder liabilities |
| $ | 6,308 |
Other liabilities |
|
| 504 |
Total liabilities held for sale |
| $ | 6,812 |
The business did not meet the criteria to be classified as a discontinued operation as the sale of the business will not have a major effect on the Company’s operations and financial results.
Note 6 – Earnings Per Share (“EPS”)
Accounting policy. The Company computes basic earnings per share using the weighted-average number of unrestricted common and deferred shares outstanding. Diluted earnings per share also includes the dilutive effect of outstanding employee stock options and restricted stock using the treasury stock method and the effect of strategic performance shares.
Basic and diluted earnings per share were computed as follows:
|
|
| 2019 |
| 2018 |
| 2017 | ||||||||||||
(Shares in thousands, dollars in millions, except per share amounts) |
|
| Effect of |
|
|
|
| Effect of |
|
|
|
| Effect of |
|
| ||||
Basic | Dilution | Diluted | Basic | Dilution | Diluted | Basic | Dilution | Diluted | |||||||||||
Shareholders’ net income | $ | 5,104 |
|
| $ | 5,104 | $ | 2,637 | $ |
| $ | 2,637 | $ | 2,237 |
|
| $ | 2,237 | |
Shares |
|
|
|
|
|
|
|
|
|
|
|
|
|
|
|
|
|
| |
Weighted average |
| 375,919 |
|
|
| 375,919 |
| 246,652 |
|
|
| 246,652 |
| 250,892 |
|
|
| 250,892 | |
Common stock equivalents |
|
|
| 3,898 |
| 3,898 |
|
|
| 3,573 |
| 3,573 |
|
|
| 4,180 |
| 4,180 | |
Total shares |
| 375,919 |
| 3,898 |
| 379,817 |
| 246,652 |
| 3,573 |
| 250,225 |
| 250,892 |
| 4,180 |
| 255,072 | |
EPS | $ | 13.58 | $ | (0.14) | $ | 13.44 | $ | 10.69 | $ | (0.15) | $ | 10.54 | $ | 8.92 | $ | (0.15) | $ | 8.77 | |
|
|
|
|
|
|
|
|
|
|
|
|
|
|
|
|
|
|
|
|
The following outstanding employee stock options were not included in the computation of diluted earnings per share because their effect was anti-dilutive.
(In millions) | 2019 | 2018 | 2017 |
Anti-dilutive options | 3.5 | 0.9 | 0.9 |
98
Note 7 – Debt
The outstanding amounts of debt and finance leases were as follows:
|
| December 31, | December 31, | ||
(In millions) | Issuer(s) | 2019 | 2018 | ||
Short-term debt |
|
|
|
|
|
Current maturities: $1,000 million, 2.25% Notes | Express Scripts (1) | $ | - | $ | 995 |
Current maturities: $337 million, 7.25% Notes | ESI (1) |
| - |
| 343 |
Current maturities: $1,000 million, Floating Rate Notes | Cigna |
| 999 |
| - |
Current maturities: $300 million, 5.125% Notes | Old Cigna |
| 300 |
| - |
Current maturities: $1,750 million, 3.2% Notes | Cigna |
| 1,748 |
| - |
Current maturities: $349 million, 4.125% Notes | Cigna |
| 351 |
| - |
Current maturities: $500 million, 2.6% Notes | Express Scripts |
| 496 |
| - |
Current maturities: $400 million, Floating Rate Notes | Express Scripts |
| 400 |
| - |
Current maturities: $250 million, 4.375% Notes | Old Cigna |
| 249 |
| - |
Commercial paper | Cigna/Old Cigna |
| 944 |
| 1,500 |
Other, including finance leases | Other |
| 27 |
| 117 |
Total short-term debt |
| $ | 5,514 | $ | 2,955 |
Long-term debt |
|
|
|
|
|
$250 million, 4.375% Notes due 2020 | Old Cigna | $ | - | $ | 248 |
$300 million, 5.125% Notes due 2020 | Old Cigna |
| - |
| 298 |
$500 million, 4.125% Notes due 2020 | Medco (1) |
| - |
| 506 |
$500 million, 2.6% Notes due 2020 | Express Scripts |
| - |
| 493 |
$1,750 million, 3.2% Notes due 2020 | Cigna |
| - |
| 1,743 |
$400 million, Floating Rate Notes due 2020 | Express Scripts |
| - |
| 399 |
$1,000 million, Floating Rate Notes due 2020 | Cigna |
| - |
| 997 |
$3,000 million, Floating Rate Term Loan due 2021 | Cigna |
| - |
| 2,997 |
$500 million, 3.3% Notes due 2021 | Cigna/Express Scripts (2) |
| 499 |
| 499 |
$300 million, 4.5% Notes due 2021 | Cigna/Old Cigna (2) |
| 298 |
| 297 |
$78 million, 6.37% Notes due 2021 | Other |
| 78 |
| 78 |
$1,000 million, Floating Rate Notes due 2021 | Cigna |
| 998 |
| 996 |
$1,250 million, 3.4% Notes due 2021 | Cigna |
| 1,247 |
| 1,245 |
$1,248 million, 4.75% Notes due 2021 | Cigna/Express Scripts (2) |
| 1,272 |
| 1,285 |
$750 million, 4% Notes due 2022 | Cigna/Old Cigna (2) |
| 747 |
| 746 |
$999 million, 3.9% Notes due 2022 | Cigna/Express Scripts (2) |
| 999 |
| 998 |
$500 million, 3.05% Notes due 2022 | Cigna/Express Scripts (2) |
| 485 |
| 481 |
$17 million, 8.3% Notes due 2023 | Cigna/Old Cigna (2) |
| 17 |
| 17 |
$100 million, 7.65% Notes due 2023 | Cigna/Old Cigna (2) |
| 100 |
| 100 |
$700 million, Floating Rate Notes due 2023 | Cigna |
| 698 |
| 697 |
$1,000 million, 3% Notes due 2023 | Cigna/Express Scripts (2) |
| 966 |
| 959 |
$3,100 million, 3.75% Notes due 2023 | Cigna |
| 3,088 |
| 3,085 |
$1,000 million, 3.5% Notes due 2024 | Cigna/Express Scripts (2) |
| 970 |
| 966 |
$900 million, 3.25% Notes due 2025 | Cigna/Old Cigna (2) |
| 895 |
| 895 |
$2,200 million, 4.125% Notes due 2025 | Cigna |
| 2,188 |
| 2,187 |
$1,500 million, 4.5% Notes due 2026 | Cigna/Express Scripts (2) |
| 1,506 |
| 1,508 |
$1,500 million, 3.4% Notes due 2027 | Cigna/Express Scripts (2) |
| 1,396 |
| 1,386 |
$259 million, 7.875% Debentures due 2027 | Cigna/Old Cigna (2) |
| 259 |
| 259 |
$600 million, 3.05% Notes due 2027 | Cigna/Old Cigna (2) |
| 595 |
| 595 |
$3,800 million, 4.375% Notes due 2028 | Cigna |
| 3,776 |
| 3,774 |
$45 million, 8.3% Step Down Notes due 2033 | Cigna/Old Cigna (2) |
| 45 |
| 45 |
$190 million, 6.15% Notes due 2036 | Cigna/Old Cigna (2) |
| 190 |
| 190 |
$2,200 million, 4.8% Notes due 2038 | Cigna |
| 2,178 |
| 2,178 |
$121 million, 5.875% Notes due 2041 | Cigna/Old Cigna (2) |
| 119 |
| 119 |
$449 million, 6.125% Notes due 2041 | Cigna/Express Scripts (2) |
| 491 |
| 493 |
$317 million, 5.375% Notes due 2042 | Cigna/Old Cigna (2) |
| 315 |
| 315 |
$1,500 million, 4.8% Notes due 2046 | Cigna/Express Scripts (2) |
| 1,465 |
| 1,465 |
$1,000 million, 3.875% Notes due 2047 | Cigna/Old Cigna (2) |
| 988 |
| 988 |
$3,000 million, 4.9% Notes due 2048 | Cigna |
| 2,964 |
| 2,964 |
Other, including finance leases | Other |
| 61 |
| 32 |
Total long-term debt |
| $ | 31,893 | $ | 39,523 |
(1) Express Scripts Holding Company is identified as Express Scripts. Express Scripts, Inc. is identified as ESI. Medco Health Solutions, Inc. is identified as Medco. | |||||
(2) Due to the Exchange of legacy Notes for Cigna Notes, there are two series of outstanding Notes. | |||||
99
Debt repayment. During 2019, the Company repaid approximately $5.2 billion of outstanding obligations, including the $3.0 billion term loan, $1.3 billion in current maturities of long-term debt, $0.7 billion in short term debt and $151 million for the early redemption of the Medco Notes.
Exchange of Legacy Notes for Cigna Notes and Redemption of Medco Notes. In the fourth quarter of 2019, the Company completed an exchange of $12.7 billion of legacy Notes issued by Express Scripts, Medco and Old Cigna for new Notes issued by Cigna with the same interest rates, maturities and other comparable terms. The Company entered into this exchange primarily to simplify its capital structure and reporting obligations. Additionally, in the fourth quarter of 2019, the Company fully redeemed all of the remaining outstanding Medco Notes. As a result of the exchange and redemption, guarantees of obligations under the remaining legacy Notes not exchanged, as well as under Notes issued by Cigna in September 2018 to finance its acquisition of Express Scripts, were released and Cigna is no longer required to separately present Condensed Consolidated Financial Information under Rule 3-10 of Regulation S-X.
Term Loan Credit Agreement. Cigna borrowed $3.0 billion under its Term Loan Credit Agreement to finance the Merger and to pay fees and expenses of the Merger. As of December 31, 2019, the Company repaid the term loan in full and the agreement was terminated.
Notes issued to fund the Express Scripts acquisition. In the third quarter of 2018, the Company issued private placement Notes with registration rights to finance the Express Scripts acquisition. Total proceeds were approximately $20.0 billion. Interest on this debt is generally paid semi-annually except for quarterly interest payments on the floating rate notes. We completed an exchange offer to register such debt in the third quarter of 2019.
Revolving Credit Agreements. Cigna has a Revolving Credit and Letter of Credit Agreement (the “Revolving Credit Agreement”) that matures on April 6, 2023 and is diversified among 23 banks. Cigna can borrow up to $3.25 billion for general corporate purposes, with up to $500 million to issue letters of credit, net of $10 million of letters of credit outstanding under the Revolving Credit Agreement as of December 31, 2019. The Revolving Credit Agreement also includes an option to increase the facility amount up to $500 million and an option to extend the termination date for additional one-year periods, subject to consent of the banks.
In the fourth quarter of 2019, Cigna entered into an additional 364-day revolving credit agreement that matures in October 2020 and is diversified among 23 banks. Under this revolving credit agreement, Cigna can borrow up to $1.0 billion for general corporate purposes. The agreement includes the option to “term out” any revolving loans that are outstanding at maturity by converting them into a term loan maturing on the one-year anniversary of conversion.
The revolving credit agreements contain customary covenants and restrictions including a financial covenant that the Company’s leverage ratio may not exceed 60%.
Commercial Paper outstanding as of December 31, 2019 had an average interest rate of 2.11%.
The Company was in compliance with its debt covenants as of December 31, 2019.
Maturities of outstanding long-term debt and finance leases are as follows:
| Scheduled Maturities | |||
(In millions) | Long-term Debt (1) | Finance Leases | ||
2020 | $ | 4,549 | $ | 27 |
2021 | $ | 4,376 | $ | 18 |
2022 | $ | 2,249 | $ | 16 |
2023 | $ | 4,917 | $ | 7 |
2024 | $ | 1,000 | $ | 5 |
Maturities after 2024 | $ | 19,581 | $ | 15 |
|
|
|
|
|
(1) Long-term debt maturity amounts include current maturities of long-term debt and exclude maturities of finance leases. | ||||
Interest expense on long-term and short-term debt was $1.6 billion in 2019, $507 million in 2018 and $243 million in 2017, excluding $209 million after-tax loss on the early extinguishment of debt in 2017.
100
Note 8 – Common and Preferred Stock
As a result of Cigna's acquisition of Express Scripts on December 20, 2018, Old Cigna shareholders exchanged each of their shares for a share of Cigna common stock and shareholders of Express Scripts received 0.2434 of a share of Cigna (and $48.75 in cash) for each share of Express Scripts. Following the Merger, Old Cigna was de-listed and shares of Cigna were listed on the New York Stock Exchange for trading.
Cigna (and, prior to the Merger, Old Cigna) has a total of million shares of $ par value preferred stock authorized for issuance. shares of preferred stock were outstanding at December 31, 2019, 2018 or 2017.
The following table presents the share activity of Old Cigna and Cigna for the years ended December 31, 2019, 2018 and 2017.
(Shares in thousands) | 2019 | 2018 | 2017 |
Common: Par value $0.25; 600,000 shares authorized - Old Cigna |
|
|
|
Outstanding - January 1, |
| 243,967 | 256,869 |
Issued for stock option exercises and other benefit plans |
| 1,118 | 2,761 |
Repurchased common stock |
| (1,300) | (15,663) |
Balance, December 20, 2018 (Merger Date) |
| 243,785 |
|
Exchange of Old Cigna shares for shares of Cigna |
| (243,785) |
|
Outstanding - December 31, |
| - | 243,967 |
Retirement of treasury stock on December 20, 2018 |
| (52,358) |
|
Exchange of Old Cigna certificated treasury stock for new Cigna certificated treasury stock |
| (2) |
|
Treasury stock - December 31, |
| - | 52,178 |
Issued - December 31, |
| - | 296,145 |
|
|
|
|
Common: Par value $0.01; 600,000 shares authorized - Cigna |
|
|
|
Outstanding - January 1, | 380,924 | - |
|
Shares issued to Old Cigna shareholders |
| 243,785 |
|
Shares issued to Express Scripts shareholders |
| 137,337 |
|
Issued for stock option exercises and other benefit plans | 3,413 | 91 |
|
Repurchased common stock | (11,806) | (289) |
|
Outstanding - December 31, | 372,531 | 380,924 |
|
Treasury stock | 13,012 | 570 |
|
Issued - December 31, | 385,543 | 381,494 |
|
Note 9 – Insurance and Contractholder Liabilities
A. Account Balances – Insurance and Contractholder Liabilities
As of December 31, 2019 and 2018, the Company’s insurance and contractholder liabilities were comprised of the following:
|
| December 31, 2019 |
| December 31, 2018 |
| ||||||||
(In millions) |
| Current |
| Non-current |
| Total |
| Current |
| Non-current |
| Total |
|
Contractholder deposit funds | $ | 600 | $ | 7,139 | $ | 7,739 | $ | 641 | $ | 7,365 | $ | 8,006 |
|
Future policy benefits |
| 553 |
| 9,281 |
| 9,834 |
| 740 |
| 8,981 |
| 9,721 |
|
Unpaid claims and claim expenses |
|
|
|
|
|
|
|
|
|
|
|
|
|
Integrated Medical |
| 2,875 |
| 17 |
| 2,892 |
| 2,678 |
| 19 |
| 2,697 |
|
Other segments |
| 2,529 |
| 3,474 |
| 6,003 |
| 2,394 |
| 3,230 |
| 5,624 |
|
Unearned premiums |
| 453 |
| 360 |
| 813 |
| 348 |
| 379 |
| 727 |
|
Total |
| 7,010 |
| 20,271 |
| 27,281 |
| 6,801 |
| 19,974 |
| 26,775 |
|
Insurance and contractholder liabilities classified as liabilities held for sale (1) |
| (2,089) |
| (4,219) |
| (6,308) |
|
|
|
|
|
|
|
Insurance and contractholder liabilities per Consolidated Balance Sheets | $ | 4,921 | $ | 16,052 | $ | 20,973 | $ | 6,801 | $ | 19,974 | $ | 26,775 |
|
(1) Amounts classified as liabilities held for sale primarily include $4.9 billion of unpaid claims, $717 million of contractholder deposit funds and $653 million of future policy benefits. |
| ||||||||||||
Insurance and contractholder liabilities expected to be paid within one year are classified as current.
101
Accounting Policy - Contractholder Deposit Funds. Liabilities for contractholder deposit funds primarily include deposits received from customers for investment-related and universal life products and investment earnings on their fund balances. These liabilities are adjusted to reflect administrative charges and, for universal life fund balances, mortality charges. In addition, this caption includes: 1) premium stabilization reserves under group insurance contracts representing experience refunds left with the Company to pay future premiums; 2) deposit administration funds used to fund non-pension retiree insurance programs; 3) retained asset accounts and 4) annuities or supplementary contracts without significant life contingencies. Interest credited on these funds is accrued ratably over the contract period.
Accounting Policy - Future Policy Benefits. Future policy benefits represent the present value of estimated future obligations under long-term life and supplemental health insurance policies and annuity products currently in force. These obligations are estimated using actuarial methods and consist primarily of reserves for annuity contracts, life insurance benefits, GMDB contracts (see Note 10 for additional information) and certain health, life and accident insurance products of our International Markets segment.
Obligations for annuities represent specified periodic benefits to be paid to an individual or groups of individuals over their remaining lives. Obligations for life insurance policies and GMDB contracts represent benefits expected to be paid to policyholders, net of future premiums expected to be received. Management estimates these obligations based on assumptions as to premiums, interest rates, mortality or morbidity, future claim adjudication expenses and surrenders, allowing for adverse deviation as appropriate. Mortality, morbidity and surrender assumptions are based on the Company’s own experience and published actuarial tables. Interest rate assumptions are based on management’s judgment considering the Company’s experience and future expectations, and range from 1% to 9%. Obligations for the run-off settlement annuity business include adjustments for realized and unrealized investment returns consistent with GAAP when a premium deficiency exists.
B. Unpaid Claims and Claim Expenses – Integrated Medical
This liability reflects estimates of the ultimate cost of claims that have been incurred but not reported, including expected development on reported claims, those that have been reported but not yet paid (reported claims in process), and other medical care expenses and services payable that are primarily comprised of accruals for incentives and other amounts payable to health care professionals and facilities.
Accounting policy. The Company uses actuarial principles and assumptions that are consistently applied each reporting period and recognizes the actuarial best estimate of the ultimate liability along with a margin for adverse deviation. This approach is consistent with actuarial standards of practice that the liabilities be adequate under moderately adverse conditions.
The Company compares key assumptions used to establish the medical costs payable to actual experience for each reporting period. The unpaid claims liability is adjusted through current period shareholders’ net income when actual experience differs from these assumptions. Additionally, the Company evaluates expected future developments and emerging trends that may impact key assumptions. The process used to determine this liability requires the Company to make critical accounting estimates that involve considerable judgment, reflecting the variability inherent in forecasting future claim payments. These estimates are highly sensitive to changes in the Company’s key assumptions, specifically completion factors and medical cost trend.
The liability is primarily calculated using “completion factors” developed by comparing the claim incurral date to the date claims were paid. Completion factors are impacted by several key items including changes in: 1) electronic (auto-adjudication) versus manual claim processing; 2) provider claims submission rates; 3) membership and 4) the mix of products. The Company uses historical completion factors combined with an analysis of current trends and operational factors to develop current estimates of completion factors. The Company estimates the liability for claims incurred in each month by applying the current estimates of completion factors to the current paid claims data. This approach implicitly assumes that historical completion rates will be a useful indicator for the current period.
The Company relies more heavily on medical cost trend analysis that reflects expected claim payment patterns and other relevant operational considerations for more recent months. Medical cost trend is primarily impacted by medical service utilization and unit costs that are affected by changes in the level and mix of health benefits offered, including inpatient, outpatient and pharmacy, the impact of copays and deductibles, changes in provider practices and changes in consumer demographics and consumption behavior.
The total of incurred but not reported liabilities plus expected development on reported claims, including reported claims in process, was $2.7 billion at December 31, 2019 and $2.5 billion at December 31, 2018.
102
Activity in the unpaid claims liability for the Integrated Medical segment for the years ended December 31 was as follows:
(In millions) | 2019 | 2018 | 2017 | |||
Balance at January 1, | $ | 2,697 | $ | 2,420 | $ | 2,261 |
Less: Reinsurance and other amounts recoverable |
| 264 |
| 262 |
| 273 |
Balance at January 1, net |
| 2,433 |
| 2,158 |
| 1,988 |
Acquired, net |
| - |
| 40 |
| - |
Incurred costs related to: |
|
|
|
|
|
|
Current year |
| 24,368 |
| 21,331 |
| 19,334 |
Prior years |
| (165) |
| (173) |
| (227) |
Total incurred |
| 24,203 |
| 21,158 |
| 19,107 |
Paid costs related to: |
|
|
|
|
|
|
Current year |
| 21,851 |
| 18,978 |
| 17,179 |
Prior years |
| 2,196 |
| 1,945 |
| 1,758 |
Total paid |
| 24,047 |
| 20,923 |
| 18,937 |
Balance at December 31, net |
| 2,589 |
| 2,433 |
| 2,158 |
Add: Reinsurance and other amounts recoverable |
| 303 |
| 264 |
| 262 |
Balance at December 31, | $ | 2,892 | $ | 2,697 | $ | 2,420 |
Reinsurance and other amounts recoverable reflect amounts due from reinsurers and policyholders to cover incurred but not reported and pending claims for certain business for which the Company administers the plan benefits without any right of offset. See Note 10 for additional information on reinsurance.
Variances in incurred costs related to prior years’ unpaid claims and claims expenses that resulted from the differences between actual experience and the Company’s key assumptions were as follows:
|
| Year Ended |
| ||||||
(Dollars in millions) |
| December 31, 2019 | December 31, 2018 |
| |||||
|
|
| $ | %(1) |
|
| $ | %(2) |
|
Actual completion factors |
| $ | 90 | 0.4 | % | $ | 92 | 0.5 | % |
Medical cost trend |
|
| 75 | 0.4 |
|
| 72 | 0.4 |
|
Other |
|
| - | - |
|
| 9 | - |
|
Total favorable variance |
| $ | 165 | 0.8 | % | $ | 173 | 0.9 | % |
(1) Percentage of current year incurred costs as reported for the year ended December 31, 2018. | |||||||||
(2) Percentage of current year incurred costs as reported for the year ended December 31, 2017. | |||||||||
Incurred costs related to prior years in the table above, although adjusted through shareholders’ net income, do not directly correspond to an increase or decrease to shareholders’ net income. The primary reason for this difference is that decreases to prior year incurred costs pertaining to the portion of the liability established for moderately adverse conditions are not considered as impacting shareholders’ net income if they are offset by increases in the current year provision for moderately adverse conditions.
Prior year development increased shareholders’ net income by $67 million ($85 million before-tax) for the year ended December 31, 2019, compared with $77 million ($97 million before-tax) for the year ended December 31, 2018. Favorable prior year development in both years reflects lower than expected utilization of medical services.
103
The following table depicts the incurred and paid claims development as of December 31, 2019 (net of reinsurance), claims frequency metrics and incurred but not reported liabilities reported in the Integrated Medical segment. The information about incurred and paid claims development for the year ended December 31, 2018 is presented as supplementary information and is unaudited.
| Incurred Costs |
|
|
|
| |||
Incurral Year | 2018 (Unaudited) | 2019 | Unpaid Claims & Claim Expenses | Claims Frequency | ||||
(In millions) |
|
|
|
|
| |||
2018 | $ | 20,458 | $ | 20,320 | $ | 58 |
| 2.9 million |
2019 |
|
|
| 23,306 | $ | 2,386 |
| 3.5 million |
Cumulative incurred costs plus acquired for the periods presented | $ | 43,626 |
|
|
|
| ||
|
|
|
|
|
|
|
|
|
| Cumulative Costs Paid |
|
|
|
| |||
Incurral Year | 2018 (Unaudited) | 2019 |
|
| ||||
2018 | $ | 18,192 | $ | 20,262 |
|
|
|
|
2019 |
|
|
| 20,920 |
|
|
|
|
Cumulative paid costs for the periods presented | $ | 41,182 |
|
|
|
| ||
|
|
|
|
|
|
|
|
|
Outstanding liabilities for the periods presented, net of reinsurance | $ | 2,444 |
|
|
|
| ||
Other long-duration liabilities not included in development table above |
| 145 |
|
|
|
| ||
Net unpaid claims and claims expenses - Integrated Medical |
| 2,589 |
|
|
|
| ||
Reinsurance and other amounts recoverable |
| 303 |
|
|
|
| ||
Unpaid claims and claim expenses - Integrated Medical | $ | 2,892 |
|
|
|
| ||
More than of health claims for an accident year are paid within one year of their incurred date.
There is no single or common claim frequency metric used in the health care industry. The Company believes a relevant metric for its health insurance business is the number of customers for whom an insured medical claim was paid. Customers for whom no insured medical claim was paid are excluded from the calculation. Claims that did not result in a liability are not included in the frequency metric.
C. Unpaid Claims and Claim Expenses – Group Disability and Other and International Markets
Accounting policy. Liabilities for unpaid claims and claim expenses are established by book of business within Group Disability and Other and International Markets. Unpaid claims and claim expenses within the Group Disability and Other and International Markets segments consist of (1) case or claims reserves for reported claims that are unpaid as of the balance sheet date; (2) incurred but not reported reserves for claims when the insured event has occurred but has not been reported to the Company and (3) loss adjustment expense reserves for the expected costs of settling these claims. The Company consistently estimates incurred but not yet reported losses using actuarial principles and assumptions based on historical and projected claim incidence patterns, claim size and the expected payment period. The Company recognizes the actuarial best estimate of the ultimate liability within a level of confidence, consistent with actuarial standards of practice that the liabilities be adequate under moderately adverse conditions. The Company immediately records an adjustment in medical costs and other benefit expenses when estimates of these liabilities change.
Liabilities for unpaid claims and claim expenses within the group disability and life business reflect the following primary products: long-term and short-term disability, life insurance and accident coverages. The majority of the Company’s liability for disability claims consists of “disabled life reserves”, measured as the present value of estimated future benefit payments, including expected development, for each reported claim that is currently receiving benefit payments over the expected disability period or pending a decision on eligibility for benefits. The Company projects the expected disability period by using historical resolution rates combined with an analysis of current trends and operational factors to develop current estimates of resolution rates. Expected claim resolution rates may vary based upon the Company’s experience for the anticipated disability period, the covered benefit period, the cause of disability, the benefit design and the claimant’s age, gender and income level. The gross monthly benefit is reduced (offset) by disability income received under other benefit programs, most commonly Social Security Disability Income, workers’ compensation, statutory disability or other group benefit plans. The Company estimates the probability and amount of future offset awards and lapses based on the Company’s experience for certain offsets not yet finalized.
104
The Company also establishes a liability for the expected present value of future benefit payments for known claims that have recently been resolved but may reopen in the future, based on Company experience. Prior to a claim becoming known, the Company establishes a liability for incurred but not reported claims using standard actuarial techniques and calculations based on completion factors and loss ratio assumptions using the Company’s experience combined with an analysis of current trends and operational factors. Completion factors are impacted by several key items including changes in claim inventory levels, claim payment patterns, changes in business volume and other factors. Loss ratio assumptions are developed using historical Company experience, adjusted prospectively for expected changes in the underlying business including rate actions, persistency and inforce growth.
Liability balance details. The liability details for unpaid claims and claim expenses are as follows:
(In millions) | 2019(1) | 2018 | ||
International Markets | $ | 844 | $ | 758 |
Group Disability and Other |
|
|
|
|
Group Disability and Life |
| 4,972 |
| 4,674 |
Other Operations |
| 187 |
| 192 |
Total Group Disability and Other |
| 5,159 |
| 4,866 |
Unpaid claims and claim expenses Group Disability and Other and International Markets | $ | 6,003 | $ | 5,624 |
(1) Includes Unpaid claims amounts classified as Liabilities held for sale. | ||||
|
|
|
|
|
The Company discounts certain liabilities, predominantly long-term disability liabilities, because benefits payments are made over extended periods. Discount rate assumptions for these liabilities are based on projected investment returns for the supporting asset portfolios. Details of the Company’s Group Disability and Life unpaid claim discounted liability balance as of December 31 were as follows:
(In billions) |
| 2019(1) |
| 2018 |
| |||||||
Discounted liabilities | $ |
|
|
| 4.5 |
| $ |
|
|
| 4.2 |
|
Aggregate amount of discount | $ |
|
|
| 1.2 |
| $ |
|
|
| 1.1 |
|
Range of discount rates |
| 4.0 | % | - | 5.2 | % |
| 4.2 | % | - | 5.2 | % |
(1) Includes unpaid claims amounts classified as Liabilities held for sale. |
| |||||||||||
Activity in the Company’s liabilities for unpaid claims and claim expenses, excluding Other Operations, are presented in the following table. Liabilities associated with Other Operations are excluded because they pertain to obligations for long-duration insurance contracts or, if short-duration, the liabilities have been fully reinsured.
(In millions) | 2019(1) | 2018 | 2017 | |||
Balance at January 1, | $ | 5,432 | $ | 5,274 | $ | 4,997 |
Less: Reinsurance |
| 156 |
| 140 |
| 123 |
Balance at January 1, net |
| 5,276 |
| 5,134 |
| 4,874 |
Incurred claims related to: |
|
|
|
|
|
|
Current year |
| 5,616 |
| 5,350 |
| 5,097 |
Prior years |
|
|
|
|
|
|
Interest accretion |
| 152 |
| 156 |
| 163 |
All other incurred |
| (40) |
| (147) |
| (43) |
Total incurred |
| 5,728 |
| 5,359 |
| 5,217 |
Paid claims related to: |
|
|
|
|
|
|
Current year |
| 3,488 |
| 3,391 |
| 3,229 |
Prior years |
| 1,873 |
| 1,808 |
| 1,757 |
Total paid |
| 5,361 |
| 5,199 |
| 4,986 |
Acquisitions |
| - |
| 23 |
| - |
Foreign currency |
| (11) |
| (41) |
| 29 |
Balance at December 31, net |
| 5,632 |
| 5,276 |
| 5,134 |
Add: Reinsurance |
| 184 |
| 156 |
| 140 |
Balance at December 31, | $ | 5,816 | $ | 5,432 | $ | 5,274 |
(1) Includes unpaid claims amounts classified as Liabilities held for sale. | ||||||
Reinsurance in the table above reflects amounts due from reinsurers related to unpaid claims liabilities. The Company’s insurance subsidiaries enter into agreements with other companies primarily to limit losses from large exposures and to permit recovery of a portion of incurred losses. See Note 10 for additional information on reinsurance.
105
The majority of the liability for unpaid claims and claim expenses is related to disability claims with long-tailed payouts. Interest earned on assets backing these liabilities is an integral part of pricing and reserving. Therefore, interest accreted on prior year balances is shown as a separate component of prior year incurred claims and reported in medical costs and other benefit expenses in the income statement. This interest is calculated by applying the average discount rate used in determining the liability balance to the average liability balance over the period. The remaining prior year incurred claims amount primarily reflects updates to the Company’s liability estimates and variances between actual experience during the period relative to the assumptions and expectations reflected in determining the liability. Assumptions reflect the Company’s expectations over the life of the book of business and will vary from actual experience in any period, both favorably and unfavorably, with variation in resolution rates being the most significant driver for the long-term disability business. Favorable prior year incurred claims for the years ended December 31, 2019 and December 31, 2018 primarily reflect favorable long-term disability and life experience. The favorable experience is driven by higher resolution rate experience relative to expectations reflected in the prior year reserve and lower than expected incidence.
Long-term disability development tables. The table below presents information about incurred and paid claims development as of December 31, 2019 (net of reinsurance), total incurred but not reported liabilities and cumulative claims frequency for the Company’s long-term disability book of business. The information about incurred and paid claims development for the years ended 2012 through 2018 is presented as supplementary information and is unaudited. As permitted under GAAP, the Company presents development table information beginning in 2012 because obtaining information beyond this period was impracticable as historical data was not maintained in such detail
(In millions, except for claims frequency) | ||||||||||||||||||||
|
|
|
|
|
|
|
|
|
|
|
|
|
|
|
|
| Incurred |
|
| |
| Incurred Claims (undiscounted) | But Not |
|
| ||||||||||||||||
| Unaudited |
|
| Reported | Claims | |||||||||||||||
Accident Year |
| 2012 | 2013 | 2014 | 2015 | 2016 | 2017 | 2018 | 2019 | Liabilities (1) | Frequency | |||||||||
2012 | $ | 995 | $ | 951 | $ | 889 | $ | 876 | $ | 883 | $ | 880 | $ | 861 | $ | 860 | $ | - |
| 21,186 |
2013 |
|
|
| 1,063 |
| 1,037 |
| 1,062 |
| 1,072 |
| 1,057 |
| 1,032 |
| 1,030 |
| - |
| 23,526 |
2014 |
|
|
|
|
| 1,158 |
| 1,129 |
| 1,167 |
| 1,146 |
| 1,094 |
| 1,081 |
| - |
| 25,324 |
2015 |
|
|
|
|
|
|
| 1,184 |
| 1,154 |
| 1,185 |
| 1,160 |
| 1,148 |
| - |
| 25,781 |
2016 |
|
|
|
|
|
|
|
|
| 1,246 |
| 1,184 |
| 1,199 |
| 1,202 |
| - |
| 25,577 |
2017 |
|
|
|
|
|
|
|
|
|
|
| 1,226 |
| 1,193 |
| 1,207 |
| 1 |
| 23,959 |
2018 |
|
|
|
|
|
|
|
|
|
|
|
|
| 1,348 |
| 1,267 |
| 10 |
| 25,154 |
2019 |
|
|
|
|
|
|
|
|
|
|
|
|
|
|
| 1,434 |
| 533 |
| 13,061 |
Cumulative incurred claims for the periods presented | $ | 9,229 |
|
|
|
| ||||||||||||||
(1) Incurred but not reported amounts are included in 2019 incurred claims. |
|
|
|
| ||||||||||||||||
|
|
|
|
|
|
|
|
|
|
|
|
|
|
|
|
|
|
|
|
|
| Cumulative Paid Claims |
|
|
|
| |||||||||||||||
| Unaudited |
|
|
|
|
|
| |||||||||||||
Accident Year |
| 2012 | 2013 | 2014 | 2015 | 2016 | 2017 | 2018 | 2019 |
|
| |||||||||
2012 | $ | 81 | $ | 288 | $ | 429 | $ | 504 | $ | 571 | $ | 621 | $ | 661 | $ | 693 |
|
|
|
|
2013 |
|
|
| 92 |
| 342 |
| 503 |
| 600 |
| 670 |
| 732 |
| 780 |
|
|
|
|
2014 |
|
|
|
|
| 111 |
| 379 |
| 575 |
| 667 |
| 743 |
| 803 |
|
|
|
|
2015 |
|
|
|
|
|
|
| 114 |
| 417 |
| 603 |
| 702 |
| 783 |
|
|
|
|
2016 |
|
|
|
|
|
|
|
|
| 122 |
| 411 |
| 598 |
| 709 |
|
|
|
|
2017 |
|
|
|
|
|
|
|
|
|
|
| 110 |
| 396 |
| 590 |
|
|
|
|
2018 |
|
|
|
|
|
|
|
|
|
|
|
|
| 116 |
| 434 |
|
|
|
|
2019 |
|
|
|
|
|
|
|
|
|
|
|
|
|
|
| 126 |
|
|
|
|
Cumulative paid claims for the periods presented | $ | 4,918 |
|
|
|
| ||||||||||||||
|
|
|
|
|
|
|
|
|
|
|
|
|
|
|
|
|
|
|
|
|
All outstanding liabilities for the periods presented, net of reinsurance | $ | 4,311 |
|
|
|
| ||||||||||||||
All outstanding liabilities prior to 2012, net of reinsurance |
| 771 |
|
|
|
| ||||||||||||||
Impact of discounting |
| (891) |
|
|
|
| ||||||||||||||
Liability for long-term disability unpaid claims and claim expenses, net of reinsurance (1)(2) | $ | 4,191 |
|
|
|
| ||||||||||||||
(1) Includes Unpaid claims amounts classified as Liabilities held for sale. |
|
|
|
| ||||||||||||||||
(2) Includes approximately $3.5 billion of disabled life reserves for individuals on long-term disability. |
|
|
|
| ||||||||||||||||
106
The claims frequency metric used for the Company’s long-term disability line of business represents the number of unique claim events for which benefits have been approved and payments made. Claim events are assigned a unique claimant identifier and incurral date. Thus, if an individual has multiple claims for different disabling events (and therefore different incurral dates), each will be determined to be a unique claim event. However, if an individual receives multiple benefits under more than one policy (for example for supplemental disability benefits such as pension contribution benefits or survivor benefits), the Company treats this as a single claim occurrence because they related to the same claim event. Claims frequency metrics for the most recent year are expected to be low reflecting the long-term disability product features including waiting and elimination periods that result in delayed eligibility for contract benefits. Claims that did not result in a liability are not included in the frequency metric.
The following is supplementary and unaudited information about average historical claims payout patterns for the long-term disability business for the years presented in the development table as of December 31, 2019. The average annual percentage payout of incurred claims, net of reinsurance, is approximately 9% in year one, 25% in year two, 16% in year three, 9% in year four, 7% in year five, 6% in year six, 5% in year seven and 4% in year eight.
The following table reconciles the long-term disability net incurred and paid claims development table to the liability for unpaid claims and claim expenses in the Company’s Consolidated Balance Sheets as of December 31, 2019.
(In millions) |
|
|
Net outstanding liabilities – Group Disability and Life businesses |
|
|
Long-term disability liabilities, net of reinsurance | $ | 4,191 |
Other short-duration insurance books of business, net of reinsurance |
| 652 |
Liabilities for unpaid claims and claim expenses, net of reinsurance |
| 4,843 |
Reinsurance recoverable on unpaid claims – Group Disability and Life businesses |
|
|
Long-term disability |
| 117 |
Other short-duration insurance books of business |
| 12 |
Total reinsurance recoverable on unpaid claims |
| 129 |
Total liability for unpaid claims and claim expenses – Group Disability and Life businesses |
| 4,972 |
International Markets segment |
| 844 |
Other Operations |
| 187 |
Unpaid claims and claim expenses - Group Disability and Other and International Markets(1) | $ | 6,003 |
(1) Includes Unpaid claims amounts classified as Liabilities held for sale. | ||
|
|
|
The Group Disability and Life and International Markets books of business, net of reinsurance, also include liabilities for life, accident and short-term disability insurance products. Liabilities for these products are typically complete within one year. Claim development on these liabilities is largely driven by completion factors and loss ratio assumptions.
Note 10 – Reinsurance
The Company’s insurance subsidiaries enter into agreements with other insurance companies to assume and cede reinsurance. Reinsurance is ceded primarily in acquisition and disposition transactions when the underwriting company is not being acquired. Reinsurance is also used to limit losses from large exposures and to permit recovery of a portion of direct or assumed losses. Reinsurance does not relieve the originating insurer of liability. Therefore, reinsured liabilities must continue to be reported along with the related reinsurance recoverables. The Company regularly evaluates the financial condition of its reinsurers and monitors concentrations of its credit risk.
107
A.Reinsurance Recoverables
The majority of the Company’s reinsurance recoverables resulted from acquisition and disposition transactions in which the underwriting company was not acquired. Components of the Company’s reinsurance recoverables are presented in the following table. The table below includes $222 million as of December 31, 2019 and $297 million as of December 31, 2018 of current reinsurance recoverables that are reported in other current assets.
(Dollars in millions) |
| December 31, | December 31, |
|
| Collateral and Other Terms | |||
| Line of Business | Reinsurer(s) | 2019 (1) | 2018 |
|
| at December 31, 2019 | ||
Ongoing Operations |
|
|
|
|
|
|
| ||
| Integrated Medical, International Markets, Group Disability, COLI(1) | Various | $ | 514 | $ | 464 |
|
| Balances range from less than $1 million up to $72 million. Approximately 70% of the balance is from companies rated as investment grade by Standard & Poor’s. |
| Total recoverables related to ongoing operations |
| 514 |
| 464 |
|
|
| |
Acquisition, disposition or runoff activities |
|
|
|
|
|
|
| ||
| Individual Life and Annuity (sold in 1998) | Lincoln National Life and Lincoln Life & Annuity of New York |
| 3,174 |
| 3,312 |
|
| Both companies’ ratings were well above the level that would trigger a contractual obligation to fully secure the outstanding balance. |
| GMDB (effectively exited in 2013) | Berkshire |
| 787 |
| 893 |
|
| 100% secured by assets in a trust. |
| Retirement Benefits Business (sold in 2004) | Prudential Retirement Insurance and Annuity |
| 711 |
| 787 |
|
| 100% secured by assets in a trust. |
| Supplemental Benefits Business (2012 acquisition) | Great American Life |
| 238 |
| 261 |
|
| 100% secured by assets in a trust. |
| Other | Various |
| 71 |
| 87 |
|
| 100% secured by assets in a trust or other deposits. |
| Total recoverables related to acquisition, disposition or runoff activities |
| 4,981 |
| 5,340 |
|
|
| |
Total reinsurance recoverables |
| $ | 5,495 | $ | 5,804 |
|
|
| |
(1) Includes $173 million of recoverables classified as Assets held for sale. | |||||||||
The Company bears the risk of loss if its reinsurers and retrocessionaires do not meet or are unable to meet their reinsurance obligations to the Company. The Company reviews its reinsurance arrangements and establishes reserves against the recoverables if recovery is not considered probable.
108
B.Effects of Reinsurance
The following table presents direct, assumed and ceded premiums for both short-duration and long-duration insurance contracts. It also presents reinsurance recoveries that have been netted against benefit expenses in the Company’s Consolidated Statements of Income.
(In millions) | 2019 | 2018 | 2017 | |||
Premiums |
|
|
|
|
|
|
Short-duration contracts |
|
|
|
|
|
|
Direct | $ | 35,690 | $ | 32,148 | $ | 28,838 |
Assumed |
| 64 |
| 77 |
| 199 |
Ceded |
| (203) |
| (182) |
| (150) |
Total short-duration contract premiums |
| 35,551 |
| 32,043 |
| 28,887 |
Long-duration contracts |
|
|
|
|
|
|
Direct |
| 4,352 |
| 4,268 |
| 3,748 |
Assumed |
| 105 |
| 116 |
| 130 |
Ceded |
|
|
|
|
|
|
Individual life insurance and annuity business sold |
| (126) |
| (133) |
| (143) |
Other |
| (168) |
| (181) |
| (131) |
Total long-duration contract premiums |
| 4,163 |
| 4,070 |
| 3,604 |
Total premiums | $ | 39,714 | $ | 36,113 | $ | 32,491 |
Reinsurance recoveries |
|
|
|
|
|
|
Individual life insurance and annuity business sold | $ | 238 | $ | 249 | $ | 259 |
Other |
| 157 |
| 203 |
| 66 |
Total reinsurance recoveries | $ | 395 | $ | 452 | $ | 325 |
The effects of reinsurance on written premiums for short-duration contracts were from the recognized premium amounts shown in the table above.
C.Effective Exit of GMDB and GMIB Business
The Company entered into an agreement with Berkshire to effectively exit the GMDB and GMIB business via a reinsurance transaction in 2013. Berkshire reinsured 100% of the Company’s future claim payments in this business, net of other reinsurance arrangements existing at that time. The reinsurance agreement is subject to an overall limit with approximately $3.3 billion remaining at December 31, 2019.
GMDB is accounted for as reinsurance and GMIB assets and liabilities are reported as derivatives at fair value as discussed below. GMIB assets are reported in other current assets and other assets and GMIB liabilities are reported in accrued expenses and other liabilities and other non-current liabilities.
GMDB
The GMDB exposure arises under annuities written by ceding companies that guarantee the benefit received at death. The Company’s exposure arises when the guaranteed minimum death benefit exceeds the fair value of the related mutual fund investments at the time of a contractholder’s death.
Accounting policy. The Company estimates the gross liability and reinsurance recoverable with an internal model based on the Company’s experience and future expectations over an extended period, consistent with the long-term nature of this product. As a result of the reinsurance transaction, reserve increases have a corresponding increase in the recorded reinsurance recoverable, provided the increased recoverable remains within the overall Berkshire limit (including the GMIB asset presented below).
109
The following table presents the account value, net amount at risk and the number of contractholders for guarantees assumed by the Company in the event of death. The net amount at risk is the amount that the Company would have to pay in excess of the contractholders’ account value if all contractholders died as of the specified date. The Company should be reimbursed in full for these payments unless the Berkshire reinsurance limit is exceeded.
| December 31, | December 31, | ||
(Dollars in millions, excludes impact of reinsurance ceded) | 2019 | 2018 | ||
Account value | $ | 9,110 | $ | 8,402 |
Net amount at risk | $ | 1,764 | $ | 2,466 |
Average attained age of contractholders (weighted by exposure) |
| 76 |
| 74 |
Number of contractholders (estimated) |
| 200,000 |
| 220,000 |
GMIB
The Company reinsured contracts with issuers of GMIB products. The Company’s exposure represents the excess of a contractually guaranteed amount over the level of variable annuity account values. Payment by the Company depends on the actual account value in the related underlying mutual funds and the level of interest rates when the contractholders elect to receive minimum income payments that can only occur within 30 days of a policy anniversary after the appropriate waiting period. The Company has purchased retrocessional coverage (“GMIB assets”) for these contracts including retrocessional coverage from Berkshire.
Accounting policy. The Company reports GMIB liabilities and assets as derivatives at fair value because cash flows of these liabilities and assets are affected by equity markets and interest rates, but are without significant life insurance risk and are settled in lump sum payments. The Company receives and pays fees periodically based on either contractholders’ account values or deposits increased at a contractual rate. The Company will also pay and receive cash depending on changes in account values and interest rates when contractholders first elect to receive minimum income payments. Cash flows on these contracts are reported in operating activities.
Assumptions used in fair value measurement. GMIB assets and liabilities are established using capital market assumptions and assumptions related to future annuitant behavior (including mortality, lapse, and annuity election rates). The Company classifies GMIB assets and liabilities in Level 3 of the fair value hierarchy described in Note 12 because assumptions related to future annuitant behavior are largely unobservable.
The only assumption expected to impact future shareholders’ net income is non-performance risk. The non-performance risk adjustment reflects a market participant’s view of nonpayment risk by adding an additional spread to the discount rate in the calculation of both (a) the GMIB liabilities to be paid by the Company and (b) the GMIB assets to be paid by the reinsurers, after considering collateral. The impact of non-performance risk was immaterial for twelve months ended December 31, 2019 and 2018.
GMIB liabilities totaling $688 million as of December 31, 2019 and $706 million as of December 31, 2018 were reported in accrued expenses and other liabilities and other non-current liabilities. There were three reinsurers covering 100% of the GMIB exposures as of December 31, 2019 and December 31, 2018 as follows:
(In millions) |
|
|
|
|
|
|
|
|
Line of Business | Reinsurer | December 31, 2019 | December 31, 2018 |
| Collateral and Other Terms at December 31, 2019 |
| ||
GMIB | Berkshire | $ | 332 | $ | 341 |
| 100% were secured by assets in a trust. |
|
| Sun Life Assurance Company of Canada |
| 202 |
| 208 |
|
|
|
| Liberty Re (Bermuda) Ltd. |
| 179 |
| 184 |
| 96% were secured by assets in a trust. |
|
Total GMIB recoverables reported in other current assets and other assets | $ | 713 | $ | 733 |
|
|
| |
Amounts included in shareholders net income for GMIB assets and liabilities were in 2019, 2018 or 2017.
110
Note 11 – Investments, Investment Income and Gains and Losses
Cigna’s investment portfolio consists of a broad range of investments including debt securities, equity securities, commercial mortgage loans, policy loans, other long-term investments, short-term investments and derivative financial instruments. The sections below provide more detail regarding our accounting policies, investment balances, net investment income and realized investment gains and losses. See Note 12 for information about valuing the Company’s investment portfolio. Debt securities, commercial mortgage loans, derivative financial instruments and short-term investments with contractual maturities during the next twelve months are classified on the balance sheet as current investments, unless they are held as statutory deposits or restricted for other purposes and then they are classified in long-term investments. Equity securities may include exchange traded funds that are used in our cash management strategy and classified as current investments. All other investments are classified as long-term investments. The following table summarizes the Company’s investments by category and current or long-term classification.
|
|
|
|
|
|
|
|
|
|
|
|
|
|
|
| December 31, 2019 (1) |
| December 31, 2018 |
| ||||||||
(In millions) |
| Current |
| Long-term |
| Total |
| Current |
| Long-term |
| Total |
|
Debt securities | $ | 928 | $ | 22,827 | $ | 23,755 | $ | 1,320 | $ | 21,608 | $ | 22,928 |
|
Equity securities |
| - |
| 303 |
| 303 |
| 377 |
| 171 |
| 548 |
|
Commercial mortgage loans |
| - |
| 1,947 |
| 1,947 |
| 32 |
| 1,826 |
| 1,858 |
|
Policy loans |
| - |
| 1,357 |
| 1,357 |
| - |
| 1,423 |
| 1,423 |
|
Other long-term investments |
| - |
| 2,403 |
| 2,403 |
| - |
| 1,901 |
| 1,901 |
|
Short-term investments |
| 423 |
| - |
| 423 |
| 316 |
| - |
| 316 |
|
Total |
| 1,351 |
| 28,837 |
| 30,188 |
| 2,045 |
| 26,929 |
| 28,974 |
|
Investments classified as assets held for sale (1) |
| (414) |
| (7,295) |
| (7,709) |
|
|
|
|
|
|
|
Investments per Consolidated Balance Sheets | $ | 937 | $ | 21,542 | $ | 22,479 | $ | 2,045 | $ | 26,929 | $ | 28,974 |
|
(1) The table above includes $7.7 billion of investments associated with the Group Disability and Life business that is held for sale to New York Life. Under the terms of the definitive agreement, some of the assets currently associated with the Group Disability and Life business can be substituted for other assets. The assets that will transfer to New York Life will be primarily debt securities and to a lesser extent commercial mortgage loans and short-term investments. |
| ||||||||||||
A.Investment Portfolio
Debt Securities
Accounting policy. Debt securities (including bonds, mortgage and other asset-backed securities and preferred stocks redeemable by the investor) are classified as available for sale and are carried at fair value with changes in fair value recorded in accumulated other comprehensive income (loss) within shareholders’ equity. Net unrealized appreciation on debt securities supporting the Company’s run-off settlement annuity business is reported in future policy benefit liabilities rather than accumulated other comprehensive income (loss).
The Company records impairment losses in net income for debt securities with fair value below amortized cost that meet either of the following conditions:
If the Company intends to sell or determines that it is more likely than not to be required to sell these debt securities before their fair values recover, an impairment loss is recognized for the excess of the amortized cost over fair value.
If the net present value of projected future cash flows of a debt security (based on qualitative and quantitative factors, including the probability of default, and the estimated timing and amount of recovery) is below the amortized cost basis, that difference is recognized as an impairment loss. For mortgage and asset-backed securities, estimated future cash flows are also based on assumptions about the collateral attributes including prepayment speeds, default rates and changes in value.
Debt securities are classified as either current or long-term investments based on their contractual maturities.
111
The amortized cost and fair value by contractual maturity periods for debt securities were as follows at December 31, 2019:
| Amortized | Fair | ||
(In millions) | Cost | Value | ||
Due in one year or less | $ | 920 | $ | 932 |
Due after one year through five years |
| 7,176 |
| 7,452 |
Due after five years through ten years |
| 9,098 |
| 9,644 |
Due after ten years |
| 4,209 |
| 5,191 |
Mortgage and other asset-backed securities |
| 506 |
| 536 |
Total | $ | 21,909 | $ | 23,755 |
| ||||
Actual maturities of these securities could differ from their contractual maturities used in the table above because issuers may have the right to call or prepay obligations, with or without penalties.
Gross unrealized appreciation (depreciation) on debt securities by type of issuer is shown below.
| Amortized | Unrealized | Unrealized | Fair | ||||
(In millions) | Cost | Appreciation | Depreciation | Value | ||||
December 31, 2019 |
|
|
|
|
|
|
|
|
Federal government and agency | $ | 498 | $ | 235 | $ | - | $ | 733 |
State and local government |
| 729 |
| 81 |
| - |
| 810 |
Foreign government |
| 2,027 |
| 230 |
| (1) |
| 2,256 |
Corporate |
| 18,149 |
| 1,299 |
| (28) |
| 19,420 |
Mortgage and other asset-backed |
| 506 |
| 31 |
| (1) |
| 536 |
Total | $ | 21,909 | $ | 1,876 | $ | (30) | $ | 23,755 |
Investments supporting liabilities of the Company’s run-off settlement annuity business (included in total above) (1) | $ | 2,229 | $ | 740 | $ | (4) | $ | 2,965 |
|
|
|
|
|
|
|
|
|
December 31, 2018 |
|
|
|
|
|
|
|
|
Federal government and agency | $ | 507 | $ | 204 | $ | (1) | $ | 710 |
State and local government |
| 920 |
| 66 |
| (1) |
| 985 |
Foreign government |
| 2,214 |
| 155 |
| (7) |
| 2,362 |
Corporate |
| 18,403 |
| 411 |
| (453) |
| 18,361 |
Mortgage and other asset-backed |
| 506 |
| 16 |
| (12) |
| 510 |
Total | $ | 22,550 | $ | 852 | $ | (474) | $ | 22,928 |
Investments supporting liabilities of the Company’s run-off settlement annuity business (included in total above) (1) | $ | 2,264 | $ | 479 | $ | (40) | $ | 2,703 |
|
|
|
|
|
|
|
|
|
(1) Net unrealized appreciation for these investments is excluded from accumulated other comprehensive income. | ||||||||
The Company had commitments to purchase $98 million of debt securities as of December 31, 2019, bearing interest at a fixed market rate.
Review of declines in fair value. Management reviews debt securities with a decline in fair value from cost for impairment based on criteria that include:
length of time and severity of decline;
financial health and specific near term prospects of the issuer;
changes in the regulatory, economic or general market environment of the issuer’s industry or geographic region; and
the Company’s intent to sell or the likelihood of a required sale prior to recovery.
112
Management believes the unrealized depreciation below to be temporary based on this review, and therefore has not impaired these amounts. The table below summarizes debt securities with a decline in fair value from amortized cost by investment grade and by the length of time these securities have been in an unrealized loss position.
| December 31, 2019 |
| December 31, 2018 | ||||||||||||
| Fair | Amortized | Unrealized | Number |
| Fair | Amortized | Unrealized | Number | ||||||
(Dollars in millions) | Value | Cost | Depreciation | of Issues |
| Value | Cost | Depreciation | of Issues | ||||||
One year or less |
|
|
|
|
|
|
|
|
|
|
|
|
|
|
|
Investment grade | $ | 723 | $ | 729 | $ | (6) | 267 |
| $ | 7,127 | $ | 7,367 | $ | (240) | 1,324 |
Below investment grade | $ | 340 | $ | 348 | $ | (8) | 355 |
| $ | 1,185 | $ | 1,240 | $ | (55) | 1,190 |
More than one year |
|
|
|
|
|
|
|
|
|
|
|
|
|
|
|
Investment grade | $ | 366 | $ | 378 | $ | (12) | 118 |
| $ | 3,023 | $ | 3,181 | $ | (158) | 784 |
Below investment grade | $ | 84 | $ | 88 | $ | (4) | 93 |
| $ | 249 | $ | 270 | $ | (21) | 245 |
| |||||||||||||||
Equity Securities
Accounting policy. Changes in the fair values of equity securities that have a readily determinable fair value are reported in net realized investment gains (losses). As of December 31, 2019, the fair values of these securities were $64 million and cost was $61 million, compared with fair value of $415 million and cost of $433 million as of December 31, 2018. Private equity securities of $192 million as of December 31, 2019, and $89 million as of December 31, 2018, without a readily determinable fair value are carried at cost minus impairment, if any, plus or minus changes resulting from observable price changes. The amount of impairments or value changes resulting from observable price changes was .
Equity securities also include hybrid investments consisting of preferred stock with call features that are carried at fair value with changes in fair value reported in net realized investment gains (losses) and dividends reported in net investment income.As of December 31, 2019, fair values of these securities were $47 million and cost was $58 million, compared with fair value of $44 million and cost of $58 million as of December 31, 2018.
Commercial Mortgage Loans
Mortgage loans held by the Company are made exclusively to commercial borrowers and are diversified by property type, location and borrower. Loans are generally issued at fixed rates of interest and are secured by high quality, primarily completed and substantially leased operating properties. Commercial mortgage loans are classified as either current or long-term investments based on their contractual maturities.
Accounting policy. Commercial mortgage loans are carried at unpaid principal balances or, if impaired, the lower of unpaid principal or fair value of the underlying collateral. A commercial mortgage loan is considered impaired when it is probable that the Company will not collect all amounts due per the terms of the promissory note. Writedowns are recorded in realized investments losses. Interest income on impaired loans is only recognized when a payment is received.
There were no impaired commercial mortgage loans as of December 31, 2019 or 2018.
As of December 31, 2019, virtually all of the Company’s commercial mortgage loan portfolio is scheduled to mature in 2022 or thereafter. Actual maturities could differ from contractual maturities for several reasons, including that borrowers may have the right to prepay their obligations with or without prepayment penalties, the maturity date may be extended or loans may be refinanced.
Credit quality. The Company regularly evaluates and monitors credit risk, beginning with the initial underwriting of a mortgage loan and continuing throughout the investment holding period. Mortgage origination professionals employ an internal credit quality rating system designed to evaluate the relative risk of the transaction at origination that is then updated each year as part of the annual portfolio loan review. The Company evaluates and monitors credit quality on a consistent and ongoing basis, classifying each loan as a loan in good standing, potential problem loan or problem loan.
Quality ratings are based on our evaluation of a number of key inputs related to the loan, including real estate market-related factors such as rental rates and vacancies, and property-specific inputs such as growth rate assumptions and lease rollover statistics. However, the two most significant contributors to the credit quality rating are the debt service coverage and loan-to-value ratios. The debt service coverage ratio measures the estimated amount of property cash flow available to meet annual interest and principal payments on debt, with a ratio below 1.0 indicating that there is not enough cash flow to cover the required loan payments. The loan-to-value ratio, commonly expressed as a percentage, compares the amount of the loan to the fair value of the underlying property
113
collateralizing the loan.
The following table summarizes the credit risk profile of the Company’s commercial mortgage loan portfolio based on loan-to-value and debt service coverage ratios as of December 31, 2019 and 2018:
(Dollars in millions) | December 31, 2019 |
| December 31, 2018 | ||||||
Loan-to-Value Ratio |
| Carrying Value | Average Debt Service Coverage Ratio | Average Loan-to-Value Ratio |
|
| Carrying Value | Average Debt Service Coverage Ratio | Average Loan-to-Value Ratio |
Below 60% | $ | 1,136 | 2.19 |
|
| $ | 1,132 | 2.14 |
|
60% to 79% |
| 723 | 1.98 |
|
|
| 650 | 1.93 |
|
80% to 100% |
| 88 | 1.62 |
|
|
| 76 | 1.49 |
|
Total | $ | 1,947 | 2.09 | 58% |
| $ | 1,858 | 2.04 | 58% |
The Company’s annual in-depth review of its commercial mortgage loan investments is the primary mechanism for identifying emerging risks in the portfolio. The Company’s investment professionals completed the annual in-depth review in the second quarter of 2019 that included an analysis of each underlying property’s most recent annual financial statements, rent rolls, operating plans, budgets, a physical inspection of the property and other pertinent factors. Based on historical results, current leases, lease expirations and rental conditions in each market, the Company estimated the current year and future stabilized property income and fair value for each loan.
The Company re-evaluates a loan’s credit quality between annual reviews if new property information is received or an event such as delinquency or a borrower’s request for restructure causes management to believe that the Company’s estimate of financial performance, fair value or the risk profile of the underlying property has been impacted.
Policy Loans
Accounting policy. Policy loans, primarily associated with our corporate-owned life insurance business, are carried at unpaid principal balances plus accumulated interest, the total of which approximates fair value. These loans are collateralized by life insurance policy cash values and therefore have minimal exposure to credit loss. Interest rates are reset annually based on a rolling average of benchmark interest rates.
Other Long-Term Investments
Accounting policy. Other long-term investments include investments in unconsolidated entities. These entities include certain limited partnerships and limited liability companies holding real estate, securities or loans. These investments are carried at cost plus the Company’s ownership percentage of reported income or loss, based on the financial statements of the underlying investments that are generally reported at fair value. Income from these investments is reported on a one quarter lag due to the timing of when financial information is received from the general partner or manager of the investments.
Other long-term investments also include investment real estate carried at depreciated cost less any impairment write-downs to fair value when cash flows indicate that the carrying value may not be recoverable. Depreciation is generally recorded using the straight-line method based on the estimated useful life of each asset. Investment real estate as of December 31, 2019 and 2018 is expected to be held longer than one year and may include real estate acquired through the foreclosure of commercial mortgage loans.
Additionally, other long-term investments include foreign currency swaps carried at fair value. See discussion below for information on the Company’s accounting policies for these derivative financial instruments.
Other long-term investments and related commitments are diversified by issuer, property type and geographic regions. The following table provides unfunded commitment and carrying value information for these investments. The Company expects to disburse approximately 30% of the committed amounts in 2020.
114
|
|
|
|
|
| Unfunded | |
|
| Carrying value as of December 31, |
| Commitments as of | |||
(In millions) | 2019 | 2018 |
| December 31, 2019 | |||
Real estate investments | $ | 788 | $ | 679 |
| $ | 551 |
Securities partnerships |
| 1,409 |
| 1,045 |
|
| 1,379 |
Other |
| 206 |
| 177 |
|
| 24 |
Total | $ | 2,403 | $ | 1,901 |
| $ | 1,954 |
Short-Term Investments and Cash Equivalents
Accounting policy. Security investments with maturities of greater than three months to one year from time of purchase are classified as short-term, available for sale and carried at fair value that approximates cost. Cash equivalents consist of short-term investments with maturities of three months or less from the time of purchase and are carried at cost that approximates fair value.
Short-term investments and cash equivalents included the following types of issuers:
|
| December 31, |
| December 31, |
(In millions) |
| 2019 |
| 2018 |
Corporate securities | $ | 1,985 | $ | 581 |
Federal government securities | $ | 472 | $ | 82 |
Foreign government securities | $ | 65 | $ | 238 |
Money market funds | $ | 631 | $ | 1,174 |
Derivative Financial Instruments
The Company uses derivative financial instruments to manage the characteristics of investment assets (such as duration, yield, currency and liquidity) to meet the varying demands of the related insurance and contract holder liabilities. The Company also uses derivative financial instruments to hedge the risk of changes in the net assets of certain of its foreign subsidiaries due to changes in foreign currency exchange rates. The Company has written and purchased GMIB reinsurance contracts in its run-off reinsurance business that are accounted for as freestanding derivatives as discussed in Note 10. Derivatives in the Company’s separate accounts are excluded from the following discussion because associated gains and losses generally accrue directly to separate account policyholders.
Derivative instruments used by the Company typically include foreign currency swap contracts and foreign currency forward contracts. Foreign currency swap contracts periodically exchange cash flows between two currencies for principal and interest. Foreign currency forward contracts require the Company to purchase a foreign currency in exchange for the functional currency of its operating unit at a future date, generally within three months from the contracts’ trade dates.
The Company manages the credit risk of these derivative instruments by diversifying its portfolio among approved dealers of high credit quality and through routine monitoring of credit risk exposures. Certain of the Company’s over-the-counter derivative instruments require either the Company or the counterparty to post collateral or demand immediate payment depending on the amount of the net liability position of the derivative instrument and predefined financial strength or credit rating thresholds. These collateral posting requirements vary by counterparty and amounts posted were as of December 31, 2019 or 2018.
Accounting policy. Derivatives are recorded on our balance sheet at fair value and are classified as current or non-current according to their contractual maturities. Further information on our policies for determining fair value are discussed in Note 12. The Company applies hedge accounting when derivatives are designated, qualified and highly effective as hedges. Under hedge accounting, the changes in fair value of the derivative and the hedged risk are generally recognized together and offset each other when reported in shareholders’ net income. Various qualitative or quantitative methods appropriate for each hedge are used to formally assess and document hedge effectiveness at inception and each period throughout the life of a hedge.
115
Gross fair values of our derivative financial instruments are presented in Note 12. As of December 31, 2019 and 2018, and for the years then ended, the effects of derivative instruments on the Consolidated Financial Statements were , including gains or losses reclassified from accumulated other comprehensive income into shareholders’ net income, as well as amounts excluded from the assessment of hedge effectiveness. The following table summarizes the types and notional quantity of derivative instruments held by the Company.
|
| Notional Value as of | |||
(In millions) |
| December 31, | December 31, | ||
Purpose | Type of Instrument | 2019 | 2018 | ||
Fair value hedge: To hedge the foreign exchange-related changes in fair values of certain foreign-denominated bonds, primarily Euro and British pounds. The notional value of these derivatives matches the amortized cost of the hedged bonds. | Foreign currency swap contracts | $ | 817 | $ | 525 |
Net investment hedge: To reduce the risk of changes in net assets due to changes in foreign currency spot exchange rates for certain foreign subsidiaries that conduct their business principally in Euros and Korean Won. The notional value of hedging instruments matches the hedged amount of subsidiary net assets. | Foreign currency swap contracts and foreign currency forward contracts | $ | 844 | $ | 439 |
Economic hedge: To hedge the foreign exchange-related changes in fair values of a U.S. dollar-denominated investment portfolio to reflect the local currency for the Company’s foreign subsidiary in South Korea. The notional value of hedging instruments generally aligns with the fair value of the hedged investment portfolio. | Foreign currency forward contracts | $ | 410 | $ | 309 |
The Company’s derivative financial instruments are presented as follows:
Fair value hedges of the foreign exchange-related changes in fair values of certain foreign-denominated bonds: Swap fair values are reported in long-term investments or other non-current liabilities. Changes in fair values attributable to foreign exchange risk of the swap contracts and the hedged bonds are reported in realized investment gains and losses. The portion of the swap contracts’ changes in fair value excluded from the assessment of hedge effectiveness is recorded in accumulated other comprehensive income and recognized in net investment income as swap coupon payments are accrued, offsetting the foreign-denominated coupons received on the designated bonds. Net interest cash flows are reported in operating activities, while exchanges of notional principal amounts are reported in investing activities.
Net investment hedges of certain foreign subsidiaries that conduct their business principally in currencies other than the U.S. dollar: The fair values of the foreign currency swap and forward contracts are reported in other assets or other liabilities. The changes in fair values of these instruments are reported in other comprehensive income, specifically in translation of foreign currencies. The portion of the change in fair values relating to foreign exchange spot rates will be recognized in earnings upon deconsolidation of the hedged foreign subsidiaries. The remaining changes in fair value of these instruments are excluded from our effectiveness assessment and recognized in interest expense when coupon payments are accrued or ratably over the term of the instrument. The notional value of hedging instruments matches the hedged amount of subsidiary net assets. Cash flows relating to these contracts are reported in investing activities.
Economic hedges for derivatives not designated as accounting hedges: Fair values of forward contracts are reported in current investments or accrued expenses and other liabilities. The changes in fair values are reported in realized investment gains and losses. Cash flows relating to these contracts are reported in investing activities.
Concentration of Risk
The Company did not have a concentration of investments in a single issuer or borrower exceeding 10% of shareholders’ equity as of December 31, 2019 or 2018.
116
B.Net Investment Income
Accounting policy. When interest and principal payments on investments are current, the Company recognizes interest income when it is earned. The Company recognizes interest income on a cash basis when interest payments are delinquent based on contractual terms or when certain terms (interest rate or maturity date) of the investment have been restructured. For unconsolidated entities that are included in Other long-term investments, investment income is generally recognized according to the Company’s share of the reported income or loss on the underlying investments. Investment income attributed to the Company’s separate accounts is excluded from our earnings because associated gains and losses generally accrue directly to separate account policyholders.
The components of net investment income for the years ended December 31 were as follows:
(In millions) | 2019 | 2018 | 2017 | |||
Debt Securities | $ | 986 | $ | 1,009 | $ | 946 |
Equity securities |
| 5 |
| 28 |
| 14 |
Commercial mortgage loans |
| 88 |
| 78 |
| 81 |
Policy loans |
| 66 |
| 70 |
| 69 |
Other long-term investments |
| 167 |
| 156 |
| 124 |
Short-term investments and cash |
| 131 |
| 194 |
| 42 |
Total investment income |
| 1,443 |
| 1,535 |
| 1,276 |
Less investment expenses |
| 53 |
| 55 |
| 50 |
Net investment income | $ | 1,390 | $ | 1,480 | $ | 1,226 |
Real estate investments and securities partnerships with a carrying value of $192 million at December 31, 2019 and $150 million at December 31, 2018 were non-income producing during the preceding twelve months.
C. Realized Investment Gains and Losses
Accounting policy. Realized investment gains and losses are based on specifically identified assets and results from sales, investment asset write-downs, changes in the fair values of certain derivatives and equity securities and changes in valuation reserves on commercial mortgage loans.
The following realized gains and losses on investments exclude amounts required to adjust future policy benefits for the run-off settlement annuity business (consistent with accounting for a premium deficiency), as well as realized gains and losses attributed to the Company’s separate accounts because those gains and losses generally accrue directly to separate account policyholders.
(In millions) | 2019 | 2018 | 2017 | |||
Net realized investment gains (losses), excluding investment asset write-downs | $ | 189 | $ | (34) | $ | 268 |
Write-downs on debt securities |
| (12) |
| (43) |
| (26) |
Write-downs on other invested assets |
| - |
| (4) |
| (5) |
Net realized investment gains (losses), before income taxes | $ | 177 | $ | (81) | $ | 237 |
Net realized investment gains, excluding investment asset write-downs in 2019 and 2017 primarily represent gains on the sales of real estate partnerships and debt securities. Additionally, 2019 included mark-to-market gains and 2017 included gains on sales of equity securities. Net realized investment losses, excluding investment asset write-downs in 2018 represented mark-to-market losses on equity securities and derivatives, partially offset by gains on the sales of real estate partnerships. Realized gains or losses on equity securities still held at December 31, 2019 and 2018 were .
The following table presents sales information for available-for-sale debt securities. Gross gains on sales and gross losses on sales exclude amounts required to adjust future policy benefits for the run-off settlement annuity business.
(In millions) | 2019 | 2018 | 2017 | |||
Proceeds from sales | $ | 3,077 | $ | 2,625 | $ | 2,012 |
Gross gains on sales | $ | 72 | $ | 28 | $ | 103 |
Gross losses on sales | $ | (19) | $ | (47) | $ | (18) |
117
Note 12 – Fair Value Measurements
The Company carries certain financial instruments at fair value in the financial statements including debt securities, certain equity securities, short-term investments and derivatives. Other financial instruments are measured at fair value only under certain conditions, such as when impaired or when there are observable price changes for equity securities with no readily determinable fair value.
Fair value is defined as the price at which an asset could be exchanged in an orderly transaction between market participants at the balance sheet date. A liability’s fair value is defined as the amount that would be paid to transfer the liability to a market participant, not the amount that would be paid to settle the liability with the creditor.
The Company’s financial assets and liabilities carried at fair value have been classified based upon a hierarchy defined by GAAP. The hierarchy gives the highest ranking to fair values determined using unadjusted quoted prices in active markets for identical assets and liabilities (Level 1) and the lowest ranking to fair values determined using methodologies and models with unobservable inputs (Level 3). An asset’s or a liability’s classification is based on the lowest level of input that is significant to its measurement. For example, a financial asset or liability carried at fair value would be classified in Level 3 if unobservable inputs were significant to the instrument’s fair value, even though the measurement may be derived using inputs that are both observable (Levels 1 and 2) and unobservable (Level 3).
The Company estimates fair values using prices from third parties or internal pricing methods. Fair value estimates received from third-party pricing services are based on reported trade activity and quoted market prices when available, and other market information that a market participant would use to estimate fair value. The internal pricing methods are performed by the Company’s investment professionals and generally involve using discounted cash flow analyses, incorporating current market inputs for similar financial instruments with comparable terms and credit quality as well as other qualitative factors. In instances where there is little or no market activity for the same or similar instruments, fair value is estimated using methods, models and assumptions that the Company believes a hypothetical market participant would use to determine a current transaction price. These valuation techniques involve some level of estimation and judgment that becomes significant with increasingly complex instruments or pricing models.
The Company is responsible for determining fair value and for assigning the appropriate level within the fair value hierarchy based on the significance of unobservable inputs. The Company reviews methodologies, processes and controls of third-party pricing services and compares prices on a test basis to those obtained from other external pricing sources or internal estimates. The Company performs ongoing analyses of both prices received from third-party pricing services and those developed internally to determine that they represent appropriate estimates of fair value. The controls executed by the Company include evaluating changes in prices and monitoring for potentially stale valuations. The Company also performs sample testing of sales values to confirm the accuracy of prior fair value estimates. The minimal exceptions identified during these processes indicate that adjustments to prices are infrequent and do not significantly impact valuations. We conduct an annual on-site visit of the most significant pricing service to review their processes, methodologies and controls. This on-site review includes a walk-through of inputs for a sample of securities held across various asset types to validate the documented pricing process.
118
A.Financial Assets and Financial Liabilities Carried at Fair Value
The following table provides information as of December 31, 2019 and 2018 about the Company’s financial assets and liabilities carried at fair value. Separate account assets are also recorded at fair value on the Company’s Consolidated Balance Sheets and are reported separately in the Separate Accounts section below as gains and losses related to these assets generally accrue directly to policyholders.
(In millions) | Quoted Prices in Active Markets for Identical Assets (Level 1) |
| Significant Other Observable Inputs (Level 2) |
| Significant Unobservable Inputs (Level 3) |
| Total | |||||||||||||
|
| As of | As of |
| As of | As of |
| As of | As of |
| As of | As of | ||||||||
|
| December 31, | December 31, |
| December 31, | December 31, |
| December 31, | December 31, |
| December 31, | December 31, | ||||||||
|
| 2019 | 2018 |
| 2019 | 2018 |
| 2019 | 2018 |
| 2019 | 2018 | ||||||||
Financial assets at fair value |
|
|
|
|
|
|
|
|
|
|
|
|
|
|
|
|
|
|
| |
Debt securities |
|
|
|
|
|
|
|
|
|
|
|
|
|
|
|
|
|
|
| |
| Federal government and agency | $ | 197 | $ | 209 |
| $ | 536 | $ | 501 |
| $ | - | $ | - |
| $ | 733 | $ | 710 |
| State and local government |
| - |
| - |
|
| 810 |
| 985 |
|
| - |
| - |
|
| 810 |
| 985 |
| Foreign government |
| - |
| - |
|
| 2,228 |
| 2,356 |
|
| 28 |
| 6 |
|
| 2,256 |
| 2,362 |
| Corporate |
| - |
| - |
|
| 19,063 |
| 18,127 |
|
| 357 |
| 234 |
|
| 19,420 |
| 18,361 |
| Mortgage and other asset-backed |
| - |
| - |
|
| 398 |
| 372 |
|
| 138 |
| 138 |
|
| 536 |
| 510 |
Total debt securities |
| 197 |
| 209 |
|
| 23,035 |
| 22,341 |
|
| 523 |
| 378 |
|
| 23,755 |
| 22,928 | |
Equity securities (1) |
| 7 |
| 384 |
|
| 72 |
| 43 |
|
| 32 |
| 32 |
|
| 111 |
| 459 | |
Short-term investments |
| - |
| - |
|
| 423 |
| 316 |
|
| - |
| - |
|
| 423 |
| 316 | |
Derivative assets |
| - |
| - |
|
| 83 |
| 53 |
|
| - |
| - |
|
| 83 |
| 53 | |
Real estate funds priced at NAV as a practical expedient (2) |
|
|
|
|
|
|
|
|
|
|
|
|
|
|
|
| 184 |
| 239 | |
Financial liabilities at fair value |
|
|
|
|
|
|
|
|
|
|
|
|
|
|
|
|
|
|
| |
Derivative liabilities | $ | - | $ | - |
| $ | 18 | $ | 10 |
| $ | - | $ | - |
| $ | 18 | $ | 10 | |
(1) Excludes certain equity securities that have no readily determinable fair value. | ||||||||||||||||||||
(2) As a practical expedient, certain real estate funds are carried at fair value based on the Company’s ownership share of the equity of the investee (Net Asset Value (“NAV“)) including changes in the fair value of its underlying investments. The funds have a quarterly redemption frequency, 45-90 day redemption notice period and $56 million in unfunded commitments as of December 31, 2019. | ||||||||||||||||||||
Level 1 Financial Assets
Inputs for instruments classified in Level 1 include unadjusted quoted prices for identical assets in active markets accessible at the measurement date. Active markets provide pricing data for trades occurring at least weekly and include exchanges and dealer markets.
Assets in Level 1 include actively-traded U.S. government bonds and exchange-listed equity securities. A relatively small portion of the Company’s investment assets are classified in this category given the narrow definition of Level 1 and the Company’s investment asset strategy to maximize investment returns.
Level 2 Financial Assets and Financial Liabilities
Inputs for instruments classified in Level 2 include quoted prices for similar assets or liabilities in active markets, quoted prices from those willing to trade in markets that are not active or other inputs that are market observable or can be corroborated by market data for the term of the instrument. Such other inputs include market interest rates and volatilities, spreads and yield curves. An instrument is classified in Level 2 if the Company determines that unobservable inputs are insignificant.
119
Debt and equity securities. Approximately 97% of the Company’s investments in debt and equity securities are classified in Level 2 including most public and private corporate debt and hybrid equity securities, federal agency and municipal bonds, non-government mortgage-backed securities and preferred stocks. Third-party pricing services and internal methods often use recent trades of securities with similar features and characteristics because many debt securities do not trade daily. Pricing models are used to determine these prices when recent trades are not available. These models calculate fair values by discounting future cash flows at estimated market interest rates. Such market rates are derived by calculating the appropriate spreads over comparable U.S. Treasury securities based on the credit quality, industry and structure of the asset. Typical inputs and assumptions to pricing models include, but are not limited to, a combination of benchmark yields, reported trades, issuer spreads, liquidity, benchmark securities, bids, offers, reference data and industry and economic events. For mortgage-backed securities, inputs and assumptions may also include characteristics of the issuer, collateral attributes, prepayment speeds and credit rating.
Nearly all of these instruments are valued using recent trades or pricing models. Less than 1% of the fair value of investments classified in Level 2 represents foreign bonds that are valued using a single, unadjusted market-observable input derived by averaging multiple broker-dealer quotes, consistent with local market practice.
Short-term investments are carried at fair value that approximates cost. The Company compares market prices for these securities to recorded amounts on a regular basis to validate that current carrying amounts approximate exit prices. The short-term nature of the investments and corroboration of the reported amounts over the holding period support their classification in Level 2.
Derivative assets and liabilities classified in Level 2 represent over-the-counter instruments such as foreign currency forward and swap contracts. Fair values for these instruments are determined using market observable inputs including forward currency and interest rate curves and widely published market observable indices. Credit risk related to the counterparty and the Company is considered when estimating the fair values of these derivatives. However, the Company is largely protected by collateral arrangements with counterparties and determined that no adjustments for credit risk were required as of December 31, 2019 or 2018. The nature and use of these derivative financial instruments are described in Note 11.
Level 3 Financial Assets and Financial Liabilities
Certain inputs for instruments classified in Level 3 are unobservable (supported by little or no market activity) and significant to their resulting fair value measurement. Unobservable inputs reflect the Company’s best estimate of what hypothetical market participants would use to determine a transaction price for the asset or liability at the reporting date.
The Company classifies certain newly-issued, privately-placed, complex or illiquid securities in Level 3. Approximately 2% of debt and equity securities are priced using significant unobservable inputs and classified in this category.
Fair values of mortgage and other asset-backed securities, as well as corporate and government debt securities, are primarily determined using pricing models that incorporate the specific characteristics of each asset and related assumptions including the investment type and structure, credit quality, industry and maturity date in comparison to current market indices, spreads and liquidity of assets with similar characteristics. Inputs and assumptions for pricing may also include characteristics of the issuer, collateral attributes and prepayment speeds for mortgage and other asset-backed securities. Recent trades in the subject security or similar securities are assessed when available, and the Company may also review published research in its evaluation as well as the issuer’s financial statements.
Quantitative Information about Unobservable Inputs
The following table summarizes the fair value and significant unobservable inputs used in pricing the following debt securities that were developed directly by the Company as of December 31, 2019 and 2018. The range and weighted average basis point amounts (“bps”) for liquidity and credit spreads (adjustment to discount rates) reflect the Company’s best estimates of the unobservable adjustments a market participant would make to calculate these fair values.
Corporate and government debt securities. The significant unobservable input used to value the following corporate and government debt securities is an adjustment for liquidity. An adjustment is needed to reflect current market conditions and issuer circumstances when there is limited trading activity for the security.
120
Mortgage and other asset-backed securities. The significant unobservable inputs used to value the following mortgage and other asset-backed securities are liquidity and weighting of credit spreads. An adjustment for liquidity is made as of the measurement date that considers current market conditions, issuer circumstances and complexity of the security structure when there is limited trading activity for the security. An adjustment to weight credit spreads is needed to value a more complex bond structure with multiple underlying collateral and no standard market valuation technique. The weighting of credit spreads is primarily based on the underlying collateral’s characteristics and their proportional cash flows supporting the bond obligations.
| Fair Value as of |
|
| Unobservable Adjustment Range (Weighted Average) as of | ||||
| December 31, |
| Unobservable Input | December 31, | ||||
(Fair value in millions ) | 2019 | 2018 |
| December 31, 2019 | 2019 | 2018 | ||
Debt securities |
|
|
|
|
|
|
|
|
Corporate and government debt securities | $ | 385 | $ | 229 |
| Liquidity | 70 - 930 (280) bps | 50 - 930 (230) bps |
Mortgage and other asset-backed securities |
| 138 |
| 138 |
| Liquidity | 60 - 370 (70) bps | 60 - 340 (70) bps |
|
|
|
|
|
| Weighting of credit spreads | 240 - 460 (330) bps | 190 - 340 (260) bps |
Securities not priced by the Company (1) |
| - |
| 11 |
|
|
|
|
Total Level 3 debt securities | $ | 523 | $ | 378 |
|
|
|
|
|
|
|
|
|
|
|
|
|
(1) The fair values for these securities use single, unadjusted non-binding broker quotes not developed directly by the Company. |
| |||||||
Significant increases in liquidity or credit spreads would result in lower fair value measurements while decreases in these inputs would result in higher fair value measurements. The unobservable inputs are generally not interrelated and a change in the assumption used for one unobservable input is not accompanied by a change in the other unobservable input.
Changes in Level 3 Financial Assets and Financial Liabilities Carried at Fair Value
The following table summarizes the changes in financial assets and financial liabilities classified in Level 3 in 2019 and 2018. Gains and losses reported in these tables may include net changes in fair value that are attributable to both observable and unobservable inputs.
(In millions) |
| 2019 | 2018 | ||
|
|
|
|
|
|
Balance at January 1, |
| $ | 410 | $ | 732 |
Total (losses) included in shareholders’ net income |
| (8) |
| (22) | |
Gains (losses) included in other comprehensive income |
| 22 |
| (8) | |
Gains (losses) required to adjust future policy benefits for settlement annuities (1) |
| 2 |
| (8) | |
Purchases, sales and settlements |
|
|
|
|
|
Purchases |
|
| 72 |
| 22 |
Sales |
|
| - |
| (11) |
Settlements |
|
| (19) |
| (70) |
Total purchases, sales and settlements |
|
| 53 |
| (59) |
Transfers into/(out of) Level 3 |
|
|
|
|
|
Transfers into Level 3 |
|
| 170 |
| 44 |
Transfers out of Level 3 (2) |
|
| (94) |
| (269) |
Total transfers into/(out of) Level 3 |
|
| 76 |
| (225) |
Balance at December 31, |
| $ | 555 | $ | 410 |
Total (losses) included in shareholders’ net income attributable to instruments held at the reporting date | $ | (8) | $ | (9) | |
|
|
|
|
|
|
(1) Amounts do not accrue to shareholders. | |||||
(2) Beginning in 2018, certain private equity securities are no longer carried at fair value under the policy election of ASU 2016-01 (Recognition and Measurement of Financial Assets and Financial Liabilities). Private equity securities of $70 million as of December 31, 2017 are included in the 2018 Transfers out of Level 3 amount. | |||||
Total gains and losses included in shareholders’ net income in the tables above are reflected in the Consolidated Statements of Income as realized investment gains (losses) and net investment income.
121
Gains and losses included in other comprehensive income in the tables above are reflected in net unrealized appreciation (depreciation) on securities in the Consolidated Statements of Comprehensive Income.
Transfers into or out of the Level 3 category occur when unobservable inputs, such as the Company’s best estimate of what a market participant would use to determine a current transaction price, become more or less significant to the fair value measurement. Transfers between Level 2 and Level 3 during 2019 and 2018 primarily reflected changes in liquidity and credit risk estimates for certain private placement issuers across several sectors.
Separate Accounts
Accounting policy. Separate account assets and liabilities are contractholder funds maintained in accounts with specific investment objectives. The assets of these accounts are legally segregated and are not subject to claims that arise out of any of the Company’s other businesses. These separate account assets are carried at fair value with equal amounts recorded for related separate account liabilities. The investment income and fair value gains and losses of these accounts generally accrue directly to the contractholders and, together with their deposits and withdrawals, are excluded from the Company’s Consolidated Statements of Income and Cash Flows. Fees and charges earned for mortality risks, asset management or administrative services are reported in either premiums or fees and other revenues. Investments that are measured using the practical expedient of NAV are excluded from the fair value hierarchy.
Fair values of separate account assets at December 31 were as follows:
(In millions) | Quoted Prices in Active Markets for Identical Assets (Level 1) |
| Significant Other Observable Inputs (Level 2) |
| Significant Unobservable Inputs (Level 3) |
| Total | ||||||||||||
| 2019 | 2018 |
| 2019 | 2018 |
| 2019 | 2018 |
| 2019 | 2018 | ||||||||
Guaranteed separate accounts (See Note 22) | $ | 219 | $ | 187 |
| $ | 271 | $ | 267 |
| $ | - | $ | - |
| $ | 490 | $ | 454 |
Non-guaranteed separate accounts (1) |
| 1,450 |
| 1,204 |
|
| 5,522 |
| 5,216 |
|
| 263 |
| 233 |
|
| 7,235 |
| 6,653 |
Subtotal | $ | 1,669 | $ | 1,391 |
| $ | 5,793 | $ | 5,483 |
| $ | 263 | $ | 233 |
|
| 7,725 |
| 7,107 |
Non-guaranteed separate accounts priced at NAV as a practical expedient (1) |
|
|
|
|
|
|
|
|
|
|
|
|
|
|
|
| 756 |
| 732 |
Total |
|
|
|
|
|
|
|
|
|
|
|
|
|
|
|
| 8,481 |
| 7,839 |
Separate account assets classified as assets held for sale |
|
|
|
|
|
|
|
|
|
|
|
|
|
|
|
| (16) |
|
|
Separate account assets per Consolidated Balance Sheets |
|
|
|
|
|
|
|
|
|
|
|
|
|
|
| $ | 8,465 | $ | 7,839 |
(1) Non-guaranteed separate accounts included $ 4.0 billion as of December 31, 2019 and $3.8 billion as of December 31, 2018 in assets supporting the Company’s pension plans, including $0.2 billion classified in Level 3 as of December 31, 2019 and 2018. | |||||||||||||||||||
|
|
|
|
|
|
|
|
|
|
| |||||||||
Separate account assets classified as Level 1 primarily include exchange-listed equity securities. Level 2 assets primarily include:
corporate and structured bonds valued using recent trades of similar securities or pricing models that discount future cash flows at estimated market interest rates as described above; and
actively-traded institutional and retail mutual fund investments.
Separate account assets classified in Level 3 primarily support Cigna’s pension plans and include certain newly-issued, privately-placed, complex, or illiquid securities that are priced using methods discussed above as well as commercial mortgage loans.Activity, including transfers into and out of Level 3, was in 2019 or 2018.
122
Separate account investments in securities partnerships, real estate, and hedge funds are generally valued based on the separate account’s ownership share of the equity of the investee (NAV as a practical expedient) including changes in the fair values of its underlying investments. Substantially all of these assets support the Cigna Pension Plans. The following table provides additional information on these investments.
|
|
| Unfunded |
| ||||
| Fair Value as of |
| Commitments | Redemption Frequency |
| |||
| December 31, |
| as of | (if currently | Redemption Notice | |||
(In millions) | 2019 | 2018 |
| December 31, 2019 | eligible) | Period | ||
Securities partnerships | $ | 531 | $ | 477 | $ | 320 | Not applicable | Not applicable |
Real estate funds |
| 220 |
| 237 |
| - | Quarterly | 30 - 90 days |
Hedge funds |
| 5 |
| 18 |
| - | Up to annually, varying by fund | 30 - 90 days |
Total | $ | 756 | $ | 732 | $ | 320 |
|
|
As of December 31, 2019, the Company does not have plans to sell any of these assets at less than fair value. These investments are structured to satisfy longer-term investment objectives. Securities partnerships are contractually unredeemable, and the underlying investment assets are expected to be liquidated by the investees within ten years after inception.
B.Assets and Liabilities Measured at Fair Value under Certain Conditions
Some financial assets and liabilities are not carried at fair value each reporting period, but may be measured using fair value only under certain conditions such as investments when they become impaired, including investment real estate and commercial mortgage loans, and certain equity securities with no readily determinable fair value. Equity securities with no readily determinable fair value are also measured at fair value when there are observable price changes from orderly transactions with the same issuer. In 2019 there were gains relating to price changes for equity securities with no readily determinable fair value and no impaired investments written down to their fair values. In 2018, there were realized investment losses resulting from impairments on these assets, and no price changes for the equity securities with no readily determinable fair value. Carrying values represented less than 1% of total investments for both 2019 and 2018.
C. Fair Value Disclosures for Financial Instruments Not Carried at Fair Value
The following table includes the Company’s financial instruments not recorded at fair value that are subject to fair value disclosure requirements at December 31, 2019 and 2018. In addition to universal life products and finance leases, financial instruments that are carried in the Company’s Consolidated Financial Statements at amounts that approximate fair value are excluded from the following table.
|
|
| December 31, 2019 |
| December 31, 2018 | ||||
(In millions) | Classification in Fair Value Hierarchy |
| Fair Value |
| Carrying Value |
| Fair Value |
| Carrying Value |
Commercial mortgage loans | Level 3 | $ | 1,989 | $ | 1,947 | $ | 1,832 | $ | 1,858 |
Long-term debt, including current maturities, excluding finance leases | Level 2 | $ | 39,439 | $ | 36,375 | $ | 40,819 | $ | 40,829 |
Fair values of off-balance sheet financial instruments were as of December 31, 2019 or 2018.
Note 13 – Variable Interest Entities
When the Company becomes involved with a variable interest entity and when there is a change in the Company’s involvement with an entity, the Company must determine if it is the primary beneficiary and must consolidate the entity. The Company is considered the primary beneficiary if it has the power to direct the entity’s most significant economic activities and has the right to receive benefits or obligation to absorb losses that could be significant to the entity. The Company evaluates the following criteria:
the structure and purpose of the entity;
the risks and rewards created by, and shared through, the entity; and
the Company’s ability to direct its activities, receive its benefits and absorb its losses relative to the other parties involved with the entity including its sponsors, equity holders, guarantors, creditors and servicers.
123
The Company determined it was not a primary beneficiary in any material variable interest entities as of December 31, 2019 or 2018. The Company’s involvement in variable interest entities for which it is not the primary beneficiary is described below.
Securities limited partnerships and real estate limited partnerships. The Company owns interests in securities limited partnerships and real estate limited partnerships that are defined as variable interest entities. These partnerships invest in the equity or mezzanine debt of privately-held companies and real estate properties. General partners unaffiliated with the Company control decisions that most significantly impact the partnership’s operations and the limited partners do not have substantive kick-out or participating rights. The Company’s maximum exposure to loss from these entities of $3.4 billion across approximately 140 limited partnerships as of December 31, 2019 includes $1.8 billion reported in long-term investments and commitments to contribute an additional $1.6 billion. The Company’s noncontrolling interest in each of these limited partnerships is generally less than 15% of the partnership ownership interests.
Other asset-backed and corporate securities. In the normal course of its investing activities, the Company also makes passive investments in certain asset-backed and corporate securities that are issued by variable interest entities whose sponsors or issuers are unaffiliated with the Company. The Company receives fixed-rate cash flows from these investments and the maximum potential exposure to loss is limited to the carrying amount of $0.7 billion as of December 31, 2019 that is reported in debt securities. The Company’s combined ownership interests are relative to the total principal amounts issued by these entities.
The Company is involved with various other variable interest entities with carrying values and maximum exposures to loss.
The Company has not provided, and does not intend to provide, financial support to any of the above entities that it is not contractually required to provide. The Company performs ongoing qualitative analyses of its involvement with these variable interest entities to determine if consolidation is required.
124
Note 14 – Accumulated Other Comprehensive Income (Loss) (“AOCI”)
AOCI includes unrealized appreciation on securities and derivatives (excluding appreciation on investments supporting future policy benefit liabilities of the run-off settlement annuity business), foreign currency translation and the net postretirement benefits liability adjustment (see Note 16). AOCI includes the Company’s share from unconsolidated entities reported on the equity method. Generally, tax effects in AOCI are established at the currently enacted tax rate and reclassified to net income in the same period that the related pre-tax AOCI reclassifications are recognized. Changes in the components of AOCI were as follows:
(In millions) |
| 2019 |
| 2018 |
| 2017 |
Securities and Derivatives |
|
|
|
|
|
|
Beginning balance | $ | 18 | $ | 328 | $ | 365 |
Reclassification adjustment to retained earnings related to U.S. tax reform legislation |
| - |
| 65 |
| - |
Reclassification adjustment to retained earnings related to new financial instruments guidance |
| - |
| (4) |
| - |
Reclassification adjustment from retained earnings related to new hedging guidance |
| - |
| (6) |
| - |
Adjusted beginning balance |
| 18 |
| 383 |
| 365 |
Appreciation (depreciation) on securities and derivatives |
| 1,266 |
| (512) |
| 34 |
Tax (expense) benefit |
| (270) |
| 100 |
| (19) |
Net appreciation (depreciation) on securities and derivatives |
| 996 |
| (412) |
| 15 |
Reclassification adjustment for (gains) losses included in shareholders' net income (net realized investment (gains) losses) |
| (49) |
| 60 |
| (81) |
Reclassification adjustment for losses included in shareholders' net income (selling, general and administrative expenses) |
| - |
| - |
| 1 |
Tax benefit (expense) |
| 10 |
| (13) |
| 28 |
Net (gains) losses reclassified from AOCI to net income |
| (39) |
| 47 |
| (52) |
Other comprehensive income (loss), net of tax |
| 957 |
| (365) |
| (37) |
Ending balance | $ | 975 | $ | 18 | $ | 328 |
|
|
|
|
|
|
|
Translation of foreign currencies |
|
|
|
|
|
|
Beginning balance | $ | (221) | $ | (65) | $ | (369) |
Reclassification adjustment to retained earnings related to U.S. tax reform legislation |
| - |
| (4) |
| - |
Adjusted beginning balance |
| (221) |
| (69) |
| (369) |
Translation of foreign currencies |
| (57) |
| (167) |
| 306 |
Tax (expense) |
| (2) |
| - |
| (5) |
Net translation of foreign currencies |
| (59) |
| (167) |
| 301 |
Less: Net translation of foreign currencies attributable to noncontrolling interests |
| (5) |
| (15) |
| (3) |
Shareholders' net translation of foreign currencies |
| (54) |
| (152) |
| 304 |
Ending balance | $ | (275) | $ | (221) | $ | (65) |
|
|
|
|
|
|
|
Postretirement benefits liability |
|
|
|
|
|
|
Beginning balance | $ | (1,508) | $ | (1,345) | $ | (1,378) |
Reclassification adjustment to retained earnings related to U.S. tax reform legislation |
| - |
| (290) |
| - |
Adjusted beginning balance |
| (1,508) |
| (1,635) |
| (1,378) |
Reclassification adjustment for amortization of net losses from past experience and prior service costs (interest expense and other) |
| 62 |
| 69 |
| 64 |
Reclassification adjustment for settlement (interest expense and other) |
| 10 |
| - |
| 7 |
Tax (expense) |
| (15) |
| (15) |
| (24) |
Net adjustments reclassified from AOCI to net income |
| 57 |
| 54 |
| 47 |
Valuation update |
| (249) |
| 93 |
| (22) |
Tax benefit (expense) |
| 59 |
| (20) |
| 8 |
Net change due to valuation update |
| (190) |
| 73 |
| (14) |
Other comprehensive (loss) income, net of tax |
| (133) |
| 127 |
| 33 |
Ending balance | $ | (1,641) | $ | (1,508) | $ | (1,345) |
|
|
|
|
|
|
|
125
Note 15 – Organizational Efficiency Plan
The Company is continuously evaluating ways to deliver our products and services more efficiently and at a lower cost. During the fourth quarter of 2019, we committed to a plan to increase our organizational alignment, operational efficiency and reduce costs. As a result, we recognized a charge in selling, general and administrative expenses of $207 million pre-tax ($162 million after-tax) in the fourth quarter of 2019 primarily for severance costs related to headcount reductions. We expect most of the severance to be paid by the end of 2021.
(In millions) |
|
|
|
|
|
|
|
Fourth quarter 2019 charge |
|
|
|
|
| $ | 207 |
Less: 2019 payments |
|
|
|
|
|
| 2 |
Balance, December 31, 2019 |
|
|
|
|
| $ | 205 |
Note 16 – Pension
A.About Our Plans
The Company sponsors U.S. and non-U.S. defined benefit pension plans; future benefit accruals for the domestic plans are frozen.
Accounting policy. The Company measures the assets and liabilities of its domestic pension plans as of December 31. Benefit obligations are measured at the present value of estimated future payments based on actuarial assumptions. The Company uses the “corridor” method to account for changes in the benefit obligation when actual results differ from those assumed, or when assumptions change. These changes are called net unrecognized actuarial gains (losses). Under the corridor method, net unrecognized actuarial gains (losses) are initially recorded in accumulated other comprehensive income. When the unrecognized gain (loss) exceeds 10% of the benefit obligation, that excess is amortized to expense over the expected remaining lives of plan participants. The net plan expense is reported in interest expense and other in the Consolidated Statements of Income.
For balance sheet purposes, we measure plan assets at fair value. When the actual return differs from the expected return, those differences are reflected in the net unrealized actuarial gain (loss) discussed above. However, to measure pension benefit costs, we use a “market-related” asset valuation that differs from the actual fair value for domestic pension plan assets invested in non-fixed income investments. The “market-related” value recognizes the difference between actual and expected long-term returns in the portfolio over five years, a method that reduces the short-term impact of market fluctuations on pension costs. The market-related asset value was approximately $4.2 billion, compared with a fair value of approximately $4.4 billion at December 31, 2019.
126
B.Funded Status and Amounts Included in Accumulated Other Comprehensive Income
The following table summarizes the projected benefit obligations and assets related to our U.S. and non-U.S. pension plans as of, and for the years ended, December 31.
|
|
| Pension | ||
|
|
| Benefits | ||
(In millions) |
| 2019 | 2018 | ||
Change in benefit obligation |
|
|
|
|
|
Benefit obligation, January 1 |
| $ | 4,741 | $ | 4,969 |
Service cost |
|
| 2 |
| 3 |
Interest cost |
|
| 194 |
| 169 |
Assumed in acquisition |
|
| - |
| 137 |
Litigation settlement |
|
| 142 |
| 32 |
Loss (gain) from past experience |
|
| 574 | (1) | (235) |
Benefits paid from plan assets |
|
| (325) |
| (314) |
Benefits paid — other |
|
| (14) |
| (20) |
Benefit obligation, December 31 |
|
| 5,314 |
| 4,741 |
Change in plan assets |
|
|
|
|
|
Fair value of plan assets, January 1 |
|
| 4,151 |
| 4,281 |
Assumed in acquisition |
|
| - |
| 96 |
Actual return on plan assets |
|
| 594 |
| 85 |
Benefits paid |
|
| (325) |
| (314) |
Contributions |
|
| 21 |
| 3 |
Fair value of plan assets, December 31 |
|
| 4,441 |
| 4,151 |
Funded status |
| $ | (873) | $ | (590) |
|
|
|
|
|
|
Liability in Consolidated Balance Sheets |
|
|
|
|
|
Accrued expenses and other liabilities |
| $ | (18) | $ | (30) |
Other non-current liabilities |
| $ | (855) | $ | (560) |
(1) Loss reflects a decrease in the discount rate and an unfavorable change in the mortality assumption. | |||||
We fund our qualified pension plans at least at the minimum amount required by the Employee Retirement Income Security Act of 1974 and the Pension Protection Act of 2006. The Company made contributions to the qualified pension plans in 2019. For 2020, contributions to the qualified pension plans are expected to be . Future years’ contributions will ultimately be based on a wide range of factors including but not limited to asset returns, discount rates and funding targets. There are no plan assets for our non-qualified pension plans as they are generally funded on a pay-as-you-go basis.
Benefit payments. The following benefit payments are expected to be paid in:
|
|
|
|
|
| Pension | |
(In millions) |
| Benefits | |
2020 |
| $ | 322 |
2021 |
| $ | 312 |
2022 |
| $ | 314 |
2023 |
| $ | 318 |
2024 |
| $ | 318 |
2025-2029 |
| $ | 1,574 |
127
Amounts reflected in the pension liabilities shown above that have not yet been reported in net income and, therefore, have been included in accumulated other comprehensive loss consisted of the following as of December 31:
| Pension Benefits | |||
(In millions) | 2019 | 2018 | ||
Unrecognized net (losses) | $ | (2,132) | $ | (1,980) |
Unrecognized prior service cost |
| (5) |
| (6) |
Postretirement benefits liability adjustment | $ | (2,137) | $ | (1,986) |
C.Cost of Our Plans
Net pension cost was as follows:
|
| Pension Benefits | |||||
(In millions) |
| 2019 | 2018 | 2017 | |||
Service cost |
| $ | 2 | $ | 3 | $ | 3 |
Interest cost |
|
| 194 |
| 169 |
| 186 |
Expected long-term return on plan assets |
|
| (245) |
| (257) |
| (260) |
Litigation settlement |
|
| 142 |
| 32 |
| - |
Amortization of: |
|
|
|
|
|
|
|
Net loss from past experience |
|
| 59 |
| 70 |
| 66 |
Settlement loss |
|
| 10 |
| - |
| 7 |
Net plan cost |
| $ | 162 | $ | 17 | $ | 2 |
As further discussed in Note 22, Old Cigna and the Cigna Pension Plan (the “Plan”) are defendants in a class action lawsuit related to the Plan’s conversion of certain employees from an annuity to a cash balance benefit in 1997. In the fourth quarter of 2018, the Plan was ordered to pay $32 million representing the attorney fee portion of the settlement. This payment was recognized as an expense in 2018. In the first quarter of 2019, the Plan implemented the court order described in Note 22 resulting in an increase to the pension liability of $142 million. The Company reversed a litigation reserve for the expenses recognized for this matter in both 2019 and 2018 aggregating to the same amount resulting in no impact on net income.
D. Assumptions Used for Pension
|
| 2019 | 2018 |
Discount rate: |
|
|
|
Pension benefit obligation |
| 3.30% | 4.23% |
Pension benefit cost |
| 4.23% | 3.51% |
Expected long-term return on plan assets: |
|
|
|
Pension benefit cost |
| 6.75% | 7.00% |
Mortality table for pension obligations |
| White Collar mortality table with MP 2019 projection scale | RP 2014 with MP 2018 projection scale |
In 2019, to better align with our mortality experience, the Company adopted the “White Collar mortality table with MP 2019 projection scale” to value our benefit obligations.
The Company sets discount rates by applying actual annualized yields for high quality bonds at various durations to the expected cash flows of the pension liabilities. A discount rate curve is constructed using an array of bonds in various industries throughout the domestic market, but only selects those for the curve that have an above average return at each duration. Management believes that this curve is representative of the yields that the Company is able to achieve through its plan asset investment strategy.
Expected long-term rates of return on plan assets were developed considering actual long-term historical returns, expected long-term market conditions, plan asset mix and management’s investment strategy that continues a significant allocation to domestic and foreign equity securities as well as securities partnerships, real estate and hedge funds. Expected long-term market conditions take into consideration certain key macroeconomic trends including expected domestic and foreign GDP growth, employment levels and inflation.
128
E.Pension Plan Assets
As of December 31, 2019, pension assets included $4 billion invested in the separate accounts of Connecticut General Life Insurance Company and Life Insurance Company of North America, subsidiaries of the Company, as well as an additional $284 million invested directly in funds offered by the buyer of the retirement benefits business, and $122 million invested by others.
The fair values of pension assets by category are as follows as of December 31, 2019 and 2018.
(In millions) |
| 2019 |
| 2018 |
Debt securities: |
|
|
|
|
Corporate | $ | 1,906 | $ | 1,446 |
Asset-backed |
| 41 |
| 32 |
Fund investments |
| 460 |
| 768 |
Total debt securities |
| 2,407 |
| 2,246 |
Equity securities: |
|
|
|
|
Domestic |
| 582 |
| 506 |
International, including funds and pooled separate accounts (1) |
| 419 |
| 360 |
Total equity securities |
| 1,001 |
| 866 |
Securities partnerships |
| 531 |
| 477 |
Real estate funds, including pooled separate accounts (1) |
| 230 |
| 250 |
Commercial mortgage loans |
| 96 |
| 110 |
Hedge funds |
| 24 |
| 36 |
Guaranteed deposit account contract |
| 100 |
| 107 |
Cash equivalents and other current assets, net |
| 52 |
| 59 |
Total pension assets at fair value | $ | 4,441 | $ | 4,151 |
|
|
|
|
|
(1) A pooled separate account has several participating benefit plans and each owns a share of the total pool of investments. | ||||
The Company’s current target investment allocation percentages (60% fixed income, 25% public equity securities and 15% in other investments, including private equity (securities partnerships) and real estate) are developed by management as guidelines, although the fair values of each asset category are expected to vary as a result of changes in market conditions. The Company would expect to further reduce the allocation to equity securities and other investments and increase the allocation to fixed income investments as funding levels improve.
See Note 12 for further details regarding how fair value is determined, including the level within the fair value hierarchy and the procedures we use to validate fair value measurements. The Company classifies substantially all debt securities in Level 2 for pension plan assets. These assets are valued using recent trades of similar securities or are fund investments priced using their daily net asset value that is the exit price. A substantial portion of domestic equity securities within pension assets are classified as Level 1, while international equity funds within pension assets are predominantly classified in Level 2 using daily net asset value.
Securities partnerships, real estate and hedge funds are valued using NAV as a practical expedient and are excluded from the fair value hierarchy. See Note 12 for additional disclosures related to these assets invested in the separate accounts of the Company’s subsidiaries. Certain securities as described in Note 12, as well as commercial mortgage loans and guaranteed deposit account contracts, are classified in Level 3 because unobservable inputs used in their valuation are significant.
F.401(k) Plans
The Company sponsors a 401(k) plan in which the Company matches a portion of employees’ pre-tax contributions. Participants in the plan may invest in various funds that invest in the Company’s common stock, several diversified stock funds, a bond fund or a fixed-income fund.
The Company may elect to increase its matching contributions if the Company’s annual performance meets certain targets. The Company’s annual expense for these plans was as follows:
(In millions) | 2019 | 2018 | 2017 | |||
Expense | $ | 256 | $ | 196 | $ | 122 |
129
Note 17 – Employee Incentive Plans
A. About Our Plans
The People Resources Committee (the “Committee”) of the Board of Directors awards stock options, restricted stock grants, restricted stock units, deferred stock and strategic performance shares (“SPS”) to certain employees. The Committee has issued common stock instead of cash compensation.
Prior to the acquisition of Express Scripts, the Company issued shares from Treasury stock for these awards. Following the acquisition, original issue shares were used.
Awards of Express Scripts options and restricted stock units were rolled over to Cigna stock options and restricted stock units in connection with the Express Scripts acquisition on December 20, 2018. Information in this footnote includes the effect of the Express Scripts rollover awards unless otherwise indicated.
The Company records compensation expense for stock and option awards over their vesting periods primarily based on the estimated fair value at the grant date. Fair value is determined differently for each type of award as discussed below.
Shares of common stock available for award at December 31 were as follows:
(In millions) | 2019 | 2018 | 2017 | |||
Common shares available for award |
| 23.2 |
| 25.7 |
| 14.0 |
B. Stock Options
Accounting policy. The Company awards options to purchase Cigna common stock at the market price of the stock on the grant date except for rollover option awards issued to Express Scripts employees in connection with the acquisition. Options vest over periods ranging from one year to three years and expire no later than 10 years from grant date. Fair value is estimated using the Black-Scholes option-pricing model by applying the assumptions presented below. That fair value is reduced by options expected to be forfeited during the vesting period. The Company estimates forfeitures at the grant date based on our experience and adjusts the expense to reflect actual forfeitures over the vesting period. The fair value of options, net of forfeitures, is recognized in selling, general and administrative expenses on a straight-line basis over the vesting period.
Black-Scholes option-pricing model assumptions and the resulting fair value of options are presented in the following table. The average fair value of options and the expected option life exclude the rollover options granted to Express Scripts employees in connection with the acquisition. See Note 4 for further information.
|
| 2019 |
| 2018 |
| 2017 |
Dividend yield |
|
|
| |||
Expected volatility |
|
|
| |||
Risk-free interest rate |
|
|
| |||
Expected option life |
| 4.4 years |
| 4.4 years |
| 4.3 years |
Weighted average fair value of options | $ | 53.10 | $ | 64.18 | $ | 46.38 |
The expected volatility reflects the past daily stock price volatility of Cigna stock. The Company does not consider volatility implied in the market prices of traded options to be a good indicator of future volatility because remaining traded options will expire within one year. The risk-free interest rate is derived using the four-year U.S. Treasury bond yield rate as of the award date for the primary annual grant. Expected option life reflects the Company’s historical experience.
130
The following table shows the status of, and changes in, common stock options during the last three years.
(Options in thousands) | 2019 | 2018 | 2017 | |||||||||
|
|
| Weighted |
|
| Weighted |
|
| Weighted | |||
|
|
| Average |
|
| Average |
|
| Average | |||
| Options | Exercise Price | Options | Exercise Price | Options | Exercise Price | ||||||
Outstanding - January 1 |
| 12,370 | $ | 125.46 |
| 6,156 | $ | 100.79 |
| 7,097 | $ | 82.01 |
Granted |
| 1,569 | $ | 183.41 |
| 7,080 | $ | 143.62 |
| 1,230 | $ | 149.17 |
Exercised |
| (2,297) | $ | 106.75 |
| (771) | $ | 88.35 |
| (2,072) | $ | 63.41 |
Expired or canceled |
| (204) | $ | 180.08 |
| (95) | $ | 165.04 |
| (99) | $ | 138.41 |
Outstanding - December 31 |
| 11,438 | $ | 136.19 |
| 12,370 | $ | 125.46 |
| 6,156 | $ | 100.79 |
Options exercisable at year-end |
| 8,874 | $ | 123.87 |
| 9,446 | $ | 114.22 |
| 3,894 | $ | 77.36 |
Compensation expense of $64 million related to unvested stock options at December 31, 2019 will be recognized over the next two years (weighted average period).
The table below summarizes information for stock options exercised during the last three years:
(In millions) | 2019 | 2018 | 2017 | |||
Intrinsic value of options exercised | $ | 180 | $ | 86 | $ | 218 |
Cash received for options exercised | $ | 224 | $ | 68 | $ | 131 |
Tax benefit from options exercised | $ | 34 | $ | 8 | $ | 41 |
The following table summarizes information for outstanding common stock options at December 31, 2019:
|
| Options |
| Options |
|
| Outstanding |
| Exercisable |
Number (in thousands) |
| 11,438 |
| 8,874 |
Total intrinsic value (in millions) | $ | 781 | $ | 715 |
Weighted average exercise price | $ | 136.19 | $ | 123.87 |
Weighted average remaining contractual life |
| 5.6 years |
| 4.7 years |
C. Restricted Stock
The Company awards restricted stock (grants and units) to the Company’s employees that vest over periods ranging from one to three years. Recipients of restricted stock awards accumulate dividends during the vesting period, but forfeit their awards and accumulated dividends if their employment terminates before the vesting date.
Accounting policy. Fair value of restricted stock awards is equal to the market price of Cigna’s common stock on the date of grant. This fair value is reduced by awards that are expected to forfeit. At the grant date, the Company estimates forfeitures based on experience and adjusts the expense to reflect actual forfeitures over the vesting period. This fair value, net of forfeitures, is recognized in selling, general and administrative expenses over the vesting period on a straight-line basis.
131
The following table shows the status of, and changes in, restricted stock awards during the last three years.
(Awards in thousands) | 2019 | 2018 | 2017 | ||||||
|
| Weighted Average Fair Value at Award Date |
| Weighted Average Fair Value at Award Date |
| Weighted Average Fair Value at Award Date | |||
|
|
|
| ||||||
| Grants/Units | Grants/Units | Grants/Units | ||||||
Outstanding - January 1 | 2,138 | $ | 168.12 | 1,295 | $ | 126.44 | 1,309 | $ | 97.78 |
Awarded | 870 | $ | 183.86 | 1,451 | $ | 183.29 | 451 | $ | 155.21 |
Vested | (964) | $ | 160.74 | (560) | $ | 112.53 | (409) | $ | 67.09 |
Forfeited | (99) | $ | 168.68 | (48) | $ | 150.84 | (56) | $ | 121.74 |
Outstanding - December 31 | 1,945 | $ | 178.78 | 2,138 | $ | 168.12 | 1,295 | $ | 126.44 |
The fair value of vested restricted stock at the vesting date for the years ended December 31 was as follows:
(In millions) | 2019 | 2018 | 2017 | |||
Fair value of vested restricted stock | $ | 171 | $ | 107 | $ | 62 |
Approximately 10,300 employees held 1.9 million restricted stock awards at the end of 2019 with $160 million of related compensation expense to be recognized over the next two years (weighted average period).
D. Strategic Performance Shares (“SPS”)
The Company awards SPSs to executives and certain other key employees generally with a performance period of three years. Half of these shares are subject to a market condition (total shareholder return relative to industry peer companies) and half are subject to a performance condition (cumulative adjusted net income). These targets are set by the Committee at the beginning of the performance period. Holders of these awards receive shares of Cigna common stock at the end of the performance period ranging anywhere from 0 to 200% of the original awards.
Accounting policy. Compensation expense for SPSs is recorded over the performance period. Fair value is determined at the grant date for “market condition” SPSs using a Monte Carlo simulation model and not subsequently adjusted regardless of the final outcome. Expense is initially accrued for “performance condition” SPSs based on the most likely outcome, but evaluated for adjustment each period for updates in the expected outcome. Expense is adjusted to the actual outcome (number of shares awarded times the share price at the grant date) at the end of the performance period.
The following table shows the status of, and changes in, SPSs during the last three years:
| 2019 |
| 2018 |
| 2017 | ||||||
|
| Weighted |
|
| Weighted |
|
| Weighted | |||
|
| Average Fair Value |
|
| Average Fair Value |
|
| Average Fair Value | |||
(Awards in thousands) | Shares | at Award Date |
| Shares | at Award Date |
| Shares | at Award Date | |||
Outstanding - January 1 | 707 | $ | 160.74 |
| 778 | $ | 136.57 |
| 942 | $ | 109.14 |
Awarded | 389 | $ | 184.72 |
| 221 | $ | 197.51 |
| 275 | $ | 150.06 |
Vested | (244) | $ | 139.27 |
| (269) | $ | 121.57 |
| (386) | $ | 78.91 |
Forfeited | (34) | $ | 178.98 |
| (23) | $ | 158.16 |
| (53) | $ | 138.19 |
Outstanding - December 31 | 818 | $ | 177.94 |
| 707 | $ | 160.74 |
| 778 | $ | 136.57 |
132
The fair value of vested SPSs at the vesting date for the years ended December 31 was as follows:
| 2019 | 2018 | 2017 | |||||||||
(Shares in thousands; $ in millions) | Shares | Fair Value | Shares | Fair Value | Shares | Fair Value | ||||||
Shares of Cigna common stock distributed upon SPS vesting |
| 254 | $ | 45 |
| 380 | $ | 73 |
| 476 | $ | 70 |
Approximately 1,600 employees held 818,000 SPSs at the end of 2019 and $58 million of related compensation expense is expected to be recognized over the next two years. The amount of expense for “performance condition” SPSs will vary based on actual performance in 2020 and 2021.
E.
Compensation Cost and Tax Effects of Share-based Compensation
The Company records tax benefits in shareholders’ net income during the vesting period based on the amount of expense being recognized. The difference between tax benefits based on the expense and the actual tax benefit realized are also recorded in net income when stock options are exercised, or when restricted stock and SPSs vest.
(In millions) | 2019 | 2018 | 2017 | |||
Total compensation cost for shared-based awards | $ | 299 | $ | 180 | $ | 178 |
Tax benefits recognized | $ | 59 | $ | 36 | $ | 79 |
Note 18 – Goodwill, Other Intangibles and Property and Equipment
A.Goodwill
Accounting policy. Goodwill represents the excess of the cost of businesses acquired over the fair value of their net assets. The resulting goodwill is assigned to those reporting units expected to realize cash flows from the acquisition, based on those reporting units’ relative fair values. As a result, goodwill is primarily reported in the Health Services segment ($ billion), the Integrated Medical segment ($ billion) and, to a lesser extent, the International Markets segment ($ billion).
The Company evaluates goodwill for impairment at least annually during the third quarter at the reporting unit level and writes it down through shareholders’ net income if impaired. Fair value of a reporting unit is generally estimated based on either a market approach or a discounted cash flow analysis using assumptions that the Company believes a hypothetical market participant would use to determine a current transaction price. The significant assumptions and estimates used in determining fair value include the discount rate and future cash flows. A discount rate is selected to correspond with each reporting unit’s weighted average cost of capital, consistent with that used for investment decisions considering the specific and detailed operating plans and strategies within that reporting unit. Projections of future cash flows for each reporting unit are consistent with our annual planning process for revenues, pharmacy costs, benefits expenses, operating expenses, taxes, capital levels and long-term growth rates.
Goodwill activity. Goodwill activity during 2019 and 2018 was as follows:
(In millions) |
| 2019 |
| 2018 |
Balance at January 1, | $ | 44,505 | $ | 6,164 |
Goodwill acquired, net |
| 103 |
| 38,371 |
Impact of foreign currency translation |
| (6) |
| (30) |
Balance at December 31, | $ | 44,602 | $ | 44,505 |
|
|
|
|
|
The significant increase in goodwill during 2018 reflects the Company’s acquisition of Express Scripts as further discussed in Note 4.
133
B.Other Intangibles
Accounting policy. The Company’s other intangible assets primarily include purchased customer and producer relationships, provider networks and trademarks. The fair value of purchased customer relationships and the amortization method were determined as of the dates of purchase using an income approach that relies on projected future net cash flows including key assumptions for customer attrition and discount rates. The Company’s definite-lived intangible assets are amortized on an accelerated or straight-line basis, reflecting their pattern of economic benefits, over periods from to years. Management revises amortization periods if it believes there has been a change in the length of time that an intangible asset will continue to have value. Costs incurred to renew or extend the terms of these intangible assets are generally expensed as incurred.
The Company’s amortized intangible assets are tested for impairment whenever events or changes in circumstances indicate that the carrying amount may not be recoverable. If the total of the expected future undiscounted cash flows generated by the underlying asset group is less than the carrying amount of the asset group, the Company recognizes an impairment charge equal to the difference between the carrying value of the asset group and its estimated fair value. The Company’s indefinite-lived intangible assets are each reviewed for impairment at least annually by comparing their fair value with their carrying value. If the carrying value exceeds fair value, that excess is recognized as an impairment loss.
There were impairments in the years ended December 31, 2019, 2018 or 2017.
Components of other assets, including other intangibles. Other intangible assets were comprised of the following at December 31:
|
|
| Accumulated | Net Carrying |
(In millions) |
| Cost | Amortization | Value |
2019 |
|
|
|
|
Customer relationships | $ | 31,184 | 3,319 | 27,865 |
Trade Name - Express Scripts |
| 8,400 |
| 8,400 |
Other |
| 383 | 86 | 297 |
Other intangible assets |
| 39,967 | 3,405 | 36,562 |
Value of business acquired (reported in deferred policy acquisition costs) |
| 643 | 122 | 521 |
Total | $ | 40,610 | 3,527 | 37,083 |
2018 |
|
|
|
|
Customer relationships | $ | 31,451 | 1,213 | 30,238 |
Trade Name - Express Scripts |
| 8,400 |
| 8,400 |
Other |
| 560 | 195 | 365 |
Other intangible assets |
| 40,411 | 1,408 | 39,003 |
Value of business acquired (reported in deferred policy acquisition costs) |
| 665 | 102 | 563 |
Total | $ | 41,076 | 1,510 | 39,566 |
The Company has indefinite-lived intangible assets totaling $8.4 billion at December 31, 2019 and 2018, largely consisting of trade names and licenses.
C. Property and Equipment
Accounting policy. Property and equipment is carried at cost less accumulated depreciation. Cost includes interest, real estate taxes and other costs incurred during construction when applicable. Internal-use software that is acquired, developed or modified solely to meet the Company’s internal needs, with no plan to market externally, is also included in this category. Costs directly related to acquiring, developing or modifying internal-use software are capitalized.
The Company calculates depreciation and amortization principally using the straight-line method generally based on the estimated useful life of each asset as follows: buildings and improvements, to years; purchased software, to years; internally developed software, to years and furniture and equipment (including computer equipment), to years. Improvements to leased facilities are depreciated over the lesser of the remaining lease term or the estimated life of the improvement. The Company considers events and circumstances that would indicate the carrying value of property, equipment or capitalized software might not be recoverable. An impairment charge is recorded if the Company determines the carrying value of any of these assets is not recoverable. The Company also reviews and shortens the estimated useful lives of these assets, if necessary.
134
Components of property and equipment. Property and equipment was comprised of the following as of December 31:
|
|
|
| Accumulated |
| Net Carrying |
(In millions) |
| Cost |
| Amortization |
| Value |
2019 |
|
|
|
|
|
|
Internal-use software | $ | 6,578 | $ | 3,282 | $ | 3,296 |
Other property and equipment |
| 2,569 |
| 1,353 |
| 1,216 |
Total property and equipment |
| 9,147 |
| 4,635 |
| 4,512 |
Property and equipment classified as Assets held for sale |
| (226) |
| (131) |
| (95) |
Total property and equipment per Consolidated Balance Sheet | $ | 8,921 | $ | 4,504 | $ | 4,417 |
2018 |
|
|
|
|
|
|
Internal-use software | $ | 5,694 | $ | 2,415 | $ | 3,279 |
Other property and equipment |
| 2,264 |
| 981 |
| 1,283 |
Total property and equipment | $ | 7,958 | $ | 3,396 | $ | 4,562 |
| ||||||
Components of depreciation and amortization. Depreciation and amortization expense was comprised of the following for the years ended December 31:
(In millions) | 2019 | 2018 | 2017 | |||
Internal-use software | $ | 850 | $ | 323 | $ | 298 |
Other property and equipment |
| 284 |
| 146 |
| 153 |
Value of business acquired (reported in deferred policy acquisition costs) |
| 34 |
| 16 |
| 18 |
Other intangibles |
| 2,483 |
| 210 |
| 97 |
Total depreciation and amortization | $ | 3,651 | $ | 695 | $ | 566 |
The Company estimates annual pre-tax amortization for intangible assets, including internal-use software, over the next five calendar years to be as follows:
(In millions) | Pre-tax Amortization | |
2020 | $ | 2,466 |
2021 | $ | 2,386 |
2022 | $ | 2,061 |
2023 | $ | 1,902 |
2024 | $ | 1,773 |
|
|
|
Note 19 – Leases
As discussed in Note 2, the Company adopted ASU 2016-02, Leases, as of January 1, 2019. As permitted by the standard, the Company did not restate its Consolidated Financial Statements for periods prior to the adoption date and the required disclosures presented below are prospective from the date of adoption. The Company’s leases are primarily for office space and certain computer and other equipment, and have terms of up to 23 years.
Accounting policy. The Company determines if an arrangement is a lease and its lease classification (operating or finance) at inception. Beginning in the first quarter of 2019, both operating and finance leases result in (1) a right-of-use (“ROU”) asset that represents our right to use the underlying asset for the lease term and (2) a lease liability that represents our obligation to make lease payments arising from the lease. ROU assets and lease liabilities are reflected in the following lines in the Company’s Consolidated Balance Sheet:
|
| ROU Asset |
| Current Lease Liability |
| Non-Current Lease Liability |
Operating lease |
|
|
|
|
|
|
Finance lease |
|
|
|
135
These lease assets and liabilities are recognized at the lease commencement date based on the present value of the lease payments over the lease term. Most of the Company’s leases do not provide an implicit rate, so the Company uses its incremental borrowing rate based on the information available at commencement date in determining the present value of lease payments. The ROU asset also includes any lease pre-payments made and excludes lease incentives for operating leases. The Company’s expected life of a lease may consider options to extend or terminate a lease when it is reasonably certain that the Company will exercise that option.
The Company has lease agreements with lease and non-lease components that are accounted for as a single lease component. Variable lease payments are expensed as incurred and represent amounts that are neither fixed in nature, such as maintenance and other services provided by the lessor, nor tied to an index or rate.
The components of lease expense were as follows:
(In millions) |
| Year Ended December 31, 2019 |
Operating lease cost | $ | 188 |
Finance lease cost: |
|
|
Amortization of ROU assets |
| 28 |
Interest on lease liabilities |
| 3 |
Total finance lease cost |
| 31 |
Variable lease cost |
| 50 |
Total lease cost | $ | 269 |
Rental expense under operating lease agreements was $162 million for the years ended December 31, 2018 and 2017.
Supplemental cash flow information related to leases was as follows:
|
| Year ended |
(In millions) |
| December 31, 2019 |
Cash paid for amounts included in the measurement of lease liabilities: |
|
|
Operating cash outflows from operating leases | $ | 173 |
Operating cash outflows from finance leases | $ | 3 |
Financing cash outflows from finance leases | $ | 25 |
|
|
|
ROU assets obtained in exchange for lease obligations: |
|
|
Operating leases | $ | 89 |
Finance leases | $ | 68 |
The non-cash impact of adopting the new lease guidance was an increase of Other assets of $615 million and an increase to Accrued expenses and other liabilities of $630 million.
136
Operating and finance lease ROU assets and lease liabilities were as follows at the balance sheet date:
(In millions) |
| December 31, 2019 |
Operating leases: |
|
|
Operating lease ROU assets | $ | 536 |
|
|
|
Accrued expenses and other current liabilities | $ | 166 |
Other non-current liabilities |
| 465 |
Total operating lease liabilities | $ | 631 |
|
|
|
Finance leases: |
|
|
Property and equipment, gross | $ | 110 |
Accumulated depreciation |
| (23) |
Property and equipment, net | $ | 87 |
|
|
|
Short-term debt | $ | 27 |
Long-term debt |
| 61 |
Total finance lease liabilities | $ | 88 |
As of December 31, 2019, the weighted average remaining lease term was five years for operating leases and five years for finance leases, and the weighted average discount rate was 3.89% for operating leases and 3.77% for finance leases.
Maturities of lease liabilities as of December 31, 2019 were as follows:
(In millions) | Operating Leases | Finance Leases | ||
2020 | $ | 177 | $ | 28 |
2021 |
| 159 |
| 21 |
2022 |
| 133 |
| 18 |
2023 |
| 89 |
| 8 |
2024 |
| 63 |
| 6 |
Thereafter |
| 74 |
| 16 |
Total lease payments |
| 695 |
| 97 |
Less: imputed interest |
| 64 |
| 9 |
Total | $ | 631 | $ | 88 |
Note 20 – Shareholders’ Equity and Dividend Restrictions
State insurance departments and foreign jurisdictions that regulate certain of the Company’s subsidiaries prescribe accounting practices (differing in some respects from GAAP) to determine statutory net income and surplus. The Company’s life, accident and health insurance and Health Maintenance Organization (“HMO”) subsidiaries are regulated by such statutory requirements. The statutory net income of the Company’s life, accident and health insurance and HMO subsidiaries for the years ended, and their statutory surplus as of December 31, were as follows:
(In billions) | 2019 | 2018 | 2017 | |||
Net income | $ | 3.8 | $ | 3.4 | $ | 2.5 |
Surplus | $ | 13.8 | $ | 12.2 | $ | 10.4 |
137
The Company’s HMO and life, accident and health insurance subsidiaries are also subject to minimum statutory surplus requirements and may be required to maintain investments on deposit with state departments of insurance or other regulatory bodies. Additionally, these subsidiaries may be subject to regulatory restrictions on the amount of annual dividends or other distributions (such as loans or cash advances) that insurance companies may extend to their parent companies without prior approval. As of December 31, 2019, these amounts, including restricted GAAP net assets of the Company’s subsidiaries, were as follows:
(In billions) |
|
| 2019 | |||
Minimum statutory surplus required by regulators |
|
|
|
| $ | 4.8 |
Investments on deposit with regulatory bodies |
|
|
|
| $ | 0.5 |
Maximum dividend distributions permitted in 2020 without regulatory approval |
|
|
|
| $ | 2.9 |
Maximum loans to the parent company permitted without regulatory approval |
|
|
|
| $ | 1.0 |
Restricted GAAP net assets of Cigna Corporation's subsidiaries |
|
|
|
| $ | 15.3 |
Permitted practices used by the Company’s insurance subsidiaries in 2019 that differed from prescribed regulatory accounting had an immaterial impact on statutory net income and surplus.
Note 21 – Income Taxes
Accounting policy. Deferred income taxes are reflected in the Consolidated Balance Sheets for differences between the financial and income tax reporting bases of the Company’s underlying assets and liabilities, and established based upon enacted tax rates and laws. Deferred income tax assets are recognized when available evidence indicates that realization is more likely than not, and a valuation allowance is established to the extent this standard is not met. The deferred income tax provision generally represents the net change in deferred income tax assets and liabilities during the reporting period excluding adjustments to accumulated other comprehensive income or amounts recorded in connection with a business combination. The current income tax provision generally represents estimated amounts due on income tax returns for the year reported to various jurisdictions plus the effect of any uncertain tax positions. The Company recognizes a liability for uncertain tax positions if management believes the probability that the positions will be sustained is less than 50 percent. The liabilities for uncertain tax positions are classified as current when the position is expected to be settled within 12 months or the statute of limitation expires within 12 months.
Income taxes attributable to the Company’s foreign operations are generally provided using the respective foreign jurisdictions’ tax rate.
Our capital management strategy to support the liquidity and regulatory capital requirements of our foreign operations and certain international growth initiatives is to retain overseas a significant portion of the earnings generated by our foreign operations. This strategy does not materially limit our ability to meet our liquidity and capital needs in the United States. The Company generally does not intend to repatriate these earnings.
A.Income Tax Expense
The components of income taxes for the years ended December 31 were as follows:
(In millions) | 2019 | 2018 | 2017 | |||
Current taxes |
|
|
|
|
|
|
U.S. income taxes | $ | 1,476 | $ | 804 | $ | 974 |
Foreign income taxes |
| 173 |
| 185 |
| 122 |
State income taxes |
| 114 |
| 47 |
| 36 |
Total current taxes |
| 1,763 |
| 1,036 |
| 1,132 |
Deferred taxes (benefits) |
|
|
|
|
|
|
U.S. income taxes (benefits) |
| (236) |
| (75) |
| 204 |
Foreign income taxes |
| 16 |
| 8 |
| 39 |
State income tax (benefits) |
| (93) |
| (34) |
| (1) |
Total deferred taxes (benefits) |
| (313) |
| (101) |
| 242 |
Total income taxes | $ | 1,450 | $ | 935 | $ | 1,374 |
138
Total income taxes for the years ended December 31 were different from the amount computed using the nominal federal income tax rate for the following reasons:
|
| 2019 |
| 2018 |
| 2017 |
| |||||
(In millions) |
| $ | % |
|
| $ | % |
|
| $ | % |
|
Tax expense at nominal rate | $ | 1,380 | 21.0 | % | $ | 752 | 21.0 | % | $ | 1,262 | 35.0 | % |
Effect of U.S. tax reform legislation |
| - | - |
|
| (4) | (0.1) |
|
| 232 | 6.4 |
|
Effect of foreign earnings |
| 24 | 0.4 |
|
| 74 | 2.1 |
|
| (70) | (1.9) |
|
Health insurance industry tax |
| - | - |
|
| 78 | 2.2 |
|
| - | - |
|
State income tax (net of federal income tax benefit) |
| 32 | 0.5 |
|
| 10 | 0.3 |
|
| 23 | 0.6 |
|
Other |
| 14 | 0.2 |
|
| 25 | 0.6 |
|
| (73) | (2.0) |
|
Total income taxes | $ | 1,450 | 22.1 | % | $ | 935 | 26.1 | % | $ | 1,374 | 38.1 | % |
The decrease in the 2019 effective tax rate was due primarily to the suspension of the health insurance industry tax. Tax expense in 2017 was based on a federal income tax rate of 35% and included a $232 million charge due to U.S. tax reform, driven by revaluation of deferred tax balances and the deemed repatriation tax on accumulated foreign earnings.
Consolidated pre-tax income from the Company’s foreign operations was approximately 12% of the Company’s pre-tax income in 2019. The comparable amounts in prior years were 15% in 2018 and 14% in 2017. South Korean operations produced a majority of the Company’s foreign pre-tax earnings.
B. Deferred Income Taxes
Deferred income tax assets and liabilities as of December 31 were as follows:
(In millions) | 2019 | 2018 | ||
Deferred tax assets (1) |
|
|
|
|
Employee and retiree benefit plans | $ | 511 | $ | 411 |
Other insurance and contractholder liabilities |
| 282 |
| 396 |
Loss carryforwards |
| 260 |
| 255 |
Other accrued liabilities |
| 183 |
| 341 |
Other |
| 218 |
| 187 |
Deferred tax assets before valuation allowance |
| 1,454 |
| 1,590 |
Valuation allowance for deferred tax assets |
| (196) |
| (199) |
Deferred tax assets, net of valuation allowance |
| 1,258 |
| 1,391 |
Deferred tax liabilities (1) |
|
|
|
|
Depreciation and amortization |
| 630 |
| 744 |
Acquisition-related basis differences |
| 9,386 |
| 9,863 |
Policy acquisition expenses |
| 113 |
| 211 |
Unrealized appreciation on investments and foreign currency translation |
| 223 |
| (29) |
Other |
| 293 |
| 55 |
Total deferred tax liabilities |
| 10,645 |
| 10,844 |
Net deferred income tax (liabilities) assets | $ | (9,387) | $ | (9,453) |
(1) Certain prior year balances have been reclassified to align with the year end 2019 presentation. |
|
|
|
|
Management believes that future results will be sufficient to realize a majority of the Company’s gross deferred tax assets. We establish valuation allowances against deferred tax assets when we determine that it is more likely than not that the asset will not be recognized. Valuation allowances have been established against certain federal, state and foreign capital and operating losses. There are multiple expiration dates associated with these losses, though a significant portion expire in 2021.
139
C. Uncertain Tax Positions and Other Tax Matters
Reconciliations of unrecognized tax benefits for the years ended December 31 follow:
(In millions) | 2019 | 2018 | 2017 | |||
Balance at January 1, | $ | 928 | $ | 35 | $ | 31 |
Increase due to prior year positions |
| 68 |
| 40 |
| - |
Increase due to business combinations |
| - |
| 860 |
| - |
Increase due to current year positions |
| 29 |
| 6 |
| 7 |
Reduction related to settlements with taxing authorities |
| - |
| (1) |
| (1) |
Reduction related to lapse of applicable statute of limitations |
| (7) |
| (12) |
| (2) |
Balance at December 31, | $ | 1,018 | $ | 928 | $ | 35 |
Substantially all unrecognized tax benefits would impact shareholders’ net income if recognized. The increase in the liability for uncertain tax positions from 2017 to 2018 was largely due to matters related to Health Services.
The Company classifies net interest expense on uncertain tax positions as a component of income tax expense, but excludes this amount from the disclosed liability for uncertain tax positions. The liability for net interest expense on uncertain tax positions was approximately $100 million as of December 31, 2019, and for the prior two years.
D.Other Tax Matters
The statute of limitations for Cigna's consolidated federal income tax returns through 2015 has closed and there are no pending examinations. The Internal Revenue Service (“IRS”) has examined Express Scripts’ tax returns for 2010 through 2012, for which there is a significant disputed tax matter, and is currently examining returns for 2013 through 2015. In addition, the Company has pending refund claims for various years. The Company conducts business in a number of state and foreign jurisdictions and may be engaged in multiple audit proceedings at any given time. Generally, no further state or foreign audit activity is expected for tax years prior to 2011 for Cigna’s entities and 2006 for Express Scripts’ entities.
Note 22 – Contingencies and Other Matters
The Company, through its subsidiaries, is contingently liable for various guarantees provided in the ordinary course of business.
A.Financial Guarantees: Retiree and Life Insurance Benefits
The Company guarantees that separate account assets will be sufficient to pay certain life insurance or retiree benefits. For the majority of these benefits, the sponsoring employers are primarily responsible for ensuring that assets are sufficient to pay these benefits and are required to maintain assets that exceed a certain percentage of benefit obligations. If employers fail to do so, the Company or an affiliate of the buyer of the retirement benefits business (Prudential Retirement Insurance and Annuity Company or “Prudential”) has the right to redirect the management of the related assets to provide for benefit payments. As of December 31, 2019, employers maintained assets that exceeded the benefit obligations under these arrangements of approximately $450 million. These guarantees are generally provided by the Company with minimal reinsurance from third parties. An additional liability is established if management believes that the Company will be required to make payments under the guarantees; there were additional liabilities required for these guarantees, net of reinsurance, as of December 31, 2019. Separate account assets supporting these guarantees are classified in Levels 1 and 2 of the GAAP fair value hierarchy (see Note 12).
The Company does not expect that these financial guarantees will have a material effect on the Company’s consolidated results of operations, liquidity or financial condition.
B.Certain Other Guarantees
The Company had indemnification obligations as of December 31, 2019 in connection with acquisition and disposition transactions. These indemnification obligations are triggered by the breach of representations or covenants provided by the Company, such as representations for the presentation of financial statements, the filing of tax returns, compliance with law or the identification of outstanding litigation. These obligations are typically subject to various time limitations, defined by the contract or by operation of law, such as statutes of limitation. In some cases, the maximum potential amount due is subject to contractual limitations based on a percentage of the transaction purchase price, while in other cases limitations are not specified or applicable. The Company does not believe that it is possible to determine the maximum potential amount due under these obligations because not all amounts due under
140
these indemnification obligations are subject to limitation. There were liabilities for these indemnification obligations as of December 31, 2019.
C.Guaranty Fund Assessments
The Company operates in a regulatory environment that may require its participation in assessments under state insurance guaranty association laws. The Company’s exposure to assessments for certain obligations of insolvent insurance companies to policyholders and claimants is based on its share of business written in the relevant jurisdictions.
There were impacts related to existing or new guaranty fund assessments in 2019.
D. Legal and Regulatory Matters
The Company is routinely involved in numerous claims, lawsuits, regulatory inquiries and audits, government investigations, including under the federal False Claims Act and state false claims acts initiated by a government investigating body or by a qui tam relator’s filing of a complaint under court seal and other legal matters arising, for the most part, in the ordinary course of managing a global health service business. Additionally, the Company has received and is cooperating with subpoenas or similar processes from various governmental agencies requesting information, all arising in the normal course of its business. Disputed tax matters arising from audits by the Internal Revenue Service or other state and foreign jurisdictions, including those resulting in litigation, are accounted for under GAAP guidance for uncertain tax positions. Further information on income tax matters can be found in Note 21.
Pending litigation and legal or regulatory matters that the Company has identified with a reasonable possibility of material loss are described below. For material pending litigation and legal or regulatory matters discussed below, the Company provides disclosure in the aggregate of accruals and range of loss, or a statement that such information cannot be estimated. The Company’s accruals for the matters discussed below under “Litigation Matters” and “Regulatory Matters” are immaterial. Due to numerous uncertain factors presented in these cases, it is not possible to estimate an aggregate range of loss (if any) for these matters at this time. In light of the uncertainties involved in these matters, there is no assurance that their ultimate resolution will not exceed the amounts currently accrued by the Company. An adverse outcome in one or more of these matters could be material to the Company’s results of operations, financial condition or liquidity for any particular period. The outcomes of lawsuits are inherently unpredictable, and we may be unsuccessful in these ongoing litigation matters or any future claims or litigation.
Litigation Matters
Amara cash balance pension plan litigation. In December 2001, Janice Amara filed a class action lawsuit in the U.S. District Court for the District of Connecticut against Cigna Corporation (now Old Cigna) and the Plan on behalf of herself and other similarly situated Plan participants affected by the 1998 conversion to a cash balance formula. The plaintiffs allege various violations of the Employee Retirement Income Security Act of 1974 (“ERISA”), including that the Plan’s cash balance formula discriminates against older employees; that the conversion resulted in a wear-away period (when the pre-conversion accrued benefit exceeded the post-conversion benefit); and that the Plan communications contained inaccurate or inadequate disclosures about these conditions.
In 2008, the District Court (1) affirmed the Company’s right to convert to a cash balance plan prospectively beginning in 1998; (2) found for plaintiffs on the disclosure claim only; and (3) required the Company to pay pre-1998 benefits under the pre-conversion traditional annuity formula and post-1997 benefits under the post-conversion cash balance formula. From 2008 through 2015, this case has undergone a series of court proceedings that resulted in the original District Court Order being largely upheld. In 2015, the Company submitted to the District Court its proposed method for calculating the additional pension benefits due to class members and plaintiffs responded in August 2015.
Since then, there has been continued litigation regarding the calculation of benefits and attorneys’ fees and administration of the remedy payments. On November 29, 2018, the Court ordered the Pension Plan to pay attorneys’ and incentive fees of $32 million, and to pay any past due lump sums and back benefits within 90 days of the Order. The attorneys’ fees were paid as ordered in December 2018. In the first quarter of 2019, the Company amended the Plan, notified class participants of their increased benefits and commenced remedy benefit payments out of the Plan, including the past due lump sums and back benefits. See Note 16 for additional information.
In April 2019, plaintiffs challenged certain aspects of the methodology used to calculate and pay benefits. In August 2019, the Court denied plaintiffs’ challenge in all but one minor respect that did not result in a material change to the pension obligation. The plaintiffs filed a motion for reconsideration that the Court denied on January 10, 2020. On January 15, 2020, plaintiffs filed a motion for an equitable accounting and a notice of appeal.
141
Cigna Litigation with Anthem. In February 2017, the Company delivered a notice to Anthem terminating the 2015 merger agreement, and notifying Anthem that it must pay the Company the $1.85 billion reverse termination fee pursuant to the terms of the merger agreement. Also in February 2017, the Company filed suit against Anthem in the Delaware Court of Chancery (the “Chancery Court”) seeking declaratory judgments that the Company’s termination of the merger agreement was valid and that Anthem was not permitted to extend the termination date. The complaint also sought payment of the reverse termination fee and additional damages in an amount exceeding $13 billion, including the lost premium value to the Company’s shareholders caused by Anthem’s willful breaches of the merger agreement. Anthem countersued, alleging its own claims for damages.
On February 15, 2017, the Chancery Court granted Anthem’s motion for a temporary restraining order and temporarily enjoined the Company from terminating the merger agreement. In May 2017, the Chancery Court denied Anthem’s motion for a preliminary injunction to enjoin Cigna from terminating the merger agreement but stayed its ruling pending Anthem’s determination as to whether to seek an appeal. Anthem subsequently notified Cigna and the Chancery Court that it did not intend to appeal the Chancery Court’s decision. As a result, the merger agreement was terminated.
The litigation between the parties remains pending. A trial was held during the first quarter of 2019. Oral arguments on post-trial briefs were held on November 26, 2019. In February 2020, the Chancery Court issued a letter requesting certain supplemental briefing. The supplemental briefs are due March 6, 2020. We believe in the merits of our claims and dispute Anthem’s claims, and we intend to vigorously defend ourselves and pursue our claims.
Express Scripts Litigation with Anthem. In March 2016, Anthem filed a lawsuit in the United States District Court for the Southern District of New York alleging various breach of contract claims against Express Scripts relating to the parties’ rights and obligations under the periodic pricing review section of the pharmacy benefit management agreement between the parties including allegations that Express Scripts failed to negotiate new pricing concessions in good faith, as well as various alleged service issues. Anthem also requested that the court enter declaratory judgment that Express Scripts is required to provide Anthem competitive benchmark pricing, that Anthem can terminate the agreement, and that Express Scripts is required to provide Anthem with post-termination services at competitive benchmark pricing for one year following any termination by Anthem. Anthem claims it is entitled to $13 billion in additional pricing concessions over the remaining term of the agreement, as well as $1.8 billion for one year following any contract termination by Anthem and $150 million in damages for service issues (“Anthem’s Allegations”). On April 19, 2016, in response to Anthem’s complaint, Express Scripts filed its answer denying Anthem’s Allegations in their entirety and asserting affirmative defenses and counterclaims against Anthem. The court subsequently granted Anthem’s motion to dismiss two of six counts of Express Scripts’ amended counterclaims. The current scheduling order runs through the completion of summary judgment briefing in October 2020. There is no tentative trial date. We believe in the merits of our claims and dispute Anthem’s claims, and we intend to vigorously defend ourselves and pursue our claims.
Regulatory Matters
Civil Investigative Demand. The U.S. Department of Justice (“DOJ”) is conducting an industry-wide investigation of Medicare Advantage organizations’ risk adjustment practices under Medicare Parts C and D including medical chart reviews and health exams. The Company is currently responding to information requests (civil investigative demands) received from the DOJ (U.S. Attorney’s Offices for the Eastern District of Pennsylvania and the Southern District of New York). We will continue to cooperate with the DOJ’s investigation.
Disability claims regulatory matter. The Company is subject to an agreement with the Departments of Insurance for Maine, Massachusetts, Pennsylvania, Connecticut and California (together, the “Lead States”), originally entered into in 2013, that relates to the Company’s long-term disability claims handling practices. The agreement provides for enhanced procedures related to documentation and disposition. Cigna has cooperated fully with the Lead States and we believe we have addressed the requirements of the agreement. The Lead States initiated a re-examination of our practices. Accordingly, the Company may be subject to additional costs, penalties and requests to change its business practices that could negatively impact future earnings for this business.
142
Note 23 – Segment Information
See Note 1 for a description of our segments. Effective with the first quarter of 2019, the Company began allocating compensation cost for stock options to the segments. Prior year segment information was not restated for this change. A description of our basis for reporting segment operating results is outlined below. Intersegment transactions primarily reflect pharmacy sales to insured customers of the Integrated Medical segment. These and other transactions are eliminated in consolidation.
The Company uses “pre-tax adjusted income from operations” and “adjusted revenues” as its principal financial measures of segment operating performance because management believes they best reflect the underlying results of business operations and permit analysis of trends in underlying revenue, expenses and profitability. Pre-tax adjusted income from operations is defined as income before taxes excluding realized investment results, amortization of acquired intangible assets, results of Anthem and Coventry Health Care, Inc. (the “transitioning clients”) and special items. Income or expense amounts that are excluded from adjusted income from operations because they are not indicative of underlying performance or the responsibility of operating segment management include:
Realized investment gains (losses) including changes in market values of certain financial instruments between balance sheet dates, as well as gains and losses associated with invested asset sales
Amortization of acquired intangible assets because these relate to costs incurred for acquisitions
Results of transitioning clients because those results are not indicative of ongoing results
Special items, if any, that management believes are not representative of the underlying results of operations due to the nature or size of these matters.
The Company does not report total assets by segment since this is not a metric used to allocate resources or evaluate segment performance.
Adjusted revenues is defined as revenues excluding: 1) revenue contributions from transitioning clients; 2) the Company’s share of certain realized investment results of its joint ventures reported in the International Markets segment using the equity method of accounting and 3) special items, if any.
The following tables present the special items recorded by the Company in 2019, 2018 and 2017.
(In millions) |
|
|
|
|
| |
Description of Special Item Charges (Benefits) and Financial Statement Line Item(s) |
| After-tax |
|
| Before-tax | |
Year ended December 31, 2019 |
|
|
|
|
| |
| Total integration and transaction-related costs (Selling, general and administrative expenses) | $ | 427 |
| $ | 552 |
| Charge for organizational efficiency plan (Selling, general and administrative expenses) | $ | 162 |
| $ | 207 |
| Charges associated with litigation matters (Selling, general and administrative expenses) | $ | 41 |
| $ | 51 |
Year ended December 31, 2018 |
|
|
|
|
| |
| Integration and transaction-related costs |
|
|
|
|
|
| - Selling, general and administrative expenses | $ | 587 |
| $ | 748 |
| - Interest expense and other |
| 179 |
|
| 227 |
| - Net investment income |
| (97) |
|
| (123) |
| Total integration and transaction-related costs | $ | 669 |
| $ | 852 |
| Charges associated with litigation matters (Selling, general and administrative expenses) | $ | 19 |
| $ | 25 |
| Charges associated with U.S. tax reform |
|
|
|
|
|
| - Selling, general and administrative expenses | $ | 1 |
| $ | 2 |
| - Tax (benefit) |
| (3) |
|
|
|
| Total (benefits) charges associated with U.S. tax reform | $ | (2) |
| $ | 2 |
Year ended December 31, 2017 |
|
|
|
|
| |
| Integration and transaction-related costs |
|
|
|
|
|
| - Selling, general and administrative expenses | $ | 92 |
| $ | 126 |
| - Tax (benefit) |
| (59) |
|
|
|
| Total integration and transaction-related costs | $ | 33 |
| $ | 126 |
| Charges associated with U.S. tax reform |
|
|
|
|
|
| - Selling, general and administrative expenses | $ | (36) |
| $ | (56) |
| - Tax expense |
| 232 |
|
|
|
| Total charges (benefits) associated with U.S. tax reform | $ | 196 |
| $ | (56) |
| Debt extinguishment costs | $ | 209 |
| $ | 321 |
| Long-term care guaranty fund assessment (Selling, general and administrative expenses) | $ | 83 |
| $ | 129 |
143
Summarized segment financial information for the years ended December 31 was as follows:
(In millions) | Health Services | Integrated Medical | International Markets | Group Disability and Other | Corporate and Eliminations | Total | ||||||
2019 |
|
|
|
|
|
|
|
|
|
|
|
|
Revenues from external customers (1) | $ | 107,354 | $ | 34,861 | $ | 5,500 | $ | 4,461 | $ | - | $ | 152,176 |
Inter-segment revenues |
| 2,380 |
| 1,180 |
| - |
| 26 |
| (3,586) |
|
|
Net investment income |
| 60 |
| 478 |
| 159 |
| 695 |
| (2) |
| 1,390 |
Total revenues |
| 109,794 |
| 36,519 |
| 5,659 |
| 5,182 |
| (3,588) |
| 153,566 |
Revenue contributions from transitioning clients |
| (13,347) |
| - |
| - |
| - |
| - |
| (13,347) |
Net realized investment results from equity method subsidiaries (2) |
| - |
| - |
| (44) |
| - |
| - |
| (44) |
Adjusted revenues | $ | 96,447 | $ | 36,519 | $ | 5,615 | $ | 5,182 | $ | (3,588) | $ | 140,175 |
Depreciation and amortization | $ | 3,071 | $ | 449 | $ | 87 | $ | 41 | $ | 3 | $ | 3,651 |
Income (loss) before taxes | $ | 3,983 | $ | 3,904 | $ | 785 | $ | 562 | $ | (2,664) | $ | 6,570 |
Pre-tax adjustments to reconcile to adjusted income from operations | ||||||||||||
Adjustment for transitioning clients |
| (1,726) |
| - |
| - |
| - |
| - |
| (1,726) |
(Income) attributable to noncontrolling interests |
| (4) |
| - |
| (16) |
| - |
| - |
| (20) |
Net realized investment (gains) (2) |
| - |
| (112) |
| (43) |
| (66) |
| - |
| (221) |
Amortization of acquired intangible assets |
| 2,839 |
| 69 |
| 36 |
| 5 |
| - |
| 2,949 |
Special items |
|
|
|
|
|
|
|
|
|
|
|
|
Integration and transaction-related costs |
| - |
| - |
| - |
| - |
| 552 |
| 552 |
Charge for organizational efficiency plan |
| - |
| - |
| - |
| - |
| 207 |
| 207 |
Charges associated with litigation matters |
| - |
| (30) |
| - |
| - |
| 81 |
| 51 |
Pre-tax adjusted income (loss) from operations | $ | 5,092 | $ | 3,831 | $ | 762 | $ | 501 | $ | (1,824) | $ | 8,362 |
| ||||||||||||
|
|
|
|
|
|
|
|
|
|
|
|
|
|
|
|
|
|
|
|
|
|
|
|
|
|
(In millions) | Health Services | Integrated Medical | International Markets | Group Disability and Other | Corporate and Eliminations | Total | ||||||
2018 |
|
|
|
|
|
|
|
|
|
|
|
|
Revenues from external customers (1) | $ | 5,902 | $ | 31,759 | $ | 5,174 | $ | 4,335 | $ | - | $ | 47,170 |
Inter-segment revenues |
| 1,154 |
| 573 |
| - |
| 14 |
| (1,741) |
|
|
Net investment income |
| 9 |
| 459 |
| 149 |
| 712 |
| 151 |
| 1,480 |
Total revenues | $ | 7,065 | $ | 32,791 | $ | 5,323 | $ | 5,061 | $ | (1,590) | $ | 48,650 |
Revenue contributions from transitioning clients |
| (459) |
| - |
| - |
| - |
| - |
| (459) |
Net realized investment results from equity method subsidiaries (2) |
| - |
| - |
| 43 |
| - |
| - |
| 43 |
Special items reported in integration and transaction-related costs |
| - |
| - |
| - |
| - |
| (123) |
| (123) |
Adjusted revenues | $ | 6,606 | $ | 32,791 | $ | 5,366 | $ | 5,061 | $ | (1,713) | $ | 48,111 |
Depreciation and amortization | $ | 120 | $ | 466 | $ | 55 | $ | 53 | $ | 1 | $ | 695 |
Income (loss) before taxes | $ | 329 | $ | 3,342 | $ | 670 | $ | 497 | $ | (1,257) | $ | 3,581 |
Pre-tax adjustments to reconcile to adjusted income from operations | ||||||||||||
Adjustment for transitioning clients |
| (62) |
| - |
| - |
| - |
| - |
| (62) |
(Income) attributable to noncontrolling interests |
| - |
| - |
| (14) |
| - |
| - |
| (14) |
Net realized investment losses(2) |
| - |
| 36 |
| 61 |
| 25 |
| 2 |
| 124 |
Amortization of acquired intangible assets |
| 113 |
| 99 |
| 18 |
| 5 |
| - |
| 235 |
Special items |
|
|
|
|
|
|
|
|
|
|
|
|
Integration and transaction-related costs |
| - |
| - |
| - |
| - |
| 852 |
| 852 |
Charges associated with litigation matters |
| - |
| 25 |
| - |
| - |
| - |
| 25 |
U.S. tax reform |
| - |
| - |
| - |
| 2 |
| - |
| 2 |
Pre-tax adjusted income (loss) from operations | $ | 380 | $ | 3,502 | $ | 735 | $ | 529 | $ | (403) | $ | 4,743 |
| ||||||||||||
(1) Includes the Company’s share of the earnings of its joint ventures reported in the International Markets segment using the equity method of accounting. | ||||||||||||
(2) Beginning in 2018, includes the Company's share of certain realized investment gains (losses) of its joint ventures reported using the equity method of accounting. | ||||||||||||
|
|
|
|
|
|
|
|
|
|
|
|
|
|
|
|
|
|
|
|
|
|
|
|
|
|
144
(In millions) | Health Services | Integrated Medical | International Markets | Group Disability and Other | Corporate and Eliminations | Total | ||||||
2017 |
|
|
|
|
|
|
|
|
|
|
|
|
Revenues from external customers (1) | $ | 3,250 | $ | 28,193 | $ | 4,774 | $ | 4,363 | $ | - | $ | 40,580 |
Inter-segment revenues |
| 988 |
| 476 |
| - |
| 12 |
| (1,476) |
|
|
Net investment income |
| 3 |
| 366 |
| 127 |
| 700 |
| 30 |
| 1,226 |
Total revenues | $ | 4,241 | $ | 29,035 | $ | 4,901 | $ | 5,075 | $ | (1,446) | $ | 41,806 |
Adjusted revenues | $ | 4,241 | $ | 29,035 | $ | 4,901 | $ | 5,075 | $ | (1,446) | $ | 41,806 |
Depreciation and amortization | $ | - | $ | 470 | $ | 61 | $ | 31 | $ | 4 | $ | 566 |
Income (loss) before taxes | $ | 288 | $ | 2,859 | $ | 667 | $ | 614 | $ | (822) | $ | 3,606 |
Pre-tax adjustments to reconcile to adjusted income from operations | ||||||||||||
Loss attributable to noncontrolling interests |
| - |
| 1 |
| 1 |
| - |
| - |
| 2 |
Net realized investment (gains) |
| - |
| (137) |
| (31) |
| (69) |
| - |
| (237) |
Amortization of acquired intangible assets |
| - |
| 93 |
| 17 |
| 5 |
| - |
| 115 |
Special items |
|
|
|
|
|
|
|
|
|
|
|
|
Debt extinguishment costs |
| - |
| - |
| - |
| - |
| 321 |
| 321 |
Long-term care guaranty fund assessment |
| - |
| 106 |
| - |
| 23 |
| - |
| 129 |
Integration and transaction-related costs |
| - |
| - |
| - |
| - |
| 126 |
| 126 |
U.S. tax reform |
| - |
| - |
| - |
| (56) |
| - |
| (56) |
Pre-tax adjusted income (loss) from operations | $ | 288 | $ | 2,922 | $ | 654 | $ | 517 | $ | (375) | $ | 4,006 |
|
|
|
|
|
|
|
|
|
|
|
|
|
(1) Includes the Company’s share of the earnings of its joint ventures reported in the International Markets segment using the equity method of accounting. | ||||||||||||
Revenue from external customers includes pharmacy revenues, premiums and fees and other revenues. The following table presents these revenues by product, premium and service type for the twelve months ended December 31:
(In millions) | 2019 |
| 2018 |
| 2017 | ||||
Products (Pharmacy revenues) (ASC 606) |
|
|
|
|
|
|
|
|
|
Network revenues | $ |
| 50,431 |
| $ | 1,415 |
| $ | - |
Home delivery and specialty revenues |
|
| 47,768 |
|
| 3,997 |
|
| 2,979 |
Other |
|
| 4,900 |
|
| 67 |
|
| - |
Total pharmacy revenues |
|
| 103,099 |
|
| 5,479 |
|
| 2,979 |
Integrated Medical premiums (ASC 944) |
|
|
|
|
|
|
|
|
|
Commercial |
|
|
|
|
|
|
|
|
|
Health Insurance |
|
| 12,523 |
|
| 10,710 |
|
| 9,439 |
Stop loss |
|
| 4,328 |
|
| 4,008 |
|
| 3,483 |
Other |
|
| 1,040 |
|
| 1,038 |
|
| 917 |
Government |
|
|
|
|
|
|
|
|
|
Medicare Advantage |
|
| 6,314 |
|
| 5,832 |
|
| 5,534 |
Medicare Part D |
|
| 1,699 |
|
| 764 |
|
| 764 |
Other |
|
| 4,185 |
|
| 4,496 |
|
| 3,494 |
Total Integrated Medical premiums |
|
| 30,089 |
|
| 26,848 |
|
| 23,631 |
International Markets premiums |
|
| 5,266 |
|
| 5,043 |
|
| 4,619 |
Domestic disability, life and accident premiums |
|
| 4,225 |
|
| 4,000 |
|
| 3,973 |
Other premiums |
|
| 134 |
|
| 222 |
|
| 268 |
Total premiums |
|
| 39,714 |
|
| 36,113 |
|
| 32,491 |
Services (ASC 606) |
|
|
|
|
|
|
|
|
|
Fees |
|
| 9,229 |
|
| 5,558 |
|
| 5,053 |
Other external revenues |
|
| 134 |
|
| 20 |
|
| 57 |
Total services |
|
| 9,363 |
|
| 5,578 |
|
| 5,110 |
Total revenues from external customers | $ |
| 152,176 |
| $ | 47,170 |
| $ | 40,580 |
|
|
|
|
|
|
|
|
|
|
145
Foreign and U.S. revenues from external customers for the three years ended December 31 are shown below. The Company’s foreign revenues are generated by its foreign operating entities. In the periods shown, no foreign country contributed more than of consolidated revenues from external customers.
(In millions) |
| 2019 |
| 2018 |
| 2017 | |||
United States |
| $ | 147,332 |
| $ | 42,773 |
| $ | 36,555 |
South Korea |
|
| 2,022 |
|
| 2,093 |
|
| 1,892 |
All other foreign countries |
|
| 2,822 |
|
| 2,304 |
|
| 2,133 |
Total |
| $ | 152,176 |
| $ | 47,170 |
| $ | 40,580 |
146
Quarterly Financial Data (unaudited)
The following unaudited quarterly financial data is presented on a consolidated basis for each of the years ended December 31, 2019 and December 31, 2018. Quarterly financial results necessarily rely heavily on estimates. This and certain other factors, such as the seasonal nature of portions of the insurance business, suggest the need to exercise caution in drawing specific conclusions from quarterly consolidated results.
(In millions, except per share amounts) |
|
|
|
| Three Months Ended |
|
|
|
| |||
| March 31, |
| June 30, | September 30, | December 31, | |||||||
Consolidated Results |
|
|
|
|
|
|
|
|
|
|
|
|
2019 |
|
|
|
|
|
|
|
|
|
|
|
|
Total revenues | $ | 37,946 |
| $ | 38,819 |
| $ | 38,556 |
| $ | 38,245 |
|
Income before income taxes |
| 1,788 |
|
| 1,758 |
|
| 1,763 |
|
| 1,261 |
|
Shareholders’ net income |
| 1,368 | (1) |
| 1,408 | (1) |
| 1,351 | (1) |
| 977 | (1) |
Shareholders’ net income per share | 1 |
|
|
|
|
|
|
|
|
|
|
|
Basic |
| 3.61 |
|
| 3.73 |
|
| 3.60 |
|
| 2.63 |
|
Diluted |
| 3.56 |
|
| 3.70 |
|
| 3.57 |
|
| 2.60 |
|
2018 |
|
|
|
|
|
|
|
|
|
|
|
|
Total revenues | $ | 11,413 |
| $ | 11,480 |
| $ | 11,457 |
| $ | 14,300 |
|
Income before income taxes |
| 1,218 |
|
| 1,102 |
|
| 1,033 |
|
| 228 |
|
Shareholders’ net income |
| 915 | (1) |
| 806 | (1) |
| 772 | (1) |
| 144 | (1) |
Shareholders’ net income per share |
|
|
|
|
|
|
|
|
|
|
|
|
Basic |
| 3.78 |
|
| 3.32 |
|
| 3.18 |
|
| 0.56 |
|
Diluted |
| 3.72 |
|
| 3.29 |
|
| 3.14 |
|
| 0.55 |
|
Stock and dividend data |
|
|
|
|
|
|
|
|
|
|
|
|
2019 |
|
|
|
|
|
|
|
|
|
|
|
|
Price range of common stock — high | $ | 202.02 |
| $ | 170.89 |
| $ | 185.77 |
| $ | 207.28 |
|
— low | $ | 158.58 |
| $ | 141.95 |
| $ | 145.51 |
| $ | 146.50 |
|
Dividends declared per common share | $ | 0.04 |
| $ | - |
| $ | - |
| $ | - |
|
2018 |
|
|
|
|
|
|
|
|
|
|
|
|
Price range of common stock — high | $ | 227.13 |
| $ | 182.10 |
| $ | 208.73 |
| $ | 226.61 |
|
— low | $ | 163.02 |
| $ | 163.80 |
| $ | 166.88 |
| $ | 176.52 |
|
Dividends declared per common share | $ | 0.04 |
| $ | - |
| $ | - |
| $ | - |
|
|
|
|
|
|
|
|
|
|
|
|
|
|
(1) Shareholders’ net income includes the following after-tax charges (benefits), described in Note 23 to the Consolidated Financial Statements: | ||||||||||||
| March 31, |
| June 30, |
| September 30, |
| December 31, |
| ||||
2019 Integration and transaction-related costs | $ | 108 |
| $ | 115 |
| $ | 88 |
| $ | 116 |
|
2019 Charge for organizational efficiency plan |
| - |
|
| - |
|
| - |
|
| 162 |
|
2019 Charges (benefits) associated with litigation matters |
| - |
|
| 64 |
|
| (23) |
|
| - |
|
Total 2019 charges | $ | 108 |
| $ | 179 |
| $ | 65 |
| $ | 278 |
|
|
|
|
|
|
|
|
|
|
|
|
|
|
| March 31, |
| June 30, |
| September 30, |
| December 31, |
| ||||
2018 Integration and transaction-related costs | $ | 50 |
| $ | 109 |
| $ | 108 |
| $ | 402 |
|
2018 Charges (benefits) associated with litigation matters |
| - |
|
| - |
|
| 35 |
|
| (16) |
|
2018 U.S. tax reform |
| - |
|
| - |
|
| (5) |
|
| 3 |
|
Total 2018 charges | $ | 50 |
| $ | 109 |
| $ | 138 |
| $ | 389 |
|
147
Item 9. CHANGES IN AND DISAGREEMENTS WITH ACCOUNTANTS ON ACCOUNTING AND FINANCIAL DISCLOSURE
None.
Item 9A. CONTROLS AND PROCEDURES
A.Disclosure Controls and Procedures
Based on an evaluation of the effectiveness of Cigna’s disclosure controls and procedures conducted under the supervision and with the participation of Cigna's management (including Cigna’s Chief Executive Officer and Chief Financial Officer), Cigna’s Chief Executive Officer and Chief Financial Officer concluded that, as of the end of the period covered by this report, Cigna’s disclosure controls and procedures are effective to ensure that information required to be disclosed by Cigna in the reports that it files or submits under the Exchange Act is recorded, processed, summarized and reported, within the time periods specified in the SEC’s rules and forms and is accumulated and communicated to Cigna’s management, including its principal executive and principal financial officers, as appropriate to allow timely decisions regarding required disclosure.
B.Internal Control Over Financial Reporting
Management’s Annual Report on Internal Control over Financial Reporting
Management of Cigna Corporation is responsible for establishing and maintaining adequate internal controls over financial reporting. The Company’s internal controls were designed to provide reasonable assurance that the Company’s consolidated published financial statements for external purposes were prepared in accordance with accounting principles generally accepted in the United States. The Company’s internal control over financial reporting includes those policies and procedures that:
(i)pertain to the maintenance of records that, in reasonable detail, accurately and fairly reflect the transactions and dispositions of the assets of the Company;
(ii)provide reasonable assurance that transactions are recorded as necessary to permit preparation of financial statements in accordance with accounting principles generally accepted in the United States, and that receipts and expenditures of the Company are being made only in accordance with authorization of management and directors of the Company; and
(iii)provide reasonable assurance regarding prevention or timely detection of unauthorized acquisitions, use or disposition of the Company’s assets that could have a material effect on the financial statements.
Because of its inherent limitations, internal control over financial reporting may not prevent or detect misstatements.
Management assessed the effectiveness of the Company’s internal controls over financial reporting as of December 31, 2019. In making this assessment, management used the criteria set forth by the Committee of Sponsoring Organizations of the Treadway Commission (“COSO”) in Internal Control-Integrated Framework (2013). Based on management’s assessment and the criteria set forth by COSO, it was determined that the Company’s internal controls over financial reporting are effective as of December 31, 2019.
The Company’s independent registered public accounting firm, PricewaterhouseCoopers LLP, has audited the effectiveness of the Company’s internal control over financial reporting, as stated in their report located in Item 8 of this Form 10-K.
Change in Internal Control over Financial Reporting
During the period covered by this report, other than the changes resulting from the Express Scripts, Inc. acquisition discussed below, there have been no changes in Cigna's internal control over financial reporting that have materially affected, or are reasonably likely to materially affect, Cigna's internal control over financial reporting.
On December 20, 2018, the Company completed the acquisition of Express Scripts, Inc. During 2019, the Company has incorporated internal controls over significant processes specific to Express Scripts that it believes to be appropriate and necessary in consideration of the level of related integration. As the Company further integrates the Express Scripts business, it will continue to review the internal controls and may take further steps to ensure that the internal controls are effective and integrated appropriately.
Item 9B. OTHER INFORMATION
None.
148
PART III
Item 10. DIRECTORS, EXECUTIVE OFFICERS AND CORPORATE GOVERNANCE
A.Directors of the Registrant
The information under the captions “Corporate Governance Matters – Process for Director Elections,” “– Board of Directors’ Nominees” and “– Board Meetings and Committees” (as it relates to Audit Committee disclosure) in Cigna’s definitive proxy statement related to the 2020 annual meeting of shareholders is incorporated herein by reference.
B.Executive Officers of the Registrant
See PART I – “Information about our Executive Officers” on page 47 in this Form 10-K.
C.Code of Ethics and Other Corporate Governance Disclosures
The information under the caption “Corporate Governance Matters – Codes of Ethics” in Cigna’s definitive proxy statement related to the 2020 annual meeting of shareholders is incorporated herein by reference. We intend to promptly disclose on our website, in accordance with applicable rules, any required disclosure of changes to or waivers, if any, of our Code of Ethics or our Director Code of Business Conduct and Ethics.
D.Delinquent Section 16(a) Reports
The information under the caption “Ownership of Cigna Common Stock – Delinquent Section 16(a) Reports”, if included in Cigna’s definitive proxy statement related to the 2020 annual meeting of shareholders, is incorporated herein by reference.
Item 11. EXECUTIVE COMPENSATION
The information under the captions “Corporate Governance Matters – Non-Employee Director Compensation,” “Corporate Governance Matters – Certain Transactions – Compensation Committee Interlocks and Inside Participation,” “Compensation Matters – Compensation Discussion and Analysis,” “– Report of the People Resources Committee” and “– Executive Compensation Tables” in Cigna’s definitive proxy statement related to the 2020 annual meeting of shareholders is incorporated herein by reference.
149
Item 12. SECURITY OWNERSHIP OF CERTAIN BENEFICIAL OWNERS AND MANAGEMENT AND RELATED STOCKHOLDER MATTERS
The following table presents information regarding Cigna’s equity compensation plans as of December 31, 2019:
|
| (a)(1) |
| (b)(2) |
| (c)(3) |
| |||||
Plan Category |
|
|
| Securities To Be Issued |
| Weighted Average |
| Securities Remaining |
| |||
Equity Compensation Plans Approved by Security Holders |
|
| 13,709,684 |
| $ | 136.19 |
|
| 26,267,656 |
| ||
Equity Compensation Plans Not Approved by Security Holders |
|
| - |
|
| - |
|
| - |
| ||
Total |
|
| 13,709,684 |
| $ | 136.19 |
|
| 26,267,656 |
| ||
(1)Includes, in addition to outstanding stock options:
(i) 96,298 restricted stock units, 115,723 deferred shares, and 1,558,258 strategic performance shares that are reported at the maximum 200% payout rate granted under the Cigna Long-Term Incentive Plan, the Corporation Stock Plan and the Cigna Corporation Director Equity Plan; and
(ii) 789,459 shares of common stock underlying stock option awards and 488,127 restricted stock units granted under the Express Scripts Holding Company 2016 Long-Term Incentive Plan, 10,001 deferred shares granted under the Express Scripts, Inc. Executive Deferred Compensation Plan of 2005, 2,077,398 shares of common stock underlying stock option awards granted under the Express Scripts, Inc. 2011 Long-Term Incentive Plan, 1,759,907 shares of common stock underlying stock option awards and 3,300 restricted stock units granted under the Medco Health Solutions, Inc. 2002 Stock Incentive Plan, and 90,088 shares of common stock underlying stock option awards granted under the Accredo Health, Incorporated 2002 Long-Term Incentive Plan that were all approved by the applicable company’s shareholders before Cigna’s acquisition of Express Scripts in December 2018.
(2)The weighted-average exercise price is based only on outstanding stock options. The outstanding stock options assumed due to Cigna's acquisition of Express Scripts, in aggregate, have a weighted-average exercise price of $139.76. Excluding the assumed options from this acquisition results in a weighted-average exercise price of $133.69.
(3) Includes 225,338 shares of common stock available as of the close of business December 31, 2019 for future issuance under the Cigna Corporation Director Equity Plan, 23,231,054 shares of common stock available as of the close of business on December 31, 2019 for future issuance under the Cigna Long-Term Incentive Plan that includes 11,825,476 shares of common stock available assumed from the Express Scripts, Inc. 2016 Long-Term Incentive Plan, and 2,811,264 shares of common stock available as of the close of business December 31, 2019 for future issuance under the Express Scripts, Inc. Executive Deferred Compensation Plan of 2005. Because no further grants may be made under the Express Scripts, Inc. 2016 Long-Term Incentive Plan, the Express Scripts, Inc. 2011 Long-Term Incentive Plan, the Medco Health Solutions, Inc. 2002 Stock Incentive Plan, and the Accredo Health, Incorporated 2002 Long-Term Incentive Plan, shares available for issuance under these plans are not included.
The information under the captions “Ownership of Cigna Common Stock – Stock Held by Directors, Nominees and Executive Officers” and “Ownership of Cigna Common Stock – Stock Held by Certain Beneficial Owners” in Cigna’s definitive proxy statement related to the 2020 annual meeting of shareholders is incorporated herein by reference.
Item 13. CERTAIN RELATIONSHIPS AND RELATED TRANSACTIONS, AND DIRECTOR INDEPENDENCE
The information under the captions “Corporate Governance Matters – Director Independence” and “– Certain Transactions” in Cigna’s definitive proxy statement related to the 2020 annual meeting of shareholders is incorporated herein by reference.
Item 14. PRINCIPAL ACCOUNTANT FEES AND SERVICES
The information under the captions “Audit Matters – Policy for the Pre-Approval of Audit and Non-Audit Services” and “– Fees to Independent Registered Public Accounting Firm” in Cigna’s definitive proxy statement related to the 2020 annual meeting of shareholders is incorporated herein by reference.
150
PART IV
Item 15. EXHIBITS AND FINANCIAL STATEMENT SCHEDULES
(a)(1) The following Financial Statements begin on page 77:
Report of Independent Registered Public Accounting Firm.
Consolidated Statements of Income for the years ended December 31, 2019, 2018 and 2017.
Consolidated Statements of Comprehensive Income for the years ended December 31, 2019, 2018 and 2017.
Consolidated Balance Sheets as of December 31, 2019 and 2018.
Consolidated Statements of Changes in Total Equity for the years ended December 31, 2019, 2018 and 2017.
Consolidated Statements of Cash Flows for the years ended December 31, 2019, 2018 and 2017.
Notes to the Consolidated Financial Statements.
(2) The financial statement schedules are listed in the Index to Financial Statement Schedules on page FS-1.
(b) The exhibits listed in the accompanying “Index to Exhibits” in this Item 15 are filed or incorporated by reference as part of this Annual Report on Form 10-K.
151
INDEX TO EXHIBITS
Number | Description | Method of Filing |
2.1(a) | Filed by Cigna Holding Company (“CHC”) as Exhibit 2.1 to the Current Report on Form 8-K on March 13, 2018 and incorporated herein by reference. | |
2.1(b) | Filed by CHC as Exhibit 2.1 to the Current Report on Form 8-K on July 2, 2018 and incorporated herein by reference. | |
3.1 | Filed by the registrant as Exhibit 3.1 to the Current Report on Form 8-K on December 20, 2018 and incorporated herein by reference. | |
3.2 | Amended and Restated By-Laws of the registrant as last amended February 26, 2020. | Filed by the registrant as Exhibit 3.1 to the Current Report on Form 8-K on February 27, 2020 and incorporated herein by reference. |
4.1(a) | Filed by CHC as Exhibit 4.1 to the Current Report on Form 8-K on September 21, 2018 and incorporated herein by reference. | |
4.1(b) | Filed by CHC as Exhibit 4.2 to the Current Report on Form 8-K on September 21, 2018 and incorporated herein by reference. | |
4.1(c) | Filed by the registrant as Exhibit 4.7 to the Current Report on Form 8-K on December 20, 2018 and incorporated herein by reference. | |
4.1(d) | Filed by the registrant as Exhibit 4.1 to the Current Report on Form 8-K on October 11, 2019 and incorporated herein by reference. | |
4.2 | Filed by the registrant as Exhibit 4.2 to the Current Report on Form 8-K on October 11, 2019 and incorporated herein by reference. | |
4.3(a) | Filed by CHC as Exhibit 4.1(a) to the Annual Report on Form 10-K for the year ended December 31, 2012 and incorporated herein by reference. | |
4.3(b) | Filed by CHC as Exhibit 4.1(b) to the Annual Report on Form 10-K for the year ended December 31, 2012 and incorporated herein by reference. |
152
4.3(c) |
| Filed by CHC as Exhibit 4.1(c) to the Quarterly Report on Form 10-Q for the quarterly period ended March 31, 2011 and incorporated herein by reference. |
4.3(d) | Filed by CHC as Exhibit 4.1 to the Current Report on Form 8-K on March 10, 2008 and incorporated herein by reference. | |
4.3(e) | Filed by CHC as Exhibit 99.2 to the Current Report on Form 8-K on May 28, 2010 and incorporated herein by reference. | |
4.3(f) | Filed by CHC as Exhibit 99.2 to the Current Report on Form 8-K on December 9, 2010 and incorporated herein by reference. | |
4.3(g) | Filed by CHC as Exhibit 99.2 to the Current Report on Form 8-K on March 8, 2011 and incorporated herein by reference. | |
4.3(h) | Filed by CHC as Exhibit 4.1 to the Current Report on Form 8-K on November 14, 2011 and incorporated herein by reference. | |
4.3(i) | Filed by CHC as Exhibit 4.1 to the Current Report on Form 8-K on March 26, 2015 and incorporated herein by reference. | |
4.3(j) | Filed by CHC as Exhibit 4.1 to the Current Report on Form 8-K filed September 14, 2017 and incorporated herein by reference. | |
4.3(k) | Filed by the registrant as Exhibit 4.1 to the Current Report on Form 8-K on December 20, 2018 and incorporated herein by reference. | |
4.3(l) | Filed by the registrant as Exhibit 4.3 to the Current Report on Form 8-K on October 11, 2019 and incorporated herein by reference. | |
4.4(a) | Filed by CHC as Exhibit 4.2 to the Annual Report on Form 10-K for the year ended December 31, 2009 and incorporated herein by reference. | |
4.4(b) | Filed by the registrant as Exhibit 4.2 to the Current Report on Form 8-K on December 20, 2018 and incorporated herein by reference. |
153
4.4(c) | Filed by the registrant as Exhibit 4.4 to the Current Report on Form 8-K on October 11, 2019 and incorporated herein by reference. | |
4.5(a) | Filed by CHC as Exhibit 4.3 to the Annual Report on Form 10-K for the year ended December 31, 2009 and incorporated herein by reference. | |
4.5(b) | Filed by the registrant as Exhibit 4.3 to the Current Report on Form 8-K on December 20, 2018 and incorporated herein by reference. | |
4.6(a) | Filed by Express Scripts, Inc. (“ESI”) as Exhibit 4.1 to the Current Report on Form 8-K filed November 25, 2011 and incorporated herein by reference. | |
4.6(b) | Filed by ESI as Exhibit 4.4 to the Current Report on Form 8-K on November 25, 2011 and incorporated herein by reference. | |
4.6(c) | Filed by ESI as Exhibit 4.5 to the Current Report on Form 8-K on November 25, 2011 and incorporated herein by reference. | |
4.6(d) | Filed by ESI as Exhibit 4.3 to the Current Report on Form 8-K filed February 10, 2012 and incorporated herein by reference. | |
4.6(e) | Filed by Express Scripts Holding Company (“ESRX”) as Exhibit 4.1 to the Current Report on Form 8-K on April 6, 2012 and incorporated herein by reference. | |
4.6(f) | Filed by ESRX as Exhibit 4.1 to the Current Report on Form 8-K on June 5, 2014 and incorporated herein by reference. | |
4.6(g) | Filed by ESRX as Exhibit 4.2 to the Current Report on Form 8-K on June 5, 2014 and incorporated herein by reference. | |
4.6(h) | Filed by ESRX as Exhibit 4.3 to the Current Report on Form 8-K on June 5, 2014 and incorporated herein by reference. |
154
4.6(i) | Filed by ESRX as Exhibit 4.1 to the Current Report on Form 8-K on February 25, 2016 and incorporated herein by reference. | |
4.6(j) | Filed by ESRX as Exhibit 4.2 to the Current Report on Form 8-K on February 25, 2016 and incorporated herein by reference. | |
4.6(k) | Filed by ESRX as Exhibit 4.1 to the Current Report on Form 8-K on July 5, 2016 and incorporated herein by reference. | |
4.6(l) | Filed by ESRX as Exhibit 4.2 to the Current Report on Form 8-K on July 5, 2016 and incorporated herein by reference. | |
4.6(m) | Filed by ESRX as Exhibit 4.3 to the Current Report on Form 8-K on July 5, 2016 and incorporated herein by reference. | |
4.6(n) | Filed by ESRX as Exhibit 4.1 to the Current Report on Form 8-K on November 30, 2017 and incorporated herein by reference. | |
4.6(o) | Filed by ESRX as Exhibit 4.2 to the Current Report on Form 8-K on November 30, 2017 and incorporated herein by reference. | |
4.6(p) | Filed by ESRX as Exhibit 4.3 to the Current Report on Form 8-K on November 30, 2017 and incorporated herein by reference. | |
4.6(q) | Filed by the registrant as Exhibit 4.4 to the Current Report on Form 8-K on December 20, 2018 and incorporated herein by reference. | |
4.6(r) | Filed by the registrant as Exhibit 4.5 to the Current Report on Form 8-K on October 11, 2019 and incorporated herein by reference. | |
4.7(a) | Filed by ESI as Exhibit 4.1 to the Current Report on Form 8-K on June 10, 2009 and incorporated herein by reference. | |
4.7(b) | Filed by ESI as Exhibit 4.4 to the Current Report on Form 8-K on June 10, 2009 and incorporated herein by reference. |
155
4.7(c) | Filed by ESI as Exhibit 4.6 to the Current Report on Form 8-K on November 25, 2011 and incorporated herein by reference. | |
4.7(d) | Filed by ESRX as Exhibit 4.2 to the Current Report on Form 8-K on April 6, 2012 and incorporated herein by reference. | |
4.7(e) | Filed by the registrant as Exhibit 4.5 to the Current Report on Form 8-K on December 20, 2018 and incorporated herein by reference. | |
4.8 | Filed herewith |
Exhibits 10.1 through 10.40 are identified as compensatory plans, management contracts or arrangements pursuant to Item 15 of Form 10-K.
10.1(a) | Filed by the registrant as Exhibit 10.1 to the Current Report on Form 8-K on May 1, 2017 and incorporated herein by reference. | |
10.1(b) | Amendment No. 1, effective January 25, 2018, to the Cigna LTIP | Filed by CHC as Exhibit 10.3 to the Quarterly Report on Form 10-Q for the quarterly period ended March 31, 2018 and incorporated herein by reference. |
10.1(c) | Form of Cigna LTIP: Strategic Performance Share Grant Agreement | Filed by the registrant as Exhibit 10.1 to Quarterly Report on Form 10-Q for the period ended March 31, 2019 and incorporated herein by reference. |
10.1(d) | Form of Cigna LTIP: Nonqualified Stock Option Grant Agreement
| Filed by the registrant as Exhibit 10.2 to Quarterly Report on Form 10-Q for the period ended March 31, 2019 and incorporated herein by reference. |
10.1(e) | Filed by the registrant as Exhibit 10.3 to Quarterly Report on Form 10-Q for the period ended March 31, 2019 and incorporated herein by reference. | |
10.1(f) | Filed by the registrant as Exhibit 10.4 to Quarterly Report on Form 10-Q for the period ended March 31, 2019 and incorporated herein by reference. | |
10.2 | Filed by CHC as Exhibit 10.7 to the Annual Report on Form 10-K for the year ended December 31, 2009 and incorporated herein by reference. | |
10.3 | Cigna Stock Unit Plan, as amended and restated effective February 22, 2017 | Filed by CHC as Exhibit 10.5 to the Quarterly Report on Form 10-Q for the quarterly period ended March 31, 2017 and incorporated herein by reference. |
156
10.4(a) | Express Scripts Holding Company 2016 Long-Term Incentive Plan (the “ESRX LTIP”)
| Filed by ESRX as Appendix A to ESRX’s Definitive Proxy Statement on Schedule 14A for its 2016 Annual Meeting of Stockholders, filed March 21, 2016 and incorporated herein by reference. |
10.4(b) | Filed by ESRX as Exhibit 10.4 to the Current Report on Form 8-K on May 4, 2016 and incorporated herein by reference. | |
10.4(c) | Filed by ESRX as Exhibit 10.5 to the Current Report on Form 8-K on May 4, 2016 and incorporated herein by reference. | |
10.4(d) | Filed by ESRX as Exhibit 10.7 to Current Report on Form 8-K on May 4, 2016 and incorporated herein by reference. | |
10.5(a) | Filed by the registrant as Exhibit 4.10 to the Registration Statement on Form S-8 (No. 333- 228930) on December 20, 2018 and incorporated herein by reference. | |
10.5(b) | Filed by ESRX as Exhibit 10.6 to Quarterly Report on Form 10-Q for the quarter ended June 30, 2012 and incorporated herein by reference. | |
10.5(c) | Filed by ESRX as Exhibit 10.14 to the Current Report on Form 8-K on April 2, 2012 and incorporated herein by reference. | |
10.5(d) | Filed by ESRX as Exhibit 10.1 to the Quarterly Report on Form 10-Q for the quarter ended March 31, 2013 and incorporated herein by reference. | |
10.6(a) | Filed by the registrant as Exhibit 4.11 to the Registration Statement on Form S-8 (No. 333- 228930) on December 20, 2018 and incorporated herein by reference. | |
10.6(b) | Form of terms and conditions for director stock option and restricted stock unit awards | Filed by Medco as Exhibit 10.2 to the Current Report on Form 8-K on February 8, 2005 and incorporated herein by reference. |
10.7 | Filed by the registrant as Exhibit 4.12 to the Registration Statement on Form S-8 (No. 333- 228930) on December 20, 2018 and incorporated herein by reference. |
157
10.8 |
| Filed by CHC as Exhibit 10.1 the Annual Report on Form 10-K for the year ended December 31, 2011 and incorporated herein by reference. |
10.9 | Cigna Deferred Compensation Plan, as amended and restated October 24, 2001
| Filed by CHC as Exhibit 10.14 to the Annual Report on Form 10-K for the year ended December 31, 2011 and incorporated herein by reference. |
10.10 | Cigna Deferred Compensation Plan of 2005 effective as of January 1, 2005 | Filed by the registrant as Exhibit 4.6 to the Registration Statement on Form S-8 (No. 333- 228930) on December 20, 2018 and incorporated herein by reference. |
10.11 | Filed by ESI as Exhibit No. 10.1 to the Current Report on Form 8-K on May 25, 2007 and incorporated herein by reference. | |
10.12(a) | Filed by the registrant as Exhibit 4.13 to the Registration Statement on Form S-8 (No. 333- 228930) on December 20, 2018 and incorporated herein by reference. | |
10.12(b) | Amendment No. 1 to the Express Scripts, Inc. Executive Deferred Compensation Plan of 2005 | Filed herewith. |
10.13(a) | Cigna Supplemental Pension Plan as amended and restated effective August 1, 1998 | Filed by CHC as Exhibit 10.15(a) to the Annual Report on Form 10-K for the year ended December 31, 2009 and incorporated herein by reference. |
10.13(b) | Filed by CHC as Exhibit 10.15(b) to the Annual Report on Form 10-K for the year ended December 31, 2009 and incorporated herein by reference. | |
10.13(c) | Amendment No. 2 dated December 6, 2000 to the Cigna Supplemental Pension | Filed by CHC as Exhibit 10.16(c) to the Annual Report on Form 10-K for the year ended December 31, 2011 and incorporated herein by reference. |
10.14(a) | Cigna Supplemental Pension Plan of 2005 effective as of January 1, 2005 | Filed by CHC as Exhibit 10.15 to the Annual Report on Form 10-K for the year ended December 31, 2007 and incorporated herein by reference. |
10.14(b) | Amendment No. 1 to the Cigna Supplemental Pension Plan of 2005 | Filed by CHC as Exhibit 10.1 to the Quarterly Report on Form 10-Q for the quarterly period ended June 30, 2009 and incorporated herein by reference. |
158
10.15(a) | Filed by the registrant as Exhibit 4.7 to the Registration Statement on Form S-8 (No. 333- 228930) on December 20, 2018 and incorporated herein by reference. | |
10.15(b) | Filed herewith | |
10.15(c) | Filed herewith | |
10.15(d) | Filed herewith | |
10.16 |
| Filed by CHC as Exhibit 10.1 to the Quarterly Report on Form 10-Q for the quarterly period ended March 31, 2014 and incorporated herein by reference. |
10.17 |
| Filed by the registrant as Exhibit 10.18 to the Annual Report on Form 10-K for the year ended December 31, 2018 and incorporated herein by reference. |
10.18 | Filed by the registrant as Exhibit 4.5 to the Registration Statement on Form S-8 (No. 333- 228930) on December 20, 2018 and incorporated herein by reference. | |
10.19 | Filed by CHC as Exhibit 10.4 to the Annual Report on Form 10-K for the year ended December 31, 2012 and incorporated herein by reference. | |
10.20 | Filed by the registrant as Exhibit 4.8 to the Registration Statement on Form S-8 (No. 333- 228930) on December 20, 2018 and incorporated herein by reference. | |
10.21 | Filed by ESRX as Exhibit 10.1 to the Current Report on Form 8-K on March 5, 2014 and incorporated herein by reference. | |
10.22 | Cigna Executive Severance Benefits Plan as amended and restated effective October 23, 2018 | Filed by the registrant as Exhibit 10.23 to the Annual Report on Form 10-K for the year ended December 31, 2018 and incorporated herein by reference. |
159
10.23 | Description of Severance Benefits for Executives in Non-Change of Control Circumstances
| Filed by CHC as Exhibit 10.10 to the Annual Report on Form 10-K for the year ended December 31, 2009 and incorporated herein by reference. |
10.24 | Cigna Executive Incentive Plan amended and restated as of January 1, 2012 | Filed by CHC as Exhibit 10.1 to the Quarterly Report on Form 10-Q for the quarterly period ended March 31, 2012 and incorporated herein by reference. |
10.25 | Filed by CHC as Exhibit 10.18 to the Annual Report on Form 10-K for the year ended December 31, 2009 and incorporated herein by reference. | |
10.26 | Filed by CHC as Exhibit 10.1 to the Current Report on Form 8-K on June 19, 2017 and incorporated herein by reference. | |
10.27 | Filed by CHC as Exhibit 10.2 to the Quarterly Report on Form 10-Q for the period ended March 31, 2012 and incorporated herein by reference. | |
10.28 | Filed by CHC as Exhibit 10.1(a) to the Quarterly Report on Form 10-Q for the period ended March 31, 2015 and incorporated herein by reference. | |
10.29 | Filed by CHC as Exhibit 10.1(b) to the Quarterly Report on Form 10-Q for the period ended March 31, 2015 and incorporated herein by reference. | |
10.30 |
| Filed by the registrant as Exhibit 10.1 to Amendment No. 1 to the Registration Statement on Form S-4 (No. 333-224960) on June 20, 2018 and incorporated herein by reference. |
10.31 | Filed by ESRX as Exhibit 10.1 to the Current Report on Form 8-K on May 4, 2016 and incorporated herein by reference. | |
10.32 | Filed by CHC as Exhibit 10.20 to the Annual Report on Form 10-K for the year ended December 31, 2008 and incorporated herein by reference. | |
10.33 | Retention Agreement between the Cigna Corporation and Steven B. Miller dated October 9, 2018 | Filed by the registrant as Exhibit 10.34 to the Annual Report on Form 10-K for the year ended December 31, 2018 and incorporated herein by reference. |
10.34 | Agreement and Release between the Company and Matthew G. Manders dated October 16, 2017 | Filed by CHC as Exhibit 10.1 to the Current Report on Form 8-K on October 18, 2017 and incorporated herein by reference. |
160
10.35 | Promotion letter for Christopher Hocevar dated January 30, 2017 | Filed by CHC as Exhibit 10.8 to the Quarterly Report on Form 10-Q for the period ended March 31, 2018 and incorporated herein by reference. |
10.36 | Agreement and Release between the Company and Christopher J. Hocevar dated September 26, 2018 | Filed by CHC as Exhibit 10.1 to the Quarterly Report on Form 10-Q for the period ended September 30, 2018 and incorporated herein by reference. |
10.37 | Agreement and Release between the Company and Alan Muney, M.D. effective December 21, 2018 | Filed by the registrant as Exhibit 10.40 to the Annual Report on Form 10-K for the year ended December 31, 2018 and incorporated herein by reference. |
10.38 | Revolving Credit and Letter of Credit Agreement, dated as of April 6, 2018 | Filed by CHC as Exhibit 10.1 to Current Report on Form 8-K on April 12, 2018 and incorporated herein by reference. |
10.39
| Filed by CHC as Exhibit 10.29 to the Annual Report on Form 10-K for the year ended December 31, 2012 and incorporated herein by reference. | |
21 | Filed herewith. | |
23 | Filed herewith. | |
31.1 | Filed herewith. | |
31.2 | Filed herewith. | |
32.1 | Furnished herewith. | |
32.2 | Furnished herewith. | |
101 | The following materials from Cigna Corporation’s Annual Report on Form 10-K for the year ended December 31, 2019, formatted in inline XBRL (Extensible Business Reporting Language): (i) the Consolidated Balance Sheets; (ii) the Consolidated Statements of Income; (iii) the Consolidated Statements of Comprehensive Income; (iv) the Consolidated Statements of Cash Flows; (v) the Consolidated Statements of Changes in Total Equity; (vi) the Notes to Consolidated Financial Statements; and (vii) Financial Statement Schedules I and II. | Filed herewith. |
104 | Cover Page Interactive Data File (formatted as inline XBRL and contained in Exhibit 101) | Filed herewith. |
161
The agreements and other documents filed as exhibits to this report are not intended to provide factual information or other disclosure other than the terms of the agreements or other documents themselves, and you should not rely on them for that purpose. In particular, any representations and warranties made by the Company in these agreements or other documents were made solely within the specific context of the relevant agreement or document and may not describe the actual state of affairs at the date they were made or at any other time.
Item 16. FORM 10-K SUMMARY
None.
162
SIGNATURES
Pursuant to the requirements of Section 13 or 15(d) of the Securities Exchange Act of 1934, the registrant has duly caused this report to be signed on its behalf by the undersigned, thereunto duly authorized.
Date: February 27, 2020
| CIGNA CORPORATION | ||
|
| ||
| By: |
|
|
| Eric P. Palmer | ||
| Executive Vice President and Chief Financial Officer | ||
| (Principal Financial Officer) | ||
| |||
Pursuant to the requirements of the Securities Exchange Act of 1934, this report has been signed below by the following persons on behalf of the registrant and in the capacities indicated as of February 27, 2020.
Signature |
| Title |
|
|
|
|
|
|
|
|
|
David M. Cordani |
| Chief Executive Officer and Director (Principal Executive Officer)
|
|
|
|
Eric P. Palmer |
| Executive Vice President and Chief Financial Officer (Principal Financial Officer)
|
|
|
|
Mary T. Agoglia Hoeltzel |
| Senior Vice President, Tax and Chief Accounting Officer (Principal Accounting Officer)
|
|
|
|
William J. DeLaney |
| Director
|
|
|
|
Eric J. Foss |
| Director
|
|
|
|
Elder Granger, M.D. |
| Director
|
|
|
|
Isaiah Harris, Jr.
|
| Chairman of the Board
|
163
|
|
|
Mark McClellan, M.D.
|
| Director
|
|
|
|
Roman Martinez IV
|
| Director
|
|
|
|
Kathleen M. Mazzarella |
| Director
|
|
|
|
John M. Partridge |
| Director
|
|
|
|
William L. Roper, M.D.
|
| Director
|
|
|
|
Eric C. Wiseman
|
| Director
|
|
|
|
Donna F. Zarcone
|
| Director
|
|
|
|
|
|
|
|
|
|
164
CIGNA CORPORATION AND SUBSIDIARIES
INDEX TO FINANCIAL STATEMENT SCHEDULES
Schedules other than those listed above are omitted because they are not required or are not applicable, or the required information is shown in the financial statements or notes thereto.
FS-1
Report of Independent Registered Public Accounting Firm on
Financial Statement Schedules
To the Board of Directors and Shareholders of Cigna Corporation
Our audits of the consolidated financial statements referred to in our report dated February 27, 2020 (which report and consolidated financial statements are included under Item 8 in this Annual Report on Form 10-K) also included an audit of the financial statement schedules listed on page FS-1 in Item 15 of this Form 10-K. In our opinion, these financial statement schedules present fairly, in all material respects, the information set forth therein when read in conjunction with the related consolidated financial statements.
/s/ PricewaterhouseCoopers LLP
Hartford, Connecticut
February 27, 2020
FS-2
CIGNA CORPORATION AND SUBSIDIARIES
SCHEDULE I
CONDENSED FINANCIAL INFORMATION OF CIGNA CORPORATION
(REGISTRANT)
STATEMENTS OF INCOME
|
| For the years ended | |||||||
| December 31, | ||||||||
|
| Cigna* |
| Cigna* |
| Old Cigna* | |||
(in millions) |
| 2019 |
| 2018 |
| 2017 | |||
Revenues | |||||||||
Net investment income |
| $ | - |
| $ | 123 |
| $ | - |
Intercompany interest income |
|
| 6 |
|
| - |
|
| - |
Total revenues |
|
| 6 |
|
| 123 |
|
| - |
Operating expenses |
|
|
|
|
|
|
|
|
|
Selling, general and administrative expenses |
|
| (85) |
|
| 200 |
|
| 195 |
Total operating expenses |
|
| (85) |
|
| 200 |
|
| 195 |
Income (loss) from operations |
|
| 91 |
|
| (77) |
|
| (195) |
Interest and other (expense) |
|
| (1,032) |
|
| (244) |
|
| (246) |
Intercompany interest (expense) |
|
| (127) |
|
| (5) |
|
| (18) |
Debt extinguishment costs |
|
| - |
|
| - |
|
| (321) |
Realized investment (loss) |
|
| - |
|
| (1) |
|
| - |
Loss before taxes |
|
| (1,068) |
|
| (327) |
|
| (780) |
Income tax (benefit) |
|
| (251) |
|
| (74) |
|
| (194) |
Loss of Parent Company |
|
| (817) |
|
| (253) |
|
| (586) |
Equity in income of subsidiaries |
|
| 5,921 |
|
| 2,890 |
|
| 2,823 |
Shareholders' net income |
|
| 5,104 |
|
| 2,637 |
|
| 2,237 |
Shareholders' other comprehensive income (loss), net of tax |
|
|
|
|
|
|
|
|
|
Net unrealized appreciation (depreciation) on securities and derivatives |
|
| 957 |
|
| (365) |
|
| (37) |
Net translation (losses) gains of foreign currencies |
|
| (54) |
|
| (152) |
|
| 304 |
Postretirement benefits liability adjustment |
|
| (133) |
|
| 127 |
|
| 33 |
Shareholders' other comprehensive income (loss), net of tax |
|
| 770 |
|
| (390) |
|
| 300 |
Shareholders' comprehensive income |
| $ | 5,874 |
| $ | 2,247 |
| $ | 2,537 |
* As described in Note 4 to the Consolidated Financial Statements, on December 20, 2018, Old Cigna became a wholly-owned subsidiary of Cigna, and Cigna became the Registrant. | |||||||||
See Notes to Financial Statements on the following pages.
FS-3
CIGNA CORPORATION AND SUBSIDIARIES
SCHEDULE I
CONDENSED FINANCIAL INFORMATION OF CIGNA CORPORATION
(REGISTRANT)
BALANCE SHEETS
|
|
| As of December 31, | ||||
(in millions) |
|
| 2019 |
| 2018 | ||
Assets |
|
|
|
|
|
|
|
Cash and cash equivalents |
|
| $ | - |
| $ | 243 |
Short-term investments |
|
|
| 30 |
|
| - |
Other current assets |
|
|
| 4 |
|
| 14 |
Total current assets |
|
|
| 34 |
|
| 257 |
Intercompany receivable |
|
|
| 4,111 |
|
| - |
Investments in subsidiaries |
|
|
| 77,380 |
|
| 68,969 |
Other noncurrent assets |
|
|
| 19 |
|
| 48 |
TOTAL ASSETS |
|
| $ | 81,544 |
| $ | 69,274 |
Liabilities |
|
|
|
|
|
|
|
Short-term debt |
|
| $ | 4,043 |
| $ | - |
Other current liabilities |
|
|
| 457 |
|
| 418 |
Total current liabilities |
|
|
| 4,500 |
|
| 418 |
Intercompany payable |
|
|
| 2,341 |
|
| 4,965 |
Long-term debt |
|
|
| 29,365 |
|
| 22,863 |
TOTAL LIABILITIES |
|
|
| 36,206 |
|
| 28,246 |
Shareholders’ Equity |
|
|
|
|
|
|
|
Common stock (shares issued, 386 and 381 ; authorized, 600 ) |
|
|
| 4 |
|
| 4 |
Additional paid-in capital |
|
|
| 28,306 |
|
| 27,751 |
Accumulated other comprehensive loss |
|
|
| (941) |
|
| (1,711) |
Retained earnings |
|
|
| 20,162 |
|
| 15,088 |
Less treasury stock, at cost |
|
|
| (2,193) |
|
| (104) |
TOTAL SHAREHOLDERS’ EQUITY |
|
|
| 45,338 |
|
| 41,028 |
TOTAL LIABILITIES AND SHAREHOLDERS’ EQUITY |
|
| $ | 81,544 |
| $ | 69,274 |
See Notes to Financial Statements on the following pages.
FS-4
CIGNA CORPORATION AND SUBSIDIARIES
SCHEDULE I
CONDENSED FINANCIAL INFORMATION OF CIGNA CORPORATION
(REGISTRANT)
STATEMENTS OF CASH FLOWS
|
| For the years ended | |||||||
December 31, | |||||||||
|
| Cigna* |
| Cigna* |
| Old Cigna* | |||
(in millions) |
| 2019 |
| 2018 |
| 2017 | |||
Cash Flows from Operating Activities |
|
|
|
|
|
|
|
| |
Shareholders’ net income | $ | 5,104 |
| $ | 2,637 |
| $ | 2,237 | |
Adjustments to reconcile shareholders’ net income |
|
|
|
|
|
|
|
| |
to net cash provided by operating activities |
|
|
|
|
|
|
|
| |
Equity in income of subsidiaries |
| (5,921) |
|
| (2,890) |
|
| (2,823) | |
Dividends received from subsidiaries |
| 2,457 |
|
| - |
|
| 758 | |
Other liabilities |
| 43 |
|
| 412 |
|
| (224) | |
Debt extinguishment costs |
|
| - |
|
| - |
|
| 321 |
Other, net |
| 20 |
|
| (14) |
|
| 333 | |
NET CASH PROVIDED BY OPERATING ACTIVITIES |
|
| 1,703 |
|
| 145 |
|
| 602 |
Cash Flows from Investing Activities |
|
|
|
|
|
|
|
| |
Short-term investment purchased, net |
|
| (30) |
|
| - |
|
| (6) |
Other, net |
| - |
|
| (27,115) |
|
| (11) | |
NET CASH (USED IN) INVESTING ACTIVITIES |
| (30) |
|
| (27,115) |
|
| (17) | |
Cash Flows from Financing Activities |
|
|
|
|
|
|
|
| |
Net change in amounts due to affiliates |
| 2,015 |
|
| 4,437 |
|
| 1,955 | |
Proceeds on issuance of commercial paper |
|
| 944 |
|
| - |
|
| 100 |
Payments for debt extinguishment |
| - |
|
| - |
|
| (313) | |
Repayment of long-term debt |
| (3,002) |
|
| - |
|
| (1,250) | |
Net proceeds on issuance of long-term debt |
|
| - |
|
| 22,856 |
|
| 1,581 |
Issuance of common stock |
| 224 |
|
| 1 |
|
| 131 | |
Common dividends paid |
| (15) |
|
| - |
|
| (10) | |
Repurchase of common stock |
| (1,987) |
|
| (32) |
|
| (2,725) | |
Tax withholding on stock compensation and other |
| (82) |
|
| (49) |
|
| (63) | |
Other |
|
| (13) |
|
| - |
|
| - |
NET CASH PROVIDED BY (USED IN) FINANCING ACTIVITIES |
| (1,916) |
|
| 27,213 |
|
| (594) | |
Net (decrease) increase in cash and cash equivalents |
| (243) |
|
| 243 |
|
| (9) | |
Cash and cash equivalents, beginning of year |
| 243 |
|
| - |
|
| 18 | |
Cash and cash equivalents, end of year | $ | - |
| $ | 243 |
| $ | 9 | |
* As described in Note 4 to the Consolidated Financial Statements, on December 20, 2018, Old Cigna became a wholly-owned subsidiary of Cigna, and Cigna became the Registrant. | |||||||||
See Notes to Financial Statements on the following pages.
FS-5
CIGNA CORPORATION AND SUBSIDIARIES
SCHEDULE I
CONDENSED FINANCIAL INFORMATION OF CIGNA CORPORATION
(REGISTRANT)
NOTES TO CONDENSED FINANCIAL STATEMENTS
The accompanying condensed financial statements should be read in conjunction with the Consolidated Financial Statements and the accompanying notes thereto contained in this Annual Report on Form 10-K (“Form 10-K”).
Note 1 – For purposes of these condensed financial statements, Cigna Corporation’s (the “Company”) wholly-owned and majority-owned subsidiaries are recorded using the equity method of accounting.
Note 2 – See Note 7 – Debt included in Part II, Item 8 of this Form 10-K for a description of the short-term and long-term debt obligations of Cigna Corporation and its subsidiaries.
Debt repayment. During 2019, the Company repaid the $3.0 billion term loan.
Exchange of Legacy Notes for Cigna Notes and Redemption of Medco Notes. In the fourth quarter of 2019, the Company completed an exchange of $12.7 billion of legacy Notes issued by Express Scripts, Medco and Old Cigna for new Notes issued by the Company with the same interest rates, maturities and other comparable terms. The exchange is reflected as a non-cash investing and financing activity. The Company entered into this exchange primarily to simplify its capital structure and reporting obligations. Additionally, in the fourth quarter of 2019, Medco, a subsidiary of the Company, fully redeemed all of the remaining outstanding Medco Notes. As a result of the exchange and redemption, guarantees of obligations under the remaining legacy Notes not exchanged, as well as under Notes issued by the Company in September 2018 to finance its acquisition of Express Scripts, were released and we are no longer required to separately present Condensed Consolidated Financial Information under Rule 3-10 of Regulation S-X.
Term Loan Credit Agreement. The Company borrowed $3.0 billion under its Term Loan Credit Agreement to finance the Merger and to pay fees and expenses of the Merger. As of December 31, 2019, the Company repaid the term loan in full and the agreement was terminated.
Notes issued to fund the Express Scripts acquisition. In the third quarter of 2018, the Company issued private placement Notes with registration rights to finance the Express Scripts acquisition. Total proceeds were approximately $20.0 billion. Interest on this debt is generally paid semi-annually except for quarterly interest payments on the floating rate notes. The Company completed an exchange offer to register such debt in the third quarter of 2019.
Maturity of the Company’s long-term debt is as follows:
(In millions) |
|
| ||
2020 |
|
| $ | 3,099 |
2021 |
|
| $ | 3,812 |
2022 |
|
| $ | 1,770 |
2023 |
|
| $ | 4,699 |
2024 |
|
| $ | 714 |
Maturities after 2024 |
|
| $ | 18,638 |
|
|
|
|
|
Note 3 — Intercompany liabilities of the Company consist primarily of payables to Old Cigna of $2.3 billion as of December 31, 2019 and $4.3 billion as of and December 31, 2018. Interest was accrued at an average monthly rate of 2.58% for 2019 and 2.33% for 2018. Intercompany receivables of the Company consist primarily of net amounts due from Express Scripts Holdings of $3.9 billion (consisting of an $8.2 billion receivable offset by a $4.3 billion payable) as of December 31, 2019. Interest income on the receivable was accrued at an annual fixed rate of 5.5%. Interest expense on the payable was accrued at an average rate of 2.58%.
Note 4 — The Company had guarantees of approximately $ million as of December 31, 2019. These guarantees are primarily related to outstanding letters of credit. In 2019, no payments have been made on these guarantees.
FS-6
CIGNA CORPORATION AND SUBSIDIARIES
SCHEDULE II
VALUATION AND QUALIFYING ACCOUNTS AND RESERVES
|
|
|
|
|
|
|
|
|
|
|
|
|
| |
|
|
|
| Charged |
| Charged |
|
|
|
|
|
| ||
| Balance at |
| (Credited) to |
| (Credited) |
|
|
| Balance at | |||||
(in millions) | beginning |
| costs and |
| to other |
| Other |
| end | |||||
Description | of year |
| expenses |
| accounts |
| deductions |
| of year | |||||
2019 |
|
|
|
|
|
|
|
|
|
|
|
|
|
|
Allowance for doubtful accounts |
|
|
|
|
|
|
|
|
|
|
|
|
|
|
Accounts receivable, net | $ | 217 |
| $ | 51 |
| $ | - |
| $ | (16) |
| $ | 252 |
Deferred tax asset valuation allowance | $ | 199 |
| $ | (6) |
| $ | 3 |
| $ | - |
| $ | 196 |
Reinsurance recoverables | $ | 2 |
| $ | - |
| $ | - |
| $ | - |
| $ | 2 |
2018 |
|
|
|
|
|
|
|
|
|
|
|
|
|
|
Allowance for doubtful accounts |
|
|
|
|
|
|
|
|
|
|
|
|
|
|
Accounts receivable, net | $ | 207 |
| $ | 18 |
| $ | (3) |
| $ | (5) |
| $ | 217 |
Deferred tax asset valuation allowance (1) | $ | 72 |
| $ | (5) |
| $ | 132 |
| $ | - |
| $ | 199 |
Reinsurance recoverables | $ | 3 |
| $ | (1) |
| $ | - |
| $ | - |
| $ | 2 |
2017 |
|
|
|
|
|
|
|
|
|
|
|
|
|
|
Investment asset valuation reserves |
|
|
|
|
|
|
|
|
|
|
|
|
|
|
Commercial mortgage loans | $ | 5 |
| $ | 1 |
| $ | - |
| $ | (6) |
| $ | - |
Allowance for doubtful accounts |
|
|
|
|
|
|
|
|
|
|
|
|
|
|
Accounts receivable, net | $ | 200 |
| $ | 19 |
| $ | (11) |
| $ | (1) |
| $ | 207 |
Deferred tax asset valuation allowance | $ | 87 |
| $ | 11 |
| $ | (26) |
| $ | - |
| $ | 72 |
Reinsurance recoverables | $ | 3 |
| $ | - |
| $ | - |
| $ | - |
| $ | 3 |
|
|
|
|
|
|
|
|
|
|
|
|
|
|
|
(1) Deferred tax valuation allowance amount includes amount assumed from Express Scripts in 2018. | ||||||||||||||
| ||||||||||||||
FS-7
Similar companies
See also UNITEDHEALTH GROUP INC - Annual report 2023 (10-K 2023-12-31) Annual report 2024 (10-Q 2024-06-30)See also HUMANA INC - Annual report 2022 (10-K 2022-12-31) Annual report 2023 (10-Q 2023-09-30)
See also CENTENE CORP - Annual report 2022 (10-K 2022-12-31) Annual report 2023 (10-Q 2023-09-30)
See also MOLINA HEALTHCARE, INC. - Annual report 2022 (10-K 2022-12-31) Annual report 2023 (10-Q 2023-09-30)
See also Alignment Healthcare, Inc. - Annual report 2022 (10-K 2022-12-31) Annual report 2023 (10-Q 2023-09-30)