DEERE & CO - Annual Report: 2022 (Form 10-K)
UNITED STATES
SECURITIES AND EXCHANGE COMMISSION
WASHINGTON, D.C. 20549
FORM 10-K
(Mark one)
☒ ANNUAL REPORT PURSUANT TO SECTION 13 OR 15(d) OF THE SECURITIES EXCHANGE ACT OF 1934
For the fiscal year ended October 30, 2022
or
☐ TRANSITION REPORT PURSUANT TO SECTION 13 OR 15(d) OF THE SECURITIES EXCHANGE ACT OF 1934
For the transition period from ____ to ____
Commission file number 1-4121
(Exact name of registrant as specified in its charter)
Delaware | | 36-2382580 |
(State of incorporation) | | (IRS Employer Identification No.) |
One John Deere Place, Moline, Illinois | | 61265 | | (309) 765-8000 |
(Address of principal executive offices) | | (Zip Code) | | (Telephone Number) |
SECURITIES REGISTERED PURSUANT TO SECTION 12(b) OF THE ACT
Title of each class | | Trading symbol | | Name of each exchange on which registered |
Common stock, $1 par value | | DE | | New York Stock Exchange |
6.55% Debentures Due 2028 | | DE28 | | New York Stock Exchange |
SECURITIES REGISTERED PURSUANT TO SECTION 12(g) OF THE ACT: NONE
Indicate by check mark if the registrant is a well-known seasoned issuer, as defined in Rule 405 of the Securities Act. Yes ☒ No ☐
Indicate by check mark if the registrant is not required to file reports pursuant to Section 13 or Section 15(d) of the Act.
Yes ☐ No ☒
Indicate by check mark whether the registrant (1) has filed all reports required to be filed by Section 13 or 15(d) of the Securities Exchange Act of 1934 during the preceding 12 months (or for such shorter period that the registrant was required to file such reports), and (2) has been subject to such filing requirements for the past 90 days.
Yes ☒ No ☐
Indicate by check mark whether the registrant has submitted electronically every Interactive Data File required to be submitted pursuant to Rule 405 of Regulation S-T (§232.405 of this chapter) during the preceding 12 months (or for such shorter period that the registrant was required to submit such files).
Yes ☒ No ☐
Indicate by check mark whether the registrant is a large accelerated filer, an accelerated filer, a non-accelerated filer, a smaller reporting company, or an emerging growth company. See the definitions of “large accelerated filer,” “accelerated filer,” “smaller reporting company,” and “emerging growth company” in Rule 12b-2 of the Exchange Act.
| | | |
| Large accelerated filer ☒ | | Accelerated filer ☐ |
| Non-accelerated filer ☐ | | Smaller reporting company ☐ |
| | | Emerging growth company ☐ |
If an emerging growth company, indicate by check mark if the registrant has elected not to use the extended transition period for complying with any new or revised financial accounting standards provided pursuant to Section 13(a) of the Exchange Act. ☐
Indicate by check mark whether the registrant has filed a report on and attestation to its management’s assessment of the effectiveness of its internal control over financial reporting under Section 404(b) of the Sarbanes-Oxley Act (15 U.S.C. 7262(b)) by the registered public accounting firm that prepared or issued its audit report. ☒
Indicate by check mark whether the registrant is a shell company (as defined in Rule 12b-2 of the Act). Yes ☐ No ☒
The aggregate quoted market price of voting stock of the registrant held by non-affiliates at April 29, 2022 was $115,295,045,197. At November 30, 2022, 298,237,257 shares of common stock, $1 par value, of the registrant were outstanding.
Documents Incorporated by Reference. Portions of the proxy statement for the annual meeting of stockholders to be held on February 22, 2023 are incorporated by reference into Part III of this Form 10-K.
TABLE OF CONTENTS
22
1
PART I
ITEM 1. | BUSINESS. |
This Annual Report on Form 10-K contains forward-looking statements that are subject to risks and uncertainties. All statements other than statements of historical fact included in this Annual Report on Form 10-K are forward-looking statements. Forward-looking statements provide our current expectations and projections relating to our financial condition, results of operations, plans, objectives, future performance, and business. You can identify forward-looking statements as they do not relate to historical or current facts and by words such as “believe,” “expect,” “estimate,” “anticipate,” “will,” “should,” “plan,” “forecast,” “target,” “guide,” “project,” “intend,” “could,” and similar words or expressions.
All forward-looking statements are subject to risks and uncertainties that may cause actual results to differ materially from those that we expected. Important factors that could cause actual results to differ materially from our expectations, or cautionary statements, and other important information about forward-looking statements are disclosed under Item 1A, “Risk Factors,” and Item 7, “Management’s Discussion and Analysis of Financial Condition and Results of Operations (MD&A)–Forward-Looking Statements,” in this Annual Report on Form 10-K.
Products
Deere & Company’s (the Company) and its subsidiaries’ (collectively, John Deere) operations are categorized into four business segments:
The production and precision agriculture segment defines, develops, and delivers global equipment and technology solutions to unlock customer value for production-scale growers of large grains, small grains, cotton, and sugarcane. The segment’s main products include large and certain mid-size tractors, combines, cotton pickers, sugarcane harvesters and loaders, and soil preparation, seeding, application, and crop care equipment.
The small agriculture and turf segment defines, develops, and delivers global equipment and technology solutions to unlock customer value for dairy and livestock producers, high-value crop producers, and turf and utility customers. The segment’s primary products include certain mid-size and small tractors, as well as hay and forage equipment, riding and commercial lawn equipment, golf course equipment, and utility vehicles.
The construction and forestry segment defines, develops, and delivers a broad range of machines and technology solutions to unlock customer value on job sites, including earthmoving, forestry, and roadbuilding production systems. The segment’s primary products include crawler dozers and loaders, four-wheel-drive loaders, excavators, skid-steer loaders, milling machines, and log harvesters.
The products and services produced by the segments above are marketed primarily through independent retail dealer networks and major retail outlets and, as it relates to roadbuilding products in certain markets outside the U.S. and Canada, primarily through Company-owned sales and service subsidiaries.
The financial services segment primarily finances sales and leases by John Deere dealers of new and used production and precision agriculture, small agriculture and turf, and construction and forestry equipment. In addition, the financial services segment provides wholesale financing to dealers of the foregoing equipment, finances retail revolving charge accounts, and offers extended equipment warranties.
John Deere’s worldwide production and precision agriculture operations, small agriculture and turf operations, and construction and forestry operations are sometimes collectively referred to as the “equipment operations.” The financial services segment is sometimes referred to as the “financial services operations.” The production and precision agriculture and small agriculture and turf segments are sometimes collectively referred to as “agriculture and turf” or the “agriculture and turf operations.”
Additional information is presented in the discussion of business segment and geographic area results within the MD&A in this Annual Report on Form 10-K. The John Deere enterprise has manufactured agricultural equipment since 1837. The present Company was incorporated under the laws of Delaware in 1958.
Smart Industrial Operating Model and Leap Ambitions
In fiscal year 2020, John Deere began implementing the Smart Industrial operating model, which focuses on delivering intelligent, connected machines and applications to transform production systems in agriculture and construction, unlocking customer economic value across the lifecycle of our products in more sustainable ways. The model is based on the following three focus areas:
| 1. | Production Systems. A strategic alignment of products and solutions around production systems roadmaps. Production Systems refer to the series of steps our customers take to execute different tasks, operations, and projects in order to grow |
2
| an agricultural product. By dedicating our business to our customers’ production systems, we expect to be better positioned to identify opportunities to improve customer profitability, productivity, and sustainability. |
| 2. | Technology Stack. Investments in technology, as well as research and development, that deliver intelligent solutions to John Deere’s customers through an intuitive technology stack consisting of the hardware and devices, embedded software, connectivity, data platforms, and applications that build upon our machines to unlock economic value for our customers. The technology stack leverages the core technologies mentioned in the previous sentence across the enterprise, including digital capabilities, automation, autonomy, and alternative propulsion technologies. The stack has the potential to simplify jobs, strengthen decision-making, and better connect the steps of a production system. |
| 3. | Lifecycle Solutions. The enterprise integration of John Deere’s aftermarket and support capabilities to more effectively manage customer equipment, service, and technology needs across the full lifetime of a John Deere product, and with a specific lifecycle solution focus on the ownership experience. This integrated support seeks to enhance customer value through proactive and reactive support and easy access to parts, value-add services, and performance upgrades, regardless of when a customer purchases our equipment. |
Building upon the Smart Industrial operating model, John Deere announced its Leap Ambitions framework in fiscal year 2022. The Leap Ambitions are focused goals designed to boost economic value and sustainability for our customers. The ambitions align across our customers’ production systems seeking to optimize their operations to deliver better outcomes with fewer resources. The Leap Ambitions framework has three components: (i) size the incremental market opportunity, quantifying the value that can be created; (ii) identify the key actions required to guide investment in digitalization, autonomy, automation, and alternative propulsion technologies; and (iii) define the desired financial and sustainable outcomes we hope to achieve to help investors and stakeholders understand the opportunities that can be unlocked in the future by present investments. Applying this framework, the Leap Ambitions set goals to measure the results under the Company’s operating model. Current financial and sustainability goals for the Leap Ambitions relate to workforce safety, agriculture customer outcomes, product circularity, environmental footprint, and equipment operations operating return on sales (OROS).
Available Information
The Company’s internet address is http://www.deere.com. Through that address, the Company’s Annual Report on Form 10-K, quarterly reports on Form 10-Q, current reports on Form 8-K, and amendments to those reports are available free of charge as soon as reasonably practicable after they are filed or furnished with the United States Securities and Exchange Commission (SEC or Commission). The information contained on the Company’s website is not included in, nor incorporated by reference into, this Annual Report on Form 10-K.
Market Conditions
Agriculture and Turf. Industry sales of large agricultural machinery in the U.S. and Canada are forecasted to increase 5 to 10 percent compared to 2022. Industry sales of small agricultural and turf equipment in the U.S. and Canada are expected to be flat to down 5 percent in 2023. Industry sales of agricultural machinery in Europe are forecasted to be flat to up 5 percent, while South American industry sales of tractors and combines are forecasted to be flat to up 5 percent in 2023. Asia industry sales are forecasted to be down moderately in 2023 as the demand in India, the world’s largest tractor market by unit, stabilizes.
Construction and Forestry. On an industry basis, North American construction equipment and compact construction equipment sales are each expected to be flat to up 5 percent in 2023. Global forestry and global roadbuilding industry sales are each expected to be flat.
Financial Services. The Company’s financial services results for full-year fiscal 2023 are expected to be slightly higher in fiscal 2023 due to income earned on a higher average portfolio, partially offset by less-favorable financing spreads and lower gains on operating-lease residual values. Excluding the portfolio in Russia, a higher provision for credit losses is forecasted for 2023.
2022 Consolidated Results Compared with 2021
Worldwide net sales and revenues increased 19 percent to $52.577 billion in 2022, compared with $44.024 billion in 2021. Net sales increased 21 percent in fiscal 2022 to $47.917 billion, compared with $39.737 billion last year, due to higher shipment volumes and price realization, partially offset by the negative effects of currency translation.
For fiscal 2022, worldwide net income attributable to the Company was $7.131 billion, or $23.28 per share, compared with $5.963 billion, or $18.99 per share, in fiscal 2021. Net income increased due to price realization, higher shipment volumes / more favorable sales mix, and income earned on a higher average portfolio. These items were partially offset by higher production costs, higher research and development expenses and selling, administrative, and general expenses, spread compression on the financial services’ portfolio, and a higher provision for credit losses. The 2022 results included a non-cash gain on the remeasurement of the previously held equity investment in the Deere-Hitachi joint venture, partially offset by the impact of higher reserves and impairments related to
3
events in Russia / Ukraine. Notes 3 and 4 to the Consolidated Financial Statements included in this Annual Report on Form 10-K contain a complete list of special items impacting net income in 2022 and 2021.
The cost of sales to net sales ratio for 2022 was 73.7 percent, compared with 73.3 percent for 2021. The cost of sales to net sales ratio increased compared to 2021 mainly due to higher production costs partially offset by price realization.
Additional information on fiscal 2022 results is provided in the MD&A.
EQUIPMENT OPERATIONS
Production and Precision Agriculture
The production and precision agriculture segment defines, develops, and delivers global equipment and technology solutions to unlock customer value for production-scale growers of crops like large grains (such as corn and soy), small grains (such as wheat, oats, and barley), cotton, and sugarcane. Equipment manufactured and distributed by the segment includes large and certain mid-size tractors, combines, cotton pickers, cotton strippers, sugarcane harvesters, related harvesting front-end equipment, pull-behind scrapers, and tillage, seeding, and application equipment, including sprayers and nutrient management and soil preparation machinery.
The segment also provides integrated agricultural solutions and precision technologies across its portfolio of large equipment. John Deere has developed a unique, production system-level approach designed to improve customer profitability, productivity, and sustainability. This approach includes precise global navigation satellite systems technology, advanced connectivity and telematics, on-board sensors and computing power, automation software, digital tools, and applications and analytics that together enable seamless integration of information designed to improve customer decision making and job execution. John Deere’s advanced telematics systems remotely connect equipment owners, business managers, and dealers to equipment in the field, providing real-time alerts and information about equipment location, utilization, performance, and maintenance to improve productivity and efficiency, as well as to monitor agronomic job execution.
In addition to the John Deere brand, the production and precision agriculture segment manufactures and sells sprayers under the Hagie and Mazzotti brand names, planters and cultivators under the Monosem brand name, sprayers and planters under the PLA brand name, and carbon fiber sprayer booms under the King Agro brand name. The segment also sells sugarcane harvester aftermarket parts under the Unimil brand name. Aftermarket parts for production and precision agriculture products are also sold under the Vapormatic and A&I brand names. John Deere manufactures its production and precision agriculture equipment for sale primarily through independent retail dealer networks.
Small Agriculture and Turf
The small agriculture and turf segment defines, develops, and delivers global equipment and technology solutions to unlock customer value for dairy and livestock producers, high-value crop producers, and turf and utility customers. The segment works to leverage integrated agricultural solutions and precision technologies across its portfolio of equipment. Equipment manufactured and distributed by the segment includes: certain mid-size as well as small and utility tractors and related loaders and attachments; turf and utility equipment, including riding lawn equipment, commercial mowing equipment, golf course equipment, utility vehicles, implements for mowing, tilling, snow and debris handling, aerating, and many other residential, commercial, golf, and sports turf care applications, and other outdoor power products; and hay and forage equipment, including self-propelled forage harvesters and attachments, balers, and mowers. John Deere also purchases certain products from other manufacturers for resale.
In addition to the John Deere brand, the small agriculture and turf segment purchases and sells a variety of equipment attachments under the Frontier, Kemper, and GreenSystem brand names. Aftermarket parts for small agriculture and turf products are sold under the Vapormatic, A&I, and Sunbelt brand names. John Deere’s small agriculture and turf equipment is sold primarily through independent retail dealer networks, although the segment also builds turf products for sale by mass retailers, including The Home Depot and Lowe’s.
Agriculture and Turf Operations
Operating Model. John Deere’s production and precision agriculture and small agriculture and turf segments together offer a full line of agriculture and turf equipment and related service parts. As mentioned in the description of the Smart Industrial operating model, the segments are aligned around production systems, enabling focus on delivering equipment, technology, and solutions across all the jobs customers execute during a season. Sales and marketing support for both the production and precision agriculture and small agriculture and turf segments continues to be organized around four geographic customer focus areas.
Business Environment. Sales of agricultural equipment are affected by total farm cash receipts, which reflect levels of farm commodity prices, acreage planted, crop yields, and government policies, including global trade policies, the amount and timing of government payments, and policies related to climate change. Sales are also influenced by general economic conditions, farmland prices, farmers’
4
debt levels and access to financing, interest and exchange rates, agricultural trends, including the production of and demand for renewable fuels, labor availability and costs, energy costs, tax policies, and other input costs associated with farming. Other key factors affecting new agricultural equipment sales are the value and level of used equipment, including tractors, harvesting equipment, self-propelled sprayers, hay and forage equipment, and seeding equipment. Weather and climatic conditions can also affect buying decisions of agricultural equipment purchasers.
Innovations in machinery and technology also influence agricultural equipment purchasing. For example, larger, more productive equipment is well accepted where farmers are striving for more efficiency in their operations. Large, cost-efficient, highly-mechanized agricultural operations account for an important share of worldwide farm output. These customers are increasingly adopting and integrating precision agricultural technologies like guidance, telematics, and data management in their operations. The large-size agricultural equipment used on such farms has been particularly important to John Deere. A large proportion of the equipment operations’ total agricultural equipment sales in the U.S. and Canada, and a large proportion of sales in many countries outside the U.S. and Canada, are comprised of tractors over 100 horsepower, self-propelled combines, self-propelled cotton pickers, self-propelled forage harvesters, self-propelled sprayers, and seeding equipment. However, small tractors are an important part of our global tractor business. Further, John Deere offers a number of harvesting solutions to support development of the mechanized harvesting of grain, oilseeds, cotton, sugarcane, and biomass.
Retail sales of lawn and garden tractors, compact utility tractors, residential and commercial mowers, utility vehicles, and golf and turf equipment are influenced by weather conditions, consumer spending patterns, and general economic conditions.
Seasonality. Seasonal patterns in retail demand for agricultural equipment can result in substantial variations in the volume and mix of products sold to retail customers during the year. Seasonal demand must be estimated in advance, and equipment must be manufactured in anticipation of such demand to achieve efficient utilization of personnel and facilities throughout the year. For certain equipment, John Deere offers early order programs, which can include discounts to retail customers that place orders well in advance of the use season. Production schedules are based, in part, on these early order programs; however, during periods of high demand, some factories may still produce after the use season. The production and precision agriculture and small agriculture and turf segments can incur substantial seasonal variations in cash flows to finance production and inventory of agricultural and turf equipment. The segments also incur costs to finance sales to dealers in advance of seasonal demand. New combine and cotton harvesting equipment has been sold under early order programs with waivers of retail finance charges available to customers who take delivery of machines during non-use seasons. In Australia, Canada, and the U.S., there are typically several used equipment trade-in transactions that take place in connection with most new agricultural equipment sales. To provide support to its dealers in these countries for carrying and ultimately selling this used inventory to retail customers, John Deere provides these dealers with pools of funds awarded as a percentage of the dealer cost for eligible new equipment sales at the time of the new equipment settlement.
Retail demand for turf and utility equipment is normally higher in the second and third fiscal quarters. John Deere has pursued a strategy of building and shipping such equipment as close to retail demand as possible. Consequently, to increase asset turnover and reduce the average level of field inventories throughout the year, production and shipment schedules of these product lines are normally proportionately higher in the second and third fiscal quarters of each year, corresponding closely to the seasonal pattern of retail sales; however, in 2022, supply constraints impacted production schedules resulting in higher than usual shipments in the fourth quarter.
Construction and Forestry
John Deere’s construction and forestry segment defines, develops, and delivers a broad range of machines and technology solutions organized along the earthmoving, forestry, and roadbuilding production systems. The segment’s primary products include a broad range of backhoe loaders, crawler dozers and loaders, four-wheel-drive loaders, excavators, motor graders, articulated dump trucks, landscape loaders, skid-steer loaders, milling machines, pavers, compactors, rollers, crushers, screens, asphalt plants, log skidders, log feller bunchers, log loaders, log forwarders, log harvesters, and a variety of attachments.
The construction and forestry segment’s products are distributed under the John Deere brand name, except for the Wirtgen Group products, which are manufactured and distributed under six brand names: Wirtgen, Vögele, Hamm, Kleemann, Benninghoven, and Ciber. Forestry attachments are distributed under the John Deere and Waratah brand names. In addition to the equipment manufactured by the construction and forestry segment, John Deere purchases certain products from other manufacturers for resale. The segment also provides advanced connectivity and telematics solutions designed to improve customer productivity, efficiency, and worksite management through access to fleet location, utilization, performance, and maintenance information.
The prevailing levels of residential, commercial, and public construction, investment in infrastructure, and the condition of the forestry products industry influence retail sales of John Deere construction, earthmoving, roadbuilding, material handling, and forestry equipment. General economic conditions, interest rate levels, the availability of credit, and certain commodity prices, such as oil and gas, and those applicable to pulp, paper, and saw logs, also influence sales.
5
In fiscal 2022, the Company and Hitachi Construction Machinery Co., Ltd. (Hitachi) voluntarily terminated their joint venture. Following the termination, Hitachi continues to supply to the Company certain John Deere-branded excavators through a new supply agreement. The Company’s marketing arrangement for Hitachi-branded construction excavators and mining equipment in the Americas also ended with Hitachi assuming distribution and support of these products. John Deere dealers may continue to support their existing field populations of Hitachi-branded excavators.
The segment has a number of initiatives in the rent-to-rent, or short-term rental, market for construction, earthmoving, roadbuilding, and material handling equipment. These include specially designed rental programs for John Deere dealers and expanded cooperation with major national equipment rental companies.
John Deere owns retail forestry sales operations in Australia, Brazil, Finland, Ireland, New Zealand, Norway, Sweden, and the United Kingdom. In addition, in many markets worldwide (most significantly in Europe, India, and Australia), the Wirtgen Group sells its products primarily through Company-owned sales and service subsidiaries.
Competition
The equipment operations sell products and services into a variety of highly competitive global and regional markets. The principal competitive factors in all markets include product performance, innovation and quality, distribution, customer service, and price. In North America and many other parts of the world, John Deere’s brand recognition is a competitive factor.
The agricultural equipment industry continues to undergo significant changes and is becoming even more competitive through the emergence and expanding global capability of many competitors. The competitive environment for the agriculture and turf operations includes some global competitors, including AGCO Corporation, CLAAS KGaA mbH, CNH Industrial N.V., Kubota Tractor Corporation, Mahindra, and The Toro Company, as well as many regional and local competitors. These competitors have varying numbers of product lines competing with John Deere’s products and each has varying degrees of regional focus. Additional competition within the agricultural equipment industry has come from a variety of short-line and specialty manufacturers, as well as local regional competitors, with differing manufacturing and marketing methods. As technology increasingly enables enhanced productivity in agriculture, the industry is also attracting non-traditional competitors, including technology-focused companies and start-up ventures. John Deere’s turf equipment is sold primarily in the competitive North American, Western European, and Australian markets.
Global competitors of the construction and forestry segment include Caterpillar Inc., CNH Industrial N.V., Doosan Infracore Co., Ltd. and its subsidiary Doosan Bobcat Inc., Fayat Group, Hitachi Construction Machinery, Komatsu Ltd., Kubota Tractor Corporation, Ponsse Plc, SANY Group Co., Ltd., Terex, Tigercat Industries Inc., Volvo Construction Equipment (part of Volvo Group AB), and XCMG. The construction business operates in competitive markets in North and South America as well as other global markets. The forestry and roadbuilding businesses operate globally.
Manufacturing
In the U.S. and Canada, the equipment operations own and operate 22 factory locations and lease and operate another two locations. Of these 24 factories, nine are devoted primarily to production and precision agriculture equipment, five to small agriculture and turf equipment, four to construction and forestry equipment, one to engines, two to component remanufacturing, two to hydraulic and power train components, and one to electronic components. Outside the U.S. and Canada, the equipment operations own or lease and operate 47 factories, including: agriculture and turf equipment factories in Argentina, Brazil, China, France, Germany, India, Israel, Italy, Mexico, the Netherlands, Russia, and Spain; earthmoving equipment factories in Brazil and China; engine, engine/power train, battery, hydraulic, or electronic component factories in Argentina, Austria, China, France, India, and Mexico; roadbuilding equipment factories in Brazil, China, Germany, and India; and forestry equipment factories in Canada, Finland, and New Zealand. The engine factories referred to above manufacture non-road, heavy duty diesel engines. The equipment operations also have financial interests in other manufacturing organizations, which include ventures that manufacture transaxles and transmissions used in certain agriculture and turf products.
John Deere’s facilities are well maintained, in good operating condition, and suitable for their present purposes. These facilities, together with both short-term and long-term planned capital expenditures, are expected to meet John Deere’s manufacturing needs in the foreseeable future.
Existing capacity is sufficient to satisfy John Deere’s current expectations for retail market demand. The equipment operations’ manufacturing strategy involves the implementation of appropriate levels of technology and automation to allow manufacturing processes to remain profitable at varying production levels. Operations are also designed to be flexible enough to accommodate the product design changes required to meet market conditions and changing customer requirements. Common manufacturing facilities and techniques are employed in the production of components for production and precision agriculture equipment, small agriculture and turf equipment, and construction and forestry equipment.
6
In order to utilize manufacturing facilities and technology more effectively, the equipment operations pursue continuous improvements in manufacturing processes. These include steps to streamline manufacturing processes and enhance responsiveness to customers. John Deere’s flexible assembly lines can accommodate a wider product mix and deliver products in line with dealer and customer demand. Additionally, considerable effort is being directed to manufacturing cost reduction through process improvement and improvements in product design, advanced manufacturing technology, and supply management and logistics, as well as compensation incentives related to productivity and organizational structure. John Deere has experienced volatility in the prices of many raw materials and supply chain challenges during the past fiscal year, which is expected to continue into fiscal year 2023. The increase in cost for raw materials and supply chain challenges have resulted in production inefficiencies causing increased overhead costs and reduced profit margins. John Deere has responded to these pressures by implementing the cost-reduction measures described above, increasing prices, and increasing the levels of inventory in an attempt to meet production demands. Significant cost increases could have an adverse effect on the Company’s operating results, although the effects to date have not been material. The equipment operations also pursue external sales of selected parts and components that can be manufactured and supplied to third parties on a competitive basis, including engines, power train components, and electronic components.
Patents, Trademarks, Copyrights, and Trade Secrets
John Deere owns a significant number of patents, trademarks, copyrights, trade secrets, and licenses related to John Deere products and services and expects the number to grow as John Deere continues to pursue technological innovations. John Deere furthers its competitive position by filing patent applications in the U.S. and internationally to protect technology and improvements considered important to the business. John Deere believes that, in the aggregate, the rights under these patents and licenses are generally important to its operations and competitive position, but does not regard any of its businesses as being dependent upon any single patent or group of patents. However, certain John Deere trademarks, which contribute to John Deere’s identity and the recognition of its products and services, including but not limited to the “John Deere” mark, the leaping deer logo, the “Nothing Runs Like a Deere” slogan, the prefix “JD” associated with many products, and the green and yellow color combination, are an integral part of John Deere’s business, and their loss could have a material adverse effect on the Company. For additional information see Risk Factors–The potential loss of John Deere intellectual property through trade secret theft, infringement of patents, trademark, counterfeitings, or other loss of rights to exclusive use of John Deere intellectual property could have a material adverse effect on the Company. Infringement of the intellectual property rights of others by John Deere could also have a material adverse effect on the Company.
Marketing
In the U.S. and Canada, the equipment operations distribute equipment and service parts through the following facilities: two agriculture and turf equipment sales and administration offices located in Olathe, Kansas and Cary, North Carolina and one sales branch located in Grimsby, Ontario; one construction, earthmoving, material handling, and forestry equipment sales and administration office located in Moline, Illinois and one sales branch located in Grimsby, Ontario; and one roadbuilding equipment sales, service, and administration office located in Nashville, Tennessee. In addition, the equipment operations operate two centralized parts distribution warehouses in coordination with nine regional parts depots and distribution centers in the U.S. and Canada.
Through these U.S. and Canadian facilities, John Deere markets products to approximately 2,007 independent dealer locations. Of these, approximately 1,552 sell agricultural equipment, while approximately 455 sell construction, earthmoving, material handling, roadbuilding, and/or forestry equipment. In addition, roadbuilding equipment is sold at approximately 114 roadbuilding-only locations that may carry products that compete with John Deere’s construction, earthmoving, material handling, and/or forestry equipment. Turf equipment is sold at most John Deere agricultural equipment locations, a few construction, earthmoving, material handling, roadbuilding, and/or forestry equipment locations, and about 321 turf-only locations, many of which also sell dissimilar lines of non-John Deere products. In addition, certain lawn and garden product lines are sold through The Home Depot and Lowe’s.
Outside the U.S. and Canada, John Deere agriculture and turf equipment is sold to distributors and dealers for resale in over 100 countries. Sales and administrative offices are located in Argentina, Australia, Brazil, China, France, Germany, India, Italy, Mexico, Poland, Russia, Singapore, South Africa, Spain, Ukraine, and the United Kingdom. Turf equipment sales outside the U.S. and Canada occur primarily in Western Europe and Australia. Construction, earthmoving, material handling, and forestry equipment is sold to distributors and dealers primarily by sales offices located in Australia, Brazil, Finland, New Zealand, Russia, Singapore, and the United Kingdom. Some of these dealers are independently owned while John Deere owns others. Roadbuilding equipment is sold both directly to retail customers as well as to independent distributors and dealers for resale. As of November 1, 2022, the Company’s U.S. senior management decided not to renew dealer agreements with dealers located in Russia, but the Company continues to distribute select parts to existing Russia dealers from the Russian distribution center. The Wirtgen Group operates company-owned sales and service subsidiaries in Australia, Austria, Belgium, Brazil, Bulgaria, China, Denmark, Estonia, Finland, France, Georgia, Germany, Hungary, India, Ireland, Italy, Japan, Latvia, Lithuania, Malaysia, the Netherlands, Norway, Poland, Romania, Russia, Serbia, Singapore, South Africa, Sweden, Taiwan, Thailand, Turkey, Ukraine, and the United Kingdom.
7
The equipment operations operate centralized parts distribution warehouses in Brazil, Germany, India, and Russia in coordination with regional parts depots and distribution centers in Argentina, Australia, China, Mexico, South Africa, Sweden, and the United Kingdom.
John Deere markets engines, power trains, and electronic components worldwide through select sales branches or directly to regional and global original equipment manufacturers and independently owned engine distributors.
Raw Materials
John Deere purchases raw materials and manufactured components and replacement parts for its equipment, engines, and other products from leading suppliers both domestically and internationally. These materials and components include a variety of steel products, metal castings, forgings, plastics, hydraulics, electronics, and ready-to-assemble components made to certain specifications. John Deere also purchases various goods and services used for production, logistics, offices, and research and development. John Deere develops and maintains sourcing strategies for all its purchased materials and emphasizes long-term supplier relationships at the core of these strategies. John Deere uses a variety of agreements with suppliers intended to drive innovation, ensure availability and delivery of industry-leading quality raw materials and components, manage costs on a globally competitive basis, protect John Deere’s intellectual property, and minimize other supply-related risks. John Deere actively monitors supply chain risks to minimize the likelihood of business disruptions caused by the supply base, including supplier financial viability, capacity, business continuity, labor availability, quality, delivery, cybersecurity, weather-related events, and natural disasters. John Deere has implemented mitigation efforts to minimize the impact of potential and actual supply chain disruptions on its customers. Examples include working with the supply base to prioritize allocations to improve material availability, multi-sourcing selected parts and materials, providing resources to suppliers to address constraints, entering long term contracts for some critical components, and using alternative freight carriers to expedite delivery. In fiscal 2022, some of John Deere’s operations were affected by certain material or component shortages related to on-going supply chain challenges, including those caused by industry capacity constraints, material availability, global logistics delays, geopolitical volatility, the COVID-19 pandemic (COVID), and constraints from, among other things, ocean and road shipping capacity constraints, and labor availability. While supply chain pressures are expected to persist into 2023, the Company is engaged with its suppliers to secure the materials and services that our customers need to deliver essential food and infrastructure more profitably and sustainably.
Backlog Orders
The dollar amount of backlog orders at October 30, 2022 believed to be firm was approximately $9.7 billion for the production and precision agriculture segment and $4.6 billion for the small agriculture and turf segment, compared with $9.6 billion and $5.2 billion, respectively, at October 31, 2021. The agriculture and turf backlog are generally highest in the second and third quarters due to seasonal buying trends in these industries. The dollar amount of backlog orders for the construction and forestry segment believed to be firm was approximately $6.5 billion at October 30, 2022, compared with $6.7 billion at October 31, 2021. Backlog orders for the equipment operations include all orders deemed to be firm as of the referenced date.
Trade Accounts and Notes Receivable
Trade accounts and notes receivable arise primarily from sales of goods to independent dealers. Most trade receivables originated by the equipment operations are purchased by the financial services operations. The equipment operations compensate the financial services operations at approximate market rates of interest for these receivables. Additional information appears in Note 11 to the Consolidated Financial Statements.
FINANCIAL SERVICES
U.S. and Canada. The financial services segment primarily provides and administers financing for retail purchases from John Deere dealers of new equipment manufactured by John Deere’s production and precision agriculture, small agriculture and turf, construction and forestry segments, and used equipment taken in trade for this equipment.
The Company and John Deere Construction & Forestry Company (a wholly-owned subsidiary of the Company) are referred to as the “sales companies.” John Deere Capital Corporation (Capital Corporation), a U.S. financial services subsidiary, generally purchases retail installment sales and loan contracts (retail notes) from the sales companies. These retail notes are acquired by the sales companies through John Deere retail dealers in the U.S. John Deere Financial Inc., a Canadian financial services subsidiary, purchases and finances retail notes acquired by John Deere Canada ULC, John Deere’s Canadian sales company. The terms of retail notes and the basis on which the financial services operations acquire retail notes from the sales companies are governed by agreements with the sales companies. The financial services segment also finances and services revolving charge accounts, in most cases acquired from and offered through merchants in the agriculture and turf and construction and forestry markets (revolving charge accounts). Additionally, the financial services operations provide wholesale financing to dealers of John Deere agriculture and turf equipment and construction and forestry equipment (wholesale notes), primarily to finance inventories of equipment for those dealers. The various financing options offered by the financial services operations are designed to enhance sales of John Deere products and generate financing
8
income for the financial services operations. In the U.S. and Canada, certain subsidiaries included in the financial services segment offer extended equipment warranties.
Retail notes acquired by the sales companies are immediately sold to the financial services operations. The equipment operations are the financial services operations’ major source of business, although many retail purchasers of John Deere products finance their purchases outside the John Deere organization through a variety of sources, including commercial banks and finance and leasing companies.
The financial services operations offer retail leases to equipment users in the U.S. A small number of leases are executed with units of local governments. Leases are usually written for periods ranging from less than one year to seven years, and typically contain an option permitting the customer to purchase the equipment at the end of the lease term. Retail leases are also offered in a generally similar manner to customers in Canada through John Deere Financial Inc. and John Deere Canada ULC.
The financial services operations’ terms for financing equipment retail sales (other than smaller items financed with unsecured revolving charge accounts) generally provide for retention of a security interest in the equipment financed. The financial services operations’ guidelines for minimum down payments, which vary with the types of equipment financed and repayment provisions, generally range from 0 percent to 20 percent of the purchase price. Finance charges are sometimes waived for specified periods or reduced on certain John Deere products sold or leased in advance of the season of use or in other sales promotions. The financial services operations generally receive compensation from the sales companies at approximate market interest rates for periods during which finance charges are waived or reduced on the retail notes or leases. The cost is accounted for as a deduction in arriving at net sales by the equipment operations.
The Company has an agreement with Capital Corporation to make payments to Capital Corporation such that its consolidated ratio of earnings to fixed charges is not less than 1.05 to 1 for any fiscal quarter. The Company has also committed to continuing to own, directly or through one or more wholly-owned subsidiaries, at least 51 percent of the voting shares of capital stock of Capital Corporation and to maintain Capital Corporation’s consolidated tangible net worth at not less than $50 million. The Company’s obligations to make payments to Capital Corporation under the agreement are independent of whether Capital Corporation is in default on its indebtedness, obligations, or other liabilities. Further, the Company’s obligations under the agreement are not measured by the amount of Capital Corporation’s indebtedness, obligations, or other liabilities. The Company’s obligations to make payments under this agreement are expressly stated not to be a guaranty of any specific indebtedness, obligation, or liability of Capital Corporation and are enforceable only by or in the name of Capital Corporation. As of October 30, 2022, the Company was in compliance with all of its obligations, and no payments were required under this agreement in fiscal 2022 or 2021. At October 30, 2022, the Company indirectly owned 100 percent of the voting shares of Capital Corporation’s capital stock and Capital Corporation’s consolidated tangible net worth was $4,803 million.
Outside the U.S. and Canada. The financial services operations also offer financing, primarily for John Deere products, in Argentina, Australia, Brazil, China, India, Mexico, New Zealand, Thailand, and in several other countries in Africa, Asia, Europe, and Latin America. Shipments to Russia were suspended on February 24, 2022 and no new retail financing has been offered. In certain markets, financing is offered through cooperation agreements or joint ventures with other financial institutions. The way the financial services operations offer financing in these countries is affected by a variety of country-specific laws, regulations, and customs, including those governing property rights and debtor obligations, which are subject to change and which may introduce greater risk to the financial services operations.
The financial services operations also offer to select customers and dealers credit enhanced international export financing primarily for the purchase of John Deere products.
Additional information on the financial services operations is provided in the MD&A section of this Annual Report on Form 10-K.
ENVIRONMENTAL MATTERS
John Deere is subject to a wide variety of local, state, and federal environmental laws and regulations in the U.S., as well as the environmental laws and regulations of other countries in which John Deere conducts business. John Deere strives to comply with applicable laws and regulations; however, failure to comply with these regulations could lead to fines and other penalties. John Deere is involved in the evaluation and clean-up of a limited number of sites but does not expect that these matters or other expenses or liabilities John Deere may incur in connection with any noncompliance with environmental laws or regulations or the cleanup of any additional properties will have a material adverse effect on the Company’s consolidated financial position, results of operations, cash flows, or competitive position. With respect to properties and businesses that have been or will be acquired, John Deere conducts due diligence into potential exposure to environmental liabilities, but cannot be certain that it has identified or will identify all adverse environmental conditions. Compliance with these laws and regulations adds to the cost of John Deere’s production operations. The Company does not expect to incur material capital expenditures for environmental control facilities during fiscal 2023. In addition to
9
ensuring compliance with laws and regulations, John Deere aims to reduce its environmental footprint through the Leap Ambitions framework and seeks opportunities to reduce the environmental impact on the communities where it operates.
The European Union’s Stage V Regulation, parts of which became effective in 2019 and 2020, applies to non-road diesel engines across various power categories for machines used in construction, agriculture, material handling, industrial use, and generator applications. Governmental agencies throughout the world are enacting similar laws to reduce off-road engine emissions, including India’s Bharat Stage IV Regulation that became effective in 2021. These standards continue the reduction of particulate and nitrogen oxides (NOx) emissions. John Deere has achieved and plans to continue to achieve compliance with these regulations through significant investments in the development of new engine technologies and after-treatment systems. Compliance with emissions regulations has added and will continue to add to the cost of John Deere’s products.
Governments are also implementing laws regulating products across their life cycles, including raw material sourcing and the storage, distribution, sale, use, and disposal of products at their end-of-life. These laws and regulations include developing less hazardous chemical substances and products, right-to-know, restriction of hazardous substances, and product take-back laws.
GOVERNMENT REGULATIONS
John Deere is subject to a wide variety of local, state, and federal laws and regulations in the countries where it conducts business. Compliance with these laws and regulations often requires the dedication of time and effort of employees, as well as financial resources. In fiscal 2022, compliance with the regulations applicable to John Deere did not have a material effect on John Deere’s capital expenditures, earnings, or competitive position. At this time, the Company does not expect to incur material capital expenditures related to compliance with regulations during fiscal year 2023. Additional information about the impact of government regulations on John Deere’s business is included in Item 1A, “Risk Factors – Strategic Risks” and “Legal and Compliance Risks.”
HUMAN CAPITAL
Higher Purpose
John Deere’s employees, its human capital, are guided by the Company’s higher purpose: We run so life can leap forward. Employees are further guided by the Company’s Code of Business Conduct (Code), which helps them to uphold and strengthen the standards of honor and integrity that have defined John Deere since its founding. Our world and business may change, but our core values—integrity, quality, commitment, and innovation—remain constant in everything we do. Our values have shaped and guided our vision since 1837.
Employees
At October 30, 2022, John Deere had approximately 82,200 employees, including approximately 32,000 employees in the U.S. and Canada. John Deere also retains consultants, independent contractors, and temporary and part-time workers. Unions are certified as bargaining agents for approximately 81 percent of John Deere’s U.S. production and maintenance employees. Approximately 11,500 of John Deere’s active U.S. production and maintenance workers are covered by a collective bargaining agreement with the International Union, United Automobile, Aerospace and Agricultural Implement Workers of America (UAW), with an expiration date of November 1, 2027. A small number of U.S. production employees are represented by the International Association of Machinists and Aerospace Workers (IAM). Collective bargaining agreements covering John Deere’s employees in the U.S. expire between 2024 and 2027. Unions also represent the majority of employees at John Deere manufacturing facilities outside the U.S.
There is no guarantee that John Deere will be able to renew collective bargaining agreements or whether such agreements will be on terms satisfactory to John Deere. For further discussion, see “Risk Factors- Disputes with labor unions have adversely affected John Deere’s ability to operate its facilities as well as its financial results.”
Code of Business Conduct
John Deere is committed to conducting business in accordance with the highest ethical standards. This means how we conduct ourselves and our global work is more than just a matter of policy and law; it reflects our core values. The Code provides specific guidance to all John Deere employees, outlining how they can and must uphold and strengthen the integrity that has defined John Deere since its founding. The Company’s policy requires all employees to complete Code training and, where permitted by law, also requires the employees certify each year that they will comply with the Code. The Company maintains a global compliance hotline to allow for concerns to be brought forward.
Health and Safety
John Deere strives to achieve safety excellence through increased focus on leading indicators, risk reduction, health and safety management systems, and prevention. John Deere utilizes a safety balanced scorecard, which includes leading and lagging indicators, and is designed to enable continuous measurement of safety performance and drive continuous improvement. Leading indicators
10
include injury/illness corrective action closure rates, near-miss corrective action closure rates, and risk reduction from safety and ergonomic risk assessment projects. Lagging indicators include total recordable incident rate, ergonomic recordable case rate, and near-miss rate. Leading indicators are tracked by most of John Deere’s manufacturing facilities and internally reported. John Deere reported a total recordable incident rate of 2.18 and a lost time frequency rate of .67 in fiscal 2022.
A key area of focus is ergonomic risk, which the Company aims to address through Prevention Through Design (PTD). As part of PTD, the Company strives to incorporate risk reduction goals in new product strategies. Defined processes and tools are utilized to identify risk early in the design processes. In addition, certain John Deere units assess themselves against a Company-developed Ergonomic Scorecard, which contains important elements of a fully functioning ergonomic program.
Diversity, Equity, and Inclusion (DEI)
John Deere believes that a diverse workforce is essential to its long-term success and strives to foster a diverse, equitable, and inclusive culture where all voices are heard, valued, and included. John Deere embraces employees’ differences in race, color, religion, age, sex, sexual orientation, gender, gender identity or expression, marital or partnership status, family status, citizenship, genetic information, national origin, ancestry, geographic background, military or veteran status, disability (mental or physical), and any other characteristics that make our employees unique.
John Deere’s global DEI strategy focuses on embedding DEI into world-wide business operations and people processes. The Company believes that sustainable DEI requires rigor and long-term investment to realize lasting benefits to the business. The Company’s DEI strategic framework consists of four DEI pillars that reflect our areas of focus—people, leadership, business strategy, and community.
John Deere’s leadership team works to set a consistent and transparent tone on DEI issues and strategy. John Deere creates spaces for open conversations and learning through its DEI speaker series, micro-learnings, and online forum panel series, ‘Let’s Talk Series’. Additionally, John Deere works to provide immersive learning experiences to improve workplace equity and inclusion. DEI expectations are integrated into John Deere’s global performance management program. To help managers with development and team building, John Deere measures inclusiveness as part of its periodic internal employee experience survey.
John Deere proudly partners with several professional organizations to support our diversity recruitment strategy, including Anita B.org. – a global organization for women in technology, Minorities in Agriculture Natural Resources and Related Sciences, the National Association of Black Accountants, Inc., the National Black MBA Association, Inc., the National Society of Black Engineers, Prospanica – the Association of Hispanic Professionals, the Society of Women Engineers, the Thurgood Marshall College Fund Leadership Institute, and the Society of Hispanic Professional Engineers.
Our 13 Employee Resource Groups (ERGs), which are Company sponsored organizations run by employees, are a key driver of inclusion at John Deere and a critical component of our global DEI strategy. ERGs build organization-wide networks that help enable employees with shared interests to come together and are open to all employees. The global chapters work with local teams to support our efforts to attract, retain, and develop the best talent. This year, we expanded our ERGs to the U.S. production workforce to help ensure all our people experience opportunities to connect and benefit from the support offered by these networks.
Compensation & Benefits
John Deere’s total rewards are intended to be competitive, meet the varied needs of our global workforce, and reinforce our values. John Deere is committed to providing comprehensive and competitive pay and benefits to its employees. John Deere has invested, and continues to invest, in its employees through growth and development and well-being initiatives.
John Deere’s work environment is designed to promote innovation and well-being and reward performance. John Deere’s total rewards for employees include a variety of components that aim to support sustainable employment and the ability to build a strong financial future, including competitive market-based pay and comprehensive benefits. In addition to earning base pay, eligible employees are compensated for their contributions to the Company’s goals with both short and long-term cash incentives and long-term equity-based incentives.
Eligible full-time employees in the U.S. have access to medical, dental, and vision plans; savings and retirement plans; parental leave and paid time off; and other resources, such as the Employee Assistance Program (EAP), which provides mental health and wellness services. John Deere also offers a variety of working arrangements to eligible employees, including flexible schedules, telecommuting, and job sharing, to help employees manage home and work-life situations. Programs and benefits differ internationally for a variety of reasons, such as local legal requirements, market practices, and negotiations with works councils, trade unions, and other employee representative bodies.
11
Expansion of Information Technology Locations
In addition to the flexible schedules mentioned above, the Company recognizes that having office locations in areas with diverse pools of technology talent is important for recruitment and talent engagement. The Company expanded its Information Technology (IT) and technology footprint in the United States in 2022 by opening a new office in the Fulton Market neighborhood of Chicago and an innovation and collaboration hub in Austin, Texas. The Company also opened an office in Bangalore, India in 2020, which serves as a core IT hub for the Company.
Training and Development
John Deere provides training and development opportunities for employees at all stages of their careers to empower them to reach their full potential. Employees are critical to the long-term success of John Deere’s business. We encourage employees to identify the paths that can build the skills, experience, knowledge, and competencies needed for career advancement. John Deere supports employees by creating purpose-driven work opportunities, comprehensive performance reviews and development plans, mentoring opportunities, and professional and personal development opportunities.
John Deere encourages employees to provide feedback across the enterprise through our internal voluntary employee experience survey, ad-hoc “pulse” surveys, and new-hire and exit surveys. Reports from these surveys help equip John Deere to address needs across the employee lifecycle to improve the overall experience and engagement of our workforce.
In terms of learning and development, John Deere continues to invest in technology and content providers that strengthen our commitment to preparing a future-ready workforce. We offer training, upskilling, and development opportunities at all stages of an employee’s career, empowering them to reach their full potential.
Each John Deere full time salaried employee completed an average of approximately 20.2 training hours globally in fiscal 2022. John Deere’s training programs, which are tailored to different geographic regions and job functions, include among other topics technical operation of equipment, equipment assembly, relationships with customers and dealers, John Deere’s culture and values, compliance with the Code, compliance with anti-bribery/corruption laws and policies, compliance with management of private data and cybersecurity, conflicts of interest, discrimination and workplace harassment policies, sexual harassment policies, and leadership development.
Human Rights
John Deere honors human rights and respects the individual dignity of all persons globally. John Deere’s commitment to human rights requires that we understand and carry out our responsibilities consistent with Company values and practices. John Deere strives to ensure that human rights are upheld for our employees and all workers in our supply chain. Our commitment to human rights is defined in the Code, our Supplier Code of Conduct, our Dealer Code of Conduct, related policies and procedures, and “Support of Human Rights in our Business Practice,” each of which is available on the Company’s website under “Governance.” These documents establish clear guidelines for our employees, suppliers, and dealers while helping to inform our business decisions. We do not tolerate human rights abuses, such as forced labor, unlawful child labor, or human trafficking. We are proud to contribute to the places where we work and support the residents of these places.
INFORMATION ABOUT OUR EXECUTIVE OFFICERS
Following are the names and ages of the executive officers of the Company, their positions with the Company, and summaries of their backgrounds and business experiences. All executive officers are elected or appointed by the Board of Directors and hold office until the meeting of the Board of Directors following the annual meeting of stockholders each year.
| | | | | | | | |
Name, age and office (at December 7, 2022), and year elected to office | | Principal occupation during last | ||||||
John C. May | | 53 | | Chairman and Chief Executive Officer | | 2020 | | 2019 Chief Executive Officer and President; 2019 President and Chief Operating Officer; 2018 – 2019 President, Worldwide Agriculture & Turf Division, Global Harvesting and Turf Platforms, Ag Solutions Americas and Australia; 2012 – 2018 President, Agricultural Solutions & Chief Information Officer |
12
Joshua A. Jepsen | | 45 | | Senior Vice President & Chief Financial Officer | | 2022 | | 2022 Deputy Financial Officer; 2018 – 2022 Director, Investor Relations; 2015 – 2018 Manager, Investor Communications |
Ryan D. Campbell | | 48 | | President, Worldwide Construction & Forestry and Power Systems | | 2022 | | 2019 – 2022 Senior Vice President and Chief Financial Officer; 2018 Deputy Financial Officer; 2017 Vice President and Comptroller |
Marc A. Howze | | 59 | | Senior Advisor, Office of the Chairman | | 2022 | | 2020 – 2022 Group President, Lifecycle Solutions and Chief Administrative Officer; 2016 – 2020 Senior Vice President and Chief Administrative Officer |
Mary K.W. Jones | | 54 | | Senior Vice President, General Counsel and Worldwide Public Affairs | | 2019 | | 2013 – 2019 Senior Vice President and General Counsel |
Rajesh Kalathur | | 54 | | President, John Deere Financial, and Chief Information Officer | | 2022 | | 2022 President, John Deere Financial and Senior Vice President, Global Information Technology and Chief Financial Officer; 2019-2022 President, John Deere Financial, and Chief Information Officer; 2018 – 2019 Senior Vice President, Chief Financial Officer and Chief Information Officer; 2012 – 2018 Senior Vice President and Chief Financial Officer |
Felecia Pryor | | 48 | | Senior Vice President & Chief People Officer | | 2022 | | 2019 – 2022 Executive Vice President & Chief Human Resources Officer, BorgWarner Inc.; 2018 – 2019 Global Vice President Human Resources, BorgWarner, Inc.- Morse Systems; 2016 – 2018 Vice President Human Resources ASEAN, Ford Motor Company |
Cory J. Reed | | 52 | | President, Worldwide Agriculture and Turf Division, Production and Precision Ag, Sales and Marketing Regions of the Americas and Australia | | 2020 | | 2019 – 2020 President, Worldwide Agriculture & Turf Division, Americas and Australia, Global Harvesting and Turf Platforms, Agricultural Solutions; 2016 – 2019 President, John Deere Financial |
Justin R. Rose | | 43 | | President, Lifecycle Solutions, Customer Support & Supply Management | | 2022 | | 2020 – 2022 Senior Partner and Managing Director at the Boston Consulting Group (BCG); 2002 – 2020 various roles of increasing responsibility from Associate to Partner and Managing Director |
Markwart von Pentz | | 59 | | President, Worldwide Agriculture and Turf Division, Small Ag and Turf, Sales and Marketing Regions of Europe, CIS, Asia, and Africa | | 2020 | | 2019 – 2020 President, Worldwide Agriculture & Turf Division Tractor and Hay & Forage, Regions 1 & 2, and Advanced Engineering; 2018 – 2019 President, Worldwide Agriculture & Turf Division Global Tractor and Hay & Forage Platforms, Europe, CIS, Asia, Africa; 2012 – 2018 President, Agriculture & Turf Division-Europe, Asia, Africa, and Global Tractor Platform |
13
ITEM 1A. | RISK FACTORS. |
The following risks are considered material to John Deere’s business based upon current knowledge, information, and assumptions. This discussion of risk factors should be considered closely in conjunction with Management’s Discussion and Analysis of Financial Condition and Results of Operations, including the risks and uncertainties described in the Forward-Looking Statements, and the Notes to Consolidated Financial Statements. These risk factors and other forward-looking statements relate to future events, expectations, trends, and operating periods, and involve certain factors that are subject to change and important risks and uncertainties that could cause actual results to differ materially. Some of these risks and uncertainties could affect particular lines of business, while others could affect all the Company’s businesses. Although the risks are organized by headings and each risk is discussed separately, many are interrelated. The risks described in this Annual Report on Form 10-K and the “Forward-Looking Statements” in this report are not the only risks faced by the Company.
STRATEGIC RISKS
International, national, and regional trade laws, regulations, and policies (particularly those related to or restricting global trade) and government farm programs and policies could significantly impair John Deere’s profitability and growth prospects.
International, national, and regional laws, regulations, and policies directly or indirectly related to or restricting the import and export of John Deere’s products, services, and technology, or those of our customers, including protectionist policies in particular jurisdictions, or for the benefit of favored industries or sectors, could harm John Deere’s global business. John Deere’s profitability and growth prospects are tied directly to the global marketplace. Restricted access to global markets impairs John Deere’s ability to export goods and services from its various manufacturing locations around the world and limits the ability to access raw materials and high-quality parts and components at competitive prices on a timely basis. Trade restrictions, including withdrawal from or modification of existing trade agreements, negotiation of new trade agreements, non-tariff trade barriers, local content requirements, and imposition of new or retaliatory tariffs against certain countries or covering certain products, including developments in U.S.-China trade relations and sanctions against Russia, have limited, and could continue to limit, John Deere’s ability to capitalize on current and future growth opportunities in international markets and impair John Deere’s ability to expand the business. These trade restrictions, and changes in, or uncertainty surrounding, global trade policies, may affect John Deere’s competitive position. Policies impacting exchange rates and commodity prices or those limiting the export or import of commodities could have a material adverse effect on the international flow of agricultural and other commodities that may result in a corresponding negative effect on the demand for agricultural and forestry equipment in many areas of the world. John Deere’s agricultural equipment sales could be especially harmed by such policies because farm income strongly influences sales of agricultural equipment around the world. Furthermore, trade restrictions could impede those in developing countries from achieving a higher standard of living, which could negatively impact John Deere’s future growth opportunities arising from increasing global demand for food, fuel, and infrastructure. Additionally, changes in government farm programs and policies, including direct payment and other subsidies, can significantly influence demand for agricultural equipment as well as create unequal competition for multinational companies relative to domestic companies.
Greater political, economic, and social uncertainty and the evolving globalization of businesses could significantly change the dynamics of John Deere’s competition, customer base, and product offerings and impact John Deere’s growth opportunities globally.
John Deere’s efforts to grow its businesses depend in part upon access to additional geographic markets, including, but not limited to, Argentina, Brazil, China, India, and South Africa, and its success in developing market share and operating profitably in such markets. In some cases, these countries have greater political and economic volatility, greater vulnerability to infrastructure and labor disruptions, and differing local customer product preferences and requirements than John Deere’s other markets. Having business operations in various regions and countries exposes John Deere to multiple and potentially conflicting business practices, and legal and regulatory requirements that are subject to change and are often complex and difficult to navigate, including those related to tariffs and trade regulations, investments, property ownership rights, taxation, repatriation of earnings, and advanced technologies. Expanding business operations globally also increases exposure to currency fluctuations, which can materially affect the Company’s financial results. While John Deere maintains a positive corporate image and its brands are widely recognized and valued in its traditional markets, the brands are less known in some emerging markets, which could impede John Deere’s efforts to successfully compete in these markets.
In addition, changing U.S. export controls and sanctions on China, as well as other restrictions affecting transactions involving China and Chinese parties, could affect John Deere’s ability to collect receivables, provide aftermarket warranty support for John Deere equipment, sell products, and otherwise impact John Deere’s reputation and business.
The conflict between Russia and Ukraine could adversely impact our business and financial results.
On February 24, 2022, John Deere suspended shipments of machines and service parts to Russia and Belarus. After assessing the impact of the Russia and Ukraine conflict on our operations within Russia, our senior management in the U.S. decided to initiate a
14
voluntary employee-separation program, which reduced overall headcount in Russia. We may further reduce or discontinue operations in Russia depending on the continued evolution of the conflict, monetary, currency or payment controls, restrictions on access to financial institutions, supply and transportation challenges, sanctions and export controls and counter-sanctions, or other circumstances and considerations. Our U.S. senior management continues to closely monitor all risks to John Deere operations in the region. The broader consequences of the Russia and Ukraine conflict such as, embargoes, regional instability, geopolitical shift, access to natural gas, higher energy prices, potential retaliatory action by the Russian government, including nationalization of foreign businesses, increased tensions between the U.S. and countries in which we operate, and the extent of the conflict’s effect on the global economy, cannot be predicted, including the extent to which the conflict may heighten other risks disclosed herein. Ultimately, these or other factors could result in further loss or write-downs of other operating assets and working capital.
Negative economic conditions and outlook can materially weaken demand for John Deere’s equipment and services, limit access to funding, and result in higher funding costs.
The demand for John Deere’s products and services can be significantly reduced in an economic environment characterized by high unemployment, rising interest rates, cautious consumer spending, changes in consumer practices due to a possible recession, lower corporate earnings, and lower business investment. Negative or uncertain economic conditions that cause John Deere’s customers to lack confidence in the general economic outlook can significantly reduce their likelihood of purchasing John Deere’s equipment. The COVID pandemic, geopolitical instability, including the conflict between Russia and Ukraine, and other global events have significantly increased economic and demand uncertainty. Some of the results of these events include supply chain challenges, inflation, high interest rates, foreign currency exchange volatility, and volatility in global capital markets. Supply chain challenges, including delays caused by shortages of raw materials, shipping containers and labor, have increased production costs and reduced our profit margins. Additionally, the cost of raw materials used in John Deere’s products and the cost of freight have increased due to heightened inflation. These adverse economic events have and may continue to adversely affect John Deere’s operations.
Sustained negative economic conditions and outlook also affect housing starts, energy prices and demand, and other construction, which dampens demand for certain construction equipment. John Deere’s turf operations and its construction and forestry segments are dependent on construction activity and have also been affected by recent adverse economic conditions. In fiscal 2022, supply constraints, shortage of turf inventory, and softening customer demand have affected our production and sales of consumer products within these segments. Decreases in construction activity and housing starts could have a material adverse effect on John Deere’s results of operations.
If negative economic conditions affect the overall farm economy, there could be a similar effect on John Deere’s agricultural equipment sales. In addition, uncertain or negative outlook with respect to pervasive U.S. fiscal issues as well as general economic conditions and outlook, such as market volatility and continued interest rate increases by the Federal Reserve, have caused and could continue to cause significant changes in market liquidity conditions. Such changes could impact access to funding and associated funding costs, which could reduce the Company’s earnings and cash flows. Additionally, the Company’s investment management activities could be adversely affected by changes in the equity and bond markets, including the recent volatility of the United Kingdom’s bond market, which would negatively affect earnings.
Changing worldwide demand for food and different forms of bio-energy could affect the price of farm commodities and consequently the demand for certain John Deere equipment and could also result in higher research and development costs related to changing machine fuel requirements.
Changing worldwide demand for farm outputs to meet the world’s growing food and bio-energy demands, driven in part by government policies, including those related to climate change, and a growing world population, are likely to result in fluctuating agricultural commodity prices, which directly affect sales of agricultural equipment. Lower agricultural commodity prices directly affect farm incomes, which could negatively affect sales of agricultural equipment and result in higher credit losses. While higher commodity prices benefit John Deere’s crop-producing agricultural equipment customers, higher commodity prices also could result in greater feed costs for livestock and poultry producers, which in turn may result in lower levels of equipment purchased by these customers. Furthermore, changing bio-energy demands may cause farmers to change the types or quantities of the crops they raise, with corresponding changes in equipment demands. Finally, changes in governmental policies regulating bio-fuel utilization could affect commodity demand and commodity prices, demand for John Deere’s diesel-fueled equipment, and result in higher research and development costs related to equipment fuel standards.
John Deere may not realize the anticipated benefits of its Smart Industrial operating model and Leap Ambitions.
John Deere’s failure to realize the anticipated benefits of its Smart Industrial operating model and related business strategies in production systems, precision technologies, and aftermarket support could adversely affect the Company’s results of operations and financial condition. Several factors could impact John Deere’s ability to successfully execute the Smart Industrial operating model, including, among other things, failure to accurately assess market opportunity and the technology required to address such
15
opportunity; failure to develop and introduce new technologies or lack of adoption of such technologies by John Deere’s customers; and failure to holistically execute lifecycle solutions. In addition, if the Company is unable to optimize its capital allocation in connection with the operating model, it may not be able to realize the full benefits, which could have an adverse effect on the Company’s financial condition or results of operations.
Similarly, John Deere may not realize the anticipated benefits of its Leap Ambitions and related goals in the expected timeline, or at all. As part of its Leap Ambitions framework, John Deere adopted various goals that it expects to achieve by 2026 or 2030, as applicable. John Deere may not be able to achieve these goals for a number of reasons, some of which may be out of its control. For example, John Deere’s estimates and assumptions related to efficiency of our products and the adoption of precision technology may not be accurate; certain materials, such as quality battery cells, may become unavailable or too costly; or infrastructure required to achieve our goals, such as sufficient charging stations, may become too costly or may not occur on the expected timeline. The actual or perceived failure to achieve our Leap Ambitions could negatively impact our ability to execute the Smart Industrial operating model, and could harm our reputation and our business.
John Deere may not realize all anticipated benefits of acquisitions, joint ventures, and divestitures, or these benefits may take longer to realize than expected.
From time to time, John Deere makes strategic acquisitions and divestitures and participates in joint ventures. In an effort to enhance its Smart Industrial operating model by adding technology and talent, during fiscal year 2022, the Company acquired majority ownership in Kreisel Electric Inc., which designs and manufactures high-durability battery packs and high-powered charging stations; a 40 percent equity method investment in GUSS Automation LLC, a producer of semi-autonomous orchard and vineyard sprayers; and LGT, LLC (Light), which specializes in depth sensing and camera-based perception for autonomous vehicles.
Acquisitions and joint ventures that John Deere has entered, or may enter in the future, may involve significant challenges and risks, including that the acquisitions or joint ventures do not advance John Deere’s business strategy or fail to produce satisfactory returns on investment. John Deere may encounter difficulties in integrating acquisitions with its operations, applying internal control processes to these acquisitions, managing strategic investments, and assimilating new capabilities to meet the future needs of John Deere’s businesses. Integrating acquisitions is often costly and may require significant attention from management. Furthermore, John Deere may not realize all the anticipated benefits of acquisitions or joint ventures, or the realized benefits may be significantly delayed. While our evaluation of any potential transaction includes business, legal, and financial due diligence with the goal of identifying and evaluating the material risks involved, these due diligence reviews may not identify all of the issues necessary to accurately estimate the cost and potential risks of a particular acquisition or joint venture, including potential exposure to regulatory sanctions resulting from an acquisition target’s or joint venture partner’s previous activities or costs associated with any quality issues with an acquisition target's or joint venture’s products or services.
John Deere may decide to divest businesses if it determines any such divestiture is in the best interests of its shareholders, and joint ventures may be terminated at or before their stated expiration, such as the joint venture between the Company and Hitachi, which the Company agreed to voluntarily terminate in fiscal 2021. Divestitures of businesses or dissolutions of joint ventures may involve significant challenges and risks, including failure to advance our business strategy, costs or disruptions to John Deere, and negative effects on John Deere’s product offerings, which may adversely affect John Deere’s business, results of operations, and financial condition. Divestitures of businesses or dissolutions of joint ventures may result in ongoing financial or legal involvement in the divested business through indemnifications or other financial arrangements, such as retained liabilities, which could affect the Company’s future financial results.
John Deere’s ability to understand its customers’ specific preferences and requirements, and to develop, manufacture, and market products that meet customer demand, could significantly affect its business results.
John Deere’s ability to match new product offerings to diverse global customers’ anticipated preferences for different types and sizes of equipment and various equipment features and functionality, at affordable prices, is critical to its success. This requires a thorough understanding of John Deere’s existing and potential customers on a global basis, particularly in growth markets such as Argentina, Brazil, and India. Failure to deliver quality products that meet customer needs at competitive prices ahead of competitors could have a significant adverse effect on John Deere’s business.
Customer preferences in the markets served by John Deere could change as these markets transition to less carbon-intensive business models. Ongoing social and regulatory focus on sustainability and the impact of policies and consumer preferences on the construction, forestry, and agriculture industries mean that change is imminent. As regulations and social pressure drive change, John Deere must be proactive in monitoring trends and developing alternatives and enhancements that complement our product offerings. For example, the Company may be unable to keep up with the rising demand for electric agriculture, turf, and construction equipment.
16
The development of alternative farming techniques, carbon sequestration technologies, and new low-carbon biofuels, could change farmers’ business models and equipment needs. If John Deere fails to properly develop or invest in new technologies to meet changing customer demands, John Deere will be at risk of losing potential sources of revenue, which could affect the Company’s future financial results.
The inability to accurately forecast customer demand for products and services, and to adequately manage inventory, could adversely affect our operating results.
To ensure adequate inventory supply, John Deere must forecast inventory needs and expenses and place orders sufficiently in advance with suppliers and contract manufacturers. These forecasts are based on estimates of future demand for particular products and services. Failure to accurately forecast our needs may result in unmet market demand, parts shortages, manufacturing delays, increased costs, or excess inventory. In response to recent supply chain constraints, John Deere has worked with suppliers to ensure optimum inventory levels. John Deere’s ability to accurately forecast demand could be affected by many factors, including changes in customer demand for John Deere’s products and services, changes in demand for the products and services of competitors, unanticipated changes in general market conditions, and the weakening of economic conditions or customer confidence in future economic conditions. If the forecasts used to manage inventory are not accurate, John Deere has in the past and may in the future experience excess inventory levels, shortage of available products, or reduced manufacturing efficiencies.
If John Deere is unable to deliver precision technology and agricultural solutions to its customers, it could affect its business, results of operations, and financial condition.
John Deere’s approach to precision technology involves hardware and software, guidance, connectivity and digital solutions, automation and machine intelligence, and autonomy. To create and maintain a competitive differentiation through precision technology solutions, John Deere needs to successfully develop and introduce new precision technology solutions that improve profitability and sustainability for customers through the production systems. John Deere may make significant investments in research and development, connectivity solutions, data security for precision technology solutions, and employee training. These investments may not produce solutions that provide the desired results for customers’ profitability or sustainability outcomes. If John Deere is not able to deliver precision technology solutions with differentiated features and functionality, customers may not adopt technology solutions, which could have a material adverse effect on the Company’s reputation and business.
Changes to or reallocation of radio frequency (RF) bands could disrupt or degrade the reliability of John Deere’s high precision augmented Global Positioning System (GPS) or other RF technology, which could impair John Deere’s ability to develop and market GPS- and RF-based technology solutions as well as significantly reduce agricultural and construction customers’ profitability.
John Deere’s current and planned integrated agricultural business and equipment management systems, as well as its fleet management telematics solutions for construction equipment, depend upon the use of RF signals. These signals include, but are not limited to, GPS signals, other GPS-like satellite signals, augmented GPS services, and other RF technologies that link equipment, operations, owners, dealers, and technicians. These radio services depend on frequency allocations governed by international and national government agencies. Any international or national reallocation of frequency bands, including frequency bands segmentation and band spectrum sharing, or other modifications concerning the regulation of frequency bands, could significantly disrupt or degrade the utility and reliability of John Deere’s GPS-based products, which could negatively affect John Deere’s ability to develop and market GPS-based technology solutions. For John Deere’s agricultural customers, the inability to use high-precision augmented GPS signals or other RF signals could result in lower crop yields and higher equipment maintenance, seed, fertilizer, fuel, and wage costs. For construction customers, disrupting GPS or RF applications could result in higher fuel and equipment maintenance costs, as well as lower construction design and project management efficiencies. These cost increases could significantly reduce customers’ profitability and demand for John Deere products.
John Deere’s ability to adapt in highly competitive markets could affect its business, results of operations, and financial condition.
John Deere operates in a variety of highly competitive global and regional markets. John Deere competes worldwide with a number of other manufacturers and distributors that produce and sell similar products. In addition, John Deere’s industry is attracting non-traditional competitors, including technology-focused companies and start-up ventures. John Deere competes on the basis of product performance, innovation and quality, distribution, customer service, and price. Aggressive pricing or other strategies pursued by competitors, unanticipated product or manufacturing delays, or John Deere’s failure to price its products competitively could adversely affect its business, results of operations, and financial condition.
John Deere relies on a network of independent dealers to manage the distribution of its products. If dealers are unsuccessful with their sales and business operations, it could have an adverse effect on overall sales and revenue.
John Deere relies on the capability of its dealers to develop and implement effective sales plans to create demand among purchasers for the equipment and related products and services that the dealers purchase from John Deere. If John Deere’s dealers are not
17
successful in these endeavors, then John Deere will be unable to grow its sales and revenue, which would have an adverse effect on its financial condition. In addition, the dealer channel’s ability to support and service precision technology solutions and emerging power solutions may affect customers’ acceptance and adoption rates of these products.
Dealers may have trouble funding their day-to-day cash flow needs and paying their obligations due to adverse business conditions resulting from negative economic effects or other factors. Dealers may exit or John Deere may seek to terminate relationships with certain dealers if they are unable to meet customer needs. The unplanned loss of any John Deere dealers could lead to inadequate market coverage, negative customer impressions of John Deere, and may adversely impact John Deere’s ability to collect receivables that are associated with that dealer.
ENVIRONMENTAL, CLIMATE, AND WEATHER RISKS
Unfavorable weather conditions or natural calamities that reduce agricultural production and demand for agriculture and turf equipment could directly and indirectly affect John Deere’s business.
Poor or unusual weather conditions, particularly during the planting and early growing season, can significantly affect the purchasing decisions of John Deere’s customers, particularly the purchasers of agriculture and turf equipment. The timing and quantity of rainfall are two of the most important factors in agricultural production. Insufficient levels of rain prevent farmers from planting new crops and may cause growing crops to die or result in lower yields. Excessive rain or flooding can prevent planting from occurring at optimal times and may cause crop loss through increased disease or mold growth. Temperature affects the rate of growth, maturity, and quality of crops. Temperatures outside normal ranges can also cause crop failure or decreased yields and may also affect disease incidence. Natural calamities such as regional floods, hurricanes or other storms, droughts, diseases, and pests, either as a physical effect of climate change or otherwise, have had and could in the future have significant negative effects on agricultural and livestock production. The resulting negative impact on farm income can strongly affect demand for agricultural equipment and the financial condition and credit risk of John Deere’s dealers and customers. Adverse weather conditions in a particular geographic region, particularly during the important spring selling season, may adversely affect sales of some turf equipment. Drought conditions can adversely affect sales of certain mowing equipment and unusually rainy weather can similarly cause lower sales volumes.
Governmental actions designed to address climate change and the emergence of new technologies and business models in connection with the transition to a lower-carbon economy could adversely affect John Deere and its customers.
There is global scientific consensus that greenhouse gas (GHG) emissions continue to alter the composition of Earth’s atmosphere in ways that are affecting and are expected to continue to affect the global climate. These considerations have led to new international, national, regional, and local legislative and regulatory responses. Various stakeholders, including legislators and regulators, shareholders, and non-governmental organizations, as well as companies in many business sectors, including John Deere, are continuing to look for ways to reduce GHG emissions. The regulation of GHG emissions from certain stationary or mobile sources or the imposition of carbon pricing mechanisms could result in additional costs to John Deere in the form of taxes or emission allowances, required facilities improvements, and increased energy costs, which would increase John Deere’s operating costs through higher utility, transportation, and materials costs. Increased input costs, such as fuel and fertilizer, and compliance-related costs could also affect customer operations and demand for John Deere equipment. John Deere’s financial services is subject to additional international and national European regulations relating to climate and environmental risk, which are continually evolving and could affect the lending operations and climate-risk processes developed by John Deere’s financial services. Regulators in Europe and the U.S. have also focused efforts on increased disclosure related to climate change and mitigation efforts. The SEC has included in its regulatory agenda potential rulemaking on climate change disclosures that, if adopted, could significantly increase compliance burdens and associated regulatory costs and complexity.
Increasingly stringent engine emission regulations or bans on internal combustion engines could impact John Deere’s ability to manufacture and distribute certain engines or equipment, which could negatively affect business results.
John Deere’s equipment operations must meet increasingly stringent engine emission reduction regulations throughout the world, including the European Union’s Stage V standard which limits the amount of harmful substances in exhaust gases that off-road engines can emit into the environment. In addition, governmental agencies throughout the world are enacting more stringent laws and regulations to reduce off-road engine emissions. These laws and regulations are applicable to engines manufactured by John Deere, including those used in John Deere agriculture and construction and forestry equipment. John Deere has incurred and continues to incur substantial research and development costs related to the implementation of these more rigorous laws and regulations. While John Deere has developed and is executing comprehensive plans to meet these requirements, these plans are subject to many variables that could delay or otherwise affect John Deere’s ability to manufacture and distribute certain equipment or engines, which could negatively impact business results. Additionally, in certain locations governments have banned or may in the future ban internal combustion engines for some types of products completely. To the extent these bans affect products manufactured and sold by John Deere, our business, results of operations, and financial condition could be negatively affected.
18
FINANCIAL RISKS
Sustained increases in funding obligations under the Company’s pension plans may impair the Company’s liquidity or financial condition.
The Company maintains certain defined benefit pension plans for certain employees, which impose funding obligations. The Company uses many assumptions in calculating its future payment obligations under these plans. Significant adverse changes in credit or market conditions could result in actual rates of return on pension investments being lower than expected. The Company may be required to make significant contributions to its pension plans in the future. These factors could significantly increase the Company’s payment obligations under the plans and adversely affect its business, results of operations, and financial condition.
Changes in government banking, monetary, and fiscal policies could have a negative effect on John Deere.
Policies of the U.S. and other governments regarding banking, monetary, and fiscal policies intended to promote or maintain liquidity, stabilize financial markets, and/or address local deficit or structural economic issues may not be effective and could have a material impact on John Deere’s customers and markets. John Deere’s operations and results could also be affected by financial regulatory reform that could, among other things, have an adverse effect on the financial services segment and on John Deere’s customers by limiting their ability to enter into hedging transactions or to finance purchases of John Deere products. Government policies on spending can also affect John Deere, especially the construction and forestry segment, due to the impact of government spending on infrastructure development. John Deere’s operations, including those outside of the United States, may also be affected by non-U.S. regulatory reforms being implemented to further regulate non-U.S. financial institutions and markets.
Changes in tax rates, tax legislation, or exposure to additional tax liabilities could have a negative effect on John Deere.
John Deere is subject to income taxes in the U.S. and numerous foreign jurisdictions. John Deere’s domestic and international tax liabilities are dependent upon the location of earnings among these different jurisdictions. Tax rates in various jurisdictions may be subject to significant change. John Deere’s effective tax rates could be affected by changes in the mix of earnings in countries with differing statutory tax rates, changes in the valuation of deferred tax assets and liabilities, or changes in tax laws or their interpretations. If John Deere’s effective tax rates were to increase, or if the ultimate determination of taxes owed is for an amount more than amounts previously accrued, John Deere’s operating results, cash flows, and financial condition could be adversely affected.
The Company’s consolidated financial results are reported in U.S. dollars while certain assets and other reported items are denominated in the currencies of other countries, creating currency exchange and translation risk.
John Deere operates in many areas of the world, involving transactions denominated in a variety of currencies. John Deere is subject to currency exchange risk to the extent that its costs are denominated in currencies other than those in which John Deere earns revenues.
Additionally, the reporting currency for the Company’s consolidated financial statements is the U.S. dollar. Certain of John Deere’s assets, liabilities, expenses, and revenues are denominated in other countries’ currencies, which are then translated into U.S. dollars at the applicable exchange rates in the Company’s reported consolidated financial statements. Therefore, fluctuations in foreign exchange rates affect the value of those items as reflected in the Company’s consolidated financial statements, even if their value remains unchanged in their original currencies. While the use of currency hedging instruments may provide us with protection from adverse fluctuations in currency exchange rates, by utilizing these instruments we potentially forego any benefits that may result from favorable fluctuations in such rates.
Because John Deere’s equipment operations and financial services segment are subject to interest rate risks, changes in interest rates can reduce demand for equipment, adversely affect interest margins, and limit access to capital markets while increasing borrowing costs.
Rising interest rates could have a dampening effect on overall economic activity and/or the financial condition of John Deere’s customers, either or both of which could negatively affect customer demand for John Deere equipment and customers’ ability to repay obligations to John Deere. In response to increasing inflation, the U.S. Federal Reserve began to raise interest rates in March 2022 for the first time in over three years, and has signaled it expects to make additional rate increases. Rising interest rates could cause credit market dislocations, which could have an impact on funding costs, which are important to the financial services segment because such costs affect the segment’s ability to offer customers competitive financing rates. While the Company strives to match the interest rate characteristics of its financial assets and liabilities, changing interest rates could have an adverse effect on the Company’s net interest rate margin—the difference between the yield the Company earns on its assets and the interest rates the Company pays for funding, which could in turn affect the Company’s net interest income and earnings.
In addition, actions by credit rating agencies, such as downgrades or negative changes to ratings outlooks, can affect the availability and cost of funding for the Company and can increase the Company’s cost of capital and hurt its competitive position.
19
Further, due to the cessation of the London Interbank Offered Rate (“LIBOR”), the Company has entered into financial transactions such as credit agreements, receivables, derivatives, and notes that use the Secured Overnight Financing Rate (“SOFR”) or the Sterling Overnight Index Average (“SONIA”) as interest rate benchmarks. SOFR and SONIA are calculated differently from LIBOR and have inherent differences, which could give rise to uncertainties, including the limited historical data and volatility in the benchmark rates. The full effects of the transition to SOFR, SONIA, or other rates remain uncertain.
Because the financial services segment provides financing for a significant portion of John Deere’s sales worldwide, negative economic conditions in the financial industry could materially impact John Deere’s operations and financial results.
Negative economic conditions could have an adverse effect on the financial industry in which the financial services segment operates. The financial services segment provides financing for a significant portion of John Deere’s sales worldwide. The financial services segment is exposed to the risk that customers and others will default on contractual obligations and may experience credit losses that exceed its expectations and adversely affect its financial condition and results of operations. The financial services segment’s inability to access funds at cost-effective rates to support its financing activities could have a material adverse effect on John Deere’s business. The financial services segment’s liquidity and ongoing profitability depend largely on timely access to capital to meet future cash flow requirements and to fund operations and costs associated with engaging in diversified funding activities. Additionally, negative market conditions could reduce customer confidence levels, resulting in declines in credit applications and increases in delinquencies and default rates, which could materially impact the financial services segment’s write-offs and provision for credit losses. The financial services segment may also experience residual value losses that exceed its expectations caused by lower pricing for used equipment and higher-than-expected equipment returns at lease maturity.
MANUFACTURING AND OPERATIONAL RISKS
Changes in the availability and price of certain raw materials, components, and whole goods have resulted and could continue to result in significant disruptions to the supply chain causing production disruptions, increased costs, and lower profits on sales of John Deere products.
John Deere requires access to various raw materials, components, and whole goods at competitive prices to manufacture and distribute its products. The price and availability of these materials have varied significantly in the last 24 months and are expected to continue to fluctuate due to inflation, geopolitical and economic uncertainty, and regulatory and policy instability, including import tariffs and trade agreements. The latter have the potential to significantly increase production and logistics costs and have a material negative effect on the profitability of the business, particularly if John Deere is unable to recover the increased costs due to market considerations or other factors. John Deere relies on suppliers to acquire raw materials, components, and whole goods required to manufacture its products. Significant disruptions to the supply chain resulting from shortages of raw materials, components, and whole goods has and could continue to adversely affect John Deere’s ability to meet commitments to customers. During fiscal 2022, the supply chain challenges in combination with demand for John Deere’s products resulted in a heavier back-end loaded year for industry retail orders. As the result of the COVID pandemic, geopolitical instability, and other global events, John Deere has experienced changes in the availability and prices of these raw materials, components, whole goods, and freight. Global logistics network challenges include shortages of shipping containers, ocean freight capacity constraints, international port delays, trucking and chassis shortages, and railway and airfreight capacity, which have resulted in delays, shortages of key manufacturing components, increased order backlogs, increased transportation costs, and production inefficiencies from a higher number of partially completed machines in inventory, which increased the Company’s overall production and overhead costs. Increases in such costs have had an adverse effect on John Deere’s business operations.
In an effort to mitigate raw material shortages and supply chain constraints, John Deere has increased the list price of its products and worked with suppliers to ensure optimum inventory levels. However, if customers are unwilling to accept price increases in John Deere products or John Deere is unable to offset the increase in costs, raw material shortages could have an adverse effect on John Deere’s operations. Continued or increased fluctuations in costs of materials or inflation generally and continued supply chain challenges could have a material adverse effect on the Company’s results of operations and financial condition.
Certain materials and components used in John Deere’s products are acquired from a single supplier or are proprietary in nature and cannot be alternatively sourced expeditiously. As discussed under Item 1, “Business - Construction and Forestry,” the Company agreed to voluntarily terminate its joint venture agreement with Hitachi in a transaction that closed in the first half of fiscal 2022. In connection with this termination, John Deere Construction & Forestry Company, a wholly-owned subsidiary of the Company, has entered into a supply agreement with Hitachi pursuant to which Hitachi will continue to provide John Deere-branded excavators, components, and service parts. Any delay or failure by Hitachi to deliver these supplies, or failure by Hitachi to produce such supplies in a manner that meets John Deere’s quality and quantity requirements, could adversely affect John Deere’s business, results of operations, cash flow, and financial condition or its ability to meet commitments to its customers.
20
Disputes with labor unions have adversely affected John Deere’s ability to operate its facilities as well as its financial results.
Many of John Deere’s production and maintenance employees are represented by labor unions under various collective bargaining agreements with different expiration dates. The failure of John Deere to successfully renegotiate labor agreements as they expire has from time to time led, and could in the future lead, to work stoppages or other disputes with labor unions. Disruptions to John Deere’s manufacturing and parts-distribution facilities, through various forms of labor disputes, adversely affect the Company. On October 14, 2021, the UAW initiated a labor strike affecting more than 10,000 workers at 14 John Deere facilities across the U.S. The strike ended after a new collective bargaining agreement was approved on November 17, 2021. The UAW strike had an adverse effect on John Deere’s results of operations in the first quarter of fiscal 2022 because of reduced production and shipments. Any strike, work stoppage, or other dispute with a labor union distracts management from operating the business, may displace employees from ordinary job positions to fill in vacant positions, may affect John Deere’s reputation, and could materially adversely affect the Company’s business, results of operations, and financial condition.
RESOURCES RISKS
John Deere’s ability to attract, develop, engage, and retain qualified employees could affect its ability to execute its strategy.
John Deere’s continued success depends, in part, on its ability to identify and attract qualified candidates with the requisite education, background, and experience as well as its ability to develop, engage, and retain qualified employees. Failure to attract, develop, engage, and retain qualified employees, whether as a result of an insufficient number of qualified applicants, difficulty in recruiting new employees, or inadequate resources to train, integrate, and retain qualified employees, could impair John Deere’s ability to execute its business strategy and could adversely affect John Deere’s business. In addition, while John Deere strives to reduce the impact of the departure of employees, John Deere’s operations or ability to execute its business strategy and meet its business objectives may be affected by the loss of employees, particularly when departures involve larger numbers of employees, such as those John Deere could experience if a surge occurs in the number of employees voluntarily leaving their jobs. Higher rates of employee separations may adversely affect John Deere through decreased employee morale, the loss of knowledge of departing employees, and the devotion of resources to recruiting and onboarding new employees.
Security breaches and other disruptions to John Deere’s information technology infrastructure could interfere with John Deere’s operations and could compromise the information of John Deere as well as its customers, suppliers, and/or dealers, exposing John Deere to liability that could cause John Deere’s business and reputation to suffer.
In the ordinary course of business, John Deere relies upon information technology networks and systems, some of which are managed by third parties, to process, transmit, and store electronic information and to manage or support a variety of business processes and activities, including supply chain, manufacturing, distribution, invoicing, and collection of payments from dealers and other purchasers of John Deere equipment and from customers of the financial services segment. John Deere uses information technology systems to record, process, and summarize financial information and results of operations for internal reporting purposes and to comply with regulatory financial reporting, legal, and tax requirements. Additionally, John Deere collects and stores sensitive data, including intellectual property, proprietary business information, and the proprietary business information of John Deere’s customers, suppliers, and dealers, as well as personally identifiable information of John Deere’s customers and employees, in data centers, which are often owned by third parties, and on information technology networks. The secure operation of these information technology networks and the processing and maintenance of this information is critical to John Deere’s business operations and strategy. Despite security measures, including a vulnerability disclosure program, and business continuity plans, John Deere’s information technology networks and infrastructure have been and may be vulnerable to intrusion, damage, disruptions, or shutdowns due to attacks by cyber criminals, employee, supplier, or dealer error or malfeasance, supply chain compromise, disruptions during the process of upgrading or replacing computer software or hardware, power outages, computer viruses, ransomware or other malware, telecommunication or utility failures, terrorist acts, natural disasters, or other events. Although John Deere has not suffered any significant cyber incidents that resulted in material business impact, we have from time to time been the target of malicious cyber threat actors. The occurrence of any significant event could compromise John Deere’s networks, and the information stored there could be accessed, obtained, publicly disclosed, lost, altered, misused, or stolen. Any such access, disclosure, alteration, misuse or other loss of information could result in legal claims or proceedings, government investigations, liability or regulatory penalties, disruption to John Deere’s operations, and damage to John Deere’s reputation, which could adversely affect John Deere’s business, results of operations, and financial condition. In addition, as security threats continue to evolve and increase in frequency and sophistication, John Deere may need to invest additional resources to protect information security.
Security breaches with respect to John Deere’s products could interfere with the business of John Deere, its dealers, and/or customers, exposing John Deere to liability that would cause its business and reputation to suffer.
Some of John Deere’s products include connectivity hardware and software typically used for remote system updates. While John Deere has implemented security measures intended to protect against unauthorized remote access to its products, third party security
21
researchers and malicious threat actors, have reportedly attempted, and may attempt in the future, to gain unauthorized access to such products in order to gain control of the products, change the products’ functionality, user interface, or performance characteristics, interfere with the products’ operations, or gain access to data stored in or generated by the products or to systems to which they connect. In addition, reports of unauthorized access to John Deere’s products, systems, and data, regardless of their veracity, may result in the perception that the products, systems, or data are vulnerable to malicious or unauthorized modifications. Any unauthorized access to or control of John Deere products or systems, any loss of data, or any perception that products, systems, or data are vulnerable could result in legal claims or proceedings against John Deere, government investigations, liability or regulatory penalties, which could adversely affect John Deere’s business, results of operations, and financial condition.
The potential loss of John Deere intellectual property through trade secret theft, infringement of patents, trademark counterfeitings, or other loss of rights to exclusive use of John Deere intellectual property, could have a material adverse effect on the Company. Infringement of the intellectual property rights of others by John Deere could also have a material adverse effect on the Company.
John Deere relies on a combination of patents, trademarks, copyrights, trade secret laws, and confidentiality agreements to protect its intellectual property rights. John Deere heavily relies on certain trademarks that contribute to John Deere’s identity and the recognition of its products and services, including but not limited to the “John Deere” mark, the leaping deer logo, the “Nothing Runs Like a Deere” slogan, the prefix “JD” associated with many products, and the green and yellow color combination. These trademarks, as well as the many patents used in our products, are integral to the John Deere business, and their loss could have a material adverse effect on the Company.
Additionally, third parties may initiate litigation to challenge the validity of John Deere’s patents or allege that John Deere infringes their patents or proprietary rights. John Deere may incur substantial costs if its competitors or other third parties initiate such litigation, or if John Deere initiates any proceedings to protect its proprietary rights. If the outcome of any such litigation is unfavorable to John Deere, our business could be adversely affected.
LEGAL AND COMPLIANCE RISKS
John Deere’s global operations are subject to complex and changing laws and regulations, the violation of which could expose John Deere to potential liabilities, increased costs, and other adverse effects.
John Deere’s global operations are subject to numerous international, federal, state, and local laws and regulations, many of which are complex, frequently changing, and subject to varying interpretations. These laws and regulations cover a broad spectrum of subject areas, including advertising; anti–money laundering; antitrust; consumer finance; environmental, climate-related, health, and safety; foreign exchange controls and cash repatriation restrictions; foreign ownership and investment; import/export and trade; human rights, labor, and employment; product liability; and telematics and data privacy and connectivity. These laws may vary substantially within the different markets in which John Deere operates. Compliance with these laws and regulations is costly and may further increase the cost of conducting John Deere’s global operations. In addition, John Deere must comply with the U.S. Foreign Corrupt Practices Act and all applicable foreign anti-corruption laws, including the U.K. Bribery Act, which generally prohibit companies and their intermediaries from making improper payments or providing anything of value to improperly influence government officials or private individuals for the purpose of obtaining or retaining a business advantage, regardless of whether those practices are culturally expected in a particular jurisdiction. Although John Deere has a compliance program in place designed to reduce the likelihood of potential violations of such laws and regulations, there can be no assurance that John Deere’s employees, contractors, or agents will not violate such laws and regulations or John Deere’s policies and procedures. Violations of these laws and regulations could result in criminal or civil sanctions and have a material adverse effect on John Deere’s reputation, business, results of operations, and financial condition.
Changes to existing laws and regulations or changes to how they are interpreted or the implementation of new, more stringent laws or regulations could adversely affect John Deere’s business by increasing compliance costs, limiting John Deere’s ability to offer a product or service, requiring changes to John Deere’s business practices, or otherwise making John Deere’s products and services less attractive to customers. For example, so-called “right to repair” legislation proposals in certain states and at the federal level in the U.S. could require John Deere to provide access to the software code embedded in its products, which, among other harmful consequences, could result in product safety issues, compromise engine emissions and performance controls, adversely affect the protection of John Deere’s intellectual property rights, and discourage innovation and investments in research and development. Legislative and regulatory changes and other actions that could potentially affect John Deere’s business may be announced with little or no advance notice and John Deere may not be able to effectively mitigate all adverse effects from such measures.
22
John Deere is subject to governmental laws, regulations, and other legal obligations related to privacy and data protection, and any inability or perceived inability of John Deere to address these requirements could adversely affect our business.
The legislative and regulatory framework for privacy and data protection issues worldwide is rapidly evolving and is likely to remain uncertain for the foreseeable future. John Deere collects personal information and other data as integral parts of its business processes and activities. This data is subject to a variety of U.S. and foreign laws and regulations, including oversight by various regulatory and other governmental bodies. Many foreign countries and governmental bodies, including the European Union, China, Canada, and other relevant jurisdictions where John Deere conducts business, have laws and regulations concerning the collection and use of personal information and other data obtained from their residents or by businesses operating within their jurisdictions. The European Union General Data Protection Regulation, the California Consumer Privacy Act, and the China Personal Information Protection Law, among others, impose stringent data protection requirements and provide significant penalties for noncompliance. New privacy laws will continue to come into effect around the world in the future. Any inability or perceived inability to adequately address privacy and data protection concerns, even if unfounded, or comply with applicable laws, regulations, policies, industry standards, contractual obligations, or other legal obligations (including at newly acquired companies) could result in additional cost and liability to the Company or Company officials, damage our reputation, inhibit sales, and otherwise adversely affect our business.
Legal proceedings and disputes in which John Deere is, and may in the future, be involved could harm the Company’s business, financial condition, reputation, and brand.
John Deere is subject to a variety of legal proceedings and legal compliance risks around the world. John Deere faces risks of exposure to various types of claims, lawsuits, and government inquires or investigations in the ordinary course of business. The uncertainty associated with substantial unresolved claims and lawsuits may harm John Deere’s business, financial condition, reputation, and brand. The defense of lawsuits and government inquiries or investigations has resulted and may result in the expenditures of significant financial resources and the diversion of management’s time and attention away from business operations. Such legal proceedings may also affect our assessment and estimates of loss contingencies recorded as a reserve and require us to make payments exceeding our reserves. In addition to the ordinary course of business proceedings, John Deere is currently subject to a series of antitrust class action lawsuits alleging that it is unlawfully monopolizing the market for repair services for its agricultural equipment. If these lawsuits result in adverse findings for John Deere, we could be exposed to damages and may be required to implement actions impacting our business model.
GENERAL RISKS
John Deere’s reputation and brand could be damaged by negative publicity.
John Deere’s brand has worldwide recognition and significantly contributes to the success of its business. John Deere’s reputation is critical to growing its customer base. John Deere’s brand depends on the ability to maintain a positive customer perception of the business, including the core values of integrity, quality, innovation, and commitment. Negative claims or publicity involving John Deere, its products or services, its culture and values, customer data, or any of its key employees or suppliers, could damage John Deere’s reputation and brand image, regardless of whether such claims are accurate. Damage to John Deere’s reputation could adversely impact the ability to attract new and maintain existing customers, employees, dealers, and business relationships.
Additionally, negative or inaccurate postings, articles, or comments on social media and the internet about John Deere could generate negative publicity that could damage the reputation of the brand or John Deere.
Further, adverse publicity about regulatory or legal action against John Deere, or by John Deere, could also damage the reputation and brand image, undermine customer confidence, and reduce long-term demand for equipment, even if the regulatory or legal action is unfounded or not material to John Deere’s operations. If the reputation, culture or image of John Deere’s brands are damaged, or John Deere receives negative publicity, then the Company’s sales, financial condition, and results of operations could be materially and adversely affected.
Unexpected events have and may in the future increase our cost of doing business or disrupt our operations.
The occurrence of one or more unexpected events, including war, acts of terrorism, epidemics and pandemics (such as the COVID pandemic), civil unrest, fires, tornadoes, tsunamis, hurricanes, earthquakes, floods, and other forms of severe weather in the United States or in other countries in which John Deere operates, or in which John Deere suppliers are located, have and could in the future adversely affect the Company’s operations and financial performance. Such events have and could cause complete or partial closure of one or more of John Deere manufacturing facilities or distribution centers, temporary or long-term disruption in the supply of component products from some local and international suppliers, and disruption and delay in the transport of products to dealers, end-users, and distribution centers. Existing insurance coverage may not provide protection from all the costs that may arise from such events.
23
The potential physical impacts of climate change on John Deere’s facilities, suppliers, and customers, and therefore on John Deere’s operations, are highly uncertain and will be particular to the circumstances developing in various geographic regions. These potential physical effects may adversely affect the demand for John Deere’s products and the cost, production, sales, and financial performance of John Deere’s operations.
ITEM 1B. | UNRESOLVED STAFF COMMENTS. |
None.
ITEM 2. | PROPERTIES. |
See “Manufacturing” in Item 1.
The equipment operations own or lease 11 facilities comprised of two locations supporting centralized parts distribution and nine regional parts depots and distribution centers throughout the U.S. and Canada. Outside the U.S. and Canada, the equipment operations also own or lease and occupy 12 centralized parts distribution centers in Brazil, Germany, India, and Russia and regional parts depots and distribution centers in Argentina, Australia, China, Mexico, South Africa, Sweden, and the United Kingdom. John Deere also owns or leases eight facilities for the manufacture and distribution of other brands of replacement parts.
The Company owns or leases 47 administrative offices and research facilities globally as well as many other smaller, miscellaneous facilities.
Overall, John Deere owns approximately 68.1 million square feet of facilities and leases approximately 12.8 million additional square feet in various locations. These properties are adequate and suitable for John Deere’s business as presently conducted and are well maintained.
ITEM 3. | LEGAL PROCEEDINGS. |
The Company is subject to various unresolved legal actions that arise in the normal course of its business, the most prevalent of which relate to product liability (including asbestos related liability), retail credit, employment, patent, trademark, and antitrust matters. The Company believes the reasonably possible range of losses for these unresolved legal actions would not have a material effect on its financial statements.
ITEM 4. | MINE SAFETY DISCLOSURES. |
Not applicable.
PART II
ITEM 5. | MARKET FOR REGISTRANT’S COMMON EQUITY, RELATED STOCKHOLDER MATTERS AND ISSUER PURCHASES OF EQUITY SECURITIES. |
| (a) | The Company’s common stock is listed on the New York Stock Exchange under the symbol “DE.” The Company has a history of paying quarterly cash dividends. While the Company currently expects a cash dividend to be paid in the future, future dividend payments will depend on the Company’s earnings, capital requirements, financial condition, and other factors considered relevant by the Company’s Board of Directors. See the information concerning the number of stockholders in Note 21 to the Consolidated Financial Statements. |
| (b) | Not applicable. |
24
| (c) | The Company’s purchases of its common stock during the fourth quarter of 2022 were as follows: |
ISSUER PURCHASES OF EQUITY SECURITIES
|
| |
| | |
| |
| Maximum |
|
| | | | | | | Total Number of | | Number of Shares |
|
| | | | | | | Shares Purchased | | that May Yet Be |
|
| | Total Number of | | | | | as Part of Publicly | | Purchased under |
|
| | Shares | | Average Price | | Announced Plans | | the Plans or |
| |
| | Purchased | | Paid Per | | or Programs (1) | | Programs (1) (2) |
| |
Period | | (thousands) | | Share | | (thousands) | | (millions) |
| |
Aug 1 to Aug 28 |
| 996 | | $ | 354.90 |
| 996 |
| 7.5 | |
Aug 29 to Sept 25 |
| 888 | | | 366.56 |
| 888 |
| 6.7 | |
Sept 26 to Oct 30 |
| 1,242 | |
| 355.43 |
| 1,242 |
| 5.6 | |
Total |
| 3,126 | | | |
| 3,126 | | | |
| (1) | The Company announced a share repurchase plan in December 2019 to purchase up to $8,000 million of shares of the Company’s common stock. The maximum number of shares that may yet be purchased under this plan was based on the closing share price as at end of the fourth quarter of $396.85 per share. At the end of the fourth quarter of 2022, $2,228 million of common stock remained to be purchased under this plan. |
| (2) | In December 2022, the Board of Directors authorized the repurchase of up to $18,000 million of additional common stock. This additional repurchase amount may be repurchased after October 30, 2022 and is not included in the amounts above (see Note 28). |
ITEM 6. | [RESERVED] |
ITEM 7. | MANAGEMENT’S DISCUSSION AND ANALYSIS OF FINANCIAL CONDITION AND RESULTS OF OPERATIONS. |
See the information under the caption “Management’s Discussion and Analysis.”
ITEM 7A. | QUANTITATIVE AND QUALITATIVE DISCLOSURES ABOUT MARKET RISK. |
The Company is exposed to a variety of market risks, including interest rates and currency exchange rates. The Company attempts to actively manage these risks. See the information under “Management’s Discussion and Analysis,” under “Financial Instrument Market Risk Information” and in Note 26 to the Consolidated Financial Statements.
ITEM 8. | FINANCIAL STATEMENTS AND SUPPLEMENTARY DATA. |
See the Consolidated Financial Statements and notes thereto and supplementary data.
ITEM 9. | CHANGES IN AND DISAGREEMENTS WITH ACCOUNTANTS ON ACCOUNTING AND FINANCIAL DISCLOSURE. |
Not applicable.
ITEM 9A. | CONTROLS AND PROCEDURES. |
Disclosure Controls and Procedures
The Company’s principal executive officer and its principal financial officer have concluded that the Company’s disclosure controls and procedures (as defined in Rules 13a-15(e) and 15d-15(e) of the Securities Exchange Act of 1934, as amended (the Exchange Act)) were effective as of October 30, 2022, based on the evaluation of these controls and procedures required by Rule 13a-15(b) or 15d-15(b) of the Exchange Act.
Management’s Report on Internal Control Over Financial Reporting
The Company’s management is responsible for establishing and maintaining adequate internal control over financial reporting. The Company’s internal control system was designed to provide reasonable assurance regarding the preparation and fair presentation of published financial statements in accordance with generally accepted accounting principles.
All internal control systems, no matter how well designed, have inherent limitations. Therefore, even those systems determined to be effective can provide only reasonable assurance with respect to financial statement preparation and presentation in accordance with generally accepted accounting principles.
25
Management assessed the effectiveness of the Company’s internal control over financial reporting as of October 30, 2022, using the criteria set forth in Internal Control - Integrated Framework (2013) issued by the Committee of Sponsoring Organizations of the Treadway Commission. Based on that assessment, management believes that, as of October 30, 2022, the Company’s internal control over financial reporting was effective.
The Company’s independent registered public accounting firm has issued an audit report on the effectiveness of the Company’s internal control over financial reporting. That report is included herein.
Changes in Internal Control Over Financial Reporting
During the fourth quarter, there were no changes that have materially affected or are reasonably likely to materially affect the Company’s internal control over financial reporting.
ITEM 9B. | OTHER INFORMATION. |
Disclosure Pursuant to Section 13(r) of the Exchange Act.
Under Section 13(r) of the Exchange Act, the Company is required to disclose in its periodic reports if it or any of its affiliates knowingly conducted transactions or dealing with entities or individuals designated pursuant to certain executive orders issued by the U.S. government. On March 2, 2021, the U.S. Secretary of State designated the Russian Federal Security Service (FSB) as a blocked party under Executive Order 13382. On that same day, the U.S. Department of the Treasury’s Office of Foreign Assets Control (OFAC) updated General License No. 1B to authorize certain transactions and activities with the FSB related to the importation, distribution, or use of certain information technology products in the Russian Federation. In the ordinary course of business, during the six-month period ended May 1, 2022, certain of the Company’s subsidiaries requested and/or received legally required administrative notifications with the FSB in connection with the importation and/or use of certain of the Company’s products in the Russian Federation, as authorized by General License No. 1B. Neither the Company nor its subsidiaries made any payments, nor did they receive gross revenues or net profits, in connection with these activities. The Company expects that in the future certain of its subsidiaries may continue to engage with the FSB in activities necessary to conduct business in the Russian Federation in accordance with applicable U.S. laws and regulations so long as it remains lawful to do so. However, no such activities have been conducted after May 1, 2022.
ITEM 9C. | DISCLOSURE REGARDING FOREIGN JURISDICTIONS THAT PREVENT INSPECTIONS. |
Not applicable.
PART III
ITEM 10. | DIRECTORS, EXECUTIVE OFFICERS AND CORPORATE GOVERNANCE. |
The information regarding directors required by this Item 10 will be set forth in the definitive proxy statement for the Company’s 2023 annual meeting of stockholders (proxy statement) to be filed with the Commission in advance of such meeting. Information regarding executive officers is presented in Item 1 of this report under the caption "Information about our Executive Officers."
The Company has adopted a code of ethics that applies to its executives, including its principal executive officer, principal financial officer, and principal accounting officer. This code of ethics and the Company's corporate governance policies are posted on the Company's website at http://www.deere.com/governance. The Company intends to satisfy disclosure requirements regarding amendments to or waivers from its code of ethics by posting such information on this website. The charters of the Audit Review, Corporate Governance, Compensation, and Finance committees of the Company's Board of Directors are available on the Company's website as well. This information is also available in print free of charge to any person who requests it.
ITEM 11. | EXECUTIVE COMPENSATION. |
The information required by this Item 11 will be set forth in the proxy statement to be filed with the Commission.
ITEM 12. | SECURITY OWNERSHIP OF CERTAIN BENEFICIAL OWNERS AND MANAGEMENT AND RELATED STOCKHOLDER MATTERS. |
The information required by this Item 12 will be set forth in the proxy statement to be filed with the Commission.
ITEM 13. | CERTAIN RELATIONSHIPS AND RELATED TRANSACTIONS, AND DIRECTOR INDEPENDENCE. |
The information required by this Item 13 will be set forth in the proxy statement to be filed with the Commission.
ITEM 14. | PRINCIPAL ACCOUNTANT FEES AND SERVICES. |
Information required by this Item 14, including aggregate fees billed to us by the Company’s principal accountant, Deloitte & Touche LLP (PCAOB ID No. 34), will be set forth in the proxy statement to be filed with the Commission.
26
PART IV
ITEM 15. | EXHIBITS AND FINANCIAL STATEMENT SCHEDULES. |
| | Page |
(1) | Financial Statements | |
| | |
| 43 | |
| | |
| 44 | |
| | |
| Consolidated Balance Sheets as of October 30, 2022 and October 31, 2021 | 45 |
| | |
| 46 | |
| | |
| 47 | |
| | |
| 48 | |
| | |
(2) | Exhibits | |
| | |
| See the “Index to Exhibits” on pages 86 – 89 of this report | |
| | |
| Certain instruments relating to long-term borrowings constituting less than 10 percent of registrant’s total assets are not filed as exhibits herewith pursuant to Item 601(b)4(iii)(A) of Regulation S-K. Registrant agrees to file copies of such instruments upon request of the Commission. | |
| | |
Financial Statement Schedules Omitted | | |
| | |
| The following schedules for the Company and consolidated subsidiaries are omitted because of the absence of the conditions under which they are required: I, II, III, IV, and V. | |
ITEM 16.FORM 10-K SUMMARY.
None.
27
MANAGEMENT’S DISCUSSION AND ANALYSIS
The following Management's Discussion and Analysis of Financial Condition and Results of Operations (MD&A) is intended to promote understanding of the financial condition and results of operations. The MD&A is provided as a supplement to, and should be read in conjunction with, the consolidated financial statements and the accompanying Notes to Consolidated Financial Statements (Part II, Item 8 of this Form 10-K).
RESULTS OF OPERATIONS FOR THE YEARS ENDED
OCTOBER 30, 2022, OCTOBER 31, 2021, AND NOVEMBER 1, 2020
OVERVIEW
Organization
The company generates net sales from the sale of equipment to John Deere dealers and distributors. The company manufactures and distributes a full line of agricultural equipment; a variety of commercial and consumer equipment; and a broad range of equipment for construction, roadbuilding, and forestry. These operations (collectively known as the “equipment operations”) are managed through the production and precision agriculture, small agriculture and turf, and construction and forestry operating segments. The company’s financial services segment provides credit services, which finance sales and leases of equipment by John Deere dealers. In addition, the financial services segment provides wholesale financing to dealers of the foregoing equipment, finances retail revolving charge accounts, and offers extended equipment warranties.
Smart Industrial Operating Model and Leap Ambitions
The company’s Smart Industrial operating model is focused on making significant investments, strengthening the company’s capabilities in digital, automation, autonomy, and alternative propulsion technologies. These technologies are intended to increase worksite efficiency, improve yields, lower input costs, and ease labor constraints. The company’s Leap Ambitions are goals designed to boost economic value and sustainability for the company’s customers. The company anticipates opportunities in this area, as the company and its customers have a vested interest in sustainable practices.
Trends and Economic Conditions
Industry Trends for Fiscal Year 2023 – Industry sales of large agricultural machinery in the U.S. and Canada for 2023 are forecasted to increase 5 to 10 percent compared to 2022. Industry sales of small agricultural and turf equipment in the U.S. and Canada are expected to be flat to down 5 percent in 2023. Industry sales of agricultural machinery in Europe are forecasted to be flat to up 5 percent, while South American industry sales of tractors and combines are expected to be flat to up 5 percent in 2023. Asia industry sales are forecasted to be down moderately in 2023 as the demand in India, the world’s largest tractor market by unit, stabilizes. On an industry basis, North American construction equipment and compact construction equipment sales are both expected to be flat to up 5 percent in 2023. Global forestry and global roadbuilding industry sales are each expected to be flat.
Company Trends – Customers’ demand for integration of technology into equipment is a market trend underlying the company’s Smart Industrial operating model and Leap Ambitions framework. Customers have sought to improve profitability, productivity, and sustainability through technology. The company’s approach to technology involves hardware and software, guidance, connectivity and digital solutions, automation and machine intelligence, autonomy, and electrification. This technology is incorporated into products within each of the company’s operating segments.
Customers continue to adopt technology integrated in the John Deere portfolio of “smart” machines, systems, and solutions. The company expects this trend to persist for the foreseeable future.
Demand for the company’s equipment remains strong, as order books are full through a majority of 2023. Agricultural fundamentals are expected to remain solid into 2023, and retail demand will comprise most of 2023 sales. The company expects dealer stock inventory replenishment to occur in 2024. The North American retail customer fleet age remains above average, and dealer inventories are historically low due to the manufacturing and supply chain constraints over the past few years. Crop prices remain favorable to our customers in part due to low stock-to-use ratios for key grains and lower exports from the Black Sea region. The company expects to sell more large agricultural equipment in 2023 than 2022 in North America, Europe, and South America. Demand for small agricultural equipment remains stable, while turf and utility equipment product sales are expected to be lower due to the overall U.S. economic conditions. Construction equipment markets are forecasted to be steady. Rental fleets replenishment, the energy industry, and U.S. infrastructure spend will offset moderation in residential home construction. Roadbuilding demand remains strongest in the U.S., largely offset by softening demand in Europe and sluggish demand in Asia. Net income for the company’s financial services operations is expected to be slightly higher than fiscal year 2022 due to a higher average portfolio, partially offset by less-favorable financing spreads and lower gains on operating leases. Excluding the portfolio in Russia, a higher provision for credit losses is forecasted for 2023.
Additional Trends – The company experienced supply chain disruptions and inflationary pressures in 2022. While these are two distinct issues and discussed separately below, their impact may be intertwined.
28
Supply chain disruptions impacted many aspects of the business, including parts availability, increased production costs, and more partially completed machines in inventory. Past due deliveries from suppliers were at elevated levels. Late part deliveries incurred expedited freight charges and rework of partially built machines, contributing to production inefficiencies and higher overhead costs. The company implemented the following mitigation efforts to minimize the impact of supply chain disruptions on its ability to meet customer demand:
| • | Worked with the supply base to obtain allocations and improve on-time deliveries of parts. |
| • | Multi-sourced some parts and materials. |
| • | Provided resources to suppliers to address constraints. |
| • | Entered into long-term contracts for some critical components. |
| • | Utilized alternative freight carriers to expedite delivery. |
While supply chain disruptions are expected to persist into 2023, the company is working diligently to secure the parts and components that customers need to deliver essential food and infrastructure more profitably and sustainably.
Inflation was a pervasive feature throughout 2022, increasing the cost of material, freight, energy, salaries, and wages. Higher costs due to general business inflation were offset by price realization, which mitigated the impact of inflation on the company’s operating results. The company expects inflation to continue in 2023 resulting in higher costs. If customers are unwilling to accept increases in cost of John Deere products, or the company is otherwise unable to offset increases in production costs, inflation could have an adverse effect on the company’s operations and financial condition.
Interest rates rose in 2022 and further central bank policy rate increases are projected in 2023. Most retail customer receivables are fixed rate, while wholesale financing receivables are floating rate. The company has both fixed and floating rate borrowings. The company manages the risk of interest rate fluctuations through balancing the types and amounts of its funding sources to its financing receivable and equipment on operating lease portfolios. Accordingly, the company enters into interest rate swap agreements to manage its interest rate exposure. Rising interest rates have historically impacted the company’s borrowings sooner than the benefit is realized from the financing receivable and equipment on operating lease portfolios. As a result, the company’s financial services operations experienced spread compression in 2022. If interest rates continue to rise, the company expects to continue experiencing spread compression in 2023.
Supply chain disruptions, inflationary pressures, and rising interest rates are driven by factors outside of the company’s control, and as a result, the company cannot reasonably foresee when these conditions will subside.
Items of Concern and Uncertainties – Other items of concern include global and regional political conditions, economic and trade policies, imposition of new or retaliatory tariffs against
certain countries or covering certain products, the ongoing effects of the pandemic, capital market disruptions, changes in demand and pricing for new and used equipment, significant fluctuations in foreign currency exchange rates, volatility in the prices of many commodities, and potential recession. These items could impact the company’s results. The company is making investments in technology and in strengthening its capabilities in digital, automation, autonomy, and electrification. As with most technology investments, marketplace adoption and monetization of these features holds an elevated level of uncertainty.
2022 COMPARED WITH 2021
CONSOLIDATED RESULTS
Deere & Company | | | | | | | |
(In millions of dollars, except per share amounts) | | 2022 | | 2021 | | ||
Net sales and revenues | | $ | 52,577 | | $ | 44,024 | |
Net income attributable to Deere & Company | | | 7,131 | | | 5,963 | |
Diluted earnings per share | | | 23.28 | | | 18.99 | |
Net income in 2022 and 2021 was impacted by special items. See Notes 3 and 4 for additional details. The discussion on net sales and operating profit is included in the Business Segment Results below.
An explanation of the cost of sales to net sales ratio and other significant statement of consolidated income changes follows:
Deere & Company | | | | | | | | | |
(In millions of dollars) | | 2022 | | 2021 | | % Change | | ||
Cost of sales to net sales | | | 73.7% | | | 73.3% | | | |
| | | | | | | | | |
Other income | | $ | 1,295 | | $ | 991 | | +31 | |
Research and development expenses | | | 1,912 | | | 1,587 | | +20 | |
Selling, administrative and general expenses | | | 3,863 | | | 3,383 | | +14 | |
Interest expense | | | 1,062 | | | 993 | | +7 | |
Other operating expenses | | | 1,275 | | | 1,343 | | -5 | |
Provision for income taxes | | | 2,007 | | | 1,658 | | +21 | |
The cost of sales to net sales ratio increased compared to 2021 mainly due to higher production costs partially offset by price realization. Other income increased due to a non-cash gain on the remeasurement of the previously held equity investment in the Deere-Hitachi joint venture. Research and development expenses were higher in 2022 largely due to continued focus on developing and incorporating technology solutions. Selling, administrative and general expenses increased mostly due to higher provision for credit losses, including higher reserves due to the economic uncertainty in Russia (see Note 4), as well as a higher merit pay increase due to inflationary conditions. Interest expense increased in 2022 due to higher average borrowings and higher average borrowing rates. Other operating expenses were lower compared to 2021 largely due to reduced depreciation of equipment on operating leases and lower retirement benefit costs. The provision for income taxes increased consistent with higher pretax income.
29
BUSINESS SEGMENT RESULTS
The following discussion relates to operating results by reportable segment. Operating profit is income before corporate expenses, certain external interest expense, certain foreign exchange gains or losses, and income taxes.
For the equipment operations, higher production costs were mostly due to elevated material and inbound freight expenses. Overhead spend was also higher for the year as factories continued to experience some production inefficiencies due to supply chain challenges and clearing partially completed machines in inventory.
Production and Precision Agriculture Operations
(In millions of dollars) | | 2022 | | 2021 | | % Change | | ||
Net sales | | $ | 22,002 | | $ | 16,509 | | +33 | |
Operating profit | | | 4,386 | | | 3,334 | | +32 | |
Operating margin | | | 19.9% | | | 20.2% | | | |
Price realization | | | | | | | | +14 | |
Currency translation | | | | | | | | -2 | |
Segment sales increased due to higher shipment volumes and price realization. Operating profit benefitted from price realization and higher shipment volumes / sales mix. These items were partially offset by higher production costs, higher research and development expenses and selling, administrative and general expenses, the impact of higher reserves and impairments related to events in Russia / Ukraine, and the UAW contract ratification bonus. The prior year was also impacted by a favorable indirect tax ruling in Brazil (see Note 4).
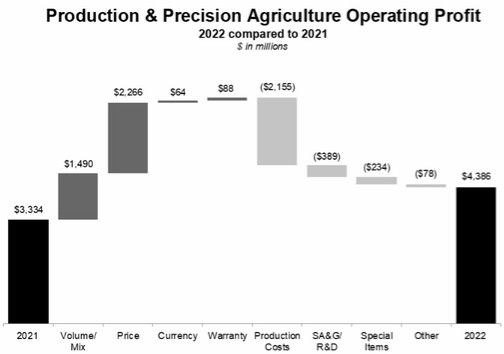
Small Agriculture and Turf Operations
(In millions of dollars) | | 2022 | | 2021 | | % Change | | ||
Net sales | | $ | 13,381 | | $ | 11,860 | | +13 | |
Operating profit | | | 1,949 | | | 2,045 | | -5 | |
Operating margin | | | 14.6% | | | 17.2% | | | |
Price realization | | | | | | | | +9 | |
Currency translation | | | | | | | | -4 | |
Segment sales were higher in 2022 due to price realization and higher shipment volumes, partially offset by the negative effects of currency translation. Operating profit decreased as a result of higher production costs, higher selling, administrative and general expenses and research and development expenses, and the unfavorable effects of foreign exchange, partially offset by price realization and improved shipment volumes. Results for the current year were affected by the impact of higher reserves and impairments related to events in Russia / Ukraine and the UAW contract ratification bonus, while results of the prior year were positively impacted by a gain on the sale of a factory in China (see Note 4).
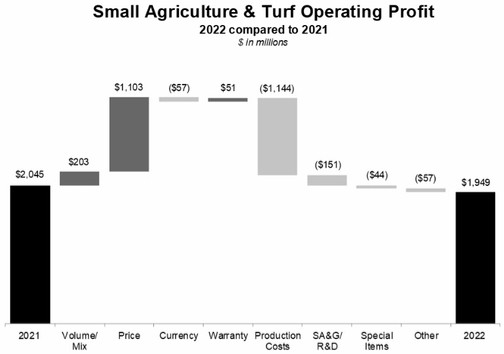
30
Construction and Forestry Operations
(In millions of dollars) | | 2022 | | 2021 | | % Change | | ||
Net sales | | $ | 12,534 | | $ | 11,368 | | +10 | |
Operating profit | | | 2,014 | | | 1,489 | | +35 | |
Operating margin | | | 16.1% | | | 13.1% | | | |
Price realization | | | | | | | | +10 | |
Currency translation | | | | | | | | -3 | |
Segment sales increased in 2022 due to price realization and higher shipment volumes, partially offset by the negative effects of currency translation. Operating profit increased mainly due to price realization, partially offset by higher production costs. The current year results included a non-cash gain on the remeasurement of the previously held equity investment in the Deere-Hitachi joint venture, partially offset by the impact of higher reserves and impairments related to events in Russia / Ukraine (see Note 4).
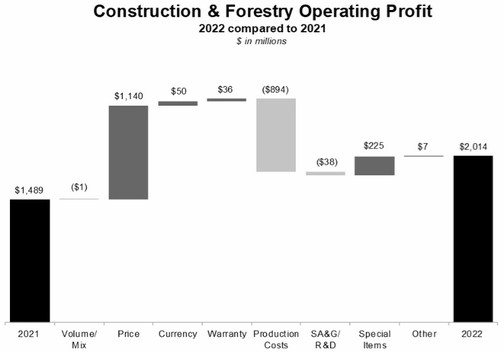
Financial Services Operations
(In millions of dollars) | | 2022 | | 2021 | | % Change | | ||
Revenue (including intercompany) | | $ | 4,085 | | $ | 3,794 | | +8 | |
Interest expense | | | 799 | | | 687 | | +16 | |
Net income | | | 880 | | | 881 | | | |
The average balance of receivables and leases financed was 8 percent higher in 2022, consistent with revenue growth. Interest expense increased in 2022 as a result of higher average borrowings and higher average borrowing rates. Net income in 2022 was roughly the same mainly due to income earned on a higher average portfolio, partially offset by less favorable financing spreads and unfavorable discrete income tax adjustments. The provision for credit losses increased, primarily due to economic uncertainty in Russia. The financial services operations received an intercompany benefit from the equipment operations, as the equipment
operations guarantees financial services’ investments in certain international markets, including Russia (see Note 4).
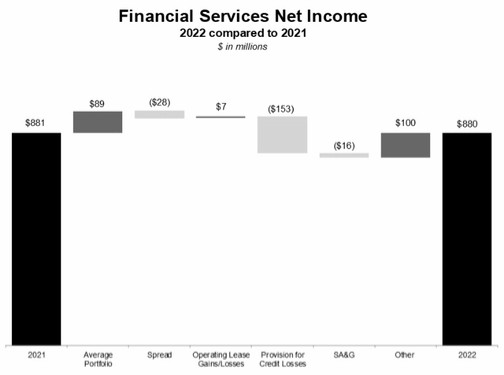
2021 COMPARED WITH 2020
The comparison of the 2021 results with 2020 can be found under the heading “2021 Compared With 2020” in the “Management’s Discussion and Analysis” section of the company’s 2021 Form 10-K.
CAPITAL RESOURCES AND LIQUIDITY
SOURCES OF LIQUIDITY, KEY METRICS, AND BALANCE SHEET DATA
The company has access to most global markets at a reasonable cost. Sources of liquidity for the company include cash and cash equivalents, marketable securities, funds from operations, the issuance of commercial paper and term debt, the securitization of retail notes (both public and private markets), and bank lines of credit. The company closely monitors its liquidity sources against the cash requirements and expects to have sufficient sources of global funding and liquidity to meet its funding needs in the short term (next 12 months) and long term (beyond 12 months). The company operates in multiple industries, which have different funding requirements. The production and precision agriculture, small agriculture and turf, and construction and forestry segments are capital intensive and are typically subject to seasonal variations in financing requirements for inventories and certain receivables from dealers. However, the patterns of seasonality in inventory have been affected by increases in production rates and supply chain disruptions experienced during fiscal year 2022, which continue to impact inventory levels. As a result, the company may not experience typical seasonal reduction in inventory during 2023. The financial services operations rely on their ability to raise substantial amounts of funds to finance their receivable and lease portfolios.
31
Key metrics are provided in the following table, in millions of dollars:
| | 2022 | | 2021 | | 2020 | | |||
Cash, cash equivalents, and marketable securities | | $ | 5,508 | | $ | 8,745 | | $ | 7,707 | |
| | | | | | | | | | |
Trade accounts and notes receivable – net | | | 6,410 | | | 4,208 | | | 4,171 | |
Ratio to prior 12 month’s net sales | | | 13% | | | 11% | | | 13% | |
| | | | | | | | | | |
Inventories | | | 8,495 | | | 6,781 | | | 4,999 | |
Ratio to prior 12 month’s cost of sales | | | 24% | | | 23% | | | 21% | |
| | | | | | | | | | |
Unused credit lines | | | 3,284 | | | 5,770 | | | 6,801 | |
| | | | | | | | | | |
Financial Services: | | | | | | | | | | |
Ratio of interest-bearing debt to stockholder’s equity | | | 8.5 to 1 | | | 7.8 to 1 | | | 7.8 to 1 | |
Due to the uncertainties around the COVID-19 pandemic, the company temporarily increased its cash, cash equivalents, and marketable securities balance beginning in March 2020. The cash balance decrease in 2022 was driven by working capital requirements. The reduction in unused credit lines in 2022 compared to both prior periods relates to an increase in commercial paper outstanding to fund growth in the receivable portfolio. The company forecasts higher operating cash flows in 2023 as identified previously in Trends and Economic Conditions.
Cash Flows
| | 2022 | | 2021 | 2020 | |||||
Net cash provided by operating activities | | $ | 4,699 | | $ | 7,726 | $ | 7,483 | ||
Net cash used for investing activities | | | (8,485) | | | (5,750) | | (3,319) | ||
Net cash provided by (used for) financing activities | | | 826 | | | (1,078) | | (980) | ||
Effect of exchange rate changes on cash, cash equivalents, and restricted cash | | | (224) | | | 55 | | 32 | ||
Net increase (decrease) in cash, cash equivalents, and restricted cash | | $ | (3,184) | | $ | 953 | $ | 3,216 | ||
Positive cash flows from consolidated operating activities in 2022 were $4,699 million. This resulted from net income adjusted for non-cash provisions, partially offset by an increase in receivables related to sales, an increase in inventories, and a $1,000 million voluntary contribution to a U.S. other postretirement benefit (OPEB) plan. Cash outflows from investing activities were $8,485 million in 2022. The primary drivers were growth in the retail customer receivable and lease portfolios; purchases of property and equipment; a change in collateral on derivatives – net; and acquisitions of businesses, net of cash acquired. Cash inflows from financing activities were $826 million in 2022, due to an increase in borrowings, partially offset by repurchases of common stock and dividends paid. Cash, cash equivalents, and restricted cash decreased $3,184 million during 2022.
Cash and Marketable Securities Held by Foreign Subsidiaries – The amount of the total cash and cash equivalents and marketable securities held by foreign subsidiaries was $3,379 million at
October 30, 2022 and $5,817 million at October 31, 2021. During 2022, the company’s foreign subsidiaries returned $5,643 million of cash and cash equivalents to the U.S. Distributions of profits from foreign subsidiaries are not expected to cause a significant incremental U.S. tax impact. However, these distributions may be subject to withholding taxes outside the U.S.
Trade Accounts and Notes Receivable – Trade accounts and notes receivable arise from sales of goods to customers. Trade receivables increased by $2,202 million in 2022. The collection period for trade receivables averages less than 12 months. The percentage of trade receivables outstanding for a period exceeding 12 months was 1 percent at each of October 30, 2022 and October 31, 2021.
Financing Receivables and Equipment on Operating Leases – Financing receivables and leases consist of retail notes originated in connection with financing of new and used equipment, operating leases, revolving charge accounts, sales-type and direct financing leases, and wholesale notes. Financing receivables and equipment on operating leases increased by $3,747 million in 2022, compared with 2021. Total acquisition volumes of financing receivables and equipment on operating leases were 7 percent higher in 2022 compared with the same period last year, as volumes of revolving charge accounts, operating leases, wholesale notes, and retail notes increased primarily due to higher sales by the company, while volumes of finance leases decreased.
Inventories – Inventories increased by $1,714 million in 2022 due to higher production schedules and supply chain disruptions. A majority of these inventories are valued on the last-in, first-out (LIFO) method. The ratios of inventories on a first-in, first-out (FIFO) basis (see Note 13), which approximates current cost, to fiscal year cost of sales were 31 percent at each of October 30, 2022 and October 31, 2021.
Property and Equipment – Property and equipment cash expenditures in 2022 were $1,134 million, compared with $848 million in 2021.
Borrowings – Total external borrowings increased by $3,487 million in 2022, corresponding with the level of the receivable and the lease portfolio, as well as the level of cash and cash equivalents.
John Deere Capital Corporation (Capital Corporation), a U.S. financial services subsidiary, has a revolving warehouse facility to utilize bank conduit facilities to securitize retail notes (see Note 12). At October 30, 2022, $948 million of short-term securitization borrowings were outstanding under the facility. At the end of the contractual revolving period, unless the banks and Capital Corporation agree to renew, Capital Corporation would liquidate the secured borrowings over time as payments on the retail notes are collected. The agreement was renewed in November 2022 with an expiration in November 2023 and a capacity of $1,500 million.
During 2022, the company issued $4,085 million and retired $2,965 million of retail note securitization borrowings, which are presented in “Increase (decrease) in total short-term borrowings” on the statements of consolidated cash flows.
32
Lines of Credit – The company also has access to bank lines of credit with various banks throughout the world. Worldwide lines of credit totaled $8,402 million at October 30, 2022, $3,284 million of which were unused. For the purpose of computing the unused credit lines, commercial paper and short-term bank borrowings, excluding secured borrowings and the current portion of long-term borrowings, were considered to constitute utilization. See Note 17 for more information.
Debt Ratings – To access public debt capital markets, the company relies on credit rating agencies to assign short-term and long-term credit ratings to the company’s securities as an indicator of credit quality for fixed income investors. A security rating is not a recommendation by the rating agency to buy, sell, or hold company securities. A credit rating agency may change or withdraw company ratings based on its assessment of the company’s current and future ability to meet interest and principal repayment obligations. Each agency’s rating should be evaluated independently of any other rating. Lower credit ratings generally result in higher borrowing costs, including costs of derivative transactions, and reduced access to debt capital markets.
The senior long-term and short-term debt ratings and outlook currently assigned to unsecured company securities by the rating agencies engaged by the company are as follows:
|
| Senior |
| |
|
|
| | Long-Term | | Short-Term | | Outlook |
| | | | | | |
| | | | | | |
Fitch Ratings | | A | | F1 | | Stable |
Moody’s Investors Service, Inc. |
| A2 |
| Prime-1 |
| Positive |
Standard & Poor’s |
| A |
| A-1 |
| Stable |
CONTRACTUAL OBLIGATIONS AND CASH REQUIREMENTS
The company’s material cash requirements include the following:
Borrowings – As of October 30, 2022, the company had $15,274 million of payments due on borrowings and securitization borrowings in the next year, along with interest payments of $1,460 million. The securitization borrowing payments are based on the expected liquidation of the retail notes. See Notes 12 and 19 for additional borrowing details. These payments will likely be replaced with new borrowings to finance the receivable and lease portfolio, which is expected to grow in 2023.
Purchase Obligations – As of October 30, 2022, the company’s outstanding purchase obligations were $4,701 million, with $4,121 million payable within one year. These purchase obligations are noncancelable.
Other Cash Requirements – In addition to its contractual obligations, the company’s quarterly cash dividend is $1.20 per share, subject to change at the discretion of the company’s Board of Directors. Total company pension and OPEB contributions in 2023 are expected to be approximately $200 million. The company also plans capital expenditures of $1,400 million in 2023. The company will consider share repurchases as a means of deploying excess cash to shareholders once the previously mentioned requirements are met.
CRITICAL ACCOUNTING ESTIMATES
The preparation of the company’s consolidated financial statements in conformity with accounting principles generally accepted in the U.S. requires management to make estimates and assumptions that affect reported amounts of assets, liabilities, revenues, and expenses. Changes in these estimates and assumptions could have a significant effect on the financial statements. The accounting policies below are those management believes are the most critical to the preparation of the company’s financial statements and require the most difficult, subjective, or complex judgments. The company’s other accounting policies are described in the Notes to the Consolidated Financial Statements.
Sales Incentives
The company provides sales incentives to dealers. At the time a sale to a dealer is recognized, the company records an estimate of the future sales incentive costs as a reduction to the sales price. These incentives may be based on a dealer’s purchase volume, or on retail sales incentive programs for allowances and financing programs that will be due when the dealer sells the equipment to a retail customer. The estimated cost of these programs is based on historical data, announced and expected incentive programs, field inventory levels, and forecasted sales volumes. The final cost of these programs is determined at the end of the measurement period for volume-based incentives or when the dealer sells the equipment to the retail customer. This is due to numerous programs available at any particular time and new programs that may be announced after the company records the equipment sale. Changes in the mix and types of programs affect these estimates, which are reviewed quarterly. Actual cost differences from the original cost estimate are recognized in “Net sales.”
The sales incentive accruals at October 30, 2022, October 31, 2021, and November 1, 2020 were $2,364 million, $1,680 million, and $1,718 million, respectively. The total accruals recorded were $1,320 million, $880 million, and $1,109 million in trade accounts and notes receivable – net, and $1,044 million, $800 million, and $609 million in accounts payable and accrued expenses at October 30, 2022, October 31, 2021, and November 1, 2020, respectively. The accruals recorded against receivables relate to programs where the company has the contractual right and the intent to offset against existing receivables. The increase in each of 2022 and 2021 primarily resulted from higher retail demand. Additional factors in 2022 were higher incentives expected to be paid for dealer market share and incentives provided to offset elevated interest rates.
The estimation of the retail sales incentive accrual is impacted by many assumptions. One of the key assumptions is the predictive value of the historical percent of retail sales incentive costs to retail sales from dealers. Over the last five fiscal years, this percent has varied by an average of approximately plus or minus .8 percent, compared to the average retail sales incentive costs to retail sales percent during that period. Holding other assumptions constant, if this estimated retail incentive cost experience percent would have increased or decreased .8 percent, the sales incentive accrual at October 30, 2022 would have increased or decreased by approximately $74 million.
33
Product Warranties
For most equipment and service parts sales, the company provides a standard warranty to provide assurance that the equipment will function as intended for a specified period of time. At the time a sale is recognized, the company records the estimated future warranty costs. The company determines its total warranty liability by applying historical claims rate experience to the estimated amount of equipment that has been sold and is still under warranty based on dealer inventories and retail sales. The historical claims rate is determined by a review of five-year claims costs and consideration of current quality developments. Variances in claims experience and the type of warranty programs affect these estimates, which are reviewed quarterly. The company also offers extended warranty arrangements for purchase at the customer’s option. The premiums for extended warranties are recognized in “Other income” in the statements of consolidated income in proportion to the costs expected to be incurred over the contract period. The unamortized extended warranty premiums (deferred revenue) are recorded in “Accounts payable and accrued expenses” in the consolidated balance sheets (see Note 18).
The product warranty accruals, excluding extended warranty unamortized premiums, at October 30, 2022, October 31, 2021, and November 1, 2020 were $1,427 million, $1,312 million, and $1,105 million, respectively. The increase in each of 2022 and 2021 related to higher sales volume, partially offset by a decrease in the warranty rate.
Estimates used to determine the product warranty accruals are significantly affected by the historical percent of warranty claims costs to sales. Over the last five fiscal years, this percent has varied by an average of approximately plus or minus .11 percent, compared to the average warranty costs to sales percent during that period. Holding other assumptions constant, if this estimated cost experience percent would have increased or decreased .11 percent, the warranty accrual at October 30, 2022 would have increased or decreased by approximately $57 million.
Postretirement Benefit Obligations
The estimation of defined benefit pension and OPEB plan obligations and expenses requires the use of estimates of the present value of the projected future benefit payments. Plan obligations and expenses are based on existing retirement plan provisions. No assumption is made regarding any potential changes to benefit provisions beyond those to which the company is presently committed (e.g., in existing labor contracts). The key assumptions used in developing the required estimates used by the company’s actuaries include discount rates, health care cost trend rates, expected long-term return on plan assets, compensation increases, retirement rates, mortality rates, and expected contributions. Actual results that differ from the assumptions and changes in assumptions affect future expenses and obligations. Assumptions are set at each year-end and are not changed during the year unless there is a significant plan event, such as a curtailment or settlement that would trigger a plan remeasurement.
The company’s pension and OPEB costs in 2022 were $176 million, compared with $197 million in 2021 and $341 million in 2020. The long-term expected return on plan assets, which is reflected in these costs, was an expected gain of 5.0 percent in 2022 and 5.9 percent in 2021, or $836 million and $876 million, respectively. The actual return was a loss of $3,565 million in 2022 and a gain of $3,616 million in 2021. In 2023, the expected return is approximately 6.0 percent. The company’s costs under these plans in 2023 are expected to decrease by $225 million compared to 2022, resulting in a net periodic benefit. The reduction in the company’s cost is due to increases in the expected long-term rates of return on plan assets and increases in discount rates.
The pension assets, net of pension liabilities, recognized on the balance sheets at October 30, 2022 and October 31, 2021 were $2,690 million and $2,665 million, respectively. The pension liabilities, net of pension assets, recognized on the balance sheets at November 1, 2020 were $447 million. The increase in the pension net assets in 2022 was due to an increase in discount rates offset by losses on plan assets and UAW contract impacts. The increase in the pension net assets in 2021 was due to returns on plan assets.
The OPEB liabilities, net of OPEB assets, at October 30, 2022, October 31, 2021, and November 1, 2020 were $1,205 million, $3,175 million, and $3,892 million, respectively. The decrease in OPEB net liabilities in 2022 was due to an increase in discount rates and a $1,000 million contribution to a U.S. OPEB plan. The decrease in OPEB net liabilities in 2021 was due to returns on plan assets and favorable changes to medical assumptions.
The company employs de-risking strategies for the global funded pension plans that increase the matching characteristics of the plan assets relative to the obligations, through an increased allocation to fixed income assets, as the funded status improves. Changes in interest rates, which directly influence changes in discount rates, in addition to other factors, have a significant impact on the value of the pension obligation and the fixed income asset portfolio. The company anticipates that changes in interest rates will likely result in offsetting effects in the value of the pension obligation and the value of the fixed income asset portfolio, reducing funded status volatility.
34
The effect of hypothetical changes to selected assumptions on the company’s major U.S. retirement benefit plans would be as follows in millions of dollars:
| | | | | | | | | | |||||||||
| | | | October 30, 2022 | | 2023 | | |||||||||||
| | | | Increase | | Increase | | |||||||||||
| | Percentage | | (Decrease) | | (Decrease) | | |||||||||||
Assumptions |
| Change |
| PBO/APBO* |
| Expense |
| |||||||||||
Pension | | | | | | | | | | |||||||||
Discount rate** |
| +/-.5 | | $ | (485)/547 | | $ | 0/1 | | |||||||||
Expected return on assets | | +/-.5 | | | | |
| (63)/63 | | |||||||||
OPEB | | | | | | | | | | |||||||||
Discount rate** |
| +/-.5 | |
| (149)/162 | |
| (2)/2 | | |||||||||
Expected return on assets |
| +/-.5 | | | | |
| (10)/10 | | |||||||||
Health care cost |
| +/-1.0 | |
| 291/(250) | |
| 40/(29) | | |||||||||
* | Projected benefit obligation (PBO) for pension plans and accumulated postretirement benefit obligation (APBO) for OPEB plans. |
** | Pretax impact on service cost, interest cost, and amortization of gains or losses. |
Goodwill
Goodwill is not amortized and is tested for impairment annually and when events or circumstances change such that it is more likely than not that the fair value of a reporting unit is reduced below its carrying amount. The end of the fiscal third quarter is the annual measurement date. To test for goodwill impairment, the carrying value of each reporting unit is compared with its fair value. If the carrying value of the goodwill is considered impaired, a loss is measured as the excess of the reporting unit’s carrying value over the fair value, with a limit of the goodwill allocated to that reporting unit.
An estimate of the fair value of the reporting unit is determined through a combination of comparable market values for similar businesses and discounted cash flows. These estimates can change significantly based on such factors as the reporting unit’s financial performance, economic conditions, interest rates, growth rates, pricing, changes in business strategies, and competition.
The company has not identified a reporting unit for which the goodwill was impaired in 2022, 2021, or 2020. For all reporting units, a 10 percent decrease in the estimated fair value would have had no effect on the carrying value of goodwill at the annual measurement date in 2022.
Allowance for Credit Losses
The allowance for credit losses is an estimate of the credit losses expected over the life of the receivable portfolio. The allowance is measured on a collective basis when similar risk characteristics exist. Risk characteristics considered by the company include finance product category, market, geography, credit risk, and remaining duration. Receivables that do not share risk characteristics with other receivables in the portfolio are evaluated on an individual basis. Non-performing receivables are included in the estimate of expected credit losses.
The company utilizes loss forecast models, which are selected based on the size and credit risk of the underlying pool of receivables, to estimate expected credit losses. Transition matrix
models are used for large and complex retail customer receivable pools, while weighted average remaining maturity models are used for smaller and less complex retail customer receivable pools. Expected credit losses on wholesale receivables are based on historical loss rates, with consideration of current economic conditions and dealer financial risk. The modeled expected credit losses are adjusted based on reasonable and supportable forecasts, which may include economic indicators such as commodity prices, industry equipment sales, unemployment rates, and housing starts. Management reviews each model’s output quarterly, and qualitative adjustments are incorporated as necessary.
In 2021, the company adopted ASU No. 2016-13, which revised the measurement of credit losses from an incurred loss to an expected loss methodology. Upon adoption the company’s allowance for credit losses increased with an offset to retained earnings. The allowance for credit losses at November 1, 2020 was not restated under the expected loss methodology. The total allowance for credit losses at October 30, 2022, October 31, 2021, and November 1, 2020 was $361 million, $207 million, and $223 million, respectively. The allowance increased in 2022 compared to 2021 due to higher reserves related to the economic uncertainty in Russia. The allowance decreased in 2021 compared to 2020 due to lower expected losses in the construction and forestry market, continued improvement in the agriculture and turf market, and better than expected performance of accounts granted payment relief due to the economic effects of COVID. As previously mentioned, the allowance decrease was partially offset by the adoption of ASU No. 2016-13.
The assumptions used in evaluating the company’s exposure to credit losses involve estimates and significant judgment. While the company believes its allowance is sufficient to provide for losses over the life of its existing receivable portfolio, different assumptions or changes in economic conditions would result in changes to the allowance for credit losses. Historically, changes in economic conditions have had limited impact on credit losses within the company’s wholesale receivable portfolio. Within the retail customer receivables portfolio, credit loss estimates are dependent on a number of factors, including historical portfolio performance, current delinquency levels, and estimated recoveries on defaulted accounts. The company’s transition matrix models, which are utilized to estimate credit losses for more than 90 percent of retail customer receivables, use historical portfolio performance and current delinquency levels to forecast future defaults. Estimated recovery rates are applied to the estimated default balance to calculate the expected credit losses. Holding all other factors constant, a 10 percent increase in the transition matrix models’ forecasted defaults and a simultaneous 10 percent decrease in recovery rates would have resulted in a $40 million increase to the allowance for credit losses at October 30, 2022.
Operating Lease Residual Values
The carrying value of equipment on operating leases is affected by the estimated fair values of the equipment at the end of the lease (residual values). Upon termination of the lease, the equipment is
35
either purchased by the lessee or sold to a third party, in which case the company may record a gain or a loss for the difference between the estimated residual value and the sale price. The estimated residual values are based on several factors, including lease term, expected hours of usage, historical wholesale sales prices, return experience, intended equipment use, market dynamics and trends, and dealer residual value guarantees. The company reviews residual value estimates during the lease term and tests the carrying value of its operating leases for impairment when events or circumstances necessitate. Changes in residual value assumptions would affect the amount of depreciation expense and the amount of investment in equipment on operating leases. Depreciation is adjusted prospectively on a straight-line basis over the remaining lease term if residual estimates are revised.
The total operating lease residual values at October 30, 2022, October 31, 2021, and November 1, 2020 were $4,640 million, $5,025 million, and $5,254 million, respectively. The decreases in 2022 and 2021 related to a lower average operating lease portfolio.
Estimates used in determining end of lease market values for equipment on operating leases significantly impact the amount and timing of depreciation expense. Hypothetically, if future market values for this equipment were to decrease 10 percent from the company’s present estimates and all the equipment on operating leases were returned to the company for remarketing at the end of the lease term, the total effect would be to increase the company’s annual depreciation for equipment on operating leases by approximately $40 million, after consideration of dealer residual value guarantees.
Income Taxes
The company’s income tax provision, deferred income tax assets and liabilities, and liabilities for uncertain tax benefits represent the company’s best estimate of current and future income taxes to be paid. The annual tax rate is based on income tax laws, statutory tax rates, taxable income levels, and tax planning opportunities available in various jurisdictions where the company operates. These tax laws are complex, and require significant judgment to determine the consolidated provision for income taxes. Changes in tax laws, regulations, statutory tax rates, and estimates of the company’s future taxable income levels could result in actual realization of deferred taxes being materially different from amounts provided for in the consolidated financial statements.
Deferred income taxes represent temporary differences between the tax and the financial reporting basis of assets and liabilities, which will result in taxable or deductible amounts in the future. Deferred tax assets also include loss carryforwards and tax credits. These assets are regularly assessed for the likelihood of recoverability from estimated future taxable income, reversal of deferred tax liabilities, and tax planning strategies. To the extent the company determines that it is more likely than not a deferred income tax asset will not be realized, a valuation allowance is established. The recoverability analysis of the deferred income tax assets and the related valuation allowances requires significant judgment and relies on estimates.
Uncertain tax positions are determined based on whether it is more likely than not the tax positions will be sustained based on the technical merits of the position. For those positions that meet the more likely than not criteria, an estimate of the largest amount of tax benefit that is greater than 50 percent likely to be realized upon ultimate settlement with the related tax authority is recognized. The ultimate resolution of the tax position could take many years and result in a payment that is significantly different from the original estimate.
A provision for foreign withholding taxes has not been recorded on undistributed profits of the company’s non-U.S. subsidiaries that are determined to be indefinitely reinvested outside the U.S. If management intentions change in the future, there may be a significant impact on the provision for income taxes in the period the change occurs. For further information on income taxes, see Note 8 to the consolidated financial statements.
FORWARD-LOOKING STATEMENTS
Certain statements contained herein, including in the section entitled “Overview” relating to future events, expectations, and trends constitute “forward-looking statements” as defined in the Private Securities Litigation Reform Act of 1995 and involve factors that are subject to change, assumptions, risks, and uncertainties that could cause actual results to differ materially. Some of these risks and uncertainties could affect all lines of the company’s operations generally while others could more heavily affect a particular line of business.
Forward-looking statements are based on currently available information and current assumptions, expectations, and projections about future events and should not be relied upon. Further information concerning the company and its businesses, including factors that could materially affect the company’s financial results, is included in the company’s other filings with the SEC (including, but not limited to, the factors discussed in Item 1A. “Risk Factors” of this Annual Report on Form 10-K and subsequent Quarterly Reports on Form 10-Q).
Factors Affecting All Lines of Business
All of the company’s businesses and their results are affected by general global macroeconomic conditions, including but not limited to inflation, including rising costs for materials used in our production, slower growth or recession, higher interest rates and currency fluctuations which could adversely affect the U.S. dollar and customer confidence, customer access to capital, and overall demand for our products; delays or disruptions in the company’s supply chain, including work stoppages or disputes by suppliers with their unionized labor; shipping delays; government spending and taxing; changes in weather and climate patterns; the political and social stability of the markets in which the company operates; the effects of, or response to, wars and other conflicts, including the current conflict between Russia and Ukraine; natural disasters; and the spread of major epidemics or pandemics (including the COVID-19 pandemic).
Significant changes in market liquidity conditions, changes in the company’s credit ratings, and any failure to comply with financial
36
covenants in credit agreements could impact our access to or terms of future funding, which could reduce the company’s earnings and cash flows. A debt crisis in Europe (including the recent volatility of the United Kingdom’s bond market), Latin America, or elsewhere could negatively impact currencies, global financial markets, funding sources and costs, asset and obligation values, customers, suppliers, and demand for equipment. The company’s investment management activities could be impaired by changes in the equity, bond, and other financial markets, which would negatively affect earnings.
Additional factors that could materially affect the company’s operations, financial condition, and results include changes in governmental trade, banking, monetary, and fiscal policies, including policies and tariffs for the benefit of certain industries or sectors; actions by environmental, health, and safety regulatory agencies, including those related to engine emissions, carbon and other greenhouse gas emissions, and the effects of climate change; changes to GPS radio frequency bands and their permitted uses; speed of research and development; effectiveness of partnerships with third parties; the dealer channel’s ability to support and service precision technology solutions; changes to accounting standards; changes to and compliance with economic sanctions and export controls laws and regulations (including those in place for Russia); and compliance with evolving U.S. and foreign laws when expanding to new markets and otherwise.
Other factors that could materially affect the company’s results and operations include security breaches, cybersecurity attacks, technology failures, and other disruptions to the information technology infrastructure of the company and its suppliers and dealers; security breaches with respect to the company’s products; the loss of or challenges to intellectual property rights; the availability and prices of strategically sourced materials, components, and whole goods; introduction of legislation that could affect the company’s business model and intellectual property, such as so-called right to repair or right to modify legislation; events that damage the company’s reputation or brand; significant investigations, claims, lawsuits, or other legal proceedings; the success or failure of new product initiatives or business strategies; changes in product preferences, sales mix, and take rates of products and life cycle solutions; gaps or limitations in rural broadband coverage, capacity, and speed needed to support technology solutions; oil and energy prices, supplies, and volatility; the availability and cost of freight; actions of competitors in the various industries in which the company competes, particularly price discounting; dealer practices, especially as to levels of new and used field inventories; changes in demand and pricing for used equipment and resulting impacts on lease residual values; the inability to deliver precision technology and agricultural solutions to customers; labor relations and contracts, including work stoppages and other disruptions; changes in the ability to attract, develop, engage, and retain qualified personnel; and the integration of acquired businesses.
Production & Precision Agriculture and Small Agriculture & Turf Operations
The company’s agricultural equipment operations are subject to a number of uncertainties, including customer profitability; consumer purchasing preferences; housing starts and supply; infrastructure investment; and consumable input costs. Additionally, these operations are subject to certain factors that affect farmers’ confidence and financial condition. These factors include demand for agricultural products; world grain stocks; soil conditions; harvest yields; prices for commodities and livestock; availability and cost of fertilizer; availability of transport for crops; the growth and sustainability of non-food uses for some crops (including ethanol and biodiesel production); real estate values; availability of technological innovations; available acreage for farming; changes in government farm programs and policies; changes in and effects of crop insurance programs; changes in environmental regulations and their impact on farming practices; animal diseases and their effects on poultry, beef, and pork consumption and prices on livestock feed demand; and crop pests and diseases.
Production and Precision Agriculture Operations
In addition to the uncertainties discussed above, the production and precision agriculture operations rely in part on hardware and software, guidance, connectivity and digital solutions, and automation and machine intelligence. Many factors contribute to the company’s production and precision agriculture sales and results, including the impact to customers’ profitability and/or sustainability outcomes.
Small Agriculture and Turf Equipment
In addition to the uncertainties discussed above, factors affecting the company’s small agriculture and turf equipment operations include spending by municipalities and golf courses.
Construction and Forestry
Factors affecting the company’s construction and forestry equipment operations include real estate and housing prices; the number of housing starts; commodity prices such as oil and gas; the levels of public and non-residential construction; and investment in infrastructure, while prices for pulp, paper, lumber, and structural panels affect sales of forestry equipment.
John Deere Financial
The liquidity and ongoing profitability of John Deere Capital Corporation and the company’s other financial services subsidiaries depend on timely access to capital to meet future cash flow requirements, and to fund operations, costs, and purchases of the company’s products. If general economic conditions deteriorate further or capital markets become more volatile, funding could be unavailable or insufficient. Additionally, customer confidence levels may result in declines in credit applications and increases in delinquencies and default rates, which could materially impact write-offs and provisions for credit losses.
37
SUPPLEMENTAL CONSOLIDATING INFORMATION
The supplemental consolidating data presented on the subsequent pages is presented for informational purposes. The equipment operations represents the enterprise without financial services. The equipment operations includes the company’s production and precision agriculture operations, small agriculture and turf operations, construction and forestry operations, and other corporate assets, liabilities, revenues, and expenses not reflected within financial services. Transactions between the “equipment operations” and “financial services” have been eliminated to arrive at the consolidated financial statements.
The equipment operations and financial services participate in different industries. The equipment operations generate earnings and cash flows by manufacturing and selling equipment, service parts, and technology solutions to dealers and retail customers. Financial services finances sales and leases by dealers of new and used equipment that is largely manufactured by the company. Those earnings and cash flows generally are the difference between the finance income received from customer payments less interest expense, and depreciation on equipment subject to an operating lease. The two businesses are capitalized differently and have separate performance metrics. The supplemental consolidating data is also used by management due to these differences.
38
SUPPLEMENTAL CONSOLIDATING DATA
| | | | | | | | | | | | | | | | | | | | | | | | | | | | | | | | | | | | | | | |
INCOME STATEMENTS | | | | ||||||||||||||||||||||||||||||||||||
For the Years Ended October 30, 2022, October 31, 2021, and November 1, 2020 | | | | ||||||||||||||||||||||||||||||||||||
(In millions of dollars) Unaudited | | | | ||||||||||||||||||||||||||||||||||||
| | EQUIPMENT | | FINANCIAL | | | | | | | | ||||||||||||||||||||||||||||
| | OPERATIONS | | SERVICES | | ELIMINATIONS | | CONSOLIDATED | | | | ||||||||||||||||||||||||||||
| | 2022 | | 2021 | | 2020 | | 2022 | | 2021 | | 2020 | | 2022 | | 2021 | | 2020 | | 2022 | | 2021 | | 2020 | | | | ||||||||||||
Net Sales and Revenues | | | |
| | |
| | |
| | |
| | |
| | |
| | |
| | |
| | |
| | |
| | |
| | | | | |
Net sales | | $ | 47,917 | | $ | 39,737 | | $ | 31,272 | | | | | | | | | | | | | | | | | | | | $ | 47,917 | | $ | 39,737 | | $ | 31,272 | | | |
Finance and interest income | | | 213 | | | 133 | | | 112 | | $ | 3,583 | | $ | 3,442 | | $ | 3,610 | | $ | (431) | | $ | (279) | | $ | (272) | | | 3,365 | | | 3,296 | | | 3,450 | | 1 | |
Other income | | | 1,261 | | | 941 | | | 808 | | | 502 | | | 352 | | | 257 | | | (468) | | | (302) | | | (247) | | | 1,295 | | | 991 | | | 818 | | 2, 3 | |
Total | | | 49,391 | | | 40,811 | | | 32,192 | | | 4,085 | | | 3,794 | | | 3,867 | | | (899) | | | (581) | | | (519) | | | 52,577 | | | 44,024 | | | 35,540 | | | |
| | | | | | | | | | | | | | | | | | | | | | | | | | | | | | | | | | | | | | | |
Costs and Expenses | | | | | | | | | | | | | | | | | | | | | | | | | | | | | | | | | | | | | | | |
Cost of sales | | | 35,341 | | | 29,119 | | | 23,679 | | | | | | | | | | | | (3) | | | (3) | | | (2) | | | 35,338 | | | 29,116 | | | 23,677 | | 4 | |
Research and development expenses | | | 1,912 | | | 1,587 | | | 1,644 | | | | | | | | | | | | | | | | | | | | | 1,912 | | | 1,587 | | | 1,644 | | | |
Selling, administrative and general expenses | | | 3,137 | | | 2,887 | | | 2,878 | | | 735 | | | 504 | | | 606 | | | (9) | | | (8) | | | (7) | | | 3,863 | | | 3,383 | | | 3,477 | | 4 | |
Interest expense | | | 390 | | | 368 | | | 329 | | | 799 | | | 687 | | | 942 | | | (127) | | | (62) | | | (24) | | | 1,062 | | | 993 | | | 1,247 | | 5 | |
Interest compensation to Financial Services | | | 299 | | | 217 | | | 248 | | | | | | | | | | | | (299) | | | (217) | | | (248) | | | | | | | | | | | 5 | |
Other operating expenses | | | 350 | | | 181 | | | 278 | | | 1,386 | | | 1,453 | | | 1,572 | | | (461) | | | (291) | | | (238) | | | 1,275 | | | 1,343 | | | 1,612 | | 6, 7 | |
Total | | | 41,429 | | | 34,359 | | | 29,056 | | | 2,920 | | | 2,644 | | | 3,120 | | | (899) | | | (581) | | | (519) | | | 43,450 | | | 36,422 | | | 31,657 | | | |
| | | | | | | | | | | | | | | | | | | | | | | | | | | | | | | | | | | | | | | |
Income before Income Taxes | | | 7,962 | | | 6,452 | | | 3,136 | | | 1,165 | | | 1,150 | | | 747 | | | | | | | | | | | | 9,127 | | | 7,602 | | | 3,883 | | | |
Provision for income taxes | | | 1,718 | | | 1,386 | | | 899 | | | 289 | | | 272 | | | 183 | | | | | | | | | | | | 2,007 | | | 1,658 | | | 1,082 | | | |
| | | | | | | | | | | | | | | | | | | | | | | | | | | | | | | | | | | | | | | |
Income after Income Taxes | | | 6,244 | | | 5,066 | | | 2,237 | | | 876 | | | 878 | | | 564 | | | | | | | | | | | | 7,120 | | | 5,944 | | | 2,801 | | | |
Equity in income (loss) of unconsolidated affiliates | | | 6 | | | 18 | | | (50) | | | 4 | | | 3 | | | 2 | | | | | | | | | | | | 10 | | | 21 | | | (48) | | | |
| | | | | | | | | | | | | | | | | | | | | | | | | | | | | | | | | | | | | | | |
Net Income | | | 6,250 | | | 5,084 | | | 2,187 | | | 880 | | | 881 | | | 566 | | | | | | | | | | | | 7,130 | | | 5,965 | | | 2,753 | | | |
Less: Net income (loss) attributable to noncontrolling interests | | | (1) | | | 2 | | | 2 | | | | | | | | | | | | | | | | | | | | | (1) | | | 2 | | | 2 | | | |
Net Income Attributable to Deere & Company | | $ | 6,251 | | $ | 5,082 | | $ | 2,185 | | $ | 880 | | $ | 881 | | $ | 566 | | | | | | | | | | | $ | 7,131 | | $ | 5,963 | | $ | 2,751 | | | |
1 Elimination of financial services’ interest income earned from equipment operations.
2 Elimination of equipment operations’ margin from inventory transferred to equipment on operating leases (see Note 6).
3 Elimination of financial services’ income related to intercompany guarantees of investments in certain international markets.
4 Elimination of intercompany service fees.
5 Elimination of equipment operations’ interest expense to financial services.
6 Elimination of financial services’ lease depreciation expense related to inventory transferred to equipment on operating leases.
7 Elimination of equipment operations’ expense related to intercompany guarantees of investments in certain international markets.
39
SUPPLEMENTAL CONSOLIDATING DATA (continued)
CONDENSED BALANCE SHEETS | | ||||||||||||||||||||||||||
As of October 30, 2022 and October 31, 2021 | | ||||||||||||||||||||||||||
(In millions of dollars) Unaudited | |||||||||||||||||||||||||||
| | EQUIPMENT | | FINANCIAL | | | | | |||||||||||||||||||
| | OPERATIONS | | SERVICES | | ELIMINATIONS | | CONSOLIDATED | |||||||||||||||||||
|
| 2022 |
| 2021 | | 2022 |
| 2021 | | 2022 |
| 2021 | | 2022 |
| 2021 | |||||||||||
ASSETS | | |
| | |
| | |
| | |
| | | | | | ||||||||||
Cash and cash equivalents | | $ | 3,767 | | $ | 7,188 | | $ | 1,007 | | $ | 829 | | | | | | | | $ | 4,774 | | $ | 8,017 | | ||
Marketable securities | |
| 61 | |
| 3 | |
| 673 | |
| 725 | |
| | |
| | |
| 734 | |
| 728 | | ||
Receivables from Financial Services | |
| 6,569 | |
| 5,564 | |
| | |
| | | $ | (6,569) | | $ | (5,564) | |
| | |
| | 8 | ||
Trade accounts and notes receivable - net | |
| 1,273 | |
| 1,155 | |
| 6,434 | |
| 3,895 | |
| (1,297) | |
| (842) | |
| 6,410 | |
| 4,208 | 9 | ||
Financing receivables - net | |
| 47 | |
| 73 | |
| 36,587 | |
| 33,726 | |
| | |
| | |
| 36,634 | |
| 33,799 | | ||
Financing receivables securitized - net | | | | | | 10 | | | 5,936 | | | 4,649 | | | | | | | | | 5,936 | | | 4,659 | | ||
Other receivables | |
| 1,670 | |
| 1,629 | |
| 832 | |
| 159 | |
| (10) | |
| (23) | |
| 2,492 | |
| 1,765 | 9 | ||
Equipment on operating leases - net | | | | | | | | | 6,623 | | | 6,988 | | | | | | | | | 6,623 | | | 6,988 | | ||
Inventories | |
| 8,495 | |
| 6,781 | |
| | |
| | |
| | |
| | |
| 8,495 | |
| 6,781 | | ||
Property and equipment - net | |
| 6,021 | |
| 5,783 | |
| 35 | |
| 37 | |
| | |
| | |
| 6,056 | |
| 5,820 | | ||
Goodwill | |
| 3,687 | |
| 3,291 | |
| | |
| | |
| | |
| | |
| 3,687 | |
| 3,291 | | ||
Other intangible assets - net | |
| 1,218 | |
| 1,275 | |
| | |
| | |
| | |
| | |
| 1,218 | |
| 1,275 | | ||
Retirement benefits | |
| 3,666 | |
| 3,539 | |
| 66 | |
| 64 | |
| (2) | |
| (2) | |
| 3,730 | |
| 3,601 | 10 | ||
Deferred income taxes | |
| 940 | |
| 1,215 | |
| 45 | |
| 53 | |
| (161) | |
| (231) | |
| 824 | |
| 1,037 | 11 | ||
Other assets | |
| 1,794 | |
| 1,646 | |
| 626 | |
| 499 | |
| (3) | |
| | |
| 2,417 | |
| 2,145 | | ||
Total Assets | | $ | 39,208 | | $ | 39,152 | | $ | 58,864 | | $ | 51,624 | | $ | (8,042) | | $ | (6,662) | | $ | 90,030 | | $ | 84,114 | | ||
| | | | | | | | | | | | | | | | | | | | | | | | | | ||
LIABILITIES AND STOCKHOLDERS’ EQUITY | | | | | | | | | | | | | | | | | | | | | | | | | | ||
| | | | | | | | | | | | | | | | | | | | | | | | | | ||
LIABILITIES | | | | | | | | | | | | | | | | | | | | | | | | | | ||
Short-term borrowings | | $ | 1,040 | | $ | 1,509 | | $ | 11,552 | | $ | 9,410 | | | | | | | | $ | 12,592 | | $ | 10,919 | | ||
Short-term securitization borrowings | | | | | | 10 | | | 5,711 | | | 4,595 | | | | | | | | | 5,711 | | | 4,605 | | ||
Payables to Equipment Operations | |
| | |
| | |
| 6,569 | |
| 5,564 | | $ | (6,569) | | $ | (5,564) | |
| | |
| | 8 | ||
Accounts payable and accrued expenses | |
| 12,962 | |
| 11,198 | |
| 3,170 | |
| 2,015 | |
| (1,310) | |
| (865) | |
| 14,822 | |
| 12,348 | 9 | ||
Deferred income taxes | |
| 380 | |
| 438 | |
| 276 | |
| 369 | |
| (161) | |
| (231) | |
| 495 | |
| 576 | 11 | ||
Long-term borrowings | |
| 7,917 | |
| 8,915 | |
| 25,679 | |
| 23,973 | |
| | |
| | |
| 33,596 | |
| 32,888 | | ||
Retirement benefits and other liabilities | |
| 2,351 | |
| 4,239 | |
| 108 | |
| 107 | |
| (2) | |
| (2) | |
| 2,457 | |
| 4,344 | 10 | ||
Total liabilities | |
| 24,650 | |
| 26,309 | |
| 53,065 | |
| 46,033 | |
| (8,042) | |
| (6,662) | |
| 69,673 | |
| 65,680 | | ||
| | | | | | | | | | | | | | | | | | | | | | | | | | ||
Commitments and contingencies (Note 20) | | | | | | | | | | | | | | | | | | | | | | | | | | ||
Redeemable noncontrolling interest (Note 3) | | | 92 | | | | | | | | | | | | | | | | | | 92 | | | | | ||
| | | | | | | | | | | | | | | | | | | | | | | | | | ||
STOCKHOLDERS’ EQUITY | | | | | | | | | | | | | | | | | | | | | | | | | | ||
Total Deere & Company stockholders’ equity | |
| 20,262 | |
| 18,431 | |
| 5,799 | |
| 5,591 | |
| (5,799) | |
| (5,591) | |
| 20,262 | |
| 18,431 | 12 | ||
Noncontrolling interests | |
| 3 | |
| 3 | |
| | |
| | |
| | |
| | |
| 3 | |
| 3 | | ||
Financial Services' equity | | | (5,799) | | | (5,591) | | | | | | | | | 5,799 | | | 5,591 | | | | | | | 12 | ||
Adjusted total stockholders' equity | |
| 14,466 | |
| 12,843 | |
| 5,799 | |
| 5,591 | |
| | |
| | |
| 20,265 | |
| 18,434 | | ||
Total Liabilities and Stockholders’ Equity | | $ | 39,208 | | $ | 39,152 | | $ | 58,864 | | $ | 51,624 | | $ | (8,042) | | $ | (6,662) | | $ | 90,030 | | $ | 84,114 | | ||
8 Elimination of receivables / payables between equipment operations and financial services.
9 Primarily reclassification of sales incentive accruals on receivables sold to financial services.
10 Reclassification of net pension assets / liabilities.
11 Reclassification of deferred tax assets / liabilities in the same taxing jurisdictions.
12 Elimination of financial services’ equity.
40
SUPPLEMENTAL CONSOLIDATING DATA (continued)
STATEMENTS OF CASH FLOWS | | | | ||||||||||||||||||||||||||||||||||||
For the Years Ended October 30, 2022, October 31, 2021, and November 1, 2020 | | | | ||||||||||||||||||||||||||||||||||||
(In millions of dollars) Unaudited | | | | ||||||||||||||||||||||||||||||||||||
| | EQUIPMENT | | FINANCIAL | | | | | | | | ||||||||||||||||||||||||||||
| | OPERATIONS | | SERVICES | | ELIMINATIONS | | CONSOLIDATED | | | | ||||||||||||||||||||||||||||
2022 | | 2021 | 2020 | 2022 | | 2021 | 2020 | | 2022 | | 2021 | 2020 | | 2022 | | 2021 | 2020 | ||||||||||||||||||||||
Cash Flows from Operating Activities |
|
|
|
|
|
|
|
|
|
|
| ||||||||||||||||||||||||||||
Net income | $ | 6,250 | $ | 5,084 | $ | 2,187 | $ | 880 | $ | 881 | $ | 566 | | | | | | | $ | 7,130 | $ | 5,965 | $ | 2,753 | | ||||||||||||||
Adjustments to reconcile net income to net cash provided by operating activities: | | | | | | | | | | | | | | | | | | | | | | | | | | ||||||||||||||
Provision (credit) for credit losses | | 3 | | 7 | | 5 | | 189 | | (13) | | 105 | | | | | | | | 192 | | (6) | | 110 | | ||||||||||||||
Provision for depreciation and amortization | | 1,041 | | 1,043 | | 1,016 | | 1,050 | | 1,140 | | 1,227 | $ | (196) | $ | (133) | $ | (125) | | 1,895 | | 2,050 | | 2,118 | 13 | ||||||||||||||
Impairment charges | | 88 | | 50 | | 162 | | | | | | 32 | | | | | | | | 88 | | 50 | | 194 | | ||||||||||||||
Share-based compensation expense | | | | | | | | | | | | | | 85 | | 82 | | 81 | | 85 | | 82 | | 81 | 14 | ||||||||||||||
Loss on sale of businesses and unconsolidated affiliates | | | | | | 24 | | | | | | | | | | | | | | | | | | 24 | | ||||||||||||||
Gain on remeasurement of previously held equity investment | | (326) | | | | | | | | | | | | | | | | | | (326) | | | | | | ||||||||||||||
Undistributed earnings of Financial Services | | 444 | | 555 | | 386 | | | | | | | | (444) | | (555) | | (386) | | | | | | | 15 | ||||||||||||||
Provision (credit) for deferred income taxes | | 8 | | (369) | | 105 | | (74) | | (72) | | (116) | | | | | | | | (66) | | (441) | | (11) | | ||||||||||||||
Changes in assets and liabilities: | | | | | | | | | | | | | | | | | | | | | | | | | | ||||||||||||||
Trade, notes, and financing receivables related to sales | | (189) | | (105) | | 373 | | | | | | | | (2,294) | | 1,074 | | 1,636 | | (2,483) | | 969 | | 2,009 | 16, 18, 19 | ||||||||||||||
Inventories | | (1,924) | | (1,835) | | 1,011 | | | | | | | | (167) | | (662) | | (614) | | (2,091) | | (2,497) | | 397 | 17 | ||||||||||||||
Accounts payable and accrued expenses | | 1,444 | | 1,589 | | (331) | | 143 | | 57 | | (1) | | (454) | | 238 | | 325 | | 1,133 | | 1,884 | | (7) | 18 | ||||||||||||||
Accrued income taxes payable/receivable | | 166 | | 13 | | (14) | | (25) | | (2) | | 22 | | | | | | | | 141 | | 11 | | 8 | | ||||||||||||||
Retirement benefits | | (1,016) | | 30 | | (544) | | 1 | | (1) | | 7 | | | | | | | | (1,015) | | 29 | | (537) | | ||||||||||||||
Other | | 250 | | (162) | | 380 | | (287) | | (25) | | 134 | | 53 | | (183) | | (170) | | 16 | | (370) | | 344 | 13, 14, 17 | ||||||||||||||
Net cash provided by operating activities | | 6,239 | | 5,900 | | 4,760 | | 1,877 | | 1,965 | | 1,976 | | (3,417) | | (139) | | 747 | | 4,699 | | 7,726 | | 7,483 | | ||||||||||||||
| | | | | | | | | | | | | | | | | | | | | | | | | | ||||||||||||||
Cash Flows from Investing Activities | | | | | | | | | | | | | | | | | | | | | | | | | | ||||||||||||||
Collections of receivables (excluding receivables related to sales) | | | | | | | | 22,400 | | 20,527 | | 18,829 | | (1,493) | | (1,568) | | (1,448) | | 20,907 | | 18,959 | | 17,381 | 16 | ||||||||||||||
Proceeds from sales of equipment on operating leases | | | | | | | | 2,093 | | 2,094 | | 1,783 | | | | | | | | 2,093 | | 2,094 | | 1,783 | | ||||||||||||||
Cost of receivables acquired (excluding receivables related to sales) | | | | | | | | (26,903) | | (25,305) | | (21,360) | | 603 | | 1,652 | | 1,395 | | (26,300) | | (23,653) | | (19,965) | 16 | ||||||||||||||
Acquisitions of businesses, net of cash acquired | | (498) | | (244) | | (66) | | | | | | | | | | | | | | (498) | | (244) | | (66) | | ||||||||||||||
Purchases of property and equipment | | (1,131) | | (845) | | (816) | | (3) | | (3) | | (4) | | | | | | | | (1,134) | | (848) | | (820) | | ||||||||||||||
Cost of equipment on operating leases acquired | | | | | | | | (2,879) | | (2,627) | | (2,666) | | 225 | | 895 | | 830 | | (2,654) | | (1,732) | | (1,836) | 17 | ||||||||||||||
Decrease (increase) in trade and wholesale receivables | | | | | | | | (3,601) | | 1,364 | | 1,999 | | 3,601 | | (1,364) | | (1,999) | | | | | | | 16 | ||||||||||||||
Collateral on derivatives - net | | 5 | | (7) | | (6) | | (647) | | (274) | | 274 | | | | | | | | (642) | | (281) | | 268 | | ||||||||||||||
Other | | (206) | | 62 | | (103) | | (81) | | (84) | | (71) | | 30 | | (23) | | 110 | | (257) | | (45) | | (64) | 15, 19 | ||||||||||||||
Net cash used for investing activities | | (1,830) | | (1,034) | | (991) | | (9,621) | | (4,308) | | (1,216) | | 2,966 | | (408) | | (1,112) | | (8,485) | | (5,750) | | (3,319) | | ||||||||||||||
| | | | | | | | | | | | | | | | | | | | | | | | | | ||||||||||||||
Cash Flows from Financing Activities | | | | | | | | | | | | | | | | | | | | | | | | | | ||||||||||||||
Increase (decrease) in total short-term borrowings | | 136 | | 65 | | (177) | | 3,716 | | 753 | | (1,183) | | | | | | | | 3,852 | | 818 | | (1,360) | | ||||||||||||||
Change in intercompany receivables/payables | | (1,633) | | (354) | | (3,207) | | 1,633 | | 354 | | 3,207 | | | | | | | | | | | | | | ||||||||||||||
Proceeds from long-term borrowings | | 138 | | 11 | | 4,586 | | 10,220 | | 8,711 | | 4,685 | | | | | | | | 10,358 | | 8,722 | | 9,271 | | ||||||||||||||
Payments of long-term borrowings | | (1,356) | | (94) | | (607) | | (7,089) | | (6,996) | | (6,776) | | | | | | | | (8,445) | | (7,090) | | (7,383) | | ||||||||||||||
Proceeds from issuance of common stock | | 63 | | 148 | | 331 | | | | | | | | | | | | | | 63 | | 148 | | 331 | | ||||||||||||||
Repurchases of common stock | | (3,597) | | (2,538) | | (750) | | | | | | | | | | | | | | (3,597) | | (2,538) | | (750) | | ||||||||||||||
Dividends paid | | (1,313) | | (1,040) | | (956) | | (444) | | (555) | | (386) | | 444 | | 555 | | 386 | | (1,313) | | (1,040) | | (956) | 15 | ||||||||||||||
Other | | (57) | | (61) | | (105) | | (42) | | (29) | | (7) | | 7 | | (8) | | (21) | | (92) | | (98) | | (133) | 15 | ||||||||||||||
Net cash provided by (used for) financing activities | | (7,619) | | (3,863) | | (885) | | 7,994 | | 2,238 | | (460) | | 451 | | 547 | | 365 | | 826 | | (1,078) | | (980) | | ||||||||||||||
| | | | | | | | | | | | | | | | | | | | | | | | | | ||||||||||||||
Effect of Exchange Rate Changes on Cash, Cash Equivalents, and Restricted Cash | | (209) | | 41 | | 76 | | (15) | | 14 | | (44) | | | | | | | | (224) | | 55 | | 32 | | ||||||||||||||
| | | | | | | | | | | | | | | | | | | | | | | | | | ||||||||||||||
Net Increase (Decrease) in Cash, Cash Equivalents, and Restricted Cash | | (3,419) | | 1,044 | | 2,960 | | 235 | | (91) | | 256 | | | | | | | | (3,184) | | 953 | | 3,216 | | ||||||||||||||
Cash, Cash Equivalents, and Restricted Cash at Beginning of Year | | 7,200 | | 6,156 | | 3,196 | | 925 | | 1,016 | | 760 | | | | | | | | 8,125 | | 7,172 | | 3,956 | | ||||||||||||||
Cash, Cash Equivalents, and Restricted Cash at End of Year | $ | 3,781 | $ | 7,200 | $ | 6,156 | $ | 1,160 | $ | 925 | $ | 1,016 | | | | | | | $ | 4,941 | $ | 8,125 | $ | 7,172 | | ||||||||||||||
Components of cash, cash equivalents, and restricted cash | |||||||||||||||||||||||||||||||||||||||
Cash and cash equivalents | | $ | 3,767 | | $ | 7,188 | | $ | 6,145 | | $ | 1,007 | | $ | 829 | | $ | 921 | | | | | | | | | | | $ | 4,774 | | $ | 8,017 | | $ | 7,066 | | | |
Restricted cash (Other assets) | | | 14 | | | 12 | | | 11 | | | 153 | | | 96 | | | 95 | | | | | | | | | | | | 167 | | | 108 | | | 106 | | | |
Total cash, cash equivalents, and restricted cash | | $ | 3,781 | | $ | 7,200 | | $ | 6,156 | | $ | 1,160 | | $ | 925 | | $ | 1,016 | | | | | | | | | | | $ | 4,941 | | $ | 8,125 | | $ | 7,172 | | | |
13 Elimination of depreciation on leases related to inventory transferred to equipment on operating leases (see Note 6).
14 Reclassification of share-based compensation expense.
15 Elimination of dividends from financial services to the equipment operations, which are included in the equipment operations operating activities, and capital investments in financial services from the equipment operations.
16 Primarily reclassification of receivables related to the sale of equipment.
17 Reclassification of direct lease agreements with retail customers.
18 Reclassification of sales incentive accruals on receivables sold to financial services
19 Elimination and reclassification of the effects of financial services partial financing of the construction and forestry retail locations sales and subsequent collection of those amounts.
41
FINANCIAL INSTRUMENT MARKET RISK INFORMATION
The company is naturally exposed to various interest rate and foreign currency risks. As a result, the company enters into derivative transactions to manage certain of these exposures that arise in the normal course of business and not for the purpose of creating speculative positions or trading. The company’s financial services operations manage the relationship of the types and amounts of their funding sources to their receivable and lease portfolio in an effort to diminish risk due to interest rate and foreign currency fluctuations while responding to favorable financing opportunities. In addition, the company has interest rate exposure at certain equipment operations units for sales incentive programs. Accordingly, from time to time, these operations enter into interest rate swap agreements to manage their interest rate exposure. The company also has foreign currency exposures at some of its foreign and domestic operations related to buying, selling, and financing in currencies other than the functional currencies. The company has entered into derivative agreements related to the management of these foreign currency transaction risks.
Interest Rate Risk
Interest rates rose in 2022 and further central bank policy rate increases are projected in 2023. Rising interest rates have historically impacted the company’s borrowings sooner than the benefit is realized from the financing receivable and equipment on operating lease portfolios. As a result, the company’s financial services operations experienced spread compression in 2022. If interest rates continue to rise, the company expects to continue experiencing spread compression in 2023.
Quarterly, the company uses a combination of cash flow models to assess the sensitivity of its financial instruments with interest rate exposure to changes in market interest rates. The models calculate the effect of adjusting interest rates as follows: cash flows for financing receivables are discounted at the current prevailing rate for each receivable portfolio, cash flows for marketable securities are discounted at the applicable benchmark yield curve plus market credit spreads, cash flows for unsecured borrowings are discounted at the applicable benchmark yield curve plus market credit spreads for similarly rated borrowers, cash flows for securitized borrowings are discounted at the swap yield curve plus a market credit spread for similarly rated borrowers, and cash flows for interest rate swaps are projected and discounted using forward rates from the swap yield curve at the repricing dates. The net impact in these financial instruments’ fair values which would be caused by increasing or decreasing the interest rates by 10 percent from the market rates at October 30, 2022 and October 31, 2021 would have been approximately $50 million and $20 million, respectively.
The company continues to transition its financing, funding, and hedging portfolios from the London Interbank Offered Rate (LIBOR) to alternative reference rates. These transition activities are not expected to have a material impact on the company’s financial statements.
Foreign Currency Risk
In the equipment operations, the company’s practice is to hedge significant currency exposures. Worldwide foreign currency exposures are reviewed quarterly. Based on the anticipated and committed foreign currency cash inflows, outflows, and hedging policy for the next twelve months, the company estimates that a hypothetical 10 percent strengthening of the U.S. dollar relative to other currencies through 2023 would decrease the 2023 expected net cash inflows by approximately $125 million, with the estimated impacts by currency as follows:
(In millions of dollars) | | 2023 | | |
Australian dollar | | $ | (100) | |
Brazilian real | | | (150) | |
British pound | | | (25) | |
Canadian dollar | | | (25) | |
Euro | | | 50 | |
Japanese yen | | | 125 | |
Mexican peso | | | 25 | |
All other | | | (25) | |
Total increase (decrease) | | $ | (125) | |
At October 31, 2021, a hypothetical 10 percent strengthening of the U.S. dollar under similar assumptions and calculations indicated a potential $110 million decrease on the 2022 net cash inflows.
In the financial services operations, the company’s policy is to manage foreign currency risk through hedging strategies if the currency of the borrowings does not match the currency of the receivable portfolio. As a result, a hypothetical 10 percent adverse change in the value of the U.S. dollar relative to all other foreign currencies would not have a material effect on the financial services cash flows.
42
DEERE & COMPANY
STATEMENTS OF CONSOLIDATED INCOME
For the Years Ended October 30, 2022, October 31, 2021, and November 1, 2020
(In millions of dollars and shares except per share amounts)
|
| 2022 |
| 2021 |
| 2020 |
| |||
Net Sales and Revenues | | | | | | | | | | |
Net sales | | $ | 47,917 | | $ | 39,737 | | $ | 31,272 | |
Finance and interest income | |
| 3,365 | |
| 3,296 | |
| 3,450 | |
Other income | |
| 1,295 | |
| 991 | |
| 818 | |
Total | |
| 52,577 | |
| 44,024 | |
| 35,540 | |
| | | | | | | | | | |
Costs and Expenses | | | | | | | | | | |
Cost of sales | |
| 35,338 | |
| 29,116 | |
| 23,677 | |
Research and development expenses | |
| 1,912 | |
| 1,587 | |
| 1,644 | |
Selling, administrative and general expenses | |
| 3,863 | |
| 3,383 | |
| 3,477 | |
Interest expense | |
| 1,062 | |
| 993 | |
| 1,247 | |
Other operating expenses | |
| 1,275 | |
| 1,343 | |
| 1,612 | |
Total | |
| 43,450 | |
| 36,422 | |
| 31,657 | |
| | | | | | | | | | |
Income of Consolidated Group before Income Taxes | |
| 9,127 | |
| 7,602 | |
| 3,883 | |
Provision for income taxes | |
| 2,007 | |
| 1,658 | |
| 1,082 | |
| | | | | | | | | | |
Income of Consolidated Group | |
| 7,120 | |
| 5,944 | |
| 2,801 | |
Equity in income (loss) of unconsolidated affiliates | |
| 10 | |
| 21 | |
| (48) | |
| | | | | | | | | | |
Net Income | |
| 7,130 | |
| 5,965 | |
| 2,753 | |
Less: Net income (loss) attributable to noncontrolling interests | |
| (1) | |
| 2 | |
| 2 | |
Net Income Attributable to Deere & Company | | $ | 7,131 | | $ | 5,963 | | $ | 2,751 | |
| | | | | | | | | | |
Per Share Data | | | | | | | | | | |
Basic | | $ | 23.42 | | $ | 19.14 | | $ | 8.77 | |
Diluted | | $ | 23.28 | | $ | 18.99 | | $ | 8.69 | |
Dividends declared | | $ | 4.36 | | $ | 3.61 | | $ | 3.04 | |
Dividends paid | | $ | 4.28 | | $ | 3.32 | | $ | 3.04 | |
| | | | | | | | | | |
Average Shares Outstanding | | | | | | | | | | |
Basic | |
| 304.5 | |
| 311.6 | |
| 313.5 | |
Diluted | |
| 306.3 | |
| 314.0 | |
| 316.6 | |
The notes to consolidated financial statements are an integral part of this statement.
43
DEERE & COMPANY
STATEMENTS OF CONSOLIDATED COMPREHENSIVE INCOME
For the Years Ended October 30, 2022, October 31, 2021, and November 1, 2020
(In millions of dollars)
|
| 2022 |
| 2021 |
| 2020 |
| |||
Net Income | | $ | 7,130 | | $ | 5,965 | | $ | 2,753 | |
| | | | | | | | | | |
Other Comprehensive Income (Loss), Net of Income Taxes | | | | | | | | | | |
Retirement benefits adjustment | |
| 645 | |
| 2,884 | |
| (3) | |
Cumulative translation adjustment | |
| (1,116) | |
| 118 | |
| 55 | |
Unrealized gain on derivatives | |
| 63 | |
| 16 | |
| 2 | |
Unrealized gain (loss) on debt securities | |
| (109) | |
| (18) | |
| 14 | |
| | | | | | | | | | |
Other Comprehensive Income (Loss), Net of Income Taxes | |
| (517) | |
| 3,000 | |
| 68 | |
| | | | | | | | | | |
Comprehensive Income of Consolidated Group | |
| 6,613 | |
| 8,965 | |
| 2,821 | |
Less: Comprehensive income (loss) attributable to noncontrolling interests | |
| (16) | |
| 2 | |
| 2 | |
Comprehensive Income Attributable to Deere & Company | | $ | 6,629 | | $ | 8,963 | | $ | 2,819 | |
The notes to consolidated financial statements are an integral part of this statement.
44
DEERE & COMPANY
CONSOLIDATED BALANCE SHEETS
As of October 30, 2022 and October 31, 2021
(In millions of dollars)
|
| 2022 |
| 2021 |
| ||
ASSETS | | | | | | | |
Cash and cash equivalents | | $ | 4,774 | | $ | 8,017 | |
Marketable securities | |
| 734 | |
| 728 | |
Trade accounts and notes receivable - net | |
| 6,410 | |
| 4,208 | |
Financing receivables - net | |
| 36,634 | |
| 33,799 | |
|
| 5,936 | |
| 4,659 | | |
Other receivables | |
| 2,492 | |
| 1,765 | |
Equipment on operating leases - net | |
| 6,623 | |
| 6,988 | |
Inventories | |
| 8,495 | |
| 6,781 | |
Property and equipment - net | |
| 6,056 | |
| 5,820 | |
Goodwill | |
| 3,687 | |
| 3,291 | |
Other intangible assets - net | |
| 1,218 | |
| 1,275 | |
Retirement benefits | |
| 3,730 | |
| 3,601 | |
Deferred income taxes | |
| 824 | |
| 1,037 | |
Other assets | |
| 2,417 | |
| 2,145 | |
Total Assets | | $ | 90,030 | | $ | 84,114 | |
| | | | | | | |
LIABILITIES AND STOCKHOLDERS’ EQUITY | | | | | | | |
| | | | | | | |
LIABILITIES | | | | | | | |
Short-term borrowings | | $ | 12,592 | | $ | 10,919 | |
Short-term securitization borrowings | |
| 5,711 | |
| 4,605 | |
Accounts payable and accrued expenses | |
| 14,822 | |
| 12,348 | |
Deferred income taxes | |
| 495 | |
| 576 | |
Long-term borrowings | |
| 33,596 | |
| 32,888 | |
Retirement benefits and other liabilities | |
| 2,457 | |
| 4,344 | |
Total liabilities | |
| 69,673 | |
| 65,680 | |
| | | | | | | |
Commitments and contingencies (Note 20) | | | | | | | |
Redeemable noncontrolling interest (Note 3) | | | 92 | | | | |
| | | | | | | |
STOCKHOLDERS’ EQUITY | | | | | | | |
Common stock, $1 par value (authorized – 1,200,000,000 shares; | |
| 5,165 | |
| 5,054 | |
Common stock in treasury, 237,659,289 shares in 2022 and 228,366,144 shares in 2021, at cost | |
| (24,094) | |
| (20,533) | |
Retained earnings | |
| 42,247 | |
| 36,449 | |
Accumulated other comprehensive income (loss) | |
| (3,056) | |
| (2,539) | |
Total Deere & Company stockholders’ equity | |
| 20,262 | |
| 18,431 | |
Noncontrolling interests | |
| 3 | |
| 3 | |
Total stockholders’ equity | |
| 20,265 | |
| 18,434 | |
Total Liabilities and Stockholders’ Equity | | $ | 90,030 | | $ | 84,114 | |
The notes to consolidated financial statements are an integral part of this statement.
45
DEERE & COMPANY
STATEMENTS OF CONSOLIDATED CASH FLOWS
For the Years Ended October 30, 2022, October 31, 2021, and November 1, 2020
(In millions of dollars)
|
| 2022 |
| 2021 |
| 2020 |
| |||
Cash Flows from Operating Activities | | | | | | | | | | |
Net income | | $ | 7,130 | | $ | 5,965 | | $ | 2,753 | |
Adjustments to reconcile net income to net cash provided by operating activities: | | | | | | | | | | |
Provision (credit) for credit losses | |
| 192 | |
| (6) | |
| 110 | |
Provision for depreciation and amortization | |
| 1,895 | |
| 2,050 | |
| 2,118 | |
Impairment charges | |
| 88 | |
| 50 | |
| 194 | |
Share-based compensation expense | |
| 85 | |
| 82 | |
| 81 | |
Loss on sales of businesses and unconsolidated affiliates | | | | | | | | | 24 | |
Gain on remeasurement of previously held equity investment | | | (326) | | | | | | | |
Credit for deferred income taxes | |
| (66) | |
| (441) | |
| (11) | |
Changes in assets and liabilities: | | | | | | | | | | |
Trade, notes, and financing receivables related to sales | |
| (2,483) | |
| 969 | |
| 2,009 | |
Inventories | |
| (2,091) | |
| (2,497) | |
| 397 | |
Accounts payable and accrued expenses | |
| 1,133 | |
| 1,884 | |
| (7) | |
Accrued income taxes payable/receivable | |
| 141 | |
| 11 | |
| 8 | |
Retirement benefits | |
| (1,015) | |
| 29 | |
| (537) | |
Other | |
| 16 | |
| (370) | |
| 344 | |
Net cash provided by operating activities | |
| 4,699 | |
| 7,726 | |
| 7,483 | |
| | | | | | | | | | |
Cash Flows from Investing Activities | | | | | | | | | | |
Collections of receivables (excluding receivables related to sales) | |
| 20,907 | |
| 18,959 | |
| 17,381 | |
Proceeds from sales of equipment on operating leases | |
| 2,093 | |
| 2,094 | |
| 1,783 | |
Cost of receivables acquired (excluding receivables related to sales) | |
| (26,300) | |
| (23,653) | |
| (19,965) | |
Acquisitions of businesses, net of cash acquired | | | (498) | |
| (244) | |
| (66) | |
Purchases of property and equipment | |
| (1,134) | |
| (848) | |
| (820) | |
Cost of equipment on operating leases acquired | |
| (2,654) | |
| (1,732) | |
| (1,836) | |
Collateral on derivatives - net | | | (642) | | | (281) | | | 268 | |
Other | |
| (257) | |
| (45) | |
| (64) | |
Net cash used for investing activities | |
| (8,485) | |
| (5,750) | |
| (3,319) | |
| | | | | | | | | | |
Cash Flows from Financing Activities | | | | | | | | | | |
Increase (decrease) in total short-term borrowings | |
| 3,852 | |
| 818 | |
| (1,360) | |
Proceeds from long-term borrowings | |
| 10,358 | |
| 8,722 | |
| 9,271 | |
Payments of long-term borrowings | |
| (8,445) | |
| (7,090) | |
| (7,383) | |
Proceeds from issuance of common stock | |
| 63 | |
| 148 | |
| 331 | |
Repurchases of common stock | |
| (3,597) | |
| (2,538) | |
| (750) | |
Dividends paid | |
| (1,313) | |
| (1,040) | |
| (956) | |
Other | |
| (92) | |
| (98) | |
| (133) | |
Net cash provided by (used for) financing activities | |
| 826 | |
| (1,078) | |
| (980) | |
| | | | | | | | | | |
Effect of Exchange Rate Changes on Cash, Cash Equivalents, and Restricted Cash | |
| (224) | |
| 55 | |
| 32 | |
| | | | | | | | | | |
Net Increase (Decrease) in Cash, Cash Equivalents, and Restricted Cash | |
| (3,184) | |
| 953 | |
| 3,216 | |
Cash, Cash Equivalents, and Restricted Cash at Beginning of Year | |
| 8,125 | |
| 7,172 | |
| 3,956 | |
Cash, Cash Equivalents, and Restricted Cash at End of Year | | $ | 4,941 | | $ | 8,125 | | $ | 7,172 | |
| | | | | | | | | | |
Components of cash, cash equivalents, and restricted cash | | | | | | | | | | |
Cash and cash equivalents | | $ | 4,774 | | $ | 8,017 | | $ | 7,066 | |
| | 167 | | | 108 | | | 106 | | |
Total cash, cash equivalents, and restricted cash | | $ | 4,941 | | $ | 8,125 | | $ | 7,172 | |
The notes to consolidated financial statements are an integral part of this statement.
46
DEERE & COMPANY
STATEMENTS OF CHANGES IN CONSOLIDATED STOCKHOLDERS’ EQUITY
For the Years Ended November 1, 2020, October 31, 2021, and October 30, 2022
(In millions of dollars)
| | | | | Total Stockholders’ Equity | | | | | | |||||||||||||
| | | | | Deere & Company Stockholders | | | | | | | | | ||||||||||
|
| | |
| | |
| | |
| | |
| Accumulated |
| | |
|
| | | | |
| | Total | | | | | | | | | | | Other | | | | | Redeemable |
| ||||
| | Stockholders’ | | Common | | Treasury | | Retained | | Comprehensive | | Noncontrolling | | | Noncontrolling | | |||||||
| | Equity | | Stock | | Stock | | Earnings | | Income (Loss) | | Interests | | | Interest | | |||||||
Balance November 3, 2019 | | $ | 11,417 | | $ | 4,642 | | $ | (17,474) | | $ | 29,852 | | $ | (5,607) | | $ | 4 | | | $ | 14 | |
| | | | | | | | | | | | | | | | | | | | | | | |
Net income | |
| 2,752 | | | | | | | | | 2,751 | | | | | | 1 | | | | 1 | |
Other comprehensive income | |
| 68 | | | | | | | | | | | | 68 | | | | | |
| | |
Repurchases of common stock | |
| (750) | | | | | | (750) | | | | | | | | | | | | | | |
Treasury shares reissued | |
| 159 | | | | | | 159 | | | | | | | | | | | | | | |
Dividends declared | |
| (956) | | | | | | | | | (955) | | | | | | (1) | | |
| (1) | |
Noncontrolling interest redemption (Note 4) | | | | | | | | | | | | | | | | | | | | | | (14) | |
Share based awards and other | |
| 254 | | | 253 | | | | | | (2) | | | | | | 3 | | | | | |
Balance November 1, 2020 | |
| 12,944 | |
| 4,895 | |
| (18,065) | |
| 31,646 | |
| (5,539) | |
| 7 | | |
| | |
| | | | | | | | | | | | | | | | | | | | | | | |
ASU No. 2016-13 adoption | | | (35) | | | | | | | | | (35) | | | | | | | | | | | |
Net income | |
| 5,965 | | | | | | | | | 5,963 | | | | | | 2 | | | | | |
Other comprehensive income | |
| 3,000 | | | | | | | | | | | | 3,000 | | | | | |
| | |
Repurchases of common stock | |
| (2,538) | | | | | | (2,538) | | | | | | | | | | | | | | |
Treasury shares reissued | |
| 70 | | | | | | 70 | | | | | | | | | | | | | | |
Dividends declared | |
| (1,127) | | | | | | | | | (1,125) | | | | | | (2) | | |
| | |
Share based awards and other | |
| 155 | | | 159 | | | | | | | | | | | | (4) | | | | | |
Balance October 31, 2021 | |
| 18,434 | |
| 5,054 | |
| (20,533) | |
| 36,449 | |
| (2,539) | |
| 3 | | |
| | |
| | | | | | | | | | | | | | | | | | | | | | | |
Acquisitions (see Note 3) | | | | | | | | | | | | | | | | | | | | | | 104 | |
Net income (loss) | |
| 7,133 | | | | | | | | | 7,131 | | | | | | 2 | | | | (3) | |
Other comprehensive loss | |
| (517) | | | | | | | | | | | | (517) | | | | | |
| (15) | |
Repurchases of common stock | |
| (3,597) | | | | | | (3,597) | | | | | | | | | | | | | | |
Treasury shares reissued | |
| 36 | | | | | | 36 | | | | | | | | | | | | | | |
Dividends declared | |
| (1,329) | | | | | | | | | (1,327) | | | | | | (2) | | |
| | |
Share based awards and other | |
| 105 | | | 111 | | | | | | (6) | | | | | | | | | | 6 | |
Balance October 30, 2022 | | $ | 20,265 | | $ | 5,165 | | $ | (24,094) | | $ | 42,247 | | $ | (3,056) | | $ | 3 | | | $ | 92 | |
The notes to consolidated financial statements are an integral part of this statement.
47
NOTES TO CONSOLIDATED FINANCIAL STATEMENTS
1. ORGANIZATION AND CONSOLIDATION
Deere & Company has been developing innovative solutions to help its customers become more profitable for 185 years. References to Deere & Company, John Deere, Deere, or the company include its consolidated subsidiaries and consolidated variable interest entities (VIEs). The company is managed through the following operating segments: production and precision agriculture (PPA), small agriculture and turf (SAT), construction and forestry (CF), and financial services (FS). References to “equipment operations” include production and precision agriculture, small agriculture and turf, and construction and forestry, while references to “agriculture and turf” include both production and precision agriculture and small agriculture and turf.
Principles of Consolidation
The consolidated financial statements represent the consolidation of all companies in which Deere & Company has a controlling interest. Certain VIEs are consolidated since the company is the primary beneficiary. The primary beneficiary has both the power to direct the activities that most significantly impact the VIEs’ economic performance and the obligation to absorb losses or the right to receive benefits that could potentially be significant to the VIEs. The company consolidates certain VIEs related to retail note securitizations (see Note 12). Deere & Company records its investment in each unconsolidated affiliated company (20 to 50 percent ownership) at cost, plus or minus the company’s share of the profit or loss after acquisition and further reduced for any dividends (see Note 16). Other investments (less than 20 percent ownership) are recorded at cost.
Fiscal Year
The company uses a 52/53 week fiscal year ending on the last Sunday in the reporting period, which generally occurs near the end of October. An additional week is included in the fourth fiscal quarter every five or six years to realign the company’s fiscal quarters with the calendar. The fiscal year ends for 2022, 2021, and 2020 were October 30, 2022, October 31, 2021, and November 1, 2020, respectively. Fiscal years 2022, 2021, and 2020 contained 52 weeks. Unless otherwise stated, references to particular years or quarters refer to the company’s fiscal years and the associated periods in those fiscal years.
Wirtgen Reporting Lag Removal
Prior to November 2, 2020, the operating results of the Wirtgen Group (Wirtgen) were incorporated into the company’s consolidated financial statements using a one-month lag period. The reporting lag was eliminated resulting in one additional month of Wirtgen activity in 2021. The effect was an increase to fiscal year 2021 “Net sales” of $270 million, which the company considers immaterial to construction and forestry’s annual net sales. Fiscal year 2020 results were not restated.
Argentina
The company has equipment operations and financial services operations in Argentina. The U.S. dollar has historically been the functional currency for the company’s Argentina operations, as its business is indexed to the U.S. dollar due to the highly inflationary conditions. The Argentine government has certain capital and
currency controls that restrict the company’s ability to access U.S. dollars in Argentina and remit earnings from its Argentine operations. As of October 30, 2022 and October 31, 2021, the company's net investment in Argentina was approximately $742 million and $578 million, respectively. Net sales and revenues from the company’s Argentine operations represented approximately 1 percent of consolidated net sales and revenues for 2022. The company has employed mechanisms to convert Argentine pesos into U.S. dollars to the extent possible. The net peso exposure was not material as of October 30, 2022 and October 31, 2021. Argentine peso-denominated monetary assets and liabilities are remeasured at each balance sheet date using the official currency exchange rate.
2. SUMMARY OF SIGNIFICANT ACCOUNTING POLICIES AND NEW ACCOUNTING STANDARDS
The following are significant accounting policies in addition to those included in other notes to the consolidated financial statements.
Use of Estimates in Financial Statements
The preparation of financial statements in conformity with accounting principles generally accepted in the U.S. requires management to make estimates and assumptions that affect the reported amounts and related disclosures. Actual results could differ from those estimates.
Revenue Recognition
Sales of equipment and service parts are recognized when the company transfers control of the good to the independent customer, which generally occurs upon shipment. In most situations, the independent customer is a dealer, which subsequently sells the equipment and service parts purchased from the company to a retail customer, who can finance the equipment with the financial services segment or another source of financing. In some situations, the company sells directly to a retail customer. The term “customer” includes both dealers and retail customers to whom the company makes direct sales.
Prior to 2022, certain goods were shipped to dealers in Canada on a consignment basis under which the risks and rewards of ownership were not transferred to the dealer at the time the goods are shipped. Accordingly, sales for consigned goods were not recorded until a retail customer purchased the goods or the goods were otherwise removed from the dealer’s inventory. The dealer contract in Canada was changed such that all goods delivered after November 1, 2021 are delivered on terms, resulting in transfer of control and revenue recognition upon delivery of all goods. For certain goods delivered to Canadian dealers prior to November 1, 2021, the dealer consignment terms already in place remain in effect. As of October 30, 2022 and October 31, 2021, the remaining consigned inventory was $7 million and $150 million, respectively. Consignment terms are not prevalent in any other market.
In limited instances, equipment is transferred to a customer or a financial institution with an obligation to repurchase the equipment for a specified amount, which is exercisable at the customer’s option. When the equipment is expected to be
48
repurchased, those arrangements are accounted for as leases. No sale is recorded at the time of the equipment transfer, and the difference between sale price and the specified repurchase amount is recognized as revenue on a straight-line basis until the customer’s option expires. When this equipment is not expected to be repurchased, a sale is recorded with a return obligation.
Under the terms of sales agreements with dealers, interest-free periods are determined based on the type of equipment sold and the time of year of the sale. These periods range from to twelve months for most equipment. Interest-free periods may not be extended. Interest is charged to dealers on outstanding balances, from the earlier of the date when goods are sold to a retail customer by the dealer or the expiration of the interest-free period granted at the time of the sale to the dealer, until payment is received by the company. Interest charged may not be forgiven and the past due interest rates exceed market rates. Dealers cannot cancel purchases after the company recognizes a sale and are responsible for payment even if the equipment is not sold to retail customers. If the interest-free or below market interest rate period exceeds one year, the company adjusts the expected sales revenue for the effects of the time value of money using a current market interest rate. The revenue related to the financing component is recognized in “Finance and interest income” using the interest method. The company does not adjust the sales price to account for a financing component if the expected interest-free or below market period is one year or less.
Generally, no right of return exists on sales of equipment. Service parts and certain attachments returns are estimable and accrued at the time a sale is recognized. The estimated returns are recorded in “Other assets” for the inventory value of estimated returns, adjusted for restocking fees. The estimated dealer refund liability, adjusted for restocking fees, is recorded in “Accounts payable and accrued expenses.” The estimated returns are based on historical return rates, current dealer inventory levels, and current economic conditions.
The company remanufactures used engines and components (cores) that are sold to dealers and retail customers for maintenance and repair parts. Revenue for remanufactured components is recognized using the same criteria as other parts sales. When a remanufactured part is sold, the company collects a deposit that is repaid if the customer returns a core that meets certain specifications within a defined time period. The deposit received from the customer is recognized as a liability in “Accounts payable and accrued expenses” and the used component that is expected to be returned is recognized in “Other assets” in the consolidated balance sheets. When a customer returns a core, the deposit is repaid, the liability reversed, and the returned core is recorded in inventory to be remanufactured and sold to another customer. If a core is not returned within the required time, the deposit is recognized as revenue in “Net sales,” and the estimated core return is recorded as an expense in “Cost of sales” in the statements of consolidated income.
Certain equipment is sold with precision guidance, telematics, and other information gathering and analyzing capabilities. These
technology solutions require hardware, software, and may include an obligation to provide services for a period of time. These solutions are mostly bundled with the sale of the equipment but can also be purchased or renewed separately. The revenue related to the hardware and embedded software is recognized at the time of the equipment sale and recorded in “Net sales” in the statements of consolidated income. The revenue for the future services is deferred and recognized over the service period. The deferred revenue is recorded as a contract liability in “Accounts payable and accrued expenses” in the consolidated balance sheets and is recognized in “Other income” with the associated expenses recognized in “Other operating expenses” in the statements of consolidated income.
Financing revenue is recorded over the lives of the related receivables using the interest method. Deferred costs on the origination of financing receivables are recognized as a reduction in “Finance and interest income” over the expected lives of the receivables using the interest method. Income and deferred costs on the origination of operating leases are recognized on a straight-line basis over the scheduled lease terms in “Finance and interest income.”
Sales Incentives
At the time of the sale to a dealer, the company records an estimated cost of sales incentive programs as a reduction to the sales price. The estimated cost is based on historical data, announced and expected incentive programs, field inventory levels, and forecasted sales volumes. The final cost of these programs is determined at the end of the measurement period for volume-based incentives or when the dealer sells the equipment to a retail customer. Actual cost differences from the original cost estimate are recognized in “Net sales.”
Product Warranties
For most equipment and service parts sales, the company provides a standard warranty to provide assurance that the equipment will function as intended for a specified period. At the time a sale is recognized, the estimated future warranty costs are recorded. The company generally determines its total warranty liability by applying historical warranty claims rate experience to the estimated amount of equipment that has been sold and is still under warranty based on dealer inventories and retail sales. The historical claims rate is primarily determined by a review of five-year claims costs with consideration of current quality developments. The company also offers extended warranty arrangements for purchase at the customer’s option. The premiums for extended warranties are recognized in “Other income” in the statement of consolidated income primarily in proportion to the costs expected to be incurred over the contract period. The unamortized extended warranty premiums (deferred revenue) are recorded in “Accounts payable and accrued expenses” in the consolidated balance sheet (see Note 18).
Sales and Transaction Taxes
The company collects and remits taxes assessed by different governmental authorities that are both imposed on and concurrent with revenue producing transactions between the company and its
49
customers. These taxes include sales, use, value-added, and some excise taxes. The company elected to exclude these taxes from the determination of the sales price (excluded from revenues).
Contract Costs
Incremental costs of obtaining an equipment revenue contract are recognized as an expense when incurred since the amortization period would be one year or less.
Advertising Costs
Advertising costs are charged to expense as incurred. This expense was $227 million in 2022, $212 million in 2021, and $196 million in 2020.
Depreciation and Amortization
Property and equipment, capitalized software, and other intangible assets are stated at cost less accumulated depreciation or amortization. These assets are depreciated over their estimated useful lives using the straight-line method. Equipment on operating leases is depreciated over the terms of the leases using the straight-line method. Property and equipment expenditures for new and revised products, increased capacity, and the replacement or major renewal of significant items are capitalized. Expenditures for maintenance, repairs, and minor renewals are charged to expense as incurred.
Securitization of Receivables
Certain financing receivables are periodically transferred to special purpose entities (SPEs) in securitization transactions (see Note 12). These securitizations qualify as collateral for secured borrowings and no gains or losses are recognized at the time of securitization. The receivables remain on the balance sheet and are classified as “Financing receivables securitized - net.” The company recognizes finance income over the lives of these receivables using the interest method.
Receivables and Allowances
All financing and trade receivables are reported on the balance sheet at outstanding principal and accrued interest, adjusted for any write-offs, the allowance for credit losses, and any unamortized deferred fees or costs on originated financing receivables. The allowance is a reduction to the receivable balances and the provision is recorded in “Selling, administrative and general expenses.” The allowance represents an estimate of the credit losses expected over the life of the receivable portfolio. The company measures expected credit losses on a collective basis when similar risk characteristics exist. Risk characteristics considered by the company include finance product category, market, geography, credit risk, and remaining duration. Receivables that do not share risk characteristics with other receivables in the portfolio are evaluated on an individual basis.
The company utilizes loss forecast models, which are selected based on the size and credit risk of the underlying pool of receivables, to estimate expected credit losses. Transition matrix models are used for large and complex retail customer receivable pools, while weighted average remaining maturity models are used for smaller and less complex retail customer receivable pools. Expected credit losses on wholesale receivables are based on historical loss rates, with consideration of current economic
conditions and dealer financial risk. The modeled expected credit losses are adjusted based on reasonable and supportable forecasts, which may include economic indicators such as commodity prices, industry equipment sales, unemployment rates, and housing starts. Management reviews each model’s output quarterly, and qualitative adjustments are incorporated as necessary. Receivables are written-off to the allowance when the account is considered uncollectible (see Note 11).
Long-Lived Asset, Goodwill, and Other Intangible Asset Impairment
The company evaluates the carrying value of long-lived assets (including equipment on operating leases, property and equipment, goodwill, and other intangible assets) when events or circumstances warrant such a review. Goodwill and unamortized intangible assets are tested for impairment annually at the end of the third quarter of each fiscal year, and more often if events or circumstances indicate a reduction in the fair value below the carrying value. Goodwill is allocated and reviewed for impairment by reporting unit. Goodwill is allocated to the reporting unit in which the business that created the goodwill resides. To test for goodwill impairment, the carrying value of each reporting unit is compared with its fair value. If the carrying value of the goodwill is considered impaired, the impairment is measured as the excess of the reporting unit’s carrying value over the fair value, with a limit of the goodwill allocated to that reporting unit. If the carrying value of the long-lived asset is considered impaired, a loss is recognized based on the amount by which the carrying value exceeds the fair value of the asset (see Notes 4 and 25).
Derivative Financial Instruments
It is the company’s policy that derivative transactions are executed only to manage exposures arising in the normal course of business and not for the purpose of creating speculative positions or trading. The company’s financial services operations manage the relationship of the types and amounts of their funding sources to their receivable and lease portfolio in an effort to diminish risk due to interest rate and foreign currency fluctuations, while responding to favorable financing opportunities. The company also has foreign currency exposures at some of its foreign and domestic operations related to buying, selling, and financing in currencies other than the functional currencies. In addition, the company has interest rate and foreign currency exposure at certain equipment operations units for sales incentive programs.
All derivatives are recorded at fair value on the consolidated balance sheets. Cash collateral received or paid is not offset against the derivative fair values on the balance sheet. The cash flows from the derivative contracts are recorded in operating activities in the statements of consolidated cash flows. Each derivative is designated as a cash flow hedge, fair value hedge, or remains undesignated. Changes in the fair value of derivatives that are designated and effective as cash flow hedges are recorded in other comprehensive income (OCI) and reclassified to the income statement when the effects of the item being hedged are recognized in the income statement. Changes in the fair value of derivatives that are designated and effective as fair value hedges are recognized currently in net income. These changes are offset in net income by fair value changes related to the risk being hedged
50
on the hedged item. Changes in the fair value of undesignated hedges are recognized currently in the income statement.
All designated hedges are formally documented as to the relationship with the hedged item as well as the risk-management strategy. Both at inception and on an ongoing basis the hedging instrument is assessed as to its effectiveness. If and when a derivative is determined not to be highly effective as a hedge, the underlying hedged transaction is no longer likely to occur, the hedge designation is removed, or the derivative is terminated, hedge accounting is discontinued (see Note 26).
Foreign Currency Translation
The functional currencies for most of the company’s foreign operations are their respective local currencies. The assets and liabilities of these operations are translated into U.S. dollars at the end of the period exchange rates. The revenues and expenses are translated at weighted-average rates for the period. The gains or losses from these translations are recorded in OCI. Gains or losses from transactions denominated in a currency other than the functional currency of the subsidiary involved and foreign exchange components of derivative contracts are included in net income, with trade flow activity recorded in Cost of sales, sales incentive activity recorded in Net sales, and all other activity recorded in Other operating expenses. The pretax net gain (loss) for foreign exchange in 2022, 2021, and 2020 was ($175) million, ($134) million, and $18 million, respectively.
New Accounting Standards
The company closely monitors all Accounting Standard Updates (ASUs) issued by the Financial Accounting Standards Board (FASB) and other authoritative guidance. The company adopted the following standards in 2022, none of which had a material effect on the company’s consolidated financial statements:
Accounting Standards Updates |
|
No. 2019-12 — Simplifying the Accounting for Income Taxes, which amends ASC 740, Income Taxes | |
No. 2020-08 — Codification Improvements to Subtopic 310-20, Receivables – Nonrefundable Fees and Other Costs | |
ASUs to be adopted in future periods are being evaluated and at this point are not expected to have a material impact on the company’s financial statements. The FASB issued ASU No. 2022-04, Liabilities – Supplier Finance Programs, which enhances the transparency about the use of supplier finance programs. Deere has not entered into any material supplier finance programs in connection with buying goods or services.
3. ACQUISITIONS AND DISPOSITIONS
Acquisitions
Kreisel
In February 2022, the company acquired majority ownership in Kreisel Electric Inc. (Kreisel), a pioneer in the development of immersion-cooled battery technology. The Austrian company manufactures high-density, high-durability electric battery modules and packs for high-performance and off-highway applications and has created a battery-buffered, high-powered charging infrastructure platform.
The transaction includes a call option to purchase the remaining ownership interest in Kreisel in 2027. The minority interest holders also have a put option that would require the company to purchase the holder’s ownership interest in 2027. The put and call options cannot be separated from the noncontrolling interest. Due to the redemption features, the minority interest is classified as redeemable noncontrolling interest in the company’s consolidated balance sheets.
The total cash purchase price was $276 million, consisting of $253 million for the acquired equity interests, $21 million to reduce the option price, and customary working capital adjustments, net of cash acquired. The preliminary fair values assigned to the assets and liabilities of the acquired entity in millions of dollars, which is based on information as of the acquisition date and available at October 30, 2022 follows:
| | February 2022 | | |
Trade accounts and notes receivable | | $ | 2 | |
Other receivables | | | 11 | |
Inventories | | | 11 | |
Property and equipment | | | 11 | |
Goodwill | | | 218 | |
Other intangible assets | | | 178 | |
Other assets | | | 6 | |
Total assets | | $ | 437 | |
| | | | |
Accounts payable and accrued expenses | | $ | 26 | |
Deferred income taxes | | | 39 | |
| | | | |
Redeemable noncontrolling interest | | $ | 96 | |
The identifiable intangible assets were related to technology, trade name, and customer relationships with a weighted average amortization period of 12 years. The goodwill is not deductible for income tax purposes. Kreisel will be allocated amongst the company’s production and precision agriculture, small agriculture and turf, and construction and forestry segments.
51
Excavator Factories
In March 2022, the company acquired full ownership of three former Deere-Hitachi joint venture factories and began new license and supply agreements with Hitachi Construction Machinery Co., Ltd. (Hitachi). The two companies also ended their joint venture manufacturing and marketing agreements. The former joint venture factories continue to manufacture Deere-branded construction excavators and forestry equipment. Through a new supply agreement with Hitachi, Deere continues to offer a full portfolio of excavators. Deere’s marketing arrangement for Hitachi-branded construction excavators and mining equipment in the Americas ended with Hitachi assuming distribution and support of these products. John Deere dealers may continue to support their existing field population of Hitachi-branded excavators.
With the completion of this acquisition, the company now has complete control over its excavator design, product, and feature updates, making it possible to more rapidly respond to customer requirements and integrate excavators with other construction products in the John Deere product portfolio. The company can leverage technology developed for other product lines and production systems across the enterprise and extend those advanced solutions to Deere-designed excavators, strengthening the entire product portfolio. The total invested capital is as follows in millions of dollars:
| | March 2022 | | |
Cash consideration for factories | | $ | 205 | |
Cash consideration for license agreement | | | 70 | |
Deferred consideration | | | 271 | |
Total purchase price consideration | | | 546 | |
Less: Cash obtained | | | (187) | |
Less: Settlement of intercompany balances | | | (113) | |
Net purchase price consideration | | | 246 | |
Fair value of previously held equity investment | | | 444 | |
Total invested capital | | $ | 690 | |
The total purchase price consideration includes deferred consideration that will be paid as the company purchases Deere-branded excavators, components, and service parts from Hitachi under the new supply agreement with a duration that ranges from to 30 years. The deferred consideration represents the price increases under the new supply arrangement. Excluding inflation adjustments, the price increases for products to be acquired by the company from Hitachi are as much as 27 percent higher than the prior supply arrangement. At October 30, 2022, the net present value of the deferred consideration was approximately $236 million, subject to changes in market conditions, developments in the company’s product offerings, and sourcing changes. The company financed the acquisition and associated transaction expenses from cash on hand. The fair value of the previously held equity investment created a non-cash gain of $326 million (pretax and ), which was recorded in Other income and included in the construction and forestry segment’s operating profit.
Prior to the acquisition, the company purchased Deere and Hitachi-branded excavators, components, and parts from the Deere-Hitachi joint venture factories for sale to John Deere dealers. These purchases were included in Cost of sales, while the sales to John Deere dealers were included in Net sales. Cost of sales also included profit-sharing payments to Hitachi in accordance with the previous marketing agreements. Following the acquisition, Net sales only includes the sale of Deere-branded excavators to John Deere dealers, while Cost of sales reflects market pricing to purchase and manufacture excavators, as well as the related components and service parts.
The preliminary fair values assigned to the assets and liabilities of the acquired factories in millions of dollars, which are based on information as of the acquisition date and available at October 30, 2022, follow:
| | March 2022 | | |
Other receivables | | $ | 29 | |
Inventories | | | 286 | |
Property and equipment | | | 180 | |
Goodwill | | | 529 | |
Other intangible assets | | | 70 | |
Deferred income taxes | | | 56 | |
Other assets | | | 3 | |
Total assets | | $ | 1,153 | |
| | | | |
Accounts payable and accrued expenses | | $ | 300 | |
Long-term borrowings | | | 163 | |
Total liabilities | | $ | 463 | |
The identifiable intangible assets were related to technology with a amortization period. The goodwill is not deductible for income tax purposes. The excavator factories will be reported in the company’s construction and forestry segment.
52
Other Acquisitions
In 2022, the company acquired AgriSync Inc. (AgriSync), a technology service provider; an 80 percent stake in both SureFire Ag Systems, Inc. and SureFire Electronics, LLC (renamed after acquisition and collectively referred to as SurePoint), which design and manufacture liquid fertilizer application and spray tendering systems; a 40 percent equity method investment in GUSS Automation LLC (GUSS Automation), a pioneer in semi-autonomous orchard and vineyard sprayers; LGT, LLC (Light), which specializes in depth sensing and camera-based perception for autonomous vehicles; and an equity method investment in InnerPlant, Inc. (InnerPlant), an early-stage biotech company. The combined cost of these acquisitions was $134 million, net of cash acquired of $3 million. The preliminary asset and liability fair values at the respective acquisition dates follow in millions of dollars:
| | October 2022 | | |
Trade accounts and notes receivable | | $ | 8 | |
Inventories | | | 8 | |
Property and equipment | | | 4 | |
Goodwill | | | 53 | |
Other intangible assets | | | 21 | |
Other assets | | | 60 | |
Total assets | | $ | 154 | |
| | | | |
Accounts payable and accrued expenses | | $ | 6 | |
Deferred income taxes | | | 5 | |
Total liabilities | | $ | 11 | |
| | | | |
Redeemable noncontrolling interest | | $ | 9 | |
The identifiable intangible assets were related to trade name, technology, and customer relationships with a weighted average amortization period of 7 years. AgriSync was allocated amongst the company’s production and precision agriculture, small agriculture and turf, and construction and forestry segments, while SurePoint, Light, and InnerPlant were allocated to the production and precision agriculture segment. GUSS Automation was assigned to the small agriculture and turf segment.
Bear Flag
In August 2021, the company acquired Bear Flag Robotics, Inc. (Bear Flag) to further accelerate Deere’s development and delivery of advanced technology. Bear Flag’s technology is complementary to other Deere technology efforts and enables autonomous tractor operations. The total cash purchase price before final adjustments, net of cash acquired of $4 million, was $225 million, with an additional $25 million to be recognized as compensation expense over the four-year post-acquisition service period. In addition to the cash purchase price, $19 million of liabilities were assumed. The asset and liability fair values at the acquisition date in millions of dollars follow:
| | August 2021 | | |
Property and equipment | | $ | 1 | |
Goodwill | | | 189 | |
Other intangible assets | | | 54 | |
Total assets | | $ | 244 | |
| | | | |
Accounts payable and accrued expenses | | $ | 1 | |
Deferred income taxes | | | 18 | |
Total liabilities | | $ | 19 | |
The identified intangible was related to technology with a seven-year amortization period. The goodwill will not be deductible for tax purposes.
Unimil
In September 2020, the company acquired Unimil, a leading Brazilian company in the after-sales service parts business for sugarcane harvesters, which is based in Piracicaba, Brazil. The total cash purchase price, net of cash acquired of $5 million, was $66 million, with $6 million funded to an escrow to secure certain indemnity obligations. In addition to the cash purchase price, $14 million of liabilities were assumed. The asset and liability fair values at the acquisition date in millions of dollars follow:
| | September 2020 | | |
Trade accounts and notes receivable | | $ | 5 | |
Other receivables | | | 2 | |
Inventories | | | 10 | |
Property and equipment | | | 22 | |
Goodwill | | | 28 | |
Other intangible assets | | | 13 | |
Total assets | | $ | 80 | |
| | | | |
Accounts payable and accrued expenses | | $ | 5 | |
Deferred income taxes | | | 9 | |
Total liabilities | | $ | 14 | |
The identified intangibles were related to customer relationships, trade name, and a non-compete agreement. The weighted-average amortization period is approximately nine years. The goodwill is not deductible for tax purposes.
For the acquisitions, the goodwill was the result of future cash flows and related fair value exceeding the fair value of the identified assets and liabilities. The results of these operations have been included in the company’s consolidated financial
53
statements, and the pro forma results of operations as if these acquisitions had occurred at the beginning of the current or comparative fiscal year would not differ significantly from the reported results.
Dispositions
In September 2020, the company sold its German lawn mower business. At the time of the sale, total assets were $26 million, which were recorded in “Other assets,” and total liabilities were $5 million, which were recorded in “Accounts payable and accrued expenses.” No cash proceeds were received, resulting in a loss on sale, including transaction costs, of $24 million pretax and . The loss was recorded with a pretax and after-tax accrual recognized in the third quarter of 2020 when a definitive sale agreement was finalized. The loss was recorded in “Other operating expenses” in the small agriculture and turf segment.
4. SPECIAL ITEMS
UAW Collective Bargaining Agreement
In November 2021, employees represented by the International Union, United Automobile, Aerospace and Agricultural Implement Workers of America (UAW) approved a new collective bargaining agreement. The agreement, which has a term of six years, covers the wages, hours, benefits, and other terms and conditions of employment for the company’s UAW-represented employees at 14 U.S. facilities. The labor agreement included a lump sum ratification bonus payment of $8,500 per eligible employee, totaling $90 million, and an immediate wage increase of 10 percent plus further wage increases over the term of the contract. The lump sum payment was expensed in the first quarter of 2022. The company remeasured the U.S. hourly pension plan as of November 30, 2021 due to the new collective bargaining agreement. See Note 7 for more information on the U.S. hourly plan remeasurement.
Impact of Events in Russia / Ukraine
The events in Russia / Ukraine have resulted in the company suspending shipments of machines and service parts to Russia. The company manufactures and markets equipment and provides financial services in Russia. As of October 30, 2022, the company’s net exposure in Russia / Ukraine was approximately $266 million, including ruble exposure of $31 million (ruble-denominated financial assets, net of cross-currency interest rate contracts). Net sales from the company’s Russian operations represented 2 percent of consolidated annual Net sales from 2017 to 2021. The Ukraine operations were not material to the consolidated financial statements.
The suspension of shipments to Russia reduced the forecasted revenue for the region, which made it probable future cash flows will not cover the carrying value of certain assets. As a result, an impairment was recorded for most long-lived assets in Russia, and the company’s U.S. senior management decided to initiate a voluntary employee-separation program. The company also recorded a reserve on inventory, and increased its allowance for credit losses, reflecting economic uncertainty in Russia.
The financial services operations received an intercompany benefit from the equipment operations, which guarantees the financial services’ investments in certain international markets, including Russia.
The Russian government has imposed certain restrictions on companies’ abilities to repatriate or remit cash from their Russian-based operations to locations outside of Russia. Cash in excess of what is required to fund operations in Russia has been reclassified as restricted. The company’s U.S. senior management continues to closely monitor all financial risks to company operations in the region. A summary of the reserves, impairments, and voluntary-separation costs recorded in 2022 follows in millions of dollars. See Note 25 for fair value measurement information.
| | PPA | | SAT | | CF | | FS | | Total | | |||||
Inventory reserve – Cost of sales | | $ | 14 | | $ | 2 | | $ | 3 | | | | | $ | 19 | |
Fixed asset impairment – Cost of sales | | | 30 | | | | | | 11 | | | | | | 41 | |
Intangible asset impairment – Cost of sales | | | | | | | | | 28 | | | | | | 28 | |
Allowance for credit losses – Financing receivables – SA&G expenses | | | | | | | | | | | $ | 153 | | | 153 | |
Voluntary-separation program: | | | 3 | | | | | | | | | | | | 3 | |
– SA&G expenses | | | 4 | | | | | | 6 | | | 1 | | | 11 | |
Intercompany agreement | | | 82 | | | 9 | | | 62 | | | (153) | | | | |
Total Russia/Ukraine events pretax expense | | $ | 133 | | $ | 11 | | $ | 110 | | $ | 1 | | | 255 | |
| | | | | | | | | | | | | | | | |
Net tax impact | | | | | | | | | | | | | | | (40) | |
Total Russia/Ukraine events after-tax expense | | | | | | | | | | | | | | $ | 215 | |
Gain on Previously Held Equity Investment
In March 2022, the company acquired full ownership of three former Deere-Hitachi joint venture factories and began new license and supply agreements with Hitachi. The fair value of the previous equity investment resulted in a non-cash gain of $326 million (pretax and ; see Note 3).
2021 Special Items
In 2021, the company sold a closed factory that previously produced small agricultural equipment in China, resulting in a $27 million pretax gain. The fixed assets in an asphalt plant factory in Germany were impaired by $38 million, pretax and . The company also continued to assess its manufacturing locations, resulting in additional long-lived asset impairments of $12 million pretax. The impairments were the result of a decline in forecasted financial performance that indicated it was probable future cash flows would not cover the carrying amount of the net assets. The company recognized a favorable indirect tax ruling in Brazil of $58 million pretax. See Note 25 for fair value measurement information.
54
Summary of 2022 and 2021 Special Items
The following table summarizes the operating profit impact, in millions of dollars, of the special items recorded in 2022 and 2021:
| | PPA | | SAT | | CF | | FS | | Total | ||||||
2022 Expense (benefit) | | | | | | | | | | | | | | | | |
Gain on remeasurement of equity investment – Other income (Note 3) | | | | | | | | $ | (326) | | | | | $ | (326) | |
Total Russia/Ukraine events pretax expense | | $ | 133 | | $ | 11 | | | 110 | | $ | 1 | | | 255 | |
UAW ratification bonus – Cost of sales | | | 53 | | | 9 | | | 28 | | | | | | 90 | |
Total expense (benefit) | | | 186 | | | 20 | | | (188) | | | 1 | | | 19 | |
| | | | | | | | | | | | | | | | |
2021 Expense (benefit) | | | | | | | | | | | | | | | | |
Gain on sale – Other income | | | | | | (27) | | | | | | | | | (27) | |
Long-lived asset impairments – Cost of sales | | | 5 | | | 3 | | | 42 | | | | | | 50 | |
Brazil indirect tax – Cost of sales | | | (53) | | | | | | (5) | | | | | | (58) | |
Total expense (benefit) | | | (48) | | | (24) | | | 37 | | | | | | (35) | |
Year over year change | | $ | 234 | | $ | 44 | | $ | (225) | | $ | 1 | | $ | 54 | |
2020 Special Items
In 2020, the company closed a factory that produced small agricultural equipment in China, recognized impairments in the fixed assets in an asphalt plant factory in Germany, a construction equipment factory in Brazil, and other international locations, and recorded impairments of equipment on operating leases and matured lease inventory, as well as impairments of the investment in certain affiliate companies. A summary of the factory closure and costs related to impairments follows in millions of dollars. See Note 25 for a description of the valuation methodologies used to measure these impairments.
| | PPA | | SAT | | CF | | FS | | Total | | |||||
Factory closure – Cost of sales | | | | | $ | 20 | | | | | | | | $ | 20 | |
Long-lived asset impairments: | | | | | | | | | | | | | | | | |
Cost of sales | | | | | | 13 | | $ | 80 | | | | | | 93 | |
SA&G expenses | | $ | 2 | | | 2 | | | | | | | | | 4 | |
Other operating expenses | | | | | | | | | | | $ | 32 | | | 32 | |
Affiliate company impairments – Equity in loss of unconsolidated affiliates | | | | | | | | | 50 | | | | | | 50 | |
Total pretax impairments and closure costs | | $ | 2 | | $ | 35 | | $ | 130 | | $ | 32 | | $ | 199 | |
Employee-Separation Programs
During 2020, the company implemented employee-separation programs for the company’s salaried workforce in several geographic areas, including the U.S., Europe, Asia, and Latin America. The programs’ main purpose was to improve efficiency through a leaner, more flexible organization. The programs were largely voluntary in nature with the expense recorded in the period in which the employees irrevocably accepted a separation offer. For the limited involuntary employee-separation programs, the expense was recorded when management committed to a plan, the plan was communicated to the employees, and the employees were not required to provide service beyond the legal notification period. The programs provided for cash payments based on years of service, and in some countries subsidized healthcare for a limited period and outplacement services.
The programs’ total pretax expenses in 2020 were as follows in millions of dollars:
| | PPA | | SAT | | CF | | FS | | Total | | |||||
Cost of sales | | $ | 51 | | $ | 31 |
| $ | 22 |
| | |
| $ | 104 | |
Research and development expenses | | | 29 | | | 18 | | | 8 | | | | | | 55 | |
Selling, administrative and general expenses | | | 53 | | | 43 | | | 24 | | $ | 15 | | | 135 | |
Total operating profit impact | | $ | 133 | | $ | 92 | | $ | 54 | | $ | 15 | | | 294 | |
Non-operating profit impact* | | | | | | | | | | | | | | | 41 | |
Total pretax expense | | | | | | | | | | | | | | $ | 335 | |
* Relates primarily to non-cash charges of $34 million from in certain OPEB plans (see Note 7) and other corporate expenses, both of which were recorded . Approximately $6 million of the charge was recorded by financial services.
Redeemable Noncontrolling Interest
In 2020, the minority interest holder in Hagie Manufacturing Company, LLC (Hagie) exercised its right to sell the remaining 20 percent interest to the company for $14 million. As a result of such transaction, the company became a 100 percent interest holder in Hagie. The arrangement was accounted for as an equity transaction with no gain or loss recorded in the statements of consolidated income. This operation is included in the company’s production and precision agriculture segment.
55
5. REVENUE RECOGNITION
The company’s net sales and revenues by primary geographic market, major product line, and timing of revenue recognition in millions of dollars follow:
| | PPA | | SAT | | CF | | FS | | Total | | |||||
2022 | | | | | | | | | | | | | | | | |
Primary geographic markets: | | | | | | | | | | | | | | | | |
United States | | $ | 10,975 | | $ | 7,741 | | $ | 7,103 | | $ | 2,419 | | $ | 28,238 | |
Canada | | | 1,387 | | | 676 | | | 1,238 | | | 601 | | | 3,902 | |
Western Europe | | | 2,188 | | | 2,478 | | | 1,576 | | | 102 | | | 6,344 | |
Central Europe and CIS | | | 1,207 | | | 488 | | | 545 | | | 49 | | | 2,289 | |
Latin America | | | 4,991 | | | 578 | | | 1,467 | | | 303 | | | 7,339 | |
Asia, Africa, Australia, New Zealand, and Middle East | | | 1,570 | | | 1,608 | | | 1,136 | | | 151 | | | 4,465 | |
Total | | $ | 22,318 | | $ | 13,569 | | $ | 13,065 | | $ | 3,625 | | $ | 52,577 | |
| | | | | | | | | | | | | | | | |
Major product lines: | | | | | | | | | | | | | | | | |
Production agriculture | | $ | 21,685 | | | | | | | | | | | $ | 21,685 | |
Small agriculture | | | | | $ | 10,027 | | | | | | | | | 10,027 | |
Turf | | | | | | 3,027 | | | | | | | | | 3,027 | |
Construction | | | | | | | | $ | 5,864 | | | | | | 5,864 | |
Compact construction | | | | | | | | | 1,667 | | | | | | 1,667 | |
Roadbuilding | | | | | | | | | 3,441 | | | | | | 3,441 | |
Forestry | | | | | | | | | 1,308 | | | | | | 1,308 | |
Financial products | | | 60 | | | 52 | | | 32 | | $ | 3,625 | | | 3,769 | |
Other | | | 573 | | | 463 | | | 753 | | | | | | 1,789 | |
Total | | $ | 22,318 | | $ | 13,569 | | $ | 13,065 | | $ | 3,625 | | $ | 52,577 | |
| | | | | | | | | | | | | | | | |
Revenue recognized: | | | | | | | | | | | | | | | | |
At a point in time | | $ | 22,178 | | $ | 13,493 | | $ | 12,980 | | $ | 105 | | $ | 48,756 | |
Over time | | | 140 | | | 76 | | | 85 | | | 3,520 | | | 3,821 | |
Total | | $ | 22,318 | | $ | 13,569 | | $ | 13,065 | | $ | 3,625 | | $ | 52,577 | |
| | PPA | | SAT | | CF | | FS | | Total | | |||||
2021 | | | | | | | | | | | | | | | | |
Primary geographic markets: | | | | | | | | | | | | | | | | |
United States | | $ | 8,223 | | $ | 6,505 | | $ | 5,697 | | $ | 2,389 | | $ | 22,814 | |
Canada | | | 853 | | | 498 | | | 1,047 | | | 617 | | | 3,015 | |
Western Europe | | | 2,086 | | | 2,433 | | | 1,807 | | | 103 | | | 6,429 | |
Central Europe and CIS | | | 1,322 | | | 475 | | | 828 | | | 39 | | | 2,664 | |
Latin America | | | 2,916 | | | 456 | | | 903 | | | 247 | | | 4,522 | |
Asia, Africa, Australia, New Zealand, and Middle East | | | 1,417 | | | 1,679 | | | 1,331 | | | 153 | | | 4,580 | |
Total | | $ | 16,817 | | $ | 12,046 | | $ | 11,613 | | $ | 3,548 | | $ | 44,024 | |
| | | | | | | | | | | | | | | | |
Major product lines: | | | | | | | | | | | | | | | | |
Production agriculture | | $ | 16,248 | | | | | | | | | | | $ | 16,248 | |
Small agriculture | | | | | $ | 8,619 | | | | | | | | | 8,619 | |
Turf | | | | | | 2,853 | | | | | | | | | 2,853 | |
Construction | | | | | | | | $ | 4,684 | | | | | | 4,684 | |
Compact construction | | | | | | | | | 1,489 | | | | | | 1,489 | |
Roadbuilding | | | | | | | | | 3,749 | | | | | | 3,749 | |
Forestry | | | | | | | | | 1,280 | | | | | | 1,280 | |
Financial products | | | 55 | | | 46 | | | 20 | | $ | 3,548 | | | 3,669 | |
Other | | | 514 | | | 528 | | | 391 | | | | | | 1,433 | |
Total | | $ | 16,817 | | $ | 12,046 | | $ | 11,613 | | $ | 3,548 | | $ | 44,024 | |
| | | | | | | | | | | | | | | | |
Revenue recognized: | | | | | | | | | | | | | | | | |
At a point in time | | $ | 16,659 | | $ | 11,969 | | $ | 11,522 | | $ | 105 | | $ | 40,255 | |
Over time | | | 158 | | | 77 | | | 91 | | | 3,443 | | | 3,769 | |
Total | | $ | 16,817 | | $ | 12,046 | | $ | 11,613 | | $ | 3,548 | | $ | 44,024 | |
| | PPA | | SAT | | CF | | FS | | Total | | |||||
2020 | | | | | | | | | | | | | | | | |
Primary geographic markets: | | | | | | | | | | | | | | | | |
United States | | $ | 6,889 | | $ | 5,059 | | $ | 4,548 | | $ | 2,500 | | $ | 18,996 | |
Canada | | | 640 | | | 350 | | | 802 | | | 598 | | | 2,390 | |
Western Europe | | | 1,827 | | | 1,937 | | | 1,479 | | | 90 | | | 5,333 | |
Central Europe and CIS | | | 898 | | | 493 | | | 646 | | | 35 | | | 2,072 | |
Latin America | | | 1,902 | | | 334 | | | 553 | | | 234 | | | 3,023 | |
Asia, Africa, Australia, New Zealand, and Middle East | | | 1,119 | | | 1,322 | | | 1,153 | | | 132 | | | 3,726 | |
Total | | $ | 13,275 | | $ | 9,495 | | $ | 9,181 | | $ | 3,589 | | $ | 35,540 | |
| | | | | | | | | | | | | | | | |
Major product lines: | | | | | | | | | | | | | | | | |
Production agriculture | | $ | 12,662 | | | | | | | | | | | $ | 12,662 | |
Small agriculture | | | | | $ | 6,827 | | | | | | | | | 6,827 | |
Turf | | | | | | 2,390 | | | | | | | | | 2,390 | |
Construction | | | | | | | | $ | 3,521 | | | | | | 3,521 | |
Compact construction | | | | | | | | | 1,269 | | | | | | 1,269 | |
Roadbuilding | | | | | | | | | 2,924 | | | | | | 2,924 | |
Forestry | | | | | | | | | 1,100 | | | | | | 1,100 | |
Financial products | | | 69 | | | 37 | | | 25 | | $ | 3,589 | | | 3,720 | |
Other | | | 544 | | | 241 | | | 342 | | | | | | 1,127 | |
Total | | $ | 13,275 | | $ | 9,495 | | $ | 9,181 | | $ | 3,589 | | $ | 35,540 | |
| | | | | | | | | | | | | | | | |
Revenue recognized: | | | | | | | | | | | | | | | | |
At a point in time | | $ | 13,106 | | $ | 9,439 | | $ | 9,071 | | $ | 106 | | $ | 31,722 | |
Over time | | | 169 | | | 56 | | | 110 | | | 3,483 | | | 3,818 | |
Total | | $ | 13,275 | | $ | 9,495 | | $ | 9,181 | | $ | 3,589 | | $ | 35,540 | |
56
Following is a description of the company’s major product lines:
Production Agriculture – Includes net sales of large and certain mid-size tractors and associated attachments, combines, cotton pickers, cotton strippers, sugarcane harvesters, sugarcane loaders and pull behind scrapers, tillage, seeding, and application equipment, including sprayers and nutrient management and soil preparation machinery, and related attachments and service parts.
Small Agriculture – Includes net sales of mid-size and utility tractors, self-propelled forage harvesters, hay and forage equipment, balers, mowers, and related attachments and service parts.
Turf – Includes net sales of turf and utility equipment, including riding lawn equipment, golf course equipment, utility vehicles, and commercial mowing equipment, along with a broad line of associated implements, other outdoor power products, and related attachments and service parts.
Construction – Includes net sales of a broad range of machines used in construction, earthmoving, and material handling, including backhoe loaders, crawler dozers and loaders, four-wheel-drive loaders, excavators, motor graders, articulated dump trucks, and related attachments and service parts.
Compact Construction – Includes net sales of smaller construction equipment, including compact excavators, compact track loaders, compact wheel loaders, skid steers, landscape loaders, and related attachments and service parts.
Roadbuilding – Includes net sales of equipment used in roadbuilding and renovation, including milling machines, recyclers, slipform pavers, surface miners, asphalt pavers, compactors, tandem and static rollers, mobile crushers and screens, mobile and stationary asphalt plants, and related attachments and service parts.
Forestry – Includes net sales of equipment used in timber harvesting, including log skidders, feller bunchers, log loaders, log forwarders, log harvesters, and related attachments and service parts.
Financial Products – Includes finance and interest income from retail notes related to sales of John Deere equipment to retail customers, wholesale financing to dealers of John Deere equipment, and revolving charge accounts; lease income from retail leases of John Deere equipment; and revenue from extended warranties.
Other – Includes sales of components to other equipment manufacturers that are included in “Net sales” and revenue earned over time from precision guidance, telematics, and other information enabled solutions, revenue from service performed at company owned dealerships and service centers, gains on disposition of property and businesses, trademark licensing revenue, and other miscellaneous revenue items that are included in “Other income.”
The company invoices in advance of recognizing the sale of certain products and the revenue for certain services. These relate to extended warranty premiums, advance payments for future equipment sales, and subscription and service revenue related to precision guidance and telematic services. These advanced customer payments are presented as deferred revenue, a contract liability, in “Accounts payable and accrued expenses” in the consolidated balance sheets. The deferred revenue received, but not recognized in revenue, including extended warranty premiums also shown in Note 20, was $1,423 million and $1,344 million at October 30, 2022 and October 31, 2021, respectively. The contract liability is reduced as the revenue is recognized. Revenue recognized from deferred revenue that was recorded as a contract liability at the beginning of the fiscal year was $609 million in 2022, $485 million in 2021, and $425 million in 2020.
The total amount of unsatisfied performance obligations for contracts with an original duration greater than one year and the estimated revenue to be recognized by fiscal year at October 30, 2022 follows in millions of dollars:
Year | | Net Sales and Revenues | | |
| $ | 336 | | |
| | 319 | | |
| | 230 | | |
| | 131 | | |
| | 84 | | |
| | 124 | | |
Total | | $ | 1,224 | |
As permitted, the company elected only to disclose remaining performance obligations with an original contract duration greater than one year. The contracts with an expected duration of one year or less are for sales to dealers and retail customers for equipment, service parts, repair services, and certain telematics services.
6. CASH FLOW INFORMATION
The company considers investments with purchased maturities of three months or less to be cash equivalents. Substantially all of the company’s short-term borrowings, excluding the current maturities of finance lease obligations and long-term borrowings, mature or may require payment within three months or less.
All cash flows from the changes in trade accounts and notes receivable (see Note 11) are classified as operating activities in the statements of consolidated cash flows as these receivables arise from sales to the company’s customers. Cash flows from financing receivables that are related to sales to the company’s customers (see Note 11) are also included in operating activities. The remaining financing receivables are related to the financing of equipment sold by independent dealers and are included in investing activities.
Restricted cash, recorded in “Other assets” in the consolidated balance sheets, relates to securitization of financing receivables (see Note 12) and certain cash held in Russia.
57
Supplemental cash flow information follows in millions of dollars:
| | 2022 | | 2021 | | 2020 | | |||
Cash paid for interest | | $ | 1,101 | | $ | 1,041 | | $ | 1,279 | |
Cash paid for income taxes | | | 1,940 | | | 2,075 | | | 1,069 | |
Inventory transferred to equipment on operating leases | | | 167 | | | 662 | | | 614 | |
Accounts payable related to purchases of property and equipment | | | 165 | | | 121 | | | 98 | |
7. PENSION AND OTHER POSTRETIREMENT BENEFITS
The company has several funded and unfunded defined benefit pension plans and other postretirement benefit (OPEB) plans, primarily health care and life insurance plans, covering its U.S. employees and employees in certain foreign countries. The company uses an October 31 measurement date.
The spot yield curve approach is used to estimate the service and interest cost components of the net periodic pension and OPEB costs by applying the specific spot rates along the yield curve used to determine the benefit plan obligations to relevant projected cash outflows. The components of net periodic pension and OPEB cost excluding the service component are included in the line item “Other operating expenses” in the statements of consolidated income.
The company’s U.S. salaried pension plan will be closed to new entrants effective January 1, 2023. Certain participants will have the opportunity to make a one-time election in 2023 to freeze their defined benefit pension plan benefit for an enhanced defined contribution benefit.
The components of net periodic pension cost and the assumptions related to the cost consisted of the following in millions of dollars and in percentages:
|
| 2022 |
| 2021 |
| 2020 |
| |||
Pensions | | | | | | | | | | |
Service cost |
| $ | 349 | | $ | 332 | | $ | 321 | |
|
| 330 | |
| 276 | |
| 347 | | |
|
| (726) | |
| (799) | |
| (819) | | |
|
| 132 | |
| 259 | |
| 256 | | |
|
| 34 | |
| 12 | |
| 13 | | |
|
| 45 | |
| 21 | |
| 25 | | |
Net cost | | $ | 164 | | $ | 101 | | $ | 143 | |
Weighted-average assumptions | | | | | | | | | | |
Discount rates - service cost | | | 3.0% | | | 2.5% | | | 2.9% | |
Discount rates - interest cost | | | 2.6% | | | 2.1% | | | 2.7% | |
Rate of compensation increase | | | 3.7% | | | 3.7% | | | 3.8% | |
Expected long-term rates of return | | | 5.1% | | | 6.0% | | | 6.4% | |
Interest crediting rate - U.S. cash balance plans | | | 2.1% | | | 1.7% | | | 2.1% | |
In November 2021, employees represented by the UAW approved a new collective bargaining agreement. The company remeasured the U.S. hourly pension plan, which increased the 2022 pension expense by nearly $80 million with $35 million negatively impacting operating profit.
A curtailment loss of $34 million was recognized during when 10 percent of active, eligible U.S. hourly employees elected
to freeze their defined benefit pension plan benefit for an enhanced defined contribution benefit.
The components of net periodic OPEB cost and the assumptions related to the cost consisted of the following in millions of dollars and in percentages:
|
| 2022 |
| 2021 |
| 2020 |
| |||
OPEB | | | | | | | | | | |
Service cost | | $ | 45 | | $ | 48 | | $ | 49 | |
|
| 99 | |
| 102 | |
| 140 | | |
|
| (110) | |
| (77) | |
| (50) | | |
|
| (18) | |
| 27 | |
| 29 | | |
|
| (4) | |
| (4) | |
| (4) | | |
|
| | | | | | | 34 | | |
Net cost | | $ | 12 | | $ | 96 | | $ | 198 | |
Weighted-average assumptions | | | | | | | | | | |
Discount rates - service cost | | | 3.6% | | | 3.4% | | | 3.7% | |
Discount rates - interest cost | | | 2.3% | | | 2.1% | | | 2.7% | |
Expected long-term rates of return | | | 4.4% | | | 5.4% | | | 5.7% | |
The were a result of the employee- (see Note 4).
The benefit plan obligations, funded status, and the assumptions related to the obligations at October 30, 2022 and October 31, 2021 in millions of dollars follow:
| | Pensions | | OPEB | | ||||||||
| | 2022 | | 2021 | | 2022 | | 2021 | | ||||
Change in benefit obligations | | |
|
| |
|
| |
|
| |
| |
Beginning of year balance | | $ | (14,525) | | $ | (15,021) | | $ | (4,930) | | $ | (5,410) | |
Service cost | |
| (349) | |
| (332) | |
| (45) | |
| (48) | |
Interest cost | |
| (330) | |
| (276) | |
| (99) | |
| (102) | |
Actuarial gain | |
| 4,122 | |
| 373 | |
| 1,492 | |
| 381 | |
Prior service cost | | | (505) | |
| | |
| (12) | |
| | |
Benefits paid | |
| 757 | |
| 755 | |
| 282 | |
| 290 | |
Health care subsidies | | | | | | | |
| (33) | |
| (29) | |
Settlements/curtailments | |
| | |
| 1 | | | | | | | |
Foreign exchange and other | |
| 301 | |
| (25) | |
| 4 | |
| (12) | |
End of year balance | |
| (10,529) | |
| (14,525) | |
| (3,341) | |
| (4,930) | |
| | | | | | | | | | | | | |
Change in plan assets (fair value) | | | | | | | | | | | | | |
Beginning of year balance | |
| 17,190 | |
| 14,574 | |
| 1,755 | |
| 1,518 | |
Actual return on plan assets | |
| (3,070) | |
| 3,249 | |
| (495) | |
| 367 | |
Employer contribution | |
| 85 | |
| 101 | |
| 1,155 | |
| 157 | |
Benefits paid | |
| (757) | |
| (755) | |
| (282) | |
| (290) | |
Foreign exchange and other | |
| (229) | |
| 21 | |
| 3 | |
| 3 | |
End of year balance | |
| 13,219 | |
| 17,190 | |
| 2,136 | |
| 1,755 | |
Funded status | | $ | 2,690 | | $ | 2,665 | | $ | (1,205) | | $ | (3,175) | |
| | | | | | | | | | | | | |
Weighted-average assumptions | | | | | | | | | | | | | |
Discount rates | | | 5.4% | | | 2.7% | | | 5.6% | | | 2.8% | |
Rate of compensation increase | | | 3.8% | | | 3.7% | | | | | | | |
Interest crediting rate - U.S. cash balance plans | | | 4.4% | | | 1.8% | | | | | | | |
58
The actuarial gains for pension and OPEB for 2022 were due to an increase in discount rates. The actuarial gain for pension for 2021 was due to an increase in discount rates. The actuarial gain for OPEB for 2021 was due to a decrease in health care trend rates, favorable mortality assumptions, and an increase in discount rates. The pension prior service cost for 2022 was due to the new UAW collective bargaining agreement.
The discount rate assumptions used to determine the pension and OPEB obligations for all periods presented were based on hypothetical AA yield curves represented by a series of annualized individual discount rates. These discount rates represent the rates at which the company’s benefit obligations could effectively be settled at the October 31 measurement dates.
The mortality assumptions for the 2022 and 2021 U.S. benefit plan obligations used the most recent tables and scales issued by the Society of Actuaries at that time. The 2022 and 2021 mortality assumptions included an adjustment to the scale related to COVID for some plans.
The weighted-average annual rates of increase in the per capita cost of covered health care benefits (the health care cost trend rates) for medical and prescription drug claims for pre- and post-65 age groups used to determine the October 30, 2022 and October 31, 2021 accumulated postretirement benefit obligations were as follows:
| | 2022 | | 2021 | |
Initial year | | 0.0% (2022 to 2023) | | 2.1% (2021 to 2022) | |
Second year | | 12.6% (2023 to 2024) | | 8.4% (2022 to 2023) | |
Ultimate | | 4.7% () | | 4.7% () | |
A decrease in Medicare Advantage premiums impacted the weighted-average annual rates of increase for the initial years in 2022 and 2021.
The amounts recognized at October 30, 2022 and October 31, 2021 in millions of dollars consisted of the following:
| | Pensions | | OPEB | | ||||||||
| | 2022 | | 2021 | | 2022 | | 2021 | | ||||
Amounts recognized in | | |
| | |
|
| |
|
| |
| |
Noncurrent asset | | $ | 3,223 |
| $ | 3,601 | | $ | 507 |
| | | |
Current liability | |
| (42) | |
| (51) | | | (39) | | $ | (36) | |
Noncurrent liability | |
| (491) | |
| (885) | |
| (1,673) | |
| (3,139) | |
Total | | $ | 2,690 | | $ | 2,665 | | $ | (1,205) | | $ | (3,175) | |
Amounts recognized in accumulated other comprehensive income – pretax | | | | | | | | | | | | | |
Net actuarial (gain) loss | | $ | 926 | | $ | 1,376 | | $ | (820) | | $ | 49 | |
Prior service cost (credit) | |
| 446 | |
| 9 | |
| (4) | |
| (20) | |
Total | | $ | 1,372 | | $ | 1,385 | | $ | (824) | | $ | 29 | |
Information related to pension plans benefit obligations at October 30, 2022 and October 31, 2021 in millions of dollars follows:
| | 2022 | | 2021 | | ||
Total accumulated benefit obligations for all plans | | $ | 10,068 | | $ | 13,787 | |
Plans with accumulated benefit obligation exceeding fair value of plan assets: | | | | | | | |
Accumulated benefit obligations | | | 1,116 | | | 2,012 | |
Fair value of plan assets | | | 672 | | | 1,207 | |
Plans with projected benefit obligation exceeding fair value of plan assets: | | | | | | | |
Projected benefit obligations | | | 1,225 | | | 2,163 | |
Fair value of plan assets | | | 692 | | | 1,227 | |
Actuarial gains and losses are recorded in accumulated other comprehensive income (loss). To the extent unamortized gains and losses exceed 10 percent of the higher of the market-related value of assets or the benefit obligation, the excess is amortized as a component of net periodic cost over the remaining service period of the active participants. For plans in which all or almost all of the plan’s participants are inactive, the amortization period is the remaining life expectancy of the inactive participants.
Contributions
The company makes any required contributions to the plan assets under applicable regulations and voluntary contributions after evaluating the company’s liquidity position and ability to make tax-deductible contributions. Total company contributions to the plans were $1,240 million in 2022 and $258 million in 2021, which included both required and voluntary contributions and direct benefit payments. 2022 OPEB contributions included a voluntary contribution of $1,000 million to a U.S. plan.
The company expects to contribute approximately $70 million to its pension plans and approximately $130 million to its OPEB plans in 2023. The contributions are direct benefit payments from company funds. The company has no significant required contributions to U.S. pension plan assets in 2023 under applicable funding regulations.
Expected Future Benefit Payments
The expected future benefit payments at October 30, 2022 were as follows in millions of dollars:
| | | | | | | |
|
| Pensions |
| OPEB* |
| ||
2023 | | $ | 739 | | $ | 246 | |
2024 | |
| 730 | |
| 248 | |
2025 | |
| 729 | |
| 250 | |
2026 | |
| 728 | |
| 252 | |
2027 | |
| 721 | |
| 253 | |
2028 to 2032 | |
| 3,589 | |
| 1,274 | |
* Net of prescription drug group benefit subsidy under Medicare Part D.
59
Plan Asset Information
The fair values of the pension plan assets at October 30, 2022 follow in millions of dollars:
|
| Total |
| Level 1 |
| Level 2 |
| |||
Cash and short-term investments | | $ | 338 | | $ | 283 | | $ | 55 | |
Equity: | | | | | | | | | | |
U.S. equity securities | |
| 311 | |
| 290 | | | 21 | |
International equity securities and funds | |
| 196 | |
| 195 | | | 1 | |
Fixed Income: | | | | | | | | | | |
Government and agency securities | |
| 1,296 | |
| 1,053 | |
| 243 | |
Corporate debt securities | |
| 4,587 | |
| | |
| 4,587 | |
Mortgage-backed securities | |
| 213 | |
| | |
| 213 | |
Other investments | |
| 49 | |
| 31 | |
| 18 | |
Derivative contracts - assets | |
| 92 | |
| 54 | |
| 38 | |
Derivative contracts - liabilities | |
| (209) | |
| (106) | |
| (103) | |
Receivables, prepaids, and payables | |
| (207) | |
| (207) | | | | |
Securities lending collateral | |
| 684 | | | | |
| 684 | |
Securities lending liability | |
| (684) | | | | |
| (684) | |
Securities sold short | |
| (64) | |
| (58) | | | (6) | |
Total of Level 1 and Level 2 assets | | | 6,602 | | $ | 1,535 | | $ | 5,067 | |
Investments at net asset value: | | | | | | | | | | |
Short-term investments | | | 633 | | | | | | | |
U.S. equity funds | | | 54 | | | | | | | |
International equity funds | | | 125 | | | | | | | |
Fixed income funds | | | 1,736 | | | | | | | |
Real estate funds | | | 592 | | | | | | | |
Hedge funds | | | 569 | | | | | | | |
Private equity | | | 1,322 | | | | | | | |
Venture capital | | | 1,553 | | | | | | | |
Other investments | | | 33 | | | | | | | |
Total net assets | | $ | 13,219 | | | | | | | |
The fair values of the health care assets at October 30, 2022 follow in millions of dollars:
|
| Total |
| Level 1 |
| Level 2 |
| |||
Cash and short-term investments | | $ | 79 | | $ | 79 | | | | |
Fixed Income: | | | | | | | | | | |
Government and agency securities | |
| 629 | |
| 597 | | $ | 32 | |
Corporate debt securities | |
| 516 | | | | |
| 516 | |
Mortgage-backed securities | |
| 83 | | | | |
| 83 | |
Other | |
| (4) | |
| (7) | | | 3 | |
Securities lending collateral | |
| 98 | | | | |
| 98 | |
Securities lending liability | |
| (98) | | | | |
| (98) | |
Total of Level 1 and Level 2 assets | | | 1,303 | | $ | 669 | | $ | 634 | |
Investments at net asset value: | | | | | | | | | | |
U.S. equity funds | | | 40 | | | | | | | |
International equity funds | | | 22 | | | | | | | |
Fixed income funds | | | 347 | | | | | | | |
Real estate funds | | | 140 | | | | | | | |
Hedge funds | | | 188 | | | | | | | |
Private equity | | | 41 | | | | | | | |
Venture capital | | | 48 | | | | | | | |
Other investments | | | 7 | | | | | | | |
Total net assets | | $ | 2,136 | | | | | | | |
The fair values of the pension plan assets at October 31, 2021 follow in millions of dollars:
|
| Total |
| Level 1 |
| Level 2 |
| |||
Cash and short-term investments | | $ | 378 | | $ | 355 | | $ | 23 | |
Equity: | | | | | | | | | | |
U.S. equity securities | |
| 1,151 | |
| 1,123 | | | 28 | |
International equity securities and funds | |
| 951 | |
| 931 | | | 20 | |
Fixed Income: | | | | | | | | | | |
Government and agency securities | |
| 1,475 | |
| 1,159 | |
| 316 | |
Corporate debt securities | |
| 4,841 | | | | |
| 4,841 | |
Mortgage-backed securities | |
| 144 | |
| | |
| 144 | |
Real estate investment trusts | |
| 62 | |
| 55 | |
| 7 | |
Derivative contracts - assets | |
| 116 | |
| 37 | |
| 79 | |
Derivative contracts - liabilities | |
| (75) | |
| (15) | |
| (60) | |
Receivables, payables, and other | |
| (155) | |
| (177) | | | 22 | |
Securities lending collateral | |
| 982 | | | 107 | |
| 875 | |
Securities lending liability | |
| (982) | | | (107) | |
| (875) | |
Securities sold short | |
| (139) | |
| (128) | | | (11) | |
Total of Level 1 and Level 2 assets | | | 8,749 | | $ | 3,340 | | $ | 5,409 | |
Investments at net asset value: | | | | | | | | | | |
Short-term investments | | | 815 | | | | | | | |
U.S. equity funds | | | 796 | | | | | | | |
International equity funds | | | 528 | | | | | | | |
Fixed income funds | | | 1,701 | | | | | | | |
Real estate funds | | | 566 | | | | | | | |
Hedge funds | | | 751 | | | | | | | |
Private equity | | | 1,385 | | | | | | | |
Venture capital | | | 1,537 | | | | | | | |
Other investments | | | 362 | | | | | | | |
Total net assets | | $ | 17,190 | | | | | | | |
The fair values of the health care assets at October 31, 2021 follow in millions of dollars:
|
| Total |
| Level 1 |
| Level 2 |
| |||
Cash and short-term investments | | $ | 55 | | $ | 55 | | | | |
Equity securities and funds | | | 30 | | | 29 | | $ | 1 | |
Fixed Income: | | | | | | | | | | |
Government and agency securities | |
| 243 | |
| 215 | | | 28 | |
Corporate debt securities | |
| 307 | | | | |
| 307 | |
Mortgage-backed securities | |
| 10 | | | | |
| 10 | |
Securities lending collateral | |
| 64 | | | 20 | |
| 44 | |
Securities lending liability | |
| (64) | | | (20) | |
| (44) | |
Securities sold short | |
| (3) | |
| (3) | | | | |
Total of Level 1 and Level 2 assets | | | 642 | | $ | 296 | | $ | 346 | |
Investments at net asset value: | | | | | | | | | | |
Short-term investments | | | 20 | | | | | | | |
U.S. equity funds | | | 619 | | | | | | | |
International equity funds | | | 358 | | | | | | | |
Fixed income funds | | | 18 | | | | | | | |
Real estate funds | | | 42 | | | | | | | |
Hedge funds | | | 13 | | | | | | | |
Private equity | | | 18 | | | | | | | |
Venture capital | | | 20 | | | | | | | |
Other investments | | | 5 | | | | | | | |
Total net assets | | $ | 1,755 | | | | | | | |
60
Investments at net asset value in the preceding tables are measured at fair value using the net asset value per share practical expedient and are not classified in the fair value hierarchy. Fair value measurement levels in the preceding tables are defined in Note 25.
Fair values are determined as follows:
Cash and Short-Term Investments – The investments include (1) cash accounts that are valued based on the account value, which approximates fair value; (2) investments that are valued at quoted prices in the active markets in which the investment trades or using a market approach (matrix pricing model) in which all significant inputs are observable or can be derived from or corroborated by observable market data; and (3) investment funds that are valued based on a constant fund net asset value (NAV), which is based on quoted prices in the active market in which the investment fund trades, or the fund’s NAV using the NAV per share practical expedient, which is based on the fair value of the underlying securities.
Equity Securities and Funds – The values are determined by quoted prices in the active market in which the equity investment trades, or the fund’s NAV, based on the fair value of the underlying securities.
Fixed Income Securities and Funds and Other Funds – The securities are valued using either a market approach (matrix pricing model) in which all significant inputs are observable or can be derived from or corroborated by observable market data such as interest rates, yield curves, volatilities, credit risk, and prepayment speeds, or they are valued using the quoted prices in the active market in which the fixed income investment trades. Fixed income and other funds are valued using the fund’s NAV, based on the fair value of the underlying securities.
Real Estate, Venture Capital, Private Equity, and Hedge Funds – The investments that are structured as limited partnerships are valued at estimated fair value based on their proportionate share of the limited partnership’s fair value that is determined by the respective general partner. These investments are valued using the fund’s NAV, which is based on the fair value of the underlying investments. Valuations may be lagged up to six months. The NAV is adjusted for cash flows (additional investments or contributions, and distributions) and any known substantive valuation changes through year end. Real estate investment trusts were valued at the quoted prices in the active markets in which the investment trades.
Derivative Instruments – The derivatives are valued using either an income approach (discounted cash flow) using market observable inputs, including swap curves and both forward and spot exchange rates, or a market approach (quoted prices in the active market in which the derivative instrument trades).
The investment objective for the pension and health care plan assets is to fulfill the projected obligations to the beneficiaries over a long period of time, while meeting the company’s fiduciary responsibilities. The asset allocation policy is the most important decision in managing the assets, and it is reviewed regularly. The asset allocation policy considers the company’s long-term asset
class risk/return expectations for each plan since the obligations are long-term in nature. The current target allocations for pension assets are approximately 20 percent for equity, 66 percent for debt, 3 percent for real estate, and 11 percent for other investments. The target allocations for health care assets are approximately 15 percent for equity, 72 percent for debt, 4 percent for real estate, and 9 percent for other investments. The allocation percentages above include the effects of combining derivatives with other investments to manage asset allocations and exposures to interest rates and foreign currency exchange. The assets are well diversified and are managed by professional investment firms as well as by investment professionals who are company employees. As a result of the company’s diversified investment policy, there were no significant concentrations of risk.
The expected long-term rate of return on plan assets reflects management’s expectations of long-term average rates of return on funds invested to provide for benefits included in the projected benefit obligations. A market related value of plan assets is used to calculate the expected return on assets. The market related value recognizes changes in the fair value of pension plan assets systematically over a five-year period. The market related value of the health care plan assets equals fair value. The expected return is based on the outlook for inflation and for returns in multiple asset classes, while also considering historical returns, asset allocation, and investment strategy. The company’s approach has emphasized the long-term nature of the return estimate such that the return assumption is not changed significantly unless there are fundamental changes in capital markets that affect the company’s expectations for returns over an extended period of time (i.e., 10 to 20 years). The average annual return of the company’s U.S. pension fund was approximately 8.6 percent during the past ten years and approximately 8.9 percent during the past 20 years. Since return premiums over inflation and total returns for major asset classes vary widely even over ten-year periods, recent history is not necessarily indicative of long-term future expected returns. The company’s systematic methodology for determining the long-term rate of return for the company’s investment strategies supports its long-term expected return assumptions.
The company has created certain Voluntary Employees’ Beneficiary Association trusts (VEBAs) for the funding of postretirement health care benefits. The future expected asset returns for these VEBAs are lower than the expected return on the other pension and health care plan assets due to investment in a higher proportion of liquid securities. These assets are in addition to the other postretirement health care plan assets that have been funded under Section 401(h) of the U.S. Internal Revenue Code and maintained in a separate account in the company’s pension plan trust.
Defined Contribution Plans
The company has defined contribution plans related to employee investment and savings plans primarily in the U.S. The company’s contributions and costs under these plans were $263 million in 2022, $207 million in 2021, and $160 million in 2020. The contribution rate varies based on the company’s performance in the prior year and employee participation in the plans.
61
8. INCOME TAXES
The provision for income taxes by taxing jurisdiction and by significant component consisted of the following in millions of dollars:
| | | | | | | | | | |
|
| 2022 |
| 2021 |
| 2020 |
| |||
Current: | | |
| | |
| | |
| |
U.S.: | | | | | | | | | | |
Federal | | $ | 514 | | $ | 899 | | $ | 400 | |
State | |
| 136 | |
| 183 | |
| 53 | |
Foreign | |
| 1,423 | |
| 1,017 | |
| 640 | |
Total current | |
| 2,073 | |
| 2,099 | |
| 1,093 | |
Deferred: | | | | | | | | | | |
U.S.: | | | | | | | | | | |
Federal | |
| 29 | |
| (303) | |
| (68) | |
State | |
| 24 | |
| (45) | |
| 9 | |
Foreign | |
| (119) | |
| (93) | |
| 48 | |
Total deferred | |
| (66) | |
| (441) | |
| (11) | |
Provision for income taxes | | $ | 2,007 | | $ | 1,658 | | $ | 1,082 | |
Based upon the location of the company’s operations, the consolidated income before income taxes in the U.S. in 2022, 2021, and 2020 was $4,977 million, $4,061 million, and $2,082 million, respectively, and in foreign countries was $4,150 million, $3,541 million, and $1,801 million, respectively. Certain foreign operations are branches or partnerships of Deere & Company and are subject to U.S. as well as foreign income tax regulations. The pretax income by location and the preceding analysis of the income tax provision by taxing jurisdiction are not directly related.
A comparison of the statutory and effective income tax provision and reasons for related differences in millions of dollars follow:
|
| 2022 |
| 2021 |
| 2020 |
| |||
U.S. federal income tax provision at the U.S. statutory rate (21 percent) | | $ | 1,917 | | $ | 1,597 | | $ | 815 | |
State and local taxes, net of federal effect | | | 133 | | | 119 | | | 59 | |
Other impacts of Tax Cuts and Jobs Act of 2017 | | | (29) | | | (85) | | | 39 | |
Rate differential on foreign subsidiaries | |
| 121 | |
| 148 | |
| 106 | |
Research and business tax credits | |
| (65) | |
| (48) | |
| (50) | |
Excess tax benefits on equity compensation | | | (55) | | | (79) | | | (87) | |
Valuation allowances | |
| 179 | |
| 18 | |
| 139 | |
Other - net | |
| (194) | | | (12) | | | 61 | |
Provision for income taxes | | $ | 2,007 | | $ | 1,658 | | $ | 1,082 | |
At October 30, 2022, undistributed profits of subsidiaries outside the U.S. of approximately $5,043 million are considered indefinitely reinvested. Determination of the amount of a foreign withholding tax liability on these unremitted earnings is not practicable.
Deferred income taxes arise because there are certain items that are treated differently for financial accounting than for income tax reporting purposes. An analysis of the deferred income tax assets and liabilities at October 30, 2022 and October 31, 2021 in millions of dollars follows:
| | 2022 | | 2021 | | ||||||||
| | Deferred | | Deferred | | Deferred | | Deferred | | ||||
| | Tax | | Tax | | Tax | | Tax | | ||||
|
| Assets |
| Liabilities |
| Assets |
| Liabilities |
| ||||
OPEB - net | | $ | 213 | | | | | $ | 676 | | | | |
Lessor lease transactions | | | | | $ | 310 | | | | | $ | 399 | |
Tax loss and tax credit carryforwards | |
| 1,405 | | | | |
| 1,542 | | | | |
Accrual for sales allowances | |
| 579 | | | | |
| 466 | | | | |
Tax over book depreciation | | | | | | 174 | | | | | | 154 | |
Goodwill and other intangible assets | | | | |
| 178 | | | | |
| 337 | |
Pension - net | |
| | | | 532 | |
| | | | 448 | |
Allowance for credit losses | |
| 90 | | | | |
| 78 | | | | |
Accrual for employee benefits | |
| 304 | | | | |
| 298 | | | | |
Share-based compensation | |
| 41 | | | | |
| 53 | | | | |
Deferred compensation | |
| 44 | | | | |
| 49 | | | | |
Lessee lease transactions | | | 62 | | | 57 | | | 46 | | | 43 | |
Unearned revenue | | | 154 | |
| | | | 172 | |
| | |
Other items | |
| 487 | |
| 254 | |
| 333 | |
| 341 | |
Less valuation allowances | |
| (1,545) | | | | |
| (1,530) | | | | |
Deferred income tax assets and liabilities | | $ | 1,834 | | $ | 1,505 | | $ | 2,183 | | $ | 1,722 | |
Deere & Company files a consolidated federal income tax return in the U.S., which includes the wholly-owned financial services subsidiaries. These subsidiaries account for income taxes as if they filed separate income tax returns, with a modification for realizability of certain tax benefits.
At October 30, 2022, tax loss and tax credit carryforwards of $1,405 million were available with $940 million expiring from 2023 through 2042 and $465 million with an indefinite carryforward period.
A reconciliation of the total amounts of unrecognized tax benefits at October 30, 2022, October 31, 2021, and November 1, 2020 in millions of dollars follows:
|
| 2022 |
| 2021 |
| 2020 |
| |||
Beginning of year balance | | $ | 811 | | $ | 668 | | $ | 553 | |
Increases to tax positions taken during the current year | |
| 98 | |
| 81 | |
| 63 | |
Increases to tax positions taken during prior years | |
| 29 | |
| 100 | |
| 95 | |
Decreases to tax positions taken during prior years | |
| (18) | |
| (23) | |
| (30) | |
Decreases due to lapse of statute of limitations | |
| (7) | |
| (12) | |
| (9) | |
Other | | | 2 | | | (3) | | | (1) | |
Foreign exchange | |
| (24) | |
| | |
| (3) | |
End of year balance | | $ | 891 | | $ | 811 | | $ | 668 | |
The amount of unrecognized tax benefits at October 30, 2022 and October 31, 2021 that would impact the effective tax rate if the tax benefits were recognized was $303 million and $227 million, respectively. The remaining liability was related to tax positions for which there are offsetting tax receivables, or the uncertainty was
62
only related to timing. The company expects that any reasonably possible change in the amounts of unrecognized tax benefits in the next twelve months would not be significant.
The company files its tax returns according to the tax laws of the jurisdictions in which it operates, which includes the U.S. federal jurisdiction and various state and foreign jurisdictions. The U.S. Internal Revenue Service (IRS) has completed the examination of the company’s federal income tax returns for periods prior to 2015. The federal income tax returns for years 2015 to 2020 are currently under examination. Various state and foreign income tax returns also remain subject to examination by taxing authorities.
The company’s policy is to recognize interest related to income taxes in interest expense and interest income and recognize penalties in selling, administrative and general expenses. During 2022 and 2021, the total amount of expense from interest and penalties was $23 million and $7 million. During 2020, interest and penalties previously recorded were reversed when tax positions were effectively settled resulting in a $3 million net benefit. The interest income in 2022, 2021, and 2020 was $12 million, $8 million, and $11 million, respectively. At October 30, 2022 and October 31, 2021, the liability for accrued interest and penalties totaled $80 million and $75 million, respectively, and the receivable for interest was $19 million and $11 million, respectively.
9. OTHER INCOME AND OTHER OPERATING EXPENSES
The major components of other income and other operating expenses consisted of the following in millions of dollars:
|
| 2022 |
| 2021 |
| 2020 |
| |||
Other income | | |
| | |
| | |
| |
Revenues from services | | $ | 283 | | $ | 322 | | $ | 314 | |
Insurance premiums and fees earned* | | | 289 | | | 227 | | | 223 | |
Trademark licensing income | | | 89 | | | 87 | | | 73 | |
Operating lease disposition gains | |
| 72 | |
| 65 | |
| | |
Gain on previously held equity investment | | | 326 | | | | | | | |
Investment income | |
| 14 | |
| 41 | |
| 26 | |
Other | |
| 222 | |
| 249 | |
| 182 | |
Total | | $ | 1,295 | | $ | 991 | | $ | 818 | |
| | | | | | | | | | |
Other operating expenses | | | | | | | | | | |
Depreciation of equipment on operating leases | | $ | 827 | | $ | 983 | | $ | 1,083 | |
Insurance claims and expenses* | |
| 267 | |
| 235 | |
| 231 | |
Cost of services | |
| 214 | |
| 202 | |
| 188 | |
Operating lease disposition losses and impairments | | | | | | | | | 52 | |
| | (218) | | | (183) | | | (31) | | |
Foreign exchange loss | | | 132 | | | 59 | | | 4 | |
Other | |
| 53 | |
| 47 | |
| 85 | |
Total | | $ | 1,275 | | $ | 1,343 | | $ | 1,612 | |
* Primarily related to extended warranties (see Note 20).
10. MARKETABLE SECURITIES
All marketable securities are classified as available-for-sale. Realized gains or losses from the sales of marketable securities are based on the specific identification method.
The amortized cost and fair value of marketable securities at October 30, 2022 and October 31, 2021 in millions of dollars follow:
|
| | |
| Gross |
| Gross |
| | |
| ||
| | Amortized | | Unrealized | | Unrealized | | Fair |
| ||||
| | Cost | | Gains | | Losses | | Value |
| ||||
2022 | | | | | | | | | | | | | |
U.S. equity fund | | | | | | | | | | | $ | 70 | |
International equity securities | | | | | | | | | | | | 3 | |
Total equity securities | | | | | | | | | | | | 73 | |
U.S. government | | $ | 220 | | | | | $ | 37 | |
| 183 | |
Municipal debt securities | |
| 74 | |
| | | | 11 | |
| 63 | |
Corporate debt securities | |
| 236 | |
| | | | 36 | |
| 200 | |
International debt securities | | | 64 | | | | | | 4 | | | 60 | |
Mortgage-backed securities* | |
| 186 | |
| | |
| 31 | |
| 155 | |
Total debt securities | | $ | 780 | | | | | $ | 119 | | | 661 | |
Marketable securities | | | | | | | | | | | $ | 734 | |
2021 | | | | | | | | | | | | | |
U.S. equity fund | | | | | | | | | | | $ | 75 | |
International equity securities | | | | | | | | | | | | 2 | |
Total equity securities | | | | | | | | | | | | 77 | |
U.S. government | | $ | 196 | | $ | 5 | | $ | 3 | |
| 198 | |
Municipal debt securities | |
| 69 | |
| 4 | | | | |
| 73 | |
Corporate debt securities | |
| 215 | |
| 11 | | | 2 | |
| 224 | |
International debt securities | | | 5 | | | | | | 3 | | | 2 | |
Mortgage-backed securities* | |
| 152 | |
| 3 | |
| 1 | |
| 154 | |
Total debt securities | | $ | 637 | | $ | 23 | | $ | 9 | | | 651 | |
Marketable securities | | | | | | | | | | | $ | 728 | |
* Primarily issued by U.S. government sponsored enterprises.
During 2022, 2021, and 2020, purchases of marketable securities were $250 million, $194 million, and $130 million, respectively, while proceeds from the maturities and sales of marketable securities were $79 million, $109 million, and $93 million, respectively.
Equity Securities
Proceeds of equity securities sold during 2022, 2021, and 2020 were not material. Unrealized gain (loss) on equity securities during 2022 and 2021 in millions of dollars follow:
| | 2022 |
| 2021 | | ||
Net gain (loss) recognized on equity securities | | $ | (11) | | $ | 24 | |
Less: Net gain on equity securities sold | | | | | | 2 | |
Unrealized gain (loss) on equity securities | | $ | (11) | | $ | 22 | |
63
Debt Securities
The contractual maturities of debt securities at October 30, 2022 in millions of dollars follow:
| | | | | | | |
|
| Amortized |
| Fair |
| ||
|
| Cost |
| Value | | ||
Due in one year or less | | $ | 81 | | $ | 81 | |
Due after one through five years | |
| 105 | |
| 96 | |
Due after five through 10 years | |
| 196 | |
| 166 | |
Due after 10 years | |
| 212 | |
| 163 | |
Mortgage-backed securities | |
| 186 | |
| 155 | |
Debt securities | | $ | 780 | | $ | 661 | |
Actual maturities may differ from contractual maturities because some securities may be called or prepaid. Because of the potential for prepayment on mortgage-backed securities, they are not categorized by contractual maturity. Proceeds from the sales of debt securities, realized gains, realized losses, and unrealized losses that have been continuous for over twelve months were not significant in 2022, 2021, and 2020. Unrealized losses at October 30, 2022 and October 31, 2021 were not recognized in income due to the ability and intent to hold to maturity. There were no significant impairment write-downs in the periods reported.
11. RECEIVABLES
Trade Accounts and Notes Receivable
Trade accounts and notes receivable at October 30, 2022 and October 31, 2021 in millions of dollars follow:
|
| 2022 |
| 2021 |
| ||
Trade accounts and notes receivable: | | | | | | | |
Production & precision ag | | $ | 2,397 | | $ | 1,204 | |
Small ag & turf | | | 2,065 | | | 1,683 | |
Construction & forestry | |
| 1,948 | |
| 1,321 | |
Trade accounts and notes receivable – net | | $ | 6,410 | | $ | 4,208 | |
Trade accounts and notes receivable have significant concentrations of credit risk in the agriculture and turf and construction and forestry markets as shown in the previous table. On a geographic basis, 52 percent of the company’s trade accounts and notes receivable are located in the U.S. and Canada at October 30, 2022. There is not a disproportionate concentration of credit risk with any single dealer.
The allowance for credit losses on trade accounts and notes receivable at October 30, 2022, October 31, 2021, and November 1, 2020, as well as the related activity, in millions of dollars follow:
| | 2022 | | 2021 | | 2020 | | |||
Beginning of year balance | | $ | 41 | | $ | 39 | | $ | 72 | |
ASU No. 2016-13 | | | | | | (2) | | | | |
Provision | | | 1 | | | 10 | | | | |
Write-offs | | | (5) | | | (7) | | | (23) | |
Recoveries | | | | | | | | | 1 | |
Translation adjustments | | | (1) | | | 1 | | | (11) | |
End of year balance | | $ | 36 | | $ | 41 | | $ | 39 | |
The equipment operations sell a significant portion of their trade receivables to financial services and provide compensation to financial services at approximate market interest rates.
Trade accounts and notes receivable arise from sales of goods to independent dealers. See Note 2 for the company’s revenue recognition policy. The company evaluates and assesses dealers on an ongoing basis as to their creditworthiness and secures the receivables by retaining a security interest in the goods associated with the trade receivables or with other financial instruments. In certain jurisdictions, the company is obligated to repurchase goods sold to a dealer upon cancellation or termination of the dealer’s contract.
Financing Receivables
While the company implemented a new operating model in fiscal year 2021 resulting in new operating segments, assets managed by financial services, including most financing receivables and equipment on operating leases, continue to be evaluated by market (agriculture and turf or construction and forestry).
Financing receivables at October 30, 2022 and October 31, 2021 in millions of dollars follow:
| | | | | | | | | | | | | |
| | 2022 | | 2021 |
| ||||||||
|
| Unrestricted/Securitized |
| Unrestricted/Securitized | | ||||||||
Retail notes: | | |
|
| |
| | |
|
| |
| |
Agriculture and turf | | $ | 23,830 | | $ | 4,868 | | $ | 21,736 | | $ | 4,041 | |
Construction and forestry | |
| 4,396 | |
| 1,179 | |
| 4,334 | |
| 712 | |
Total | |
| 28,226 | |
| 6,047 | |
| 26,070 | |
| 4,753 | |
Wholesale notes | |
| 3,285 | | | | |
| 2,577 | | | | |
Revolving charge accounts | |
| 4,316 | | | | |
| 3,880 | | | | |
Financing leases (direct | |
| 2,832 | | | | |
| 2,879 | | | | |
Total financing receivables | |
| 38,659 | |
| 6,047 | |
| 35,406 | |
| 4,753 | |
Less: | | | | | | | | | | | | | |
Unearned finance income: | | | | | | | | | | | | | |
Retail notes | |
| 1,358 | |
| 95 | |
| 1,131 | |
| 80 | |
Wholesale notes | | | 12 | | | | | | 11 | | | | |
Revolving charge accounts | | | 61 | | | | | | 55 | | | | |
Financing leases | |
| 285 | | | | |
| 258 | | | | |
Total | |
| 1,716 | |
| 95 | |
| 1,455 | |
| 80 | |
Allowance for credit losses | |
| 309 | |
| 16 | |
| 152 | |
| 14 | |
Financing receivables – net | | $ | 36,634 | | 5,936 | | $ | 33,799 | | $ | 4,659 | | |
Financing receivables have significant concentrations of credit risk in the agriculture and turf and construction and forestry markets. On a geographic basis, 85 percent of the company’s financing receivables were located in the U.S. and Canada at October 30, 2022. There is no disproportionate concentration of credit risk with any single customer or dealer. The company retains as collateral security in the equipment associated with retail notes, wholesale notes, and financing leases, and requires theft and physical damage insurance on such equipment.
64
Financing receivables at October 30, 2022 and October 31, 2021 related to the company’s sales of equipment that were included in the previous table consisted of the following in millions of dollars:
| | 2022 | | 2021 |
| ||
Retail notes*: | | | | | | | |
Agriculture and turf | | $ | 1,392 | | $ | 1,977 | |
Construction and forestry | | | 304 | |
| 378 | |
Total | | | 1,696 | |
| 2,355 | |
Wholesale notes | | | 3,285 | |
| 2,577 | |
Sales-type leases | | | 799 | |
| 1,269 | |
Total | | | 5,780 | | | 6,201 | |
Less: | | | | | | | |
Unearned finance income: | | | | | | | |
Retail notes | | | 133 | | | 159 | |
Wholesale notes | | | 12 | | | 11 | |
Sales-type leases | | | 67 | |
| 98 | |
Total | |
| 212 | |
| 268 | |
Financing receivables related to the company’s sales of equipment | | $ | 5,568 | | $ | 5,933 | |
* These retail notes arise from sales of equipment by company-owned dealers or through direct sales.
Included in the table above were $10 million of securitized construction and forestry retail notes at .
Financing receivable installments, including unearned finance income, at October 30, 2022 and October 31, 2021 were scheduled as follows in millions of dollars:
| | | | | | | | | | | | | |
| | 2022 | | 2021 |
| ||||||||
| | Unrestricted/Securitized |
| Unrestricted/Securitized |
| ||||||||
Due in months: |
| |
|
| |
|
| |
|
| |
| |
0 – 12 | | $ | 17,032 | | $ | 2,226 | | $ | 15,205 | | $ | 1,904 | |
13 – 24 | |
| 7,975 | |
| 1,667 | |
| 7,412 | |
| 1,323 | |
25 – 36 | |
| 5,987 | |
| 1,209 | |
| 5,629 | |
| 885 | |
37 – 48 | |
| 4,297 | |
| 709 | |
| 3,991 | |
| 478 | |
49 – 60 | |
| 2,559 | |
| 227 | |
| 2,397 | |
| 150 | |
Thereafter | |
| 809 | |
| 9 | |
| 772 | |
| 13 | |
Total | | $ | 38,659 | | $ | 6,047 | | $ | 35,406 | | $ | 4,753 | |
The maximum terms for retail notes are seven years for agriculture and turf equipment, and five years for construction and forestry equipment. The maximum term for financing leases is seven years. In total, wholesale notes turned four times during 2022 and three times during 2021.
Past due balances of financing receivables still accruing finance income represent the total balance held (principal plus accrued interest) with any payment amounts 30 days or more past the contractual payment due date. Non-performing financing receivables represent loans for which the company has ceased accruing finance income. The company ceases accruing finance income when these receivables are generally 90 days delinquent. Generally, when receivables are 120 days delinquent the estimated uncollectible amount from the customer is written off to the allowance for credit losses. Finance income for non-performing receivables is recognized on a cash basis. Accrual of finance income is resumed when the receivable becomes contractually current and collections are reasonably assured.
The company monitors the credit quality of financing receivables based on delinquency status. The credit quality analysis of retail notes, financing leases, and revolving charge accounts (collectively, retail customer receivables) by year of origination was as follows in millions of dollars:
| | October 30, 2022 | | ||||||||||
| | 2022 | | 2021 | | 2020 | | 2019 | | ||||
Retail customer receivables: |
|
|
|
|
|
|
|
|
|
|
|
|
|
Agriculture and turf | | | | | | | | | | | | | |
Current | | $ | 13,500 | | $ | 7,984 | | $ | 4,091 | | $ | 1,875 | |
30-59 days past due | | | 46 | | | 63 | | | 36 | | | 17 | |
60-89 days past due | | | 14 | | | 25 | | | 13 | | | 6 | |
90+ days past due | | | 1 | | | | | | | | | | |
Non-performing | | | 27 | | | 60 | | | 44 | | | 28 | |
Construction and forestry | | | | | | | | | | | | | |
Current | | | 2,964 | | | 1,974 | | | 842 | | | 292 | |
30-59 days past due | | | 53 | | | 52 | | | 23 | | | 9 | |
60-89 days past due | | | 19 | | | 16 | | | 7 | | | 3 | |
90+ days past due | | | 1 | | | 4 | | | 1 | | | 3 | |
Non-performing | | | 25 | | | 61 | | | 34 | | | 19 | |
Total retail customer receivables | | $ | 16,650 | | $ | 10,239 | | $ | 5,091 | | $ | 2,252 | |
| | | | | | | | | | | | | |
| | October 30, 2022 | | ||||||||||
| | 2018 | | Prior Years | | Revolving Charge Accounts | | Total | | ||||
Retail customer receivables: | | | | | | | | | | | | | |
Agriculture and turf | | | | | | | | | | | | | |
Current | | $ | 785 | | $ | 200 | | $ | 4,111 | | $ | 32,546 | |
30-59 days past due | | | 7 | | | 3 | | | 19 | | | 191 | |
60-89 days past due | | | 2 | | | 1 | | | 5 | | | 66 | |
90+ days past due | | | | | | | | | | | | 1 | |
Non-performing | | | 18 | | | 19 | | | 8 | | | 204 | |
Construction and forestry | | | | | | | | | | | | | |
Current | | | 73 | | | 12 | | | 108 | | | 6,265 | |
30-59 days past due | | | 2 | | | 1 | | | 3 | | | 143 | |
60-89 days past due | | | 1 | | | | | | 1 | | | 47 | |
90+ days past due | | | | | | 1 | | | | | | 10 | |
Non-performing | | | 7 | | | 3 | | | | | | 149 | |
Total retail customer receivables | | $ | 895 | | $ | 240 | | $ | 4,255 | | $ | 39,622 | |
65
| | October 31, 2021 | |||||||||||
| | 2021 | | 2020 | | 2019 | | 2018 | |||||
Retail customer receivables: |
|
|
|
|
|
|
|
|
|
|
|
|
|
Agriculture and turf | | | | | | | | | | | | | |
Current | | $ | 12,877 | | $ | 6,676 | | $ | 3,463 | | $ | 1,738 | |
30-59 days past due | | | 43 | | | 53 | | | 29 | | | 16 | |
60-89 days past due | | | 16 | | | 23 | | | 12 | | | 6 | |
90+ days past due | | | | | | 1 | | | | | | | |
Non-performing | | | 23 | | | 57 | | | 53 | | | 32 | |
Construction and forestry | | | | | | | | | | | | | |
Current | | | 3,122 | | | 1,575 | | | 754 | | | 273 | |
30-59 days past due | | | 50 | | | 40 | | | 27 | | | 7 | |
60-89 days past due | | | 15 | | | 11 | | | 9 | | | 6 | |
90+ days past due | | | 1 | | | 2 | | | 3 | | | 3 | |
Non-performing | | | 26 | | | 56 | | | 39 | | | 17 | |
Total retail customer receivables | | $ | 16,173 | | $ | 8,494 | | $ | 4,389 | | $ | 2,098 | |
October 31, 2021 | |||||||||||||
2017 | | Prior Years | | Revolving Charge Accounts | | Total | |||||||
Retail customer receivables: | |||||||||||||
Agriculture and turf | |||||||||||||
Current | $ | 728 | | $ | 211 | | $ | 3,704 | | $ | 29,397 | ||
30-59 days past due | | 7 | | | 3 | | | 14 | | | 165 | ||
60-89 days past due | | 3 | | | 1 | | | 4 | | | 65 | ||
90+ days past due | | | | | | | | | | | 1 | ||
Non-performing | | 17 | | | 23 | | | 7 | | | 212 | ||
Construction and forestry | | | | | | | | | | | | ||
Current | | 57 | | | 7 | | | 92 | | | 5,880 | ||
30-59 days past due | | 4 | | | 1 | | | 3 | | | 132 | ||
60-89 days past due | | 1 | | | | | | 1 | | | 43 | ||
90+ days past due | | 4 | | | 2 | | | | | | 15 | ||
Non-performing | | 7 | | | 3 | | | | | | 148 | ||
Total retail customer receivables | $ | 828 | | $ | 251 | | $ | 3,825 | | $ | 36,058 | ||
The credit quality analysis of wholesale receivables by year of origination was as follows in millions of dollars:
| | October 30, 2022 | | ||||||||||
| | 2022 | | 2021 | | 2020 | | 2019 | | ||||
Wholesale receivables: |
|
|
|
|
|
|
|
|
|
|
|
|
|
Agriculture and turf | | | | | | | | | | | | | |
Current | | $ | 387 | | $ | 64 | | $ | 27 | | $ | 4 | |
30+ days past due | | | | | | | | | | | | | |
Non-performing | | | | | | | | | | | | 1 | |
Construction and forestry | | | | | | | | | | | | | |
Current | | | 7 | | | 29 | | | 2 | | | 1 | |
30+ days past due | | | | | | | | | | | | | |
Non-performing | | | | | | | | | | | | | |
Total wholesale receivables | | $ | 394 | | $ | 93 | | $ | 29 | | $ | 6 | |
| | | | | | | | | | | | | |
| | October 30, 2022 | | ||||||||||
| | 2018 | | Prior Years | | Revolving | | Total | | ||||
Wholesale receivables: | |
|
|
|
|
|
|
|
|
|
|
| |
Agriculture and turf | | | | | | | | | | | | | |
Current | | | | | $ | 2 | | $ | 2,371 | | $ | 2,855 | |
30+ days past due | | | | | | | | | | | | | |
Non-performing | | | | | | | | | | | | 1 | |
Construction and forestry | | | | | | | | | | | | | |
Current | | | | | | 1 | | | 377 | | | 417 | |
30+ days past due | | | | | | | | | | | | | |
Non-performing | | | | | | | | | | | | | |
Total wholesale receivables | | | | | $ | 3 | | $ | 2,748 | | $ | 3,273 | |
| | October 31, 2021 | | ||||||||||
| | 2021 | | 2020 | | 2019 | | 2018 | | ||||
Wholesale receivables: |
|
|
|
|
|
|
|
|
|
|
|
|
|
Agriculture and turf | | | | | | | | | | | | | |
Current | | $ | 346 | | $ | 80 | | $ | 22 | | $ | 9 | |
30+ days past due | | | | | | | | | | | | | |
Non-performing | | | | | | | | | 12 | | | | |
Construction and forestry | | | | | | | | | | | | | |
Current | | | 41 | | | 7 | | | 7 | | | | |
30+ days past due | | | | | | | | | | | | | |
Non-performing | | | | | | | | | | | | | |
Total wholesale receivables | | $ | 387 | | $ | 87 | | $ | 41 | | $ | 9 | |
| | | | | | | | | | | | | |
| | October 31, 2021 | | ||||||||||
| | 2017 | | Prior Years | | Revolving | | Total | | ||||
Wholesale receivables: | |
|
|
|
|
|
|
|
|
|
|
| |
Agriculture and turf | | | | | | | | | | | | | |
Current | | $ | 3 | | | | | $ | 1,696 | | $ | 2,156 | |
30+ days past due | | | | | | | | | | | | | |
Non-performing | | | | | | | | | | | | 12 | |
Construction and forestry | | | | | | | | | | | | | |
Current | | | 1 | | $ | 1 | | | 340 | | | 397 | |
30+ days past due | | | | | | 1 | | | | | | 1 | |
Non-performing | | | | | | | | | | | | | |
Total wholesale receivables | | $ | 4 | | $ | 2 | | $ | 2,036 | | $ | 2,566 | |
66
An analysis of the allowance for credit losses and investment in financing receivables follows in millions of dollars:
| | Retail Notes | | Revolving | | | | |
| ||||
| | & Financing | | Charge | | Wholesale | | |
| ||||
|
| Leases |
| Accounts |
| Receivables | | Total |
| ||||
2022 |
| | | | |
| | | |
| | |
|
Allowance: | | | | | | | | | | | | | |
Beginning of year balance | | $ | 138 | | $ | 21 | | $ | 7 | | $ | 166 | |
Provision (credit) | |
| 197 | |
| (2) | |
| (3) | |
| 192 | |
Write-offs | |
| (61) | |
| (27) | |
| | |
| (88) | |
Recoveries | |
| 22 | |
| 30 | | | | |
| 52 | |
Translation adjustments | |
| 3 | | | | |
| | |
| 3 | |
End of year balance* | | $ | 299 | | $ | 22 | | $ | 4 | | $ | 325 | |
| | | | | | | | | | | | | |
Financing receivables: | | | | | | | | | | | | | |
End of year balance | | $ | 35,367 | | $ | 4,255 | | $ | 3,273 | | $ | 42,895 | |
2021 |
| | |
| |
|
| | |
| | |
|
Allowance: | | | | | | | | | | | | | |
Beginning of year balance | | $ | 133 | | $ | 43 | | $ | 8 | | $ | 184 | |
ASU No. 2016-13 | | | 44 | |
| (13) | |
| | | | 31 | |
Provision (credit) | |
| | |
| (17) | |
| (1) | |
| (18) | |
Write-offs | |
| (60) | |
| (28) | |
| | |
| (88) | |
Recoveries | |
| 20 | |
| 36 | | | | |
| 56 | |
Translation adjustments | |
| 1 | | | | |
| | |
| 1 | |
End of year balance* | | $ | 138 | | $ | 21 | | $ | 7 | | $ | 166 | |
| | | | | | | | | | | | | |
Financing receivables: | | | | | | | | | | | | | |
End of year balance | | $ | 32,233 | | $ | 3,825 | | $ | 2,566 | | $ | 38,624 | |
2020 | | | | | | | | | | | | | |
Allowance: | | | | | | | | | | | | | |
Beginning of year balance | | $ | 107 | | $ | 40 | | $ | 3 | | $ | 150 | |
Provision | |
| 81 | |
| 26 | |
| 3 | |
| 110 | |
Write-offs | |
| (65) | |
| (53) | |
| | |
| (118) | |
Recoveries | |
| 17 | |
| 30 | | | | |
| 47 | |
Translation adjustments | |
| (7) | | | | |
| 2 | |
| (5) | |
End of year balance* | | $ | 133 | | $ | 43 | | $ | 8 | | $ | 184 | |
| | | | | | | | | | | | | |
Financing receivables: | | | | | | | | | | | | | |
End of year balance | | $ | 27,206 | | $ | 3,902 | | $ | 3,529 | | $ | 34,637 | |
* Individual allowances were not significant.
As part of the allowance setting process, the company continues to monitor the economy, including potential impacts of inflation and rising interest rates, among other factors, and qualitative adjustments to the allowance are incorporated, as necessary. In 2022, the allowance for credit losses on retail notes and financing lease receivables increased due to higher reserves related to the events in Russia / Ukraine and higher portfolio balances. This was partially offset by continued positive agricultural market conditions, which drove favorable impacts on the allowance. Similar to the strong performance in 2021, the revolving portfolio experienced low write-offs and solid recoveries. In 2021, the allowance for credit losses on retail notes and financing lease receivables increased due to the adoption of ASU No. 2016-13. This was partially offset by lower expected losses in the construction and forestry market and better than expected performance of accounts granted payment relief due to the economic effects of COVID. The allowance for credit losses on revolving charge accounts decreased in 2021, reflecting a decrease due to the
adoption of ASU No. 2016-13 and continued improvement in the agricultural and turf market.
Financing receivable analysis metrics follow in millions of dollars:
| | 2022 | | 2021 | | ||
Percent of the overall financing receivable portfolio: | | | | | | | |
Past-due amounts | | | 1.07 | | | 1.09 | |
Non-performing | | | .83 | | | .96 | |
Allowance for credit losses | | | .76 | | | .43 | |
Deposits held as credit enhancements | | $ | 158 | | $ | 154 | |
A troubled debt restructuring is a significant modification of debt in which a creditor grants a concession it would not otherwise consider to a debtor that is experiencing financial difficulties. These modifications may include a reduction of the stated interest rate, an extension of the maturity dates, a reduction of the face amount or maturity amount of the debt, or a reduction of accrued interest. The following table includes receivable contracts identified as troubled debt restructurings:
|
| 2022 |
| 2021 |
| 2020 | | |||
Number of receivable contracts | | | 276 | | | 397 | | | 574 | |
Pre-modification balance in millions | | $ | 12 | | $ | 18 | | $ | 108 | |
Post modification balance in millions | | | 10 | | | 17 | | | 95 | |
Troubled debt restructurings in 2022 and 2021 related to retail notes, while 2020 modifications related to wholesale receivables in Argentina. The short-term relief related to COVID (primarily granted in 2020) did not meet the definition of a troubled debt restructuring. In 2022, 2021, and 2020, there were no significant troubled debt restructurings that subsequently defaulted and were written off. At October 30, 2022, the company had no commitments to lend to customers whose accounts were modified in troubled debt restructurings.
Other Receivables
Other receivables at October 30, 2022 and October 31, 2021 consisted of the following in millions of dollars:
|
| 2022 |
| 2021 |
| ||
Taxes receivable | | $ | 1,450 | | $ | 1,436 |
|
Collateral on derivatives | | | 709 | | | 13 | |
Receivables from unconsolidated affiliates | | | | | | 27 | |
Other | |
| 333 | |
| 289 | |
Other receivables |
| $ | 2,492 |
| $ | 1,765 | |
67
12. SECURITIZATION OF FINANCING RECEIVABLES
As a part of its overall funding strategy, the company periodically transfers certain financing receivables (retail notes) into VIEs that are SPEs, or non-VIE banking operations, as part of its asset-backed securities programs (securitizations). The structure of these transactions is such that the transfer of the retail notes does not meet the accounting criteria for sales of receivables, and is, therefore, accounted for as a secured borrowing. SPEs utilized in securitizations of retail notes differ from other entities included in the company’s consolidated statements because the assets they hold are legally isolated. Use of the assets held by the SPEs or the non-VIEs is restricted by terms of the documents governing the securitization transactions.
In these securitizations, the retail notes are transferred to certain SPEs, which in turn issue debt to investors, or to non-VIE banking operations, which provide funding directly to the company. The funding provided by these third-parties result in secured borrowings, which are recorded as “Short-term securitization borrowings” on the balance sheets. The securitized retail notes are recorded as “Financing receivables securitized - net” on the balance sheets. The total restricted assets on the balance sheets related to these securitizations include the financing receivables securitized, less an allowance for credit losses, and other assets primarily representing restricted cash. Restricted cash results from contractual requirements in securitized borrowing arrangements and serves as a credit enhancement. The restricted cash is used to satisfy payment deficiencies, if any, in the required payments on secured borrowings. The balance of restricted cash is contractually stipulated and is either a fixed amount as determined by the initial balance of the financing receivables securitized or a fixed percentage of the outstanding balance of the securitized financing receivables. The restriction is removed either after all secured borrowing payments are made or proportionally as these receivables are collected and borrowing obligations reduced. For those securitizations in which retail notes are transferred into SPEs, the SPEs supporting the secured borrowings are consolidated unless the company does not have both the power to direct the activities that most significantly impact the SPEs’ economic performance and the obligation to absorb losses or the right to receive benefits that could potentially be significant to the SPEs. No additional support to these SPEs beyond what was previously contractually required has been provided during the reporting periods.
In certain securitizations, the company consolidates the SPEs since it has both the power to direct the activities that most significantly impact the SPEs’ economic performance through its role as servicer of all the receivables held by the SPEs, and the obligation through variable interests in the SPEs to absorb losses or receive benefits that could potentially be significant to the SPEs. The restricted assets (retail notes securitized, allowance for credit losses, and other assets) of the consolidated SPEs totaled $5,037 million and $3,094 million at October 30, 2022 and October 31, 2021, respectively. The liabilities (short-term securitization borrowings and accrued interest) of these SPEs totaled $4,768 million and
$3,024 million at October 30, 2022 and October 31, 2021, respectively. The credit holders of these SPEs do not have legal recourse to the company’s general credit.
The company has a revolving warehouse facility to utilize bank conduit facilities to securitize retail notes, described further in the following paragraphs. At October 30, 2022, the facility had a total capacity, or “financing limit,” of up to $1,000 million of secured financings at any time. The agreement was renewed in November 2022 with an expiration in November 2023 and a capacity of $1,500 million.
Through the revolving warehouse facility, the company transfers retail notes into bank-sponsored, multi-seller, commercial paper conduits, which are SPEs that are not consolidated. The company does not service a significant portion of the conduits’ receivables, and therefore, does not have the power to direct the activities that most significantly impact the conduits’ economic performance. These conduits provide a funding source to the company (as well as other transferors into the conduit) as they fund the retail notes through the issuance of commercial paper. The company’s carrying values and variable interest related to these conduits were restricted assets (retail notes securitized, allowance for credit losses, and other assets) of $843 million and $1,176 million at October 30, 2022 and October 31, 2021, respectively. The liabilities (short-term securitization borrowings and accrued interest) related to these conduits were $759 million and $1,113 million at October 30, 2022 and October 31, 2021, respectively.
The company’s carrying amount of the liabilities to the unconsolidated conduits, compared to the maximum exposure to loss related to these conduits, which would only be incurred in the event of a complete loss on the restricted assets, was as follows at October 30, 2022 in millions of dollars:
|
| 2022 |
| |
Carrying value of liabilities | | $ | 759 |
|
Maximum exposure to loss | |
| 843 | |
The total assets of the unconsolidated conduits related to securitizations were approximately $18 billion at October 30, 2022.
In addition, through the revolving warehouse facility, the company transfers retail notes to banks, which may elect to fund the retail notes through the use of their own funding sources. These non-VIE banking operations are not consolidated since the company does not have a controlling interest in them. The company’s carrying values and interests related to the securitizations with the unconsolidated non-VIEs were restricted assets (retail notes securitized, allowance for credit losses and other assets) of $211 million and $496 million at October 30, 2022 and October 31, 2021, respectively. The liabilities (short-term securitization borrowings and accrued interest) were $190 million and $470 million at October 30, 2022 and October 31, 2021, respectively.
68
The components of consolidated restricted assets, secured borrowings, and other liabilities related to secured borrowings at October 30, 2022 and October 31, 2021 were as follows in millions of dollars:
|
| 2022 |
| 2021 |
| ||
Financing receivables securitized (retail notes) | | $ | 5,952 | | $ | 4,673 |
|
Allowance for credit losses | |
| (16) | |
| (14) | |
Other assets (primarily restricted cash) | |
| 155 | |
| 107 | |
Total restricted securitized assets |
| $ | 6,091 |
| $ | 4,766 | |
| | | | | | | |
Short-term securitization borrowings | | $ | 5,711 | | $ | 4,605 | |
Accrued interest on borrowings | |
| 6 | |
| 2 | |
Total liabilities related to restricted securitized assets |
| $ | 5,717 |
| $ | 4,607 | |
The short-term securitization borrowings are presented net of debt acquisition costs. The weighted-average interest rates on short-term securitization borrowings at October 30, 2022 and October 31, 2021 were 2.8 percent and .9 percent, respectively. The secured borrowings related to these restricted securitized retail notes are obligations that are payable as the retail notes are liquidated. Repayment of the secured borrowings depends on cash flows generated by the restricted assets. Depending on the company’s ability to obtain and meet certain pre-established credit rating criteria, cash collections from these restricted assets are required to be placed into a segregated collection account either on a daily basis or immediately prior to the time payment is required to the secured creditors. At October 30, 2022 the maximum remaining term of all securitized retail notes was approximately seven years.
The payment schedule for these borrowings at October 30, 2022 based on the expected liquidation of the retail notes in millions of dollars is as follows: 2023 - $2,703, 2024 - $1,662, 2025 - $955, 2026 - $373, 2027 - $25, and later years - $3.
13. INVENTORIES
A majority of inventory owned by Deere & Company and its U.S. equipment subsidiaries are valued at cost, on the “last-in, first-out” (LIFO) basis. Remaining inventories are generally valued at the lower of cost, on the “first-in, first-out” (FIFO) basis, or net realizable value. The value of gross inventories on the LIFO basis at October 30, 2022 and October 31, 2021 represented 57 percent and 54 percent, respectively, of worldwide gross inventories at FIFO value. If all inventories had been valued on a FIFO basis, estimated inventories by major classification at October 30, 2022 and October 31, 2021 in millions of dollars would have been as follows:
| | | | | | | |
|
| 2022 |
| 2021 |
| ||
Raw materials and supplies |
| $ | 4,442 |
| $ | 3,524 |
|
Work-in-process | |
| 1,190 | |
| 994 | |
Finished goods and parts | |
| 5,363 | |
| 4,373 | |
Total FIFO value | |
| 10,995 | |
| 8,891 | |
Less adjustment to LIFO value | |
| 2,500 | |
| 2,110 | |
Inventories |
| $ | 8,495 |
| $ | 6,781 | |
14. PROPERTY AND DEPRECIATION
A summary of property and equipment at October 30, 2022 and October 31, 2021 in millions of dollars follows:
| | Useful Lives* | | | | | | |
|
|
| (Years) |
| 2022 |
| 2021 |
| ||
Land | | | | $ | 274 | | $ | 297 |
|
Buildings and building equipment |
| 22 | |
| 4,386 | |
| 4,352 | |
Machinery and equipment |
| 11 | |
| 6,208 | |
| 6,123 | |
Dies, patterns, tools, etc. |
| 8 | |
| 1,558 | |
| 1,679 | |
All other |
| 5 | |
| 1,205 | |
| 1,197 | |
Construction in progress | | | |
| 818 | |
| 527 | |
Total at cost | | | |
| 14,449 | |
| 14,175 | |
Less accumulated depreciation | | | |
| 8,393 | |
| 8,355 | |
Property and equipment - net | | |
| $ | 6,056 |
| $ | 5,820 | |
* Weighted-averages
Total property and equipment additions in 2022, 2021, and 2020 were $1,197 million, $897 million, and $815 million and depreciation was $806 million, $830 million, and $800 million, respectively. Capitalized interest was $4 million, $3 million, and $6 million in the same periods, respectively. The cost of leased property and equipment under finance leases was $117 million and $131 million, with accumulated depreciation of $68 million and $60 million at October 30, 2022 and October 31, 2021, respectively.
For property and equipment, more than 10 percent resides in the U.S. and Germany, separately disclosed below in millions of dollars:
|
| 2022 |
| 2021 |
| 2020 | | |||
U.S. | | $ | 3,452 | | $ | 3,138 | | $ | 3,150 | |
Germany | |
| 991 | |
| 1,096 | |
| 1,113 | |
Other countries | |
| 1,613 | |
| 1,586 | |
| 1,554 | |
Total | | $ | 6,056 | | $ | 5,820 | | $ | 5,817 | |
The cost of compliance with foreseeable environmental requirements has been accrued and did not have a material effect on the company’s consolidated financial statements.
15. GOODWILL AND OTHER INTANGIBLE ASSETS – NET
The changes in amounts of goodwill by operating segments were as follows in millions of dollars:
|
| PPA |
| SAT |
| CF |
| Total |
| ||||
November 1, 2020 | | $ | 333 | | $ | 268 | | $ | 2,480 | | $ | 3,081 |
|
Acquisitions (Note 3) | | | 201 | | | | | | | | | 201 | |
Translation adjustments and other | | | 8 | | | (3) | | | 4 | |
| 9 | |
October 31, 2021 | | | 542 | | | 265 | | | 2,484 | |
| 3,291 | |
Acquisitions (Note 3) | | | 132 | | | 69 | | | 599 | | | 800 | |
Translation adjustments and other | | | (28) | | | (16) | | | (360) | |
| (404) | |
October 30, 2022 | | $ | 646 | | $ | 318 | | $ | 2,723 | | $ | 3,687 | |
There were no accumulated goodwill impairment losses in the reported periods.
69
The components of other intangible assets are as follows in millions of dollars:
|
| 2022 |
| 2021 |
| ||
Amortized intangible assets: | | | | | | |
|
Customer lists and relationships | | $ | 493 | | $ | 542 |
|
Technology, patents, trademarks, and other | |
| 1,301 | |
| 1,104 | |
Total at cost | |
| 1,794 | |
| 1,646 | |
Less accumulated amortization: | |
| | |
| | |
Customer lists and relationships | | | 166 | | | 151 | |
Technology, patents, trademarks, and other | | | 410 | | | 343 | |
Total accumulated amortization | | | 576 | | | 494 | |
Amortized intangible assets | |
| 1,218 | | | 1,152 | |
Unamortized intangible assets: | | | | | | | |
In-process research and development | |
| | | | 123 | |
Other intangible assets - net |
| $ | 1,218 |
| $ | 1,275 | |
In September 2017, the company acquired Blue River Technology’s in-process research and development related to machine learning technology to optimize the use of farm inputs. Those research and development activities were completed, and the company started amortizing the acquired technology in 2022.
Other intangible assets are stated at cost less accumulated amortization. The amortization of other intangible assets in 2022, 2021, and 2020 was $145 million, $116 million, and $102 million, respectively. The estimated amortization expense for the next five years is as follows in millions of dollars:
| | Estimated | | |
Year | | Amortization | | |
2023 | | $ | 162 | |
2024 | | | 158 | |
2025 | | | 131 | |
2026 | | | 111 | |
2027 | | | 110 | |
16. OTHER ASSETS
Other assets at October 30, 2022 and October 31, 2021 consisted of the following in millions of dollars:
|
| 2022 |
| 2021 | | ||
Operating lease asset (Note 24) | | $ | 299 | | $ | 291 | |
Capitalized software, net |
| | 372 |
| | 282 | |
Investment in unconsolidated affiliates | | | 117 |
| | 175 | |
Deferred charges (including prepaids) | | | 383 | | | 281 | |
Derivative assets (Note 26) | | | 373 | | | 275 | |
Prepaid taxes | | | 185 | | | 193 | |
Parts return asset | | | 119 | | | 114 | |
| | 167 | | | 108 | | |
Matured lease & repossessed inventory | | | 44 | | | 55 | |
Other | | | 358 | | | 371 | |
Total | | $ | 2,417 | | $ | 2,145 | |
Capitalized software has an estimated useful life of three years. Amortization of these software costs in 2022, 2021, and 2020 was $117 million, $121 million, and $133 million, respectively.
Investment in unconsolidated affiliates are companies in which Deere & Company owns 20 percent to 50 percent of the
outstanding voting shares. Deere & Company does not control these companies and accounts for its investments in them on the equity basis. In March 2022, the company acquired full ownership of three former Deere-Hitachi joint venture factories and began new license and supply agreements with Hitachi (see Note 3). During 2021, the company sold its investment in Bell Equipment Limited, resulting in no material gain or loss.
Combined financial information of the unconsolidated affiliated companies in millions of dollars follows:
Operations |
| 2022 |
| 2021 |
| 2020 |
| |||
Sales | | $ | 1,023 | | $ | 2,095 | | $ | 1,793 | |
Net income | |
| 11 | |
| 51 | |
| 7 | |
Deere & Company’s equity in net income (loss) | |
| 10 | | | 21 | | | (48) | |
Financial Position |
| 2022 |
| 2021 |
| ||
Total assets | | $ | 696 | | $ | 1,289 | |
Total external borrowings | |
| 470 | |
| 497 | |
Total net assets | |
| 166 | |
| 366 | |
Deere & Company’s share of the net assets | |
| 117 | |
| 175 | |
In the ordinary course of business, the company purchases and sells components and finished goods to the unconsolidated affiliated companies. Transactions with unconsolidated affiliated companies reported in the statements of consolidated income in millions of dollars follow:
| | 2022 |
| 2021 |
| 2020 | | |||
Net sales | | $ | 26 | | $ | 78 | | $ | 81 | |
Purchases | | | 761 | | | 1,605 | | | 1,288 | |
17. SHORT-TERM BORROWINGS
Short-term borrowings at October 30, 2022 and October 31, 2021 consisted of the following in millions of dollars:
|
| 2022 |
| 2021 |
| ||
Commercial paper |
| $ | 4,703 |
| $ | 2,230 |
|
Notes payable to banks | | | 402 |
| | 336 | |
Finance lease obligations due within one year | | | 21 | | | 23 | |
Long-term borrowings due within one year* | |
| 7,466 | |
| 8,330 | |
Short-term borrowings | | $ | 12,592 | | $ | 10,919 | |
* Includes unamortized fair value adjustments related to interest rate swaps.
The weighted-average interest rates on short-term borrowings, excluding current maturities of finance lease obligations and long-term borrowings, at October 30, 2022 and October 31, 2021 were 4.1 percent and .8 percent, respectively.
Lines of credit available from U.S. and foreign banks were $8,402 million at October 30, 2022. At October 30, 2022, $3,284 million of these worldwide lines of credit were unused. For the purpose of computing the unused credit lines, commercial paper and short-term bank borrowings, excluding secured borrowings and the current portion of long-term borrowings, were primarily considered to constitute utilization. Included in the total credit lines at October 30, 2022 was a 364-day credit facility agreement of $3,000 million, expiring in the second quarter of 2023. In addition, total credit lines included long-term credit facility agreements of $2,500 million, expiring in the second quarter of 2026, and $2,500
70
million, expiring in the second quarter of 2027. The agreements are mutually extendable, and the annual facility fees are not significant.
In October 2022, the company amended these credit agreements with pricing adjustments tied to the Leap Ambitions framework. Failure to meet certain Scope 1 and 2 emissions targets or engaged acres goals will result in a maximum 6 basis-point penalty rate, while exceeding certain thresholds on the same metrics will result in a similar favorable rate adjustment.
These credit agreements require Capital Corporation to maintain its consolidated ratio of earnings to fixed charges at not less than 1.05 to 1 for each fiscal quarter and the ratio of senior debt, excluding securitization indebtedness, to capital base (total subordinated debt and stockholder’s equity excluding accumulated other comprehensive income (loss)) at not more than 11 to 1 at the end of any fiscal quarter. The credit agreements also require the equipment operations to maintain a ratio of total debt to total capital (total debt and stockholders’ equity excluding accumulated other comprehensive income (loss)) of 65 percent or less at the end of each fiscal quarter. Under this provision, the company’s excess equity capacity and retained earnings balance free of restriction at October 30, 2022 was $18,526 million. Alternatively under this provision, the equipment operations had the capacity to incur additional debt of $34,405 million at October 30, 2022. All of these credit agreement requirements have been met during the periods included in the consolidated financial statements.
Deere & Company has an agreement with Capital Corporation pursuant to which it has agreed to continue to own, directly or through one or more wholly-owned subsidiaries, at least 51 percent of the voting shares of capital stock of Capital Corporation and to maintain Capital Corporation’s consolidated tangible net worth at not less than $50 million. This agreement also obligates Deere & Company to make payments to Capital Corporation such that its consolidated ratio of earnings to fixed charges is not less than 1.05 to 1 for each fiscal quarter. Deere & Company’s obligations to make payments to Capital Corporation under the agreement are independent of whether Capital Corporation is in default on its indebtedness, obligations or other liabilities. Further, Deere & Company’s obligations under the agreement are not measured by the amount of Capital Corporation’s indebtedness, obligations, or other liabilities. Deere & Company’s obligations to make payments under this agreement are expressly stated not to be a guaranty of any specific indebtedness, obligation, or liability of Capital Corporation and are enforceable only by or in the name of Capital Corporation. No payments were required under this agreement during the periods included in the consolidated financial statements. At October 30, 2022, Deere & Company indirectly owned 100 percent of the voting shares of Capital Corporation’s capital stock and Capital Corporation’s consolidated tangible net worth was $4,803 million.
18. ACCOUNTS PAYABLE AND ACCRUED EXPENSES
Accounts payable and accrued expenses at October 30, 2022 and October 31, 2021 consisted of the following in millions of dollars:
|
| 2022 |
| 2021 |
| ||
Accounts payable and accrued expenses | | |
| | |
| |
Accounts payable: | | | | | | | |
Trade payables |
| $ | 3,894 |
| $ | 3,173 |
|
Payables to unconsolidated affiliates | | | 11 | | | 143 | |
Dividends payable | |
| 343 | |
| 329 | |
| | 302 | | | 279 | | |
Deposits withheld from dealers and merchants | | | 163 | | | 157 | |
Other | |
| 214 | |
| 159 | |
Accrued expenses: | | | | | | | |
Dealer sales discounts | |
| 2,324 | |
| 1,636 | |
Product warranties | |
| 1,427 | |
| 1,312 | |
Employee benefits | |
| 1,528 | |
| 1,531 | |
Accrued taxes | | | 1,265 | | | 1,075 | |
Unearned operating lease revenue | | | 399 | | | 421 | |
Unearned revenue (contractual liability) | |
| 557 | |
| 570 | |
Extended warranty premium | | | 866 | | | 774 | |
Accrued interest | | | 288 | | | 251 | |
Derivative liabilities | | | 1,231 | | | 228 | |
Other | |
| 1,320 | |
| 1,175 | |
Total | | | 16,132 | | | 13,213 | |
Eliminations* | |
| 1,310 | |
| 865 | |
Total accounts payable and accrued expenses |
| $ | 14,822 |
| $ | 12,348 | |
* Primarily sales incentive accruals with a right of set-off against trade receivables. At October 30, 2022 and October 31, 2021, $1,280 million and $836 million, respectively, of sales incentive accruals were classified as accrued expenses by the equipment operations as the related trade receivables had been sold to financial services.
19. LONG-TERM BORROWINGS
Long-term borrowings at October 30, 2022 and October 31, 2021 consisted of the following in millions of dollars:
|
| 2022 |
| 2021 |
| ||
Underwritten term debt | | |
| | |
| |
U.S. dollar notes and debentures: | | | | | | | |
2.75% notes due 2025 | | $ | 700 | | $ | 700 | |
6.55% debentures due 2028 | |
| 200 | |
| 200 | |
5.375% notes due 2029 | |
| 500 | |
| 500 | |
3.10% notes due 2030 | | | 700 | | | 700 | |
8.10% debentures due 2030 | |
| 250 | |
| 250 | |
7.125% notes due 2031 | |
| 300 | |
| 300 | |
3.90% notes due 2042 | |
| 1,250 | |
| 1,250 | |
2.875% notes due 2049 | | | 500 | | | 500 | |
3.75% notes due 2050 | | | 850 | | | 850 | |
Euro notes: | | | | | | | |
.5% notes due 2023 (€500 principal) | | | | | | 584 | |
1.375% notes due 2024 (€800 principal) | | | 797 | | | 934 | |
1.85% notes due 2028 (€600 principal) | | | 598 | | | 701 | |
2.20% notes due 2032 (€600 principal) | | | 598 | | | 701 | |
1.65% notes due 2039 (€650 principal) | | | 648 | | | 759 | |
Serial issuances | | | | | | | |
Medium-term notes: (principal $25,629 - 2022, $22,647 - 2021) Average interest rates of 2.9% - 2022, 1.2% - 2021 |
| | 24,604 | | | 22,899 | |
Other notes and finance lease obligations | |
| 1,223 | |
| 1,178 | |
Less debt issuance costs and debt discounts | | | (122) | | | (118) | |
Long-term borrowings |
| $ | 33,596 | | $ | 32,888 | |
71
Medium-term notes serially due 2023 through 2032 are primarily offered by prospectus and issued at fixed and variable rates. These notes are presented in the table above with fair value adjustments related to interest rate swaps. All outstanding notes and debentures are senior unsecured borrowings and rank equally with each other.
In April 2022, the company issued $600 million of sustainability-linked medium-term notes with an initial interest rate of 3.35 percent, which are due in 2029. This transaction supports the company’s commitment to environmental sustainability. Failure to meet the stated sustainability performance target will result in a 25-basis point increase to the interest rate payable on the 2029 notes from and including April 2026.
The principal amounts of the company’s long-term borrowings maturing in each of the next five years in millions of dollars are as follows: 2023 - $7,453, 2024 - $7,960, 2025 - $6,820, 2026 - $4,154, and 2027 - $3,242.
20. COMMITMENTS AND CONTINGENCIES
The company determines its total warranty liability by applying historical claims rate experience to the estimated amount of equipment that has been sold and is still under warranty based on dealer inventories and retail sales. The historical claims rate is determined by a review of five-year claims costs and current quality developments.
The premiums for extended warranties are recognized in “Other income” in the statements of consolidated income in proportion to the costs expected to be incurred over the contract period. The unamortized extended warranty premiums (deferred revenue) included in the following table totaled $866 million and $774 million at October 30, 2022 and October 31, 2021, respectively.
A reconciliation of the changes in the warranty liability and unearned premiums in millions of dollars follows:
| | Warranty Liability/ |
| ||||
| | Unearned Premiums |
| ||||
|
| 2022 |
| 2021 |
| ||
Beginning of year balance |
| $ | 2,086 |
| $ | 1,743 |
|
Payments | |
| (951) | |
| (864) | |
Amortization of premiums received | |
| (289) | |
| (227) | |
Accruals for warranties | |
| 1,094 | |
| 1,071 | |
Premiums received | |
| 404 | |
| 358 | |
Foreign exchange | |
| (51) | |
| 5 | |
End of year balance |
| $ | 2,293 |
| $ | 2,086 | |
At October 30, 2022, the company had approximately $287 million of guarantees issued to banks outside the U.S. and Canada related to third-party receivables for the retail financing of John Deere equipment. The company may recover a portion of any required payments incurred under these agreements from repossession of the equipment collateralizing the receivables. At October 30, 2022, the accrued losses under these agreements were not material. The maximum remaining term of the receivables guaranteed at October 30, 2022 was about eight years.
At October 30, 2022, the company had commitments of approximately $418 million for the construction and acquisition of property and equipment. Also at October 30, 2022, the company had restricted assets of $221 million, classified as “Other assets.”
The company also had other miscellaneous contingent liabilities and guarantees totaling approximately $110 million at October 30, 2022. The accrued liability for these contingencies was not material at October 30, 2022.
The company has commitments to extend credit to customers through lines of credit and other pre-approved credit arrangements. The amount of unused commitments to extend credit to John Deere dealers was approximately $10 billion at October 30, 2022. The amount of unused commitments to extend credit to retail customers was approximately $32 billion at October 30, 2022, primarily related to revolving charge accounts. A significant portion of these commitments is not expected to be fully drawn upon; therefore, the total commitment amounts likely do not represent a future cash requirement. The company generally has the right to unconditionally cancel, alter, or amend the terms of these commitments at any time. The company has a reserve for credit losses of $3 million on unfunded commitments that are not unconditionally cancellable at October 30, 2022.
The company is subject to various unresolved legal actions which arise in the normal course of its business, the most prevalent of which relate to product liability (including asbestos related liability), retail credit, employment, patent, trademark, and antitrust matters. The company believes the reasonably possible range of losses for these unresolved legal actions would not have a material effect on its financial statements.
21. CAPITAL STOCK
The $1 par value common stock of Deere & Company is listed on the New York Stock Exchange under the symbol “DE”. At October 30, 2022, there were 17,829 holders of record of the company’s common stock.
The number of common shares the company is authorized to issue is 1,200 million. The number of common shares issued at October 30, 2022, October 31, 2021, and November 1, 2020 was 536.4 million. The number of authorized preferred shares is nine million. No preferred shares have been issued.
The Board of Directors at a meeting in December 2019 authorized the repurchase of up to $8,000 million of common stock. At the end of fiscal year 2022, this repurchase program had $2,228 million (5.6 million shares based on the fiscal year end closing common stock price of $396.85 per share) remaining to be repurchased. Repurchases of the company’s common stock under this plan are made from time to time, at the company’s discretion, in the open market.
72
A reconciliation of basic and diluted net income per share attributable to Deere & Company follows in millions, except per share amounts:
|
| 2022 |
| 2021 |
| 2020 |
| |||
Net income attributable to Deere & Company |
| $ | 7,131 |
| $ | 5,963 |
| $ | 2,751 | |
Average shares outstanding | |
| 304.5 | |
| 311.6 | |
| 313.5 | |
Basic per share |
| $ | 23.42 |
| $ | 19.14 |
| $ | 8.77 | |
Average shares outstanding | |
| 304.5 | |
| 311.6 | |
| 313.5 | |
Effect of dilutive stock options | |
| 1.8 | |
| 2.4 | |
| 3.1 | |
Total potential shares outstanding | |
| 306.3 | |
| 314.0 | |
| 316.6 | |
Diluted per share |
| $ | 23.28 |
| $ | 18.99 |
| $ | 8.69 | |
All stock options outstanding were included in the computation of diluted shares except .2 million in 2022 and .6 million in 2020 that had an antidilutive effect under the treasury stock method.
22. STOCK OPTION AND RESTRICTED STOCK UNIT AWARDS
The company issues stock options and restricted stock unit awards to key employees under plans approved by stockholders. Restricted stock unit awards consist of service-based and performance /service-based awards. Restricted stock units are also issued to nonemployee directors for their services as directors under a plan approved by stockholders. At October 30, 2022, the company is authorized to grant an additional 17.2 million shares related to stock options or restricted stock units. The company currently uses shares that have been repurchased through its stock repurchase programs to satisfy share option exercises.
Service-based restricted stock units cliff vest after a three-year service period and include dividend equivalent payments. Performance/service-based awards are subject to a performance metric based on the company’s compound annual revenue growth rate, compared to a benchmark group of companies over the three-year vesting period. The performance/service-based units award common stock in a range of zero to 200 percent for each unit granted based on the level of the metric achieved and do not include dividend equivalent payments over the vesting period. Stock options ratably vest over a three-year service period and expire ten years from the grant date.
The fair value of stock options and service-based restricted stock units, which is based on the closing price of the company’s common stock on the grant date, are expensed over the shorter of the award vesting period or the employee’s retirement eligibility period. Performance/service-based units expense, which are based on the fair value at the grant date excluding dividends, are recognized over the employees’ requisite service period and adjusted quarterly for the probable number of shares to be awarded. The fair value of each stock option award was estimated on the date of grant using a binomial lattice option valuation model. The company recognizes the effect of award forfeitures as an adjustment to compensation expense in the period the forfeiture occurs.
The total share-based compensation expense, recognized income tax benefits, and total grant-date fair values of stock options and
restricted stock units vested consisted of the following in millions of dollars:
| | 2022 | | 2021 | | 2020 | | |||
Share-based compensation expense | | $ | 85 | | $ | 82 | | $ | 81 | |
Income tax benefits | | | 17 | | | 16 | | | 19 | |
Stock options and restricted stock units vested | | | 74 | | | 93 | | | 79 | |
At October 30, 2022, there was $66 million of total unrecognized compensation cost from share-based compensation arrangements granted under the plans. This compensation is expected to be recognized over a weighted-average period of approximately 1.5 years.
Stock Options
Expected volatilities are based on implied volatilities from traded call options on the company’s stock. The expected volatilities are constructed from the following three components: the starting implied volatility of short-term call options traded within a few days of the valuation date; the predicted implied volatility of long-term call options; and the trend in implied volatilities over the span of the call options’ time to maturity. The company uses historical data to estimate option exercise behavior. The expected term of options granted is derived from the output of the option valuation model based on the underlying distribution of historical exercise behavior and represents the weighted-average period of time that options granted are expected to be outstanding. The risk-free rates utilized for periods throughout the contractual life of the options are based on U.S. Treasury security yields at the time of grant.
The assumptions used for the binomial lattice model to determine the fair value of options follow:
| | | | | | | |
|
| 2022 |
| 2021 |
| 2020 |
|
Risk-free interest rate* |
| 1.27% |
| .47% |
| 1.67% | |
Expected dividends | | 1.2% | | 1.2% | | 1.8% | |
Volatility* | | 32.0% | | 31.0% | | 26.0% | |
Expected term (in years)* |
| 5.1 |
| 5.5 |
| 5.7 | |
* Weighted-averages
The activity for outstanding stock options at October 30, 2022, and changes during 2022 in millions of dollars and shares follow:
| | | | | | | Remaining | | | |
|
| | | | | | | Contractual | | Aggregate |
| |
| | | | Exercise | | Term | | Intrinsic |
| ||
| | Shares |
| Price* |
| (Years) |
| Value |
| ||
Outstanding at beginning of year |
| 2.5 | | $ | 127.82 | | | | | | |
Granted |
| .2 | |
| 343.94 | | | | | | |
Exercised |
| (.6) | |
| 105.85 | | | | | | |
Forfeited |
| (.1) | |
| 290.65 | | | | | | |
Outstanding at end of year |
| 2.0 | |
| 153.11 |
| 4.81 |
| $ | 497.2 | |
Exercisable at end of year |
| 1.6 | |
| 119.16 |
| 3.79 | |
| 436.9 | |
* Weighted-averages
73
The amounts related to stock options were as follows in millions of dollars unless otherwise noted:
| | 2022 | | 2021 | | 2020 | | |||
Weighted-average grant date fair values (per share) | | $ | 89.20 | | $ | 62.73 | | $ | 35.83 | |
Intrinsic value of options exercised | | $ | 169 | | $ | 318 | | $ | 398 | |
Cash received from exercises | | | 63 | | | 148 | | | 331 | |
Tax benefit from exercises | | | 39 | | | 71 | | | 93 | |
Restricted Stock Units
The weighted-average grant date fair values were as follows:
| | 2022 | | 2021 | | 2020 | | |||
Service-based | | $ | 347.59 | | $ | 258.86 | | $ | 168.94 | |
Performance/service-based | | | 331.47 | | | 245.73 | | | 160.81 | |
The company’s restricted stock units at October 30, 2022 and changes during 2022 in thousands of shares follow:
| | | | Grant-Date |
| |
| | Shares | | Fair Value* |
| |
Service-based | | | | | | |
Nonvested at beginning of year |
| 486 | | $ | 190.87 | |
Granted |
| 139 | |
| 347.59 | |
Vested |
| (208) | |
| 173.62 | |
Forfeited | | (13) | | | 259.72 | |
Nonvested at end of year |
| 404 | |
| 251.42 | |
Performance/service based | | | | | | |
Nonvested at beginning of year |
| 197 | | $ | 171.82 | |
Granted |
| 37 | |
| 331.47 | |
Vested |
| (168) | |
| 139.37 | |
Performance change |
| 84 | |
| 139.37 | |
Forfeited |
| (7) | |
| 267.13 | |
Nonvested at end of year |
| 143 | |
| 227.70 | |
* Weighted-averages
23. OTHER COMPREHENSIVE INCOME ITEMS
The after-tax components of accumulated other comprehensive income follow in millions of dollars.
| | | 2022 | | | 2021 | | | 2020 | |
Retirement benefits adjustment | | $ | (389) | | $ | (1,034) | | $ | (3,918) | |
Cumulative translation adjustment | | | (2,594) | | | (1,478) | | | (1,596) | |
Unrealized gain (loss) on derivatives | | | 21 | | | (42) | | | (58) | |
Unrealized gain (loss) on debt securities | | | (94) | | | 15 | | | 33 | |
Total accumulated other comprehensive income (loss) | | $ | (3,056) | | $ | (2,539) | | $ | (5,539) | |
Following are amounts recorded in and reclassifications out of other comprehensive income (loss), and the income tax effects, in millions of dollars. Retirement benefits adjustment reclassifications for actuarial (gain) loss, prior service (credit) cost,
and settlements/curtailment are included in net periodic pension and other postretirement benefit costs (see Note 7).
| | Before | | Tax | | After |
| |||
| | Tax | | (Expense) | | Tax |
| |||
|
| Amount |
| Credit |
| Amount |
| |||
2022 | | | | | | | | | | |
Cumulative translation adjustment |
| $ | (1,105) | | $ | (11) | | $ | (1,116) | |
Unrealized gain (loss) on derivatives: | | | | | | | | | | |
Unrealized hedging gain (loss) | |
| 89 | | | (19) | |
| 70 | |
Reclassification of realized (gain) loss to: | | | | | | | | | | |
Interest rate contracts – Interest expense | |
| (9) | |
| 2 | |
| (7) | |
Net unrealized gain (loss) on derivatives | |
| 80 | |
| (17) | |
| 63 | |
Unrealized gain (loss) on debt securities: | | | | | | | | | | |
Unrealized holding gain (loss) | |
| (140) | |
| 30 | |
| (110) | |
Reclassification of realized (gain) loss – Other income | | | 1 | |
| | |
| 1 | |
Net unrealized gain (loss) on debt securities | |
| (139) | |
| 30 | |
| (109) | |
Retirement benefits adjustment: | | | | | | | | | | |
Net actuarial gain (loss) | |
| 1,192 | |
| (298) | |
| 894 | |
Prior service credit (cost) | | | (517) | | | 124 | | | (393) | |
Reclassification to Other operating expenses through amortization of: | | | | | | | | | | |
Actuarial (gain) loss | |
| 116 | |
| (29) | |
| 87 | |
Prior service (credit) cost | |
| 30 | |
| (7) | |
| 23 | |
Settlements/curtailments | |
| 45 | |
| (11) | |
| 34 | |
Net unrealized gain (loss) on retirement benefits adjustment | |
| 866 | |
| (221) | |
| 645 | |
Total other comprehensive income (loss) |
| $ | (298) |
| $ | (219) |
| $ | (517) | |
| | Before | | Tax | | After |
| |||
| | Tax | | (Expense) | | Tax |
| |||
|
| Amount |
| Credit |
| Amount |
| |||
2021 |
| | |
| | |
| | | |
Cumulative translation adjustment: | | | | | | | | | | |
Unrealized translation gain (loss) |
| $ | 112 | | | | | $ | 112 | |
Reclassification of realized (gain) loss to: | | | | | | | | | | |
Equity in (income) loss of unconsolidated affiliates | | | 6 | | | | | | 6 | |
Net unrealized translation gain (loss) | | | 118 | | | | | | 118 | |
Unrealized gain (loss) on derivatives: | | | | | | | | | | |
Unrealized hedging gain (loss) | |
| 8 | | $ | (2) | |
| 6 | |
Reclassification of realized (gain) loss to: | | | | | | | | | | |
Interest rate contracts – Interest expense | |
| 13 | |
| (3) | |
| 10 | |
Net unrealized gain (loss) on derivatives | |
| 21 | |
| (5) | |
| 16 | |
Unrealized gain (loss) on debt securities: | | | | | | | | | | |
Unrealized holding gain (loss) | |
| (21) | |
| 3 | |
| (18) | |
Net unrealized gain (loss) on debt securities | |
| (21) | |
| 3 | |
| (18) | |
Retirement benefits adjustment: | | | | | | | | | | |
Net actuarial gain (loss) | |
| 3,492 | |
| (845) | |
| 2,647 | |
Reclassification to Other operating expenses through amortization of: | | | | | | | | | | |
Actuarial (gain) loss | |
| 283 | |
| (69) | |
| 214 | |
Prior service (credit) cost | |
| 8 | |
| (2) | |
| 6 | |
Settlements | |
| 22 | |
| (5) | |
| 17 | |
Net unrealized gain (loss) on retirement benefits adjustment | |
| 3,805 | |
| (921) | |
| 2,884 | |
Total other comprehensive income (loss) |
| $ | 3,923 |
| $ | (923) |
| $ | 3,000 | |
74
| | Before | | Tax | | After |
| |||
| | Tax | | (Expense) | | Tax |
| |||
|
| Amount |
| Credit |
| Amount |
| |||
2020 | | | | | | | | | | |
Cumulative translation adjustment: |
| | | | | | | | | |
Unrealized translation gain (loss) | | $ | 18 | | $ | 1 | | $ | 19 | |
Reclassification of realized (gain) loss to: | | | | | | | | | | |
Other operating expenses | | | 13 | | | | | | 13 | |
Equity in (income) loss of unconsolidated affiliates | | | 23 | | | | | | 23 | |
Net unrealized translation gain (loss) | | | 54 | | | 1 | | | 55 | |
Unrealized gain (loss) on derivatives: | | | | | | | | | | |
Unrealized hedging gain (loss) | |
| (18) | |
| 2 | |
| (16) | |
Reclassification of realized (gain) loss to: | | | | | | | | | | |
Interest rate contracts – Interest expense | |
| 21 | |
| (3) | |
| 18 | |
Net unrealized gain (loss) on derivatives | |
| 3 | |
| (1) | |
| 2 | |
Unrealized gain (loss) on debt securities: | | | | | | | | | | |
Unrealized holding gain (loss) | |
| 17 | |
| (3) | |
| 14 | |
Net unrealized gain (loss) on debt securities | |
| 17 | |
| (3) | |
| 14 | |
Retirement benefits adjustment: | | | | | | | | | | |
Net actuarial gain (loss) | |
| (302) | |
| 65 | |
| (237) | |
Reclassification to Other operating expenses through amortization of: | | | | | | | | | | |
Actuarial (gain) loss | |
| 278 | |
| (68) | |
| 210 | |
Prior service (credit) cost | |
| 7 | |
| (2) | |
| 5 | |
Settlements | |
| 26 | |
| (7) | |
| 19 | |
Net unrealized gain (loss) on retirement benefits adjustment | |
| 9 | |
| (12) | |
| (3) | |
Total other comprehensive income (loss) |
| $ | 83 |
| $ | (15) |
| $ | 68 | |
24. LEASES
The company is both a lessee and a lessor. The company leases for its own use warehouse facilities, office space, production equipment, information technology equipment, and vehicles. The expected use periods range from less than one year to 20 years. The company’s financial services segment leases to users equipment produced or sold by the company, and a limited amount of other equipment. These leases are usually written for periods of less than one year to seven years. The company determines if an arrangement is or contains a lease at the contract inception.
Lessee
The company recognizes on the balance sheets a lease liability and a right of use asset for leases with a term greater than one year for both operating and finance leases.
The amounts of the lease liability and right of use asset are determined at lease commencement and are based on the present value of the lease payments over the lease term. The lease payments are discounted using the company’s incremental borrowing rate since the rate implicit in the lease is not readily determinable. The company determines the incremental borrowing rate for each lease based on the lease term and the economic environment of the country where the asset will be used, adjusted as if the borrowings were collateralized. Leases with contractual periods greater than one year and that do not meet the finance lease criteria are classified as operating leases.
Certain real estate leases contain one or more options to terminate or renew, with terms that can extend the lease term from to ten years. Options that the company is reasonably certain to exercise are included in the lease term.
The company has elected to combine lease and nonlease components, such as maintenance and utilities costs included in a lease contract, for all asset classes. Leases with an initial term of one year or less are expensed on a straight-line basis over the lease term and recorded in short-term lease expense. Variable lease expense includes warehouse facilities leases with payments based on utilization exceeding contractual minimum amounts and leases with payments indexed to inflation when the index changes after lease commencement.
The lease expense by type consisted of the following in millions of dollars:
| | 2022 | | 2021 | | 2020 | | |||
Operating lease expense | | $ | 114 | | $ | 116 | | $ | 126 | |
Short-term lease expense | | | 55 | | | 29 | | | 23 | |
Variable lease expense | | | 74 | | | 53 | | | 41 | |
Finance lease: | | | | | | | | | | |
Depreciation expense | | | 26 | | | 26 | | | 20 | |
Interest on lease liabilities | | | 1 | | | 1 | | | 2 | |
Total lease expense | | $ | 270 | | $ | 225 | | $ | 212 | |
Operating and finance lease right of use assets and lease liabilities follow in millions of dollars:
| | | 2022 | | | 2021 | |
Operating leases: | | | | | | | |
| $ | 299 | | $ | 291 | | |
| | 302 | | | 279 | | |
| | | | | | | |
Finance leases: | | | | | | | |
| $ | 49 | | $ | 71 | | |
| | | | | | | |
| | 21 | | | 23 | | |
| | 30 | | | 38 | | |
| $ | 51 | | $ | 61 | |
The weighted-average remaining lease terms in years and discount rates follows:
| | | 2022 | | | 2021 | |
Weighted-average remaining lease terms: | | | | | | | |
Operating leases | | | | | | ||
Finance leases | | | | | | ||
| | | | | | | |
Weighted-average discount rates: | | | | | | | |
Operating leases | | | 2.4% | | | 2.3% | |
Finance leases | | | 1.9% | | | 2.3% | |
75
Lease payment amounts in each of the next five years at October 30, 2022 follow in millions of dollars:
| | Operating | | Finance | | ||
Due in: | | Leases | | Leases | | ||
2023 | | $ | 95 | | $ | 22 | |
2024 | | | 77 | | | 14 | |
2025 | | | 54 | | | 7 | |
2026 | | | 27 | | | 3 | |
2027 | | | 17 | | | 2 | |
Later years | | | 53 | | | 6 | |
Total lease payments | | | 323 | | | 54 | |
Less imputed interest | | | 21 | | | 3 | |
Total lease liabilities | | 302 | | 51 | | ||
Cash paid for amounts included in the measurement of lease liabilities follows in millions of dollars:
| | | 2022 | | | 2021 | | | 2020 | |
Operating cash flows for operating leases | | $ | 127 | | $ | 104 | | $ | 124 | |
Operating cash flows for finance leases | | | 1 | | | 1 | | | 2 | |
Financing cash flows for finance leases | | | 28 | | | 25 | | | 17 | |
Right of use assets obtained in exchange for lease liabilities follow in millions of dollars:
| | | 2022 | | | 2021 | |
Operating leases | | $ | 135 | | $ | 101 | |
Finance leases | | | 17 | | | 27 | |
Lessor
The company leases equipment manufactured or sold by the company and a limited amount of non-John Deere equipment to retail customers through sales-type, direct financing, and operating leases. Sales-type and direct financing leases are reported in “Financing receivables - net” on the consolidated balance sheets. Operating leases are reported in “Equipment on operating leases - net” on the consolidated balance sheets.
Leases offered by the company may include early termination and renewal options. At the end of a lease, the lessee has the option to purchase the underlying equipment for a fixed price or return it to the dealer. If the equipment is returned to the dealer, the dealer also has the option to purchase the equipment or return it to the company for remarketing.
The company estimates the residual values for operating leases at lease inception based on several factors, including lease term, expected hours of usage, historical wholesale sale prices, return experience, intended use of the equipment, market dynamics and trends, and dealer residual guarantees. The company reviews residual value estimates during the lease term and tests the carrying value of its operating lease assets for impairment when events or circumstances necessitate. The depreciation is adjusted on a straight-line basis over the remaining lease term if residual value estimates change. Lease agreements include usage limits and specifications on machine condition, which allow the company to assess lessees for excess use or damages to the underlying equipment. In 2020, the company recorded impairment losses on operating leases of $22 million, due to higher expected equipment return rates and lower estimated values of used construction
equipment. Operating lease impairments were recorded in “Other operating expenses.”
The company has elected to combine lease and nonlease components. The nonlease components relate to preventative maintenance and extended warranty agreements financed by the retail customer. The company has also elected to report consideration related to sales and value added taxes net of the related tax expense. Property taxes on leased assets are recorded on a gross basis in “Finance and interest income” and “Other operating expenses” on the statements of consolidated income. Variable lease revenues relate to property taxes on leased assets in certain markets and late fees. Variable lease revenues also include excess use and damage fees of $2 million, $7 million, and $8 million for 2022, 2021, and 2020 respectively, which were reported in “Other income” on the statements of consolidated income.
Lease revenues earned by the company follow in millions of dollars:
| | | 2022 | | | 2021 | | | 2020 | |
Sales-type and direct finance lease revenues | | $ | 154 | | $ | 145 | | $ | 135 | |
Operating lease revenues | | | 1,318 | | | 1,423 | | | 1,469 | |
Variable lease revenues | | | 26 | | | 30 | | | 31 | |
Total lease revenues | | $ | 1,498 | | $ | 1,598 | | $ | 1,635 | |
At the time of accepting a lease that qualifies as a sales-type or direct financing lease, the company records the gross amount of lease payments receivable, estimated residual value of the leased equipment, and unearned finance income. The unearned finance income is recognized as revenue over the lease term using the interest method.
Sales-type and direct financing lease receivables by market follow in millions of dollars:
2022 | 2021 | ||||||
Agriculture and turf | | $ | 1,118 | | $ | 1,131 | |
Construction and forestry | | | 1,167 | | | 1,284 | |
Total | | | 2,285 | | | 2,415 | |
Guaranteed residual values | | | 491 | | | 394 | |
Unguaranteed residual values | | | 56 | | | 70 | |
Less unearned finance income | | | (285) | | | (258) | |
Financing lease receivables | | $ | 2,547 | | $ | 2,621 |
Scheduled payments, including guaranteed residual values, on sales-type and direct financing lease receivables at October 30, 2022 follow in millions of dollars:
Due in: | | 2022 | | |
2023 | | $ | 1,310 | |
2024 | | | 722 | |
2025 | | | 404 | |
2026 | | | 200 | |
2027 | | | 120 | |
Later years | | | 20 | |
Total | | $ | 2,776 | |
Lease payments from operating leases are recorded as income on a straight-line method over the lease terms. Operating lease assets are recorded at cost and depreciated to their estimated residual value on a straight-line method over the terms of the leases.
76
The cost of equipment on operating leases by market follow in millions of dollars:
2022 | 2021 | ||||||
Agriculture and turf | | $ | 6,912 | | $ | 7,317 | |
Construction and forestry | | | 1,342 | | | 1,616 | |
Total | | | 8,254 | | | 8,933 | |
Less accumulated depreciation | | | (1,631) | | | (1,945) | |
Equipment on operating leases - net | | $ | 6,623 | | $ | 6,988 |
The total operating lease residual values at October 30, 2022 and October 31, 2021 were $4,640 million and $5,025 million, respectively. For operating lease originations effective after January 2020, John Deere dealers provide a first-loss residual value guarantee. The total first-loss residual value guarantees were $1,025 million and $950 million at October 30, 2022 and October 31, 2021, respectively.
The equipment is depreciated on a straight-line basis over the term of the lease. The corresponding depreciation expense was $827 million in 2022, $983 million in 2021, and $1,083 million in 2020.
Lease payments for equipment on operating leases at October 30, 2022 were scheduled as follows in millions of dollars:
Due in: | | 2022 | | |
2023 | | $ | 974 | |
2024 | | | 709 | |
2025 | | | 437 | |
2026 | | | 228 | |
2027 | | | 58 | |
Later years | | | 6 | |
Total | | $ | 2,412 | |
Past due balances of operating leases represent the total balance held (net book value plus accrued lease payments) and still accruing financing income with any payment amounts 30 days or more past the contractual payment due date. These amounts were $68 million and $70 million at October 30, 2022 and October 31, 2021, respectively.
The company discusses with lessees and dealers options to purchase the equipment or extend the lease prior to lease maturity. Equipment returned to the company upon termination of leases is remarketed by the company and recorded in “Other assets” at the lower of net book value or estimated fair value of the equipment less costs to sell and is not depreciated. In 2020, the company recorded impairment losses on matured operating lease inventory of $10 million due to lower estimated values of used construction equipment. Impairment losses on matured operating lease inventory were included in “Other operating expenses.”
25. FAIR VALUE MEASUREMENTS
Fair value is defined as the price that would be received to sell an asset or paid to transfer a liability in an orderly transaction between market participants at the measurement date. To determine fair value, the company uses various methods including market and income approaches. The company utilizes valuation models and techniques that maximize the use of observable inputs. The models are industry-standard models that consider various assumptions including time values and yield curves as well as other economic measures. These valuation techniques are consistently applied.
Level 1 measurements consist of quoted prices in active markets for identical assets or liabilities. Level 2 measurements include significant other observable inputs such as quoted prices for similar assets or liabilities in active markets; identical assets or liabilities in inactive markets; observable inputs such as interest rates and yield curves; and other market-corroborated inputs. Level 3 measurements include significant unobservable inputs.
Fair values of the financing receivables that were issued long-term were based on the discounted values of their related cash flows at interest rates currently being offered by the company for similar financing receivables. The fair values of the remaining financing receivables approximated the carrying amounts.
Fair values of long-term borrowings and short-term securitization borrowings were based on current market quotes for identical or similar borrowings and credit risk, or on the discounted values of their related cash flows at current market interest rates. Certain long-term borrowings have been swapped to current variable interest rates. The carrying values of these long-term borrowings included adjustments related to fair value hedges.
The fair values of financial instruments that do not approximate the carrying values at October 30, 2022 and October 31, 2021 in millions of dollars follow:
| | 2022 | | 2021 | | ||||||||
| | Carrying | | Fair | | Carrying | | Fair | | ||||
|
| Value |
| Value* |
| Value |
| Value* |
| ||||
Financing receivables – net | | $ | 36,634 | | $ | 35,526 | | $ | 33,799 | | $ | 33,718 | |
Financing receivables securitized – net | | | 5,936 | | | 5,698 | | | 4,659 | | | 4,704 | |
Short-term securitization borrowings | | | 5,711 | | | 5,577 | | | 4,605 | | | 4,610 | |
Long-term borrowings due within one year** |
| | 7,466 |
| | 7,322 |
| | 8,330 |
| | 8,364 | |
Long-term borrowings** |
| | 33,566 |
| | 31,852 |
| | 32,850 |
| | 34,506 | |
* Fair value measurements above were Level 3 for all financing receivables and Level 2 for all borrowings.
** | Values exclude finance lease liabilities that are presented as borrowings (see Note 24). |
77
Assets and liabilities measured at October 30, 2022 and October 31, 2021 at fair value on a recurring basis in millions of dollars follow, excluding the company’s cash equivalents, which were carried at a cost that approximates fair value and consisted of money market funds and time deposits:
|
| 2022 |
| 2021 |
| ||
Level 1: | | | | | | | |
Marketable securities | | | | | | | |
U.S. equity fund |
| $ | 70 |
| $ | 75 | |
International equity securities | | | 3 | | | 2 | |
U.S. government debt securities | |
| 62 | |
| 59 | |
Total Level 1 marketable securities | | | 135 | | | 136 | |
| | | | | | | |
Level 2: | | | | | | | |
Marketable securities | | | | | | | |
U.S. government debt securities | | | 121 | | | 139 | |
Municipal debt securities | |
| 63 | |
| 73 | |
Corporate debt securities | |
| 200 | |
| 224 | |
International debt securities | | | 60 | | | 2 | |
Mortgage-backed securities* | |
| 155 | |
| 154 | |
Total Level 2 marketable securities | |
| 599 | |
| 592 | |
Other assets | | | | | | | |
Derivatives | | | 373 | | | 275 | |
Accounts payable and accrued expenses | | | | | | | |
Derivatives | | | 1,231 | | | 228 | |
| | | | | | | |
Level 3: | | | | | | | |
Accounts payable and accrued expenses – Deferred consideration | | | 236 | | | | |
* Primarily issued by U.S. government sponsored enterprises.
Fair value, nonrecurring measurements from impairments at October 30, 2022 and October 31, 2021 in millions of dollars follow:
| | Fair Value | | Losses | ||||||||||||
|
| 20221 |
| 2021 |
| 2022 |
| 2021 |
| 2020 | ||||||
Other receivables | | | |
| | |
| | |
| | |
| $ | 2 | |
Equipment on operating leases – net |
| | |
| | |
| | |
| | |
| | 22 | |
Inventories | | $ | 19 | | | | | $ | 19 | | | | | | | |
| | 15 |
| $ | 41 |
| | 41 |
| $ | 44 |
| | 102 | ||
Investments in unconsolidated affiliates | | | | | | | | | | | | | | | 50 | |
| | | | | | | | 28 |
| | |
| | 2 | ||
Other assets 3 |
| | | | | 1 |
| | | | | 6 | | | 16 | |
1 Related to assessments on the Russian operations, performed at May 1, 2022 and updated on July 31, 2022 and October 30, 2022.
2 2021 fair value of $41 million at January 31, 2021.
3 2021 fair value as of January 31, 2021.
The following is a description of the valuation methodologies the company uses to measure certain financial instruments on the balance sheets at fair value. For more information on asset impairments, see Note 4.
Marketable securities – The portfolio of investments is valued on a market approach (matrix pricing model) in which all significant inputs are observable or can be derived from or corroborated by observable market data such as interest rates, yield curves, volatilities, credit risk, and prepayment speeds. Funds are valued
using the fund’s net asset value, based on the fair value of the underlying securities.
Derivatives – The company’s derivative financial instruments consist of interest rate contracts (swaps), foreign currency exchange contracts (futures, forwards and swaps), and cross-currency interest rate contracts (swaps). The portfolio is valued based on an income approach (discounted cash flow) using market observable inputs, including swap curves and both forward and spot exchange rates for currencies.
Financing receivables – Specific reserve impairments are based on the fair value of the collateral, which is measured using a market approach (appraisal values or realizable values). Inputs include a selection of realizable values (see Note 11).
Other receivables – The impairment was based on the expected realization of value-added tax receivables related to a closed factory operation.
Equipment on operating leases – net – The impairments are based on an income approach (discounted cash flow), using the contractual payments, plus an estimate of return rates and equipment sale price at lease maturity. Inputs include historical return rates and realized sales values.
Inventories – The impairment was based on net realizable value, less reasonably predictable selling and disposal costs.
Property and equipment – net – The valuations were based on cost and market approaches. The inputs include replacement cost estimates adjusted for physical deterioration and economic obsolescence, or quoted prices when available.
Investment in unconsolidated affiliates – Other than temporary impairments for investments are measured as the difference between the implied fair value or the estimated realization amount, and the carrying value. The fair value for publicly traded entities is the share price multiplied by the shares owned, or the estimated realization amount.
Other intangible assets – net – In 2022, the company considered external valuations based on the company’s probability weighted cash flow analysis. In 2020, the impairment was measured at the remaining net book value of customer relationships related to a closed factory operation.
Other assets – In 2021, the impairments were measured at the fair value of the right of use operating lease asset. In 2020, the impairments of the matured operating lease inventory were measured at the fair value of that equipment. The valuations were based on a market approach. The inputs include sales of comparable assets. Also in 2020, the impairment of the German lawn mower business was measured at the estimated realizable value. Fair value was based on estimates of the final sale price.
78
26. DERIVATIVE INSTRUMENTS
Cash Flow Hedges
Certain interest rate contracts (swaps) were designated as hedges of future cash flows from borrowings. The total notional amounts of the receive-variable/pay-fixed interest rate contracts at October 30, 2022 and October 31, 2021 were $1,950 million and $2,700 million, respectively. Fair value gains or losses on cash flow hedges are recorded in OCI and subsequently reclassified into interest expense in the same periods during which the hedged transactions impact earnings. These amounts offset the effects of interest rate changes on the related borrowings.
The amount of gain recorded in OCI at October 30, 2022 that is expected to be reclassified to interest expense or other operating expenses in the next twelve months if interest rates or exchange rates remain unchanged is $44 million after-tax. There were no gains or losses reclassified from OCI to earnings based on the probability that the original forecasted transaction would not occur.
Fair Value Hedges
Certain interest rate contracts (swaps) were designated as fair value hedges of borrowings. The total notional amounts of the receive-fixed/pay-variable interest rate contracts at October 30, 2022 and October 31, 2021 were $10,112 million and $8,043 million, respectively. The fair value gains or losses on these contracts were offset by fair value gains or losses on the hedged items (fixed-rate borrowings) with both items recorded in interest expense.
The amounts recorded, at October 30, 2022 and October 31, 2021, in the consolidated balance sheets related to borrowings designated in fair value hedging relationships were as follows in millions of dollars. Fair value hedging adjustments are included in the carrying amount of the hedged item.
Active Hedging | Discontinued Hedging | ||||||||||||
| | Relationships | | Relationships | | ||||||||
| | Carrying | | Cumulative | | Carrying | | Cumulative | | ||||
| | Amount of | | Fair Value | | Amount of | | Fair Value | | ||||
| | Hedged | | Hedging | | Formerly | | Hedging | | ||||
| | Item | | Amount | | Hedged Item | | Amount | | ||||
2022 | | | | | | | | | | | | | |
Short-term borrowings | | | | | | | | $ | 2,515 | | $ | 15 | |
Long-term borrowings | | $ | 9,060 | | $ | (1,006) | | | 5,520 | | | (19) | |
2021 | | | | | | | | | | | | | |
Short-term borrowings | | $ | 191 | | $ | 3 | | $ | 1,997 | | $ | (2) | |
Long-term borrowings | | | 7,847 | | | 29 | | | 6,287 | | | 223 | |
Derivatives Not Designated as Hedging Instruments
The company has certain interest rate contracts (swaps), foreign currency exchange contracts (futures, forwards, and swaps), and cross-currency interest rate contracts (swaps), which were not formally designated as hedges. These derivatives were held as economic hedges for underlying interest rate or foreign currency exposures for certain borrowings, purchases or sales of inventory, and sales incentive programs. The total notional amounts of the interest rate swaps at October 30, 2022 and October 31, 2021 were $10,568 million and $10,848 million, the foreign currency exchange contracts were $8,185 million and $7,584 million, and the cross-currency interest rate contracts were $260 million and
$238 million, respectively. The fair value gains or losses from derivatives not designated as hedging instruments were recorded in the statements of consolidated income, generally offsetting over time the exposure on the hedged item.
Fair values of derivative instruments in the consolidated balance sheets at October 30, 2022 and October 31, 2021 in millions of dollars follow:
|
| 2022 |
| 2021 |
| ||
Other Assets | | | | | | | |
Designated as hedging instruments: | | | | | | | |
Interest rate contracts |
| $ | 87 |
| $ | 166 | |
Not designated as hedging instruments: | | | | | | | |
Interest rate contracts | |
| 212 | | | 73 | |
Foreign exchange contracts | |
| 66 | | | 31 | |
Cross-currency interest rate contracts | |
| 8 | | | 5 | |
Total not designated | |
| 286 | | | 109 | |
Total derivative assets |
| $ | 373 |
| $ | 275 | |
Accounts Payable and Accrued Expenses | | | | | | | |
Designated as hedging instruments: | | | | | | | |
Interest rate contracts |
| $ | 1,004 |
| $ | 99 | |
Not designated as hedging instruments: | | | | | | | |
Interest rate contracts | | | 107 | | | 33 | |
Foreign exchange contracts | |
| 118 | | | 94 | |
Cross-currency interest rate contracts | | | 2 | | | 2 | |
Total not designated | |
| 227 | | | 129 | |
Total derivative liabilities |
| $ | 1,231 |
| $ | 228 | |
The classification and gains (losses), including accrued interest expense, related to derivative instruments on the statements of consolidated income consisted of the following in millions of dollars:
|
| 2022 |
| 2021 |
| 2020 |
| |||
Fair Value Hedges | | | | | | | | | | |
Interest rate contracts – Interest expense |
| $ | (1,144) |
| $ | (236) |
| $ | 496 | |
| | | | | | | | | | |
Cash Flow Hedges | | | | | | | | | | |
Recognized in OCI: | | | | | | | | | | |
Interest rate contracts – OCI (pretax) | |
| 89 | |
| 8 | |
| (18) | |
| | | | | | | | | | |
Reclassified from OCI: | | | | | | | | | | |
Interest rate contracts – Interest expense | |
| 9 | |
| (13) | |
| (21) | |
| | | | | | | | | | |
Not Designated as Hedges | | | | | | | | | | |
Interest rate contracts – Net sales | | $ | 53 | | $ | 13 | | $ | (23) | |
Interest rate contracts – Interest expense* |
| | 81 |
| | 14 |
| | (2) | |
Foreign exchange contracts – Net sales | | | (6) | | | | | | | |
Foreign exchange contracts – Cost of sales | |
| (64) | |
| (101) | |
| 93 | |
Foreign exchange contracts – Other operating expenses* | |
| 402 | |
| (262) | |
| 122 | |
Total not designated |
| $ | 466 |
| $ | (336) |
| $ | 190 | |
* Includes interest and foreign exchange gains (losses) from cross-currency
interest rate contracts.
Counterparty Risk and Collateral
Derivative instruments are subject to significant concentrations of credit risk to the banking sector. The company manages individual counterparty exposure by setting limits that consider the credit rating of the counterparty, the credit default swap spread of the
79
counterparty, and other financial commitments and exposures between the company and the counterparty banks. All interest rate derivatives are transacted under International Swaps and Derivatives Association (ISDA) documentation. Some of these agreements include credit support provisions. Each master agreement permits the net settlement of amounts owed in the event of default or termination.
Certain of the company’s derivative agreements contain credit support provisions that may require the company to post collateral based on the size of the net liability positions and credit ratings. The aggregate fair value of all derivatives with credit-risk-related contingent features that were in a net liability position at October 30, 2022 and October 31, 2021, was $1,113 million and $135 million, respectively. In accordance with the limits established in these agreements, the company posted $701 million of cash collateral at October 30, 2022 and no cash collateral at October 31, 2021. In addition, the company paid $8 million of collateral either in cash or pledged securities that was outstanding at both October 30, 2022 and October 31, 2021 to participate in an international futures market to hedge currency exposure, not included in the table below.
Derivatives are recorded without offsetting for netting arrangements or collateral. The impact on the derivative assets and liabilities related to netting arrangements and collateral at October 30, 2022 and October 31, 2021 in millions of dollars follows:
| | | | | | | | | | | | | |
| | Gross Amounts | | Netting | | | | Net | | ||||
|
| Recognized |
| Arrangements |
| Collateral |
| Amount |
| ||||
2022 | | | | | | | | | | | | | |
Assets |
| $ | 373 |
| $ | (179) |
| $ | (54) |
| $ | 140 | |
Liabilities | |
| 1,231 | |
| (179) | | | (701) | | | 351 | |
2021 | | | | | | | | | | | | | |
Assets |
| $ | 275 |
| $ | (105) |
| | |
| $ | 170 | |
Liabilities | |
| 228 | |
| (105) | | $ | (5) | | | 118 | |
27. SEGMENT DATA
The company’s operations are presently organized and reported in four business segments described as follows. This presentation is consistent with how the chief operating decision maker (the CEO) assesses the performance of the segments and makes decisions about resource allocations.
The production and precision agriculture segment defines, develops, and delivers global equipment and technology solutions to unlock customer value for production-scale growers of large grains, small grains, cotton, and sugarcane. Main products include large and certain mid-size tractors, combines, cotton pickers, sugarcane harvesters and loaders, and soil preparation, seeding, application and crop care equipment.
The small agriculture and turf segment defines, develops, and delivers global equipment and technology solutions to unlock customer value for dairy and livestock producers, high-value crop producers, and turf and utility customers. The segment’s primary products include certain mid-size and small tractors, as well as hay and forage equipment, riding and commercial lawn equipment, golf course equipment, and utility vehicles.
The construction and forestry segment defines, develops, and delivers a broad range of machines and technology solutions organized along the earthmoving, forestry, and roadbuilding production systems. The segment’s primary products include crawler dozers and loaders, four-wheel-drive loaders, excavators, skid-steer loaders, milling machines, and log harvesters.
The products and services produced by the segments above are marketed through independent retail dealer networks and major retail outlets, and, as it relates to roadbuilding products in certain markets outside the U.S. and Canada, through company-owned sales and service subsidiaries.
The financial services segment finances sales and leases by John Deere dealers of new and used production and precision agriculture equipment, small agriculture and turf equipment, and construction and forestry equipment. In addition, the financial services segment provides wholesale financing to dealers of the foregoing equipment, finances retail revolving charge accounts, and offers extended equipment warranties.
Because of integrated manufacturing operations and common administrative and marketing support, a substantial number of allocations must be made to determine operating segment data. Intersegment sales and revenues represent sales of products and components or finance charges, which are based on market prices, from one operating segment to another operating segment. Intersegment sales of products and components are eliminated in all Net sales data presented in this Annual Report.
Intersegment sales and revenues in 2022, 2021, and 2020 were as follows: production and precision agriculture net sales of $19 million, $27 million, and $22 million; small agriculture and turf net sales of $10 million, $11 million, and $2 million; construction and forestry had $1 million, none, and $1 million; and financial services revenues of $460 million, $246 million, and $278 million, respectively.
Identifiable assets assigned to the operating segments are those the units actively manage, consisting of trade receivables, inventories, property and equipment, intangible assets, and certain other assets. Corporate assets are managed collectively, including cash and cash equivalents, retirement benefit net assets, goodwill, and deferred income tax assets.
Information relating to operations by operating segment in millions of dollars follows for the years ended October 30, 2022, October 31, 2021 and November 1, 2020.
OPERATING SEGMENTS | | 2022 |
| 2021 |
| 2020 |
| |||
Net sales and revenues |
| |
| | |
| | |
| |
Unaffiliated customers: | | | | | | | | | | |
Production & precision ag net sales | | $ | 22,002 | | $ | 16,509 | | $ | 12,962 | |
Small ag & turf net sales | | | 13,381 | | | 11,860 | | | 9,363 | |
Construction & forestry net sales | |
| 12,534 | |
| 11,368 | |
| 8,947 | |
Financial services revenues | |
| 3,625 | |
| 3,548 | |
| 3,589 | |
Other revenues* | |
| 1,035 | |
| 739 | |
| 679 | |
Total | | $ | 52,577 | | $ | 44,024 | | $ | 35,540 | |
* Other revenues are primarily the production and precision ag, small ag and turf, and construction and forestry revenues for finance and interest income, and other income.
80
OPERATING SEGMENTS |
| 2022 |
| 2021 |
| 2020 |
| |||
Operating profit |
| |
| | |
| | |
| |
Production & precision ag | | $ | 4,386 | | $ | 3,334 | | $ | 1,969 | |
Small ag & turf | | | 1,949 | | | 2,045 | | | 1,000 | |
Construction & forestry | |
| 2,014 | |
| 1,489 | |
| 590 | |
Financial services* | |
| 1,159 | |
| 1,144 | |
| 746 | |
Total operating profit* | |
| 9,508 | |
| 8,012 | |
| 4,305 | |
Interest income | |
| 159 | |
| 82 | |
| 62 | |
Interest expense | |
| (390) | |
| (368) | |
| (329) | |
Foreign exchange gains (losses) from equipment operations’ financing activities | |
| (103) | |
| (45) | |
| 17 | |
| | 218 | | | 183 | | | 31 | | |
Corporate expenses – net | |
| (255) | |
| (241) | |
| (251) | |
Income taxes | |
| (2,007) | |
| (1,658) | |
| (1,082) | |
Total | |
| (2,378) | |
| (2,047) | |
| (1,552) | |
Net income | |
| 7,130 | |
| 5,965 | |
| 2,753 | |
Less: Net income (loss) attributable to noncontrolling interests | |
| (1) | | | 2 | | | 2 | |
Net income attributable to Deere & Company | | $ | 7,131 | | $ | 5,963 | | $ | 2,751 | |
* Operating profit of the financial services business segment includes the effect of its interest expense and foreign exchange gains or losses.
Interest income* |
| |
| | |
| | |
| |
Production & precision ag | | $ | 22 | | $ | 21 | | $ | 22 | |
Small ag & turf | | | 24 | | | 21 | | | 16 | |
Construction & forestry | |
| 8 | |
| 10 | |
| 12 | |
Financial services | |
| 2,245 | |
| 1,999 | |
| 2,122 | |
Corporate | |
| 159 | |
| 82 | |
| 62 | |
Intercompany | |
| (431) | |
| (279) | |
| (272) | |
Total | | $ | 2,027 | | $ | 1,854 | | $ | 1,962 | |
* Does not include finance rental income for equipment on operating leases.
Interest expense |
| |
| | |
| | |
| |
Production & precision ag | | $ | 122 | | $ | 84 | | $ | 76 | |
Small ag & turf | | | 105 | | | 87 | | | 111 | |
Construction & forestry | |
| 72 | |
| 46 | |
| 61 | |
Financial services | |
| 799 | |
| 687 | |
| 942 | |
Corporate | |
| 390 | |
| 368 | |
| 329 | |
Intercompany | |
| (426) | |
| (279) | |
| (272) | |
Total | | $ | 1,062 | | $ | 993 | | $ | 1,247 | |
|
| | | | | | | | | |
Depreciation* and amortization expense |
| |
| | |
| | |
| |
Production & precision ag | | $ | 523 | | $ | 495 | | $ | 480 | |
Small ag & turf | | | 236 | | | 245 | | | 247 | |
Construction & forestry | |
| 282 | |
| 303 | |
| 289 | |
Financial services | |
| 1,050 | |
| 1,140 | |
| 1,227 | |
Intercompany | | | (196) | | | (133) | | | (125) | |
Total | | $ | 1,895 | | $ | 2,050 | | $ | 2,118 | |
* Includes depreciation for equipment on operating leases.
OPERATING SEGMENTS |
| 2022 |
| 2021 |
| 2020 |
| |||
Equity in income (loss) of unconsolidated affiliates |
| |
| | |
| | |
| |
Small ag & turf | | $ | 1 | | $ | 2 | | $ | 2 | |
Construction & forestry | |
| 5 | | | 16 | | | (52) | |
Financial services | |
| 4 | |
| 3 | |
| 2 | |
Total | | $ | 10 | | $ | 21 | | $ | (48) | |
| | | | | | | | | | |
| | | | | | | | | | |
Identifiable operating assets |
| |
| | |
| | |
| |
Production & precision ag | | $ | 8,414 | | $ | 7,021 | | $ | 5,708 | |
Small ag & turf | | | 4,451 | | | 3,959 | | | 3,266 | |
Construction & forestry | |
| 6,754 | |
| 6,457 | |
| 6,322 | |
Financial services | |
| 58,864 | |
| 51,624 | |
| 48,719 | |
Corporate | |
| 11,547 | |
| 15,053 | |
| 11,076 | |
Total | | $ | 90,030 | | $ | 84,114 | | $ | 75,091 | |
Capital additions |
| |
| | |
| | |
| |
Production & precision ag | | $ | 649 | | $ | 458 | | $ | 431 | |
Small ag & turf | | | 329 | | | 253 | | | 223 | |
Construction & forestry | |
| 217 | |
| 183 | |
| 157 | |
Financial services | |
| 2 | |
| 3 | |
| 4 | |
Total | | $ | 1,197 | | $ | 897 | | $ | 815 | |
| | | | | | | | | | |
|
| | | | | | | | | |
Investments in unconsolidated affiliates |
| |
| | |
| | |
| |
Production & precision ag | | $ | 10 | | | | | $ | 1 | |
Small ag & turf | | | 84 | | $ | 31 | | | 29 | |
Construction & forestry | |
| | |
| 122 | |
| 144 | |
Financial services | |
| 23 | |
| 22 | |
| 19 | |
Total | | $ | 117 | | $ | 175 | | $ | 193 | |
28. SUBSEQUENT EVENTS
On December 7, 2022, a quarterly dividend of $1.20 per share was declared at the Board of Directors meeting, payable on February 8, 2023 to stockholders of record on December 30, 2022.
In December 2022, the Board of Directors authorized the repurchase of up to $18,000 million of additional common stock. This repurchase program will supplement the existing $8,000 million share repurchase program, which had $2,228 million remaining at October 30, 2022. Repurchases of the company’s common stock will be made at the company’s discretion in the open market.
81
DEERE & COMPANY
SELECTED FINANCIAL DATA
(Dollars in millions except per share amounts)
|
| 2022 | | 2021 | | 2020 | | 2019 | | 2018 | | 2017 | | 2016 | | 2015 | | 2014 | | 2013 |
| ||||||||||
Net sales and revenues | | $ | 52,577 | | $ | 44,024 | | $ | 35,540 | | $ | 39,258 | | $ | 37,358 | | $ | 29,738 | | $ | 26,644 | | $ | 28,863 | | $ | 36,067 | | $ | 37,795 | |
Net sales | |
| 47,917 | |
| 39,737 | |
| 31,272 | |
| 34,886 | |
| 33,351 | |
| 25,885 | |
| 23,387 | |
| 25,775 | |
| 32,961 | |
| 34,998 | |
Finance and interest income | |
| 3,365 | |
| 3,296 | |
| 3,450 | |
| 3,493 | |
| 3,107 | |
| 2,732 | |
| 2,511 | |
| 2,381 | |
| 2,282 | |
| 2,115 | |
Research and development expenses | |
| 1,912 | |
| 1,587 | |
| 1,644 | |
| 1,783 | |
| 1,658 | |
| 1,373 | |
| 1,394 | |
| 1,410 | |
| 1,437 | |
| 1,445 | |
Selling, administrative and general expenses | |
| 3,863 | |
| 3,383 | |
| 3,477 | |
| 3,551 | |
| 3,455 | |
| 3,098 | |
| 2,791 | |
| 2,868 | |
| 3,266 | |
| 3,558 | |
Interest expense | |
| 1,062 | |
| 993 | |
| 1,247 | |
| 1,466 | |
| 1,204 | |
| 899 | |
| 764 | |
| 680 | |
| 664 | |
| 741 | |
Net income* | |
| 7,131 | |
| 5,963 | |
| 2,751 | |
| 3,253 | |
| 2,368 | |
| 2,159 | |
| 1,524 | |
| 1,940 | |
| 3,162 | |
| 3,537 | |
Return on net sales | | | 14.9% | | | 15.0% | | | 8.8% | | | 9.3% | | | 7.1% | | | 8.3% | | | 6.5% | | | 7.5% | | | 9.6% | | | 10.1% | |
Return on beginning Deere & Company stockholders’ equity | | | 38.7% | | | 46.1% | | | 24.1% | | | 28.8% | | | 24.8% | | | 33.1% | | | 22.6% | | | 21.4% | | | 30.8% | | | 51.7% | |
Comprehensive income* | |
| 6,629 | |
| 8,963 | |
| 2,819 | |
| 2,081 | |
| 3,222 | |
| 3,221 | |
| 627 | |
| 994 | |
| 2,072 | |
| 5,416 | |
|
| | | | | | | | | | | | | | | | | | | | | | | | | | | | | | |
|
| | | | | | | | | | | | | | | | | | | | | | | | | | | | | | |
Net income per share – basic* | | $ | 23.42 | | $ | 19.14 | | $ | 8.77 | | $ | 10.28 | | $ | 7.34 | | $ | 6.76 | | $ | 4.83 | | $ | 5.81 | | $ | 8.71 | | $ | 9.18 | |
– diluted* | |
| 23.28 | |
| 18.99 | |
| 8.69 | |
| 10.15 | |
| 7.24 | |
| 6.68 | |
| 4.81 | |
| 5.77 | |
| 8.63 | |
| 9.09 | |
Dividends declared per share | |
| 4.36 | |
| 3.61 | |
| 3.04 | |
| 3.04 | |
| 2.58 | |
| 2.40 | |
| 2.40 | |
| 2.40 | |
| 2.22 | |
| 1.99 | |
Dividends paid per share | |
| 4.28 | |
| 3.32 | |
| 3.04 | |
| 2.97 | |
| 2.49 | |
| 2.40 | |
| 2.40 | |
| 2.40 | |
| 2.13 | |
| 1.94 | |
Average number of common shares outstanding (in millions) – basic | | | 304.5 | |
| 311.6 | |
| 313.5 | |
| 316.5 | |
| 322.6 | |
| 319.5 | |
| 315.2 | |
| 333.6 | |
| 363.0 | |
| 385.3 | |
– diluted | |
| 306.3 | |
| 314.0 | |
| 316.6 | |
| 320.6 | |
| 327.3 | |
| 323.3 | |
| 316.6 | |
| 336.0 | |
| 366.1 | |
| 389.2 | |
|
| | | | | | | | | | | | | | | | | | | | | | | | | | | | | | |
|
| | | | | | | | | | | | | | | | | | | | | | | | | | | | | | |
Total assets | | $ | 90,030 | | $ | 84,114 | | $ | 75,091 | | $ | 73,011 | | $ | 70,108 | | $ | 65,786 | | $ | 57,918 | | $ | 57,883 | | $ | 61,267 | | $ | 59,454 | |
Trade accounts and notes receivable – net | |
| 6,410 | |
| 4,208 | |
| 4,171 | |
| 5,230 | |
| 5,004 | |
| 3,925 | |
| 3,011 | |
| 3,051 | |
| 3,278 | |
| 3,758 | |
Financing receivables – net | |
| 36,634 | |
| 33,799 | |
| 29,750 | |
| 29,195 | |
| 27,054 | |
| 25,104 | |
| 23,702 | |
| 24,809 | |
| 27,422 | |
| 25,633 | |
Financing receivables securitized – net | |
| 5,936 | |
| 4,659 | |
| 4,703 | |
| 4,383 | |
| 4,022 | |
| 4,159 | |
| 5,127 | |
| 4,835 | |
| 4,602 | |
| 4,153 | |
Equipment on operating leases – net | |
| 6,623 | |
| 6,988 | |
| 7,298 | |
| 7,567 | |
| 7,165 | |
| 6,594 | |
| 5,902 | |
| 4,970 | |
| 4,016 | |
| 3,152 | |
Inventories | |
| 8,495 | |
| 6,781 | |
| 4,999 | |
| 5,975 | |
| 6,149 | |
| 3,904 | |
| 3,341 | |
| 3,817 | |
| 4,210 | |
| 4,935 | |
Property and equipment – net | |
| 6,056 | |
| 5,820 | |
| 5,817 | |
| 5,973 | |
| 5,868 | |
| 5,068 | |
| 5,171 | |
| 5,181 | |
| 5,578 | |
| 5,467 | |
Short-term borrowings | | | 12,592 | | | 10,919 | |
| 8,582 | |
| 10,784 | |
| 11,062 | |
| 10,035 | |
| 6,911 | |
| 8,425 | |
| 8,018 | |
| 8,787 | |
Short-term securitization borrowings | | | 5,711 | | | 4,605 | | | 4,682 | | | 4,321 | | | 3,957 | | | 4,119 | | | 4,998 | | | 4,585 | | | 4,553 | | | 4,103 | |
Long-term borrowings | | | 33,596 | | | 32,888 | |
| 32,734 | |
| 30,229 | |
| 27,237 | |
| 25,891 | |
| 23,703 | |
| 23,775 | |
| 24,318 | |
| 21,518 | |
Total Deere & Company stockholders’ equity | |
| 20,262 | |
| 18,431 | |
| 12,937 | |
| 11,413 | |
| 11,288 | |
| 9,557 | |
| 6,520 | |
| 6,743 | |
| 9,063 | |
| 10,266 | |
|
| | | | | | | | | | | | | | | | | | | | | | | | | | | | | | |
|
| | | | | | | | | | | | | | | | | | | | | | | | | | | | | | |
Book value per share* | | $ | 67.82 | | $ | 59.83 | | $ | 41.25 | | $ | 36.45 | | $ | 35.45 | | $ | 29.70 | | $ | 20.71 | | $ | 21.29 | | $ | 26.23 | | $ | 27.46 | |
Capital expenditures | | $ | 1,176 | | $ | 867 | | $ | 762 | | $ | 1,084 | | $ | 969 | | $ | 586 | | $ | 668 | | $ | 655 | | $ | 1,004 | | $ | 1,132 | |
Number of employees (at year end) | |
| 82,239 | |
| 75,550 | |
| 69,634 | |
| 73,489 | |
| 74,413 | |
| 60,476 | |
| 56,767 | |
| 57,180 | |
| 59,623 | |
| 67,044 | |
* Attributable to Deere & Company.
82
REPORT OF INDEPENDENT REGISTERED PUBLIC ACCOUNTING FIRM
To the stockholders and the Board of Directors of Deere & Company:
Opinion on the Financial Statements
We have audited the accompanying consolidated balance sheets of Deere & Company and subsidiaries (the "Company") as of October 30, 2022 and October 31, 2021, the related statements of consolidated income, consolidated comprehensive income, changes in consolidated stockholders' equity and consolidated cash flows for each of the three years in the period ended October 30, 2022, and the related notes (collectively referred to as the "financial statements”). In our opinion, the financial statements present fairly, in all material respects, the financial position of the Company as of October 30, 2022 and October 31, 2021, and the results of its operations and its cash flows for each of the three years in the period ended October 30, 2022, in conformity with accounting principles generally accepted in the United States of America.
We have also audited, in accordance with the standards of the Public Company Accounting Oversight Board (United States) (PCAOB), the Company's internal control over financial reporting as of October 30, 2022, based on criteria established in Internal Control — Integrated Framework (2013) issued by the Committee of Sponsoring Organizations of the Treadway Commission and our report dated December 15, 2022, expressed an unqualified opinion on the Company's internal control over financial reporting.
Basis for Opinion
These financial statements are the responsibility of the Company's management. Our responsibility is to express an opinion on the Company's financial statements based on our audits. We are a public accounting firm registered with the PCAOB and are required to be independent with respect to the Company in accordance with the U.S. federal securities laws and the applicable rules and regulations of the Securities and Exchange Commission and the PCAOB.
We conducted our audits in accordance with the standards of the PCAOB. Those standards require that we plan and perform the audit to obtain reasonable assurance about whether the financial statements are free of material misstatement, whether due to error or fraud. Our audits included performing procedures to assess the risks of material misstatement of the financial statements, whether due to error or fraud, and performing procedures that respond to those risks. Such procedures included examining, on a test basis, evidence regarding the amounts and disclosures in the financial statements. Our audits also included evaluating the accounting principles used and significant estimates made by management, as well as evaluating the overall presentation of the financial statements. We believe that our audits provide a reasonable basis for our opinion.
Critical Audit Matters
The critical audit matters communicated below are matters arising from the current-period audit of the financial statements that were communicated or required to be communicated to the audit committee and that (1) relate to accounts or disclosures that are material to the financial statements and (2) involved our especially challenging, subjective, or complex judgments. The communication of critical audit matters does not alter in any way our opinion on the financial statements, taken as a whole, and we are not, by communicating the critical audit matters below, providing separate opinions on the critical audit matters or on the accounts or disclosures to which they relate.
Sales Incentives — Refer to Note 2 to the financial statements
Critical Audit Matter Description
The sales incentive accrual at October 30, 2022 was $2,364 million, of which $1,320 million is recorded within trade accounts and notes receivable – net and $1,044 million is recorded within accounts payable and accrued expenses. At the time a sale to a dealer is recognized, the Company records an estimate of the future sales incentive costs as a reduction to the sales price. These incentives may be based on a dealer’s purchase volume, or on retail sales incentive programs for allowances and financing programs that will be due when the dealer sells the equipment to a retail customer. The estimated cost of these programs is based on historical data, announced and expected incentive programs, field inventory levels and forecasted sales volumes. The final cost of these programs is determined at the end of the measurement period for volume-based incentives or when the dealer sells the equipment to the retail customer. This is due to numerous programs available at any particular time and new programs that may be announced after the Company records the equipment sale. Changes in the mix and types of programs affect these estimates, which are reviewed quarterly. The estimation of the sales incentive accrual is impacted by many assumptions. One of the key assumptions is the predictive value of the historical percentage of sales incentive costs to retail sales from dealers.
We identified the sales incentive accrual as a critical audit matter because estimating sales incentive costs requires significant judgment by management and changes in historical percentage of sales incentive costs to retails sales by dealers could have a material impact on the sales incentive accrual. Auditing management’s assumptions about the predictive nature of historical sales incentive costs involves a high degree of auditor judgment and an increased extent of effort to evaluate the reasonableness of management’s estimates.
83
How the Critical Audit Matter Was Addressed in the Audit
Our audit procedures related to testing management’s assumption that historical sales incentive costs are predictive of future incentive costs included the following, among others:
| ● | We tested the effectiveness of management’s controls over the assumptions used to estimate the sales incentive accrual. |
| ● | We evaluated management’s ability to accurately forecast future incentive costs performing a retrospective review that involved comparing actual incentive costs to management’s historical forecasts. |
| ● | We tested the completeness of the population used in the calculation by inspecting a sample of incentive program communications to dealers to ensure all sales incentive programs offered were included in the calculation and by confirming sales incentive payments with a sample of dealers. |
| ● | We evaluated the reasonableness of management’s assumption that historical sales incentive costs are predictive of future incentive costs by: |
| ● | Considering the impact of changes in the current economic conditions and competitive environment. |
| ● | Comparing historical and current sales incentive data for eligible products in the following manner: |
| ● | Type and number of programs |
| ● | Geography |
| ● | Program size and duration |
Allowance for Credit Losses – Refer to Notes 2 and 11 to the financial statements
Critical Audit Matter Description
The allowance for credit losses as of October 30, 2022 was $361 million. The allowance for credit losses is an estimate of the credit losses expected over the life of the Company’s receivable portfolio. The Company measures expected credit losses on a collective basis when similar risk characteristics exist. Risk characteristics considered by the Company include finance product category, market, geography, credit risk, and remaining duration. The Company utilizes loss forecast models, which are selected based on the size and credit risk of the underlying pool of receivables, to estimate expected credit losses. Transition matrix models are used for large and complex retail customer receivable pools. The modeled expected credit losses are adjusted based on reasonable and supportable forecasts, which may include economic indicators such as commodity prices, industry equipment sales, unemployment rates, and housing starts. Management reviews each model’s output quarterly, and qualitative adjustments are incorporated as necessary.
We identified the allowance for credit losses as a critical audit matter because determining the appropriate methodology and assumptions used in the estimate requires significant judgment by management. Given the subjective nature and judgment applied by management to determine the allowance for credit losses, auditing the methodology and assumptions requires a high degree of auditor judgment and an increased extent of effort, including the need to involve credit specialists.
How the Critical Audit Matter Was Addressed in the Audit
Our audit procedures related to testing the Company’s allowance for credit losses included the following, among others:
| ● | We tested the effectiveness of management’s controls over the methodology, data and assumptions used to estimate the allowance for credit losses. |
| ● | We tested the accuracy and evaluated the relevance of the underlying historical data used in the Company’s model. |
| ● | With the assistance of our credit specialists, we evaluated the reasonableness and accuracy of the models used to estimate the allowance for credit losses, including model assumptions and the selection and application of relevant risk characteristics and use of qualitative adjustments. |
| ● | We evaluated qualitative adjustments to the model estimate. Our evaluation included: |
| ● | Comparison of qualitative factors used by the Company to source data provided by the Company and/or to externally available data. |
| ● | Consideration and evaluation of contradictory evidence. |
| ● | We evaluated management’s ability to accurately forecast credit losses by performing a retrospective review, which involved comparing actual credit losses to historical estimates. |
/s/ DELOITTE & TOUCHE LLP
Chicago, Illinois
December 15, 2022
We have served as the Company’s auditor since 1910.
84
REPORT OF INDEPENDENT REGISTERED PUBLIC ACCOUNTING FIRM
To the stockholders and the Board of Directors of Deere & Company:
Opinion on Internal Control over Financial Reporting
We have audited the internal control over financial reporting of Deere & Company and subsidiaries (the “Company”) as of October 30, 2022, based on criteria established in Internal Control — Integrated Framework (2013) issued by the Committee of Sponsoring Organizations of the Treadway Commission (COSO). In our opinion, the Company maintained, in all material respects, effective internal control over financial reporting as of October 30, 2022, based on criteria established in Internal Control — Integrated Framework (2013) issued by COSO.
We have also audited, in accordance with the standards of the Public Company Accounting Oversight Board (United States) (PCAOB), the consolidated financial statements as of and for the year ended October 30, 2022 of the Company and our report dated December 15, 2022, expressed an unqualified opinion on those financial statements.
Basis for Opinion
The Company’s management is responsible for maintaining effective internal control over financial reporting and for its assessment of the effectiveness of internal control over financial reporting, included in the accompanying Management’s Report on Internal Control over Financial Reporting. Our responsibility is to express an opinion on the Company’s internal control over financial reporting based on our audit. We are a public accounting firm registered with the PCAOB and are required to be independent with respect to the Company in accordance with the U.S. federal securities laws and the applicable rules and regulations of the Securities and Exchange Commission and the PCAOB.
We conducted our audit in accordance with the standards of the PCAOB. Those standards require that we plan and perform the audit to obtain reasonable assurance about whether effective internal control over financial reporting was maintained in all material respects. Our audit included obtaining an understanding of internal control over financial reporting, assessing the risk that a material weakness exists, testing and evaluating the design and operating effectiveness of internal control based on the assessed risk, and performing such other procedures as we considered necessary in the circumstances. We believe that our audit provides a reasonable basis for our opinion.
Definition and Limitations of Internal Control over Financial Reporting
A company’s internal control over financial reporting is a process designed to provide reasonable assurance regarding the reliability of financial reporting and the preparation of financial statements for external purposes in accordance with generally accepted accounting principles. A company’s internal control over financial reporting includes those policies and procedures that (1) pertain to the maintenance of records that, in reasonable detail, accurately and fairly reflect the transactions and dispositions of the assets of the company; (2) provide reasonable assurance that transactions are recorded as necessary to permit preparation of financial statements in accordance with generally accepted accounting principles, and that receipts and expenditures of the company are being made only in accordance with authorizations of management and directors of the company; and (3) provide reasonable assurance regarding prevention or timely detection of unauthorized acquisition, use, or disposition of the company’s assets that could have a material effect on the financial statements.
Because of its inherent limitations, internal control over financial reporting may not prevent or detect misstatements. Also, projections of any evaluation of effectiveness to future periods are subject to the risk that controls may become inadequate because of changes in conditions, or that the degree of compliance with the policies or procedures may deteriorate.
/s/ DELOITTE & TOUCHE LLP
Chicago, Illinois
December 15, 2022
85
Index to Exhibits
3.1 | | |
| | |
3.2 | | |
| | |
3.3 | | |
| | |
4.1 | | |
| | |
4.2 | | |
| | |
4.3 | | |
| | |
4.4 | | |
| | |
4.5 | | |
| | |
4.6 | | |
| | |
4.7 | | |
| | |
Certain instruments relating to long-term debt constituting less than 10% of the registrant’s total assets are not filed as exhibits herewith pursuant to Item 601(b)(4)(iii)(A) of Regulation S-K. The registrant will furnish copies of such instruments to the Commission upon request. | ||
| | |
10.1 | | |
| | |
10.2 | | |
| | |
10.3 | | |
| | |
10.4 | | |
| | |
86
10.5 | | |
| | |
10.6† | | |
| | |
10.7† | | |
| | |
10.8† | | |
| | |
10.9† | | |
| | |
10.10† | | Form of Terms and Conditions for John Deere Nonqualified Stock Options |
| | |
10.11† | | Form of Terms and Conditions for John Deere Restricted Stock Units and Performance Stock Units |
| | |
10.12† | | |
| | |
10.13† | | |
| | |
10.14† | | |
| | |
10.15† | | |
| | |
10.16† | | |
| | |
10.17† | | |
| | |
10.18† | | |
| | |
10.19† | | |
| | |
10.20† | | |
| | |
10.21† | | |
| | |
10.22† | | |
| | |
10.23† | | |
| | |
87
10.24† | | |
| | |
10.25† | | |
| | |
10.26 | | |
| | |
10.27 | | |
| | |
10.28 | | |
| | |
10.29 | | |
| | |
10.30 | | |
| | |
10.31 | | |
| | |
10.32 | | |
| | |
10.33 | | |
| | |
21. | | |
| | |
22. | | List of Guarantors and Subsidiary Issuers of Guaranteed Securities |
| | |
23. | | |
| | |
24. | | |
| | |
31.1 | | |
| | |
31.2 | | |
| | |
32. | | |
| | |
88
101.SCH | | Inline XBRL Taxonomy Extension Schema Document |
| | |
101.CAL | | Inline XBRL Taxonomy Extension Calculation Linkbase Document |
| | |
101.DEF | | Inline XBRL Taxonomy Extension Definition Linkbase Document |
| | |
101.LAB | | Inline XBRL Taxonomy Extension Label Linkbase Document |
| | |
101.PRE | | Inline XBRL Taxonomy Extension Presentation Linkbase Document |
| | |
104. | | Cover Page Interactive Data File (formatted as Inline XBRL and contained in Exhibit 101) |
* | Incorporated by reference. |
† | Management contract or compensatory plan or arrangement. |
89
SIGNATURES
Pursuant to the requirements of Section 13 or 15(d) of the Securities Exchange Act of 1934, the registrant has duly caused this report to be signed on its behalf by the undersigned, thereunto duly authorized.
| | DEERE & COMPANY |
| | |
| By: | /s/ John C. May |
| | John C. May |
| | Chairman and Chief Executive Officer |
| | (Principal Executive Officer) |
Date: December 15, 2022
Pursuant to the requirements of the Securities Exchange Act of 1934, this report has been signed below by the following persons on behalf of the registrant and in the capacities and on the date indicated.
Each person signing below also hereby appoints John C. May, Joshua A. Jepsen, and Edward R. Berk, and each of them singly, his or her lawful attorney-in-fact with full power to execute and file any and all amendments to this report together with exhibits thereto and generally to do all such things as such attorney-in-fact may deem appropriate to enable Deere & Company to comply with the provisions of the Securities Exchange Act of 1934 and all requirements of the Securities and Exchange Commission.
Signature | | Title | | Date | |
| | | | | |
| | | | | |
/s/ Leanne G. Caret | | Director | ) | | December 15, 2022 |
Leanne G. Caret | | | ) | | |
| | | ) | | |
| | | ) | | |
/s/ Tamra A. Erwin | | Director | ) | | |
Tamra A. Erwin | | | ) | | |
| | | ) | | |
| | | ) | | |
/s/ Alan C. Heuberger | | Director | ) | | |
Alan C. Heuberger | | | ) | | |
| | | ) | | |
| | | ) | | |
/s/ Charles O. Holliday, Jr. | | Director | ) | | |
Charles O. Holliday, Jr. | | | ) | | |
| | | ) | | |
| | | ) | | |
/s/ Joshua A. Jepsen | | Senior Vice President and | ) | | |
Joshua A. Jepsen | | Chief Financial Officer | ) | | |
| | (Principal Financial Officer and Principal | ) | | |
| | Accounting Officer) | ) | | |
| | | ) | | |
| | | ) | | |
/s/ Michael O. Johanns | | Director | ) | | |
Michael O. Johanns | | | ) | | |
| | | ) | | |
| | | ) | | |
/s/ Clayton M. Jones | | Director | ) | | |
Clayton M. Jones | | | ) | | |
| | | ) | | |
| | | ) | | |
/s/ John C. May | | Chairman and Chief Executive Officer | ) | | |
John C. May | | (Principal Executive Officer) | ) | | |
| | | ) | | |
| | | | | |
90
/s/ Gregory R. Page | | Director | ) | | |
Gregory R. Page | | | ) | | |
| | | ) | | |
| | | ) | | |
/s/ Sherry M. Smith | | Director | ) | | |
Sherry M. Smith | | | ) | | |
| | | ) | | |
| | | ) | | |
/s/ Dmitri L. Stockton | | Director | ) | | |
Dmitri L. Stockton | | | ) | | |
| | | ) | | |
| | | ) | | |
/s/ Sheila G. Talton | | Director | ) | | |
Sheila G. Talton | | | ) | | |
| | | | | |
| | | | | |
91
Similar companies
See also AGCO CORP /DE - Annual report 2022 (10-K 2022-12-31) Annual report 2024 (10-Q 2024-09-30)See also LINDSAY CORP - Annual report 2023 (10-K 2023-08-31) Annual report 2023 (10-Q 2023-05-31)
See also ALAMO GROUP INC - Annual report 2022 (10-K 2022-12-31) Annual report 2025 (10-Q 2025-06-30)
See also ARTS WAY MANUFACTURING CO INC - Annual report 2022 (10-K 2022-11-30) Annual report 2023 (10-Q 2023-08-31)
See also MJ Harvest, Inc. - Annual report 2022 (10-K 2022-05-31) Annual report 2023 (10-Q 2023-02-28)