DEERE & CO - Quarter Report: 2023 April (Form 10-Q)
UNITED STATES
SECURITIES AND EXCHANGE COMMISSION
WASHINGTON, D.C. 20549
FORM 10-Q
(Mark One)
☒ QUARTERLY REPORT PURSUANT TO SECTION 13 OR 15(d) OF THE SECURITIES EXCHANGE ACT OF 1934
For the quarterly period ended April 30, 2023
or
☐ TRANSITION REPORT PURSUANT TO SECTION 13 OR 15(d) OF THE SECURITIES EXCHANGE ACT OF 1934
For the transition period from ____ to ____
Commission file no: 1-4121
(Exact name of registrant as specified in its charter)
Delaware | 36-2382580 |
One John Deere Place
Moline, Illinois 61265
(Address of principal executive offices)
Telephone Number: (309) 765-8000
Securities Registered Pursuant to Section 12(b) of the Act:
Title of each class | Trading symbol | Name of each exchange on which registered | ||
Common stock, $1 par value | DE | New York Stock Exchange | ||
6.55% Debentures Due 2028 | DE28 | New York Stock Exchange |
Indicate by check mark whether the registrant: (1) has filed all reports required to be filed by Section 13 or 15(d) of the Securities Exchange Act of 1934 during the preceding 12 months (or for such shorter period that the registrant was required to file such reports), and (2) has been subject to such filing requirements for the past 90 days.
Yes ☒ No ☐
Indicate by check mark whether the registrant has submitted electronically every Interactive Data File required to be submitted pursuant to Rule 405 of Regulation S-T (§232.405 of this chapter) during the preceding 12 months (or for such shorter period that the registrant was required to submit such files).
Yes ☒ No ☐
Indicate by check mark whether the registrant is a large accelerated filer, an accelerated filer, a non-accelerated filer, a smaller reporting company, or an emerging growth company. See the definitions of “large accelerated filer,” “accelerated filer,” “smaller reporting company,” and “emerging growth company” in Rule 12b-2 of the Exchange Act.
Large accelerated filer | ☒ | Accelerated filer | ☐ |
Non-accelerated filer | ☐ | Smaller reporting company | ☐ |
Emerging growth company | ☐ |
If an emerging growth company, indicate by check mark if the registrant has elected not to use the extended transition period for complying with any new or revised financial accounting standards provided pursuant to Section 13(a) of the Exchange Act. ☐
Indicate by check mark whether the registrant is a shell company (as defined in Rule 12b-2 of the Exchange Act).
Yes ☐ No ☒
At April 30, 2023, 293,192,141 shares of common stock, $1 par value, of the registrant were outstanding.
PART I. FINANCIAL INFORMATION
ITEM 1. FINANCIAL STATEMENTS | |||||||||||||
DEERE & COMPANY | |||||||||||||
STATEMENTS OF CONSOLIDATED INCOME | |||||||||||||
For the Three and Six Months Ended April 30, 2023 and May 1, 2022 | |||||||||||||
(In millions of dollars and shares except per share amounts) Unaudited | |||||||||||||
Three Months Ended | Six Months Ended | ||||||||||||
| 2023 |
| 2022 |
| 2023 |
| 2022 |
| |||||
Net Sales and Revenues | |||||||||||||
Net sales |
| $ | 16,079 | $ | 12,034 |
| $ | 27,481 | $ | 20,565 | |||
Finance and interest income | 1,079 |
| 796 | 2,073 |
| 1,595 | |||||||
Other income | 229 |
| 540 | 484 |
| 779 | |||||||
Total | 17,387 |
| 13,370 | 30,038 |
| 22,939 | |||||||
Costs and Expenses | |||||||||||||
Cost of sales | 10,730 |
| 8,918 | 18,663 |
| 15,613 | |||||||
Research and development expenses | 547 |
| 453 | 1,043 |
| 855 | |||||||
Selling, administrative and general expenses | 1,330 |
| 932 | 2,283 |
| 1,713 | |||||||
Interest expense | 569 |
| 187 | 1,049 |
| 417 | |||||||
Other operating expenses | 363 |
| 328 | 660 |
| 638 | |||||||
Total | 13,539 |
| 10,818 | 23,698 |
| 19,236 | |||||||
Income of Consolidated Group before Income Taxes | 3,848 |
| 2,552 | 6,340 |
| 3,703 | |||||||
Provision for income taxes | 991 |
| 461 | 1,528 |
| 710 | |||||||
Income of Consolidated Group | 2,857 |
| 2,091 | 4,812 |
| 2,993 | |||||||
Equity in income of unconsolidated affiliates | 2 |
| 6 | 3 |
| 8 | |||||||
Net Income | 2,859 |
| 2,097 | 4,815 |
| 3,001 | |||||||
Less: Net loss attributable to noncontrolling interests | (1) |
| (1) | (4) |
|
| |||||||
Net Income Attributable to Deere & Company |
| $ | 2,860 | $ | 2,098 |
| $ | 4,819 | $ | 3,001 | |||
Per Share Data | |||||||||||||
Basic |
| $ | 9.69 | $ | 6.85 |
| $ | 16.26 | $ | 9.78 | |||
Diluted |
| 9.65 | 6.81 |
| 16.18 | 9.72 | |||||||
Dividends declared | 1.25 | 1.05 | 2.45 | 2.10 | |||||||||
Dividends paid | 1.20 | 1.05 | 2.33 | 2.10 | |||||||||
Average Shares Outstanding | |||||||||||||
Basic | 295.1 |
| 306.2 | 296.3 |
| 306.8 | |||||||
Diluted | 296.5 |
| 308.1 | 297.8 |
| 308.8 | |||||||
See Condensed Notes to Interim Consolidated Financial Statements.
2
DEERE & COMPANY | |||||||||||||
STATEMENTS OF CONSOLIDATED COMPREHENSIVE INCOME | |||||||||||||
For the Three and Six Months Ended April 30, 2023 and May 1, 2022 | |||||||||||||
(In millions of dollars) Unaudited | |||||||||||||
Three Months Ended | Six Months Ended | ||||||||||||
| 2023 |
| 2022 |
| 2023 |
| 2022 |
| |||||
| |||||||||||||
Net Income |
| $ | 2,859 | $ | 2,097 |
| $ | 4,815 | $ | 3,001 | |||
Other Comprehensive Income (Loss), Net of Income Taxes | |||||||||||||
Retirement benefits adjustment | (247) |
| 129 | (258) |
| (216) | |||||||
Cumulative translation adjustment | 100 |
| (248) | 781 |
| (515) | |||||||
Unrealized gain (loss) on derivatives | (18) |
| 28 | (31) |
| 42 | |||||||
Unrealized gain (loss) on debt securities | (1) |
| (48) | 26 |
| (63) | |||||||
Other Comprehensive Income (Loss), Net of Income Taxes | (166) |
| (139) | 518 |
| (752) | |||||||
Comprehensive Income of Consolidated Group | 2,693 |
| 1,958 | 5,333 |
| 2,249 | |||||||
Less: Comprehensive income (loss) attributable to noncontrolling interests | 1 |
| (5) | 6 |
| (4) | |||||||
Comprehensive Income Attributable to Deere & Company |
| $ | 2,692 | $ | 1,963 |
| $ | 5,327 | $ | 2,253 | |||
See Condensed Notes to Interim Consolidated Financial Statements.
3
DEERE & COMPANY | | |||||||||
CONDENSED CONSOLIDATED BALANCE SHEETS | ||||||||||
(In millions of dollars) Unaudited | ||||||||||
| April 30 |
| October 30 |
| May 1 |
| ||||
2023 | 2022 | 2022 |
| |||||||
Assets | ||||||||||
Cash and cash equivalents |
| $ | 5,267 | $ | 4,774 | $ | 3,878 | |||
Marketable securities | 856 |
| 734 |
| 682 | |||||
Trade accounts and notes receivable – net | 9,971 |
| 6,410 |
| 6,258 | |||||
Financing receivables – net | 38,954 |
| 36,634 |
| 34,085 | |||||
5,659 |
| 5,936 |
| 4,073 | ||||||
Other receivables | 2,593 |
| 2,492 |
| 2,306 | |||||
Equipment on operating leases – net | 6,524 |
| 6,623 |
| 6,465 | |||||
Inventories | 9,713 |
| 8,495 |
| 9,030 | |||||
Property and equipment – net | 6,288 |
| 6,056 |
| 5,715 | |||||
Goodwill | 3,963 |
| 3,687 |
| 3,812 | |||||
Other intangible assets – net | 1,222 |
| 1,218 |
| 1,352 | |||||
Retirement benefits | 3,519 |
| 3,730 |
| 3,059 | |||||
Deferred income taxes | 1,308 |
| 824 |
| 1,104 | |||||
Other assets | 2,510 |
| 2,417 |
| 2,280 | |||||
Total Assets |
| $ | 98,347 | $ | 90,030 | $ | 84,099 | |||
Liabilities and Stockholders’ Equity | ||||||||||
Liabilities | ||||||||||
Short-term borrowings | $ | 17,109 | $ | 12,592 | $ | 12,413 | ||||
Short-term securitization borrowings | 5,379 |
| 5,711 |
| 4,006 | |||||
Accounts payable and accrued expenses | 14,716 |
| 14,822 |
| 12,679 | |||||
Deferred income taxes | 511 |
| 495 |
| 584 | |||||
Long-term borrowings | 35,611 |
| 33,596 |
| 32,447 | |||||
Retirement benefits and other liabilities | 2,520 |
| 2,457 |
| 2,964 | |||||
Total liabilities | 75,846 |
| 69,673 |
| 65,093 | |||||
Commitments and contingencies (Note 16) | ||||||||||
Redeemable noncontrolling interest | 102 | 92 | 99 | |||||||
Stockholders’ Equity | ||||||||||
Common stock, $1 par value (issued shares at April 30, 2023 – 536,431,204) | 5,227 |
| 5,165 |
| 5,117 | |||||
Common stock in treasury | (26,630) |
| (24,094) |
| (21,727) | |||||
Retained earnings | 46,336 |
| 42,247 |
| 38,805 | |||||
Accumulated other comprehensive income (loss) | (2,538) |
| (3,056) |
| (3,291) | |||||
Total Deere & Company stockholders’ equity | 22,395 |
| 20,262 |
| 18,904 | |||||
Noncontrolling interests | 4 |
| 3 |
| 3 | |||||
Total stockholders’ equity | 22,399 |
| 20,265 |
| 18,907 | |||||
Total Liabilities and Stockholders’ Equity | $ | 98,347 | $ | 90,030 | $ | 84,099 | ||||
See Condensed Notes to Interim Consolidated Financial Statements.
4
DEERE & COMPANY | |||||||
STATEMENTS OF CONSOLIDATED CASH FLOWS | |||||||
For the Six Months Ended April 30, 2023 and May 1, 2022 | |||||||
(In millions of dollars) Unaudited | |||||||
| 2023 |
| 2022 |
| |||
Cash Flows from Operating Activities |
|
| |||||
Net income |
| $ | 4,815 | $ | 3,001 | ||
Adjustments to reconcile net income to net cash used for operating activities: | |||||||
Provision (credit) for credit losses | (89) |
| 45 | ||||
Provision for depreciation and amortization | 995 |
| 933 | ||||
Impairments and other adjustments | 173 |
| 77 | ||||
Share-based compensation expense | 54 |
| 44 | ||||
Gain on remeasurement of previously held equity investment |
|
| (326) | ||||
Provision (credit) for deferred income taxes | (377) |
| 37 | ||||
Changes in assets and liabilities: | |||||||
Receivables related to sales | (4,407) |
| (1,535) | ||||
Inventories | (982) |
| (2,265) | ||||
Accounts payable and accrued expenses | (313) |
| (443) | ||||
Accrued income taxes payable/receivable | (96) |
| (139) | ||||
Retirement benefits | (68) |
| (1,020) | ||||
Other | 148 |
| (171) | ||||
Net cash used for operating activities | (147) |
| (1,762) | ||||
Cash Flows from Investing Activities | |||||||
Collections of receivables (excluding receivables related to sales) | 12,593 |
| 11,190 | ||||
Proceeds from sales of equipment on operating leases | 993 |
| 1,035 | ||||
Proceeds from sales of businesses and unconsolidated affiliates, net of cash sold | 36 |
|
| ||||
Cost of receivables acquired (excluding receivables related to sales) | (13,451) |
| (11,971) | ||||
Acquisitions of businesses, net of cash acquired | (41) |
| (473) | ||||
Purchases of property and equipment | (584) |
| (346) | ||||
Cost of equipment on operating leases acquired | (1,229) |
| (1,004) | ||||
Collateral on derivatives - net | 367 | (248) | |||||
Other | (178) |
| (71) | ||||
Net cash used for investing activities | (1,494) |
| (1,888) | ||||
Cash Flows from Financing Activities | |||||||
Increase in total short-term borrowings | 3,992 |
| 812 | ||||
Proceeds from long-term borrowings | 4,868 |
| 4,298 | ||||
Payments of long-term borrowings | (3,567) |
| (3,625) | ||||
Proceeds from issuance of common stock | 30 |
| 50 | ||||
Repurchases of common stock | (2,546) |
| (1,226) | ||||
Dividends paid | (697) |
| (649) | ||||
Other | (63) |
| (46) | ||||
Net cash provided by (used for) financing activities | 2,017 |
| (386) | ||||
Effect of Exchange Rate Changes on Cash, Cash Equivalents, and Restricted Cash | 70 |
| (110) | ||||
Net Increase (Decrease) in Cash, Cash Equivalents, and Restricted Cash | 446 | (4,146) | |||||
Cash, Cash Equivalents, and Restricted Cash at Beginning of Period | 4,941 |
| 8,125 | ||||
Cash, Cash Equivalents, and Restricted Cash at End of Period | $ | 5,387 | $ | 3,979 | |||
Components of Cash, Cash Equivalents, and Restricted Cash | |||||||
Cash and cash equivalents | $ | 5,267 | $ | 3,878 | |||
120 | 101 | ||||||
Total Cash, Cash Equivalents, and Restricted Cash | $ | 5,387 | $ | 3,979 | |||
See Condensed Notes to Interim Consolidated Financial Statements.
5
DEERE & COMPANY | |||||||||||||||||||||||
STATEMENTS OF CHANGES IN CONSOLIDATED STOCKHOLDERS’ EQUITY | |||||||||||||||||||||||
For the Three and Six Months Ended April 30, 2023 and May 1, 2022 | |||||||||||||||||||||||
(In millions of dollars) Unaudited | |||||||||||||||||||||||
Total Stockholders’ Equity | |||||||||||||||||||||||
Deere & Company Stockholders |
| ||||||||||||||||||||||
Accumulated | |||||||||||||||||||||||
Total | Other | Redeemable | |||||||||||||||||||||
Stockholders’ | Common | Treasury | Retained | Comprehensive | Noncontrolling | Noncontrolling | |||||||||||||||||
| Equity |
| Stock |
| Stock |
| Earnings |
| Income (Loss) |
| Interests |
|
| Interest | |||||||||
|
| ||||||||||||||||||||||
Three Months Ended May 1, 2022 | |||||||||||||||||||||||
Balance January 30, 2022 |
| $ | 17,808 | $ | 5,066 | $ | (21,139) | $ | 37,029 | $ | (3,152) | $ | 4 |
| |||||||||
Acquisitions |
| $ | 105 | ||||||||||||||||||||
Net income (loss) |
| 2,098 | 2,098 |
| (1) | ||||||||||||||||||
Other comprehensive loss |
| (139) | (139) |
| (4) | ||||||||||||||||||
Repurchases of common stock |
| (603) | (603) | ||||||||||||||||||||
Treasury shares reissued |
| 15 | 15 | ||||||||||||||||||||
Dividends declared |
| (323) | (322) | (1) |
| ||||||||||||||||||
Share based awards and other |
| 51 | 51 |
|
| (1) | |||||||||||||||||
Balance May 1, 2022 | $ | 18,907 | $ | 5,117 | $ | (21,727) | $ | 38,805 | $ | (3,291) | $ | 3 | $ | 99 | |||||||||
Six Months Ended May 1, 2022 |
|
| |||||||||||||||||||||
Balance October 31, 2021 |
| $ | 18,434 | $ | 5,054 | $ | (20,533) | $ | 36,449 | $ | (2,539) | $ | 3 |
|
| ||||||||
Acquisitions |
| $ | 105 | ||||||||||||||||||||
Net income (loss) |
| 3,002 | 3,001 | 1 | (1) | ||||||||||||||||||
Other comprehensive loss |
| (752) | (752) |
| (4) | ||||||||||||||||||
Repurchases of common stock |
| (1,226) | (1,226) | ||||||||||||||||||||
Treasury shares reissued |
| 32 | 32 | ||||||||||||||||||||
Dividends declared |
| (646) | (645) | (1) |
| ||||||||||||||||||
Share based awards and other |
| 63 | 63 |
|
| (1) | |||||||||||||||||
Balance May 1, 2022 | $ | 18,907 | $ | 5,117 | $ | (21,727) | $ | 38,805 | $ | (3,291) | $ | 3 | $ | 99 | |||||||||
|
| ||||||||||||||||||||||
Three Months Ended April 30, 2023 | |||||||||||||||||||||||
Balance January 29, 2023 | $ | 21,336 | $ | 5,191 | $ | (25,333) | $ | 43,846 | $ | (2,372) | $ | 4 | $ | 100 | |||||||||
Net income (loss) | 2,861 | 2,860 | 1 | (2) | |||||||||||||||||||
Other comprehensive income (loss) | (166) | (166) |
| 2 | |||||||||||||||||||
Repurchases of common stock | (1,301) | (1,301) | |||||||||||||||||||||
Treasury shares reissued | 4 | 4 | |||||||||||||||||||||
Dividends declared | (370) | (369) | (1) |
| |||||||||||||||||||
Share based awards and other | 35 | 36 | (1) |
| 2 | ||||||||||||||||||
Balance April 30, 2023 | $ | 22,399 | $ | 5,227 | $ | (26,630) | $ | 46,336 | $ | (2,538) | $ | 4 | $ | 102 | |||||||||
Six Months Ended April 30, 2023 | |||||||||||||||||||||||
Balance October 30, 2022 | $ | 20,265 | $ | 5,165 | $ | (24,094) | $ | 42,247 | $ | (3,056) | $ | 3 | $ | 92 | |||||||||
Net income (loss) | 4,820 | 4,819 | 1 | (5) | |||||||||||||||||||
Other comprehensive income | 518 | 518 |
| 10 | |||||||||||||||||||
Repurchases of common stock | (2,558) | (2,558) | |||||||||||||||||||||
Treasury shares reissued | 22 | 22 | |||||||||||||||||||||
Dividends declared | (726) | (725) | (1) |
| |||||||||||||||||||
Share based awards and other | 58 | 62 | (5) | 1 | 5 | ||||||||||||||||||
Balance April 30, 2023 | $ | 22,399 | $ | 5,227 | $ | (26,630) | $ | 46,336 | $ | (2,538) | $ | 4 | $ | 102 | |||||||||
See Condensed Notes to Interim Consolidated Financial Statements.
6
Condensed Notes to Interim Consolidated Financial Statements (Unaudited)
(1) Organization and Consolidation
Deere & Company has been developing innovative solutions to help its customers become more profitable for more than 185 years. References to Deere & Company, John Deere, Deere, or the Company include its consolidated subsidiaries and consolidated variable interest entities (VIEs). The Company is managed through the following operating segments: production and precision agriculture (PPA), small agriculture and turf (SAT), construction and forestry (CF), and financial services (FS). References to “equipment operations” include production and precision agriculture, small agriculture and turf, and construction and forestry, while references to “agriculture and turf” include both production and precision agriculture and small agriculture and turf.
The Company uses a 52/53 week fiscal year with quarters ending on the last Sunday in the reporting period. The second quarter ends for fiscal year 2023 and 2022 were April 30, 2023 and May 1, 2022, respectively. Both second quarters contained 13 weeks, while both year-to-date periods contained 26 weeks. Unless otherwise stated, references to particular years, quarters, or months refer to the Company’s fiscal years generally ending in October and the associated periods in those fiscal years.
(2) Summary of Significant Accounting Policies and New Accounting Standards
Quarterly Financial Statements
The interim consolidated financial statements of Deere & Company have been prepared by the Company, without audit, pursuant to the rules and regulations of the U.S. Securities and Exchange Commission (SEC). Certain information and footnote disclosures normally included in annual financial statements prepared in accordance with accounting principles generally accepted in the U.S. have been condensed or omitted as permitted by such rules and regulations. All normal recurring adjustments have been included. Management believes the disclosures are adequate to present fairly the financial position, results of operations, and cash flows at the dates and for the periods presented. It is suggested these interim consolidated financial statements be read in conjunction with the consolidated financial statements and the notes thereto appearing in the Company’s latest Annual Report on Form 10-K. Results for interim periods are not necessarily indicative of those to be expected for the fiscal year.
Use of Estimates in Financial Statements
The preparation of financial statements in conformity with accounting principles generally accepted in the U.S. requires management to make estimates and assumptions that affect the reported amounts and related disclosures. Actual results could differ from those estimates.
New Accounting Standards
The Company closely monitors all Accounting Standard Updates (ASUs) issued by the Financial Accounting Standards Board and other authoritative guidance. ASUs adopted in 2023 did not have a material impact on the Company’s financial statements. ASUs to be adopted in future periods are being evaluated and at this point are not expected to have a material impact on the Company’s financial statements.
7
(3) Revenue Recognition
The Company’s net sales and revenues by primary geographic market, major product line, and timing of revenue recognition in millions of dollars follow:
Three Months Ended April 30, 2023 | ||||||||||||||||
| Production & Precision Ag |
| Small Ag & Turf |
| Construction |
| Financial |
| Total | |||||||
Primary geographic markets: |
|
| ||||||||||||||
United States | $ | 4,058 | $ | 2,241 | $ | 2,561 | $ | 766 | $ | 9,626 | ||||||
Canada | 546 | 189 | 302 |
| 153 |
| 1,190 | |||||||||
Western Europe | 758 | 888 | 492 |
| 31 |
| 2,169 | |||||||||
Central Europe and CIS | 393 | 212 | 90 |
| 8 |
| 703 | |||||||||
Latin America | 1,543 | 201 | 388 |
| 106 |
| 2,238 | |||||||||
Asia, Africa, Oceania, and Middle East | 614 | 469 | 335 | 43 | 1,461 | |||||||||||
Total | $ | 7,912 | $ | 4,200 | $ | 4,168 | $ | 1,107 | $ | 17,387 | ||||||
Major product lines: |
|
| ||||||||||||||
Production agriculture | $ | 7,733 |
|
|
| $ | 7,733 | |||||||||
Small agriculture |
| $ | 2,952 |
|
|
|
| 2,952 | ||||||||
Turf |
| 1,099 |
|
|
|
| 1,099 | |||||||||
Construction |
|
| $ | 1,813 |
|
|
| 1,813 | ||||||||
Compact construction |
|
| 663 |
| 663 | |||||||||||
Roadbuilding |
|
| 1,134 |
|
|
| 1,134 | |||||||||
Forestry |
|
| 429 |
|
|
| 429 | |||||||||
Financial products | 29 | 20 | 12 | $ | 1,107 |
| 1,168 | |||||||||
Other | 150 | 129 | 117 |
|
|
| 396 | |||||||||
Total | $ | 7,912 | $ | 4,200 | $ | 4,168 | $ | 1,107 | $ | 17,387 | ||||||
Revenue recognized: |
|
| ||||||||||||||
At a point in time | $ | 7,861 | $ | 4,171 | $ | 4,146 | $ | 27 | $ | 16,205 | ||||||
Over time | 51 | 29 | 22 | 1,080 | 1,182 | |||||||||||
Total | $ | 7,912 | $ | 4,200 | $ | 4,168 | $ | 1,107 | $ | 17,387 | ||||||
| Six Months Ended April 30, 2023 | |||||||||||||||
Production & Precision Ag |
| Small Ag & Turf |
| Construction |
| Financial |
| Total | ||||||||
Primary geographic markets: | ||||||||||||||||
United States | $ | 6,686 | $ | 3,906 | $ | 4,461 | $ | 1,479 | $ | 16,532 | ||||||
Canada | 906 | 335 | 577 |
| 303 |
| 2,121 | |||||||||
Western Europe | 1,259 | 1,452 | 857 |
| 60 |
| 3,628 | |||||||||
Central Europe and CIS | 595 | 335 | 165 |
| 20 |
| 1,115 | |||||||||
Latin America | 2,780 | 357 | 727 |
| 201 |
| 4,065 | |||||||||
Asia, Africa, Oceania, and Middle East | 989 | 869 | 635 | 84 | 2,577 | |||||||||||
Total | $ | 13,215 | $ | 7,254 | $ | 7,422 | $ | 2,147 | $ | 30,038 | ||||||
Major product lines: |
|
| ||||||||||||||
Production agriculture | $ | 12,845 |
|
|
| $ | 12,845 | |||||||||
Small agriculture |
| $ | 5,146 |
|
|
|
| 5,146 | ||||||||
Turf |
| 1,818 |
|
|
|
| 1,818 | |||||||||
Construction |
|
| $ | 3,295 |
|
|
| 3,295 | ||||||||
Compact construction |
|
| 1,136 |
| 1,136 | |||||||||||
Roadbuilding |
|
| 1,952 |
|
|
| 1,952 | |||||||||
Forestry |
|
| 785 |
|
| 785 | ||||||||||
Financial products | 60 | 38 | 25 | $ | 2,147 |
| 2,270 | |||||||||
Other | 310 | 252 | 229 |
|
|
| 791 | |||||||||
Total | $ | 13,215 | $ | 7,254 | $ | 7,422 | $ | 2,147 | $ | 30,038 | ||||||
Revenue recognized: |
|
| ||||||||||||||
At a point in time | $ | 13,109 | $ | 7,200 | $ | 7,375 | $ | 50 | $ | 27,734 | ||||||
Over time | 106 | 54 | 47 | 2,097 | 2,304 | |||||||||||
Total | $ | 13,215 | $ | 7,254 | $ | 7,422 | $ | 2,147 | $ | 30,038 | ||||||
8
Three Months Ended May 1, 2022 | ||||||||||||||||
| Production & Precision Ag |
| Small Ag & Turf |
| Construction |
| Financial |
| Total | |||||||
Primary geographic markets: |
|
| ||||||||||||||
United States | $ | 2,434 | $ | 2,103 | $ | 2,108 | $ | 569 | $ | 7,214 | ||||||
Canada | 309 | 161 | 355 |
| 149 |
| 974 | |||||||||
Western Europe | 536 | 658 | 464 | 25 |
| 1,683 | ||||||||||
Central Europe and CIS | 404 | 151 | 146 | 11 |
| 712 | ||||||||||
Latin America | 1,126 | 134 | 333 | 73 |
| 1,666 | ||||||||||
Asia, Africa, Oceania, and Middle East | 367 | 399 | 318 | 37 | 1,121 | |||||||||||
Total | $ | 5,176 | $ | 3,606 | $ | 3,724 | $ | 864 | $ | 13,370 | ||||||
Major product lines: |
|
| ||||||||||||||
Production agriculture | $ | 5,032 |
|
| $ | 5,032 | ||||||||||
Small agriculture | $ | 2,668 |
|
|
|
| 2,668 | |||||||||
Turf | 817 |
|
|
|
| 817 | ||||||||||
Construction |
| $ | 1,516 |
|
|
| 1,516 | |||||||||
Compact construction |
| 427 |
| 427 | ||||||||||||
Roadbuilding |
| 1,017 |
|
|
| 1,017 | ||||||||||
Forestry |
| 325 |
|
|
| 325 | ||||||||||
Financial products | 10 | 9 | 6 | $ | 864 |
| 889 | |||||||||
Other | 134 | 112 | 433 |
|
|
| 679 | |||||||||
Total | $ | 5,176 | $ | 3,606 | $ | 3,724 | $ | 864 | $ | 13,370 | ||||||
Revenue recognized: |
|
| ||||||||||||||
At a point in time | $ | 5,144 | $ | 3,593 | $ | 3,707 | $ | 26 | $ | 12,470 | ||||||
Over time | 32 | 13 | 17 | 838 | 900 | |||||||||||
Total | $ | 5,176 | $ | 3,606 | $ | 3,724 | $ | 864 | $ | 13,370 | ||||||
Six Months Ended May 1, 2022 | ||||||||||||||||
| Production & Precision Ag |
| Small Ag & Turf |
| Construction |
| Financial |
| Total | |||||||
Primary geographic markets: | ||||||||||||||||
United States | $ | 4,042 | $ | 3,541 | $ | 3,368 | $ | 1,142 | $ | 12,093 | ||||||
Canada | 448 | 283 | 687 | 301 |
| 1,719 | ||||||||||
Western Europe | 1,003 | 1,190 | 822 | 51 |
| 3,066 | ||||||||||
Central Europe and CIS | 606 | 277 | 341 | 22 |
| 1,246 | ||||||||||
Latin America | 1,902 | 238 | 561 | 141 |
| 2,842 | ||||||||||
Asia, Africa, Oceania, and Middle East | 608 | 751 | 537 | 77 | 1,973 | |||||||||||
Total | $ | 8,609 | $ | 6,280 | $ | 6,316 | $ | 1,734 | $ | 22,939 | ||||||
Major product lines: |
|
| ||||||||||||||
Production agriculture | $ | 8,315 |
|
|
| $ | 8,315 | |||||||||
Small agriculture |
| $ | 4,600 |
|
|
| 4,600 | |||||||||
Turf |
| 1,444 |
|
|
| 1,444 | ||||||||||
Construction |
|
| $ | 2,691 |
|
| 2,691 | |||||||||
Compact construction |
|
| 748 |
| 748 | |||||||||||
Roadbuilding |
|
| 1,709 |
|
| 1,709 | ||||||||||
Forestry |
|
| 630 |
|
| 630 | ||||||||||
Financial products | 22 | 20 | 11 | $ | 1,734 |
| 1,787 | |||||||||
Other | 272 | 216 | 527 |
|
| 1,015 | ||||||||||
Total | $ | 8,609 | $ | 6,280 | $ | 6,316 | $ | 1,734 | $ | 22,939 | ||||||
Revenue recognized: |
|
| ||||||||||||||
At a point in time | $ | 8,540 | $ | 6,247 | $ | 6,277 | $ | 50 | $ | 21,114 | ||||||
Over time | 69 | 33 | 39 | 1,684 | 1,825 | |||||||||||
Total | $ | 8,609 | $ | 6,280 | $ | 6,316 | $ | 1,734 | $ | 22,939 | ||||||
9
The Company invoices in advance of recognizing the sale of certain products and the revenue for certain services. These relate to extended warranty premiums, advance payments for future equipment sales, and subscription and service revenue related to precision guidance and telematic services. These advanced customer payments are presented as deferred revenue, a contract liability, in “Accounts payable and accrued expenses” in the consolidated balance sheets. The deferred revenue received, but not recognized in revenue, including extended warranty premiums also shown in Note 16, was $1,622 million, $1,423 million, and $1,423 million at April 30, 2023, October 30, 2022, and May 1, 2022, respectively. The contract liability is reduced as the revenue is recognized. During the three months ended April 30, 2023 and May 1, 2022, $129 million and $130 million, respectively, of revenue was recognized from deferred revenue that was recorded as a contract liability at the beginning of the respective fiscal year. During the six months ended April 30, 2023 and May 1, 2022, $343 million and $395 million, respectively, of revenue was recognized from deferred revenue that was recorded as a contract liability at the beginning of the respective fiscal year.
The amount of unsatisfied performance obligations for contracts with an original duration greater than one year was $1,378 million at April 30, 2023. The estimated revenue to be recognized by fiscal year follows in millions of dollars: remainder of - $238, - $376, - $294, - $191, - $111, - $68 and - $100. As permitted, the Company elected only to disclose remaining performance obligations with an original contract duration greater than one year. The contracts with an expected duration of one year or less are for sales of equipment, service parts, repair services, and certain telematics services.
(4) Other Comprehensive Income Items
The after-tax components of accumulated other comprehensive income (loss) in millions of dollars follow:
April 30 | October 30 | May 1 | ||||||||
2023 | 2022 | 2022 | ||||||||
Retirement benefits adjustment | $ | (647) | $ | (389) | $ | (1,250) | ||||
Cumulative translation adjustment | (1,813) | (2,594) | (1,993) | |||||||
Unrealized gain (loss) on derivatives | (10) | 21 |
| |||||||
Unrealized gain (loss) on debt securities | (68) | (94) | (48) | |||||||
Total accumulated other comprehensive income (loss) | $ | (2,538) | $ | (3,056) | $ | (3,291) | ||||
Following are amounts recorded in and reclassifications out of other comprehensive income (loss), and the income tax effects, in millions of dollars. Retirement benefits adjustment reclassifications for actuarial (gain) loss, prior service (credit) cost, and settlements are included in net periodic pension and other postretirement benefit costs (see Note 6).
| Before |
| Tax |
| After |
| ||||
Tax | (Expense) | Tax |
| |||||||
Three Months Ended April 30, 2023 | Amount | Credit | Amount |
| ||||||
Cumulative translation adjustment | $ | 100 |
| $ | 100 | |||||
Unrealized gain (loss) on derivatives: | ||||||||||
Unrealized hedging gain (loss) | (4) | $ | 1 | (3) | ||||||
Reclassification of realized (gain) loss to: | ||||||||||
Interest rate contracts – Interest expense | (19) | 4 | (15) | |||||||
Net unrealized gain (loss) on derivatives | (23) | 5 | (18) | |||||||
Unrealized gain (loss) on debt securities: | ||||||||||
Unrealized holding gain (loss) | (2) | 1 | (1) | |||||||
Net unrealized gain (loss) on debt securities | (2) | 1 | (1) | |||||||
Retirement benefits adjustment: | ||||||||||
Net actuarial gain (loss) | (349) | 83 | (266) | |||||||
Reclassification of amortized amounts: | ||||||||||
Actuarial (gain) loss – Other operating expenses | (20) | 5 | (15) | |||||||
Prior service (credit) cost – Other operating expenses | 10 | (2) | 8 | |||||||
Settlements – Other operating expenses | 36 | (10) | 26 | |||||||
Net unrealized gain (loss) on retirement benefits adjustment | (323) | 76 | (247) | |||||||
Total other comprehensive income (loss) |
| $ | (248) | $ | 82 | $ | (166) | |||
10
| Before |
| Tax |
| After |
| ||||
Tax | (Expense) | Tax |
| |||||||
Six Months Ended April 30, 2023 | Amount | Credit | Amount |
| ||||||
Cumulative translation adjustment |
| $ | 771 | $ | 10 | $ | 781 | |||
Unrealized gain (loss) on derivatives: | ||||||||||
Unrealized hedging gain (loss) | (5) | 1 | (4) | |||||||
Reclassification of realized (gain) loss to: | ||||||||||
Interest rate contracts – Interest expense | (34) | 7 | (27) | |||||||
Net unrealized gain (loss) on derivatives | (39) | 8 | (31) | |||||||
Unrealized gain (loss) on debt securities: | ||||||||||
Unrealized holding gain (loss) | 33 | (7) | 26 | |||||||
Net unrealized gain (loss) on debt securities | 33 | (7) | 26 | |||||||
Retirement benefits adjustment: | ||||||||||
Net actuarial gain (loss) | (350) | 83 | (267) | |||||||
Reclassification of amortized amounts: | ||||||||||
Actuarial (gain) loss – Other operating expenses | (41) | 10 | (31) | |||||||
Prior service (credit) cost – Other operating expenses | 19 | (5) | 14 | |||||||
Settlements – Other operating expenses | 36 | (10) | 26 | |||||||
Net unrealized gain (loss) on retirement benefits adjustment | (336) | 78 | (258) | |||||||
Total other comprehensive income (loss) |
| $ | 429 | $ | 89 | $ | 518 | |||
| Before |
| Tax |
| After |
| ||||
Tax | (Expense) | Tax |
| |||||||
Three Months Ended May 1, 2022 | Amount | Credit | Amount |
| ||||||
Cumulative translation adjustment |
| $ | (243) | $ | (5) | $ | (248) | |||
Unrealized gain (loss) on derivatives: | ||||||||||
Unrealized hedging gain (loss) | 35 | (7) | 28 | |||||||
Reclassification of realized (gain) loss to: |
| |||||||||
Interest rate contracts – Interest expense | 1 | (1) |
| |||||||
Net unrealized gain (loss) on derivatives | 36 | (8) | 28 | |||||||
Unrealized gain (loss) on debt securities: | ||||||||||
Unrealized holding gain (loss) | (61) | 13 | (48) | |||||||
Net unrealized gain (loss) on debt securities | (61) | 13 | (48) | |||||||
Retirement benefits adjustment: | ||||||||||
Net actuarial gain (loss) | 128 | (30) | 98 | |||||||
Reclassification of amortized amounts: |
| |||||||||
Actuarial (gain) loss – Other operating expenses | 27 | (7) | 20 | |||||||
Prior service (credit) cost – Other operating expenses | 8 | (2) | 6 | |||||||
Settlements – Other operating expenses | 7 | (2) | 5 | |||||||
Net unrealized gain (loss) on retirement benefits adjustment | 170 | (41) | 129 | |||||||
Total other comprehensive income (loss) |
| $ | (98) | $ | (41) | $ | (139) | |||
11
| Before |
| Tax |
| After |
| ||||
Tax | (Expense) | Tax |
| |||||||
Six Months Ended May 1, 2022 | Amount | Credit | Amount |
| ||||||
Cumulative translation adjustment |
| $ | (507) |
| $ | (8) | $ | (515) | ||
Unrealized gain (loss) on derivatives: | ||||||||||
Unrealized hedging gain (loss) | 50 | (10) | 40 | |||||||
Reclassification of realized (gain) loss to: |
| |||||||||
Interest rate contracts – Interest expense | 3 | (1) | 2 | |||||||
Net unrealized gain (loss) on derivatives | 53 | (11) | 42 | |||||||
Unrealized gain (loss) on debt securities: | ||||||||||
Unrealized holding gain (loss) | (80) | 17 | (63) | |||||||
Net unrealized gain (loss) on debt securities | (80) | 17 | (63) | |||||||
Retirement benefits adjustment: | ||||||||||
Net actuarial gain (loss) and prior service credit (cost) | (372) | 90 | (282) | |||||||
Reclassification of amortized amounts: |
| |||||||||
Actuarial (gain) loss – Other operating expenses | 67 | (17) | 50 | |||||||
Prior service (credit) cost – Other operating expenses | 14 | (4) | 10 | |||||||
Settlements – Other operating expenses | 8 | (2) | 6 | |||||||
Net unrealized gain (loss) on retirement benefits adjustment | (283) | 67 | (216) | |||||||
Total other comprehensive income (loss) |
| $ | (817) | $ | 65 | $ | (752) | |||
(5) Earnings Per Share
A reconciliation of basic and diluted net income per share attributable to Deere & Company follows in millions (except per share amounts):
| Three Months Ended | Six Months Ended |
| ||||||||||
April 30 | May 1 | April 30 | May 1 |
| |||||||||
2023 | 2022 | 2023 | 2022 |
| |||||||||
Net income attributable to Deere & Company |
| $ | 2,860 |
| $ | 2,098 |
| $ | 4,819 |
| $ | 3,001 | |
Average shares outstanding | 295.1 |
| 306.2 | 296.3 |
| 306.8 | |||||||
Basic per share | $ | 9.69 | $ | 6.85 | $ | 16.26 | $ | 9.78 | |||||
Average shares outstanding | 295.1 |
| 306.2 | 296.3 |
| 306.8 | |||||||
Effect of dilutive share-based compensation | 1.4 |
| 1.9 | 1.5 |
| 2.0 | |||||||
Total potential shares outstanding | 296.5 |
| 308.1 | 297.8 |
| 308.8 | |||||||
Diluted per share | $ | 9.65 | $ | 6.81 | $ | 16.18 | $ | 9.72 | |||||
Shares excluded from EPS calculation, as antidilutive | .2 | .2 | .1 | .1 | |||||||||
12
(6) Pension and Other Postretirement Employee Benefits
The Company has several defined benefit pension plans and other postretirement employee benefit (OPEB) plans, primarily health care and life insurance plans, covering its U.S. employees and employees in certain foreign countries. The components of net periodic pension and OPEB (benefit) cost consisted of the following in millions of dollars:
Three Months Ended | Six Months Ended |
| |||||||||||
April 30 | May 1 | April 30 | May 1 |
| |||||||||
2023 | 2022 | 2023 | 2022 |
| |||||||||
Pension | |||||||||||||
Service cost |
| $ | 64 |
| $ | 94 |
| $ | 124 |
| $ | 179 | |
134 |
| 80 | 267 |
| 157 | ||||||||
(220) |
| (180) | (432) |
| (362) | ||||||||
(6) |
| 37 | (11) |
| 76 | ||||||||
10 |
| 9 | 20 |
| 16 | ||||||||
36 |
| 7 | 36 |
| 8 | ||||||||
Net cost | $ | 18 | $ | 47 | $ | 4 | $ | 74 | |||||
OPEB | |||||||||||||
Service cost |
| $ | 6 |
| $ | 11 |
| $ | 13 |
| $ | 23 | |
45 |
| 23 | 88 |
| 49 | ||||||||
(29) |
| (27) | (58) |
| (55) | ||||||||
(14) |
| (10) | (30) |
| (9) | ||||||||
|
| (1) | (1) |
| (2) | ||||||||
Net (benefit) cost | $ | 8 | $ | (4) | $ | 12 | $ | 6 | |||||
The reduction in the 2023 pension net cost is due to increases in the expected long-term return rates on plan assets and increases in discount rates. The components of net periodic pension and OPEB (benefit) cost excluding the service cost component are included in the line item “Other operating expenses” in the statements of consolidated income.
During the second quarter of 2023, an international pension plan paid a premium to an insurance company to irrevocably transfer the benefit obligations and administration for the majority of its retired participants. The transaction did not impact the benefits to be received by the retired participants. In connection with the transaction, the Company recognized a one-time, non-cash, pre-tax pension settlement charge of $36 million in the second quarter of related to the accelerated recognition of actuarial losses included within “Accumulated other comprehensive income (loss)” in the statements of changes in consolidated stockholders’ equity.
13
(7) Segment Reporting
Worldwide net sales and revenues, operating profit, and identifiable assets by segment were as follows in millions of dollars:
Three Months Ended | Six Months Ended |
| |||||||||||||||
| April 30 | May 1 | % | April 30 | May 1 | % |
| ||||||||||
2023 | 2022 | Change | 2023 | 2022 | Change |
| |||||||||||
Net sales and revenues: |
|
|
|
|
|
|
|
|
|
|
| ||||||
Production & precision ag net sales |
| $ | 7,822 | $ | 5,117 | +53 |
| $ | 13,021 | $ | 8,473 | +54 | |||||
Small ag & turf net sales | 4,145 | 3,570 | +16 | 7,146 | 6,201 | +15 | |||||||||||
Construction & forestry net sales | 4,112 |
| 3,347 | +23 | 7,314 |
| 5,891 | +24 | |||||||||
Financial services revenues | 1,107 |
| 864 | +28 | 2,147 |
| 1,734 | +24 | |||||||||
Other revenues | 201 |
| 472 | -57 | 410 |
| 640 | -36 | |||||||||
Total net sales and revenues |
| $ | 17,387 | $ | 13,370 | +30 |
| $ | 30,038 | $ | 22,939 | +31 | |||||
Operating profit: | |||||||||||||||||
Production & precision ag |
| $ | 2,170 | $ | 1,057 | +105 |
| $ | 3,378 | $ | 1,353 | +150 | |||||
Small ag & turf | 849 | 520 | +63 | 1,296 | 891 | +45 | |||||||||||
Construction & forestry | 838 |
| 814 | +3 | 1,463 |
| 1,085 | +35 | |||||||||
Financial services | 41 |
| 279 | -85 | 279 |
| 577 | -52 | |||||||||
Total operating profit | 3,898 |
| 2,670 | +46 | 6,416 |
| 3,906 | +64 | |||||||||
Reconciling items | (47) |
| (111) | -58 | (69) |
| (195) | -65 | |||||||||
Income taxes | (991) |
| (461) | +115 | (1,528) |
| (710) | +115 | |||||||||
Net income attributable to Deere & Company |
| $ | 2,860 | $ | 2,098 | +36 |
| $ | 4,819 | $ | 3,001 | +61 | |||||
Intersegment sales and revenues: | |||||||||||||||||
Production & precision ag net sales |
| $ | 8 | $ | 6 | +33 |
| $ | 12 | $ | 10 | +20 | |||||
Small ag & turf net sales | 4 | 4 | 7 | 6 | +17 | ||||||||||||
Construction & forestry net sales |
|
|
|
|
| ||||||||||||
Financial services revenues | 190 |
| 87 | +118 | 395 |
| 133 | +197 | |||||||||
Operating profit for production and precision ag, small ag and turf, and construction and forestry is income from continuing operations before reconciling items and income taxes. Operating profit of the financial services segment includes the effect of interest expense and foreign exchange gains and losses. Reconciling items to net income are primarily corporate expenses, certain external interest expenses, certain foreign exchange gains and losses, pension and OPEB benefit amounts excluding the service cost component, equity in income of unconsolidated affiliates, and net income attributable to noncontrolling interests.
| April 30 |
| October 30 | May 1 |
| |||||
2023 | 2022 | 2022 |
| |||||||
Identifiable assets: | ||||||||||
Production & precision ag |
| $ | 9,504 | $ | 8,414 | $ | 8,680 | |||
Small ag & turf | 4,743 | 4,451 | 4,431 | |||||||
Construction & forestry | 7,299 |
| 6,754 |
| 6,984 | |||||
Financial services | 65,233 |
| 58,864 |
| 53,110 | |||||
Corporate | 11,568 |
| 11,547 |
| 10,894 | |||||
Total assets |
| $ | 98,347 | $ | 90,030 | $ | 84,099 | |||
(8) Financing Receivables
The Company monitors the credit quality of financing receivables based on delinquency status. Past due balances of financing receivables still accruing finance income represent the total balance held (principal plus accrued interest) with any payment amounts 30 days or more past the contractual payment due date. Non-performing financing receivables represent receivables for which the Company has ceased accruing finance income. The Company ceases accruing finance income when these receivables are generally 90 days delinquent. Generally, when receivables are 120 days delinquent the estimated uncollectible amount from the customer is written off to the allowance for credit losses. Finance income for non-performing receivables is recognized on a cash basis. Accrual of finance income is generally resumed when the receivable becomes contractually current and collections are reasonably assured.
14
The credit quality analysis of retail notes, financing leases, and revolving charge accounts (collectively, retail customer receivables) by year of origination was as follows in millions of dollars:
April 30, 2023 | |||||||||||||||||||||||||
2023 | 2022 | 2021 | 2020 | 2019 | Prior Years | Revolving Charge Accounts | Total | ||||||||||||||||||
Retail customer receivables: |
|
|
|
|
|
|
|
|
|
|
|
|
|
|
|
|
|
|
|
|
|
|
|
| |
Agriculture and turf | |||||||||||||||||||||||||
Current | $ | 6,718 | $ | 10,947 | $ | 6,435 | $ | 3,155 | $ | 1,305 | $ | 619 | $ | 3,621 | $ | 32,800 | |||||||||
30-59 days past due | 10 | 55 | 55 | 31 | 18 | 9 | 16 | 194 | |||||||||||||||||
60-89 days past due | 2 | 15 | 24 | 19 | 4 | 2 | 8 | 74 | |||||||||||||||||
90+ days past due |
| 1 | 1 |
|
|
|
| 2 | |||||||||||||||||
Non-performing | 5 | 51 | 51 | 36 | 25 | 29 | 25 | 222 | |||||||||||||||||
Construction and forestry | |||||||||||||||||||||||||
Current | 1,442 | 2,434 | 1,490 | 557 | 169 | 56 | 106 | 6,254 | |||||||||||||||||
30-59 days past due | 7 | 35 | 29 | 25 | 21 | 10 | 4 | 131 | |||||||||||||||||
60-89 days past due | 1 | 8 | 16 | 12 | 14 | 12 | 2 | 65 | |||||||||||||||||
90+ days past due |
| 7 | 1 | 1 | 2 |
|
| 11 | |||||||||||||||||
Non-performing | 5 | 71 | 61 | 33 | 12 | 6 | 1 | 189 | |||||||||||||||||
Total | $ | 8,190 | $ | 13,624 | $ | 8,163 | $ | 3,869 | $ | 1,570 | $ | 743 | $ | 3,783 | $ | 39,942 | |||||||||
October 30, 2022 | |||||||||||||||||||||||||
2022 | 2021 | 2020 | 2019 | 2018 | Prior | Revolving Charge Accounts | Total | ||||||||||||||||||
Retail customer receivables: |
|
|
|
|
|
|
|
|
|
|
|
|
|
|
|
|
|
|
|
|
|
|
|
| |
Agriculture and turf | |||||||||||||||||||||||||
Current | $ | 13,500 | $ | 7,984 | $ | 4,091 | $ | 1,875 | $ | 785 | $ | 200 | $ | 4,111 | $ | 32,546 | |||||||||
30-59 days past due | 46 | 63 | 36 | 17 | 7 | 3 | 19 | 191 | |||||||||||||||||
60-89 days past due | 14 | 25 | 13 | 6 | 2 | 1 | 5 | 66 | |||||||||||||||||
90+ days past due | 1 |
| 1 | ||||||||||||||||||||||
Non-performing | 27 | 60 | 44 | 28 | 18 | 19 | 8 | 204 | |||||||||||||||||
Construction and forestry | |||||||||||||||||||||||||
Current | 2,964 | 1,974 | 842 | 292 | 73 | 12 | 108 | 6,265 | |||||||||||||||||
30-59 days past due | 53 | 52 | 23 | 9 | 2 | 1 | 3 | 143 | |||||||||||||||||
60-89 days past due | 19 | 16 | 7 | 3 | 1 | 1 | 47 | ||||||||||||||||||
90+ days past due | 1 | 4 | 1 | 3 |
| 1 | 10 | ||||||||||||||||||
Non-performing | 25 | 61 | 34 | 19 | 7 | 3 | 149 | ||||||||||||||||||
Total | $ | 16,650 | $ | 10,239 | $ | 5,091 | $ | 2,252 | $ | 895 | $ | 240 | $ | 4,255 | $ | 39,622 | |||||||||
May 1, 2022 | |||||||||||||||||||||||||
2022 | 2021 | 2020 | 2019 | 2018 | Prior | Revolving Charge Accounts | Total | ||||||||||||||||||
Retail customer receivables: |
|
|
|
|
|
|
|
|
|
|
|
|
|
|
|
|
|
|
|
|
|
|
|
| |
Agriculture and turf | |||||||||||||||||||||||||
Current | $ | 5,540 | $ | 10,141 | $ | 5,318 | $ | 2,684 | $ | 1,286 | $ | 723 | $ | 3,381 | $ | 29,073 | |||||||||
30-59 days past due | 20 | 75 | 36 | 20 | 9 | 5 | 12 | 177 | |||||||||||||||||
60-89 days past due | 4 | 29 | 14 | 9 | 5 | 2 | 4 | 67 | |||||||||||||||||
90+ days past due |
|
| 1 |
|
|
|
| 1 | |||||||||||||||||
Non-performing | 3 | 40 | 44 | 41 | 25 | 31 | 14 | 198 | |||||||||||||||||
Construction and forestry | |||||||||||||||||||||||||
Current | 1,506 | 2,404 | 1,211 | 577 | 234 | 105 | 91 | 6,128 | |||||||||||||||||
30-59 days past due | 20 | 52 | 33 | 17 | 6 | 2 | 3 | 133 | |||||||||||||||||
60-89 days past due | 7 | 25 | 15 | 6 | 1 | 1 | 1 | 56 | |||||||||||||||||
90+ days past due |
| 1 | 1 | 1 | 1 | 5 |
| 9 | |||||||||||||||||
Non-performing | 3 | 46 | 50 | 29 | 12 | 5 | 1 | 146 | |||||||||||||||||
Total | $ | 7,103 | $ | 12,813 | $ | 6,723 | $ | 3,384 | $ | 1,579 | $ | 879 | $ | 3,507 | $ | 35,988 | |||||||||
15
The credit quality analysis of wholesale receivables by year of origination was as follows in millions of dollars:
April 30, 2023 | |||||||||||||||||||||||||
2023 | 2022 | 2021 | 2020 | 2019 | Prior | Revolving | Total | ||||||||||||||||||
Wholesale receivables: |
|
|
|
|
|
|
|
|
|
|
|
|
|
|
|
|
|
|
|
|
|
|
|
| |
Agriculture and turf | |||||||||||||||||||||||||
Current | $ | 265 | $ | 198 | $ | 36 | $ | 15 | $ | 2 | $ | 1 | $ | 3,653 | $ | 4,170 | |||||||||
30+ days past due |
|
|
|
|
|
|
|
| |||||||||||||||||
Non-performing |
|
|
|
| 1 |
|
| 1 | |||||||||||||||||
Construction and forestry | |||||||||||||||||||||||||
Current | 10 | 6 | 24 | 1 |
| 1 | 638 | 680 | |||||||||||||||||
30+ days past due |
|
|
|
|
|
|
|
| |||||||||||||||||
Non-performing |
|
|
|
|
|
|
|
| |||||||||||||||||
Total | $ | 275 | $ | 204 | $ | 60 | $ | 16 | $ | 3 | $ | 2 | $ | 4,291 | $ | 4,851 | |||||||||
October 30, 2022 | |||||||||||||||||||||||||
2022 | 2021 | 2020 | 2019 | 2018 | Prior | Revolving | Total | ||||||||||||||||||
Wholesale receivables: |
|
|
|
|
|
|
|
|
|
|
|
|
|
|
|
|
|
|
|
|
|
|
|
| |
Agriculture and turf | |||||||||||||||||||||||||
Current | $ | 387 | $ | 64 | $ | 27 | $ | 4 |
| $ | 2 | $ | 2,371 | $ | 2,855 | ||||||||||
30+ days past due |
| ||||||||||||||||||||||||
Non-performing |
| 1 | 1 | ||||||||||||||||||||||
Construction and forestry | |||||||||||||||||||||||||
Current | 7 | 29 | 2 | 1 |
| 1 | 377 | 417 | |||||||||||||||||
30+ days past due |
| ||||||||||||||||||||||||
Non-performing |
| ||||||||||||||||||||||||
Total | $ | 394 | $ | 93 | $ | 29 | $ | 6 |
| $ | 3 | $ | 2,748 | $ | 3,273 | ||||||||||
May 1, 2022 | |||||||||||||||||||||||||
2022 | 2021 | 2020 | 2019 | 2018 | Prior | Revolving | Total | ||||||||||||||||||
Wholesale receivables: |
|
|
|
|
|
|
|
|
|
|
|
|
|
|
|
|
|
|
|
|
|
|
|
| |
Agriculture and turf | |||||||||||||||||||||||||
Current | $ | 224 | $ | 155 | $ | 43 | $ | 8 | $ | 1 | $ | 2 | $ | 1,605 | $ | 2,038 | |||||||||
30+ days past due |
|
|
|
|
|
|
|
| |||||||||||||||||
Non-performing |
|
|
| 5 |
|
|
| 5 | |||||||||||||||||
Construction and forestry | |||||||||||||||||||||||||
Current | 6 | 35 | 4 | 2 |
| 1 | 268 | 316 | |||||||||||||||||
30+ days past due |
|
|
|
|
| 1 |
| 1 | |||||||||||||||||
Non-performing |
|
|
|
|
|
|
|
| |||||||||||||||||
Total | $ | 230 | $ | 190 | $ | 47 | $ | 15 | $ | 1 | $ | 4 | $ | 1,873 | $ | 2,360 | |||||||||
16
An analysis of the allowance for credit losses and investment in financing receivables in millions of dollars during the periods follows:
Retail Notes | Revolving | ||||||||||||
& Financing | Charge | Wholesale | |||||||||||
Leases | Accounts | Receivables | Total | ||||||||||
Three Months Ended April 30, 2023 | |||||||||||||
Allowance: |
|
|
|
|
|
|
|
|
|
|
| ||
Beginning of period balance |
| $ | 140 |
| $ | 16 | $ | 4 | $ | 160 | |||
Provision | 30 | 8 |
| 38 | |||||||||
Write-offs | (19) | (11) |
| (30) | |||||||||
Recoveries | 6 | 6 |
| 12 | |||||||||
End of period balance |
| $ | 157 |
| $ | 19 | $ | 4 | $ | 180 | |||
Six Months Ended April 30, 2023 | |||||||||||||
Allowance: |
| ||||||||||||
Beginning of period balance |
| $ | 299 |
| $ | 22 | $ | 4 | $ | 325 | |||
Provision | 45 | 4 |
| 49 | |||||||||
Provision transferred to held for sale | (142) |
|
| (142) | |||||||||
Provision (credit) subtotal | (97) | 4 |
| (93) | |||||||||
Write-offs | (37) | (18) |
| (55) | |||||||||
Recoveries | 10 | 11 |
| 21 | |||||||||
Translation adjustments | (18) |
|
| (18) | |||||||||
End of period balance |
| $ | 157 |
| $ | 19 | $ | 4 | $ | 180 | |||
Financing receivables: | |||||||||||||
End of period balance |
| $ | 36,159 |
| $ | 3,783 | $ | 4,851 | $ | 44,793 | |||
Retail Notes | Revolving |
| |||||||||||
& Financing | Charge | Wholesale |
| ||||||||||
Leases | Accounts | Receivables | Total | ||||||||||
Three Months Ended May 1, 2022 | |||||||||||||
Allowance: |
|
|
|
|
|
|
|
| |||||
Beginning of period balance | $ | 138 |
| $ | 15 | $ | 5 | $ | 158 | ||||
Provision |
| 39 | 3 |
|
| 42 | |||||||
Write-offs |
| (18) | (8) |
|
| (26) | |||||||
Recoveries |
| 5 | 7 |
|
| 12 | |||||||
Translation adjustments |
| 4 |
|
|
| 4 | |||||||
End of period balance | $ | 168 | $ | 17 | $ | 5 | $ | 190 | |||||
Six Months Ended May 1, 2022 | |||||||||||||
Allowance: |
|
|
|
|
|
|
|
|
|
| |||
Beginning of period balance | $ | 138 |
| $ | 21 | $ | 7 | $ | 166 | ||||
Provision (credit) |
| 52 | (7) | (2) | 43 | ||||||||
Write-offs |
| (35) | (12) |
| (47) | ||||||||
Recoveries |
| 9 | 15 |
| 24 | ||||||||
Translation adjustments | 4 |
|
|
| 4 | ||||||||
End of period balance | $ | 168 | $ | 17 | $ | 5 | $ | 190 | |||||
Financing receivables: | |||||||||||||
End of period balance | $ | 32,481 |
| $ | 3,507 | $ | 2,360 | $ | 38,348 | ||||
In the first quarter of 2023, the Company determined that the financial services business in Russia met the held for sale criteria. The financing receivables in Russia were reclassified to “Other assets” and the associated allowance for credit losses was reversed in the first quarter of 2023. These operations were sold in the second quarter of 2023 (see Note 20).
Excluding the portfolio in Russia, the allowance for credit losses increased in the second quarter and the first six months of 2023 mainly due to higher portfolio balances and higher expected losses on turf and construction financing receivables. As part of the allowance setting process, the Company continues to monitor the economy, including potential impacts of inflation and interest rates, among other factors, on portfolio performance and adjustments to the allowance are incorporated, as necessary.
17
(9) Securitization of Financing Receivables
As a part of its overall funding strategy, the Company periodically transfers certain financing receivables (retail notes) into VIEs that are special purpose entities (SPEs), or non-VIE banking operations, as part of its asset-backed securities programs (securitizations). The structure of these transactions is such that the transfer of the retail notes does not meet the accounting criteria for sales of receivables, and is, therefore, accounted for as a secured borrowing. SPEs utilized in securitizations of retail notes differ from other entities included in the Company’s consolidated statements because the assets they hold are legally isolated. Use of the assets held by the SPEs or the non-VIEs is restricted by terms of the documents governing the securitization transactions.
The components of consolidated restricted assets, secured borrowings, and other liabilities related to secured borrowings in securitization transactions were as follows in millions of dollars:
| April 30 |
| October 30 |
| May 1 |
| ||||
2023 | 2022 | 2022 |
| |||||||
Financing receivables securitized (retail notes) |
| $ | 5,674 | $ | 5,952 | $ | 4,085 | |||
Allowance for credit losses | (15) |
| (16) |
| (12) | |||||
Other assets (primarily restricted cash) | 115 |
| 155 |
| 124 | |||||
Total restricted securitized assets |
| $ | 5,774 | $ | 6,091 | $ | 4,197 | |||
Short-term securitization borrowings | $ | 5,379 | $ | 5,711 | $ | 4,006 | ||||
Accrued interest on borrowings | 8 | 6 |
| 2 | ||||||
Total liabilities related to restricted securitized assets | $ | 5,387 | $ | 5,717 | $ | 4,008 | ||||
(10) Inventories
A majority of inventory owned by Deere & Company and its U.S. equipment subsidiaries are valued at cost on the “last-in, first-out” (LIFO) basis. If all of the Company’s inventories had been valued on a “first-in, first-out” (FIFO) basis, estimated inventories by major classification in millions of dollars would have been as follows:
| April 30 |
| October 30 |
| May 1 |
| ||||
2023 | 2022 | 2022 |
| |||||||
Raw materials and supplies |
| $ | 4,647 | $ | 4,442 | $ | 4,384 | |||
Work-in-process | 1,262 |
| 1,190 |
| 1,640 | |||||
Finished goods and parts | 6,435 |
| 5,363 |
| 5,434 | |||||
Total FIFO value | 12,344 |
| 10,995 |
| 11,458 | |||||
Less adjustment to LIFO value | 2,631 |
| 2,500 |
| 2,428 | |||||
Inventories |
| $ | 9,713 | $ | 8,495 | $ | 9,030 | |||
(11) Goodwill and Other Intangible Assets–Net
The changes in amounts of goodwill by operating segments were as follows in millions of dollars:
| Production & |
| Small Ag |
| Construction |
|
| ||||||
Precision Ag | & Turf | & Forestry | Total |
| |||||||||
Goodwill at October 31, 2021 | $ | 542 | $ | 265 | $ | 2,484 | $ | 3,291 | |||||
Acquisitions |
| 122 | 69 | 600 | 791 | ||||||||
Translation adjustments |
| (11) | (7) | (252) | (270) | ||||||||
Goodwill at May 1, 2022 | $ | 653 | $ | 327 | $ | 2,832 | $ | 3,812 | |||||
Goodwill at October 30, 2022 | $ | 646 | $ | 318 | $ | 2,723 | $ | 3,687 | |||||
Acquisition | 41 |
|
| 41 | |||||||||
Translation adjustments | 18 | 8 | 209 | 235 | |||||||||
Goodwill at April 30, 2023 | $ | 705 | $ | 326 | $ | 2,932 | $ | 3,963 | |||||
There were no accumulated goodwill impairment losses in the reported periods.
18
The components of other intangible assets were as follows in millions of dollars:
| April 30 |
| October 30 |
| May 1 |
| ||||
2023 | 2022 | 2022 |
| |||||||
Amortized intangible assets: | ||||||||||
Customer lists and relationships | $ | 525 | $ | 493 | $ | 520 | ||||
Technology, patents, trademarks, and other | 1,397 |
| 1,301 |
| 1,350 | |||||
Total at cost | 1,922 |
| 1,794 |
| 1,870 | |||||
Less accumulated amortization: |
|
| ||||||||
Customer lists and relationships | 193 | 166 | 158 | |||||||
Technology, patents, trademarks, and other | 507 | 410 | 360 | |||||||
Total accumulated amortization | 700 | 576 | 518 | |||||||
Other intangible assets – net | $ | 1,222 | $ | 1,218 | $ | 1,352 | ||||
The amortization of other intangible assets in the second quarter and the first six months of 2023 was $45 million and $84 million, and for the second quarter and the first six months of 2022 was $34 million and $62 million, respectively. The estimated amortization expense for the next five years is as follows in millions of dollars: remainder of 2023 – $88, 2024 – $168, 2025 – $139, 2026 – $120, 2027 – $119, and 2028 –$86.
(12) Short-Term Borrowings
Short-term borrowings were as follows in millions of dollars:
April 30 | October 30 | May 1 | ||||||||
| 2023 |
| 2022 |
| 2022 | |||||
Commercial paper | $ | 9,184 | $ | 4,703 | $ | 3,403 | ||||
Notes payable to banks | 284 | 402 | 555 | |||||||
Finance lease obligations due within one year | 23 | 21 | 21 | |||||||
Long-term borrowings due within one year |
| 7,618 |
| 7,466 |
| 8,434 | ||||
Short-term borrowings | $ | 17,109 | $ | 12,592 | $ | 12,413 | ||||
(13) Accounts Payable and Accrued Expenses
Accounts payable and accrued expenses were as follows in millions of dollars:
| April 30 |
| October 30 |
| May 1 |
| ||||
| 2023 |
| 2022 | 2022 | ||||||
Accounts payable: | ||||||||||
Trade payables |
| $ | 3,680 |
| $ | 3,894 | $ | 3,631 | ||
Payables to unconsolidated affiliates | 9 | 11 | 7 | |||||||
Dividends payable |
| 371 |
| 343 |
| 325 | ||||
294 | 302 | 260 | ||||||||
Deposits withheld from dealers and merchants | 157 | 163 | 150 | |||||||
Other |
| 131 |
| 214 |
| 163 | ||||
Accrued expenses: | ||||||||||
Dealer sales discounts |
| 605 |
| 1,044 |
| 400 | ||||
Product warranties |
| 1,562 |
| 1,427 |
| 1,286 | ||||
Employee benefits |
| 1,475 |
| 1,528 |
| 1,069 | ||||
Accrued taxes | 1,691 | 1,255 | 1,150 | |||||||
Unearned operating lease revenue | 441 | 399 | 391 | |||||||
Unearned revenue (contractual liability) |
| 673 |
| 557 |
| 614 | ||||
Extended warranty premium | 949 | 866 | 809 | |||||||
Accrued interest | 354 | 288 | 256 | |||||||
Derivative liabilities | 758 | 1,231 | 780 | |||||||
Other |
| 1,566 |
| 1,300 |
| 1,388 | ||||
Total accounts payable and accrued expenses |
| $ | 14,716 |
| $ | 14,822 | $ | 12,679 | ||
Amounts are presented net of eliminations, which primarily consist of dealer sales incentives with a right of set-off against trade receivables of $1,979 million at April 30, 2023, $1,280 million at October 30, 2022, and $1,173 million at May 1, 2022. Other eliminations were made for accrued taxes and other accrued expenses.
19
(14) Long-Term Borrowings
Long-term borrowings were as follows in millions of dollars:
April 30 | October 30 | May 1 | ||||||||
| 2023 |
| 2022 |
| 2022 | |||||
Underwritten term debt |
|
|
| |||||||
U.S. dollar notes and debentures: | ||||||||||
2.75% notes due 2025 | $ | 700 | $ | 700 | $ | 700 | ||||
6.55% debentures due 2028 |
| 200 |
| 200 |
| 200 | ||||
5.375% notes due 2029 |
| 500 |
| 500 |
| 500 | ||||
3.10% notes due 2030 | 700 | 700 | 700 | |||||||
8.10% debentures due 2030 |
| 250 |
| 250 |
| 250 | ||||
7.125% notes due 2031 |
| 300 |
| 300 |
| 300 | ||||
3.90% notes due 2042 |
| 1,250 |
| 1,250 |
| 1,250 | ||||
2.875% notes due 2049 | 500 | 500 | 500 | |||||||
3.75% notes due 2050 | 850 | 850 | 850 | |||||||
Euro notes: | ||||||||||
.5% notes due 2023 (€500 principal) |
| 525 | ||||||||
1.375% notes due 2024 (€800 principal) |
| 797 | 840 | |||||||
1.85% notes due 2028 (€600 principal) | 662 | 598 | 630 | |||||||
2.20% notes due 2032 (€600 principal) | 662 | 598 | 630 | |||||||
1.65% notes due 2039 (€650 principal) | 717 | 648 | 682 | |||||||
Serial issuances | ||||||||||
Medium-term notes: (principal as of: April 30, 2023 - $27,428, October 30, 2022 - $25,629, May 1, 2022 - $23,247) |
| 26,734 | 24,604 | 22,740 | ||||||
Other notes and finance lease obligations |
| 1,707 |
| 1,223 |
| 1,266 | ||||
Less debt issuance costs and debt discounts | (121) | (122) | (116) | |||||||
Long-term borrowings |
| $ | 35,611 | $ | 33,596 | $ | 32,447 | |||
Medium-term notes serially due through 2032 are primarily offered by prospectus and issued at fixed and variable rates. These notes are presented in the table above with fair value adjustments related to interest rate swaps. All outstanding notes and debentures are senior unsecured borrowings and rank equally with each other.
(15) Leases - Lessor
The Company leases equipment manufactured or sold by the Company and a limited amount of non-John Deere equipment to retail customers through sales-type, direct financing, and operating leases. Sales-type and direct financing leases are reported in Financing receivables – net on the consolidated balance sheets, while operating leases are reported in Equipment on operating leases – net.
Lease revenues earned by the Company were as follows in millions of dollars:
Three Months Ended | Six Months Ended | ||||||||||||
| April 30, 2023 |
| May 1, 2022 |
| April 30, 2023 |
| May 1, 2022 | ||||||
Sales-type and direct finance lease revenues | $ | 37 | $ | 35 | $ | 79 | $ | 74 | |||||
Operating lease revenues | 321 | 330 | 642 | 665 | |||||||||
Variable lease revenues | 5 | 7 | 11 | 14 | |||||||||
Total lease revenues | $ | 363 | $ | 372 | $ | 732 | $ | 753 | |||||
(16) Commitments and Contingencies
The Company determines its total warranty liability by applying historical claims rate experience to the estimated amount of equipment that has been sold and is still under warranty based on dealer inventories and retail sales. The historical claims rate is determined by a review of five-year claims costs and current quality developments.
The premiums for extended warranties are recognized in other income in the statements of consolidated income in proportion to the costs expected to be incurred over the contract period. The unamortized extended warranty premiums (deferred revenue) included in the following table totaled $949 million and $809 million at April 30, 2023 and May 1, 2022, respectively.
20
A reconciliation of the changes in the warranty liability and unearned premiums was as follows in millions of dollars:
Three Months Ended | Six Months Ended |
| |||||||||||
April 30 | May 1 | April 30 | May 1 |
| |||||||||
2023 | 2022 | 2023 | 2022 |
| |||||||||
Beginning of period balance |
| $ | 2,345 |
| $ | 2,064 |
| $ | 2,293 |
| $ | 2,086 | |
Payments | (274) |
| (224) | (537) |
| (417) | |||||||
Amortization of premiums received | (63) |
| (64) | (146) |
| (130) | |||||||
Accruals for warranties | 392 |
| 223 | 647 |
| 404 | |||||||
Premiums received | 108 |
| 91 | 215 |
| 174 | |||||||
Foreign exchange | 3 |
| 5 | 39 |
| (22) | |||||||
End of period balance | $ | 2,511 | $ | 2,095 | $ | 2,511 | $ | 2,095 | |||||
At April 30, 2023, the Company had $207 million of guarantees issued to banks outside the U.S. and Canada related to third-party receivables for the retail financing of John Deere equipment. The Company may recover a portion of any required payments incurred under these agreements from repossession of the equipment collateralizing the receivables. At April 30, 2023, the accrued losses under these agreements were not material.
At April 30, 2023, the Company had commitments of $524 million for the construction and acquisition of property and equipment. Also, at April 30, 2023, the Company had restricted assets of $189 million, classified as Other assets.
The Company also had other miscellaneous contingent liabilities and guarantees totaling approximately $65 million at April 30, 2023. The accrued liability for these contingencies was not material at April 30, 2023.
The Company is subject to various unresolved legal actions which arise in the normal course of its business, the most prevalent of which relate to product liability (including asbestos-related liability), retail credit, employment, patent, trademark, and antitrust matters. The Company believes the reasonably possible range of losses for these unresolved legal actions would not have a material effect on its consolidated financial statements.
(17) Fair Value Measurements
The fair values of financial instruments that do not approximate the carrying values were as follows in millions of dollars. Long-term borrowings exclude finance lease liabilities.
April 30, 2023 | October 30, 2022 | May 1, 2022 |
| ||||||||||||||||
Carrying | Fair | Carrying | Fair | Carrying | Fair |
| |||||||||||||
Financing receivables – net | $ | 38,954 | $ | 38,337 | $ | 36,634 | $ | 35,526 | $ | 34,085 | $ | 33,540 | |||||||
Financing receivables securitized – net | 5,659 | 5,494 | 5,936 | 5,698 | 4,073 | 4,016 | |||||||||||||
Short-term securitization borrowings | 5,379 | 5,271 | 5,711 | 5,577 | 4,006 | 3,944 | |||||||||||||
Long-term borrowings due within one year | 7,618 | 7,461 | 7,466 | 7,322 | 8,434 | 8,398 | |||||||||||||
Long-term borrowings | 35,571 | 34,802 | 33,566 | 31,852 | 32,410 | 31,975 | |||||||||||||
Fair value measurements above were Level 3 for all financing receivables and Level 2 for all borrowings.
Fair values of the financing receivables that were issued long-term were based on the discounted values of their related cash flows at interest rates currently being offered by the Company for similar financing receivables. The fair values of the remaining financing receivables approximated the carrying amounts.
Fair values of long-term borrowings and short-term securitization borrowings were based on current market quotes for identical or similar borrowings and credit risk, or on the discounted values of their related cash flows at current market interest rates. Certain long-term borrowings have been swapped to current variable interest rates. The carrying values of these long-term borrowings included adjustments related to fair value hedges.
21
Assets and liabilities measured at fair value on a recurring basis in millions of dollars follow, excluding the Company’s cash equivalents, which were carried at cost that approximates fair value and consisted of money market funds and time deposits.
| April 30 |
| October 30 |
| May 1 |
| ||||
2023 | 2022 | 2022 |
| |||||||
Level 1: | ||||||||||
Marketable securities | ||||||||||
International equity securities | $ | 2 | $ | 3 | $ | 2 | ||||
International mutual funds | 11 | |||||||||
U.S. equity fund | 92 | 70 | 65 | |||||||
U.S. fixed income fund | 97 |
|
|
|
| |||||
U.S. government debt securities | 64 |
| 62 |
| 59 | |||||
Total Level 1 marketable securities | 266 | 135 | 126 | |||||||
Level 2: | ||||||||||
Marketable securities | ||||||||||
U.S. government debt securities | 138 | 121 | 130 | |||||||
Municipal debt securities | 70 |
| 63 |
| 67 | |||||
Corporate debt securities | 213 |
| 200 |
| 206 | |||||
International debt securities | 1 | 60 | 2 | |||||||
Mortgage-backed securities | 168 |
| 155 |
| 151 | |||||
Total Level 2 marketable securities | 590 |
| 599 |
| 556 | |||||
Other assets - Derivatives |
| 367 | 373 | 407 | ||||||
Accounts payable and accrued expenses - Derivatives |
| 758 | 1,231 | 780 | ||||||
Level 3: | ||||||||||
Accounts payable and accrued expenses - Deferred consideration | 214 | 236 | 262 | |||||||
The contractual maturities of debt securities at April 30, 2023 in millions of dollars are shown below. Actual maturities may differ from contractual maturities because some securities may be called or prepaid. Unrealized losses were not recognized in income due to the ability and intent to hold to maturity. Because of the potential for prepayment on mortgage-backed securities, they are not categorized by contractual maturity.
Amortized | Fair | ||||||
Cost | Value | ||||||
Due in one year or less |
| $ | 25 | | $ | 25 | |
Due after one through five years | 123 | 116 | |||||
Due after five through 10 years | 192 | 171 | |||||
Due after 10 years | 206 | 174 | |||||
Mortgage-backed securities | 193 | 168 | |||||
Debt securities |
| $ | 739 |
| $ | 654 | |
Fair value, nonrecurring Level 3 measurements from impairments, excluding financing receivables with specific allowances which were not significant, were as follows in millions of dollars. Inventories and property and equipment – net fair values for October 30, 2022 represent the fair value assessment at May 1, 2022.
Fair Value | Losses | |||||||||||||||||||||
Three Months Ended | Six Months Ended | |||||||||||||||||||||
April 30 | October 30 | May 1 | April 30 | May 1 | April 30 | May 1 | ||||||||||||||||
| 2023 |
| 2022 |
| 2022 |
| 2023 |
| 2022 |
| 2023 |
| 2022 |
| ||||||||
Inventories |
| $ | 19 | $ | 19 |
| $ | 8 |
| $ | 8 | |||||||||||
| 15 | 15 |
| 41 |
| 41 | ||||||||||||||||
| 28 |
| 28 | |||||||||||||||||||
The following is a description of the valuation methodologies the Company uses to measure certain financial instruments on the balance sheet at fair value:
Marketable securities – The portfolio of investments is valued on a market approach (matrix pricing model) in which all significant inputs are observable or can be derived from or corroborated by observable market data such as interest rates, yield curves, volatilities, credit risk, and prepayment speeds. Funds are valued using closing prices in the active market in which the investment trades.
22
Derivatives – The Company’s derivative financial instruments consist of interest rate contracts (swaps), foreign currency exchange contracts (futures, forwards, and swaps), and cross-currency interest rate contracts (swaps). The portfolio is valued based on an income approach (discounted cash flow) using market observable inputs, including swap curves and both forward and spot exchange rates for currencies.
Financing receivables – Specific reserve impairments are based on the fair value of the collateral, which is measured using a market approach (appraisal values or realizable values).
Inventories – The impairment was based on net realizable value.
Property and equipment - net – The valuations were based on cost and market approaches. The inputs include replacement cost estimates adjusted for physical deterioration and economic obsolescence.
Other intangible assets - net – The Company considered external valuations based on the Company’s probability weighted cash flow analysis.
(18) Derivative Instruments
The Company’s policy is to execute derivative transactions to manage exposures arising in the normal course of business and not for the purpose of creating speculative positions or trading. The financial services operations manage the relationship of the types and amounts of their funding sources to their receivable and lease portfolio in an effort to diminish risk due to interest rate and foreign currency fluctuations, while responding to favorable financing opportunities. The Company also has foreign currency exposures at some of its foreign and domestic operations related to buying, selling, and financing in currencies other than the functional currencies. In addition, the Company has interest rate and foreign currency exposure at certain equipment operations units for sales incentive programs.
All derivatives are recorded at fair value on the balance sheets. Cash collateral received or paid is not offset against the derivative fair values on the balance sheet. The cash flows from the derivative contracts were recorded in operating activities in the statements of consolidated cash flows. Each derivative is designated as a cash flow hedge, a fair value hedge, or remains undesignated. All designated hedges are formally documented as to the relationship with the hedged item as well as the risk-management strategy. Both at inception and on an ongoing basis the hedging instrument is assessed as to its effectiveness. If and when a derivative is determined not to be highly effective as a hedge, the underlying hedged transaction is no longer likely to occur, the hedge designation is removed, or the derivative is terminated, hedge accounting is discontinued.
Cash Flow Hedges
Certain interest rate contracts (swaps) were designated as hedges of future cash flows from borrowings. The total notional amounts of the receive-variable/pay-fixed interest rate contracts at April 30, 2023, October 30, 2022, and May 1, 2022 were $2,250 million, $1,950 million, and $2,450 million, respectively. Fair value gains or losses on cash flow hedges were recorded in other comprehensive income (OCI) and are subsequently reclassified into interest expense in the same periods during which the hedged transactions impact earnings. These amounts offset the effects of interest rate changes on the related borrowings.
The amount of gain recorded in OCI at April 30, 2023 that is expected to be reclassified to interest expense in the next twelve months if interest rates remain unchanged is approximately $30 million after-tax. No gains or losses were reclassified from OCI to earnings based on the probability that the original forecasted transaction would not occur.
Fair Value Hedges
Certain interest rate contracts (swaps) were designated as fair value hedges of borrowings. The total notional amounts of the receive-fixed/pay-variable interest rate contracts at April 30, 2023, October 30, 2022, and May 1, 2022 were $10,943 million, $10,112 million, and $8,655 million, respectively. The fair value gains or losses on these contracts were generally offset by fair value gains or losses on the hedged items (fixed-rate borrowings) with both items recorded in interest expense.
23
The amounts recorded in the consolidated balance sheet related to borrowings designated in fair value hedging relationships were as follows in millions of dollars. Fair value hedging adjustments are included in the carrying amount of the hedged item.
Active Hedging Relationships | Discontinued Hedging Relationships | ||||||||||||
Carrying Amount | Cumulative Fair Value | Carrying Amount of | Cumulative Fair Value | ||||||||||
of Hedged Item | Hedging Amount | Formerly Hedged Item | Hedging Amount | ||||||||||
April 30, 2023 | |||||||||||||
Short-term borrowings | $ | 1,213 | $ | 14 | |||||||||
Long-term borrowings | $ | 10,334 | $ | (562) | 5,657 | (132) | |||||||
October 30, 2022 | |||||||||||||
Short-term borrowings | $ | 2,515 | $ | 15 | |||||||||
Long-term borrowings | $ | 9,060 | $ | (1,006) | 5,520 | (19) | |||||||
May 1, 2022 | |||||||||||||
Short-term borrowings | $ | 178 | $ | 1 | $ | 2,607 | $ | 7 | |||||
Long-term borrowings | 7,827 | (613) | 5,120 | 106 | |||||||||
Derivatives Not Designated as Hedging Instruments
The Company has certain interest rate contracts (swaps), foreign currency exchange contracts (futures, forwards, and swaps), and cross-currency interest rate contracts (swaps), which were not formally designated as hedges. These derivatives were held as economic hedges for underlying interest rate or foreign currency exposures for certain borrowings, purchases or sales of inventory, and sales incentive programs. The total notional amounts of these interest rate swaps at April 30, 2023, October 30, 2022, and May 1, 2022 were $11,956 million, $10,568 million, and $9,912 million, the foreign exchange contracts were $9,163 million, $8,185 million, and $7,640 million, and the cross-currency interest rate contracts were $163 million, $260 million, and $264 million, respectively. The fair value gains or losses from derivatives not designated as hedging instruments were recorded in the statements of consolidated income, generally offsetting over time the exposure on the hedged item.
Fair values of derivative instruments in the condensed consolidated balance sheets were as follows in millions of dollars:
| April 30 |
| October 30 |
| May 1 |
| ||||
Other Assets | 2023 | 2022 | 2022 |
| ||||||
Designated as hedging instruments: | ||||||||||
Interest rate contracts |
| $ | 104 | $ | 87 | $ | 63 | |||
| ||||||||||
Not designated as hedging instruments: | ||||||||||
Interest rate contracts | 171 |
| 212 |
| 180 | |||||
Foreign exchange contracts | 91 |
| 66 |
| 125 | |||||
Cross-currency interest rate contracts | 1 |
| 8 |
| 39 | |||||
Total not designated | 263 |
| 286 |
| 344 | |||||
| ||||||||||
Total derivative assets |
| $ | 367 | $ | 373 | $ | 407 | |||
| ||||||||||
Accounts Payable and Accrued Expenses | ||||||||||
Designated as hedging instruments: | ||||||||||
Interest rate contracts |
| $ | 611 | $ | 1,004 | $ | 591 | |||
| ||||||||||
Not designated as hedging instruments: | ||||||||||
Interest rate contracts | 91 | 107 | 75 | |||||||
Foreign exchange contracts | 42 |
| 118 |
| 114 | |||||
Cross-currency interest rate contracts | 14 |
| 2 |
| ||||||
Total not designated | 147 |
| 227 |
| 189 | |||||
| ||||||||||
Total derivative liabilities |
| $ | 758 | $ | 1,231 | $ | 780 | |||
24
The classification and gains (losses) including accrued interest expense related to derivative instruments on the statements of consolidated income consisted of the following in millions of dollars:
Three Months Ended | Six Months Ended |
| |||||||||||
April 30 | May 1 | April 30 | May 1 |
| |||||||||
2023 | 2022 | 2023 | 2022 |
| |||||||||
Fair Value Hedges: |
|
|
|
|
|
|
|
|
| ||||
Interest rate contracts - Interest expense |
| $ | (10) | $ | (514) |
| $ | 229 | $ | (656) | |||
| |||||||||||||
Cash Flow Hedges: | |||||||||||||
Recognized in OCI | |||||||||||||
Interest rate contracts - OCI (pretax) | $ | (4) | $ | 35 | $ | (5) | $ | 50 | |||||
Reclassified from OCI | |||||||||||||
Interest rate contracts - Interest expense | 19 |
| (1) | 34 |
| (3) | |||||||
| |||||||||||||
Not Designated as Hedges: | |||||||||||||
Interest rate contracts - Net sales | $ | 1 | $ | 31 | $ | (6) | $ | 44 | |||||
Interest rate contracts - Interest expense * |
| 5 | 61 |
| (3) | 59 | |||||||
Foreign exchange contracts - Net sales | (2) | (1) | (1) | (1) | |||||||||
Foreign exchange contracts - Cost of sales | 59 |
| (79) | 64 | (80) | ||||||||
Foreign exchange contracts - Other operating expenses * | 127 |
| 26 | (15) |
| 173 | |||||||
Total not designated |
| $ | 190 | $ | 38 |
| $ | 39 | $ | 195 | |||
* Includes interest and foreign exchange gains (losses) from cross-currency interest rate contracts.
Counterparty Risk and Collateral
Derivative instruments are subject to significant concentrations of credit risk to the banking sector. The Company manages individual counterparty exposure by setting limits that consider the credit rating of the counterparty, the credit default swap spread of the counterparty, and other financial commitments and exposures between the Company and the counterparty banks. All interest rate derivatives are transacted under International Swaps and Derivatives Association (ISDA) documentation. Some of these agreements include credit support provisions. Each master agreement permits the net settlement of amounts owed in the event of default or termination.
Certain of the Company’s derivative agreements contain credit support provisions that may require the Company to post collateral based on the size of the net liability positions and credit ratings. The aggregate fair value of all derivatives with credit-risk-related contingent features that were in a net liability position at April 30, 2023, October 30, 2022, and May 1, 2022, was $716 million, $1,113 million, and $673 million, respectively. In accordance with the limits established in these agreements, the Company posted $308 million, $701 million, and $254 million of cash collateral at April 30, 2023, October 30, 2022, and May 1, 2022, respectively. In addition, the Company paid $8 million of collateral that was outstanding at April 30, 2023, October 30, 2022, and May 1, 2022 to participate in an international futures market to hedge currency exposure, not included in the table below.
Derivatives are recorded without offsetting for netting arrangements or collateral. The impact on the derivative assets and liabilities related to netting arrangements and any collateral received or paid in millions of dollars follows:
Gross Amounts | Netting |
| |||||||||||
April 30, 2023 |
| Recognized |
| Arrangements |
| Collateral |
| Net Amount |
| ||||
Assets |
| $ | 367 |
| $ | (168) |
| $ | (29) |
| $ | 170 | |
Liabilities | 758 | (168) | (308) | 282 | |||||||||
Gross Amounts | Netting |
| |||||||||||
October 30, 2022 |
| Recognized |
| Arrangements |
| Collateral |
| Net Amount |
| ||||
Assets | $ | 373 |
| $ | (179) | $ | (54) |
| $ | 140 | |||
Liabilities | 1,231 | (179) | (701) | 351 | |||||||||
| Gross Amounts |
| Netting |
|
|
| |||||||
May 1, 2022 | Recognized | Arrangements | Collateral | Net Amount |
| ||||||||
Assets | $ | 407 | $ | (110) | $ | 297 | |||||||
Liabilities |
| 780 |
| (110) | $ | (254) |
| 416 | |||||
25
(19) Stock Option and Restricted Stock Unit Awards
In December 2022, the Company granted stock options to employees for the purchase of 161 thousand shares of common stock at an exercise price of $438.44 per share and a binomial lattice model fair value of $136.46 per share at the grant date. At April 30, 2023, options for 1.9 million shares were outstanding with a weighted-average exercise price of $181.91 per share. The Company also granted 117 thousand of service-based restricted stock units and 41 thousand of performance/service-based restricted stock units to employees in the first six months of 2023. The weighted-average fair value of the service-based restricted stock units at the grant date was $433.30 per unit based on the market price of a share of underlying common stock. The fair value of the performance/service-based restricted stock units at the grant date was $424.93 per unit based on the market price of a share of underlying common stock excluding dividends. At April 30, 2023, the Company was authorized to grant awards for an additional 16.6 million shares under the equity incentive plans.
(20) Disposition
On March 7, 2023, the Company sold its financial services business in Russia (registered in Russia as a leasing company) to Insight Investment Group. The total proceeds, net of restricted cash sold, were $36 million. The operations were included in the Company’s financial services operating segment through the date of sale. At the disposal date, the total assets were $31 million, consisting primarily of financing receivables, the total liabilities were $5 million, and the cumulative translation loss was $10 million. The Company did not incur additional gains or losses upon disposition. At January 29, 2023, the assets and liabilities were classified as “” and “Accounts payable and accrued expenses”, respectively, which included $100 million of restricted cash. In the first quarter of 2023, the Company reversed the allowance for credit losses and recorded a valuation allowance on the assets held for sale in “Selling, administrative and general expenses.”
(21) Special Items
2023
Financial Services Financing Incentives Correction
In the second quarter of 2023, the Company corrected the for financing incentives offered to John Deere dealers, which impacted the timing of expense recognition and the presentation of incentive costs in the consolidated financial statements. The cumulative effect of this correction, $173 million pretax ($135 million after-tax), was recorded in the second quarter of 2023. Prior period results for Deere & Company were not restated, as the adjustment is considered immaterial to the Company’s financial statements.
2022
Impact of Events in Russia / Ukraine
In the second quarter of 2022, the Company suspended shipments of machines and service parts to Russia. The suspension of shipments to Russia reduced actual and forecasted revenue for the region, which made it probable future cash flows will not cover the carrying value of certain assets. The accounting consequences during the second quarter of 2022 were impairments of most long-lived assets, an increase in reserves of certain financial assets, and an accrual for various contractual uncertainties.
Gain on Previously Held Equity Investment
In the second quarter of 2022, the Company acquired full ownership of three former Deere-Hitachi joint venture factories and began new license and supply agreements with Hitachi Construction Machinery Co., Ltd. The fair value of the previous equity investment resulted in a non-cash gain of $326 million (pretax and ).
UAW Collective Bargaining Agreement
In the first quarter of 2022, employees represented by the International Union, United Automobile, Aerospace and Agricultural Implement Workers of America (UAW) approved a new collective bargaining agreement. The labor agreement included a lump sum ratification bonus payment of $8,500 per eligible employee, totaling $90 million, and an immediate wage increase of 10 percent plus further wage increases over the term of the contract. The lump sum payment was expensed in the first quarter of 2022.
26
The following table summarizes the operating profit impact, in millions of dollars, of the special items recorded for the three months and six months ended April 30, 2023 and May 1, 2022:
Three Months | Six Months | ||||||||||||||||||||||||||||||
PPA |
| SAT |
| CF |
| FS |
| Total | PPA | SAT |
| CF |
| FS |
| Total | |||||||||||||||
2023 Expense: | |||||||||||||||||||||||||||||||
Financing incentive – SA&G expense | $ | 173 | $ | 173 | $ | 173 | $ | 173 | |||||||||||||||||||||||
|
| ||||||||||||||||||||||||||||||
2022 Expense (benefit): | |||||||||||||||||||||||||||||||
Gain on remeasurement of equity investment – Other income | $ | (326) | (326) | $ | (326) | (326) | |||||||||||||||||||||||||
Total Russia/Ukraine events expense | $ | 46 | $ | 1 | 47 | 26 | 120 | $ | 46 | $ | 1 | 47 | 26 | 120 | |||||||||||||||||
UAW ratification bonus – Cost of sales | 53 | 9 | 28 | 90 | |||||||||||||||||||||||||||
Total 2022 expense (benefit) | 46 | 1 | (279) | 26 | (206) | 99 | 10 | (251) | 26 | (116) | |||||||||||||||||||||
Period over period change | $ | (46) | $ | (1) | $ | 279 | $ | 147 | $ | 379 | $ | (99) | $ | (10) | $ | 251 | $ | 147 | $ | 289 | |||||||||||
(22) Subsequent Events
On May 22, 2023, the Company entered into a retail note securitization using its revolving warehouse facility that resulted in securitization borrowings of $589 million.
On May 31, 2023, the Company’s Board of Directors declared a quarterly dividend of $1.25 per share payable on August 8, 2023, to stockholders of record on June 30, 2023.
27
Item 2. MANAGEMENT’S DISCUSSION AND ANALYSIS OF FINANCIAL CONDITION AND RESULTS OF OPERATIONS
RESULTS OF OPERATIONS
Overview
Organization
The Company generates net sales from the sale of equipment to John Deere dealers and distributors. The Company manufactures and distributes a full line of agricultural equipment; a variety of commercial and consumer equipment; and a broad range of equipment for construction, roadbuilding, and forestry. These operations (collectively known as the “equipment operations”) are managed through the production and precision agriculture, small agriculture and turf, and construction and forestry operating segments. The Company’s financial services segment provides credit services, which finance sales and leases of equipment by John Deere dealers. In addition, the financial services segment provides wholesale financing to dealers of the foregoing equipment, finances retail revolving charge accounts, and offers extended equipment warranties.
Smart Industrial Operating Model and Leap Ambitions
The Company’s Smart Industrial operating model is focused on making significant investments, strengthening the Company’s capabilities in digital, automation, autonomy, and alternative propulsion technologies. These technologies are intended to increase worksite efficiency, improve yields, lower input costs, and ease labor constraints. The Company’s Leap Ambitions are goals designed to boost economic value and sustainability for the Company’s customers. The Company anticipates opportunities in this area, as the Company and its customers have a vested interest in sustainable practices.
Trends and Economic Conditions
Industry Trends for Fiscal Year 2023 – Industry sales of large agricultural machinery in the U.S. and Canada for 2023 are forecasted to increase approximately 10 percent compared to 2022. Industry sales of small agricultural and turf equipment in the U.S. and Canada are expected to be down about 5 percent in 2023. Industry sales of agricultural machinery in Europe are forecasted to be flat to up 5 percent, while South American industry sales of tractors and combines are expected to be flat in 2023. Asia industry sales are forecasted to be down moderately in 2023. On an industry basis, the U.S. and Canada construction equipment and compact construction equipment sales are both expected to be flat to up 5 percent in 2023. Global forestry and global roadbuilding industry sales are each expected to be flat.
Company Trends – Customers’ demand for integration of technology into equipment is a market trend underlying the Company’s Smart Industrial operating model and Leap Ambitions framework. Customers have sought to improve profitability, productivity, and sustainability through technology. The Company’s approach to technology involves hardware and software; guidance, connectivity and digital solutions; automation and machine intelligence; machine autonomy; and alternative propulsion technologies. This technology is incorporated into products within each of the Company’s operating segments.
Customers continue to adopt technology integrated in the John Deere portfolio of “smart” machines, systems, and solutions. The Company expects this trend to persist for the foreseeable future.
Demand for the Company’s equipment remains strong, as order books are full throughout 2023. Agricultural fundamentals are expected to remain solid through 2023, and retail demand will comprise most of 2023 sales. The North American retail customer fleet age of combines and large tractors is historically high, and dealer inventories are low due to the manufacturing and supply chain constraints over the past few years. The Company expects elevated demand to continue for the second half of the year as evidenced by retail customer orders that extend into 2024. Crop prices remain favorable to our customers in part due to a stock-to-use ratio below the 10-year average for key grains. The Company expects sales volume of large agricultural equipment to be greater in 2023 than 2022 in North America and Europe. Sales volume for small agriculture and turf equipment is expected to be lower than 2022 due to lower demand for consumer-oriented products, partially offset by stronger demand for mid-sized equipment. Construction equipment markets are forecasted to be steady. Strong U.S. infrastructure spending, industrial construction, and rental inventory restocking are expected to more than offset moderation in residential home and commercial real estate construction. Importantly, construction equipment dealer inventory remains below historical averages. Roadbuilding demand remains strongest in the U.S., largely offset by softening demand in Europe and parts of Asia. Net income for the Company’s financial services operations is expected to be lower than
28
fiscal year 2022 due to less-favorable financing spreads, the correction of the accounting treatment for financing incentives offered to John Deere dealers, unfavorable derivative market valuation adjustments, a higher provision for credit losses, higher selling, administrative and general expenses, and lower gains on operating-lease dispositions. These factors are expected to be partially offset by income earned on higher average portfolio balances.
Additional Trends – Supply chain conditions have improved over 2022; however, the Company continues to experience disruptions above historical norms. Supply chain disruptions impacted many aspects of the business starting in 2022, including parts availability, increased production costs, and higher inventory levels. Past due deliveries from suppliers were at elevated levels during 2022. The Company implemented the following mitigation efforts to minimize the impact of supply chain disruptions on its ability to meet customer demand:
•Worked with the supply base to obtain allocations and improve on-time deliveries of parts.
•Multi-sourced some parts and materials.
•Provided resources to suppliers to address constraints.
•Entered into long-term contracts for some critical components.
•Utilized alternative freight carriers to expedite delivery.
The Company has experienced supply chain improvements in the second quarter of 2023. The reduction in supply chain disruptions contributed to higher levels of production in the second quarter of 2023. However, remaining constraints in the supply base will limit higher levels of production in the second half of the year. As a result, the production schedules in 2023 will be more aligned with the customers’ seasonal use of the Company’s products, marking a return to historical seasonal production patterns.
Central bank policy interest rates increased in the first six months of 2023. Most retail receivables are fixed rate, while wholesale financing receivables are variable rate. The Company has both fixed and variable rate borrowings. The Company manages the risk of interest rate fluctuations by balancing the types and amounts of its funding sources to its financing receivable and equipment on operating lease portfolios. Accordingly, the Company enters into interest rate swap agreements to manage its interest rate exposure. Historically, rising interest rates impact the Company’s borrowings sooner than the benefit is realized from the financing receivable and equipment on operating lease portfolios. As a result, the Company’s financial services operations experienced $84 million (after-tax) of less favorable financing spreads in the first six months of 2023 compared to 2022. The Company expects spread compression to persist during 2023.
Recent banking sector events have resulted in increased liquidity considerations. The Company’s deposits are well diversified, and as a result, the Company was not materially exposed to banks that have entered receivership or encountered liquidity issues. These events have not changed the Company’s access to capital markets. The Company continues to monitor counterparty exposure through regular reviews of various risk metrics and adjusting exposure limits as needed.
Supply chain disruptions, rising interest rates, and recent banking sector events are driven by factors outside of the Company’s control, and as a result, the Company cannot reasonably foresee when these conditions will subside.
Other Items of Concern and Uncertainties – Other items of concern include global and regional political conditions, failure to raise the U.S. debt ceiling, economic and trade policies, imposition of new or retaliatory tariffs against certain countries or covering certain products, post-pandemic effects, capital market disruptions, changes in demand and pricing for new and used equipment, significant fluctuations in foreign currency exchange rates, and volatility in the prices of many commodities. These items could impact the Company’s results. The Company is making investments in technology and in strengthening its capabilities in digital, automation, autonomy, and alternative propulsion technologies. As with most technology investments, marketplace adoption, monetization, and regulation of these features holds an elevated level of uncertainty.
29
2023 Compared with 2022
Three Months Ended | Six Months Ended | ||||||||||||||||
Deere & Company | April 30 | May 1 | % | April 30 | May 1 | % | |||||||||||
(In millions of dollars, except per share amounts) | 2023 | 2022 | Change | 2023 | 2022 | Change | |||||||||||
Net sales and revenues | $ | 17,387 | $ | 13,370 | +30 | $ | 30,038 | $ | 22,939 | +31 | |||||||
Net income attributable to Deere & Company | 2,860 | 2,098 | +36 | 4,819 | 3,001 | +61 | |||||||||||
Diluted earnings per share | 9.65 | 6.81 | 16.18 | 9.72 | |||||||||||||
Net sales and revenues increased for both the quarter and year-to-date periods due to higher shipment volumes and price realization. See the Business Segment Results for additional details. Net income in each of the periods presented were impacted by special items. See Note 21 for additional details.
An explanation of the cost of sales to net sales ratio and other significant statement of consolidated income changes follows:
Three Months Ended | Six Months Ended | ||||||||||||||||
Deere & Company | April 30 | May 1 | % | April 30 | May 1 | % | |||||||||||
(In millions of dollars) | 2023 | 2022 | Change | 2023 | 2022 | Change | |||||||||||
Cost of sales to net sales | 66.7% | 74.1% | 67.9% | 75.9% | |||||||||||||
Other income | $ | 229 | $ | 540 | -58 | $ | 484 | $ | 779 | -38 | |||||||
Research and development expenses | 547 | 453 | +21 | 1,043 | 855 | +22 | |||||||||||
Selling, administrative and general expenses | 1,330 | 932 | +43 | 2,283 | 1,713 | +33 | |||||||||||
Other operating expenses | 363 | 328 | +11 | 660 | 638 | +3 | |||||||||||
Provision for income taxes | 991 | 461 | +115 | 1,528 | 710 | +115 | |||||||||||
The cost of sales ratio improved in the second quarter and the first six months of fiscal 2023 due to price realization, partially offset by higher production costs. The six months ended May 1, 2022 were also impacted by inefficiencies due to the delayed ratification of the UAW labor agreement and contract-ratification bonus costs (see Note 21). Other income decreased compared to both prior periods due to a non-cash gain on the remeasurement of the previously held equity investment in the Deere-Hitachi joint venture recorded in 2022. Research and development expenses were higher due to continued focus on developing and incorporating technology solutions. Selling, administrative and general expenses increased mostly due to higher employee pay driven by inflationary conditions, profit-sharing incentives, commissions paid to dealers, as well as the cumulative correction of the accounting treatment for financing incentives offered to John Deere dealers. The provision for income taxes was higher as a result of higher pretax income as well as the prior period exclusion of the Deere-Hitachi joint-venture remeasurement gain from tax-effected income.
Business Segment Results
For the equipment operations, higher production costs were mostly due to elevated cost of purchased components, energy, salaries, and wages.
30
Three Months Ended | Six Months Ended | ||||||||||||||||
Production and Precision Agriculture | April 30 | May 1 | % | April 30 | May 1 | % | |||||||||||
(In millions of dollars) | 2023 | 2022 | Change | 2023 | 2022 | Change | |||||||||||
Net sales | $ | 7,822 | $ | 5,117 | +53 | $ | 13,021 | $ | 8,473 | +54 | |||||||
Operating profit | 2,170 | 1,057 | +105 | 3,378 | 1,353 | +150 | |||||||||||
Operating margin | 27.7% | 20.7% | 25.9% | 16.0% | |||||||||||||
Price realization | +20 | +21 | |||||||||||||||
Currency translation impact on Net sales | -3 | -2 | |||||||||||||||
Production and precision agriculture sales increased for the quarter as a result of higher shipment volumes (primarily in the U.S., Brazil, Europe, and Canada) and price realization in most end markets. Operating profit improved primarily due to price realization and improved sales volumes. These items were partially offset by increased selling, administrative and general expenses and research and development expenses, higher production costs, and the unfavorable effects of foreign currency exchange mostly due to a stronger U.S. dollar.
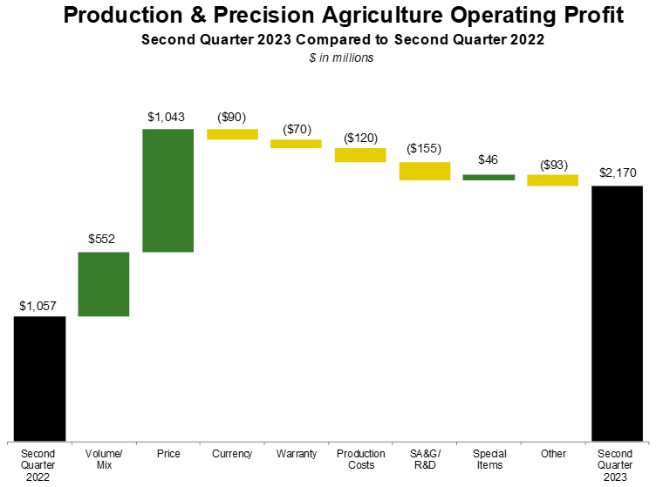
Sales for the first six months increased as a result of higher shipment volumes (primarily in the U.S., Canada, Brazil, and Europe) and price realization. Operating profit for the first six months increased primarily from price realization and higher sales volume. Partially offsetting these factors were higher production costs, higher selling, administrative, and general expenses and research and development expenses, and the unfavorable effects of foreign currency exchange mostly due to a stronger U.S. dollar.
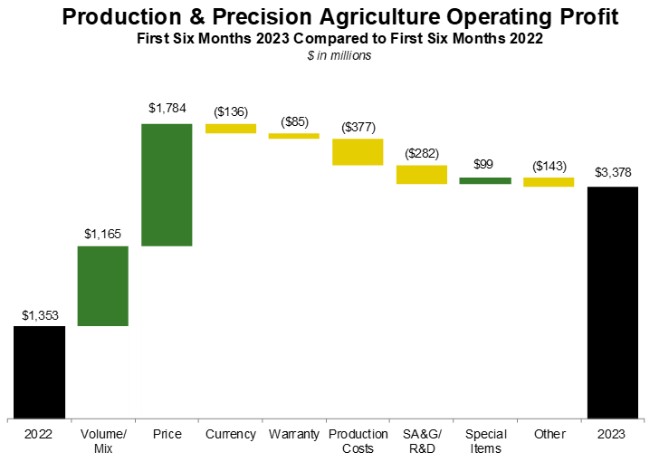
31
Three Months Ended | Six Months Ended | ||||||||||||||||
Small Agriculture and Turf | April 30 | May 1 | % | April 30 | May 1 | % | |||||||||||
(In millions of dollars) | 2023 | 2022 | Change | 2023 | 2022 | Change | |||||||||||
Net sales | $ | 4,145 | $ | 3,570 | +16 | $ | 7,146 | $ | 6,201 | +15 | |||||||
Operating profit | 849 | 520 | +63 | 1,296 | 891 | +45 | |||||||||||
Operating margin | 20.5% | 14.6% | 18.1% | 14.4% | |||||||||||||
Price realization | +12 | +12 | |||||||||||||||
Currency translation impact on Net sales | -2 | -3 | |||||||||||||||
Small agriculture and turf sales increased for the quarter due to price realization in most end markets and higher shipment volumes (primarily in Europe, Mexico, and China), partially offset by the negative effects of foreign currency translation. Operating profit improved primarily as a result of price realization and improved sales volumes / mix. These items were partially offset by higher production costs, increased selling, administrative and general expenses and research and development expenses, and the unfavorable effects of foreign currency exchange mostly due to a stronger U.S. dollar.
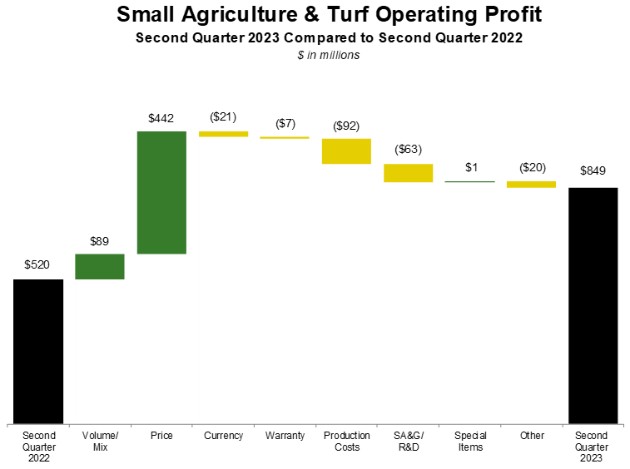
Sales for the first six months increased mainly as a result of price realization and higher shipment volumes (primarily in Europe and Mexico), partially offset by the unfavorable impact of currency translation. Operating profit for the first six months improved primarily as a result of price realization and improved sales volumes / mix. These items were partially offset by higher production costs, higher selling, administrative, and general expenses and research and development expenses, and the unfavorable effects of foreign currency exchange mostly due to a stronger U.S. dollar.
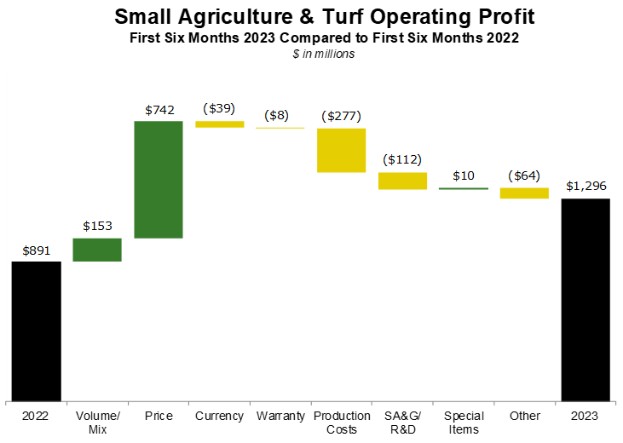
32
Three Months Ended | Six Months Ended | ||||||||||||||||
Construction and Forestry | April 30 | May 1 | % | April 30 | May 1 | % | |||||||||||
(In millions of dollars) | 2023 | 2022 | Change | 2023 | 2022 | Change | |||||||||||
Net sales | $ | 4,112 | $ | 3,347 | +23 | $ | 7,314 | $ | 5,891 | +24 | |||||||
Operating profit | 838 | 814 | +3 | 1,463 | 1,085 | +35 | |||||||||||
Operating margin | 20.4% | 24.3% | 20.0% | 18.4% | |||||||||||||
Price realization | +13 | +13 | |||||||||||||||
Currency translation impact on Net sales | -1 | -2 | |||||||||||||||
Construction and forestry sales moved higher for the quarter primarily due to price realization and higher shipment volumes. Operating profit improved due to price realization and improved sales volumes / mix, partially offset by higher production costs, higher selling, administrative, and general expenses and research and development expenses. Prior period results benefited from the non-cash gain on the remeasurement of previously held equity investment in the Deere-Hitachi joint venture.
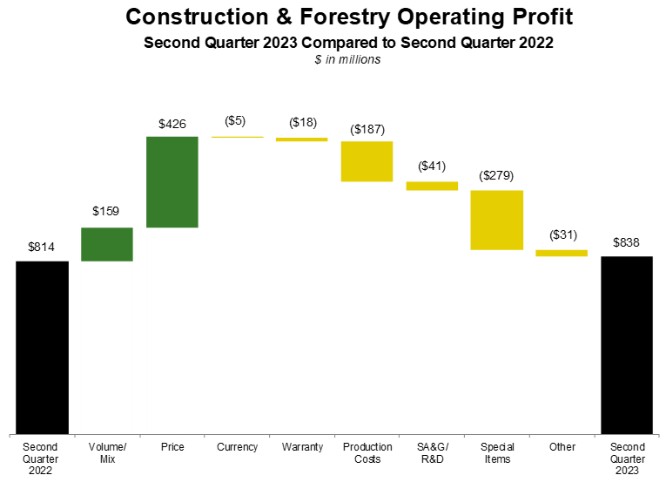
The segment’s six-month sales increased due to higher shipment volumes and price realization partially offset by the unfavorable impact of currency translation. The first six-month’s operating profit moved higher due to price realization and higher sales volumes, partially offset by higher production costs. Prior period results benefitted from the non-cash gain on the remeasurement of the previously held equity investment in the Deere-Hitachi joint venture.
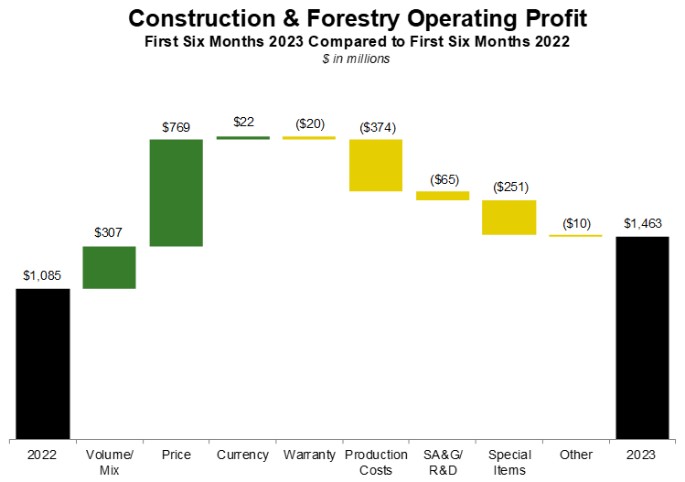
33
Three Months Ended | Six Months Ended | ||||||||||||||||
Financial Services | April 30 | May 1 | % | April 30 | May 1 | % | |||||||||||
(In millions of dollars) | 2023 | 2022 | Change | 2023 | 2022 | Change | |||||||||||
Revenue (including intercompany) | $ | 1,297 | $ | 951 | +36 | $ | 2,542 | $ | 1,867 | +36 | |||||||
Interest expense | 540 | 112 | +382 | 983 | 270 | +264 | |||||||||||
Net income | 28 | 208 | -87 | 212 | 439 | -52 | |||||||||||
The average balance of receivables and leases financed was 18 percent higher in the second quarter of 2023, and 17 percent higher in the first six months of 2023 compared with the same periods last year. Revenue also increased due to higher average financing rates in both periods. Interest expense increased compared to both prior periods as a result of higher average borrowing rates and higher average borrowings. Financial services net income for both periods decreased primarily due to less-favorable financing spreads and a higher provision for credit losses, partially offset by income earned on a higher average portfolio. Net income for the first six months of the year was also impacted by unfavorable derivative market valuation adjustments. Additionally impacting the results for both periods was a $135 million after-tax correction of the accounting treatment for financing incentives offered to John Deere dealers, which affected the timing of expense recognition and the presentation of incentive costs in the consolidated financial statements. The accounting correction is unrelated to current market conditions or the credit quality of the financial services portfolio, which remains strong. The allowance for credit losses, excluding the portfolio in Russia, was .40 percent of financing receivables as of April 30, 2023, compared with .42 percent as of May 1, 2022.
Critical Accounting Estimates
See the Company’s critical accounting estimates discussed in the Management’s Discussion and Analysis of the most recently filed Annual Report on Form 10-K. There have been no material changes to these policies.
CAPITAL RESOURCES AND LIQUIDITY
Sources of Liquidity, Key Metrics and Balance Sheet Data
The Company has access to most global capital markets at a reasonable cost. Sources of liquidity for the Company include cash and cash equivalents, marketable securities, funds from operations, the issuance of commercial paper and term debt, the securitization of retail notes (both public and private markets), and bank lines of credit. The Company closely monitors its liquidity sources against the cash requirements and expects to have sufficient sources of global funding and liquidity to meet its funding needs in the short term (next 12 months) and long term (beyond 12 months). The Company operates in multiple industries, which have different funding requirements. The production and precision agriculture, small agriculture and turf, and construction and forestry segments are capital intensive and are typically subject to seasonal variations in financing requirements for inventories and certain receivables from dealers. However, the patterns of seasonality in inventory have been affected by increases in production rates and supply chain disruptions experienced during fiscal year 2022. Supply chain conditions have begun trending towards more normalized levels in 2023, though disruptions remain above historical performance. The financial services operations rely on their ability to raise substantial amounts of funds to finance their receivable and lease portfolios.
Key metrics are provided in the following table, in millions of dollars:
April 30 | October 30 | May 1 | ||||||||
2023 | 2022 | 2022 | ||||||||
Cash, cash equivalents, and marketable securities | $ | 6,123 | $ | 5,508 | $ | 4,560 | ||||
Trade accounts and notes receivable – net | 9,971 | 6,410 | 6,258 | |||||||
Ratio to prior 12 month’s net sales | 18% | 13% | 15% | |||||||
Inventories | 9,713 | 8,495 | 9,030 | |||||||
Ratio to prior 12 month’s cost of sales | 25% | 24% | 29% | |||||||
Unused credit lines | 785 | 3,284 | 4,608 | |||||||
Financial Services: | ||||||||||
Ratio of interest-bearing debt to stockholder’s equity | 8.0 to 1 | 8.5 to 1 | 7.8 to 1 | |||||||
34
The reduction in unused credit lines in 2023 compared to both prior periods relates to an increase in commercial paper outstanding due to changes in receivables and funding mix. The Company forecasts higher operating cash flows in 2023 driven by an increase in net income adjusted for non-cash provisions and a favorable change in working capital.
There have been no material changes to the contractual and other cash requirements identified in the Company’s most recently issued Annual Report on Form 10-K.
Cash Flows (in millions of dollars)
Six Months Ended | |||||||
April 30, 2023 | May 1, 2022 | ||||||
Net cash used for operating activities | $ | (147) | $ | (1,762) | |||
Net cash used for investing activities | (1,494) | (1,888) | |||||
Net cash provided by (used for) financing activities | 2,017 | (386) | |||||
Effect of exchange rate changes on cash, cash equivalents, and restricted cash | 70 | (110) | |||||
Net increase (decrease) in cash, cash equivalents, and restricted cash | $ | 446 | $ | (4,146) | |||
Cash outflows from operating activities in the first six months of 2023 were $147 million. This resulted mainly from a working capital change, partially offset by net income adjusted for non-cash provisions. Cash outflows from investing activities were $1,494 million in the first six months of 2023. The primary drivers were growth in the retail customer receivable portfolio and purchases of property and equipment. Cash inflows from financing activities were $2,017 million in the first six months of 2023, as higher external borrowings of $5,293 million to support working capital requirements were offset by repurchases of common stock and dividends paid. Cash, cash equivalents, and restricted cash increased $446 million during the first six months of 2023.
Trade Accounts and Notes Receivable. Trade accounts and notes receivable arise from sales of goods to customers. Trade receivables increased $3,561 million during the first six months of 2023, primarily due to a seasonal increase and higher sales volumes, as well as the effect of foreign currency translation. These receivables increased $3,713 million, compared to a year ago, primarily due to higher sales volumes. The percentage of total worldwide trade receivables outstanding for periods exceeding 12 months was 1 percent at each of April 30, 2023, October 30, 2022, and May 1, 2022.
Financing Receivables and Equipment on Operating Leases. Financing receivables and equipment on operating leases consist of retail notes originated in connection with financing of new and used equipment, operating leases, revolving charge accounts, sales-type and direct financing leases, and wholesale notes. Financing receivables and equipment on operating leases increased $1,944 million during the first six months of 2023 and increased $6,514 million in the past 12 months due to strong retail sales. Total acquisition volumes of financing receivables and equipment on operating leases were 31 percent higher in the first six months of 2023, compared with the same period last year, as volumes of wholesale notes, retail notes, revolving charge accounts, operating leases, and finance leases were higher compared to May 1, 2022.
Inventories. Inventories increased by $1,218 million during the first six months of 2023 and increased by $683 million compared to a year ago. The increases were due to higher forecasted sales volumes and supply chain disruptions. The effect of foreign currency translation also increased inventories during the first six months of 2023. A majority of these inventories are valued on the last-in, first out (LIFO) method.
Property and Equipment. Property and equipment cash expenditures in the first six months of 2023 were $584 million, compared with $346 million in the same period last year. Capital expenditures in 2023 are estimated to be approximately $1,500 million.
Accounts Payable and Accrued Expenses. Accounts payable and accrued expenses decreased by $106 million in the first six months of 2023. Accounts payable and accrued expenses increased $2,037 million compared to a year ago due to an increase in accrued expenses associated with accrued taxes, employee benefits, product warranties, and dealer sales discounts.
Borrowings. Total external borrowings have changed generally corresponding with the level of the receivable and the lease portfolio, as well as other working capital requirements.
John Deere Capital Corporation (Capital Corporation), a U.S. financial services subsidiary, has a revolving warehouse facility to utilize bank conduit facilities to securitize retail notes (see Note 9). The facility was renewed in November 2022 with an expiration in November 2023 and increased the total capacity or “financing limit” from $1,000 million to $1,500 million. At April 30, 2023, $948 million of securitization borrowings was outstanding
35
under the facility. At the end of the contractual revolving period, unless the banks and Capital Corporation agree to renew, Capital Corporation would liquidate the secured borrowings over time as payments on the retail notes are collected.
In the first six months of 2023, the financial services operations issued $1,289 million and retired $1,622 million of retail note securitization borrowings, which are presented in “Increase (decrease) in total short-term borrowings.”
Lines of Credit. The Company also has access to bank lines of credit with various banks throughout the world. Worldwide lines of credit totaled $10,309 million at April 30, 2023, $785 million of which were unused. For the purpose of computing unused credit lines, commercial paper, and short-term bank borrowings, excluding secured borrowings and the current portion of long-term borrowings, were considered to constitute utilization. Included in the total credit lines at April 30, 2023 was a 364-day credit facility agreement of $5,000 million expiring in the second quarter of 2024. In addition, total credit lines included long-term credit facility agreements of $2,500 million expiring in the second quarter of 2027 and $2,500 million expiring in the second quarter of 2028. These credit agreements require Capital Corporation and other parts of the Company to maintain certain performance metrics and liquidity targets. All of the requirements in the credit agreements have been met during the periods included in the financial statements.
Debt Ratings. To access public debt capital markets, the Company relies on credit rating agencies to assign short-term and long-term credit ratings to the Company’s debt securities as an indicator of credit quality for fixed income investors. A security rating is not a recommendation by the rating agency to buy, sell, or hold Company securities. A credit rating agency may change or withdraw ratings based on its assessment of the Company’s current and future ability to meet interest and principal repayment obligations. Each agency’s rating should be evaluated independently of any other rating. Lower credit ratings generally result in higher borrowing costs, including costs of derivative transactions, and reduced access to debt capital markets. The senior long-term and short-term debt ratings and outlook currently assigned to unsecured Company securities by the rating agencies engaged by the Company are as follows:
| Senior |
|
|
| |||
Long-Term | Short-Term | Outlook |
| ||||
Fitch Ratings | A+ | F1 | Stable | ||||
Moody’s Investors Service, Inc. |
| A2 |
| Prime-1 |
| Positive | |
Standard & Poor’s |
| A |
| A-1 |
| Stable |
Forward-Looking Statements
Certain statements contained herein, including in the section entitled “Overview,” relating to future events, expectations, and trends constitute “forward-looking statements” as defined in the Private Securities Litigation Reform Act of 1995. Some of these risks and uncertainties could affect all lines of the Company’s operations generally while others could more heavily affect a particular line of business.
Forward-looking statements are based on currently available information and current assumptions, expectations, and projections about future events and should not be relied upon. Except as required by law, the Company expressly disclaims any obligation to update or revise its forward-looking statements. Many factors, risks, and uncertainties could cause actual results to differ materially from these forward-looking statements. Among these factors are risks related to:
| ● | changes in U.S. and international laws, regulations, and policies relating to trade, spending, taxing, banking, monetary, environmental (including climate change and engine emission), and farming policies; |
| ● | political, economic, and social instability of the geographies in which the Company operates; |
| ● | wars and other conflicts, including the current conflict between Russia and Ukraine; |
| ● | adverse macroeconomic conditions, including unemployment, inflation, rising interest rates, changes in consumer practices due to slower economic growth or possible recession, and regional or global liquidity constraints; |
| ● | growth and sustainability of non-food uses for crops (including ethanol and biodiesel production); |
| ● | the ability to execute business strategies, including the Company’s Smart Industrial operating model, Leap Ambitions, and mergers and acquisitions; |
| ● | the ability to understand and meet customers’ changing expectations and demand for John Deere products and solutions; |
| ● | accurately forecasting customer demand for products and services and adequately managing inventory; |
| ● | changes to governmental communications channels (radio frequency technology); |
| ● | gaps or limitations in rural broadband coverage, capacity, and speed needed to support technology solutions; |
| ● | the Company’s ability to adapt in highly competitive markets; |
36
| ● | dealer practices and their ability to manage distribution of John Deere products and support and service precision technology solutions; |
| ● | changes in climate patterns, unfavorable weather events and natural disasters; |
| ● | higher interest rates and currency fluctuations which could adversely affect the U.S. dollar, customer confidence, access to capital, and demand for our products and solutions; |
| ● | stress in the banking sector may have adverse impacts on vendors or customers as well as on the Company’s ability to access cash deposits; |
| ● | uncertainty related to prolonged negotiations regarding the U.S. federal debt ceiling or the U.S. government’s failure to raise the debt ceiling; |
| ● | changes in the Company’s credit ratings, and failure to comply with financial covenants in credit agreements could impact access to funding; |
| ● | availability and price of raw materials, components, and whole goods; |
| ● | delays or disruptions in the Company’s supply chain; |
| ● | labor relations and contracts, including work stoppages and other disruptions; |
| ● | the ability to attract, develop, engage, and retain qualified personnel; |
| ● | security breaches, cybersecurity attacks, technology failures, and other disruptions to the information technology infrastructure of the Company and its products; |
| ● | loss of or challenges to intellectual property rights; |
| ● | compliance with evolving U.S. and foreign laws, including economic sanctions, data privacy, and environmental laws and regulations; |
| ● | legislation introduced or enacted that could affect the Company’s business model and intellectual property, such as so-called right to repair or right to modify legislation; |
| ● | investigations, claims, lawsuits, or other legal proceedings; |
| ● | events that damage the Company’s reputation or brand; |
| ● | world grain stocks, available farm acres, soil conditions, harvest yields, prices for commodities and livestock, input costs, and availability of transport for crops; and |
| ● | housing starts and supply, real estate and housing prices, levels of public and non-residential construction, and infrastructure investment. |
Further information concerning the Company and its businesses, including factors that could materially affect the Company’s financial results, is included in the Company’s other filings with the SEC (including, but not limited to, the factors discussed in Item 1A. “Risk Factors” of our Annual Report on Form 10-K and this Quarterly Report on Form 10-Q). There also may be other factors that we cannot anticipate or that are not described herein because we do not currently perceive them to be material.
Supplemental Consolidating Information
The supplemental consolidating data presented on the subsequent pages is presented for informational purposes. The equipment operations represents the enterprise without financial services. The equipment operations includes the Company’s production and precision agriculture operations, small agriculture and turf operations, construction and forestry operations, and other corporate assets, liabilities, revenues, and expenses not reflected within financial services. Transactions between the equipment operations and financial services have been eliminated to arrive at the consolidated financial statements.
The equipment operations and financial services participate in different industries. The equipment operations primarily generate earnings and cash flows by manufacturing and selling equipment, service parts, and technology solutions to dealers and retail customers. Financial services finances sales and leases by dealers of new and used equipment that is largely manufactured by the Company. Those earnings and cash flows generally are the difference between the finance income received from customer payments less interest expense, and depreciation on equipment subject to an operating lease. The two businesses are capitalized differently and have separate performance metrics. The supplemental consolidating data is also used by management due to these differences.
37
DEERE & COMPANY | ||||||||||||||||||||||||||
SUPPLEMENTAL CONSOLIDATING DATA | ||||||||||||||||||||||||||
STATEMENTS OF INCOME | ||||||||||||||||||||||||||
For the Three Months Ended April 30, 2023 and May 1, 2022 | ||||||||||||||||||||||||||
(In millions of dollars) Unaudited | ||||||||||||||||||||||||||
EQUIPMENT | FINANCIAL | |||||||||||||||||||||||||
OPERATIONS | SERVICES | ELIMINATIONS | CONSOLIDATED |
| ||||||||||||||||||||||
2023 | 2022 | 2023 | 2022 | 2023 | 2022 | 2023 | 2022 |
| ||||||||||||||||||
Net Sales and Revenues |
|
|
|
|
|
|
|
|
|
|
|
| ||||||||||||||
Net sales | $ | 16,079 | $ | 12,034 | $ | 16,079 | $ | 12,034 | ||||||||||||||||||
Finance and interest income | 121 |
| 36 | $ | 1,206 | $ | 847 | $ | (248) | $ | (87) | 1,079 | 796 | 1 | ||||||||||||
Other income | 185 |
| 584 | 91 |
| 104 | (47) |
| (148) | 229 |
| 540 | 2, 3 | |||||||||||||
Total | 16,385 |
| 12,654 | 1,297 |
| 951 | (295) |
| (235) | 17,387 |
| 13,370 | ||||||||||||||
Costs and Expenses | ||||||||||||||||||||||||||
Cost of sales | 10,737 |
| 8,919 | (7) |
| (1) | 10,730 | 8,918 | 4 | |||||||||||||||||
Research and development expenses | 547 |
| 453 | 547 | 453 | |||||||||||||||||||||
Selling, administrative and general expenses | 935 |
| 753 | 397 |
| 181 | (2) |
| (2) | 1,330 |
| 932 | 4 | |||||||||||||
Interest expense | 103 |
| 97 | 540 |
| 112 | (74) |
| (22) | 569 |
| 187 | 5 | |||||||||||||
Interest compensation to Financial Services | 174 |
| 62 | (174) |
| (62) |
|
| 5 | |||||||||||||||||
Other operating expenses | 85 |
| 99 | 316 |
| 377 | (38) |
| (148) | 363 |
| 328 | 6, 7 | |||||||||||||
Total | 12,581 |
| 10,383 | 1,253 |
| 670 | (295) |
| (235) | 13,539 |
| 10,818 | ||||||||||||||
Income before Income Taxes | 3,804 |
| 2,271 | 44 |
| 281 |
|
|
| 3,848 |
| 2,552 | ||||||||||||||
Provision for income taxes | 974 |
| 387 | 17 |
| 74 |
|
|
| 991 |
| 461 | ||||||||||||||
Income after Income Taxes | 2,830 |
| 1,884 | 27 |
| 207 |
|
|
| 2,857 |
| 2,091 | ||||||||||||||
Equity in income of unconsolidated affiliates | 1 |
| 5 | 1 |
| 1 | 2 | 6 | ||||||||||||||||||
Net Income | 2,831 |
| 1,889 | 28 |
| 208 |
|
|
| 2,859 |
| 2,097 | ||||||||||||||
Less: Net loss attributable to noncontrolling interests | (1) |
| (1) |
|
|
|
| (1) | (1) | |||||||||||||||||
Net Income Attributable to Deere & Company | $ | 2,832 | $ | 1,890 | $ | 28 | $ | 208 |
|
| $ | 2,860 | $ | 2,098 | ||||||||||||
1 Elimination of financial services’ interest income earned from equipment operations.
2 Elimination of equipment operations’ margin from inventory transferred to equipment on operating leases.
3 Elimination of financial services’ income related to intercompany guarantees of investments in certain international markets and intercompany service revenue.
4 Elimination of intercompany service fees.
5 Elimination of equipment operations’ interest expense to financial services.
6 Elimination of financial services’ lease depreciation expense related to inventory transferred to equipment on operating leases.
7 Elimination of equipment operations’ expense related to intercompany guarantees of investments in certain international markets and intercompany service expenses.
38
DEERE & COMPANY | ||||||||||||||||||||||||||
SUPPLEMENTAL CONSOLIDATING DATA (Continued) | ||||||||||||||||||||||||||
STATEMENTS OF INCOME | ||||||||||||||||||||||||||
For the Six Months Ended April 30, 2023 and May 1, 2022 | ||||||||||||||||||||||||||
(In millions of dollars) Unaudited | ||||||||||||||||||||||||||
EQUIPMENT | FINANCIAL | |||||||||||||||||||||||||
OPERATIONS | SERVICES | ELIMINATIONS | CONSOLIDATED |
| ||||||||||||||||||||||
2023 | 2022 | 2023 | 2022 | 2023 | 2022 | 2023 | 2022 |
| ||||||||||||||||||
Net Sales and Revenues |
|
|
|
|
|
|
|
|
| |||||||||||||||||
Net sales | $ | 27,481 | $ | 20,565 | $ | 27,481 | $ | 20,565 | ||||||||||||||||||
Finance and interest income | 234 |
| 70 | $ | 2,274 | $ | 1,675 | $ | (435) | $ | (150) | 2,073 | 1,595 | 1 | ||||||||||||
Other income | 417 |
| 801 | 268 |
| 192 | (201) |
| (214) | 484 |
| 779 | 2, 3 | |||||||||||||
Total | 28,132 |
| 21,436 | 2,542 |
| 1,867 | (636) |
| (364) | 30,038 |
| 22,939 | ||||||||||||||
Costs and Expenses | ||||||||||||||||||||||||||
Cost of sales | 18,675 |
| 15,614 | (12) |
| (1) | 18,663 | 15,613 | 4 | |||||||||||||||||
Research and development expenses | 1,043 |
| 855 | 1,043 | 855 | |||||||||||||||||||||
Selling, administrative and general expenses | 1,719 |
| 1,410 | 569 |
| 307 | (5) |
| (4) | 2,283 |
| 1,713 | 4 | |||||||||||||
Interest expense | 204 |
| 188 | 983 |
| 270 | (138) |
| (41) | 1,049 |
| 417 | 5 | |||||||||||||
Interest compensation to Financial Services | 297 |
| 106 | (297) |
| (106) |
|
| 5 | |||||||||||||||||
Other operating expenses | 137 |
| 138 | 707 |
| 712 | (184) |
| (212) | 660 |
| 638 | 6, 7 | |||||||||||||
Total | 22,075 |
| 18,311 | 2,259 |
| 1,289 | (636) |
| (364) | 23,698 |
| 19,236 | ||||||||||||||
Income before Income Taxes | 6,057 |
| 3,125 | 283 |
| 578 |
|
|
| 6,340 |
| 3,703 | ||||||||||||||
Provision for income taxes | 1,455 |
| 568 | 73 |
| 142 |
|
|
| 1,528 |
| 710 | ||||||||||||||
Income after Income Taxes | 4,602 |
| 2,557 | 210 |
| 436 |
|
|
| 4,812 |
| 2,993 | ||||||||||||||
Equity in income of unconsolidated affiliates | 1 |
| 5 | 2 |
| 3 | 3 | 8 | ||||||||||||||||||
Net Income | 4,603 |
| 2,562 | 212 |
| 439 |
|
|
| 4,815 |
| 3,001 | ||||||||||||||
Less: Net loss attributable to noncontrolling interests | (4) |
|
|
|
|
| (4) |
| ||||||||||||||||||
Net Income Attributable to Deere & Company | $ | 4,607 | $ | 2,562 | $ | 212 | $ | 439 |
|
| $ | 4,819 | $ | 3,001 | ||||||||||||
1 Elimination of financial services’ interest income earned from equipment operations.
2 Elimination of equipment operations’ margin from inventory transferred to equipment on operating leases.
3 Elimination of financial services’ income related to intercompany guarantees of investments in certain international markets and intercompany service revenue.
4 Elimination of intercompany service fees.
5 Elimination of equipment operations’ interest expense to financial services.
6 Elimination of financial services’ lease depreciation expense related to inventory transferred to equipment on operating leases.
7 Elimination of equipment operations’ expense related to intercompany guarantees of investments in certain international markets and intercompany service expenses.
39
DEERE & COMPANY | ||||||||||||||||||||||||||||||||||||||
SUPPLEMENTAL CONSOLIDATING DATA (Continued) | ||||||||||||||||||||||||||||||||||||||
CONDENSED BALANCE SHEETS | ||||||||||||||||||||||||||||||||||||||
(In millions of dollars) Unaudited | ||||||||||||||||||||||||||||||||||||||
EQUIPMENT | FINANCIAL | |||||||||||||||||||||||||||||||||||||
OPERATIONS | SERVICES | ELIMINATIONS | CONSOLIDATED | |||||||||||||||||||||||||||||||||||
Apr 30 | Oct 30 | May 1 | Apr 30 | Oct 30 | May 1 | Apr 30 | Oct 30 | May 1 | Apr 30 | Oct 30 | May 1 | |||||||||||||||||||||||||||
2023 | 2022 | 2022 | 2023 | 2022 | 2022 | 2023 | 2022 | 2022 | 2023 | 2022 | 2022 | |||||||||||||||||||||||||||
Assets |
|
|
|
|
|
|
|
|
|
|
|
|
|
|
|
|
|
|
|
|
|
|
|
|
|
|
|
|
|
|
|
|
|
|
|
| ||
Cash and cash equivalents | $ | 3,587 | $ | 3,767 | $ | 3,167 | $ | 1,680 | $ | 1,007 | $ | 711 |
|
|
| $ | 5,267 | $ | 4,774 | $ | 3,878 | |||||||||||||||||
Marketable securities | 14 |
| 61 |
| 2 | 842 |
| 673 |
| 680 |
|
|
|
|
| 856 |
| 734 |
| 682 | ||||||||||||||||||
Receivables from Financial Services | 5,899 |
| 6,569 |
| 5,669 | $ | (5,899) | $ | (6,569) | $ | (5,669) |
|
|
| 8 | |||||||||||||||||||||||
Trade accounts and notes receivable – net | 1,562 |
| 1,273 |
| 1,358 | 10,422 |
| 6,434 |
| 6,079 | (2,013) |
| (1,297) |
| (1,179) | 9,971 |
| 6,410 |
| 6,258 | 9 | |||||||||||||||||
Financing receivables – net | 54 |
| 47 |
| 49 | 38,900 |
| 36,587 |
| 34,036 |
|
|
|
|
| 38,954 |
| 36,634 |
| 34,085 | ||||||||||||||||||
Financing receivables securitized – net | 1 |
| 6 | 5,658 |
| 5,936 |
| 4,067 |
|
|
|
|
| 5,659 |
| 5,936 |
| 4,073 | ||||||||||||||||||||
Other receivables | 2,201 |
| 1,670 |
| 1,944 | 481 |
| 832 |
| 405 | (89) |
| (10) |
| (43) | 2,593 |
| 2,492 |
| 2,306 | 9 | |||||||||||||||||
Equipment on operating leases – net | 6,524 |
| 6,623 |
| 6,465 |
|
|
|
|
| 6,524 |
| 6,623 |
| 6,465 | |||||||||||||||||||||||
Inventories | 9,713 |
| 8,495 |
| 9,030 |
|
|
| 9,713 | 8,495 | 9,030 | |||||||||||||||||||||||||||
Property and equipment – net | 6,254 |
| 6,021 |
| 5,678 | 34 |
| 35 |
| 37 |
|
|
|
|
| 6,288 |
| 6,056 |
| 5,715 | ||||||||||||||||||
Goodwill | 3,963 |
| 3,687 |
| 3,812 |
|
|
| 3,963 | 3,687 | 3,812 | |||||||||||||||||||||||||||
Other intangible assets – net | 1,222 |
| 1,218 |
| 1,352 |
|
|
|
|
|
|
| 1,222 |
| 1,218 |
| 1,352 | |||||||||||||||||||||
Retirement benefits | 3,450 |
| 3,666 |
| 2,996 | 69 |
| 66 |
| 65 |
|
| (2) |
| (2) | 3,519 |
| 3,730 |
| 3,059 | 10 | |||||||||||||||||
Deferred income taxes | 1,355 |
| 940 |
| 1,247 | 59 |
| 45 |
| 49 | (106) |
| (161) |
| (192) | 1,308 |
| 824 |
| 1,104 | 11 | |||||||||||||||||
Other assets | 1,961 |
| 1,794 |
| 1,767 | 564 |
| 626 |
| 516 | (15) |
| (3) |
| (3) | 2,510 |
| 2,417 |
| 2,280 | 9 | |||||||||||||||||
Total Assets | $ | 41,236 | $ | 39,208 | $ | 38,077 | $ | 65,233 | $ | 58,864 | $ | 53,110 | $ | (8,122) | $ | (8,042) | $ | (7,088) | $ | 98,347 | $ | 90,030 | $ | 84,099 | ||||||||||||||
Liabilities and Stockholders’ Equity | ||||||||||||||||||||||||||||||||||||||
Liabilities | ||||||||||||||||||||||||||||||||||||||
Short-term borrowings | $ | 1,755 | $ | 1,040 | $ | 1,554 | $ | 15,354 | $ | 11,552 | $ | 10,859 |
|
|
| $ | 17,109 | $ | 12,592 | $ | 12,413 | |||||||||||||||||
Short-term securitization borrowings |
|
| 5 | 5,379 |
| 5,711 |
| 4,001 |
|
|
|
|
| 5,379 |
| 5,711 |
| 4,006 | ||||||||||||||||||||
Payables to Equipment Operations |
|
|
|
|
| 5,899 |
| 6,569 |
| 5,669 | $ | (5,899) | $ | (6,569) | $ | (5,669) |
|
|
|
|
| 8 | ||||||||||||||||
Accounts payable and accrued expenses | 13,759 |
| 12,962 |
| 11,370 | 3,074 |
| 3,170 |
| 2,534 | (2,117) |
| (1,310) |
| (1,225) | 14,716 |
| 14,822 |
| 12,679 | 9 | |||||||||||||||||
Deferred income taxes | 402 |
| 380 |
| 454 | 215 |
| 276 |
| 322 | (106) |
| (161) |
| (192) | 511 |
| 495 |
| 584 | 11 | |||||||||||||||||
Long-term borrowings | 7,310 |
| 7,917 |
| 8,556 | 28,301 |
| 25,679 |
| 23,891 |
|
|
|
|
| 35,611 |
| 33,596 |
| 32,447 | ||||||||||||||||||
Retirement benefits and other liabilities | 2,410 |
| 2,351 |
| 2,855 | 110 |
| 108 |
| 111 |
|
| (2) |
| (2) | 2,520 |
| 2,457 |
| 2,964 | 10 | |||||||||||||||||
Total liabilities | 25,636 | 24,650 | 24,794 | 58,332 | 53,065 | 47,387 | (8,122) | (8,042) | (7,088) | 75,846 | 69,673 | 65,093 | ||||||||||||||||||||||||||
Commitments and contingencies (Note 16) | ||||||||||||||||||||||||||||||||||||||
Redeemable noncontrolling interest | 102 | 92 | 99 |
|
|
|
|
|
| 102 | 92 | 99 | ||||||||||||||||||||||||||
Stockholders’ Equity | ||||||||||||||||||||||||||||||||||||||
Total Deere & Company stockholders’ equity | 22,395 |
| 20,262 |
| 18,904 | 6,901 | 5,799 | 5,723 | (6,901) | (5,799) | (5,723) | 22,395 | 20,262 | 18,904 | 12 | |||||||||||||||||||||||
Noncontrolling interests | 4 |
| 3 |
| 3 |
|
|
|
|
|
| 4 | 3 | 3 | ||||||||||||||||||||||||
Financial Services’ equity | (6,901) |
| (5,799) |
| (5,723) |
|
|
| 6,901 | 5,799 | 5,723 |
|
|
| 12 | |||||||||||||||||||||||
Adjusted total stockholders’ equity | 15,498 |
| 14,466 |
| 13,184 | 6,901 |
| 5,799 |
| 5,723 |
|
|
|
|
| 22,399 |
| 20,265 |
| 18,907 | ||||||||||||||||||
Total Liabilities and Stockholders’ Equity | $ | 41,236 | $ | 39,208 | $ | 38,077 | $ | 65,233 | $ | 58,864 | $ | 53,110 | $ | (8,122) | $ | (8,042) | $ | (7,088) | $ | 98,347 | $ | 90,030 | $ | 84,099 | ||||||||||||||
8 Elimination of receivables / payables between equipment operations and financial services.
9 Primarily reclassification of sales incentive accruals on receivables sold to financial services.
10 Reclassification of net pension assets / liabilities.
11 Reclassification of deferred tax assets / liabilities in the same taxing jurisdictions.
12 Elimination of financial services’ equity.
40
DEERE & COMPANY | ||||||||||||||||||||||||||
SUPPLEMENTAL CONSOLIDATING DATA (Continued) | ||||||||||||||||||||||||||
STATEMENTS OF CASH FLOWS | ||||||||||||||||||||||||||
For the Six Months Ended April 30, 2023 and May 1, 2022 | ||||||||||||||||||||||||||
(In millions of dollars) Unaudited | ||||||||||||||||||||||||||
EQUIPMENT | FINANCIAL | |||||||||||||||||||||||||
OPERATIONS | SERVICES | ELIMINATIONS | CONSOLIDATED | |||||||||||||||||||||||
2023 | 2022 | 2023 | 2022 | 2023 | 2022 | 2023 | 2022 | |||||||||||||||||||
Cash Flows from Operating Activities |
|
|
|
|
|
|
|
|
|
|
|
|
|
|
|
|
| |||||||||
Net income | $ | 4,603 | $ | 2,562 | $ | 212 | $ | 439 |
|
| $ | 4,815 | $ | 3,001 | ||||||||||||
Adjustments to reconcile net income to net cash provided by (used for) operating activities: | ||||||||||||||||||||||||||
Provision (credit) for credit losses |
| 4 |
| 1 |
| (93) |
| 44 |
|
|
|
|
| (89) |
| 45 | ||||||||||
Provision for depreciation and amortization |
| 565 |
| 518 |
| 500 |
| 530 | $ | (70) | $ | (115) |
| 995 |
| 933 | 13 | |||||||||
Impairments and other adjustments |
|
| 77 |
| 173 |
|
|
|
|
|
|
| 173 |
| 77 | |||||||||||
Share-based compensation expense |
|
|
|
| 54 | 44 | 54 | 44 | 14 | |||||||||||||||||
Gain on remeasurement of previously held equity investment |
|
| (326) |
|
|
|
|
|
|
|
|
|
|
| (326) | |||||||||||
Distributed earnings of Financial Services |
| 12 |
| 232 |
|
|
|
|
| (12) |
| (232) |
|
|
|
| 15 | |||||||||
Provision (credit) for deferred income taxes |
| (304) |
| 75 |
| (73) |
| (38) |
|
|
|
|
| (377) |
| 37 | ||||||||||
Changes in assets and liabilities: | ||||||||||||||||||||||||||
Receivables related to sales |
| (255) |
| (215) |
|
| (4,152) | (1,320) | (4,407) | (1,535) | 16, 18, 19 | |||||||||||||||
Inventories |
| (910) |
| (2,201) |
|
| (72) | (64) | (982) | (2,265) | 17 | |||||||||||||||
Accounts payable and accrued expenses |
| 161 |
| (99) |
| 243 |
| (7) |
| (717) |
| (337) |
| (313) |
| (443) | 18 | |||||||||
Accrued income taxes payable/receivable |
| (97) |
| (144) |
| 1 |
| 5 |
|
|
|
|
| (96) |
| (139) | ||||||||||
Retirement benefits |
| (67) |
| (1,024) |
| (1) |
| 4 |
|
|
|
|
| (68) |
| (1,020) | ||||||||||
Other |
| 54 |
| (102) |
| 103 |
| (117) |
| (9) |
| 48 |
| 148 |
| (171) | 13, 14, 17 | |||||||||
Net cash provided by (used for) operating activities |
| 3,766 |
| (646) |
| 1,065 |
| 860 |
| (4,978) |
| (1,976) |
| (147) |
| (1,762) | ||||||||||
Cash Flows from Investing Activities | ||||||||||||||||||||||||||
Collections of receivables (excluding receivables related to sales) |
|
|
| 13,169 |
| 12,004 |
| (576) |
| (814) |
| 12,593 |
| 11,190 | 16 | |||||||||||
Proceeds from sales of equipment on operating leases |
|
|
| 993 |
| 1,035 |
|
|
|
|
| 993 |
| 1,035 | ||||||||||||
Proceeds from sales of businesses and unconsolidated affiliates, net of cash sold |
|
| 36 |
|
|
| 36 |
| ||||||||||||||||||
Cost of receivables acquired (excluding receivables related to sales) |
|
|
| (13,584) |
| (12,260) |
| 133 |
| 289 |
| (13,451) |
| (11,971) | 16 | |||||||||||
Acquisitions of businesses, net of cash acquired | (41) | (473) |
|
|
|
|
|
|
|
|
| (41) |
| (473) | ||||||||||||
Purchases of property and equipment |
| (583) |
| (345) |
| (1) |
| (1) |
|
|
|
|
| (584) |
| (346) | ||||||||||
Cost of equipment on operating leases acquired |
|
|
| (1,327) |
| (1,090) |
| 98 |
| 86 |
| (1,229) |
| (1,004) | 17 | |||||||||||
Increase in investment in Financial Services | (799) |
|
|
|
|
|
| 799 |
|
|
|
|
|
| 20 | |||||||||||
Increase in trade and wholesale receivables |
|
|
| (5,310) |
| (2,159) |
| 5,310 |
| 2,159 |
|
|
|
| 16 | |||||||||||
Collateral on derivatives – net |
| 6 | 367 | (254) |
|
| 367 | (248) | ||||||||||||||||||
Other |
| (37) |
| (46) |
| (142) |
| (49) |
| 1 |
| 24 |
| (178) |
| (71) | 19 | |||||||||
Net cash used for investing activities |
| (1,460) |
| (858) |
| (5,799) |
| (2,774) |
| 5,765 |
| 1,744 |
| (1,494) |
| (1,888) | ||||||||||
Cash Flows from Financing Activities | ||||||||||||||||||||||||||
Increase (decrease) in total short-term borrowings |
| (225) |
| 128 |
| 4,217 |
| 684 |
|
|
|
|
| 3,992 |
| 812 | ||||||||||
Change in intercompany receivables/payables |
| 932 |
| (424) |
| (932) |
| 424 |
|
|
|
|
|
|
|
| ||||||||||
Proceeds from long-term borrowings |
| 41 |
| 55 |
| 4,827 |
| 4,243 |
|
|
|
|
| 4,868 |
| 4,298 | ||||||||||
Payments of long-term borrowings |
| (47) |
| (308) |
| (3,520) |
| (3,317) |
|
|
|
|
| (3,567) |
| (3,625) | ||||||||||
Proceeds from issuance of common stock |
| 30 |
| 50 |
|
|
|
| 30 | 50 | ||||||||||||||||
Repurchases of common stock |
| (2,546) |
| (1,226) |
|
|
|
| (2,546) | (1,226) | ||||||||||||||||
Capital investment from Equipment Operations |
|
|
| 799 |
| (799) |
|
|
| 20 | ||||||||||||||||
Dividends paid |
| (697) |
| (649) |
| (12) | (232) |
| 12 | 232 |
| (697) | (649) | 15 | ||||||||||||
Other |
| (35) |
| (27) |
| (28) |
| (19) |
|
|
|
|
| (63) |
| (46) | ||||||||||
Net cash provided by (used for) financing activities |
| (2,547) |
| (2,401) |
| 5,351 |
| 1,783 |
| (787) |
| 232 |
| 2,017 |
| (386) | ||||||||||
Effect of Exchange Rate Changes on Cash, Cash Equivalents, and Restricted Cash |
| 62 |
| (113) |
| 8 |
| 3 |
|
|
|
|
| 70 |
| (110) | ||||||||||
Net Increase (Decrease) in Cash, Cash Equivalents, and Restricted Cash |
| (179) |
| (4,018) |
| 625 |
| (128) |
|
|
|
|
| 446 |
| (4,146) | ||||||||||
Cash, Cash Equivalents, and Restricted Cash at Beginning of Period |
| 3,781 |
| 7,200 |
| 1,160 |
| 925 |
|
|
|
|
| 4,941 |
| 8,125 | ||||||||||
Cash, Cash Equivalents, and Restricted Cash at End of Period | $ | 3,602 | $ | 3,182 | $ | 1,785 | $ | 797 |
|
| $ | 5,387 | $ | 3,979 | ||||||||||||
Components of Cash, Cash Equivalents, and Restricted Cash | ||||||||||||||||||||||||||
Cash and cash equivalents | $ | 3,587 | $ | 3,167 | $ | 1,680 | $ | 711 |
|
| $ | 5,267 | $ | 3,878 | ||||||||||||
Restricted cash (Other assets) | 15 | 15 | 105 | 86 | 120 | 101 | ||||||||||||||||||||
Total Cash, Cash Equivalents, and Restricted Cash | $ | 3,602 | $ | 3,182 | $ | 1,785 | $ | 797 |
|
| $ | 5,387 | $ | 3,979 | ||||||||||||
13 Elimination of depreciation on leases related to inventory transferred to equipment on operating leases.
14 Reclassification of share-based compensation expense.
15 Elimination of dividends from financial services to the equipment operations, which are included in the equipment operations’ operating activities.
16 Primarily reclassification of receivables related to the sale of equipment.
17 Reclassification of direct lease agreements with retail customers.
18 Reclassification of sales incentive accruals on receivables sold to financial services.
19 Elimination and reclassification of the effects of financial services partial financing of the construction and forestry retail locations sales and subsequent collection of those amounts.
20 Elimination of investment from equipment operations to financial services
41
Item 3. QUANTITATIVE AND QUALITATIVE DISCLOSURES ABOUT MARKET RISK
See the Company’s most recently filed Annual Report on Form 10-K (Part II, Item 7A). There has been no material change in this information.
Item 4. CONTROLS AND PROCEDURES
The Company’s principal executive officer and its principal financial officer have concluded that the Company’s disclosure controls and procedures (as defined in Rules 13a-15(e) and 15d-15(e) of the Securities Exchange Act of 1934, as amended (the Exchange Act)) were effective as of April 30, 2023, based on the evaluation of these controls and procedures required by Rule 13a-15(b) or 15d-15(b) of the Exchange Act. During the second quarter of 2023, there were no changes that have materially affected or are reasonably likely to materially affect the Company’s internal control over financial reporting.
PART II. OTHER INFORMATION
Item 1. Legal Proceedings
The Company is subject to various unresolved legal actions which arise in the normal course of its business, the most prevalent of which relate to product liability (including asbestos-related liability), retail credit, employment, patent, trademark, and antitrust matters. The Company believes the reasonably possible range of losses for these unresolved legal actions would not have a material effect on its consolidated financial statements.
Item 1A. Risk Factors
See the Company’s most recently filed Annual Report on Form 10-K (Part I, Item 1A). There has been no material change in this information. The risks described in the Annual Report on Form 10-K, and the “Forward-Looking Statements” in this report, are not the only risks faced by the Company. Additional risks and uncertainties may also materially affect the Company’s business, financial condition, or operating results. One should not consider the risk factors to be a complete discussion of risks, uncertainties, and assumptions.
Item 2. Unregistered Sales of Equity Securities and Use of Proceeds
Issuer Purchases of Equity Securities
The Company’s purchases of its common stock during the second quarter of 2023 were as follows:
|
| Total Number of |
|
|
| ||||||
Shares Purchased as | Maximum Number of |
|
| ||||||||
Total Number of | Part of Publicly | Shares that May Yet Be |
|
| |||||||
Shares | Announced Plans or | Purchased under the |
|
| |||||||
Purchased | Average Price | Programs (1) | Plans or Programs (1) |
|
| ||||||
Period | (thousands) | Per Share | (thousands) | (millions) |
|
| |||||
Jan 30 to Feb 26 | 434 |
| $ | 418.32 | 434 | 49.8 | |||||
Feb 27 to Mar 26 | 1,075 | 413.41 | 1,075 | 48.6 | |||||||
Mar 27 to Apr 30 | 1,716 | 393.04 | 1,716 | 46.8 | |||||||
Total | 3,225 | 3,225 | |||||||||
| (1) | The Company had a share repurchase plan that was announced in December 2019 to purchase up to $8,000 million of shares of the Company’s common stock. The share repurchases under the December 2019 plan were completed in April 2023. The Company has a share repurchase plan that was announced in December 2022 to repurchase up to $18,000 million of shares of the Company’s common stock. The maximum number of shares that may yet be repurchased under this plan was 46.8 million shares based on the end of the second quarter 2023 closing share price of $378.02 per share. At the end of the second quarter of 2023, $17,694 million of common stock remains to be repurchased under this plan. |
Sales of Unregistered Securities
During the second quarter of 2023, the Company issued 3,930 deferred stock units under the Deere & Company Nonemployee Director Stock Ownership Plan (“NEDSOP”) to the Company’s non-employee directors for their service on the Board of Directors of the Company. The deferred stock units convert to shares of common stock on a one-for-one basis following a termination of service as described in the plan. Deferred stock units issued under the NEDSOP are exempt from registration pursuant to Section 4(a)(2) of the Securities Act of 1933, as amended, and Rule 506 of the SEC’s Regulation D thereunder.
42
Item 3. Defaults Upon Senior Securities
None.
Item 4. Mine Safety Disclosures
Not applicable.
Item 5. Other Information
Not applicable.
Item 6. Exhibits
Certain instruments relating to long-term borrowings constituting less than 10 percent of the registrant’s total assets are not filed as exhibits herewith pursuant to Item 601(b)(4)(iii)(A) of Regulation S-K. The registrant will furnish copies of such instruments to the Commission upon request of the Commission.
3.1 | |
3.2 | |
10.1 | |
10.2 | |
10.3 | |
10.4 | |
31.1 | |
31.2 | |
32 | |
101.SCH | Inline XBRL Taxonomy Extension Schema Document |
101.CAL | Inline XBRL Taxonomy Extension Calculation Linkbase Document |
101.DEF | Inline XBRL Taxonomy Extension Definition Linkbase Document |
101.LAB | Inline XBRL Taxonomy Extension Label Linkbase Document |
101.PRE | Inline XBRL Taxonomy Extension Presentation Linkbase Document |
104 | Cover Page Interactive Data File (formatted as Inline XBRL and contained in Exhibit 101) |
* Incorporated by reference.
43
SIGNATURES
Pursuant to the requirements of the Securities Exchange Act of 1934, the registrant has duly caused this report to be signed on its behalf by the undersigned thereunto duly authorized.
DEERE & COMPANY | ||||
Date: | June 1, 2023 | By: | /s/ Joshua A. Jepsen | |
Joshua A. Jepsen (Principal Financial Officer and Principal Accounting Officer) | ||||
44
Similar companies
See also AGCO CORP /DE - Annual report 2022 (10-K 2022-12-31) Annual report 2024 (10-Q 2024-09-30)See also LINDSAY CORP - Annual report 2023 (10-K 2023-08-31) Annual report 2023 (10-Q 2023-05-31)
See also ALAMO GROUP INC - Annual report 2022 (10-K 2022-12-31) Annual report 2025 (10-Q 2025-06-30)
See also ARTS WAY MANUFACTURING CO INC - Annual report 2022 (10-K 2022-11-30) Annual report 2023 (10-Q 2023-08-31)
See also MJ Harvest, Inc. - Annual report 2022 (10-K 2022-05-31) Annual report 2023 (10-Q 2023-02-28)