Magnera Corp - Annual Report: 2016 (Form 10-K)
UNITED STATES SECURITIES AND EXCHANGE COMMISSION
WASHINGTON, D.C. 20549
FORM 10-K
|
☒ |
Annual report pursuant to Section 13 or 15(d) of the Securities Exchange Act of 1934 |
For the fiscal year ended December 31, 2016
or
|
☐ |
Transition Report Pursuant to Section 13 or 15(d) of the Securities Exchange Act of 1934 |
For the transition period from to

96 South George Street, Suite 520
York, Pennsylvania 17401
(Address of principal executive offices)
(717) 225-4711
(Registrant's telephone number, including area code)
|
Commission file number |
|
Exact name of registrant as specified in its charter |
|
IRS Employer Identification No. |
|
State or other jurisdiction of incorporation or organization |
|
1-03560 |
|
P. H. Glatfelter Company |
|
23-0628360 |
|
Pennsylvania |
|
Securities registered pursuant to Section 12(b) of the Act: |
||
|
|
|
|
|
Title of Each Class |
|
Name of Each Exchange on which registered |
|
Common Stock, par value $.01 per share |
|
New York Stock Exchange |
Indicate by check mark if the registrant is a well-known seasoned issuer, as defined in Rule 405 of the Securities Act. Yes ☐ No ☑.
Indicate by check mark if the registrant is not required to file reports pursuant to Section 13 or Section 15(d) of the Act. Yes ☐ No ☑.
Indicate by check mark whether the registrant (1) has filed all reports required to be filed by Section 13 or 15(d) of the Securities Exchange Act of 1934 during the preceding 12 months (or for such shorter period that the registrant was required to file such reports) and (2) has been subject to such filing requirements for the past 90 days. Yes ☑ No ☐.
Indicate by check mark whether the registrant has submitted electronically and posted on its corporate Web site, if any, every Interactive Data File required to be submitted and posted pursuant to Rule 405 of Regulation S-T during the preceding 12 months (or for such shorter period that the registrant was required to submit and post such files). Yes ☑ No ☐.
Indicate by check mark if disclosure of delinquent filers pursuant to Item 405 of Regulation S-K is not contained herein, and will not be contained, to the best of registrant’s knowledge, in definitive proxy or information statements incorporated by reference in Part III of this Form 10-K or any amendment to this Form 10-K. ☐
Indicate by check mark whether the registrant is a large accelerated filer, an accelerated filer, a non-accelerated filer, or a small reporting company. See the definitions of “large accelerated filer”, “accelerated filer” and “smaller reporting company” in Rule 12b-2 of the Exchange Act. ☑ Large accelerated filer ☐ Accelerated filer ☐ Non-accelerated filer ☐ Small reporting company (Do not check if a smaller reporting company).
Indicate by check mark whether the registrant is a shell company (as defined in Rule 12b-2 of the Exchange Act). Yes ☐ No ☑.
Based on the closing price as of June 30, 2016, the aggregate market value of the Common Stock of the Registrant held by non‑affiliates was $839.8 million.
Common Stock outstanding on February 21, 2017 totaled 43,558,387 shares.
DOCUMENTS INCORPORATED BY REFERENCE
Portions of the following documents are incorporated by reference in this Annual Report on Form 10‑K:
Portions of the registrant’s Proxy Statement to be dated on or about March 30, 2017 are incorporated by reference to Part III.
ANNUAL REPORT ON FORM 10-K
For the Year Ended
DECEMBER 31, 2016
Table of Contents
|
Page |
|||
|
PART I |
|
||
|
Item 1 |
|
1 |
|
|
Item 1A |
|
6 |
|
|
Item 1B |
|
11 |
|
|
Item 2 |
|
11 |
|
|
Item 3 |
|
11 |
|
|
|
|
11 |
|
|
Item 4 |
|
12 |
|
|
|
|
|
|
|
PART II |
|
||
|
Item 5 |
|
12 |
|
|
|
|
12 |
|
|
|
|
13 |
|
|
Item 6 |
|
13 |
|
|
Item 7 |
|
Management's Discussion and Analysis of Financial Condition and Results of Operations |
14 |
|
|
|
15 |
|
|
|
|
23 |
|
|
|
|
24 |
|
|
Item 7A |
|
26 |
|
|
Item 8 |
|
27 |
|
|
|
|
28 |
|
|
|
|
30 |
|
|
|
|
31 |
|
|
|
|
32 |
|
|
|
|
33 |
|
|
|
|
34 |
|
|
|
|
Notes to Consolidated Financial Statements |
|
|
|
|
35 |
|
|
|
|
35 |
|
|
|
|
37 |
|
|
|
|
38 |
|
|
|
|
38 |
|
|
|
|
38 |
|
|
|
|
38 |
|
|
|
|
39 |
|
|
|
|
40 |
|
|
|
|
|
Page |
|
|
|
41 |
|
|
|
|
43 |
|
|
|
|
47 |
|
|
|
|
47 |
|
|
|
|
47 |
|
|
|
|
47 |
|
|
|
|
47 |
|
|
|
|
47 |
|
|
|
|
49 |
|
|
|
|
49 |
|
|
|
|
51 |
|
|
|
|
51 |
|
|
|
|
53 |
|
|
|
|
56 |
|
|
|
|
60 |
|
|
|
|
|
|
|
Item 9 |
|
Changes in and Disagreements With Accountants on Accounting and Financial Disclosures |
61 |
|
Item 9A |
|
61 |
|
|
Item 9B |
|
61 |
|
|
|
|
|
|
|
PART III |
|
||
|
Item 10 |
|
61 |
|
|
Item 11 |
|
61 |
|
|
Item 12 |
|
Security Ownership of Certain Beneficial Owners and Management and Related Stockholder Matters |
61 |
|
Item 13 |
|
Certain Relationships and Related Transactions, and Director Independence |
61 |
|
Item 14 |
|
61 |
|
|
|
|
|
|
|
PART IV |
|
||
|
Item 15 |
|
62 |
|
|
|
|
|
|
|
64 |
|||
|
|
|
|
|
|
65 |
|||
P. H. Glatfelter Company makes regular filings with the Securities and Exchange Commission (“SEC”), including this Annual Report on Form 10-K, as well as Quarterly Reports on Form 10-Q and Current Reports on Form 8-K. These filings are available, free of charge, on our website, www.glatfelter.com, and the SEC’s website at www.sec.gov. We also provide copies of our SEC filings at no charge upon request to Investor Relations at (717) 225-2719, ir@glatfelter.com, or by mail to Investor Relations, 96 South George Street, Suite 520, York, PA, 17401. In this filing, unless the context indicates otherwise, the terms “we,” “us,” “our,” “the Company,” or “Glatfelter” refer to P. H. Glatfelter Company and subsidiaries.
|
ITEM 1 |
Overview Glatfelter began operations in 1864, and we believe we are one of the world’s leading manufacturers of specialty papers and fiber-based engineered materials. We are headquartered in York, Pennsylvania, and we own and operate manufacturing facilities in, Pennsylvania, Ohio, Canada, Germany, the United Kingdom, France, and the Philippines and we have sales and distribution offices in Russia and China. We are constructing a new manufacturing facility in Arkansas which is expected to be operational by the end of 2017. Exclusive of Arkansas, our ten manufacturing facilities have a combined production capacity of approximately 1.1 million tons of specialty papers and airlaid products used in a wide array of applications.
Strategy Our strategy is focused on growing, organically and by acquisition, in our key global growth markets including single-serve coffee and tea products, nonwoven wall cover materials, electrical products, hygiene and wipes products, and other technical engineered materials. We partner with leading consumer product companies and other market leaders to provide innovative solutions delivering outstanding performance to meet market requirements. Over the past several years, we have made investments to increase production capacity and improve our technical capabilities to ensure we are best positioned to serve the market demands and grow our revenue. We are committed to growing in our key markets and expect to make additional investments to support our customers and satisfy market demands. Consistent with this strategy, we are investing approximately $80 million to build a new advanced airlaid facility in Arkansas to service the North America market. Production at the new facility is expected to begin in late 2017 with annual production capacity of approximately 22,000 short tons. The investment increases our total global airlaid materials capacity to approximately 129,000 short tons.
New product development and new business development are critical components of our business.
During 2016, 2015 and 2014, we invested $10.3 million, $10.4 million and $12.3 million, respectively, in new product development activities. In each of the past three years, in excess of 50% of net sales were generated from products developed, enhanced or improved within the past five years.
In addition, our business strategy includes expanding product margins and generating strong free cash flows driven by delivering on cost reduction and continuous improvement initiatives and by making strategic investments designed to improve our returns on invested capital.
Acquisitions Over the past several years, we have completed a number of acquisitions that have diversified our revenue, expanded our geographic footprint and enhanced our asset base. Our acquisition strategy is focused on targeting investments in adjacent or closely related markets and which complement our long-term strategy of driving growth in core markets. Since 2006, we have successfully completed six acquisitions demonstrating our ability to establish leading market positions through the successful acquisition and integration of complementary businesses.
Business Units We manage our company as three separate business units: Composite Fibers; Advanced Airlaid Materials; and Specialty Papers. Consolidated net sales and the relative net sales contribution of each of our business units for the past three years are summarized below:
|
Dollars in thousands |
2016 |
|
|
|
2015 |
|
|
2014 |
|
|
|||
|
Net sales |
$ |
1,604,797 |
|
|
|
$ |
1,661,084 |
|
|
$ |
1,802,415 |
|
|
|
Business unit contribution |
|
|
|
|
|
|
|
|
|
|
|
|
|
|
Composite Fibers |
|
32.2 |
% |
|
|
|
32.6 |
% |
|
|
34.3 |
% |
|
|
Advanced Airlaid Materials |
|
15.2 |
|
|
|
|
14.7 |
|
|
|
15.6 |
|
|
|
Specialty Papers |
|
52.6 |
|
|
|
|
52.7 |
|
|
|
50.1 |
|
|
|
Total |
|
100.0 |
% |
|
|
|
100.0 |
% |
|
|
100.0 |
% |
|
Net tons sold by each business unit for the past three years were as follows:
|
Short tons |
2016 |
|
|
|
2015 |
|
|
2014 |
|
|
|||
|
Composite Fibers |
|
151,766 |
|
|
|
|
153,766 |
|
|
|
157,336 |
|
|
|
Advanced Airlaid Materials |
|
99,037 |
|
|
|
|
95,957 |
|
|
|
99,667 |
|
|
|
Specialty Papers |
|
794,318 |
|
|
|
|
802,188 |
|
|
|
802,878 |
|
|
|
Total |
|
1,045,121 |
|
|
|
|
1,051,911 |
|
|
|
1,059,881 |
|
|
Composite Fibers Our Composite Fibers business unit serves customers globally and focuses on higher value-added products in the following markets:
|
|
• |
Food & Beverage filtration paper primarily used for single-serve coffee and tea products; |
|
|
• |
Wallcovering base materials used by the world’s largest wallpaper manufacturers; |
|
GLATFELTER 2016 FORM 10-K |
1 |
|
|
• |
Metallized products used in labels, packaging liners, gift wrap, and other consumer product applications; |
|
|
• |
Composite Laminates paper used in production of decorative laminates, furniture, and flooring applications; and |
|
|
• |
Technical Specialties a diverse line of special paper products used in applications such as electrical energy storage, transport and transmission, wipes, and other highly-engineered fiber-based applications. |
We believe Composite Fibers maintains a market leadership position in the single-serve coffee and tea markets, nonwoven wallcover base material and many others of the products it produces. This business unit’s revenue composition by market consisted of the following for the years indicated:
|
In thousands |
2016 |
|
|
|
2015 |
|
|
2014 |
|
|
|||
|
Food & beverage |
$ |
258,463 |
|
|
|
$ |
274,865 |
|
|
$ |
296,304 |
|
|
|
Wallcovering |
|
90,767 |
|
|
|
|
91,620 |
|
|
|
149,957 |
|
|
|
Metallized |
|
61,059 |
|
|
|
|
68,397 |
|
|
|
80,839 |
|
|
|
Composite laminates |
|
35,107 |
|
|
|
|
34,897 |
|
|
|
38,159 |
|
|
|
Technical specialties and other |
|
71,558 |
|
|
|
|
71,689 |
|
|
|
52,592 |
|
|
|
Total |
$ |
516,954 |
|
|
|
$ |
541,468 |
|
|
$ |
617,851 |
|
|
A significant portion of this business unit’s revenue is transacted in currencies other than the U.S. dollar and therefore the comparison from period to period reflects the impact of changes in currency exchange rates. Changes in exchange rates unfavorably affected the comparison of 2016 to 2015 by $11.1 million and by $75.8 million in the comparison of 2015 to 2014.
We believe many of the markets served by Composite Fibers present attractive growth opportunities due to evolving consumer preferences, new or emerging geographic markets, and increased market share through superior products and quality. We also believe growth opportunities exist as a result of new product innovations. Many of this business’ papers are extremely lightweight, technically sophisticated, require specialized fibers, and require specifically designed papermaking equipment and production processes. Our proven capability to produce these demanding products and our focus on customer relationships positions us well to compete in these global markets.
The primary raw materials used in the production of our lightweight papers are abaca pulp, wood pulp and synthetic fibers. Sufficient quantities of abaca pulp and its source abaca fiber are required to support growth in this business unit. Abaca pulp, a specialized pulp with limited sources of availability, is produced by our Philippine mill, which provides a unique advantage to our Composite Fibers business unit. In the event the supply of abaca fiber becomes constrained or when production demands exceed the capacity of the Philippines mill, alternative sources
and/or substitute fibers are used to meet customer demands.
The Composite Fibers business unit is comprised of five paper making facilities (Germany, France and England), two metallizing operations (Wales and Germany) and a pulp mill (the Philippines). The combined attributes of the facilities are summarized as follows:
|
Production Capacity (short tons) |
|
Principal Raw Material (“PRM”) |
|
Estimated Annual Quantity of PRM (short tons) |
|
|
|
|
155,500 lightweight and other paper |
|
Abaca pulp |
|
|
14,500 |
|
|
|
|
|
Wood pulp |
|
|
93,000 |
|
|
|
|
|
Synthetic fiber |
|
|
22,000 |
|
|
|
28,000 metallized |
|
Base stock |
|
|
28,000 |
|
|
|
18,000 abaca pulp |
|
Abaca fiber |
|
|
25,800 |
|
|
Composite Fibers’ lightweight products are produced using highly specialized inclined wire paper machine technology. We believe we currently maintain approximately 25% of the global inclined wire capacity.
In addition to critical raw materials, Composite Fibers’ production cost is influenced by energy prices, particularly natural gas. The business unit generates all of its steam needed for production by burning natural gas. However, in 2016, it purchased approximately 75% of its electricity needs the cost of which is influenced by the natural gas markets.
In Composite Fibers’ markets, competition is product line specific as the necessity for technical expertise and specialized manufacturing equipment limits the number of companies offering multiple product lines. The following chart summarizes key competitors by market segment:
|
Market segment |
Competitor |
|
|
Single serve coffee & tea |
Ahlstrom, Purico, MB Papeles and Zhejiang Kan |
|
|
Nonwoven wallcovering |
Technocell, Neu Kaliss, and Goznak |
|
|
Composite laminates |
Schweitzer-Maudit, Purico, MB Papeles and Oi Feng |
|
|
Metallized |
AR Metallizing, Torras Papel Novelis, Vaassen, Galileo Nanotech, and Wenzhou Protec Vacuum Metallizing Co. |
|
Our strategy in Composite Fibers is focused on:
|
|
• |
capitalizing on growing global markets in food & beverage, electrical products and consumer products; |
|
|
• |
optimizing capacity utilization provided by the investment in state-of-the-art inclined wire technology to support consistent growth of key markets; |
|
|
• |
enhancing product mix across all markets by utilizing new product and new business development capabilities; |
2
|
|
• |
maximize continuous improvement methodologies to increase productivity, reduce costs and expand capacity; and |
|
|
• |
ensuring readily available access to specialized raw material requirements to support projected growth. |
Advanced Airlaid Materials Our Advanced Airlaid Materials business unit is a leading global supplier of highly absorbent cellulose-based airlaid nonwoven materials primarily used to manufacture consumer products for growing global end-user markets. The markets served by Advanced Airlaid Materials include:
|
|
• |
feminine hygiene; |
|
|
• |
specialty wipes; |
|
|
• |
adult incontinence; |
|
|
• |
home care; and |
|
|
• |
other consumer products. |
Advanced Airlaid Materials serves customers who are industry leading consumer product companies as well as private label converters. We believe this business unit holds leading market share positions in many of the markets it serves. Advanced Airlaid Materials has developed long-term customer relationships through superior quality, customer service, and a reputation for quickly bringing product and process innovations to market.
Advanced Airlaid Materials’ revenue composition by market consisted of the following for the years indicated:
|
In thousands |
2016 |
|
|
|
2015 |
|
|
2014 |
|
|
|||
|
Feminine hygiene |
$ |
173,902 |
|
|
|
$ |
182,048 |
|
|
$ |
216,836 |
|
|
|
Specialty wipes |
|
25,206 |
|
|
|
|
22,950 |
|
|
|
16,002 |
|
|
|
Adult incontinence |
|
12,281 |
|
|
|
|
10,720 |
|
|
|
17,586 |
|
|
|
Home care |
|
12,630 |
|
|
|
|
13,345 |
|
|
|
15,401 |
|
|
|
Other |
|
20,243 |
|
|
|
|
15,526 |
|
|
|
15,848 |
|
|
|
Total |
$ |
244,262 |
|
|
|
$ |
244,589 |
|
|
$ |
281,673 |
|
|
A significant portion of this business unit’s revenue is transacted in currencies other than the U.S. dollar and therefore the comparison from period to period reflects the impact of changes in currency exchange rates. Changes in exchange rates unfavorably affected the comparison of 2015 to 2014 by $25.1 million. The effect of currency changes was not material in 2016 compared with 2015.
The feminine hygiene category accounted for 71% of Advanced Airlaid Material’s revenue in 2016. The majority of sales of this product are to a small group of large, leading global consumer products companies. These markets are considered to be more growth oriented due to population growth in certain geographic regions and changing consumer preferences. In developing
regions, demand is also influenced by increases in disposable income and cultural preferences.
The Advanced Airlaid Materials business unit operates state-of-the-art facilities in Falkenhagen, Germany and Gatineau, Canada. The Falkenhagen location operates three multi-bonded production lines and three proprietary single-lane festooners. The Gatineau location consists of two airlaid production lines employing multi-bonded and thermal-bonded airlaid technologies and two proprietary single-lane festooners. In addition, we are building a new production facility in Fort Smith, Arkansas which is expected to be operational in late 2017 with an annual capacity of approximately 22,000 short tons and will primarily serve the growing demand for wipes and hygiene airlaid products in North America.
The business unit’s two existing facilities operate with the following combined attributes:
|
Airlaid Production Capacity (short tons) |
|
|
Principal Raw Material (“PRM”) |
|
Estimated Annual Quantity of PRM (short tons) |
|
|
||
|
|
107,000 |
|
|
Fluff pulp |
|
|
81,000 |
|
|
In addition to the cost of critical raw materials, our cost to produce is impacted by energy. Advanced Airlaid Materials purchases substantially all of the electricity and natural gas used in its operations. Approximately 90% of this business unit’s revenue is earned under contracts with pass-through provisions directly related to the cost of key raw materials.
Advanced Airlaid Materials continues to be a technology and product innovation leader in technically demanding segments of the airlaid market. This business unit’s airlaid material production employs multi-bonded and thermal-bonded airlaid technologies as opposed to other methods such as hydrogen-bonding. We believe that its facilities are among the most modern and flexible airlaid facilities in the world, allowing it to produce at industry leading operating rates. Its proprietary single-lane festooning technology provides converting and product packaging which supports efficiency optimization by the customers converting processes. This business unit’s in-house technical expertise, combined with significant capital investment requirements and rigorous customer expectations creates large barriers to entry for new competitors.
The following summarizes this business unit’s key competitors:
|
Market segment |
Competitor |
|
|
Airlaid products |
Georgia-Pacific LLC, Fitesa, McAirlaid's GmbH, Domtar |
|
|
GLATFELTER 2016 FORM 10-K |
3 |
The global markets served by this business unit are characterized by attractive growth opportunities. To take advantage of this, our strategy is focused on:
|
|
• |
maintaining and expanding relationships with customers that are market-leading consumer product companies as well as companies distributing through private label arrangements; |
|
|
• |
capitalizing on our product and process innovation capabilities; |
|
|
• |
expanding geographic reach of markets served; |
|
|
• |
optimizing the use of existing production capacity; and |
|
|
• |
employing continuous improvement methodologies and initiatives to reduce costs, improve efficiencies and create additional capacity. |
Specialty Papers Our North America-based Specialty Papers business unit focuses on producing papers for the following markets:
|
|
• |
Carbonless & non-carbonless forms papers for credit card receipts, multi-part forms, security papers and other end-user applications; |
|
|
• |
Engineered products for high speed ink jet printing, office specialty products, greeting cards, and other niche specialty applications; |
|
|
• |
Envelope and converting papers primarily utilized for transactional and direct mail envelopes; and |
|
|
• |
Book publishing papers for the production of high-quality hardbound books and other book publishing needs. |
This business unit produces both commodity products and higher-value-added specialty products. Specialty Papers’ revenue composition by market consisted of the following for the years indicated:
|
In thousands |
2016 |
|
|
|
2015 |
|
|
2014 |
|
|
|||
|
Carbonless & forms |
$ |
319,648 |
|
|
|
$ |
349,831 |
|
|
$ |
376,959 |
|
|
|
Engineered products |
|
189,463 |
|
|
|
|
190,943 |
|
|
|
194,189 |
|
|
|
Envelope & converting |
|
173,362 |
|
|
|
|
178,067 |
|
|
|
183,194 |
|
|
|
Book publishing |
|
157,541 |
|
|
|
|
152,647 |
|
|
|
144,744 |
|
|
|
Other |
|
3,568 |
|
|
|
|
3,538 |
|
|
|
3,805 |
|
|
|
Total |
$ |
843,582 |
|
|
|
$ |
875,026 |
|
|
$ |
902,891 |
|
|
Many of the market segments served by Specialty Papers are characterized by declining demand resulting in an industry with excess capacity, lower operating rates and pricing pressure. As a result, over the past several years, certain producers have closed, reduced or repurposed production capacity in an attempt to bring supply balance to the market. In addition, foreign producers have created additional imbalance by shipping product to the U.S. when market pricing is favorable or the U.S. dollar is stronger. Maintaining the supply and demand balance will require
the industry to continually remove capacity sufficient to match declining demand.
Despite our exposure to these declining markets, in each of the past twelve years, we have outperformed the broader uncoated free sheet market in terms of shipping volume. We have been successful at maintaining this business unit’s shipments by leveraging the flexibility of our assets base to respond to new product and new business development opportunities, efficiently responding to changing customer demands and delivering superior customer service.
We are one of the leading suppliers of carbonless and book publishing papers in the United States. Although the markets for these products are declining, we have been successful in executing our strategy to replace this lost volume with products such as envelope papers, business forms, and other value-added specialty engineered products. Specialty Papers envelope papers market is also declining, however we have leveraged our customer service capabilities and geographic locations to grow our market share in each of the last several years.
Specialty Papers’ highly technical engineered products include high speed ink jet printing papers, office specialty products, greeting cards, packaging, casting, release, transfer, playing card, postal, FDA-compliant food and other niche specialty applications. Such products comprise an array of distinct business niches that are in a continuous state of evolution. Many of these products are utilized for demanding, specialized customer and end-user applications. Some of our products are new and higher growth while others are more mature and further along in the product life cycle. Because many of these products are technically complex and involve substantial customer-supplier development collaboration, they typically command higher per ton prices and generally exhibit greater pricing stability relative to commodity grade paper products.
The Specialty Papers business unit operates two integrated pulp and paper making facilities with the following combined attributes:
|
Uncoated Production Capacity (short tons) |
|
|
Principal Raw Material (“PRM”) |
|
Estimated Annual Quantity of PRM (short tons) |
|
|
||
|
|
815,000 |
|
|
Pulpwood |
|
|
2,340,000 |
|
|
|
|
|
|
|
Wood- and other pulps |
|
|
730,000 |
|
|
This business unit’s pulp mills have a combined pulp making capacity of 620,000 tons of bleached pulp per year. The principal raw material used to produce pulp is pulpwood, including both hardwoods and softwoods. Pulpwood is obtained from a variety of locations including the states of Pennsylvania, Maryland, Delaware, New Jersey, New York, West Virginia, Virginia, Kentucky, Ohio and Tennessee. To protect our sources of pulpwood, we actively promote conservation and forest management among suppliers and woodland owners.
4
The Spring Grove facility includes four uncoated paper machines as well as an off-line blade coater and a specialty coater which together provide annual production capacity for coated paper of approximately 65,000 tons. The Chillicothe facility operates four paper machines producing uncoated and carbonless paper. Two of the machines have built-in coating capability which along with three additional coaters across the Ohio operations’ facilities provide annual coated capacity of approximately 126,000 tons.
In addition to critical raw materials, the cost to produce Specialty Papers’ products is influenced by energy. In 2016, the business unit generated all of its steam needed for production and generated more power than it consumes at the Spring Grove, PA facility, and it purchased approximately 25% of its electricity needed for the Chillicothe, OH mill. In connection with the conversion of the fuel source for its boilers from coal beginning in the fourth quarter of 2016, for the Chillicothe, OH mill and the first quarter of 2017, for the Spring Grove, PA mill, both facilities’ source of fuel is now predominantly natural gas.
In Specialty Papers’ markets, competition is product line specific due to the necessity for technical expertise and specialized manufacturing for certain products. The following chart summarizes key competitors by market segment:
|
Market segment |
Competitor |
|
|
Carbonless paper and forms |
Appvion, Inc., and to a lesser extent, Fibria Celulose, Koehler Paper, Mitsubishi Paper, Nekoosa Coated Products and Asia Pulp and Paper Co. |
|
|
Engineered products |
Specialty papers divisions of International Paper, Domtar Corp., Packaging Corp, and Sappi Limited, among others. |
|
|
Envelope & converting |
Domtar and International Paper |
|
|
Book publishing |
Domtar Corp., North Pacific Paper (NORPAC), Resolute Forest and others |
|
Customer service, product performance, technological advances and product pricing are important competitive factors with respect to all our products. We believe our reputation in these areas continues to be excellent.
To be successful in the market environment in which Specialty Papers operates, our strategy is focused on:
|
|
• |
new product and new business development capabilities to ensure optimal utilization of our capacity and to maximize margins; |
|
|
• |
leveraging our flexible operating platform to optimize product mix by shifting production among the machines in our system to more closely match output with changing demand trends; |
|
|
• |
driving operational excellence by utilizing ongoing continuous improvement |
|
|
• |
methodologies to ensure efficiencies and asset reliability; and |
|
|
• |
maintaining superior customer service. |
Additional financial information for each of our business units is included in Item 7 – Management’s Discussion and Analysis of Financial Condition and Results of Operations and in Item 8 – Financial Statements and Supplementary Data, Note 24 including geographic revenue and long-lived asset financial information.
Concentration of Customers For each of the past three years, no single customer represented more than 10% of our consolidated net sales. However, as discussed in Item 1A Risk Factors, one customer accounted for the majority of Advanced Airlaid Materials net sales in 2016, 2015 and 2014.
Capital Expenditures Our business is capital intensive and requires significant expenditures for equipment enhancements to support growth strategies, research and development initiatives, environmental compliance and for normal upgrades or replacements. Capital expenditures totaled $160.2 million, $99.9 million and $66.0 million in 2016, 2015 and 2014, respectively. For 2017, capital expenditures are estimated as follows:
|
In millions |
Low |
|
|
|
High |
|
||
|
Normal capital expenditures |
$ |
70 |
|
– |
|
$ |
80 |
|
|
Major Projects |
|
|
|
|
|
|
|
|
|
Airlaid capacity expansion |
|
45 |
|
– |
|
|
50 |
|
|
Specialty Papers' environmental compliance projects |
|
10 |
|
– |
|
|
10 |
|
|
Total |
$ |
125 |
|
– |
|
$ |
140 |
|
Environmental Matters We are subject to various federal, state and local laws and regulations intended to protect the environment as well as human health and safety. At various times, we have incurred significant costs to comply with these regulations and we could incur additional costs as new regulations are developed or regulatory priorities change.
We have incurred material capital costs to comply with new air quality regulations including the U.S. EPA Best Available Retrofit Technology rule (BART; otherwise known as the Regional Haze Rule) and the Boiler Maximum Achievable Control Technology rule (Boiler MACT). In order to comply with these rules, during 2015 and 2016 we completed process modifications on boilers at two of our facilities. We converted or replaced five coal-fired boilers to natural gas and upgraded site infrastructure to accommodate the new boilers, including connecting to a gas supply. The cost of these projects totaled approximately $113 million.
We are a defendant in the Fox River environmental site, a complex and significant matter. For a more
|
GLATFELTER 2016 FORM 10-K |
5 |
complete discussion of this matter and our exposure to potential additional costs, see Item 8 – Financial Statements and Supplementary Data – Note 21.
Employees As of December 31, 2016, we employed 4,346 people worldwide, of which approximately 67% are unionized. The United Steelworkers International Union and the Office and Professional Employees International Union represents approximately 1,440 hourly employees at our Chillicothe, OH and Spring Grove, PA facilities. We have separate labor agreements covering the Ohio and Pennsylvania operations. The three year agreement covering the Ohio operations expires in August 2019 and an agreement covering the Pennsylvania operations expired in February 2017 and is currently under negotiations. We consider the overall relationship with our employees to be satisfactory.
Other Available Information The Corporate Governance page of our website includes the Company’s Governance Principles, Code of Business Conduct, and biographies of our Board of Directors and Executive Officers. In addition, the website includes charters of the Audit, Compensation, Finance, and Nominating and Corporate Governance Committees of the Board of Directors. The Corporate Governance page also includes the Code of Business Ethics for the CEO and Senior Financial Officers of Glatfelter, our “whistle-blower” policy and other related material. We satisfy the disclosure requirement for any future amendments to, or waivers from, our Code of Business Conduct or Code of Business Ethics for the CEO and Senior Financial Officers by posting such information on our website. We will provide a copy of the Code of Business Conduct or Code of Business Ethics for the CEO and Senior Financial Officers, without charge, to any person who requests one, by contacting Investor Relations at (717) 225-2719, ir@glatfelter.com or by mail to 96 South George Street, Suite 520, York, PA, 17401.
|
ITEM 1A |
Our business and financial performance may be adversely affected by a weak global economic environment or downturns in the target markets that we serve.
Adverse global economic conditions could impact our target markets resulting in decreased demand for our products. Our results could be adversely affected if economic conditions weaken. In the event of significant currency weakening in the countries into which our products are sold, demand for or pricing of our products could be adversely impacted. Also, there may be periods during which demand for our products is insufficient to enable us to operate our production facilities in an economical manner. As a result, we may be forced to take machine downtime to curtail production to match demand. The economic environment may also cause
customer insolvencies which may result in their inability to satisfy their financial obligations to us. These conditions are beyond our control and may have a significant impact on our sales and results of operations.
Approximately $73.8 million of our revenue in 2016 was earned from customers located in Ukraine, Russia and members of the Commonwealth of Independent States (also known as “CIS”). Uncertain geo-political conditions, this region’s economic environment and weak currencies have caused and may continue to cause weak demand for our products and volatility in our customers buying patterns.
Approximately 28% of our net sales in 2016 were shipped to customers in Europe, the demand for which is dependent on economic conditions in this area, or to the extent such customers do business outside of Europe, in other regions of the world. Uncertain economic conditions in this region may cause weakness in demand for our products as well as volatility in our customers buying patterns.
Our airlaid materials capacity expansion project may not be successful due to unanticipated costs, unforeseen delays in production of commercially saleable products or softness in the demand for airlaid products.
We are investing approximately $80 million to construct a new airlaid production facility in Fort Smith, Arkansas, to allow us to better meet the growing demands for airlaid materials. The success of our $80 million investment to expand capacity for airlaid materials is dependent on a variety of factors including, among others:
|
|
i. |
our ability to complete the project, in all material respects, within budget and on schedule; |
|
|
ii. |
availability and costs of a qualified workforce; |
|
|
iii. |
qualification, and acceptance by, customers of products produced; |
|
|
iv. |
demand for airlaid materials and market growth rates; and |
|
|
v. |
technological changes and innovations. |
If we incur significant unforeseen costs or delays or if we are unable to produce commercially acceptable airlaid materials to meet growing demands, our results of operations and/or financial position may be adversely affected.
Foreign currency exchange rate fluctuations could adversely affect our results of operations.
A significant proportion of our revenue and earnings is generated from operations outside of the United States. In addition, we own and operate manufacturing facilities in Canada, Germany, France, the United Kingdom and the Philippines. A significant portion of our business is transacted in currencies other than the U.S. dollar including
6
the euro, British pound, Canadian dollars and Philippine peso, among others. Our euro denominated revenue exceeds euro expenses by an estimated €130 million. With respect to the British pound, Canadian dollar and Philippine peso, we have greater outflows than inflows of these currencies, although to a lesser degree than the euro. As a result, we are exposed to changes in currency exchange rates and such changes could be significant.
Economic weakness, the potential inability of certain European countries to continue to service their sovereign debt obligations, actions of this region’s central banks and disunity within the European Union memberships has caused, and could continue to cause, the value of the euro to weaken. As a result, our operating results could be negatively impacted. In the event that one or more European countries were to replace the euro with another currency, business may be adversely affected until stable exchange rates are established.
Our ability to maintain our products' price competitiveness is reliant, in part, on the relative strength of the currency in which the product is denominated compared to the currency of the market into which it is sold and the functional currency of our competitors. Changes in the rate of exchange of foreign currencies in relation to the U.S. dollar, and other currencies, may adversely impact our results of operations and our ability to offer products in certain markets at acceptable prices. For example, approximately $73.8 million of our revenue in 2016 was earned from shipments to customers located in Ukraine, Russia and members of the CIS. Although these sales are denominated in euros, a significant weakening of the customers’ local currencies has and may continue to adversely affect our revenue, our customers’ credit risk and our results of operation.
The cost of raw materials and energy used to manufacture our products could increase and the availability of certain raw materials could become constrained.
We require access to sufficient and reasonably priced quantities of pulpwood, purchased pulps, pulp substitutes, abaca fiber, synthetic fibers, and certain other raw materials, as well as access to reliable and abundant supply of water to support many of our production facilities.
Our Specialty Papers’ locations are vertically integrated manufacturing facilities that can generate approximately 85% of their annual pulp requirements.
Our Philippine mill purchases abaca fiber to produce abaca pulp, a key material used to manufacture paper for single-serve coffee, tea and technical specialty products at Composite Fibers’ facilities. At certain times, the supply of abaca fiber has been constrained or the quality diminished due to factors such as weather-related damage to the source crop as well as decisions by land
owners to produce alternative crops in lieu of those used to produce abaca fiber. These factors have contributed to volatility in fiber prices or limited available supply.
Our Advanced Airlaid Materials business unit requires access to sufficient quantities of fluff pulp, the supply of which is subject to availability of certain softwoods. Softwood availability can be limited by many factors, including weather in regions where softwoods are abundant.
The cost of many of our production materials, including petroleum based chemicals and freight charges, are influenced by the cost of oil. In addition, we recently completed the conversion of Specialty Papers’ boilers to burn natural gas as opposed to coal. Natural gas is now the principal source of fuel for each of our facilities worldwide.
Government rules, regulations and policies have an impact on the cost of certain energy sources, particularly for our European operations. In Europe, we currently benefit from a number of government sponsored programs related to, among others, green energy or renewable energy initiatives designed to mitigate the cost of electricity to larger industrial consumers of power. Any reduction in the extent of government sponsored incentives may adversely affect the cost ultimately borne by our operations. Furthermore, the European Commission is investigating certain energy programs in Germany from which we benefit as to whether the programs comply with European Union rules on state aid. The outcome of these investigations could require us to return certain benefits previously earned or reduce such benefits in the future and could impact our results of operations.
Although we have contractual cost pass-through arrangements with certain Advanced Airlaid Materials’ customers, we may not be able to fully pass increased raw materials or energy costs on to all customers if the market will not bear the higher price or if existing agreements limit price increases. If price adjustments significantly trail increases in raw materials or energy prices, our operating results could be adversely affected.
Our industry is highly competitive and increased competition could reduce our sales and profitability.
Specialty Papers The primary geographic market for our Specialty Papers business unit is the United States, which has been adversely affected by declining demand for uncoated free sheet, industry capacity exceeding demand, and increased imports from foreign competitors. As a result, the industry has historically taken steps to reduce capacity, although the timing of the reductions is uncertain. Slowing demand or increased competition could force us to lower our prices or to offer additional services at a higher cost to us, which could reduce our gross margins and net income. The greater financial
|
GLATFELTER 2016 FORM 10-K |
7 |
resources of certain of our competitors may enable them to commit larger amounts of capital in response to changing market conditions. Certain competitors may also have the ability to develop product or service innovations that could put us at a competitive disadvantage.
There have been periods of supply/demand imbalance in our industry which have caused pulp prices and our products’ selling prices to be volatile. The timing and magnitude of price increases or decreases in these markets have generally varied by region and by product type. A sustained period of weak demand or excess supply would likely adversely affect pulp prices and our products’ selling prices. This could have a material adverse effect on our operating and financial results.
Some of the other factors that may adversely affect our ability to compete in Specialty Papers’ markets include:
|
|
• |
the entry of new competitors into the markets we serve; |
|
|
• |
the prevalence of imported product, particularly uncoated free sheet, into the U.S.; |
|
|
• |
the willingness of commodity-based producers to enter our markets when they are unable to compete or when demand softens in their traditional markets; |
|
|
• |
the aggressiveness of our competitors’ pricing strategies, which could force us to decrease prices in order to maintain market share; |
|
|
• |
our failure to anticipate and respond to changing customer preferences; |
|
|
• |
the impact of electronic-based substitutes for certain of our products such as carbonless and forms, book publishing, and envelope papers; |
|
|
• |
the impact of replacement or disruptive technologies; |
|
|
• |
changes in end-user preferences; |
|
|
• |
our inability to develop new, improved or enhanced products; |
|
|
• |
our inability to maintain the cost efficiency of our facilities; and |
|
|
• |
the cost of regulatory environmental compliance requirements. |
Composite Fibers and Advanced Airlaid Materials The global markets in which we compete, although growing, are not as large as the markets for Specialty Papers. As a result, our ability to compete is more sensitive to, and may be adversely impacted by, the following:
|
|
• |
the entry of new competitors into the markets we serve; |
|
|
• |
the aggressiveness of our competitors’ pricing strategies, which could force us to decrease prices in order to maintain market share; |
|
|
• |
our failure to anticipate and respond to changing customer preferences; and |
|
|
• |
technological advances or changes that impact production or cost competiveness of our products. |
The impact of any significant changes may result in our inability to effectively compete in the markets in which we operate, and as a result our sales and operating results would be adversely affected.
We may not be able to develop new products acceptable to our existing or potential customers.
Our business strategy is market focused and includes investments in developing new products to meet the changing needs of our customers, serve new customers and to maintain our market share. Our success will depend, in part, on our ability to develop and introduce new and enhanced products that keep pace with introductions by our competitors and changing customer preferences. If we fail to anticipate or respond adequately to these factors, we may lose opportunities for business with both current and potential customers. The success of our new product offerings will depend on several factors, including our ability to:
|
|
• |
anticipate and properly identify our customers' needs and industry trends; |
|
|
• |
develop and commercialize new products and applications in a timely manner; |
|
|
• |
price our products competitively; |
|
|
• |
differentiate our products from our competitors' products; and |
|
|
• |
invest efficiently in research and development activities. |
Our inability to develop new products or new business opportunities could adversely impact our business and ultimately harm our profitability.
We are subject to substantial costs and potential liability for environmental matters.
We are subject to various environmental laws and regulations that govern our operations, including discharges into the environment, and the handling and disposal of hazardous substances and wastes. We are also subject to laws and regulations that impose liability and clean-up responsibility for releases of hazardous substances into the environment. To comply with environmental laws and regulations, we have incurred, and will continue to incur, substantial capital and operating expenditures. The Clean Air Act, and similar regulations, has imposed significant compliance costs and
8
required significant capital expenditures. Compliance with the Clean Air Act resulted in significant process modifications to the boilers at two of our facilities.
We anticipate that environmental regulation of our operations will continue to become more burdensome and that capital and operating expenditures necessary to comply with environmental regulations will continue, and perhaps increase, in the future. Because environmental regulations are not consistent worldwide, our ability to compete globally may be adversely affected by capital and operating expenditures required for environmental compliance. In addition, we may incur obligations to remove or mitigate any adverse effects on the environment, such as air and water quality, resulting from mills we operate or have operated. Potential obligations include compensation for the restoration of natural resources, personal injury and property damages. See Item 1 – Environmental Matters for an additional discussion of expected costs to comply with environmental regulations.
We have exposure to potential liability for remediation and other costs related to the presence of polychlorinated biphenyls (PCBs) in the lower Fox River on which our former Neenah, Wisconsin mill was located. As more fully discussed in Item 8 – Financial Statements and Supplementary Data – Note 21, in 2016 and 2015, we increased our reserve for potential liabilities by $40.0 million and $10 million, respectively. The increase recorded in 2016 was based on our current evaluation of recent developments, particularly a proposed consent decree between two other defendants and the government agencies. We have financial reserves for this matter but we cannot be certain that those reserves will be adequate to provide for future obligations related to this matter, that our share of costs and/or damages will not exceed our available resources, or that such obligations will not have a long-term, material adverse effect on our consolidated financial position, liquidity or results of operations.
Our environmental issues are complex and should be reviewed in the context set forth in more detail in Item 8 – Financial Statements and Supplementary Data – Note 21.
The Advanced Airlaid Materials business unit generates a substantial portion of its revenue from one customer serving the hygiene products market, the loss of which could have a material adverse effect on our results of operations.
The majority of Advanced Airlaid Materials’ sales of hygiene products are to one customer. In addition, sales to the feminine hygiene market accounted for 71% of Advanced Airlaid Materials’ net sales in 2016 and sales are concentrated within a small group of large customers. The loss of the large customer or a decline in sales of hygiene products could have a material adverse effect on this business’s operating results. Our ability to effectively
compete could be affected by technological production alternatives which could provide substitute products into this market segment. Customers in the airlaid nonwoven fabric material market, including the hygiene market, may also switch to less expensive products, change preferences or otherwise reduce demand for Advanced Airlaid Material’s products, thus reducing the size of the markets in which it currently sells its products. Any of the foregoing could have a material adverse effect on our financial performance and business prospects.
Our operations may be impaired and we may be exposed to potential losses and liability as a result of natural disasters, acts of terrorism or sabotage or similar events.
If we have a catastrophic loss or unforeseen operational problem at any of our facilities, we could suffer significant lost production which could impair our ability to satisfy customer demands.
Natural disasters, such as earthquakes, hurricanes, typhoons, flooding or fire, and acts of terrorism or sabotage affecting our operating activities and major facilities could materially and adversely affect our operations, operating results and financial condition.
In addition, we own and maintain two dams in York County, Pennsylvania, that were built to ensure a steady supply of water for the operation of our facility in Spring Grove which is a primary manufacturing location for our envelope papers and engineered products. Each of these dams is classified as “high hazard” by the Commonwealth of Pennsylvania because they are located in close proximity to inhabited areas. Any sudden failure of a dam, including as a result of natural disaster or act of terrorism or sabotage, would endanger occupants and residential, commercial and industrial structures, for which we could be liable. The failure of a dam could also be extremely disruptive and result in damage to, or the shutdown of, our Spring Grove mill. Any losses or liabilities incurred due to the failure of one of our dams may not be fully covered by or may substantially exceed the limits of our insurance policies and could materially and adversely affect our operating results and financial condition.
In addition, many of our papermaking operations require a reliable and abundant supply of water. Such mills rely on a local water body or water source for their water needs and, therefore, are particularly sensitive to drought conditions or other natural or manmade interruptions to water supplies. At various times and for differing periods, each of our mills has had to modify operations due to water shortages, water clarity, or low flow conditions in its principal water supplies. Any interruption or curtailment of operations at any of our production facilities due to drought or low flow conditions at the principal water source or another cause could materially and adversely affect our operating results and financial condition.
|
GLATFELTER 2016 FORM 10-K |
9 |
Our pulp mill in Lanao del Norte on the Island of Mindanao in the Republic of the Philippines is located along the Pacific Rim, one of the world’s hazard belts. By virtue of its geographic location, this mill is subject to similar types of natural disasters discussed above, cyclones, typhoons, and volcanic activity. Moreover, the area of Lanao del Norte has been a target of suspected terrorist activities. Our pulp mill in Mindanao is located in a rural portion of the island and is susceptible to attacks and/or power interruptions. The Mindanao mill supplies the abaca pulp used by our Composite Fibers business unit to manufacture paper for single serve coffee and tea products and certain technical specialties products. Any interruption, loss or extended curtailment of operations at our Mindanao mill could affect our ability to meet customer demands for our products and materially affect our operating results and financial condition.
We have operations in a potentially politically and economically unstable location.
Our pulp mill in the Philippines is located in a region that is unstable and subject to political unrest. As discussed above, our Philippine pulp mill produces abaca pulp, a significant raw material used by our Composite Fibers business unit, and is currently our main provider of abaca pulp. There are limited suitable alternative sources of readily available abaca pulp in the world. In the event of a disruption in supply from our Philippine mill, there is no guarantee that we could obtain adequate amounts of abaca pulp, if at all, from alternative sources at a reasonable price. Further, there is no assurance the performance of such alternative materials will satisfy customer performance requirements. As a consequence, any civil disturbance, unrest, political instability or other event that causes a disruption in supply could limit the availability of abaca pulp and would increase our cost of obtaining abaca pulp. Such occurrences could adversely impact our sales volumes, revenues and operating results.
Our international operations pose certain risks that may adversely impact sales and earnings.
We have significant operations and assets located in Canada, Germany, France, the United Kingdom, and the Philippines. Our international sales and operations are subject to a number of unique risks, in addition to the risks in our domestic sales and operations, including differing protections of intellectual property, trade barriers, labor unrest, exchange controls, regional economic uncertainty, differing (and possibly more stringent) labor regulation, risk of governmental expropriation, domestic and foreign customs and tariffs, differing regulatory environments, difficulty in managing widespread operations and political instability. These factors may adversely affect our future profits. Also, in some foreign jurisdictions, we may be subject to laws limiting the right and ability of entities organized or operating therein to pay dividends or remit earnings to
affiliated companies unless specified conditions are met. Any such limitations would restrict our flexibility in using funds generated in those jurisdictions.
We are subject to cyber-security risks related to unauthorized or malicious access to sensitive customer, vendor, company or employee information as well as to the technology that supports our operations and other business processes.
Our business operations rely upon secure systems for mill operations, and data capture, processing, storage and reporting. Although we maintain appropriate data security and controls, our information technology systems, and those of our third party providers, could become subject to cyber attacks. Systems such as ours are inherently exposed to cyber-security risks and potential attacks. The result of such attacks could result in a breach of data security and controls. Such a breach of our network, systems, applications or data could result in operational disruptions or damage or information misappropriation including, but not limited to, interruption to systems availability, denial of access to and misuse of applications required by our customers to conduct business with us, denial of access to the applications we use to plan our operations, procure materials, manufacture and ship products and account for orders, theft of intellectual knowhow and trade secrets, and inappropriate disclosure of confidential company, employee, customer or vendor information, could stem from such incidents.
Any of these operational disruptions and/or misappropriation of information could adversely affect our results of operations, create negative publicity and could have a material effect on our business.
We operate in and are subject to taxation from numerous U.S. and foreign jurisdictions.
The multinational nature of our business subjects us to taxation in the U.S and numerous foreign jurisdictions. Due to economic and political conditions, tax rates in various jurisdictions may be subject to significant change. Our effective tax rates could be affected by changes in tax laws or their interpretation or changes in the mix of earnings in jurisdictions with differing statutory tax rates, changes in the valuation of deferred tax assets and liabilities. For example, the European Commission has opened formal investigations to examine whether decisions by the tax authorities in certain European countries comply with European Union rules on state aid. The outcome of the European Commission’s investigations could require changes to existing tax rulings that, in turn, could have an impact on our income taxes and results of operations.
10
In the event any of the above risk factors impact our business in a material way or in combination during the same period, we may be unable to generate sufficient cash flow to simultaneously fund our operations, finance capital expenditures, satisfy obligations and make dividend payments on our common stock.
In addition to debt service obligations, our business is capital intensive and requires significant expenditures to support growth strategies, research and development initiatives, environmental compliance, and for normal upgrades or replacements. We expect to meet all of our near and long-term cash needs from a combination of operating cash flow, cash and cash equivalents, availability under our existing credit facility or other long-term debt. If we are unable to generate sufficient cash flow from these sources, we could be unable to fund our operations, finance capital expenditures, satisfy our near and long-term cash needs or make dividend payments.
|
ITEM 1B |
None.
|
ITEM 2 |
We own substantially all of the land and buildings comprising our manufacturing facilities located in Arkansas; Pennsylvania; Ohio; Canada; the United Kingdom; Germany; France; and the Philippines; as well as substantially all of the equipment used in our manufacturing and related operations. Certain of our operations are under lease arrangements including our metallized paper production facility located in Caerphilly, Wales, office and warehouse space in Moscow, Russia, Souzou, China and our corporate offices in York, Pennsylvania. All of our properties, other than those that are leased, are free from any material liens or encumbrances. We consider all of our buildings to be in good structural condition and well maintained and our properties to be suitable and adequate for present operations.
|
ITEM 3 |
We are involved in various lawsuits that we consider to be ordinary and incidental to our business. The ultimate outcome of these lawsuits cannot be predicted with certainty; however, except with respect to the Fox River matter referred to below, we do not expect such lawsuits, individually or in the aggregate, will have a material adverse effect on our consolidated financial position, liquidity or results of operations.
We are one of several defendants in a significant environmental matter relating to contamination in the Fox River and Bay of Green Bay in Wisconsin. For a discussion this matter, see Item 8 – Financial Statements and Supplementary Data – Note 23.
The following table sets forth certain information with respect to our executive officers and senior management as of February 24, 2017
|
Name |
Age |
Office with the Company |
|
Dante C. Parrini |
52 |
Chairman and Chief Executive Officer |
|
John P. Jacunski |
51 |
Executive Vice President, Chief Financial Officer |
|
Christopher W. Astley |
44 |
Senior Vice President & Business Unit President, Advanced Airlaid Materials |
|
Timothy R. Hess |
50 |
Senior Vice President & Business Unit President, Specialty Papers |
|
Martin Rapp |
57 |
Senior Vice President & Business Unit President, Composite Fibers |
|
William T. Yanavitch II |
56 |
Senior Vice President, Human Resources and Administration |
|
David C. Elder |
48 |
Vice President, Finance |
|
Samuel L. Hillard |
35 |
Vice President, Corporate Development & Strategy |
|
Kent K. Matsumoto |
57 |
Vice President, General Counsel and Corporate Secretary |
Officers are elected to serve at the pleasure of the Board of Directors. Except in the case of officers elected to fill a new position or a vacancy occurring at some other date, officers are generally elected at the organizational meeting of the Board of Directors held immediately after the annual meeting of shareholders.
Dante C. Parrini became Chief Executive Officer effective January 1, 2011 and Chairman of the Board in May 2011. Prior to this, he was Executive Vice President and Chief Operating Officer, a position he held since February 2005. Mr. Parrini joined us in 1997 and previously served as Senior Vice President and General Manager, a position he held beginning in January 2003 and prior to that as Vice President responsible for Sales and Marketing.
John P. Jacunski was promoted to Executive Vice President and Chief Financial Officer in February 2014. From April 2016 through January 2017, Mr. Jacunski also served as President of the Specialty Papers business unit. He joined us in October 2003 and served as Vice President and Corporate Controller. In July 2006 he was promoted to Senior Vice President and Chief Financial Officer. Mr. Jacunski was previously Vice President and Chief Financial Officer at WCI Steel, Inc. from June 1999 to October 2003. Prior to joining WCI, Mr. Jacunski was with KPMG, an international accounting and consulting firm, where he served in various capacities.
Christopher W. Astley was named Senior Vice President & Business Unit President, Advanced Airlaid Materials in January 2015. He joined us in August 2010 as Vice President, Corporate Strategy and was promoted to Senior Vice President in February 2014. Prior to joining us, he was an entrepreneur leading a privately held business from 2004 until 2010. Prior to that Mr. Astley held positions with Accenture, a global management consulting firm, and The Coca-Cola Company.
|
GLATFELTER 2016 FORM 10-K |
11 |
Timothy R. Hess was named Senior Vice President & Business Unit President, Specialty Papers in January 2017. Prior to this, Tim served as Vice President Sales & Marketing, Specialty Papers since 2014, and he was the General Manager – Engineered & Converting Products Division from 2008 - 2014. Since joining our company in 1994, Mr. Hess has held various technical, manufacturing, sales and business development positions within Glatfelter.
Martin Rapp serves as Senior Vice President & Business Unit President, Composite Fibers. Mr. Rapp joined us in August 2006 and has led the Composite Fibers business unit since that time. Prior to this, he was Vice President and General Manager of Avery Dennison’s Roll Materials Business in Central and Eastern Europe since August 2002.
William T. Yanavitch II was promoted to Senior Vice President Human Resources and Administration in February 2014. Since joining us in July 2000, he has served as Vice President, Human Resources. Prior to working for us he was with Dentsply International and Gould Pumps Inc. in various leadership capacities. Mr. Yanavitch will be retiring from Glatfelter effective March 31, 2017.
David C. Elder was named Vice President, Finance in December 2011 and serves as our chief accounting officer. Prior to his promotion, he was our Vice President, Corporate Controller, a position held since joining Glatfelter in January 2006. Mr. Elder was previously Corporate Controller for YORK International Corporation.
Samuel L. Hillard joined us in March 2016 as Vice President, Corporate Development & Strategy. Prior to joining us, Mr. Hillard was Vice President – Business Development for Dover Corporation from July 2014 until 2016 where he was responsible for strategy and mergers & acquisitions within the Fluids Business Segment. From February 2011 to 2014, he served as Vice President – Business Development for SPX Corporation where he was responsible for all M&A related strategy activity within the Flow Technology Segment. Additionally, he previously worked for Blackstone in their M&A group.
Kent K. Matsumoto was appointed Vice President, General Counsel and Corporate Secretary in October 2013. Mr. Matsumoto joined us in June 2012 as Assistant General Counsel and also served as interim General Counsel from March 2013 to October 2013. From July 2008 until February 2012, he was Associate General Counsel for Wolters Kluwer.
|
ITEM 4 |
Not Applicable
|
ITEM 5 |
MARKET FOR REGISTRANT'S COMMON EQUITY, RELATED STOCKHOLDER MATTERS AND ISSUER PURCHASES OF EQUITY SECURITIES |
Common Stock Prices and Dividends Declared Information
The following table shows the high and low prices of our common stock traded on the New York Stock Exchange under the symbol “GLT” and the dividend declared per share for each quarter during the past two years:
|
Quarter |
High |
|
Low |
|
Dividend |
|
2016 |
|
|
|
|
|
|
Fourth |
$25.49 |
|
$17.50 |
|
$0.125 |
|
Third |
23.43 |
|
19.16 |
|
0.125 |
|
Second |
23.81 |
|
18.50 |
|
0.125 |
|
First |
20.94 |
|
14.09 |
|
0.125 |
|
2015 |
|
|
|
|
|
|
Fourth |
$20.09 |
|
$16.28 |
|
$0.12 |
|
Third |
22.47 |
|
16.56 |
|
0.12 |
|
Second |
27.40 |
|
21.81 |
|
0.12 |
|
First |
27.58 |
|
22.18 |
|
0.12 |
As of February 24, 2017, we had 1,024 shareholders of record.
12
The following graph compares the cumulative 5-year total return of our common stock with the cumulative total returns of both a peer group and a broad market index. We compare our stock performance to the S&P Small Cap 600 Paper Products index comprised of us, Clearwater Paper Corp., Kapstone Paper & Packaging Corp., Neenah Paper Inc., and Schweitzer-Mauduit International. In addition, the chart includes a comparison to the Russell 2000, which we believe is an appropriate benchmark index for stocks such as ours. The following graph assumes that the value of the investment in our common stock, in each index, and in the peer group (including reinvestment of dividends) was $100 on December 31, 2011 and charts it through December 31, 2016.

|
As of or for the year ended December 31 Dollars in thousands, except per share |
2016 |
|
|
|
2015 |
|
|
2014 |
|
|
2013 |
|
(1) |
2012 |
|
|
|||||
|
Net sales |
$ |
1,604,797 |
|
|
|
$ |
1,661,084 |
|
|
$ |
1,802,415 |
|
|
$ |
1,722,615 |
|
|
$ |
1,577,788 |
|
|
|
Energy and related sales, net |
|
6,141 |
|
|
|
|
5,664 |
|
|
|
7,927 |
|
|
|
3,153 |
|
|
|
7,000 |
|
|
|
Total revenue |
|
1,610,938 |
|
|
|
|
1,666,748 |
|
|
|
1,810,342 |
|
|
|
1,725,768 |
|
|
|
1,584,788 |
|
|
|
|
|
|
|
|
|
|
|
|
|
|
|
|
|
|
|
|
|
|
|
|
|
|
(Losses) gains on dispositions of plant, equipment and timberlands, net |
|
(216 |
) |
|
|
|
21,113 |
|
|
|
4,861 |
|
|
|
1,726 |
|
|
|
9,815 |
|
|
|
|
|
|
|
|
|
|
|
|
|
|
|
|
|
|
|
|
|
|
|
|
|
|
Net income |
$ |
21,554 |
|
|
|
$ |
64,575 |
|
|
$ |
69,246 |
|
|
$ |
67,158 |
|
|
$ |
59,379 |
|
|
|
Earnings per share |
|
|
|
|
|
|
|
|
|
|
|
|
|
|
|
|
|
|
|
|
|
|
Basic |
$ |
0.49 |
|
|
|
$ |
1.49 |
|
|
$ |
1.60 |
|
|
$ |
1.56 |
|
|
$ |
1.39 |
|
|
|
Diluted |
|
0.49 |
|
|
|
|
1.47 |
|
|
|
1.57 |
|
|
|
1.52 |
|
|
|
1.36 |
|
|
|
|
|
|
|
|
|
|
|
|
|
|
|
|
|
|
|
|
|
|
|
|
|
|
Total assets |
$ |
1,521,259 |
|
|
|
$ |
1,500,416 |
|
(2) |
$ |
1,557,710 |
|
(2) |
$ |
1,674,010 |
|
(2) |
$ |
1,238,187 |
|
(2) |
|
Total debt |
|
372,608 |
|
|
|
|
360,662 |
|
(2) |
|
400,818 |
|
(2) |
|
437,925 |
|
(2) |
|
245,202 |
|
(2) |
|
|
|
|
|
|
|
|
|
|
|
|
|
|
|
|
|
|
|
|
|
|
|
|
Shareholders’ equity |
|
653,826 |
|
|
|
|
663,247 |
|
|
|
649,109 |
|
|
|
684,476 |
|
|
|
539,679 |
|
|
|
Cash dividends declared per common share |
|
0.50 |
|
|
|
|
0.48 |
|
|
|
0.44 |
|
|
|
0.40 |
|
|
|
0.36 |
|
|
|
|
|
|
|
|
|
|
|
|
|
|
|
|
|
|
|
|
|
|
|
|
|
|
Depreciation, depletion and amortization |
|
65,826 |
|
|
|
|
63,236 |
|
|
|
70,555 |
|
|
|
68,196 |
|
|
|
69,500 |
|
|
|
Capital expenditures |
|
160,158 |
|
|
|
|
99,889 |
|
|
|
66,046 |
|
|
|
103,047 |
|
|
|
58,752 |
|
|
|
Net tons sold |
|
1,045,121 |
|
|
|
|
1,051,911 |
|
|
|
1,059,881 |
|
|
|
1,029,819 |
|
|
|
969,833 |
|
|
|
Number of employees |
|
4,346 |
|
|
|
|
4,375 |
|
|
|
4,516 |
|
|
|
4,403 |
|
|
|
4,258 |
|
|
|
|
(1) |
On April 30, 2013, we acquired Dresden Papier GmbH, the results of which are included prospectively from the acquisition date, including $101.8 million of net sales and $18.3 million of operating income. |
|
|
(2) |
The amounts set forth for Total assets and Total debt as of December 31, 2015, 2014, 2013 and 2012 has been restated to retroactively adopt Accounting Standards Number 2015-03, Interest - Imputation of Interest (Subtopic 835-30) Simplifying the Presentation of Debt Issuance Costs. |
|
GLATFELTER 2016 FORM 10-K |
13 |
|
ITEM 7 |
MANAGEMENT'S DISCUSSION AND ANALYSIS OF FINANCIAL CONDITION AND RESULTS OF OPERATIONS |
Forward-Looking Statements This Annual Report on Form 10-K includes forward-looking statements within the meaning of the Private Securities Litigation Reform Act of 1995. All statements other than statements of historical fact, including statements regarding industry prospects and future consolidated financial position or results of operations, made in this Report on Form 10-K are forward looking. We use words such as “anticipates”, “believes”, “expects”, “future”, “intends” and similar expressions to identify forward-looking statements. Forward-looking statements reflect management’s current expectations and are inherently uncertain. Our actual results may differ significantly from such expectations. The following discussion includes forward-looking statements regarding expectations of, among others, non-cash pension expense, environmental costs, capital expenditures and liquidity, all of which are inherently difficult to predict. Although we make such statements based on assumptions that we believe to be reasonable, there can be no assurance that actual results will not differ materially from our expectations. Accordingly, we identify the following important factors, among others, which could cause our results to differ from any results that might be projected, forecasted or estimated in any such forward-looking statements:
|
i. |
variations in demand for our products including the impact of unplanned market-related downtime, variations in product pricing, or product substitution; |
|
ii. |
the impact of competition, both domestic and international, changes in industry production capacity, including the construction of new mills or new machines, the closing of mills and incremental changes due to capital expenditures or productivity increases; |
|
iii. |
risks associated with our international operations, including local economic and political environments and fluctuations in currency exchange rates; |
|
iv. |
geopolitical events, including Russia, Ukraine and Philippines; |
|
v. |
our ability to develop new, high value-added products; |
|
vi. |
changes in the cost or availability of raw materials we use, in particular pulpwood, pulp, pulp substitutes, caustic soda, and abaca fiber; |
|
vii. |
changes in energy-related costs and commodity raw materials with an energy component; |
|
viii. |
the impact of unplanned production interruption; |
|
ix. |
disruptions in production and/or increased costs due to labor disputes; |
|
x. |
the impact of exposure to volatile market-based pricing for sales of excess electricity; |
|
xi. |
the gain or loss of significant customers and/or on-going viability of such customers; |
|
xii. |
cost and other effects of environmental compliance, cleanup, damages, remediation or restoration, or personal injury or property damages related thereto, such as the costs of natural resource restoration or damages related to the presence of polychlorinated biphenyls ("PCBs") in the lower Fox River on which our former Neenah mill was located; |
|
xiii. |
adverse results in litigation in the Fox River matter; |
|
xiv. |
the impact of war and terrorism; |
|
xv. |
the impact of unfavorable outcomes of audits by various state, federal or international tax authorities or changes in pre-tax income and its impact on the valuation of deferred tax assets; |
|
xvi. |
enactment of adverse state, federal or foreign tax or other legislation or changes in government policy or regulation; and |
|
xvii. |
our ability to finance, consummate and integrate future acquisitions. |
Introduction We manufacture a wide array of specialty papers and fiber-based engineered materials. We manage our company along three business units:
|
• |
Composite Fibers with revenue from the sale of single-serve tea and coffee filtration papers, nonwoven wallcovering base materials, metallized products, composite laminate papers, and many technically special papers including substrates for electrical applications; |
|
• |
Advanced Airlaid Materials with revenue from the sale of airlaid nonwoven fabric-like materials used in feminine hygiene and adult incontinence products, specialty wipes, home care products and other airlaid applications; and |
|
• |
Specialty Papers with revenue from the sale of papers for carbonless and other forms, envelopes, book publishing, and engineered products such as papers for high-speed ink jet printing, office specialty products, greeting cards, packaging, casting, release, transfer, playing card, postal, FDA-compliant food, and other niche specialty applications. |
14
2016 versus 2015
Overview Net income for the year ended December 31, 2016 was $21.6 million, or $0.49 per diluted share compared with $64.6 million, or $1.47 per diluted share in 2015. The GAAP-based results reflect the impact of significant unusual and non-recurring items including, among others, a $40.0 million charge to earnings to increase our reserve in the Fox River environmental matter, a pension settlement charge, and costs related to our environmental compliance initiative and a capacity expansion project. Excluding these items from reported results, adjusted earnings, a non-GAAP measure, was $60.7 million, or $1.38 per diluted share for 2016, compared with $58.9 million, or $1.34 per diluted share, a year ago.
We generated $116.1 million of cash flow from operations in 2016 compared with $133.7 million in 2015. During 2016, capital expenditures totaled $160.9 million primarily related to the environmental compliance project for Specialty Papers and a capacity expansion project for Advanced Airlaid Materials. We also returned additional cash to our shareholders in the form of a 4% increase in the quarterly dividend beginning with the 2016 first quarter dividend payment. This was the fourth consecutive year in which the dividend was increased.
The following table sets forth summarized consolidated results of operations:
|
|
Year ended December 31 |
|
|
||||||
|
In thousands, except per share |
2016 |
|
|
|
2015 |
|
|
||
|
Net sales |
$ |
1,604,797 |
|
|
|
$ |
1,661,084 |
|
|
|
Gross profit |
|
218,603 |
|
|
|
|
202,965 |
|
|
|
Operating income |
|
27,693 |
|
|
|
|
96,372 |
|
|
|
Net income |
|
21,554 |
|
|
|
|
64,575 |
|
|
|
Earnings per diluted share |
|
0.49 |
|
|
|
1.47 |
|
|
|
Operating income from our business units increased $6.3 million in the year-over-year comparison. The Advanced Airlaid Materials and Specialty Papers businesses reported higher operating income in the comparison, driven by improved operations and lower input costs, partially offset by lower selling prices. However, Composite Fibers’ results were affected by excess capacity in the market, lower selling prices and changes in foreign exchange. Our continuous improvement initiatives and cost control actions during 2016 resulted in approximately $22.7 million of benefits on a consolidated basis.
In addition to the results reported in accordance with GAAP, we evaluate our performance using adjusted earnings and adjusted earnings per diluted share. We disclose this information to allow investors to evaluate our performance exclusive of certain items that impact the comparability of results from period to period and we believe it is helpful in understanding underlying operating trends and cash flow generation. Adjusted earnings consists of net income determined in accordance with GAAP adjusted to exclude the impact of the following:
Fox River environmental matter. This adjustment reflects charges incurred to increase our reserve for estimated costs related to government oversight, remediation activity and long term monitoring and maintenance at the Fox River site. These costs are irregular in timing and as such may not be indicative of our past or future performance.
Pension settlement charge. This adjustment reflects the one-time charge incurred during 2016 in connection with the settlement of certain pension liabilities as part of a voluntary offer to vested terminated participants. Our qualified pension plan is overfunded and this action did not require us to contribute any cash.
Specialty Papers environmental compliance. These adjustments reflect non-capitalized, one-time costs incurred by the business unit directly related to the compliance with the U.S. EPA Best Available Retrofit Technology rule and the Boiler Maximum Achievable Control Technology rule. This adjustment includes costs incurred during the transition period in which the newly installed equipment was brought on-line.
Airlaid capacity expansion costs. These adjustments reflect non-capitalized, one-time costs incurred related to the start-up of a new airlaid production facility in Ft. Smith, Arkansas.
Cost optimization actions. This adjustment reflects charges incurred in connection with initiatives to optimize the cost structure of certain business units in response to changes in business conditions. The costs are primarily related to headcount reduction efforts, asset write-offs and certain contract termination costs.
Asset impairment charges. This adjustment represents a non-cash charge required to adjust to its estimated fair value the carrying value of a trade name intangible asset. Charges of this nature are irregular in timing and as such may not be indicative of our past and future performance.
Timberland sales and related costs. These adjustments exclude gains from the sales of timberlands as these items are not considered to be part of our core business, ongoing results of operations or cash flows. These adjustments are irregular in timing and amount and may significantly impact our operating performance. As such, these items may not be indicative of past and future performance of the Company and therefore are excluded for comparability purposes.
Acquisition and integration related costs. These adjustments include costs directly related to the consummation of the acquisition process and those related to integrating businesses previously acquired. These costs are irregular in timing and as such may not be indicative of our past and future performance.
Adjusted earnings and adjusted earnings per diluted share are considered measures not calculated in accordance with GAAP, and therefore are non-GAAP measures. The non-GAAP financial information should not be considered in isolation from, or as a substitute for,
|
GLATFELTER 2016 FORM 10-K |
15 |
measures of financial performance prepared in accordance with GAAP. The following table sets forth the
reconciliation of net income to adjusted earnings for the years ended December 31, 2016 and 2015:
|
|
Year ended December 31 |
|
|||||||||||||
|
|
2016 |
|
|
2015 |
|
||||||||||
|
In thousands, except per share |
Amount |
|
|
Diluted EPS |
|
|
Amount |
|
|
Diluted EPS |
|
||||
|
Net income |
$ |
21,554 |
|
|
$ |
0.49 |
|
|
$ |
64,575 |
|
|
$ |
1.47 |
|
|
Adjustments (pre-tax) |
|
|
|
|
|
|
|
|
|
|
|
|
|
|
|
|
Fox River environmental matter |
|
40,000 |
|
|
|
|
|
|
|
10,000 |
|
|
|
|
|
|
Pension settlement charge |
|
7,306 |
|
|
|
|
|
|
|
- |
|
|
|
|
|
|
Specialty Papers' environmental compliance |
|
8,348 |
|
|
|
|
|
|
|
- |
|
|
|
|
|
|
Airlaid capacity expansion costs |
|
2,661 |
|
|
|
|
|
|
|
50 |
|
|
|
|
|
|
Cost optimization actions |
|
3,534 |
|
|
|
|
|
|
|
2,461 |
|
|
|
|
|
|
Asset impairment charge |
|
- |
|
|
|
|
|
|
|
1,201 |
|
|
|
|
|
|
Timberland sales and related costs |
|
- |
|
|
|
|
|
|
|
(20,867 |
) |
|
|
|
|
|
Acquisition and integration related costs |
|
- |
|
|
|
|
|
|
|
178 |
|
|
|
|
|
|
Total adjustments (pre-tax) |
|
61,849 |
|
|
|
|
|
|
|
(6,977 |
) |
|
|
|
|
|
Income taxes (1) (2) |
|
(22,719 |
) |
|
|
|
|
|
|
1,328 |
|
|
|
|
|
|
Total after-tax adjustments |
|
39,130 |
|
|
|
0.89 |
|
|
|
(5,649 |
) |
|
|
(0.13 |
) |
|
Adjusted earnings |
$ |
60,684 |
|
|
$ |
1.38 |
|
|
$ |
58,926 |
|
|
$ |
1.34 |
|
|
(1) |
Tax effect for adjustments calculated primarily based on the tax rate of the jurisdiction in which each adjustment originated. |
|
(2) |
Includes release of $1.4 million of tax reserves on timberland sales in 2015. |
Business Unit Performance
|
Year ended December 31 |
|
|
|
Advanced Airlaid |
|
|
|
|
|
Other and |
|
|
|
|
|||||||||||||||||||||||||
|
Dollars in millions |
Composite Fibers |
|
|
Materials |
|
|
Specialty Papers |
|
|
Unallocated |
|
|
Total |
|
|||||||||||||||||||||||||
|
|
2016 |
|
|
2015 |
|
|
2016 |
|
|
2015 |
|
|
2016 |
|
|
2015 |
|
|
2016 |
|
|
2015 |
|
|
2016 |
|
|
2015 |
|
||||||||||
|
Net sales |
$ |
517.0 |
|
|
$ |
541.5 |
|
|
$ |
244.3 |
|
|
$ |
244.6 |
|
|
$ |
843.6 |
|
|
$ |
875.0 |
|
|
$ |
— |
|
|
$ |
— |
|
|
$ |
1,604.8 |
|
|
$ |
1,661.1 |
|
|
Energy and related sales, net |
|
— |
|
|
— |
|
|
|
— |
|
|
— |
|
|
|
6.1 |
|
|
|
5.7 |
|
|
|
— |
|
|
|
— |
|
|
|
6.1 |
|
|
|
5.7 |
|
||
|
Total revenue |
|
517.0 |
|
|
541.5 |
|
|
|
244.3 |
|
|
|
244.6 |
|
|
|
849.7 |
|
|
|
880.7 |
|
|
|
— |
|
|
|
— |
|
|
|
1,610.9 |
|
|
|
1,666.7 |
|
|
|
Cost of products sold |
|
416.4 |
|
|
|
434.4 |
|
|
|
209.5 |
|
|
|
215.7 |
|
|
|
752.6 |
|
|
|
804.5 |
|
|
|
13.9 |
|
|
|
9.2 |
|
|
|
1,392.3 |
|
|
|
1,463.8 |
|
|
Gross profit (loss) |
|
100.6 |
|
|
|
107.1 |
|
|
|
34.8 |
|
|
|
28.9 |
|
|
|
97.1 |
|
|
|
76.2 |
|
|
|
(13.9 |
) |
|
|
(9.2 |
) |
|
|
218.6 |
|
|
|
203.0 |
|
|
SG&A |
|
46.3 |
|
|
|
45.7 |
|
|
|
8.4 |
|
|
|
7.6 |
|
|
|
55.9 |
|
|
|
43.3 |
|
|
|
80.1 |
|
|
|
31.0 |
|
|
|
190.7 |
|
|
|
127.7 |
|
|
Loss (gains) on dispositions of plant, |
|
|
|
|
|
|
|
|
|
|
|
|
|
|
|
|
|
|
|
|
|
|
|
|
|
|
|
|
|
|
|
|
|
|
|
|
|
|
|
|
equipment and timberlands, net |
|
— |
|
|
|
— |
|
|
|
— |
|
|
|
— |
|
|
|
— |
|
|
|
— |
|
|
|
0.2 |
|
|
|
(21.1 |
) |
|
|
0.2 |
|
|
|
(21.1 |
) |
|
Total operating income (loss) |
|
54.3 |
|
|
|
61.4 |
|
|
|
26.4 |
|
|
|
21.3 |
|
|
|
41.2 |
|
|
|
32.9 |
|
|
|
(94.2 |
) |
|
|
(19.1 |
) |
|
|
27.7 |
|
|
|
96.4 |
|
|
Non-operating expense |
|
— |
|
|
|
— |
|
|
|
— |
|
|
|
— |
|
|
|
— |
|
|
|
— |
|
|
|
(16.9 |
) |
|
|
(17.8 |
) |
|
|
(16.9 |
) |
|
|
(17.8 |
) |
|
Income (loss) before income taxes |
$ |
54.3 |
|
|
$ |
61.4 |
|
|
$ |
26.4 |
|
|
$ |
21.3 |
|
|
$ |
41.2 |
|
|
$ |
32.9 |
|
|
$ |
(111.1 |
) |
|
$ |
(36.9 |
) |
|
$ |
10.8 |
|
|
$ |
78.6 |
|
|
Supplementary Data |
|
|
|
|
|
|
|
|
|
|
|
|
|
|
|
|
|
|
|
|
|
|
|
|
|
|
|
|
|
|
|
|
|
|
|
|
|
|
|
|
Net tons sold (thousands) |
|
151.8 |
|
|
|
153.8 |
|
|
|
99.0 |
|
|
|
96.0 |
|
|
|
794.3 |
|
|
|
802.2 |
|
|
|
— |
|
|
|
— |
|
|
|
1,045.1 |
|
|
|
1,051.9 |
|
|
Depreciation, depletion and amortization |
$ |
27.8 |
|
|
$ |
26.2 |
|
|
$ |
9.0 |
|
|
$ |
8.8 |
|
|
$ |
26.3 |
|
|
$ |
26.0 |
|
|
$ |
2.7 |
|
|
$ |
2.2 |
|
|
$ |
65.8 |
|
|
$ |
63.2 |
|
|
Capital expenditures |
|
18.8 |
|
|
|
26.8 |
|
|
|
36.8 |
|
|
|
7.8 |
|
|
|
99.0 |
|
|
|
63.5 |
|
|
|
5.6 |
|
|
|
1.8 |
|
|
|
160.2 |
|
|
|
99.9 |
|
The sum of individual amounts set forth above may not agree to the consolidated financial statements included herein due to rounding.
Business Units Results of individual business units are presented based on our management accounting practices and management structure. There is no comprehensive, authoritative body of guidance for management accounting equivalent to accounting principles generally accepted in the United States of America; therefore, the financial results of individual business units are not necessarily comparable with similar information for any other company. The management accounting process uses assumptions and allocations to measure performance of the business units. Methodologies are refined from time to time as management accounting practices are enhanced and businesses change. The costs incurred by support areas not directly aligned with the business unit are allocated primarily based on an estimated utilization of support area services or are included in “Other and Unallocated” in the Business Unit Performance table.
Management evaluates results of operations of the business units before pension expense, certain corporate level costs, and the effects of certain gains or losses not considered to be related to the core business operations. Management believes that this is a more meaningful representation of the operating performance of its core businesses, the profitability of business units and the extent of cash flow generated from these core operations. Such amounts are presented under the caption “Other and Unallocated.” In the evaluation of business unit results, management does not use any measures of total assets. This presentation is aligned with the management and operating structure of our company. It is also on this basis that the Company’s performance is evaluated internally and by the Company’s Board of Directors.
16
Sales and Costs of Products Sold
|
|
Year ended December 31 |
|
|
|
|
|
||||||
|
In thousands |
2016 |
|
|
|
2015 |
|
|
Change |
|
|||
|
Net sales |
$ |
1,604,797 |
|
|
|
$ |
1,661,084 |
|
|
$ |
(56,287 |
) |
|
Energy and related sales, net |
|
6,141 |
|
|
|
|
5,664 |
|
|
|
477 |
|
|
Total revenues |
|
1,610,938 |
|
|
|
|
1,666,748 |
|
|
|
(55,810 |
) |
|
Costs of products sold |
|
1,392,335 |
|
|
|
|
1,463,783 |
|
|
|
(71,448 |
) |
|
Gross profit |
$ |
218,603 |
|
|
|
$ |
202,965 |
|
|
$ |
15,638 |
|
|
Gross profit as a percent of Net sales |
|
13.6 |
% |
|
|
|
12.2 |
% |
|
|
|
|
The following table sets forth the contribution to consolidated net sales by each business unit:
|
|
Year ended December 31 |
|
|
||||||
|
Percent of Total |
2016 |
|
|
|
2015 |
|
|
||
|
Business Unit |
|
|
|
|
|
|
|
|
|
|
Composite Fibers |
|
32.2 |
% |
|
|
|
32.6 |
% |
|
|
Advanced Airlaid Material |
|
15.2 |
|
|
|
|
14.7 |
|
|
|
Specialty Papers |
|
52.6 |
|
|
|
|
52.7 |
|
|
|
Total |
|
100.0 |
% |
|
|
|
100.0 |
% |
|
Net sales on a consolidated basis totaled $1,604.8 million and $1,661.1 million in 2016 and 2015, respectively. The $56.3 million decrease was primarily driven by $30.8 million of lower selling prices and $11.5 million of unfavorable currency translation. Shipping volumes decreased 0.6%.
Composite Fibers’ net sales decreased $24.5 million, or 4.5%, primarily due to $7.2 million of lower selling prices and $11.1 million of unfavorable currency translation. Shipping volumes in this business unit decreased 1.3%.
Composite Fibers’ operating income for the year ended December 31, 2016 decreased $7.1 million to $54.3 million compared to the year-ago period. The primary drivers are summarized in the following chart (in millions):

Advanced Airlaid Materials’ net sales decreased $0.3 million in the year-over-year comparison as the impact from higher shipping volumes was substantially offset by $8.5 million of lower selling prices, from the contractual pass through of lower raw material costs. Shipping volumes increased 3.1% primarily due to higher shipments of hygiene, wipes and other consumer application products.
Advanced Airlaid Materials’ operating income totaled $26.4 million, an increase of $5.1 million, or 23.9% compared to the same period a year ago. The primary drivers are summarized in the following chart (in millions):
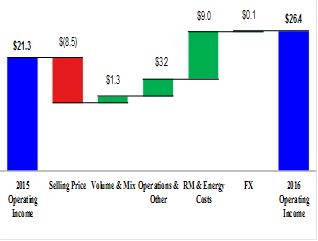
Specialty Papers’ net sales decreased $31.4 million, or 3.6% due to a $15.1 million impact from lower selling prices. Shipping volumes decreased 1.0%. The business unit again outperformed the broader uncoated freesheet market which declined 1.9%.
Operating income totaled $41.2 million, an increase of $8.3 million compared to the year ended December 31, 2015. The primary drivers are summarized in the following chart (in millions):
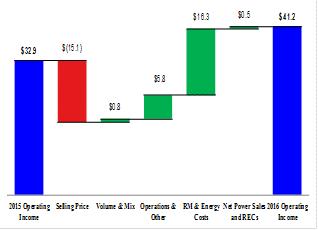
|
GLATFELTER 2016 FORM 10-K |
17 |
The following table summarizes Energy and related sales activity for 2016 and 2015:
|
|
Year ended December 31 |
|
|
|
|
|
||||||
|
In thousands |
2016 |
|
|
|
2015 |
|
|
Change |
|
|||
|
Energy sales |
$ |
3,613 |
|
|
|
$ |
5,315 |
|
|
$ |
(1,702 |
) |
|
Costs to produce |
|
(3,972 |
) |
|
|
|
(4,428 |
) |
|
|
456 |
|
|
Net |
|
(359 |
) |
|
|
|
887 |
|
|
|
(1,246 |
) |
|
Renewable energy credits |
|
6,500 |
|
|
|
|
4,777 |
|
|
|
1,723 |
|
|
Total |
$ |
6,141 |
|
|
|
$ |
5,664 |
|
|
$ |
477 |
|
We sell excess power generated by the Spring Grove, PA facility. Renewable energy credits (“RECs”) represent sales of certified credits earned related to burning renewable sources of energy such as black liquor and wood waste. We sell RECs into an illiquid market. The extent and value of future revenues from REC sales is dependent on many factors outside of management’s control. Therefore, we may not be able to generate consistent additional sales of RECs in future periods.
Other and Unallocated The amount of net operating expenses not allocated to a business unit and reported as “Other and Unallocated” in our table of Business Unit Performance, totaled $94.2 million in the year ended December 31, 2016 compared with $19.1 million in the year ended December 31, 2015. The amounts reported as “Other and Unallocated” include charges of $40.0 million and $10.0 million recorded in 2016 and 2015, respectively, to increase our reserve for potential costs related to the Fox River environmental matter. These charges are not allocated to a business unit and are recorded in the accompanying consolidated statements of income under the caption “Selling, general and administrative expenses.” This matter is more fully discussed in Item 8, Financial Statements and Supplementary Data, Note 21. In addition, the comparison reflects $21.1 million of lower gains in 2016 than 2015 from sales of timberlands. The remaining increase in Other and unallocated costs is due to the environmental compliance and capacity expansion projects, a pension settlement charge discussed below and a charge for cost optimization actions.
Pension Expense During 2016, pension expense totaled $12.8 million inclusive of a one-time pension settlement charge of $7.3 million related to the settlement of $24.2 million of benefits in connection with a voluntary program offered to deferred vested terminated participants. The following table summarizes the amounts of normal pension expense recognized, excluding the pension settlement charge, for the periods indicated:
|
|
Year ended December 31 |
|
|
|
|
|
||||||
|
In thousands |
2016 |
|
|
|
2015 |
|
|
Change |
|
|||
|
Recorded as: |
|
|
|
|
|
|
|
|
|
|
|
|
|
Costs of products sold |
$ |
2,346 |
|
|
|
$ |
7,043 |
|
|
$ |
(4,697 |
) |
|
SG&A expense |
|
3,149 |
|
|
|
|
2,038 |
|
|
|
1,111 |
|
|
Total |
$ |
5,495 |
|
|
|
$ |
9,081 |
|
|
$ |
(3,586 |
) |
The amount of pension expense recognized each year is dependent on various actuarial assumptions and certain other factors, including discount rates and the fair value of our pension assets. Pension expense for the full year of 2017 is expected to be approximately $5.3 million compared with $5.5 million, excluding the settlement charge in 2016.
Gain on Sales of Plant, Equipment and Timberlands, net During each of the past three years, we completed the following sales of assets:
|
Dollars in thousands |
|
Acres |
|
|
Proceeds |
|
|
Gain (loss) |
|
|
|||
|
2016 |
|
|
|
|
|
|
|
|
|
|
|
|
|
|
Other |
|
n/a |
|
|
$ |
70 |
|
|
$ |
(216 |
) |
|
|
|
Total |
|
|
|
|
|
$ |
70 |
|
|
$ |
(216 |
) |
|
|
2015 |
|
|
|
|
|
|
|
|
|
|
|
|
|
|
Timberlands |
|
|
15,628 |
|
|
$ |
23,917 |
|
|
$ |
20,867 |
|
|
|
Other |
|
n/a |
|
|
542 |
|
|
246 |
|
|
|||
|
Total |
|
|
|
|
|
$ |
24,459 |
|
|
$ |
21,113 |
|
|
|
2014 |
|
|
|
|
|
|
|
|
|
|
|
|
|
|
Timberlands |
|
|
2,753 |
|
|
$ |
5,062 |
|
|
$ |
4,855 |
|
|
|
Other |
|
n/a |
|
|
10 |
|
|
6 |
|
|
|||
|
Total |
|
|
|
|
|
$ |
5,072 |
|
|
$ |
4,861 |
|
|
Income taxes For the year ended December 31, 2016, we recorded a $10.7 million benefit from income taxes on pretax income of $10.8 million. The comparable amounts in 2015 were a provision of $14.0 million and pretax income of $78.6 million. Tax expense in 2016 includes a benefit of $14.9 million on the increase in our reserve for the Fox River matter and benefits of $4.1 million primarily due to investment tax credits, release of reserves related to the completion of tax audits and statute closures and due to changes in statutory tax rates. The effective tax rate in each period reflects a greater proportion of earnings generated in lower tax foreign jurisdictions relative to the U.S. As a result of an expected U.S. pretax loss in 2017 primarily due to one-time start-up related costs and depreciation of the significant investment for environmental compliance, we will likely record a valuation allowance against a portion of our deferred tax assets generated in the U.S. in 2017, thereby adversely impacting our effective tax rate.
18
Foreign Currency We own and operate facilities in Canada, Germany, France, the United Kingdom and the Philippines. The functional currency of our Canadian operations is the U.S. dollar. However, in Germany and France it is the Euro, in the UK, it is the British Pound Sterling, and in the Philippines the functional currency is the Peso. On an annual basis, our euro denominated revenue exceeds euro expenses by an estimated €130 million. For 2016 compared to 2015 the average currency exchange rate of the euro to U.S. dollar was essentially unchanged in the year over year comparison, although the British pound sterling to the dollar declined approximately 17%. With respect to the British pound sterling, Canadian dollar, and Philippine peso, we have differing amounts of inflows and outflows of these currencies, although to a lesser degree than the euro. As a result, we are exposed to changes in currency exchange rates and such changes could be significant. The translation of the results from international operations into U.S. dollars is subject to changes in foreign currency exchange rates.
The table below summarizes the translation impact on reported results that changes in currency exchange rates had on our non-U.S. based operations from the conversion of these operation’s results for the year ended December 31, 2016.
|
In thousands |
Year ended December 31, 2016 |
|
|
||||
|
|
Favorable (unfavorable) |
|
|
||||
|
Net sales |
|
|
|
$ |
(11,502 |
) |
|
|
Costs of products sold |
|
|
|
|
5,762 |
|
|
|
SG&A expenses |
|
|
|
|
1,284 |
|
|
|
Income taxes and other |
|
|
|
|
550 |
|
|
|
Net income |
|
|
|
$ |
(3,906 |
) |
|
The above table only presents the financial reporting impact of foreign currency translations assuming currency exchange rates in 2016 were the same as 2015. It does not present the impact of certain competitive advantages or disadvantages of operating or competing in multi-currency markets.
2015 versus 2014
Overview Net income for 2015 was $64.6 million, or $1.47 per diluted share, compared with $69.2 million, or $1.57 per diluted share, in 2014. On an adjusted earnings basis, a non-GAAP measure that excludes non-core business items discussed below, earnings per share were $1.34 compared with $1.55 in 2014. The year-over-year comparison of results of operations reflects the adverse impact of i) the stronger U.S. dollar on our euro-denominated businesses; ii) weaker demand and pricing for nonwoven wallcover products primarily due to economic conditions in Russia and Ukraine; iii) pricing pressures in our Specialty Papers business; and iv) weaker demand for certain Advanced Airlaid Materials’ products in the first half of 2015.
During 2015, we implemented cost reduction and continuous improvement initiatives that generated $31 million of savings. Our workforce was reduced by 3.1%.
We generated $133.7 million of cash flow from operations compared with $99.6 million in 2014. We also returned additional cash to our shareholders in the form of a 9% increase in the quarterly dividend beginning with the 2015 first quarter dividend payment. This was the third consecutive year in which the dividend was increased.
On October 1, 2014, we completed the acquisition of Spezialpapierfabrik Oberschmitten GmbH (“SPO”) for $8.0 million in cash. SPO’s results are reported as part of the Composite Fibers business unit prospectively from the acquisition date. It primarily produces highly technical papers for use in a wide range of capacitors used in consumer and industrial products; insulation papers for cables and transformers; and materials for industrial power inverters, electromagnetic current filters and electric rail traction.
The following table sets forth summarized results of operations:
|
|
Year ended December 31 |
|
|
||||||
|
In thousands, except per share |
2015 |
|
|
|
2014 |
|
|
||
|
Net sales |
$ |
1,661,084 |
|
|
|
$ |
1,802,415 |
|
|
|
Gross profit |
|
202,965 |
|
|
|
|
235,154 |
|
|
|
Operating income |
|
96,372 |
|
|
|
|
106,780 |
|
|
|
Net income |
|
64,575 |
|
|
|
|
69,246 |
|
|
|
Earnings per diluted share |
|
1.47 |
|
|
|
|
1.57 |
|
|
Net sales on a consolidated basis for year ended December 31, 2015 were $1,661.1 million compared with $1,802.4 million for 2014. On a constant currency basis, net sales declined $40.3 million, or 2.2 percent. Shipping volumes declined less than one percent.
The following table sets forth the reconciliation of net income to adjusted earnings for the years ended December 31, 2015 and 2014.
|
GLATFELTER 2016 FORM 10-K |
19 |
|
|
Year ended December 31 |
|
|||||||||||||
|
|
2015 |
|
|
2014 |
|
||||||||||
|
In thousands, except per share |
Amount |
|
|
Diluted EPS |
|
|
Amount |
|
|
Diluted EPS |
|
||||
|
Net income |
$ |
64,575 |
|
|
$ |
1.47 |
|
|
$ |
69,246 |
|
|
$ |
1.57 |
|
|
Adjustments (pre-tax) |
|
|
|
|
|
|
|
|
|
|
|
|
|
|
|
|
Fox River environmental matter |
|
10,000 |
|
|
|
|
|
|
|
- |
|
|
|
|
|
|
Airlaid capacity expansion costs |
|
50 |
|
|
|
|
|
|
|
- |
|
|
|
|
|
|
Cost optimization actions |
|
2,461 |
|
|
|
|
|
|
|
516 |
|
|
|
|
|
|
Asset impairment charge |
|
1,201 |
|
|
|
|
|
|
|
3,262 |
|
|
|
|
|
|
Timberland sales and related costs |
|
(20,867 |
) |
|
|
|
|
|
|
(4,855 |
) |
|
|
|
|
|
Acquisition and integration related costs |
|
178 |
|
|
|
|
|
|
|
1,056 |
|
|
|
|
|
|
Total adjustments (pre-tax) |
|
(6,977 |
) |
|
|
|
|
|
|
(21 |
) |
|
|
|
|
|
Income taxes (1) (2) |
|
1,328 |
|
|
|
|
|
|
|
(756 |
) |
|
|
|
|
|
Total after-tax adjustments |
|
(5,649 |
) |
|
|
(0.13 |
) |
|
|
(777 |
) |
|
|
(0.02 |
) |
|
Adjusted earnings |
$ |
58,926 |
|
|
$ |
1.34 |
|
|
$ |
68,469 |
|
|
$ |
1.55 |
|
|
(1) |
Tax effect for adjustments calculated based on the tax rate of the jurisdiction in which each adjustment originated. |
|
(2) |
Includes release of $1.4 million of tax reserves on timberland sales in 2015. |
Business Unit Performance
|
Year ended December 31 |
|
|
|
Advanced Airlaid |
|
|
|
|
|
Other and |
|
|
|
|
|||||||||||||||||||||||||
|
Dollars in millions |
Composite Fibers |
|
|
Materials |
|
|
Specialty Papers |
|
|
Unallocated |
|
|
Total |
|
|||||||||||||||||||||||||
|
|
2015 |
|
|
2014 |
|
|
2015 |
|
|
2014 |
|
|
2015 |
|
|
2014 |
|
|
2015 |
|
|
2014 |
|
|
2015 |
|
|
2014 |
|
||||||||||
|
Net sales |
$ |
541.5 |
|
|
$ |
617.9 |
|
|
$ |
244.6 |
|
|
$ |
281.7 |
|
|
$ |
875.0 |
|
|
$ |
902.9 |
|
|
$ |
— |
|
|
$ |
— |
|
|
$ |
1,661.1 |
|
|
$ |
1,802.4 |
|
|
Energy and related sales, net |
|
— |
|
|
— |
|
|
|
— |
|
|
— |
|
|
|
5.7 |
|
|
|
7.9 |
|
|
|
— |
|
|
|
— |
|
|
|
5.7 |
|
|
|
7.9 |
|
||
|
Total revenue |
541.5 |
|
|
617.9 |
|
|
|
244.6 |
|
|
|
281.7 |
|
|
|
880.7 |
|
|
|
910.8 |
|
|
|
— |
|
|
|
— |
|
|
|
1,666.8 |
|
|
|
1,810.3 |
|
||
|
Cost of products sold |
|
434.4 |
|
|
|
498.0 |
|
|
|
215.7 |
|
|
|
247.6 |
|
|
|
804.5 |
|
|
|
821.8 |
|
|
|
9.2 |
|
|
|
7.8 |
|
|
|
1,463.8 |
|
|
|
1,575.2 |
|
|
Gross profit (loss) |
|
107.1 |
|
|
|
119.9 |
|
|
|
28.9 |
|
|
|
34.1 |
|
|
|
76.2 |
|
|
|
89.0 |
|
|
|
(9.2 |
) |
|
|
(7.8 |
) |
|
|
203.0 |
|
|
|
235.2 |
|
|
SG&A |
|
45.7 |
|
|
|
51.6 |
|
|
|
7.6 |
|
|
|
8.8 |
|
|
|
43.3 |
|
|
|
50.4 |
|
|
|
31.0 |
|
|
|
22.4 |
|
|
|
127.7 |
|
|
|
133.2 |
|
|
Gains on dispositions of plant, |
|
|
|
|
|
|
|
|
|
|
|
|
|
|
|
|
|
|
|
|
|
|
|
|
|
|
|
|
|
|
|
|
|
|
|
|
|
|
|
|
equipment and timberlands, net |
|
— |
|
|
|
— |
|
|
|
— |
|
|
|
— |
|
|
|
— |
|
|
|
— |
|
|
|
(21.1 |
) |
|
|
(4.9 |
) |
|
|
(21.1 |
) |
|
|
(4.9 |
) |
|
Total operating income (loss) |
|
61.4 |
|
|
|
68.3 |
|
|
|
21.3 |
|
|
|
25.3 |
|
|
|
32.9 |
|
|
|
38.6 |
|
|
|
(19.1 |
) |
|
|
(25.3 |
) |
|
|
96.4 |
|
|
|
106.8 |
|
|
Non-operating expense |
|
— |
|
|
|
— |
|
|
|
— |
|
|
|
— |
|
|
|
— |
|
|
|
— |
|
|
|
(17.8 |
) |
|
|
(19.4 |
) |
|
|
(17.8 |
) |
|
|
(19.4 |
) |
|
Income (loss) before income taxes |
$ |
61.4 |
|
|
$ |
68.3 |
|
|
$ |
21.3 |
|
|
$ |
25.3 |
|
|
$ |
32.9 |
|
|
$ |
38.6 |
|
|
$ |
(36.9 |
) |
|
$ |
(44.7 |
) |
|
$ |
78.6 |
|
|
$ |
87.4 |
|
|
Supplementary Data |
|
|
|
|
|
|
|
|
|
|
|
|
|
|
|
|
|
|
|
|
|
|
|
|
|
|
|
|
|
|
|
|
|
|
|
|
|
|
|
|
Net tons sold (thousands) |
|
153.8 |
|
|
|
157.3 |
|
|
|
96.0 |
|
|
|
99.7 |
|
|
|
802.2 |
|
|
|
802.9 |
|
|
|
— |
|
|
|
— |
|
|
|
1,051.9 |
|
|
|
1,059.9 |
|
|
Depreciation, depletion and amortization |
$ |
26.2 |
|
|
$ |
29.7 |
|
|
$ |
8.8 |
|
|
$ |
9.1 |
|
|
$ |
26.0 |
|
|
$ |
29.9 |
|
|
$ |
2.2 |
|
|
$ |
1.9 |
|
|
$ |
63.2 |
|
|
$ |
70.6 |
|
|
Capital expenditures |
|
26.8 |
|
|
|
23.9 |
|
|
|
7.8 |
|
|
|
7.6 |
|
|
|
63.5 |
|
|
|
32.1 |
|
|
|
1.8 |
|
|
|
2.4 |
|
|
|
99.9 |
|
|
|
66.0 |
|
The sum of individual amounts set forth above may not agree to the consolidated financial statements included herein due to rounding.
Sales and Costs of Products Sold
|
|
Year ended December 31 |
|
|
|
|
|
||||||
|
In thousands |
2015 |
|
|
|
2014 |
|
|
Change |
|
|||
|
Net sales |
$ |
1,661,084 |
|
|
|
$ |
1,802,415 |
|
|
$ |
(141,331 |
) |
|
Energy and related sales, net |
|
5,664 |
|
|
|
|
7,927 |
|
|
|
(2,263 |
) |
|
Total revenues |
|
1,666,748 |
|
|
|
|
1,810,342 |
|
|
|
(143,594 |
) |
|
Costs of products sold |
|
1,463,783 |
|
|
|
|
1,575,188 |
|
|
|
(111,405 |
) |
|
Gross profit |
$ |
202,965 |
|
|
|
$ |
235,154 |
|
|
$ |
(32,189 |
) |
|
Gross profit as a percent of Net sales |
|
12.2 |
% |
|
|
|
13.0 |
% |
|
|
|
|
The following table sets forth the contribution to consolidated net sales by each business unit:
|
|
Year ended December 31 |
|
|
||||||
|
Percent of Total |
2015 |
|
|
|
2014 |
|
|
||
|
Business Unit |
|
|
|
|
|
|
|
|
|
|
Composite Fibers |
|
32.6 |
% |
|
|
|
34.3 |
% |
|
|
Advanced Airlaid Material |
|
14.7 |
|
|
|
|
15.6 |
|
|
|
Specialty Papers |
|
52.7 |
|
|
|
|
50.1 |
|
|
|
Total |
|
100.0 |
% |
|
|
|
100.0 |
% |
|
Net sales declined by $141.3 million and totaled $1,661.1 million and $1,802.4 million, in 2015 and 2014, respectively. Currency translation unfavorably impacted the year-over-year comparison by $101.0 million reflecting a significantly stronger U.S. dollar.
20
Composite Fibers’ net sales declined $76.4 million, or 12.4%, due to $75.8 million of unfavorable currency translation and $10.2 million from lower selling prices. Shipping volumes declined 2.2% due to a 19.8% decline in wallcover products which more than offset solid gains in all other segments. The weakness in sales to the wallcover segment is directly related to economic conditions in Russia and Ukraine, a region that historically had accounted for approximately 50% of sales of this business unit’s wallcover products.
Composite Fibers’ operating income for 2015 decreased $6.9 million to $61.4 million. The primary drivers are summarized in the following chart (in millions):

Advanced Airlaid Materials’ net sales decreased $37.1 million due to $25.1 million of unfavorable currency translation and a 3.7% decline in shipping volumes.
Advanced Airlaid Materials’ operating income for 2015 declined $4.0 million compared to 2014. The primary drivers are summarized in the following chart (in millions):
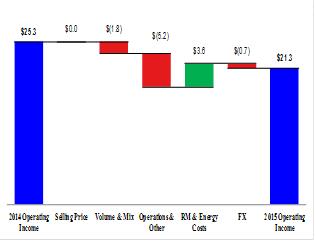
The adverse impact from lower shipping volumes reflects softer market demand in the first half of the year. The amount set forth for “Operations & other” includes
general wage cost inflation, $2.6 million of market related downtime as well as lost production associated with machine upgrades.
Specialty Papers’ net sales declined $27.9 million, or 3.1% primarily due to $11.3 million from lower selling prices, slightly lower shipping volumes and unfavorable mix changes.
This business unit’s operating income totaled $32.9 million in 2015, a $5.7 million decline from $38.6 million a year ago. The primary drivers are summarized in the following chart (in millions):
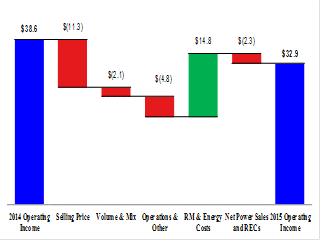
The following table summarizes this Energy and related sales for 2015 and 2014:
|
|
Year ended December 31 |
|
|
|
|
|
||||||
|
In thousands |
2015 |
|
|
|
2014 |
|
|
Change |
|
|||
|
Energy sales |
$ |
5,315 |
|
|
|
$ |
11,886 |
|
|
$ |
(6,571 |
) |
|
Costs to produce |
|
(4,428 |
) |
|
|
|
(6,204 |
) |
|
|
1,776 |
|
|
Net |
|
887 |
|
|
|
|
5,682 |
|
|
|
(4,795 |
) |
|
Renewable energy credits |
|
4,777 |
|
|
|
|
2,245 |
|
|
|
2,532 |
|
|
Total |
$ |
5,664 |
|
|
|
$ |
7,927 |
|
|
$ |
(2,263 |
) |
We sell excess power generated by the Spring Grove, PA facility. Renewable energy credits (“RECs”) represent sales of certified credits earned related to burning renewable sources of energy such as black liquor and wood waste. We sell RECs into an illiquid market. The extent and value of future revenues from REC sales is dependent on many factors outside of management’s control.
Energy and related sales decreased $2.3 million in the comparison as severe weather conditions in early 2014 resulted in higher selling prices for excess power and a boiler outage in the first quarter of 2015 reduced power sales.
Other and Unallocated The amount of net operating expenses not allocated to a business unit and reported as “Other and Unallocated” in our table of Business Unit Performance, excluding gains from sales of plant, equipment and timberlands, totaled $40.2 million in
|
GLATFELTER 2016 FORM 10-K |
21 |
2015 compared with $30.2 million in 2014. The increase was primarily due to a $10.0 charge to increase our reserve for the Fox River environmental matter as well as related legal costs which were partially offset by benefits from corporate cost reduction initiatives.
Asset impairment charges During 2015 and 2014, in connection with our annual test of potential impairment of indefinite lived intangible assets, we recorded a non-cash asset impairment charge of $1.2 million and $3.3 million, respectively, related to a trade name intangible asset acquired in connection with our Composite Fibers business unit’s 2013 Dresden acquisition. The charges were due to changes in the estimated fair value of the trade name, primarily driven by lower forecasted revenues associated with the business, an increase in discount rates related to Dresden’s business in Russia and Ukraine and this region’s political and economic instability. The charges are expenses not allocated to a business unit and are recorded in the accompanying consolidated statements of income under the caption “Selling, general and administrative expenses.”
Pension Expense Pension expenses are not allocated to a business unit. The following table summarizes the amounts of pension expense recognized for the periods indicated:
|
|
Year ended December 31 |
|
|
|
|
|
||||||
|
In thousands |
2015 |
|
|
|
2014 |
|
|
Change |
|
|||
|
Recorded as: |
|
|
|
|
|
|
|
|
|
|
|
|
|
Costs of products sold |
$ |
7,043 |
|
|
|
$ |
6,605 |
|
|
$ |
438 |
|
|
SG&A expense |
|
2,038 |
|
|
|
|
55 |
|
|
|
1,983 |
|
|
Total |
$ |
9,081 |
|
|
|
$ |
6,660 |
|
|
$ |
2,421 |
|
The amount of pension expense recognized each year is dependent on various actuarial assumptions and certain other factors, including discount rates, mortality, and the fair value of our pension assets.
Income taxes For 2015, we recorded a provision for income taxes of $14.0 million on pretax income of $78.6 million. The comparable amounts in 2014 were an income tax provision of $18.1 million on $87.4 million of pretax income. The lower effective rate in 2015 is largely driven by a greater proportion of earnings generated in lower tax foreign jurisdictions relative to the U.S. due, in part, to a $10.0 million increase in our reserve for the Fox River matter. Income tax expense in 2014 includes a $4.2 million benefit from the reduction of deferred tax liabilities and release of valuation allowances related to the restructuring of non-U.S. legal entities.
Foreign Currency For the year ended December 31, 2015, the average currency exchange rate declined to 1.11 U.S. dollars to 1.00 euro compared with 1.33 to 1.00 for 2014. With respect to the British pound sterling, Canadian dollar, and Philippine peso, we have greater outflows than inflows of these currencies, although to a lesser degree. As a result, particularly with respect to the euro, we are exposed to changes in currency exchange rates and such changes could be significant. The translation of the results from international operations into U.S. dollars is subject to changes in foreign currency exchange rates.
The table below summarizes the translation impact on reported results that changes in currency exchange rates had on our non-U.S. based operations from the conversion of these operation’s results for 2016:
|
In thousands |
Year ended December 31, 2015 |
|
|
||||
|
|
Favorable (unfavorable) |
|
|
||||
|
Net sales |
|
|
|
$ |
(104,996 |
) |
|
|
Costs of products sold |
|
|
|
|
84,156 |
|
|
|
SG&A expenses |
|
|
|
|
8,436 |
|
|
|
Income taxes and other |
|
|
|
|
2,565 |
|
|
|
Net income |
|
|
|
$ |
(9,839 |
) |
|
The above table only presents the financial reporting impact of foreign currency translations assuming currency exchange rates in 2015 were the same as 2014. It does not include the impact of certain competitive advantages or disadvantages of operating or competing in multi-currency markets.
22
LIQUIDITY AND CAPITAL RESOURCES
Our business is capital intensive and requires significant expenditures for new or enhanced equipment, to support our research and development efforts, for environmental compliance matters including, but not limited to, the Clean Air Act, and to support our business strategy including the capacity expansion project for Advanced Airlaid Materials. In addition, we have mandatory debt service requirements of both principal and interest. The following table summarizes cash flow information for each of the periods presented:
|
|
Year ended December 31 |
|
|
||||||
|
In thousands |
2016 |
|
|
|
2015 |
|
|
||
|
Cash and cash equivalents at beginning of period |
$ |
105,304 |
|
|
|
$ |
99,837 |
|
|
|
Cash provided (used) by |
|
|
|
|
|
|
|
|
|
|
Operating activities |
|
116,110 |
|
|
|
|
133,743 |
|
|
|
Investing activities |
|
(160,888 |
) |
|
|
|
(77,254 |
) |
|
|
Financing activities |
|
(3,019 |
) |
|
|
|
(48,016 |
) |
|
|
Effect of exchange rate changes on cash |
|
(2,063 |
) |
|
|
|
(3,006 |
) |
|
|
Net cash provided (used) |
|
(49,860 |
) |
|
|
|
5,467 |
|
|
|
Cash and cash equivalents at end of period |
$ |
55,444 |
|
|
|
$ |
105,304 |
|
|
At December 31, 2016, we had $55.4 million in cash and cash equivalents held by both domestic and foreign subsidiaries. Unremitted earnings of our foreign subsidiaries are deemed to be indefinitely reinvested; however, as of December 31, 2016, the majority of our cash and cash equivalents is either held by domestic entities or is available for use domestically. In addition to our cash and cash equivalents, $176.6 million is available under our revolving credit agreement, which matures in March 2020.
Cash provided by operating activities totaled $116.1 million in the year ended December 31, 2016 compared with $133.7 million a year ago. The decrease in cash from operations primarily reflects lower earnings and the reduction in one-time benefits in payables due to improved payment terms with suppliers partially offset by improvement in the timing of customer collections.
Net cash used by investing activities increased by $83.6 million in the year-over-year comparison primarily due to capital expenditures for Specialty Papers’ environmental compliance and Advanced Airlaid Materials’ capacity expansion projects which totaled $100.2 million in 2016 compared to $27.0 million in 2015. Capital expenditures are expected to total between $125 million and $140 million for 2017 including approximately $10 million for the Specialty Papers’ environmental compliance projects and $45 million to $50 million for the Airlaid capacity expansion.
Net cash used by financing activities totaled $3.0 million in the year ended December 31, 2016 compared with a use of $48.0 million in 2015. The decrease in cash used by financing activities primarily reflects additional
term loan borrowings and receipt of $5.6 million of government grants primarily related to our Specialty Papers’ environmental compliance and Airlaid capacity expansion projects in 2016.
The following table sets forth our outstanding long-term indebtedness:
|
|
December 31 |
|
|
||||||
|
In thousands |
|
2016 |
|
|
|
|
2015 |
|
|
|
Revolving credit facility, due Mar. 2020 |
$ |
61,595 |
|
|
|
$ |
58,792 |
|
|
|
5.375% Notes, due Oct. 2020 |
|
250,000 |
|
|
|
|
250,000 |
|
|
|
2.40% Term Loan, due Jun. 2022 |
|
8,282 |
|
|
|
|
10,109 |
|
|
|
2.05% Term Loan, due Mar. 2023 |
|
35,163 |
|
|
|
|
42,130 |
|
|
|
1.30% Term Loan, due Jun. 2023 |
|
9,788 |
|
|
|
|
— |
|
|
|
1.55% Term Loan, due Sep. 2025 |
|
10,333 |
|
|
|
|
2,839 |
|
|
|
Total long-term debt |
|
375,161 |
|
|
|
|
363,870 |
|
|
|
Less current portion |
|
(8,961 |
) |
|
|
|
(7,366 |
) |
|
|
Unamortized deferred issuance costs |
|
(2,553 |
) |
|
|
|
(3,208 |
) |
|
|
Long-term debt, net of current portion |
$ |
363,647 |
|
|
|
$ |
353,296 |
|
|
Our revolving credit facility contains a number of customary compliance covenants, the most restrictive of which is a maximum leverage ratio of 3.5x. As of December 31, 2016, the leverage ratio, as calculated in accordance with the definition in our amended credit agreement, was 2.2x, within the limits set forth in our credit agreement. Based on our expectations of future results of operations and capital needs, we do not believe the debt covenants will impact our operations or limit our ability to undertake financings that may be necessary to meet our capital needs.
The 5.375% Notes contain cross default provisions that could result in all such notes becoming due and payable in the event of a failure to repay debt outstanding under the credit agreement at maturity, or a default under the credit agreement that accelerates the debt outstanding thereunder. As of December 31, 2016, we met all of the requirements of our debt covenants. The significant terms of the debt instruments are more fully discussed in Item 8 - Financial Statements and Supplementary Data – Note 17.
Financing activities includes cash used for common stock dividends which reflects a 4% increase in our quarterly cash dividend rate in 2016. In the year ended December 31, 2016, we used $21.6 million of cash for dividends on our common stock compared with $20.4 million in 2015. Our Board of Directors determines what, if any, dividends will be paid to our shareholders. Dividend payment decisions are based upon then-existing factors and conditions and, therefore, historical trends of dividend payments are not necessarily indicative of future payments.
We are subject to various federal, state and local laws and regulations intended to protect the environment as well as human health and safety. At various times, we have incurred significant costs to comply with these regulations and we could incur additional costs as new regulations are developed or regulatory priorities change. We have incurred material capital costs to comply with new air quality regulations including the U.S. EPA Best Available
|
GLATFELTER 2016 FORM 10-K |
23 |
Retrofit Technology rule (BART; otherwise known as the Regional Haze Rule) and the Boiler Maximum Achievable Control Technology rule (Boiler MACT). These rules required process modifications and/or installation of air pollution controls on boilers at two of our facilities. We converted or replaced five coal-fired boilers to natural gas and upgraded site infrastructure to accommodate the new boilers, including connecting to gas pipelines. Net of government grants, the total cost of these projects is estimated at $105 million, of which approximately $99.2 million has been incurred through the end 2016.
As more fully discussed in Item 8 - Financial Statements and Supplementary Data – Note 21 – Commitments, Contingencies and Legal Proceedings (“Note 21”), we are involved in the Lower Fox River in Wisconsin (the “Fox River”), an EPA Superfund site for which we remain potentially liable for certain response costs and long-term monitoring and maintenance related matters. During 2016 and 2015, we used $4.3 million and $9.1 million, respectively, for remediation activities. Based on the recent developments more fully discussed in Note 21, it is conceivable the resolution of this matter may
require us to spend in excess of $25 million in 2017. Although we are unable to determine with any degree of certainty the amount we may be required to spend, the recent developments provide greater clarity to the extent of such amounts.
We expect to meet all of our near and long-term cash needs from a combination of operating cash flow, cash and cash equivalents, our existing credit facility and other long-term debt. However, as discussed in Note 21, an unfavorable outcome of the Fox River matters could have a material adverse impact on our consolidated financial position, liquidity and/or results of operations.
Off-Balance-Sheet Arrangements As of December 31, 2016 and 2015, we had not entered into any off-balance-sheet arrangements. Financial derivative instruments, to which we are a party, and guarantees of indebtedness, which solely consist of obligations of subsidiaries and a partnership, are reflected in the consolidated balance sheets included herein in Item 8 – Financial Statements.
Contractual Obligations The following table sets forth contractual obligations as of December 31, 2016:
|
|
|
|
|
|
Payments Due During the Year Ended December 31, |
|
|
|||||||||||||
|
In millions |
Total |
|
|
2017 |
|
|
2018 to 2019 |
|
|
2020 to 2021 |
|
|
2022 and beyond |
|
|
|||||
|
Long-term debt (1) |
$ |
433 |
|
|
$ |
25 |
|
|
$ |
51 |
|
|
$ |
342 |
|
|
$ |
15 |
|
|
|
Operating leases (2) |
|
23 |
|
|
|
5 |
|
|
|
7 |
|
|
|
4 |
|
|
|
7 |
|
|
|
Purchase obligations (3) |
|
125 |
|
|
|
88 |
|
|
|
29 |
|
|
|
6 |
|
|
|
2 |
|
|
|
Other long term obligations (4), (5) |
|
56 |
|
|
|
5 |
|
|
|
11 |
|
|
|
12 |
|
|
|
28 |
|
|
|
Total |
$ |
637 |
|
|
$ |
123 |
|
|
$ |
98 |
|
|
$ |
364 |
|
|
$ |
52 |
|
|
|
(1) |
Represents principal and interest payments due on long-term debt, the significant terms of which are discussed in Item 8 – Financial Statements and Supplementary Data, Note 17, “Long-term Debt.” The amounts set forth above include expected interest payments of $58 million over the term of the underlying debt instruments based contractual rates or current market rates in the case of variable rate instruments. See Item 8 – Financial Statements, Note 17, “Long-Term Debt”. |
|
(2) |
Represents rental agreements for various land, buildings, vehicles, and computer and office equipment. |
|
(3) |
Represents open purchase order commitments and other obligations, primarily for raw material and energy supply contracts. In certain situations, prices are subject to variations based on market prices. In such situations, the information above is based on prices in effect at December 31, 2016. |
|
(4) |
Primarily represents expected benefits to be paid pursuant to retirement medical plans and nonqualified pension plans. |
|
(5) |
Since we are unable to reasonably estimate the timing of ultimate payment, the amounts set forth above do not include any payments that may be made related to uncertain tax positions, including potential interest, accounted for in accordance with ASC 740-10-20. As discussed in more detail in Item 8 – Financial Statements and Supplementary Data, Note 9, “Income Taxes”, such amounts totaled $14 million at December 31, 2016. |
Critical Accounting Policies and Estimates The preceding discussion and analysis of our consolidated financial position and results of operations is based upon our consolidated financial statements, which have been prepared in accordance with accounting principles generally accepted in the United States of America. The preparation of these consolidated financial statements requires us to make estimates and assumptions that affect the reported amounts of assets, liabilities, revenues and expenses, and related disclosures of contingent assets and liabilities. On an on-going basis, we evaluate our estimates, including those related to inventories, long-lived assets, pension and post-employment obligations, environmental liabilities and income taxes. We base our
estimates on historical experience and on various other assumptions that we believe are reasonable under the circumstances, the results of which form the basis for making judgments about the carrying values of assets and liabilities that are not readily apparent from other sources. Actual results may differ from these estimates.
We believe the following represent the most significant and subjective estimates used in the preparation of our consolidated financial statements.
Long-lived Assets We evaluate the recoverability of our long-lived assets, including plant, equipment, timberlands, goodwill and other intangible assets periodically or whenever events or changes in
24
circumstances indicate that the carrying amounts may not be recoverable. Goodwill and non-amortizing tradename intangible assets are reviewed, on a discounted cash flow basis, during the third quarter of each year for impairment or more frequently if impairment indicators are present. Our evaluations include considerations of a variety of qualitative factors and analyses based on the cash flows generated by the underlying assets, profitability information, including estimated future operating results, trends or other determinants of fair value. If the value of an asset determined by these evaluations is less than its carrying amount, a loss is recognized for the difference between the fair value and the carrying value of the asset. Future adverse changes in market conditions or poor operating results of the related business may indicate an inability to recover the carrying value of the assets, thereby possibly requiring an impairment charge in the future.
Pension and Other Post-Employment Obligations Accounting for defined-benefit pension plans, and any curtailments thereof, requires various assumptions, including, but not limited to, discount rates, expected long-term rates of return on plan assets, future compensation growth rates and mortality rates. Accounting for our retiree medical plans, and any curtailments thereof, also requires various assumptions, which include, but are not limited to, discount rates and annual rates of increase in the per capita costs of health care benefits.
The following chart summarizes the more significant assumption used in the actuarial valuation of our defined-benefit plans for each of the past three years:
|
|
|
2016 |
|
|
|
2015 |
|
|
|
2014 |
|
|||
|
Pension plans |
|
|
|
|
|
|
|
|
|
|
|
|
|
|
|
Weighted average discount rate for benefit expense |
|
|
4.65 |
% |
|
|
|
4.21 |
% |
|
|
|
5.20 |
% |
|
for benefit obligation |
|
|
4.43 |
% |
|
|
|
4.65 |
% |
|
|
|
4.21 |
% |
|
Expected long-term rate of return on plan assets(1) |
|
|
7.75 |
% |
|
|
|
8.00 |
% |
|
|
|
8.00 |
% |
|
Rate of compensation increase(2) |
|
|
3.50 |
% |
|
|
|
3.50 |
% |
|
|
|
4.00 |
% |
|
Post-employment medical |
|
|
|
|
|
|
|
|
|
|
|
|
|
|
|
Weighted average discount rate for benefit expense |
|
|
4.38 |
% |
|
|
|
3.89 |
% |
|
|
|
4.52 |
% |
|
for benefit obligation |
|
|
4.18 |
% |
|
|
|
4.38 |
% |
|
|
|
3.89 |
% |
|
Health care cost trend rate assumed for next year |
|
|
6.50 |
% |
|
|
|
6.80 |
% |
|
|
|
7.65 |
% |
|
Ultimate cost trend rate |
|
|
4.50 |
% |
|
|
|
4.50 |
% |
|
|
|
4.50 |
% |
|
Year that the ultimate cost trend rate is reached |
|
2037 |
|
|
|
2037 |
|
|
|
2028 |
|
|||
|
(1) |
For 2017, the expected long-term rate of return on plan assets was reduced to 7.25%. |
|
(2) |
For 2017, the assumed rate of compensation increase was reduced to 3.00%. |
We evaluate these assumptions at least once each year or as facts and circumstances dictate and we make
changes as conditions warrant. Changes to these assumptions will increase or decrease our reported net periodic benefit expense, which will result in changes to the recorded benefit plan assets and liabilities.
Environmental Liabilities We maintain accruals for losses associated with environmental obligations when it is probable that a liability has been incurred and the amount of the liability can be reasonably estimated based on existing legislation and remediation technologies. These accruals are adjusted periodically as assessment and remediation actions continue and/or further legal or technical information develops. Such undiscounted liabilities are exclusive of any insurance or other claims against third parties. Environmental costs are capitalized if the costs extend the life of the asset, increase its capacity and/or mitigate or prevent contamination from future operations. Recoveries of environmental remediation costs from other parties, including insurance carriers, are recorded as assets when their receipt is assured beyond a reasonable doubt.
Income Taxes We record the estimated future tax effects of temporary differences between the tax bases of assets and liabilities and amounts reported in our consolidated balance sheets, as well as operating loss and tax credit carry forwards. These deferred tax assets and liabilities are measured using enacted tax rates and laws that will be in effect when such amounts are expected to reverse or be utilized. We regularly review our deferred tax assets for recoverability based on historical taxable income, projected future taxable income, the expected timing of the reversals of existing temporary differences and tax planning strategies. If we are unable to generate sufficient future taxable income, or if there is a material change in the actual effective tax rates or time period within which the underlying temporary differences become taxable or deductible, we could be required to increase the valuation allowance against our deferred tax assets, which may result in a substantial increase in our effective tax rate and a material adverse impact on our reported results.
Significant judgment is required in determining our worldwide provision for income taxes and recording the related assets and liabilities. In the ordinary course of our business, there are many transactions and calculations where the ultimate tax determination is less than certain. We and our subsidiaries are examined by various Federal, State and foreign tax authorities. We regularly assess the potential outcomes of these examinations and any future examinations for the current or prior years in determining the adequacy of our provision for income taxes. We continually assess the likelihood and amount of potential adjustments and adjust the income tax provision, the current liability and deferred taxes in the period in which the facts that give rise to a revision become known. Other significant accounting policies, not involving the same level of uncertainties as those discussed above, are
|
GLATFELTER 2016 FORM 10-K |
25 |
nevertheless important to an understanding of the Consolidated Financial Statements. Refer to Item 8 – Financial Statements and Supplementary Data – Notes to
Consolidated Financial Statements for additional accounting policies.
|
|
|
Year Ended December 31 |
|
|
December 31, 2016 |
|
||||||||||||||||||||||
|
Dollars in thousands |
|
2017 |
|
|
2018 |
|
|
2019 |
|
|
2020 |
|
|
2021 |
|
|
Carrying Value |
|
|
Fair Value |
|
|||||||
|
Long-term debt |
|
|
|
|
|
|
|
|
|
|
|
|
|
|
|
|
|
|
|
|
|
|
|
|
|
|
|
|
|
Average principal outstanding |
|
|
|
|
|
|
|
|
|
|
|
|
|
|
|
|
|
|
|
|
|
|
|
|
|
|
|
|
|
At fixed interest rates – Bond |
|
$ |
250,000 |
|
|
$ |
250,000 |
|
|
$ |
250,000 |
|
|
$ |
218,750 |
|
|
$ |
- |
|
|
$ |
250,000 |
|
|
$ |
256,563 |
|
|
At fixed interest rates – Term Loans |
|
|
59,247 |
|
|
|
49,963 |
|
|
|
40,034 |
|
|
|
30,105 |
|
|
|
20,176 |
|
|
|
63,566 |
|
|
|
66,110 |
|
|
At variable interest rates |
|
|
61,595 |
|
|
|
61,595 |
|
|
|
61,595 |
|
|
|
53,896 |
|
|
|
- |
|
|
|
61,595 |
|
|
|
61,595 |
|
|
|
|
|
|
|
|
|
|
|
|
|
|
|
|
|
|
|
|
|
|
|
|
$ |
375,161 |
|
|
$ |
384,268 |
|
|
Weighted-average interest rate |
|
|
|
|
|
|
|
|
|
|
|
|
|
|
|
|
|
|
|
|
|
|
|
|
|
|
|
|
|
On fixed rate debt – Bond |
|
|
5.375 |
% |
|
|
5.375 |
% |
|
|
5.375 |
% |
|
|
5.375 |
% |
|
|
5.375 |
% |
|
|
|
|
|
|
|
|
|
On fixed rate debt – Term Loans |
|
|
1.89 |
% |
|
|
1.89 |
% |
|
|
1.88 |
% |
|
|
1.86 |
% |
|
|
1.82 |
% |
|
|
|
|
|
|
|
|
|
On variable rate debt |
|
|
2.06 |
% |
|
|
2.06 |
% |
|
|
2.06 |
% |
|
|
2.06 |
% |
|
|
2.06 |
% |
|
|
|
|
|
|
|
|
The table above presents the average principal outstanding and related interest rates for the next five years for debt outstanding as of December 31, 2016. Fair values included herein have been determined based upon rates currently available to us for debt with similar terms and remaining maturities.
Our market risk exposure primarily results from changes in interest rates and currency exchange rates. At December 31, 2016, we had $372.6 million of long-term debt, net of deferred debt issuance costs. Approximately 16.5% of our debt was at variable interest rates. The fixed rate Term Loans and the variable rate debt are all euro-based borrowings and thus the value of which is also subject to currency risk. Variable-rate debt outstanding represents borrowings under our revolving credit agreement that accrues interest based on one month LIBOR plus a margin. At December 31, 2016, the interest rate paid was 2.06%. A hypothetical 100 basis point increase or decrease in the interest rate on variable rate debt would increase or decrease annual interest expense by $0.6 million.
As part of our overall risk management practices, we enter into financial derivatives primarily designed to either i) hedge currency risks associated with forecasted transactions – “cash flow hedges” or ii) mitigate the impact that changes in currency exchange rates have on intercompany financing transactions and foreign currency denominated receivables and payables – “foreign currency hedges.” For a more complete discussion of this activity, refer to Item 8 – Financial Statements and Supplementary Data – Note 19.
We are subject to certain risks associated with changes in foreign currency exchange rates to the extent our operations are conducted in currencies other than the U.S. Dollar. Our euro denominated revenue exceeds euro expenses by an estimated €130 million. With respect to the British Pound Sterling, Canadian dollar, and Philippine Peso, we have greater outflows than inflows of these currencies, although to a lesser degree. As a result, particularly with respect to the euro, we are exposed to changes in currency exchange rates and such changes could be significant.
26
MANAGEMENT’S REPORT ON INTERNAL CONTROL OVER FINANCIAL REPORTING
Management of P. H. Glatfelter Company (the “Company”) is responsible for establishing and maintaining adequate internal control over financial reporting. The Company’s internal control over financial reporting is a process designed under the supervision of the chief executive and chief financial officer to provide reasonable assurance regarding the reliability of financial reporting and the preparation of the Company’s financial statements for external reporting purposes in accordance with accounting principles generally accepted in the United States.
As of December 31, 2016, management conducted an assessment of the effectiveness of the Company’s internal control over financial reporting based on the framework established in Internal Control — Integrated Framework (2013) issued by the Committee of Sponsoring Organizations of the Treadway Commission (COSO). Management has determined that the Company’s internal control over financial reporting as of December 31, 2016, is effective to provide reasonable assurance regarding the reliability of financial reporting and the preparation of the Company’s financial statements for external reporting purposes in accordance with accounting principles generally accepted in the United States.
The Company’s internal control over financial reporting includes policies and procedures that pertain to the maintenance of records that, in reasonable detail, accurately and fairly reflect transactions and dispositions of assets; provide reasonable assurances that transactions are recorded as necessary to permit preparation of financial statements in accordance with accounting principles generally accepted in the United States, and that receipts and expenditures are being made only in accordance with authorizations of management; and provide reasonable assurance regarding prevention or timely detection of unauthorized acquisition, use or disposition of the Company’s assets that could have a material effect on our financial statements.
The Company’s internal control over financial reporting as of December 31, 2016, has been audited by Deloitte & Touche LLP, an independent registered public accounting firm, as stated in their report appearing herein, which expresses an unqualified opinion on the effectiveness of the Company’s internal control over financial reporting as of December 31, 2016.
The Company’s management, including the chief executive officer and chief financial officer, does not expect that our internal control over financial reporting will prevent or detect all errors and all frauds. A control system, no matter how well designed and operated, can provide only reasonable, not absolute, assurance that the control system’s objectives will be met. The design of a control system must reflect the fact that there are resource constraints, and the benefits of controls must be considered relative to their costs. Further, because of the inherent limitations in all control systems, no evaluation of controls can provide absolute assurance that misstatements due to error or fraud will not occur or that all control issues and instances of fraud, if any, within the Company have been detected. These inherent limitations include the realities that judgments in decision-making can be faulty and that breakdowns can occur because of simple error or mistake. Controls can also be circumvented by the individual acts of some persons, by collusion of two or more people, or by management override of the controls. The design of any system of controls is based, in part, on certain assumptions about the likelihood of future events, and there can be no assurance that any design will succeed in achieving its stated goals under all potential future conditions. Projections of any evaluation of controls effectiveness to future periods are subject to risks. Over time, controls may become inadequate because of changes in conditions or deterioration in the degree of compliance with policies or procedures.
|
GLATFELTER 2016 FORM 10-K |
27 |
REPORT OF INDEPENDENT REGISTERED PUBLIC ACCOUNTING FIRM
To the Board of Directors and Shareholders of P. H. Glatfelter Company
We have audited the internal control over financial reporting of P. H. Glatfelter Company and subsidiaries (the "Company") as of December 31, 2016, based on criteria established in Internal Control — Integrated Framework (2013) issued by the Committee of Sponsoring Organizations of the Treadway Commission. The Company's management is responsible for maintaining effective internal control over financial reporting and for its assessment of the effectiveness of internal control over financial reporting, included in the accompanying Management’s Report on Internal Control over Financial Reporting. Our responsibility is to express an opinion on the Company's internal control over financial reporting based on our audit.
We conducted our audit in accordance with the standards of the Public Company Accounting Oversight Board (United States). Those standards require that we plan and perform the audit to obtain reasonable assurance about whether effective internal control over financial reporting was maintained in all material respects. Our audit included obtaining an understanding of internal control over financial reporting, assessing the risk that a material weakness exists, testing and evaluating the design and operating effectiveness of internal control based on the assessed risk, and performing such other procedures as we considered necessary in the circumstances. We believe that our audit provides a reasonable basis for our opinion.
A company's internal control over financial reporting is a process designed by, or under the supervision of, the company's principal executive and principal financial officers, or persons performing similar functions, and effected by the company's board of directors, management, and other personnel to provide reasonable assurance regarding the reliability of financial reporting and the preparation of financial statements for external purposes in accordance with generally accepted accounting principles. A company's internal control over financial reporting includes those policies and procedures that (1) pertain to the maintenance of records that, in reasonable detail, accurately and fairly reflect the transactions and dispositions of the assets of the company;
(2) provide reasonable assurance that transactions are recorded as necessary to permit preparation of financial
statements in accordance with generally accepted accounting principles, and that receipts and expenditures of the company are being made only in accordance with authorizations of management and directors of the company; and (3) provide reasonable assurance regarding prevention or timely detection of unauthorized acquisition, use, or disposition of the company's assets that could have a material effect on the financial statements.
Because of the inherent limitations of internal control over financial reporting, including the possibility of collusion or improper management override of controls, material misstatements due to error or fraud may not be prevented or detected on a timely basis. Also, projections of any evaluation of the effectiveness of the internal control over financial reporting to future periods are subject to the risk that the controls may become inadequate because of changes in conditions, or that the degree of compliance with the policies or procedures may deteriorate.
In our opinion, the Company maintained, in all material respects, effective internal control over financial reporting as of December 31, 2016, based on the criteria established in Internal Control — Integrated Framework (2013) issued by the Committee of Sponsoring Organizations of the Treadway Commission.
We have also audited, in accordance with the standards of the Public Company Accounting Oversight Board (United States), the consolidated financial statements and financial statement schedule as of and for the year ended December 31, 2016 of the Company and our report dated February 24, 2017 expressed an unqualified opinion on those consolidated financial statements and financial statement schedule.
DELOITTE & TOUCHE LLP
Philadelphia, Pennsylvania
February 24, 2017
28
REPORT OF INDEPENDENT REGISTERED PUBLIC ACCOUNTING FIRM
To the Board of Directors and Shareholders of P. H. Glatfelter Company
We have audited the accompanying consolidated balance sheets of P. H. Glatfelter Company and subsidiaries (the "Company") as of December 31, 2016 and 2015, and the related consolidated statements of income, comprehensive income, shareholders’ equity, and cash flows for each of the three years in the period ended December 31, 2016. Our audits also included the financial statement schedule listed in the Index at Item 15. These consolidated financial statements and financial statement schedule are the responsibility of the Company's management. Our responsibility is to express an opinion on the consolidated financial statements and financial statement schedule based on our audits.
We conducted our audits in accordance with the standards of the Public Company Accounting Oversight Board (United States). Those standards require that we plan and perform the audit to obtain reasonable assurance about whether the financial statements are free of material misstatement. An audit includes examining, on a test basis, evidence supporting the amounts and disclosures in the financial statements. An audit also includes assessing the accounting principles used and significant estimates made by management, as well as evaluating the overall financial statement presentation. We believe that our audits provide a reasonable basis for our opinion.
In our opinion, such consolidated financial statements present fairly, in all material respects, the financial position of P. H. Glatfelter Company and subsidiaries as of December 31, 2016 and 2015, and the results of their operations and their cash flows for each of the three years in the period ended December 31, 2016, in conformity with accounting principles generally accepted in the United States of America. Also, in our opinion, such financial statement schedule, when considered in relation to the basic consolidated financial statements taken as a whole, presents fairly, in all material respects, the information set forth therein.
We have also audited, in accordance with the standards of the Public Company Accounting Oversight Board (United States), the Company's internal control over financial reporting as of December 31, 2016, based on the criteria established in Internal Control — Integrated Framework (2013) issued by the Committee of Sponsoring Organizations of the Treadway Commission and our report dated February 24, 2017 expressed an unqualified opinion on the Company's internal control over financial reporting.
DELOITTE & TOUCHE LLP
Philadelphia, Pennsylvania
February 24, 2017
|
GLATFELTER 2016 FORM 10-K |
29 |
P. H. GLATFELTER COMPANY AND SUBSIDIARIES
CONSOLIDATED STATEMENTS OF INCOME
|
|
|
Year ended December 31 |
|
||||||||||
|
In thousands, except per share |
|
2016 |
|
|
|
2015 |
|
|
2014 |
|
|||
|
Net sales |
|
$ |
1,604,797 |
|
|
|
$ |
1,661,084 |
|
|
$ |
1,802,415 |
|
|
Energy and related sales, net |
|
|
6,141 |
|
|
|
|
5,664 |
|
|
|
7,927 |
|
|
Total revenues |
|
|
1,610,938 |
|
|
|
|
1,666,748 |
|
|
|
1,810,342 |
|
|
Costs of products sold |
|
|
1,392,335 |
|
|
|
|
1,463,783 |
|
|
|
1,575,188 |
|
|
Gross profit |
|
|
218,603 |
|
|
|
|
202,965 |
|
|
|
235,154 |
|
|
Selling, general and administrative expenses |
|
|
190,694 |
|
|
|
|
127,706 |
|
|
|
133,235 |
|
|
Losses (gains) on dispositions of plant, equipment and timberlands, net |
|
|
216 |
|
|
|
|
(21,113 |
) |
|
|
(4,861 |
) |
|
Operating income |
|
|
27,693 |
|
|
|
|
96,372 |
|
|
|
106,780 |
|
|
Non-operating income (expense) |
|
|
|
|
|
|
|
|
|
|
|
|
|
|
Interest expense |
|
|
(15,822 |
) |
|
|
|
(17,464 |
) |
|
|
(18,921 |
) |
|
Interest income |
|
|
206 |
|
|
|
|
283 |
|
|
|
159 |
|
|
Other, net |
|
|
(1,271 |
) |
|
|
|
(615 |
) |
|
|
(635 |
) |
|
Total non-operating expense |
|
|
(16,887 |
) |
|
|
|
(17,796 |
) |
|
|
(19,397 |
) |
|
Income before income taxes |
|
|
10,806 |
|
|
|
|
78,576 |
|
|
|
87,383 |
|
|
Income tax provision (benefit) |
|
|
(10,748 |
) |
|
|
|
14,001 |
|
|
|
18,137 |
|
|
Net income |
|
$ |
21,554 |
|
|
|
$ |
64,575 |
|
|
$ |
69,246 |
|
|
|
|
|
|
|
|
|
|
|
|
|
|
|
|
|
Earnings per share |
|
|
|
|
|
|
|
|
|
|
|
|
|
|
Basic |
|
$ |
0.49 |
|
|
|
$ |
1.49 |
|
|
$ |
1.60 |
|
|
Diluted |
|
|
0.49 |
|
|
|
|
1.47 |
|
|
|
1.57 |
|
|
|
|
|
|
|
|
|
|
|
|
|
|
|
|
|
Cash dividends declared per common share |
|
$ |
0.50 |
|
|
|
$ |
0.48 |
|
|
$ |
0.44 |
|
|
|
|
|
|
|
|
|
|
|
|
|
|
|
|
|
Weighted average shares outstanding |
|
|
|
|
|
|
|
|
|
|
|
|
|
|
Basic |
|
|
43,558 |
|
|
|
|
43,397 |
|
|
|
43,201 |
|
|
Diluted |
|
|
44,129 |
|
|
|
|
43,942 |
|
|
|
44,066 |
|
The accompanying notes are an integral part of these consolidated financial statements.
30
P. H. GLATFELTER COMPANY AND SUBSIDIARIES
CONSOLIDATED STATEMENTS OF COMPREHENSIVE INCOME
|
|
|
Year ended December 31 |
|
||||||||||
|
In thousands |
|
2016 |
|
|
|
2015 |
|
|
2014 |
|
|||
|
|
|
|
|
|
|
|
|
|
|
|
|
|
|
|
Net income |
|
$ |
21,554 |
|
|
|
$ |
64,575 |
|
|
$ |
69,246 |
|
|
|
|
|
|
|
|
|
|
|
|
|
|
|
|
|
Foreign currency translation adjustments |
|
|
(27,407 |
) |
|
|
|
(38,817 |
) |
|
|
(49,365 |
) |
|
Net change in: |
|
|
|
|
|
|
|
|
|
|
|
|
|
|
Deferred gains (losses) on cash flow hedges, net of taxes of $(335), $880 and $(1,281), respectively |
|
|
1,725 |
|
|
|
|
(2,581 |
) |
|
|
3,297 |
|
|
Unrecognized retirement obligations, net of taxes of $(7,247), $(2,920) and $20,730, respectively |
|
|
11,562 |
|
|
|
|
5,782 |
|
|
|
(33,445 |
) |
|
Other comprehensive loss |
|
|
(14,120 |
) |
|
|
|
(35,616 |
) |
|
|
(79,513 |
) |
|
Comprehensive income (loss) |
|
$ |
7,434 |
|
|
|
$ |
28,959 |
|
|
$ |
(10,267 |
) |
The accompanying notes are an integral part of these consolidated financial statements.
|
GLATFELTER 2016 FORM 10-K |
31 |
P. H. GLATFELTER COMPANY AND SUBSIDIARIES
|
|
|
December 31 |
|
||||||
|
In thousands |
|
2016 |
|
|
|
2015 |
|
||
|
Assets |
|
|
|
|
|
|
|
|
|
|
Cash and cash equivalents |
|
$ |
55,444 |
|
|
|
$ |
105,304 |
|
|
Accounts receivable (less allowance for doubtful accounts: 2016 - $1,719; 2015 - $2,239) |
|
|
152,989 |
|
|
|
|
167,199 |
|
|
Inventories |
|
|
249,669 |
|
|
|
|
247,214 |
|
|
Prepaid expenses and other current assets |
|
|
36,157 |
|
|
|
|
32,650 |
|
|
Total current assets |
|
|
494,259 |
|
|
|
|
552,367 |
|
|
|
|
|
|
|
|
|
|
|
|
|
Plant, equipment and timberlands, net |
|
|
775,898 |
|
|
|
|
698,864 |
|
|
Goodwill |
|
|
73,094 |
|
|
|
|
76,056 |
|
|
Intangible assets, net |
|
|
56,259 |
|
|
|
|
63,057 |
|
|
Other assets |
|
|
121,749 |
|
|
|
|
110,072 |
|
|
Total assets |
|
$ |
1,521,259 |
|
|
|
$ |
1,500,416 |
|
|
|
|
|
|
|
|
|
|
|
|
|
Liabilities and Shareholders' Equity |
|
|
|
|
|
|
|
|
|
|
|
|
|
|
|
|
|
|
|
|
|
Current portion of long-term debt |
|
$ |
8,961 |
|
|
|
$ |
7,366 |
|
|
Accounts payable |
|
|
164,345 |
|
|
|
|
172,735 |
|
|
Dividends payable |
|
|
5,455 |
|
|
|
|
5,231 |
|
|
Environmental liabilities |
|
|
25,000 |
|
|
|
|
12,544 |
|
|
Other current liabilities |
|
|
119,250 |
|
|
|
|
106,444 |
|
|
Total current liabilities |
|
|
323,011 |
|
|
|
|
304,320 |
|
|
|
|
|
|
|
|
|
|
|
|
|
Long-term debt |
|
|
363,647 |
|
|
|
|
353,296 |
|
|
|
|
|
|
|
|
|
|
|
|
|
Deferred income taxes |
|
|
54,995 |
|
|
|
|
76,458 |
|
|
|
|
|
|
|
|
|
|
|
|
|
Other long-term liabilities |
|
|
125,780 |
|
|
|
|
103,095 |
|
|
Total liabilities |
|
|
867,433 |
|
|
|
|
837,169 |
|
|
|
|
|
|
|
|
|
|
|
|
|
Commitments and contingencies |
|
|
— |
|
|
|
|
— |
|
|
|
|
|
|
|
|
|
|
|
|
|
Shareholders’ equity |
|
|
|
|
|
|
|
|
|
|
Common stock, $0.01 par value; authorized - 120,000,000; issued - 54,361,980 (including treasury shares: 2016 - 10,812,341; 2015 - 10,941,944) |
|
|
544 |
|
|
|
|
544 |
|
|
Capital in excess of par value |
|
|
57,917 |
|
|
|
|
54,912 |
|
|
Retained earnings |
|
|
962,884 |
|
|
|
|
963,143 |
|
|
Accumulated other comprehensive loss |
|
|
(204,606 |
) |
|
|
|
(190,486 |
) |
|
|
|
|
816,739 |
|
|
|
|
828,113 |
|
|
Less cost of common stock in treasury |
|
|
(162,913 |
) |
|
|
|
(164,866 |
) |
|
Total shareholders’ equity |
|
|
653,826 |
|
|
|
|
663,247 |
|
|
Total liabilities and shareholders’ equity |
|
$ |
1,521,259 |
|
|
|
$ |
1,500,416 |
|
The accompanying notes are an integral part of these consolidated financial statements.
32
P. H. GLATFELTER COMPANY AND SUBSIDIARIES
CONSOLIDATED STATEMENTS OF CASH FLOWS
|
|
|
Year ended December 31 |
|
||||||||||
|
In thousands |
|
2016 |
|
|
|
2015 |
|
|
2014 |
|
|||
|
Operating activities |
|
|
|
|
|
|
|
|
|
|
|
|
|
|
Net income |
|
$ |
21,554 |
|
|
|
$ |
64,575 |
|
|
$ |
69,246 |
|
|
Adjustments to reconcile to net cash provided by operations: |
|
|
|
|
|
|
|
|
|
|
|
|
|
|
Depreciation, depletion and amortization |
|
|
65,826 |
|
|
|
|
63,236 |
|
|
|
70,555 |
|
|
Amortization of debt issue costs and original issue discount |
|
|
1,153 |
|
|
|
|
1,184 |
|
|
|
1,315 |
|
|
Pension expense, net of unfunded benefits paid |
|
|
11,180 |
|
|
|
|
7,383 |
|
|
|
5,173 |
|
|
Charge for impairment of intangible asset |
|
|
— |
|
|
|
|
1,200 |
|
|
|
3,262 |
|
|
Deferred income tax benefit |
|
|
(22,055 |
) |
|
|
|
(1,902 |
) |
|
|
(9,419 |
) |
|
Losses (gains) on dispositions of plant, equipment and timberlands, net |
|
|
216 |
|
|
|
|
(21,113 |
) |
|
|
(4,861 |
) |
|
Share-based compensation |
|
|
5,889 |
|
|
|
|
7,244 |
|
|
|
7,859 |
|
|
Change in operating assets and liabilities |
|
|
|
|
|
|
|
|
|
|
|
|
|
|
Accounts receivable |
|
|
8,372 |
|
|
|
|
(13,312 |
) |
|
|
(5,404 |
) |
|
Inventories |
|
|
(10,778 |
) |
|
|
|
(8,054 |
) |
|
|
(21,456 |
) |
|
Prepaid and other current assets |
|
|
(2,430 |
) |
|
|
|
5,506 |
|
|
|
(3,521 |
) |
|
Accounts payable |
|
|
(8,174 |
) |
|
|
|
26,042 |
|
|
|
(4,175 |
) |
|
Accruals and other current liabilities |
|
|
43,195 |
|
|
|
|
(2,186 |
) |
|
|
(12,802 |
) |
|
Other |
|
|
2,162 |
|
|
|
|
3,940 |
|
|
|
3,805 |
|
|
Net cash provided by operating activities |
|
|
116,110 |
|
|
|
|
133,743 |
|
|
|
99,577 |
|
|
Investing activities |
|
|
|
|
|
|
|
|
|
|
|
|
|
|
Expenditures for purchases of plant, equipment and timberlands |
|
|
(160,158 |
) |
|
|
|
(99,889 |
) |
|
|
(66,046 |
) |
|
Proceeds from disposals of plant, equipment and timberlands, net |
|
|
70 |
|
|
|
|
24,459 |
|
|
|
5,072 |
|
|
Acquisition, net of cash acquired |
|
|
— |
|
|
|
|
(224 |
) |
|
|
(8,015 |
) |
|
Other |
|
|
(800 |
) |
|
|
|
(1,600 |
) |
|
|
(600 |
) |
|
Net cash used by investing activities |
|
|
(160,888 |
) |
|
|
|
(77,254 |
) |
|
|
(69,589 |
) |
|
Financing activities |
|
|
|
|
|
|
|
|
|
|
|
|
|
|
Net borrowings under (repayments of) revolving credit facility |
|
|
2,891 |
|
|
|
|
(22,294 |
) |
|
|
(30,720 |
) |
|
Payments of borrowing costs |
|
|
(136 |
) |
|
|
|
(1,329 |
) |
|
– |
|
|
|
Proceeds from term loans |
|
|
19,428 |
|
|
|
|
2,873 |
|
|
|
12,592 |
|
|
Repayment of term loans |
|
|
(8,205 |
) |
|
|
|
(5,229 |
) |
|
|
– |
|
|
Repurchases of common stock |
|
|
— |
|
|
|
|
— |
|
|
|
(12,180 |
) |
|
Payments of dividends |
|
|
(21,589 |
) |
|
|
|
(20,443 |
) |
|
|
(18,696 |
) |
|
Proceeds from government grants |
|
|
5,582 |
|
|
|
|
421 |
|
|
|
— |
|
|
Payments related to share-based compensation awards and other |
|
|
(990 |
) |
|
|
|
(2,015 |
) |
|
|
(1,877 |
) |
|
Net cash used by financing activities |
|
|
(3,019 |
) |
|
|
|
(48,016 |
) |
|
|
(50,881 |
) |
|
Effect of exchange rate changes on cash |
|
|
(2,063 |
) |
|
|
|
(3,006 |
) |
|
|
(2,152 |
) |
|
Net increase (decrease) in cash and cash equivalents |
|
|
(49,860 |
) |
|
|
|
5,467 |
|
|
|
(23,045 |
) |
|
Cash and cash equivalents at the beginning of period |
|
|
105,304 |
|
|
|
|
99,837 |
|
|
|
122,882 |
|
|
Cash and cash equivalents at the end of period |
|
$ |
55,444 |
|
|
|
$ |
105,304 |
|
|
$ |
99,837 |
|
|
Supplemental cash flow information |
|
|
|
|
|
|
|
|
|
|
|
|
|
|
Cash paid for: |
|
|
|
|
|
|
|
|
|
|
|
|
|
|
Interest, net of amounts capitalized |
|
$ |
14,569 |
|
|
|
$ |
16,256 |
|
|
$ |
17,643 |
|
|
Income taxes, net |
|
|
14,020 |
|
|
|
|
15,849 |
|
|
|
24,139 |
|
The accompanying notes are an integral part of these consolidated financial statements.
|
GLATFELTER 2016 FORM 10-K |
33 |
P. H. GLATFELTER COMPANY AND SUBSIDIARIES
CONSOLIDATED STATEMENTS OF SHAREHOLDERS’ EQUITY
For the Years Ended December 31, 2016, 2015 and 2014
|
In thousands |
Common Stock |
|
|
Capital in Excess of Par Value |
|
|
Retained Earnings |
|
|
Accumulated Other Comprehensive Loss |
|
|
Treasury Stock |
|
|
Total Shareholders’ Equity |
|
||||||
|
Balance at January 1, 2014 |
$ |
544 |
|
|
$ |
53,940 |
|
|
$ |
869,329 |
|
|
$ |
(75,357 |
) |
|
$ |
(163,980 |
) |
|
$ |
684,476 |
|
|
Net income |
|
|
|
|
|
|
|
|
|
69,246 |
|
|
|
|
|
|
|
|
|
|
|
69,246 |
|
|
Other comprehensive loss |
|
|
|
|
|
|
|
|
|
|
|
|
|
(79,513 |
) |
|
|
|
|
|
|
(79,513 |
) |
|
Comprehensive loss |
|
|
|
|
|
|
|
|
|
|
|
|
|
|
|
|
|
|
|
|
|
(10,267 |
) |
|
Tax effect on exercise of stock awards |
|
|
|
|
|
(14 |
) |
|
|
|
|
|
|
|
|
|
|
|
|
|
|
(14 |
) |
|
Cash dividends declared ($0.44 per share) |
|
|
|
|
|
|
|
|
|
(19,107 |
) |
|
|
|
|
|
|
|
|
|
|
(19,107 |
) |
|
Share-based compensation expense |
|
|
|
|
|
4,738 |
|
|
|
|
|
|
|
|
|
|
|
|
|
|
|
4,738 |
|
|
Repurchase of common shares |
|
|
|
|
|
|
|
|
|
|
|
|
|
|
|
|
|
(12,180 |
) |
|
|
(12,180 |
) |
|
Delivery of treasury shares |
|
|
|
|
|
|
|
|
|
|
|
|
|
|
|
|
|
|
|
|
|
|
|
|
RSUs |
|
|
|
|
|
(4,121 |
) |
|
|
|
|
|
|
|
|
|
|
2,363 |
|
|
|
(1,758 |
) |
|
401 (k) plans |
|
|
|
|
|
1,318 |
|
|
|
|
|
|
|
|
|
|
|
1,775 |
|
|
|
3,093 |
|
|
Employee stock options exercised — net |
|
|
|
|
|
(1,519 |
) |
|
|
|
|
|
|
|
|
|
|
1,647 |
|
|
|
128 |
|
|
Balance at December 31, 2014 |
|
544 |
|
|
|
54,342 |
|
|
|
919,468 |
|
|
|
(154,870 |
) |
|
|
(170,375 |
) |
|
|
649,109 |
|
|
|
|
|
|
|
|
|
|
|
|
|
|
|
|
|
|
|
|
|
|
|
|
|
|
|
Net income |
|
|
|
|
|
|
|
|
|
64,575 |
|
|
|
|
|
|
|
|
|
|
|
64,575 |
|
|
Other comprehensive loss |
|
|
|
|
|
|
|
|
|
|
|
|
|
(35,616 |
) |
|
|
|
|
|
|
(35,616 |
) |
|
Comprehensive income |
|
|
|
|
|
|
|
|
|
|
|
|
|
|
|
|
|
|
|
|
|
28,959 |
|
|
Tax effect on exercise of stock awards |
|
|
|
|
|
843 |
|
|
|
|
|
|
|
|
|
|
|
|
|
|
|
843 |
|
|
Cash dividends declared ($0.48 per share) |
|
|
|
|
|
|
|
|
|
(20,900 |
) |
|
|
|
|
|
|
|
|
|
|
(20,900 |
) |
|
Share-based compensation expense |
|
|
|
|
|
4,403 |
|
|
|
|
|
|
|
|
|
|
|
|
|
|
|
4,403 |
|
|
Delivery of treasury shares |
|
|
|
|
|
|
|
|
|
|
|
|
|
|
|
|
|
|
|
|
|
|
|
|
RSUs and PSAs |
|
|
|
|
|
(5,078 |
) |
|
|
|
|
|
|
|
|
|
|
3,102 |
|
|
|
(1,976 |
) |
|
401 (k) plans |
|
|
|
|
|
838 |
|
|
|
|
|
|
|
|
|
|
|
2,010 |
|
|
|
2,848 |
|
|
Employee stock options exercised — net |
|
|
|
|
|
(436 |
) |
|
|
|
|
|
|
|
|
|
|
397 |
|
|
|
(39 |
) |
|
Balance at December 31, 2015 |
|
544 |
|
|
|
54,912 |
|
|
|
963,143 |
|
|
|
(190,486 |
) |
|
|
(164,866 |
) |
|
|
663,247 |
|
|
|
|
|
|
|
|
|
|
|
|
|
|
|
|
|
|
|
|
|
|
|
|
|
|
|
Net income |
|
|
|
|
|
|
|
|
|
21,554 |
|
|
|
|
|
|
|
|
|
|
|
21,554 |
|
|
Other comprehensive loss |
|
|
|
|
|
|
|
|
|
|
|
|
|
(14,120 |
) |
|
|
|
|
|
|
(14,120 |
) |
|
Comprehensive income |
|
|
|
|
|
|
|
|
|
|
|
|
|
|
|
|
|
|
|
|
|
7,434 |
|
|
Tax effect on exercise of stock awards |
|
|
|
|
|
58 |
|
|
|
|
|
|
|
|
|
|
|
|
|
|
|
58 |
|
|
Cash dividends declared ($0.50 per share) |
|
|
|
|
|
|
|
|
|
(21,813 |
) |
|
|
|
|
|
|
|
|
|
|
(21,813 |
) |
|
Share-based compensation expense |
|
|
|
|
|
5,889 |
|
|
|
|
|
|
|
|
|
|
|
|
|
|
|
5,889 |
|
|
Delivery of treasury shares |
|
|
|
|
|
|
|
|
|
|
|
|
|
|
|
|
|
|
|
|
|
|
|
|
RSUs and PSAs |
|
|
|
|
|
(2,375 |
) |
|
|
|
|
|
|
|
|
|
|
1,624 |
|
|
|
(751 |
) |
|
Employee stock options exercised — net |
|
|
|
|
|
(567 |
) |
|
|
|
|
|
|
|
|
|
|
329 |
|
|
|
(238 |
) |
|
Balance at December 31, 2016 |
$ |
544 |
|
|
$ |
57,917 |
|
|
$ |
962,884 |
|
|
$ |
(204,606 |
) |
|
$ |
(162,913 |
) |
|
$ |
653,826 |
|
The accompanying notes are an integral part of the consolidated financial statements.
34
NOTES TO CONSOLIDATED FINANCIAL STATEMENTS
|
1. |
P. H. Glatfelter Company and subsidiaries (“Glatfelter”) is a manufacturer of specialty papers and fiber-based engineered materials. Headquartered in York, PA, U.S. operations include facilities in Spring Grove, PA and Chillicothe and Fremont, OH. International operations include facilities in Canada, Germany, France, the United Kingdom and the Philippines, and sales and distribution offices in Russia and China. Our products are marketed worldwide, either through wholesale paper merchants, brokers and agents, or directly to customers.
|
2. |
Principles of Consolidation The consolidated financial statements include the accounts of Glatfelter and its wholly owned subsidiaries. All intercompany balances and transactions have been eliminated.
Accounting Estimates The preparation of financial statements in conformity with accounting principles generally accepted in the United States of America requires management to make estimates and assumptions that affect the reported amounts of assets and liabilities and disclosures of contingencies as of the balance sheet date and the reported amounts of revenues and expenses during the reporting period. Management believes the estimates and assumptions used in the preparation of these consolidated financial statements are reasonable, based upon currently available facts and known circumstances, but recognizes that actual results may differ from those estimates and assumptions.
Cash and Cash Equivalents We classify all highly liquid instruments with an original maturity of three months or less at the time of purchase as cash equivalents.
Inventories Inventories are stated at the lower of cost or market. Raw materials, in-process and finished inventories of our U.S. manufacturing operations are valued using the last-in, first-out (LIFO) method, and the supplies inventories are valued principally using the average-cost method. Inventories at our foreign operations are valued using the average cost method.
Plant, Equipment and Timberlands For financial reporting purposes, depreciation is computed using the straight-line method over the estimated useful lives of the respective assets.
The range of estimated service lives used to calculate financial reporting depreciation for principal items of plant and equipment are as follows:
|
Buildings |
15 – 45 Years |
|
Machinery and equipment |
5 – 40 Years |
|
Other |
3 – 25 Years |
Maintenance and Repairs Maintenance and repairs costs are charged to income and major renewals and betterments are capitalized. At the time property is retired or sold, the net carrying value is eliminated and any resultant gain or loss is included in income.
Valuation of Long-lived Assets, Intangible Assets and Goodwill We evaluate long-lived assets for impairment when a specific event indicates that the carrying value of an asset may not be recoverable. Recoverability is assessed based on estimates of future cash flows expected to result from the use and eventual disposition of the asset. If the sum of expected undiscounted cash flows is less than the carrying value of the asset, the asset’s fair value is estimated and an impairment loss is recognized for the amount by which the carrying value exceeds the estimated fair value. Goodwill and non-amortizing tradename intangible assets are reviewed, on a discounted cash flow basis, during the third quarter of each year for impairment or more frequently if impairment indicators are present. Impairment losses, if any, are recognized for the amount by which the carrying value of the reporting unit exceeds its fair value. The carrying value of a reporting unit is defined using an enterprise premise which is generally determined by the difference between the unit’s assets and operating liabilities.
Asset Retirement Obligations In accordance with the Financial Accounting Standards Board (“FASB”) Accounting Standards Codification (“ASC”) No. 410, Asset Retirement and Environmental Obligations, we accrue asset retirement obligations in the period in which obligations relating to future asset retirements are incurred and when a reasonable estimate of fair value can be determined. Under these standards, costs are to be accrued at estimated fair value, and a related long-lived asset is capitalized. Over time, the liability is accreted to its settlement value and the capitalized cost is depreciated over the useful life of the related asset for which the obligation exists. Upon settlement of the liability, we recognize a gain or loss for any difference between the settlement amount and the liability recorded.
Income Taxes Income taxes are determined using the asset and liability method of accounting for income taxes in accordance with FASB ASC 740 Income Taxes (“ASC 740”). Under ASC 740, tax expense includes U.S.
|
GLATFELTER 2016 FORM 10-K |
35 |
and international income taxes plus the provision for U.S. taxes on undistributed earnings of international subsidiaries not deemed to be permanently invested. Tax credits and other incentives reduce tax expense in the year the credits are claimed. Certain items of income and expense are not reported in tax returns and financial statements in the same year. The tax effect of such temporary differences is reported in deferred income taxes. Deferred tax assets are recognized if it is more likely than not that the assets will be realized in future years. We establish a valuation allowance for deferred tax assets for which realization is not more likely than not.
Significant judgment is required in determining our worldwide provision for income taxes and recording the related assets and liabilities. In the ordinary course of our business, there are many transactions and calculations where the ultimate tax determination is less than certain. We and our subsidiaries are examined by various Federal, State, and foreign tax authorities. We regularly assess the potential outcomes of these examinations and any future examinations for the current or prior years in determining the adequacy of our provision for income taxes. We continually assess the likelihood and amount of potential adjustments and record any necessary adjustments in the period in which the facts that give rise to a revision become known.
Investment tax credits are accounted for by the flow-through method, which results in recognition of the benefit in the year in which the credit become available.
Treasury Stock Common stock purchased for treasury is recorded at cost. At the date of subsequent reissue, the treasury stock account is reduced by the cost of such stock on the weighted-average cost basis.
Foreign Currency Translation Foreign currency translation gains and losses and the effect of exchange rate changes on transactions designated as hedges of net foreign investments are included as a component of other comprehensive income (loss). Transaction gains and losses are included in income in the period in which they occur.
Revenue Recognition We recognize revenue on product sales when the customer takes title and assumes the risks and rewards of ownership. Estimated costs for sales incentives, discounts and sales returns and allowances are recorded as sales deductions in the period in which the related revenue is recognized.
Revenue from energy sales is recognized when electricity is delivered to the customer. Certain costs associated with the production of electricity, such as fuel, labor, depreciation and maintenance are netted against energy sales for presentation on the consolidated statements of income.
Revenue from renewable energy credits is recorded under the caption “Energy and related sales, net” in the
consolidated statements of income and is recognized when all risks, rights and rewards to the certificate are transferred to the counterparty.
Environmental Liabilities Accruals for losses associated with environmental obligations are recorded when it is probable that a liability has been incurred and the amount of the liability can be reasonably estimated based on existing legislation and remediation technologies. These accruals are adjusted periodically as assessment and remediation actions continue and/or further legal or technical information develops. Such undiscounted liabilities are exclusive of any insurance or other claims against third parties. Environmental costs are capitalized if the costs extend the life of the asset, increase its capacity and/or mitigate or prevent contamination from future operations. Recoveries of environmental remediation costs from other parties, including insurance carriers, are recorded as assets when their receipt is assured beyond a reasonable doubt.
Earnings Per Share Basic earnings per share is computed by dividing net income by the weighted-average common shares outstanding during the respective periods. Diluted earnings per share is computed by dividing net income by the weighted-average common shares and common share equivalents outstanding during the period. The dilutive effect of common share equivalents is considered in the diluted earnings per share computation using the treasury stock method.
Financial Derivatives and Hedging Activities We use financial derivatives to manage exposure to changes in foreign currencies. In accordance with FASB ASC 815 Derivatives and Hedging (“ASC 815”), we record all derivatives on the balance sheet at fair value. The accounting for changes in the fair value of derivatives depends on the intended use of the derivative, whether we have elected to designate a derivative in a hedging relationship and apply hedge accounting, and whether the hedging relationship has satisfied the criteria necessary to apply hedge accounting.
Cash Flow Hedges The effective portion of the gain or loss on those derivative instruments designated and qualifying as a hedge of the exposure to variability in expected future cash flows related to forecasted transactions is deferred and reported as a component of accumulated other comprehensive income (loss). Deferred gains or losses are reclassified to our results of operations at the time the hedged forecasted transaction is recorded in our results of operations. The effectiveness of cash flow hedges is assessed at inception and quarterly thereafter. If the instrument becomes ineffective or it becomes probable that the originally forecasted transaction will not occur, the related change in fair value of the derivative instrument is also reclassified from accumulated other comprehensive income (loss) and recognized in earnings.
36
Fair Value of Financial Instruments Under the accounting for fair value measurements and disclosures, a fair value hierarchy was established that prioritizes the inputs to valuation techniques used to measure fair value. The hierarchy gives the highest priority to unadjusted quoted prices in active markets for identical assets or liabilities (Level 1 measurements) and the lowest priority to unobservable inputs (Level 3 measurements). A financial instrument's level within the fair value hierarchy is based on the lowest level of any input that is significant to the fair value measurement. The three levels of the fair value hierarchy are described below:
|
Level 1 - |
Unadjusted quoted prices in active markets that are accessible at the measurement date for identical, unrestricted assets or liabilities. |
|
Level 2 - |
Inputs other than quoted prices included within Level 1 that are observable for the asset or liability, either directly or indirectly, including quoted prices for similar assets or liabilities in active markets; quoted prices for identical or similar assets or liabilities in markets that are not active; inputs other than quoted prices that are observable for the asset or liability (e.g., interest rates); and inputs that are derived principally from or corroborated by observable market data by correlation or other means. |
|
Level 3 - |
Inputs that are both significant to the fair value measurement and unobservable. |
Recently Issued Accounting Pronouncements In March 2016, the Financial Accounting Standards Board (“FASB”) issued Accounting Standards Update (“ASU”) No. 2016-09, Compensation – Stock Compensation (Topic 718) Improvements to Employee Share-Based Payment Accounting designed to simplify certain aspects of accounting for share-based awards. The new ASU requires entities to recognize as a component of income tax expense all excess tax benefits or deficiencies arising from the difference between compensation costs recognized and the intrinsic value at the time an option is exercised or, in the case of restricted stock and similar awards, the fair value upon vesting of an award. Previously such differences were recognized in additional paid in capital as part of an “APIC pool.” In addition, the ASU also requires entities to exclude excess tax benefits and tax deficiencies from the calculation of common share equivalents for purposes of calculating earnings per share. The new standard is required to be adopted, either prospectively or retrospectively, in the first quarter of 2017. We do not believe the adoption of this standard will have a material impact on our reported results of operations or financial position.
In February 2016, the FASB issued ASU No. 2016-02, Leases (Topic 842). This ASU will require organizations that lease assets to recognize on the balance sheet the assets and liabilities for the rights and obligations created by those leases. The new guidance will be effective for annual periods beginning after December 15, 2018, and interim periods therein. Early adoption is permitted. We are in the process of assessing the impact this standard will have on us and expect to follow a modified retrospective method provided for under the standard.
In May 2014, the FASB issued ASU No. 2014-09, Revenue from Contracts with Customers which clarifies the principles for recognizing revenue and develops a common revenue standard for GAAP and International Financial Reporting Standards. The new standard is required to be adopted retrospectively for fiscal years beginning after December 15, 2017 and early adoption is permitted only for reporting periods beginning after December 31, 2016. We are in the process of evaluating the impact this standard may have, if any, on our reported results of operations or financial position. Based on our initial assessment, we do not expect this ASU will have a significant impact on the timing or amount of revenue recognition.
In June 2016, the FASB issued ASU No. 2016-13 Financial Instruments—Credit Losses (Topic 326): Measurement of Credit Losses on Financial Instruments that changes the impairment model for most financial instruments, including trade receivables from an incurred loss method to a new forward-looking approach, based on expected losses. Under the new guidance, an allowance is recognized based on an estimate of expected credit losses. This standard is effective for us in the first quarter of 2020 and must be adopted using a modified retrospective transition approach. We are currently assessing the impact this standard may have on our results of operations and financial position.
|
3. |
On October 1, 2014, we completed the acquisition of all of the outstanding equity of Spezialpapierfabrik Oberschmitten GmbH (“SPO”) from FINSPO Beteiligungs-GmbH for $8.0 million. SPO had annual sales of approximately $33 million in 2014. SPO, located near Frankfurt, Germany, primarily produces highly technical papers for a wide range of capacitors used in consumer and industrial products; insulation papers for cables and transformers; and materials for industrial power inverters, electromagnetic current filters and electric rail traction. SPO also produces glassine products, which are used in cosmetics packaging, food packaging, and pharmaceutical dosage bags. SPO is operated as part of the Composite Fibers business unit, and complements our technical specialties products.
|
GLATFELTER 2016 FORM 10-K |
37 |
|
4. |
We sell excess power generated by the Spring Grove, PA facility. We also sell renewable energy credits generated by the Spring Grove, PA and Chillicothe, OH facilities representing sales of certified credits earned related to burning renewable sources of energy such as black liquor and wood waste.
The following table summarizes this activity for each of the past three years:
|
|
Year ended December 31 |
|
|
||||||||||
|
In thousands |
2016 |
|
|
|
2015 |
|
|
2014 |
|
|
|||
|
Energy sales |
$ |
3,613 |
|
|
|
$ |
5,315 |
|
|
$ |
11,886 |
|
|
|
Costs to produce |
|
(3,972 |
) |
|
|
|
(4,428 |
) |
|
|
(6,204 |
) |
|
|
Net |
|
(359 |
) |
|
|
|
887 |
|
|
|
5,682 |
|
|
|
Renewable energy credits |
|
6,500 |
|
|
|
|
4,777 |
|
|
|
2,245 |
|
|
|
Total |
$ |
6,141 |
|
|
|
$ |
5,664 |
|
|
$ |
7,927 |
|
|
|
5. |
During 2016, 2015 and 2014, we completed the following sales of assets:
|
Dollars in thousands |
|
Acres |
|
|
Proceeds |
|
|
Gain (loss) |
|
|
|||
|
2016 |
|
|
|
|
|
|
|
|
|
|
|
|
|
|
Other |
|
n/a |
|
|
|
70 |
|
|
|
(216 |
) |
|
|
|
Total |
|
|
|
|
|
$ |
70 |
|
|
$ |
(216 |
) |
|
|
2015 |
|
|
|
|
|
|
|
|
|
|
|
|
|
|
Timberlands |
|
|
15,628 |
|
|
$ |
23,917 |
|
|
$ |
20,867 |
|
|
|
Other |
|
n/a |
|
|
542 |
|
|
246 |
|
|
|||
|
Total |
|
|
|
|
|
$ |
24,459 |
|
|
$ |
21,113 |
|
|
|
2014 |
|
|
|
|
|
|
|
|
|
|
|
|
|
|
Timberlands |
|
|
2,753 |
|
|
$ |
5,062 |
|
|
$ |
4,855 |
|
|
|
Other |
|
n/a |
|
|
10 |
|
|
6 |
|
|
|||
|
Total |
|
|
|
|
|
$ |
5,072 |
|
|
$ |
4,861 |
|
|
|
6. |
During 2015 and 2014, in connection with our annual test of potential impairment of indefinite lived intangible assets, we recorded $1.2 million and $3.3 million, respectively, of non-cash asset impairment charges. No such charges were recorded in 2016. The trade name intangible asset was acquired in connection with our Composite Fibers business unit’s 2013 Dresden
acquisition. The charges were due to changes in the estimated fair value of the trade name, primarily driven by lower forecasted revenues associated with the business, an increase in discount rates related to Dresden’s business in Russia and Ukraine and this region’s political and economic instability. The fair value of the asset was estimated using a discounted cash flow model under a relief from royalty method. The significant assumptions used included projected financial performance and discount rates, which resulted in a Level 3 fair value classification.
The charge is recorded in the accompanying consolidated statements of income under the caption “Selling, general and administrative expenses.” For additional information on Goodwill and Intangible Assets, see Note 14.
|
7. |
The following table sets forth the details of basic and diluted earnings per share (EPS):
|
|
Year ended December 31 |
|
|
||||||||||
|
In thousands, except per share |
|
2016 |
|
|
|
2015 |
|
|
2014 |
|
|
||
|
Net income |
$ |
21,554 |
|
|
|
$ |
64,575 |
|
|
$ |
69,246 |
|
|
|
Weighted average common shares outstanding used in basic EPS |
|
43,558 |
|
|
|
|
43,397 |
|
|
|
43,201 |
|
|
|
Common shares issuable upon exercise of dilutive stock options and PSAs / RSUs |
|
571 |
|
|
|
|
545 |
|
|
|
865 |
|
|
|
Weighted average common shares outstanding and common share equivalents used in diluted EPS |
|
44,129 |
|
|
|
|
43,942 |
|
|
|
44,066 |
|
|
|
Earnings per share |
|
|
|
|
|
|
|
|
|
|
|
|
|
|
Basic |
$ |
0.49 |
|
|
|
$ |
1.49 |
|
|
$ |
1.60 |
|
|
|
Diluted |
|
0.49 |
|
|
|
|
1.47 |
|
|
|
1.57 |
|
|
The following table sets forth the potential common shares outstanding for stock options that were not included in the computation of diluted EPS for the period indicated, because their effect would be anti-dilutive:
|
|
Year ended December 31 |
|
|
||||||||||
|
In thousands |
2016 |
|
|
|
2015 |
|
|
2014 |
|
|
|||
|
Potential common shares |
|
596 |
|
|
|
|
678 |
|
|
|
277 |
|
|
38
The following table sets forth details of the changes in accumulated other comprehensive income (losses) for the three years ended December 31, 2016, 2015 and 2014.
|
In thousands |
Currency translation adjustments |
|
|
Unrealized gain (loss) on cash flow hedges |
|
|
Change in pensions |
|
|
Change in other postretirement defined benefit plans |
|
|
Total |
|
|||||
|
Balance at January 1, 2016 |
$ |
(73,041 |
) |
|
$ |
(225 |
) |
|
$ |
(120,714 |
) |
|
$ |
3,494 |
|
|
$ |
(190,486 |
) |
|
Other comprehensive income before reclassifications (net of tax) |
|
(27,407 |
) |
|
|
1,247 |
|
|
|
(4,334 |
) |
|
|
2,086 |
|
|
|
(28,408 |
) |
|
Amounts reclassified from accumulated other comprehensive income (net of tax) |
|
— |
|
|
|
478 |
|
|
|
14,392 |
|
|
|
(582 |
) |
|
|
14,288 |
|
|
Net current period other comprehensive income (loss) |
|
(27,407 |
) |
|
|
1,725 |
|
|
|
10,058 |
|
|
|
1,504 |
|
|
|
(14,120 |
) |
|
Balance at December 31, 2016 |
$ |
(100,448 |
) |
|
$ |
1,500 |
|
|
$ |
(110,656 |
) |
|
$ |
4,998 |
|
|
$ |
(204,606 |
) |
|
Balance at January 1, 2015 |
$ |
(34,224 |
) |
|
$ |
2,356 |
|
|
$ |
(120,260 |
) |
|
$ |
(2,742 |
) |
|
$ |
(154,870 |
) |
|
Other comprehensive income before reclassifications (net of tax) |
|
(38,817 |
) |
|
|
1,620 |
|
|
|
(12,995 |
) |
|
|
6,266 |
|
|
|
(43,926 |
) |
|
Amounts reclassified from accumulated other comprehensive income (net of tax) |
|
— |
|
|
|
(4,201 |
) |
|
|
12,541 |
|
|
|
(30 |
) |
|
|
8,310 |
|
|
Net current period other comprehensive income (loss) |
|
(38,817 |
) |
|
|
(2,581 |
) |
|
|
(454 |
) |
|
|
6,236 |
|
|
|
(35,616 |
) |
|
Balance at December 31, 2015 |
$ |
(73,041 |
) |
|
$ |
(225 |
) |
|
$ |
(120,714 |
) |
|
$ |
3,494 |
|
|
$ |
(190,486 |
) |
|
Balance at January 1, 2014 |
$ |
15,141 |
|
|
$ |
(941 |
) |
|
$ |
(89,547 |
) |
|
$ |
(10 |
) |
|
$ |
(75,357 |
) |
|
Other comprehensive income before reclassifications (net of tax) |
|
(49,365 |
) |
|
|
2,826 |
|
|
|
(40,266 |
) |
|
|
(2,803 |
) |
|
|
(89,608 |
) |
|
Amounts reclassified from accumulated other comprehensive income (net of tax) |
|
— |
|
|
|
471 |
|
|
|
9,553 |
|
|
|
71 |
|
|
|
10,095 |
|
|
Net current period other comprehensive income (loss) |
|
(49,365 |
) |
|
|
3,297 |
|
|
|
(30,713 |
) |
|
|
(2,732 |
) |
|
|
(79,513 |
) |
|
Balance at December 31, 2014 |
$ |
(34,224 |
) |
|
$ |
2,356 |
|
|
$ |
(120,260 |
) |
|
$ |
(2,742 |
) |
|
$ |
(154,870 |
) |
The following table sets forth the amounts reclassified from accumulated other comprehensive income (losses) for the years indicated.
|
|
Year ended December 31 |
|
|
|
|
|||||||
|
In thousands |
2016 |
|
2015 |
|
2014 |
|
|
|
|
|||
|
Description |
|
|
|
|
|
|
|
|
|
|
Line Item in Statements of Income |
|
|
Cash flow hedges (Note 19) |
|
|
|
|
|
|
|
|
|
|
|
|
|
(Gains) losses on cash flow hedges |
$ |
551 |
|
$ |
(5,752 |
) |
$ |
655 |
|
|
Costs of products sold |
|
|
Tax expense (benefit) |
|
(73 |
) |
|
1,551 |
|
|
(184 |
) |
|
Income tax provision |
|
|
Net of tax |
|
478 |
|
|
(4,201 |
) |
|
471 |
|
|
|
|
|
Retirement plan obligations (Note 11) |
|
|
|
|
|
|
|
|
|
|
|
|
|
Amortization of deferred benefit pension plan items |
|
|
|
|
|
|
|
|
|
|
|
|
|
Prior service costs |
|
2,026 |
|
|
2,300 |
|
|
2,503 |
|
|
Costs of products sold |
|
|
|
|
672 |
|
|
762 |
|
|
830 |
|
|
Selling, general and administrative |
|
|
Actuarial losses |
|
9,798 |
|
|
12,745 |
|
|
8,965 |
|
|
Costs of products sold |
|
|
|
|
3,373 |
|
|
4,388 |
|
|
3,086 |
|
|
Selling, general and administrative |
|
|
Settlement recognition |
|
7,306 |
|
|
— |
|
|
— |
|
|
Selling, general and administrative |
|
|
|
|
23,175 |
|
|
20,195 |
|
|
15,384 |
|
|
|
|
|
Tax expense (benefit) |
|
(8,783 |
) |
|
(7,654 |
) |
|
(5,831 |
) |
|
Income tax provision |
|
|
Net of tax |
|
14,392 |
|
|
12,541 |
|
|
9,553 |
|
|
|
|
|
Amortization of deferred benefit other plan items |
|
|
|
|
|
|
|
|
|
|
|
|
|
Prior service costs |
|
(150 |
) |
|
(230 |
) |
|
(237 |
) |
|
Costs of products sold |
|
|
|
|
(32 |
) |
|
(50 |
) |
|
(51 |
) |
|
Selling, general and administrative |
|
|
Actuarial losses |
|
(621 |
) |
|
190 |
|
|
331 |
|
|
Costs of products sold |
|
|
|
|
(134 |
) |
|
41 |
|
|
71 |
|
|
Selling, general and administrative |
|
|
|
|
(937 |
) |
|
(49 |
) |
|
114 |
|
|
|
|
|
Tax expense (benefit) |
|
355 |
|
|
19 |
|
|
(43 |
) |
|
Income tax provision |
|
|
Net of tax |
|
(582 |
) |
|
(30 |
) |
|
71 |
|
|
|
|
|
Total reclassifications, net of tax |
$ |
14,288 |
|
$ |
8,310 |
|
$ |
10,095 |
|
|
|
|
|
GLATFELTER 2016 FORM 10-K |
39 |
|
9. |
Income taxes are recognized for the amount of taxes payable or refundable for the current year and deferred tax liabilities and assets for the future tax consequences of events that have been recognized in our consolidated financial statements or tax returns. The effects of income taxes are measured based on enacted tax laws and rates.
The provision for income taxes from operations consisted of the following:
|
|
Year ended December 31 |
|
|
|||||||||||
|
In thousands |
2016 |
|
|
|
2015 |
|
|
|
2014 |
|
|
|||
|
Current taxes |
|
|
|
|
|
|
|
|
|
|
|
|
|
|
|
Federal |
$ |
2,216 |
|
|
|
$ |
5,047 |
|
|
|
$ |
3,291 |
|
|
|
State |
|
(1,112 |
) |
|
|
|
(1,680 |
) |
|
|
|
238 |
|
|
|
Foreign |
|
10,203 |
|
|
|
|
12,536 |
|
|
|
|
24,027 |
|
|
|
|
|
11,307 |
|
|
|
|
15,903 |
|
|
|
|
27,556 |
|
|
|
Deferred taxes and other |
|
|
|
|
|
|
|
|
|
|
|
|
|
|
|
Federal |
|
(24,411 |
) |
|
|
|
(7,287 |
) |
|
|
|
(3,975 |
) |
|
|
State |
|
(1,723 |
) |
|
|
|
564 |
|
|
|
|
(147 |
) |
|
|
Foreign |
|
4,079 |
|
|
|
|
4,821 |
|
|
|
|
(5,297 |
) |
|
|
|
|
(22,055 |
) |
|
|
|
(1,902 |
) |
|
|
|
(9,419 |
) |
|
|
Income tax provision (benefit) |
$ |
(10,748 |
) |
|
|
$ |
14,001 |
|
|
|
$ |
18,137 |
|
|
The following are the domestic and foreign components of pretax income (loss) from operations:
|
|
Year ended December 31 |
|
|
|||||||||||
|
In thousands |
2016 |
|
|
|
2015 |
|
|
|
2014 |
|
|
|||
|
United States |
$ |
(63,315 |
) |
|
|
$ |
2,382 |
|
|
|
$ |
4,637 |
|
|
|
Foreign |
|
74,121 |
|
|
|
|
76,194 |
|
|
|
|
82,746 |
|
|
|
Total pretax income |
$ |
10,806 |
|
|
|
$ |
78,576 |
|
|
|
$ |
87,383 |
|
|
A reconciliation between the income tax provision, computed by applying the statutory federal income tax rate of 35% to income before income taxes, and the actual income tax provision is as follows:
|
|
Year ended December 31 |
|
|
|||||||||||
|
|
2016 |
|
|
|
2015 |
|
|
|
2014 |
|
|
|||
|
Federal income tax provision at statutory rate |
|
35.0 |
% |
|
|
|
35.0 |
% |
|
|
|
35.0 |
% |
|
|
State income taxes, net of federal income tax benefit |
|
(15.0 |
) |
|
|
|
0.3 |
|
|
|
|
0.2 |
|
|
|
Foreign income tax rate differential |
|
(96.3 |
) |
|
|
|
(8.6 |
) |
|
|
|
(5.0 |
) |
|
|
Rate changes due to enacted legislation |
|
(6.7 |
) |
|
|
– |
|
|
|
|
(2.2 |
) |
|
|
|
Tax effect of credits |
|
(30.3 |
) |
|
|
|
(1.9 |
) |
|
|
|
(2.0 |
) |
|
|
Provision for (resolution of ) tax matters |
|
2.8 |
|
|
|
|
(2.1 |
) |
|
|
|
1.3 |
|
|
|
Permanent differences on non-U.S. earnings |
|
- |
|
|
|
|
(4.4 |
) |
|
|
|
(2.8 |
) |
|
|
Valuation allowance |
|
7.1 |
|
|
|
|
0.4 |
|
|
|
|
(2.7 |
) |
|
|
Other |
|
3.9 |
|
|
|
|
(0.9 |
) |
|
|
|
(1.0 |
) |
|
|
Actual tax rate |
|
(99.5 |
)% |
|
|
|
17.8 |
% |
|
|
|
20.8 |
% |
|
The sources of deferred income taxes were as follows at December 31:
|
In thousands |
2016 |
|
|
|
2015 |
|
|
||
|
Reserves |
$ |
4,625 |
|
|
|
$ |
4,720 |
|
|
|
Environmental |
|
20,868 |
|
|
|
|
7,211 |
|
|
|
Compensation |
|
8,950 |
|
|
|
|
8,250 |
|
|
|
Post-retirement benefits |
|
18,318 |
|
|
|
|
19,476 |
|
|
|
Research & development expenses |
|
6,949 |
|
|
|
|
8,925 |
|
|
|
Inventories |
|
1,464 |
|
|
|
|
3,445 |
|
|
|
Other |
|
993 |
|
|
|
|
605 |
|
|
|
Tax carryforwards |
|
14,438 |
|
|
|
|
8,413 |
|
|
|
Deferred tax assets |
|
76,605 |
|
|
|
|
61,045 |
|
|
|
Valuation allowance |
|
(4,066 |
) |
|
|
|
(3,773 |
) |
|
|
Net deferred tax assets |
|
72,539 |
|
|
|
|
57,272 |
|
|
|
Property |
|
(81,837 |
) |
|
|
|
(84,009 |
) |
|
|
Intangible assets |
|
(16,561 |
) |
|
|
|
(17,748 |
) |
|
|
Pension |
|
(29,041 |
) |
|
|
|
(26,885 |
) |
|
|
Deferred tax liabilities |
|
(127,439 |
) |
|
|
|
(128,642 |
) |
|
|
Net deferred tax liabilities |
$ |
(54,900 |
) |
|
|
$ |
(71,370 |
) |
|
Non-current deferred tax assets and liabilities are included in the following balance sheet captions:
|
|
December 31 |
|
|
||||||
|
In thousands |
2016 |
|
|
|
2015 |
|
|
||
|
Other assets |
$ |
95 |
|
|
|
$ |
5,088 |
|
|
|
Deferred income taxes |
|
54,995 |
|
|
|
|
76,458 |
|
|
At December 31, 2016 we had federal, state and foreign tax net operating loss (“NOL”) carryforwards of $15.5 million, $77.8 million and $4.8 million, respectively. These NOL carryforwards are available to offset future taxable income, if any. The federal NOL carryforward expires in 2036, state NOLs expire at various times and in various amounts beginning in 2017 and through 2036. Certain foreign NOL carryforwards begin to expire after 2019.
The state and foreign NOL carryforwards and federal tax credits on the income tax returns filed included unrecognized tax benefits taken in prior years. The NOLs for which a deferred tax asset is recognized for financial statement purposes in accordance with ASC 740 are presented net of these unrecognized tax benefits.
In addition, we had various federal tax credit carryforwards totaling $2.9 million which begin to expire in 2035, state tax credit carryforwards totaling $0.2 million, which begin to expire in 2017, and foreign investment tax credits of $0.8 million which begin to expire after 2030.
As of December 31, 2016 and 2015, we had a valuation allowance of $4.1 million and $3.8 million, respectively, against net deferred tax assets, primarily due to uncertainty regarding the ability to utilize state and foreign tax NOL carryforwards and certain state tax credits. In assessing the need for a valuation allowance, management considers all available positive and negative evidence in its analysis. Based on this analysis, we
40
recorded a valuation allowance for the portion of deferred tax assets where the weight of available evidence indicated it is more likely than not that the deferred tax assets will not be realized.
Tax credits and other incentives reduce tax expense in the year the credits are claimed. We recorded tax credits of $1.1 million, $1.5 million and $1.8 million in 2016, 2015 and 2014, respectively, related to research and development credits and fuels tax credits. We also recognized $2.2 million related to investment tax credits in 2016.
At December 31, 2016 and 2015, unremitted earnings of subsidiaries outside the United States deemed to be indefinitely reinvested totaled $399.9 million and $338.6 million, respectively. Because the unremitted earnings of subsidiaries are deemed to be indefinitely reinvested as of December 31, 2016 and because we have no need for or plans to repatriate such earnings, no deferred tax liability has been recognized in our consolidated financial statements. It is not practicable to determine the amount of additional taxes that have not been provided.
As of December 31, 2016, 2015 and 2014, we had $14.2 million, $12.2 million and $14.9 million of gross unrecognized tax benefits, respectively. As of December 31, 2016, if such benefits were to be recognized, approximately $11.3 million would be recorded as a component of income tax expense, thereby affecting our effective tax rate.
A reconciliation of the beginning and ending balances of the total amounts of gross unrecognized tax benefits is as follows:
|
In millions |
2016 |
|
|
|
2015 |
|
|
|
2014 |
|
|
|||
|
Balance at January 1 |
$ |
12.2 |
|
|
|
$ |
14.9 |
|
|
|
$ |
14.9 |
|
|
|
Increases in tax positions for prior years |
|
2.0 |
|
|
|
- |
|
|
|
|
0.7 |
|
|
|
|
Decreases in tax positions for prior years |
|
(1.4 |
) |
|
|
|
(4.3 |
) |
|
|
|
(0.5 |
) |
|
|
Acquisition related: |
|
|
|
|
|
|
|
|
|
|
|
|
|
|
|
Purchase Accounting |
|
- |
|
|
|
|
- |
|
|
|
|
0.3 |
|
|
|
Increases in tax positions for current year |
|
1.9 |
|
|
|
|
1.9 |
|
|
|
|
3.4 |
|
|
|
Settlements |
|
(0.2 |
) |
|
|
- |
|
|
|
|
(1.3 |
) |
|
|
|
Lapse in statutes of limitation |
|
(0.3 |
) |
|
|
|
(0.3 |
) |
|
|
|
(2.6 |
) |
|
|
Balance at December 31 |
$ |
14.2 |
|
|
|
$ |
12.2 |
|
|
|
$ |
14.9 |
|
|
We, or one of our subsidiaries, file income tax returns with the United States Internal Revenue Service, as well as various state and foreign authorities. The following table summarizes tax years that remain subject to examination by major jurisdiction:
|
|
Open Tax Years |
|
|||
|
Jurisdiction |
Examinations not yet initiated |
|
|
Examination in progress |
|
|
United States |
|
|
|
|
|
|
Federal |
2013 - 2016 |
|
|
N/A |
|
|
State |
2012 - 2016 |
|
|
2014 |
|
|
Canada(1) |
2010 - 2016 |
|
|
N/A |
|
|
Germany(1) |
2012 - 2016 |
|
|
2011 - 2013 |
|
|
France |
2014 - 2016 |
|
|
2011 - 2012 |
|
|
United Kingdom |
2015 - 2016 |
|
|
N/A |
|
|
Philippines |
2015 -2016 |
|
|
2013, 2014 |
|
|
(1) |
includes provincial or similar local jurisdictions, as applicable. |
The amount of income taxes we pay is subject to ongoing audits by federal, state and foreign tax authorities, which often result in proposed assessments. Management performs a comprehensive review of its global tax positions on a quarterly basis and accrues amounts for uncertain tax positions. Based on these reviews and the result of discussions and resolutions of matters with certain tax authorities and the closure of tax years subject to tax audit, reserves are adjusted as necessary. However, future results may include favorable or unfavorable adjustments to our estimated tax liabilities in the period the assessments are determined or resolved or as such statutes are closed. Due to potential for resolution of federal, state and foreign examinations, and the expiration of various statutes of limitation, it is reasonably possible our gross unrecognized tax benefits balance may decrease within the next twelve months by a range of zero to $0.9 million. Substantially all of this range relates to tax positions taken in the United Kingdom and in the U.S.
We recognize interest and penalties related to uncertain tax positions as income tax expense. The following table summarizes information related to interest and penalties on uncertain tax positions:
|
|
As of or for the year ended December 31, |
|
|
|||||||||||
|
In millions |
2016 |
|
|
|
2015 |
|
|
|
2014 |
|
|
|||
|
Accrued interest payable |
$ |
0.5 |
|
|
|
$ |
0.6 |
|
|
|
$ |
0.6 |
|
|
|
Interest expense (income) |
|
(0.1 |
) |
|
|
– |
|
|
|
– |
|
|
||
|
Penalties |
– |
|
|
|
– |
|
|
|
– |
|
|
|||
|
10. |
The P. H. Glatfelter Amended and Restated Long Term Incentive Plan (the “LTIP”) provides for the issuance of Glatfelter common stock to eligible participants in the form of restricted stock units, restricted
|
GLATFELTER 2016 FORM 10-K |
41 |
stock awards, non-qualified stock options, performance shares, incentive stock options and performance units. As of December 31, 2016, there were 611,699 shares of common stock available for future issuance under the LTIP.
Since the approval of the LTIP, we have issued to eligible participants restricted stock units, performance share awards and stock only stock appreciation rights (“SOSARs”).
Restricted Stock Units (“RSUs”) and Performance Share Awards (“PSAs”)Awards of RSUs and PSAs are made under our LTIP. The vesting of RSUs is generally based on the passage of time, generally on a graded scale over a three, four, and five-year period. Beginning in March of 2011, PSAs were issued annually to members of senior management and each respective grant cliff vests each December 31, assuming the achievement of predetermined, multi-year cumulative performance targets. The performance measures include a minimum, target and maximum performance level providing the grantees an opportunity to receive more or less shares than targeted depending on actual financial performance. For both RSUs and PSAs, the grant date fair value of the awards, which is equal to the closing price per common share on the date of the award, is used to determine the amount of expense to be recognized over the applicable service period. Settlement of RSUs and
PSAs will be made in shares of our common stock currently held in treasury.
The following table summarizes RSU and PSA activity during the past three years:
|
Units |
2016 |
|
|
|
2015 |
|
|
|
2014 |
|
|||
|
Balance at January 1, |
|
674,523 |
|
|
|
|
888,942 |
|
|
|
|
1,001,814 |
|
|
Granted |
|
302,722 |
|
|
|
|
164,666 |
|
|
|
|
178,882 |
|
|
Forfeited |
|
(148,232 |
) |
|
|
|
(92,183 |
) |
|
|
|
(47,379 |
) |
|
Shares delivered |
|
(149,975 |
) |
|
|
|
(286,902 |
) |
|
|
|
(244,375 |
) |
|
Balance at December 31, |
|
679,038 |
|
|
|
|
674,523 |
|
|
|
|
888,942 |
|
|
|
2016 |
|
|
|
2015 |
|
|
|
2014 |
|
|||
|
Compensation expense |
$ |
3,154 |
|
|
|
$ |
1,758 |
|
|
|
$ |
2,652 |
|
The amount granted in 2016, 2015 and 2014 includes 199,693, 105,017 and 101,743 PSAs, respectively, exclusive of reinvested dividends. The performance period for the 2014 PSAs concluded on December 31, 2016 and, based on actual performance relative to target, no shares underlying the PSA were issued to participants. The weighted average grant date fair value per unit for awards in 2016, 2015 and 2014 was $18.08, $24.62 and $28.89, respectively. As of December 31, 2016, unrecognized compensation expense for outstanding RSUs and PSAs totaled $5.4 million. The weighted average remaining period over which the expense will be recognized is 2.1 years.
42
Stock Only Stock Appreciation Rights The following table sets forth information related to outstanding SOSARS:
|
|
2016 |
|
|
|
2015 |
|
|
2014 |
|
|
||||||||||||||||
|
SOSARS |
Shares |
|
|
|
Wtd Avg Exercise Price |
|
|
|
Shares |
|
|
Wtd Avg Exercise Price |
|
|
Shares |
|
|
Wtd Avg Exercise Price |
|
|
||||||
|
Outstanding at January 1, |
|
2,199,742 |
|
|
|
$ |
17.82 |
|
|
|
|
1,864,707 |
|
|
$ |
16.20 |
|
|
|
1,977,133 |
|
|
$ |
13.91 |
|
|
|
Granted |
|
743,925 |
|
|
|
|
17.54 |
|
|
|
|
423,590 |
|
|
|
24.62 |
|
|
|
281,881 |
|
|
29.78 |
|
|
|
|
Exercised |
|
(61,190 |
) |
|
|
|
10.70 |
|
|
|
|
(70,347 |
) |
|
|
14.12 |
|
|
|
(364,465 |
) |
|
|
13.99 |
|
|
|
Canceled / forfeited |
|
(145,861 |
) |
|
|
|
22.80 |
|
|
|
|
(18,208 |
) |
|
|
25.41 |
|
|
|
(29,842 |
) |
|
|
19.36 |
|
|
|
Outstanding at December 31, |
|
2,736,616 |
|
|
|
$ |
17.64 |
|
|
|
|
2,199,742 |
|
|
$ |
17.82 |
|
|
|
1,864,707 |
|
|
$ |
16.20 |
|
|
|
Exercisable at December 31, |
|
1,740,591 |
|
|
|
|
16.19 |
|
|
|
|
1,504,599 |
|
|
14.48 |
|
|
|
1,285,998 |
|
|
|
12.94 |
|
|
|
|
Vested and expected to vest |
|
2,725,611 |
|
|
|
|
|
|
|
|
|
2,178,708 |
|
|
|
|
|
|
|
1,754,295 |
|
|
|
|
|
|
|
|
|
|
|
|
|
|
|
|
|
|
|
|
|
|
|
|
|
|
|
|
|
|
|
|
|
|
|
SOSAR Grants |
|
|
|
|
|
|
|
|
|
|
|
|
|
|
|
|
|
|
|
|
|
|
|
|
|
|
|
Weighted average grant date fair value per share |
$ |
4.07 |
|
|
|
|
|
|
|
|
$ |
7.46 |
|
|
|
|
|
|
$ |
9.81 |
|
|
|
|
|
|
|
Aggregate grant date fair value (in thousands) |
$ |
3,013 |
|
|
|
|
|
|
|
|
$ |
3,134 |
|
|
|
|
|
|
$ |
2,764 |
|
|
|
|
|
|
|
Black-Scholes assumptions |
|
|
|
|
|
|
|
|
|
|
|
|
|
|
|
|
|
|
|
|
|
|
|
|
|
|
|
Dividend yield |
|
2.85 |
% |
|
|
|
|
|
|
|
|
1.94 |
% |
|
|
|
|
|
|
1.48 |
% |
|
|
|
|
|
|
Risk free rate of return |
|
1.34 |
% |
|
|
|
|
|
|
|
|
1.64 |
% |
|
|
|
|
|
|
1.74 |
% |
|
|
|
|
|
|
Volatility |
|
31.97 |
% |
|
|
|
|
|
|
|
|
36.38 |
% |
|
|
|
|
|
|
37.59 |
% |
|
|
|
|
|
|
Expected life |
6 |
|
|
|
|
|
|
|
|
6 |
|
|
|
|
|
|
6 |
|
|
|
|
|
|
|||
|
Compensation expense (in thousands) |
$ |
2,735 |
|
|
|
|
|
|
|
|
$ |
2,645 |
|
|
|
|
|
|
$ |
2,086 |
|
|
|
|
|
|
Under terms of the SOSAR, the recipients receive the right to receive a payment in the form of shares of common stock equal to the difference, if any, in the fair market value of one share of common stock at the time of exercising the SOSAR and the exercise price. The SOSARs vest ratably over a three year period. As of December 31, 2016, the intrinsic value of SOSARs vested and expected to vest totaled $18.9 million and the remaining weighted average contractual life of outstanding SOSARs was 5.2 years.
|
11. |
We provide non-contributory retirement benefits under both funded and unfunded plans to all U.S. employees and to certain non-U.S. employees. Participation and benefits under the plans are based upon the employees’ date of hire and the covered group in which that employee falls. U.S. benefits are based on either a unit-benefit formula for bargained hourly employees, or a final average pay formula or cash balance formula for salaried employees. Non-U.S. benefits are based, in the case of certain plans, on average salary and years of service and, in the case of other plans, on a fixed amount for each year of service. U.S. plan provisions and funding meet the requirements of the Employee Retirement Income Security Act of 1974. We use a December 31-measurement date for all of our defined benefit plans.
|
GLATFELTER 2016 FORM 10-K |
43 |
We also provide certain health care benefits to eligible U.S.-based retired employees and exclude all salaried employees hired after January 1, 2008. These benefits include a comprehensive medical plan for retirees prior to age 65 and fixed supplemental premium payments to certain retirees over age 65 to help defray the costs of Medicare. Claims are paid as reported.
|
|
|
Pension Benefits |
|
|
|
Other Benefits |
|
||||||||||||
|
In millions |
|
2016 |
|
|
|
2015 |
|
|
|
2016 |
|
|
|
2015 |
|
||||
|
Change in Benefit Obligation |
|
|
|
|
|
|
|
|
|
|
|
|
|
|
|
|
|
|
|
|
Balance at beginning of year |
|
$ |
541.9 |
|
|
|
$ |
577.6 |
|
|
|
$ |
51.0 |
|
|
|
$ |
59.8 |
|
|
Service cost |
|
|
10.5 |
|
|
|
|
11.6 |
|
|
|
|
1.1 |
|
|
|
|
1.4 |
|
|
Interest cost |
|
|
24.5 |
|
|
|
|
23.3 |
|
|
|
|
2.0 |
|
|
|
|
2.0 |
|
|
Plan amendments |
|
|
5.5 |
|
|
|
|
- |
|
|
|
|
- |
|
|
|
|
- |
|
|
Participant contributions |
|
|
- |
|
|
|
|
- |
|
|
|
|
1.0 |
|
|
|
|
1.2 |
|
|
Actuarial (gain)/loss |
|
|
17.0 |
|
|
|
|
(34.8 |
) |
|
|
|
(3.4 |
) |
|
|
|
(10.1 |
) |
|
Benefits paid |
|
|
(22.9 |
) |
|
|
|
(34.8 |
) |
|
|
|
(3.8 |
) |
|
|
|
(3.3 |
) |
|
One-time settlement |
|
|
(24.2 |
) |
|
|
|
- |
|
|
|
|
- |
|
|
|
|
- |
|
|
Effect of currency rate changes |
|
|
(0.3 |
) |
|
|
|
(1.0 |
) |
|
|
|
- |
|
|
|
|
- |
|
|
Balance at end of year |
|
$ |
552.0 |
|
|
|
$ |
541.9 |
|
|
|
$ |
47.9 |
|
|
|
$ |
51.0 |
|
|
|
|
|
|
|
|
|
|
|
|
|
|
|
|
|
|
|
|
|
|
|
Change in Plan Assets |
|
|
|
|
|
|
|
|
|
|
|
|
|
|
|
|
|
|
|
|
Fair value of plan assets at beginning of year |
|
$ |
594.9 |
|
|
|
$ |
638.0 |
|
|
|
$ |
- |
|
|
|
$ |
- |
|
|
Actual return on plan assets |
|
|
60.8 |
|
|
|
|
(10.3 |
) |
|
|
|
- |
|
|
|
|
- |
|
|
Total contributions |
|
|
2.1 |
|
|
|
|
2.0 |
|
|
|
|
3.8 |
|
|
|
|
3.3 |
|
|
Benefits paid |
|
|
(22.9 |
) |
|
|
|
(34.8 |
) |
|
|
|
(3.8 |
) |
|
|
|
(3.3 |
) |
|
One-time settlement |
|
|
(24.2 |
) |
|
|
|
- |
|
|
|
|
- |
|
|
|
|
- |
|
|
Fair value of plan assets at end of year |
|
$ |
610.7 |
|
|
|
|
594.9 |
|
|
|
|
- |
|
|
|
|
- |
|
|
Funded status at end of year |
|
$ |
58.7 |
|
|
|
$ |
53.0 |
|
|
|
$ |
(47.9 |
) |
|
|
$ |
(51.0 |
) |
In 2016, the we recorded a pension settlement charge of $7.3 million and settled $24.2 million of benefits in connection with a voluntary program offered to deferred vested terminated participants.
Amounts recognized in the consolidated balance sheets consist of the following as of December 31:
|
|
|
Pension Benefits |
|
|
|
Other Benefits |
|
||||||||||||
|
In millions |
|
2016 |
|
|
|
2015 |
|
|
|
2016 |
|
|
|
2015 |
|
||||
|
Other assets |
|
$ |
96.7 |
|
|
|
$ |
89.1 |
|
|
|
$ |
- |
|
|
|
$ |
- |
|
|
Current liabilities |
|
|
(2.0 |
) |
|
|
|
(2.1 |
) |
|
|
|
(3.2 |
) |
|
|
|
(3.2 |
) |
|
Other long-term liabilities |
|
|
(36.0 |
) |
|
|
|
(34.0 |
) |
|
|
|
(44.7 |
) |
|
|
|
(47.7 |
) |
|
Net amount recognized |
|
$ |
58.7 |
|
|
|
$ |
53.0 |
|
|
|
$ |
(47.9 |
) |
|
|
$ |
(50.9 |
) |
The components of amounts recognized as “Accumulated other comprehensive income” consist of the following on a pre-tax basis:
|
|
|
Pension Benefits |
|
|
|
Other Benefits |
|
||||||||||||
|
In millions |
|
2016 |
|
|
|
2015 |
|
|
|
2016 |
|
|
|
2015 |
|
||||
|
Prior service cost/(credit) |
|
$ |
14.8 |
|
|
|
$ |
12.0 |
|
|
|
$ |
(0.6 |
) |
|
|
$ |
(0.8 |
) |
|
Net actuarial loss |
|
|
165.9 |
|
|
|
|
185.0 |
|
|
|
|
(7.4 |
) |
|
|
|
(4.8 |
) |
The accumulated benefit obligation for all defined benefit pension plans was $537.6 million and $526.7 million at December 31, 2016 and 2015, respectively.
The weighted-average assumptions used in computing the benefit obligations above were as follows:
|
|
|
Pension Benefits |
|
|
|
Other Benefits |
|
||||||||||||
|
|
|
2016 |
|
|
|
2015 |
|
|
|
2016 |
|
|
|
2015 |
|
||||
|
Discount rate – benefit obligation |
|
|
4.43 |
% |
|
|
|
4.65 |
% |
|
|
|
4.18 |
% |
|
|
|
4.38 |
% |
|
Future compensation growth rate |
|
|
3.00 |
|
|
|
|
3.50 |
|
|
|
– |
|
|
|
– |
|
||
The discount rates set forth above were estimated based on the modeling of expected cash flows for each of our benefit plans and selecting a portfolio of high-quality debt instruments with maturities matching the respective cash flows of each plan. The resulting discount rates as of December 31, 2016 ranged from 1.90% to 4.55% for pension plans and from 4.02% to 4.21% for other benefit plans.
Information for pension plans with an accumulated benefit obligation in excess of plan assets was as follows:
|
In millions |
|
2016 |
|
|
|
2015 |
|
||
|
Projected benefit obligation |
|
$ |
37.9 |
|
|
|
$ |
36.1 |
|
|
Accumulated benefit obligation |
|
|
34.6 |
|
|
|
|
33.1 |
|
|
Fair value of plan assets |
|
– |
|
|
|
– |
|
||
44
Net periodic benefit cost includes the following components:
|
|
|
Year Ended December 31 |
|
|||||||||||
|
In millions |
|
2016 |
|
|
|
2015 |
|
|
|
2014 |
|
|||
|
Pension Benefits |
|
|
|
|
|
|
|
|
|
|
|
|
|
|
|
Service cost |
|
$ |
10.5 |
|
|
|
$ |
11.6 |
|
|
|
$ |
10.4 |
|
|
Interest cost |
|
|
24.5 |
|
|
|
|
23.3 |
|
|
|
|
24.8 |
|
|
Expected return on plan assets |
|
|
(45.4 |
) |
|
|
|
(46.0 |
) |
|
|
|
(43.9 |
) |
|
Amortization of prior service cost |
|
|
2.7 |
|
|
|
|
3.1 |
|
|
|
|
3.3 |
|
|
Amortization of actuarial loss |
|
|
13.2 |
|
|
|
|
17.1 |
|
|
|
|
12.1 |
|
|
One-time settlement charge |
|
|
7.3 |
|
|
|
|
— |
|
|
|
|
— |
|
|
Total net periodic benefit cost |
|
$ |
12.8 |
|
|
|
$ |
9.1 |
|
|
|
$ |
6.7 |
|
|
|
|
|
|
|
|
|
|
|
|
|
|
|
|
|
|
Other Benefits |
|
|
|
|
|
|
|
|
|
|
|
|
|
|
|
Service cost |
|
$ |
1.1 |
|
|
|
$ |
1.4 |
|
|
|
$ |
1.5 |
|
|
Interest cost |
|
|
2.0 |
|
|
|
|
2.0 |
|
|
|
|
2.5 |
|
|
Amortization of prior service cost/(credit) |
|
|
(0.2 |
) |
|
|
|
(0.3 |
) |
|
|
|
(0.3 |
) |
|
Amortization of actuarial loss |
|
|
(0.8 |
) |
|
|
|
0.2 |
|
|
|
|
0.4 |
|
|
Total net periodic benefit cost |
|
$ |
2.1 |
|
|
|
$ |
3.3 |
|
|
|
$ |
4.1 |
|
The prior service cost and actuarial net loss for our defined benefit pension plans that will be amortized from accumulated other comprehensive income (loss) into our results of operations as a component of net periodic benefit cost over the next fiscal year are $2.8 million and $11.3 million, respectively. The comparable amounts of expected amortization for other benefit plans are a credit of $0.2 million and $0.6 million, respectively.
Other changes in plan assets and benefit obligations recognized in other comprehensive income (loss) were as follows:
|
|
|
|
Year Ended December 31 |
|
||||||
|
In millions |
|
|
2016 |
|
|
|
2015 |
|
||
|
Pension Benefits |
|
|
|
|
|
|
|
|
|
|
|
Actuarial loss |
|
|
$ |
1.4 |
|
|
|
$ |
21.5 |
|
|
Plan amendments |
|
|
|
5.5 |
|
|
|
|
— |
|
|
Recognized prior service cost |
|
|
|
(2.7 |
) |
|
|
|
(3.1 |
) |
|
Recognized actuarial losses |
|
|
|
(20.5 |
) |
|
|
|
(17.1 |
) |
|
Total recognized in other comprehensive loss |
|
|
|
(16.3 |
) |
|
|
|
1.3 |
|
|
Total recognized in net periodic benefit cost and other comprehensive loss |
|
|
$ |
(3.5 |
) |
|
|
$ |
10.4 |
|
|
Other Benefits |
|
|
|
|
|
|
|
|
|
|
|
Actuarial (gain) loss |
|
|
$ |
(3.4 |
) |
|
|
$ |
(10.1 |
) |
|
Amortization of prior service cost |
|
|
|
0.2 |
|
|
|
|
0.3 |
|
|
Amortization of actuarial losses |
|
|
|
0.8 |
|
|
|
|
(0.2 |
) |
|
Total recognized in other comprehensive (income) loss |
|
|
|
(2.4 |
) |
|
|
|
(10.0 |
) |
|
Total recognized in net periodic benefit cost and other comprehensive (income) loss |
|
|
$ |
(0.3 |
) |
|
|
$ |
(6.7 |
) |
The weighted-average assumptions used in computing the net periodic benefit cost information above were as follows:
|
|
|
|
Year Ended December 31 |
|
|||||||||||
|
|
|
|
2016 |
|
|
|
2015 |
|
|
|
2014 |
|
|||
|
Pension Benefits |
|
|
|
|
|
|
|
|
|
|
|
|
|
|
|
|
Discount rate – benefit expense |
|
|
|
4.65 |
% |
|
|
|
4.21 |
% |
|
|
|
5.20 |
% |
|
Future compensation growth rate |
|
|
|
3.50 |
|
|
|
|
4.00 |
|
|
|
|
4.00 |
|
|
Expected long-term rate of return on plan assets |
|
|
|
7.75 |
|
|
|
|
8.00 |
|
|
|
|
8.00 |
|
|
|
|
|
|
|
|
|
|
|
|
|
|
|
|
|
|
|
Other Benefits |
|
|
|
|
|
|
|
|
|
|
|
|
|
|
|
|
Discount rate – benefit expense |
|
|
|
4.38 |
% |
|
|
|
3.89 |
% |
|
|
|
4.52 |
% |
To develop the expected long-term rate of return assumption, we considered the historical returns and the future expected returns for each asset class, as well as the target asset allocation of the pension portfolio.
Assumed health care cost trend rates used to determine benefit obligations at December 31 were as follows:
|
|
|
2016 |
|
|
|
2015 |
|
||
|
Health care cost trend rate assumed for next year |
|
|
6.50 |
% |
|
|
|
6.80 |
% |
|
Rate to which the cost trend rate is assumed to decline (the ultimate trend rate) |
|
|
4.50 |
|
|
|
|
4.50 |
|
|
Year that the rate reaches the ultimate rate |
|
2037 |
|
|
|
2037 |
|
||
Assumed health care cost trend rates have a significant effect on the amounts reported for health care plans. A one percentage-point change in assumed health care cost trend rates would have the following effects:
|
|
|
One Percentage Point |
|
||||||
|
In millions |
|
Increase |
|
|
|
Decrease |
|
||
|
Effect on: |
|
|
|
|
|
|
|
|
|
|
Post-retirement benefit obligation |
|
$ |
3.8 |
|
|
|
$ |
(3.4 |
) |
|
Total of service and interest cost components |
|
|
0.3 |
|
|
|
|
(0.3 |
) |
Plan Assets All pension plan assets in the U.S. are invested through a single master trust fund. The strategic asset allocation for this trust fund is selected by management, reflecting the results of comprehensive asset and liability modeling. The general principles guiding U.S. pension asset investment policies are those embodied in the Employee Retirement Income Security Act of 1974 (ERISA). These principles include discharging our investment responsibilities for the exclusive benefit of plan participants and in accordance with the “prudent expert” standard and other ERISA rules and regulations. We establish strategic asset allocation percentage targets and appropriate benchmarks for significant asset classes with the aim of achieving a prudent balance between return and risk.
Investments and decisions will be made solely in the interest of the Plan’s participants and beneficiaries, and for the exclusive purpose of providing benefits accrued thereunder. The primary goal of the Plan is to ensure the
|
GLATFELTER 2016 FORM 10-K |
45 |
solvency of the Plan over time and thereby meet its distribution objectives. All investments in the Plan will be made in accordance with ERISA and other applicable statutes.
Risk is minimized by diversification by asset class, by style of each manager and by sector and industry limits when applicable. The targeted range of investment allocations of Plan assets is as follows:
|
|
|
Range |
|
||||||
|
Domestic Equity |
|
|
35 |
% |
|
- |
|
45 |
% |
|
International equity |
|
8 |
|
|
- |
14 |
|
||
|
Real Estate Investment Trusts (REIT) |
|
2 |
|
|
- |
6 |
|
||
|
Fixed income, cash and cash equivalents |
|
55 |
|
|
- |
35 |
|
||
Diversification of plan assets is achieved by:
|
|
i. |
placing restrictions on the percentage of equity investments in any one company, percentage of investment in any one industry, limiting the amount of assets placed with any one manager; and |
|
|
ii. |
setting targets for duration of fixed income securities, maintaining a certain level of credit quality, and limiting the amount of investment in a single security and in non-investment grade paper. |
A formal asset allocation review is done periodically to ensure that the Plan has an appropriate asset allocation based on the Plan’s projected benefit obligations. The target return for each equity and fixed income manager will be one that places the manager’s performance in the top 40% of its peers and, on a gross basis, exceeds that of the manager’s respective benchmark index. The target return for cash and cash equivalents is a return that at least equals that of the 90-day T-bills.
The Investment Policy statement lists specific categories of securities or activities that are prohibited including options, futures, commodities, hedge funds, limited partnerships, and our stock.
The table below presents the fair values of our benefit plan assets by level within the fair value hierarchy, as described in Note 2:
|
|
|
December 31, 2016 |
|
||||||||||||||||
|
In millions |
|
Total |
|
|
|
Level 1 |
|
|
|
Level 2 |
|
|
|
Level 3 |
|
||||
|
Domestic Equity |
|
|
|
|
|
|
|
|
|
|
|
|
|
|
|
|
|
|
|
|
Large cap |
|
$ |
201.9 |
|
|
|
$ |
7.1 |
|
|
|
$ |
194.8 |
|
|
|
$ |
- |
|
|
Small and mid cap |
|
|
50.9 |
|
|
|
|
50.9 |
|
|
|
|
- |
|
|
|
|
- |
|
|
International equity |
|
|
79.5 |
|
|
|
|
38.8 |
|
|
|
|
40.7 |
|
|
|
|
- |
|
|
REIT |
|
|
27.9 |
|
|
|
|
27.9 |
|
|
|
|
- |
|
|
|
|
- |
|
|
Fixed income |
|
|
237.7 |
|
|
|
|
28.5 |
|
|
|
|
209.2 |
|
|
|
|
- |
|
|
Cash and equivalents |
|
|
12.8 |
|
|
|
|
- |
|
|
|
|
12.8 |
|
|
|
|
- |
|
|
Total |
|
$ |
610.7 |
|
|
|
$ |
153.2 |
|
|
|
$ |
457.5 |
|
|
|
$ |
- |
|
|
|
|
December 31, 2015 |
|
||||||||||||||||
|
In millions |
|
Total |
|
|
|
Level 1 |
|
|
|
Level 2 |
|
|
|
Level 3 |
|
||||
|
Domestic Equity |
|
|
|
|
|
|
|
|
|
|
|
|
|
|
|
|
|
|
|
|
Large cap |
|
$ |
175.1 |
|
|
|
$ |
58.4 |
|
|
|
$ |
116.7 |
|
|
|
$ |
- |
|
|
Small and mid cap |
|
|
68.7 |
|
|
|
|
68.7 |
|
|
|
|
- |
|
|
|
|
- |
|
|
International equity |
|
|
79.8 |
|
|
|
|
42.2 |
|
|
|
|
37.6 |
|
|
|
|
- |
|
|
REIT |
|
|
31.9 |
|
|
|
|
31.9 |
|
|
|
|
- |
|
|
|
|
- |
|
|
Fixed income |
|
|
222.4 |
|
|
|
|
32.3 |
|
|
|
|
190.1 |
|
|
|
|
- |
|
|
Cash and equivalents |
|
|
17.0 |
|
|
|
|
- |
|
|
|
|
17.0 |
|
|
|
|
- |
|
|
Total |
|
$ |
594.9 |
|
|
|
$ |
233.5 |
|
|
|
$ |
361.4 |
|
|
|
$ |
- |
|
Cash Flow We were not required to make contributions to our qualified pension plan in 2016 nor do we expect to make any to this plan in 2017. Benefit payments expected to be made in 2017 under our non-qualified pension plans and other benefit plans are summarized below:
|
In thousands |
|
|
|
|
|
|
|
|
Nonqualified pension plans |
|
|
|
|
$ |
1,991 |
|
|
Other benefit plans |
|
|
|
|
|
3,212 |
|
The following benefit payments under all pension and other benefit plans, and giving effect to expected future service, as appropriate, are expected to be paid:
|
In thousands |
|
Pension Benefits |
|
|
|
Other Benefits |
|
||
|
2017 |
|
$ |
36,885 |
|
|
|
$ |
3,212 |
|
|
2018 |
|
|
37,033 |
|
|
|
|
3,548 |
|
|
2019 |
|
|
36,520 |
|
|
|
|
4,013 |
|
|
2020 |
|
|
36,871 |
|
|
|
|
4,389 |
|
|
2021 |
|
|
36,871 |
|
|
|
|
4,488 |
|
|
2022 through 2026 |
|
|
184,679 |
|
|
|
|
21,009 |
|
Defined Contribution Plans We maintain 401(k) plans for certain hourly and salaried employees. Employees may contribute up to 50% of their earnings, subject to certain restrictions. Through November 2015, we matched a portion of the employee’s contribution, subject to certain limitations, in the form of shares of Glatfelter common stock out of treasury. Company matches are now made in cash. The expense associated with our 401(k) match was $2.0 million, $2.1 million and $2.0 million in 2016, 2015 and 2014, respectively.
46
|
12. |
Inventories, net of reserves were as follows:
|
|
December 31 |
|
||||||
|
In thousands |
|
2016 |
|
|
|
|
2015 |
|
|
Raw materials |
$ |
66,359 |
|
|
|
$ |
60,098 |
|
|
In-process and finished |
|
112,507 |
|
|
|
|
115,874 |
|
|
Supplies |
|
70,803 |
|
|
|
|
71,242 |
|
|
Total |
$ |
249,669 |
|
|
|
$ |
247,214 |
|
We value all of our U.S. inventories, excluding supplies, on the LIFO method. If we had valued these inventories using the first-in, first-out method, inventories would have been $21.3 million and $28.2 million higher than reported at December 31, 2016 and 2015, respectively.
|
13. |
Plant, equipment and timberlands at December 31 were as follows:
|
In thousands |
|
2016 |
|
|
|
|
2015 |
|
|
Land and buildings |
$ |
192,877 |
|
|
|
$ |
205,338 |
|
|
Machinery and equipment |
|
1,335,669 |
|
|
|
|
1,305,067 |
|
|
Furniture, fixtures, and other |
|
142,110 |
|
|
|
|
135,355 |
|
|
Accumulated depreciation |
|
(1,036,825 |
) |
|
|
|
(1,009,331 |
) |
|
|
|
633,831 |
|
|
|
|
636,429 |
|
|
Construction in progress |
|
137,665 |
|
|
|
|
58,657 |
|
|
Asset retirement obligation, net |
|
— |
|
|
|
|
579 |
|
|
Timberlands, less depletion |
|
4,402 |
|
|
|
|
3,199 |
|
|
Total |
$ |
775,898 |
|
|
|
$ |
698,864 |
|
As of December 31, 2016 and 2015, we had $24.3 million and $13.4 million, respectively, of accrued capital expenditures.
|
14. |
The following table sets forth information with respect to goodwill and other intangible assets:
|
|
December 31 |
|
||||||
|
In thousands |
|
2016 |
|
|
|
|
2015 |
|
|
Goodwill – Composite Fibers |
$ |
73,094 |
|
|
|
$ |
76,056 |
|
|
|
|
|
|
|
|
|
|
|
|
Specialty Papers |
|
|
|
|
|
|
|
|
|
Customer relationships |
$ |
6,155 |
|
|
|
$ |
6,155 |
|
|
Composite Fibers |
|
|
|
|
|
|
|
|
|
Tradename |
|
4,195 |
|
|
|
|
4,332 |
|
|
Technology and related |
|
35,874 |
|
|
|
|
37,625 |
|
|
Customer relationships and related |
|
32,310 |
|
|
|
|
33,618 |
|
|
Advanced Airlaid Materials |
|
|
|
|
|
|
|
|
|
Technology and related |
|
1,377 |
|
|
|
|
1,403 |
|
|
Customer relationships and related |
|
2,638 |
|
|
|
|
2,725 |
|
|
Total intangibles |
|
82,549 |
|
|
|
|
85,858 |
|
|
Accumulated amortization |
|
(26,290 |
) |
|
|
|
(22,801 |
) |
|
Net intangibles |
$ |
56,259 |
|
|
|
$ |
63,057 |
|
The change in goodwill was due to currency translation adjustments. Other than non-amortizable goodwill and tradename, intangible assets are amortized on a straight-line basis. Customer relationships are amortized over periods ranging from 10 years to 14 years and technology and related intangible assets are amortized
over periods ranging from 14 years to 20 years. The following table sets forth information pertaining to amortization of intangible assets:
|
In thousands |
|
|
2016 |
|
|
|
|
2015 |
|
|
|
|
2014 |
|
|
|
Aggregate amortization expense: |
|
$ |
4,852 |
|
|
|
$ |
5,340 |
|
|
|
$ |
6,136 |
|
|
|
Estimated amortization expense: |
|
|
|
|
|
|
|
|
|
|
|
|
|
|
|
|
|
2017 |
|
|
4,464 |
|
|
|
|
|
|
|
|
|
|
|
|
|
2018 |
|
|
4,464 |
|
|
|
|
|
|
|
|
|
|
|
|
|
2019 |
|
|
4,464 |
|
|
|
|
|
|
|
|
|
|
|
|
|
2020 |
|
|
4,336 |
|
|
|
|
|
|
|
|
|
|
|
|
|
2021 |
|
|
3,973 |
|
|
|
|
|
|
|
|
|
|
|
The remaining weighted average useful life of intangible assets was 13.1 years at December 31, 2016.
|
15. |
Other long-term assets consist of the following:
|
|
December 31 |
|
||||||
|
In thousands |
|
2016 |
|
|
|
|
2015 |
|
|
Pension |
$ |
96,699 |
|
|
|
$ |
89,093 |
|
|
Other |
|
25,050 |
|
|
|
|
20,979 |
|
|
Total |
$ |
121,749 |
|
|
|
$ |
110,072 |
|
|
16. |
Other current liabilities consist of the following:
|
|
December 31 |
|
||||||
|
In thousands |
|
2016 |
|
|
|
|
2015 |
|
|
Accrued payroll and benefits |
$ |
48,306 |
|
|
|
$ |
35,079 |
|
|
Other accrued compensation and retirement benefits |
|
6,828 |
|
|
|
|
6,866 |
|
|
Income taxes payable |
|
211 |
|
|
|
|
2,921 |
|
|
Accrued rebates |
|
14,329 |
|
|
|
|
18,248 |
|
|
Other accrued expenses |
|
49,576 |
|
|
|
|
43,330 |
|
|
Total |
$ |
119,250 |
|
|
|
$ |
106,444 |
|
|
17. |
Long-term debt is summarized as follows:
|
|
December 31 |
|
|
||||||
|
In thousands |
|
2016 |
|
|
|
|
2015 |
|
|
|
Revolving credit facility, due Mar. 2020 |
$ |
61,595 |
|
|
|
$ |
58,792 |
|
|
|
5.375% Notes, due Oct. 2020 |
|
250,000 |
|
|
|
|
250,000 |
|
|
|
2.40% Term Loan, due Jun. 2022 |
|
8,282 |
|
|
|
|
10,109 |
|
|
|
2.05% Term Loan, due Mar. 2023 |
|
35,163 |
|
|
|
|
42,130 |
|
|
|
1.30% Term Loan, due Jun. 2023 |
|
9,788 |
|
|
|
|
- |
|
|
|
1.55% Term Loan, due Sep. 2025 |
|
10,333 |
|
|
|
|
2,839 |
|
|
|
Total long-term debt |
|
375,161 |
|
|
|
|
363,870 |
|
|
|
Less current portion |
|
(8,961 |
) |
|
|
|
(7,366 |
) |
|
|
Unamortized deferred issuance costs |
|
(2,553 |
) |
|
|
|
(3,208 |
) |
|
|
Long-term debt, net of current portion |
$ |
363,647 |
|
|
|
$ |
353,296 |
|
|
The amount set forth for Long-term debt, net of current portion as of December 31, 2015, has been restated to retroactively adopt ASU No. 2015-03, Interest - Imputation of Interest (Subtopic 835-30) Simplifying the Presentation of Debt Issuance Costs. This ASU required debt issuance costs to be presented as a direct deduction from the carrying value of the related debt instrument
|
GLATFELTER 2016 FORM 10-K |
47 |
rather than as a deferred asset except for costs associated with a revolving line of credit.
On March 12, 2015, we amended our revolving credit agreement with a consortium of banks (the “Revolving Credit Facility”) which increased the amount available for borrowing to $400 million, extended the maturity of the facility to March 12, 2020, and instituted a revised interest rate pricing grid. On February 1, 2017, the Revolving Credit Agreement was further amended to, among other things, change the definition of earnings before interest, taxes, depreciation and amortization (“EBITDA”) for purposes of calculating covenant compliance.
For all US dollar denominated borrowings under the Revolving Credit Facility, the borrowing rate is, at our option, either, (a) the bank’s base rate which is equal to the greater of i) the prime rate; ii) the federal funds rate plus 50 basis points; or iii) the daily Euro-rate plus 100 basis points plus an applicable spread over either i), ii) or iii) ranging from 12.5 basis points to 100 basis points based on the Company’s leverage ratio and its corporate credit ratings determined by Standard & Poor’s Rating Services and Moody’s Investor Service, Inc. (the “Corporate Credit Rating”); or (b) the daily Euro-rate plus an applicable margin ranging from 112.5 basis points to 200 basis points based on the Company’s leverage ratio and the Corporate Credit Rating. For non-US dollar denominated borrowings, interest is based on (b) above.
The Revolving Credit Facility contains a number of customary covenants for financings of this type that, among other things, restrict our ability to dispose of or create liens on assets, incur additional indebtedness, repay other indebtedness, limits certain intercompany financing arrangements, make acquisitions and engage in mergers or consolidations. We are also required to comply with specified financial tests and ratios including: i) maximum net debt EBITDA ratio (the “leverage ratio”); and ii) a consolidated EBITDA to interest expense ratio. The most restrictive of our covenants is a maximum leverage ratio of 3.5x. As of December 31, 2016, the leverage ratio, as calculated in accordance with the definition in our amended credit agreement was 2.2x. A breach of these requirements would give rise to certain remedies under the Revolving Credit Facility, among which are the termination of the agreement and accelerated repayment of the outstanding borrowings plus accrued and unpaid interest under the credit facility.
On October 3, 2012, we completed a private placement offering of $250.0 million aggregate principal amount of 5.375% Senior Notes due 2020 (the “5.375% Notes”). The 5.375% Notes, which are now publically registered, are fully and unconditionally guaranteed, jointly and severally, by PHG Tea Leaves, Inc., Mollanvick, Inc., Glatfelter Composite Fibers N. A., Inc., Glatfelter Advanced Materials N.A., Inc., and Glatfelter Holdings, LLC (the “Guarantors”). Interest on the 5.375%
Notes is payable semiannually in arrears on April 15 and October 15.
The 5.375% Notes are redeemable, in whole or in part, at any time on or after October 15, 2016 at the redemption prices specified in the applicable Indenture. These Notes and the guarantees of the notes are senior obligations of the Company and the Guarantors, respectively, rank equally in right of payment with future senior indebtedness of the Company and the Guarantors and will mature on October 15, 2020.
The 5.375% Notes contain various covenants customary to indebtedness of this nature including limitations on i) the amount of indebtedness that may be incurred; ii) certain restricted payments including common stock dividends; iii) distributions from certain subsidiaries; iv) sales of assets; v) transactions amongst subsidiaries; and vi) incurrence of liens on assets. In addition, the 5.375% Notes contain cross default provisions that could result in all such notes becoming due and payable in the event of a failure to repay debt outstanding under the Revolving Credit Agreement at maturity or a default under the Revolving Credit Agreement that accelerates the debt outstanding thereunder. As of December 31, 2016, we met all of the requirements of our debt covenants.
Glatfelter Gernsbach GmbH & Co. KG (“Gernsbach”), a wholly-owned subsidiary of ours, entered into a series of borrowing agreements with IKB Deutsche Industriebank AG, Düsseldorf (“IKB”) as summarized below:
|
Amounts in thousands |
Original Principal |
|
|
|
Interest Rate |
|
|
|
Maturity |
||
|
Borrowing date |
|
|
|
|
|
|
|
|
|
|
|
|
Apr. 11, 2013 |
€ |
42,700 |
|
|
|
|
2.05 |
% |
|
|
Mar. 2023 |
|
Sep. 4, 2014 |
|
10,000 |
|
|
|
|
2.40 |
% |
|
|
Jun. 2022 |
|
Oct. 10, 2015 |
|
2,608 |
|
|
|
|
1.55 |
% |
|
|
Sep. 2025 |
|
May 4, 2016 |
|
7,195 |
|
|
|
|
1.55 |
% |
|
|
Sep. 2025 |
|
Apr. 26, 2016 |
|
10,000 |
|
|
|
|
1.30 |
% |
|
|
Jun. 2023 |
Each of the borrowings require quarterly repayments of principal and interest and provide for representations, warranties and covenants customary for financings of these types. The financial covenants contained in each of the IKB loans, which relate to the minimum ratio of consolidated EBITDA to consolidated interest expense and the maximum ratio of consolidated total net debt to consolidated adjusted EBITDA, will be calculated by reference to our Revolving Credit Agreement.
Aggregated unamortized deferred debt issuance costs incurred in connection with all of our outstanding debt totaled $4.2 million at December 31, 2016. The deferred costs are being amortized on a straight line basis over the life of the underlying instruments. Amortization expense related to deferred debt issuance costs totaled $1.2 million in 2016.
48
The following schedule sets forth the amortization of our term loan agreements together with the maturity of our other long-term debt during the indicated year.
|
In thousands |
|
|
|
|
|
2017 |
$ |
8,961 |
|
|
|
2018 |
|
9,930 |
|
|
|
2019 |
|
9,930 |
|
|
|
2020 |
|
321,525 |
|
|
|
2021 |
|
9,930 |
|
|
|
Thereafter |
|
14,885 |
|
|
P. H. Glatfelter Company guarantees all debt obligations of its subsidiaries. All such obligations are recorded in these consolidated financial statements.
As of December 31, 2016 and 2015, we had $5.1 million and $5.3 million, respectively, of letters of credit issued to us by certain financial institutions. The letters of credit, which reduce amounts available under our revolving credit facility, primarily provide financial assurances for the benefit of certain state workers compensation insurance agencies in conjunction with our self-insurance program. We bear the credit risk on this amount to the extent that we do not comply with the provisions of certain agreements. No amounts are outstanding under the letters of credit.
|
18. |
The amounts reported on the consolidated balance sheets for cash and cash equivalents, accounts receivable and short-term debt approximate fair value. The following table sets forth the carrying value and fair value of long-term debt as of December 31:
|
|
2016 |
|
|
|
2015 |
|
||||||||||
|
In thousands |
Carrying Value |
|
|
Fair Value |
|
|
|
Carrying Value |
|
|
Fair Value |
|
||||
|
Variable rate debt |
$ |
61,595 |
|
|
$ |
61,595 |
|
|
|
$ |
58,792 |
|
|
$ |
58,792 |
|
|
Fixed-rate bonds |
|
250,000 |
|
|
|
256,563 |
|
|
|
|
250,000 |
|
|
|
250,938 |
|
|
2.40% Term loan |
|
8,282 |
|
|
|
8,877 |
|
|
|
|
10,109 |
|
|
|
10,535 |
|
|
2.05% Term loan |
|
35,163 |
|
|
|
37,089 |
|
|
|
|
42,130 |
|
|
|
42,886 |
|
|
1.30% Term Loan |
|
9,788 |
|
|
|
10,062 |
|
|
|
|
- |
|
|
|
- |
|
|
1.55% Term loan |
|
10,333 |
|
|
|
10,082 |
|
|
|
|
2,839 |
|
|
|
2,524 |
|
|
Total |
$ |
375,161 |
|
|
$ |
384,268 |
|
|
|
$ |
363,870 |
|
|
$ |
365,675 |
|
As of December 31, 2016 and 2015, we had $250.0 million of 5.375% fixed rate bonds. These bonds are publicly registered, but thinly traded. Accordingly, the values set forth above for the bonds, as well as our other debt instruments, are based on observable inputs and other relevant market data (Level 2). The fair value of financial derivatives is set forth below in Note 19.
|
19. |
As part of our overall risk management practices, we enter into financial derivatives primarily designed to either i) hedge foreign currency risks associated with forecasted transactions – “cash flow hedges” or ii)
mitigate the impact that changes in currency exchange rates have on intercompany financing transactions and foreign currency denominated receivables and payables – “foreign currency hedges."
Derivatives Designated as Hedging Instruments - Cash Flow Hedges We use currency forward contracts as cash flow hedges to manage our exposure to fluctuations in the currency exchange rates on certain forecasted production costs or capital expenditures expected to be incurred over a maximum of nineteen months. Currency forward contracts involve fixing the EUR-USD exchange rate or USD-CAD for delivery of a specified amount of foreign currency on a specified date.
We designate certain currency forward contracts as cash flow hedges of forecasted raw material purchases, certain production costs or capital expenditures with exposure to changes in foreign currency exchange rates. The effective portion of changes in the fair value of derivatives designated and that qualify as cash flow hedges of foreign exchange risk is deferred as a component of accumulated other comprehensive income in the accompanying consolidated balance sheets. With respect to hedges of forecasted raw material purchases or production costs, the amount deferred is subsequently reclassified into costs of products sold in the period that inventory produced using the hedged transaction affects earnings. For hedged capital expenditures, deferred gains or losses are reclassified and included in the historical cost of the capital asset and subsequently affect earnings as depreciation is recognized. The ineffective portion of the change in fair value of the derivative is recognized directly to earnings and reflected in the accompanying consolidated statements of income as non-operating income (expense) under the caption “Other-net.”
We had the following outstanding derivatives that were used to hedge foreign exchange risks associated with forecasted transactions and designated as hedging instruments:
|
|
December 31 |
|
||||||
|
In thousands |
|
2016 |
|
|
|
|
2015 |
|
|
Derivative |
|
|
|
|
|
|
|
|
|
Sell/Buy - sell notional |
|
|
|
|
|
|
|
|
|
Euro / British Pound |
|
10,373 |
|
|
|
|
10,527 |
|
|
|
|
|
|
|
|
|
|
|
|
Sell/Buy - buy notional |
|
|
|
|
|
|
|
|
|
Euro / Philippine Peso |
|
699,279 |
|
|
|
|
758,634 |
|
|
British Pound / Philippine Peso |
|
557,025 |
|
|
|
|
542,063 |
|
|
Euro / U.S. Dollar |
|
43,951 |
|
|
|
|
51,433 |
|
|
U.S. Dollar / Canadian Dollar |
|
35,290 |
|
|
|
|
34,649 |
|
|
U.S. Dollar / Euro |
|
15,379 |
|
|
|
|
— |
|
These contracts have maturities of nineteen months or less.
Derivatives Not Designated as Hedging Instruments - Foreign Currency Hedges We also enter into forward foreign exchange contracts to mitigate the impact changes in currency exchange rates have on
|
GLATFELTER 2016 FORM 10-K |
49 |
balance sheet monetary assets and liabilities. None of these contracts are designated as hedges for financial accounting purposes and, accordingly, changes in value of the foreign exchange forward contracts and in the offsetting underlying on-balance-sheet transactions are reflected in the accompanying consolidated statements of income under the caption “Other, net.”
|
|
December 31 |
|
||||||
|
In thousands |
|
2016 |
|
|
|
|
2015 |
|
|
Derivative |
|
|
|
|
|
|
|
|
|
Sell/Buy - sell notional |
|
|
|
|
|
|
|
|
|
U.S. Dollar / Euro |
|
— |
|
|
|
|
— |
|
|
U.S. Dollar / British Pound |
|
10,500 |
|
|
|
|
10,000 |
|
|
Euro / British Pound |
|
— |
|
|
|
|
— |
|
|
British Pound / Euro |
|
2,500 |
|
|
|
|
3,500 |
|
|
|
|
|
|
|
|
|
|
|
|
Sell/Buy - buy notional |
|
|
|
|
|
|
|
|
|
Euro / U.S. Dollar |
|
3,500 |
|
|
|
|
12,500 |
|
|
British Pound / Euro |
|
18,500 |
|
|
|
|
13,500 |
|
These contracts have maturities of one month from the date originally entered into.
Fair Value Measurements
The following table summarizes the fair values of derivative instruments as of December 31 for the year indicated and the line items in the accompanying consolidated balance sheets where the instruments are recorded:
|
|
December 31 |
|
|
|
December 31 |
|
||||||||||||
|
In thousands |
|
2016 |
|
|
|
|
2015 |
|
|
|
|
2016 |
|
|
|
|
2015 |
|
|
|
Prepaid Expenses and Other |
|
|
|
Other Current |
|
||||||||||||
|
Balance sheet caption |
Current Assets |
|
|
|
Liabilities |
|
||||||||||||
|
Designated as hedging: |
|
|
|
|
|
|
|
|
|
|
|
|
|
|
|
|
|
|
|
Forward foreign currency exchange contracts |
$ |
2,625 |
|
|
|
$ |
955 |
|
|
|
$ |
1,493 |
|
|
|
$ |
1,545 |
|
|
Not designated as hedging: |
|
|
|
|
|
|
|
|
|
|
|
|
|
|
|
|
|
|
|
Forward foreign currency exchange contracts |
$ |
60 |
|
|
|
$ |
68 |
|
|
|
$ |
104 |
|
|
|
$ |
49 |
|
The amounts set forth in the table above represent the net asset or liability giving effect to rights of offset with each counterparty.
The following table summarizes the amount of income or loss from derivative instruments recognized in our results of operations for the periods indicated and the line items in the accompanying consolidated statements of income where the results are recorded:
|
|
|
|
|
Year ended December 31 |
|
|||||||||||
|
In thousands |
|
|
|
2016 |
|
|
|
2015 |
|
|
|
2014 |
|
|||
|
Designated as hedging: |
|
|
|
|
|
|
|
|
|
|
|
|
|
|
|
|
|
Forward foreign currency exchange contracts: |
|
|
|
|
|
|
|
|
|
|
|
|
|
|
|
|
|
Effective portion – cost of products sold |
|
|
|
$ |
(551 |
) |
|
|
$ |
5,752 |
|
|
|
$ |
(655 |
) |
|
Ineffective portion – other – net |
|
|
|
|
(166 |
) |
|
|
|
(152 |
) |
|
|
|
184 |
|
|
Not designated as hedging: |
|
|
|
|
|
|
|
|
|
|
|
|
|
|
|
|
|
Forward foreign currency exchange contracts: |
|
|
|
|
|
|
|
|
|
|
|
|
|
|
|
|
|
Other – net |
|
|
|
$ |
806 |
|
|
|
$ |
599 |
|
|
|
$ |
1,599 |
|
The impact of activity not designated as hedging was substantially all offset by the remeasurement of the underlying on-balance sheet item.
The fair value hierarchy consists of three broad levels, which gives the highest priority to unadjusted quoted prices in active markets for identical assets or liabilities (Level 1) and the lowest priority to unobservable inputs (Level 3). The three levels of the fair value hierarchy are described in Note 2.
The fair values of the foreign exchange forward contracts are considered to be Level 2. Foreign currency forward contracts are valued using foreign currency forward and interest rate curves. The fair value of each contract is determined by comparing the contract rate to the forward rate and discounting to present value. Contracts in a gain position are recorded in the accompanying consolidated balance sheets under the caption “Prepaid expenses and other current assets” and the value of contracts in a loss position is recorded under the caption “Other current liabilities.”
A rollforward of fair value amounts recorded as a component of accumulated other comprehensive income is as follows:
|
In thousands |
2016 |
|
|
|
2015 |
|
||
|
Balance at January 1, |
$ |
(178 |
) |
|
|
$ |
3,282 |
|
|
Deferred (losses) gains on cash flow hedges |
|
1,509 |
|
|
|
|
2,292 |
|
|
Reclassified to earnings |
|
551 |
|
|
|
|
(5,752 |
) |
|
Balance at December 31, |
$ |
1,882 |
|
|
|
$ |
(178 |
) |
We expect substantially all of the amounts recorded as a component of accumulated other comprehensive income will be realized in results of operations within the next twelve to eighteen months and the amount ultimately recognized will vary depending on actual market rates.
50
Credit risk related to derivative activity arises in the event a counterparty fails to meet its obligations to us. This exposure is generally limited to the amounts, if any, by which the counterparty’s obligations exceed our obligation to them. Our policy is to enter into contracts only with financial institutions which meet certain minimum credit ratings.
|
20. |
The following table summarizes outstanding shares of common stock:
|
|
Year ended December 31 |
|
|||||||||||
|
In thousands |
2016 |
|
|
|
2015 |
|
|
|
2014 |
|
|||
|
Shares outstanding at beginning of year |
|
43,420 |
|
|
|
|
43,054 |
|
|
|
|
43,130 |
|
|
Shares repurchased |
|
— |
|
|
|
|
— |
|
|
|
|
(464 |
) |
|
Treasury shares issued for: |
|
|
|
|
|
|
|
|
|
|
|
|
|
|
Restricted stock awards |
|
108 |
|
|
|
|
206 |
|
|
|
|
162 |
|
|
401(k) plan |
|
— |
|
|
|
|
134 |
|
|
|
|
116 |
|
|
Employee stock options exercised |
|
22 |
|
|
|
|
26 |
|
|
|
|
110 |
|
|
Shares outstanding at end of year |
|
43,550 |
|
|
|
|
43,420 |
|
|
|
|
43,054 |
|
|
21. |
Contractual Commitments The following table summarizes the minimum annual payments due on noncancelable operating leases and other similar contractual obligations having initial or remaining terms in excess of one year:
|
In thousands |
|
Leases |
|
|
|
Other |
|
||
|
2017 |
|
$ |
5,298 |
|
|
|
$ |
87,831 |
|
|
2018 |
|
|
3,706 |
|
|
|
|
23,584 |
|
|
2019 |
|
|
3,030 |
|
|
|
|
5,193 |
|
|
2020 |
|
|
2,472 |
|
|
|
|
3,115 |
|
|
2021 |
|
|
1,896 |
|
|
|
|
2,961 |
|
|
Thereafter |
|
|
7,270 |
|
|
|
|
1,890 |
|
Other contractual obligations primarily represent minimum purchase commitments under energy supply contracts and other purchase obligations.
At December 31, 2016, required minimum annual payments due under operating leases and other similar contractual obligations aggregated $23.7 million and $124.6 million, respectively.
Fox River - Neenah, Wisconsin
Background. We have significant uncertainties associated with environmental claims arising out of the presence of polychlorinated biphenyls (“PCBs”) in sediments in the lower Fox River, on which our former Neenah facility was located, and in the Bay of Green Bay Wisconsin (collectively, the “Site”). Since the early 1990s, the United States, the State of Wisconsin and two Indian tribes (collectively, the “Governments”) have pursued a cleanup of a 39-mile stretch of river from Little
Lake Butte des Morts into Green Bay and natural resource damages (“NRDs”).
The Site has been subject to certain studies, demonstration projects and interim cleanups. The permanent cleanup, known as a “remedial action” under the Comprehensive Environmental Response, Compensation and Liability Act (“CERCLA”), consists of sediment dredging, installation of engineered caps and placement of sand covers in various areas in the bed of the river.
The United States originally notified several entities that they were potentially responsible parties (“PRPs”); however, after giving effect to settlements reached with the Governments, the remaining PRPs exposed to continuing obligations to implement the remainder of the cleanup consist of us, Georgia Pacific Consumer Products, L.P. (“Georgia Pacific”) and NCR Corporation (“NCR”). In addition to the government claims, Appvion retains a claim against us and Georgia Pacific.
The United States Environmental Protection Agency (“EPA”) has divided the Site into five “operable units”, including the most upstream portion of the Site on which our facility was located (“OU1”) and four downstream reaches of the river and bay (“OU2-5”).
We and WTM I Company, one of the PRPs, implemented the remedial action in OU1 under a consent decree with the Governments; Menasha Corporation made a financial contribution to that work. That project began in 2004 and the work is complete, other than on-going monitoring and maintenance.
For OU2-5, work has proceeded primarily under a Unilateral Administrative Order (“UAO”) issued in November 2007 by the EPA to us and seven other respondents. The majority of that work to date has been funded or conducted by parties other than us, although before the UAO, we contributed to a project in that area and we have conducted about $13.4 million of cleanup work under the UAO in 2015 and 2016. The cleanup is expected to continue through 2018. However, as discussed below, under a proposed consent decree between the United States, Wisconsin, NCR and Appvion, Inc. (“Appvion”), we would not be responsible for any additional cleanup at the Site.
Litigation and Settlement. In 2008, in an allocation action, NCR and Appvion sued us and many other defendants in an effort to allocate among the liable parties the costs of cleaning up this Site and compensating the Governments for their costs and the natural resource trustees for NRDs. This case has been called the “Whiting litigation.” After several summary judgment rulings and a trial, the trial court entered judgment in the Whiting Litigation allocating to NCR 100% of the costs of (a) the OU2-5 cleanup, (b) NRDs, (c) past and future costs incurred by the Governments in OU2-5, and (d) past and
|
GLATFELTER 2016 FORM 10-K |
51 |
future costs incurred by any of the other parties net of an appropriate equitable adjustment for insurance recoveries.
On appeal, the United States Court of Appeals for the Seventh Circuit affirmed the district court’s ruling, holding that if knowledge and fault were the only equitable factors governing allocation of costs and NRDs at the Site, NCR would owe 100% of all costs and damages in OU2-5, but would not have a share of costs in OU1 -- which is upstream of the outfall of the facilities for which NCR is responsible -- solely as an “arranger for disposal” of PCB-containing waste paper by recycling it at our mill. However, the court of appeals vacated the judgment and remanded the case for the district court’s further consideration of whether any other equitable factors might cause the district court to alter its allocation.
In 2010, in an enforcement action, the Governments sued us and other defendants for (a) an injunction to require implementation of the cleanup ordered by the 2007 UAO, (b) recovery of the Governments’ past and future costs of response, (c) recovery of NRDs, and (d) recovery of a declaration of liability for the Site. After appeals, the Governments did not obtain an injunction and they withdrew their claims for NRDs. The Governments obtained a declaration of our liability to comply with the 2007 UAO. The Governments’ costs claims remained pending.
On January 17, 2017, the United States filed a consent decree with the federal district court among the United States, Wisconsin, NCR, and Appvion under which NCR would agree to complete the remaining cleanup and both NCR and Appvion would agree not to seek to recover from us or anyone else any amounts they have spent or will spend, and we and others would be barred from seeking claims against NCR or Appvion. If the proposed consent decree is approved by the district court and if it were to withstand any appeal, then we would only face exposure to: (i) government past oversight costs, (ii) government future oversight costs, (iii) long term monitoring and maintenance, and (iv) depending on the reason, a further remedy if necessary in the event the currently ordered remedy fails, over 30 or more years, to achieve its objectives. Under the proposed consent decree, we would be liable for all past and future costs incurred by the Governments in addition to long term monitoring and maintenance with respect to OU1 through OU4a. As the result of earlier settlements, Georgia Pacific is only jointly liable with us to the Governments for monitoring and maintenance costs incurred in the most downstream three miles of the river (“OU4b”) and the bay of Green Bay (“OU5”). In addition, we and Georgia Pacific have claims against each other to reallocate the costs that we have each incurred or will incur. In connection with the filing of the proposed consent decree, NCR and Appvion filed a request to stay the trial scheduled to commence in April 2017. The courts granted the stay.
Cost estimates. The January 17, 2017, proposed consent decree states that all parties combined have spent more than approximately $1 billion to date towards remedial actions and NRDs, of which we have contributed approximately $65 million. In addition, work to complete the remaining site remedy under the UAO is anticipated to cost approximately $200 million. If the consent decree were entered, we would no longer be exposed to reallocation of any of those amounts other than the portion contributed by Georgia Pacific, which Georgia Pacific claims to be about $145 million.
Under the proposed consent decree, we would remain responsible for the Governments’ unreimbursed past costs, which although they are in dispute, are represented to total approximately $34 million and the governments future costs. Furthermore, we, along with Georgia Pacific, would be responsible for long term monitoring and maintenance required pursuant to the Lower Fox River 100% Remedial Design Report dated December 2009 – Long Term Monitoring Plan (the “Plan”). The Plan requires long term monitoring of each of OU1 through OU5 over a period of 30 years. The monitoring activities consist of, among others, testing fish tissue, sampling water quality and sediment, and inspections of the engineered caps. Each operable unit is required to be monitored; however, in the event the consent decree is entered by the court, we believe the cost of portions of the plan would be subject to allocation between us and Georgia Pacific. Although we are unable to determine with certainty the timing of cash expenditures for the above matters, they are reasonably likely to extend over a period of at least 30 years.
Reserves for the Site. As the result of the proposed consent decree, and assuming it is ultimately approved and stands on appeal, our assessment of the range of probable outcomes for this matter has changed. The higher end of our range of our exposure is now lower; however, the lower end of the range is higher. We increased our reserve by $40.0 million as of December 31, 2016, to reflect our analysis of the range of potential outcomes in this matter and our current estimate of the most likely scenario. Our reserve is set forth below:
|
|
|
Year ended December 31 |
|
||||||
|
In thousands |
|
|
2016 |
|
|
|
|
2015 |
|
|
Balance at January 1, |
|
$ |
17,105 |
|
|
|
$ |
16,223 |
|
|
Payments |
|
|
(4,317 |
) |
|
|
|
(9,118 |
) |
|
Accruals |
|
|
40,000 |
|
|
|
|
10,000 |
|
|
Balance at December 31, |
|
$ |
52,788 |
|
|
|
$ |
17,105 |
|
The payments set forth above represent cash paid towards completion of remediation activities in connection with the 2016 and 2015 Work Plan. Of our total reserve for the Fox River, $25.0 million is recorded in the accompanying December 31, 2016 consolidated balance sheet under the caption “Environmental
52
liabilities” and the remaining $27.8 million is recorded under the caption “Other long term liabilities.”
Range of Reasonably Possible Outcomes. Based on our analysis of all available information, including but not limited to decisions of the courts, official documents such as records of decision, discussions with legal counsel, cost estimates for future monitoring and maintenance and other post-remediation costs to be performed at the Site, and substantially dependent on whether the January 17, 2017, consent decree is entered and the resolution of the allocation issues between Georgia Pacific and us, we believe it is reasonably possible that our costs associated with the Fox River matter could exceed the aggregate amounts accrued by amounts ranging from insignificant to $40 million. We believe the likelihood of an outcome in the upper end of the monetary range is less than other possible outcomes within the range and the possibility of an outcome in excess of the upper end of the monetary range is remote. However, in the event the consent decree is not entered, the ultimate resolution of this matter would likely resort to extensive litigation involving various matters, including allocation of remedial action and related costs. In such a scenario, although we should ultimately bear a very small share, it is reasonably possible that our costs
associated with the Fox River matter could exceed the aggregate amounts accrued by amounts ranging from insignificant to $150 million.
Summary. Our current assessment is we will be able to manage this environmental matter without a long-term, material adverse impact on the Company. This matter could, however, at any particular time or for any particular year or years, have a material adverse effect on our consolidated financial position, liquidity and/or results of operations or could result in a default under our debt covenants. Moreover, there can be no assurance our reserves will be adequate to provide for future obligations related to this matter, or our share of costs and/or damages will not exceed our available resources, or those obligations will not have a material adverse effect on our consolidated financial position, liquidity and results of operations and might result in a default under our loan covenants. If the proposed consent decree is not approved and a court grants relief requiring us individually either to perform directly or to contribute significant amounts towards remedial action downstream of OU1 those developments could have a material adverse effect on our consolidated financial position, liquidity and results of operations and might result in a default under our loan covenants.
The following tables set forth profitability and other information by business unit:
|
For the year ended December 31, 2016 |
Composite |
|
|
|
Advanced Airlaid |
|
|
|
Specialty |
|
|
|
Other and |
|
|
|
|
|
|
||||
|
In millions |
Fibers |
|
|
|
Materials |
|
|
|
Papers |
|
|
|
Unallocated |
|
|
|
Total |
|
|||||
|
Net sales |
$ |
517.0 |
|
|
|
$ |
244.3 |
|
|
|
$ |
843.6 |
|
|
|
$ |
— |
|
|
|
$ |
1,604.8 |
|
|
Energy and related sales, net |
|
— |
|
|
|
|
— |
|
|
|
|
6.1 |
|
|
|
|
— |
|
|
|
|
6.1 |
|
|
Total revenue |
|
517.0 |
|
|
|
|
244.3 |
|
|
|
|
849.7 |
|
|
|
|
— |
|
|
|
|
1,610.9 |
|
|
Cost of products sold |
|
416.4 |
|
|
|
|
209.5 |
|
|
|
|
752.6 |
|
|
|
|
13.8 |
|
|
|
|
1,392.3 |
|
|
Gross profit |
|
100.6 |
|
|
|
|
34.8 |
|
|
|
|
97.1 |
|
|
|
|
(13.8 |
) |
|
|
|
218.7 |
|
|
SG&A |
|
46.3 |
|
|
|
|
8.4 |
|
|
|
|
55.9 |
|
|
|
|
80.1 |
|
|
|
|
190.7 |
|
|
Loss on dispositions of plant, equipment and timberlands, net |
|
— |
|
|
|
|
— |
|
|
|
|
— |
|
|
|
|
0.2 |
|
|
|
|
0.2 |
|
|
Total operating income (loss) |
|
54.3 |
|
|
|
|
26.4 |
|
|
|
|
41.2 |
|
|
|
|
(94.1 |
) |
|
|
|
27.8 |
|
|
Non-operating expense |
|
— |
|
|
|
|
— |
|
|
|
|
— |
|
|
|
|
(16.9 |
) |
|
|
|
(16.9 |
) |
|
Income (loss) before income taxes |
$ |
54.3 |
|
|
|
$ |
26.4 |
|
|
|
$ |
41.2 |
|
|
|
$ |
(111.0 |
) |
|
|
$ |
10.9 |
|
|
Supplementary Data |
|
|
|
|
|
|
|
|
|
|
|
|
|
|
|
|
|
|
|
|
|
|
|
|
Plant, equipment and timberlands, net |
$ |
235.1 |
|
|
|
$ |
179.3 |
|
|
|
$ |
352.9 |
|
|
|
$ |
8.6 |
|
|
|
$ |
775.9 |
|
|
Depreciation, depletion and amortization |
|
27.8 |
|
|
|
|
9.0 |
|
|
|
|
26.3 |
|
|
|
|
2.7 |
|
|
|
|
65.8 |
|
|
Capital expenditures |
|
18.8 |
|
|
|
|
36.8 |
|
|
|
|
99.0 |
|
|
|
|
5.6 |
|
|
|
|
160.2 |
|
|
GLATFELTER 2016 FORM 10-K |
53 |
|
Composite |
|
|
|
Advanced Airlaid |
|
|
|
Specialty |
|
|
|
Other and |
|
|
|
|
|
|
|||||
|
In millions |
Fibers |
|
|
|
Materials |
|
|
|
Papers |
|
|
|
Unallocated |
|
|
|
Total |
|
|||||
|
Net sales |
$ |
541.5 |
|
|
|
$ |
244.6 |
|
|
|
$ |
875.0 |
|
|
|
$ |
— |
|
|
|
$ |
1,661.1 |
|
|
Energy and related sales, net |
|
— |
|
|
|
|
— |
|
|
|
|
5.7 |
|
|
|
|
— |
|
|
|
|
5.7 |
|
|
Total revenue |
|
541.5 |
|
|
|
|
244.6 |
|
|
|
|
880.7 |
|
|
|
|
— |
|
|
|
|
1,666.7 |
|
|
Cost of products sold |
|
434.4 |
|
|
|
|
215.7 |
|
|
|
|
804.5 |
|
|
|
|
9.2 |
|
|
|
|
1,463.8 |
|
|
Gross profit |
|
107.1 |
|
|
|
|
28.9 |
|
|
|
|
76.2 |
|
|
|
|
(9.2 |
) |
|
|
|
203.0 |
|
|
SG&A |
|
45.7 |
|
|
|
|
7.6 |
|
|
|
|
43.3 |
|
|
|
|
31.0 |
|
|
|
|
127.7 |
|
|
Gains on dispositions of plant, equipment and timberlands, net |
|
— |
|
|
|
|
— |
|
|
|
|
— |
|
|
|
|
(21.1 |
) |
|
|
|
(21.1 |
) |
|
Total operating income (loss) |
|
61.4 |
|
|
|
|
21.3 |
|
|
|
|
32.9 |
|
|
|
|
(19.1 |
) |
|
|
|
96.4 |
|
|
Non-operating expense |
|
— |
|
|
|
|
— |
|
|
|
|
— |
|
|
|
|
(17.8 |
) |
|
|
|
(17.8 |
) |
|
Income (loss) before income taxes |
$ |
61.4 |
|
|
|
$ |
21.3 |
|
|
|
$ |
32.9 |
|
|
|
$ |
(36.9 |
) |
|
|
$ |
78.6 |
|
|
Supplementary Data |
|
|
|
|
|
|
|
|
|
|
|
|
|
|
|
|
|
|
|
|
|
|
|
|
Plant, equipment and timberlands, net |
$ |
258.1 |
|
|
|
$ |
153.5 |
|
|
|
$ |
281.6 |
|
|
|
$ |
5.7 |
|
|
|
$ |
698.9 |
|
|
Depreciation, depletion and amortization |
|
26.2 |
|
|
|
|
8.8 |
|
|
|
|
26.0 |
|
|
|
|
2.2 |
|
|
|
|
63.2 |
|
|
Capital expenditures |
|
26.8 |
|
|
|
|
7.8 |
|
|
|
|
63.5 |
|
|
|
|
1.8 |
|
|
|
|
99.9 |
|
|
For the year ended December 31, 2014 |
Composite |
|
|
|
Advanced Airlaid |
|
|
|
Specialty |
|
|
|
Other and |
|
|
|
|
|
|
||||
|
In millions |
Fibers |
|
|
|
Materials |
|
|
|
Papers |
|
|
|
Unallocated |
|
|
|
Total |
|
|||||
|
Net sales |
$ |
617.9 |
|
|
|
$ |
281.7 |
|
|
|
$ |
902.9 |
|
|
|
$ |
— |
|
|
|
$ |
1,802.4 |
|
|
Energy and related sales, net |
|
— |
|
|
|
|
— |
|
|
|
|
7.9 |
|
|
|
|
— |
|
|
|
|
7.9 |
|
|
Total revenue |
|
617.9 |
|
|
|
|
281.7 |
|
|
|
|
910.8 |
|
|
|
|
— |
|
|
|
|
1,810.3 |
|
|
Cost of products sold |
|
498.0 |
|
|
|
|
247.6 |
|
|
|
|
821.8 |
|
|
|
|
7.8 |
|
|
|
|
1,575.2 |
|
|
Gross profit |
|
119.9 |
|
|
|
|
34.1 |
|
|
|
|
89.0 |
|
|
|
|
(7.8 |
) |
|
|
|
235.1 |
|
|
SG&A |
|
51.6 |
|
|
|
|
8.8 |
|
|
|
|
50.4 |
|
|
|
|
22.4 |
|
|
|
|
133.2 |
|
|
Gains on dispositions of plant, equipment and timberlands, net |
|
— |
|
|
|
|
— |
|
|
|
|
— |
|
|
|
|
(4.9 |
) |
|
|
|
(4.9 |
) |
|
Total operating income (loss) |
|
68.3 |
|
|
|
|
25.3 |
|
|
|
|
38.6 |
|
|
|
|
(25.3 |
) |
|
|
|
106.8 |
|
|
Non-operating expense |
|
— |
|
|
|
|
— |
|
|
|
|
— |
|
|
|
|
(19.4 |
) |
|
|
|
(19.4 |
) |
|
Income (loss) before income taxes |
$ |
68.3 |
|
|
|
$ |
25.3 |
|
|
|
$ |
38.6 |
|
|
|
$ |
(44.7 |
) |
|
|
$ |
87.4 |
|
|
Supplementary Data |
|
|
|
|
|
|
|
|
|
|
|
|
|
|
|
|
|
|
|
|
|
|
|
|
Plant, equipment and timberlands, net |
$ |
277.8 |
|
|
|
$ |
163.6 |
|
|
|
$ |
250.1 |
|
|
|
$ |
6.1 |
|
|
|
$ |
697.6 |
|
|
Depreciation, depletion and amortization |
|
29.7 |
|
|
|
|
9.1 |
|
|
|
|
29.9 |
|
|
|
|
1.9 |
|
|
|
|
70.6 |
|
|
Capital expenditures |
|
23.9 |
|
|
|
|
7.6 |
|
|
|
|
32.1 |
|
|
|
|
2.4 |
|
|
|
|
66.0 |
|
The sum of individual amounts set forth above may not agree to the consolidated financial statements included herein due to rounding.
54
Results of individual business units are presented based on our management accounting practices and management structure. There is no comprehensive, authoritative body of guidance for management accounting equivalent to accounting principles generally accepted in the United States of America; therefore, the financial results of individual business units are not necessarily comparable with similar information for any other company. The management accounting process uses assumptions and allocations to measure performance of the business units. Methodologies are refined from time to time as management accounting practices are enhanced and businesses change. The costs incurred by support areas not directly aligned with the business unit are allocated primarily based on an estimated utilization of support area services.
Management evaluates results of operations of the business units before pension expense, certain corporate level costs, and the effects of certain gains or losses not considered to be related to the core business operations. Management believes that this is a more meaningful representation of the operating performance of its core businesses, the profitability of business units and the extent of cash flow generated from these core operations. Such amounts are presented under the caption “Other and Unallocated.” In the evaluation of business unit results, management does not use any measures of total assets. This presentation is aligned with the management and operating structure of our company. It is also on this basis that the Company’s performance is evaluated internally and by the Company’s Board of Directors.
Our Composite Fibers business unit serves customers globally and focuses on higher value-added products in the following markets:
|
|
• |
Food & Beverage filtration paper primarily used for single-serve coffee and tea products; |
|
|
• |
Wallcovering base materials used by the world’s largest wallpaper manufacturers; |
|
|
• |
Metallized products used in labels, packaging liners, gift wrap, and other consumer product applications; |
|
|
• |
Composite Laminate paper used in production of decorative laminates, furniture, and flooring applications; and |
|
|
• |
Technical Specialties a diverse line of special paper products used in applications such as electrical energy storage, transport and transmission, wipes, and other highly-engineered fiber-based applications. |
Composite Fibers’ revenue composition by market consisted of the following for the years indicated:
|
In thousands |
2016 |
|
|
|
2015 |
|
|
|
2014 |
|
|||
|
Food & beverage |
$ |
258,463 |
|
|
|
$ |
274,865 |
|
|
|
$ |
296,304 |
|
|
Wallcovering |
|
90,767 |
|
|
|
|
91,620 |
|
|
|
|
149,957 |
|
|
Metallized |
|
61,059 |
|
|
|
|
68,397 |
|
|
|
|
80,839 |
|
|
Composite laminates |
|
35,107 |
|
|
|
|
34,897 |
|
|
|
|
38,159 |
|
|
Technical specialties and other |
|
71,558 |
|
|
|
|
71,689 |
|
|
|
|
52,592 |
|
|
Total |
$ |
516,954 |
|
|
|
$ |
541,468 |
|
|
|
$ |
617,851 |
|
The Advanced Airlaid Materials business unit is a leading global supplier of highly absorbent cellulose-based airlaid nonwoven materials primarily used to manufacture consumer products for growing global end-user markets. These products include:
|
|
• |
feminine hygiene; |
|
|
• |
specialty wipes; |
|
|
• |
adult incontinence; |
|
|
• |
home care; and |
|
|
• |
other consumer products. |
Advanced Airlaid Materials’ revenue composition by market consisted of the following for the years indicated:
|
In thousands |
2016 |
|
|
|
2015 |
|
|
|
2014 |
|
|||
|
Feminine hygiene |
$ |
173,902 |
|
|
|
$ |
182,048 |
|
|
|
$ |
216,836 |
|
|
Specialty wipes |
|
25,206 |
|
|
|
|
22,950 |
|
|
|
|
16,002 |
|
|
Adult incontinence |
|
12,281 |
|
|
|
|
10,720 |
|
|
|
|
17,586 |
|
|
Home care |
|
12,630 |
|
|
|
|
13,345 |
|
|
|
|
15,401 |
|
|
Other |
|
20,243 |
|
|
|
|
15,526 |
|
|
|
|
15,848 |
|
|
Total |
$ |
244,262 |
|
|
|
$ |
244,589 |
|
|
|
$ |
281,673 |
|
Our Specialty Papers business unit focuses on producing papers for the following markets:
|
|
• |
Carbonless & non-carbonless forms papers for credit card receipts, multi-part forms, security papers and other end-user applications; |
|
|
• |
Engineered products for high speed ink jet printing, office specialty products, greeting cards, and other niche specialty applications; |
|
|
• |
Envelope and converting papers primarily utilized for transactional and direct mail envelopes; and |
|
|
• |
Book publishing papers for the production of high quality hardbound books and other book publishing needs. |
Specialty Papers’ revenue composition by market consisted of the following for the years indicated:
|
In thousands |
2016 |
|
|
|
2015 |
|
|
|
2014 |
|
|||
|
Carbonless & forms |
$ |
319,648 |
|
|
|
$ |
349,831 |
|
|
|
$ |
376,959 |
|
|
Engineered products |
|
189,463 |
|
|
|
|
190,943 |
|
|
|
|
194,189 |
|
|
Envelope & converting |
|
173,362 |
|
|
|
|
178,067 |
|
|
|
|
183,194 |
|
|
Book publishing |
|
157,541 |
|
|
|
|
152,647 |
|
|
|
|
144,744 |
|
|
Other |
|
3,568 |
|
|
|
|
3,538 |
|
|
|
|
3,805 |
|
|
Total |
$ |
843,582 |
|
|
|
$ |
875,026 |
|
|
|
$ |
902,891 |
|
|
GLATFELTER 2016 FORM 10-K |
55 |
No individual customer accounted for more than 10% of our consolidated net sales in 2016, 2015 and 2014. However, one customer accounted for the majority
of Advanced Airlaid Materials’ net sales in each of the past three years ended December 31, 2016.
Our net sales to external customers and location of net plant, equipment and timberlands are summarized below. Net sales are attributed to countries based upon origin of shipment.
|
|
2016 |
|
|
2015 |
|
|
2014 |
|
|||||||||||||||
|
In thousands |
Net sales |
|
|
Plant, Equipment and Timberlands – Net |
|
|
Net sales |
|
|
Plant, Equipment and Timberlands – Net |
|
|
Net sales |
|
|
Plant, Equipment and Timberlands – Net |
|
||||||
|
United States |
$ |
918,567 |
|
|
$ |
391,977 |
|
|
$ |
959,730 |
|
|
$ |
287,447 |
|
|
$ |
980,933 |
|
|
$ |
256,251 |
|
|
Germany |
|
427,520 |
|
|
|
220,380 |
|
|
|
444,009 |
|
|
|
232,340 |
|
|
|
529,003 |
|
|
|
257,311 |
|
|
United Kingdom |
|
78,759 |
|
|
|
51,903 |
|
|
|
86,442 |
|
|
|
62,931 |
|
|
|
103,219 |
|
|
|
62,617 |
|
|
Canada |
|
115,902 |
|
|
|
79,727 |
|
|
|
118,568 |
|
|
|
81,201 |
|
|
|
129,401 |
|
|
|
82,774 |
|
|
Other |
|
64,049 |
|
|
|
31,911 |
|
|
|
52,335 |
|
|
|
34,945 |
|
|
|
59,859 |
|
|
|
38,655 |
|
|
Total |
$ |
1,604,797 |
|
|
$ |
775,898 |
|
|
$ |
1,661,084 |
|
|
$ |
698,864 |
|
|
$ |
1,802,415 |
|
|
$ |
697,608 |
|
Our 5.375% Notes issued by P. H. Glatfelter Company (the “Parent”) are fully and unconditionally guaranteed, on a joint and several basis, by certain of our 100%-owned domestic subsidiaries, PHG Tea Leaves, Inc., Mollanvick, Inc., Glatfelter Composite Fibers N. A., Inc., Glatfelter Advance Materials N.A., Inc., and Glatfelter Holdings, LLC. The guarantees are subject to certain customary release provisions including i) the designation of such subsidiary as an unrestricted or excluded subsidiary; (ii) in connection with any sale or disposition of the capital stock of the subsidiary guarantor; and (iii) upon our exercise of our legal defeasance option or our covenant defeasance option, all of which are more fully described in the Indenture dated as of October 3, 2012 and the First Supplemental Indenture dated as of October 27, 2015, among us, the Guarantors and US Bank National Association, as Trustee, relating to the 5.375% Notes.
The following presents our condensed consolidating statements of income, including comprehensive income and cash flows for the years ended December 31, 2016, 2015 and 2014 and our condensed consolidating balance sheets as of December 31, 2016 and 2015.
Condensed Consolidating Statement of Income for the
year ended December 31, 2016
|
In thousands |
Parent Company |
|
|
Guarantors |
|
|
Non Guarantors |
|
|
Adjustments/ Eliminations |
|
|
Consolidated |
|
|
|||||
|
Net sales |
$ |
843,582 |
|
|
$ |
75,000 |
|
|
$ |
755,860 |
|
|
$ |
(69,645 |
) |
|
$ |
1,604,797 |
|
|
|
Energy and related sales, net |
|
6,141 |
|
|
|
— |
|
|
|
— |
|
|
|
— |
|
|
|
6,141 |
|
|
|
Total revenues |
|
849,723 |
|
|
|
75,000 |
|
|
|
755,860 |
|
|
|
(69,645 |
) |
|
|
1,610,938 |
|
|
|
Costs of products sold |
|
763,109 |
|
|
|
70,991 |
|
|
|
627,880 |
|
|
|
(69,645 |
) |
|
|
1,392,335 |
|
|
|
Gross profit |
|
86,614 |
|
|
|
4,009 |
|
|
|
127,980 |
|
|
|
— |
|
|
|
218,603 |
|
|
|
Selling, general and administrative |
|
|
|
|
|
|
|
|
|
|
|
|
|
|
|
|
|
|
|
|
|
expenses |
|
133,387 |
|
|
|
(156 |
) |
|
|
57,463 |
|
|
|
— |
|
|
|
190,694 |
|
|
|
Loss on dispositions of plant |
|
|
|
|
|
|
|
|
|
|
|
|
|
|
|
|
|
|
|
|
|
equipment and timberlands, net |
|
177 |
|
|
|
— |
|
|
|
39 |
|
|
|
— |
|
|
|
216 |
|
|
|
Operating income (loss) |
|
(46,950 |
) |
|
|
4,165 |
|
|
|
70,478 |
|
|
|
— |
|
|
|
27,693 |
|
|
|
Other non-operating |
|
|
|
|
|
|
|
|
|
|
|
|
|
|
|
|
|
|
|
|
|
income (expense) |
|
|
|
|
|
|
|
|
|
|
|
|
|
|
|
|
|
|
|
|
|
Interest expense |
|
(17,436 |
) |
|
|
(41 |
) |
|
|
(3,060 |
) |
|
|
4,715 |
|
|
|
(15,822 |
) |
|
|
Interest income |
|
687 |
|
|
|
4,177 |
|
|
|
57 |
|
|
|
(4,715 |
) |
|
|
206 |
|
|
|
Equity in earnings of subsidiaries |
|
61,007 |
|
|
|
58,347 |
|
|
|
— |
|
|
|
(119,354 |
) |
|
|
— |
|
|
|
Other, net |
|
(2,312 |
) |
|
|
(3,966 |
) |
|
|
5,007 |
|
|
|
— |
|
|
|
(1,271 |
) |
|
|
Total other non-operating |
|
|
|
|
|
|
|
|
|
|
|
|
|
|
|
|
|
|
|
|
|
income (expense) |
|
41,946 |
|
|
|
58,517 |
|
|
|
2,004 |
|
|
|
(119,354 |
) |
|
|
(16,887 |
) |
|
|
Income (loss) before income taxes |
|
(5,004 |
) |
|
|
62,682 |
|
|
|
72,482 |
|
|
|
(119,354 |
) |
|
|
10,806 |
|
|
|
Income tax provision (benefit) |
|
(26,558 |
) |
|
|
1,675 |
|
|
|
14,135 |
|
|
|
— |
|
|
|
(10,748 |
) |
|
|
Net income |
|
21,554 |
|
|
|
61,007 |
|
|
|
58,347 |
|
|
|
(119,354 |
) |
|
|
21,554 |
|
|
|
Other comprehensive loss |
|
(14,120 |
) |
|
|
(25,916 |
) |
|
|
(25,176 |
) |
|
|
51,092 |
|
|
|
(14,120 |
) |
|
|
Comprehensive income |
$ |
7,434 |
|
|
$ |
35,091 |
|
|
$ |
33,171 |
|
|
$ |
(68,262 |
) |
|
$ |
7,434 |
|
|
56
Condensed Consolidating Statement of Income for the
year ended December 31, 2015
|
In thousands |
Parent Company |
|
|
Guarantors |
|
|
Non Guarantors |
|
|
Adjustments/ Eliminations |
|
|
Consolidated |
|
|
|||||
|
Net sales |
$ |
875,026 |
|
|
$ |
84,704 |
|
|
$ |
779,380 |
|
|
$ |
(78,026 |
) |
|
$ |
1,661,084 |
|
|
|
Energy and related sales, net |
|
5,664 |
|
|
|
— |
|
|
|
— |
|
|
|
— |
|
|
|
5,664 |
|
|
|
Total revenues |
|
880,690 |
|
|
|
84,704 |
|
|
|
779,380 |
|
|
|
(78,026 |
) |
|
|
1,666,748 |
|
|
|
Costs of products sold |
|
811,329 |
|
|
|
80,455 |
|
|
|
650,025 |
|
|
|
(78,026 |
) |
|
|
1,463,783 |
|
|
|
Gross profit |
|
69,361 |
|
|
|
4,249 |
|
|
|
129,355 |
|
|
|
— |
|
|
|
202,965 |
|
|
|
Selling, general and administrative |
|
|
|
|
|
|
|
|
|
|
|
|
|
|
|
|
|
|
|
|
|
expenses |
|
71,751 |
|
|
|
821 |
|
|
|
55,134 |
|
|
|
— |
|
|
|
127,706 |
|
|
|
Gain on dispositions of plant |
|
|
|
|
|
|
|
|
|
|
|
|
|
|
|
|
|
|
|
|
|
equipment and timberlands, net |
|
(19,720 |
) |
|
|
(1,183 |
) |
|
|
(210 |
) |
|
|
— |
|
|
|
(21,113 |
) |
|
|
Operating income |
|
17,330 |
|
|
|
4,611 |
|
|
|
74,431 |
|
|
|
— |
|
|
|
96,372 |
|
|
|
Other non-operating |
|
|
|
|
|
|
|
|
|
|
|
|
|
|
|
|
|
|
|
|
|
income (expense) |
|
|
|
|
|
|
|
|
|
|
|
|
|
|
|
|
|
|
|
|
|
Interest expense |
|
(18,147 |
) |
|
|
— |
|
|
|
(36,859 |
) |
|
|
37,542 |
|
|
|
(17,464 |
) |
|
|
Interest income |
|
673 |
|
|
|
37,127 |
|
|
|
26 |
|
|
|
(37,543 |
) |
|
|
283 |
|
|
|
Equity in earnings of subsidiaries |
|
61,946 |
|
|
|
24,737 |
|
|
|
— |
|
|
|
(86,683 |
) |
|
|
— |
|
|
|
Other, net |
|
(3,389 |
) |
|
|
(1,471 |
) |
|
|
4,245 |
|
|
|
— |
|
|
|
(615 |
) |
|
|
Total other non-operating |
|
|
|
|
|
|
|
|
|
|
|
|
|
|
|
|
|
|
|
|
|
income (expense) |
|
41,083 |
|
|
|
60,393 |
|
|
|
(32,588 |
) |
|
|
(86,684 |
) |
|
|
(17,796 |
) |
|
|
Income before income taxes |
|
58,413 |
|
|
|
65,004 |
|
|
|
41,843 |
|
|
|
(86,684 |
) |
|
|
78,576 |
|
|
|
Income tax provision (benefit) |
|
(6,162 |
) |
|
|
2,922 |
|
|
|
17,241 |
|
|
|
— |
|
|
|
14,001 |
|
|
|
Net income |
|
64,575 |
|
|
|
62,082 |
|
|
|
24,602 |
|
|
|
(86,684 |
) |
|
|
64,575 |
|
|
|
Other comprehensive income (loss) |
|
(35,616 |
) |
|
|
(41,010 |
) |
|
|
29,680 |
|
|
|
11,330 |
|
|
|
(35,616 |
) |
|
|
Comprehensive income |
$ |
28,959 |
|
|
$ |
21,072 |
|
|
$ |
54,282 |
|
|
$ |
(75,354 |
) |
|
$ |
28,959 |
|
|
Condensed Consolidating Statement of Income for the
year ended December 31, 2014
|
In thousands |
Parent Company |
|
|
Guarantors |
|
|
Non Guarantors |
|
|
Adjustments/ Eliminations |
|
|
Consolidated |
|
|
|||||
|
Net sales |
$ |
902,892 |
|
|
$ |
78,077 |
|
|
$ |
897,363 |
|
|
$ |
(75,917 |
) |
|
$ |
1,802,415 |
|
|
|
Energy and related sales, net |
|
7,927 |
|
|
|
— |
|
|
|
— |
|
|
|
— |
|
|
|
7,927 |
|
|
|
Total revenues |
|
910,819 |
|
|
|
78,077 |
|
|
|
897,363 |
|
|
|
(75,917 |
) |
|
|
1,810,342 |
|
|
|
Costs of products sold |
|
830,710 |
|
|
|
74,414 |
|
|
|
745,981 |
|
|
|
(75,917 |
) |
|
|
1,575,188 |
|
|
|
Gross profit |
|
80,109 |
|
|
|
3,663 |
|
|
|
151,382 |
|
|
|
— |
|
|
|
235,154 |
|
|
|
Selling, general and administrative |
|
|
|
|
|
|
|
|
|
|
|
|
|
|
|
|
|
|
|
|
|
expenses |
|
67,086 |
|
|
|
1,765 |
|
|
|
64,384 |
|
|
|
— |
|
|
|
133,235 |
|
|
|
Gain on dispositions of plant |
|
|
|
|
|
|
|
|
|
|
|
|
|
|
|
|
|
|
|
|
|
equipment and timberlands, net |
|
(3,545 |
) |
|
|
(1,316 |
) |
|
|
— |
|
|
|
— |
|
|
|
(4,861 |
) |
|
|
Operating income |
|
16,568 |
|
|
|
3,214 |
|
|
|
86,998 |
|
|
|
— |
|
|
|
106,780 |
|
|
|
Other non-operating |
|
|
|
|
|
|
|
|
|
|
|
|
|
|
|
|
|
|
|
|
|
income (expense) |
|
|
|
|
|
|
|
|
|
|
|
|
|
|
|
|
|
|
|
|
|
Interest expense |
|
(19,105 |
) |
|
|
— |
|
|
|
(102,571 |
) |
|
|
102,755 |
|
|
|
(18,921 |
) |
|
|
Interest income |
|
638 |
|
|
|
102,241 |
|
|
|
36 |
|
|
|
(102,756 |
) |
|
|
159 |
|
|
|
Equity in earnings of subsidiaries |
|
67,590 |
|
|
|
(34,265 |
) |
|
|
— |
|
|
|
(33,325 |
) |
|
|
— |
|
|
|
Other, net |
|
(1,366 |
) |
|
|
317 |
|
|
|
414 |
|
|
|
— |
|
|
|
(635 |
) |
|
|
Total other non-operating |
|
|
|
|
|
|
|
|
|
|
|
|
|
|
|
|
|
|
|
|
|
income (expense) |
|
47,757 |
|
|
|
68,293 |
|
|
|
(102,121 |
) |
|
|
(33,326 |
) |
|
|
(19,397 |
) |
|
|
Income (loss) before income taxes |
|
64,325 |
|
|
|
71,507 |
|
|
|
(15,123 |
) |
|
|
(33,326 |
) |
|
|
87,383 |
|
|
|
Income tax provision (benefit) |
|
(4,921 |
) |
|
|
3,916 |
|
|
|
19,142 |
|
|
|
— |
|
|
|
18,137 |
|
|
|
Net income (loss) |
|
69,246 |
|
|
|
67,591 |
|
|
|
(34,265 |
) |
|
|
(33,326 |
) |
|
|
69,246 |
|
|
|
Other comprehensive income (loss) |
|
(79,513 |
) |
|
|
(40,704 |
) |
|
|
28,840 |
|
|
|
11,864 |
|
|
|
(79,513 |
) |
|
|
Comprehensive income (loss) |
$ |
(10,267 |
) |
|
$ |
26,887 |
|
|
$ |
(5,425 |
) |
|
$ |
(21,462 |
) |
|
$ |
(10,267 |
) |
|
|
GLATFELTER 2016 FORM 10-K |
57 |
Condensed Consolidating Balance Sheet as of December 31, 2016
|
In thousands |
|
Parent Company |
|
|
Guarantors |
|
|
Non Guarantors |
|
|
Adjustments/ Eliminations |
|
|
Consolidated |
|
|
|||||
|
Assets |
|
|
|
|
|
|
|
|
|
|
|
|
|
|
|
|
|
|
|
|
|
|
Cash and cash equivalents |
|
$ |
5,082 |
|
|
$ |
1,461 |
|
|
$ |
48,901 |
|
|
$ |
— |
|
|
$ |
55,444 |
|
|
|
Other current assets |
|
|
206,002 |
|
|
|
256,289 |
|
|
|
242,187 |
|
|
|
(265,663 |
) |
|
|
438,815 |
|
|
|
Plant, equipment and timberlands, net |
|
|
360,521 |
|
|
|
31,455 |
|
|
|
383,922 |
|
|
|
— |
|
|
|
775,898 |
|
|
|
Investments in subsidiaries |
|
|
789,565 |
|
|
|
540,029 |
|
|
|
— |
|
|
|
(1,329,594 |
) |
|
|
— |
|
|
|
Other assets |
|
|
123,010 |
|
|
|
— |
|
|
|
128,092 |
|
|
|
— |
|
|
|
251,102 |
|
|
|
Total assets |
|
$ |
1,484,180 |
|
|
$ |
829,234 |
|
|
$ |
803,102 |
|
|
$ |
(1,595,257 |
) |
|
$ |
1,521,259 |
|
|
|
Liabilities and Shareholders' Equity |
|
|
|
|
|
|
|
|
|
|
|
|
|
|
|
|
|
|
|
|
|
|
Current liabilities |
|
$ |
426,628 |
|
|
$ |
26,085 |
|
|
$ |
135,961 |
|
|
$ |
(265,663 |
) |
|
$ |
323,011 |
|
|
|
Long-term debt |
|
|
283,686 |
|
|
|
14,000 |
|
|
|
65,961 |
|
|
|
— |
|
|
|
363,647 |
|
|
|
Deferred income taxes |
|
|
10,221 |
|
|
|
(729 |
) |
|
|
45,503 |
|
|
|
— |
|
|
|
54,995 |
|
|
|
Other long-term liabilities |
|
|
109,819 |
|
|
|
313 |
|
|
|
15,648 |
|
|
|
— |
|
|
|
125,780 |
|
|
|
Total liabilities |
|
|
830,354 |
|
|
|
39,669 |
|
|
|
263,073 |
|
|
|
(265,663 |
) |
|
|
867,433 |
|
|
|
Shareholders’ equity |
|
|
653,826 |
|
|
|
789,565 |
|
|
|
540,029 |
|
|
|
(1,329,594 |
) |
|
|
653,826 |
|
|
|
Total liabilities and shareholders’ equity |
|
$ |
1,484,180 |
|
|
$ |
829,234 |
|
|
$ |
803,102 |
|
|
$ |
(1,595,257 |
) |
|
$ |
1,521,259 |
|
|
Condensed Consolidating Balance Sheet as of December 31, 2015
|
In thousands |
|
Parent Company |
|
|
Guarantors |
|
|
Non Guarantors |
|
|
Adjustments/ Eliminations |
|
|
Consolidated |
|
|
|||||
|
Assets |
|
|
|
|
|
|
|
|
|
|
|
|
|
|
|
|
|
|
|
|
|
|
Cash and cash equivalents |
|
$ |
59,130 |
|
|
$ |
465 |
|
|
$ |
45,709 |
|
|
$ |
— |
|
|
$ |
105,304 |
|
|
|
Other current assets |
|
|
199,690 |
|
|
|
238,515 |
|
|
|
239,367 |
|
|
|
(230,509 |
) |
|
|
447,063 |
|
|
|
Plant, equipment and timberlands, net |
|
|
286,334 |
|
|
|
1,114 |
|
|
|
411,416 |
|
|
|
— |
|
|
|
698,864 |
|
|
|
Investments in subsidiaries |
|
|
737,450 |
|
|
|
507,116 |
|
|
|
— |
|
|
|
(1,244,566 |
) |
|
|
— |
|
|
|
Other assets |
|
|
106,586 |
|
|
|
— |
|
|
|
142,599 |
|
|
|
— |
|
|
|
249,185 |
|
|
|
Total assets |
|
$ |
1,389,190 |
|
|
$ |
747,210 |
|
|
$ |
839,091 |
|
|
$ |
(1,475,075 |
) |
|
$ |
1,500,416 |
|
|
|
Liabilities and Shareholders' Equity |
|
|
|
|
|
|
|
|
|
|
|
|
|
|
|
|
|
|
|
|
|
|
Current liabilities |
|
$ |
363,037 |
|
|
$ |
9,725 |
|
|
$ |
162,081 |
|
|
$ |
(230,523 |
) |
|
$ |
304,320 |
|
|
|
Long-term debt |
|
|
247,075 |
|
|
|
— |
|
|
|
106,221 |
|
|
|
— |
|
|
|
353,296 |
|
|
|
Deferred income taxes |
|
|
28,561 |
|
|
|
(79 |
) |
|
|
47,976 |
|
|
|
— |
|
|
|
76,458 |
|
|
|
Other long-term liabilities |
|
|
87,270 |
|
|
|
— |
|
|
|
15,825 |
|
|
|
— |
|
|
|
103,095 |
|
|
|
Total liabilities |
|
|
725,943 |
|
|
|
9,646 |
|
|
|
332,103 |
|
|
|
(230,523 |
) |
|
|
837,169 |
|
|
|
Shareholders’ equity |
|
|
663,247 |
|
|
|
737,564 |
|
|
|
506,988 |
|
|
|
(1,244,552 |
) |
|
|
663,247 |
|
|
|
Total liabilities and shareholders’ equity |
|
$ |
1,389,190 |
|
|
$ |
747,210 |
|
|
$ |
839,091 |
|
|
$ |
(1,475,075 |
) |
|
$ |
1,500,416 |
|
|
58
Condensed Consolidating Statement of Cash Flows for the year
ended December 31, 2016
|
In thousands |
|
Parent Company |
|
|
Guarantors |
|
|
Non Guarantors |
|
|
Adjustments/ Eliminations |
|
|
Consolidated |
|
|
|||||
|
Net cash provided (used) by |
|
|
|
|
|
|
|
|
|
|
|
|
|
|
|
|
|
|
|
|
|
|
Operating activities |
|
$ |
33,109 |
|
|
$ |
1,275 |
|
|
$ |
81,726 |
|
|
$ |
— |
|
|
$ |
116,110 |
|
|
|
Investing activities |
|
|
|
|
|
|
|
|
|
|
|
|
|
|
|
|
|
|
|
|
|
|
Expenditures for purchases of plant, equipment and timberlands |
|
|
(104,595 |
) |
|
|
(30,682 |
) |
|
|
(24,881 |
) |
|
|
— |
|
|
|
(160,158 |
) |
|
|
Proceeds from disposals of plant, equipment and timberlands, net |
|
|
41 |
|
|
|
— |
|
|
|
29 |
|
|
|
— |
|
|
|
70 |
|
|
|
Repayments from intercompany loans |
|
|
— |
|
|
|
15,601 |
|
|
|
— |
|
|
|
(15,601 |
) |
|
|
— |
|
|
|
Advances of intercompany loans |
|
|
— |
|
|
|
(18,330 |
) |
|
|
— |
|
|
|
18,330 |
|
|
|
— |
|
|
|
Intercompany capital contributed |
|
|
(17,000 |
) |
|
|
(500 |
) |
|
|
— |
|
|
|
17,500 |
|
|
|
— |
|
|
|
Other |
|
|
(800 |
) |
|
|
— |
|
|
|
— |
|
|
|
— |
|
|
|
(800 |
) |
|
|
Total investing activities |
|
|
(122,354 |
) |
|
|
(33,911 |
) |
|
|
(24,852 |
) |
|
|
20,229 |
|
|
|
(160,888 |
) |
|
|
Financing activities |
|
|
|
|
|
|
|
|
|
|
|
|
|
|
|
|
|
|
|
|
|
|
Net long-term borrowings |
|
|
36,000 |
|
|
|
14,000 |
|
|
|
(35,886 |
) |
|
|
— |
|
|
|
14,114 |
|
|
|
Payments of borrowing costs |
|
|
(136 |
) |
|
|
— |
|
|
|
— |
|
|
|
— |
|
|
|
(136 |
) |
|
|
Payment of dividends to shareholders |
|
|
(21,589 |
) |
|
|
— |
|
|
|
— |
|
|
|
— |
|
|
|
(21,589 |
) |
|
|
Repayments of intercompany loans |
|
|
— |
|
|
|
— |
|
|
|
(15,601 |
) |
|
|
15,601 |
|
|
|
— |
|
|
|
Borrowings of intercompany loans |
|
|
18,330 |
|
|
|
— |
|
|
|
— |
|
|
|
(18,330 |
) |
|
|
— |
|
|
|
Intercompany capital (returned) received |
|
|
— |
|
|
|
17,000 |
|
|
|
500 |
|
|
|
(17,500 |
) |
|
|
— |
|
|
|
Payment of intercompany dividend |
|
|
— |
|
|
|
632 |
|
|
|
(632 |
) |
|
|
- |
|
|
|
— |
|
|
|
Proceeds from government grants |
|
|
3,582 |
|
|
|
2,000 |
|
|
|
— |
|
|
|
— |
|
|
|
5,582 |
|
|
|
Payments related to share-based compensation awards and other |
|
|
(990 |
) |
|
|
— |
|
|
|
— |
|
|
|
— |
|
|
|
(990 |
) |
|
|
Total financing activities |
|
|
35,197 |
|
|
|
33,632 |
|
|
|
(51,619 |
) |
|
|
(20,229 |
) |
|
|
(3,019 |
) |
|
|
Effect of exchange rate on cash |
|
|
— |
|
|
|
— |
|
|
|
(2,063 |
) |
|
|
— |
|
|
|
(2,063 |
) |
|
|
Net increase (decrease) in cash |
|
|
(54,048 |
) |
|
|
996 |
|
|
|
3,192 |
|
|
|
— |
|
|
|
(49,860 |
) |
|
|
Cash at the beginning of period |
|
|
59,130 |
|
|
|
465 |
|
|
|
45,709 |
|
|
|
— |
|
|
|
105,304 |
|
|
|
Cash at the end of period |
|
$ |
5,082 |
|
|
$ |
1,461 |
|
|
$ |
48,901 |
|
|
$ |
— |
|
|
$ |
55,444 |
|
|
Condensed Consolidating Statement of Cash Flows for the year
ended December 31, 2015
|
In thousands |
|
Parent Company |
|
|
Guarantors |
|
|
Non Guarantors |
|
|
Adjustments/ Eliminations |
|
|
Consolidated |
|
|
|||||
|
Net cash provided (used) by |
|
|
|
|
|
|
|
|
|
|
|
|
|
|
|
|
|
|
|
|
|
|
Operating activities |
|
$ |
34,391 |
|
|
$ |
627 |
|
|
$ |
98,725 |
|
|
$ |
— |
|
|
$ |
133,743 |
|
|
|
Investing activities |
|
|
|
|
|
|
|
|
|
|
|
|
|
|
|
|
|
|
|
|
|
|
Expenditures for purchases of plant, equipment and timberlands |
|
|
(65,265 |
) |
|
|
(109 |
) |
|
|
(34,515 |
) |
|
|
— |
|
|
|
(99,889 |
) |
|
|
Proceeds from disposals of plant, equipment and timberlands, net |
|
|
22,741 |
|
|
|
1,213 |
|
|
|
505 |
|
|
|
— |
|
|
|
24,459 |
|
|
|
Repayments from intercompany loans |
|
|
— |
|
|
|
57,855 |
|
|
|
— |
|
|
|
(57,855 |
) |
|
|
— |
|
|
|
Advances of intercompany loans |
|
|
— |
|
|
|
(49,230 |
) |
|
|
— |
|
|
|
49,230 |
|
|
|
— |
|
|
|
Intercompany capital (contributed) returned |
|
|
10,100 |
|
|
|
(300 |
) |
|
|
— |
|
|
|
(9,800 |
) |
|
|
— |
|
|
|
Acquisitions, net of cash acquired |
|
|
— |
|
|
|
— |
|
|
|
(224 |
) |
|
|
— |
|
|
|
(224 |
) |
|
|
Other |
|
|
(1,600 |
) |
|
|
— |
|
|
|
— |
|
|
|
— |
|
|
|
(1,600 |
) |
|
|
Total investing activities |
|
|
(34,024 |
) |
|
|
9,429 |
|
|
|
(34,234 |
) |
|
|
(18,425 |
) |
|
|
(77,254 |
) |
|
|
Financing activities |
|
|
|
|
|
|
|
|
|
|
|
|
|
|
|
|
|
|
|
|
|
|
Net repayments of indebtedness |
|
|
— |
|
|
|
— |
|
|
|
(24,650 |
) |
|
|
— |
|
|
|
(24,650 |
) |
|
|
Payments of borrowing costs |
|
|
(1,329 |
) |
|
|
— |
|
|
|
— |
|
|
|
— |
|
|
|
(1,329 |
) |
|
|
Payment of dividends to shareholders |
|
|
(20,443 |
) |
|
|
— |
|
|
|
— |
|
|
|
— |
|
|
|
(20,443 |
) |
|
|
Repayments of intercompany loans |
|
|
(9,158 |
) |
|
|
— |
|
|
|
(48,697 |
) |
|
|
57,855 |
|
|
|
— |
|
|
|
Borrowings of intercompany loans |
|
|
49,230 |
|
|
|
— |
|
|
|
— |
|
|
|
(49,230 |
) |
|
|
— |
|
|
|
Intercompany capital (returned) received |
|
|
— |
|
|
|
(10,100 |
) |
|
|
300 |
|
|
|
9,800 |
|
|
|
— |
|
|
|
Proceeds from government grants |
|
|
421 |
|
|
|
— |
|
|
|
— |
|
|
|
— |
|
|
|
421 |
|
|
|
Payments related to share-based compensation awards and other |
|
|
(2,166 |
) |
|
|
— |
|
|
|
151 |
|
|
|
— |
|
|
|
(2,015 |
) |
|
|
Total financing activities |
|
|
16,555 |
|
|
|
(10,100 |
) |
|
|
(72,896 |
) |
|
|
18,425 |
|
|
|
(48,016 |
) |
|
|
Effect of exchange rate on cash |
|
|
— |
|
|
|
— |
|
|
|
(3,006 |
) |
|
|
— |
|
|
|
(3,006 |
) |
|
|
Net decrease in cash |
|
|
16,922 |
|
|
|
(44 |
) |
|
|
(11,411 |
) |
|
|
— |
|
|
|
5,467 |
|
|
|
Cash at the beginning of period |
|
|
42,208 |
|
|
|
509 |
|
|
|
57,120 |
|
|
|
— |
|
|
|
99,837 |
|
|
|
Cash at the end of period |
|
$ |
59,130 |
|
|
$ |
465 |
|
|
$ |
45,709 |
|
|
$ |
— |
|
|
$ |
105,304 |
|
|
|
GLATFELTER 2016 FORM 10-K |
59 |
Condensed Consolidating Statement of Cash Flows for the year
ended December 31, 2014
|
In thousands |
|
Parent Company |
|
|
Guarantors |
|
|
Non Guarantors |
|
|
Adjustments/ Eliminations |
|
|
Consolidated |
|
|||||
|
Net cash provided (used) by |
|
|
|
|
|
|
|
|
|
|
|
|
|
|
|
|
|
|
|
|
|
Operating activities |
|
$ |
36,240 |
|
|
$ |
4,159 |
|
|
$ |
59,178 |
|
|
$ |
— |
|
|
$ |
99,577 |
|
|
Investing activities |
|
|
|
|
|
|
|
|
|
|
|
|
|
|
|
|
|
|
|
|
|
Expenditures for plant, equipment and timberlands |
|
|
(34,518 |
) |
|
|
— |
|
|
|
(31,528 |
) |
|
|
— |
|
|
|
(66,046 |
) |
|
Proceeds from disposal plant, equipment and timberlands, net |
|
|
3,707 |
|
|
|
1,355 |
|
|
|
10 |
|
|
|
— |
|
|
|
5,072 |
|
|
Repayments from intercompany loans |
|
|
— |
|
|
|
20,840 |
|
|
|
— |
|
|
|
(20,840 |
) |
|
|
— |
|
|
Advances of intercompany loans |
|
|
(12,671 |
) |
|
|
(26,340 |
) |
|
|
— |
|
|
|
39,011 |
|
|
|
— |
|
|
Acquisitions, net of cash acquired |
|
|
— |
|
|
|
— |
|
|
|
(8,015 |
) |
|
|
— |
|
|
|
(8,015 |
) |
|
Other |
|
|
(600 |
) |
|
|
— |
|
|
|
— |
|
|
|
— |
|
|
|
(600 |
) |
|
Total investing activities |
|
|
(44,082 |
) |
|
|
(4,145 |
) |
|
|
(39,533 |
) |
|
|
18,171 |
|
|
|
(69,589 |
) |
|
Financing activities |
|
|
|
|
|
|
|
|
|
|
|
|
|
|
|
|
|
|
|
|
|
Net proceeds from indebtedness |
|
|
— |
|
|
|
— |
|
|
|
(18,128 |
) |
|
|
— |
|
|
|
(18,128 |
) |
|
Payments of note offering costs |
|
|
— |
|
|
|
— |
|
|
|
— |
|
|
|
— |
|
|
|
— |
|
|
Payment of dividends to shareholders |
|
|
(18,696 |
) |
|
|
— |
|
|
|
— |
|
|
|
— |
|
|
|
(18,696 |
) |
|
Repurchases of common stock |
|
|
(12,180 |
) |
|
|
— |
|
|
|
— |
|
|
|
— |
|
|
|
(12,180 |
) |
|
Repayments of intercompany loans |
|
|
— |
|
|
|
— |
|
|
|
(20,840 |
) |
|
|
20,840 |
|
|
|
— |
|
|
Borrowings of intercompany loans |
|
|
26,340 |
|
|
|
— |
|
|
|
12,671 |
|
|
|
(39,011 |
) |
|
|
— |
|
|
Payments related to share-based compensation awards and other |
|
|
(1,630 |
) |
|
|
— |
|
|
|
(247 |
) |
|
|
— |
|
|
|
(1,877 |
) |
|
Total financing activities |
|
|
(6,166 |
) |
|
|
— |
|
|
|
(26,544 |
) |
|
|
(18,171 |
) |
|
|
(50,881 |
) |
|
Effect of exchange rate on cash |
|
|
— |
|
|
|
— |
|
|
|
(2,152 |
) |
|
|
— |
|
|
|
(2,152 |
) |
|
Net increase (decrease) in cash |
|
|
(14,008 |
) |
|
|
14 |
|
|
|
(9,051 |
) |
|
|
— |
|
|
|
(23,045 |
) |
|
Cash at the beginning of period |
|
|
56,216 |
|
|
|
495 |
|
|
|
66,171 |
|
|
|
— |
|
|
|
122,882 |
|
|
Cash at the end of period |
|
$ |
42,208 |
|
|
$ |
509 |
|
|
$ |
57,120 |
|
|
$ |
— |
|
|
$ |
99,837 |
|
|
|
|
|
|
|
|
|
|
|
|
|
|
|
|
|
|
|
|
|
|
|
|
|
|
|
|
|
|
Earnings (loss) |
|
|
||||||
|
In thousands, |
Net sales |
|
|
Gross profit |
|
|
Net income (loss) |
|
|
per share |
|
|
||||||||||||||||||||||||
|
except per share |
2016 |
|
|
|
2015 |
|
|
2016 |
|
|
|
2015 |
|
|
2016 |
|
|
|
2015 |
|
|
2016 |
|
|
|
2015 |
|
|
||||||||
|
First |
$ |
402,218 |
|
|
|
$ |
417,469 |
|
|
$ |
57,843 |
|
|
|
$ |
52,108 |
|
|
$ |
16,168 |
|
|
|
$ |
13,925 |
|
|
$ |
0.37 |
|
|
|
$ |
0.32 |
|
|
|
Second |
|
406,413 |
|
|
|
|
410,803 |
|
|
|
42,723 |
|
|
|
|
32,833 |
|
|
|
1,965 |
|
|
|
|
2,848 |
|
|
|
0.04 |
|
|
|
|
0.06 |
|
|
|
Third |
|
405,301 |
|
|
|
|
419,960 |
|
|
|
61,170 |
|
|
|
|
59,908 |
|
|
|
19,601 |
|
|
|
|
13,504 |
|
|
|
0.44 |
|
|
|
|
0.31 |
|
|
|
Fourth |
|
390,865 |
|
|
|
|
412,852 |
|
|
|
56,867 |
|
|
|
|
58,116 |
|
|
|
(16,180 |
) |
|
|
|
34,298 |
|
|
|
(0.37 |
) |
|
|
|
0.78 |
|
|
60
|
ITEM 9 |
CHANGES IN AND DISAGREEMENTS WITH ACCOUNTANTS ON ACCOUNTING AND FINANCIAL DISCLOSURES |
None.
|
ITEM 9A |
Disclosure Controls and Procedures
Our chief executive officer and our chief financial officer have, after evaluating the effectiveness of our disclosure controls and procedures (as defined in Exchange Act Rules 13a-15(e) and 15d-15(e)), as of December 31, 2016, concluded that, as of the evaluation date, our disclosure controls and procedures were effective.
Internal Control Over Financial Reporting
Management’s report on the Company’s internal control over financial reporting (as defined in Exchange Act Rules 13a-15(f) and 15d-15(f)) and the related report of our independent registered public accounting firm are included in Item 8 – Financial Statements and Supplementary Data.
Changes in Internal Control over Financial Reporting
There were no changes in our internal control over financial reporting during the three months ended December 31, 2016, that have materially affected or are reasonably likely to materially affect our internal control over financial reporting.
|
ITEM 9B |
None.
|
ITEM 10 |
Directors The information with respect to directors required under this Item is incorporated herein by reference to our Proxy Statement, to be dated on or about March 30, 2017. Our board of directors has determined that, based on the relevant experience of the members of the Audit Committee, two of the four members are audit committee financial experts as this term is set forth in the applicable regulations of the SEC.
Executive Officers of the Registrant The information with respect to the executive officers required under this Item incorporated herein by reference to “Executive Officers” as set forth in Part I, page 11 of this report.
We have adopted a Code of Business Ethics for the CEO and Senior Financial Officers (the “Code of Business Ethics”) in compliance with applicable rules of the Securities and Exchange Commission that applies to our chief executive officer, chief financial officer and our principal accounting officer or controller, or persons performing similar functions. A copy of the Code of Business Ethics is filed as an exhibit to this Annual Report on Form 10-K and is available on our website, free of charge, at www.glatfelter.com.
|
ITEM 11 |
The information required under this Item is incorporated herein by reference to our Proxy Statement, to be dated on or about March 30, 2017.
|
ITEM 12 |
SECURITY OWNERSHIP OF CERTAIN BENEFICIAL OWNERS AND MANAGEMENT |
The information required under this Item is incorporated herein by reference to our Proxy Statement, to be dated on or about March 30, 2017.
|
ITEM 13 |
CERTAIN RELATIONSHIPS AND RELATED TRANSACTIONS, AND DIRECTOR INDEPENDENCE |
The information required under this Item is incorporated herein by reference to our Proxy Statement, to be dated on or about March 30, 2017.
|
ITEM 14 |
The information required under this Item is incorporated herein by reference to our Proxy Statement, to be dated on or about March 30, 2017.
Our Chief Executive Officer has certified to the New York Stock Exchange that he is not aware of any violations by the Company of the NYSE corporate governance listing standards.
|
GLATFELTER 2016 FORM 10-K |
61 |
|
(a) |
1. |
|
Our Consolidated Financial Statements as follows are included in Part II, Item 8: |
|
|
|
i. |
Consolidated Statements of Income for the years ended December 31, 2016, 2015 and 2014 |
|
|
|
ii. |
Consolidated Statements of Comprehensive Income for the years ended December 31, 2016, 2015 and 2014 |
|
|
|
iii. |
Consolidated Balance Sheets as of December 31, 2016 and 2015 |
|
|
|
iv. |
Consolidated Statements of Cash Flows for the years ended December 31, 2016, 2015 and 2014 |
|
|
|
v. |
Consolidated Statements of Shareholders' Equity for the years ended December 31, 2016, 2015 and 2014 |
|
|
|
vi. |
Notes to Consolidated Financial Statements |
|
|
2. |
|
Financial Statement Schedules (Consolidated) included in Part IV: |
|
|
|
i. |
Schedule II ‑Valuation and Qualifying Accounts - For each of the three years ended December 31, 2016 |
|
Exhibit Number |
|
Description of Documents |
Incorporated by Reference to |
|
|
|
|
|
Exhibit |
Filing |
|
2.1 |
|
Share Purchase Agreement, dated March 13, 2013, by and among Glatfelter Gernsbach GmbH & Co. KG. (as purchaser), P H. Glatfelter Company (as purchaser guarantor), Fortress Security Papers AG (as vendor) and Fortress Paper Ltd. (as vendor guarantor) (the schedules have been omitted pursuant to Item 601(b)(2) of Regulation S-K and will be provided to the Securities and Exchange Commission upon request). |
2.1 |
Form 10-Q filed May 9, 2013 |
|
3.1 |
|
Articles of Incorporation, as amended through December 20, 2007 (restated for the purpose of filing on EDGAR). |
3(b) |
Form 10-K filed March 13, 2008 |
|
3.2 |
|
Amended and Restated By‑Laws of P. H. Glatfelter Company, as amended, dated December 15, 2016, filed herewith |
|
|
|
4.1 |
|
Indenture, dated as of October 3, 2012, by and among P. H. Glatfelter Company, the Subsidiary Guarantors named therein and U.S. Bank National Association, as Trustee, relating to 5.375% Senior Notes due 2020. |
4.1 |
Form 8-K filed October 3, 2012 |
|
4.2 |
|
First Supplemental Indenture dated as of October 27, 2015 by and among P. H. Glatfelter Company, the Subsidiary Guarantors named therein and US Bank National Association, as Trustee. |
4.2 |
Form 10-K filed February 26, 2016 |
|
10.1 |
|
Second Amended and Restated Credit Agreement, dated as of March 12, 2015, by and among the Company, certain of its subsidiaries as borrowers and certain of its subsidiaries as guarantors and PNC Bank, National Association, as administrative agent, PNC Capital Markets LLC, J.P. Morgan Securities LLC and HSBC Bank USA, N.A., as joint lead arrangers and joint bookrunners, and JPMorgan Chase Bank, N.A. and HSBC Bank USA, N.A., as co-syndication agents, and Cobank, ACB, Bank of America, N.A. and Manufacturers and Traders Trust Company, as co-documentation agents. |
10.1 |
Form 8-K filed March 16, 2015 |
|
10.2 |
|
First Amendment to Second Amended and Restated Credit Agreement, dated as of February 1, 2017, by and among P. H. Glatfelter Company, the Lenders party thereto, and PNC Bank, National Association, in its capacity as administrative agent for the Lenders. |
10.1 |
Form 8-K filed on February 6, 2017 |
|
10.3 |
|
Loan Agreement, dated April 11, 2013, by and among Glatfelter Gernsbach GmbH & Co. KG. and IKB Deutsche Industriebank AG, Düsseldorf |
10.1 |
Form 10-Q filed May 9, 2013 |
|
10.4 |
|
Guaranty, dated April 17, 2013, executed by P. H. Glatfelter Company (as Guarantor) in favor of IKB Deutsche Industriebank AG. |
10.2 |
Form 10-Q filed May 9, 2013 |
|
10.5 |
|
P. H. Glatfelter Company Amended and Restated Long-Term Incentive Plan, as amended and restated effective February 26, 2015** |
10.4 |
Form 10-K filed February 27, 2015 |
|
10.6 |
|
P. H. Glatfelter Company Amended and Restated 2005 Management Incentive Plan, effective January 1, 2015** |
10.1 |
Form 8-K filed May 8, 2015 |
|
10.7 |
|
P. H. Glatfelter Company Supplemental Long Term Disability Plan, dated February 25, 2014, between the registrant and certain employees** |
10.1 |
Form 10-Q filed May 2, 2014 |
|
10.8 |
|
P. H. Glatfelter Company Supplemental Executive Retirement Plan (amended and restated effective January 1, 2010)** |
10(c) |
Form 10-K filed March 8, 2013 |
|
10.9 |
|
P. H. Glatfelter Company Supplemental Management Pension Plan (amended and restated effective January 1, 2008)** |
10(d) |
Form 10-K filed March 8, 2013 |
|
10.10 |
|
Form of Top Management Restricted Stock Unit Award Certificate** |
10.2 |
Form 8-K filed May 5, 2009 |
|
10.11 |
|
Form of Non-Employee Director Restricted Stock Unit Award Certificate** |
10.3 |
Form 8-K filed April 29, 2005 |
|
10.12 |
|
Form of Stock-Only Stock Appreciation Right Award Certificate (form effective February 26, 2014)** |
10.3 |
Form 10-Q filed May 2, 2014 |
|
10.13 |
|
Form of Performance Share Award Certificate (form effective February 26, 2014)** |
10.2 |
Form 10-Q filed May 2, 2014 |
|
10.14 |
|
Form of Restricted Stock Unit Award Certificate, form effective as of December 13, 2013** |
10.(l) |
Form 10-K filed March 3, 2014 |
|
10.15 |
|
Restricted Stock Unit Award Certificate, dated as of December 13, 2013, for Dante C. Parrini** |
10.1 |
Form 8-K filed December 17, 2013 |
|
10.16 |
|
Non-Competition and Non-Solicitation Agreement by and between P. H. Glatfelter Company and Dante C. Parrini, dated July 2, 2010. ** |
10.1 |
Form 8-K filed July 6, 2010 |
62
|
Exhibit Number |
|
Description of Documents |
Incorporated by Reference to |
|
|
|
|
|
Exhibit |
Filing |
|
|
Retention agreement between P. H. Glatfelter Company and Timothy R. Hess, dated January 7, 2017, filed herewith** |
|
|
|
|
10.18 |
|
Restricted Stock Unit Award Certificate for Timothy R. Hess, dated as of January 6, 2017, filed herewith ** |
|
|
|
10.19 |
|
Form of Change in Control Employment Agreement by and between P. H. Glatfelter Company and certain employees, form effective as of August 5, 2013** |
10(q) |
Form 10-K filed March 3, 2014 |
|
10.19 |
(A) |
Schedule of Change in Control Employment Agreements, filed herewith** |
|
|
|
10.20 |
|
Form of Change in Control Employment Agreement by and between P. H. Glatfelter Company and certain employees, form effective as of December 8, 2008** |
10(j) |
Form 10-K filed March 13, 2009 |
|
10.21 |
|
Summary of Non-Employee Director Compensation (effective January 1, 2005)** |
10.1 |
Form 8-K filed December 20, 2004 |
|
10.22 |
|
P. H. Glatfelter Company Deferred Compensation Plan for Directors, effective as of January 1, 2007** |
10(k) |
Form 10-K filed March 8, 2013 |
|
10.23 |
|
Service Agreement, commencing on August 1, 2006, between the Registrant (through a wholly owned subsidiary) and Martin Rapp** |
10(r) |
Form 10-K filed March 16, 2007 |
|
10.24 |
|
Retirement Pension Contract, dated October 31, 2007, between Registrant (through a wholly owned subsidiary) and Martin Rapp** |
10(t) |
Form 10-K filed March 13, 2008 |
|
10.25 |
|
Guidelines for Executive Severance** |
10.2 |
Form 8-K filed July 6, 2010 |
|
10.25 |
|
Agreement between the State of Wisconsin and Certain Companies Concerning the Fox River, dated as of January 31, 1997, among P. H. Glatfelter Company, Fort Howard Corporation, NCR Corporation, Appleton Papers Inc., Riverside Paper Corporation, U.S. Paper Mills, Wisconsin Tissue Mills Inc. and the State of Wisconsin |
10(i) |
Form 10-K filed March 28, 1997 |
|
10.25 |
|
Consent Decree for Remedial Design and Remedial Action at Operable Unit 1 of the Lower Fox River and Green Bay Site between the United States of America and the State of Wisconsin v. P. H. Glatfelter Company and WTM I Company (f/k/a Wisconsin Tissue Mills Inc.) |
10.3(a) |
Form 10-Q filed August 6, 2010 |
|
10.25 |
(A) |
Agreed Supplement to Consent Decree between United States of America and the State of Wisconsin vs. P. H. Glatfelter Company and WTM I Company (f/k/a Wisconsin Tissue Mills Inc.) |
10.3(b) |
Form 10-Q filed August 6, 2010 |
|
10.25 |
(B) |
Second Agreed Supplement to Consent Decree between United States of America and the State of Wisconsin vs. P. H. Glatfelter Company and WTM I Company (f/k/a Wisconsin Tissue Mills Inc.) |
10.3(c) |
Form 10-Q filed August 6, 2010 |
|
10.26 |
(C) |
Amended Consent Decree for Remedial Design and Remedial Action at Operable Unit 1 of the Lower Fox River and Green Bay Site by and among the United States of America and the State of Wisconsin v. P. H. Glatfelter and WTM I Company (f/k/a Wisconsin Tissue Mills Inc.) (certain Appendices have been intentionally omitted, copies of which can be obtained free of charge from the Registrant) |
10.3(d) |
Form 10-Q filed August 6, 2010 |
|
10.27 |
|
Administrative Order for Remedial Action dated November 13, 2007, issued by the United States Environmental Protection Agency |
10.2 |
Form 8-K filed November 19, 2007 |
|
14 |
|
Code of Business Ethics for the CEO and Senior Financial Officers of Glatfelter |
14 |
Form 10-K filed March 15, 2004 |
|
21 |
|
Subsidiaries of the Registrant, filed herewith |
|
|
|
23 |
|
Consent of Independent Registered Public Accounting Firm, filed herewith |
|
|
|
31.1 |
|
Certification of Dante C. Parrini, Chairman and Chief Executive Officer of Glatfelter, pursuant to Section 302(a) of the Sarbanes-Oxley Act Of 2002, filed herewith |
|
|
|
31.2 |
|
Certification of John P. Jacunski, Executive Vice President and Chief Financial Officer of Glatfelter, pursuant to Section 302(a) of the Sarbanes-Oxley Act Of 2002, filed herewith |
|
|
|
32.1 |
|
Certification of Dante C. Parrini, Chairman and Chief Executive Officer of Glatfelter, pursuant to Section 906 of the Sarbanes-Oxley Act of 2002, 18 U.S.C. Section 1350, furnished herewith |
|
|
|
32.2 |
|
Certification of John P. Jacunski, Executive Vice President and Chief Financial Officer of Glatfelter, pursuant to Section 906 of the Sarbanes-Oxley Act of 2002, 18 U.S.C. Section 1350, furnished herewith
|
|
|
|
101.INS |
XBRL Instance Document, filed herewith |
|
|
|
|
101.SCH |
XBRL Taxonomy Extension Schema, filed herewith |
|
|
|
|
101.CAL |
XBRL Extension Calculation Linkbase, filed herewith |
|
|
|
|
101.DEF |
XBRL Extension Definition Linkbase, filed herewith |
|
|
|
|
101.LAB |
XBRL Extension Label Linkbase, filed herewith |
|
|
|
|
101.PRE |
XBRL Extension Presentation Linkbase, filed herewith |
|
|
|
|
** |
Management contract or compensatory plan |
|
GLATFELTER 2016 FORM 10-K |
63 |
Pursuant to the requirements of Section 13 or 15(d) of the Securities Exchange Act of 1934, the Registrant has duly caused this report to be signed on its behalf by the undersigned, thereunto duly authorized.
|
|
P. H. GLATFELTER COMPANY (Registrant) |
|
|
February 24, 2017 |
|
|
|
|
By |
/s/ Dante C. Parrini |
|
|
|
Dante C. Parrini |
|
|
|
Chairman and |
|
|
|
Chief Executive Officer |
Pursuant to the requirements of the Securities Exchange Act of 1934, this report has been signed below by the following persons on behalf of the Registrant in the capacities and on the dates indicated:
|
Date |
|
Signature |
|
Capacity |
|
|
|
|
|
|
|
February 24, 2017 |
|
/s/ Dante C. Parrini |
|
Principal Executive Officer and Director |
|
|
|
Dante C. Parrini Chairman and Chief Executive Officer |
|
|
|
|
|
|
|
|
|
February 24, 2017 |
|
/s/ John P. Jacunski |
|
Principal Financial Officer |
|
|
|
John P. Jacunski Executive Vice President and Chief Financial Officer |
|
|
|
|
|
|
|
|
|
February 24, 2017 |
|
/s/ David C. Elder |
|
Chief Accounting Officer |
|
|
|
David C. Elder Vice President, Finance |
|
|
|
|
|
|
|
|
|
February 24, 2017 |
|
/s/ Bruce Brown |
|
Director |
|
|
|
Bruce Brown |
|
|
|
|
|
|
|
|
|
February 24, 2017 |
|
/s/ Kathleen A. Dahlberg |
|
Director |
|
|
|
Kathleen A. Dahlberg |
|
|
|
|
|
|
|
|
|
February 24, 2017 |
|
/s/ Nicholas DeBenedictis |
|
Director |
|
|
|
Nicholas DeBenedictis |
|
|
|
|
|
|
|
|
|
February 24, 2017 |
|
/s/ Kevin M. Fogarty |
|
Director |
|
|
|
Kevin M. Fogarty |
|
|
|
|
|
|
|
|
|
February 24, 2017 |
|
/s/ J. Robert Hall |
|
Director |
|
|
|
J. Robert Hall |
|
|
|
|
|
|
|
|
|
February 24, 2017 |
|
/s/ Richard C. Ill |
|
Director |
|
|
|
Richard C. Ill |
|
|
|
|
|
|
|
|
|
February 24, 2017 |
|
/s/ Ronald J. Naples |
|
Director |
|
|
|
Ronald J. Naples |
|
|
|
|
|
|
|
|
|
February 24, 2017 |
|
/s/ Lee C. Stewart |
|
Director |
|
|
|
Lee C. Stewart |
|
|
64
P. H. GLATFELTER COMPANY AND SUBSIDIARIES
SUPPLEMENTAL FINANCIAL STATEMENT SCHEDULE
For each of the three years ended December 31, 2016
Valuation and Qualifying Accounts
|
|
Allowance for |
|
|
|||||||||||||||||||||||
|
In thousands |
Doubtful Accounts |
Sales Discounts and Deductions |
|
|
||||||||||||||||||||||
|
|
2016 |
|
|
|
2015 |
|
|
2014 |
|
|
2016 |
|
|
|
2015 |
|
|
2014 |
|
|
||||||
|
Balance, beginning of year |
$ |
2,239 |
|
|
|
$ |
2,703 |
|
|
$ |
2,725 |
|
|
$ |
1,593 |
|
|
|
$ |
1,809 |
|
|
$ |
1,810 |
|
|
|
Provision |
|
32 |
|
|
|
|
7 |
|
|
|
1,061 |
|
|
|
4,283 |
|
|
|
|
3,856 |
|
|
|
4,356 |
|
|
|
Write-offs, recoveries and discounts allowed |
|
(497 |
) |
|
|
|
(275 |
) |
|
|
(946 |
) |
|
|
(4,368 |
) |
|
|
|
(3,649 |
) |
|
|
(4,719 |
) |
|
|
Other (a) |
|
(55 |
) |
|
|
|
(196 |
) |
|
|
(137 |
) |
|
|
(46 |
) |
|
|
|
(423 |
) |
|
|
362 |
|
|
|
Balance, end of year |
$ |
1,719 |
|
|
|
$ |
2,239 |
|
|
$ |
2,703 |
|
|
$ |
1,462 |
|
|
|
$ |
1,593 |
|
|
$ |
1,809 |
|
|
The provision for doubtful accounts is included in selling, general and administrative expense and the provision for sales discounts and deductions is deducted from sales. The related allowances are deducted from accounts receivable.
|
(a) |
Relates primarily to changes in currency exchange rates. |
|
GLATFELTER 2016 FORM 10-K |
65 |
Similar companies
See also INTERNATIONAL PAPER CO /NEW/ - Annual report 2022 (10-K 2022-12-31) Annual report 2023 (10-Q 2023-09-30)See also Suzano S.A.
See also Sylvamo Corp - Annual report 2022 (10-K 2022-12-31) Annual report 2023 (10-Q 2023-09-30)
See also Resolute Forest Products Inc. - Annual report 2021 (10-K 2021-12-31) Annual report 2022 (10-Q 2022-09-30)
See also Mativ Holdings, Inc. - Annual report 2022 (10-K 2022-12-31) Annual report 2023 (10-Q 2023-09-30)