Magnera Corp - Quarter Report: 2019 September (Form 10-Q)
UNITED STATES
SECURITIES AND EXCHANGE COMMISSION
WASHINGTON, D.C. 20549
FORM 10-Q
|
☒ |
Quarterly Report pursuant to Section 13 or 15(d) of the Securities Exchange Act of 1934 |
For the quarterly period ended September 30, 2019
or
|
☐ |
Transition Report Pursuant to Section 13 or 15(d) of the Securities Exchange Act of 1934 |
For the transition period from to
96 South George Street, Suite 520
York, Pennsylvania 17401
(Address of principal executive offices)
(717) 850-0170
(Registrant's telephone number, including area code)
|
|
Commission file number |
|
Exact name of registrant as specified in its charter |
|
IRS Employer Identification No. |
|
State or other jurisdiction of incorporation or organization |
|
|
|
1-03560 |
|
P. H. Glatfelter Company |
|
23-0628360 |
|
Pennsylvania |
|
N/A
(Former name or former address, if changed since last report)
Securities registered pursuant to Section 12(b) of the Act:
|
Title of each class |
|
Trading Symbol(s) |
|
Name of each exchange on which registered |
|
Common Stock |
|
GLT |
|
New York Stock Exchange |
Indicate by check mark whether the registrant (1) has filed all reports required to be filed by Section 13 or 15(d) of the Securities Exchange Act of 1934 during the preceding 12 months (or for such shorter period that the registrant was required to file such reports), and (2) has been subject to such filing requirements for at the past 90 days. Yes ☒ No ☐.
Indicate by check mark whether the registrant has submitted electronically every Interactive Data File required to be submitted pursuant to Rule 405 of Regulation S-T (§232.405 of this chapter) during the preceding 12 months (or for such shorter period that the registrant was required to submit such files). Yes ☒ No ☐.
Indicate by check mark whether the registrant is a large accelerated filer, an accelerated filer, a non-accelerated filer, a small reporting company or emerging growth company. See the definitions of “large accelerated filer”, “accelerated filer”, “smaller reporting company” and “emerging growth company” in Rule 12b-2 of the Exchange Act.
|
Large accelerated filer |
☒ |
|
Accelerated filer |
☐ |
||
|
Non-accelerated filer |
☐ |
|
Smaller reporting company |
☐ |
||
|
|
|
Emerging growth company |
☐ |
|
|
|
|
If an emerging growth company, indicate by check mark if the registrant has elected not to use the extended transition period for complying with any new or revised financial accounting standards provided pursuant to Section 13(a) of the Exchange Act. |
☐ |
|||||
Indicate by check mark whether the registrant is a shell company (as defined in Rule 12b-2 of the Exchange Act) Yes ☐ No ☒.
Common Stock outstanding on October 21, 2019 totaled 44,171,151 shares.
P. H. GLATFELTER COMPANY AND SUBSIDIARIES
REPORT ON FORM 10-Q
For the QUARTERLY PERIOD ENDED
September 30, 2019
Table of Contents
|
|
|
Page |
||
|
|
|
|
||
|
|
|
|
|
|
|
Item 1 |
|
|
||
|
|
|
2 |
||
|
|
|
3 |
||
|
|
Condensed Consolidated Balance Sheets as of September 30, 2019 and December 31, 2018 (unaudited) |
|
4 |
|
|
|
|
5 |
||
|
|
|
6 |
||
|
|
Notes to Condensed Consolidated Financial Statements (unaudited) |
|
7 |
|
|
|
1. |
|
7 |
|
|
|
2. |
|
7 |
|
|
|
3. |
|
8 |
|
|
|
4. |
|
9 |
|
|
|
5. |
|
10 |
|
|
|
6. |
|
11 |
|
|
|
7. |
|
11 |
|
|
|
8. |
|
12 |
|
|
|
9. |
|
13 |
|
|
|
10. |
|
14 |
|
|
|
11. |
|
16 |
|
|
|
12. |
|
16 |
|
|
|
13. |
|
17 |
|
|
|
14. |
|
17 |
|
|
|
15. |
|
18 |
|
|
|
16. |
|
19 |
|
|
|
17. |
|
19 |
|
|
|
18. |
|
22 |
|
|
|
19. |
|
23 |
|
|
|
|
|
|
|
|
Item 2 |
Management’s Discussion and Analysis of Financial Condition and Results of Operations |
|
25 |
|
|
Item 3 |
|
36 |
||
|
Item 4 |
|
36 |
||
|
|
|
|
|
|
|
|
37 |
|||
|
|
|
|
|
|
|
Item 6 |
|
37 |
||
|
|
|
|
|
|
|
|
|
37 |
||
PART I
Item 1 – Financial Statements
P. H. GLATFELTER COMPANY AND SUBSIDIARIES
CONDENSED CONSOLIDATED STATEMENTS OF INCOME
(unaudited)
|
|
|
Three months ended September 30 |
|
|
Nine months ended September 30 |
|
||||||||||
|
In thousands, except per share |
|
2019 |
|
|
2018 |
|
|
2019 |
|
|
2018 |
|
||||
|
Net sales |
|
$ |
232,515 |
|
|
$ |
209,855 |
|
|
$ |
696,701 |
|
|
$ |
636,806 |
|
|
Costs of products sold |
|
|
194,494 |
|
|
|
179,983 |
|
|
|
585,563 |
|
|
|
537,073 |
|
|
Gross profit |
|
|
38,021 |
|
|
|
29,872 |
|
|
|
111,138 |
|
|
|
99,733 |
|
|
Selling, general and administrative expenses |
|
|
23,721 |
|
|
|
25,799 |
|
|
|
71,143 |
|
|
|
81,915 |
|
|
Gains on dispositions of plant, equipment and timberlands, net |
|
|
(235 |
) |
|
|
(249 |
) |
|
|
(1,327 |
) |
|
|
(1,939 |
) |
|
Operating income |
|
|
14,535 |
|
|
|
4,322 |
|
|
|
41,322 |
|
|
|
19,757 |
|
|
Non-operating income (expense) |
|
|
|
|
|
|
|
|
|
|
|
|
|
|
|
|
|
Interest expense |
|
|
(1,902 |
) |
|
|
(3,965 |
) |
|
|
(8,513 |
) |
|
|
(11,237 |
) |
|
Interest income |
|
|
185 |
|
|
|
147 |
|
|
|
931 |
|
|
|
227 |
|
|
Other, net |
|
|
(1,034 |
) |
|
|
2,253 |
|
|
|
(3,547 |
) |
|
|
1,131 |
|
|
Total non-operating expense |
|
|
(2,751 |
) |
|
|
(1,565 |
) |
|
|
(11,129 |
) |
|
|
(9,879 |
) |
|
Income from continuing operations before income taxes |
|
|
11,784 |
|
|
|
2,757 |
|
|
|
30,193 |
|
|
|
9,878 |
|
|
Income tax provision |
|
|
3,141 |
|
|
|
3,462 |
|
|
|
10,654 |
|
|
|
7,037 |
|
|
Income (loss) from continuing operations |
|
|
8,643 |
|
|
|
(705 |
) |
|
|
19,539 |
|
|
|
2,841 |
|
|
|
|
|
|
|
|
|
|
|
|
|
|
|
|
|
|
|
|
Discontinued operations: |
|
|
|
|
|
|
|
|
|
|
|
|
|
|
|
|
|
Income (loss) before income taxes |
|
|
1,062 |
|
|
|
(114,656 |
) |
|
|
1,291 |
|
|
|
(128,714 |
) |
|
Income tax benefit |
|
|
(2,519 |
) |
|
|
(19,530 |
) |
|
|
(2,511 |
) |
|
|
(28,361 |
) |
|
Income (loss) from discontinued operations |
|
|
3,581 |
|
|
|
(95,126 |
) |
|
|
3,802 |
|
|
|
(100,353 |
) |
|
Net income (loss) |
|
$ |
12,224 |
|
|
$ |
(95,831 |
) |
|
$ |
23,341 |
|
|
$ |
(97,512 |
) |
|
|
|
|
|
|
|
|
|
|
|
|
|
|
|
|
|
|
|
Basic earnings per share |
|
|
|
|
|
|
|
|
|
|
|
|
|
|
|
|
|
Income (loss) from continuing operations |
|
$ |
0.19 |
|
|
$ |
(0.02 |
) |
|
$ |
0.44 |
|
|
$ |
0.06 |
|
|
Income (loss) from discontinued operations |
|
|
0.09 |
|
|
|
(2.17 |
) |
|
|
0.09 |
|
|
|
(2.29 |
) |
|
Basic earnings (loss) per share |
|
$ |
0.28 |
|
|
$ |
(2.19 |
) |
|
$ |
0.53 |
|
|
$ |
(2.23 |
) |
|
|
|
|
|
|
|
|
|
|
|
|
|
|
|
|
|
|
|
Diluted earnings (loss) per share |
|
|
|
|
|
|
|
|
|
|
|
|
|
|
|
|
|
Income (loss) from continuing operations |
|
$ |
0.19 |
|
|
$ |
(0.02 |
) |
|
$ |
0.44 |
|
|
$ |
0.06 |
|
|
Income (loss) from discontinued operations |
|
|
0.09 |
|
|
|
(2.17 |
) |
|
|
0.09 |
|
|
$ |
(2.29 |
) |
|
Diluted earnings (loss) per share |
|
$ |
0.28 |
|
|
$ |
(2.19 |
) |
|
$ |
0.53 |
|
|
$ |
(2.23 |
) |
|
|
|
|
|
|
|
|
|
|
|
|
|
|
|
|
|
|
|
Cash dividends declared per common share |
|
$ |
0.13 |
|
|
$ |
0.13 |
|
|
$ |
0.39 |
|
|
$ |
0.39 |
|
|
|
|
|
|
|
|
|
|
|
|
|
|
|
|
|
|
|
|
Weighted average shares outstanding |
|
|
|
|
|
|
|
|
|
|
|
|
|
|
|
|
|
Basic |
|
|
44,171 |
|
|
|
43,792 |
|
|
|
44,113 |
|
|
|
43,754 |
|
|
Diluted |
|
|
44,442 |
|
|
|
43,792 |
|
|
|
44,405 |
|
|
|
43,754 |
|
The accompanying notes are an integral part of these condensed consolidated financial statements.
- 2 -
GLATFELTER
Form 10-Q
P. H. GLATFELTER COMPANY AND SUBSIDIARIES
CONDENSED CONSOLIDATED STATEMENTS OF COMPREHENSIVE INCOME
(unaudited)
|
|
|
Three months ended September 30 |
|
|
Nine months ended September 30 |
|
||||||||||
|
In thousands |
|
2019 |
|
|
2018 |
|
|
2019 |
|
|
2018 |
|
||||
|
Net income (loss) |
|
$ |
12,224 |
|
|
$ |
(95,831 |
) |
|
$ |
23,341 |
|
|
$ |
(97,512 |
) |
|
Foreign currency translation adjustments |
|
|
(17,073 |
) |
|
|
(3,217 |
) |
|
|
(20,452 |
) |
|
|
(23,693 |
) |
|
Net change in: |
|
|
|
|
|
|
|
|
|
|
|
|
|
|
|
|
|
Deferred gains on cash flow hedges, net of taxes of $(873), $(582), $(1,629) and $(1,718), respectively |
|
|
2,365 |
|
|
|
1,616 |
|
|
|
4,608 |
|
|
|
4,363 |
|
|
Unrecognized retirement obligations, net of taxes of $(220), $(1,932), $(1,606) and $(3,874), respectively |
|
|
2,817 |
|
|
|
21,572 |
|
|
|
7,657 |
|
|
|
27,668 |
|
|
Other comprehensive income (loss) |
|
|
(11,891 |
) |
|
|
19,971 |
|
|
|
(8,187 |
) |
|
|
8,338 |
|
|
Comprehensive income (loss) |
|
$ |
333 |
|
|
$ |
(75,860 |
) |
|
$ |
15,154 |
|
|
$ |
(89,174 |
) |
The accompanying notes are an integral part of these condensed consolidated financial statements.
- 3 -
GLATFELTER
Form 10-Q
P. H. GLATFELTER COMPANY AND SUBSIDIARIES
CONDENSED CONSOLIDATED BALANCE SHEETS
(unaudited)
|
|
|
September 30 |
|
|
December 31 |
|
||
|
In thousands |
|
2019 |
|
|
2018 |
|
||
|
Assets |
|
|
|
|
|
|
|
|
|
Cash and cash equivalents |
|
$ |
57,046 |
|
|
$ |
142,685 |
|
|
Accounts receivable, net |
|
|
121,050 |
|
|
|
119,772 |
|
|
Inventories |
|
|
190,574 |
|
|
|
173,411 |
|
|
Prepaid expenses and other current assets |
|
|
40,637 |
|
|
|
33,418 |
|
|
Total current assets |
|
|
409,307 |
|
|
|
469,286 |
|
|
|
|
|
|
|
|
|
|
|
|
Plant, equipment and timberlands, net |
|
|
524,021 |
|
|
|
556,044 |
|
|
Goodwill |
|
|
146,093 |
|
|
|
153,463 |
|
|
Intangible assets, net |
|
|
83,129 |
|
|
|
93,614 |
|
|
Other assets |
|
|
83,016 |
|
|
|
67,347 |
|
|
Total assets |
|
$ |
1,245,566 |
|
|
$ |
1,339,754 |
|
|
|
|
|
|
|
|
|
|
|
|
Liabilities and Shareholders' Equity |
|
|
|
|
|
|
|
|
|
Current portion of long-term debt |
|
$ |
22,235 |
|
|
$ |
10,785 |
|
|
Accounts payable |
|
|
109,609 |
|
|
|
120,701 |
|
|
Dividends payable |
|
|
5,742 |
|
|
|
5,719 |
|
|
Environmental liabilities |
|
|
7,700 |
|
|
|
23,000 |
|
|
Other current liabilities |
|
|
72,160 |
|
|
|
72,597 |
|
|
Total current liabilities |
|
|
217,446 |
|
|
|
232,802 |
|
|
|
|
|
|
|
|
|
|
|
|
Long-term debt |
|
|
329,771 |
|
|
|
400,962 |
|
|
Deferred income taxes |
|
|
79,151 |
|
|
|
78,651 |
|
|
Other long-term liabilities |
|
|
80,441 |
|
|
|
88,441 |
|
|
Total liabilities |
|
|
706,809 |
|
|
|
800,856 |
|
|
|
|
|
|
|
|
|
|
|
|
Commitments and contingencies |
|
|
|
|
|
|
|
|
|
|
|
|
|
|
|
|
|
|
|
Shareholders’ equity |
|
|
|
|
|
|
|
|
|
Common stock |
|
|
544 |
|
|
|
544 |
|
|
Capital in excess of par value |
|
|
60,965 |
|
|
|
62,239 |
|
|
Retained earnings |
|
|
776,424 |
|
|
|
770,305 |
|
|
Accumulated other comprehensive loss |
|
|
(145,627 |
) |
|
|
(137,440 |
) |
|
|
|
|
692,306 |
|
|
|
695,648 |
|
|
Less cost of common stock in treasury |
|
|
(153,549 |
) |
|
|
(156,750 |
) |
|
Total shareholders’ equity |
|
|
538,757 |
|
|
|
538,898 |
|
|
Total liabilities and shareholders’ equity |
|
$ |
1,245,566 |
|
|
$ |
1,339,754 |
|
The accompanying notes are an integral part of these condensed consolidated financial statements.
- 4 -
GLATFELTER
Form 10-Q
P. H. GLATFELTER COMPANY AND SUBSIDIARIES
CONDENSED CONSOLIDATED STATEMENTS OF CASH FLOWS
(unaudited)
|
|
|
Nine months ended September 30 |
|
|||||
|
In thousands |
|
2019 |
|
|
2018 |
|
||
|
Operating activities |
|
|
|
|
|
|
|
|
|
Net income (loss) |
|
$ |
23,341 |
|
|
$ |
(97,512 |
) |
|
(Income) loss from discontinued operations, net of taxes |
|
|
(3,802 |
) |
|
|
100,353 |
|
|
|
|
|
|
|
|
|
|
|
|
Adjustments to reconcile to net cash provided (used) by continuing operations: |
|
|
|
|
|
|
|
|
|
Depreciation, depletion and amortization |
|
|
38,114 |
|
|
|
34,731 |
|
|
Amortization of debt issue costs and original issue discount |
|
|
1,525 |
|
|
|
870 |
|
|
Deferred income tax benefit (provision) |
|
|
441 |
|
|
|
(5,466 |
) |
|
Gains on dispositions of plant, equipment and timberlands, net |
|
|
(1,327 |
) |
|
|
(1,939 |
) |
|
Share-based compensation |
|
|
2,683 |
|
|
|
4,594 |
|
|
Change in operating assets and liabilities |
|
|
|
|
|
|
|
|
|
Accounts receivable |
|
|
(5,431 |
) |
|
|
(10,421 |
) |
|
Inventories |
|
|
(23,728 |
) |
|
|
(40,314 |
) |
|
Prepaid and other current assets |
|
|
(4,512 |
) |
|
|
(2,935 |
) |
|
Accounts payable |
|
|
(5,347 |
) |
|
|
(2,019 |
) |
|
Accruals and other current liabilities |
|
|
(5,891 |
) |
|
|
3,768 |
|
|
Other |
|
|
(472 |
) |
|
|
78 |
|
|
Net cash provided (used) by operating activities from continuing operations |
|
|
15,594 |
|
|
|
(16,212 |
) |
|
|
|
|
|
|
|
|
|
|
|
Investing activities |
|
|
|
|
|
|
|
|
|
Expenditures for purchases of plant, equipment and timberlands |
|
|
(18,017 |
) |
|
|
(32,155 |
) |
|
Proceeds from disposals of plant, equipment and timberlands, net |
|
|
1,363 |
|
|
|
2,073 |
|
|
Acquisition, net of cash acquired |
|
|
(1,974 |
) |
|
|
— |
|
|
Other |
|
|
(163 |
) |
|
|
(68 |
) |
|
Net cash used by investing activities from continuing operations |
|
|
(18,791 |
) |
|
|
(30,150 |
) |
|
|
|
|
|
|
|
|
|
|
|
Financing activities |
|
|
|
|
|
|
|
|
|
Net (repayments) borrowings under revolving credit facility |
|
|
(30,183 |
) |
|
|
174,761 |
|
|
Repayment of 5.375% Notes |
|
|
(250,000 |
) |
|
|
— |
|
|
Proceeds from term loans |
|
|
248,644 |
|
|
|
— |
|
|
Payments of borrowing costs |
|
|
(2,170 |
) |
|
|
— |
|
|
Repayment of term loans |
|
|
(11,020 |
) |
|
|
(8,373 |
) |
|
Payments of dividends |
|
|
(17,194 |
) |
|
|
(17,064 |
) |
|
Payments related to share-based compensation awards and other |
|
|
(755 |
) |
|
|
(1,008 |
) |
|
Net cash provided (used) by financing activities from continuing operations |
|
|
(62,678 |
) |
|
|
148,316 |
|
|
Effect of exchange rate changes on cash |
|
|
(1,794 |
) |
|
|
(3,931 |
) |
|
Net increase (decrease) in cash and cash equivalents |
|
|
(67,669 |
) |
|
|
98,023 |
|
|
Change in cash and cash equivalents from discontinued operations |
|
|
(17,970 |
) |
|
|
19,828 |
|
|
Cash and cash equivalents at the beginning of period |
|
|
142,685 |
|
|
|
116,219 |
|
|
Cash and cash equivalents at the end of period |
|
$ |
57,046 |
|
|
$ |
234,070 |
|
|
|
|
|
|
|
|
|
|
|
|
Supplemental cash flow information |
|
|
|
|
|
|
|
|
|
Cash paid for: |
|
|
|
|
|
|
|
|
|
Interest, net of amounts capitalized |
|
$ |
9,245 |
|
|
$ |
7,213 |
|
|
Income taxes, net |
|
|
10,741 |
|
|
|
11,001 |
|
The accompanying notes are an integral part of these condensed consolidated financial statements.
- 5 -
GLATFELTER
Form 10-Q
P. H. GLATFELTER COMPANY AND SUBSIDIARIES
STATEMENTS OF SHAREHOLDERS’ EQUITY
(unaudited)
|
In thousands |
|
Common stock |
|
|
Capital in Excess of Par Value |
|
|
Retained Earnings |
|
|
Accumulated Other Comprehensive Loss |
|
|
Treasury Stock |
|
|
Total Shareholders’ Equity |
|
||||||
|
Balance at July 1, 2019 |
|
$ |
544 |
|
|
$ |
59,920 |
|
|
$ |
769,940 |
|
|
$ |
(133,736 |
) |
|
$ |
(153,549 |
) |
|
$ |
543,119 |
|
|
Net income |
|
|
|
|
|
|
|
|
|
|
12,224 |
|
|
|
|
|
|
|
|
|
|
|
12,224 |
|
|
Other comprehensive loss |
|
|
|
|
|
|
|
|
|
|
|
|
|
|
(11,891 |
) |
|
|
|
|
|
|
(11,891 |
) |
|
Comprehensive income |
|
|
|
|
|
|
|
|
|
|
|
|
|
|
|
|
|
|
|
|
|
|
333 |
|
|
Cash dividends declared ($0.13 per share) |
|
|
|
|
|
|
|
|
|
|
(5,740 |
) |
|
|
|
|
|
|
|
|
|
|
(5,740 |
) |
|
Share-based compensation expense |
|
|
|
|
|
|
1,045 |
|
|
|
|
|
|
|
|
|
|
|
|
|
|
|
1,045 |
|
|
Balance at September 30, 2019 |
|
$ |
544 |
|
|
$ |
60,965 |
|
|
$ |
776,424 |
|
|
$ |
(145,627 |
) |
|
$ |
(153,549 |
) |
|
$ |
538,757 |
|
|
|
|
|
|
|
|
|
|
|
|
|
|
|
|
|
|
|
|
|
|
|
|
|
|
|
|
Balance at July 1, 2018 |
|
$ |
544 |
|
|
$ |
62,827 |
|
|
$ |
957,643 |
|
|
$ |
(174,606 |
) |
|
$ |
(159,456 |
) |
|
$ |
686,952 |
|
|
Net loss |
|
|
|
|
|
|
|
|
|
|
(95,831 |
) |
|
|
|
|
|
|
|
|
|
|
(95,831 |
) |
|
Other comprehensive income |
|
|
|
|
|
|
|
|
|
|
|
|
|
|
19,971 |
|
|
|
|
|
|
|
19,971 |
|
|
Comprehensive loss |
|
|
|
|
|
|
|
|
|
|
|
|
|
|
|
|
|
|
|
|
|
|
(75,860 |
) |
|
Cash dividends declared ($0.13 per share) |
|
|
|
|
|
|
|
|
|
|
(5,694 |
) |
|
|
|
|
|
|
|
|
|
|
(5,694 |
) |
|
Share-based compensation expense |
|
|
|
|
|
|
890 |
|
|
|
|
|
|
|
|
|
|
|
|
|
|
|
890 |
|
|
Delivery of treasury shares |
|
|
|
|
|
|
|
|
|
|
|
|
|
|
|
|
|
|
|
|
|
|
|
|
|
RSUs and PSAs |
|
|
|
|
|
|
(21 |
) |
|
|
|
|
|
|
|
|
|
|
14 |
|
|
|
(7 |
) |
|
Employee stock options exercised — net |
|
|
|
|
|
|
(67 |
) |
|
|
|
|
|
|
|
|
|
|
32 |
|
|
|
(35 |
) |
|
Balance at September 30, 2018 |
|
$ |
544 |
|
|
$ |
63,629 |
|
|
$ |
856,118 |
|
|
$ |
(154,635 |
) |
|
$ |
(159,410 |
) |
|
$ |
606,246 |
|
|
|
|
|
|
|
|
|
|
|
|
|
|
|
|
|
|
|
|
|
|
|
|
|
|
|
|
Balance at January 1, 2019 |
|
$ |
544 |
|
|
$ |
62,239 |
|
|
$ |
770,305 |
|
|
$ |
(137,440 |
) |
|
$ |
(156,750 |
) |
|
$ |
538,898 |
|
|
Net income |
|
|
|
|
|
|
|
|
|
|
23,341 |
|
|
|
|
|
|
|
|
|
|
|
23,341 |
|
|
Other comprehensive loss |
|
|
|
|
|
|
|
|
|
|
|
|
|
|
(8,187 |
) |
|
|
|
|
|
|
(8,187 |
) |
|
Comprehensive income |
|
|
|
|
|
|
|
|
|
|
|
|
|
|
|
|
|
|
|
|
|
|
15,154 |
|
|
Cash dividends declared ($0.39 per share) |
|
|
|
|
|
|
|
|
|
|
(17,222 |
) |
|
|
|
|
|
|
|
|
|
|
(17,222 |
) |
|
Share-based compensation expense |
|
|
|
|
|
|
2,683 |
|
|
|
|
|
|
|
|
|
|
|
|
|
|
|
2,683 |
|
|
Delivery of treasury shares |
|
|
|
|
|
|
|
|
|
|
|
|
|
|
|
|
|
|
|
|
|
|
|
|
|
RSUs and PSAs |
|
|
|
|
|
|
(2,421 |
) |
|
|
|
|
|
|
|
|
|
|
2,097 |
|
|
|
(324 |
) |
|
Employee stock options exercised — net |
|
|
|
|
|
|
(1,536 |
) |
|
|
|
|
|
|
|
|
|
|
1,104 |
|
|
|
(432 |
) |
|
Balance at September 30, 2019 |
|
$ |
544 |
|
|
$ |
60,965 |
|
|
$ |
776,424 |
|
|
$ |
(145,627 |
) |
|
$ |
(153,549 |
) |
|
$ |
538,757 |
|
|
|
|
|
|
|
|
|
|
|
|
|
|
|
|
|
|
|
|
|
|
|
|
|
|
|
|
Balance at January 1, 2018 |
|
$ |
544 |
|
|
$ |
62,594 |
|
|
$ |
948,411 |
|
|
$ |
(140,675 |
) |
|
$ |
(161,946 |
) |
|
$ |
708,928 |
|
|
Reclassification pursuant to ASU No. 2018-02 |
|
|
|
|
|
|
|
|
|
|
22,298 |
|
|
|
(22,298 |
) |
|
|
|
|
|
|
— |
|
|
Net loss |
|
|
|
|
|
|
|
|
|
|
(97,512 |
) |
|
|
|
|
|
|
|
|
|
|
(97,512 |
) |
|
Other comprehensive income |
|
|
|
|
|
|
|
|
|
|
|
|
|
|
8,338 |
|
|
|
|
|
|
|
8,338 |
|
|
Comprehensive loss |
|
|
|
|
|
|
|
|
|
|
|
|
|
|
|
|
|
|
|
|
|
|
(89,174 |
) |
|
Cash dividends declared ($0.39 per share) |
|
|
|
|
|
|
|
|
|
|
(17,079 |
) |
|
|
|
|
|
|
|
|
|
|
(17,079 |
) |
|
Share-based compensation expense |
|
|
|
|
|
|
4,594 |
|
|
|
|
|
|
|
|
|
|
|
|
|
|
|
4,594 |
|
|
Delivery of treasury shares |
|
|
|
|
|
|
|
|
|
|
|
|
|
|
|
|
|
|
|
|
|
|
|
|
|
RSUs and PSAs |
|
|
|
|
|
|
(2,397 |
) |
|
|
|
|
|
|
|
|
|
|
1,914 |
|
|
|
(483 |
) |
|
Employee stock options exercised — net |
|
|
|
|
|
|
(1,162 |
) |
|
|
|
|
|
|
|
|
|
|
622 |
|
|
|
(540 |
) |
|
Balance at September 30, 2018 |
|
$ |
544 |
|
|
$ |
63,629 |
|
|
$ |
856,118 |
|
|
$ |
(154,635 |
) |
|
$ |
(159,410 |
) |
|
$ |
606,246 |
|
The accompanying notes are an integral part of these condensed consolidated financial statements.
- 6 -
GLATFELTER
Form 10-Q
P. H. GLATFELTER COMPANY AND SUBSIDIARIES
NOTES TO CONDENSED CONSOLIDATED FINANCIAL STATEMENTS
(unaudited)
|
1. |
ORGANIZATION |
P. H. Glatfelter Company and subsidiaries is a leading global supplier of high-quality, innovative and customizable solutions found in tea and single-serve coffee filtration, personal hygiene and packaging products, as well as home improvement and industrial applications. We are headquartered in York, Pennsylvania, and operate facilities in the United States, Canada, Germany, France, the United Kingdom and the Philippines. We have sales and distribution offices in the U.S., Europe, Russia and China and our products are marketed worldwide, either directly to customers or through brokers and agents. The terms “we,” “us,” “our,” “the Company,” or “Glatfelter,” refer to P. H. Glatfelter Company and subsidiaries unless the context indicates otherwise.
|
2. |
ACCOUNTING POLICIES |
Basis of Presentation The unaudited condensed consolidated financial statements (“financial statements”) include the accounts of Glatfelter and its wholly-owned subsidiaries. All intercompany balances and transactions have been eliminated.
We prepared these financial statements in accordance with accounting principles generally accepted in the United States of America (“generally accepted accounting principles” or “GAAP”) and pursuant to the rules and regulations of the Securities and Exchange Commission pertaining to interim financial statements. In our opinion, the financial statements reflect all normal, recurring adjustments needed to present fairly our results for the interim periods. When preparing these financial statements, we have assumed you have read the audited consolidated financial statements included in our 2018 Annual Report on Form 10-K.
Discontinued Operations The results of operations for our former Specialty Papers business have been classified as discontinued operations for all periods presented in the condensed consolidated statements of income.
Accounting Estimates The preparation of financial statements in conformity with GAAP requires management to make estimates and assumptions that affect the reported amounts of assets and liabilities and disclosures of contingencies as of the balance sheet date and the reported amounts of revenues and expenses during the reporting period. Management believes the estimates and assumptions used in the preparation of these financial statements are reasonable, based upon currently available facts and known circumstances, but recognizes actual results may differ from those estimates and assumptions.
Recently Issued Accounting Pronouncements In February 2016, the Financial Accounting Standards Board (“FASB”) issued ASU No. 2016-02, Leases (Topic 842) (“ASU 842”). This ASU requires organizations to recognize on its balance sheet the assets and liabilities for the rights and obligations created by leases. We adopted ASU 842 as of January 1, 2019 and elected to follow a modified retrospective method which permitted us to adopt the standard without restating previously reported periods. As a result of adopting ASU 842, we recorded a right of use asset and corresponding lease obligation of approximately $14.1 million. Refer to Note 14 “Leases” for additional information.
In August 2017, the FASB issued ASU No. 2017-12, "Derivatives and Hedging (Topic 815), Targeted Improvements to Accounting for Hedging Activities" (“ASU No. 2017-12”), which simplifies the application of hedge accounting and more closely aligns hedge accounting with an entity’s risk management strategies. ASU No. 2017-12 also amends the manner in which hedge effectiveness may be performed and changes the presentation of hedge ineffectiveness in the financial statements. We adopted ASU No. 2017-12 effective January 1, 2019 but it had an insignificant effect on our results of operations and financial position.
In June 2016, the FASB issued ASU No. 2016-13 “Financial Instruments—Credit Losses (Topic 326): Measurement of Credit Losses on Financial Instruments” that changes the impairment model for most financial instruments, including trade receivables from an incurred loss method to a new forward-looking approach, based on expected losses. Under the new guidance, an allowance is recognized based on an estimate of expected credit losses. This standard is effective for us in the first quarter of 2020 and must be adopted using a modified retrospective approach. We expect the adoption of this standard will not have a material impact on our results of operations or financial position.
- 7 -
GLATFELTER
Form 10-Q
|
3. |
ACQUISITION |
On October 1, 2018, we completed our acquisition of Georgia-Pacific’s European nonwovens business (the “GP Business”) for $186 million and a working capital adjustment and post-closing purchase price adjustments of $2.0 million.
The acquisition consisted of Georgia-Pacific’s operations located in Steinfurt, Germany, along with sales offices located in France and Italy. The Steinfurt facility produces high-quality airlaid products for the table-top, wipes, hygiene, food pad, and other nonwoven materials markets, competing in the marketplace with nonwoven technologies and substrates, as well as other materials focused primarily on consumer based end-use applications. The facility is a state-of-the-art, 32,000-metric-ton-capacity manufacturing facility that employs approximately 220 people. Steinfurt’s results were reported prospectively from the acquisition date as part of our Airlaid Materials operating segment.
We financed the transaction through a combination of cash on hand and borrowings under our revolving credit facility.
The allocation of the purchase price to assets acquired and liabilities assumed is as follows:
|
In thousands |
|
|
|
Allocation |
|
|
|
Assets |
|
|
|
|
|
|
|
Cash and cash equivalents |
|
|
|
$ |
7,540 |
|
|
Accounts receivable |
|
|
|
|
13,277 |
|
|
Inventory |
|
|
|
|
11,133 |
|
|
Prepaid and other current assets |
|
|
|
|
869 |
|
|
Plant, equipment and timberlands |
|
|
|
|
66,167 |
|
|
Intangible assets |
|
|
|
|
43,573 |
|
|
Goodwill |
|
|
|
|
74,770 |
|
|
Total assets |
|
|
|
|
217,329 |
|
|
Liabilities |
|
|
|
|
|
|
|
Accounts payable |
|
|
|
|
8,577 |
|
|
Deferred tax liabilities |
|
|
|
|
19,119 |
|
|
Other long term liabilities |
|
|
|
|
1,162 |
|
|
Total liabilities |
|
|
|
|
28,858 |
|
|
Total |
|
|
|
|
188,471 |
|
|
less cash acquired |
|
|
|
|
(7,540 |
) |
|
Total purchase price |
|
|
|
$ |
180,931 |
|
For purposes of allocating the total purchase price, assets acquired and liabilities assumed are recorded at their estimated fair market value. The allocation set forth above is based on management’s estimate of the fair value using valuation techniques such as discounted cash flow models, appraisals and similar methodologies. The amount allocated to intangible assets represents the estimated value of customer relationships, technological know-how and trade name.
In connection with the Steinfurt acquisition we recorded $74.8 million of goodwill and $43.6 million of intangible assets. The goodwill arising from the acquisition largely relates to strategic benefits, product and market diversification, assembled workforce, and similar factors. For tax purposes, none of the goodwill is deductible. Intangible assets consist of technology, customer relationships and tradename.
The following table summarizes unaudited pro forma financial information for the indicated periods of 2018 as if the acquisition occurred as of January 1, 2018:
|
|
|
Three months ended September 30 |
|
|
Nine months ended September 30 |
|
||
|
In thousands, except per share |
|
(unaudited) |
|
|||||
|
Pro forma |
|
|
|
|
|
|
|
|
|
Net sales |
|
$ |
233,043 |
|
|
$ |
707,563 |
|
|
Income from continuing operations |
|
|
2,463 |
|
|
|
7,558 |
|
|
Income per share from continuing operations |
|
|
0.06 |
|
|
|
0.17 |
|
- 8 -
GLATFELTER
Form 10-Q
|
4. |
REVENUE |
The following tables set forth disaggregated information pertaining to our net sales:
|
|
|
Three months ended September 30 |
|
|
Nine months ended September 30 |
|
||||||||||
|
In thousands |
|
2019 |
|
|
2018 |
|
|
2019 |
|
|
2018 |
|
||||
|
Composite Fibers |
|
|
|
|
|
|
|
|
|
|
|
|
|
|
|
|
|
Food & beverage |
|
$ |
66,637 |
|
|
$ |
68,534 |
|
|
$ |
208,480 |
|
|
$ |
209,117 |
|
|
Wallcovering |
|
|
20,673 |
|
|
|
26,135 |
|
|
|
62,181 |
|
|
|
82,056 |
|
|
Technical specialties |
|
|
20,301 |
|
|
|
20,615 |
|
|
|
58,855 |
|
|
|
63,182 |
|
|
Composite laminates |
|
|
8,859 |
|
|
|
10,544 |
|
|
|
26,552 |
|
|
|
28,902 |
|
|
Metallized |
|
|
11,234 |
|
|
|
13,348 |
|
|
|
32,934 |
|
|
|
40,450 |
|
|
|
|
|
127,704 |
|
|
|
139,176 |
|
|
|
389,002 |
|
|
|
423,707 |
|
|
Airlaid Materials |
|
|
|
|
|
|
|
|
|
|
|
|
|
|
|
|
|
Feminine hygiene |
|
|
52,159 |
|
|
|
46,054 |
|
|
|
158,998 |
|
|
|
141,464 |
|
|
Specialty wipes |
|
|
17,994 |
|
|
|
11,104 |
|
|
|
52,982 |
|
|
|
29,366 |
|
|
Table top |
|
|
19,179 |
|
|
|
2,091 |
|
|
|
48,857 |
|
|
|
6,335 |
|
|
Adult incontinence |
|
|
5,855 |
|
|
|
5,036 |
|
|
|
17,708 |
|
|
|
14,658 |
|
|
Home care |
|
|
4,857 |
|
|
|
4,009 |
|
|
|
13,173 |
|
|
|
11,911 |
|
|
Other |
|
|
4,767 |
|
|
|
2,385 |
|
|
|
15,981 |
|
|
|
9,365 |
|
|
|
|
|
104,811 |
|
|
|
70,679 |
|
|
|
307,699 |
|
|
|
213,099 |
|
|
|
|
|
|
|
|
|
|
|
|
|
|
|
|
|
|
|
|
Total |
|
$ |
232,515 |
|
|
$ |
209,855 |
|
|
$ |
696,701 |
|
|
$ |
636,806 |
|
|
|
|
Three months ended September 30 |
|
|
Nine months ended September 30 |
|
||||||||||
|
In thousands |
|
2019 |
|
|
2018 |
|
|
2019 |
|
|
2018 |
|
||||
|
Composite Fibers |
|
|
|
|
|
|
|
|
|
|
|
|
|
|
|
|
|
Europe, Middle East and Africa |
|
$ |
77,012 |
|
|
$ |
87,870 |
|
|
$ |
234,928 |
|
|
$ |
274,442 |
|
|
Americas |
|
|
33,179 |
|
|
|
30,205 |
|
|
|
98,783 |
|
|
|
83,245 |
|
|
Asia Pacific |
|
|
17,513 |
|
|
|
21,101 |
|
|
|
55,291 |
|
|
|
66,020 |
|
|
|
|
|
127,704 |
|
|
|
139,176 |
|
|
|
389,002 |
|
|
|
423,707 |
|
|
Airlaid Materials |
|
|
|
|
|
|
|
|
|
|
|
|
|
|
|
|
|
Europe, Middle East and Africa |
|
|
58,279 |
|
|
|
35,283 |
|
|
|
167,924 |
|
|
|
107,416 |
|
|
Americas |
|
|
45,039 |
|
|
|
34,899 |
|
|
|
134,634 |
|
|
|
104,027 |
|
|
Asia Pacific |
|
|
1,493 |
|
|
|
497 |
|
|
|
5,141 |
|
|
|
1,656 |
|
|
|
|
|
104,811 |
|
|
|
70,679 |
|
|
|
307,699 |
|
|
|
213,099 |
|
|
|
|
|
|
|
|
|
|
|
|
|
|
|
|
|
|
|
|
Total |
|
$ |
232,515 |
|
|
$ |
209,855 |
|
|
$ |
696,701 |
|
|
$ |
636,806 |
|
- 9 -
GLATFELTER
Form 10-Q
|
5. |
DISCONTINUED OPERATIONS |
On October 31, 2018, we completed the previously announced sale of our Specialty Papers business on a cash free and debt free basis to Pixelle Specialty Solutions LLC, an affiliate of Lindsay Goldberg (the “Purchaser”) for $360 million. Cash proceeds from the sale were approximately $323 million in cash reflecting estimated purchase price adjustments as of the closing date and the assumption by the Purchaser of approximately $38 million in retiree healthcare liabilities. In addition, the Purchaser assumed approximately $210 million of pension liabilities relating to Specialty Papers’ employees and received approximately $274 million of related assets from the Company’s existing pension plan.
In connection with the sale of Specialty Papers, we entered into a Transition Services Agreement with Purchaser pursuant to which we agreed to provide various back-office and information technology support until the business is fully separated from us, which was completed in the third quarter of 2019.
The following table sets forth a summary of discontinued operations included in the condensed consolidated statements of income:
|
|
|
Three months ended September 30 |
|
|
Nine months ended September 30 |
|
||||||||||
|
In thousands |
|
2019 |
|
|
2018 |
|
|
2019 |
|
|
2018 |
|
||||
|
Net sales |
|
$ |
— |
|
|
$ |
201,288 |
|
|
$ |
— |
|
|
$ |
590,757 |
|
|
Energy and related sales, net |
|
|
— |
|
|
|
844 |
|
|
|
— |
|
|
|
3,217 |
|
|
Total revenues |
|
|
— |
|
|
|
202,132 |
|
|
|
— |
|
|
|
593,974 |
|
|
Costs of products sold |
|
|
— |
|
|
|
181,628 |
|
|
|
— |
|
|
|
572,820 |
|
|
Gross profit |
|
|
— |
|
|
|
20,504 |
|
|
|
— |
|
|
|
21,154 |
|
|
Selling, general and administrative expenses |
|
|
(2,455 |
) |
|
|
6,058 |
|
|
|
(2,684 |
) |
|
|
18,566 |
|
|
Gains on dispositions of plant, equipment and timberlands, net |
|
|
— |
|
|
|
3 |
|
|
|
— |
|
|
|
(440 |
) |
|
Operating income |
|
|
2,455 |
|
|
|
14,443 |
|
|
|
2,684 |
|
|
|
3,028 |
|
|
Non-operating income (expense) |
|
|
|
|
|
|
|
|
|
|
|
|
|
|
|
|
|
Interest expense |
|
|
— |
|
|
|
(2,281 |
) |
|
|
— |
|
|
|
(6,017 |
) |
|
Other, net |
|
|
(1,393 |
) |
|
|
(1,174 |
) |
|
|
(1,393 |
) |
|
|
(81 |
) |
|
Impairment charge |
|
|
— |
|
|
|
(125,644 |
) |
|
|
— |
|
|
|
(125,644 |
) |
|
Income (loss) before income taxes |
|
|
1,062 |
|
|
|
(114,656 |
) |
|
|
1,291 |
|
|
|
(128,714 |
) |
|
Income tax benefit |
|
|
(2,519 |
) |
|
|
(19,530 |
) |
|
|
(2,511 |
) |
|
|
(28,361 |
) |
|
Income (loss) from discontinued operations |
|
$ |
3,581 |
|
|
$ |
(95,126 |
) |
|
$ |
3,802 |
|
|
$ |
(100,353 |
) |
The amounts for 2018 presented above are derived from the segment reporting for Specialty Papers adjusted to include certain retirement benefit costs and to exclude corporate shared services costs which are required to remain in continuing operations. Interest expense was allocated to discontinued operations based on borrowings under the revolving credit facility required to be repaid with proceeds from the sale of Specialty Papers.
The following table sets forth a summary of cash flows from discontinued operations which is included in the condensed consolidated statements of cash flows:
|
|
|
Nine months ended September 30 |
|
|||||
|
In thousands |
|
2019 |
|
|
2018 |
|
||
|
Net cash provided (used) by operating activities |
|
$ |
(9,749 |
) |
|
$ |
33,721 |
|
|
Net cash used by investing activities |
|
|
(8,221 |
) |
|
|
(14,018 |
) |
|
Net cash provided by financing activities |
|
|
— |
|
|
|
125 |
|
|
Change in cash and cash equivalents from discontinued operations |
|
$ |
(17,970 |
) |
|
$ |
19,828 |
|
- 10 -
GLATFELTER
Form 10-Q
|
6. |
GAINS ON DISPOSITION OF PLANT, EQUIPMENT AND TIMBERLANDS |
During the first nine months of 2019 and 2018 we completed the following sales of timberlands and other assets included in continuing operations:
|
Dollars in thousands |
|
Acres |
|
|
Proceeds |
|
|
Gain |
|
|||
|
2019 |
|
|
|
|
|
|
|
|
|
|
|
|
|
Timberlands |
|
|
463 |
|
|
$ |
1,147 |
|
|
$ |
1,114 |
|
|
Other |
|
n/a |
|
|
|
216 |
|
|
|
213 |
|
|
|
Total |
|
|
|
|
|
$ |
1,363 |
|
|
$ |
1,327 |
|
|
2018 |
|
|
|
|
|
|
|
|
|
|
|
|
|
Timberlands |
|
|
1,103 |
|
|
$ |
2,046 |
|
|
$ |
1,929 |
|
|
Other |
|
n/a |
|
|
|
27 |
|
|
|
10 |
|
|
|
Total |
|
|
|
|
|
$ |
2,073 |
|
|
$ |
1,939 |
|
|
7. |
EARNINGS PER SHARE |
The following table sets forth the details of basic and diluted earnings per share (“EPS”) from continuing operations:
|
|
|
Three months ended September 30 |
|
|||||
|
In thousands, except per share |
|
2019 |
|
|
2018 |
|
||
|
Income (loss) from continuing operations |
|
$ |
8,643 |
|
|
$ |
(705 |
) |
|
Weighted average common shares |
|
|
|
|
|
|
|
|
|
outstanding used in basic EPS |
|
|
44,171 |
|
|
|
43,792 |
|
|
Effect of dilutive SOSARs, |
|
|
|
|
|
|
|
|
|
PSAs and RSUs |
|
|
271 |
|
|
|
— |
|
|
Weighted average common shares |
|
|
|
|
|
|
|
|
|
outstanding and common share |
|
|
|
|
|
|
|
|
|
equivalents used in diluted EPS |
|
|
44,442 |
|
|
|
43,792 |
|
|
Earnings (loss) per share from continuing operations |
|
|
|
|
|
|
|
|
|
Basic |
|
$ |
0.19 |
|
|
$ |
(0.02 |
) |
|
Diluted |
|
|
0.19 |
|
|
|
(0.02 |
) |
|
|
|
Nine months ended September 30 |
|
|||||
|
In thousands, except per share |
|
2019 |
|
|
2018 |
|
||
|
Income from continuing operations |
|
$ |
19,539 |
|
|
$ |
2,841 |
|
|
Weighted average common shares |
|
|
|
|
|
|
|
|
|
outstanding used in basic EPS |
|
|
44,113 |
|
|
|
43,754 |
|
|
Effect of dilutive SOSARs, |
|
|
|
|
|
|
|
|
|
PSAs and RSUs |
|
|
292 |
|
|
|
— |
|
|
Weighted average common shares |
|
|
|
|
|
|
|
|
|
outstanding and common share |
|
|
|
|
|
|
|
|
|
equivalents used in diluted EPS |
|
|
44,405 |
|
|
|
43,754 |
|
|
Earnings per share from continuing operations |
|
|
|
|
|
|
|
|
|
Basic |
|
$ |
0.44 |
|
|
$ |
0.06 |
|
|
Diluted |
|
|
0.44 |
|
|
|
0.06 |
|
The numerator used to compute income per share from discontinued operations was $3.581 million and $(95.126) million for the third quarter of 2019 and 2018, respectively, and $3.802 million and $(100.353) million for the first nine months of 2019 and 2018, respectively. The denominator used to compute per share amounts of loss from discontinued operations is the same as the denominator used for per share amounts of income from continuing operations.
- 11 -
GLATFELTER
Form 10-Q
The following table sets forth potential common shares outstanding that were not included in the computation of diluted EPS for the periods indicated, because their effect would be anti-dilutive:
|
|
|
September 30 |
|
|||||
|
In thousands |
|
2019 |
|
|
2018 |
|
||
|
Three months ended |
|
|
1,233 |
|
|
|
2,393 |
|
|
Nine months ended |
|
|
1,233 |
|
|
|
2,393 |
|
|
8. |
ACCUMULATED OTHER COMPREHENSIVE INCOME |
The following table sets forth details of the changes in accumulated other comprehensive income (losses) for the three months and nine months ended September 30, 2019 and 2018.
|
In thousands |
Currency translation adjustments |
|
|
Unrealized gain (loss) on cash flow hedges |
|
|
Change in pensions |
|
|
Change in other postretirement defined benefit plans |
|
|
Total |
|
|||||
|
Balance at July 1, 2019 |
$ |
(73,001 |
) |
|
$ |
4,442 |
|
|
$ |
(66,325 |
) |
|
$ |
1,148 |
|
|
$ |
(133,736 |
) |
|
Other comprehensive income (loss) before reclassifications (net of tax) |
|
(17,073 |
) |
|
|
3,596 |
|
|
|
2,449 |
|
|
|
— |
|
|
|
(11,028 |
) |
|
Amounts reclassified from accumulated other comprehensive income (net of tax) |
|
— |
|
|
|
(1,231 |
) |
|
|
592 |
|
|
|
(224 |
) |
|
|
(863 |
) |
|
Net current period other comprehensive income (loss) |
|
(17,073 |
) |
|
|
2,365 |
|
|
|
3,041 |
|
|
|
(224 |
) |
|
|
(11,891 |
) |
|
Balance at September 30, 2019 |
$ |
(90,074 |
) |
|
$ |
6,807 |
|
|
$ |
(63,284 |
) |
|
$ |
924 |
|
|
$ |
(145,627 |
) |
|
|
|
|
|
|
|
|
|
|
|
|
|
|
|
|
|
|
|
|
|
|
Balance at July 1, 2018 |
$ |
(62,315 |
) |
|
$ |
(1,345 |
) |
|
$ |
(115,167 |
) |
|
$ |
4,221 |
|
|
$ |
(174,606 |
) |
|
Other comprehensive income (loss) before reclassifications (net of tax) |
|
(3,217 |
) |
|
|
627 |
|
|
|
12,981 |
|
|
|
4,699 |
|
|
|
15,090 |
|
|
Amounts reclassified from accumulated other comprehensive income (net of tax) |
|
— |
|
|
|
989 |
|
|
|
4,053 |
|
|
|
(161 |
) |
|
|
4,881 |
|
|
Net current period other comprehensive income (loss) |
|
(3,217 |
) |
|
|
1,616 |
|
|
|
17,034 |
|
|
|
4,538 |
|
|
|
19,971 |
|
|
Balance at September 30, 2018 |
$ |
(65,532 |
) |
|
$ |
271 |
|
|
$ |
(98,133 |
) |
|
$ |
8,759 |
|
|
$ |
(154,635 |
) |
|
In thousands |
Currency translation adjustments |
|
|
Unrealized gain (loss) on cash flow hedges |
|
|
Change in pensions |
|
|
Change in other postretirement defined benefit plans |
|
|
Total |
|
|||||
|
Balance at January 1, 2019 |
$ |
(69,622 |
) |
|
$ |
2,199 |
|
|
$ |
(71,431 |
) |
|
$ |
1,414 |
|
|
$ |
(137,440 |
) |
|
Other comprehensive income (loss) before reclassifications (net of tax) |
|
(20,452 |
) |
|
|
7,326 |
|
|
|
7,375 |
|
|
|
— |
|
|
|
(5,751 |
) |
|
Amounts reclassified from accumulated other comprehensive income (net of tax) |
|
— |
|
|
|
(2,718 |
) |
|
|
772 |
|
|
|
(490 |
) |
|
|
(2,436 |
) |
|
Net current period other comprehensive income (loss) |
|
(20,452 |
) |
|
|
4,608 |
|
|
|
8,147 |
|
|
|
(490 |
) |
|
|
(8,187 |
) |
|
Balance at September 30, 2019 |
$ |
(90,074 |
) |
|
$ |
6,807 |
|
|
$ |
(63,284 |
) |
|
$ |
924 |
|
|
$ |
(145,627 |
) |
|
|
|
|
|
|
|
|
|
|
|
|
|
|
|
|
|
|
|
|
|
|
Balance at January 1, 2018 |
$ |
(41,839 |
) |
|
$ |
(4,092 |
) |
|
$ |
(98,295 |
) |
|
$ |
3,551 |
|
|
$ |
(140,675 |
) |
|
Amount reclassified for adoption of ASU No. 2018-02 |
|
|
|
|
|
|
|
|
|
(23,297 |
) |
|
|
999 |
|
|
$ |
(22,298 |
) |
|
Balance as adjusted at January 1, 2018 |
|
(41,839 |
) |
|
|
(4,092 |
) |
|
|
(121,592 |
) |
|
|
4,550 |
|
|
|
(162,973 |
) |
|
Other comprehensive income (loss) before reclassifications (net of tax) |
|
(23,693 |
) |
|
|
778 |
|
|
|
12,981 |
|
|
|
4,699 |
|
|
|
(5,235 |
) |
|
Amounts reclassified from accumulated other comprehensive income (net of tax) |
|
— |
|
|
|
3,585 |
|
|
|
10,478 |
|
|
|
(490 |
) |
|
|
13,573 |
|
|
Net current period other comprehensive income (loss) |
|
(23,693 |
) |
|
|
4,363 |
|
|
|
23,459 |
|
|
|
4,209 |
|
|
|
8,338 |
|
|
Balance at September 30, 2018 |
$ |
(65,532 |
) |
|
$ |
271 |
|
|
$ |
(98,133 |
) |
|
$ |
8,759 |
|
|
$ |
(154,635 |
) |
- 12 -
GLATFELTER
Form 10-Q
Reclassifications out of accumulated other comprehensive income and into the condensed consolidated statements of income were as follows:
|
|
|
Three months ended September 30 |
|
|
Nine months ended September 30 |
|
|
|
||||||||||
|
In thousands |
|
2019 |
|
|
2018 |
|
|
2019 |
|
|
2018 |
|
|
|
||||
|
Description |
|
|
|
|
|
|
|
|
|
|
|
|
|
|
|
|
|
Line Item in Statements of Income |
|
Cash flow hedges (Note 17) |
|
|
|
|
|
|
|
|
|
|
|
|
|
|
|
|
|
|
|
(Gains) losses on cash flow hedges |
|
$ |
(1,738 |
) |
|
$ |
1,344 |
|
|
$ |
(3,783 |
) |
|
$ |
4,939 |
|
|
Costs of products sold |
|
Tax expense (benefit) |
|
|
507 |
|
|
|
(355 |
) |
|
|
1,065 |
|
|
|
(1,354 |
) |
|
Income tax provision |
|
Net of tax |
|
|
(1,231 |
) |
|
|
989 |
|
|
|
(2,718 |
) |
|
|
3,585 |
|
|
|
|
Retirement plan obligations (Note 11) |
|
|
|
|
|
|
|
|
|
|
|
|
|
|
|
|
|
|
|
Amortization of deferred benefit pension plans |
|
|
|
|
|
|
|
|
|
|
|
|
|
|
|
|
|
|
|
Prior service costs |
|
|
64 |
|
|
|
5 |
|
|
|
152 |
|
|
|
16 |
|
|
Other, net |
|
Actuarial losses |
|
|
819 |
|
|
|
2,060 |
|
|
|
2,383 |
|
|
|
6,179 |
|
|
Other, net |
|
Discontinued operations amortization of defined benefit pension plans |
|
|
— |
|
|
|
2,171 |
|
|
|
— |
|
|
|
6,515 |
|
|
Discontinued operations |
|
Curtailment and Settlement recognition |
|
|
— |
|
|
|
1,805 |
|
|
|
— |
|
|
|
1,805 |
|
|
Discontinued operations |
|
|
|
|
883 |
|
|
|
6,041 |
|
|
|
2,535 |
|
|
|
14,515 |
|
|
|
|
Tax benefit |
|
|
(291 |
) |
|
|
(1,988 |
) |
|
|
(1,763 |
) |
|
|
(4,037 |
) |
|
Income tax provision |
|
Net of tax |
|
|
592 |
|
|
|
4,053 |
|
|
|
772 |
|
|
|
10,478 |
|
|
|
|
Amortization of deferred benefit other plans |
|
|
|
|
|
|
|
|
|
|
|
|
|
|
|
|
|
|
|
Prior service costs |
|
|
(2 |
) |
|
|
— |
|
|
|
(7 |
) |
|
|
— |
|
|
Other, net |
|
Actuarial gains |
|
|
(293 |
) |
|
|
(16 |
) |
|
|
(639 |
) |
|
|
(49 |
) |
|
Other, net |
|
Discontinued operations amortization of defined benefit other plans |
|
|
— |
|
|
|
(201 |
) |
|
|
— |
|
|
|
(604 |
) |
|
Discontinued operations |
|
|
|
|
(295 |
) |
|
|
(217 |
) |
|
|
(646 |
) |
|
|
(653 |
) |
|
|
|
Tax expense |
|
|
71 |
|
|
|
56 |
|
|
|
156 |
|
|
|
163 |
|
|
Income tax provision |
|
Net of tax |
|
|
(224 |
) |
|
|
(161 |
) |
|
|
(490 |
) |
|
|
(490 |
) |
|
|
|
Total reclassifications, net of tax |
|
$ |
(863 |
) |
|
$ |
4,881 |
|
|
$ |
(2,436 |
) |
|
$ |
13,573 |
|
|
|
|
9. |
INCOME TAXES |
Income taxes are recognized for the amount of taxes payable or refundable for the current year and deferred tax liabilities and assets for the future tax consequences of events that have been recognized in our consolidated financial statements or tax returns. The effects of income taxes are measured based on enacted tax laws and rates.
We elect to account for the tax associated with the Global Intangible Low-Taxed Income (GILTI) provision of the 2017 Tax Cuts and Jobs Act in the period in which it is incurred. The GILTI provisions require entities to include in its U.S. income tax return foreign subsidiary earnings in excess of an allowable return on the foreign subsidiary’s tangible assets.
For the nine months ended September 30, 2019, our effective tax rate increased by approximately 6% as a result of the GILTI provisions due to our U.S. federal tax loss carryforward position which limits our ability to recognize the associated foreign tax credits and a deduction of up to 50% of the GILTI income. Due to our U.S. federal tax loss carryforward position, there is no impact to cash taxes related to the GILTI provisions.
For the nine months ended September 30, 2019, we recorded an additional valuation allowance of $0.3 million against our net deferred tax assets primarily due to uncertainty regarding our ability to utilize federal net operating losses and credit carryforwards. In assessing the need for a valuation allowance, we consider all available positive and negative evidence in our analysis. Based on this analysis, we recorded a valuation allowance for the portion of deferred tax assets where the weight of the evidence indicated it is more likely than not that the deferred tax assets will not be realized.
As of September 30, 2019 and December 31, 2018, we had $29.5 million and $29.6 million, respectively, of gross unrecognized tax benefits. As of September 30, 2019, if such benefits were to be recognized, approximately $18.6 million would be recorded as a component of income tax expense, thereby affecting our effective tax rate.
- 13 -
GLATFELTER
Form 10-Q
We, or one of our subsidiaries, file income tax returns with the United States Internal Revenue Service, as well as various state and foreign authorities.
The following table summarizes, by major jurisdiction, tax years that remain subject to examination:
|
|
Open Tax Years |
||
|
Jurisdiction |
Examinations not yet initiated |
|
Examination in progress |
|
United States |
|
|
|
|
Federal |
2016 - 2018 |
|
N/A |
|
State |
2014 - 2018 |
|
N/A |
|
Canada(1) |
2012-2013; 2018 |
|
2014 - 2017 |
|
Germany(1) |
2016 - 2018 |
|
2012 - 2015 |
|
France |
2018 |
|
N/A |
|
United Kingdom |
2017 - 2018 |
|
N/A |
|
Philippines |
2018 |
|
2016, 2017 |
|
(1) |
includes provincial or similar local jurisdictions, as applicable |
The amount of income taxes we pay is subject to ongoing audits by federal, state and foreign tax authorities, which often result in proposed assessments. Management performs a comprehensive review of its global tax positions on a quarterly basis and accrues amounts for uncertain tax positions. Based on these reviews and the result of discussions and resolutions of matters with certain tax authorities and the closure of tax years subject to tax audit, reserves are adjusted as necessary. However, future results may include favorable or unfavorable adjustments to our estimated tax liabilities in the period the assessments are determined or resolved or as such statutes are closed. Due to potential for resolution of federal, state and foreign examinations, and the lapse of various statutes of limitation, it is reasonably possible our gross unrecognized tax benefits balance may decrease within the next twelve months by a range of zero to $4.3 million. Substantially all this range relates to tax positions taken in Germany and the U.S.
We recognize interest and penalties related to uncertain tax positions as income tax expense. The following table summarizes information included in continuing operations related to interest and penalties on uncertain tax positions:
|
|
Nine months ended September 30 |
|
|||||
|
In millions |
2019 |
|
|
2018 |
|
||
|
Interest expense (income) |
$ |
— |
|
|
$ |
0.3 |
|
|
Penalties |
|
— |
|
|
|
— |
|
|
|
September 30 |
|
|
December 31 |
|
||
|
|
2019 |
|
|
2018 |
|
||
|
Accrued interest payable |
$ |
1.1 |
|
|
$ |
1.1 |
|
|
10. |
STOCK-BASED COMPENSATION |
The P. H. Glatfelter Amended and Restated Long Term Incentive Plan (the “LTIP”) provides for the issuance of Glatfelter common stock to eligible participants in the form of restricted stock units, restricted stock awards, non-qualified stock options, performance shares, incentive stock options and performance units.
Pursuant to terms of the LTIP, we have issued to eligible participants restricted stock units, performance share awards and stock only stock appreciation rights.
Restricted Stock Units (“RSU”) and Performance Share Awards (“PSAs”) Awards of RSUs and PSAs are made under our LTIP. The RSUs vest on the passage of time, generally on a graded scale over a three, four, and five-year period, or in certain instances the RSUs were issued with five-year cliff vesting. PSAs are issued to participants and vesting is based on achievement of cumulative financial performance targets covering a two-year period followed by an additional one-year service period. In addition, beginning in 2018, PSA awards include a modifier based on our three-year total shareholder return (“TSR”) relative to the TSR of the S&P SmallCap 600 Index. The performance measures include a minimum, target and maximum performance level providing the
- 14 -
GLATFELTER
Form 10-Q
grantees an opportunity to receive more or less shares than targeted depending on actual financial performance. In addition, the number of shares earned may be further increased or decreased based on our TSR relative to the S&P SmallCap 600 Index.
For RSUs, the grant date fair value of the awards, which is equal to the closing price per common share on the date of the award, is used to determine the amount of expense to be recognized over the applicable service period. For PSAs, the grant date fair value is estimated using a lattice model. The significant inputs include the stock price, volatility, dividend yield, and risk-free rate of return. Settlement of RSUs and PSAs will be made in shares of our common stock currently held in treasury.
The following table summarizes RSU and PSA activity during periods indicated:
|
Units |
|
2019 |
|
|
2018 |
|
||
|
Balance at January 1, |
|
|
756,786 |
|
|
|
929,386 |
|
|
Granted |
|
|
484,108 |
|
|
|
398,005 |
|
|
Forfeited |
|
|
(158,767 |
) |
|
|
(73,673 |
) |
|
Shares delivered |
|
|
(163,078 |
) |
|
|
(151,371 |
) |
|
Balance at September 30, |
|
|
919,049 |
|
|
|
1,102,347 |
|
The amount granted in 2019 and 2018 includes 218,422 and 184,121, respectively, of PSAs exclusive of reinvested dividends.
The following table sets forth aggregate RSU and PSA compensation expense included in continuing operations for the periods indicated:
|
|
|
September 30 |
|
|||||
|
In thousands |
|
2019 |
|
|
2018 |
|
||
|
Three months ended |
|
$ |
1,048 |
|
|
$ |
1,022 |
|
|
Nine months ended |
|
|
2,643 |
|
|
|
4,283 |
|
Stock Only Stock Appreciation Rights (“SOSARs”) Under terms of the SOSAR, a recipient receives the right to a payment in the form of shares of common stock equal to the difference, if any, in the fair market value of one share of common stock at the time of exercising the SOSAR and the exercise price. The SOSARs vest ratably over a three year period and have a term of ten years. No SOSARs were awarded since 2016.
The following table sets forth information related to outstanding SOSARS:
|
|
|
2019 |
|
|
2018 |
|
||||||||||
|
SOSARS |
|
Shares |
|
|
Wtd Avg Exercise Price |
|
|
Shares |
|
|
Wtd Avg Exercise Price |
|
||||
|
Outstanding at January 1, |
|
|
2,334,742 |
|
|
$ |
18.08 |
|
|
|
2,561,846 |
|
|
$ |
17.87 |
|
|
Granted |
|
|
— |
|
|
|
— |
|
|
|
— |
|
|
|
— |
|
|
Exercised |
|
|
(441,920 |
) |
|
|
14.31 |
|
|
|
(158,545 |
) |
|
|
13.31 |
|
|
Canceled / forfeited |
|
|
(446,435 |
) |
|
|
21.06 |
|
|
|
(51,285 |
) |
|
|
22.35 |
|
|
Outstanding at September 30, |
|
|
1,446,387 |
|
|
$ |
19.31 |
|
|
|
2,352,016 |
|
|
$ |
18.08 |
|
The following table sets forth SOSAR compensation expense included in continuing operations for the periods indicated:
|
|
|
September 30 |
|
|||||
|
In thousands |
|
2019 |
|
|
2018 |
|
||
|
Three months ended |
|
$ |
— |
|
|
$ |
67 |
|
|
Nine months ended |
|
|
40 |
|
|
|
311 |
|
- 15 -
GLATFELTER
Form 10-Q
|
11. |
RETIREMENT PLANS AND OTHER POST-RETIREMENT BENEFITS |
The following tables provide information with respect to the net periodic costs of our pension and post-retirement medical benefit plans included in continuing operations.
|
|
|
Three months ended September 30 |
|
||||||
|
In thousands |
|
2019 |
|
|
|
2018 |
|
||
|
Pension Benefits |
|
|
|
|
|
|
|
|
|
|
Service cost |
|
$ |
216 |
|
|
|
$ |
595 |
|
|
Interest cost |
|
|
3,287 |
|
|
|
|
3,241 |
|
|
Expected return on plan assets |
|
|
(3,895 |
) |
|
|
|
(5,531 |
) |
|
Amortization of prior service cost |
|
|
64 |
|
|
|
|
5 |
|
|
Amortization of unrecognized loss |
|
|
819 |
|
|
|
|
2,060 |
|
|
Total net periodic benefit cost |
|
$ |
491 |
|
|
|
$ |
370 |
|
|
|
|
|
|
|
|
|
|
|
|
|
Other Benefits |
|
|
|
|
|
|
|
|
|
|
Service cost |
|
$ |
7 |
|
|
|
$ |
16 |
|
|
Interest cost |
|
|
67 |
|
|
|
|
80 |
|
|
Amortization of prior service credit |
|
|
(2 |
) |
|
|
|
— |
|
|
Amortization of actuarial gain |
|
|
(293 |
) |
|
|
|
(16 |
) |
|
Total net periodic benefit cost |
|
$ |
(221 |
) |
|
|
$ |
80 |
|
|
|
|
Nine months ended September 30 |
|
||||||
|
In thousands |
|
2019 |
|
|
|
2018 |
|
||
|
Pension Benefits |
|
|
|
|
|
|
|
|
|
|
Service cost |
|
$ |
1,073 |
|
|
|
$ |
1,784 |
|
|
Interest cost |
|
|
10,074 |
|
|
|
|
9,723 |
|
|
Expected return on plan assets |
|
|
(11,290 |
) |
|
|
|
(16,592 |
) |
|
Amortization of prior service cost |
|
|
152 |
|
|
|
|
16 |
|
|
Amortization of unrecognized loss |
|
|
2,383 |
|
|
|
|
6,179 |
|
|
Total net periodic benefit cost |
|
$ |
2,392 |
|
|
|
$ |
1,110 |
|
|
|
|
|
|
|
|
|
|
|
|
|
Other Benefits |
|
|
|
|
|
|
|
|
|
|
Service cost |
|
$ |
25 |
|
|
|
$ |
46 |
|
|
Interest cost |
|
|
235 |
|
|
|
|
239 |
|
|
Amortization of prior service credit |
|
|
(7 |
) |
|
|
|
— |
|
|
Amortization of actuarial gain |
|
|
(639 |
) |
|
|
|
(49 |
) |
|
Total net periodic benefit cost |
|
$ |
(386 |
) |
|
|
$ |
236 |
|
In April 2019, we informed participants that our qualified pension plan benefits would be frozen as of May 31, 2019 and the plan was terminated June 30, 2019. We replaced this benefit for active employees with an enhanced defined contribution plan. In connection with the termination, we remeasured the pension liability and recognized a gain of $1.9 million in the second quarter of 2019 as an adjustment to other comprehensive income (loss).
|
12. |
INVENTORIES |
Inventories, net of reserves, were as follows:
|
|
|
September 30 |
|
|
December 31 |
|
||
|
In thousands |
|
2019 |
|
|
2018 |
|
||
|
Raw materials |
|
$ |
55,357 |
|
|
$ |
50,205 |
|
|
In-process and finished |
|
|
97,409 |
|
|
|
84,894 |
|
|
Supplies |
|
|
37,808 |
|
|
|
38,312 |
|
|
Total |
|
$ |
190,574 |
|
|
$ |
173,411 |
|
- 16 -
GLATFELTER
Form 10-Q
|
13. |
CAPITALIZED INTEREST |
The following table sets forth details of interest incurred, capitalized and expensed included in continuing operations:
|
|
|
Three months ended September 30 |
|
|
Nine months ended September 30 |
|
||||||||||
|
In thousands |
|
2019 |
|
|
2018 |
|
|
2019 |
|
|
2018 |
|
||||
|
Interest cost incurred |
|
$ |
1,902 |
|
|
$ |
3,965 |
|
|
$ |
8,513 |
|
|
$ |
11,633 |
|
|
Interest capitalized |
|
|
— |
|
|
|
— |
|
|
|
— |
|
|
|
396 |
|
|
Interest expense |
|
$ |
1,902 |
|
|
$ |
3,965 |
|
|
$ |
8,513 |
|
|
$ |
11,237 |
|
Capitalized interest relates to spending for the Airlaid capacity expansion project.
|
14. |
LEASES |
We enter into a variety of arrangements in which we are the lessee for the use of automobiles, forklifts and other production equipment, production facilities, warehouses and office space. We determine if an arrangement contains a lease at inception. All our lease arrangements are operating leases and are recorded in the condensed consolidated balance sheet under the caption “Other assets” and the lease obligation is under “Other current liabilities” and “Other long-term liabilities.” We currently do not have any finance leases.
Operating lease right of use (“ROU”) assets and operating lease liabilities are recognized based on the present value of the future minimum lease payments over the lease term at commencement date. ROU assets also include any initial direct costs incurred and any lease payments made at or before the lease commencement date, less lease incentives received. We use our incremental borrowing rate based on information available at the commencement date in determining the lease liabilities as our leases generally do not provide an implicit rate. Lease terms may include options to extend or terminate when we are reasonably certain that the option will be exercised. Lease expense is recognized on a straight-line basis over the lease term.
We also have arrangements with both lease and non-lease components. The Company elected the practical expedient not to separate non-lease components from lease components for the Company’s real estate and automobile leases. We elected to apply the short-term lease measurement and recognition exemption in which ROU assets and lease liabilities are not recognized for arrangements less than twelve months in duration.
At September 30, 2019, the ROU assets and corresponding lease obligation included in our condensed consolidated balance sheet totaled $11.1 million and had a weighted average remaining maturity of 36 months. The weighted average discount rate used to value the leases at inception was 3.02%. We recognized $4.4 million of operating lease expense during the first nine months of 2019.
The following table sets forth required minimum lease payments for the periods indicated:
|
|
|
September 30 |
|
|
December 31 |
|
||
|
In thousands |
|
|
2019 |
|
|
|
2018 |
|
|
2019 |
|
$ |
1,342 |
|
|
$ |
5,020 |
|
|
2020 |
|
|
4,502 |
|
|
|
3,861 |
|
|
2021 |
|
|
3,025 |
|
|
|
2,515 |
|
|
2022 |
|
|
1,583 |
|
|
|
1,426 |
|
|
2023 |
|
|
568 |
|
|
|
584 |
|
|
Thereafter |
|
|
335 |
|
|
|
383 |
|
- 17 -
GLATFELTER
Form 10-Q
|
15. |
LONG-TERM DEBT |
Long-term debt is summarized as follows:
|
|
|
September 30 |
|
|
|
December 31 |
|
||
|
In thousands |
|
2019 |
|
|
|
2018 |
|
||
|
Revolving credit facility, due Mar. 2020 |
|
$ |
— |
|
|
|
$ |
114,495 |
|
|
Revolving credit facility, due Feb. 2024 |
|
|
79,490 |
|
|
|
|
— |
|
|
5.375% Notes, due Oct. 2020 |
|
|
— |
|
|
|
|
250,000 |
|
|
Term loan, due Feb. 2024 |
|
|
236,564 |
|
|
|
|
— |
|
|
2.40% Term Loan, due Jun. 2022 |
|
|
4,278 |
|
|
|
|
5,725 |
|
|
2.05% Term Loan, due Mar. 2023 |
|
|
20,342 |
|
|
|
|
25,972 |
|
|
1.30% Term Loan, due Jun. 2023 |
|
|
5,834 |
|
|
|
|
7,361 |
|
|
1.55% Term Loan, due Sep. 2025 |
|
|
8,006 |
|
|
|
|
9,470 |
|
|
Total long-term debt |
|
|
354,514 |
|
|
|
|
413,023 |
|
|
Less current portion |
|
|
(22,235 |
) |
|
|
|
(10,785 |
) |
|
Unamortized deferred issuance costs |
|
|
(2,508 |
) |
|
|
|
(1,276 |
) |
|
Long-term debt, net of current portion |
|
$ |
329,771 |
|
|
|
$ |
400,962 |
|
On February 8, 2019, we entered into an amended and restated $400 million Revolving Credit Facility and a €220 million Term Loan with a consortium of banks (together, the “Credit Agreement”). The proceeds of the Term Loan due Feb. 2024 were used to redeem in its entirety the 5.375% Notes. The principal amount of the Term Loan amortizes in consecutive quarterly installments of principal, with each such quarterly installment to be in an amount equal to 1.25% of the Term Loan funded, commencing on July 1, 2019 and continuing quarterly thereafter. The €220 million Term Loan is designated as a net investment hedge of our Euro functional currency foreign subsidiaries. During the first nine months of 2019, we recognized a pre-tax gain of $9.0 million from changes in currency exchange rates through Other Comprehensive Income (Loss).
For all US dollar denominated borrowings under the Revolving Credit Facility, the borrowing rate is, at our option, either, (a) the bank’s base rate which is equal to the greater of i) the prime rate; ii) the federal funds rate plus 50 basis points; or iii) the Euro-rate plus 100 basis points plus an applicable spread over either i), ii) or iii) ranging from 12.5 basis points to 100 basis points based on the Company’s leverage ratio and its corporate credit ratings determined by Standard & Poor’s Rating Services and Moody’s Investor Service, Inc. (the “Corporate Credit Rating”); or (b) the Euro-rate plus an applicable margin ranging from 112.5 basis points to 200 basis points based on the Company’s leverage ratio and the Corporate Credit Rating. For non-US dollar denominated borrowings, the borrowing rate is, at our option, based on (b) above or for Euro denominated borrowings, the Euro Interbank Offering Rate (“EURIBOR”) plus an applicable margin ranging from 112.5 basis points to 200 basis points based on the Company’s leverage ratio and the Corporate Credit Rating.
In October 2019, we entered into a €180 million notional value floating-to-fixed interest rate swap agreement with certain financial institutions. Under the terms of the swap, we will pay a fixed interest rate of the applicable margin plus 0.0395% on €180 million of the underlying variable rate term loan. We will receive the greater of 0.00% or EURIBOR.
The Credit Agreement contains a number of customary covenants for financings of this type that, among other things, restrict our ability to dispose of or create liens on assets, incur additional indebtedness, repay other indebtedness, limits certain intercompany financing arrangements, make acquisitions and engage in mergers or consolidations. We are also required to comply with specified financial tests and ratios including: i) maximum net debt to EBITDA ratio (the “leverage ratio”); and ii) a consolidated EBITDA to interest expense ratio. The most restrictive of our covenants is a maximum leverage ratio of 4.0x provided that such ratio increases to 4.5x during the period of four fiscal quarters immediately following a material acquisition such as Steinfurt. As of September 30, 2019, the leverage ratio, as calculated in accordance with the definition in our Credit Agreement, was 2.9x. A breach of these requirements would give rise to certain remedies under the Revolving Credit Facility, among which are the termination of the agreement and accelerated repayment of the outstanding borrowings plus accrued and unpaid interest under the Credit Agreement.
All remaining principal outstanding and accrued interest under the Credit Agreement will be due and payable on February 8, 2024.
- 18 -
GLATFELTER
Form 10-Q
Glatfelter Gernsbach GmbH & Co. KG (“Gernsbach”), a wholly-owned subsidiary of ours, entered into a series of borrowing agreements with IKB Deutsche Industriebank AG, Düsseldorf (“IKB”) as summarized below:
|
Amounts in thousands |
|
Original Principal |
|
|
Interest Rate |
|
|
Maturity |
||
|
Borrowing date |
|
|
|
|
|
|
|
|
|
|
|
Apr. 11, 2013 |
|
€ |
42,700 |
|
|
|
2.05 |
% |
|
Mar. 2023 |
|
Sep. 4, 2014 |
|
|
10,000 |
|
|
|
2.40 |
% |
|
Jun. 2022 |
|
Oct. 10, 2015 |
|
|
2,608 |
|
|
|
1.55 |
% |
|
Sep. 2025 |
|
Apr. 26, 2016 |
|
|
10,000 |
|
|
|
1.30 |
% |
|
Jun. 2023 |
|
May 4, 2016 |
|
|
7,195 |
|
|
|
1.55 |
% |
|
Sep. 2025 |
Each of the borrowings require quarterly repayments of principal and interest and provide for representations, warranties and covenants customary for financings of these types. The financial covenants contained in each of the IKB loans, which relate to the minimum ratio of consolidated EBITDA to consolidated interest expense and the maximum ratio of consolidated total net debt to consolidated adjusted EBITDA, are calculated by reference to our Credit Agreement.
P. H. Glatfelter Company guarantees all debt obligations of its subsidiaries. All such obligations are recorded in these condensed consolidated financial statements.
Letters of credit issued to us by certain financial institutions totaled $7.4 million as of September 30, 2019 and $5.2 million as of December 31, 2018. The letters of credit, which reduce amounts available under our Revolving Credit Facility, primarily provide financial assurances for the benefit of certain state workers compensation insurance agencies in conjunction with our self-insurance program and for performance of certain remediation activity related to the Fox River matter. We bear the credit risk on this amount to the extent that we do not comply with the provisions of certain agreements. No amounts are outstanding under the letters of credit.
|
16. |
FAIR VALUE OF FINANCIAL INSTRUMENTS |
The amounts reported on the condensed consolidated balance sheets for cash and cash equivalents, accounts receivable and accounts payable approximate fair value. The following table sets forth carrying value and fair value of long-term debt:
|
|
September 30, 2019 |
|
|
December 31, 2018 |
|
||||||||||
|
In thousands |
Carrying Value |
|
|
Fair Value |
|
|
Carrying Value |
|
|
Fair Value |
|
||||
|
Variable rate debt |
$ |
79,490 |
|
|
$ |
79,490 |
|
|
$ |
114,495 |
|
|
$ |
114,495 |
|
|
Fixed-rate bonds |
|
— |
|
|
|
— |
|
|
|
250,000 |
|
|
|
249,010 |
|
|
Term loan, due Feb. 2024 |
|
236,564 |
|
|
|
236,564 |
|
|
|
— |
|
|
|
— |
|
|
2.40% Term loan |
|
4,278 |
|
|
|
4,371 |
|
|
|
5,725 |
|
|
|
5,836 |
|
|
2.05% Term loan |
|
20,342 |
|
|
|
20,757 |
|
|
|
25,972 |
|
|
|
26,346 |
|
|
1.30% Term Loan |
|
5,834 |
|
|
|
5,873 |
|
|
|
7,361 |
|
|
|
7,341 |
|
|
1.55% Term loan |
|
8,006 |
|
|
|
8,142 |
|
|
|
9,470 |
|
|
|
9,453 |
|
|
Total |
$ |
354,514 |
|
|
$ |
355,197 |
|
|
$ |
413,023 |
|
|
$ |
412,481 |
|
The values set forth above are based on observable inputs and other relevant market data (Level 2). The fair value of financial derivatives is set forth below in Note 17.
|
17. |
FINANCIAL DERIVATIVES AND HEDGING ACTIVITIES |
As part of our overall risk management practices, we enter into financial derivatives primarily designed to either i) hedge foreign currency risks associated with forecasted transactions (“cash flow hedges”); or ii) mitigate the impact that changes in currency exchange rates have on intercompany financing transactions and foreign currency denominated receivables and payables (“foreign currency hedges”).
Derivatives Designated as Hedging Instruments - Cash Flow Hedges We use currency forward contracts as cash flow hedges to manage our exposure to fluctuations in the currency exchange rates on certain forecasted production costs or capital expenditures expected to be incurred. Currency forward contracts involve fixing the exchange for delivery of a specified amount of foreign
- 19 -
GLATFELTER
Form 10-Q
currency on a specified date. As of September 30, 2019, the maturity of currency forward contracts ranged from one month to 18 months.
We designate certain currency forward contracts as cash flow hedges of forecasted raw material purchases, certain production costs or capital expenditures with exposure to changes in foreign currency exchange rates. The effective portion of changes in the fair value of derivatives designated and that qualify as cash flow hedges of foreign exchange risk is deferred as a component of accumulated other comprehensive income in the accompanying condensed consolidated balance sheets. With respect to hedges of forecasted raw material purchases or production costs, the amount deferred is subsequently reclassified into costs of products sold in the period that inventory produced using the hedged transaction affects earnings. For hedged capital expenditures, deferred gains or losses are reclassified and included in the historical cost of the capital asset and subsequently affect earnings as depreciation is recognized.
We had the following outstanding derivatives that were used to hedge foreign exchange risks associated with forecasted transactions and designated as hedging instruments:
|
In thousands |
|
September 30, 2019 |
|
|
December 31, 2018 |
|
||
|
Derivative |
|
|
|
|
|
|
|
|
|
Sell/Buy - sell notional |
|
|
|
|
|
|
|
|
|
Philippine Peso / British Pound |
|
|
— |
|
|
|
13,140 |
|
|
Philippine Peso / Euro |
|
|
6,784 |
|
|
|
16,446 |
|
|
Euro / British Pound |
|
|
17,428 |
|
|
|
15,250 |
|
|
U.S. Dollar / Euro |
|
|
6,859 |
|
|
|
88 |
|
|
U.S. Dollar / Canadian Dollar |
|
|
1,850 |
|
|
|
— |
|
|
|
|
|
|
|
|
|
|
|
|
Sell/Buy - buy notional |
|
|
|
|
|
|
|
|
|
Euro / Philippine Peso |
|
|
889,778 |
|
|
|
1,069,006 |
|
|
British Pound / Philippine Peso |
|
|
1,083,507 |
|
|
|
980,137 |
|
|
Euro / U.S. Dollar |
|
|
87,872 |
|
|
|
76,417 |
|
|
U.S. Dollar / Canadian Dollar |
|
|
34,934 |
|
|
|
35,154 |
|
|
Canadian Dollar / U.S. Dollar |
|
|
1,850 |
|
|
|
— |
|
|
British Pound / Euro |
|
|
— |
|
|
|
216 |
|
Derivatives Not Designated as Hedging Instruments - Foreign Currency Hedges We also entered into forward foreign exchange contracts to mitigate the impact changes in currency exchange rates have on balance sheet monetary assets and liabilities. None of these contracts are designated as hedges for financial accounting purposes and, accordingly, changes in value of the foreign exchange forward contracts and in the offsetting underlying on-balance-sheet transactions are reflected in the accompanying condensed consolidated statements of income under the caption “Other, net.”
The following sets forth derivatives used to mitigate the impact changes in currency exchange rates have on balance sheet monetary assets and liabilities:
|
In thousands |
|
September 30, 2019 |
|
|
December 31, 2018 |
|
||
|
Derivative |
|
|
|
|
|
|
|
|
|
Sell/Buy - sell notional |
|
|
|
|
|
|
|
|
|
U.S. Dollar / British Pound |
|
|
26,000 |
|
|
|
25,500 |
|
|
British Pound / Euro |
|
|
3,000 |
|
|
|
2,000 |
|
|
|
|
|
|
|
|
|
|
|
|
Sell/Buy - buy notional |
|
|
|
|
|
|
|
|
|
Euro / U.S. Dollar |
|
|
12,000 |
|
|
|
11,000 |
|
|
British Pound / Euro |
|
|
9,000 |
|
|
|
8,000 |
|
These contracts have maturities of one month from the date originally entered into.
- 20 -
GLATFELTER
Form 10-Q
Fair Value Measurements The following table summarizes the fair values of derivative instruments for the period indicated and the line items in the accompanying condensed consolidated balance sheets where the instruments are recorded:
|
In thousands |
|
September 30 2019 |
|
|
December 31 2018 |
|
|
September 30 2019 |
|
|
December 31 2018 |
|
||||
|
|
|
Prepaid Expenses and Other |
|
|
Other |
|
||||||||||
|
Balance sheet caption |
|
Current Assets |
|
|
Current Liabilities |
|
||||||||||
|
Designated as hedging: |
|
|
|
|
|
|
|
|
|
|
|
|
|
|
|
|
|
Forward foreign currency exchange contracts |
|
$ |
7,679 |
|
|
$ |
4,381 |
|
|
$ |
220 |
|
|
$ |
1,548 |
|
|
Not designated as hedging: |
|
|
|
|
|
|
|
|
|
|
|
|
|
|
|
|
|
Forward foreign currency exchange contracts |
|
$ |
343 |
|
|
$ |
103 |
|
|
$ |
320 |
|
|
$ |
122 |
|
The amounts set forth in the table above represent the net asset or liability giving effect to rights of offset with each counterparty. The effect of netting the amounts presented above did not have a material effect on our consolidated financial position.
The following table summarizes the amount of income or (loss) from derivative instruments recognized in our results of operations for the periods indicated and the line items in the accompanying condensed consolidated statements of income where the results are recorded:
|
|
|
|
|
Three months ended September 30 |
|
|
Nine months ended September 30 |
|
||||||||||
|
In thousands |
|
|
|
2019 |
|
|
2018 |
|
|
2019 |
|
|
2018 |
|
||||
|
Designated as hedging: |
|
|
|
|
|
|
|
|
|
|
|
|
|
|
|
|
|
|
|
Forward foreign currency exchange contracts: |
|
|
|
|
|
|
|
|
|
|
|
|
|
|
|
|
|
|
|
Effective portion – cost of products sold |
|
|
|
$ |
1,738 |
|
|
$ |
(1,344 |
) |
|
$ |
3,783 |
|
|
$ |
(4,939 |
) |
|
|
|
|
|
|
|
|
|
|
|
|
|
|
|
|
|
|
|
|
|
Ineffective portion – other – net |
|
|
|
|
— |
|
|
|
207 |
|
|
|
— |
|
|
|
(5 |
) |
|
Not designated as hedging: |
|
|
|
|
|
|
|
|
|
|
|
|
|
|
|
|
|
|
|
Forward foreign currency exchange contracts: |
|
|
|
|
|
|
|
|
|
|
|
|
|
|
|
|
|
|
|
Other – net |
|
|
|
$ |
(511 |
) |
|
$ |
(477 |
) |
|
$ |
(483 |
) |
|
$ |
(1,078 |
) |
The impact of activity not designated as hedging was substantially all offset by the remeasurement of the underlying on-balance-sheet item.
The fair value hierarchy consists of three broad levels, which gives the highest priority to unadjusted quoted prices in active markets for identical assets or liabilities (Level 1) and the lowest priority to unobservable inputs (Level 3).
The fair values of the foreign exchange forward contracts are considered to be Level 2. Foreign currency forward contracts are valued using foreign currency forward and interest rate curves. The fair value of each contract is determined by comparing the contract rate to the forward rate and discounting to present value. Contracts in a gain position are recorded in the condensed consolidated balance sheets under the caption “Prepaid expenses and other current assets” and the value of contracts in a loss position is recorded under the caption “Other current liabilities.”
A rollforward of fair value amounts recorded as a component of accumulated other comprehensive income (loss), before taxes, is as follows:
|
In thousands |
|
2019 |
|
|
2018 |
|
||
|
Balance at January 1, |
|
$ |
3,004 |
|
|
$ |
(5,640 |
) |
|
Deferred gains on cash flow hedges |
|
|
10,020 |
|
|
|
1,142 |
|
|
Reclassified to earnings |
|
|
(3,783 |
) |
|
|
4,939 |
|
|
Balance at September 30, |
|
$ |
9,241 |
|
|
$ |
441 |
|
We expect substantially all of the amounts recorded as a component of accumulated other comprehensive income will be recorded as a component of the capital asset or realized in results of operations within the next 12 to 18 months and the amount ultimately recognized will vary depending on actual market rates.
- 21 -
GLATFELTER
Form 10-Q
Credit risk related to derivative activity arises in the event the counterparty fails to meet its obligations to us. This exposure is generally limited to the amounts, if any, by which the counterparty’s obligations exceed our obligation to them. Our policy is to enter into contracts only with financial institutions which meet certain minimum credit ratings.
|
18. |
COMMITMENTS, CONTINGENCIES AND LEGAL PROCEEDINGS |
Fox River - Neenah, Wisconsin
Background. We previously reported we faced significant uncertainties associated with environmental claims arising out of the presence of polychlorinated biphenyls (“PCBs”) in sediments in the lower Fox River, on which our former Neenah facility was located, and in the Bay of Green Bay Wisconsin (collectively, the “Site”). We have resolved these uncertainties as described below.
Since the early 1990s, the United States, the State of Wisconsin (collectively, the “Governments”) and two Indian tribes have pursued the cleanup of a 39-mile stretch of river from Little Lake Butte des Morts into Green Bay and natural resource damages (“NRDs”).
The United States Environmental Protection Agency (“EPA”) has divided the Site into five “operable units”, including the most upstream portion of the Site on which our facility was located (“OU1”) and four downstream reaches of the river and bay (“OU2-5”).
The United States originally notified several entities that they were potentially responsible parties (“PRPs”). We, with contributions of certain other PRPs, implemented the remedial action in OU1 under a consent decree with the Governments. That work is complete, other than on-going monitoring and maintenance.
For OU2-5, after giving effect to settlements reached with the Governments, the remaining PRPs exposed to continuing obligations to implement the remainder of the cleanup consisted of us, Georgia Pacific Consumer Products, L.P. (“Georgia Pacific”) and NCR Corporation (“NCR”). The majority of the work in OU 2-5 has been funded or conducted by parties other than us. The cleanup is expected to continue at least through 2019, followed by decommissioning and post-remediation long-term monitoring and maintenance.
In 2017, the United States entered into a consent decree with the State of Wisconsin, NCR, and Appvion under which NCR agreed to complete the remaining cleanup and both NCR and Appvion agreed not to seek to recover from us or anyone else any amounts they have spent or would spend, and we and others would be barred from seeking claims against NCR or Appvion. Under the consent decree, the Governments agreed to seek long term monitoring and maintenance in OU2-5 from us and Georgia Pacific; as the result of earlier settlements, Georgia Pacific was only responsible for that work in the most downstream three miles of the river (“OU4b”) and the bay of Green Bay (“OU5”). The Governments agreed to seek their past and future oversight costs only from us.
We and Georgia Pacific had claims against each other to reallocate the costs that we had each incurred or would incur. In 2017, we entered into a settlement agreement with Georgia Pacific to settle these claims. Georgia Pacific agreed to implement the monitoring and maintenance in OU4b and OU5 and we agreed to monitoring and maintenance of all other upstream operable units. We paid Georgia Pacific $9.5 million in August 2017 in connection with this settlement.
After years of extensive and complex litigation, in January 2019, we reached an agreement with the United States, the State of Wisconsin, and Georgia-Pacific to resolve all remaining claims among those parties. A consent decree (“Glatfelter consent decree”) documenting that agreement was entered in the federal district court on March 14, 2019. Under the Glatfelter consent decree, we paid $20.5 million to settle the United States’ and Wisconsin’s claims for response costs incurred by them prior to October 2018 and for NRDs. We also agreed to reimburse the governments for future oversight costs incurred over the next 30 years. We anticipate that a significant portion of the oversight costs will be incurred in the next few years while the remediation is being completed. Once finished, costs will be an order of magnitude lower in most years during the period of long-term monitoring and maintenance. In addition to our previous agreement to be responsible for long-term monitoring and maintenance of OU-1, under this consent decree, we agreed to be primarily responsible for long-term monitoring and maintenance in OU2-OU4a.
Long term monitoring and maintenance will continue over a period of at least 30 years. The monitoring activities consist of, among others, testing fish tissue, sampling water quality and sediment, and inspections of the engineered caps. In the first quarter of 2018, we entered into a fixed-price, 30-year agreement with a third party for the performance of all of our monitoring and maintenance obligations in OU1 through OU4a with limited exceptions, such as, for extraordinary amounts of cap maintenance or replacement. Our obligation under this agreement is included in our total reserve for the Site. We are permitted to pay for this contract using the remaining balance of an escrow account established by us and WTM I Company under the OU1 consent decree during any- 22 -
GLATFELTER
Form 10-Q
period that the balance in that account exceeds the amount due under our fixed-price contract. The difference at present is approximately $2 million. We are also required to secure the payment of that difference with a renewal letter of credit or another instrument in the interim.
Reserves for the Site. Our reserve for past and future government oversight costs and long-term monitoring and maintenance is set forth below:
|
|
|
Nine months ended September 30 |
|
||||||
|
In thousands |
|
|
2019 |
|
|
|
|
2018 |
|
|
Balance at January 1, |
|
$ |
45,001 |
|
|
|
$ |
43,144 |
|
|
Payments |
|
|
(20,771 |
) |
|
|
|
(3,014 |
) |
|
Reserve adjustment |
|
|
(2,509 |
) |
|
|
|
— |
|
|
Assumption of WTM I escrow |
|
|
— |
|
|
|
|
4,746 |
|
|
Accretion |
|
|
141 |
|
|
|
|
115 |
|
|
Balance at September 30, |
|
$ |
21,862 |
|
|
|
$ |
44,991 |
|
Of our total reserve for the Fox River, $7.7 million is recorded in the accompanying September 30, 2019 condensed consolidated balance sheet under the caption “Environmental liabilities” and the remaining $14.2 million is recorded under the caption “Other long term liabilities.” In connection with the court approval of our January 2019 consent decree, we reduced our reserve by $2.5 million and recorded the adjustment as a reduction in “Selling, general and administrative” expenses in the condensed consolidated statements of income.
|
19. |
SEGMENT INFORMATION |
The following tables set forth financial and other information by segment for the period indicated:
|
Three months ended September 30 |
|
|
|
|
|
|
Other and |
|
|
|
|
||||||||||||||||||||
|
Dollars in millions |
Composite Fibers |
|
|
Airlaid Materials |
|
|
Unallocated |
|
|
Total |
|
||||||||||||||||||||
|
|
2019 |
|
|
2018 |
|
|
2019 |
|
|
2018 |
|
|
2019 |
|
|
2018 |
|
|
2019 |
|
|
2018 |
|
||||||||
|
Net sales |
$ |
127.7 |
|
|
$ |
139.2 |
|
|
$ |
104.8 |
|
|
$ |
70.7 |
|
|
$ |
— |
|
|
$ |
— |
|
|
$ |
232.5 |
|
|
$ |
209.9 |
|
|
Cost of products sold |
|
106.0 |
|
|
|
116.8 |
|
|
|
88.4 |
|
|
|
62.3 |
|
|
|
0.1 |
|
|
|
0.9 |
|
|
|
194.5 |
|
|
|
180.0 |
|
|
Gross profit (loss) |
|
21.7 |
|
|
|
22.4 |
|
|
|
16.4 |
|
|
|
8.4 |
|
|
|
(0.1 |
) |
|
|
(0.9 |
) |
|
|
38.0 |
|
|
|
29.9 |
|
|
SG&A |
|
10.6 |
|
|
|
10.5 |
|
|
|
4.8 |
|
|
|
2.9 |
|
|
|
8.3 |
|
|
|
12.4 |
|
|
|
23.7 |
|
|
|
25.8 |
|
|
Gains on dispositions of plant, equipment and timberlands, net |
|
— |
|
|
|
— |
|
|
|
— |
|
|
|
— |
|
|
|
(0.2 |
) |
|
|
(0.2 |
) |
|
|
(0.2 |
) |
|
|
(0.2 |
) |
|
Total operating income (loss) |
|
11.1 |
|
|
|
11.9 |
|
|
|
11.6 |
|
|
|
5.5 |
|
|
|
(8.2 |
) |
|
|
(13.1 |
) |
|
|
14.5 |
|
|
|
4.3 |
|
|
Non-operating expense |
|
— |
|
|
|
— |
|
|
|
— |
|
|
|
— |
|
|
|
(2.8 |
) |
|
|
(1.6 |
) |
|
|
(2.8 |
) |
|
|
(1.6 |
) |
|
Income (loss) before income taxes |
$ |
11.1 |
|
|
$ |
11.9 |
|
|
$ |
11.6 |
|
|
$ |
5.5 |
|
|
$ |
(11.0 |
) |
|
$ |
(14.7 |
) |
|
$ |
11.8 |
|
|
$ |
2.8 |
|
|
Supplementary Data |
|
|
|
|
|
|
|
|
|
|
|
|
|
|
|
|
|
|
|
|
|
|
|
|
|
|
|
|
|
|
|
|
Net tons sold (thousands) |
|
33.4 |
|
|
|
37.4 |
|
|
|
35.9 |
|
|
|
24.0 |
|
|
|
— |
|
|
|
— |
|
|
|
69.3 |
|
|
|
61.5 |
|
|
Depreciation, depletion and amortization |
$ |
6.4 |
|
|
$ |
7.1 |
|
|
$ |
5.3 |
|
|
$ |
3.4 |
|
|
$ |
0.9 |
|
|
$ |
1.0 |
|
|
$ |
12.6 |
|
|
$ |
11.5 |
|
|
Capital expenditures |
|
4.0 |
|
|
|
3.0 |
|
|
|
2.9 |
|
|
|
1.9 |
|
|
|
0.5 |
|
|
|
1.3 |
|
|
|
7.4 |
|
|
|
6.2 |
|
- 23 -
GLATFELTER
Form 10-Q
|
Nine months ended September 30 |
|
|
|
|
|
|
Other and |
|
|
|
|
||||||||||||||||||||
|
Dollars in millions |
Composite Fibers |
|
|
Airlaid Materials |
|
|
Unallocated |
|
|
Total |
|
||||||||||||||||||||
|
|
2019 |
|
|
2018 |
|
|
2019 |
|
|
2018 |
|
|
2019 |
|
|
2018 |
|
|
2019 |
|
|
2018 |
|
||||||||
|
Net sales |
$ |
389.0 |
|
|
$ |
423.7 |
|
|
$ |
307.7 |
|
|
$ |
213.1 |
|
|
$ |
— |
|
|
$ |
— |
|
|
$ |
696.7 |
|
|
$ |
636.8 |
|
|
Cost of products sold |
|
322.2 |
|
|
|
349.5 |
|
|
|
262.3 |
|
|
|
184.7 |
|
|
|
1.1 |
|
|
|
2.8 |
|
|
|
585.6 |
|
|
|
537.1 |
|
|
Gross profit (loss) |
|
66.8 |
|
|
|
74.2 |
|
|
|
45.4 |
|
|
|
28.4 |
|
|
|
(1.1 |
) |
|
|
(2.8 |
) |
|
|
111.1 |
|
|
|
99.7 |
|
|
SG&A |
|
31.4 |
|
|
|
34.0 |
|
|
|
13.4 |
|
|
|
8.1 |
|
|
|
26.3 |
|
|
|
39.8 |
|
|
|
71.1 |
|
|
|
81.9 |
|
|
Gains on dispositions of plant, equipment and timberlands, net |
|
— |
|
|
|
— |
|
|
|
— |
|
|
|
— |
|
|
|
(1.3 |
) |
|
|
(1.9 |
) |
|
|
(1.3 |
) |
|
|
(1.9 |
) |
|
Total operating income (loss) |
|
35.4 |
|
|
|
40.2 |
|
|
|
32.0 |
|
|
|
20.3 |
|
|
|
(26.1 |
) |
|
|
(40.8 |
) |
|
|
41.3 |
|
|
|
19.8 |
|
|
Non-operating expense |
|
— |
|
|
|
— |
|
|
|
— |
|
|
|
— |
|
|
|
(11.1 |
) |
|
|
(9.9 |
) |
|
|
(11.1 |
) |
|
|
(9.9 |
) |
|
Income (loss) before income taxes |
$ |
35.4 |
|
|
$ |
40.2 |
|
|
$ |
32.0 |
|
|
$ |
20.3 |
|
|
$ |
(37.2 |
) |
|
$ |
(50.7 |
) |
|
$ |
30.2 |
|
|
$ |
9.9 |
|
|
Supplementary Data |
|
|
|
|
|
|
|
|
|
|
|
|
|
|
|
|
|
|
|
|
|
|
|
|
|
|
|
|
|
|
|
|
Net tons sold (thousands) |
|
99.4 |
|
|
|
110.4 |
|
|
|
103.1 |
|
|
|
72.4 |
|
|
|
— |
|
|
|
— |
|
|
|
202.6 |
|
|
|
182.8 |
|
|
Depreciation, depletion and amortization |
$ |
19.7 |
|
|
$ |
21.7 |
|
|
$ |
15.8 |
|
|
$ |
9.7 |
|
|
$ |
2.6 |
|
|
$ |
3.3 |
|
|
$ |
38.1 |
|
|
$ |
34.7 |
|
|
Capital expenditures |
|
8.7 |
|
|
|
10.9 |
|
|
|
7.9 |
|
|
|
17.6 |
|
|
|
1.4 |
|
|
|
3.7 |
|
|
|
18.0 |
|
|
|
32.2 |
|
The sum of individual amounts set forth above may not agree to the condensed consolidated financial statements included herein due to rounding.
Segments Results of individual operating segments are presented based on our management accounting practices and management structure. There is no comprehensive, authoritative body of guidance for management accounting equivalent to accounting principles generally accepted in the United States of America; therefore, the financial results of individual segments are not necessarily comparable with similar information for any other company. The management accounting process uses assumptions and allocations to measure performance of the segments. Methodologies are refined from time to time as management accounting practices are enhanced and businesses change. The costs incurred by support areas not directly aligned with the segment are allocated primarily based on an estimated utilization of support area services or are included in “Other and Unallocated” in the table set forth above.
Management evaluates results of operations of the operating segments before certain corporate level costs and the effects of certain gains or losses not considered to be related to the core business operations. Management believes that this is a more meaningful representation of the operating performance of its core businesses, the profitability of the segments and the extent of cash flow generated from these core operations. Such amounts are presented under the caption “Other and Unallocated.” In the evaluation of operating segments results, management does not use any measures of total assets. This presentation is aligned with the management and operating structure of our company. It is also on this basis that the Company’s performance is evaluated internally and by the Company’s Board of Directors.
Specialty Papers’ results of operations are reported as discontinued operations. In addition, corporate shared services costs previously included in Specialty Papers’ results are required to be included in income from continuing operations and are reported as “other and unallocated”.
- 24 -
GLATFELTER
Form 10-Q
ITEM 2. MANAGEMENT'S DISCUSSION AND ANALYSIS OF FINANCIAL CONDITION AND RESULTS OF OPERATIONS
The following discussion should be read in conjunction with the information in the unaudited condensed consolidated financial statements and notes thereto included herein and Glatfelter’s Financial Statements and Management’s Discussion and Analysis of Financial Condition and Results of Operations included in our 2018 Annual Report on Form 10-K.
Forward-Looking Statements This Quarterly Report on Form 10-Q includes forward-looking statements within the meaning of the Private Securities Litigation Reform Act of 1995. All statements other than statements of historical fact, including statements regarding industry prospects and future consolidated financial position or results of operations, made in this Report on Form 10-Q are forward looking. We use words such as “anticipates”, “believes”, “expects”, “future”, “intends” and similar expressions to identify forward-looking statements. Forward-looking statements reflect management’s current expectations and are inherently uncertain. Our actual results may differ significantly from such expectations. The following discussion includes forward-looking statements all of which are inherently difficult to predict. Although we make such statements based on assumptions that we believe to be reasonable, there can be no assurance that actual results will not differ materially from our expectations. Accordingly, we identify the following important factors, among others, which could cause our results to differ from any results that might be projected, forecasted or estimated in any such forward-looking statements:
|
i. |
variations in demand for our products including the impact of unplanned market-related downtime, variations in product pricing, or product substitution; |
|
ii. |
the impact of competition, changes in industry production capacity, including the construction of new mills or new machines, the closing of mills and incremental changes due to capital expenditures or productivity increases; |
|
iii. |
risks associated with our international operations, including local economic and political environments and fluctuations in currency exchange rates; |
|
iv. |
geopolitical matters, including any impact to our operations from events in Russia, Ukraine and Philippines; |
|
v. |
our ability to develop new, high value-added products; |
|
vi. |
changes in the price or availability of raw materials we use, particularly woodpulp, pulp substitutes, synthetic pulp, and abaca fiber; |
|
vii. |
changes in energy-related prices and commodity raw materials with an energy component; |
|
viii. |
the impact of unplanned production interruption at our facilities or at any of our key suppliers; |
|
ix. |
disruptions in production and/or increased costs due to labor disputes; |
|
x. |
the gain or loss of significant customers and/or on-going viability of such customers; |
|
xi. |
the impact of war and terrorism; |
|
xii. |
the impact of unfavorable outcomes of audits by various state, federal or international tax authorities or changes in pre-tax income and its impact on the valuation of deferred taxes; |
|
xiii. |
enactment of adverse state, federal or foreign tax or other legislation or changes in government legislation, policy or regulation; and |
|
xiv. |
our ability to finance, consummate and integrate acquisitions. |
Introduction We manufacture a wide array of engineered materials. We report our results along two segments:
|
|
• |
Composite Fibers with revenue from the sale of single-serve tea and coffee filtration papers, nonwoven wallcovering base materials, metallized products, composite laminate papers, and many technically special papers including substrates for electrical applications; and |
|
|
• |
Airlaid Materials with revenue from the sale of airlaid nonwoven fabric-like materials used in feminine hygiene and adult incontinence products, specialty wipes, home care products and other airlaid applications. |
The former Specialty Papers business’ results of operations and financial condition are reported as discontinued operations. Following is a discussion and analysis primarily of the financial results of operations and financial condition of our continuing operations.
- 25 -
GLATFELTER
Form 10-Q
RESULTS OF OPERATIONS
Nine months ended September 30, 2019 versus the nine months ended September 30, 2018
Overview For the first nine months of 2019, we reported net income of $23.3 million, or $0.53 per share compared with a loss of $97.5 million and $2.23 per diluted share in the year earlier period.
On October 1, 2018, we acquired Georgia-Pacific’s European nonwovens business based in Steinfurt, Germany (“Steinfurt”). The results of Steinfurt, whose annual revenue approximated $99 million, are included prospectively from the date of acquisition. In addition, we sold our Specialty Papers business on October 31, 2018. Accordingly, the financial results of this business are classified as discontinued operations for all periods presented.
The following table sets forth summarized consolidated results of operations:
|
|
Nine months ended September 30 |
|
||||||
|
In thousands, except per share |
2019 |
|
|
|
2018 |
|
||
|
Net sales |
$ |
696,701 |
|
|
|
$ |
636,806 |
|
|
Gross profit |
|
111,138 |
|
|
|
|
99,733 |
|
|
Operating income |
|
41,322 |
|
|
|
|
19,757 |
|
|
Continuing operations |
|
|
|
|
|
|
|
|
|
Income |
|
19,539 |
|
|
|
|
2,841 |
|
|
Earnings per share |
|
0.44 |
|
|
|
|
0.06 |
|
|
Discontinued operations |
|
|
|
|
|
|
|
|
|
Income (loss) from discontinued operations |
|
3,802 |
|
|
|
|
(100,353 |
) |
|
Earnings (loss) per share |
|
0.09 |
|
|
|
|
(2.29 |
) |
|
Net income (loss) |
|
23,341 |
|
|
|
|
(97,512 |
) |
|
Earnings (loss) per share |
$ |
0.53 |
|
|
|
$ |
(2.23 |
) |
In addition to the results reported in accordance with GAAP, we evaluate our performance using adjusted earnings and adjusted earnings per diluted share. We disclose this information to allow investors to evaluate our performance exclusive of certain items that impact the comparability of results from period to period and we believe it is helpful in understanding underlying operating trends and cash flow generation.
Adjusted earnings from continuing operations for the first nine months of 2019 were $25.5 million, or $0.57 per diluted share compared with $7.8 million, or $0.18 per diluted share, for the same period a year ago. The improved results reflect i) growth in Airlaid Materials, as revenue and operating income each improved by approximately 44% and 58%, respectively; ii) lower corporate costs in connection with cost reduction initiatives and the separation of costs previously included as part of Specialty Papers and the collection of fees for transition services; iii) lower interest expense, net; and iv) partially offset by lower earnings in Composite Fibers. Adjusted earnings consists of net income determined in accordance with GAAP adjusted to exclude the impact of the following:
Cost optimization actions. These adjustments reflect charges incurred in connection with initiatives to optimize the cost structure of the Company including costs related to the organizational change to a functional operating model. The costs are primarily related to executive separation, other headcount reductions, professional fees, asset write-offs and certain contract termination costs. These adjustments, which have occurred at various times in the past, are irregular in timing and relate to specific identified programs to reduce or optimize the cost structure of a particular operating segment or the corporate function.
Airlaid capacity expansion costs. These adjustments reflect non-capitalized, one-time costs incurred related to the start-up of a new airlaid production facility in Fort Smith, Arkansas and implementation of a new business system.
Debt refinancing costs. Represents a charge to write-off unamortized debt issuance costs in connection with the redemption of the Company’s $250 million, 5.375% Notes.
Strategic initiatives. These adjustments primarily reflect professional and legal fees incurred directly related to evaluating and executing certain strategic initiatives including costs associated with acquisitions and the related integration and, in 2018, a currency translation gain on acquisition financing.
- 26 -
GLATFELTER
Form 10-Q
Fox River environmental matter. This adjustment excludes a gain for a decrease in the Company’s overall reserve for the Fox River matter primarily due to the resolution of the litigation in the first quarter of 2019.
Timberland sales and related costs. These adjustments exclude gains from the sales of timberlands as these items are not considered to be part of our core business, ongoing results of operations or cash flows. These adjustments are irregular in timing and amount and may significantly impact our operating results.
U.S. Tax Reform. These adjustments reflect amounts estimating the impact of the Tax Cuts and Jobs Act (“TCJA”) which was signed into law on December 22, 2017.
Adjusted earnings and adjusted earnings per share are considered measures not calculated in accordance with GAAP, and therefore are non-GAAP measures. The non-GAAP financial information should not be considered in isolation from, or as a substitute for, measures of financial performance prepared in accordance with GAAP. The following table sets forth the reconciliation of net income to adjusted earnings for the nine months ended September 30, 2019 and 2018:
|
|
|
Nine months ended September 30 |
|
|||||||||||||
|
|
|
2019 |
|
|
2018 |
|
||||||||||
|
In thousands, except per share |
|
Amount |
|
|
EPS |
|
|
Amount |
|
|
EPS |
|
||||
|
Net income |
|
$ |
23,341 |
|
|
$ |
0.53 |
|
|
|
(97,512 |
) |
|
$ |
(2.23 |
) |
|
Exclude: (Income) loss from discontinued operations, net of taxes |
|
|
(3,802 |
) |
|
|
(0.09 |
) |
|
|
100,353 |
|
|
|
2.29 |
|
|
Income from continuing operations |
|
|
19,539 |
|
|
|
0.44 |
|
|
|
2,841 |
|
|
|
0.06 |
|
|
Adjustments (pre-tax) |
|
|
|
|
|
|
|
|
|
|
|
|
|
|
|
|
|
Cost optimization actions |
|
|
7,643 |
|
|
|
|
|
|
|
— |
|
|
|
|
|
|
Airlaid capacity expansion costs |
|
|
1,014 |
|
|
|
|
|
|
|
5,572 |
|
|
|
|
|
|
Debt refinancing |
|
|
992 |
|
|
|
|
|
|
|
— |
|
|
|
|
|
|
Strategic initiatives (1) |
|
|
249 |
|
|
|
|
|
|
|
853 |
|
|
|
|
|
|
Fox River environmental matter |
|
|
(2,509 |
) |
|
|
|
|
|
|
— |
|
|
|
|
|
|
Timberland sales and related costs |
|
|
(1,114 |
) |
|
|
|
|
|
|
(1,929 |
) |
|
|
|
|
|
Total adjustments (pre-tax) |
|
|
6,275 |
|
|
|
|
|
|
|
4,496 |
|
|
|
|
|
|
Income taxes (2) |
|
|
(348 |
) |
|
|
|
|
|
|
(191 |
) |
|
|
|
|
|
U.S. Tax Reform |
|
|
— |
|
|
|
|
|
|
|
604 |
|
|
|
|
|
|
Total after-tax adjustments |
|
|
5,927 |
|
|
|
0.13 |
|
|
|
4,909 |
|
|
|
0.11 |
|
|
Adjusted earnings |
|
$ |
25,466 |
|
|
$ |
0.57 |
|
|
$ |
7,750 |
|
|
$ |
0.18 |
|
|
|
(1) |
The amount for 2018 includes approximately $2.9 million of foreign currency gains associated with the financing for the Steinfurt acquisition. |
|
|
(2) |
Tax effect on adjustments calculated based on the incremental effective tax rate of the jurisdiction in which each adjustment originated and the related $0.3 million increase in our valuation allowance related to the termination of our qualified pension plan. |
The sum of individual per share amounts set forth above may not agree to adjusted earnings per share due to rounding.
- 27 -
GLATFELTER
Form 10-Q
Segment Financial Performance
|
Nine months ended September 30 |
|
|
|
|
|
|
Other and |
|
|
|
|
||||||||||||||||||||
|
Dollars in millions |
Composite Fibers |
|
|
Airlaid Materials |
|
|
Unallocated |
|
|
Total |
|
||||||||||||||||||||
|
|
2019 |
|
|
2018 |
|
|
2019 |
|
|
2018 |
|
|
2019 |
|
|
2018 |
|
|
2019 |
|
|
2018 |
|
||||||||
|
Net sales |
$ |
389.0 |
|
|
$ |
423.7 |
|
|
$ |
307.7 |
|
|
$ |
213.1 |
|
|
$ |
— |
|
|
$ |
— |
|
|
$ |
696.7 |
|
|
$ |
636.8 |
|
|
Cost of products sold |
|
322.2 |
|
|
|
349.5 |
|
|
|
262.3 |
|
|
|
184.7 |
|
|
|
1.1 |
|
|
|
2.8 |
|
|
|
585.6 |
|
|
|
537.1 |
|
|
Gross profit (loss) |
|
66.8 |
|
|
|
74.2 |
|
|
|
45.4 |
|
|
|
28.4 |
|
|
|
(1.1 |
) |
|
|
(2.8 |
) |
|
|
111.1 |
|
|
|
99.7 |
|
|
SG&A |
|
31.4 |
|
|
|
34.0 |
|
|
|
13.4 |
|
|
|
8.1 |
|
|
|
26.3 |
|
|
|
39.8 |
|
|
|
71.1 |
|
|
|
81.9 |
|
|
Gains on dispositions of plant, equipment and timberlands, net |
|
— |
|
|
|
— |
|
|
|
— |
|
|
|
— |
|
|
|
(1.3 |
) |
|
|
(1.9 |
) |
|
|
(1.3 |
) |
|
|
(1.9 |
) |
|
Total operating income (loss) |
|
35.4 |
|
|
|
40.2 |
|
|
|
32.0 |
|
|
|
20.3 |
|
|
|
(26.1 |
) |
|
|
(40.8 |
) |
|
|
41.3 |
|
|
|
19.8 |
|
|
Non-operating expense |
|
— |
|
|
|
— |
|
|
|
— |
|
|
|
— |
|
|
|
(11.1 |
) |
|
|
(9.9 |
) |
|
|
(11.1 |
) |
|
|
(9.9 |
) |
|
Income (loss) before income taxes |
$ |
35.4 |
|
|
$ |
40.2 |
|
|
$ |
32.0 |
|
|
$ |
20.3 |
|
|
$ |
(37.2 |
) |
|
$ |
(50.7 |
) |
|
$ |
30.2 |
|
|
$ |
9.9 |
|
|
Supplementary Data |
|
|
|
|
|
|
|
|
|
|
|
|
|
|
|
|
|
|
|
|
|
|
|
|
|
|
|
|
|
|
|
|
Net tons sold (thousands) |
|
99.4 |
|
|
|
110.4 |
|
|
|
103.1 |
|
|
|
72.4 |
|
|
|
— |
|
|
|
— |
|
|
|
202.6 |
|
|
|
182.8 |
|
|
Depreciation, depletion and amortization |
$ |
19.7 |
|
|
$ |
21.7 |
|
|
$ |
15.8 |
|
|
$ |
9.7 |
|
|
$ |
2.6 |
|
|
$ |
3.3 |
|
|
$ |
38.1 |
|
|
$ |
34.7 |
|
|
Capital expenditures |
|
8.7 |
|
|
|
10.9 |
|
|
|
7.9 |
|
|
|
17.6 |
|
|
|
1.4 |
|
|
|
3.7 |
|
|
|
18.0 |
|
|
|
32.2 |
|
The sum of individual amounts set forth above may not agree to the condensed consolidated financial statements included herein due to rounding.
Segments Results of individual operating segments are presented based on our management accounting practices and management structure. There is no comprehensive, authoritative body of guidance for management accounting equivalent to accounting principles generally accepted in the United States of America; therefore, the financial results of individual segments are not necessarily comparable with similar information for any other company. The management accounting process uses assumptions and allocations to measure performance of the segments. Methodologies are refined from time to time as management accounting practices are enhanced and businesses change. The costs incurred by support areas not directly aligned with the segment are allocated primarily based on an estimated utilization of support area services or are included in “Other and Unallocated” in the table set forth above.
Management evaluates results of operations of the operating segments before certain corporate level costs and the effects of certain gains or losses not considered to be related to the core business operations. Management believes that this is a more meaningful representation of the operating performance of its core businesses, the profitability of the segments and the extent of cash flow generated from these core operations. Such amounts are presented under the caption “Other and Unallocated.” In the evaluation of operating segments results, management does not use any measures of total assets. This presentation is aligned with the management and operating structure of our company. It is also on this basis that the Company’s performance is evaluated internally and by the Company’s Board of Directors.
Sales and Costs of Products Sold
|
|
Nine months ended September 30 |
|
|
|
|
|
||||||
|
In thousands |
2019 |
|
|
|
2018 |
|
|
Change |
|
|||
|
Net sales |
$ |
696,701 |
|
|
|
$ |
636,806 |
|
|
$ |
59,895 |
|
|
Costs of products sold |
|
585,563 |
|
|
|
|
537,073 |
|
|
|
48,490 |
|
|
Gross profit |
$ |
111,138 |
|
|
|
$ |
99,733 |
|
|
$ |
11,405 |
|
|
Gross profit as a percent of Net sales |
|
16.0 |
% |
|
|
|
15.7 |
% |
|
|
|
|
The following table sets forth the contribution to consolidated net sales by each segment:
|
|
Nine months ended September 30 |
|
||||||
|
Percent of Total |
2019 |
|
|
|
2018 |
|
||
|
Segment |
|
|
|
|
|
|
|
|
|
Composite Fibers |
|
55.8 |
% |
|
|
|
66.5 |
% |
|
Airlaid Materials |
|
44.2 |
|
|
|
|
33.5 |
|
|
Total |
|
100.0 |
% |
|
|
|
100.0 |
% |
- 28 -
GLATFELTER
Form 10-Q
Net sales totaled $696.7 million and $636.8 million in the first nine months of 2019 and 2018, respectively. The increase was primarily due to the Steinfurt acquisition, volume growth in Airlaid Materials’ legacy business and higher selling prices partially offset by unfavorable currency translation. On a constant currency basis and excluding the Steinfurt acquisition, Advanced Airlaid Material’s net sales increased 15.0% and Composite Fibers’ decreased by 3.5%.
Composite Fibers’ net sales decreased $34.7 million, or 8.2% primarily due to $19.8 million unfavorable currency translation, a 10.0% decline in shipping volumes which was partially offset by higher average selling prices totaling $1.9 million. Food and beverage shipping volumes increased 1.2% but shipping volumes in all other market segments declined, particularly metallized and wallcover products.
Composite Fibers’ operating income for the first nine months of 2019 totaled $35.4 million, a decrease of $4.8 million compared to the year-earlier quarter. Lower shipping volumes impacted results by $5.2 million. Higher raw material and energy prices of $3.9 million and costs related to the disruption in the supply of a key raw material were partially offset by benefits of efficient operations and our cost reduction actions. Currency was $3.8 million favorable compared to the year-ago period.
The primary drivers of the change in Composite Fibers’ operating income are summarized in the following chart:
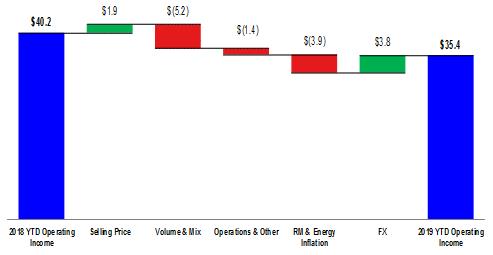
Airlaid Materials’ net sales increased $94.6 million, or 44.4%, primarily due to the Steinfurt acquisition and a 12.9% organic increase in shipping volumes reflecting growth in wipes, hygiene and table top products. Higher average selling prices contributed $1.5 million and currency translation was unfavorable by $6.9 million.
- 29 -
GLATFELTER
Form 10-Q
Airlaid Materials’ operating income for the first nine months of 2019 totaled $32.0 million, or 57.6% higher than the comparable period a year ago. The increase was primarily due to $11.9 million from higher shipping volumes in part related to the Steinfurt acquisition. The primary drivers are summarized in the following chart:
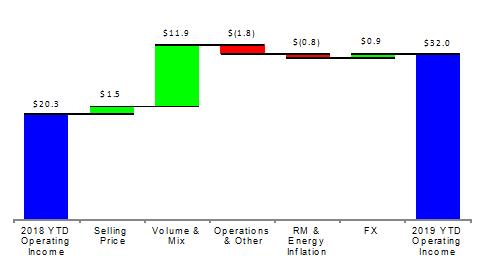
Other and Unallocated The amount of “Other and Unallocated” operating expense in our table of Segment Financial Performance totaled $26.1 million in the first nine months of 2019 compared with $40.8 million in the first nine months of 2018. The decrease in Other and Unallocated expenses, excluding the impact of gains from timberland sales, primarily reflects the impact of corporate cost reduction initiatives, lower start-up costs related to the Airlaid Materials capacity expansion program and the reduction in our reserve for the Fox River matter. Other and Unallocated expenses during the nine months of 2019, include $7.6 million of costs related to cost optimization including changes to the new functional operating model and associated separation costs.
Income taxes In the first nine months of 2019 and 2018, we recorded an income tax provision of $10.7 million and $7.0 million, respectively, on income from continuing operations of $30.2 million and $9.9 million, respectively. The lower effective tax rate in the first nine months of 2019 compared to the same period of 2018 was primarily due to a greater proportion of pretax income or losses being generated in the U.S., a lower tax jurisdiction.
Foreign Currency We own and operate facilities in Canada, Germany, France, the United Kingdom and the Philippines. The functional currency of our Canadian operations is the U.S. dollar. However, in Germany and France it is the Euro, in the UK, it is the British Pound Sterling, and in the Philippines the functional currency is the Peso. On an annual basis, our Euro denominated revenue exceeds Euro expenses by an estimated €160 million. For the first nine months of 2019, the average currency exchange rate was 1.12 dollar/euro compared with 1.19 in the same period of 2018. With respect to the British Pound Sterling, Canadian Dollar, and Philippine Peso, we have differing amounts of inflows and outflows of these currencies, although to a lesser degree than the Euro. As a result, we are exposed to changes in currency exchange rates and such changes could be significant. The translation of the results from international operations into U.S. dollars is subject to changes in foreign currency exchange rates.
The table below summarizes the translation impact on reported results that changes in currency exchange rates had on our non-U.S. based operations from the conversion of these operation’s results for the first nine months of 2019.
|
In thousands |
Nine months ended September 30, 2019 |
|
||||
|
|
Favorable (unfavorable) |
|
||||
|
Net sales |
|
|
|
$ |
(26,743 |
) |
|
Costs of products sold |
|
|
|
|
29,286 |
|
|
SG&A expenses |
|
|
|
|
2,018 |
|
|
Income taxes and other |
|
|
|
|
68 |
|
|
Net income |
|
|
|
$ |
4,629 |
|
- 30 -
GLATFELTER
Form 10-Q
The above table only presents the financial reporting impact of foreign currency translations assuming currency exchange rates in 2019 were the same as 2018. It does not present the impact of certain competitive advantages or disadvantages of operating or competing in multi-currency markets.
Discontinued Operations We completed the sale of our Specialty Papers business on October 31, 2018. Its results of operations are reported as discontinued operations for all periods presented. For the first nine months 2019, we reported income from discontinued operations of $3.8 million compared with a loss of $100.4 million in the same period of 2018. The income reported in the first nine months of 2019 primarily relates to adjustments for post-closing working capital, pension and the reversal of tax reserves associated with the closure of tax matters, and other items in connection with the sale of Specialty Papers. The loss reported in the first nine months of 2018 includes a $97.5 million, after-tax, impairment charge recorded in connection with the sale of the Specialty Papers business.
Three months ended September 30, 2019 versus the three months ended September 30, 2018
Overview For the third quarter of 2019, our net income totaled $12.2 million, or $0.28 per share compared with a loss of $95.8 million, or $2.19 per share in the third quarter of 2018. On an adjusted basis earnings from continuing operations for the third quarter of 2019 was $9.7 million, or $0.22 per share compared with a loss of $0.2 million, or $0.00 per share, for the same period a year ago. The following table sets forth summarized results of operations:
|
|
Three months ended September 30 |
|
||||||
|
In thousands, except per share |
2019 |
|
|
|
2018 |
|
||
|
Net sales |
$ |
232,515 |
|
|
|
$ |
209,855 |
|
|
Gross profit |
|
38,021 |
|
|
|
|
29,872 |
|
|
Operating income |
|
14,535 |
|
|
|
|
4,322 |
|
|
Continuing operations |
|
|
|
|
|
|
|
|
|
Income (loss) |
|
8,643 |
|
|
|
|
(705 |
) |
|
Earnings (loss) per share |
|
0.19 |
|
|
|
|
(0.02 |
) |
|
Discontinued operations |
|
|
|
|
|
|
|
|
|
Income (loss) from discontinued operations |
|
3,581 |
|
|
|
|
(95,126 |
) |
|
Earnings (loss) per share |
|
0.09 |
|
|
|
|
(2.17 |
) |
|
Net income (loss) |
|
12,224 |
|
|
|
|
(95,831 |
) |
|
Earnings (loss) per share |
$ |
0.28 |
|
|
|
$ |
(2.19 |
) |
The following table sets forth the reconciliation of net income (loss) to adjusted earnings for the three months ended September 30, 2019 and 2018:
|
|
|
Three months ended September 30 |
|
|||||||||||||
|
|
|
2019 |
|
|
2018 |
|
||||||||||
|
In thousands, except per share |
|
Amount |
|
|
EPS |
|
|
Amount |
|
|
Diluted EPS |
|
||||
|
Net income (loss) |
|
$ |
12,224 |
|
|
$ |
0.28 |
|
|
$ |
(95,831 |
) |
|
$ |
(2.19 |
) |
|
Exclude: (Income) loss from discontinued operations, net of tax |
|
|
(3,581 |
) |
|
|
(0.09 |
) |
|
|
95,126 |
|
|
|
2.17 |
|
|
Income (loss) from continuing operations |
|
|
8,643 |
|
|
|
0.19 |
|
|
|
(705 |
) |
|
|
(0.02 |
) |
|
Adjustments (pre-tax) |
|
|
|
|
|
|
|
|
|
|
|
|
|
|
|
|
|
Cost optimization |
|
|
1,736 |
|
|
|
|
|
|
|
— |
|
|
|
|
|
|
Strategic initiatives (1) |
|
|
— |
|
|
|
|
|
|
|
(1,342 |
) |
|
|
|
|
|
Airlaid capacity expansion costs |
|
|
— |
|
|
|
|
|
|
|
867 |
|
|
|
|
|
|
Timberland sales and related costs |
|
|
(233 |
) |
|
|
|
|
|
|
(249 |
) |
|
|
|
|
|
Total adjustments (pre-tax) |
|
|
1,503 |
|
|
|
|
|
|
|
(724 |
) |
|
|
|
|
|
Income taxes (2) |
|
|
(415 |
) |
|
|
|
|
|
|
622 |
|
|
|
|
|
|
U.S. Tax Reform |
|
|
— |
|
|
|
|
|
|
|
612 |
|
|
|
|
|
|
Total after-tax adjustments |
|
|
1,088 |
|
|
|
0.02 |
|
|
|
510 |
|
|
|
0.01 |
|
|
Adjusted earnings (loss) |
|
$ |
9,731 |
|
|
$ |
0.22 |
|
|
$ |
(195 |
) |
|
$ |
— |
|
|
|
(1) |
The amount for 2018 includes approximately $2.9 million of foreign currency gains associated with the financing for the Steinfurt acquisition. |
- 31 -
GLATFELTER
Form 10-Q
|
|
(2) |
Tax effect on adjustments calculated based on the incremental effective tax rate of the jurisdiction in which each adjustment originated and the related $0.2 million decrease in our valuation allowance related to the termination of our qualified pension plan. |
Segment Financial Performance
|
Three months ended September 30 |
|
|
|
|
|
|
Other and |
|
|
|
|
||||||||||||||||||||
|
Dollars in millions |
Composite Fibers |
|
|
Airlaid Materials |
|
|
Unallocated |
|
|
Total |
|
||||||||||||||||||||
|
|
2019 |
|
|
2018 |
|
|
2019 |
|
|
2018 |
|
|
2019 |
|
|
2018 |
|
|
2019 |
|
|
2018 |
|
||||||||
|
Net sales |
$ |
127.7 |
|
|
$ |
139.2 |
|
|
$ |
104.8 |
|
|
$ |
70.7 |
|
|
$ |
— |
|
|
$ |
— |
|
|
$ |
232.5 |
|
|
$ |
209.9 |
|
|
Cost of products sold |
|
106.0 |
|
|
|
116.8 |
|
|
|
88.4 |
|
|
|
62.3 |
|
|
|
0.1 |
|
|
|
0.9 |
|
|
|
194.5 |
|
|
|
180.0 |
|
|
Gross profit (loss) |
|
21.7 |
|
|
|
22.4 |
|
|
|
16.4 |
|
|
|
8.4 |
|
|
|
(0.1 |
) |
|
|
(0.9 |
) |
|
|
38.0 |
|
|
|
29.9 |
|
|
SG&A |
|
10.6 |
|
|
|
10.5 |
|
|
|
4.8 |
|
|
|
2.9 |
|
|
|
8.3 |
|
|
|
12.4 |
|
|
|
23.7 |
|
|
|
25.8 |
|
|
Gains on dispositions of plant, equipment and timberlands, net |
|
— |
|
|
|
— |
|
|
|
— |
|
|
|
— |
|
|
|
(0.2 |
) |
|
|
(0.2 |
) |
|
|
(0.2 |
) |
|
|
(0.2 |
) |
|
Total operating income (loss) |
|
11.1 |
|
|
|
11.9 |
|
|
|
11.6 |
|
|
|
5.5 |
|
|
|
(8.2 |
) |
|
|
(13.1 |
) |
|
|
14.5 |
|
|
|
4.3 |
|
|
Non-operating expense |
|
— |
|
|
|
— |
|
|
|
— |
|
|
|
— |
|
|
|
(2.8 |
) |
|
|
(1.6 |
) |
|
|
(2.8 |
) |
|
|
(1.6 |
) |
|
Income (loss) before income taxes |
$ |
11.1 |
|
|
$ |
11.9 |
|
|
$ |
11.6 |
|
|
$ |
5.5 |
|
|
$ |
(11.0 |
) |
|
$ |
(14.7 |
) |
|
$ |
11.8 |
|
|
$ |
2.8 |
|
|
Supplementary Data |
|
|
|
|
|
|
|
|
|
|
|
|
|
|
|
|
|
|
|
|
|
|
|
|
|
|
|
|
|
|
|
|
Net tons sold (thousands) |
|
33.4 |
|
|
|
37.4 |
|
|
|
35.9 |
|
|
|
24.0 |
|
|
|
— |
|
|
|
— |
|
|
|
69.3 |
|
|
|
61.5 |
|
|
Depreciation, depletion and Amortization |
$ |
6.4 |
|
|
$ |
7.1 |
|
|
$ |
5.3 |
|
|
$ |
3.4 |
|
|
$ |
0.9 |
|
|
$ |
1.0 |
|
|
$ |
12.6 |
|
|
$ |
11.5 |
|
|
Capital expenditures |
|
4.0 |
|
|
|
3.0 |
|
|
|
2.9 |
|
|
|
1.9 |
|
|
|
0.5 |
|
|
|
1.3 |
|
|
|
7.4 |
|
|
|
6.2 |
|
The sum of individual amounts set forth above may not agree to the condensed consolidated financial statements included herein due to rounding
- 32 -
GLATFELTER
Form 10-Q
Sales and Costs of Products Sold
|
|
Three months ended September 30 |
|
|
|
|
|
||||||
|
In thousands |
2019 |
|
|
|
2018 |
|
|
Change |
|
|||
|
Net sales |
$ |
232,515 |
|
|
|
$ |
209,855 |
|
|
$ |
22,660 |
|
|
Costs of products sold |
|
194,494 |
|
|
|
|
179,983 |
|
|
|
14,511 |
|
|
Gross profit |
$ |
38,021 |
|
|
|
$ |
29,872 |
|
|
$ |
8,149 |
|
|
Gross profit as a percent of Net sales |
|
16.4 |
% |
|
|
|
14.2 |
% |
|
|
|
|
The following table sets forth the contribution to consolidated net sales by each segment:
|
|
Three months ended September 30 |
|
||||||
|
Percent of Total |
2019 |
|
|
|
2018 |
|
||
|
Segment |
|
|
|
|
|
|
|
|
|
Composite Fibers |
|
54.9 |
% |
|
|
|
66.3 |
% |
|
Airlaid Materials |
|
45.1 |
|
|
|
|
33.7 |
|
|
Total |
|
100.0 |
% |
|
|
|
100.0 |
% |
Net sales totaled $232.5 million and $209.9 million in the third quarters of 2019 and 2018, respectively. Excluding the Steinfurt, Germany acquisition and on a constant currency basis, Airlaid Materials’ net sales increased by 14.2% and Composite Fibers’ net sales decreased by 4.2%.
Composite Fibers’ net sales declined $11.5 million, or 8.2%, driven by unfavorable currency translation of $5.6 million and a 10.8% decline in shipping volumes. The decline in shipping volumes was primarily due to wallcover and metallized products, which were lower by 17.1% and 20.0%, respectively.
Composite Fibers’ third quarter of 2019 operating income decreased to $11.1 million, down $0.8 million from the prior-year quarter. Lower shipping volumes impacted results by $2.5 million with related downtime impact of $1.3 million. Lower raw material and energy prices of $2.8 million and higher selling prices of $0.6 million more than offset $1.2 million of inflationary pressure and higher operating costs. Currency favorably impacted results by $0.8 million compared to the year-ago quarter reflecting hedging instruments that matured, more than offsetting the impact of a lower Euro translation rate. The primary drivers are summarized in the following chart:
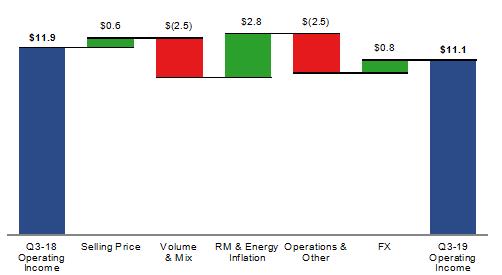
Airlaid Materials’ net sales increased $34.1 million in the quarter-over-quarter comparison primarily due to the Steinfurt acquisition and a 15.8% organic increase in shipping volumes reflecting strong growth in wipes, hygiene and table top products. Currency translation was $1.7 million unfavorable.
- 33 -
GLATFELTER
Form 10-Q
Airlaid Materials’ operating income totaled $11.6 million compared with $5.5 million in the third quarter of 2018. The $6.1 million increase was primarily due to higher shipping volumes and the Steinfurt acquisition. Lower prices for raw material and energy outpaced selling price declines by $0.4 million and currency translation was $0.7 million favorable. The primary drivers are summarized in the following chart:
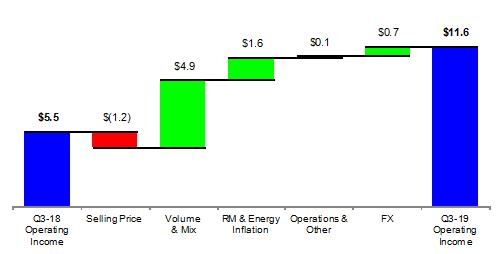
Other and Unallocated The amount of “Other and Unallocated” operating expense in our table of Segment Financial Performance totaled $8.2 million in the third quarter of 2019 compared with $13.1 million in the third quarter of 2018. Excluding the items identified to present “adjusted earnings,” unallocated expenses for the third quarter of 2019 declined $4.2 million compared to the third quarter of 2018, primarily reflecting the impact of corporate cost reduction initiatives.
Income Taxes In the third quarter of 2019, we recorded an income tax provision of $3.1 million on income from continuing operations of $11.8 million. The comparable amounts in the same period of 2018 were $3.5 million and $2.8 million, respectively. The lower effective tax rate in the third quarter of 2019 compared to the same period of 2018 was primarily due to a greater proportion of pretax income or losses being generated in the U.S., a lower tax jurisdiction.
Foreign Currency For the three months ended September 30 2019, the average currency exchange rate was 1.11 dollar/euro compared with 1.16 in the same period of 2018. The table below summarizes the translation impact on reported results that changes in currency exchange rates had on our non-U.S. based operations from the conversion of these operation’s results for the third quarter of 2019.
|
In thousands |
Three months ended September 30, 2019 |
|
|
||||
|
|
Favorable (unfavorable) |
|
|
||||
|
Net sales |
|
|
|
$ |
(7,253 |
) |
|
|
Costs of products sold |
|
|
|
|
8,213 |
|
|
|
SG&A expenses |
|
|
|
|
504 |
|
|
|
Income taxes and other |
|
|
|
|
112 |
|
|
|
Net income |
|
|
|
$ |
1,576 |
|
|
The above table only presents the financial reporting impact of foreign currency translations assuming currency exchange rates in 2019 were the same as 2018. It does not present the impact of certain competitive advantages or disadvantages of operating or competing in multi-currency markets.
- 34 -
GLATFELTER
Form 10-Q
LIQUIDITY AND CAPITAL RESOURCES
Our business requires significant expenditures for new or enhanced equipment, to support our research and development efforts, and to support our business strategy. In addition, we have mandatory debt service requirements of both principal and interest. The following table summarizes cash flow information for each of the periods presented:
|
|
Nine months ended September 30 |
|
|||||
|
In thousands |
2019 |
|
|
2018 |
|
||
|
Cash and cash equivalents at beginning of period |
$ |
142,685 |
|
|
$ |
116,219 |
|
|
Cash provided (used) by |
|
|
|
|
|
|
|
|
Operating activities |
|
15,594 |
|
|
|
(16,212 |
) |
|
Investing activities |
|
(18,791 |
) |
|
|
(30,150 |
) |
|
Financing activities |
|
(62,678 |
) |
|
|
148,316 |
|
|
Effect of exchange rate changes on cash |
|
(1,794 |
) |
|
|
(3,931 |
) |
|
Change in cash and cash equivalents from discontinued operations |
|
(17,970 |
) |
|
|
19,828 |
|
|
Net cash provided (used) |
|
(85,639 |
) |
|
|
117,851 |
|
|
Cash and cash equivalents at end of period |
$ |
57,046 |
|
|
$ |
234,070 |
|
At September 30, 2019, we had $57.0 million in cash and cash equivalents held by both domestic and foreign subsidiaries. Unremitted earnings of our foreign subsidiaries as of January 1, 2018 and forward are deemed to be indefinitely reinvested and therefore no U.S. tax liability is reflected in the accompanying condensed consolidated financial statements. Approximately 69% of our cash and cash equivalents is held by our foreign subsidiaries but could be repatriated without incurring a significant amount of additional taxes.
Cash provided by operating activities in the first nine months of 2019 totaled $15.6 million compared with a use of $16.2 million in the same period a year ago. The improvement in operating cash flow was primarily due to increased profitability and a decrease in cash used for inventory and other working capital. The use of $20.8 million of cash in the first nine months of 2019 for the Fox River matter was partially offset by lower incentive payments.
Net cash used by investing activities decreased by $11.4 million in the year-over-year comparison due to lower capital expenditures as a result of completing the airlaid capacity expansion in early 2018. Capital expenditures are expected to be $23 million to $28 million for the full year 2019.
Net cash used by financing activities totaled $62.7 million in the first nine months of 2019 compared with $148.3 million provided by financing activities in the same period of 2018. The increase in cash used by financing activities primarily reflects net repayment of borrowings under our revolving credit facility in the first nine months of 2019. In addition, cash provided by financing activities in the first nine months of 2018 included borrowings to finance the $186 million Steinfurt acquisition which closed on October 1, 2018.
The following table sets forth our outstanding long-term indebtedness:
|
|
|
September 30 |
|
|
|
December 31 |
|
||
|
In thousands |
|
2019 |
|
|
|
2018 |
|
||
|
Revolving credit facility, due Mar. 2020 |
|
$ |
— |
|
|
|
$ |
114,495 |
|
|
Revolving credit facility, due Feb. 2024 |
|
|
79,490 |
|
|
|
|
— |
|
|
5.375% Notes, due Oct. 2020 |
|
|
— |
|
|
|
|
250,000 |
|
|
Term loan, due Feb. 2024 |
|
|
236,564 |
|
|
|
|
— |
|
|
2.40% Term Loan, due Jun. 2022 |
|
|
4,278 |
|
|
|
|
5,725 |
|
|
2.05% Term Loan, due Mar. 2023 |
|
|
20,342 |
|
|
|
|
25,972 |
|
|
1.30% Term Loan, due Jun. 2023 |
|
|
5,834 |
|
|
|
|
7,361 |
|
|
1.55% Term Loan, due Sep. 2025 |
|
|
8,006 |
|
|
|
|
9,470 |
|
|
Total long-term debt |
|
|
354,514 |
|
|
|
|
413,023 |
|
|
Less current portion |
|
|
(22,235 |
) |
|
|
|
(10,785 |
) |
|
Unamortized deferred issuance costs |
|
|
(2,508 |
) |
|
|
|
(1,276 |
) |
|
Long-term debt, net of current portion |
|
$ |
329,771 |
|
|
|
$ |
400,962 |
|
- 35 -
GLATFELTER
Form 10-Q
In the first quarter of 2019, we significantly changed our debt capital structure. On February 8, 2019, we entered into a new credit facility with a consortium of financial institutions. The new five-year facility (the “2019 Facility”) replaces our then existing revolving credit facility and consists of a $400 million variable rate revolver and a €220 million, amortizing term loan. The other terms of the 2019 Facility are substantially similar to our previous revolving credit facility. On February 28, 2019, we redeemed all outstanding 5.375% Notes with proceeds from the new term loan.
The 2019 Facility contains a number of customary compliance covenants, the most restrictive of which is a maximum leverage ratio of 4.0x provided that such ratio increases to 4.5x during the period of four fiscal quarters immediately following a material acquisition such as Steinfurt. As of September 30, 2019, the leverage ratio, as calculated in accordance with the definition in our amended credit agreement, was 2.9x, within the limits set forth in our credit agreement. Based on our expectations of future results of operations and capital needs, we do not believe the debt covenants will impact our operations or limit our ability to undertake financings that may be necessary to meet our capital needs.
Financing activities include cash used for common stock dividends. In both the first nine months of 2019 and 2018, we used $17.2 million and $17.1 million, respectively, of cash for dividends on our common stock. Our Board of Directors determines what, if any, dividends will be paid to our shareholders. Dividend payment decisions are based upon then-existing factors and conditions and, therefore, historical trends of dividend payments are not necessarily indicative of future payments.
We are subject to various federal, state and local laws and regulations intended to protect the environment as well as human health and safety. At various times, we have incurred significant costs to comply with these regulations and we could incur additional costs as new regulations are developed or regulatory priorities change.
We expect to meet all of our near and long-term cash needs from a combination of operating cash flow, cash and cash equivalents, our existing credit facility and other long-term debt.
Off-Balance-Sheet Arrangements As of September 30, 2019 and December 31, 2018, we had not entered into any off-balance-sheet arrangements. Financial derivative instruments, to which we are a party, and guarantees of indebtedness, which solely consist of obligations of subsidiaries, are reflected in the condensed consolidated balance sheets included herein in Item 1 – Financial Statements.
- 36 -
GLATFELTER
Form 10-Q
ITEM 3. QUANTITATIVE AND QUALITATIVE DISCLOSURES ABOUT MARKET RISKS
|
|
|
Year Ended December 31 |
|
|
September 30, 2019 |
|
||||||||||||||||||||||
|
Dollars in thousands |
|
2019 |
|
|
2020 |
|
|
2021 |
|
|
2022 |
|
|
2023 |
|
|
Carrying Value |
|
|
Fair Value |
|
|||||||
|
Long-term debt |
|
|
|
|
|
|
|
|
|
|
|
|
|
|
|
|
|
|
|
|
|
|
|
|
|
|
|
|
|
Average principal outstanding |
|
|
|
|
|
|
|
|
|
|
|
|
|
|
|
|
|
|
|
|
|
|
|
|
|
|
|
|
|
At fixed interest rates – Term Loans |
|
|
37,178 |
|
|
|
30,766 |
|
|
|
20,509 |
|
|
|
10,835 |
|
|
|
5,038 |
|
|
|
38,460 |
|
|
|
39,143 |
|
|
At variable interest rates |
|
|
311,562 |
|
|
|
304,076 |
|
|
|
292,098 |
|
|
|
280,120 |
|
|
|
268,142 |
|
|
|
316,054 |
|
|
|
316,054 |
|
|
|
|
|
|
|
|
|
|
|
|
|
|
|
|
|
|
|
|
|
|
|
|
$ |
354,514 |
|
|
$ |
355,197 |
|
|
Weighted-average interest rate |
|
|
|
|
|
|
|
|
|
|
|
|
|
|
|
|
|
|
|
|
|
|
|
|
|
|
|
|
|
On fixed rate debt – Term Loans |
|
|
1.87 |
% |
|
|
1.85 |
% |
|
|
1.82 |
% |
|
|
1.77 |
% |
|
|
1.67 |
% |
|
|
|
|
|
|
|
|
|
On variable rate debt |
|
|
1.50 |
% |
|
|
1.50 |
% |
|
|
1.50 |
% |
|
|
1.50 |
% |
|
|
1.50 |
% |
|
|
|
|
|
|
|
|
The table above presents the average principal outstanding and related interest rates for the next five years for debt outstanding as of September 30, 2019. Fair values included herein have been determined based upon rates currently available to us for debt with similar terms and remaining maturities.
Our market risk exposure primarily results from changes in interest rates and currency exchange rates. At September 30, 2019, we had $352.0 million of long-term debt, net of unamortized debt issuance costs, of which 89.8% was at variable interest rates. Variable-rate debt outstanding represents borrowings under the 2019 Facility including both revolving credit borrowings and the amortizing term loan. Interest accrues based on EURIBOR plus a margin. At September 30, 2019, the interest rate paid was approximately 1.50%. A hypothetical 100 basis point increase or decrease in the interest rate on variable rate debt would increase or decrease annual interest expense by $3.2 million. However, in October 2019, we entered into a €180 million notional value floating-to-fixed interest rate swap agreement with certain financial institutions. Under the terms of the swap, we will pay a fixed interest rate of 0.0395% on €180 million of the underlying variable rate term loan. We will receive the greater of 0.00% or EURIBOR.
As part of our overall risk management practices, we enter into financial derivatives primarily designed to either i) hedge foreign currency risks associated with forecasted transactions – “cash flow hedges”; or ii) mitigate the impact that changes in currency exchange rates have on intercompany financing transactions and foreign currency denominated receivables and payables – “foreign currency hedges.” For a more complete discussion of this activity, refer to Item 1 – Financial Statements – Note 16.
We are subject to certain risks associated with changes in foreign currency exchange rates to the extent our operations are conducted in currencies other than the U.S. Dollar. On an annual basis, our euro denominated revenue exceeds euro expenses by an estimated €160 million. With respect to the British Pound Sterling, Canadian Dollar, and Philippine Peso, we have differing amounts of inflows and outflows of these currencies, although to a lesser degree than the euro. As a result, particularly with respect to the euro, we are exposed to changes in currency exchange rates and such changes could be significant.
ITEM 4. CONTROLS AND PROCEDURES
Evaluation of Disclosure Controls and Procedures Our chief executive officer and our principal financial officer, after evaluating the effectiveness of our disclosure controls and procedures (as defined in Exchange Act Rules 13a-15(e) and 15d-15(e)) as of September 30, 2019, have concluded that, as of the evaluation date, our disclosure controls and procedures are effective.
Changes in Internal Controls There were no changes in our internal control over financial reporting during the three months ended September 30, 2019, that have materially affected or are reasonably likely to materially affect our internal control over financial reporting.
- 37 -
GLATFELTER
Form 10-Q
PART II
ITEM 6. EXHIBITS
The following exhibits are filed herewith or incorporated by reference as indicated.
|
|
|
|
10.1 |
|
|
|
|
|
10.2 |
First Amendment to Third Amended and Restated Credit Agreement, filed herewith. |
|
|
|
|
31.1 |
|
|
|
|
|
31.2 |
|
|
|
|
|
32.1 |
|
|
|
|
|
32.2 |
|
|
|
|
|
101.INS |
Inline XBRL Instance Document - – the instance document does not appear in the Interactive Data file because its iXBRL tags are embedded within the Inline XBRL document, filed herewith. |
|
|
|
|
101.SCH |
XBRL Taxonomy Extension Schema, filed herewith. |
|
|
|
|
101.CAL |
XBRL Extension Calculation Linkbase, filed herewith. |
|
|
|
|
101.DEF |
XBRL Extension Definition Linkbase, filed herewith. |
|
|
|
|
101.LAB |
XBRL Extension Label Linkbase, filed herewith. |
|
|
|
|
101.PRE |
XBRL Extension Presentation Linkbase, filed herewith. |
|
|
|
|
104 |
The cover page from the Company’s Quarterly Report on Form 10-Q for the quarter ended September 30, 2019, has been formatted in Inline XBRL. |
SIGNATURES
Pursuant to the requirements of Section 13 or 15(d) of the Securities Exchange Act of 1934, the Registrant has duly caused this report to be signed on its behalf by the undersigned, thereunto duly authorized.
|
|
P. H. GLATFELTER COMPANY (Registrant) |
||
|
|
|
|
|
|
October 30, 2019 |
|
|
|
|
|
|
|
|
|
|
By |
|
/s/ David C. Elder |
|
|
|
|
David C. Elder |
|
|
|
|
Vice President, Finance and Chief Accounting Officer |
- 38 -
GLATFELTER
Form 10-Q
Similar companies
See also INTERNATIONAL PAPER CO /NEW/ - Annual report 2022 (10-K 2022-12-31) Annual report 2023 (10-Q 2023-09-30)See also Suzano S.A.
See also Sylvamo Corp - Annual report 2022 (10-K 2022-12-31) Annual report 2023 (10-Q 2023-09-30)
See also Resolute Forest Products Inc. - Annual report 2021 (10-K 2021-12-31) Annual report 2022 (10-Q 2022-09-30)
See also Mativ Holdings, Inc. - Annual report 2022 (10-K 2022-12-31) Annual report 2023 (10-Q 2023-09-30)