Investar Holding Corp - Annual Report: 2016 (Form 10-K)
UNITED STATES
SECURITIES AND EXCHANGE COMMISSION
Washington, D.C. 20549
FORM 10-K
(Mark One)
|
☑ |
ANNUAL REPORT PURSUANT TO SECTION 13 OR 15(d) OF THE SECURITIES EXCHANGE ACT OF 1934 |
For the fiscal year ended December 31, 2016
or
|
☐ |
TRANSITION REPORT PURSUANT TO SECTION 13 OR 15(d) OF THE SECURITIES EXCHANGE ACT OF 1934 |
For the transition period from to
Commission File Number: 001-36522

Investar Holding Corporation
(Exact name of registrant as specified in its charter)
|
Louisiana |
|
27-1560715 |
|
(State or other jurisdiction of incorporation or organization) |
|
(I.R.S. Employer Identification No.) |
7244 Perkins Road, Baton Rouge, Louisiana 70808
(Address of principal executive offices, including zip code)
(225) 227-2222
(Registrant’s telephone number, including area code)
Securities registered pursuant to Section 12(b) of the Act:
|
Title of each class |
Name of each exchange on which registered |
|
Common Stock, $1.00 par value per share |
The Nasdaq Global Market |
Securities registered pursuant to Section 12(g) of the Act: None
Indicate by check mark whether the registrant is a well-known seasoned issuer, as defined in Rule 405 of the Securities Act. Yes ☐ No ☑
Indicate by check mark whether the registrant is not required to file reports pursuant to Section 13 or Section 15(d) of the Act. Yes ☐ No ☑
Indicate by check mark whether the registrant (1) has filed all reports required to be filed by Section 13 or 15(d) of the Securities Exchange Act of 1934 during the preceding 12 months (or for such shorter period that the registrant was required to file such reports), and (2) has been subject to such filing requirements for the past 90 days. Yes ☑ No ☐
Indicate by check mark whether the registrant has submitted electronically and posted on its corporate Web site, if any, every Interactive Data File required to be submitted and posted pursuant to Rule 405 of Regulation S-T (§232.405 of this chapter) during the preceding 12 months (or for such shorter period that the registrant was required to submit and post such files). Yes ☑ No ☐
Indicate by check mark if disclosure of delinquent filers pursuant to Item 405 of Regulation S-K (§229.405 of this chapter) is not contained herein, and will not be contained, to the best of registrant’s knowledge, in definitive proxy or information statements incorporated by reference in Part III of this Form 10-K or any amendment to this Form 10-K. ☐
Indicate by check mark whether the registrant is a large accelerated filer, an accelerated filer, a non-accelerated filer, or a smaller reporting company. See the definitions of “large accelerated filer,” “accelerated filer,” and “smaller reporting company” in Rule 12b-2 of the Exchange Act. (Check one):
|
Large accelerated filer |
|
☐ |
|
Accelerated filer |
|
☑ |
|
|
|
|
|
|||
|
Non-accelerated filer |
|
☐ (Do not check if a smaller reporting company) |
|
Smaller reporting company |
|
☐ |
Indicate by check mark whether the registrant is a shell company (as defined in Rule 12b-2 of the Exchange Act). Yes ☐ No ☑
The aggregate market value of the voting stock held by non-affiliates of the registrant, computed by reference to the closing price of the common stock as of June 30, 2016, was approximately $99,218,702.
The number of shares outstanding of each of the issuer’s classes of common stock, as of the latest practicable date, is as follows: Common stock, $1.00 par value, 7,168,235 shares outstanding as of March 9, 2017.
DOCUMENTS INCORPORATED BY REFERENCE
Portions of the Definitive Proxy Statement relating to the 2017 Annual Meeting of Shareholders of Investar Holding Corporation are incorporated by reference into Part III of the Form 10-K. Such Definitive Proxy Statement will be filed with the Securities and Exchange Commission within 120 days after the end of the registrant’s fiscal year ended December 31, 2016.
|
|
|
|
|
Page |
|
|
|
|
|
|
|
|
|
|
|
|
|
Item 1. |
|
|
3 |
|
|
|
|
|
|
|
|
Item 1A. |
|
|
15 |
|
|
|
|
|
|
|
|
Item 1B. |
|
|
30 |
|
|
|
|
|
|
|
|
Item 2. |
|
|
30 |
|
|
|
|
|
|
|
|
Item 3. |
|
|
30 |
|
|
|
|
|
|
|
|
Item 4. |
|
|
30 |
|
|
|
|
|
|
|
|
|
|
|
|
|
|
|
|
|
|
|
|
Item 5. |
|
|
31 |
|
|
|
|
|
|
|
|
Item 6. |
|
|
33 |
|
|
|
|
|
|
|
|
Item 7. |
|
Management’s Discussion and Analysis of Financial Condition and Results of Operations |
|
36 |
|
|
|
|
|
|
|
Item 7A. |
|
|
63 |
|
|
|
|
|
|
|
|
Item 8. |
|
|
64 |
|
|
|
|
|
|
|
|
Item 9. |
|
Changes in and Disagreements With Accountants on Accounting and Financial Disclosure |
|
118 |
|
|
|
|
|
|
|
Item 9A. |
|
|
118 |
|
|
|
|
|
|
|
|
Item 9B. |
|
|
118 |
|
|
|
|
|
|
|
|
|
|
|
|
|
|
|
|
|
|
|
|
Item 10. |
|
|
119 |
|
|
|
|
|
|
|
|
Item 11. |
|
|
124 |
|
|
|
|
|
|
|
|
Item 12. |
|
Security Ownership of Certain Beneficial Owners and Management and Related Stockholder Matters |
|
129 |
|
|
|
|
|
|
|
Item 13. |
|
Certain Relationships and Related Transactions, and Directors Independence |
|
131 |
|
|
|
|
|
|
|
Item 14. |
|
|
132 |
|
|
|
|
|
|
|
|
|
|
|
|
|
|
|
|
|
|
|
|
Item 15. |
|
|
133 |
|
2
General
Investar Holding Corporation (the “Company”), a Louisiana corporation incorporated in 2009, is a financial holding company headquartered in Baton Rouge, Louisiana that conducts its operations primarily through its wholly-owned subsidiary, Investar Bank (the “Bank”), a Louisiana commercial bank, chartered in 2006. Through the Bank, the Company offers a wide range of commercial banking products tailored to meet the needs of individuals and small to medium-sized businesses. The primary markets served are Baton Rouge, New Orleans, Hammond and Lafayette, Louisiana, and their surrounding metropolitan areas. These markets are served from our main office located in Baton Rouge and from nine additional full service branches located throughout our market areas. As of December 31, 2016, on a consolidated basis, the Company had total assets of $1.2 billion, net loans of $886.4 million, total deposits of $907.8 million, and stockholders’ equity of $112.8 million.
Management believes that the current markets present a significant opportunity for growth and franchise expansion, both organically and through strategic acquisitions. Although the financial services industry is rapidly changing and intensely competitive, and likely to remain so, we believe that the Bank competes effectively as a local community bank and possesses the consistency of local leadership, the availability of local access and responsive customer service, coupled with competitively-priced products and services, necessary to successfully compete with other financial institutions for individual and small to medium-sized business customers.
We have experienced significant growth since the Bank was chartered, completing acquisitions in 2011 and 2013, as described below in more detail, and establishing additional branches in our market areas. In 2012, we entered the New Orleans market through de novo branching by purchasing two closed branch locations of another financial institution in suburban New Orleans, Louisiana. In 2013, we entered the Lafayette market by opening a de novo branch. In addition, we opened our sixth Baton Rouge market area branch location in August 2014.
We have completed construction of our seventh Baton Rouge market area branch location in Gonzales, Louisiana, which we expect to open in 2017, subject to regulatory approval. In September 2015, we acquired land and a building for an additional branch location in the New Orleans market area, also expected to open in 2017, subject to regulatory approval.
In November 2013, the Company and the Bank completed a share exchange with the Bank’s shareholders, resulting in the Bank becoming a wholly-owned subsidiary of the Company. In July 2014, the Company completed the issuance and sale of 3,285,300 shares of its common stock in its initial public offering, which amount included 410,300 shares sold pursuant to the underwriters’ exercise of their option to purchase additional shares from the Company, at a public offering price of $14.00 per share. After deducting underwriting commissions and offering expenses, the Company received net proceeds of $41.7 million from the sale of such shares.
The information set forth in this Annual Report on Form 10-K is as of March 9, 2017, unless otherwise indicated herein.
Operations
General. We offer a full range of commercial and retail lending products throughout our market areas, including business loans to small to medium-sized businesses as well as loans to individuals. Our business lending products include owner-occupied commercial real estate loans, construction loans and commercial and industrial loans, such as term loans, equipment financing and lines of credit, while our loans to individuals include first and second mortgage loans, installment loans, and lines of credit. For business customers, we target businesses with $10 million in annual revenue or less but do not focus on any particular industry. We also target professional organizations such as law firms, accounting firms and medical practices.
Management considers all of our operations to be aggregated in one reportable operating segment, and accordingly no separate segment disclosures are presented in this report. Please refer to our audited consolidated financial statements and the notes thereto in Item 8, Financial Statements and Supplementary Data, for information with respect to our revenues from external customers, profit or loss for the last three years and total assets for the last two years. Neither we nor the Bank have any foreign operations.
Lending Activities. Income generated by our lending activities represents a substantial portion of our total revenue. For the years ended December 31, 2016, 2015 and 2014, income from our lending activities comprised 81%, 77% and 80%, respectively, of our total revenue.
3
Lending to Businesses. Our lending to small to medium-sized businesses falls into three general categories:
|
|
• |
Commercial real estate loans. Approximately 48% of our total loans at December 31, 2016 were commercial real estate loans, which include multifamily, farmland and commercial real estate loans, with owner-occupied loans comprising approximately 42% of the commercial real estate loan portfolio. Commercial real estate loan terms generally are ten years or less, although payments may be structured on a longer amortization basis. Interest rates may be fixed or adjustable, although rates typically will not be fixed for a period exceeding 120 months, and we generally charge an origination fee. We do not offer non-recourse loans. Risks associated with commercial real estate loans include, among other things, fluctuations in the value of real estate, new job creation trends, tenant vacancy rates and the quality of the borrower’s management. We attempt to limit risk by analyzing a borrower’s cash flow and collateral value on an ongoing basis. Also, we typically require personal guarantees from the principal owners of the property, supported by a review of their personal financial statements, as an additional means of mitigating our risk. |
|
|
• |
Construction and development loans. Construction and development loans, which consist of loans for the construction of commercial projects, single family residential properties and multifamily properties, accounted for approximately 10% of our total loans at December 31, 2016. Our construction and development loans are made on both a “pre-sold” basis and on a “speculative” basis. Construction and development loans are generally made with a term of 6 to 18 months, with interest accruing at either a fixed or floating rate and paid monthly. These loans are secured by the underlying project being built. For construction loans, loan to value ratios range from 70% to 80% of the developed/completed value, while for development loans our loan to value ratios typically will not exceed 70% to 75% of such value. Speculative loans are based on the borrower’s financial strength and cash flow position, and we disburse funds in installments based on the percentage of completion and only after the project has been inspected by an experienced construction lender or third-party inspector. |
Construction lending entails significant additional risks compared to commercial real estate or residential real estate lending. One such risk is that loan funds are advanced upon the security of the property under construction, which is of uncertain value prior to the completion of construction. Thus, it is more difficult to evaluate accurately the total loan funds required to complete a project and to calculate related loan-to-value ratios. We attempt to minimize the risks associated with construction lending by limiting loan-to-value ratios as described above. In addition, as to speculative development loans, we generally make such loans only to borrowers that have a positive pre-existing relationship with us.
|
|
• |
Commercial and industrial loans. Commercial and industrial loans primarily consist of working capital lines of credit and equipment loans. We often make commercial loans to borrowers with whom we have previously made a commercial real estate loan. The terms of these loans vary by purpose and by type of underlying collateral. We make equipment loans for a term of five years or less at fixed or variable rates, with the loan fully amortized over the term and secured by the relevant piece of equipment. Loans to support working capital typically have terms not exceeding one year, and such loans are secured by accounts receivable or inventory. Fixed rate loans are priced based on collateral, term and amortization. The interest rate for floating rate loans is typically tied to the prime rate published in The Wall Street Journal with a floor of 4.5%. Commercial and industrial loans accounted for approximately 10% of our total loans at December 31, 2016. |
Commercial lending generally involves different risks from those associated with commercial real estate lending or construction lending. Although commercial loans may be collateralized by equipment or other business assets (including real estate, if available as collateral), the repayment of these types of loans depends primarily on the creditworthiness and projected cash flow of the borrower (and any guarantors). Thus, the general business conditions of the local economy and the borrower’s ability to sell its products and services, thereby generating sufficient operating revenue to repay us under the agreed upon terms and conditions, are the chief considerations when assessing the risk of a commercial loan. The liquidation of collateral is considered a secondary source of repayment because equipment and other business assets may, among other things, be obsolete or of limited resale value. We actively monitor certain financial measures of the borrower, including advance rate, cash flow, collateral value and other appropriate credit factors.
Lending to Individuals. We make the following types of loans to our individual customers:
|
|
• |
Consumer loans. Consumer loans represented 12% of our total loans at December 31, 2016. We make these loans (which are normally fixed-rate loans) to individuals for a variety of personal, family and household purposes, secured and unsecured installment and term loans, second mortgages, home equity loans and home equity lines of credit. Because many consumer loans are secured by depreciable assets such as cars, boats and trailers, the loans are amortized over the useful life of the asset. The amortization of second mortgages generally does not exceed 15 years and the rates generally are not fixed for more than 60 months. As a general matter, in underwriting these loans, our credit analysts review a borrower’s past credit history, past income level, debt history and, when applicable, cash flow, and determine the impact of all these factors on the ability of the borrower to make future payments as agreed. A comparison of the value of the collateral, if any, to the proposed loan amount, is also a consideration in the underwriting process. Repayment of consumer loans depends upon the borrower’s financial stability and is more likely to be adversely affected by divorce, job loss, illness and personal hardships than repayment of other loans. A shortfall in the value of any collateral also may pose a risk of loss to us for these types of loans. |
4
Auto loans comprised the largest component of our consumer loans and third largest component of our overall loan portfolio, representing 85% of our total consumer loans and 10% of our total loans as of December 31, 2016. We have been an indirect lender for our auto loans, meaning that the loans have been originated by automobile dealerships and then assigned to us. These dealerships were selected based on our review of their operating history and the dealership’s reputation in the marketplace, which we believe helps to mitigate the risks of fraud or negligence by the dealership. At all times, the decision whether or not to provide financing resided with us.
In November 2015, the Bank announced that it was exiting the indirect auto loan origination business. The Bank discontinued accepting indirect auto loan applications December 31, 2015, but continued to process and fund applications that were accepted on or before that date. The Bank will continue to service the current auto loan portfolio for its duration but expects this portfolio to decrease over time.
|
|
• |
Residential real estate. One-to-four family residential real estate loans, including second mortgage loans, comprised approximately 20% of our total loans at December 31, 2016. Second mortgage loans in this category include only loans we make to cover the gap between the purchase price of a residence and the amount of the first mortgage; all other second mortgage loans are considered consumer loans. Loan to value ratios do not typically exceed 80%, although some of the mortgage loans that we retain in our portfolio may have higher loan to value ratios. We use an independent appraiser to establish collateral values. We generate residential real estate mortgage loans through Bank referrals and contacts with real estate agents in our markets. We do not originate subprime residential real estate loans. |
Deposits. We offer a broad base of deposit products and services to our individual and business clients, including savings, checking, money market and NOW accounts, debit cards and mobile banking with smartphone deposit capability, as well as a variety of certificates of deposit and individual retirement accounts. For our business clients, we offer a competitive suite of cash management products which include, but are not limited to, remote deposit capture, electronic statements, positive pay, ACH origination and wire transfer, investment sweep accounts and enhanced business internet banking.
Other Banking Services. Investar Bank’s other banking services include cashiers’ checks, direct deposit of payroll and Social Security checks, night depository, bank-by-mail, automated teller machines with deposit automation and debit cards. We have also associated with nationwide networks of automated teller machines, enabling the Bank’s customers to use ATMs throughout Louisiana and other regions. Currently, we reimburse our customers up to $12.50 per month for any foreign ATM fees they may incur. We offer merchant card services through a third-party vendor, and, during 2015, launched our own credit card product. The Bank does not offer trust services or insurance products.
Acquisition Activity
General. To complement our organic growth strategy, from time to time, we evaluate potential acquisition opportunities. We believe there are many banking institutions that continue to face credit challenges, capital constraints and liquidity issues and that lack the scale and management expertise to manage the increasing regulatory burden. Our management team has a long history of identifying targets, assessing and pricing risk and executing acquisitions in a creative, yet disciplined, manner. We seek acquisitions that provide meaningful financial benefits, long-term organic growth opportunities and expense reductions, without compromising our risk profile. Additionally, we seek banking markets with favorable competitive dynamics and potential consolidation opportunities. All of our acquisition activity is evaluated and overseen by a standing Merger and Acquisition Committee of our board of directors.
Acquisition of South Louisiana Business Bank. On October 1, 2011, the Bank completed its acquisition of South Louisiana Business Bank (“SLBB”), a Louisiana-chartered commercial bank with one location in Prairieville, Louisiana. The Bank acquired all of the outstanding common stock of the former SLBB shareholders for a total consideration of approximately $14.7 million in the form of 1,069,065 shares of Bank common stock. Including the effect of purchase accounting adjustments, the Bank acquired assets with a fair value of $50.9 million, including loans with a fair value of $31.5 million, and assumed $38.6 million in deposits. The fair value of net assets acquired including identifiable intangible assets was approximately $12.0 million. Goodwill of approximately $2.7 million was recognized on the acquisition date.
Acquisition of First Community Bank. On May 1, 2013, the Bank completed its acquisition of First Community Bank (“FCB”), a Louisiana-chartered commercial bank headquartered in Hammond, Louisiana with one branch in Mandeville, Louisiana. The Bank acquired all of the outstanding common stock of the former FCB shareholders for a total consideration of approximately $4.5 million in the form of 320,774 shares of Bank common stock. Including the effect of purchase accounting adjustments, the Bank acquired assets with a fair value of $99.2 million, including loans with a fair value of $77.5 million, assumed $86.5 million in deposits and recognized a $0.9 million bargain purchase gain.
5
Definitive Agreement with Citizens. On March 8, 2017, the Company announced that it has entered into a definitive agreement (the “Agreement”) to acquire Citizens Bancshares, Inc. (“Citizens”) and its wholly-owned subsidiary, Citizens Bank, in Ville Platte, Louisiana. According to the terms of the Agreement, the Company will pay a total amount of cash merger consideration to shareholders of Citizens equal to $45.8 million.
At December 31, 2016, Citizens had approximately $245.5 million in assets, $126.8 million in net loans, and $208.7 million in deposits and $35.6 million in stockholder’s equity. Citizens offers a full range of banking products and services to the residents of Evangeline Parish through its three branch locations.
Competition
We face competition in all major product and geographic areas in which we conduct our operations. Through the Bank, we compete for available loans and deposits with state, regional and national banks, as well as savings and loan associations, credit unions, finance companies, mortgage companies, insurance companies, brokerage firms and investment companies. All of these institutions compete in the delivery of services and products through availability, quality and pricing, both with respect to interest rates on loans and deposits and fees charged for banking services. Many of our competitors are larger and have substantially greater resources than we do, including higher total assets and capitalization, greater access to capital markets and a broader offering of financial services. As larger institutions, many of our competitors can offer more attractive pricing than we can offer and have more extensive branch networks from which they can offer their financial services products.
While we continually strive to offer competitive pricing for our banking products, we believe that our community bank approach to customers, focusing on quality customer service and maintaining strong customer relationships affords us the best opportunity to successfully compete with other institutions. In addition, as a smaller institution, we think we can be flexible in developing and implementing new products and services. Further, in recent years there has been consolidation activity involving banks with a presence in our markets. In our view, mergers and other business combinations within our markets provide us with growth opportunities. Many acquisitions, especially when local institutions are acquired by institutions based outside our markets, result not only in customer disruption but also in a loss of market knowledge and relationships that we believe provide us the opportunity to acquire customers seeking a personalized approach to banking. Furthermore, acquisition activity typically creates opportunities to hire talented personnel from the combining institutions.
The following table sets forth certain information about our total deposits and our market share. The amount of total deposits in our markets is as of June 30, 2016, which is the latest date for which such information is available.
|
Market (MSA) |
|
Investar Total Deposits |
|
|
Investar Market Share |
|
||
|
|
|
(in millions) |
|
|
|
|
|
|
|
Baton Rouge |
|
$ |
591 |
|
|
|
3.0 |
% |
|
New Orleans |
|
|
109 |
|
|
|
0.3 |
% |
|
Hammond |
|
|
53 |
|
|
|
3.0 |
% |
|
Lafayette |
|
|
115 |
|
|
|
1.1 |
% |
Supervision and Regulation
General. Banking is highly regulated under federal and state law. We are a financial holding company registered under the Bank Holding Company Act of 1956, as amended, and are subject to supervision, regulation and examination by the Federal Reserve. Investar Bank is a commercial bank chartered under the laws of the State of Louisiana. The Bank is not a member of the Federal Reserve System and is subject to supervision, regulation and examination by the Louisiana Office of Financial Institutions, or OFI, and the Federal Deposit Insurance Corporation, or FDIC. This system of supervision and regulation establishes a comprehensive framework for our operations and, consequently, can have a material impact on our growth and earnings performance.
The primary goals of the bank regulatory scheme are to maintain a safe and sound banking system and to facilitate the conduct of sound monetary policy. This system is intended primarily for the protection of the FDIC’s deposit insurance funds, bank depositors and the public, rather than our shareholders and creditors. The banking agencies have broad enforcement power over bank holding companies and banks, including the authority, among other things, to enjoin “unsafe or unsound” practices, require affirmative action to correct any violation or practice, issue administrative orders that can be judicially enforced, direct increases in capital, direct the sale of subsidiaries or other assets, limit dividends and distributions, restrict growth, assess civil monetary penalties, remove officers and directors, and, with respect to banks, terminate deposit insurance or place the bank into conservatorship or receivership. In general, these enforcement actions may be initiated for violations of laws and regulations or unsafe or unsound practices.
6
The Dodd-Frank Act. The Dodd-Frank Act, enacted on July 21, 2010, aims to restore responsibility and accountability to the financial system by significantly altering the regulation of financial institutions and the financial services industry. Full implementation of the Dodd-Frank Act has required and will continue to require many new rules to be issued by federal regulatory agencies over the next several years, which will profoundly affect how financial institutions will be regulated in the future. The ultimate effect of the Dodd-Frank Act and its implementing regulations on the financial services industry in general, and on us in particular, is uncertain at this time.
The Dodd-Frank Act, among other things:
|
|
• |
established the Consumer Financial Protection Bureau, an independent organization within the Federal Reserve with centralized responsibility for promulgating and enforcing federal consumer protection laws applicable to all entities offering consumer financial products or services; |
|
|
• |
established the Financial Stability Oversight Council, tasked with the authority to identify and monitor institutions and systems that pose a systemic risk to the financial system; |
|
|
• |
changed the assessment base for federal deposit insurance from the amount of insured deposits held by the depository institution to the institution’s average total consolidated assets less tangible equity; |
|
|
• |
increased the minimum reserve ratio for the Deposit Insurance Fund from 1.15% to 1.35%; |
|
|
• |
permanently increased the deposit insurance coverage amount from $100,000 to $250,000; |
|
|
• |
required the FDIC to make its capital requirements for insured depository institutions countercyclical, so that capital requirements increase in times of economic expansion and decrease in times of economic contraction; |
|
|
• |
required bank holding companies and banks to be “well capitalized” and “well managed” in order to acquire banks located outside of their home state and requires any bank holding company electing to be treated as a financial holding company to be “well capitalized” and “well managed” |
|
|
• |
directed the Federal Reserve to establish interchange fees for debit cards under a restrictive “reasonable and proportional cost” per transaction standard; |
|
|
• |
limited the ability of banking organizations to sponsor or invest in private equity and hedge funds and to engage in proprietary trading; |
|
|
• |
increased regulation of consumer protections regarding mortgage originations, including originator compensation, minimum repayment standards and prepayment consideration; |
|
|
• |
restricted the preemption of select state laws by federal banking law applicable to national banks and disallow subsidiaries and affiliates of national banks from availing themselves of such preemption; |
|
|
• |
authorized national and state banks to establish de novo branches in any state that would permit a bank chartered in that state to open a branch at that location; and |
|
|
• |
repealed the federal prohibition on the payment of interest on demand deposits, thereby permitting depository institutions to pay interest on business transaction and other accounts. |
Some of these provisions may have the consequence of increasing our expenses, decreasing our revenues, and changing the activities in which we choose to engage. The environment in which banking organizations will operate after the financial crisis, including legislative and regulatory changes affecting capital, liquidity, supervision, permissible activities, corporate governance and compensation, changes in fiscal policy and steps to eliminate government support for banking organizations, may have long-term effects on the business model and profitability of banking organizations that cannot currently be foreseen. The specific impact on our current activities or new financial activities we may consider in the future, our financial performance and the markets in which we operate will depend on the manner in which the relevant agencies develop and implement the required rules and the reaction of market participants to these regulatory developments. Many aspects of the Dodd-Frank Act are subject to further rulemaking and will take effect over several years. While we cannot predict what effect any presently contemplated or future changes in the laws or regulations or their interpretations would have on us, these changes could be materially adverse to our financial condition and results of operations.
7
The Volcker Rule. On December 10, 2013, the Federal Reserve and the other federal banking regulators as well as the SEC each adopted a final rule implementing Section 619 of the Dodd-Frank Act, commonly referred to as the “Volcker Rule.” Generally speaking, the final rule prohibits a bank and its affiliates from engaging in proprietary trading and from sponsoring certain “covered funds” or from acquiring or retaining any ownership interest in such covered funds. Most private equity, venture capital and hedge funds are considered “covered funds” as are bank trust preferred collateralized debt obligations. The final rule requires banking entities to divest disallowed securities by July 21, 2015, subject to extension upon application. The Volcker Rule does not impact any of our current activities nor do we hold any securities that we would be required to sell under the rule, but it does limit the scope of permissible activities in which we might engage in the future.
Regulatory Capital Requirements
Capital Adequacy. The Federal Reserve Board monitors the capital adequacy of the Company, on a consolidated basis, and the FDIC and the OFI monitor the capital adequacy of the Bank. The regulatory agencies use a combination of risk-based guidelines and a leverage ratio to evaluate capital adequacy and consider these capital levels when taking action on various types of applications and when conducting supervisory activities related to safety and soundness. The risk-based capital standards are designed to make regulatory capital requirements more sensitive to differences in risk profiles among financial institutions and their holding companies, to account for off-balance sheet exposure, and to minimize disincentives for holding liquid assets. A financial institution’s assets and off-balance sheet items, such as letters of credit and unfunded loan commitments, are assigned to broad risk categories, each with appropriate risk weights. Regulatory capital, in turn, is classified in one of two tiers. “Tier 1” capital includes two components: (1) common equity Tier 1 capital and (2) additional Tier 1 capital. Common equity Tier 1 capital consists solely of common stock (plus related surplus), retained earnings, accumulated other comprehensive income, and limited amounts of minority interests that are in the form of common stock. Additional Tier 1 capital includes other perpetual instruments historically included in Tier 1 capital, such as non-cumulative perpetual preferred stock. “Tier 2” capital includes, among other things, qualifying subordinated debt and allowances for loan and lease losses, subject to limitations. The resulting capital ratios represent capital as a percentage of total risk-weighted assets and off-balance sheet items.
Effective January 1, 2015, the minimum capital standards under Basel III, as well as the prompt corrective action standards discussed below, increased from previous requirements as a result of changes adopted by the federal banking agencies, which are described in greater detail below under “Basel III.”
Prompt Corrective Action Regulations. Under the prompt corrective action regulations, the FDIC is required and authorized to take supervisory actions against undercapitalized financial institutions. For this purpose, a bank is placed in one of the following five categories based on its capital: well capitalized, adequately capitalized, undercapitalized, significantly undercapitalized, and critically undercapitalized. Under the prompt corrective action regulations, as currently in effect, to be well capitalized, a bank must have a leverage capital ratio of at least 5%, a common equity Tier 1 capital ratio of at least 6.5%, a Tier 1 risk-based capital ratio of at least 8% and a total risk-based capital ratio of at least 10% and must not be subject to any order or written agreement or directive by a federal banking agency to meet and maintain a specific capital level for any capital measure. As discussed below under “Basel III,” the federal banking agencies have adopted changes to the capital thresholds applicable to each of the five categories under the prompt corrective action regulations.
Federal banking regulators are required to take various mandatory supervisory actions and are authorized to take other discretionary actions with respect to institutions in the three undercapitalized categories. The severity of the action depends upon the capital category in which the institution is placed. Generally, subject to a narrow exception, banking regulators must appoint a receiver or conservator for an institution that is critically undercapitalized. The federal banking agencies have specified by regulation the relevant capital level for each category. An institution that is categorized as undercapitalized, significantly undercapitalized, or critically undercapitalized is required to submit an acceptable capital restoration plan to its appropriate federal banking agency. An undercapitalized institution also is generally prohibited from increasing its average total assets, making acquisitions, establishing any branches or engaging in any new line of business, except under an accepted capital restoration plan or with FDIC approval. The regulations also establish procedures for downgrading an institution to a lower capital category based on supervisory factors other than capital.
Furthermore, a bank holding company must guarantee that a subsidiary depository institution meets its capital restoration plan, subject to various limitations. The controlling holding company’s obligation to fund a capital restoration plan is limited to the lesser of 5% of an undercapitalized subsidiary’s assets at the time it became undercapitalized or the amount required to meet regulatory capital requirements.
The capital classification of a bank affects the frequency of regulatory examinations, the bank’s ability to engage in certain activities and the deposit insurance premiums paid by the bank. As of December 31, 2016, Investar Bank met the requirements to be categorized as well capitalized under the prompt corrective action framework as currently in effect.
8
Basel III. On July 2, 2013, the federal banking agencies adopted a final rule revising the regulatory capital framework applicable to all top tier bank holding companies with consolidated assets of $500 million or more and all banks, regardless of size. The Basel III framework became effective on January 1, 2015, although the capital conservation buffer, which is discussed in greater detail below, will be phased in over a three year period, beginning January 1, 2016.
Under the Basel III framework, we are required to maintain the following minimum regulatory capital ratios:
|
|
• |
A new ratio of common equity Tier 1 capital to total risk-weighted assets of not less than 4.5%; |
|
|
• |
A Tier 1 risk-based capital ratio of 6.0% (an increase from 4.0%); |
|
|
• |
A total risk-based capital ratio of 8.0%; and |
|
|
• |
A leverage ratio of 4.0%. |
The Basel III framework also changes the regulatory capital requirements for purposes of the prompt corrective action regulations. Accordingly, as of January 1, 2015, to be categorized as well capitalized, the Bank must have a minimum common equity Tier 1 capital ratio of at least 6.5%, a Tier 1 risk-based capital ratio of at least 8.0%, a total risk-based capital ratio of at least 10.0%, and a leverage capital ratio of at least 5.0%.
Under the Basel III framework, Tier 1 capital is redefined to include two components: (1) common equity Tier 1 capital and (2) additional Tier 1 capital. Common equity Tier 1 capital consists solely of common stock (plus related surplus), retained earnings, accumulated other comprehensive income, and limited amounts of minority interests that are in the form of common stock. Additional Tier 1 capital includes other perpetual instruments historically included in Tier 1 capital, such as non-cumulative perpetual preferred stock. With limited exceptions, trust preferred securities and cumulative perpetual preferred stock will no longer qualify as Tier 1 capital. Tier 2 capital consists of instruments that currently qualify as Tier 2 capital plus instruments that the rule has disqualified from Tier 1 capital treatment. In addition, the Basel III framework establishes certain deductions from and adjustments to the regulatory capital ratios.
The Basel III framework also implements a requirement for all banking organizations to maintain a capital conservation buffer above the minimum capital requirements to avoid certain restrictions on capital distributions and discretionary bonus payments to executive officers. The capital conservation buffer must be composed of common equity Tier 1 capital. The capital conservation buffer requirement, when fully phased in, will effectively require banking organizations to maintain regulatory capital ratios at least 50 basis points higher than well capitalized levels under prompt corrective action standards to avoid the restrictions on capital distributions and discretionary bonus payments to executive officers.
The Basel III framework alters the method under which banking organizations must calculate risk-weighted assets in an effort to make the calculation of risk-weighted assets more risk sensitive, to better account for risk mitigation techniques, and to create substitutes for credit ratings (in accordance with the Dodd-Frank Act). The standardized approach, which will apply to us, includes additional exposure categories as compared with current standards including a new high volatility commercial real estate category that is risk-weighted at 150%. Although a number of asset classes will be risk-weighted differently, the Basel III framework does not change standardized risk weightings for certain assets, including residential mortgages.
Although management is continuing to evaluate the impact the Basel III framework will have on the Company and the Bank, we were in compliance with all applicable minimum regulatory capital requirements as of December 31, 2016, and management believes that at December 31, 2016, the Company and the Bank would have met all new capital adequacy requirements under the new Basel III framework on a fully phased-in basis if such requirements were then effective.
The Basel III framework also requires banks and bank holding companies to measure their liquidity against specific liquidity tests. However, the final rules adopted by the federal banking agencies in September 2014 implementing the Basel III liquidity framework apply only to banking organizations with $250 billion or more in consolidated assets or $10 billion or more in foreign exposures. As a result, unless modified, the Basel III liquidity framework does not apply to us.
9
Acquisitions by Bank Holding Companies
Federal and state laws, including the Bank Holding Company Act and the Change in Bank Control Act, impose additional prior notice or approval requirements and ongoing regulatory requirements on any investor that seeks to acquire direct or indirect “control” of an FDIC-insured depository institution or bank holding company. We must obtain the prior approval of the Federal Reserve before (1) acquiring more than 5% of the voting stock of any bank or other bank holding company, (2) acquiring all or substantially all of the assets of any bank or bank holding company, or (3) merging or consolidating with any other bank holding company. The Federal Reserve may determine not to approve any of these transactions if it would result in or tend to create a monopoly or substantially lessen competition or otherwise function as a restraint of trade, unless the anti-competitive effects of the proposed transaction are clearly outweighed by the public interest in meeting the convenience and needs of the community to be served. The Federal Reserve is also required to consider the financial and managerial resources and future prospects of the bank holding companies and banks concerned, the convenience and needs of the community to be served, and the record of a bank holding company and its subsidiary bank(s) in combating money laundering activities. In addition, a failure to implement and maintain adequate compliance programs could cause the Federal Reserve or other banking regulators not to approve an acquisition when regulatory approval is required or to prohibit an acquisition even if approval is not required.
Scope of Permissible Bank Holding Company Activities
In general, the Bank Holding Company Act limits the activities permissible for bank holding companies to the business of banking, managing or controlling banks and such other activities as the Federal Reserve has determined to be so closely related to banking as to be properly incident thereto.
A bank holding company may elect to be treated as a financial holding company and receive expanded powers if it and its depository institution subsidiaries are “well capitalized” and “well managed.” We have elected for the Company to be treated as a financial holding company. As a financial holding company, we may engage in a range of activities that are (1) financial in nature or incidental to such financial activity or (2) complementary to a financial activity and which do not pose a substantial risk to the safety and soundness of a depository institution or to the financial system generally. These activities include securities dealing, underwriting and market making, insurance underwriting and agency activities, merchant banking and insurance company portfolio investments. Expanded financial activities of financial holding companies generally will be regulated according to the type of such financial activity: banking activities by banking regulators; securities activities by securities regulators; and insurance activities by insurance regulators.
The Bank Holding Company Act does not place territorial limitations on permissible non-banking activities of bank holding companies. The Federal Reserve has the power to order any bank holding company or its subsidiaries to terminate any activity or to terminate its ownership or control of any subsidiary when the Federal Reserve has reasonable grounds to believe that continuation of such activity or such ownership or control constitutes a serious risk to the financial soundness, safety or stability of any bank subsidiary of the bank holding company.
Source of Strength Doctrine for Bank Holding Companies
Under longstanding Federal Reserve policy which has been codified by the Dodd-Frank Act, we are expected to act as a source of financial strength to, and to commit resources to support, Investar Bank. This support may be required at times when we may not be inclined to provide it. In addition, any capital loans that we make to Investar Bank are subordinate in right of payment to deposits and to certain other indebtedness of the Bank. In the event of our bankruptcy, any commitment by us to a federal bank regulatory agency to maintain the capital of the Bank will be assumed by the bankruptcy trustee and entitled to a priority of payment.
Dividends
As a bank holding company, we are subject to certain restrictions on dividends under applicable banking laws and regulations. The Federal Reserve has issued a policy statement that provides that a bank holding company should not pay dividends unless: (1) its net income over the last four quarters (net of dividends paid) has been sufficient to fully fund the dividends; (2) the prospective rate of earnings retention appears to be consistent with the capital needs, asset quality and overall financial condition of the bank holding company and its subsidiaries; and (3) the bank holding company will continue to meet minimum required capital adequacy ratios. Accordingly, a bank holding company should not pay cash dividends that exceed its net income or that can only be funded in ways that weaken the bank holding company’s financial health, such as by borrowing. The Dodd-Frank Act imposes, and Basel III effected, additional restrictions on the ability of banking institutions to pay dividends. In addition, in the current financial and economic environment, the Federal Reserve Board has indicated that bank holding companies should carefully review their dividend policy and has discouraged payment ratios that are at maximum allowable levels unless both asset quality and capital are very strong.
10
The Bank is also subject to certain restrictions on dividends under federal and state laws, regulations and policies. In general, under Louisiana law, the Bank may pay dividends to us without the approval of the OFI only so long as the amount of the dividend does not exceed the Bank’s net profits earned during the current year combined with its retained net profits of the immediately preceding year. The Bank must obtain the approval of the OFI for any amount in excess of this threshold. In addition, under federal law, the Bank may not pay any dividend to us if it is undercapitalized or the payment of the dividend would cause it to become undercapitalized. The FDIC may further restrict the payment of dividends by requiring the Bank to maintain a higher level of capital than would otherwise be required to be adequately capitalized for regulatory purposes. Moreover, if, in the opinion of the FDIC, the Bank is engaged in an unsound practice (which could include the payment of dividends even within the legal requirements noted above), the FDIC may require, generally after notice and hearing, the Bank to cease such practice. The FDIC has indicated that paying dividends that deplete a depository institution’s capital base to an inadequate level would be an unsafe banking practice. The FDIC has also issued policy statements providing that insured depository institutions generally should pay dividends only out of current operating earnings.
Restrictions on Transactions with Affiliates and Loans to Insiders
Federal law strictly limits the ability of banks to engage in transactions with their affiliates, including their bank holding companies. Sections 23A and 23B of the Federal Reserve Act, and Federal Reserve Regulation W, impose quantitative limits, qualitative standards, and collateral requirements on certain transactions by a bank with, or for the benefit of, its affiliates, and generally require those transactions to be on terms at least as favorable to the bank as transactions with non-affiliates and to be consistent with safe and sound practices. The Dodd-Frank Act significantly expands the coverage and scope of the limitations on affiliate transactions within a banking organization, including an expansion of what types of transactions are covered transactions to include credit exposures related to derivatives, repurchase agreements and securities lending arrangements and an increase in the amount of time for which collateral requirements regarding covered transactions must be satisfied.
Federal law also limits a bank’s authority to extend credit to its directors, executive officers and 10% shareholders, as well as to entities controlled by such persons. Among other things, extensions of credit to insiders are required to be made on terms that are substantially the same as, and follow credit underwriting procedures that are not less stringent than, those prevailing for comparable transactions with unaffiliated persons. Also, the terms of such extensions of credit may not involve more than the normal risk of repayment or present other unfavorable features and may not exceed certain limitations on the amount of credit extended to such persons, individually and in the aggregate, which limits are based, in part, on the amount of the bank’s capital.
Incentive Compensation Guidance
The federal banking agencies have issued comprehensive guidance on incentive compensation policies. This guidance is designed to ensure that a financial institution’s incentive compensation structure does not encourage imprudent risk taking, which may undermine the safety and soundness of the institution. The guidance, which applies to all employees that have the ability to materially affect an institution’s risk profile, either individually or as part of a group, is based upon three primary principles: (1) balanced risk taking incentives; (2) compatibility with effective controls and risk management; and (3) strong corporate governance.
An institution’s supervisory ratings will incorporate any identified deficiencies in an institution’s compensation practices, and it may be subject to an enforcement action if the incentive compensation arrangements pose a risk to the safety and soundness of the institution. Further, a provision of the Basel III proposals described above would limit discretionary bonus payments to bank executives if the institution’s regulatory capital ratios fail to exceed certain thresholds.
Deposit Insurance Assessments
FDIC insured banks are required to pay deposit insurance assessments to the FDIC. The amount of the assessment is based on the size of the bank’s assessment base, which is equal to its average consolidated total assets less its average tangible equity, and its risk classification under an FDIC risk-based assessment system. Institutions assigned to higher risk classifications (that is, institutions that pose a higher risk of loss to the Deposit Insurance Fund) pay assessments at higher rates than institutions that pose a lower risk. An institution’s risk classification is assigned based on its capital levels and the level of supervisory concern that the institution poses to the regulators. In addition, the FDIC can impose special assessments in certain instances. As noted above, the Dodd-Frank Act changed the way that deposit insurance premiums are calculated. Continued action by the FDIC to replenish the Deposit Insurance Fund, as well as the changes contained in the Dodd-Frank Act, may result in higher assessment rates, which could reduce our profitability or otherwise negatively impact our operations.
11
Branching and Interstate Banking
Under Louisiana law, Investar Bank is permitted to establish additional branch offices within Louisiana, subject to the approval of the OFI. As a result of the Dodd-Frank Act, the Bank may also establish additional branch offices outside of Louisiana, subject to prior regulatory approval, so long as the laws of the state where the branch is to be located would permit a state bank chartered in that state to establish a branch. We currently do not have any branches outside the state of Louisiana. The Bank may also establish offices in other states by merging with banks or by purchasing branches of other banks in other states, subject to certain restrictions.
Community Reinvestment Act
Investar Bank is required under the Community Reinvestment Act, or CRA, and related FDIC regulations to help meet the credit needs of its communities, including low and moderate-income borrowers. In connection with its examination of the Bank, the FDIC assesses our record of compliance with the CRA. The Bank’s failure to comply with the provisions of the CRA could, at a minimum, result in denial of certain corporate applications, such as branches or mergers, or in restrictions on its or the Company’s activities. The Bank received a “satisfactory” CRA rating on its most recent CRA examination. The CRA requires all FDIC insured institutions to publicly disclose their rating.
Concentrated Commercial Real Estate Lending Regulations
The federal banking regulatory agencies have promulgated guidance governing financial institutions with concentrations in commercial real estate lending. The guidance provides that a bank has a concentration in commercial real estate lending if (i) total reported loans for construction, land development, and other land represent 100% or more of total capital or (ii) total reported loans secured by multifamily and nonfarm residential properties and loans for construction, land development, and other land represent 300% or more of total capital and the bank’s commercial real estate loan portfolio has increased 50% or more during the prior 36 months. Owner occupied loans are excluded from this second category. If a concentration is present, management must employ heightened risk management practices that address, among other things, board and management oversight and strategic planning, portfolio management, development of underwriting standards, risk assessment and monitoring through market analysis and stress testing, and maintenance of increased capital levels as needed to support the level of commercial real estate lending. At December 31, 2016, the Company did not have a concentration in commercial real estate as defined by the regulatory guidance.
Financial Privacy Requirements
Federal law and regulations limit a financial institution’s ability to share consumer financial information with unaffiliated third parties. Specifically, these provisions require all financial institutions offering financial products or services to retail customers to provide such customers with the financial institution’s privacy policy and provide such customers the opportunity to “opt out” of the sharing of personal financial information with unaffiliated third parties. The sharing of information for marketing purposes is also subject to limitations. The Bank currently has a privacy protection policy in place.
Consumer Laws and Regulations
The Bank is subject to numerous laws and regulations intended to protect consumers in transactions with the Bank, including, among others, laws regarding unfair, deceptive and abusive acts and practices, usury laws, and other federal consumer protection statutes. These federal laws include the ECOA, the Electronic Fund Transfer Act, the Fair Credit Reporting Act, the Fair Debt Collection Practices Act, the Real Estate Procedures Act of 1974, the S.A.F.E. Mortgage Licensing Act of 2008, the Truth in Lending Act and the Truth in Savings Act, among others. Many states and local jurisdictions have consumer protection laws analogous, and in addition, to those enacted under federal law. These laws and regulations mandate certain disclosure requirements and regulate the manner in which financial institutions must deal with customers when taking deposits, making loans and conducting other types of transactions. Failure to comply with these laws and regulations could give rise to regulatory sanctions, customer rescission rights, action by state and local attorneys general and civil or criminal liability.
In addition, the Dodd-Frank Act created the Consumer Financial Protection Bureau that has broad authority to regulate and supervise retail financial services activities of banks and various non-bank providers. The Bureau has authority to promulgate regulations, issue orders, guidance and policy statements, conduct examinations and bring enforcement actions with regard to consumer financial products and services. In general, however, banks with assets of $10 billion or less, such as Investar Bank, will continue to be examined for consumer compliance by their primary federal bank regulator.
12
The Dodd-Frank Act authorized the Consumer Financial Protection Bureau to establish certain minimum standards for the origination of residential mortgages, including a determination of the borrower’s ability to repay. Under the Dodd-Frank Act, financial institutions may not make a residential mortgage loan unless they make a “reasonable and good faith determination” that the consumer has a “reasonable ability” to repay the loan. The Dodd-Frank Act allows borrowers to raise certain defenses to foreclosure but provides a full or partial safe harbor from such defenses for loans that are “qualified mortgages.” On January 10, 2013, the Bureau published final rules to, among other things, specify the types of income and assets that may be considered in the ability-to-repay determination, the permissible sources for verification, and the required methods of calculating the loan’s monthly payments. Since then, the Bureau has made certain modifications to these rules. The rules extend the requirement that creditors verify and document a borrower’s income and assets to include all information that creditors rely on in determining repayment ability. The rules also provide further examples of third-party documents that may be relied on for such verification, such as government records and check cashing or funds transfer service receipts. The new rules became effective on January 10, 2014. The rules also define “qualified mortgages,” imposing both underwriting standards, for example, a borrower’s debt-to-income ratio may not exceed 43%, and limits on the terms of their loans. Points and fees are subject to a relatively stringent cap, and the terms include a wide array of payments that may be made in the course of closing a loan. Certain loans, including interest-only loans and negative amortization loans, cannot be qualified mortgages.
Anti-Money Laundering and OFAC
Under federal law, financial institutions must maintain anti-money laundering programs that include: established internal policies, procedures and controls; a designated compliance officer; an ongoing employee training program; and testing of the program by an independent audit function. Financial institutions are also prohibited from entering into specified financial transactions and account relationships and must meet enhanced standards for due diligence and customer identification in their dealings with foreign financial institutions and foreign customers. Financial institutions must take reasonable steps to conduct enhanced scrutiny of account relationships to guard against money laundering and to report any suspicious transactions, and law enforcement authorities have been granted increased access to financial information maintained by financial institutions.
The Office of Foreign Assets Control, or OFAC, is responsible for helping to insure that U.S. entities do not engage in transactions with certain prohibited parties, as defined by various Executive Orders and Acts of Congress. OFAC publishes lists of persons and organizations suspected of aiding, harboring or engaging in terrorist acts, known as Specially Designated Nationals and Blocked Persons. Generally, if the Bank identifies a transaction, account or wire transfer relating to a person or entity on an OFAC list, it must freeze the account or block the transaction, file a suspicious activity report and notify the appropriate authorities.
Bank regulators routinely examine institutions for compliance with these obligations and they must consider an institution’s compliance in connection with the regulatory review of applications, including applications for banking mergers and acquisitions. Failure of a financial institution to maintain and implement adequate programs to combat money laundering and terrorist financing and comply with OFAC sanctions, or to comply with relevant laws and regulations, could have serious legal, reputational and financial consequences for the institution.
Safety and Soundness Standards
Federal bank regulatory agencies have adopted guidelines that establish general standards relating to internal controls and information systems, internal audit systems, loan documentation, credit underwriting, interest rate exposure, asset growth and compensation, fees and benefits. Additionally, the agencies have adopted regulations that provide the authority to order an institution that has been given notice by an agency that it is not satisfying any of these safety and soundness standards to submit a compliance plan. If, after being so notified, an institution fails to submit an acceptable compliance plan or fails in any material respect to implement an acceptable compliance plan, the agency must issue an order directing action to correct the deficiency and may issue an order directing other actions of the types to which an undercapitalized institution is subject under the “prompt corrective action” provisions of the Federal Deposit Insurance Act. If an institution fails to comply with such an order, the agency may seek to enforce such order in judicial proceedings and to impose civil money penalties.
Bank holding companies are also not permitted to engage in unsound banking practices. For example, the Federal Reserve’s Regulation Y requires a holding company to give the Federal Reserve prior notice of any redemption or repurchase of its own equity securities, if the consideration to be paid, together with the consideration paid for any repurchases in the preceding year, is equal to 10% or more of the company’s consolidated net worth. The Federal Reserve may oppose the transaction if it believes that the transaction would constitute an unsafe or unsound practice or would violate any law or regulation. As another example, a holding company could not impair its subsidiary bank’s soundness by causing it to make funds available to non-banking subsidiaries or their customers if the Federal Reserve believed it not prudent to do so. The Federal Reserve has broad authority to prohibit activities of bank holding companies and their nonbanking subsidiaries that represent unsafe and unsound banking practices or that constitute violations of laws or regulations.
13
Effect of Governmental Monetary Policies
The commercial banking business is affected not only by general economic conditions but also by U.S. fiscal policy and the monetary policies of the Federal Reserve. Some of the instruments of monetary policy available to the Federal Reserve include changes in the discount rate on member bank borrowings, the fluctuating availability of borrowings at the “discount window,” open market operations, the imposition of and changes in reserve requirements against member banks’ deposits and assets of foreign branches, and the imposition of and changes in reserve requirements against certain borrowings by banks and their affiliates. These policies influence to a significant extent the overall growth of bank loans, investments, and deposits and the interest rates charged on loans or paid on deposits. We cannot predict the nature of future fiscal and monetary policies and the effect of these policies on our future business and earnings.
Future Legislation and Regulatory Reform
As a result of the recent economic downturn and its effect on financial institutions, regulators have increased their focus on the regulation of financial institutions. New laws, regulations and policies are regularly proposed that contain wide-ranging proposals for altering the structures, regulations and competitive relationships of financial institutions operating in the United States. In addition, existing laws, regulations and policies are continually subject to modification or changes in interpretation. We cannot predict whether or in what form any law, regulation or policy will be adopted or modified or the extent to which our operations and activities, financial condition, results of operations, growth plans or future prospects may be affected by its adoption or modification.
The cumulative effect of these laws and regulations add significantly to the cost of our operations and thus have a negative impact on profitability. There has also been a tremendous expansion in recent years of financial service providers that are not subject to the same level of regulation, examination and oversight as we are. Those providers, because they are not so highly regulated, may have a competitive advantage over us and may continue to draw large amounts of funds away from traditional banking institutions, with a continuing adverse effect on the banking industry in general.
Employees
As of December 31, 2016, we had 152 full-time equivalent employees. None of our employees are represented by any collective bargaining unit or are parties to a collective bargaining agreement. We believe that our relations with our employees are good.
Dependence upon a Single Customer
No material portion of our loans has been made to, nor have our deposits been obtained from, a single or small group of customers; the loss of any single customer or small group of customers would not have a materially adverse effect on our business. A discussion of concentrations of credit in our loan portfolio is set forth under the heading Loan Concentrations in “Discussion and Analysis of Financial Condition—Loans” in Item 7, Management’s Discussion and Analysis of Financial Condition and Results of Operations.
Available Information
Our filings with the Securities and Exchange Commission (the “SEC”), including annual reports on Form 10-K, quarterly reports on Form 10-Q, current reports on Form 8-K and all amendments thereto, are available on our website as soon as reasonably practicable after the reports are filed with or furnished to the SEC. Copies can be obtained free of charge in the “Investor Relations” section of our website at www.investarbank.com. Our SEC filings are also available through the SEC’s website www.sec.gov. Copies of these filings are also available by writing to us at the following address:
Investar Holding Corporation
P.O. Box 84207
Baton Rouge, Louisiana 70884-4207
14
Our business is subject to risk. In addition to the other information contained in this Annual Report on Form 10-K, including management’s discussion and analysis of financial condition and results of operations and our financial statements and the notes thereto, investors should consider the following risks when evaluating whether to invest in our common stock. If any of the following risks occur, whether alone or in combination, our business, financial condition, results of operations, cash flows and growth prospects could be materially and adversely affected. Additional risks that we do not presently know of or currently deem immaterial may also adversely affect our business, financial condition, results of operations cash flows and growth prospects.
Risks Related to our Business
As a business operating in the financial services industry, our business and operations may be adversely affected by current economic conditions.
General business and economic conditions in the United States and abroad can materially affect our business and operations. A weak U.S. economy is likely to cause uncertainty about the federal fiscal policymaking process, the medium and long-term fiscal outlook of the federal government and future tax rates. In addition, economic conditions in foreign countries, including uncertainty over the stability of the euro currency, could affect the stability of global financial markets, which could hinder U.S. economic growth.
Weak economic conditions are characterized by deflation, fluctuations in debt and equity capital markets, a lack of liquidity and/or depressed prices in the secondary market for mortgage loans, increased delinquencies on mortgage, consumer and commercial loans, residential and commercial real estate price declines and lower home sales and commercial activity. The current economic environment in the United States is also characterized by interest rates at historically low levels, which impacts our ability to attract deposits and to generate attractive earnings through our investment portfolio. All of these factors are detrimental to our business, and the interplay between these factors can be complex and unpredictable. Our business is also significantly affected by monetary and related policies of the U.S. federal government and its agencies. Changes in any of these policies are influenced by macroeconomic conditions and other factors that are beyond our control. Adverse economic conditions and government policy responses to such conditions could have a material adverse effect on our business, financial condition, results of operations and growth prospects.
Our business strategy includes the continuation of growth plans, and our financial condition and results of operations could be negatively affected if we fail to grow or fail to manage our growth effectively.
We have grown our business primarily through de novo branching and through the acquisition of other financial institutions. Since June 14, 2006, we have opened eight de novo branches and acquired South Louisiana Business Bank (“SLBB”) in 2011 and First Community Bank (“FCB”) in 2013 by merger. We intend to continue pursuing a growth strategy for our business through de novo branching and to evaluate attractive acquisition opportunities that are presented to us. Our growth prospects must be considered in light of the risks, expenses and difficulties frequently encountered by companies when expanding their franchise, including the following:
|
|
• |
Management of Growth. We may be unable to successfully maintain loan quality in the context of significant loan growth or maintain adequate management personnel and systems to oversee such growth, including internal audit, loan review and compliance personnel. Our growth may require that we implement additional policies, procedures and operating systems, and we may encounter difficulties in doing so at all or in a timely manner. |
|
|
• |
Operating Results. There is no assurance that existing offices or future offices will maintain or achieve deposit levels, loan balances or other operating results necessary to avoid losses or produce profits. Our growth and de novo branching strategy necessarily entails growth in overhead expenses as we routinely add new offices and staff. Our historical results may not be indicative of future results or results that may be achieved as we continue to increase the number and concentration of our branch offices. Should any new location be unprofitable or marginally profitable, or should any existing location experience a decline in profitability or incur losses, the adverse effect on our results of operations and financial condition could be more significant than would be the case for a larger company. |
|
|
• |
De Novo Branching. There are considerable costs involved in opening branches, and new branches generally do not generate sufficient revenues to offset their costs until they have been in operation for at least a year or more. Accordingly, our de novo branches can be expected to negatively impact our earnings for some period of time until the branches reach certain economies of scale. Our expenses could be further increased if we encounter delays in opening any of our de novo branches. We may be unable to accomplish future branch expansion plans due to a lack of available satisfactory sites, difficulties in acquiring such sites, increased expenses or loss of potential sites due to complexities associated with zoning and permitting processes, higher than anticipated merger and acquisition costs or other factors. Finally, we have no assurance our de novo branches or branches that we may acquire will be successful even after they have been established or acquired, as the case may be. |
15
Failure to successfully address these issues could have a material adverse effect on our financial condition and results of operations, and could adversely affect our ability to successfully implement our business strategy. Also, if our growth occurs more slowly than anticipated or declines, our operating results could be materially adversely affected.
Our success depends significantly on our management team, and the loss of our senior executive officers or other key employees and our inability to recruit or retain suitable replacements could adversely affect our business, results of operations and growth prospects.
Our success depends significantly on the continued service and skills of our existing executive management team. The implementation of our business and growth strategies also depends significantly on our ability to retain employees with experience and business relationships within their respective market areas, as well as on our ability to attract, motivate and retain highly qualified senior and middle management. We do not have employment agreements with any of our executive officers, and our officers may terminate their employment with us at any time. Competition for employees is intense, and we could have difficulty replacing such officers with personnel with the combination of skills and attributes required to execute our business and growth strategies and who have ties to the communities within our market areas. The loss of any of our key personnel could therefore have a material adverse effect on our business, financial condition, results of operations and growth prospects.
As a community bank, our ability to maintain our reputation is critical to the growth of our business.
We are a community bank and our reputation is one of the most valuable components of our business. Much of our growth over the past several years has depended on attracting new customers from competing financial institutions and increasing our market share, primarily through the involvement of our employees in the communities that we serve. Also, our ability to attract and retain highly-skilled management and employees is impacted by our reputation. A negative public opinion of our business can result from any number of activities, including our lending practices, corporate governance, and regulatory compliance, acquisitions, and actions taken by our regulators or by community organizations in response to these activities. Significant harm to our reputation could also arise as a result of regulatory or governmental actions, litigation, employee misconduct, or the activities of our customers, other participants in the financial services industry or our contractual counterparties, such as our service providers and vendors. Damage to our reputation could also adversely affect our credit ratings and access to capital markets.
Our business is concentrated in southern Louisiana, and a regional or local economic downturn affecting southern Louisiana may magnify the adverse effects and consequences to us.
We conduct our operations almost exclusively in southern Louisiana, and more specifically, in the Baton Rouge, New Orleans, Lafayette and Hammond metropolitan areas. At December 31, 2016, approximately 96% of the secured loans in our total loan portfolio are secured by properties and other collateral located in Louisiana, while approximately 75% of the loans in our loan portfolio (measured by dollar amount) were made to borrowers who live or work in either the Baton Rouge or New Orleans metropolitan area. This geographic concentration imposes a greater risk to us than to our competitors in the area who maintain significant operations outside of southern Louisiana. Accordingly, any regional or local economic downturn, or natural or man-made disaster, that affects southern Louisiana or existing or prospective property or borrowers in such area may affect us and our profitability more significantly and more adversely than our more geographically diversified competitors.
More particularly, much of our business development and marketing strategy is directed toward fulfilling the banking and financial services needs of small to medium-sized businesses. Such businesses generally have fewer financial resources in terms of capital or borrowing capacity than larger entities. If general economic conditions negatively impact our markets or the Louisiana market generally and these businesses are adversely affected, our financial condition and results of operations may be negatively affected.
16
Adverse economic factors affecting particular industries could have a negative effect on our customers and their ability to make payments to us.
In addition to the geographic concentration of our markets, certain industry-specific economic factors also affect us. For example, a downturn in segments of the commercial and residential real estate industries in our markets due to adverse economic factors affecting particular industries could have an adverse effect on our customers. In addition, the energy sector, which is historically cyclical, has recently experienced significant volatility and a decline in oil and gas prices. While we consider our exposure to the energy sector to not be significant, comprising less than 1% of total loans as of December 31, 2016, should the price of oil and gas decline further and/or remain at the current low price for an extended period, the general economic conditions in our south Louisiana markets could be negatively affected, which could have a material adverse effect on our business, financial condition, and results of operations.
We have a significant number of loans secured by real estate, and a downturn in the real estate market could result in losses and negatively impact our profitability.
At December 31, 2016, approximately 78% of our total loan portfolio had real estate as a primary or secondary component of the collateral securing the loan. The real estate provides an alternate source of repayment in the event of a default by the borrower and may deteriorate in value during the time the credit is extended. Real estate values in southern Louisiana declined in the aftermath of Hurricane Katrina in August 2005. These values started to improve in 2006 and 2007. However, in connection with the national recession, real estate values nationally declined severely in 2008 and 2009, including in our markets. Recently, real estate values both nationally and in our markets have shown improvement. Future declines in real estate values in our southern Louisiana markets could significantly impair the value of the particular collateral securing our loans and our ability to sell the collateral upon foreclosure for an amount necessary to satisfy the borrower’s obligations to us. Furthermore, in a declining real estate market, we often will need to further increase our allowance for loan losses to address the deterioration in the value of the real estate securing our loans. Any of the foregoing could have a material adverse effect on our business, financial condition, results of operations, cash flows and growth prospects.
Commercial real estate loans may expose us to greater risks than our other real estate loans.
Our loan portfolio includes nonowner-occupied commercial real estate loans for individuals and businesses for various purposes, which are secured by commercial properties, as well as real estate construction and development loans. As of December 31, 2016, our nonowner-occupied commercial real estate loans totaled $200.3 million, or 22% of our total loan portfolio.
Commercial real estate loans typically depend on cash flows from the property to service the debt. Cash flows, either in the form of rental income or the proceeds from sales of commercial real estate, may be affected significantly by general economic conditions. These loans expose a lender to greater credit risk than loans secured by residential real estate because the collateral securing these loans typically cannot be liquidated as easily as residential real estate. If we foreclose on these loans, our holding period for the collateral typically is longer than for a one-to-four family residential property because there are fewer potential purchasers of the collateral. Additionally, nonowner-occupied commercial real estate loans generally involve relatively large balances to single borrowers or related groups of borrowers. Accordingly, charge-offs on nonowner-occupied commercial real estate loans may be larger on a per loan basis than those incurred with our residential or consumer loan portfolios. Unexpected deterioration in the credit quality of our commercial real estate loan portfolio would require us to increase our provision for loan losses, which would reduce our profitability and could materially adversely affect our business, financial condition, results of operations, cash flows and growth prospects.
We are exposed to consumer credit risk.
Historically, we have originated a significant number of consumer installment loans, particularly with respect to automobile finance. We are subject to credit risk resulting from defaults in payment or performance by customers for our loans, as well as loans that we sell to third parties but retain servicing rights. A weak economic environment and high unemployment rates could exert pressure on our auto loan customers resulting in higher delinquencies, repossessions and losses. There can be no assurances that our monitoring of our credit risk as it affects the value of these loans and the underlying collateral will be sufficient to prevent an effect on our profitability and financial condition.
17
There are also risks with respect to our auto lending in particular. First, as an indirect auto lender, all of our auto loans were originated by dealerships with which we have relationships. As a result, we do not have relationships directly with the borrowers and are dependent on the relationships these dealerships have with their customers to make a determination on whether or not there are factors that would cause an otherwise qualified customer to not repay the loan. In addition, federal and state laws may prohibit, limit or delay our repossession and sale of vehicles on defaulted automobile loan contracts, which will impair our ability to recover losses on these loans. Additional factors that may affect our ability to recoup the full amount due on an indirect auto loan include, among other things, our failure to perfect our security interest in the relevant vehicle, depreciation, obsolescence, damage or loss to the vehicle and the impact of federal and state bankruptcy and insolvency laws. Furthermore, proceeds from the sale of repossessed vehicles can fluctuate significantly based upon market conditions. A deterioration in general economic conditions could result in a greater loss in the sale of repossessed vehicles than we have historically experienced.
In November 2015, the Bank announced that it was exiting the indirect auto loan origination business. The Bank discontinued accepting indirect auto loan applications December 31, 2015, but continued to process and fund applications that were accepted on or before that date. The Bank will continue to service the current auto loan portfolio for its duration, which bears the risks discussed above.
Our allowance for loan losses may prove to be insufficient to absorb losses inherent in our loan portfolio, and we may be required to further increase our provision for loan losses.
Although we endeavor to diversify our loan portfolio in order to minimize the effect of economic conditions within a particular industry, management also maintains an allowance for loan losses, which is a reserve established through a provision for loan losses charged to expense, to absorb probable credit losses inherent in the entire loan portfolio. We maintain our allowance for loan losses at a level considered adequate by management to absorb probable loan losses, including collateral impairment, based on our analysis of our portfolio and market environment, using relevant information available to us. Among other considerations in establishing the allowance for loan losses, management considers economic conditions reflected within industry segments, the unemployment rate in our markets, loan segmentation and historical losses that are inherent in the loan portfolio.
As of December 31, 2016, our allowance for loan losses as percentages of total loans and nonperforming loans was 0.79% and 356%, respectively. The determination of the appropriate level of the allowance is inherently subjective and requires us to make significant estimates of current credit risks and future trends, all of which are subject to material changes. In addition, loans acquired in connection with business combination transactions are measured at fair value, based on management’s estimates related to expected prepayments and the amount and timing of undiscounted expected principal, interest and other cash flows. Because fair value measurements incorporate assumptions regarding credit risk, no allowance for loan losses related to the acquired loans is recorded on the acquisition date.
Inaccurate management assumptions, including with respect to the fair value of acquired loans, continuing deterioration of economic conditions affecting borrowers, new information regarding existing loans, identification of additional problem loans and other factors, both within and outside of our control, may require us to increase our allowance for loan losses. In addition, bank regulatory agencies periodically review the allowance for loan losses and may require an increase in the provision for loan losses or the recognition of further loan charge-offs, based on judgments different than those of management. Finally, if actual charge-offs in future periods exceed the allowance for loan losses, we will need additional provisions to increase the allowance for loan losses. Any increases in the allowance for loan losses will result in a decrease in net income and, possibly, capital and may have a material adverse effect on our business, financial condition, results of operations and growth prospects.
Lack of seasoning of our loan portfolio could increase the risk of future credit defaults.
As a result of our growth over the past three years, a large portion of loans in our loan portfolio and of our lending relationships are of relatively recent origin. In general, loans do not begin to show signs of credit deterioration or default until they have been outstanding for some period of time, a process referred to as “seasoning.” As a result, a portfolio of older loans will usually behave more predictably than a newer portfolio. Because a large portion of our portfolio is relatively new, the current level of delinquencies and defaults may not represent the level that may prevail as the portfolio becomes more seasoned. If delinquencies and defaults increase, we may be required to increase our provision for loan losses, which could materially adversely affect our business, financial condition, results of operations and growth prospects.
18
New lines of business or new products and services may subject the Company to additional risks.
From time to time, the Company may implement or may acquire new lines of business or offer new products and services within existing lines of business. There are substantial risks and uncertainties associated with these efforts, particularly in instances where the markets are not fully developed. In developing and marketing new lines of business and/or new products and services, the Company may invest significant time and resources. Initial timetables for the introduction and development of new lines of business and/or new products or services may not be achieved and price and profitability targets may not prove feasible. External factors, such as compliance with regulations, competitive alternatives and shifting market preferences, may also impact the successful implementation of a new line of business or a new product or service. Furthermore, any new line of business and/or new product or service could have a significant impact on the effectiveness of the Company’s system of internal controls. Failure to successfully manage these risks in the development and implementation of new lines of business or new products or services could have a material adverse effect on the Company’s business, financial condition, and results of operations.
We are subject to interest rate risk.
The majority of our banking assets are monetary in nature and subject to risk from changes in interest rates. Our earnings, like that of most financial institutions, are significantly dependent on our net interest income, which is the difference between our interest income on interest-earning assets, such as loans and investment securities, and our interest expense on interest-bearing liabilities, such as deposits and borrowings. We expect that we will periodically experience “gaps” in the interest rate sensitivities of our assets and liabilities, meaning that either our interest-bearing liabilities will be more sensitive to changes in market interest rates than our interest-earning assets, or vice versa. In either event, if market interest rates should move contrary to our position, this “gap” will negatively impact our earnings. At December 31, 2016, our interest sensitivity profile was somewhat liability sensitive, meaning that our interest expense would increase more than our interest income from rising interest rates resulting in a decrease in net interest income.
Interest rates are highly sensitive to many factors that are beyond our control, including governmental monetary policies, inflation, recession, changes in unemployment, the money supply, international disorder and instability in domestic and foreign financial markets. Changes in monetary policy, including changes in interest rates, could influence not only the interest we receive on loans and securities and the interest we pay on deposits and borrowings, but such changes could also affect our ability to originate loans and obtain deposits, the fair value of our financial assets and liabilities and the average duration of our assets. Any substantial, unexpected, prolonged change in market interest rates could have a material adverse effect on our business, financial condition, results of operations and growth prospects.
In addition, as interest rates increase, the ability of borrowers to repay their current loan obligations could be negatively impacted, which would adversely affect our results of operations. These circumstances could not only result in increased loan defaults, foreclosures and charge-offs but also necessitate further increases to the allowance for loan losses. At the same time, the marketability of the property securing a loan may be adversely affected by any reduced demand resulting from higher interest rates. Further, when we place a loan on nonaccrual status, we reverse any accrued but unpaid interest receivable, which decreases interest income, but we continue to have a cost to fund the loan, which is reflected as interest expense, without any interest income to offset the associated funding expense. Thus, an increase in the amount of nonperforming assets would have an adverse impact on net interest income. On the other hand, in a declining interest rate environment, there may be an increase in prepayments on loans as borrowers refinance their loans at lower rates.
If short-term interest rates remain at their historically low levels for a prolonged period, and assuming longer term interest rates fall further, we could experience net interest margin compression as our interest-earning assets would continue to reprice downward while our interest-bearing liability rates could fail to decline in tandem. Such an occurrence would have a material adverse effect on our net interest income and our results of operations.
19
By engaging in derivative transactions, we are exposed to credit and market risk, which could adversely affect our profitability and financial condition.
We manage interest rate risk by utilizing derivative instruments to minimize significant unplanned fluctuations in earnings that are caused by interest rate volatility. Hedging interest rate risk is a complex process, requiring sophisticated models and constant monitoring. The effect of this unrealized appreciation or depreciation will generally be offset by income or loss on the derivative instruments that are linked to the hedged assets and liabilities. By engaging in derivative transactions, we are exposed to credit and market risk. If the counterparty fails to perform, credit risk exists to the extent of the fair value gain in the derivative instrument. Market risk exists to the extent that interest rates change in ways that are significantly different from what was expected when we entered into the derivative agreement. The existence of credit and market risk associated with our derivative instruments could adversely affect our profitability and financial condition.
Breakdowns in our internal controls and procedures could have an adverse effect on us.
Management regularly reviews and updates our internal controls over financial reporting, disclosure controls and procedures, and corporate governance policies and procedures. Any system of controls, however well designed and operated, is based in part on certain assumptions and can provide only reasonable, not absolute, assurances that the objectives of the system are met. Any failure or circumvention of our controls and procedures or failure to comply with regulations related to controls and procedures could have a material adverse effect on our business, financial condition, and results of operations. See Item 9A, Controls and Procedures for additional information.
Hurricanes or other adverse weather conditions, as well as man-made disasters, could negatively affect our local markets or disrupt our operations, which may adversely affect our business and results of operations.
Our business is concentrated in southern Louisiana, and in the Baton Rouge, New Orleans, Lafayette, and Hammond metropolitan areas in particular. Southern Louisiana is susceptible to major hurricanes, floods, tropical storms and other natural disasters and adverse weather. These natural disasters can disrupt our operations, cause widespread property damage and severely depress the local economies in which we operate. For example, Hurricane Gustav in 2008 severely impacted our headquarters city of Baton Rouge, with power in many areas of the city not being restored for nearly three weeks after the hurricane. In addition, Hurricane Katrina in August 2005 and the historic flooding of Baton Rouge and surrounding areas in August 2016 had significant impacts in several markets in which we conduct business. The 2010 Deepwater Horizon oil spill in the Gulf of Mexico illustrated that man-made disasters can also adversely affect economic activity in the markets in which we operate. Any economic decline as a result of a natural disaster, adverse weather, oil spill or other man-made disaster can reduce the demand for loans and our other products and services.
Such events could also affect the stability of our deposit base, impair the ability of borrowers to repay outstanding loans (resulting in increased delinquencies, foreclosures and loan losses), impair the value of collateral securing such loans, cause significant property damage, result in loss of revenue and/or cause us to incur additional expenses. The occurrence of any such event could, therefore, result in decreased revenue and loan losses that have a material adverse effect on our business, financial condition, results of operations and growth prospects.
We are subject to a variety of risks in connection with any sale of loans we may conduct.
As discussed elsewhere in this document, we sell certain mortgage loans that we originate as well as pools of our consumer loans. In connection with these sales, we are typically required to make representations and warranties to the purchaser about the loans sold and the procedures under which those loans have been originated. If these representations and warranties are incorrect, we may be required to indemnify the purchaser for its losses or we may be required to repurchase part or all of the affected loans. Borrower fraud may also cause us to have to repurchase loans that we have sold. If we are required to make any indemnity payments or repurchases and do not have a remedy available to us against a solvent counterparty, we may not be able to recover our losses resulting from these indemnity payments and repurchases. Consequently, our results of operations may be adversely affected.
Factors outside our control could result in impairment of or losses with respect to our investment securities.
There are many factors beyond our control that can significantly influence, and adversely change, the fair value of the securities in our portfolio. Factors include, for example, rating agency downgrades of the securities, defaults by the issuer or continued instability in the capital markets. Any of these factors, among others, could cause other-than-temporary impairments and realized and/or unrealized losses in future periods and declines in other comprehensive income, which could materially and adversely affect our business, results of operations, financial condition and growth prospects. The process for determining whether impairment of a security is other-than-temporary usually requires difficult, subjective judgments about the future financial performance and liquidity of the issuer and any collateral underlying the security in order to assess the probability of receiving all contractual principal and interest payments on the security.
20
We may need to raise additional capital in the future to execute our business strategy.
In addition to the liquidity that we require to conduct our day-to-day operations, the Company, on a consolidated basis, and Investar Bank, on a stand-alone basis, must meet certain regulatory capital requirements. With the implementation of certain new regulatory requirements, such as the Basel III accord and the capital requirements enacted under the Dodd-Frank Wall Street Reform and Consumer Protection Act of 2010, or the Dodd-Frank Act, financial institutions will be required to establish higher tangible capital requirements. Also, we may need capital to finance acquisitions.
Our ability to raise additional capital depends on conditions in the capital markets, economic conditions and a number of other factors, including investor perceptions regarding the banking industry, market conditions and governmental activities, and on our financial condition and performance. Accordingly, there can be no assurances that we will be able to raise additional capital if needed or on terms acceptable to us. If we fail to maintain capital to meet regulatory requirements, our business, financial condition, results of operations and growth prospects could be materially and adversely affected.
Competition in our industry is intense, which could adversely affect our growth and profitability.
We face substantial competition in all areas of our operations from a variety of different competitors, many of which are larger and have substantially greater resources than we have, including higher total assets and capitalization, a more extensive and established branch network, greater access to capital markets and a broader offering of financial services. Such competitors primarily include national, regional and community banks within the various markets in which we operate. Because of their scale, many of these competitors can be more aggressive than we can on loan and deposit pricing. We also face competition from many other types of financial institutions, including savings and loans, credit unions, finance companies, brokerage firms, insurance companies, factoring companies and other financial intermediaries. Many of these entities have fewer regulatory constraints and may have lower cost structures than we do.
Our industry could become even more competitive as a result of legislative and regulatory changes as well as continued consolidation. The increased regulatory requirements imposed on financial institutions as well as the economic downturn in the United States in the 2007-2009 time frame, and generally slow recovery thereafter, have already resulted in the consolidation of a number of financial institutions, in addition to acquisitions of failed institutions. We expect additional consolidation to occur. Finally, technology has lowered barriers to entry and made it possible for non-banks to offer products and services traditionally provided by banks, such as automatic transfer and automatic payment systems. If we are unable to successfully compete, our business, financial condition, results of operations and growth prospects will be materially adversely affected.
If the goodwill that we recorded in connection with a business acquisition becomes impaired, it could require charges to earnings, which would have a negative impact on our financial condition and results of operations.
Goodwill represents the amount by which the cost of an acquisition exceeded the fair value of net assets we acquired in connection with the purchase of another financial institution. We review goodwill for impairment at least annually, or more frequently if events or changes in circumstances indicate that the carrying value of the asset might be impaired.
We determine impairment by comparing the implied fair value of the reporting unit goodwill with the carrying amount of that goodwill. If the carrying amount of the reporting unit goodwill exceeds the implied fair value of that goodwill, an impairment loss is recognized in an amount equal to that excess. Any such adjustments are reflected in our results of operations in the periods in which they become known. As of December 31, 2016, our goodwill totaled $2.7 million. While we have not recorded any such impairment charges since we initially recorded the goodwill, there can be no assurance that our future evaluations of goodwill will not result in findings of impairment and related write-downs, which may have a material adverse effect on our financial condition and results of operations.
We may face risks with respect to future acquisitions.
When we attempt to expand our business in Louisiana and other states through mergers and acquisitions, we seek targets that are culturally similar to us, have experienced management and possess either significant market presence or have potential for improved profitability through economies of scale or expanded services. In addition to the general risks associated with our growth plans highlighted above, acquiring other banks, businesses or branches involves various risks commonly associated with acquisitions, including, among other things:
|
|
• |
the time and costs associated with identifying and evaluating potential acquisition and merger targets; |
|
|
• |
inaccuracies in the estimates and judgments used to evaluate credit, operations, management and market risks with respect to the target institution; |
21
|
|
• |
our ability to finance an acquisition and possible dilution to our existing shareholders; |
|
|
• |
the diversion of our management’s attention to the negotiation of a transaction; |
|
|
• |
the incurrence of an impairment of goodwill associated with an acquisition and adverse effects on our results of operations; |
|
|
• |
entry into new markets where we lack experience; and |
|
|
• |
risks associated with integrating the operations and personnel of the acquired business in a manner that permits growth opportunities and does not materially disrupt existing customer relationships or result in decreased revenues resulting from any loss of customers. |
With respect to the risks particularly associated with the integration of an acquired business, we may encounter a number of difficulties, such as:
|
|
• |
customer loss and revenue loss; |
|
|
• |
the loss of key employees; |
|
|
• |
the disruption of our operations and business; |
|
|
• |
our inability to maintain and increase competitive presence; |
|
|
• |
possible inconsistencies in standards, control procedures and policies; and/or |
|
|
• |
unexpected problems with costs, operations, personnel, technology and credit. |
In addition to the risks posed by the integration process itself, the focus of management’s attention and effort on integration may result in a lack of sufficient management attention to other important issues, causing harm to our business. Also, general market and economic conditions or governmental actions affecting the financial industry generally may inhibit our successful integration of an acquired business.
We expect to continue to evaluate merger and acquisition opportunities that are presented to us and conduct due diligence activities related to possible transactions with other financial institutions. As a result, merger or acquisition discussions and, in some cases, negotiations may take place and future mergers or acquisitions involving cash, debt or equity securities may occur at any time. Historically, acquisitions of non-failed financial institutions involve the payment of a premium over book and market values, and, therefore, some dilution of our book value and net income per common share may occur in connection with any future transaction. Failure to realize the expected revenue increases, cost savings, increases in geographic or product presence and/or other projected benefits from an acquisition could have a material adverse effect on our business, financial condition, results of operations and growth prospects.
22
Regulatory approvals for the mergers of Citizens and Citizens Bank may not be received, may take longer than expected or impose conditions that are not presently anticipated.
The Federal Reserve must approve, or waive approval of, the merger of Citizens with Investar (the “Merger”), and the FDIC and the Louisiana OFI must approve the merger of Citizens Bank with and into Investar Bank (the “Bank Merger”). The Federal Reserve, the FDIC, and the OFI will consider, among other factors, the competitive impact of the Merger and the Bank Merger, the financial and managerial resources of each of the parties to the proposed transactions, and the convenience and needs of the communities to be served. As part of that consideration, we expect the FDIC to evaluate whether we have fully implemented certain improvements to our compliance management system that the FDIC requested, and which we agreed to implement, in connection with our most recent compliance examination. We also expect that the Federal Reserve, the FDIC and the OFI will review issues related to the parties’ capital position, safety and soundness, and legal and regulatory compliance, including without limitation our compliance with applicable fair lending laws, in connection with their respective decisions whether to approve the Merger and the Bank Merger. There can be no assurance as to whether regulatory approvals will be received, the timing of those approvals or whether any conditions will be imposed. If the proposed transactions are not approved for any reason, we will not be able to consummate our planned acquisition of Citizens and Citizens Bank.
A lack of liquidity could adversely affect our ability to fund operations and meet our obligations as they become due.
Liquidity is essential to our business. Liquidity risk is the potential that we will be unable to meet our obligations as they come due because of an inability to liquidate assets or obtain adequate funding. The primary source of the Bank’s funds are customer deposits and loan repayments, while borrowings are a secondary source of liquidity. Our access to deposits and other funding sources in adequate amounts and on acceptable terms is affected by a number of factors, including rates paid by competitors, returns available to customers on alternative investments and general economic conditions. Any decline in available funding could adversely impact our ability to originate loans, invest in securities, meet our expenses, pay dividends to our shareholders, or to fulfill obligations such as repaying our borrowings or meeting deposit withdrawal demands, any of which could have a material adverse impact on our business, financial condition, results of operations and growth prospects.
The Company may be materially and adversely affected by the creditworthiness and liquidity of other financial institutions.
Financial services institutions are interrelated as a result of trading, clearing, counterparty and other relationships. Our Bank has exposure to many different industries and counterparties, and routinely executes transactions with counterparties in the financial services industry, including commercial banks, brokers and dealers, investment banks, and other institutional clients. Many of these transactions expose our Bank to credit risk in the event of a default by a counterparty or client. In addition, our Bank’s credit risk may be increased when the collateral to which it is entitled cannot be realized upon or is liquidated at prices not sufficient to recover the full amount of its credit or derivative exposure. Any such losses could have a material adverse effect on our business, financial condition, and results of operations.
We rely on information technology and telecommunications systems and third-party vendors, and our failure to effectively implement new technology or disruption of service could adversely affect our operations and financial condition.
Our industry is undergoing rapid technological changes with frequent introductions of new technology-driven products and services. We believe that improved technology allows us to serve our customers in a more efficient and less costly manner. Our ability to compete successfully to some extent depends on whether we can implement new technologies to provide products and services to our customers while avoiding significant operational challenges that increase our costs or delay full implementation of technology enhancements or new products, especially relative to our peers (many of which have greater resources to devote to technological improvements).
Although new technologies enable us to enhance the products and services we offer our customers, this technology exposes us to certain risks. First, the successful and uninterrupted functioning of our information technology and telecommunications systems is critical to our business. We outsource many of our major systems, such as data processing, loan servicing and deposit processing. If one of these third-party service providers terminates their relationship with us or fails to provide services to us for any reason or provides such services poorly, our business will be negatively affected. In addition, we may be forced to replace such vendor, which could interrupt our operations and result in a higher cost to us.
23
Cyber-attacks or other security breaches could adversely affect our operations, net income or reputation.
As part of our banking business, we collect, use and hold sensitive data concerning individuals and businesses with whom we have a banking relationship. Threats to data security, including unauthorized access and cyber-attacks, rapidly emerge and change, exposing us to additional costs for protection or remediation and competing time constraints to secure our data in accordance with customer expectations and statutory and regulatory requirements. The increasing sophistication of cyber-criminals makes it extremely difficult to keep up with new threats and could result in a breach of our data security. Patching and other measures to protect existing systems and servers could be inadequate, especially on systems that are being retired. Controls employed by our information technology department and third-party vendors could prove inadequate. We could also experience a breach by intentional or negligent conduct on the part of our employees or other internal sources or by merchants using our customers’ debit and credit cards, software bugs or other technical malfunctions, or other causes. As a result of any of these threats, our customer accounts could become vulnerable to account takeover schemes or cyber-fraud. Our systems and those of our third-party vendors may become vulnerable to damage or disruption due to circumstances beyond our or their control, such as from catastrophic events, power anomalies or outages, natural disasters, network failures, and viruses and malware.
A breach of our security that results in unauthorized access to our data could expose us to a disruption or challenges relating to our daily operations as well as to data loss, litigation, damages, fines and penalties, customer notification requirements, significant increases in compliance costs, and reputational damage, any of which could individually or in the aggregate have a material adverse effect on our business, results of operations, financial condition and prospects.
We have attempted to address these concerns by backing up our systems as well as retaining qualified third-party vendors to test and audit our network. However, there can be no guarantees that our efforts will be successful in avoiding material problems with our information technology and telecommunications systems.
We are subject to environmental liability risk associated with our lending activities.
A significant portion of our loan portfolio is secured by real property. Also, in the ordinary course of business, we may foreclose on and take title to properties securing certain loans or purchase real estate to expand our facilities. In doing so, there is a risk that hazardous or toxic substances could be found on these properties. If hazardous or toxic substances are found, we may be liable for remediation costs, as well as for personal injury and property damage. Environmental laws may require us to incur substantial expenses and may materially reduce the affected property’s value or limit our ability to use or sell the affected property. The remediation costs and any other financial liabilities associated with an environmental hazard could have a material adverse effect on our business, financial condition, results of operations and growth prospects. In addition, future laws or more stringent interpretations or enforcement policies with respect to existing laws may increase our exposure to environmental liability. Although management has policies and procedures to perform an environmental review before the loan is recorded and before initiating any foreclosure action on real property, these reviews may not be sufficient to detect all potential environmental hazards.
Risks Related to Our Industry
We operate in a highly regulated environment, which could restrain our growth and profitability.
We are subject to extensive regulation and supervision that governs almost all aspects of our operations, including, among other things, our lending practices, capital structure, investment practices, dividend policy, operations and growth. These laws and regulations, and the supervisory framework that oversees the administration of these laws and regulations, are primarily intended to protect consumers, depositors, the Deposit Insurance Fund and the banking system as a whole, and not shareholders and counterparties. Furthermore, new proposals for legislation continue to be introduced in the U.S. Congress that could further substantially increase regulation of the financial services industry, impose restrictions on our operations and our ability to conduct business consistent with historical practices, including in the areas of compensation, interest rates, financial product offerings and disclosures, and have an effect on bankruptcy proceedings with respect to consumer residential real estate mortgages, among other things.
Our efforts to comply with these additional laws, regulations and standards are likely to result in increased expenses and a diversion of management time and attention. The information under the heading “Supervision and Regulation” in Item 1, Business, provides more information regarding the regulatory environment in which we and the Bank operate.
24
Financial reform legislation enacted by Congress will, among other things, tighten capital standards and result in new laws and regulations that likely will increase our costs of operations.
The Dodd-Frank Act was signed into law on July 21, 2010. This law significantly changed the then-existing bank regulatory structure and affected the lending, deposit, investment, trading and operating activities of financial institutions and their holding companies. The Dodd-Frank Act changes the regulatory structure to which we are subject in numerous ways, including, but not limited to, the following:
|
|
• |
The base for FDIC insurance assessments has been changed to a bank’s average consolidated total assets minus average tangible equity, rather than upon its deposit base, while the FDIC’s authority to raise insurance premiums has been expanded. |
|
|
• |
The current standard deposit insurance limit has been permanently raised to $250,000. |
|
|
• |
The FDIC must raise the ratio of reserves to deposits from 1.15% to 1.35% for deposit insurance purposes by September 30, 2020 and to “offset the effect” of increased assessments on insured depository institutions with assets of less than $10.0 billion. |
|
|
• |
The interchange fees payable on debit card transactions have been limited. |
|
|
• |
There are multiple new provisions affecting corporate governance and executive compensation at all publicly traded companies. |
|
|
• |
All federal prohibitions on the ability of financial institutions to pay interest on commercial demand deposit accounts have been repealed. |
Our management continues to assess the impact on our operations of the Dodd-Frank Act and its regulations, many of which have yet to be proposed or adopted or are to be phased-in over the next several months and years. Because the impact of many of the regulations adopted pursuant to the Dodd-Frank Act may not be known for some time, it is difficult to predict at this time the full impact that Dodd-Frank Act will have on us. However, it is expected that at a minimum our operating and compliance costs will increase, and our interest expense could also increase.
In addition to the foregoing, the Dodd-Frank Act established the Bureau of Consumer Financial Protection (the “CFPB”) as an independent entity within the Federal Reserve. The CFPB has broad rulemaking, supervisory and enforcement authority over consumer financial products and services, including deposit products, residential mortgages, home-equity loans and credit cards, as well as with respect to certain mortgage-related matters, such as steering incentives, determinations as to a borrower’s ability to repay and prepayment penalties.
Federal and state regulators periodically examine our business, and we may be required to remediate adverse examination findings.
The Federal Reserve, the FDIC and the OFI, periodically examine our business, including our compliance with laws and regulations. If, as a result of an examination, a federal banking agency were to determine that our financial condition, capital resources, asset quality, earnings prospects, management, liquidity or other aspects of any of our operations had become unsatisfactory, or that we were in violation of any law or regulation, it may take a number of different remedial actions as it deems appropriate. These actions include the power to enjoin “unsafe or unsound” practices, to require affirmative action to correct any conditions resulting from any violation or practice, to issue an administrative order that can be judicially enforced, to direct an increase in our capital, to restrict our growth, to assess civil monetary penalties against our officers or directors, to remove officers and directors and, if it is concluded that such conditions cannot be corrected or there is an imminent risk of loss to depositors, to terminate our deposit insurance and place us into receivership or conservatorship. If we become subject to any regulatory actions, it could have a material adverse effect on our business, results of operations, financial condition and growth prospects.
We may be required to pay significantly higher FDIC deposit insurance premiums in the future.
The deposits of Investar Bank are insured by the FDIC up to legal limits and, accordingly, subject it to the payment of FDIC deposit insurance assessments. A bank’s regular assessments are determined by its risk classification, which is based on its regulatory capital levels and the level of supervisory concern that it poses. In connection with the most recent economic recession, insured depository institution failures, general deterioration in banking and economic conditions, and significantly increased losses of the FDIC, resulted in a decline in the designated reserve ratio of the FDIC to historical lows. To restore this reserve ratio and bolster its funding position, the FDIC imposed a special assessment on depository institutions and also increased deposit insurance assessment rates. Further increases in assessment rates are possible in the future, especially if there are additional bank failures. Any increase in deposit insurance assessment rates, or any future special assessment, could materially and adversely affect our business, results of operations, financial condition and growth prospects.
25
The short-term and long-term impact of the new regulatory capital rules is uncertain.
In July 2013, each of the U.S. federal banking agencies adopted final rules implementing the recommendations of the International Basel Committee on Bank Supervision to strengthen the regulatory capital requirements of all banking organizations in the United States. The new capital framework, referred to as Basel III, replaces the existing regulatory capital rules for all banks, savings associations and U.S. bank holding companies with greater than $500 million in total assets, and all savings and loan holding companies. The final Basel III rules became effective with respect to the Company and the Bank on January 1, 2015, although the rules will not be fully phased in until January 1, 2019.
The new rules establish a new regulatory capital standard based on Tier 1 common equity, increase the minimum Tier 1 capital risk-based capital ratio, and impose a capital conservation buffer of at least 2.5% of common equity Tier 1 capital above the new minimum regulatory capital ratios, when fully phased in during 2019. Failure to meet the capital conservation buffer will result in certain limitations on dividends, capital repurchases, and discretionary bonus payments to executive officers. The rules also change the manner in which a number of our regulatory capital components are calculated and the risk weights applicable to certain asset categories. Although there remains some uncertainty associated with the implementation and regulatory interpretation of the newly adopted standards, we expect that the new rules will generally require us to maintain greater amounts of regulatory capital. The new rules may also limit or restrict how we utilize our capital. A significant increase in our capital requirements could have a material adverse effect on our business, financial condition, results of operations or prospects.
We are subject to numerous laws designed to protect consumers, including the Community Reinvestment Act and fair lending laws, and failure to comply with these laws could lead to a wide variety of sanctions.
The Community Reinvestment Act, or CRA, the ECOA, the Fair Housing Act and other fair lending laws and regulations impose nondiscriminatory lending requirements on financial institutions. The Department of Justice and other federal agencies enforce these laws and regulations, but private parties may also have the ability to challenge an institution’s performance under fair lending laws in private class action litigation. If an institution’s performance under the Community Reinvestment Act or fair lending laws and regulations is found to be deficient, the institution could be subject to damages and civil money penalties, injunctive relief, restrictions on mergers and acquisitions activity, restrictions on expansion and restrictions on entering new business lines, among other sanctions. In addition, the FDIC’s assessment of our compliance with CRA provisions is taken into account when evaluating any application we submit for, among other things, approval of the acquisition or establishment of a branch or other deposit facility, an office relocation, a merger or the acquisition of another financial institution. Our failure to satisfy our CRA obligations could, at a minimum, result in the denial of such applications and limit our growth.
We face a risk of noncompliance and enforcement action with the Bank Secrecy Act and other anti-money laundering statutes and regulations.
The Bank Secrecy Act, the USA PATRIOT Act of 2001, and other laws and regulations require financial institutions, among other duties, to institute and maintain an effective anti-money laundering program and file suspicious activity and currency transaction reports as appropriate. The federal Financial Crimes Enforcement Network is authorized to impose significant civil money penalties for violations of those requirements and has recently engaged in coordinated enforcement efforts with the individual federal banking regulators, as well as the U.S. Department of Justice, Drug Enforcement Administration and Internal Revenue Service. We are also subject to increased scrutiny of compliance with the rules enforced by the Office of Foreign Assets Control. If our policies, procedures and systems are deemed deficient, we would be subject to liability, including fines and regulatory actions, which may include restrictions on our ability to pay dividends and the necessity to obtain regulatory approvals to proceed with certain aspects of our business plan, including our acquisition plans. Failure to maintain and implement adequate programs to combat money laundering and terrorist financing could also have serious reputational consequences for us. Any of these results could materially and adversely affect our business, financial condition, results of operations and growth prospects.
26
Risks Related to an Investment in our Common Stock
The market price of our common stock may be volatile, which may make it difficult for investors to sell their shares at the volume, prices and times desired.
The market price of our common stock may fluctuate substantially due to a variety of factors, many of which are beyond our control, including, without limitation:
|
|
• |
actual or anticipated variations in our quarterly and annual operating results, financial condition or asset quality; |
|
|
• |
changes in general economic or business conditions, both domestically and internationally; |
|
|
• |
the effects of, and changes in, trade, monetary and fiscal policies, including the interest rate policies of the Federal Reserve, or in laws and regulations affecting us; |
|
|
• |
the number of securities analysts covering us; |
|
|
• |
publication of research reports about us, our competitors, or the financial services industry generally, or changes in, or failure to meet, securities analysts’ estimates of our financial and operating performance, or lack of research reports by industry analysts or ceasing of coverage; |
|
|
• |
changes in market valuations or earnings of companies that investors deemed comparable to us; |
|
|
• |
the average daily trading volume of our common stock; |
|
|
• |
future issuances of our common stock or other securities; |
|
|
• |
additions or departures of key personnel; |
|
|
• |
perceptions in the marketplace regarding our competitors and/or us; |
|
|
• |
significant acquisitions or business combinations, strategic partnerships, joint ventures or capital commitments by or involving our competitors or us; and |
|
|
• |
other news, announcements or disclosures (whether by us or others) related to us, our competitors, our core market or the financial services industry. |
The stock market and, in particular, the market for financial institution stocks have experienced significant fluctuations in recent years. In many cases, these changes have been unrelated to the operating performance and prospects of particular companies. In addition, significant fluctuations in the trading volume in our common stock may cause significant price variations to occur. Increased market volatility may materially and adversely affect the market price of our common stock, which may make it difficult for investors to sell their shares at the volume, prices and times desired.
We are an “emerging growth company,” and the reduced reporting requirements applicable to emerging growth companies may make our common stock less attractive to investors.
We are an “emerging growth company,” as defined in the Jumpstart Our Business Startups Act of 2012, or the JOBS Act. While we retain this status, we intend to take advantage of certain exemptions from various reporting requirements that are applicable to other public companies that are not emerging growth companies, including reduced disclosure obligations regarding executive compensation in our periodic reports and proxy statements and exemptions from the requirements of holding a nonbinding advisory vote on executive compensation and shareholder approval of any golden parachute payments not previously approved. We will continue to be an emerging growth company until the earliest to occur of the following: (1) December 31, 2019; (2) the last day of the fiscal year in which we have more than $1.0 billion in annual revenues; (3) the date on which we have more than $700 million in market value of our common stock held by non-affiliates; or (4) the date on which we have issued more than $1.0 billion in non-convertible debt over a three-year period. We cannot predict if investors will find our common stock less attractive because we may rely on these exemptions, or if we choose to rely on additional exemptions in the future. If some investors find our common stock less attractive as a result, there may be a less active trading market for our common stock and our stock price may be more volatile.
27
Shares eligible for future sale could adversely affect market prices of our common stock.
Shares of our common stock eligible for future sale, including those that may be issued in any private or public offering of our common stock, as consideration in acquisition transactions, or as incentives under incentive plans, could adversely affect market prices for our common stock. As of December 31, 2016, we had 7,101,851 shares outstanding, 319,364 shares subject to options granted under our incentive plan, and warrants outstanding to purchase 124,275 shares of our common stock. Because our outstanding shares of common stock either were issued in an offering registered under the Securities Act of 1933, as amended (the “Securities Act”) or have been held for more than one year, such shares are freely tradable, except for shares held by our affiliates (approximately 9% of shares outstanding as of December 31, 2016) and 93,366 shares that represent unvested restricted shares under our incentive plan. Shares issued under our incentive plan will be available for sale into the public market, except for shares held by our affiliates. Shares held by our affiliates may be resold subject to the restrictions in Rule 144 of the Securities Act. In the future, we may issue additional shares of common stock to raise capital for growth or as consideration in acquisition transactions or for other purposes, and such shares may be registered under the Securities Act and freely tradable.
Our dividend policy may change without notice, and our future ability to pay dividends is subject to restrictions.
Holders of our common stock are entitled to receive only such cash dividends as our board of directors may declare out of funds legally available for the payment of dividends. We have no obligation to continue paying dividends, and we may change our dividend policy at any time without notice to our shareholders.
Since the Company’s primary asset is its stock of Investar Bank, we are dependent upon dividends from the Bank to pay our operating expenses, satisfy our obligations and to pay dividends on the Company’s common stock. Accordingly, any declaration and payment of dividends on common stock will substantially depend upon the Bank’s earnings and financial condition, liquidity and capital requirements, the general economic and regulatory climate and other factors deemed relevant by our board of directors. Furthermore, consistent with our strategic plans, growth initiatives, capital availability, projected liquidity needs, and other factors, we have made, and will continue to make, capital management decisions and policies that could adversely impact the amount of dividends, if any, paid to our common shareholders.
In addition, there are numerous laws and banking regulations that limit our and Investar Bank’s ability to pay dividends. For Investar Bank, federal and state statutes and regulations require, among other things, that the Bank maintain certain levels of capital in order to pay a dividend. Further, state and federal banking authorities have the ability to restrict the payment of dividends by supervisory action. At the holding company level, the Federal Reserve Board has indicated that bank holding companies should carefully review their dividend policy in relation to the organization’s overall asset quality, level of current and prospective earnings and level, composition and quality of capital. The guidance requires that a company inform and consult with the Federal Reserve Board prior to declaring and paying a dividend that exceeds earnings for the period for which the dividend is being paid or that could result in an adverse change to its capital structure.
Our Restated Articles of Incorporation and By-laws, and certain banking laws applicable to us, could have an anti-takeover effect that decreases our chances of being acquired, even if our acquisition is in our shareholders’ best interests.
Certain provisions of our restated articles of incorporation and our by-laws, as amended, and federal banking laws, including regulatory approval requirements, could make it more difficult for a third party to acquire control of our organization or conduct a proxy contest, even if those events were perceived by many of our shareholders as beneficial to their interests. These provisions, and the corporate and banking laws and regulations applicable to us:
|
|
• |
enable our board of directors to issue additional shares of authorized, but unissued capital stock. In particular, our board may issue “blank check” preferred stock with such designations, rights and preferences as may be determined from time to time by the board; |
|
|
• |
enable our board of directors to increase the size of the board and fill the vacancies created by the increase; |
|
|
• |
enable our board of directors to amend our by-laws without shareholder approval; |
|
|
• |
require advance notice for director nominations and other shareholder proposals; and |
|
|
• |
require prior regulatory application and approval of any transaction involving control of our organization. |
These provisions may discourage potential acquisition proposals and could delay or prevent a change in control, including circumstances in which our shareholders might otherwise receive a premium over the market price of our shares.
28
Our issuance of preferred stock could adversely affect holders of our common stock and discourage a takeover.
Our shareholders authorized our board of directors to issue up to 5,000,000 shares of preferred stock without any further action on the part of our shareholders. The board also has the power, without shareholder approval, to set the terms of any series of preferred stock that may be issued, including voting rights, dividend rights, preferences over our common stock with respect to dividends or in the event of a dissolution, liquidation or winding up and other terms. In the event that we issue preferred stock in the future that has preference over our common stock with respect to payment of dividends or upon our liquidation, dissolution or winding up, or if we issue preferred stock with voting rights that dilute the voting power of our common stock, the rights of the holders of our common stock or the market price of our common stock could be adversely affected. In addition, the ability of our board of directors to issue shares of preferred stock without any action on the part of our shareholders may impede a takeover of us and prevent a transaction perceived to be favorable to our shareholders.
Holders of the junior subordinated debentures have rights that are senior to those of our common shareholders.
In connection with the FCB merger, we assumed junior subordinated debentures issued by FCB and the obligations of related trust preferred securities issued by trusts established by FCB. At December 31, 2016, we had trust preferred securities and accompanying junior subordinated debentures with a carrying value of $3.6 million. Payments of the principal and interest on the trust preferred securities of these trusts are conditionally guaranteed by us. Further, the junior subordinated debentures we issued to the trusts are senior to our shares of common stock. As a result, we must make payments on the junior subordinated debentures before any dividends can be paid on our common stock and, in the event of our bankruptcy, dissolution or liquidation, the holders of the junior subordinated debentures must be satisfied before any distributions can be made on our common stock. We have the right to defer distributions on our junior subordinated debentures (and the related trust preferred securities) for up to five years, during which time no dividends may be paid on our common stock.
An investment in our common stock is not an insured deposit and is subject to risk of loss.
Our common stock is not a bank deposit and, therefore, is not insured against loss by the FDIC, any deposit insurance fund or by any other public or private entity. Investment in our common stock is inherently risky for the reasons described in this “Risk Factors” section and elsewhere in this Annual Report on Form 10-K and is subject to the same market forces that affect the price of common stock in any company. As a result, an investor may lose some or all of his or her investment in our common stock.
29
Item 1B. Unresolved Staff Comments
Not applicable.
Our main office is located at 7244 Perkins Road in Baton Rouge, Louisiana, in an approximately 4,900 square foot building built in May 2008. In addition to our main office, we operate nine branch offices located in Ascension (1), East Baton Rouge (2), Jefferson (1), Lafayette (1), Livingston (1), St. Tammany (1), Tangipahoa (1) and West Baton Rouge (1) Parishes, Louisiana, as well as a separate executive and operations center in Baton Rouge. We also have four stand-alone automated teller machines in Baton Rouge.
We own our main office and all of our branch sites. Each branch facility is a stand-alone building, equipped with an automatic teller machine and on-site parking as well as providing for drive-up access. We believe that our facilities are in good condition and are adequate to meet our operating needs for the foreseeable future.
We have completed construction on a new branch location in Gonzales, Louisiana, which is in our Baton Rouge market area, and which we expect to open in 2017, subject to regulatory approval. In September 2015, we acquired land and a building for an additional branch location in the New Orleans market area, also expected to open in 2017, subject to regulatory approval. We also own one tract of land in Ascension Parish, one in St. Mary parish, one in Calcasieu Parish, one in Lafayette Parish, and one in East Baton Rouge Parish, each of which has been designated as a future branch location, although the timing of the development of these tracts is uncertain. In addition, we own a building that provides space for storage and other general purposes.
From time to time we are party to ordinary routine litigation matters incidental to the conduct of our business. We are not presently party to, and none of our property is the subject of, any legal proceedings, the resolution of which we believe would have a material adverse effect on our business, financial condition, results of operations, cash flows, growth prospects or capital levels, nor were any such proceedings terminated during the fourth quarter of 2016.
Item 4. Mine Safety Disclosures
Not applicable.
30
Item 5. Market for Registrant’s Common Equity, Related Stockholder Matters and Issuer Purchases of Equity Securities
Common Stock Market Prices
Our common stock is listed on the Nasdaq Global Market (the “Nasdaq”) under the symbol “ISTR.” As of February 28, 2017, there were approximately 951 holders of record of our common stock, and the closing sales price of our common stock on that date was $20.15.
The following tables set forth the reported high and low intraday sales prices for the Company’s common stock as reported by Nasdaq during each quarter since we completed our initial public offering and began trading on July 3, 2014. Prior to that date, there was no public trading market for our common stock.
|
2016 |
|
High |
|
|
Low |
|
||
|
4th quarter |
|
$ |
19.70 |
|
|
$ |
15.40 |
|
|
3rd quarter |
|
|
16.47 |
|
|
|
15.00 |
|
|
2nd quarter |
|
|
16.48 |
|
|
|
14.61 |
|
|
1st quarter |
|
|
17.63 |
|
|
|
13.63 |
|
|
|
|
|
|
|
|
|
|
|
|
2015 |
|
|
|
|
|
|
|
|
|
4th quarter |
|
$ |
18.00 |
|
|
$ |
15.39 |
|
|
3rd quarter |
|
|
16.52 |
|
|
|
14.95 |
|
|
2nd quarter |
|
|
17.20 |
|
|
|
14.65 |
|
|
1st quarter |
|
|
17.42 |
|
|
|
13.35 |
|
Dividends
The following table sets forth the amounts of dividends declared on the Company’s common stock during each quarterly period for the years ended December 31, 2016 and 2015.
|
2016 |
|
Amount Per Share |
|
|
|
4th quarter |
|
$ |
0.0121 |
|
|
3rd quarter |
|
|
0.0110 |
|
|
2nd quarter |
|
|
0.0100 |
|
|
1st quarter |
|
|
0.0090 |
|
|
2015 |
|
|
|
|
|
4th quarter |
|
$ |
0.0086 |
|
|
3rd quarter |
|
|
0.0082 |
|
|
2nd quarter |
|
|
0.0078 |
|
|
1st quarter |
|
|
0.0074 |
|
31
The Company intends to declare dividends on a quarterly basis. Since we are a holding company with no material business activities, our ability to pay dividends is substantially dependent upon the ability of Investar Bank to transfer funds to us in the form of dividends, loans and advances. The Bank’s ability to pay dividends and make other distributions and payments to us depends upon the Bank’s earnings, financial condition, general economic conditions, compliance with regulatory requirements and other factors. In addition, the Bank’s ability to pay dividends to us is itself subject to various legal, regulatory and other restrictions. See “Supervision and Regulation—Dividends” in Item 1, Business, above for a discussion of the restrictions on dividends under federal banking laws and regulations. In addition, as a Louisiana corporation, we are subject to certain restrictions on dividends under the Louisiana Business Corporation Act. Generally, a Louisiana corporation may pay dividends to its shareholders unless, after giving effect to the dividend, either (1) the corporation would not be able to pay its debts as they come due in the usual course of business or (2) the corporations’ total assets are less than the sum of its total liabilities and the amount that would be needed, if the corporation were to be dissolved at the time of the payment of the dividend, to satisfy the preferential rights of shareholders whose preferential rights are superior to those receiving the dividend. Finally, our ability to pay dividends may be limited on account of the junior subordinated debentures that we assumed in the FCB acquisition. We must make payments on the junior subordinated debentures before any dividends can be paid on our common stock.
These restrictions do not, and are not expected in the future to, materially limit the Company’s ability to pay dividends to its shareholders in an amount consistent with the Company’s history of paying dividends.
Stock Performance Graph
The following graph compares the cumulative total shareholder return on the Company’s common stock over a measurement period beginning July 3, 2014 with (i) the cumulative total return on the stocks included in the Russell 3000 Index and (ii) the cumulative total return on the stocks included in the SNL Index of Banks with assets between $500 million and $1 billion. The performance graph assumes that the value of the investment in our common stock, the Russell 3000 Index and the SNL Index of Banks was $100 at July 3, 2014, the date our common stock began publicly trading on the Nasdaq, and that all dividends were reinvested.
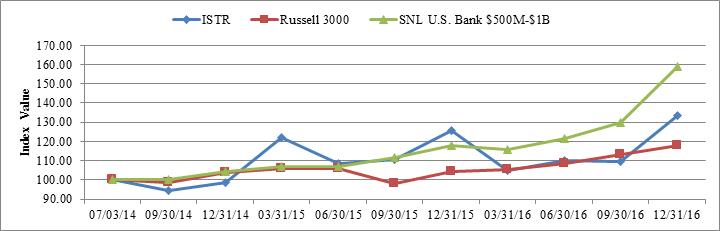
|
Index |
7/3/2014 |
|
|
9/30/2014 |
|
|
12/31/2014 |
|
|
3/31/2015 |
|
|
6/30/2015 |
|
|
9/30/2015 |
|
|
12/31/2015 |
|
|||||||
|
Investar Holding Corporation |
$ |
100.00 |
|
|
$ |
94.66 |
|
|
$ |
98.58 |
|
|
$ |
121.71 |
|
|
$ |
108.19 |
|
|
$ |
110.25 |
|
|
$ |
125.27 |
|
|
Russell 3000 |
|
100.00 |
|
|
|
98.35 |
|
|
|
103.01 |
|
|
|
104.37 |
|
|
|
104.02 |
|
|
|
96.00 |
|
|
|
101.50 |
|
|
SNL U.S. Bank $500M-$1B |
|
100.00 |
|
|
|
99.91 |
|
|
|
103.39 |
|
|
|
105.33 |
|
|
|
104.93 |
|
|
|
108.54 |
|
|
|
114.05 |
|
|
|
|
|
|
|
|
|
|
|
|
|
|
|
|
|
|
|
|
|
|
|
|
|
|
|
|
|
|
|
|
3/31/2016 |
|
|
6/30/2016 |
|
|
9/30/2016 |
|
|
12/31/2016 |
|
|
|
|
|
|
|
|
|
|
|
|
|
||||
|
Investar Holding Corporation |
$ |
104.79 |
|
|
$ |
109.93 |
|
|
$ |
109.72 |
|
|
$ |
133.49 |
|
|
|
|
|
|
|
|
|
|
|
|
|
|
Russell 3000 |
|
105.48 |
|
|
|
108.25 |
|
|
|
113.01 |
|
|
|
117.77 |
|
|
|
|
|
|
|
|
|
|
|
|
|
|
SNL U.S. Bank $500M-$1B |
|
115.54 |
|
|
|
121.59 |
|
|
|
129.90 |
|
|
|
159.16 |
|
|
|
|
|
|
|
|
|
|
|
|
|
There can be no assurance that our common stock performance will continue in the future with the same or similar trends depicted in the performance graph above. We will not make or endorse any predictions as to future stock performance.
32
The information provided under the heading “Stock Performance Graph” shall not be deemed to be “soliciting material” or to be “filed” with the SEC or subject to its proxy regulations or to the liabilities of Section 18 of the Securities Exchange Act of 1934, as amended, other than as provided in Item 201 of Regulation S-K. The information provided in this section shall not be deemed to be incorporated by reference into any filing under the Securities Act of 1933, as amended, or the Securities Exchange Act of 1934, as amended.
Issuer Purchases of Equity Securities
|
Period |
|
(a) Total Number of Shares (or Units) Purchased(1) |
|
|
(b) Average Price Paid per Share (or Unit) |
|
|
(c ) Total Number of Shares (or Units) Purchased as Part of Publicly Announced Plans or Programs |
|
|
(d) Maximum Number (or Approximate Dollar Value) of Shares (or Units) That May Be Purchased Under the Plans or Programs (2) |
|
||||
|
October 1, 2016 to October 31, 2016 |
|
|
170 |
|
|
$ |
15.22 |
|
|
|
- |
|
|
|
279,554 |
|
|
November 1, 2016 to November 30, 2016 |
|
|
38,335 |
|
|
|
16.75 |
|
|
|
38,311 |
|
|
|
241,243 |
|
|
December 1, 2016 to December 31, 2016 |
|
|
78 |
|
|
|
17.86 |
|
|
|
- |
|
|
|
241,243 |
|
|
|
|
|
38,583 |
|
|
$ |
16.74 |
|
|
|
38,311 |
|
|
|
241,243 |
|
|
(1) |
Includes 272 shares surrendered to cover the payroll taxes due upon the vesting of restricted stock. |
|
(2) |
On February 19, 2015, the Company announced that its board of directors authorized the repurchase of up to 250,000 shares of the Company’s common stock in open market transactions from time to time or through privately negotiated transactions in accordance with federal securities laws. In addition, on October 19, 2016, the Company announced that its board of directors authorized the repurchase of an additional 250,000 shares of the Company’s common stock under its stock repurchase plan. |
Unregistered Sales of Equity Securities
None.
Securities Authorized for Issuance under Equity Compensation Plans
Please refer to the information under the heading “Securities Authorized for Issuance under Equity Compensation Plans” in Item 12, Security Ownership of Certain Beneficial Owners and Management and Related Stockholder Matters, for a discussion of the securities authorized for issuance under the Company’s equity compensation plans.
Item 6. Selected Financial Data
The following table sets forth selected historical financial information and other data as of and for the years ended December 31, 2016, 2015, 2014, 2013, and 2012. As discussed in Item 1, Business, Investar Bank did not become a subsidiary of the Company until the completion of the share exchange in November 2013. Accordingly, the selected financial information below as of and for the year ended December 31, 2012 relates only to the operations of the Bank, while the selected financial information below as of and for the years ended December 31, 2016, 2015, 2014 and 2013 reflects the operations of the Company and the Bank on a consolidated basis. The selected financial information for the years ended December 31, 2016, 2015, 2014 and 2013 has been derived from the audited consolidated financial statements of the Company as of and for such years, other than the performance ratios, and the selected financial information for the year ended December 31, 2012 has been derived from the audited financial statements of Investar Bank as of and for such years, other than the performance ratios.
The selected financial information below should be read in conjunction with other information contained in this report, including the information contained in Item 7, Management’s Discussion and Analysis of Financial Condition and Results of Operations, and the consolidated financial statements and related notes in Item 8, Financial Statements and Supplementary Data. Our historical results for any prior period are not necessarily indicative of results to be expected in any future period.
33
|
(In thousands, except share data)(1) |
|
As of December 31, |
|
|||||||||||||||||
|
|
|
2016 |
|
|
2015 |
|
|
2014 |
|
|
2013 |
|
|
2012 |
|
|||||
|
Financial Condition Data |
|
|
|
|
|
|
|
|
|
|
|
|
|
|
|
|
|
|
|
|
|
Total assets |
|
$ |
1,158,960 |
|
|
$ |
1,031,555 |
|
|
$ |
879,354 |
|
|
$ |
634,946 |
|
|
$ |
375,446 |
|
|
Total gross loans, net of allowance for loan losses |
|
|
886,375 |
|
|
|
819,822 |
|
|
|
721,556 |
|
|
|
505,744 |
|
|
|
303,019 |
|
|
Allowance for loan losses |
|
|
7,051 |
|
|
|
6,128 |
|
|
|
4,630 |
|
|
|
3,380 |
|
|
|
2,722 |
|
|
Investment securities |
|
|
183,142 |
|
|
|
139,779 |
|
|
|
92,818 |
|
|
|
62,752 |
|
|
|
44,326 |
|
|
Goodwill and other intangible assets |
|
|
3,234 |
|
|
|
3,175 |
|
|
|
3,216 |
|
|
|
3,257 |
|
|
|
2,828 |
|
|
Noninterest-bearing deposits |
|
|
108,404 |
|
|
|
90,447 |
|
|
|
70,217 |
|
|
|
72,795 |
|
|
|
37,489 |
|
|
Interest-bearing deposits |
|
|
799,383 |
|
|
|
646,959 |
|
|
|
557,901 |
|
|
|
459,811 |
|
|
|
262,181 |
|
|
Total deposits |
|
|
907,787 |
|
|
|
737,406 |
|
|
|
628,118 |
|
|
|
532,606 |
|
|
|
299,670 |
|
|
Long-term borrowings |
|
|
12,809 |
|
|
|
11,969 |
|
|
|
25,055 |
|
|
|
34,427 |
|
|
|
26,794 |
|
|
Total stockholders’ equity |
|
$ |
112,757 |
|
|
$ |
109,350 |
|
|
$ |
103,384 |
|
|
$ |
55,483 |
|
|
$ |
43,553 |
|
|
|
|
As of and for the year ended December 31, |
|
|||||||||||||||||
|
|
|
2016 |
|
|
2015 |
|
|
2014 |
|
|
2013 |
|
|
2012 |
|
|||||
|
Income Statement Data |
|
|
|
|
|
|
|
|
|
|
|
|
|
|
|
|
|
|
|
|
|
Interest income |
|
$ |
43,152 |
|
|
$ |
37,340 |
|
|
$ |
31,369 |
|
|
$ |
22,472 |
|
|
$ |
14,587 |
|
|
Interest expense |
|
|
8,413 |
|
|
|
5,882 |
|
|
|
4,675 |
|
|
|
3,460 |
|
|
|
2,542 |
|
|
Net interest income |
|
|
34,739 |
|
|
|
31,458 |
|
|
|
26,694 |
|
|
|
19,012 |
|
|
|
12,045 |
|
|
Provision for loan losses |
|
|
2,079 |
|
|
|
1,865 |
|
|
|
1,628 |
|
|
|
1,026 |
|
|
|
685 |
|
|
Net interest income after provision |
|
|
32,660 |
|
|
|
29,593 |
|
|
|
25,066 |
|
|
|
17,986 |
|
|
|
11,360 |
|
|
Noninterest income |
|
|
5,468 |
|
|
|
8,344 |
|
|
|
5,860 |
|
|
|
5,354 |
|
|
|
3,625 |
|
|
Noninterest expense |
|
|
26,639 |
|
|
|
27,353 |
|
|
|
24,384 |
|
|
|
19,024 |
|
|
|
11,645 |
|
|
Income before income taxes |
|
|
11,489 |
|
|
|
10,584 |
|
|
|
6,542 |
|
|
|
4,316 |
|
|
|
3,340 |
|
|
Income tax expense |
|
|
3,609 |
|
|
|
3,511 |
|
|
|
1,145 |
|
|
|
1,148 |
|
|
|
979 |
|
|
Net income |
|
$ |
7,880 |
|
|
$ |
7,073 |
|
|
$ |
5,397 |
|
|
$ |
3,168 |
|
|
$ |
2,361 |
|
34
|
|
|
As of and for the year ended December 31, |
|
|||||||||||||||||
|
|
|
2016 |
|
|
2015 |
|
|
2014 |
|
|
2013 |
|
|
2012 |
|
|||||
|
Per Common Share Data |
|
|
|
|
|
|
|
|
|
|
|
|
|
|
|
|
|
|
|
|
|
Basic earnings per share |
|
$ |
1.11 |
|
|
$ |
0.98 |
|
|
$ |
0.98 |
|
|
$ |
0.86 |
|
|
$ |
0.79 |
|
|
Diluted earnings per share |
|
|
1.10 |
|
|
|
0.97 |
|
|
|
0.93 |
|
|
|
0.81 |
|
|
|
0.71 |
|
|
Dividends per share |
|
|
0.04 |
|
|
|
0.03 |
|
|
|
0.04 |
|
|
|
0.05 |
|
|
|
0.05 |
|
|
Book value per share |
|
|
15.88 |
|
|
|
15.05 |
|
|
|
14.24 |
|
|
|
14.06 |
|
|
|
13.56 |
|
|
Tangible book value per share(2) |
|
|
15.42 |
|
|
|
14.62 |
|
|
|
13.79 |
|
|
|
13.24 |
|
|
|
12.68 |
|
|
Period end common shares outstanding |
|
|
7,101,851 |
|
|
|
7,264,282 |
|
|
|
7,262,085 |
|
|
|
3,945,114 |
|
|
|
3,210,816 |
|
|
Basic weighted average common shares outstanding |
|
|
7,107,187 |
|
|
|
7,214,045 |
|
|
|
5,533,514 |
|
|
|
3,667,929 |
|
|
|
2,998,087 |
|
|
Diluted weighted average common shares outstanding |
|
|
7,149,834 |
|
|
|
7,258,008 |
|
|
|
5,777,302 |
|
|
|
3,923,375 |
|
|
|
3,302,661 |
|
|
|
|
|
|
|
|
|
|
|
|
|
|
|
|
|
|
|
|
|
|
|
|
Performance Ratios |
|
|
|
|
|
|
|
|
|
|
|
|
|
|
|
|
|
|
|
|
|
Return on average assets |
|
|
0.71 |
% |
|
|
0.77 |
% |
|
|
0.73 |
% |
|
|
0.64 |
% |
|
|
0.74 |
% |
|
Return on average equity |
|
|
6.99 |
|
|
|
6.60 |
|
|
|
6.80 |
|
|
|
6.10 |
|
|
|
5.90 |
|
|
Net interest margin |
|
|
3.32 |
|
|
|
3.61 |
|
|
|
3.85 |
|
|
|
4.10 |
|
|
|
4.04 |
|
|
Efficiency ratio(3) |
|
|
66.25 |
|
|
|
68.72 |
|
|
|
74.90 |
|
|
|
78.07 |
|
|
|
74.32 |
|
|
Net interest income to average assets |
|
|
3.14 |
|
|
|
3.42 |
|
|
|
3.63 |
|
|
|
3.83 |
|
|
|
3.77 |
|
|
Dividend payout ratio |
|
|
3.80 |
|
|
|
3.26 |
|
|
|
3.93 |
|
|
|
5.44 |
|
|
|
5.84 |
|
|
|
|
|
|
|
|
|
|
|
|
|
|
|
|
|
|
|
|
|
|
|
|
Asset Quality Ratios |
|
|
|
|
|
|
|
|
|
|
|
|
|
|
|
|
|
|
|
|
|
Nonperforming assets to total assets |
|
|
0.52 |
% |
|
|
0.30 |
% |
|
|
0.69 |
% |
|
|
0.79 |
% |
|
|
0.62 |
% |
|
Nonperforming loans to total loans |
|
|
0.22 |
|
|
|
0.32 |
|
|
|
0.54 |
|
|
|
0.30 |
|
|
|
0.02 |
|
|
Allowance for loan losses to total loans |
|
|
0.79 |
|
|
|
0.82 |
|
|
|
0.74 |
|
|
|
0.67 |
|
|
|
0.94 |
|
|
Allowance for loan losses to nonperforming loans |
|
|
356.16 |
|
|
|
254.16 |
|
|
|
138.61 |
|
|
|
227.00 |
|
|
|
5136.00 |
|
|
Net charge-offs to average loans |
|
|
0.14 |
|
|
|
0.05 |
|
|
|
0.07 |
|
|
|
0.09 |
|
|
|
-0.12 |
|
|
|
|
|
|
|
|
|
|
|
|
|
|
|
|
|
|
|
|
|
|
|
|
Capital Ratios(4) |
|
|
|
|
|
|
|
|
|
|
|
|
|
|
|
|
|
|
|
|
|
Total equity to total assets |
|
|
9.73 |
% |
|
|
10.60 |
% |
|
|
11.76 |
% |
|
|
8.74 |
% |
|
|
11.60 |
% |
|
Tangible common equity to tangible assets(5) |
|
|
9.48 |
|
|
|
10.32 |
|
|
|
11.43 |
|
|
|
8.27 |
|
|
|
10.93 |
|
|
Tier 1 capital to average assets |
|
|
10.10 |
|
|
|
11.39 |
|
|
|
12.61 |
|
|
|
9.53 |
|
|
|
11.55 |
|
|
Common equity tier 1 capital ratio |
|
|
11.40 |
|
|
|
11.67 |
|
|
NA |
|
|
NA |
|
|
NA |
|
|||
|
Tier 1 capital to risk-weighted assets |
|
|
11.75 |
|
|
|
12.05 |
|
|
|
13.79 |
|
|
|
10.85 |
|
|
|
13.06 |
|
|
Total capital to risk-weighted assets |
|
|
12.47 |
|
|
|
12.72 |
|
|
|
14.41 |
|
|
|
11.51 |
|
|
|
13.95 |
|
|
(1) |
Selected consolidated financial data includes the effect of mergers from the date of each merger. On May 1, 2013, Investar Bank acquired FCB, a Louisiana state bank headquartered in Hammond, Louisiana, by merger of FCB with and into Investar Bank. On October 1, 2011, Investar Bank acquired SLBB, a Louisiana state bank headquartered in Prairieville, Louisiana, by merger of SLBB with and into Investar Bank. References in this document to assets purchased and liabilities assumed in the FCB and SLBB mergers reflect the fair value of such assets and liabilities on the date of acquisition, unless the context otherwise requires. |
|
(2) |
Tangible book value per common share is a non-GAAP financial measure. Tangible book value per common share is calculated as total stockholders’ equity less goodwill and other intangible assets, divided by the number of common shares outstanding as of the balance sheet date. We believe that the most directly comparable GAAP financial measure is book value per share. For more information regarding our use of non-GAAP financial measures, including a reconciliation of tangible book value per common share to book value per share, please refer to the information under the heading “Non-GAAP Financial Measures” in Item 7, Management’s Discussion and Analysis of Financial Condition and Results of Operations. |
|
(3) |
Efficiency ratio represents noninterest expenses divided by the sum of net interest income (before provision for loan losses) and noninterest income. For more information regarding our use of non-GAAP financial measures, including our calculation of the efficiency ratio, please refer to the information under the heading “Non-GAAP Financial Measures” in Item 7, Management’s Discussion and Analysis of Financial Condition and Results of Operations. |
|
(4) |
Beginning January 1, 2015, the capital ratios are calculated using the Basel III framework. Capital ratios for prior periods were calculated using the Basel I framework. The Common Equity Tier 1 capital ratio is a new ratio introduced under the Basel III framework. Please refer to the discussion of Basel III framework under the heading “Regulatory Capital Requirements” in Item 1, Business. |
|
(5) |
Tangible equity to tangible assets is a non-GAAP financial measure. Tangible equity is calculated as total stockholders’ equity less goodwill and other intangible assets, and tangible assets is calculated as total assets less goodwill and other intangible assets. We believe that the most directly comparable GAAP financial measure is total equity to total assets. For more information regarding our use of non-GAAP financial measures, including a reconciliation of the ratio of tangible equity to tangible assets to the ratio of total equity to total assets, please refer to the information under the heading “Non-GAAP Financial Measures” in Item 7, Management’s Discussion and Analysis of Financial Condition and Results of Operations. |
35
Item 7. Management’s Discussion and Analysis of Financial Condition and Results of Operations
This section presents management’s perspective on the financial condition and results of operations of Investar Holding Corporation (the “Company,” “we,” “our,” or “us”) and its wholly-owned subsidiary, Investar Bank (the “Bank”). The following discussion and analysis should be read in conjunction with the Company’s consolidated financial statements and related notes and other supplemental information included herein. Certain risks, uncertainties and other factors, including those set forth under Item 1A, Risk Factors in Part I, and elsewhere in this Annual Report on Form 10-K, may cause actual results to differ materially from those projected results discussed in the forward-looking statement appearing in this discussion and analysis.
SPECIAL NOTE REGARDING FORWARD-LOOKING STATEMENTS
This annual report on Form 10-K, both in Management’s Discussion and Analysis of Financial Condition and Results of Operations, and elsewhere, contains forward-looking statements within the meaning of Section 27A of the Securities Act and Section 21E of the Securities Exchange Act of 1934, as amended (the “Exchange Act”). These forward-looking statements include statements relating to our projected growth, anticipated future financial performance, financial condition, credit quality and performance goals, as well as statements relating to the anticipated effects on our business, financial condition and results of operations from expected developments, our growth, and potential acquisitions. These statements can typically be identified through the use of words or phrases such as “may,” “should,” “could,” “predict,” “potential,” “believe,” “think,” “will likely result,” “expect,” “continue,” “will,” “anticipate,” “seek,” “estimate,” “intend,” “plan,” “projection,” “would” and “outlook,” or the negative version of those words or other comparable words or phrases of a future or forward-looking nature.
Our forward-looking statements contained herein are based on assumptions and estimates that management believes to be reasonable in light of the information available at this time. However, many of these statements are inherently uncertain and beyond our control and could be affected by many factors. Factors that could have a material effect on our business, financial condition, results of operations, cash flows and future growth prospects can be found in Item 1A, Risk Factors. These factors include, but are not limited to, the following, any one or more of which could materially affect the outcome of future events:
|
|
• |
business and economic conditions generally and in the financial services industry in particular, whether nationally, regionally or in the markets in which we operate; |
|
|
• |
our ability to achieve organic loan and deposit growth, and the composition of that growth; |
|
|
• |
changes (or the lack of changes) in interest rates, yield curves and interest rate spread relationships that affect our loan and deposit pricing; |
|
|
• |
the extent of continuing client demand for the high level of personalized service that is a key element of our banking approach as well as our ability to execute our strategy generally; |
|
|
• |
our dependence on our management team and our ability to attract and retain qualified personnel; |
|
|
• |
changes in the quality or composition of our loan or investment portfolios, including adverse developments in borrower industries or in the repayment ability of individual borrowers and including the potential impact on our borrowers of the August 2016 flooding in Baton Rouge and surrounding areas; |
|
|
• |
inaccuracy of the assumptions and estimates we make in establishing reserves for probable loan losses and other estimates; |
|
|
• |
the concentration of our business within our geographic areas of operation in Louisiana; |
|
|
• |
concentration of credit exposure; |
|
|
• |
deteriorating asset quality and higher loan charge-offs, and the time and effort necessary to resolve problem assets; |
|
|
• |
a lack of liquidity, including as a result of a reduction in the amount of deposits we hold or other sources of liquidity; |
|
|
• |
our potential growth, including our entrance or expansion into new markets, and the need for sufficient capital to support that growth; |
|
|
• |
difficulties in identifying attractive acquisition opportunities and strategic partners that will complement our relationship banking approach; |
|
|
• |
our ability to efficiently integrate acquisitions into our operations, retain the customers of acquired businesses and grow the acquired operations; |
|
|
• |
the impact of litigation and other legal proceedings to which we become subject; |
|
|
• |
data processing system failures and errors; |
36
|
|
• |
the impact of changes in laws and regulations applicable to us, including banking, securities and tax laws and regulations and accounting standards, as well as changes in the interpretation of such laws and regulations by our regulators; |
|
|
• |
changes in the scope and costs of FDIC insurance and other coverages; |
|
|
• |
governmental monetary and fiscal policies; |
|
|
• |
hurricanes, floods, other natural disasters and adverse weather; oil spills and other man-made disasters; acts of terrorism, an outbreak of hostilities or other international or domestic calamities, acts of God and other matters beyond our control; and |
|
|
• |
other circumstances, many of which are beyond our control. |
The foregoing factors should not be construed as exhaustive and should be read together with the other cautionary statements included herein. If one or more events related to these or other risks or uncertainties materialize, or if our underlying assumptions prove to be incorrect, actual results may differ materially from what we anticipate. Accordingly, you should not place undue reliance on any such forward-looking statements.
Any forward-looking statement speaks only as of the date on which it is made, and we do not undertake any obligation to publicly update or review any forward-looking statement, whether as a result of new information, future developments or otherwise. New factors emerge from time to time, and it is not possible for us to predict which will arise. In addition, we cannot assess the impact of each factor on our business or the extent to which any factor, or combination of factors, may cause actual results to differ materially from those contained in any forward-looking statements. We qualify all of our forward-looking statements by these cautionary statements.
Overview
Through our wholly-owned subsidiary Investar Bank, we provide full banking services, excluding trust services, tailored primarily to meet the needs of individuals and small to medium-sized businesses in our primary areas of operation in South Louisiana: Baton Rouge, New Orleans, Lafayette, Hammond and their surrounding metropolitan areas. Our Bank commenced operations in 2006 and we completed our initial public offering in July 2014. Our strategy includes organic growth through high quality loans and growth through acquisitions. We currently operate 10 full service branches. We have completed construction of one new branch in Gonzales, Louisiana in our Baton Rouge market area, and in September 2015, acquired land and a building for an additional branch in our New Orleans market area. We continue to focus on growing our deposit base in our markets. We completed acquisitions in 2011 and 2013 and regularly review acquisition opportunities.
Our principal business is lending to and accepting deposits from individuals and small to medium-sized businesses in our areas of operation. We generate our income principally from interest on loans and, to a lesser extent, our securities investments, as well as from fees charged in connection with our various loan and deposit services and gains on the sale of loans and securities. Our principal expenses are interest expense on interest-bearing customer deposits and borrowings, salaries, employee benefits, occupancy costs, data processing and operating expenses. We measure our performance through our net interest margin, return on average assets, and return on average equity, among other metrics, while seeking to maintain appropriate regulatory leverage and risk-based capital ratios.
Financial Condition and Results of Operations
Net income for the year ended December 31, 2016 totaled $7.9 million, or $1.10 per diluted share, compared to $7.1 million, or $0.97 per diluted share, for the year ended December 31, 2015. This represents a $0.8 million, or 11%, increase in net income. The increase can mainly be attributed to the Company’s year over year interest-earning asset growth.
Key components of the Company’s performance during the year ended December 31, 2016 are summarized below.
|
|
• |
Total assets grew to $1.2 billion at December 31, 2016, an increase of 12% from $1.0 billion at December 31, 2015. |
|
|
• |
Total loans, excluding held for sale, net of allowance for loan losses at December 31, 2016 were $886.4 million, an increase of $147.1 million, or 20% compared to $739.3 million at December 31, 3015. |
|
|
• |
Total deposits were $907.8 million at December 31, 2016, an increase of $170.4 million, or 23%, compared to deposits of $737.4 million at December 31, 2015. Noninterest-bearing deposits increased $18 million, or 20%, to $108.4 million compared to $90.4 million at December 31, 2015. |
37
|
|
• |
We hired a number of key bankers in the past few years, including experienced commercial lenders and their teams. |
Non-GAAP Financial Measures
Our accounting and reporting policies conform to accounting principles generally accepted in the United States, or GAAP, and the prevailing practices in the banking industry. However, we also evaluate our performance based on certain additional metrics. The efficiency ratio, tangible book value per share and the ratio of tangible equity to tangible assets are not financial measures recognized under GAAP and, therefore, are considered non-GAAP financial measures.
Our management, banking regulators, many financial analysts and other investors use these non-GAAP financial measures to compare the capital adequacy of banking organizations with significant amounts of preferred equity and/or goodwill or other intangible assets, which typically stem from the use of the purchase accounting method of accounting for mergers and acquisitions. Tangible equity, tangible assets, tangible book value per share or related measures should not be considered in isolation or as a substitute for total stockholders’ equity, total assets, book value per share or any other measure calculated in accordance with GAAP. Moreover, the manner in which we calculate tangible equity, tangible assets, tangible book value per share and any other related measures may differ from that of other companies reporting measures with similar names. The following table reconciles, as of the dates set forth below, stockholders’ equity (on a GAAP basis) to tangible equity and total assets (on a GAAP basis) to tangible assets and calculates both our tangible book value per share and efficiency ratio (dollars in thousands).
|
|
As of and for the year ended December 31, |
|
|||||||||||||||||
|
|
2016 |
|
|
2015 |
|
|
2014 |
|
|
2013 |
|
|
2012 |
|
|||||
|
Total stockholders' equity - GAAP |
$ |
112,757 |
|
|
$ |
109,350 |
|
|
$ |
103,384 |
|
|
$ |
55,483 |
|
|
$ |
43,553 |
|
|
Adjustments: |
|
|
|
|
|
|
|
|
|
|
|
|
|
|
|
|
|
|
|
|
Goodwill |
|
2,684 |
|
|
|
2,684 |
|
|
|
2,684 |
|
|
|
2,684 |
|
|
|
2,684 |
|
|
Core deposit intangible |
|
450 |
|
|
|
491 |
|
|
|
532 |
|
|
|
573 |
|
|
|
145 |
|
|
Trademark intangible |
|
100 |
|
|
|
- |
|
|
|
- |
|
|
|
- |
|
|
|
- |
|
|
Tangible equity |
$ |
109,523 |
|
|
$ |
106,175 |
|
|
$ |
100,168 |
|
|
$ |
52,226 |
|
|
$ |
40,724 |
|
|
|
|
|
|
|
|
|
|
|
|
|
|
|
|
|
|
|
|
|
|
|
Total assets - GAAP |
$ |
1,158,960 |
|
|
$ |
1,031,555 |
|
|
$ |
879,354 |
|
|
$ |
634,946 |
|
|
$ |
375,446 |
|
|
Adjustments: |
|
|
|
|
|
|
|
|
|
|
|
|
|
|
|
|
|
|
|
|
Goodwill |
|
2,684 |
|
|
|
2,684 |
|
|
|
2,684 |
|
|
|
2,684 |
|
|
|
2,684 |
|
|
Core deposit intangible |
|
450 |
|
|
|
491 |
|
|
|
532 |
|
|
|
573 |
|
|
|
145 |
|
|
Trademark intangible |
|
100 |
|
|
|
- |
|
|
|
- |
|
|
|
- |
|
|
|
- |
|
|
Tangible assets |
$ |
1,155,726 |
|
|
$ |
1,028,380 |
|
|
$ |
876,138 |
|
|
$ |
631,689 |
|
|
$ |
372,617 |
|
|
|
|
|
|
|
|
|
|
|
|
|
|
|
|
|
|
|
|
|
|
|
Total shares outstanding |
|
7,101,851 |
|
|
|
7,264,282 |
|
|
|
7,262,085 |
|
|
|
3,945,114 |
|
|
|
3,210,816 |
|
|
Book value per share |
$ |
15.88 |
|
|
$ |
15.05 |
|
|
$ |
14.24 |
|
|
$ |
14.06 |
|
|
$ |
13.56 |
|
|
Effect of adjustment |
|
(0.46 |
) |
|
|
(0.43 |
) |
|
|
(0.45 |
) |
|
|
(0.82 |
) |
|
|
(0.88 |
) |
|
Tangible book value per share |
$ |
15.42 |
|
|
$ |
14.62 |
|
|
$ |
13.79 |
|
|
$ |
13.24 |
|
|
$ |
12.68 |
|
|
Total equity to total assets |
|
9.73 |
% |
|
|
10.60 |
% |
|
|
11.76 |
% |
|
|
8.74 |
% |
|
|
11.60 |
% |
|
Effect of adjustment |
|
(0.25 |
) |
|
|
(0.28 |
) |
|
|
(0.33 |
) |
|
|
(0.47 |
) |
|
|
(0.67 |
) |
|
Tangible equity to tangible assets |
|
9.48 |
% |
|
|
10.32 |
% |
|
|
11.43 |
% |
|
|
8.27 |
% |
|
|
10.93 |
% |
|
|
|
|
|
|
|
|
|
|
|
|
|
|
|
|
|
|
|
|
|
|
Efficiency ratio(1) |
|
|
|
|
|
|
|
|
|
|
|
|
|
|
|
|
|
|
|
|
Noninterest expense |
$ |
26,639 |
|
|
$ |
27,353 |
|
|
$ |
24,384 |
|
|
$ |
19,024 |
|
|
$ |
11,645 |
|
|
Net interest income |
|
34,739 |
|
|
|
31,458 |
|
|
|
26,694 |
|
|
|
19,012 |
|
|
|
12,045 |
|
|
Noninterest income |
|
5,468 |
|
|
|
8,344 |
|
|
|
5,860 |
|
|
|
5,354 |
|
|
|
3,625 |
|
|
Efficiency ratio |
|
66.25 |
% |
|
|
68.72 |
% |
|
|
74.90 |
% |
|
|
78.07 |
% |
|
|
74.32 |
% |
|
|
|
|
|
|
|
|
|
|
|
|
|
|
|
|
|
|
|
|
|
|
(1)Calculated as noninterest expense divided by the sum of net interest income (before provision for loan losses) and noninterest income. |
|
||||||||||||||||||
38
The preparation of our consolidated financial statements in accordance with GAAP requires us to make estimates and judgments that affect our reported amounts of assets, liabilities, income and expenses and related disclosure of contingent assets and liabilities. Wherever feasible, we utilize third-party information to provide management with these estimates. Although independent third parties are engaged to assist us in the estimation process, management evaluates the results, challenges assumptions used and considers other factors which could impact these estimates. Actual results may differ from these estimates under different assumptions or conditions.
For more detailed information about our accounting policies, please refer to Note 1, Summary of Significant Accounting Policies, in the Notes to Consolidated Financial Statements contained in Item 8, Financial Statements and Supplementary Data. The following discussion presents an overview of some of our accounting policies and estimates that require us to make difficult, subjective or complex judgments about inherently uncertain matters when preparing our financial statements. We believe that the judgments, estimates and assumptions that we use in the preparation of our consolidated financial statements are appropriate.
Allowance for Loan Losses. One of the accounting policies most important to the presentation of our financial statements relates to the allowance for loan losses and the related provision for loan losses. The allowance for loan losses is established as losses are estimated through a provision for loan losses charged to earnings. The allowance for loan losses is based on the amount that management believes will be adequate to absorb probable losses inherent in the loan portfolio based on, among other things, evaluations of the collectability of loans and prior loan loss experience. The evaluations take into consideration such factors as changes in the nature and volume of the loan portfolio, overall portfolio quality, review of specific problem loans and current economic conditions that may affect borrowers’ ability to pay. Another component of the allowance is losses on loans assessed as impaired under Financial Accounting Standards Board (“FASB”) Accounting Standards Codification (“ASC”) Topic 310, Receivables (“ASC 310”). The balance of the loans determined to be impaired under ASC 310 and the related allowance is included in management’s estimation and analysis of the allowance for loan losses. Allowances for impaired loans are generally determined based on collateral values or the present value of estimated cash flows.
The determination of the appropriate level of the allowance is inherently subjective as it requires estimates that are susceptible to significant revision as more information becomes available. We have an established methodology to determine the adequacy of the allowance for loan losses that assesses the risks and losses inherent in our portfolio and portfolio segments. We have an internally developed model that requires significant judgment to determine the estimation method that fits the credit risk characteristics of the loans in our portfolio and portfolio segments. Qualitative and environmental factors that may not be directly reflected in quantitative estimates include: asset quality trends, changes in loan concentrations, new products and process changes, changes and pressures from competition, changes in lending policies and underwriting practices, trends in the nature and volume of the loan portfolio, and national and regional economic trends. Changes in these factors are considered in determining changes in the allowance for loan losses. The impact of these factors on our qualitative assessment of the allowance for loan losses can change from period to period based on management’s assessment of the extent to which these factors are already reflected in historic loss rates. The uncertainty inherent in the estimation process is also considered in evaluating the allowance for loan losses.
Acquisition Accounting. We account for our acquisitions under ASC Topic 805, Business Combinations (“ASC 805”), which requires the use of the purchase method of accounting. All identifiable assets acquired, including loans, are recorded at fair value (which is discussed below). The excess purchase price over the fair value of net assets acquired is recorded as goodwill. If the fair value of the net assets acquired exceeds the purchase price, a bargain purchase gain is recognized.
Because the fair value measurements incorporate assumptions regarding credit risk, no allowance for loan losses related to the acquired loans is recorded on the acquisition date. The fair value measurements of acquired loans are based on estimates related to expected prepayments and the amount and timing of undiscounted expected principal, interest and other cash flows. The fair value adjustment is amortized over the life of the loan using the effective interest method.
The Company accounts for acquired impaired loans under ASC Topic 310-30, Loans and Debt Securities Acquired with Deteriorated Credit Quality (“ASC 310-30”). An acquired loan is considered impaired when there is evidence of credit deterioration since origination and it is probable at the date of acquisition that we will be unable to collect all contractually required payments. ASC 310-30 prohibits the carryover of an allowance for loan losses for acquired impaired loans. Over the life of the acquired loans, we continually estimate the cash flows expected to be collected on individual loans or on pools of loans sharing common risk characteristics. As of the end of each fiscal quarter, we evaluate the present value of the acquired loans using the effective interest rates. For any increases in cash flows expected to be collected, we adjust the amount of accretable yield recognized on a prospective basis over the loan’s or pool’s remaining life, while we recognize a provision for loan loss in the consolidated statement of operations if the cash flows expected to be collected have decreased.
39
Intangible Assets. Our intangible assets consist of goodwill, core deposit intangibles, and a trademark intangible that was acquired during the year ended December 31, 2016. Goodwill represents the excess of the purchase price over the fair value of the net identifiable assets acquired in a business combination. Goodwill and other intangible assets deemed to have an indefinite useful life are not amortized but instead are subject to review for impairment annually, or more frequently if deemed necessary, in accordance with ASC Topic 350, Intangibles – Goodwill and Other. Intangible assets with estimable useful lives are amortized over their respective estimated useful lives and reviewed for impairment in accordance with ASC Topic 360, Property, Plant, and Equipment. If impaired, the asset is written down to its estimated fair value. Core deposit intangibles representing the value of the acquired core deposit base are generally recorded in connection with business combinations involving banks and branch locations. Our policy is to amortize core deposit intangibles over the estimated useful life of the deposit base, either on a straight line basis not exceeding 15 years or an accelerated basis over 10 years. The remaining useful lives of core deposit intangibles are evaluated periodically to determine whether events and circumstances warrant revision of the remaining period of amortization. All of our core deposit intangibles are currently amortized on a straight-line basis over 15 years.
Fair Value Measurement. Fair value is defined as the price that would be received to sell an asset or paid to transfer a liability in an orderly transaction between market participants at the measurement date, using assumptions market participants would use when pricing an asset or liability. Fair value is best determined based upon quoted market prices. In cases where quoted market prices are not available, fair values are based on estimates using present value or other valuation techniques. Those techniques are significantly affected by the assumptions used, including the discount rate and estimates of future cash flows, and the fair value estimates may not be realized in an immediate settlement of the instruments. Accordingly, the aggregate fair value amounts presented do not necessarily represent our underlying value.
The definition of fair value focuses on exit price in an orderly transaction (that is, not a forced liquidation or distressed sale) between market participants at the measurement date under current market conditions. If there has been a significant decrease in the volume and level of activity for the asset or liability, a change in valuation technique or the use of multiple valuation techniques may be appropriate. In such instances, determining the price at which willing market participants would transact at the measurement date under current market conditions depends on the facts and circumstances and requires use of significant judgment. The fair value is a reasonable point within the range that is most representative of fair value under current market conditions.
In accordance with fair value guidance, we group our financial assets and financial liabilities measured at fair value in three levels, based on the markets in which the assets and liabilities are traded and the reliability of the assumptions used to determine fair value.
|
|
• |
Level 1 – Valuation is based on quoted prices in active markets for identical assets or liabilities that the reporting entity has the ability to access at the measurement date. Level 1 assets and liabilities generally include debt and equity securities that are traded in an active exchange market. Valuations are obtained from readily available pricing sources for market transactions involving identical assets or liabilities. |
|
|
• |
Level 2—Valuation is based on inputs other than quoted prices included within Level 1 that are observable for the asset or liability, either directly or indirectly. The valuation may be based on quoted prices for similar assets or liabilities; quoted prices in markets that are not active; or other inputs that are observable or can be corroborated by observable market data for substantially the full term of the asset or liability. |
|
|
• |
Level 3—Valuation is based on unobservable inputs that are supported by little or no market activity and that are significant to the fair value of the assets or liabilities. Level 3 assets and liabilities include financial instruments whose value is determined using pricing models, discounted cash flow methodologies, or similar techniques, as well as instruments for which determination of fair value requires significant management judgment or estimation. |
A financial instrument’s categorization within the valuation hierarchy is based upon the lowest level of input that is significant to the fair value measurement.
40
Other-Than-Temporary-Impairment on Investment Securities. On a quarterly basis, we evaluate our investment portfolio for other-than-temporary-impairment (“OTTI”) in accordance with ASC Topic 320, Investments – Debt and Equity Securities. An investment security is considered impaired if the fair value of the security is less than its cost or amortized cost basis. When impairment of an equity security is considered to be other-than-temporary, the security is written down to its fair value and an impairment loss is recorded in earnings. When impairment of a debt security is considered to be other-than-temporary, the security is written down to its fair value. The amount of OTTI recorded as a loss in earnings depends on whether we intend to sell the debt security and whether it is more likely than not that we will be required to sell the security before recovery of its amortized cost basis. If we intend to sell the debt security or more likely than not will be required to sell the security before recovery of its amortized cost basis, the entire difference between the security’s amortized cost basis and its fair value is recorded as an impairment loss in earnings. If we do not intend to sell the debt security and it is not more likely than not that we will be required to sell the security before recovery of its amortized cost basis, OTTI is separated into the amount representing credit loss and the amount related to all other market factors. The amount related to credit loss is recognized in earnings. The amount related to other market factors is recognized in other comprehensive income, net of applicable taxes.
Stock-Based Compensation. We recognize compensation expense for all stock-based payments to employees in accordance with ASC Topic 718, Compensation – Stock Compensation. Under this accounting guidance, such payments are measured at fair value. Determining the fair value of, and ultimately the expense we recognize related to, our stock-based payments requires us to make assumptions regarding dividend yields, expected stock price volatility, estimated forfeitures and, as to stock options, the expected life of the option. Changes in these assumptions and estimates can materially affect the calculated fair value of stock-based compensation and the related expense to be recognized.
Income Taxes. Accrued taxes represent the estimated amount payable to or receivable from taxing jurisdictions, either currently or in the future, and are reported in our consolidated statement of operations after exclusion of non-taxable income such as interest on state and municipal securities. Also, certain items of income and expenses are recognized in different time periods for financial statement purposes than for income tax purposes. Thus, provisions for deferred taxes are recorded in recognition of such temporary differences. The calculation of our income tax expense is complex and requires the use of many estimates and judgments in its determination.
Deferred taxes are determined utilizing a liability method whereby we recognize deferred tax assets for deductible temporary differences and deferred tax liabilities for taxable temporary differences. Temporary differences are the differences between the reported amounts of assets and liabilities and their tax bases. Deferred tax assets are reduced by a valuation allowance when, in the opinion of management, it is more likely than not that some portion or all of the deferred tax assets will not be realized. We adjust deferred tax assets and liabilities for the effects of changes in tax laws and rates on the date of enactment.
The Company has adopted accounting guidance related to accounting for uncertainty in income taxes, which sets out a consistent framework to determine the appropriate level of tax reserves to maintain for uncertain tax positions. We recognize deferred tax assets if it is more likely than not, based on the technical merits, that the tax position will be realized or sustained upon examination. The term “more likely than not” means a likelihood of more than 50%. A tax position that meets the more-likely-than-not recognition threshold is initially and subsequently measured as the largest amount of tax benefit that has a greater than 50% likelihood of being realized upon settlement with a taxing authority that has full knowledge of all relevant information. The determination of whether or not a tax position has met the more-likely-than-not recognition threshold considers the facts, circumstances, and information available at the reporting date and is subject to management’s judgment. Deferred tax assets are reduced by a valuation allowance when, if based on the weight of evidence available, it is more likely than not that some portion or all of deferred tax asset will not be realized.
We recognize interest and penalties on income taxes as a component of income tax expense.
Implications of and Elections under the JOBS Act. Pursuant to the JOBS Act, an emerging growth company such as the Company can choose to not adopt new or revised accounting standards that may be issued by the FASB until they would apply to private companies. We have elected not to opt in to such extended transition period, which election is irrevocable. As a result of this election, our financial statements may not be comparable to the financial statements of emerging growth companies that have opted in to this extended transition period, but they will be comparable to those of other public companies that are neither emerging growth companies nor emerging growth companies that have opted in to using the extended transition period. In addition, we have elected to take advantage of the reduced disclosure requirements relating to executive compensation arrangements that is available to us so long as we remain an emerging growth company.
Discussion and Analysis of Financial Condition
Total assets were $1.2 billion at December 31, 2016, an increase of 12% from total assets of $1.0 billion at December 31, 2015. Our total assets of $1.0 billion at December 31, 2015 represents a 17% increase from total assets of $879.4 million at December 31, 2014. The growth experienced since December 31, 2014 can be attributed to organic growth of the Company through the hiring of a number of key bankers, including experienced commercial lenders.
41
General. Loans, excluding loans held for sale, constitute our most significant asset, comprising 77%, 72%, and 71% of our total assets at December 31, 2016, 2015, and 2014, respectively. Loans, excluding loans held for sale, increased $148.0 million, or 20%, to $893.4 million at December 31, 2016 from $745.4 million at December 31, 2015. Loans, excluding loans held for sale, increased $122.6 million, or 20%, to $745.4 million at December 31, 2015 from $622.8 million at December 31, 2014.
The table below sets forth the balance of loans, excluding loans held for sale, outstanding by loan type as of the dates presented, and the percentage of each loan type to total loans (dollars in thousands).
|
|
December 31, |
|
|
|||||||||||||||||||||||||||||||||||||||||
|
|
2016 |
|
|
|
2015 |
|
|
|
2014 |
|
|
|
2013 |
|
|
|
2012 |
|
|
|||||||||||||||||||||||||
|
|
Amount |
|
|
Percentage of Total Loans |
|
|
|
Amount |
|
|
Percentage of Total Loans |
|
|
|
Amount |
|
|
Percentage of Total Loans |
|
|
|
Amount |
|
|
Percentage of Total Loans |
|
|
|
Amount |
|
|
Percentage of Total Loans |
|
|
||||||||||
|
Mortgage loans on real estate: |
|
|
|
|
|
|
|
|
|
|
|
|
|
|
|
|
|
|
|
|
|
|
|
|
|
|
|
|
|
|
|
|
|
|
|
|
|
|
|
|
|
|
|
|
|
Construction and land development |
$ |
90,737 |
|
|
|
10.2 |
% |
|
|
$ |
81,863 |
|
|
|
11.0 |
% |
|
|
$ |
71,350 |
|
|
|
11.4 |
% |
|
|
$ |
63,170 |
|
|
|
12.5 |
% |
|
|
$ |
20,271 |
|
|
|
7.0 |
% |
|
|
1-4 Family |
|
177,205 |
|
|
|
19.8 |
|
|
|
|
156,300 |
|
|
|
21.0 |
|
|
|
|
137,519 |
|
|
|
22.1 |
|
|
|
|
104,685 |
|
|
|
20.8 |
|
|
|
|
54,813 |
|
|
|
19.0 |
|
|
|
Multifamily |
|
42,759 |
|
|
|
4.8 |
|
|
|
|
29,694 |
|
|
|
4.0 |
|
|
|
|
17,458 |
|
|
|
2.8 |
|
|
|
|
14,286 |
|
|
|
2.8 |
|
|
|
|
1,750 |
|
|
|
0.6 |
|
|
|
Farmland |
|
8,207 |
|
|
|
0.9 |
|
|
|
|
2,955 |
|
|
|
0.4 |
|
|
|
|
2,919 |
|
|
|
0.5 |
|
|
|
|
830 |
|
|
|
0.2 |
|
|
|
|
64 |
|
|
|
0.0 |
|
|
|
Commercial real estate |
|
|
|
|
|
|
|
|
|
|
|
|
|
|
|
|
|
|
|
|
|
|
|
|
|
|
|
|
|
|
|
|
|
|
|
|
|
|
|
|
|
|
|
|
|
Owner- occupied |
|
180,458 |
|
|
|
20.2 |
|
|
|
|
137,752 |
|
|
|
18.5 |
|
|
|
|
119,668 |
|
|
|
19.2 |
|
|
|
|
78,415 |
|
|
|
15.6 |
|
|
|
|
52,534 |
|
|
|
18.2 |
|
|
|
Nonowner- occupied |
|
200,258 |
|
|
|
22.4 |
|
|
|
|
150,831 |
|
|
|
20.2 |
|
|
|
|
105,390 |
|
|
|
16.9 |
|
|
|
|
78,948 |
|
|
|
15.6 |
|
|
|
|
47,393 |
|
|
|
16.4 |
|
|
|
Commercial and industrial |
|
85,377 |
|
|
|
9.6 |
|
|
|
|
69,961 |
|
|
|
9.4 |
|
|
|
|
54,187 |
|
|
|
8.7 |
|
|
|
|
32,665 |
|
|
|
6.5 |
|
|
|
|
15,319 |
|
|
|
5.3 |
|
|
|
Consumer |
|
108,425 |
|
|
|
12.1 |
|
|
|
|
116,085 |
|
|
|
15.5 |
|
|
|
|
114,299 |
|
|
|
18.4 |
|
|
|
|
131,096 |
|
|
|
26.0 |
|
|
|
|
96,609 |
|
|
|
33.5 |
|
|
|
Total loans |
$ |
893,426 |
|
|
|
100.0 |
% |
|
|
$ |
745,441 |
|
|
|
100.0 |
% |
|
|
$ |
622,790 |
|
|
|
100.0 |
% |
|
|
$ |
504,095 |
|
|
|
100.0 |
% |
|
|
$ |
288,753 |
|
|
|
100.0 |
% |
|
As the table above indicates, we have experienced significant growth in all loan categories, with the exception of consumer, from 2014 to 2016. Our focus on a relationship-driven banking strategy and the hiring of experienced commercial lenders are the primary reasons for our loan growth from 2014 to 2016. The decrease in the consumer loan portfolio from 2014 to 2016 is primarily a result of pay-downs of portfolio loans. In addition, the Company announced in November 2015 that the Bank would be exiting the indirect auto loan origination business based on the operating performance of the business, in order to focus the Bank’s resources on relationship banking. The Bank discontinued accepting indirect auto loan applications on December 31, 2015, but continued to process and fund applications that were accepted on or before that date. Indirect auto loans represented approximately 85% of our total consumer loans at December 31, 2016. As a result, the Company expects its consumer loan portfolio as a percentage of the total loan portfolio to decrease over time.
At December 31, 2016, the Company’s total business lending portfolio, which consists of loans secured by owner-occupied commercial real estate properties and commercial and industrial loans, was $265.8 million, an increase of $58.1 million, or 28%, compared to the business lending portfolio of $207.7 million at December 31, 2015. The business lending portfolio at December 31, 2015 increased $33.8 million, or 19%, compared to $173.9 million at December 31, 2014.
42
The following table sets forth loans outstanding at December 31, 2016, which, based on remaining scheduled repayments of principal, are due in the periods indicated, as well as the amount of loans with fixed and variable rates in each maturity range. Loans with balloon payments and longer amortizations are often repriced and extended beyond the initial maturity when credit conditions remain satisfactory. Demand loans, loans having no stated schedule of repayments and no stated maturity and overdrafts are reported below as due in one year or less.
|
(dollars in thousands) |
|
One Year or Less |
|
|
After One Year Through Five Years |
|
|
After Five Years Through Ten Years |
|
|
After Ten Years Through Fifteen Years |
|
|
After Fifteen Years |
|
|
Total |
|
||||||
|
Mortgage loans on real estate: |
|
|
|
|
|
|
|
|
|
|
|
|
|
|
|
|
|
|
|
|
|
|
|
|
|
Construction and land development |
|
$ |
72,807 |
|
|
$ |
10,404 |
|
|
$ |
5,330 |
|
|
$ |
1,700 |
|
|
$ |
496 |
|
|
$ |
90,737 |
|
|
1-4 Family |
|
|
25,342 |
|
|
|
35,576 |
|
|
|
42,069 |
|
|
|
30,326 |
|
|
|
43,892 |
|
|
|
177,205 |
|
|
Multifamily |
|
|
744 |
|
|
|
17,503 |
|
|
|
22,804 |
|
|
|
120 |
|
|
|
1,588 |
|
|
|
42,759 |
|
|
Farmland |
|
|
3,478 |
|
|
|
21 |
|
|
|
2,766 |
|
|
|
1,942 |
|
|
|
- |
|
|
|
8,207 |
|
|
Commercial real estate |
|
|
|
|
|
|
|
|
|
|
|
|
|
|
|
|
|
|
|
|
|
|
|
|
|
Owner-occupied |
|
|
14,770 |
|
|
|
47,487 |
|
|
|
71,952 |
|
|
|
36,130 |
|
|
|
10,119 |
|
|
|
180,458 |
|
|
Nonowner-occupied |
|
|
18,365 |
|
|
|
94,444 |
|
|
|
60,603 |
|
|
|
26,846 |
|
|
|
- |
|
|
|
200,258 |
|
|
Commercial and industrial |
|
|
35,340 |
|
|
|
37,437 |
|
|
|
11,991 |
|
|
|
- |
|
|
|
609 |
|
|
|
85,377 |
|
|
Consumer |
|
|
1,990 |
|
|
|
72,193 |
|
|
|
33,745 |
|
|
|
377 |
|
|
|
120 |
|
|
|
108,425 |
|
|
Total loans |
|
$ |
172,836 |
|
|
$ |
315,065 |
|
|
$ |
251,260 |
|
|
$ |
97,441 |
|
|
$ |
56,824 |
|
|
$ |
893,426 |
|
|
Amounts with fixed rates |
|
$ |
21,905 |
|
|
$ |
305,003 |
|
|
$ |
247,035 |
|
|
$ |
97,441 |
|
|
$ |
56,824 |
|
|
$ |
728,208 |
|
|
Amounts with variable rates |
|
|
150,931 |
|
|
|
10,062 |
|
|
|
4,225 |
|
|
|
- |
|
|
|
- |
|
|
|
165,218 |
|
|
Total loans |
|
$ |
172,836 |
|
|
$ |
315,065 |
|
|
$ |
251,260 |
|
|
$ |
97,441 |
|
|
$ |
56,824 |
|
|
$ |
893,426 |
|
Loans Held for Sale. Loans held for sale, consisting of both consumer and mortgage loans, decreased $80.5 million, or 100%, to $0 at December 31, 2016. This decrease is mainly attributable to the reclassification of approximately $35.0 million of consumer loans from held for sale to the consumer portfolio during the fourth quarter of 2016. In addition, during the year ended December 31, 2016, the Company sold approximately $26.9 million of the consumer loans and $0.6 million of the mortgage loans that were held for sale at December 31, 2015. Loans held for sale were $80.5 million and $103.4 million at December 31, 2015 and 2014, respectively.
There were no consumer loans originated for sale during the year ended December 31, 2016. In the years ended December 31, 2015 and 2014, we originated $303.1 million, and $170.8 million, respectively, in consumer loans for sale, consisting of auto loans.
For the year ended December 31, 2016, we recognized gains from the sales of pools of our consumer loans of $0.4 million. For the year ended December 31, 2015, the gains from sales of pools of our consumer loans was $3.1 million, an increase over gains of $1.7 million from such sales for the year ended December 31, 2014, due primarily to the overall growth in consumer loan originations and our strategy to sell the majority of consumer loans originated during the year ended 2015. We have reclassified all remaining consumer loans previously held for sale into our consumer portfolio and no longer anticipate recognizing gains from the sales of these loans, as mentioned in Loans – General above.
In the years ended December 31, 2016 and 2015, we originated $0.5 million and $46.6 million, respectively, in mortgage loans for sale, and recognized $13,000 and $1.3 million, respectively, in gain on the sale of mortgage loans. Mortgage loans held for sale decreased $0.6 million, or 100%, to $0 at December 31, 2016 from $0.6 million at December 31, 2015. The decrease is due to our decreased mortgage operations, and we do not anticipate originating mortgage loans for sale in the future.
Historically, the one-to-four family mortgage loans not held in our portfolio were typically sold on a “best efforts” basis within 30 days after the loan was funded. This means that residential real estate originations are locked in at a contractual rate with a third-party investor or directly with government sponsored agencies, and we are obligated to sell the mortgage only if it is closed and funded. As a result, the risk we assume is conditioned upon loan underwriting and market conditions in the national mortgage market. Although loan fees and some interest income are derived from mortgage loans held for sale, our main source of income on these loans is gains from the loan sales in the secondary market which is recorded in gain on sale of loans on the consolidated statements of operations.
Loan Concentrations. Loan concentrations are considered to exist when there are amounts loaned to multiple borrowers engaged in similar activities that would cause them to be similarly impacted by economic or other conditions. At December 31, 2016 and December 31, 2015, we had no concentrations of loans exceeding 10% of total loans other than loans in the categories listed in the table above.
43
We purchase investment securities primarily to provide a source for meeting liquidity needs, with return on investment a secondary consideration. We also use investment securities as collateral for certain deposits and other types of borrowing. Investment securities represented 16% of our total assets at December 31, 2016 and totaled $183.1 million at December 31, 2016, an increase of $43.3 million, or 31%, from $139.8 million at December 31, 2015. The investment securities balance at December 31, 2015 represents a $47.0 million, or 51%, increase from $92.8 million at December 31, 2014. The increase in investment securities at December 31, 2016 compared to December 31, 2015 and 2014 resulted from purchases of multiple investment types in our current portfolio using excess funds not used in lending.
The table below shows the carrying value of our investment securities portfolio by investment type and the percentage that such investment type comprises of our entire portfolio as of the dates indicated (dollars in thousands).
|
|
December 31, 2016 |
|
|
|
December 31, 2015 |
|
|
|
December 31, 2014 |
|
|
|||||||||||||||
|
|
Balance |
|
|
Percentage of Portfolio |
|
|
|
Balance |
|
|
Percentage of Portfolio |
|
|
|
Balance |
|
|
Percentage of Portfolio |
|
|
||||||
|
Obligations of other U.S. government agencies and corporations |
$ |
29,490 |
|
|
|
16.1 |
% |
|
|
$ |
30,460 |
|
|
|
21.8 |
% |
|
|
$ |
8,339 |
|
|
|
9.0 |
% |
|
|
Obligations of state and political subdivisions |
|
40,831 |
|
|
|
22.3 |
|
|
|
|
35,515 |
|
|
|
25.4 |
|
|
|
|
26,811 |
|
|
|
28.9 |
|
|
|
Corporate bonds |
|
14,968 |
|
|
|
8.2 |
|
|
|
|
14,824 |
|
|
|
10.6 |
|
|
|
|
5,419 |
|
|
|
5.8 |
|
|
|
Residential mortgage-backed securities |
|
94,703 |
|
|
|
51.7 |
|
|
|
|
55,899 |
|
|
|
40.0 |
|
|
|
|
50,224 |
|
|
|
54.1 |
|
|
|
Commercial mortgage-backed securities |
|
2,444 |
|
|
|
1.3 |
|
|
|
|
1,989 |
|
|
|
1.4 |
|
|
|
|
1,491 |
|
|
|
1.6 |
|
|
|
Equity securities |
|
706 |
|
|
|
0.4 |
|
|
|
|
1,092 |
|
|
|
0.8 |
|
|
|
|
534 |
|
|
|
0.6 |
|
|
|
Total investment securities |
$ |
183,142 |
|
|
|
100.0 |
% |
|
|
$ |
139,779 |
|
|
|
100.0 |
% |
|
|
$ |
92,818 |
|
|
|
100.0 |
% |
|
The investment portfolio consists of available for sale and held to maturity securities. We classify debt securities as held to maturity if management has the positive intent and ability to hold the securities to maturity. Held to maturity securities are stated at amortized cost. Securities not classified as held to maturity or trading are classified as available for sale. The carrying values of the Company’s available for sale securities are adjusted for unrealized gains or losses as valuation allowances, and any gains or losses are reported on an after-tax basis as a component of other comprehensive income. Any expected credit loss due to the inability to collect all amounts due according to the security’s contractual terms is recognized as a charge against earnings. Any remaining unrealized loss related to other factors would be recognized in other comprehensive income, net of taxes.
In the year ended December 31, 2016, we purchased $87.3 million of investment securities, compared to purchases of $88.6 million and $72.2 million of investment securities during the years ended December 31, 2015 and 2014, respectively. We increased our purchases of securities in 2015, which continued throughout 2016, primarily to increase the amount of liquidity on our balance sheet and also to reposition the portfolio to take advantage of an anticipated rising interest rate environment. Mortgage-backed securities represented 65%, 42%, and 87% of the available for sale securities we purchased in 2016, 2015, and 2014, respectively. Of the remaining securities purchased in 2016, 2015 and 2014, 20%, 29% and 6%, respectively, were U.S. government agency securities, while 2%, 16%, and 3%, respectively, were municipal securities. We only purchase corporate bonds that are investment grade securities issued by seasoned corporations.
Typically, our investment securities are available for sale. There were no purchases of held to maturity securities during the year ended December 31, 2016. Our purchases of held to maturity securities comprised only 6% of our total investment purchases in 2015 and consisted only of mortgage-backed securities. Our purchases of held to maturity securities comprised 23% of our total investment purchases in 2014 and mainly consisted of U.S. government agency securities.
44
The table below sets forth the stated maturities and weighted average yields of our investment debt securities based on the amortized cost of our investment portfolio as of December 31, 2016 (dollars in thousands).
|
|
One Year or Less |
|
|
After One Year Through Five Years |
|
|
After Five Years Through Ten Years |
|
|
After Ten Years |
|
|
||||||||||||||||||||
|
|
Amount |
|
|
Yield |
|
|
Amount |
|
|
Yield |
|
|
Amount |
|
|
Yield |
|
|
Amount |
|
|
Yield |
|
|
||||||||
|
Held to maturity: |
|
|
|
|
|
|
|
|
|
|
|
|
|
|
|
|
|
|
|
|
|
|
|
|
|
|
|
|
|
|
|
|
|
Obligations of states and political subdivisions |
$ |
685 |
|
|
|
7.17 |
% |
|
$ |
3,095 |
|
|
|
7.17 |
% |
|
$ |
2,745 |
|
|
|
7.17 |
% |
|
$ |
6,451 |
|
|
|
4.38 |
% |
|
|
Residential mortgage-backed securities |
|
- |
|
|
|
- |
|
|
|
- |
|
|
|
- |
|
|
|
- |
|
|
|
- |
|
|
|
7,115 |
|
|
|
2.74 |
|
|
|
Available for sale: |
|
|
|
|
|
|
|
|
|
|
|
|
|
|
|
|
|
|
|
|
|
|
|
|
|
|
|
|
|
|
|
|
|
Obligations of other U.S. government agencies and corporations |
|
- |
|
|
|
- |
|
|
|
1,346 |
|
|
|
2.61 |
|
|
|
5,819 |
|
|
|
2.42 |
|
|
|
22,644 |
|
|
|
2.32 |
|
|
|
Obligations of states and political subdivisions |
|
853 |
|
|
|
1.31 |
|
|
|
4,391 |
|
|
|
2.15 |
|
|
|
4,121 |
|
|
|
3.06 |
|
|
|
20,266 |
|
|
|
4.05 |
|
|
|
Corporate bonds |
|
900 |
|
|
|
1.90 |
|
|
|
4,772 |
|
|
|
2.29 |
|
|
|
9,370 |
|
|
|
3.28 |
|
|
|
250 |
|
|
|
4.00 |
|
|
|
Residential mortgage-backed securities |
|
- |
|
|
|
- |
|
|
|
- |
|
|
|
- |
|
|
|
5,343 |
|
|
|
2.31 |
|
|
|
82,952 |
|
|
|
2.18 |
|
|
|
Commercial mortgage-backed securities |
|
- |
|
|
|
- |
|
|
|
- |
|
|
|
- |
|
|
|
2,520 |
|
|
|
2.14 |
|
|
|
- |
|
|
|
- |
|
|
|
|
$ |
2,438 |
|
|
|
|
|
|
$ |
13,604 |
|
|
|
|
|
|
$ |
29,918 |
|
|
|
|
|
|
$ |
139,678 |
|
|
|
|
|
|
The maturity of mortgage-backed securities reflects scheduled repayments based upon the contractual maturities of the securities. Weighted average yields on tax-exempt obligations have been computed on a fully tax equivalent basis assuming a federal tax rate of 35%.
Premises and Equipment
Bank premises and equipment increased $1.1 million, or 3.6%, to $31.7 million at December 31, 2016 from $30.6 million at December 31, 2015. In September 2016, the Bank purchased the second floor of the building in which its executive and operations center is located, which is the primary reason for the increase. Bank premises and equipment increased $2.1 million, or 7%, to $30.6 million at December 31, 2015 from $28.5 million at December 31, 2014. The construction of a new branch location in Gonzales, Louisiana and the purchase of potential future branch locations in Jefferson and Calcasieu Parishes are the primary reasons for this increase.
Deferred Tax Asset
At December 31, 2016, the net deferred tax asset was $2.9 million, compared to $1.9 million and $1.1 million, respectively, at December 31, 2015 and 2014. The increase is mainly attributable to the $0.8 million increase in the deferred tax asset related to the increase in the unrealized loss in the available for sale securities portfolio resulting from an increase in interest rates, and the $0.6 million increase related to the provision for loan losses.
The Bank acquired net operating loss carryforwards as a result of the acquisitions of both SLBB and FCB. At December 31, 2016, we held approximately $0.9 million in net operating loss carryforwards, which expire in 2033. U.S. tax law imposes annual limitations under Internal Revenue Code Section 382 on the amount of net operating loss carryforwards that may be used to offset federal taxable income. Under these laws, we may apply up to approximately $0.1 million to offset our taxable income each year through 2023. In addition to this limitation, our ability to utilize net operating loss carryforwards depends upon the Company generating taxable income. Given the substantial amount of time before our net operating loss carryforwards begin to expire, we currently expect to utilize these net operating loss carryforwards in full before their expiration.
45
The following table sets forth the composition of our deposits and the percentage of each deposit type to total deposits at December 31, 2016, 2015 and 2014 (dollars in thousands).
|
|
December 31, 2016 |
|
|
|
December 31, 2015 |
|
|
|
December 31, 2014 |
|
|
|||||||||||||||
|
|
Amount |
|
|
Percentage of Total Deposits |
|
|
|
Amount |
|
|
Percentage of Total Deposits |
|
|
|
Amount |
|
|
Percentage of Total Deposits |
|
|
||||||
|
Noninterest-bearing demand deposits |
$ |
108,404 |
|
|
|
11.9 |
% |
|
|
$ |
90,447 |
|
|
|
12.3 |
% |
|
|
$ |
70,217 |
|
|
|
11.2 |
% |
|
|
NOW accounts |
|
171,556 |
|
|
|
18.9 |
|
|
|
|
140,503 |
|
|
|
19.0 |
|
|
|
|
116,644 |
|
|
|
18.6 |
|
|
|
Money market deposit accounts |
|
123,079 |
|
|
|
13.6 |
|
|
|
|
96,113 |
|
|
|
13.0 |
|
|
|
|
77,589 |
|
|
|
12.3 |
|
|
|
Savings accounts |
|
52,860 |
|
|
|
5.8 |
|
|
|
|
53,735 |
|
|
|
7.3 |
|
|
|
|
53,332 |
|
|
|
8.5 |
|
|
|
Time deposits |
|
451,888 |
|
|
|
49.8 |
|
|
|
|
356,608 |
|
|
|
48.4 |
|
|
|
|
310,336 |
|
|
|
49.4 |
|
|
|
Total deposits |
$ |
907,787 |
|
|
|
100 |
% |
|
|
$ |
737,406 |
|
|
|
100 |
% |
|
|
$ |
628,118 |
|
|
|
100 |
% |
|
Total deposits were $907.8 million at December 31, 2016, an increase of $170.4 million, or 23%, from total deposits of $737.4 million at December 31, 2015. Total deposits at December 31, 2015 increased $109.3 million, or 17%, from total deposits of $628.1 million at December 31, 2014. The increase in deposits at December 31, 2016 compared to December 31, 2015 and 2014 resulted from organic growth in all of our markets.
The following table shows the contractual maturities of certificates of deposit and other time deposits greater than $100,000 at December 31, 2016 and 2015 (dollars in thousands).
|
|
December 31, |
|
|||||||||||||
|
|
2016 |
|
|
2015 |
|
||||||||||
|
Time remaining until maturity: |
Certificates of Deposit |
|
|
Other Time Deposits |
|
|
Certificates of Deposit |
|
|
Other Time Deposits |
|
||||
|
Three months or less |
$ |
59,639 |
|
|
$ |
100 |
|
|
$ |
4,312 |
|
|
$ |
363 |
|
|
Over three months through six months |
|
25,695 |
|
|
|
358 |
|
|
|
10,039 |
|
|
|
- |
|
|
Over six months through twelve months |
|
20,327 |
|
|
|
660 |
|
|
|
12,809 |
|
|
|
103 |
|
|
Over one year through three years |
|
65,865 |
|
|
|
1,388 |
|
|
|
5,272 |
|
|
|
438 |
|
|
Over three years |
|
8,684 |
|
|
|
297 |
|
|
|
1,468 |
|
|
|
- |
|
|
|
$ |
180,210 |
|
|
$ |
2,803 |
|
|
$ |
33,900 |
|
|
$ |
904 |
|
Borrowings
Total borrowings include securities sold under agreements to repurchase, advances from the Federal Home Loan Bank (“FHLB”), unsecured lines of credit with First National Bankers Bankshares, Inc. (“FNBB”) and The Independent Bankers Bank (“TIB”), and junior subordinated debentures. In addition, in June 2016, the Company entered into a loan agreement with TIB providing for a $20.0 million secured, revolving line of credit maturing June 27, 2018, as further described under the heading Liquidity and Capital Resources. Other borrowings on the consolidated balance sheets consist of the balance on our secured revolving line of credit with TIB, which was $1.0 million at December 31, 2016. There were no funds drawn on the unsecured lines of credit at December 31, 2016 or 2015. Our advances from the FHLB were $82.8 million at December 31, 2016, a decrease of $44.7 million, or 35%, from FHLB advances of $127.5 million at December 31, 2015. Securities sold under agreements to repurchase remained consistent at $39.1 million at both December 31, 2016 and 2015. The $3.6 million in junior subordinated debt at December 31, 2016 and 2015 represents the junior subordinated debentures that we assumed in connection with our acquisition of FCB. The Company decreased its overall borrowings by $43.7 million with funds from organic growth in deposits.
46
Securities sold under agreements to repurchase increased $26.8 million to $39.1 million at December 31, 2015 from $12.3 million at December 31, 2014 primarily as a result of increased agreements with one customer. Our advances from the FHLB were $127.5 million at December 31, 2015, an increase of $1.7 million, or 1%, from FHLB advances of $125.8 million at December 31, 2014.
The average balances and cost of funds of short-term borrowings at December 31, 2016, 2015 and 2014 are summarized in the table below (dollars in thousands).
|
|
Average Balances |
|
|
Cost of Funds |
|
|
||||||||||||||||||||
|
|
December 31, |
|
|
December 31, |
|
|
||||||||||||||||||||
|
|
2016 |
|
|
2015 |
|
|
2014 |
|
|
2016 |
|
|
|
2015 |
|
|
|
2014 |
|
|
||||||
|
Federal funds purchased and other short-term borrowings |
$ |
80,638 |
|
|
$ |
41,906 |
|
|
$ |
16,521 |
|
|
|
1.12 |
% |
|
|
|
0.20 |
% |
|
|
|
0.16 |
% |
|
|
Securities sold under agreements to repurchase |
|
27,701 |
|
|
|
19,064 |
|
|
|
11,828 |
|
|
|
0.20 |
|
|
|
|
0.20 |
|
|
|
|
0.23 |
|
|
|
Total short-term borrowings |
$ |
108,339 |
|
|
$ |
60,970 |
|
|
$ |
28,349 |
|
|
|
0.88 |
% |
|
|
|
0.20 |
% |
|
|
|
0.19 |
% |
|
Results of Operations
Performance Summary
2016 vs. 2015. For the year ended December 31, 2016, net income was $7.9 million, or $1.11 per basic share and $1.10 per diluted share, compared to net income of $7.1 million, or $0.98 per basic share and $0.97 per diluted share, for the year ended December 31, 2015. The increase in our net income was primarily driven by higher levels of net interest income resulting from strong organic loan growth, offset, in part, by a decrease in yields on interest-earning assets and an increase in the cost of funds. Return on average assets decreased to 0.71% for the year ended December 31, 2016 from 0.77% for the year ended December 31, 2015, mainly as a result of a decrease in noninterest income, lower yields on interest-earning assets, and an increased cost of funds. Return on average equity was 7.0% for the year ended December 31, 2016 compared to 6.6% for the year ended December 31, 2015.
2015 vs. 2014. For the year ended December 31, 2015, net income was $7.1 million, or $0.98 per basic share and $0.97 per diluted share, compared to net income of $5.4 million, or $0.98 per basic share and $0.93 per diluted share, for the year ended December 31, 2014. The increase in our net income was primarily driven by higher levels of net interest income resulting from strong organic loan growth, offset, in part, by a decrease in yields on interest-earning assets. Return on average assets increased to 0.77% for the year ended December 31, 2015 from 0.73% for the year ended December 31, 2014 primarily as a result of increases in interest income and noninterest income. Return on average equity was 6.6% for the year ended December 31, 2015 compared to 6.8% for the year ended December 31, 2014. This decrease is attributable to the increase in average equity in 2015 as a result of the Company’s initial public offering in July 2014.
Net Interest Income and Net Interest Margin
Net interest income, which is the largest component of our earnings, is the difference between interest earned on assets and the cost of interest-bearing liabilities. The primary factors affecting net interest income are the volume, yield and mix of our rate-sensitive assets and liabilities as well as the amount of our nonperforming loans and the interest rate environment.
The primary factors affecting net interest margin are changes in interest rates, competition and the shape of the interest rate yield curve. The decline in interest rates since 2008 has put significant downward pressure on net interest margin over the past few years. Each rate reduction in interest rate indices (and, in particular, the prime rate, rates paid on U.S. Treasury securities and the London Interbank Offering Rate) resulted in a reduction in the yield on our variable rate loans indexed to one of these indices. However, rates on our deposit and other interest-bearing liabilities did not decline proportionally. To offset the effects on our net interest income and net interest margin from the prevailing interest rate environment, we have attempted to focus our interest-earning assets in loans and shift our interest-bearing liabilities from higher-costing deposits, like certificates of deposit, to noninterest-bearing and other lower cost deposits.
2016 vs. 2015. Net interest income increased 10.4% to $34.7 million for the year ended December 31, 2016 from $31.5 million for the same period in 2015. Net interest margin was 3.32% for the year ended December 31, 2016, down 29 basis points from 3.61% for the year ended December 31, 2015. The increase in net interest income resulted from increases in the volume of interest-earning assets, offset by declines in the rate earned on interest-earning assets and an increase in the volume of interest-bearing liabilities, as well as an increase in the rate paid on such liabilities. These changes were driven by organic loan and deposit growth and the current interest rate environment. For the year ended December 31, 2016, average loans and average investment securities increased approximately $108.3 million and $57.8 million, respectively, compared to the same period in 2015, while average interest-bearing deposits and average short- and long-term borrowings increased approximately $129.5 million and $33.7 million, respectively.
47
Interest income was $43.2 million for the year ended December 31, 2016 compared to $37.3 million for the same period in 2015. Loan interest income made up substantially all of our interest income for the years ended December 31, 2016 and 2015. Interest on our commercial real estate loans, one-to-four family residential real estate loans and consumer loans constituted the three largest components of our loan interest income for the years ended December 31, 2016 and 2015 at 75% and 77%, respectively, for such periods. The prolonged low interest rate environment contributed to a lower yield on earning assets, offset by the increases in interest-earning assets, described above. The overall yield on interest-earning assets decreased 17 basis points to 4.12% for the year ended December 31, 2016 as compared to 4.29% for the same period in 2015. The loan portfolio yielded 4.55% for the year ended December 31, 2016 as compared to 4.65% for the year ended December 31, 2015, while the yield on the investment portfolio was 2.27% for the year ended December 31, 2016 compared to 2.22% for the year ended December 31, 2015.
Interest expense was $8.4 million for the year ended December 31, 2016, an increase of $2.5 million compared to interest expense of $5.9 million for the year ended December 31, 2015, as a result of an increase in volume of interest-bearing liabilities and a slight increase in cost. Average interest-bearing liabilities increased approximately $163.2 million for the year ended December 31, 2016 compared to the same period in 2015 as a result of our organic deposit growth as well as increased borrowings. The cost of interest-bearing liabilities increased 13 basis points to 0.95% for the year ended December 31, 2016 compared to the same period in 2015, primarily as a result of an increase in the cost of short-term borrowings.
2015 vs. 2014. Net interest income increased 18% to $31.5 million for the year ended December 31, 2015 from $26.7 million for the same period in 2014. Net interest margin was 3.61% for the year ended December 31, 2015, down 24 basis points from 3.85% for the year ended December 31, 2014. The increase in net interest income resulted from increases in the volume of interest-earning assets, offset by declines in the rate earned on interest-earnings assets and an increase in the volume of interest-bearing liabilities, as well as a slight decrease in the rate paid on such liabilities. These changes were driven by organic loan and deposit growth and the current interest rate environment. For the year ended December 31, 2015, average loans and average investment securities increased approximately $152.8 million and $19.6 million, respectively, compared to the same period in 2014, while average interest-bearing deposits and average short- and long-term borrowings increased approximately $105.2 million and $30.0 million, respectively.
Interest income was $37.3 million for the year ended December 31, 2015 compared to $31.4 million for the same period in 2014. Loan interest income made up substantially all of our interest income for the years ended December 31, 2015 and 2014. Interest on our commercial real estate loans, one-to-four family residential real estate loans and consumer loans constituted the three largest components of our loan interest income for the years ended December 31, 2015 and 2014 at 77% and 79%, respectively, for such periods. The prolonged low interest rate environment contributed to a lower yield on earning assets, offset by the increases in interest-earning assets, described above. The overall yield on interest-earning assets decreased 23 basis points to 4.29% for the year ended December 31, 2015 as compared to 4.52% for the same period in 2014. The loan portfolio yielded 4.65% for the year ended December 31, 2015 as compared to 4.99% for the year ended December 31, 2014, while the yield on the investment portfolio was 2.22% for the year ended December 31, 2015 compared to 1.69% for the year ended December 31, 2014.
Interest expense was $5.9 million for the year ended December 31, 2015, an increase of $1.2 million compared to interest expense of $4.7 million for the year ended December 31, 2014, as a result of an increase in volume of interest-bearing liabilities and a slight increase in cost. Average interest-bearing liabilities increased approximately $135.1 million for the year ended December 31, 2015 as compared to the same period in 2014 as a result of our organic deposit growth. The cost of interest-bearing liabilities increased two basis points to 0.82% for the year ended December 31, 2015 compared to the same period in 2014, primarily as a result of an increase in the cost of short-term borrowings.
48
Average Balances and Yields. The following table sets forth average balance sheet data, including all major categories of interest-earning assets and interest-bearing liabilities, together with the interest earned or paid and the average yield or rate paid on each such category as of and for the years ended December 31, 2016, 2015 and 2014. Averages presented below are daily averages (dollars in thousands).
|
|
As of and for the year ended December 31, |
|
|
|||||||||||||||||||||||||||||||||||
|
|
2016 |
|
|
|
2015 |
|
|
|
2014 |
|
|
|||||||||||||||||||||||||||
|
|
Average Balance |
|
|
Interest Income/ Expense(1) |
|
|
Yield/ Rate(1) |
|
|
|
Average Balance |
|
|
Interest Income/ Expense(1) |
|
|
Yield/ Rate(1) |
|
|
|
Average Balance |
|
|
Interest Income/ Expense(1) |
|
|
Yield/ Rate(1) |
|
|
|||||||||
|
Assets |
|
|
|
|
|
|
|
|
|
|
|
|
|
|
|
|
|
|
|
|
|
|
|
|
|
|
|
|
|
|
|
|
|
|
|
|
|
|
|
Interest-earning assets: |
|
|
|
|
|
|
|
|
|
|
|
|
|
|
|
|
|
|
|
|
|
|
|
|
|
|
|
|
|
|
|
|
|
|
|
|
|
|
|
Loans |
$ |
862,340 |
|
|
$ |
39,380 |
|
|
|
4.55 |
|
% |
|
$ |
754,056 |
|
|
$ |
35,076 |
|
|
|
4.65 |
|
% |
|
$ |
601,238 |
|
|
$ |
29,979 |
|
|
|
4.99 |
|
% |
|
Securities: |
|
|
|
|
|
|
|
|
|
|
|
|
|
|
|
|
|
|
|
|
|
|
|
|
|
|
|
|
|
|
|
|
|
|
|
|
|
|
|
Taxable |
|
129,251 |
|
|
|
2,878 |
|
|
|
2.22 |
|
|
|
|
80,516 |
|
|
|
1,741 |
|
|
|
2.16 |
|
|
|
|
66,384 |
|
|
|
945 |
|
|
|
1.42 |
|
|
|
Tax-exempt |
|
27,171 |
|
|
|
687 |
|
|
|
2.52 |
|
|
|
|
18,077 |
|
|
|
448 |
|
|
|
2.48 |
|
|
|
|
12,652 |
|
|
|
394 |
|
|
|
3.11 |
|
|
|
Interest-earning balances with banks |
|
26,196 |
|
|
|
207 |
|
|
|
0.79 |
|
|
|
|
18,136 |
|
|
|
75 |
|
|
|
0.41 |
|
|
|
|
13,060 |
|
|
|
51 |
|
|
|
0.39 |
|
|
|
Total interest-earning assets |
|
1,044,958 |
|
|
|
43,152 |
|
|
|
4.12 |
|
|
|
|
870,785 |
|
|
|
37,340 |
|
|
|
4.29 |
|
|
|
|
693,334 |
|
|
|
31,369 |
|
|
|
4.52 |
|
|
|
Cash and due from banks |
|
7,463 |
|
|
|
|
|
|
|
|
|
|
|
|
5,611 |
|
|
|
|
|
|
|
|
|
|
|
|
5,668 |
|
|
|
|
|
|
|
|
|
|
|
Intangible assets |
|
3,231 |
|
|
|
|
|
|
|
|
|
|
|
|
3,194 |
|
|
|
|
|
|
|
|
|
|
|
|
3,235 |
|
|
|
|
|
|
|
|
|
|
|
Other assets |
|
54,951 |
|
|
|
|
|
|
|
|
|
|
|
|
46,313 |
|
|
|
|
|
|
|
|
|
|
|
|
36,617 |
|
|
|
|
|
|
|
|
|
|
|
Allowance for loan losses |
|
(6,891 |
) |
|
|
|
|
|
|
|
|
|
|
|
(5,636 |
) |
|
|
|
|
|
|
|
|
|
|
|
(3,877 |
) |
|
|
|
|
|
|
|
|
|
|
Total assets |
$ |
1,103,712 |
|
|
|
|
|
|
|
|
|
|
|
$ |
920,267 |
|
|
|
|
|
|
|
|
|
|
|
$ |
734,977 |
|
|
|
|
|
|
|
|
|
|
|
Liabilities and stockholders’ equity |
|
|
|
|
|
|
|
|
|
|
|
|
|
|
|
|
|
|
|
|
|
|
|
|
|
|
|
|
|
|
|
|
|
|
|
|
|
|
|
Interest-bearing liabilities: |
|
|
|
|
|
|
|
|
|
|
|
|
|
|
|
|
|
|
|
|
|
|
|
|
|
|
|
|
|
|
|
|
|
|
|
|
|
|
|
Deposits: |
|
|
|
|
|
|
|
|
|
|
|
|
|
|
|
|
|
|
|
|
|
|
|
|
|
|
|
|
|
|
|
|
|
|
|
|
|
|
|
Interest-bearing demand |
$ |
257,888 |
|
|
$ |
1,690 |
|
|
|
0.65 |
|
% |
|
$ |
222,730 |
|
|
$ |
1,402 |
|
|
|
0.63 |
|
% |
|
$ |
173,715 |
|
|
$ |
1,078 |
|
|
|
0.62 |
|
% |
|
Savings deposits |
|
52,753 |
|
|
|
353 |
|
|
|
0.67 |
|
|
|
|
54,240 |
|
|
|
367 |
|
|
|
0.68 |
|
|
|
|
52,881 |
|
|
|
361 |
|
|
|
0.68 |
|
|
|
Time deposits |
|
439,423 |
|
|
|
5,139 |
|
|
|
1.17 |
|
|
|
|
343,638 |
|
|
|
3,481 |
|
|
|
1.01 |
|
|
|
|
288,837 |
|
|
|
2,834 |
|
|
|
0.98 |
|
|
|
Total interest-bearing deposits |
|
750,064 |
|
|
|
7,182 |
|
|
|
0.95 |
|
|
|
|
620,608 |
|
|
|
5,250 |
|
|
|
0.85 |
|
|
|
|
515,433 |
|
|
|
4,273 |
|
|
|
0.83 |
|
|
|
Short-term borrowings |
|
108,339 |
|
|
|
956 |
|
|
|
0.88 |
|
|
|
|
60,970 |
|
|
|
296 |
|
|
|
0.49 |
|
|
|
|
28,349 |
|
|
|
54 |
|
|
|
0.19 |
|
|
|
Long-term debt |
|
23,092 |
|
|
|
275 |
|
|
|
1.19 |
|
|
|
|
36,712 |
|
|
|
336 |
|
|
|
0.92 |
|
|
|
|
39,376 |
|
|
|
348 |
|
|
|
0.88 |
|
|
|
Total interest-bearing liabilities |
|
881,495 |
|
|
|
8,413 |
|
|
|
0.95 |
|
|
|
|
718,290 |
|
|
|
5,882 |
|
|
|
0.82 |
|
|
|
|
583,158 |
|
|
|
4,675 |
|
|
|
0.80 |
|
|
|
Noninterest-bearing deposits |
|
97,948 |
|
|
|
|
|
|
|
|
|
|
|
|
85,635 |
|
|
|
|
|
|
|
|
|
|
|
|
67,639 |
|
|
|
|
|
|
|
|
|
|
|
Other liabilities |
|
11,793 |
|
|
|
|
|
|
|
|
|
|
|
|
9,256 |
|
|
|
|
|
|
|
|
|
|
|
|
4,809 |
|
|
|
|
|
|
|
|
|
|
|
Stockholders’ equity |
|
112,476 |
|
|
|
|
|
|
|
|
|
|
|
|
107,086 |
|
|
|
|
|
|
|
|
|
|
|
|
79,371 |
|
|
|
|
|
|
|
|
|
|
|
Total liabilities and stockholders’ equity |
$ |
1,103,712 |
|
|
|
|
|
|
|
|
|
|
|
$ |
920,267 |
|
|
|
|
|
|
|
|
|
|
|
$ |
734,977 |
|
|
|
|
|
|
|
|
|
|
|
Net interest income/net interest margin |
|
|
|
|
$ |
34,739 |
|
|
|
3.32 |
|
% |
|
|
|
|
|
$ |
31,458 |
|
|
|
3.61 |
|
% |
|
|
|
|
|
$ |
26,694 |
|
|
|
3.85 |
|
% |
|
(1) |
Interest income and net interest margin are expressed as a percentage of average interest-earning assets outstanding for the indicated periods. Interest expense is expressed as a percentage of average interest-bearing liabilities for the indicated periods. |
Nonaccrual loans were included in the computation of average loan balances but carry a zero yield. The yields include the effect of loan fees, $1.7 million, $1.5 million and $2.3 million for the years ended December 31, 2016, 2015 and 2014, respectively, and discounts and premiums that are amortized or accreted to interest income or expense.
49
Volume/Rate Analysis. The following table sets forth a summary of the changes in interest earned and interest paid resulting from changes in volume and rates for the year ended December 31, 2016 compared to the year ended December 31, 2015 (dollars in thousands):
|
|
Year ended December 31, 2016 vs. Year ended December 31, 2015 |
|
|||||||||
|
|
Volume |
|
|
Rate |
|
|
Net(1) |
|
|||
|
|
|
|
|||||||||
|
Interest income: |
|
|
|
|
|
|
|
|
|
|
|
|
Loans |
$ |
5,051 |
|
|
$ |
(747 |
) |
|
$ |
4,304 |
|
|
Securities: |
|
|
|
|
|
|
|
|
|
|
|
|
Taxable |
|
1,057 |
|
|
|
80 |
|
|
|
1,137 |
|
|
Tax-exempt |
|
226 |
|
|
|
13 |
|
|
|
239 |
|
|
Interest-earning balances with banks |
|
33 |
|
|
|
99 |
|
|
|
132 |
|
|
Total interest-earning assets |
|
6,367 |
|
|
|
(555 |
) |
|
|
5,812 |
|
|
Interest expense: |
|
|
|
|
|
|
|
|
|
|
|
|
Interest-bearing demand deposits |
|
222 |
|
|
|
66 |
|
|
|
288 |
|
|
Savings deposits |
|
(10 |
) |
|
|
(4 |
) |
|
|
(14 |
) |
|
Time deposits |
|
973 |
|
|
|
685 |
|
|
|
1,658 |
|
|
Short-term borrowings |
|
230 |
|
|
|
430 |
|
|
|
660 |
|
|
Long-term debt |
|
(125 |
) |
|
|
64 |
|
|
|
(61 |
) |
|
Total interest-bearing liabilities |
|
1,290 |
|
|
|
1,241 |
|
|
|
2,531 |
|
|
Change in net interest income |
$ |
5,077 |
|
|
$ |
(1,796 |
) |
|
$ |
3,281 |
|
|
(1) |
Changes in interest due to both volume and rate have been allocated on a pro-rata basis using the absolute ratio value of amounts calculated. |
Noninterest Income
Noninterest income includes, among other things, fees generated from our deposit services, gains on the sales of consumer and mortgage loans, fixed assets and securities, and servicing fees and fee income on serviced loans. We expect to continue to develop new products that generate noninterest income, and enhance our existing products, in order to diversify our revenue sources.
2016 vs. 2015. Total noninterest income decreased $2.9 million, or 34.5%, to $5.5 million for the year ended December 31, 2016 compared from $8.3 million for the year ended December 31, 3015. The decrease is primarily due to the $4.0 million decrease in the gain on sale of loans, offset by a $1.3 million increase in gain on sale of fixed assets.
Servicing fees and fee income on serviced loans is the largest component of our noninterest income for the year ended December 31, 2016. Servicing fees and fee income on serviced loans decreased $0.4 million, or 17.9%, to $2.1 million, for the year ended December 31, 2016. This decrease is a result of the Bank exiting the indirect auto loan origination business at the end of 2015. Since the Bank did not originate auto loans for sale during the year ended December 31, 2016, the servicing portfolio, which experienced regularly scheduled paydowns, was not replaced with new loans. We expect servicing fees and fee income on serviced loans to decrease over time until all serviced loans are paid off.
Gain on sale of fixed assets was $1.3 million for the year ended December 31, 2016 compared to $15,000 for the year ended December 31, 2015. The $1.3 million gain on sale of fixed assets was recognized for the sale of the land and building of one of the Bank’s branch locations to a healthcare company during the second quarter of 2016.
Gain on sale of loans decreased $4.0 million, or 90%, to $0.4 million for the year ended December 31, 2016 from $4.4 million for the year ended December 31, 2015. Since exiting the indirect auto loan origination business at the end of 2015, the Bank has experienced decreased loan sales and has ceased originations of consumer loans held for sale. Therefore, we expect the gain on sale of loans to diminish over time. We do not anticipate any sales of our consumer loans in 2017.
Service charges on deposit accounts include maintenance fees on accounts, account enhancement charges for additional deposit account features, per item charges and overdraft fees. Service charges on deposits decreased 9.7% to $343,000 for the year ended December 31, 2016 compared to $380,000 for the same period in 2015 as a result of decreases in NSF and treasury management fees charged.
50
Gains on the sale of investment securities for the year ended December 31, 2016 decreased 9.4%, to $443,000 from $489,000 for the same period in 2015. We sold approximately $15.5 million in securities for the year ended December 31, 2016 compared to sales of $27.2 million for the year ended December 31, 2015.
Gains on the sale of other real estate owned for the year ended December 31, 2016 increased $0.1 million, or 112.4%, to $13,000 from a loss of $0.1 million for the same period in 2015. We sold approximately $0.5 million of other real estate owned for the year ended December 31, 2016, compared to sales of $2.9 million for the year ended December 31, 2015.
Other operating income, which consists of ATM fees, wire fees, credit card fees, and changes in the cash surrender value of bank-owned life insurance policies, among other things, was $0.9 million for the year ended December 31, 2016 compared to $0.7 million for the same period in 2015. The increase is mainly attributable to a $0.2 million increase in the cash surrender value of bank-owned life insurance policies.
2015 vs. 2014. Total noninterest income increased $2.4 million, or 42%, to $8.3 million for the year ended December 31, 2015 compared to $5.9 million for the year ended December 31, 2014. The increase is mainly due to the $1.7 million increase in servicing fees and fee income on serviced loans and the $0.9 million increase in gain on sale of consumer loans.
Gain on sale of loans is the largest component of our noninterest income for the years ended December 31, 2015 and 2014. Gain on sale of loans increased $1.0 million to $4.4 million for the year ended December 31, 2015 from $3.4 million for the year ended December 31, 2014. These gains were generated by sales of mortgage loans and pools of our consumer loans and increased from the prior year as a result of the growth in our consumer loan originations and sales. The gain on sale of loans recognized for the year ended December 31, 2015 directly related to sales of auto loans was $3.1 million, compared to $1.7 million for the year ended December 31, 2014.
Service charges on deposit accounts include maintenance fees on accounts, account enhancement charges for additional deposit account features, per item charges and overdraft fees. Service charges on deposits increased 25% to $0.4 million for the year ended December 31, 2015 compared to $0.3 million for the same period in 2014 as a result of our organic deposit growth.
Gains on the sale of investment securities for the year ended December 31, 2015 increased $0.2 million, or 44%, to $0.5 million from $0.3 million for the same period in 2014. We sold approximately $27.2 million in securities for the year ended December 31, 2015, compared to sales of $31.6 million for the year ended December 31, 2014.
Gains on the sale of other real estate owned for the year ended December 31, 2015 decreased $0.3 million, or $150%, resulting in a loss of $0.1 million compared to a gain of $0.2 million for the same period in 2014. We sold approximately $2.9 million of other real estate owned for the year ended December 31, 2015, compared to sales of $1.3 million for the year ended December 31, 2014.
Servicing fees and fee income on serviced loans was $2.5 million for the year ended December 31, 2015, an increase of $1.6 million, or 187%, compared to $0.9 million for the same period in 2014. This increase is a direct result of the increase in the sales of consumer loan pools and the corresponding growth in our servicing portfolio.
Noninterest Expense
Noninterest expense includes salaries and benefits and other costs associated with the conduct of our operations. We are committed to managing our costs within the framework of our operating strategy. However, since we are focused on growth both organically and through acquisition, we expect our expenses to continue to increase as we add employees and physical locations to accommodate our growing franchise.
2016 vs. 2015. Total noninterest expense was $26.6 million for the year ended December 31, 2016, a decrease of $0.7 million, or 2.6%, from $27.4 million for the year ended December 31, 2015. This decrease was mainly the result of a $0.9 million decrease in other operating expenses and a $0.8 million decrease in salaries and employee benefits, offset by increases in professional fees and customer reimbursements that were paid to certain customers during the year. The decrease in both other operating expenses and salaries and benefits is directly related to the Bank’s exit of the indirect auto loan origination business at the end of 2015.
Salaries and employee benefits decreased $0.8 million, or 4.8%, to $15.6 million for the year ended December 31, 2016, compared to $16.4 million for the year ended December 31, 2015. Staff levels decreased to 152 full-time equivalent employees at December 31, 2016 compared to 168 full-time equivalent employees at December 31, 2015, primarily as a result of the Bank’s exit from the auto loan origination business.
Occupancy expense increased 4.6% to $995,000 for the year ended December 31, 2016 from $951,000 for the year ended December 31, 2015. This increase is primarily attributable to repair and maintenance costs for existing Bank premises.
51
Professional fees increased $0.2 million, or 17%, to $1.3 million for the year ended December 31, 2016 from $1.1 million for the year ended December 31, 2015. This increase is attributable to fees incurred as a result of transferring a commercial real estate loan to other real estate during the fourth quarter of 2016.
Other operating expenses include security, business development, FDIC and OFI assessments, bank shares tax, charitable contributions, personnel training and development, filing fees and duplicating costs. Other operating expenses decreased $0.9 million, or 16%, to $4.8 million for the year ended December 31, 2016 from $5.7 million for the same period in 2015. The decrease is directly related to the Bank’s exit from the indirect auto loan origination business at the end of 2015.
2015 vs. 2014. Total noninterest expense was $27.4 million for the year ended December 31, 2015, an increase of $3.0 million, or 12%, from $24.4 million for the year ended December 31, 2014. This increase was a result of increased costs associated with our expanded operations, including the opening of our Highland branch in Baton Rouge, Louisiana in the third quarter of 2014, our organic growth, as well as increased costs related to being a publicly-traded company since the Company’s initial public offering in July 2014, including implementation of Sarbanes-Oxley compliance.
Salaries and employee benefits increased $1.8 million, or 13%, to $16.4 million for the year ended December 31, 2015, compared to $14.6 million for the year ended December 31, 2014. Staff levels decreased to 168 full-time equivalent employees at December 31, 2015 compared to 179 full-time equivalent employees at December 31, 2014. The decrease in staffing did not occur until late in the second half of 2015 with the restructuring of certain departments. In addition, in May 2014, the Company became self-insured for a substantial portion of its potential claims. The Company recognizes these costs, up to a specified deductible limit, in the period in which a claim is incurred, including with respect to both reported claims and claims incurred but not yet reported. Costs related to these claims increased $0.6 million for the year ended December 31, 2015 compared to the same period 2014. Also, the Company incurred severance expense of approximately $0.2 million related to the restructuring of certain departments, including the Bank’s exit from the indirect auto loan origination business at the end of 2015.
Occupancy expense increased 14% to $1.0 million for the year ended December 31, 2015 from $0.8 million for the year ended December 31, 2014. This increase is primarily attributable to the costs associated with our newest branch in Baton Rouge, which opened in the third quarter of 2014.
Data processing expenses increased 17% to $1.5 million for the year ended December 31, 2015 from $1.3 million for the year ended December 31, 2014. This increase is primarily a result of organic growth of our loans and deposits. Data processing expenses are also related to the number of consumer loans that we service, and fluctuations in this portfolio will affect the amount of data processing expense.
Other operating expenses include security, business development, FDIC and OFI assessments, bank shares tax, charitable contributions, personnel training and development, filing fees and duplicating costs. Other operating expenses increased $0.9 million to $5.7 million for the year ended December 31, 2015 from $4.8 million for the same period in 2014. The increase is primarily the result of our organic growth.
Income Tax Expense
Income tax expense for the year ended December 31, 2016 was $3.6 million compared to $3.5 million at December 31, 2015. The effective tax rate for the years ended December 31, 2016 and 2015 was 31% and 33%, respectively. The Company recorded a $0.1 million tax benefit during the third quarter of 2016 related to the filing of its 2015 tax return which contributed to the lower effective tax rate for the year ended December 31, 2016.
Income tax expense for the year ended December 31, 2015 was $3.5 million, compared to $1.1 million for the year ended December 31, 2014. The effective tax rate for the years ended December 31, 2015 and 2014 was 33% and 18%, respectively. The increase in the effective tax rate is mainly due to the Company’s utilization of its Historic Rehabilitation Tax Credit for the year ended December 31, 2014.
52
The primary risks associated with our operations are credit, interest rate and liquidity risk. Credit and interest rate risk are discussed below, while liquidity risk is discussed in this section under the heading Liquidity and Capital Resources below.
Credit Risk and the Allowance for Loan Losses
General. The risk of loss should a borrower default on a loan is inherent in any lending activity. Our portfolio and related credit risk are monitored and managed on an ongoing basis by our risk management department, the board of directors’ loan committee and the full board of directors. We utilize a ten point risk-rating system, which assigns a risk grade to each borrower based on a number of quantitative and qualitative factors associated with a loan transaction. The risk grade categorizes the loan into one of five risk categories, based on information about the ability of borrowers to service the debt. The information includes, among other factors, current financial information about the borrower, historical payment experience, credit documentation, public information and current economic trends. These categories assist management in monitoring our credit quality. The following describes each of the risk categories, which are consistent with the definitions used in guidance promulgated by federal banking regulators:
|
|
• |
Pass (Loan grades 1-6)—Loans not meeting the criteria below are considered pass. These loans have high credit characteristics and financial strength. The borrowers at least generate profits and cash flow that are in line with peer and industry standards and have debt service coverage ratios above loan covenants and our policy guidelines. For some of these loans, a guaranty from a financially capable party mitigates characteristics of the borrower that might otherwise result in a lower grade. |
|
|
• |
Special Mention (grade 7)—Loans classified as special mention possess some credit deficiencies that need to be corrected to avoid a greater risk of default in the future. For example, financial ratios relating to the borrower may have deteriorated. Often, a special mention categorization is temporary while certain factors are analyzed or matters addressed before the loan is re-categorized as either pass or substandard. |
|
|
• |
Substandard (grade 8)—Loans classified as substandard are inadequately protected by the current net worth and paying capacity of the borrower or the liquidation value of any collateral. If deficiencies are not addressed, it is likely that this category of loan will result in the Bank incurring a loss. Where a borrower has been unable to adjust to industry or general economic conditions, the borrower’s loan is often categorized as substandard. |
|
|
• |
Doubtful (grade 9)—Doubtful loans are substandard loans with one or more additional negative factors that makes full collection of amounts outstanding, either through repayment or liquidation of collateral, highly questionable and improbable. |
|
|
• |
Loss (grade 10)—Loans classified as loss have deteriorated to such a point that it is not practicable to defer writing off the loan. For these loans, all efforts to remediate the loan’s negative characteristics have failed and the value of the collateral, if any, has severely deteriorated relative to the amount outstanding. Although some value may be recovered on such a loan, it is not significant in relation to the amount borrowed. |
At December 31, 2016 and December 31, 2015, there were no loans classified as doubtful or loss, while there were $3.7 million and $6.7 million, respectively, of loans classified as substandard, and $0.6 million and $1.4 million, respectively, of loans classified as special mention as of such dates. Of our substandard and special mention loans at December 31, 2016 and December 31, 2015, $0.6 million and $1.6 million, respectively, were acquired in the FCB acquisition and marked to fair value at the time of their acquisition. At December 31, 2014, we had no doubtful or loss loans, and we had substandard and special mention loans of $5.6 million and $0.5 million, respectively.
An external loan review consultant is engaged annually by the risk management department to review approximately 40% of commercial loans, utilizing a risk-based approach designed to maximize the effectiveness of the review. In addition, credit analysts periodically review smaller dollar commercial loans to identify negative financial trends related to any one borrower, any related groups of borrowers or an industry. All loans not categorized as pass are put on an internal watch list, with quarterly reports to the board of directors. In addition, a written status report is maintained by our special assets division for all commercial loans categorized as substandard or worse. We use this information in connection with our collection efforts.
If our collection efforts are unsuccessful, collateral securing loans may be repossessed and sold or, for loans secured by real estate, foreclosure proceedings initiated. The collateral is sold at public auction for fair market value (based upon recent appraisals), with fees associated with the foreclosure being deducted from the sales price. The purchase price is applied to the outstanding loan balance. If the loan balance is greater than the sales proceeds, the deficient balance is charged-off.
53
Allowance for Loan Losses. The allowance for loan losses is an amount that management believes will be adequate to absorb probable losses inherent in the entire loan portfolio. The appropriate level of the allowance is based on an ongoing analysis of the loan portfolio and represents an amount that management deems adequate to provide for inherent losses, including collective impairment as recognized under ASC Topic 450, Contingencies. Collective impairment is calculated based on loans grouped by grade. Another component of the allowance is losses on loans assessed as impaired under ASC Topic 310, Receivables. The balance of these loans and their related allowance is included in management’s estimation and analysis of the allowance for loan losses. Other considerations in establishing the allowance for loan losses include the nature and volume of the loan portfolio, overall portfolio quality, historical loan loss, review of specific problem loans and current economic conditions that may affect the borrower’s ability to pay, as well as trends within each of these factors. The allowance for loan losses is established after input from management as well as our risk management department and our special assets committee. We evaluate the adequacy of the allowance for loan losses on a quarterly basis. This evaluation is inherently subjective as it requires estimates that are susceptible to significant revision as more information becomes available. The allowance for loan losses was $7.1 million at December 31, 2016, up from $6.1 million at December 31, 2015 and $4.6 million at December 31, 2014, as we increased our loan loss provisioning to reflect our organic loan growth.
A loan is considered impaired when, based on current information and events, it is probable that we will be unable to collect the scheduled payments of principal and interest when due according to the contractual terms of the loan agreement. Determination of impairment is treated the same across all classes of loans. Impairment is measured on a loan-by-loan basis for, among others, all loans of $500,000 or greater, nonaccrual loans and a sample of loans between $250,000 and $500,000. When we identify a loan as impaired, we measure the extent of the impairment based on the present value of expected future cash flows, discounted at the loan’s effective interest rate, except when the sole (remaining) source of repayment for the loans is the operation or liquidation of the collateral. In these cases when foreclosure is probable, we use the current fair value of the collateral, less selling costs, instead of discounted cash flows. For real estate collateral, the fair value of the collateral is based upon a recent appraisal by a qualified and licensed appraiser. If we determine that the value of the impaired loan is less than the recorded investment in the loan (net of previous charge-offs, deferred loan fees or costs and unamortized premium or discount), we recognize impairment through an allowance estimate or a charge-off recorded against the allowance. When the ultimate collectability of the total principal of an impaired loan is in doubt and the loan is on nonaccrual, all payments are applied to principal, under the cost recovery method. When the ultimate collectability of the total principal of an impaired loan is not in doubt and the loan is on nonaccrual, contractual interest is credited to interest income when received, under the cash basis method.
Impaired loans at December 31, 2016 were $4.4 million, including impaired loans acquired in the FCB acquisition in the amount of $1.7 million, compared to $4.0 million, including impaired loans acquired in the FCB acquisition in the amount of $1.5 million, at December 31, 2015. Impaired loans were $3.6 million, including impaired loans acquired in the FCB acquisition in the amount of $1.3 million, at December 31, 2014. At December 31, 2016 and December 31, 2015, $0.4 million and $0.2 million, respectively, of the allowance for loan losses were specifically allocated to impaired loans, while $0.1 million of the allowance was specifically allocated to such loans at December 31, 2014.
The provision for loan losses is a charge to income in an amount that management believes is necessary to maintain an adequate allowance for loan losses. The provision is based on management’s regular evaluation of current economic conditions in our specific markets as well as regionally and nationally, changes in the character and size of the loan portfolio, underlying collateral values securing loans, and other factors which deserve recognition in estimating loan losses. For the year ended December 31, 2016 and 2015, the provision for loan losses was $2.1 million and $1.9 million, respectively, up from $1.6 million in 2014. The increase is due primarily to the overall growth in our loan portfolio, including our commercial real estate loans.
Acquired SLBB loans had a carrying value of $31.3 million and a fair value of $31.5 million on the acquisition date, while acquired FCB loans had a carrying value of $78.4 million and a fair value of $77.5 million on the acquisition date. Acquired loans that are accounted for under ASC 310-30, Loans and Debt Securities Acquired with Deteriorated Credit Quality (“ASC 310-30”), were marked to market on the date we acquired the loans to values which, in management’s opinion, reflected the estimated future cash flows, based on the facts and circumstances surrounding each respective loan at the date of acquisition. We continually monitor these loans as part of our normal credit review and monitoring procedures for changes in the estimated future cash flows. Because ASC 310-30 does not permit carry over or recognition of an allowance for loan losses, we may be required to reserve for these loans in the allowance for loan losses through future provision for loan losses if future cash flows deteriorate below initial projections. We did not increase the allowance for loan losses for loans accounted for under ASC 310-30 during 2016, 2015 or 2014. There was no provision for loan losses charged to operating expense attributable to loans accounted for under ASC 310-30 for the years ended December 31, 2016, 2015 and 2014.
54
The following table presents the allocation of the allowance for loan losses by loan category as of the dates indicated (dollars in thousands).
|
|
December 31, |
|
|||||||||||||||||
|
|
2016 |
|
|
2015 |
|
|
2014 |
|
|
2013 |
|
|
2012 |
|
|||||
|
Mortgage loans on real estate: |
|
|
|
|
|
|
|
|
|
|
|
|
|
|
|
|
|
|
|
|
Construction and development |
$ |
579 |
|
|
$ |
644 |
|
|
$ |
526 |
|
|
$ |
420 |
|
|
$ |
276 |
|
|
1-4 Family |
|
1,377 |
|
|
|
1,213 |
|
|
|
909 |
|
|
|
567 |
|
|
|
415 |
|
|
Multifamily |
|
355 |
|
|
|
246 |
|
|
|
137 |
|
|
|
101 |
|
|
|
18 |
|
|
Farmland |
|
60 |
|
|
|
22 |
|
|
|
18 |
|
|
|
4 |
|
|
|
- |
|
|
Commercial real estate |
|
2,499 |
|
|
|
2,156 |
|
|
|
1,571 |
|
|
|
992 |
|
|
|
977 |
|
|
Commercial and industrial |
|
759 |
|
|
|
513 |
|
|
|
390 |
|
|
|
397 |
|
|
|
332 |
|
|
Consumer |
|
1,422 |
|
|
|
1,334 |
|
|
|
1,079 |
|
|
|
899 |
|
|
|
704 |
|
|
Total |
$ |
7,051 |
|
|
$ |
6,128 |
|
|
$ |
4,630 |
|
|
$ |
3,380 |
|
|
$ |
2,722 |
|
The following table presents the amount of the allowance for loan losses allocated to each loan category as a percentage of total loans as of the dates indicated.
|
|
December 31, |
|
|
|||||||||||||||||||||
|
|
2016 |
|
|
|
2015 |
|
|
|
2014 |
|
|
|
2013 |
|
|
|
2012 |
|
|
|||||
|
Mortgage loans on real estate: |
|
|
|
|
|
|
|
|
|
|
|
|
|
|
|
|
|
|
|
|
|
|
|
|
|
Construction and development |
|
0.06 |
% |
|
|
|
0.09 |
% |
|
|
|
0.09 |
% |
|
|
|
0.08 |
% |
|
|
|
0.10 |
% |
|
|
1-4 Family |
|
0.15 |
|
|
|
|
0.16 |
|
|
|
|
0.15 |
|
|
|
|
0.11 |
|
|
|
|
0.14 |
|
|
|
Multifamily |
|
0.04 |
|
|
|
|
0.03 |
|
|
|
|
0.02 |
|
|
|
|
0.02 |
|
|
|
|
0.01 |
|
|
|
Farmland |
|
0.01 |
|
|
|
|
- |
|
|
|
|
- |
|
|
|
|
- |
|
|
|
|
- |
|
|
|
Commercial real estate |
|
0.28 |
|
|
|
|
0.29 |
|
|
|
|
0.25 |
|
|
|
|
0.20 |
|
|
|
|
0.33 |
|
|
|
Commercial and industrial |
|
0.09 |
|
|
|
|
0.07 |
|
|
|
|
0.06 |
|
|
|
|
0.08 |
|
|
|
|
0.12 |
|
|
|
Consumer |
|
0.16 |
|
|
|
|
0.18 |
|
|
|
|
0.17 |
|
|
|
|
0.18 |
|
|
|
|
0.24 |
|
|
|
Total |
|
0.79 |
% |
|
|
|
0.82 |
% |
|
|
|
0.74 |
% |
|
|
|
0.67 |
% |
|
|
|
0.94 |
% |
|
55
As discussed above, the balance in the allowance for loan losses is principally influenced by the provision for loan losses and by net loan loss experience. Additions to the allowance are charged to the provision for loan losses. Losses are charged to the allowance as incurred and recoveries on losses previously charged to the allowance are credited to the allowance at the time recovery is collected. The table below reflects the activity in the allowance for loan losses for the periods indicated (dollars in thousands).
|
|
Year ended December 31, |
|
|||||||||||||||||
|
|
2016 |
|
|
2015 |
|
|
2014 |
|
|
2013 |
|
|
2012 |
|
|||||
|
Allowance at beginning of period |
$ |
6,128 |
|
|
$ |
4,630 |
|
|
$ |
3,380 |
|
|
$ |
2,722 |
|
|
$ |
1,746 |
|
|
Provision for loan losses |
|
2,079 |
|
|
|
1,865 |
|
|
|
1,628 |
|
|
|
1,026 |
|
|
|
685 |
|
|
Charge-offs: |
|
|
|
|
|
|
|
|
|
|
|
|
|
|
|
|
|
|
|
|
Mortgage loans on real estate: |
|
|
|
|
|
|
|
|
|
|
|
|
|
|
|
|
|
|
|
|
Construction and development |
|
(27 |
) |
|
|
(17 |
) |
|
|
- |
|
|
|
- |
|
|
|
- |
|
|
1-4 Family |
|
(57 |
) |
|
|
(78 |
) |
|
|
(123 |
) |
|
|
- |
|
|
|
- |
|
|
Multifamily |
|
- |
|
|
|
- |
|
|
|
- |
|
|
|
- |
|
|
|
(15 |
) |
|
Commercial real estate |
|
(526 |
) |
|
|
- |
|
|
|
(3 |
) |
|
|
- |
|
|
|
- |
|
|
Commercial and industrial |
|
- |
|
|
|
(58 |
) |
|
|
(16 |
) |
|
|
(118 |
) |
|
|
- |
|
|
Consumer |
|
(618 |
) |
|
|
(477 |
) |
|
|
(317 |
) |
|
|
(271 |
) |
|
|
(166 |
) |
|
Total charge-offs |
|
(1,228 |
) |
|
|
(630 |
) |
|
|
(459 |
) |
|
|
(389 |
) |
|
|
(181 |
) |
|
Recoveries |
|
|
|
|
|
|
|
|
|
|
|
|
|
|
|
|
|
|
|
|
Mortgage loans on real estate: |
|
|
|
|
|
|
|
|
|
|
|
|
|
|
|
|
|
|
|
|
Construction and development |
|
14 |
|
|
|
25 |
|
|
|
1 |
|
|
|
- |
|
|
|
- |
|
|
1-4 Family |
|
13 |
|
|
|
12 |
|
|
|
4 |
|
|
|
- |
|
|
|
- |
|
|
Commercial real estate |
|
1 |
|
|
|
1 |
|
|
|
1 |
|
|
|
- |
|
|
|
448 |
|
|
Commercial and industrial |
|
20 |
|
|
|
197 |
|
|
|
17 |
|
|
|
- |
|
|
|
2 |
|
|
Consumer |
|
24 |
|
|
|
28 |
|
|
|
58 |
|
|
|
21 |
|
|
|
22 |
|
|
Total recoveries |
|
72 |
|
|
|
263 |
|
|
|
81 |
|
|
|
21 |
|
|
|
472 |
|
|
Net (charge-offs) recoveries |
|
(1,156 |
) |
|
|
(367 |
) |
|
|
(378 |
) |
|
|
(368 |
) |
|
|
291 |
|
|
Balance at end of period |
$ |
7,051 |
|
|
$ |
6,128 |
|
|
$ |
4,630 |
|
|
$ |
3,380 |
|
|
$ |
2,722 |
|
|
|
|
|
|
|
|
|
|
|
|
|
|
|
|
|
|
|
|
|
|
|
Net charge-offs to: |
|
|
|
|
|
|
|
|
|
|
|
|
|
|
|
|
|
|
|
|
Loans - average |
|
0.14 |
% |
|
|
0.05 |
% |
|
|
0.07 |
% |
|
|
0.09 |
% |
|
|
-0.12 |
% |
|
Allowance for loan losses |
|
16.39 |
% |
|
|
5.99 |
% |
|
|
8.16 |
% |
|
|
10.89 |
% |
|
|
-10.69 |
% |
|
Allowance for loan losses to: |
|
|
|
|
|
|
|
|
|
|
|
|
|
|
|
|
|
|
|
|
Total loans |
|
0.79 |
% |
|
|
0.82 |
% |
|
|
0.74 |
% |
|
|
0.67 |
% |
|
|
0.94 |
% |
|
Nonperforming loans |
|
356 |
% |
|
|
254 |
% |
|
|
139 |
% |
|
|
227 |
% |
|
|
5136 |
% |
The allowance for loan losses to total loans ratio decreased to 0.79% at December 31, 2016 compared to 0.82% at December 31, 2015. The allowance for loan losses to nonperforming loans ratio increased to 356% at December 31, 2016 from 254% at December 31, 2015 as the result of a $0.4 million decrease in nonperforming loans and a $1.0 million increase in the allowance for loan losses. The increase in the ratio of the allowance for loan losses to nonperforming loans at December 31, 2015 compared to December 31, 2014 was due to a $0.9 million decrease in nonperforming loans.
Charge-offs reflect the realization of losses in the portfolio that were recognized previously through the provision for loan losses. Net charge-offs for the year ended December 31, 2016 were $1.2 million, or 0.14% of the average loan balance. Net charge-offs for each of the years ended December 31, 2015 and 2014 were $0.4 million, equal to 0.05% and 0.07%, respectively, of the average loan balance for the respective periods. For the years ended December 31, 2016, 2015 and 2014, the majority of our charge-offs were indirect consumer loans. Net charge-offs of our indirect consumer loans as a percentage of average indirect consumer loans for the years ended December 31, 2016, 2015 and 2014 were 0.4%, 0.26% and 0.16%, respectively.
As a result of the flooding that occurred during the third quarter of 2016, the Company instituted a 90-day loan deferral program for customers who were impacted by the flood and has allocated a portion of its general reserves to the potential impact as a result of the flood. The Company placed approximately $23.5 million, or 2.8% of the total loan portfolio on a 90-day deferral plan during the third quarter of 2016. As these loans transition from a deferred status, the Company continues to assess the impact the flooding may have on the region and its loan portfolio to determine the need for specific or additional general reserves.
56
Management believes the allowance for loan losses at December 31, 2016 is sufficient to provide adequate protection against losses in our portfolio. Although the allowance for loan losses is considered adequate by management, there can be no assurance that this allowance will prove to be adequate over time to cover ultimate losses in connection with our loans. This allowance may prove to be inadequate due to unanticipated adverse changes in the economy or discrete events adversely affecting specific customers or industries. Our results of operations and financial condition could be materially adversely affected to the extent that the allowance is insufficient to cover such changes or events.
Nonperforming assets and restructured loans. Nonperforming assets consist of nonperforming loans and other real estate owned. Nonperforming loans are those on which the accrual of interest has stopped or loans which are contractually 90 days past due on which interest continues to accrue. Loans are ordinarily placed on nonaccrual when a loan is specifically determined to be impaired or when principal and interest is delinquent for 90 days or more. However, management may elect to continue the accrual when the estimated net available value of collateral is sufficient to cover the principal balance and accrued interest. It is our policy to discontinue the accrual of interest income on any loan for which we have reasonable doubt as to the payment of interest or principal. Nonaccrual loans are returned to an accrual status when the financial position of the borrower indicates there is no longer any reasonable doubt as to the payment of principal or interest.
Another category of assets which contribute to our credit risk is troubled debt restructurings, or restructured loans. A restructured loan is a loan for which a concession that is not insignificant has been granted to the borrower due to a deterioration of the borrower’s financial condition and which are performing in accordance with the new terms. Such concessions may include reduction in interest rates, deferral of interest or principal payments, principal forgiveness and other actions intended to minimize the economic loss and to avoid foreclosure or repossession of the collateral. We strive to identify borrowers in financial difficulty early and work with them to modify their loans to more affordable terms before such loan reaches nonaccrual status. In evaluating whether to restructure a loan, management analyzes the long-term financial condition of the borrower, including guarantor and collateral support, to determine whether the proposed concessions will increase the likelihood of repayment of principal and interest. Restructured loans that are not performing in accordance with their restructured terms that are either contractually 90 days past due or placed on nonaccrual status are reported as nonperforming loans.
There were eighteen loans classified as TDRs at December 31, 2016 that totaled approximately $2.4 million compared to eleven credits totaling $2.2 million at December 31, 2015. Sixteen of the eighteen TDRs were acquired. Eight of the restructured loans were considered TDRs due to a modification of terms through adjustments to maturity, nine of the restructured loans were considered TDRs due to a reduction in the interest rate to a rate lower than the current market rate, and one restructured loan was considered a TDR due to a modification of terms through principal payment forbearance, paying interest only for a specified period of time. As of December 31, 2016, all TDRs were performing under their modified terms. As of December 31, 2015, three of the restructured loans with a balance of $0.5 million were in default of their modified terms and had been placed on nonaccrual. The Company individually evaluates each TDR for allowance purposes, primarily based on collateral value, and excludes these loans from the loan population that is evaluated by applying qualitative factors.
The following table shows the principal amounts of nonperforming and restructured loans as of the dates indicated. All loans where information exists about possible credit problems that would cause us to have serious doubts about the borrower’s ability to comply with the current repayment terms of the loan have been reflected in the table below (dollars in thousands).
|
|
December 31, |
|
|||||||||||||||||
|
|
2016 |
|
|
2015 |
|
|
2014 |
|
|
2013 |
|
|
2012 |
|
|||||
|
Nonaccrual loans |
$ |
1,978 |
|
|
$ |
2,411 |
|
|
$ |
3,340 |
|
|
$ |
1,489 |
|
|
$ |
53 |
|
|
Accruing loans past due 90 days or more |
|
1 |
|
|
|
- |
|
|
|
- |
|
|
|
- |
|
|
|
- |
|
|
Total nonperforming loans |
|
1,979 |
|
|
|
2,411 |
|
|
|
3,340 |
|
|
|
1,489 |
|
|
|
53 |
|
|
Restructured loans |
|
2,399 |
|
|
|
1,629 |
|
|
|
226 |
|
|
|
815 |
|
|
|
- |
|
|
Total nonperforming and restructured loans |
$ |
4,378 |
|
|
$ |
4,040 |
|
|
$ |
3,566 |
|
|
$ |
2,304 |
|
|
$ |
53 |
|
|
Interest income recognized on nonperforming and restructured loans |
|
169 |
|
|
|
174 |
|
|
|
105 |
|
|
|
100 |
|
|
|
2 |
|
|
Interest income foregone on nonperforming and restructured loans |
|
159 |
|
|
|
252 |
|
|
|
169 |
|
|
|
281 |
|
|
|
4 |
|
57
Of the total nonaccrual loans at December 31, 2016 and 2015, $0.5 million, and $1.1 million, respectively, were acquired. We had $1.1 million in nonaccrual loans acquired through acquisition at December 31, 2014. Nonperforming loans are comprised of accruing loans past due 90 days or more and nonaccrual loans. Nonperforming loans outstanding represented 0.22%, 0.32%, and 0.54% of total loans at December 31, 2016, 2015 and 2014, respectively.
Other Real Estate Owned. Other real estate owned consists of properties acquired through foreclosure or acceptance of a deed in lieu of foreclosure. These properties are carried at the lower of cost or fair market value based on appraised value less estimated selling costs. Losses arising at the time of foreclosure of properties are charged against the allowance for loan losses. Other real estate owned with a cost basis of $0.5 million and $2.9 million was sold during the years ended December 31, 2016 and 2015, respectively, resulting in a net gain of $13,000 and a net loss of $0.1 million for the respective period, compared to a cost basis of $1.3 million and a net gain of $0.2 million at December 31, 2014. At December 31, 2016, $0.3 million of our other real estate owned was related to prior acquisitions compared to $0.6 million at December 31, 2015.
The following table provides details of our other real estate owned as of the dates indicated (dollars in thousands).
|
|
December 31, 2016 |
|
|
December 31, 2015 |
|
||
|
|
|
|
|
|
|
|
|
|
Construction and development |
$ |
270 |
|
|
$ |
616 |
|
|
1-4 Family |
|
- |
|
|
|
109 |
|
|
Commercial real estate |
|
3,795 |
|
|
|
- |
|
|
Total other real estate owned |
$ |
4,065 |
|
|
$ |
725 |
|
Changes in our other real estate owned are summarized in the table below for the periods indicated (dollars in thousands).
|
|
Year ended |
|
|
Year ended |
|
||
|
|
December 31, 2016 |
|
|
December 31, 2015 |
|
||
|
Balance, beginning of period |
$ |
725 |
|
|
$ |
2,735 |
|
|
Transfers from loans |
|
3,795 |
|
|
|
950 |
|
|
Transfers from acquired loans |
|
80 |
|
|
|
55 |
|
|
Sales of other real estate owned |
|
(528 |
) |
|
|
(2,961 |
) |
|
Write-downs |
|
(7 |
) |
|
|
(54 |
) |
|
Balance, end of period |
$ |
4,065 |
|
|
$ |
725 |
|
Interest Rate Risk
Market risk is the risk of loss from adverse changes in market prices and rates. Since the majority of our assets and liabilities are monetary in nature, our market risk arises primarily from interest rate risk inherent in our lending and deposit activities. A sudden and substantial change in interest rates may adversely impact our earnings and profitability because the interest rates borne by assets and liabilities do not change at the same speed, to the same extent or on the same basis. Accordingly, our ability to proactively structure the volume and mix of our assets and liabilities to address anticipated changes in interest rates, as well as to react quickly to such fluctuations, can significantly impact our financial results. To that end, management actively monitors and manages our interest rate risk exposure.
The Asset/Liability Committee (“ALCO”) has been authorized by the board of directors to implement our asset/liability management policy, which establishes guidelines with respect to our exposure to interest rate fluctuations, liquidity, loan limits as a percentage of funding sources, exposure to correspondent banks and brokers and reliance on non-core deposits. The goal of the policy is to enable us to maximize our interest income and maintain our net interest margin without exposing the Bank to excessive interest rate risk, credit risk and liquidity risk. Within that framework, the ALCO monitors our interest rate sensitivity and makes decisions relating to our asset/liability composition.
We monitor the impact of changes in interest rates on our net interest income using gap analysis. The gap represents the net position of our assets and liabilities subject to repricing in specified time periods. During any given time period, if the amount of rate-sensitive liabilities exceeds the amount of rate-sensitive assets, a financial institution would generally be considered to have a negative gap position and would benefit from falling rates over that period of time. Conversely, a financial institution with a positive gap position would generally benefit from rising rates.
58
Within the gap position that management directs, we attempt to structure our assets and liabilities to minimize the risk of either a rising or falling interest rate environment. We manage our gap position for time horizons of one month, two months, three months, four to six months, seven to twelve months, 13-24 months, 25-36 months, 37-60 months and more than 60 months. The goal of our asset/liability management is for the Bank to maintain a net interest income at risk in an up or down 100 basis point environment at less than (5)%. At December 31, 2016, the Bank was within the policy guidelines for asset/liability management.
The following table depicts the estimated impact on net interest income of immediate changes in interest rates at the specified levels for the periods presented.
|
As of December 31, 2016 |
|
|||
|
Changes in Interest Rates (in basis points) |
|
Estimated Increase/Decrease in Net Interest Income (1) |
|
|
|
+300 |
|
(6.40 |
)% |
|
|
+200 |
|
(4.10 |
)% |
|
|
+100 |
|
(2.10 |
)% |
|
|
-100 |
|
5.60 |
% |
|
|
-200 |
|
3.20 |
% |
|
|
-300 |
|
3.00 |
% |
|
|
(1) |
The percentage change in this column represents the projected net interest income for 12 months on a flat balance sheet in a stable interest rate environment versus the projected net interest income in the various rate scenarios. |
The computation of the prospective effects of hypothetical interest rate changes requires numerous assumptions regarding characteristics of new business and the behavior of existing positions. These business assumptions are based upon our experience, business plans and published industry experience. Key assumptions include asset prepayment speeds, competitive factors, the relative price sensitivity of certain assets and liabilities, and the expected life of non-maturity deposits. However, there are a number of factors that influence the effect of interest rate fluctuations on us which are difficult to measure and predict. For example, a rapid drop in interest rates might cause our loans to repay at a more rapid pace and certain mortgage-related investments to prepay more quickly than projected. This could mitigate some of the benefits of falling rates as are expected when we are in a negatively-gapped position. Conversely, a rapid rise in rates could give us an opportunity to increase our margins and stifle the rate of repayment on our mortgage-related loans which would increase our returns. As a result, because these assumptions are inherently uncertain, actual results will differ from simulated results.
Liquidity and Capital Resources
Liquidity. Liquidity is a measure of the ability to fund loan commitments and meet deposit maturities and withdrawals in a timely and cost-effective way. Cash flow requirements can be met by generating net income, attracting new deposits, converting assets to cash or borrowing funds. While maturities and scheduled amortization of loans and securities are predictable sources of funds, deposit outflows, loan prepayments, loan sales and borrowings are greatly influenced by general interest rates, economic conditions and the competitive environment in which we operate. To minimize funding risks, we closely monitor our liquidity position through periodic reviews of maturity profiles, yield and rate behaviors, and loan and deposit forecasts. Excess short-term liquidity is usually invested in overnight federal funds sold.
Our core deposits, which are deposits excluding time deposits greater than $250,000 and deposits of municipalities and other political entities, are our most stable source of liquidity to meet our cash flow needs due to the nature of the long-term relationships generally established with our customers. Maintaining the ability to acquire these funds as needed in a variety of markets, and within ALCO compliance targets, is essential to ensuring our liquidity. At December 31, 2016 and 2015, 76% and 69% of our total assets, respectively, were funded by core deposits.
Our investment portfolio is another alternative for meeting our cash flow requirements. Investment securities generate cash flow through principal payments and maturities, and they generally have readily available markets that allow for their conversion to cash. Some securities are pledged to secure certain deposit types or short-term borrowings (such as FHLB advances), which impacts their liquidity. At December 31, 2016, securities with a carrying value of $77.5 million were pledged to secure deposits or borrowings, compared to $88.1 million in pledged securities as of December 31, 2015.
59
Other sources available for meeting liquidity needs include advances from the FHLB, repurchase agreements and other borrowings. FHLB advances are primarily used to match-fund fixed rate loans in order to minimize interest rate risk and also may be used to meet day to day liquidity needs, particularly if the prevailing interest rate on an FHLB advance compares favorably to the rates that we would be required to pay to attract deposits. At December 31, 2016, the balance of our outstanding advances with the FHLB was $82.8 million, a decrease from $127.5 million at December 31, 2015. The total amount of the remaining credit available to us from the FHLB at December 31, 2016 was $344.1 million. Repurchase agreements are contracts for the sale of securities which we own with a corresponding agreement to repurchase those securities at an agreed upon price and date. Our policies limit the use of repurchase agreements collateralized by U.S. Treasury and agency securities. We had $39.1 million of repurchase agreements outstanding as of December 31, 2016 and 2015. We maintain unsecured lines of credit with other commercial banks totaling $55.0 million. These lines of credit are Fed Funds lines of credit and are used for overnight borrowing only. There were no outstanding balances on our unsecured lines of credit at December 31, 2016 or 2015.
In addition, on June 27, 2016, we entered into a loan agreement (“Agreement”) with TIB providing for a $20.0 million revolving line of credit maturing June 27, 2018. Borrowings bear interest, payable quarterly, at a fixed rate per annum equal to the U.S. prime rate on June 27, 2016 (3.5%); provided, however, that on June 27, 2017, the rate will be adjusted to a fixed rate of interest equal to the prime rate on such date. The revolving line of credit is secured by a first priority security interest in all of the capital stock of Investar Bank and a security interest in all property of Investar Bank held by the lender. At December 31, 2016, we had $1.0 million outstanding on our secured line of credit.
The Agreement for the revolving line of credit contains customary representations, warranties, affirmative covenants and events of default, and also contains a number of negative covenants, including, but not limited to, restrictions on mergers and similar transactions, restrictions on liens, and a prohibition on the payment of dividends or repurchase of stock during an event of default. The agreement also contains financial covenants, including requiring that Investar Bank maintain (i) a Tier 1 Leverage Ratio and a Common Equity Tier 1 Ratio not less than 7.5% at all times, (ii) a Tier 1 Capital Ratio and a Total Capital Ratio not less than 9.5% at all times, (iii) a return on average assets of no less than 0.70% as of the end of each fiscal quarter, annualized on a year-to-date basis, (iv) Classified Assets (as defined in the Agreement) at no more than 35% of Investar Bank’s Tier 1 Capital plus allowance for loan and lease losses, and (v) a total loans to total assets ratio of no more than 85% at all times.
Our liquidity strategy is focused on using the least costly funds available to us in the context of our balance sheet composition and interest rate risk position. Accordingly, we target growth of noninterest-bearing deposits. Although we cannot directly control the types of deposit instruments our customers choose, we can influence those choices with the interest rates and deposit specials we offer. We do not hold any brokered deposits, as defined for federal regulatory purposes, although we do hold QwikRate® deposits, included in our time deposit balances, which we obtain via the internet to address liquidity needs when rates on such deposits compare favorably with deposit rates in in our markets. At December 31, 2016, we held $123.2 million of QwikRate® deposits, up from $79.3 million at December 31, 2015.
The following tables presents, by type, our funding sources, which consist of total average deposits and borrowed funds, as a percentage of total funds and the total cost of each funding source for the years ended December 31, 2016 and 2015.
|
|
Percentage of Total Average Deposits |
|
|
|
Cost of Funds |
|
|
||||||||||||
|
|
Year ended December 31, |
|
|
|
Year ended December 31, |
|
|
||||||||||||
|
|
2016 |
|
|
|
2015 |
|
|
|
2016 |
|
|
|
2015 |
|
|
||||
|
Noninterest-bearing demand |
|
10 |
% |
|
|
|
11 |
% |
|
|
|
- |
% |
|
|
|
- |
% |
|
|
Interest-bearing demand |
|
26 |
|
|
|
|
28 |
|
|
|
|
0.65 |
|
|
|
|
0.63 |
|
|
|
Savings |
|
6 |
|
|
|
|
7 |
|
|
|
|
0.67 |
|
|
|
|
0.68 |
|
|
|
Time deposits |
|
45 |
|
|
|
|
43 |
|
|
|
|
1.17 |
|
|
|
|
1.01 |
|
|
|
Short-term borrowings |
|
11 |
|
|
|
|
7 |
|
|
|
|
0.88 |
|
|
|
|
0.48 |
|
|
|
Borrowed funds |
|
2 |
|
|
|
|
4 |
|
|
|
|
1.19 |
|
|
|
|
0.92 |
|
|
|
Total deposits and borrowed funds |
|
100 |
% |
|
|
|
100 |
% |
|
|
|
0.86 |
% |
|
|
|
0.73 |
% |
|
60
We are subject to certain restrictions on dividends under applicable banking laws and regulations. Please refer to the discussion under the heading “Supervision and Regulation – Dividends” in Item 1, Business, for more information regarding the restrictions on dividends applicable to the Company and the Bank.
Capital Management. Our primary sources of capital include retained earnings, capital obtained through acquisitions and proceeds from the sale of our capital stock. We are subject to various regulatory capital requirements administered by the Federal Reserve and the FDIC. These requirements are described in greater detail under the heading “Supervision and Regulation – Regulatory Capital Requirements” of Item 1, Business. Those guidelines specify capital tiers, which include the following classifications:
|
Capital Tiers |
|
Tier 1 Leverage Ratio |
|
Common Equity Tier 1 Capital Ratio |
|
Tier 1 Capital Ratio |
|
Total Capital Ratio |
|
Well capitalized |
|
5% or above |
|
6.5% of above |
|
8% or above |
|
10% or above |
|
Adequately capitalized |
|
4% or above |
|
4.5% or above |
|
6% or above |
|
8% or above |
|
Undercapitalized |
|
Less than 4% |
|
Less than 4.5% |
|
Less than 6% |
|
Less than 8% |
|
Significantly undercapitalized |
|
Less than 3% |
|
Less than 3% |
|
Less than 4% |
|
Less than 6% |
|
Critically undercapitalized |
|
|
|
|
|
2% or less |
|
|
The Company and the Bank each were in compliance with all regulatory capital requirements as of December 31, 2016 and 2015, and the Bank was in compliance with all regulatory capital requirements as of December 31, 2014. The Bank also was considered “well-capitalized” under the FDIC’s prompt corrective action regulations as of these dates. The following table presents the actual capital amounts and regulatory capital ratios for the Company and the Bank as of the dates presented (dollars in thousands).
|
|
Actual |
|
|
Minimum Capital Requirement to be Well Capitalized |
|
|
||||||||||
|
|
Amount |
|
|
Ratio |
|
|
Amount |
|
|
Ratio |
|
|
||||
|
December 31, 2016 |
|
|
|
|
|
|
|
|
|
|
|
|
|
|
|
|
|
Investar Holding Corporation: |
|
|
|
|
|
|
|
|
|
|
|
|
|
|
|
|
|
Tier 1 capital to average assets (leverage) |
$ |
115,312 |
|
|
|
10.10 |
% |
|
$ |
- |
|
|
|
- |
% |
|
|
Tier 1 common equity to risk-weighted assets |
|
111,812 |
|
|
|
11.40 |
|
|
|
- |
|
|
|
- |
|
|
|
Tier 1 capital to risk-weighted assets |
|
115,312 |
|
|
|
11.75 |
|
|
|
- |
|
|
|
- |
|
|
|
Total capital to risk-weighted assets |
|
122,363 |
|
|
|
12.47 |
|
|
|
- |
|
|
|
- |
|
|
|
Investar Bank: |
|
|
|
|
|
|
|
|
|
|
|
|
|
|
|
|
|
Tier 1 capital to average assets (leverage) |
|
114,417 |
|
|
|
10.03 |
|
|
|
57,063 |
|
|
|
5.00 |
|
|
|
Tier 1 common equity to risk-weighted assets |
|
114,417 |
|
|
|
11.67 |
|
|
|
63,706 |
|
|
|
6.50 |
|
|
|
Tier 1 capital to risk-weighted assets |
|
114,417 |
|
|
|
11.67 |
|
|
|
78,408 |
|
|
|
8.00 |
|
|
|
Total capital to risk-weighted assets |
|
121,468 |
|
|
|
12.39 |
|
|
|
98,010 |
|
|
|
10.00 |
|
|
|
|
|
|
|
|
|
|
|
|
|
|
|
|
|
|
|
|
|
December 31, 2015 |
|
|
|
|
|
|
|
|
|
|
|
|
|
|
|
|
|
Investar Holding Corporation: |
|
|
|
|
|
|
|
|
|
|
|
|
|
|
|
|
|
Tier 1 capital to average assets (leverage) |
$ |
110,574 |
|
|
|
11.39 |
% |
|
$ |
- |
|
|
|
- |
% |
|
|
Tier 1 common equity to risk-weighted assets |
|
107,074 |
|
|
|
11.67 |
|
|
|
- |
|
|
|
- |
|
|
|
Tier 1 capital to risk-weighted assets |
|
110,574 |
|
|
|
12.05 |
|
|
|
- |
|
|
|
- |
|
|
|
Total capital to risk-weighted assets |
|
116,702 |
|
|
|
12.72 |
|
|
|
- |
|
|
|
- |
|
|
|
Investar Bank: |
|
|
|
|
|
|
|
|
|
|
|
|
|
|
|
|
|
Tier 1 capital to average assets (leverage) |
|
107,209 |
|
|
|
11.07 |
|
|
|
48,436 |
|
|
|
5.00 |
|
|
|
Tier 1 common equity to risk-weighted assets |
|
107,209 |
|
|
|
11.71 |
|
|
|
59,511 |
|
|
|
6.50 |
|
|
|
Tier 1 capital to risk-weighted assets |
|
107,209 |
|
|
|
11.71 |
|
|
|
73,244 |
|
|
|
8.00 |
|
|
|
Total capital to risk-weighted assets |
|
113,337 |
|
|
|
12.38 |
|
|
|
91,555 |
|
|
|
10.00 |
|
|
61
Off-Balance Sheet Transactions
The Bank entered into forward starting interest rate swap contracts to manage exposure against the variability in the expected future cash flows (future interest payments) attributable to changes in the 1-month LIBOR associated with the forecasted issuances of 1-month fixed rate debt arising from a rollover strategy. An interest rate swap is an agreement whereby one party agrees to pay a fixed rate of interest on a notional principal amount in exchange for receiving a floating rate of interest on the same notional amount for a predetermined period of time, from a second party. The maximum length of time over which the Bank is currently hedging its exposure to the variability in future cash flows for forecasted transactions is approximately 3.6 years. The total notional amount of the derivative contracts is $50.0 million.
For the years ended December 31, 2016 and 2015, a gain of $0.4 million, net of a $0.2 million tax expense, and a loss of $0.2 million, net of a $0.1 million tax benefit, was recognized in “Other comprehensive (loss) income” in the accompanying consolidated statement of other comprehensive income for the change in fair value of the interest rate swap. The swap contracts had a fair value of $8,000 and a negative fair value of $0.6 million as of December 31, 2016 and 2015, respectively, and have been recorded in “Other assets” and “Accrued taxes and other liabilities,” respectively, in the accompanying consolidated balance sheets. The Bank expects the hedge to remain fully effective during the remaining term of the swap contract.
The Bank enters into loan commitments and standby letters of credit in the normal course of its business. Loan commitments are made to meet the financing needs of our customers, while standby letters of credit commit the Bank to make payments on behalf of customers when certain specified future events occur. The credit risks associated with loan commitments and standby letters of credit are essentially the same as those involved in making loans to our customers. Accordingly, our normal credit policies apply to these arrangements. Collateral (e.g., securities, receivables, inventory, equipment, etc.) is obtained based on management’s credit assessment of the customer.
Loan commitments and standby letters of credit do not necessarily represent future cash requirements, in that while the customer typically has the ability to draw upon these commitments at any time, these commitments often expire without being drawn upon in full or at all. Virtually all of our standby letters of credit expire within one year. Our unfunded loan commitments and standby letters of credit outstanding are summarized below as of the dates indicated (dollars in thousands).
|
|
December 31, 2016 |
|
|
December 31, 2015 |
|
||
|
Commitments to extend credit: |
|
|
|
|
|
|
|
|
Loan commitments |
$ |
142,891 |
|
|
$ |
149,561 |
|
|
Standby letters of credit |
|
1,008 |
|
|
|
382 |
|
The Company closely monitors the amount of remaining future commitments to borrowers in light of prevailing economic conditions and adjusts these commitments as necessary. The Company will continue this process as new commitments are entered into or existing commitments are renewed.
Additionally, at December 31, 2016, the Company had unfunded commitments of $0.9 million for its investment in Small Business Investment Company qualified funds.
For each of the years ended December 31, 2016 and 2015, we engaged in no off-balance sheet transactions reasonably likely to have a material effect on our financial condition, results of operations or cash flows currently or in the future.
Contractual Obligations
The following table presents, as of December 31, 2016, significant fixed and determinable contractual obligations to third parties by payment date (dollars in thousands).
|
|
Payments Due In: |
|
|||||||||||||||||
|
|
Less Than One Year |
|
|
One to Three Years |
|
|
Three to Five Years |
|
|
Over Five Years |
|
|
Total |
|
|||||
|
Deposits without a stated maturity(1) |
$ |
455,899 |
|
|
$ |
- |
|
|
$ |
- |
|
|
$ |
- |
|
|
$ |
455,899 |
|
|
Time deposits |
|
267,003 |
|
|
|
166,703 |
|
|
|
18,182 |
|
|
|
- |
|
|
|
451,888 |
|
|
Securities sold under agreements to repurchase |
|
39,087 |
|
|
|
- |
|
|
|
- |
|
|
|
- |
|
|
|
39,087 |
|
|
Federal Home Loan Bank advances |
|
73,603 |
|
|
|
6,100 |
|
|
|
3,100 |
|
|
|
- |
|
|
|
82,803 |
|
|
Junior subordinated debentures |
|
- |
|
|
|
- |
|
|
|
- |
|
|
|
3,609 |
|
|
|
3,609 |
|
|
Total contractual obligations |
$ |
835,592 |
|
|
$ |
172,803 |
|
|
$ |
21,282 |
|
|
$ |
3,609 |
|
|
$ |
1,033,286 |
|
|
(1) |
Excludes interest. |
62
Item 7A. Quantitative and Qualitative Disclosures about Market Risk
The information contained in the section captioned “Management’s Discussion and Analysis of Financial Condition and Results of Operations – Risk Management” in Item 7 hereof is incorporated herein by reference.
63
Item 8. Financial Statements and Supplementary Data
Report on Management’s Assessment of Internal Control over Financial Reporting
To the Stockholders and Board of Directors
Investar Holding Corporation
Baton Rouge, Louisiana
Investar Holding Corporation (the “Company”) is responsible for the preparation, integrity and fair presentation of the consolidated financial statements included in this annual report. The consolidated financial statements and notes included in this annual report have been prepared in conformity with accounting principles generally accepted in the United States of America and necessarily include some amounts that are based on management’s best estimates and judgments.
Management of the Company is responsible for establishing and maintaining effective internal control over financial reporting designed to provide reasonable assurance regarding the reliability of financial reporting and the preparation of financial statements for external purposes in accordance with accounting principles generally accepted in the United States of America. The Company’s internal control over financial reporting includes those policies and procedures that: (1) pertain to the maintenance of records that, in reasonable detail, accurately and fairly reflect the transactions and dispositions of the assets of the Company; (2) provide reasonable assurance that transactions are recorded as necessary to permit preparation of financial statements in accordance with accounting principles generally accepted in the United States of America and that receipts and expenditures of the Company are being made only in accordance with authorizations of management and directors of the Company; and (3) provide reasonable assurance regarding prevention or timely detection of unauthorized acquisition, use or disposition of the Company’s assets that could have a material effect on the financial statements.
The system of internal control over financial reporting as it relates to the financial statements is evaluated for effectiveness by management and tested for reliability through a program of internal audits. Actions are taken to correct potential deficiencies as they are identified. Any system of internal control, no matter how well designed, has inherent limitations, including the possibility that a control can be circumvented or overridden, and misstatements due to error or fraud may occur and not be detected. Also, because of changes in conditions, internal control effectiveness may vary over time. Accordingly, even an effective system of internal control will provide only reasonable assurance with respect to financial statement preparation.
Management, with the participation of the Company’s principal executive officer and principal financial officer, conducted an assessment of the effectiveness of the Company’s system of internal control over financial reporting as of December 31, 2016, based on criteria for effective internal control over financial reporting described in the “Internal Control - Integrated Framework,” (2013) issued by the Committee of Sponsoring Organizations of the Treadway Commission. Based on this assessment, management has concluded that, as of December 31, 2016, the Company’s system of internal control over financial reporting is effective and meets the criteria of the “Internal Control – Integrated Framework.” Postethwaite & Netterville, the Company’s independent registered public accounting firm that has audited the Company’s financial statements included in this annual report, has issued an attestation report on the Company’s internal control over financial reporting which is included herein.
|
Date: March 9, 2017 |
|
By: |
/s/ John J. D’Angelo |
|
|
|
|
John J. D’Angelo |
|
|
|
|
President and Chief Executive Officer |
|
Date: March 9, 2017 |
|
By: |
/s/ Christopher L. Hufft |
|
|
|
|
Christopher L. Hufft |
|
|
|
|
Executive Vice President and Chief Financial Officer |
64
REPORT OF INDEPENDENT REGISTERED PUBLIC ACCOUNTING FIRM
To the Stockholders and Board of Directors
Investar Holding Corporation
Baton Rouge, Louisiana
We have audited the accompanying consolidated balance sheets of Investar Holding Corporation (the Company) as of December 31, 2016 and 2015, and the related consolidated statements of operations, comprehensive income, changes in stockholders’ equity, and cash flows for each of the years in the three-year period ended December 31, 2016. We have also audited Investar Holding Corporation’s internal control over financial reporting as of December 31, 2016, based on criteria established in Internal Control – Integrated Framework issued by the Committee of Sponsoring Organizations of the Treadway Commission (2013 framework) (the COSO criteria). Investar Holding Corporation’s management is responsible for these financial statements, for maintaining effective internal control over financial reporting, and for its assessment of the effectiveness of internal control over financial reporting, included in the accompanying Management’s Report on Internal Control over Financial Reporting. Our responsibility is to express an opinion on these financial statements and an opinion on the Company's internal control over financial reporting based on our audits.
We conducted our audits in accordance with the standards of the Public Company Accounting Oversight Board (United States). Those standards require that we plan and perform the audits to obtain reasonable assurance about whether the consolidated financial statements are free of material misstatement and whether effective internal control over financial reporting was maintained in all material respects. Our audits of the financial statements included examining, on a test basis, evidence supporting the amounts and disclosures in the financial statements, assessing the accounting principles used and significant estimates made by management, and evaluating the overall financial statement presentation. Our audit of internal control over financial reporting included obtaining an understanding of internal control over financial reporting, assessing the risk that a material weakness exists, and testing and evaluating the design and operating effectiveness of internal control based on the assessed risk. Our audits also included performing such other procedures as we considered necessary in the circumstances. We believe that our audits provide a reasonable basis for our opinions.
A company's internal control over financial reporting is a process designed to provide reasonable assurance regarding the reliability of financial reporting and the preparation of financial statements for external purposes in accordance with generally accepted accounting principles. A company's internal control over financial reporting includes those policies and procedures that (1) pertain to the maintenance of records that, in reasonable detail, accurately and fairly reflect the transactions and dispositions of the assets of the company; (2) provide reasonable assurance that transactions are recorded as necessary to permit preparation of financial statements in accordance with generally accepted accounting principles, and that receipts and expenditures of the company are being made only in accordance with authorizations of management and directors of the company; and (3) provide reasonable assurance regarding prevention or timely detection of unauthorized acquisition, use, or disposition of the company's assets that could have a material effect on the financial statements.
Because of its inherent limitations, internal control over financial reporting may not prevent or detect misstatements. Also, projections of any evaluation of effectiveness to future periods are subject to the risk that controls may become inadequate because of changes in conditions, or that the degree of compliance with the policies or procedures may deteriorate.
In our opinion, the consolidated financial statements referred to above present fairly, in all material respects, the financial position of Investar Holding Corporation as of December 31, 2016 and 2015, and the results of its operations and its cash flows for each of the years in the three-year period ended December 31, 2016, in conformity with accounting principles generally accepted in the United States of America. Also in our opinion, Investar Holding Corporation maintained, in all material respects, effective internal control over financial reporting as of December 31, 2016, based on the COSO criteria.
/s/ Postlethwaite & Netterville
Baton Rouge, Louisiana
March 9, 2017
65
CONSOLIDATED BALANCE SHEETS
(Amounts in thousands, except share data)
|
|
December 31, |
|
|||||
|
|
2016 |
|
|
2015 |
|
||
|
|
|
|
|
|
|
|
|
|
ASSETS |
|
|
|
|
|
|
|
|
Cash and due from banks |
$ |
9,773 |
|
|
$ |
6,313 |
|
|
Interest-bearing balances due from other banks |
|
19,569 |
|
|
|
14,472 |
|
|
Federal funds sold |
|
106 |
|
|
|
181 |
|
|
Cash and cash equivalents |
|
29,448 |
|
|
|
20,966 |
|
|
|
|
|
|
|
|
|
|
|
Available for sale securities at fair value (amortized cost of $166,258 and $113,828, respectively) |
|
163,051 |
|
|
|
113,371 |
|
|
Held to maturity securities at amortized cost (estimated fair value of $19,612 and $26,271, respectively) |
|
20,091 |
|
|
|
26,408 |
|
|
Loans held for sale |
|
- |
|
|
|
80,509 |
|
|
Loans, net of allowance for loan losses of $7,051 and $6,128, respectively |
|
886,375 |
|
|
|
739,313 |
|
|
Other equity securities |
|
5,362 |
|
|
|
5,835 |
|
|
Bank premises and equipment, net of accumulated depreciation of $6,751 and $5,368, respectively |
|
31,722 |
|
|
|
30,630 |
|
|
Other real estate owned, net |
|
4,065 |
|
|
|
725 |
|
|
Accrued interest receivable |
|
3,218 |
|
|
|
2,831 |
|
|
Deferred tax asset |
|
2,868 |
|
|
|
1,915 |
|
|
Goodwill and other intangible assets, net |
|
3,234 |
|
|
|
3,175 |
|
|
Bank owned life insurance |
|
7,201 |
|
|
|
3,512 |
|
|
Other assets |
|
2,325 |
|
|
|
2,365 |
|
|
Total assets |
$ |
1,158,960 |
|
|
$ |
1,031,555 |
|
|
|
|
|
|
|
|
|
|
|
LIABILITIES |
|
|
|
|
|
|
|
|
Deposits: |
|
|
|
|
|
|
|
|
Noninterest-bearing |
$ |
108,404 |
|
|
$ |
90,447 |
|
|
Interest-bearing |
|
799,383 |
|
|
|
646,959 |
|
|
Total deposits |
|
907,787 |
|
|
|
737,406 |
|
|
Advances from Federal Home Loan Bank |
|
82,803 |
|
|
|
127,497 |
|
|
Repurchase agreements |
|
39,087 |
|
|
|
39,099 |
|
|
Junior subordinated debt |
|
3,609 |
|
|
|
3,609 |
|
|
Other borrowings |
|
1,000 |
|
|
|
- |
|
|
Accrued taxes and other liabilities |
|
11,917 |
|
|
|
14,594 |
|
|
Total liabilities |
|
1,046,203 |
|
|
|
922,205 |
|
|
|
|
|
|
|
|
|
|
|
STOCKHOLDERS’ EQUITY |
|
|
|
|
|
|
|
|
Preferred stock, no par value per share; 5,000,000 shares authorized |
|
- |
|
|
|
- |
|
|
Common stock, $1.00 par value per share; 40,000,000 shares authorized; 7,101,851 and 7,264,282 shares issued and outstanding, respectively |
|
7,102 |
|
|
|
7,264 |
|
|
Surplus |
|
81,499 |
|
|
|
84,099 |
|
|
Retained earnings |
|
26,227 |
|
|
|
18,650 |
|
|
Accumulated other comprehensive loss |
|
(2,071 |
) |
|
|
(663 |
) |
|
Total stockholders’ equity |
|
112,757 |
|
|
|
109,350 |
|
|
Total liabilities and stockholders’ equity |
$ |
1,158,960 |
|
|
$ |
1,031,555 |
|
|
|
|
|
|
|
|
|
|
|
See accompanying notes to the consolidated financial statements. |
|
||||||
66
CONSOLIDATED STATEMENTS OF OPERATIONS
(Amounts in thousands, except share data)
|
|
For the years ended |
|
|||||||||
|
|
December 31, |
|
|||||||||
|
|
2016 |
|
|
2015 |
|
|
2014 |
|
|||
|
|
|
|
|
|
|
|
|
|
|
|
|
|
INTEREST INCOME |
|
|
|
|
|
|
|
|
|
|
|
|
Interest and fees on loans |
$ |
39,380 |
|
|
$ |
35,076 |
|
|
$ |
29,979 |
|
|
Interest on investment securities |
|
3,565 |
|
|
|
2,189 |
|
|
|
1,339 |
|
|
Other interest income |
|
207 |
|
|
|
75 |
|
|
|
51 |
|
|
Total interest income |
|
43,152 |
|
|
|
37,340 |
|
|
|
31,369 |
|
|
|
|
|
|
|
|
|
|
|
|
|
|
|
INTEREST EXPENSE |
|
|
|
|
|
|
|
|
|
|
|
|
Interest on deposits |
|
7,182 |
|
|
|
5,250 |
|
|
|
4,273 |
|
|
Interest on borrowings |
|
1,231 |
|
|
|
632 |
|
|
|
402 |
|
|
Total interest expense |
|
8,413 |
|
|
|
5,882 |
|
|
|
4,675 |
|
|
Net interest income |
|
34,739 |
|
|
|
31,458 |
|
|
|
26,694 |
|
|
|
|
|
|
|
|
|
|
|
|
|
|
|
Provision for loan losses |
|
2,079 |
|
|
|
1,865 |
|
|
|
1,628 |
|
|
Net interest income after provision for loan losses |
|
32,660 |
|
|
|
29,593 |
|
|
|
25,066 |
|
|
|
|
|
|
|
|
|
|
|
|
|
|
|
NONINTEREST INCOME |
|
|
|
|
|
|
|
|
|
|
|
|
Service charges on deposit accounts |
|
343 |
|
|
|
380 |
|
|
|
305 |
|
|
Gain on sale of investment securities, net |
|
443 |
|
|
|
489 |
|
|
|
340 |
|
|
Gain on sale of fixed assets, net |
|
1,266 |
|
|
|
15 |
|
|
|
3 |
|
|
Gain (loss) on sale of other real estate owned, net |
|
13 |
|
|
|
(105 |
) |
|
|
230 |
|
|
Gain on sale of loans, net |
|
405 |
|
|
|
4,368 |
|
|
|
3,449 |
|
|
Servicing fees and fee income on serviced loans |
|
2,087 |
|
|
|
2,543 |
|
|
|
885 |
|
|
Other operating income |
|
911 |
|
|
|
654 |
|
|
|
648 |
|
|
Total noninterest income |
|
5,468 |
|
|
|
8,344 |
|
|
|
5,860 |
|
|
Income before noninterest expense |
|
38,128 |
|
|
|
37,937 |
|
|
|
30,926 |
|
|
|
|
|
|
|
|
|
|
|
|
|
|
|
NONINTEREST EXPENSE |
|
|
|
|
|
|
|
|
|
|
|
|
Depreciation and amortization |
|
1,493 |
|
|
|
1,446 |
|
|
|
1,326 |
|
|
Salaries and employee benefits |
|
15,609 |
|
|
|
16,398 |
|
|
|
14,565 |
|
|
Occupancy |
|
995 |
|
|
|
951 |
|
|
|
833 |
|
|
Data processing |
|
1,488 |
|
|
|
1,508 |
|
|
|
1,289 |
|
|
Marketing |
|
386 |
|
|
|
248 |
|
|
|
329 |
|
|
Professional fees |
|
1,261 |
|
|
|
1,075 |
|
|
|
599 |
|
|
Impairment on investment in tax credit entity |
|
11 |
|
|
|
54 |
|
|
|
690 |
|
|
Customer reimbursements |
|
584 |
|
|
|
- |
|
|
|
- |
|
|
Other operating expenses |
|
4,812 |
|
|
|
5,673 |
|
|
|
4,753 |
|
|
Total noninterest expense |
|
26,639 |
|
|
|
27,353 |
|
|
|
24,384 |
|
|
Income before income tax expense |
|
11,489 |
|
|
|
10,584 |
|
|
|
6,542 |
|
|
Income tax expense |
|
3,609 |
|
|
|
3,511 |
|
|
|
1,145 |
|
|
Net income |
$ |
7,880 |
|
|
$ |
7,073 |
|
|
$ |
5,397 |
|
|
|
|
|
|
|
|
|
|
|
|
|
|
|
EARNINGS PER SHARE |
|
|
|
|
|
|
|
|
|
|
|
|
Basic earnings per share |
$ |
1.11 |
|
|
$ |
0.98 |
|
|
$ |
0.98 |
|
|
Diluted earnings per share |
|
1.10 |
|
|
|
0.97 |
|
|
|
0.93 |
|
|
Cash dividends declared per common share |
|
0.04 |
|
|
|
0.03 |
|
|
|
0.04 |
|
|
|
|
|
|
|
|
|
|
|
|
|
|
|
See accompanying notes to the consolidated financial statements. |
|
||||||||||
67
CONSOLIDATED STATEMENTS OF COMPREHENSIVE INCOME
(Amounts in thousands)
|
|
For the years ended |
|
|||||||||
|
|
December 31, |
|
|||||||||
|
|
2016 |
|
|
2015 |
|
|
2014 |
|
|||
|
|
|
|
|
|
|
|
|
|
|
|
|
|
Net income |
$ |
7,880 |
|
|
$ |
7,073 |
|
|
$ |
5,397 |
|
|
Other comprehensive income (loss): |
|
|
|
|
|
|
|
|
|
|
|
|
Unrealized (loss) gains on investment securities: |
|
|
|
|
|
|
|
|
|
|
|
|
Unrealized (loss) gain, available for sale, net of tax (benefit) expense of ($808), ($153) and $463, respectively |
|
(1,500 |
) |
|
|
(283 |
) |
|
|
898 |
|
|
Reclassification of realized gains, net of tax expense of $155, $171 and $116, respectively |
|
(287 |
) |
|
|
(318 |
) |
|
|
(224 |
) |
|
Unrealized loss, transfer from available for sale to held to maturity, net of tax benefit of $1, $2, and $1, respectively |
|
(4 |
) |
|
|
(5 |
) |
|
|
(3 |
) |
|
Fair value of derivative financial instruments: |
|
|
|
|
|
|
|
|
|
|
|
|
Change in fair value of interest rate swap designated as a cash flow hedge, net of tax expense (benefit) of $206, ($95), and ($103), respectively |
|
383 |
|
|
|
(178 |
) |
|
|
(200 |
) |
|
Total other comprehensive (loss) income |
|
(1,408 |
) |
|
|
(784 |
) |
|
|
471 |
|
|
Total comprehensive income |
$ |
6,472 |
|
|
$ |
6,289 |
|
|
$ |
5,868 |
|
|
|
|
|
|
|
|
|
|
|
|
|
|
|
|
|
|
|
|
|
|
|
|
|
|
|
|
See accompanying notes to the consolidated financial statements. |
|
||||||||||
68
CONSOLIDATED STATEMENTS OF CHANGES IN STOCKHOLDERS’ EQUITY
(Amounts in thousands, except share data)
|
|
|
|
|
|
|
|
|
|
|
|
|
|
|
|
|
|
Accumulated |
|
|
|
|
|
|
|
|
|
|
|
|
|
|
|
|
|
|
|
|
|
|
|
|
Other |
|
|
Total |
|
||
|
|
Common |
|
|
Treasury |
|
|
|
|
|
|
Retained |
|
|
Comprehensive |
|
|
Stockholders’ |
|
|||||
|
|
Stock |
|
|
Stock |
|
|
Surplus |
|
|
Earnings |
|
|
Income (Loss) |
|
|
Equity |
|
||||||
|
Balance, December 31, 2013 |
$ |
3,943 |
|
|
$ |
- |
|
|
$ |
45,281 |
|
|
$ |
6,609 |
|
|
$ |
(350 |
) |
|
$ |
55,483 |
|
|
Common stock issued in offering, net of direct cost of $4,266 |
|
3,285 |
|
|
|
- |
|
|
|
38,443 |
|
|
|
- |
|
|
|
- |
|
|
|
41,728 |
|
|
Warrants exercised |
|
22 |
|
|
|
- |
|
|
|
275 |
|
|
|
- |
|
|
|
- |
|
|
|
297 |
|
|
Surrendered shares |
|
- |
|
|
|
(17 |
) |
|
|
- |
|
|
|
- |
|
|
|
- |
|
|
|
(17 |
) |
|
Shares repurchased |
|
- |
|
|
|
(6 |
) |
|
|
- |
|
|
|
- |
|
|
|
- |
|
|
|
(6 |
) |
|
Dividends declared, $0.04 per share |
|
- |
|
|
|
- |
|
|
|
- |
|
|
|
(197 |
) |
|
|
- |
|
|
|
(197 |
) |
|
Stock-based compensation |
|
14 |
|
|
|
- |
|
|
|
214 |
|
|
|
- |
|
|
|
- |
|
|
|
228 |
|
|
Net income |
|
- |
|
|
|
- |
|
|
|
- |
|
|
|
5,397 |
|
|
|
- |
|
|
|
5,397 |
|
|
Other comprehensive income, net |
|
- |
|
|
|
- |
|
|
|
- |
|
|
|
- |
|
|
|
471 |
|
|
|
471 |
|
|
Balance, December 31, 2014 |
$ |
7,264 |
|
|
$ |
(23 |
) |
|
$ |
84,213 |
|
|
$ |
11,809 |
|
|
$ |
121 |
|
|
$ |
103,384 |
|
|
Surrendered shares |
|
- |
|
|
|
(39 |
) |
|
|
- |
|
|
|
- |
|
|
|
- |
|
|
|
(39 |
) |
|
Shares repurchased |
|
- |
|
|
|
(572 |
) |
|
|
- |
|
|
|
- |
|
|
|
- |
|
|
|
(572 |
) |
|
Reclassification of treasury stock under the LBCA(1) |
|
(41 |
) |
|
|
634 |
|
|
|
(593 |
) |
|
|
- |
|
|
|
- |
|
|
|
- |
|
|
Options exercised |
|
10 |
|
|
|
- |
|
|
|
125 |
|
|
|
- |
|
|
|
- |
|
|
|
135 |
|
|
Dividends declared, $0.03 per share |
|
- |
|
|
|
- |
|
|
|
- |
|
|
|
(232 |
) |
|
|
- |
|
|
|
(232 |
) |
|
Stock-based compensation |
|
31 |
|
|
|
- |
|
|
|
354 |
|
|
|
- |
|
|
|
- |
|
|
|
385 |
|
|
Net income |
|
- |
|
|
|
- |
|
|
|
- |
|
|
|
7,073 |
|
|
|
- |
|
|
|
7,073 |
|
|
Other comprehensive loss, net |
|
- |
|
|
|
- |
|
|
|
- |
|
|
|
- |
|
|
|
(784 |
) |
|
|
(784 |
) |
|
Balance, December 31, 2015 |
$ |
7,264 |
|
|
$ |
- |
|
|
$ |
84,099 |
|
|
$ |
18,650 |
|
|
$ |
(663 |
) |
|
$ |
109,350 |
|
|
Surrendered shares |
|
(4 |
) |
|
|
- |
|
|
|
(61 |
) |
|
|
- |
|
|
|
- |
|
|
|
(65 |
) |
|
Shares repurchased |
|
(222 |
) |
|
|
- |
|
|
|
(3,251 |
) |
|
|
- |
|
|
|
- |
|
|
|
(3,473 |
) |
|
Options and warrants exercised |
|
12 |
|
|
|
- |
|
|
|
153 |
|
|
|
- |
|
|
|
- |
|
|
|
165 |
|
|
Dividends declared, $0.04 per share |
|
- |
|
|
|
- |
|
|
|
- |
|
|
|
(303 |
) |
|
|
- |
|
|
|
(303 |
) |
|
Stock-based compensation |
|
52 |
|
|
|
- |
|
|
|
557 |
|
|
|
- |
|
|
|
- |
|
|
|
609 |
|
|
Net tax effect of stock-based compensation |
|
- |
|
|
|
- |
|
|
|
2 |
|
|
|
- |
|
|
|
- |
|
|
|
2 |
|
|
Net income |
|
- |
|
|
|
- |
|
|
|
- |
|
|
|
7,880 |
|
|
|
- |
|
|
|
7,880 |
|
|
Other comprehensive loss, net |
|
- |
|
|
|
- |
|
|
|
- |
|
|
|
- |
|
|
|
(1,408 |
) |
|
|
(1,408 |
) |
|
Balance, December 31, 2016 |
$ |
7,102 |
|
|
$ |
- |
|
|
$ |
81,499 |
|
|
$ |
26,227 |
|
|
$ |
(2,071 |
) |
|
$ |
112,757 |
|
|
|
|
||||||||||||||||||||||
|
(1) Effective January 1, 2015, companies incorporated in Louisiana became subject to the Louisiana Business Corporation Act ("LBCA"), which eliminates the concept of treasury stock and provides that shares reacquired by a company are to be treated as authorized but unissued. Refer to Note 1 for further discussion. |
|
||||||||||||||||||||||
|
|
|
|
|
|
|
|
|
|
|
|
|
|
|
|
|
|
|
|
|
|
|
|
|
|
See accompanying notes to the consolidated financial statements. |
|
||||||||||||||||||||||
69
CONSOLIDATED STATEMENTS OF CASH FLOWS
(Amounts in thousands)
|
|
For the years ended December 31, |
|
|||||||||
|
|
2016 |
|
|
2015 |
|
|
2014 |
|
|||
|
Cash flows from operating activities |
|
|
|
|
|
|
|
|
|
|
|
|
Net income |
$ |
7,880 |
|
|
$ |
7,073 |
|
|
$ |
5,397 |
|
|
Adjustments to reconcile net income to net cash provided by (used in) operating activities: |
|
|
|
|
|
|
|
|
|
|
|
|
Depreciation and amortization |
|
1,493 |
|
|
|
1,446 |
|
|
|
1,326 |
|
|
Provision for loan losses |
|
2,079 |
|
|
|
1,865 |
|
|
|
1,628 |
|
|
Amortization of purchase accounting adjustments |
|
(39 |
) |
|
|
(186 |
) |
|
|
(366 |
) |
|
Provision for other real estate owned |
|
7 |
|
|
|
54 |
|
|
|
210 |
|
|
Net amortization of securities |
|
1,304 |
|
|
|
1,051 |
|
|
|
1,087 |
|
|
Gain on sale of securities, net |
|
(443 |
) |
|
|
(489 |
) |
|
|
(340 |
) |
|
Gain on sale of fixed assets, net |
|
(1,266 |
) |
|
|
(15 |
) |
|
|
(3 |
) |
|
Impairment of investment in tax credit entity |
|
11 |
|
|
|
54 |
|
|
|
690 |
|
|
(Gain) loss on sale of other real estate owned, net |
|
(13 |
) |
|
|
105 |
|
|
|
(230 |
) |
|
FHLB stock dividend |
|
(66 |
) |
|
|
(14 |
) |
|
|
(8 |
) |
|
Stock-based compensation |
|
609 |
|
|
|
385 |
|
|
|
228 |
|
|
Deferred taxes |
|
(207 |
) |
|
|
(386 |
) |
|
|
(134 |
) |
|
Net change in value of bank owned life insurance |
|
(189 |
) |
|
|
(12 |
) |
|
|
- |
|
|
Other |
|
- |
|
|
|
23 |
|
|
|
- |
|
|
Loans held for sale: |
|
|
|
|
|
|
|
|
|
|
|
|
Originations |
|
(494 |
) |
|
|
(349,684 |
) |
|
|
(238,471 |
) |
|
Proceeds from sales |
|
29,013 |
|
|
|
376,939 |
|
|
|
141,893 |
|
|
Gain on sale of loans |
|
(405 |
) |
|
|
(4,368 |
) |
|
|
(3,449 |
) |
|
Net change in: |
|
|
|
|
|
|
|
|
|
|
|
|
Accrued interest receivable |
|
(387 |
) |
|
|
(396 |
) |
|
|
(600 |
) |
|
Other assets |
|
581 |
|
|
|
(4,015 |
) |
|
|
(71 |
) |
|
Accrued taxes and other liabilities |
|
(2,164 |
) |
|
|
8,086 |
|
|
|
3,615 |
|
|
Net cash provided by (used in) operating activities |
|
37,304 |
|
|
|
37,516 |
|
|
|
(87,598 |
) |
|
|
|
|
|
|
|
|
|
|
|
|
|
|
Cash flows from investing activities |
|
|
|
|
|
|
|
|
|
|
|
|
Proceeds from sales of investment securities available for sale |
|
15,515 |
|
|
|
27,187 |
|
|
|
31,603 |
|
|
Funds invested in securities available for sale |
|
(87,340 |
) |
|
|
(82,945 |
) |
|
|
(55,901 |
) |
|
Proceeds from maturities, prepayments and calls of investment securities available for sale |
|
18,627 |
|
|
|
11,224 |
|
|
|
10,465 |
|
|
Funds invested in securities held to maturity |
|
- |
|
|
|
(5,622 |
) |
|
|
(16,348 |
) |
|
Proceeds from maturities, prepayments and calls of investment securities held to maturity |
|
6,217 |
|
|
|
1,663 |
|
|
|
385 |
|
|
Proceeds from redemption of other equity securities |
|
2,800 |
|
|
|
6,813 |
|
|
|
1,972 |
|
|
Purchase of other equity securities |
|
(2,261 |
) |
|
|
(7,067 |
) |
|
|
(5,509 |
) |
|
Proceeds from sale of loans |
|
- |
|
|
|
- |
|
|
|
105,241 |
|
|
Net increase in loans |
|
(100,634 |
) |
|
|
(124,041 |
) |
|
|
(223,132 |
) |
|
Proceeds from sales of other real estate owned |
|
541 |
|
|
|
2,857 |
|
|
|
1,506 |
|
|
Proceeds from sales of fixed assets |
|
2,686 |
|
|
|
696 |
|
|
|
3 |
|
|
Purchases of fixed assets |
|
(3,964 |
) |
|
|
(4,079 |
) |
|
|
(5,142 |
) |
|
Acquisition of trademark intangible |
|
(100 |
) |
|
|
- |
|
|
|
- |
|
|
Purchase of bank owned life insurance |
|
(3,500 |
) |
|
|
- |
|
|
|
- |
|
|
Purchase of other investments |
|
(553 |
) |
|
|
- |
|
|
|
- |
|
|
Purchase of investment in tax credit entity |
|
- |
|
|
|
- |
|
|
|
(766 |
) |
|
Net cash used in investing activities |
|
(151,966 |
) |
|
|
(173,314 |
) |
|
|
(155,623 |
) |
|
|
|
|
|
|
|
|
|
|
|
|
|
|
Cash flows from financing activities |
|
|
|
|
|
|
|
|
|
|
|
|
Net increase in customer deposits |
|
170,436 |
|
|
|
109,391 |
|
|
|
95,648 |
|
|
Net (decrease) increase in repurchase agreements |
|
(12 |
) |
|
|
26,807 |
|
|
|
2,089 |
|
|
Net (decrease) increase in short-term FHLB advances |
|
(33,780 |
) |
|
|
13,141 |
|
|
|
90,639 |
|
|
Proceeds from long-term FHLB advances |
|
5,000 |
|
|
|
3,000 |
|
|
|
7,500 |
|
|
Repayment of long-term FHLB advances |
|
(15,914 |
) |
|
|
(14,429 |
) |
|
|
(3,171 |
) |
|
Cash dividends paid on common stock |
|
(278 |
) |
|
|
(221 |
) |
|
|
(194 |
) |
|
Payments to repurchase common stock |
|
(3,473 |
) |
|
|
(572 |
) |
|
|
(6 |
) |
|
Proceeds from issuance of common stock in initial public offering |
|
- |
|
|
|
- |
|
|
|
41,728 |
|
|
Proceeds from stock options and warrants exercised |
|
165 |
|
|
|
135 |
|
|
|
297 |
|
|
Proceeds from other borrowings |
|
1,000 |
|
|
|
- |
|
|
|
- |
|
|
Net cash provided by financing activities |
|
123,144 |
|
|
|
137,252 |
|
|
|
234,530 |
|
|
Net increase (decrease) in cash and cash equivalents |
|
8,482 |
|
|
|
1,454 |
|
|
|
(8,691 |
) |
|
Cash and cash equivalents, beginning of period |
|
20,966 |
|
|
|
19,512 |
|
|
|
28,203 |
|
|
Cash and cash equivalents, end of period |
$ |
29,448 |
|
|
$ |
20,966 |
|
|
$ |
19,512 |
|
|
|
|
|
|
|
|
|
|
|
|
|
|
|
See accompanying notes to the consolidated financial statements. |
|
||||||||||
70
INVESTAR HOLDING CORPORATION
CONSOLIDATED STATEMENTS OF CASH FLOWS (CONTINUED)
(Amounts in thousands)
|
|
For the years ended December 31, |
|
|||||||||
|
|
2016 |
|
|
2015 |
|
|
2014 |
|
|||
|
SUPPLEMENTAL DISCLOSURES OF CASH FLOW INFORMATION |
|
|
|
|
|
|
|
|
|
|
|
|
Cash payments for: |
|
|
|
|
|
|
|
|
|
|
|
|
Income taxes |
$ |
2,850 |
|
|
$ |
4,000 |
|
|
$ |
1,336 |
|
|
Interest on deposits and borrowings |
$ |
8,294 |
|
|
$ |
5,833 |
|
|
$ |
4,675 |
|
|
SUPPLEMENTAL DISCLOSURES OF NONCASH INVESTING ACTIVITIES |
|
|
|
|
|
|
|
|
|
|
|
|
Transfer from loans to other real estate owned |
$ |
3,875 |
|
|
$ |
1,005 |
|
|
$ |
706 |
|
|
|
|
|
|
|
|
|
|
|
|
|
|
|
See accompanying notes to the consolidated financial statements. |
|
||||||||||
71
INVESTAR HOLDING CORPORATION
Notes to Consolidated Financial Statements
NOTE 1. SUMMARY OF SIGNIFICANT ACCOUNTING POLICIES
Nature of Operations
Investar Holding Corporation (the “Company”) was incorporated in 2009 to serve as a holding company for Investar Bank (the “Bank”), a Louisiana-chartered commercial bank founded in 2006. On November 15, 2013, the Company completed a share exchange with the shareholders of the Bank, which resulted in the Bank becoming a wholly-owned subsidiary of the Company. Pursuant to this share exchange, all issued and outstanding common stock of the Bank, and all outstanding and unexercised warrants and options to purchase additional shares of common stock of the Bank, were exchanged for a like number of shares of common stock of the Company, and respectively, a like number of warrants and options to purchase additional shares of common stock of the Company.
In July 2014, the Company completed the issuance and sale of 3,285,300 shares of its common stock in its initial public offering, which amount includes 410,300 shares sold pursuant to the underwriters’ exercise of their option to purchase additional shares from the Company, at a public offering price of $14.00 per share. The shares were offered pursuant to the Company’s Registration Statement on Form S-1. After deducting underwriting commissions and offering expenses, the Company received net proceeds of $41.7 million from the sale of such shares.
The consolidated financial statements of Investar Holding Corporation and its wholly-owned subsidiary, the Bank, have been prepared in conformity with accounting principles generally accepted in the United States of America (“U.S. GAAP”).
Segments
While our chief decision makers monitor the revenue streams of the various banking products and services, operations are managed and financial performance is evaluated on a Company-wide basis. Accordingly, all of the Company’s banking operations are considered by management to be aggregated in one reportable operating segment. Because the overall banking operations comprise substantially all of the consolidated operations, no separate segment disclosures are presented in the accompanying consolidated financial statements.
Principles of Consolidation
The consolidated financial statements include the accounts of the Company and its wholly-owned subsidiary, the Bank. All significant intercompany accounts and transactions have been eliminated in consolidation.
Use of Estimates
The preparation of statements in conformity with U.S. GAAP requires management to make estimates and assumptions that affect the reported amounts of assets and liabilities and the disclosure of contingent assets and liabilities at the date of the financial statements as well as the reported amounts of revenues and expenses during the reporting period. Actual results could differ from those estimates, and such differences could be material.
Material estimates that are particularly susceptible to significant change relate to the determination of the allowance for loan losses. While management uses available information to recognize losses on loans, future additions to the allowance may be necessary based on changes in local economic conditions. In addition, regulatory agencies, as an integral part of their examination process, periodically review the Company’s allowance for loan losses. Such agencies may require the Company to recognize additions to the allowance based on their judgments about information available to them at the time of their examination. Because of these factors, it is reasonably possible that the allowance for loan losses may change materially in the near term. However, the amount of the change that is reasonably possible cannot be estimated.
Other estimates that are susceptible to significant change in the near term relate to the determination of other-than-temporary impairments of securities and the fair value of financial instruments.
72
INVESTAR HOLDING CORPORATION
Notes to Consolidated Financial Statements
The Company’s investments in securities are accounted for in accordance with applicable guidance contained in the Financial Accounting Standards Board (“FASB”) Accounting Standards Codification (“ASC”), which requires the classification of securities into one of the following categories:
|
|
• |
Securities to be held to maturity (“HTM”): bonds, notes, and debentures for which the Company has the positive intent and ability to hold to maturity are reported at cost, adjusted for premiums and discounts that are recognized in interest income using the interest method over the period to maturity. |
|
|
• |
Securities available for sale (“AFS”): available for sale securities consist of bonds, notes, and debentures that are available to meet the Company’s operating needs. These securities are reported at fair value. |
Unrealized holding gains and losses, net of tax, on available for sale securities are reported as a net amount in other comprehensive income. Purchase premiums and discounts are recognized in interest income using the interest method over the terms of the securities. Realized gains and losses on the sale of investment securities are determined using the specific-identification method.
The Company follows FASB guidance related to the recognition and presentation of other-than-temporary impairment. The guidance specifies that if an entity does not have the intent to sell a debt security prior to recovery, the security would not be considered other-than-temporarily impaired unless there is a credit loss. When an entity does not intend to sell the security, and it is more likely than not that the entity will not have to sell the security before recovery of its cost basis, it will recognize the credit component of an other-than-temporary impairment of a debt security in earnings and the remaining portion in other comprehensive income.
Other Equity Securities
Other equity securities include investments in Federal Home Loan Bank (“FHLB”), Independent Bankers Financial Corporation (“IBFC”), and First National Bankers Bankshares (“FNBB”) stock, which investments are restricted. These investments are carried at cost which approximated fair value at December 31, 2016 and 2015.
Loans
The Company’s loan portfolio categories include real estate, commercial and consumer loans. Real estate loans are further categorized into construction and development, one-to-four family residential, multifamily, farmland and commercial real estate loans. The consumer loan category includes loans originated through indirect lending. Indirect lending, which is lending initiated through third-party business partners, is largely comprised of loans made through automotive dealerships.
Loans that management has the intent and ability to hold for the foreseeable future or until maturity or pay-off are stated at unpaid principal balances, adjusted by an allowance for loan losses. Interest on loans is calculated by using the simple interest method on daily balances of the principal amount outstanding. Loans are ordinarily placed on nonaccrual when a loan is specifically determined to be impaired or when principal or interest is delinquent for 90 days or more; however, management may elect to continue the accrual when the estimated net realizable value of collateral is sufficient to cover the principal balance and the accrued interest. Any unpaid interest previously accrued on nonaccrual loans is reversed from income. Interest income, generally, is not recognized on specific impaired loans unless the likelihood of further loss is remote. Interest payments received on such loans are applied as a reduction of the loan principal balance. Interest income on other nonaccrual loans is recognized only to the extent of interest payments received.
The Company considers a loan to be impaired when, based upon current information and events, it believes it is probable that the Company will be unable to collect all amounts due according to the contractual terms of the loan agreement. Factors considered by management in determining impairment include payment status, collateral value, and the probability of collecting scheduled principal and interest payments when due. Loans that experience insignificant payment delays and payment shortfalls generally are not classified as impaired. The Company’s impaired loans include troubled debt restructurings and performing and non-performing major loans for which full payment of principal or interest is not expected. Large groups of smaller balance homogenous loans are collectively evaluated for impairment. The Company calculates an allowance required for impaired loans based on the present value of expected future cash flows discounted at the loan’s effective interest rate, the loan’s observable market price or the fair value of its collateral. If the recorded investment in the impaired loan exceeds the measure of fair value, a valuation allowance is required as a component of the allowance for loan losses. Changes to the valuation allowance are recorded as a component of the provision for loan losses.
73
INVESTAR HOLDING CORPORATION
Notes to Consolidated Financial Statements
The Company follows the FASB accounting guidance on sales of financial assets, which includes participating interests in loans. For loan participations that are structured in accordance with this guidance, the sold portions are recorded as a reduction of the loan portfolio. Loan participations that do not meet the criteria are accounted for as secured borrowings.
Loans Held for Sale
Loans originated and intended for sale in the secondary market are carried at the lower of cost or fair value. For loans carried at the lower of cost or fair value, gains and losses on loan sales (sales proceeds minus carrying value) are recorded in noninterest income, and direct loan origination costs and fees are deferred at origination of the loan and are recognized in noninterest income upon sale of the loan.
Loans Sold with Recourse
The Company has an obligation to repurchase certain mortgage loans and indirect loans sold and to refund certain fees to the purchaser if the loans fail to perform or prepay within prescribed time periods after the date of sale. Prepayment penalty features also exist for certain conforming loans as defined in each agreement with investors. Accounting guidance requires a guarantor to recognize, at the inception of a guarantee, a liability in an amount equal to the fair value of the obligation undertaken in issuing the guarantee. The Company considers loans sold with recourse to be guarantees.
Allowance for Loan Losses
The adequacy of the allowance for loan losses is determined in accordance with U.S. GAAP. The allowance for loan losses is estimated through a provision for loan losses charged to earnings. Loan losses are charged against the allowance when management believes the loan balance is uncollectable. Subsequent recoveries, if any, are credited to the allowance.
The allowance is an amount that management believes will be adequate to absorb probable losses inherent in the loan portfolio as of the balance sheet date based on evaluations of the collectability of loans and prior loan loss experience. The evaluations take into consideration such factors as changes in the nature and volume of the loan portfolio, overall portfolio quality, review of specific problem loans, and current economic conditions that may affect the borrower’s ability to pay. This evaluation is inherently subjective as it requires estimates that are susceptible to significant revision as more information becomes available. Allowances for impaired loans are generally determined based on collateral values or the present value of estimated cash flows. Credits deemed uncollectible are charged to the allowance. Provisions for loan losses and recoveries on loans previously charged off are adjusted to the allowance. Past due status is determined based on contractual terms.
The allowance consists of allocated and general components. The allocated component relates to loans that are classified as impaired. For loans that are classified as impaired, an allowance is established when the discounted cash flows (or collateral value observable market price) of the impaired loan is lower than the carrying value of that loan. The general component covers non-classified loans and is based on historical loss experience adjusted for qualitative factors. Based on management’s review and observations made through qualitative review, management may apply qualitative adjustments to determine loss estimates at a group and/or portfolio segment level as deemed appropriate. Management has an established methodology to determine the adequacy of the allowance for loan losses that assesses the risks and losses inherent in its portfolio and portfolio segments. The Company utilizes an internally developed model that requires significant judgment to determine the estimation method that fits the credit risk characteristics of the loans in its portfolio and portfolio segments. Qualitative and environmental factors that may not be directly reflected in quantitative estimates include: asset quality trends, changes in loan concentrations, new products and process changes, changes and pressures from competition, changes in lending policies and underwriting practices, trends in the nature and volume of the loan portfolio, changes in experience and depth of lending staff and management and national and regional economic trends. Changes in these factors are considered in determining the directional consistency of changes in the allowance for loan losses. The impact of these factors on the Company’s qualitative assessment of the allowance for loan losses can change from period to period based on management’s assessment of the extent to which these factors are already reflected in historic loss rates. The uncertainty inherent in the estimation process is also considered in evaluating the allowance for loan losses.
74
INVESTAR HOLDING CORPORATION
Notes to Consolidated Financial Statements
The Company periodically grants concessions to its customers in an attempt to protect as much of its investment as possible and minimize the risk of loss. These concessions may include restructuring the terms of a customer loan, thereby adjusting the customer’s payment requirements. In accordance with the FASB’s Accounting Standards Update (“ASU”) 2011-02, Receivables (Topic 310): A Creditor’s Determination of Whether a Restructuring is a Troubled Debt Restructuring, in order to be considered a troubled debt restructuring (a “TDR”), the Company must conclude that the restructuring constitutes a concession and the customer is experiencing financial difficulties. The Company defines a concession to a customer as a modification of existing loan terms for economic or legal reasons that it would otherwise not consider. Concessions are typically granted through an agreement with the customer or are imposed by a court of law. Concessions include modifying original loan terms to reduce or defer cash payments required as part of the loan agreement, including but not limited to a reduction of the stated interest rate for the remaining original life of the debt, an extension of the maturity date or dates at a stated interest rate lower than the current market rate for new debt with similar risk characteristics, a reduction of the face amount or maturity amount of the debt, or a reduction of accrued interest receivable on a debt. In its determination of whether the customer is experiencing financial difficulties, the Company considers numerous indicators, including but not limited to, whether the customer has declared or is in the process of declaring bankruptcy, whether there is substantial doubt about the customer’s ability to continue as a going concern, whether the Company believes the customer’s future cash flows will be insufficient to service the debt in accordance with the contractual terms of the existing agreement for the foreseeable future, and whether without modification the customer cannot obtain sufficient funds from other sources at an effective interest rate equal to the current market rate for similar debt for a non-troubled debtor.
If the Company concludes that both a concession has been granted and the concession was granted to a customer experiencing financial difficulties, the Company identifies the loan as a TDR. For purposes of the determination of an allowance for loan losses on these TDRs, the loan is reviewed for specific impairment in accordance with the Company’s allowance for loan loss methodology. If it is determined that losses are probable on such TDRs, either because of delinquency or other credit quality indicators, the Company establishes specific reserves for these loans.
Servicing Rights
Primary servicing rights represent the Company’s right to service consumer automobile loans for third-party whole-loan sales and loans sold as participations. Primary servicing involves the collection of payments from individual borrowers and the distribution of these payments to the investors.
The Company capitalizes the value expected to be realized from performing specified automobile servicing activities for others as automobile servicing rights (“ASRs”) when the expected future cash flows from servicing are projected to be more than adequate compensation for such activities. These capitalized servicing rights are purchased or retained upon sale of consumer automobile loans.
The Company measures all consumer automobile servicing assets and liabilities at fair value. The Company defines servicing rights based on both the availability of market inputs and the manner in which the Company manages the risks of servicing assets and liabilities. The Company leverages all available relevant market data to determine the fair value of recognized servicing assets and liabilities.
The Company calculates the fair value of ASRs using various assumptions including future cash flows, market discount rates, expected prepayments, servicing costs and other factors. A significant change in prepayments of loans in the servicing portfolio could result in significant changes in the valuation adjustments, thus creating potential volatility in the carrying amount of ASRs.
As of the years ended December 31, 2016, 2015, and 2014, expected future cash flows from ASRs approximated adequate compensation for such activities. Accordingly, the Company has not recorded an asset or liability. Total income earned from servicing activities was approximately $1.6 million, $1.6 million and $0.6 million for the years ended December 31, 2016, 2015, and 2014, respectively.
75
INVESTAR HOLDING CORPORATION
Notes to Consolidated Financial Statements
Real estate acquired through, or in lieu of, foreclosure, or other real estate owned on the consolidated balance sheets, is initially recorded at fair value at the time of foreclosure, less estimated selling cost, and any related write down is charged to the allowance for loan losses. Valuations are periodically performed by management and provisions for estimated losses on other real estate owned are charged to expense when fair value is determined to be less than the carrying value.
Costs relative to the development and improvement of properties are capitalized to the extent realizable, whereas ordinary upkeep disbursements are charged to expense. The ability of the Company to recover the carrying value of real estate is based upon future sales of the other real estate owned. The ability to affect such sales is subject to market conditions and other factors, many of which are beyond the Company’s control. Operating income and expense of such properties is included in other operating income or expense, respectively, on the accompanying consolidated statements of operations. Gain or loss on the disposition of such properties is included in noninterest income on the consolidated statements of operations.
Bank Premises and Equipment
Land is carried at cost. Buildings and equipment are stated at cost, less accumulated depreciation. Depreciation expense is computed by the straight-line method and is charged to expense over the estimated useful lives of the assets, which range from 1 to 39 years. Costs of major additions and improvements are capitalized. Expenditures for maintenance and repairs are expensed as incurred. Gains or losses on the disposition of land, buildings, and equipment are included in noninterest income on the consolidated statements of operations.
Bank Owned Life Insurance
The Company invests in bank owned life insurance (“BOLI”) policies that provide earnings to help cover the cost of employee benefit plans. The Company is the owner and beneficiary of the life insurance policies it purchased directly on a chosen group of employees. The policies are carried on the Company’s consolidated balance sheet at their cash surrender value and are subject to regulatory capital requirements. The determination of the cash surrender value includes a full evaluation of the contractual terms of each policy and assumes the surrender of policies on an individual-life by individual-life basis. Additionally, the Company periodically reviews the creditworthiness of the insurance companies that have underwritten the policies. Earnings accruing to the Company are derived from the general account investments of the insurance companies. Increases in the net cash surrender value of BOLI policies and insurance proceeds received are not taxable and are recorded in noninterest income in the consolidated statements of operations.
Goodwill and Other Intangible Assets
Goodwill represents the excess of the purchase price over the fair value of the net identifiable assets acquired in a business combination. Goodwill and other intangible assets deemed to have an indefinite useful life are not amortized but instead are subject to review for impairment annually, or more frequently if deemed necessary, in accordance with the provisions of FASB ASC Topic 350, Intangibles – Goodwill and Other. Intangible assets with estimable useful lives are amortized over their respective estimated useful lives and reviewed for impairment in accordance with FASB ASC Topic 360, Property, Plant, and Equipment. If impaired, the asset is written down to its estimated fair value. No impairment charges have been recognized through December 31, 2016. Core deposit intangibles representing the value of the acquired core deposit base are generally recorded in connection with business combinations involving banks and branch locations. The Company’s policy is to amortize core deposit intangibles over the estimated useful life of the deposit base. The remaining useful lives of core deposit intangibles are evaluated periodically to determine whether events and circumstances warrant revision of the remaining period of amortization. All of the Company’s core deposit intangibles are currently amortized on a straight-line basis over 15 years. See Note 7, Goodwill and Other Intangible Assets, for additional information.
Repurchase Agreements
Securities sold under agreements to repurchase are secured borrowings treated as financing activities and are carried at the amounts at which the securities will be subsequently reacquired as specified in the respective agreements.
Stock-Based Compensation
The Company accounts for stock-based compensation under the provisions of ASC Topic 718, Compensation - Stock Compensation. Under this accounting guidance, fair value is established as the measurement objective in accounting for stock awards and requires the application of a fair value based measurement method in accounting for compensation costs, which is recognized over the requisite service period. See Note 13, Stockholders’ Equity, for further disclosures regarding stock-based compensation.
76
INVESTAR HOLDING CORPORATION
Notes to Consolidated Financial Statements
Off-Balance Sheet Credit-Related Financial Instruments
The Company accounts for its guarantees in accordance with the provisions of ASC Topic 460, Guarantees. In the ordinary course of business, the Company has entered into commitments to extend credit, including commitments under credit card agreements, commercial letters of credit and standby letters of credit. Such financial instruments are recorded when they are funded.
Derivative Financial Instruments
ASC Topic 815, Derivatives and Hedging, requires that all derivatives be recognized as assets or liabilities in the balance sheet at fair value.
In the course of its business operations, the Company is exposed to certain risks, including interest rate, liquidity and credit risk. The Company manages its risks through the use of derivative financial instruments, primarily through management of exposure due to the receipt or payment of future cash amounts based on interest rates. The Company’s derivative financial instruments manage the differences in the timing, amount and duration of expected cash receipts and payments.
Derivatives which are designated and qualify as a hedge of the exposure to variability in expected future cash flows, or other types of forecasted transactions, are considered cash flow hedges. The effective portion of the derivative’s gain or loss is initially reported as a component of other comprehensive income and subsequently reclassified into earnings when the forecasted transaction affects earnings or when the hedge is terminated. The ineffective portion of the gain or loss is reported in earnings immediately.
In applying hedge accounting for derivatives, the Company establishes a method for assessing the effectiveness of the hedging derivative and a measurement approach for determining the ineffective aspect of the hedge upon the inception of the hedge. These methods are consistent with the Company’s approach to managing risk. Note 12, Derivative Financial Instruments, describes the derivative instruments currently used by the Company and discloses how these derivatives impact the Company’s financial position and results of operations.
Income Taxes
The provision for income taxes is based on amounts reported in the consolidated statements of operations after exclusion of nontaxable income such as interest on state and municipal securities. Also, certain items of income and expenses are recognized in different time periods for financial statement purposes than for income tax purposes. Thus, provisions for deferred taxes are recorded in recognition of such temporary differences.
Deferred taxes are determined utilizing a liability method whereby deferred tax assets are recognized for deductible temporary differences and deferred tax liabilities are recognized for taxable temporary differences. Temporary differences are the differences between the reported amounts of assets and liabilities and their tax bases. Deferred tax assets are reduced by a valuation allowance when, in the opinion of management, it is more likely than not that some portion or all of the deferred tax assets will not be realized. Deferred tax assets and liabilities are adjusted for the effects of changes in tax laws and rates on the date of enactment.
The Company has adopted accounting guidance related to accounting for uncertainty in income taxes, which sets out a consistent framework to determine the appropriate level of tax reserves to maintain for uncertain tax positions.
Deferred tax assets are recognized if it is more likely than not, based on the technical merits, that the tax position will be realized or sustained upon examination. The term “more likely than not” means a likelihood of more than 50 percent. A tax position that meets the more-likely-than-not recognition threshold is initially and subsequently measured as the largest amount of tax benefit that has a greater than 50 percent likelihood of being realized upon settlement with a taxing authority that has full knowledge of all relevant information. The determination of whether or not a tax position has met the more-likely-than-not recognition threshold considers the facts, circumstances, and information available at the reporting date and is subject to management’s judgment. Deferred tax assets are reduced by a valuation allowance if, based on the weight of evidence available, it is more likely than not that some portion or all of deferred tax asset will not be realized.
The Company recognizes interest and penalties on income taxes as a component of income tax expense.
77
INVESTAR HOLDING CORPORATION
Notes to Consolidated Financial Statements
The Company recognizes revenue in the consolidated statements of operations as it is earned and when collectability is reasonably assured. The primary source of revenue is interest income from interest-earning assets, which is recognized on the accrual basis of accounting using the effective interest method. The recognition of revenues from interest-earning assets is based upon formulas from underlying loan agreements, securities contracts, or other similar contracts. Noninterest income is recognized on the accrual basis of accounting as services are provided or as transactions occur. Noninterest income includes fees from deposit accounts, merchant services, ATM and debit card fees, and other miscellaneous services and transactions.
Earnings Per Share
Basic earnings per share represents income available to common shareholders divided by the weighted average number of shares of common stock outstanding during the period. Diluted earnings per share reflects the additional potential common shares that would have been outstanding if dilutive potential common shares had been issued, as well as any adjustment to income that would result from the assumed issuance.
Statements of Cash Flows
For purposes of the statements of cash flows, cash and cash equivalents include cash and amounts due from banks and federal funds sold due to the short-term nature of these items.
Advertising Costs
Advertising and marketing costs are recorded as expenses in the year in which they are incurred. Advertising and marketing costs charged to operations were approximately $0.4 million, $0.2 million and $0.3 million for the years ended December 31, 2016, 2015 and 2014, respectively.
Comprehensive Income
Comprehensive income includes net income and other comprehensive income or loss, which in the case of the Company includes unrealized gains and losses on securities and changes in the fair value of interest rate swaps, net of related income taxes.
Acquisition Accounting
Acquisitions are accounted for under the purchase method of accounting. Purchased assets and assumed liabilities are recorded at their respective acquisition date fair values, and identifiable intangible assets are recorded at fair value. If the consideration given exceeds the fair value of the net assets received, goodwill is recognized. If the fair value of the net assets received exceeds the consideration given, a bargain purchase gain is recognized. Fair values are subject to refinement for up to one year after the closing date of an acquisition as information relative to closing date fair values becomes available.
Purchased loans acquired in a business combination are recorded at their estimated fair value as of the acquisition date. The fair value of loans acquired is determined using a discounted cash flow model based on assumptions regarding the amount and timing of principal and interest prepayments, estimated payments, estimated default rates, estimated loss severity in the event of defaults, and current market rates. Estimated credit losses are included in the determination of fair value; therefore, an allowance for loan losses is not recorded on the acquisition date. The fair value adjustment is amortized over the life of the loan using the effective interest method.
Acquired Impaired Loans
The Company accounts for acquired impaired loans under FASB ASC Topic 310-30, Loans and Debt Securities Acquired with Deteriorated Credit Quality (“ASC 310-30”). An acquired loan is considered impaired when there is evidence of credit deterioration since origination and it is probable at the date of acquisition that the Company will be unable to collect all contractually required payments. For acquired impaired loans, the Company (a) calculates the contractual amount and timing of undiscounted principal and interest payments (the “undiscounted contractual cash flows”) and (b) estimates the amount and timing of undiscounted expected principal and interest payments (the “undiscounted expected cash flows”). Under ASC 310-30, the difference between the undiscounted contractual cash flows and the undiscounted expected cash flows is the nonaccretable difference. The nonaccretable difference represents an estimate of the loss exposure of principal and interest related to the acquired impaired loan portfolio, and such amount is subject to change over time based on the performance of such loans.
78
INVESTAR HOLDING CORPORATION
Notes to Consolidated Financial Statements
The excess of expected cash flows at acquisition over the initial fair value of acquired impaired loans is referred to as the “accretable yield” and is recorded as interest income over the estimated life of the loans using the effective yield method if the timing and amount of the future cash flows is reasonably estimable. As required by ASC 310-30, the Company periodically re-estimates the expected cash flows to be collected over the life of the acquired impaired loans. Improvements in expected cash flows over those originally estimated increase the accretable yield and are recognized as interest income prospectively. Decreases in the amount and changes in the timing of expected cash flows compared to those originally estimated decrease the accretable yield and usually result in a provision for loan losses and the establishment of an allowance for loan losses with respect to the acquired impaired loan. The carrying value of acquired impaired loans is reduced by payments received, both principal and interest, and increased by the portion of the accretable yield recognized as interest income.
Share Repurchases
Effective January 1, 2015, companies incorporated under Louisiana law became subject to the Louisiana Business Corporation Act. Provisions of the Louisiana Business Corporation Act eliminate the concept of treasury stock. Rather, shares purchased by the Company constitute authorized but unissued shares. Accounting principles generally accepted in the United States of America state that accounting for treasury stock shall conform to state law. The Company's consolidated financial statements as of December 31, 2015 and 2016 reflect this change. The cost of shares purchased by the Company has been allocated to common stock and surplus balances.
Reclassifications
Certain reclassifications have been made to the 2015 and 2014 financial statements to be consistent with the 2016 presentation.
Recent Accounting Pronouncements
This section briefly describes accounting standards that have been issued, but are not yet adopted, that could have a material effect on the Company’s financial statements.
FASB ASC Topic 805 “Business Combinations: Clarifying the Definition of a Business” Update No. 2017-01. The FASB issued Update No. 2017-01 in January 2017. The amendments in the Update are intended to clarify the definition and the current interpretation of a business to assist companies and other reporting organizations with evaluating whether transactions should be accounted for as acquisitions or disposals of assets or businesses. The Update will be effective for the Company beginning January 1, 2018. The amendments will be applied prospectively on or after the effective date. Early application of the amendments in this Update is allowed for transactions, including when a subsidiary or group of assets is deconsolidated/derecognized, in which the acquisition date occurs before the issuance date or effective date of the amendments, only when the transaction has not been reported in financial statements that have been issued or made available for issuance. The adoption of this standard is not expected to have a material impact on the Company’s financial statements.
FASB ASC Topic 350 “Intangibles-Goodwill and Other: Simplifying the Test for Goodwill Impairment” Update No. 2017-04. The FASB issued Update No. 2017-04 in January 2017. This Update simplifies how an entity is required to test goodwill for impairment by eliminating Step 2 from the goodwill impairment test. Therefore, any carrying amount which exceeds the reporting unit’s fair value, up to the amount of goodwill recorded, will be recognized as an impairment loss.
Update 2017-04 will be effective for the Company on January 1, 2020. The amendments will be applied prospectively on or after the effective date. Early adoption is permitted for interim or annual goodwill impairment tests performed on testing dates after January 1, 2017. Based on recent goodwill impairments tests, which did not require the application of Step 2, the Company does not expect the adoption of this ASU to have an immediate impact.
FASB ASC Topic 230 “Statement of Cash Flows – Classification of Certain Cash Receipts and Cash Payments” Update No. 2016-15. The FASB issued Update No. 2016-15 in August 2016. The amendments in the Update address eight specific cash flow issues with the objective of reducing the existing diversity in practice, as the issues are either unclear or do not have specific guidance under current GAAP.
Update 2016-15 will be effective for the Company on January 1, 2018. The adoption of this standard is not expected to have a material impact on the Company’s consolidated statement of cash flows.
79
INVESTAR HOLDING CORPORATION
Notes to Consolidated Financial Statements
FASB ASC Topic 326 “Financial Instruments – Credit Losses: Measurement of Credit Losses on Financial Instruments” Update No. 2016-13. The FASB issued Update No. 2016-13 in June 2016. The amendments introduce an impairment model that is based on expected credit losses, rather than incurred losses, to estimate credit losses on certain types of financial instruments (e.g., loans and held-to-maturity securities), including certain off-balance sheet financial instruments (e.g., loan commitments). The expected credit losses should consider historical information, current information, and reasonable and supportable forecasts, including estimates of prepayments, over the contractual term. Financial instruments with similar risk characteristics may be grouped together when estimating expected credit losses. The Update also amends the current AFS security impairment model for debt securities. The new model will require an estimate of expected credit losses when the fair value is below the amortized cost of the asset through the use of an allowance to record estimated credit losses (and subsequent recoveries). Non-credit related losses will continue to be recognized through other comprehensive income. In addition, the amendments provide for a simplified accounting model for purchased financial assets with a more-than-insignificant amount of credit deterioration since their origination. The initial estimate of expected credit losses would be recognized through an allowance for loan losses with an offset (i.e., increase) to the cost basis of the related financial asset at acquisition.
Update 2016-13 will be effective for the Company beginning January 1, 2020. The amendments will be applied through a modified-retrospective approach, resulting in a cumulative-effect adjustment to retained earnings as of the beginning of the first reporting period in which the guidance is effective. A prospective transition approach is required for debt securities for which other-than-temporary impairment had been recognized before the effective date. Amounts previously recognized in accumulated other comprehensive income as of the date of adoption that relate to improvements in cash flows expected to be collected should continue to be accreted into income over the remaining life of the asset. Recoveries of amounts previously written off relating to improvements in cash flows after the date of adoption should be recorded in earnings when received.
Management is currently evaluating the potential impact of Update 2016-13 on the Company’s consolidated financial statements.
FASB ASC Topic 718 “Compensation – Stock Compensation: Improvements to Employee Share-Based Payment Accounting” Update No. 2016-09. The FASB issued Update No. 2016-09 in March 2016 as part of its simplification initiative. The amendments will require recognition of excess tax benefits and deficiencies associated with awards which vest or settle within income tax expense or benefit in the statement of comprehensive income, with the tax effects treated as discrete items in the reporting period in which they occur. The Update further requires entities to recognize excess tax benefits regardless of whether the benefit reduces taxes payable in the current period. This will eliminate the current Surplus pool concept. The amendments will also allow an accounting policy election to account for forfeitures as they occur, permit an entity to withhold up to the maximum statutory tax rates in the applicable jurisdictions while still qualifying for equity classification, and change the classification of certain cash flows associated with stock compensation. The amendments in the Update are effective for the Company beginning January 1, 2017. The adoption of this standard is not expected to have a material impact on the Company’s consolidated financial statements.
FASB ASC Topic 323 “Investments – Equity Method and Joint Ventures” Update No. 2016-07. The FASB issued Update No. 2016-07 in March 2016 as part of its simplification initiative. The amendments in the Update eliminate the requirement that when an investment qualifies for use of the equity method as a result of an increase in the level of ownership interest or degree of influence, an investor must adjust the investment, results of operations, and retained earnings retroactively on a step-by-step basis as if the equity method had been in effect during all previous periods that the investment had been held. The amendments require that the equity method investor add the cost of acquiring the additional interest in the investee to the current basis of the investor’s previously held interest and adopt the equity method of accounting as of the date the investment becomes qualified for equity method accounting. In addition, the amendments in this Update require that an entity that has an equity security classified as available for sale that becomes qualified for the equity method of accounting recognize through earnings the unrealized holding gain or loss in accumulated other comprehensive income at the date the investment becomes qualified for use of the equity method.
The amendments in the Update are effective for the Company beginning January 1, 2017. The adoption of this standard is not expected to have a material impact on the Company’s consolidated financial statements.
80
INVESTAR HOLDING CORPORATION
Notes to Consolidated Financial Statements
FASB ASC Topic 825 “Financial Instruments – Overall” Update No. 2016-01. The FASB issued Update No. 2016-01 in January 2016 to address certain aspects of recognition, measurement, presentation, and disclosure of financial instruments. The Update will not change the guidance for classifying and measuring investments in debt securities or loans; however, it will impact how entities measure certain equity investments, recognize changes in the fair value of financial liabilities measured under the fair value option that are attributable to instrument-specific credit risk, and disclose and present financial assets and liabilities in financial statements. The main provisions require investments in equity securities to be measured at fair value through net income, unless they qualify for a new practicability exception, the equity method of accounting, or consolidation, and require fair value changes arising from changes in instrument-specific credit risk for financial liabilities that are measured under the fair value option to be recognized in other comprehensive income. The amendments will also require entities to present financial assets and financial liabilities separately, grouped by measurement category and form of financial asset in the statement of financial position or in the accompanying notes to the financial statements. Entities will also no longer have to disclose the methods and significant assumptions for financial instruments measured at amortized cost, but will be required to measure such instruments under the “exit price” notion for disclosure purposes.
The amendments in this Update are effective for the Company beginning January 1, 2018. The Company will record a cumulative-effect adjustment to beginning retained earnings as of the beginning of the first reporting period in which the guidance is adopted, with two exceptions. The amendments related to equity investments without readily determinable fair values will be effective prospectively. The requirement to use the exit price notion to measure fair value of financial instruments for disclosure purposes will also be applied prospectively.
The Company does not expect a significant cumulative-effect adjustment to be recorded at adoption or any significant impact to the consolidated financial statements associated with the accounting for its current equity investments. The Company does anticipate financial statement disclosures to be impacted, specifically related to financial instruments measured at amortized cost whose fair values are disclosed under the “entry price” notion, but is currently still in the process of determining the impact.
FASB ASC Topic 606 “Revenue from Contracts with Customers” Update No. 2014-09. The FASB issued Update No. 2014-09 in May 2014 which implements a common revenue standard and clarifies the principles used for recognizing revenue. The amendments in the Update clarify that an entity should recognize revenue to depict the transfer of promised goods or services to customers in an amount that reflects the consideration to which the entity expects to be entitled in exchange for those goods or services. As part of that principle, the entity should identify the contract(s) with the customer, identify the performance obligation(s) of the contract, determine the transaction price, allocate that transaction price to the performance obligation(s), and then recognize revenue when or as the entity satisfies the performance obligation(s). The amendments also provide additional guidance/principles associated with gross vs. net presentation (i.e., principal versus agency considerations).
The amendments in Update No. 2014-09 will be effective for the Company beginning January 1, 2018. Earlier application is permitted only as of annual reporting periods beginning after December 15, 2016, including interim reporting periods within that annual reporting period. The amendments will be applied through the election of one of two retrospective methods.
The Company intends to adopt the amendments beginning January 1, 2018 and does not expect to recognize a significant cumulative adjustment to equity upon implementation of the standard. Further, the Company does not expect a significant impact to the Company’s consolidated statements of comprehensive income or consolidated balance sheets from either a presentation or timing perspective, but is still analyzing some contracts.
NOTE 2. INVESTMENT SECURITIES
The amortized cost and approximate fair value of investment securities classified as available for sale are summarized below as of the dates presented (dollars in thousands).
|
|
|
|
|
|
|
Gross |
|
|
Gross |
|
|
|
|
|
||
|
|
|
Amortized |
|
|
Unrealized |
|
|
Unrealized |
|
|
Fair |
|
||||
|
December 31, 2016 |
|
Cost |
|
|
Gains |
|
|
Losses |
|
|
Value |
|
||||
|
Obligations of other U.S. government agencies and corporations |
|
$ |
29,809 |
|
|
$ |
68 |
|
|
$ |
(387 |
) |
|
$ |
29,490 |
|
|
Obligations of state and political subdivisions |
|
|
29,631 |
|
|
|
15 |
|
|
|
(1,791 |
) |
|
|
27,855 |
|
|
Corporate bonds |
|
|
15,292 |
|
|
|
54 |
|
|
|
(378 |
) |
|
|
14,968 |
|
|
Residential mortgage-backed securities |
|
|
88,295 |
|
|
|
193 |
|
|
|
(900 |
) |
|
|
87,588 |
|
|
Commercial mortgage-backed securities |
|
|
2,520 |
|
|
|
- |
|
|
|
(76 |
) |
|
|
2,444 |
|
|
Equity securities |
|
|
711 |
|
|
|
46 |
|
|
|
(51 |
) |
|
|
706 |
|
|
Total available for sale securities |
|
$ |
166,258 |
|
|
$ |
376 |
|
|
$ |
(3,583 |
) |
|
$ |
163,051 |
|
81
INVESTAR HOLDING CORPORATION
Notes to Consolidated Financial Statements
|
|
|
|
|
|
|
Gross |
|
|
Gross |
|
|
|
|
|
||
|
|
|
Amortized |
|
|
Unrealized |
|
|
Unrealized |
|
|
Fair |
|
||||
|
December 31, 2015 |
|
Cost |
|
|
Gains |
|
|
Losses |
|
|
Value |
|
||||
|
Obligations of other U.S. government agencies and corporations |
|
$ |
26,502 |
|
|
$ |
73 |
|
|
$ |
(102 |
) |
|
$ |
26,473 |
|
|
Obligations of state and political subdivisions |
|
|
21,365 |
|
|
|
125 |
|
|
|
(23 |
) |
|
|
21,467 |
|
|
Corporate bonds |
|
|
15,069 |
|
|
|
1 |
|
|
|
(246 |
) |
|
|
14,824 |
|
|
Residential mortgage-backed securities |
|
|
47,703 |
|
|
|
72 |
|
|
|
(249 |
) |
|
|
47,526 |
|
|
Commercial mortgage-backed securities |
|
|
2,005 |
|
|
|
- |
|
|
|
(16 |
) |
|
|
1,989 |
|
|
Equity securities |
|
|
1,184 |
|
|
|
8 |
|
|
|
(100 |
) |
|
|
1,092 |
|
|
Total available for sale securities |
|
$ |
113,828 |
|
|
$ |
279 |
|
|
$ |
(736 |
) |
|
$ |
113,371 |
|
The amortized cost and approximate fair value of investment securities classified as held to maturity are summarized below as of the dates presented (dollars in thousands).
|
|
|
|
|
|
|
Gross |
|
|
Gross |
|
|
|
|
|
||
|
|
|
Amortized |
|
|
Unrealized |
|
|
Unrealized |
|
|
Fair |
|
||||
|
December 31, 2016 |
|
Cost |
|
|
Gains |
|
|
Losses |
|
|
Value |
|
||||
|
Obligations of state and political subdivisions |
|
$ |
12,976 |
|
|
$ |
2 |
|
|
$ |
(429 |
) |
|
$ |
12,549 |
|
|
Residential mortgage-backed securities |
|
|
7,115 |
|
|
|
8 |
|
|
|
(60 |
) |
|
|
7,063 |
|
|
Total held to maturity securities |
|
$ |
20,091 |
|
|
$ |
10 |
|
|
$ |
(489 |
) |
|
$ |
19,612 |
|
|
|
|
|
|
|
|
Gross |
|
|
Gross |
|
|
|
|
|
||
|
|
|
Amortized |
|
|
Unrealized |
|
|
Unrealized |
|
|
Fair |
|
||||
|
December 31, 2015 |
|
Cost |
|
|
Gains |
|
|
Losses |
|
|
Value |
|
||||
|
Obligations of other U.S. government agencies and corporations |
|
$ |
3,987 |
|
|
$ |
- |
|
|
$ |
(64 |
) |
|
$ |
3,923 |
|
|
Obligations of state and political subdivisions |
|
|
14,048 |
|
|
|
18 |
|
|
|
(5 |
) |
|
|
14,061 |
|
|
Residential mortgage-backed securities |
|
|
8,373 |
|
|
|
5 |
|
|
|
(91 |
) |
|
|
8,287 |
|
|
Total held to maturity securities |
|
$ |
26,408 |
|
|
$ |
23 |
|
|
$ |
(160 |
) |
|
$ |
26,271 |
|
The aggregate fair values and aggregate unrealized losses on securities whose fair values are below book values are summarized below. Due to the nature of the investment and current market prices, these unrealized losses are considered a temporary impairment of the securities.
The following table presents, by type and number of securities, the age of gross unrealized losses and fair value by investment category for securities available for sale as of the dates presented (dollars in thousands).
|
|
|
|
|
|
|
Less than 12 Months |
|
|
12 Months or More |
|
|
Total |
|
|||||||||||||||
|
|
|
|
|
|
|
|
|
|
|
Unrealized |
|
|
|
|
|
|
Unrealized |
|
|
|
|
|
|
Unrealized |
|
|||
|
December 31, 2016 |
|
Count |
|
|
Fair Value |
|
|
Losses |
|
|
Fair Value |
|
|
Losses |
|
|
Fair Value |
|
|
Losses |
|
|||||||
|
Obligations of other U.S. government agencies and corporations |
|
|
45 |
|
|
$ |
22,819 |
|
|
$ |
(382 |
) |
|
$ |
448 |
|
|
$ |
(5 |
) |
|
$ |
23,267 |
|
|
$ |
(387 |
) |
|
Obligations of state and political subdivisions |
|
|
33 |
|
|
|
25,764 |
|
|
|
(1,791 |
) |
|
|
- |
|
|
|
- |
|
|
|
25,764 |
|
|
|
(1,791 |
) |
|
Corporate bonds |
|
|
27 |
|
|
|
3,724 |
|
|
|
(132 |
) |
|
|
6,929 |
|
|
|
(246 |
) |
|
|
10,653 |
|
|
|
(378 |
) |
|
Residential mortgage-backed securities |
|
|
110 |
|
|
|
60,433 |
|
|
|
(883 |
) |
|
|
1,778 |
|
|
|
(17 |
) |
|
|
62,211 |
|
|
|
(900 |
) |
|
Commercial mortgage-backed securities |
|
|
4 |
|
|
|
2,444 |
|
|
|
(76 |
) |
|
|
- |
|
|
|
- |
|
|
|
2,444 |
|
|
|
(76 |
) |
|
Equity securities |
|
|
3 |
|
|
|
50 |
|
|
|
(4 |
) |
|
|
492 |
|
|
|
(47 |
) |
|
|
542 |
|
|
|
(51 |
) |
|
Total |
|
|
222 |
|
|
$ |
115,234 |
|
|
$ |
(3,268 |
) |
|
$ |
9,647 |
|
|
$ |
(315 |
) |
|
$ |
124,881 |
|
|
$ |
(3,583 |
) |
82
INVESTAR HOLDING CORPORATION
Notes to Consolidated Financial Statements
|
|
|
|
|
|
|
Less than 12 Months |
|
|
12 Months or More |
|
|
Total |
|
|||||||||||||||
|
|
|
|
|
|
|
|
|
|
|
Unrealized |
|
|
|
|
|
|
Unrealized |
|
|
|
|
|
|
Unrealized |
|
|||
|
December 31, 2015 |
|
Count |
|
|
Fair Value |
|
|
Losses |
|
|
Fair Value |
|
|
Losses |
|
|
Fair Value |
|
|
Losses |
|
|||||||
|
Obligations of other U.S. government agencies and corporations |
|
|
28 |
|
|
$ |
14,792 |
|
|
$ |
(93 |
) |
|
$ |
592 |
|
|
$ |
(9 |
) |
|
$ |
15,384 |
|
|
$ |
(102 |
) |
|
Obligations of state and political subdivisions |
|
|
14 |
|
|
|
2,312 |
|
|
|
(11 |
) |
|
|
1,322 |
|
|
|
(12 |
) |
|
|
3,634 |
|
|
|
(23 |
) |
|
Corporate bonds |
|
|
29 |
|
|
|
10,888 |
|
|
|
(222 |
) |
|
|
1,225 |
|
|
|
(24 |
) |
|
|
12,113 |
|
|
|
(246 |
) |
|
Residential mortgage-backed securities |
|
|
62 |
|
|
|
31,836 |
|
|
|
(245 |
) |
|
|
326 |
|
|
|
(4 |
) |
|
|
32,162 |
|
|
|
(249 |
) |
|
Commercial mortgage-backed securities |
|
|
3 |
|
|
|
1,989 |
|
|
|
(16 |
) |
|
|
- |
|
|
|
- |
|
|
|
1,989 |
|
|
|
(16 |
) |
|
Equity securities |
|
|
8 |
|
|
|
517 |
|
|
|
(79 |
) |
|
|
485 |
|
|
|
(21 |
) |
|
|
1,002 |
|
|
|
(100 |
) |
|
Total |
|
|
144 |
|
|
$ |
62,334 |
|
|
$ |
(666 |
) |
|
$ |
3,950 |
|
|
$ |
(70 |
) |
|
$ |
66,284 |
|
|
$ |
(736 |
) |
The following table presents, by type and number of securities, the age of gross unrealized losses and fair value by investment category for securities held to maturity as of the dates presented (dollars in thousands).
|
|
|
|
|
|
|
Less than 12 Months |
|
|
12 Months or More |
|
|
Total |
|
|||||||||||||||
|
|
|
|
|
|
|
|
|
|
|
Unrealized |
|
|
|
|
|
|
Unrealized |
|
|
|
|
|
|
Unrealized |
|
|||
|
December 31, 2016 |
|
Count |
|
|
Fair Value |
|
|
Losses |
|
|
Fair Value |
|
|
Losses |
|
|
Fair Value |
|
|
Losses |
|
|||||||
|
Obligations of state and political subdivisions |
|
|
5 |
|
|
$ |
9,597 |
|
|
$ |
(429 |
) |
|
$ |
- |
|
|
$ |
- |
|
|
$ |
9,597 |
|
|
$ |
(429 |
) |
|
Residential mortgage-backed securities |
|
|
6 |
|
|
|
4,677 |
|
|
|
(60 |
) |
|
|
- |
|
|
|
- |
|
|
|
4,677 |
|
|
|
(60 |
) |
|
Total |
|
|
11 |
|
|
$ |
14,274 |
|
|
$ |
(489 |
) |
|
$ |
- |
|
|
$ |
- |
|
|
$ |
14,274 |
|
|
$ |
(489 |
) |
|
|
|
|
|
|
|
Less than 12 Months |
|
|
12 Months or More |
|
|
Total |
|
|||||||||||||||
|
|
|
|
|
|
|
|
|
|
|
Unrealized |
|
|
|
|
|
|
Unrealized |
|
|
|
|
|
|
Unrealized |
|
|||
|
December 31, 2015 |
|
Count |
|
|
Fair Value |
|
|
Losses |
|
|
Fair Value |
|
|
Losses |
|
|
Fair Value |
|
|
Losses |
|
|||||||
|
Obligations of other U.S. government agencies and corporations |
|
|
2 |
|
|
$ |
1,958 |
|
|
$ |
(36 |
) |
|
$ |
1,965 |
|
|
$ |
(28 |
) |
|
$ |
3,923 |
|
|
$ |
(64 |
) |
|
Obligations of state and political subdivisions |
|
|
1 |
|
|
|
6,862 |
|
|
|
(5 |
) |
|
|
- |
|
|
|
- |
|
|
|
6,862 |
|
|
|
(5 |
) |
|
Residential mortgage-backed securities |
|
|
7 |
|
|
|
4,469 |
|
|
|
(37 |
) |
|
|
1,932 |
|
|
|
(54 |
) |
|
|
6,401 |
|
|
|
(91 |
) |
|
Total |
|
|
10 |
|
|
$ |
13,289 |
|
|
$ |
(78 |
) |
|
$ |
3,897 |
|
|
$ |
(82 |
) |
|
$ |
17,186 |
|
|
$ |
(160 |
) |
The unrealized losses in the Bank’s investment portfolio, caused by interest rate increases, are not credit issues. The Bank does not intend to sell the securities and it is not more likely than not that the Bank will be required to sell the investments before recovery of their amortized cost bases. The Bank does not consider these securities to be other-than-temporarily impaired at December 31, 2016 or December 31, 2015.
The weighted average tax equivalent yield, amortized cost and approximate fair value of investment debt securities, by contractual maturity (including mortgage-backed securities), are shown below as of the dates presented (dollars in thousands). Actual maturities will differ from contractual maturities because borrowers may have the right to call or prepay obligations with or without call or prepayment penalties.
|
|
|
Securities Available For Sale |
|
|
Securities Held To Maturity |
|
||||||||||||||||||
|
|
|
Weighted |
|
|
|
|
|
|
|
|
|
|
Weighted |
|
|
|
|
|
|
|
|
|
||
|
|
|
Average T.E. |
|
|
Amortized |
|
|
Fair |
|
|
Average T.E. |
|
|
Amortized |
|
|
Fair |
|
||||||
|
December 31, 2016 |
|
Yield |
|
|
Cost |
|
|
Value |
|
|
Yield |
|
|
Cost |
|
|
Value |
|
||||||
|
Due within one year |
|
|
1.61 |
% |
|
$ |
1,753 |
|
|
$ |
1,750 |
|
|
|
7.17 |
% |
|
$ |
685 |
|
|
$ |
686 |
|
|
Due after one year through five years |
|
|
2.27 |
|
|
|
10,509 |
|
|
|
10,476 |
|
|
|
7.17 |
|
|
|
3,095 |
|
|
|
3,089 |
|
|
Due after five years through ten years |
|
|
2.77 |
|
|
|
27,173 |
|
|
|
26,771 |
|
|
|
7.17 |
|
|
|
2,745 |
|
|
|
2,637 |
|
|
Due after ten years |
|
|
2.51 |
|
|
|
126,112 |
|
|
|
123,348 |
|
|
|
3.52 |
|
|
|
13,566 |
|
|
|
13,200 |
|
|
Total debt securities |
|
|
|
|
|
$ |
165,547 |
|
|
$ |
162,345 |
|
|
|
|
|
|
$ |
20,091 |
|
|
$ |
19,612 |
|
83
INVESTAR HOLDING CORPORATION
Notes to Consolidated Financial Statements
|
|
|
Securities Available For Sale |
|
|
Securities Held To Maturity |
|
||||||||||||||||||
|
|
|
Weighted |
|
|
|
|
|
|
|
|
|
|
Weighted |
|
|
|
|
|
|
|
|
|
||
|
|
|
Average T.E. |
|
|
Amortized |
|
|
Fair |
|
|
Average T.E. |
|
|
Amortized |
|
|
Fair |
|
||||||
|
December 31, 2015 |
|
Yield |
|
|
Cost |
|
|
Value |
|
|
Yield |
|
|
Cost |
|
|
Value |
|
||||||
|
Due within one year |
|
|
- |
% |
|
$ |
- |
|
|
$ |
- |
|
|
|
7.17 |
% |
|
$ |
655 |
|
|
$ |
657 |
|
|
Due after one year through five years |
|
|
2.01 |
|
|
|
9,979 |
|
|
|
9,984 |
|
|
|
7.17 |
|
|
|
2,950 |
|
|
|
2,958 |
|
|
Due after five years through ten years |
|
|
2.81 |
|
|
|
23,662 |
|
|
|
23,494 |
|
|
|
7.17 |
|
|
|
3,575 |
|
|
|
3,584 |
|
|
Due after ten years |
|
|
2.63 |
|
|
|
79,003 |
|
|
|
78,801 |
|
|
|
3.17 |
|
|
|
19,228 |
|
|
|
19,072 |
|
|
Total debt securities |
|
|
|
|
|
$ |
112,644 |
|
|
$ |
112,279 |
|
|
|
|
|
|
$ |
26,408 |
|
|
$ |
26,271 |
|
NOTE 3. LOANS
The Company’s loan portfolio, excluding loans held for sale, consists of the following categories of loans as of the dates presented (dollars in thousands).
|
|
December 31, |
|
|||||
|
|
2016 |
|
|
2015 |
|
||
|
Construction and development |
$ |
90,737 |
|
|
$ |
81,863 |
|
|
1-4 Family |
|
177,205 |
|
|
|
156,300 |
|
|
Multifamily |
|
42,759 |
|
|
|
29,694 |
|
|
Farmland |
|
8,207 |
|
|
|
2,955 |
|
|
Commercial real estate |
|
380,716 |
|
|
|
288,583 |
|
|
Total mortgage loans on real estate |
|
699,624 |
|
|
|
559,395 |
|
|
Commercial and industrial |
|
85,377 |
|
|
|
69,961 |
|
|
Consumer |
|
108,425 |
|
|
|
116,085 |
|
|
Total loans |
$ |
893,426 |
|
|
$ |
745,441 |
|
The table below provides an analysis of the aging of loans as of the dates presented (dollars in thousands).
|
|
December 31, 2016 |
|
|||||||||||||||||||||||||
|
|
Past Due and Accruing |
|
|
|
|
|
|
|
|
|
|
|
|
|
|
|
|
|
|||||||||
|
|
|
|
|
|
|
|
|
|
|
|
|
|
|
|
|
|
Total Past |
|
|
|
|
|
|
|
|
|
|
|
|
|
|
|
|
|
|
|
|
90 or more |
|
|
|
|
|
|
Due & |
|
|
|
|
|
|
|
|
|
||
|
|
30-59 days |
|
|
60-89 days |
|
|
days |
|
|
Nonaccrual |
|
|
Nonaccrual |
|
|
Current |
|
|
Total Loans |
|
|||||||
|
Construction and development |
$ |
48 |
|
|
$ |
- |
|
|
$ |
- |
|
|
$ |
480 |
|
|
$ |
528 |
|
|
$ |
90,209 |
|
|
$ |
90,737 |
|
|
1-4 Family |
|
427 |
|
|
|
- |
|
|
|
- |
|
|
|
47 |
|
|
|
474 |
|
|
|
176,731 |
|
|
|
177,205 |
|
|
Multifamily |
|
- |
|
|
|
- |
|
|
|
- |
|
|
|
- |
|
|
|
- |
|
|
|
42,759 |
|
|
|
42,759 |
|
|
Farmland |
|
- |
|
|
|
- |
|
|
|
- |
|
|
|
- |
|
|
|
- |
|
|
|
8,207 |
|
|
|
8,207 |
|
|
Commercial real estate |
|
- |
|
|
|
- |
|
|
|
- |
|
|
|
- |
|
|
|
- |
|
|
|
380,716 |
|
|
|
380,716 |
|
|
Total mortgage loans on real estate |
|
475 |
|
|
|
- |
|
|
|
- |
|
|
|
527 |
|
|
|
1,002 |
|
|
|
698,622 |
|
|
|
699,624 |
|
|
Commercial and industrial |
|
30 |
|
|
|
- |
|
|
|
- |
|
|
|
443 |
|
|
|
473 |
|
|
|
84,904 |
|
|
|
85,377 |
|
|
Consumer |
|
378 |
|
|
|
149 |
|
|
|
1 |
|
|
|
1,008 |
|
|
|
1,536 |
|
|
|
106,889 |
|
|
|
108,425 |
|
|
Total loans |
$ |
883 |
|
|
$ |
149 |
|
|
$ |
1 |
|
|
$ |
1,978 |
|
|
$ |
3,011 |
|
|
$ |
890,415 |
|
|
$ |
893,426 |
|
84
INVESTAR HOLDING CORPORATION
Notes to Consolidated Financial Statements
|
December 31, 2015 |
|
||||||||||||||||||||||||||
|
|
Past Due and Accruing |
|
|
|
|
|
|
|
|
|
|
|
|
|
|
|
|
|
|||||||||
|
|
|
|
|
|
|
|
|
|
|
|
|
|
|
|
|
|
Total Past |
|
|
|
|
|
|
|
|
|
|
|
|
|
|
|
|
|
|
|
|
90 or more |
|
|
|
|
|
|
Due & |
|
|
|
|
|
|
|
|
|
||
|
|
30-59 days |
|
|
60-89 days |
|
|
days |
|
|
Nonaccrual |
|
|
Nonaccrual |
|
|
Current |
|
|
Total Loans |
|
|||||||
|
Construction and development |
$ |
129 |
|
|
$ |
- |
|
|
$ |
- |
|
|
$ |
1,061 |
|
|
$ |
1,190 |
|
|
$ |
80,673 |
|
|
$ |
81,863 |
|
|
1-4 Family |
|
222 |
|
|
|
- |
|
|
|
- |
|
|
|
538 |
|
|
|
760 |
|
|
|
155,540 |
|
|
|
156,300 |
|
|
Multifamily |
|
- |
|
|
|
- |
|
|
|
- |
|
|
|
- |
|
|
|
- |
|
|
|
29,694 |
|
|
|
29,694 |
|
|
Farmland |
|
- |
|
|
|
- |
|
|
|
- |
|
|
|
- |
|
|
|
- |
|
|
|
2,955 |
|
|
|
2,955 |
|
|
Commercial real estate |
|
- |
|
|
|
- |
|
|
|
- |
|
|
|
97 |
|
|
|
97 |
|
|
|
288,486 |
|
|
|
288,583 |
|
|
Total mortgage loans on real estate |
|
351 |
|
|
|
- |
|
|
|
- |
|
|
|
1,696 |
|
|
|
2,047 |
|
|
|
557,348 |
|
|
|
559,395 |
|
|
Commercial and industrial |
|
26 |
|
|
|
1,779 |
|
|
|
- |
|
|
|
- |
|
|
|
1,805 |
|
|
|
68,156 |
|
|
|
69,961 |
|
|
Consumer |
|
292 |
|
|
|
179 |
|
|
|
- |
|
|
|
715 |
|
|
|
1,186 |
|
|
|
114,899 |
|
|
|
116,085 |
|
|
Total loans |
$ |
669 |
|
|
$ |
1,958 |
|
|
$ |
- |
|
|
$ |
2,411 |
|
|
$ |
5,038 |
|
|
$ |
740,403 |
|
|
$ |
745,441 |
|
The total December 31, 2016 balance in the table above includes approximately $28.8 million of acquired loans that were recorded at fair value as of the acquisition dates. Included in the acquired loan balances as of December 31, 2016 were approximately $0.3 million in loans 30-59 days past due and $0.5 million in nonaccrual loans.
The total December 31, 2015 balance in the table above includes approximately $37.0 million of acquired loans that were recorded at fair value as of the acquisition dates. Included in the acquired loan balances as of December 31, 2015 were approximately $0.2 million in loans 30-59 days past due and $1.1 million in nonaccrual loans.
Credit Quality Indicators
Loans are categorized into risk categories based on relevant information about the ability of borrowers to service their debt, such as current financial information, historical payment experience, credit documentation, public information, and current economic trends, among other factors. The following definitions are utilized for risk ratings, which are consistent with the definitions used in supervisory guidance:
Pass – Loans not meeting the criteria below are considered pass. These loans have high credit characteristics and financial strength. The borrowers at least generate profits and cash flow that are in line with peer and industry standards and have debt service coverage ratios above loan covenants and our policy guidelines. For some of these loans, a guaranty from a financially capable party mitigates characteristics of the borrower that might otherwise result in a lower grade.
Special Mention – Loans classified as special mention possess some credit deficiencies that need to be corrected to avoid a greater risk of default in the future. For example, financial ratios relating to the borrower may have deteriorated. Often, a special mention categorization is temporary while certain factors are analyzed or matters addressed before the loan is re-categorized as either pass or substandard.
Substandard – Loans classified as substandard are inadequately protected by the current net worth and paying capacity of the borrower or the liquidation value of any collateral. If deficiencies are not addressed, it is likely that this category of loan will result in the Bank incurring a loss. Where a borrower has been unable to adjust to industry or general economic conditions, the borrower’s loan is often categorized as substandard.
Doubtful – Loans classified as doubtful have all the weaknesses inherent in those classified as substandard, with the added characteristic that the weaknesses make collection or liquidation in full, on the basis of currently existing facts, conditions, and values, highly questionable and improbable.
Loss – Loans classified as loss are considered uncollectible and of such little value that their continuance as recorded assets is not warranted. This classification does not mean that the assets have absolutely no recovery or salvage value, but rather it is not practical or desirable to defer writing off these assets.
85
INVESTAR HOLDING CORPORATION
Notes to Consolidated Financial Statements
The tables below present a summary of the Company’s loan portfolio by credit quality indicator as of the dates presented (dollars in thousands).
|
|
December 31, 2016 |
|
|||||||||||||
|
|
|
|
|
|
Special |
|
|
|
|
|
|
|
|
|
|
|
|
Pass |
|
|
Mention |
|
|
Substandard |
|
|
Total |
|
||||
|
Construction and development |
$ |
90,238 |
|
|
$ |
- |
|
|
$ |
499 |
|
|
$ |
90,737 |
|
|
1-4 Family |
|
177,091 |
|
|
|
20 |
|
|
|
94 |
|
|
|
177,205 |
|
|
Multifamily |
|
42,759 |
|
|
|
- |
|
|
|
- |
|
|
|
42,759 |
|
|
Farmland |
|
8,207 |
|
|
|
- |
|
|
|
- |
|
|
|
8,207 |
|
|
Commercial real estate |
|
380,716 |
|
|
|
- |
|
|
|
- |
|
|
|
380,716 |
|
|
Total mortgage loans on real estate |
|
699,011 |
|
|
|
20 |
|
|
|
593 |
|
|
|
699,624 |
|
|
Commercial and industrial |
|
83,215 |
|
|
|
59 |
|
|
|
2,103 |
|
|
|
85,377 |
|
|
Consumer |
|
106,916 |
|
|
|
501 |
|
|
|
1,008 |
|
|
|
108,425 |
|
|
Total loans |
$ |
889,142 |
|
|
$ |
580 |
|
|
$ |
3,704 |
|
|
$ |
893,426 |
|
86
INVESTAR HOLDING CORPORATION
Notes to Consolidated Financial Statements
|
|
December 31, 2015 |
|
|||||||||||||
|
|
|
|
|
|
Special |
|
|
|
|
|
|
|
|
|
|
|
|
Pass |
|
|
Mention |
|
|
Substandard |
|
|
Total |
|
||||
|
Construction and development |
$ |
80,759 |
|
|
$ |
15 |
|
|
$ |
1,089 |
|
|
$ |
81,863 |
|
|
1-4 Family |
|
154,741 |
|
|
|
719 |
|
|
|
840 |
|
|
|
156,300 |
|
|
Multifamily |
|
29,694 |
|
|
|
- |
|
|
|
- |
|
|
|
29,694 |
|
|
Farmland |
|
2,955 |
|
|
|
- |
|
|
|
- |
|
|
|
2,955 |
|
|
Commercial real estate |
|
287,853 |
|
|
|
- |
|
|
|
730 |
|
|
|
288,583 |
|
|
Total mortgage loans on real estate |
|
556,002 |
|
|
|
734 |
|
|
|
2,659 |
|
|
|
559,395 |
|
|
Commercial and industrial |
|
66,694 |
|
|
|
- |
|
|
|
3,267 |
|
|
|
69,961 |
|
|
Consumer |
|
114,684 |
|
|
|
647 |
|
|
|
754 |
|
|
|
116,085 |
|
|
Total loans |
$ |
737,380 |
|
|
$ |
1,381 |
|
|
$ |
6,680 |
|
|
$ |
745,441 |
|
The Company had no loans that were classified as doubtful or loss as of December 31, 2016 or 2015.
Loan participations and whole loans sold to and serviced for others are not included in the accompanying consolidated balance sheets. The balances of the participations and whole loans sold were $274.9 million and $383.7 million as of December 31, 2016 and 2015, respectively. The unpaid principal balances of these loans were approximately $319.6 million and $426.9 million at December 31, 2016 and 2015, respectively.
In the ordinary course of business, the Company makes loans to its executive officers, principal shareholders, directors and to companies in which these borrowers are principal owners. Loans outstanding to such borrowers (including companies in which they are principal owners) amounted to approximately $20.0 million and $18.0 million as of December 31, 2016 and December 31, 2015, respectively. These loans are all current and performing according to the original terms. These loans were made on substantially the same terms, including interest rate and collateral, as those prevailing at the time for comparable transactions with persons not related to the Company or the Bank and did not involve more than normal risk of collectability or present other unfavorable features.
The table below shows the aggregate amount of loans to such related parties for the years ended December 31, 2016 and 2015 (dollars in thousands).
|
|
December 31, |
|
|||||
|
|
2016 |
|
|
2015 |
|
||
|
Balance, beginning of period |
$ |
17,992 |
|
|
$ |
14,631 |
|
|
New loans |
|
5,058 |
|
|
|
6,600 |
|
|
Repayments |
|
(3,093 |
) |
|
|
(3,239 |
) |
|
Balance, end of period |
$ |
19,957 |
|
|
$ |
17,992 |
|
Loans Acquired with Deteriorated Credit Quality
The Company elected to account for certain acquired loans as acquired impaired loans under ASC 310-30 due to evidence of credit deterioration at acquisition and the probability that the Company will be unable to collect all contractually required payments.
87
INVESTAR HOLDING CORPORATION
Notes to Consolidated Financial Statements
The following table presents changes in the carrying value, net of allowance for loan losses, of acquired impaired loans, or loans accounted for under ASC 310-30, for the periods presented (dollars in thousands).
|
|
Acquired |
|
|
|
|
Impaired |
|
|
|
Carrying value, net at December 31, 2014 |
$ |
2,778 |
|
|
Accretion to interest income |
|
140 |
|
|
Net transfers from (to) nonaccretable difference to (from) accretable yield |
|
110 |
|
|
Payments received |
|
(232 |
) |
|
Charge-offs |
|
(61 |
) |
|
Transfers to real estate owned |
|
(45 |
) |
|
Carrying value, net at December 31, 2015 |
$ |
2,690 |
|
|
Accretion to interest income |
|
121 |
|
|
Net transfers from (to) nonaccretable difference to (from) accretable yield |
|
1 |
|
|
Payments received |
|
(551 |
) |
|
Charge-offs |
|
(85 |
) |
|
Carrying value, net at December 31, 2016 |
$ |
2,176 |
|
The table below shows the changes in the accretable yield on acquired impaired loans for the periods presented below (dollars in thousands).
|
|
Acquired |
|
|
|
|
Impaired |
|
|
|
Balance, year ended December 31, 2014 |
$ |
425 |
|
|
Net transfers from (to) nonaccretable difference to (from) accretable yield |
|
110 |
|
|
Accretion to interest income |
|
(140 |
) |
|
Balance, year ended December 31, 2015 |
$ |
395 |
|
|
Net transfers from (to) nonaccretable difference to (from) accretable yield |
|
1 |
|
|
Accretion to interest income |
|
(121 |
) |
|
Balance, year ended December 31, 2016 |
$ |
275 |
|
NOTE 4. ALLOWANCE FOR LOAN LOSSES
The table below shows a summary of the activity in the allowance for loan losses for the years ended December 31, 2016, 2015 and 2014 (dollars in thousands).
|
|
December 31, |
|
|||||||||
|
|
2016 |
|
|
2015 |
|
|
2014 |
|
|||
|
Balance, beginning of period |
$ |
6,128 |
|
|
$ |
4,630 |
|
|
$ |
3,380 |
|
|
Provision for loan losses |
|
2,079 |
|
|
|
1,865 |
|
|
|
1,628 |
|
|
Loans charged-off |
|
(1,228 |
) |
|
|
(630 |
) |
|
|
(459 |
) |
|
Recoveries |
|
72 |
|
|
|
263 |
|
|
|
81 |
|
|
Balance, end of period |
$ |
7,051 |
|
|
$ |
6,128 |
|
|
$ |
4,630 |
|
88
INVESTAR HOLDING CORPORATION
Notes to Consolidated Financial Statements
The following tables outline the activity in the allowance for loan losses by collateral type for the years ended December 31, 2016, 2015 and 2014, and show both the allowance and portfolio balances for loans individually and collectively evaluated for impairment as of December 31, 2016, 2015 and 2014 (dollars in thousands).
Allowance for Loan Losses and Recorded Investment in Loans Receivable
|
|
December 31, 2016 |
|
|||||||||||||||||||||||||||||
|
|
Construction & |
|
|
|
|
|
|
|
|
|
|
|
|
|
|
Commercial |
|
|
Commercial & |
|
|
|
|
|
|
|
|
|
|||
|
|
Development |
|
|
Farmland |
|
|
1-4 Family |
|
|
Multifamily |
|
|
Real Estate |
|
|
Industrial |
|
|
Consumer |
|
|
Total |
|
||||||||
|
Allowance for loan losses: |
|
|
|
|
|
|
|
|
|
|
|
|
|
|
|
|
|
|
|
|
|
|
|
|
|
|
|
|
|
|
|
|
Beginning balance |
$ |
644 |
|
|
$ |
22 |
|
|
$ |
1,213 |
|
|
$ |
246 |
|
|
$ |
2,156 |
|
|
$ |
513 |
|
|
$ |
1,334 |
|
|
$ |
6,128 |
|
|
Charge-offs |
|
(27 |
) |
|
|
- |
|
|
|
(57 |
) |
|
|
- |
|
|
|
(526 |
) |
|
|
- |
|
|
|
(618 |
) |
|
|
(1,228 |
) |
|
Recoveries |
|
14 |
|
|
|
- |
|
|
|
13 |
|
|
|
- |
|
|
|
1 |
|
|
|
20 |
|
|
|
24 |
|
|
|
72 |
|
|
Provision |
|
(52 |
) |
|
|
38 |
|
|
|
208 |
|
|
|
109 |
|
|
|
868 |
|
|
|
226 |
|
|
|
682 |
|
|
|
2,079 |
|
|
Ending balance |
$ |
579 |
|
|
$ |
60 |
|
|
$ |
1,377 |
|
|
$ |
355 |
|
|
$ |
2,499 |
|
|
$ |
759 |
|
|
$ |
1,422 |
|
|
$ |
7,051 |
|
|
Ending allowance balance for loans individually evaluated for impairment |
$ |
- |
|
|
$ |
- |
|
|
$ |
- |
|
|
$ |
- |
|
|
$ |
- |
|
|
$ |
136 |
|
|
$ |
287 |
|
|
$ |
423 |
|
|
Ending allowance balance for loans collectively evaluated for impairment |
$ |
579 |
|
|
$ |
60 |
|
|
$ |
1,377 |
|
|
$ |
355 |
|
|
$ |
2,499 |
|
|
$ |
623 |
|
|
$ |
1,135 |
|
|
$ |
6,628 |
|
|
Ending allowance balance for loans acquired with deteriorated credit quality |
$ |
- |
|
|
$ |
- |
|
|
$ |
- |
|
|
$ |
- |
|
|
$ |
- |
|
|
$ |
- |
|
|
$ |
- |
|
|
$ |
- |
|
|
Loans receivable: |
|
|
|
|
|
|
|
|
|
|
|
|
|
|
|
|
|
|
|
|
|
|
|
|
|
|
|
|
|
|
|
|
Balance of loans individually evaluated for impairment |
$ |
645 |
|
|
$ |
- |
|
|
$ |
1,673 |
|
|
$ |
- |
|
|
$ |
608 |
|
|
$ |
443 |
|
|
$ |
1,008 |
|
|
$ |
4,377 |
|
|
Balance of loans collectively evaluated for impairment |
|
90,092 |
|
|
|
8,207 |
|
|
|
175,532 |
|
|
|
42,759 |
|
|
|
380,108 |
|
|
|
84,934 |
|
|
|
107,417 |
|
|
$ |
889,049 |
|
|
Total period-end balance |
$ |
90,737 |
|
|
$ |
8,207 |
|
|
$ |
177,205 |
|
|
$ |
42,759 |
|
|
$ |
380,716 |
|
|
$ |
85,377 |
|
|
$ |
108,425 |
|
|
$ |
893,426 |
|
|
Balance of loans acquired with deteriorated credit quality |
$ |
660 |
|
|
$ |
- |
|
|
$ |
494 |
|
|
$ |
1,022 |
|
|
$ |
- |
|
|
$ |
- |
|
|
$ |
- |
|
|
$ |
2,176 |
|
89
INVESTAR HOLDING CORPORATION
Notes to Consolidated Financial Statements
|
December 31, 2015 |
|
||||||||||||||||||||||||||||||
|
|
Construction & |
|
|
|
|
|
|
|
|
|
|
|
|
|
|
Commercial |
|
|
Commercial & |
|
|
|
|
|
|
|
|
|
|||
|
|
Development |
|
|
Farmland |
|
|
1-4 Family |
|
|
Multifamily |
|
|
Real Estate |
|
|
Industrial |
|
|
Consumer |
|
|
Total |
|
||||||||
|
Allowance for loan losses: |
|
|
|
|
|
|
|
|
|
|
|
|
|
|
|
|
|
|
|
|
|
|
|
|
|
|
|
|
|
|
|
|
Beginning balance |
$ |
526 |
|
|
$ |
18 |
|
|
$ |
909 |
|
|
$ |
137 |
|
|
$ |
1,571 |
|
|
$ |
390 |
|
|
$ |
1,079 |
|
|
$ |
4,630 |
|
|
Charge-offs |
|
(17 |
) |
|
|
- |
|
|
|
(78 |
) |
|
|
- |
|
|
|
- |
|
|
|
(58 |
) |
|
|
(477 |
) |
|
|
(630 |
) |
|
Recoveries |
|
25 |
|
|
|
- |
|
|
|
12 |
|
|
|
- |
|
|
|
1 |
|
|
|
197 |
|
|
|
28 |
|
|
|
263 |
|
|
Provision |
|
110 |
|
|
|
4 |
|
|
|
370 |
|
|
|
109 |
|
|
|
584 |
|
|
|
(16 |
) |
|
|
704 |
|
|
|
1,865 |
|
|
Ending balance |
$ |
644 |
|
|
$ |
22 |
|
|
$ |
1,213 |
|
|
$ |
246 |
|
|
$ |
2,156 |
|
|
$ |
513 |
|
|
$ |
1,334 |
|
|
$ |
6,128 |
|
|
Ending allowance balance for loans individually evaluated for impairment |
$ |
- |
|
|
$ |
- |
|
|
$ |
- |
|
|
$ |
- |
|
|
$ |
- |
|
|
$ |
- |
|
|
$ |
220 |
|
|
$ |
220 |
|
|
Ending allowance balance for loans collectively evaluated for impairment |
$ |
644 |
|
|
$ |
22 |
|
|
$ |
1,213 |
|
|
$ |
246 |
|
|
$ |
2,156 |
|
|
$ |
513 |
|
|
$ |
1,114 |
|
|
$ |
5,908 |
|
|
Ending allowance balance for loans acquired with deteriorated credit quality |
$ |
- |
|
|
$ |
- |
|
|
$ |
- |
|
|
$ |
- |
|
|
$ |
- |
|
|
$ |
- |
|
|
$ |
- |
|
|
$ |
- |
|
|
Loans receivable: |
|
|
|
|
|
|
|
|
|
|
|
|
|
|
|
|
|
|
|
|
|
|
|
|
|
|
|
|
|
|
|
|
Balance of loans individually evaluated for impairment |
$ |
1,242 |
|
|
$ |
- |
|
|
$ |
1,419 |
|
|
$ |
- |
|
|
$ |
630 |
|
|
$ |
- |
|
|
$ |
754 |
|
|
$ |
4,045 |
|
|
Balance of loans collectively evaluated for impairment |
|
80,621 |
|
|
|
2,955 |
|
|
|
154,881 |
|
|
|
29,694 |
|
|
|
287,953 |
|
|
|
69,961 |
|
|
|
115,331 |
|
|
|
741,396 |
|
|
Total period-end balance |
$ |
81,863 |
|
|
$ |
2,955 |
|
|
$ |
156,300 |
|
|
$ |
29,694 |
|
|
$ |
288,583 |
|
|
$ |
69,961 |
|
|
$ |
116,085 |
|
|
$ |
745,441 |
|
|
Balance of loans acquired with deteriorated credit quality |
$ |
737 |
|
|
$ |
- |
|
|
$ |
852 |
|
|
$ |
1,062 |
|
|
$ |
- |
|
|
$ |
- |
|
|
$ |
39 |
|
|
$ |
2,690 |
|
|
|
December 31, 2014 |
|
|||||||||||||||||||||||||||||
|
|
Construction & |
|
|
|
|
|
|
|
|
|
|
|
|
|
|
Commercial |
|
|
Commercial & |
|
|
|
|
|
|
|
|
|
|||
|
|
Development |
|
|
Farmland |
|
|
1-4 Family |
|
|
Multifamily |
|
|
Real Estate |
|
|
Industrial |
|
|
Consumer |
|
|
Total |
|
||||||||
|
Allowance for loan losses: |
|
|
|
|
|
|
|
|
|
|
|
|
|
|
|
|
|
|
|
|
|
|
|
|
|
|
|
|
|
|
|
|
Beginning balance |
$ |
420 |
|
|
$ |
4 |
|
|
$ |
567 |
|
|
$ |
101 |
|
|
$ |
992 |
|
|
$ |
397 |
|
|
$ |
899 |
|
|
$ |
3,380 |
|
|
Charge-offs |
|
- |
|
|
|
- |
|
|
|
(123 |
) |
|
|
- |
|
|
|
(3 |
) |
|
|
(16 |
) |
|
|
(317 |
) |
|
|
(459 |
) |
|
Recoveries |
|
1 |
|
|
|
- |
|
|
|
4 |
|
|
|
- |
|
|
|
1 |
|
|
|
17 |
|
|
|
58 |
|
|
|
81 |
|
|
Provision |
|
105 |
|
|
|
14 |
|
|
|
461 |
|
|
|
36 |
|
|
|
581 |
|
|
|
(8 |
) |
|
|
439 |
|
|
|
1,628 |
|
|
Ending balance |
$ |
526 |
|
|
$ |
18 |
|
|
$ |
909 |
|
|
$ |
137 |
|
|
$ |
1,571 |
|
|
$ |
390 |
|
|
$ |
1,079 |
|
|
$ |
4,630 |
|
|
Ending allowance balance for loans individually evaluated for impairment |
$ |
- |
|
|
$ |
- |
|
|
$ |
- |
|
|
$ |
- |
|
|
$ |
- |
|
|
$ |
- |
|
|
$ |
70 |
|
|
$ |
70 |
|
|
Ending allowance balance for loans collectively evaluated for impairment |
$ |
526 |
|
|
$ |
18 |
|
|
$ |
909 |
|
|
$ |
137 |
|
|
$ |
1,571 |
|
|
$ |
390 |
|
|
$ |
1,009 |
|
|
$ |
4,560 |
|
|
Ending allowance balance for loans acquired with deteriorated credit quality |
$ |
- |
|
|
$ |
- |
|
|
$ |
- |
|
|
$ |
- |
|
|
$ |
- |
|
|
$ |
- |
|
|
$ |
- |
|
|
$ |
- |
|
|
Loans receivable: |
|
|
|
|
|
|
|
|
|
|
|
|
|
|
|
|
|
|
|
|
|
|
|
|
|
|
|
|
|
|
|
|
Balance of loans individually evaluated for impairment |
$ |
1,543 |
|
|
$ |
- |
|
|
$ |
837 |
|
|
$ |
- |
|
|
$ |
749 |
|
|
$ |
179 |
|
|
$ |
260 |
|
|
$ |
3,568 |
|
|
Balance of loans collectively evaluated for impairment |
|
69,807 |
|
|
|
2,919 |
|
|
|
136,682 |
|
|
|
17,458 |
|
|
|
224,309 |
|
|
|
54,008 |
|
|
|
114,039 |
|
|
|
619,222 |
|
|
Total period-end balance |
$ |
71,350 |
|
|
$ |
2,919 |
|
|
$ |
137,519 |
|
|
$ |
17,458 |
|
|
$ |
225,058 |
|
|
$ |
54,187 |
|
|
$ |
114,299 |
|
|
$ |
622,790 |
|
|
Balance of loans acquired with deteriorated credit quality |
$ |
820 |
|
|
$ |
- |
|
|
$ |
858 |
|
|
$ |
1,054 |
|
|
$ |
- |
|
|
$ |
- |
|
|
$ |
46 |
|
|
$ |
2,778 |
|
90
INVESTAR HOLDING CORPORATION
Notes to Consolidated Financial Statements
The Company considers a loan to be impaired when, based on current information and events, the Company determines that it will not be able to collect all amounts due according to the loan agreement, including scheduled interest payments. Determination of impairment is treated the same across all classes of loans. When the Company identifies a loan as impaired, it measures the impairment based on the present value of expected future cash flows, discounted at the loan’s effective interest rate, except when the sole (remaining) source of repayment for the loans is the operation or liquidation of the collateral. In these cases when foreclosure is probable, the Company uses the current fair value of the collateral, less selling costs, instead of discounted cash flows. If the Company determines that the value of the impaired loan is less than the recorded investment in the loan (net of previous charge-offs, deferred loan fees or costs and unamortized premium or discount), the Company recognizes impairment through an allowance estimate or a charge-off to the allowance.
When the ultimate collectability of the total principal of an impaired loan is in doubt and the loan is on nonaccrual, all payments are applied to principal, under the cost recovery method. When the ultimate collectability of the total principal of an impaired loan is not in doubt and the loan is on nonaccrual, contractual interest is credited to interest income when received, under the cash basis method.
The following tables include the recorded investment and unpaid principal balances for impaired loans with the associated allowance amount, if applicable. Also presented is the average recorded investment of the impaired loans and the related amount of interest recognized during the time within the period that the impaired loans were impaired. The average balances are calculated based on the month-end balances of the loans during the period reported (dollars in thousands).
|
|
As of and for the year ended December 31, 2016 |
|
|||||||||||||||||
|
|
|
|
|
|
Unpaid |
|
|
|
|
|
|
Average |
|
|
Interest |
|
|||
|
|
Recorded |
|
|
Principal |
|
|
Related |
|
|
Recorded |
|
|
Income |
|
|||||
|
|
Investment |
|
|
Balance |
|
|
Allowance |
|
|
Investment |
|
|
Recognized |
|
|||||
|
With no related allowance recorded: |
|
|
|
|
|
|
|
|
|
|
|
|
|
|
|
|
|
|
|
|
Construction and development |
$ |
645 |
|
|
$ |
661 |
|
|
$ |
- |
|
|
$ |
1,024 |
|
|
$ |
90 |
|
|
1-4 Family |
|
1,673 |
|
|
|
1,701 |
|
|
|
- |
|
|
|
1,910 |
|
|
|
66 |
|
|
Commercial real estate |
|
608 |
|
|
|
623 |
|
|
|
- |
|
|
|
1,742 |
|
|
|
7 |
|
|
Total mortgage loans on real estate |
|
2,926 |
|
|
|
2,985 |
|
|
|
- |
|
|
|
4,676 |
|
|
|
163 |
|
|
Commercial and industrial |
|
15 |
|
|
|
16 |
|
|
|
- |
|
|
|
1,509 |
|
|
|
- |
|
|
Consumer |
|
153 |
|
|
|
166 |
|
|
|
- |
|
|
|
399 |
|
|
|
11 |
|
|
Total |
|
3,094 |
|
|
|
3,167 |
|
|
|
- |
|
|
|
6,584 |
|
|
|
174 |
|
|
|
|
|
|
|
|
|
|
|
|
|
|
|
|
|
|
|
|
|
|
|
With related allowance recorded: |
|
|
|
|
|
|
|
|
|
|
|
|
|
|
|
|
|
|
|
|
Commercial and industrial |
|
428 |
|
|
|
430 |
|
|
|
136 |
|
|
|
144 |
|
|
|
- |
|
|
Consumer |
|
855 |
|
|
|
873 |
|
|
|
287 |
|
|
|
506 |
|
|
|
6 |
|
|
Total |
|
1,283 |
|
|
|
1,303 |
|
|
|
423 |
|
|
|
650 |
|
|
|
6 |
|
|
|
|
|
|
|
|
|
|
|
|
|
|
|
|
|
|
|
|
|
|
|
Total loans: |
|
|
|
|
|
|
|
|
|
|
|
|
|
|
|
|
|
|
|
|
Construction and development |
|
645 |
|
|
|
661 |
|
|
|
- |
|
|
|
1,024 |
|
|
|
90 |
|
|
1-4 Family |
|
1,673 |
|
|
|
1,701 |
|
|
|
- |
|
|
|
1,910 |
|
|
|
66 |
|
|
Commercial real estate |
|
608 |
|
|
|
623 |
|
|
|
- |
|
|
|
1,742 |
|
|
|
7 |
|
|
Total mortgage loans on real estate |
|
2,926 |
|
|
|
2,985 |
|
|
|
- |
|
|
|
4,676 |
|
|
|
163 |
|
|
Commercial and industrial |
|
443 |
|
|
|
446 |
|
|
|
136 |
|
|
|
1,653 |
|
|
|
- |
|
|
Consumer |
|
1,008 |
|
|
|
1,039 |
|
|
|
287 |
|
|
|
905 |
|
|
|
17 |
|
|
Total |
$ |
4,377 |
|
|
$ |
4,470 |
|
|
$ |
423 |
|
|
$ |
7,234 |
|
|
$ |
180 |
|
91
INVESTAR HOLDING CORPORATION
Notes to Consolidated Financial Statements
|
As of and for the year ended December 31, 2015 |
|
||||||||||||||||||
|
|
|
|
|
|
Unpaid |
|
|
|
|
|
|
Average |
|
|
Interest |
|
|||
|
|
Recorded |
|
|
Principal |
|
|
Related |
|
|
Recorded |
|
|
Income |
|
|||||
|
|
Investment |
|
|
Balance |
|
|
Allowance |
|
|
Investment |
|
|
Recognized |
|
|||||
|
With no related allowance recorded: |
|
|
|
|
|
|
|
|
|
|
|
|
|
|
|
|
|
|
|
|
Construction and development |
$ |
1,242 |
|
|
$ |
1,241 |
|
|
$ |
- |
|
|
$ |
1,349 |
|
|
$ |
17 |
|
|
1-4 Family |
|
1,419 |
|
|
|
1,416 |
|
|
|
- |
|
|
|
1,522 |
|
|
|
52 |
|
|
Commercial real estate |
|
630 |
|
|
|
629 |
|
|
|
- |
|
|
|
844 |
|
|
|
49 |
|
|
Total mortgage loans on real estate |
|
3,291 |
|
|
|
3,286 |
|
|
|
- |
|
|
|
3,715 |
|
|
|
118 |
|
|
Commercial and industrial |
|
- |
|
|
|
- |
|
|
|
- |
|
|
|
66 |
|
|
|
45 |
|
|
Consumer |
|
159 |
|
|
|
159 |
|
|
|
- |
|
|
|
266 |
|
|
|
26 |
|
|
Total |
|
3,450 |
|
|
|
3,445 |
|
|
|
- |
|
|
|
4,047 |
|
|
|
189 |
|
|
|
|
|
|
|
|
|
|
|
|
|
|
|
|
|
|
|
|
|
|
|
With related allowance recorded: |
|
|
|
|
|
|
|
|
|
|
|
|
|
|
|
|
|
|
|
|
Consumer |
|
595 |
|
|
|
595 |
|
|
|
220 |
|
|
|
210 |
|
|
|
15 |
|
|
Total |
|
595 |
|
|
|
595 |
|
|
|
220 |
|
|
|
210 |
|
|
|
15 |
|
|
|
|
|
|
|
|
|
|
|
|
|
|
|
|
|
|
|
|
|
|
|
Total loans: |
|
|
|
|
|
|
|
|
|
|
|
|
|
|
|
|
|
|
|
|
Construction and development |
|
1,242 |
|
|
|
1,241 |
|
|
|
- |
|
|
|
1,349 |
|
|
|
17 |
|
|
1-4 Family |
|
1,419 |
|
|
|
1,416 |
|
|
|
- |
|
|
|
1,522 |
|
|
|
52 |
|
|
Commercial real estate |
|
630 |
|
|
|
629 |
|
|
|
- |
|
|
|
844 |
|
|
|
49 |
|
|
Total mortgage loans on real estate |
|
3,291 |
|
|
|
3,286 |
|
|
|
- |
|
|
|
3,715 |
|
|
|
118 |
|
|
Commercial and industrial |
|
- |
|
|
|
- |
|
|
|
- |
|
|
|
66 |
|
|
|
45 |
|
|
Consumer |
|
754 |
|
|
|
754 |
|
|
|
220 |
|
|
|
476 |
|
|
|
41 |
|
|
Total |
$ |
4,045 |
|
|
$ |
4,040 |
|
|
$ |
220 |
|
|
$ |
4,257 |
|
|
$ |
204 |
|
|
|
As of and for the year ended December 31, 2014 |
|
|||||||||||||||||
|
|
|
|
|
|
Unpaid |
|
|
|
|
|
|
Average |
|
|
Interest |
|
|||
|
|
Recorded |
|
|
Principal |
|
|
Related |
|
|
Recorded |
|
|
Income |
|
|||||
|
|
Investment |
|
|
Balance |
|
|
Allowance |
|
|
Investment |
|
|
Recognized |
|
|||||
|
With no related allowance recorded: |
|
|
|
|
|
|
|
|
|
|
|
|
|
|
|
|
|
|
|
|
Construction and development |
$ |
1,543 |
|
|
$ |
1,542 |
|
|
$ |
- |
|
|
$ |
1,530 |
|
|
$ |
41 |
|
|
1-4 Family |
|
837 |
|
|
|
837 |
|
|
|
- |
|
|
|
900 |
|
|
|
30 |
|
|
Commercial real estate |
|
749 |
|
|
|
749 |
|
|
|
- |
|
|
|
764 |
|
|
|
24 |
|
|
Total mortgage loans on real estate |
|
3,129 |
|
|
|
3,128 |
|
|
|
- |
|
|
|
3,194 |
|
|
|
95 |
|
|
Commercial and industrial |
|
179 |
|
|
|
179 |
|
|
|
- |
|
|
|
312 |
|
|
|
1 |
|
|
Consumer |
|
80 |
|
|
|
79 |
|
|
|
- |
|
|
|
97 |
|
|
|
10 |
|
|
Total |
|
3,387 |
|
|
|
3,386 |
|
|
|
- |
|
|
|
3,603 |
|
|
|
106 |
|
|
|
|
|
|
|
|
|
|
|
|
|
|
|
|
|
|
|
|
|
|
|
With related allowance recorded: |
|
|
|
|
|
|
|
|
|
|
|
|
|
|
|
|
|
|
|
|
Consumer |
|
180 |
|
|
|
180 |
|
|
|
70 |
|
|
|
179 |
|
|
|
4 |
|
|
Total |
|
180 |
|
|
|
180 |
|
|
|
70 |
|
|
|
179 |
|
|
|
4 |
|
|
|
|
|
|
|
|
|
|
|
|
|
|
|
|
|
|
|
|
|
|
|
Total loans: |
|
|
|
|
|
|
|
|
|
|
|
|
|
|
|
|
|
|
|
|
Construction and development |
|
1,543 |
|
|
|
1,542 |
|
|
|
- |
|
|
|
1,530 |
|
|
|
41 |
|
|
1-4 Family |
|
837 |
|
|
|
837 |
|
|
|
- |
|
|
|
900 |
|
|
|
30 |
|
|
Commercial real estate |
|
749 |
|
|
|
749 |
|
|
|
- |
|
|
|
764 |
|
|
|
24 |
|
|
Total mortgage loans on real estate |
|
3,129 |
|
|
|
3,128 |
|
|
|
- |
|
|
|
3,194 |
|
|
|
95 |
|
|
Commercial and industrial |
|
179 |
|
|
|
179 |
|
|
|
- |
|
|
|
312 |
|
|
|
1 |
|
|
Consumer |
|
260 |
|
|
|
259 |
|
|
|
70 |
|
|
|
276 |
|
|
|
14 |
|
|
Total |
$ |
3,568 |
|
|
$ |
3,566 |
|
|
$ |
70 |
|
|
$ |
3,782 |
|
|
$ |
110 |
|
92
INVESTAR HOLDING CORPORATION
Notes to Consolidated Financial Statements
In situations where, for economic or legal reasons related to a borrower’s financial difficulties, the Company grants a concession for other than an insignificant period of time to the borrower that the Company would not otherwise consider, the related loan is classified as a troubled debt restructuring (“TDR”). The Company strives to identify borrowers in financial difficulty early and work with them to modify their loans to more affordable terms before such loans reach nonaccrual status. These modified terms may include rate reductions, principal forgiveness, payment forbearance and other actions intended to minimize the economic loss and to avoid foreclosure or repossession of the collateral. In cases where the Company grants the borrower new terms that provide for a reduction of either interest or principal, the Company measures any impairment on the restructuring as previously noted for impaired loans.
Loans classified as TDRs, consisting of eighteen credits, totaled approximately $2.4 million at December 31, 2016, compared to eleven credits totaling $2.2 million at December 31, 2015. Sixteen of the eighteen TDRs were acquired. Eight of the restructured loans were considered TDRs due to modification of terms through adjustments to maturity, nine of the restructured loans were considered TDRs due to a reduction in the interest rate to a rate lower than the current market rate, and one restructured loan was considered a TDR due to modification of terms through principal payment forbearance only for a specified period of time. As of December 31, 2016, all restructured loans were performing under their modified terms. As of December 31, 2015, three of the restructured loans with a balance of $0.5 million were in default of their modified terms and included in nonaccrual loans. The Company individually evaluates each TDR for allowance purposes, primarily based on collateral value, and excludes these loans from the loan population that is evaluated by applying qualitative factors.
The table below presents the TDR pre- and post-modification outstanding recorded investments by loan categories for loans modified during the years ended December 31, 2016 and 2015 (dollars in thousands).
|
|
|
December 31, 2016 |
|
|
December 31, 2015 |
|
||||||||||||||
|
|
|
|
|
Pre- |
|
|
Post- |
|
|
|
|
Pre- |
|
|
Post- |
|
||||
|
|
|
|
|
Modification |
|
|
Modification |
|
|
|
|
Modification |
|
|
Modification |
|
||||
|
|
|
|
|
Outstanding |
|
|
Outstanding |
|
|
|
|
Outstanding |
|
|
Outstanding |
|
||||
|
|
|
Number of |
|
Recorded |
|
|
Recorded |
|
|
Number of |
|
Recorded |
|
|
Recorded |
|
||||
|
Troubled debt restructurings |
|
Contracts |
|
Investment |
|
|
Investment |
|
|
Contracts |
|
Investment |
|
|
Investment |
|
||||
|
Construction and development |
|
- |
|
$ |
- |
|
|
$ |
- |
|
|
1 |
|
$ |
28 |
|
|
$ |
28 |
|
|
1-4 Family |
|
9 |
|
|
436 |
|
|
|
436 |
|
|
3 |
|
|
981 |
|
|
|
981 |
|
|
Commercial real estate |
|
- |
|
|
- |
|
|
|
- |
|
|
2 |
|
|
630 |
|
|
|
630 |
|
|
|
|
|
|
$ |
436 |
|
|
$ |
436 |
|
|
|
|
$ |
1,639 |
|
|
$ |
1,639 |
|
At December 31, 2016 and 2015, there were no loans modified under troubled debt restructurings during the previous twelve month period that subsequently defaulted during the years ended December 31, 2016 and 2015, respectively.
The following is a summary of accruing and nonaccrual TDRs and the related loan losses by portfolio type as of the dates presented (dollars in thousands).
|
|
TDRs |
|
|||||||||||||
|
|
|
|
|
|
|
|
|
|
|
|
|
|
|
|
|
|
|
|
|
|
|
|
|
|
|
|
|
|
|
Related |
|
|
|
|
Accruing |
|
|
Nonaccrual |
|
|
Total |
|
|
Allowance |
|
||||
|
December 31, 2016 |
|
|
|
|
|
|
|
|
|
|
|
|
|
|
|
|
Construction and development |
$ |
165 |
|
|
$ |
- |
|
|
$ |
165 |
|
|
$ |
- |
|
|
1-4 Family |
|
1,626 |
|
|
|
- |
|
|
|
1,626 |
|
|
|
- |
|
|
Commercial real estate |
|
608 |
|
|
|
- |
|
|
|
608 |
|
|
|
- |
|
|
Total |
$ |
2,399 |
|
|
$ |
- |
|
|
$ |
2,399 |
|
|
$ |
- |
|
|
|
|
|
|
|
|
|
|
|
|
|
|
|
|
|
|
|
December 31, 2015 |
|
|
|
|
|
|
|
|
|
|
|
|
|
|
|
|
Construction and development |
$ |
180 |
|
|
$ |
- |
|
|
$ |
180 |
|
|
$ |
- |
|
|
1-4 Family |
|
878 |
|
|
|
449 |
|
|
|
1,327 |
|
|
|
- |
|
|
Commercial and industrial |
|
532 |
|
|
|
97 |
|
|
|
629 |
|
|
|
- |
|
|
Consumer |
|
39 |
|
|
|
- |
|
|
|
39 |
|
|
|
|
|
|
Total |
$ |
1,629 |
|
|
$ |
546 |
|
|
$ |
2,175 |
|
|
$ |
- |
|
93
INVESTAR HOLDING CORPORATION
Notes to Consolidated Financial Statements
The table below includes the average recorded investment and interest income recognized for TDRs for the years ended December 31, 2016, 2015 and 2014 (dollars in thousands).
|
|
TDRs |
|
|||||
|
|
Average Recorded Investment |
|
|
Interest Income Recognized |
|
||
|
December 31, 2016 |
|
|
|
|
|
|
|
|
Construction and development |
$ |
171 |
|
|
$ |
13 |
|
|
1-4 Family |
|
1,614 |
|
|
|
66 |
|
|
Commercial real estate |
|
617 |
|
|
|
7 |
|
|
Total |
$ |
2,402 |
|
|
$ |
86 |
|
|
|
|
|
|
|
|
|
|
|
December 31, 2015 |
|
|
|
|
|
|
|
|
Construction and development |
$ |
181 |
|
|
$ |
13 |
|
|
1-4 Family |
|
1,240 |
|
|
|
52 |
|
|
Commercial real estate |
|
371 |
|
|
|
9 |
|
|
Consumer |
|
42 |
|
|
|
6 |
|
|
Total |
$ |
1,834 |
|
|
$ |
80 |
|
|
|
|
|
|
|
|
|
|
|
December 31, 2014 |
|
|
|
|
|
|
|
|
Construction and development |
$ |
187 |
|
|
$ |
11 |
|
|
Commercial real estate |
|
359 |
|
|
|
19 |
|
|
Commercial and industrial |
|
2 |
|
|
|
- |
|
|
Consumer |
|
48 |
|
|
|
4 |
|
|
Total |
$ |
596 |
|
|
$ |
34 |
|
NOTE 5. OTHER REAL ESTATE OWNED
The table below shows the activity in other real estate owned for the periods presented (dollars in thousands).
|
|
December 31, |
|
|||||
|
|
2016 |
|
|
2015 |
|
||
|
Balance, beginning of period |
$ |
725 |
|
|
$ |
2,735 |
|
|
Transfers from non-acquired loans |
|
3,795 |
|
|
|
950 |
|
|
Transfers from acquired loans |
|
80 |
|
|
|
55 |
|
|
Other real estate sold |
|
(528 |
) |
|
|
(2,961 |
) |
|
Write-downs |
|
(7 |
) |
|
|
(54 |
) |
|
Balance, end of period |
$ |
4,065 |
|
|
$ |
725 |
|
As of December 31, 2016 and December 31, 2015, other real estate owned related to acquisitions totaled approximately $0.3 million and $0.6 million, respectively.
NOTE 6. BANK PREMISES AND EQUIPMENT
Bank premises and equipment consisted of the following as of the dates indicated (dollars in thousands).
|
|
December 31, |
|
|||||
|
|
2016 |
|
|
2015 |
|
||
|
Land |
$ |
9,668 |
|
|
$ |
10,460 |
|
|
Buildings and improvements |
|
18,641 |
|
|
|
16,887 |
|
|
Furniture and equipment |
|
6,567 |
|
|
|
6,350 |
|
|
Software |
|
684 |
|
|
|
668 |
|
|
Construction-in-progress |
|
2,913 |
|
|
|
1,633 |
|
|
Less: Accumulated depreciation and amortization |
|
(6,751 |
) |
|
|
(5,368 |
) |
|
Bank premises and equipment, net |
$ |
31,722 |
|
|
$ |
30,630 |
|
94
INVESTAR HOLDING CORPORATION
Notes to Consolidated Financial Statements
Depreciation and amortization related to bank premises and equipment charged to noninterest expense was approximately $1.5 million, $1.4 million and $1.3 million for the years ended December 31, 2016, 2015 and 2014, respectively.
NOTE 7. GOODWILL AND OTHER INTANGIBLE ASSETS
At December 31, 2016, goodwill and intangible assets totaled $3.2 million. The Company’s intangible assets consist of goodwill and core deposits arising from acquisitions, as well as a trademark intangible that was acquired during the year ended December 31, 2016. The Company has determined that the core deposit intangible assets have finite lives and amortizes them over the useful lives of the assets.
Goodwill was acquired during the year ended December 31, 2011 as a result of the SLBB acquisition on October 1, 2011. The carrying amount of goodwill as of December 31, 2016 and 2015 was $2.7 million. The trademark intangible was acquired during the year ended December 31, 2016 and had a carrying value of $0.1 million at December 31, 2016.
In accordance with ASC 350, Intangibles-Goodwill and Other, the Company reviews the carrying value of indefinite-lived intangible assets at least annually, or more frequently if certain impairment indicators exist. The Company performed its annual impairment testing in the fourth quarter of 2016 and determined that there was no impairment to its goodwill or trademark intangible asset.
The table below shows a summary of the core deposit intangible assets activity for the periods presented (dollars in thousands).
|
|
December 31, |
|
|||||
|
|
2016 |
|
|
2015 |
|
||
|
Gross carrying amount |
$ |
617 |
|
|
$ |
617 |
|
|
Accumulated amortization |
|
(167 |
) |
|
|
(126 |
) |
|
Net carrying amount |
$ |
450 |
|
|
$ |
491 |
|
Amortization expense on the core deposit intangible assets recorded in other operating expenses totaled approximately $41,000 for each of the years ended December 31, 2016, 2015 and 2014. Amortization of the core deposit intangible assets is estimated to be approximately $41,000 each year for the next eleven years.
NOTE 8. INVESTMENT IN TAX CREDIT ENTITY
In December 2014, the Company acquired a limited partner interest in a tax-advantaged limited partnership whose purpose was to invest in an approved Federal Historic Rehabilitation tax credit project. This investment is accounted for using the cost method of accounting and is included in “Other assets” in the accompanying consolidated balance sheets. At December 31, 2016 and 2015, the recorded investment was $0.2 million. The limited partnership is considered to be a variable interest entity (“VIE”). The VIE has not been consolidated because the Company is not considered the primary beneficiary. The Company’s investment in the limited partnership was evaluated for impairment at the end of the reporting period, and, as a result, the Company recorded impairment expense of $11,000, $0.1 million and $0.7 million for the years ended December 31, 2016, 2015, and 2014, respectively. At December 31, 2016 and 2015, the Company had $0.9 million invested in this partnership. The investment generated historic tax credits of $1.0 million, all of which was recognized in the year ended December 31, 2014. The Company did not make any loans related to this real estate project. Based on the structure of this transaction, the Company expects to recover its investment solely through use of the tax credits that were generated by the investment.
NOTE 9. DEPOSITS
Deposits consisted of the following as of the dates presented (dollars in thousands).
|
|
December 31, |
|
|||||
|
|
2016 |
|
|
2015 |
|
||
|
Noninterest-bearing demand deposits |
$ |
108,404 |
|
|
$ |
90,447 |
|
|
NOW accounts |
|
171,556 |
|
|
|
140,503 |
|
|
Money market deposit accounts |
|
123,079 |
|
|
|
96,113 |
|
|
Savings accounts |
|
52,860 |
|
|
|
53,735 |
|
|
Time deposits |
|
451,888 |
|
|
|
356,608 |
|
|
Total deposits |
$ |
907,787 |
|
|
$ |
737,406 |
|
95
INVESTAR HOLDING CORPORATION
Notes to Consolidated Financial Statements
The table below summarizes outstanding time deposits as of the dates indicated (dollars in thousands).
|
|
2016 |
|
|
2015 |
|
||
|
$0 to $99,999 |
$ |
268,875 |
|
|
$ |
321,804 |
|
|
$100,000 to $249,999 |
|
134,920 |
|
|
|
13,395 |
|
|
$250,000 and above |
|
48,093 |
|
|
|
21,409 |
|
|
|
$ |
451,888 |
|
|
$ |
356,608 |
|
The contractual maturities of time deposits of $100,000 or more outstanding are summarized in the table below as of the dates presented (dollars in thousands).
|
|
December 31, |
|
|||||
|
|
2016 |
|
|
2015 |
|
||
|
Time remaining until maturity: |
|
|
|
|
|
|
|
|
Three months or less |
$ |
59,739 |
|
|
$ |
4,675 |
|
|
Over three through six months |
|
26,053 |
|
|
|
10,039 |
|
|
Over six through twelve months |
|
20,987 |
|
|
|
12,912 |
|
|
Over one year through three years |
|
67,253 |
|
|
|
5,710 |
|
|
Over three years |
|
8,981 |
|
|
|
1,468 |
|
|
|
$ |
183,013 |
|
|
$ |
34,804 |
|
The approximate scheduled maturities of time deposits for each of the next five years are shown below (dollars in thousands).
|
2017 |
$ |
267,003 |
|
|
2018 |
|
131,697 |
|
|
2019 |
|
35,006 |
|
|
2020 |
|
10,004 |
|
|
2021 |
|
8,178 |
|
|
|
$ |
451,888 |
|
Public fund deposits as of December 31, 2016 and 2015 totaled approximately $29.8 million and $17.5 million, respectively. The funds were secured by U.S. government securities with a fair value of approximately $28.1 million as of December 31, 2016 and $16.9 million as of December 31, 2015.
As of December 31, 2016 and 2015, total deposits outstanding to executive officers, principal shareholders, directors and to companies in which they are principal owners amounted to approximately $29.4 million and $28.1 million, respectively.
NOTE 10. SECURITIES SOLD UNDER AGREEMENTS TO REPURCHASE
Securities sold under agreements for repurchase amounted to $39.1 million as of both December 31, 2016 and December 31, 2015, respectively, and mature on a daily basis. These funds were secured by investment securities with fair values of approximately $49.3 million and $41.9 million as of December 31, 2016 and December 31, 2015, respectively. The interest rate on these agreements was 0.20% at December 31, 2016 and December 31, 2015.
96
INVESTAR HOLDING CORPORATION
Notes to Consolidated Financial Statements
Federal Home Loan Bank Advances
Maturity amounts and the weighted average rate of FHLB advances by year of maturity were as follows as of the dates presented (dollars in thousands).
|
|
|
Amount |
|
|
Weighted Average Rate |
|
||||||||||
|
|
|
December 31, 2016 |
|
|
December 31, 2015 |
|
|
December 31, 2016 |
|
|
December 31, 2015 |
|
||||
|
Fixed rate advances maturing: |
|
|
|
|
|
|
|
|
|
|
|
|
|
|
|
|
|
2016 |
|
|
- |
|
|
|
119,137 |
|
|
|
- |
|
|
|
0.40 |
|
|
2017(a) |
|
|
73,603 |
|
|
|
4,160 |
|
|
|
0.79 |
|
|
|
0.97 |
|
|
2018(b) |
|
|
6,100 |
|
|
|
1,100 |
|
|
|
0.91 |
|
|
|
1.00 |
|
|
2020 |
|
|
3,100 |
|
|
|
3,100 |
|
|
|
1.52 |
|
|
|
1.52 |
|
|
|
|
$ |
82,803 |
|
|
$ |
127,497 |
|
|
|
0.82 |
% |
|
|
0.45 |
% |
(a) Includes amortizing advances, requiring monthly principal and interest of $51
(b) Includes amortizing advances, requiring monthly principal and interest of $1
As of December 31, 2016, these advances are collateralized by approximately $376.4 million of the Company’s loan portfolio and $50.4 million of the Company’s investment securities in accordance with the Advance Security and Collateral Agreement with the FHLB.
As of December 31, 2016, the Company had an additional $344.1 million available under its line of credit with the FHLB. In addition, the Company has outstanding unsecured lines of credit with its correspondent banks available to assist in the management of short-term liquidity. At December 31, 2016, the available balance on the unsecured lines of credit totaled approximately $55.0 million, with no outstanding balance reflected on the consolidated balance sheet.
Revolving Line of Credit
In addition to the unsecured lines of credit mentioned above, on June 27, 2016, the Company entered into a loan agreement (“Agreement”) with TIB providing for a $20.0 million revolving line of credit maturing June 27, 2018. Borrowings bear interest, payable quarterly, at a fixed rate per annum equal to the U.S. prime rate on June 27, 2016 (3.5%); provided, however, that on June 27, 2017, the rate will be adjusted to a fixed rate of interest equal to the prime rate on such date. The revolving line of credit is secured by a first priority security interest in all of the capital stock of Investar Bank and a security interest in all property of Investar Bank held by the lender. At December 31, 2016, the outstanding balance on the secured line of credit was $1.0 million and is reflected in other borrowings on the consolidated balances sheets.
The Agreement for the revolving line of credit contains customary representations, warranties, affirmative covenants and events of default, and also contains a number of negative covenants, including, but not limited to, restrictions on mergers and similar transactions, restrictions on liens, and a prohibition on the payment of dividends or repurchase of stock during an event of default. The agreement also contains financial covenants, including requiring that Investar Bank maintain (i) a Tier 1 Leverage Ratio and a Common Equity Tier 1 Ratio not less than 7.5% at all times, (ii) a Tier 1 Capital Ratio and a Total Capital Ratio not less than 9.5% at all times, (iii) a return on average assets of no less than 0.70% as of the end of each fiscal quarter, annualized on a year-to-date basis, (iv) Classified Assets (as defined in the Agreement) at no more than 35% of Investar Bank’s Tier 1 Capital plus allowance for loan and lease losses, and (v) a total loans to total assets ratio of no more than 85% at all times.
97
INVESTAR HOLDING CORPORATION
Notes to Consolidated Financial Statements
On May 1, 2013, in connection with the acquisition of First Community Bank (“FCB”), the Company assumed the common securities of First Community Louisiana Statutory Trust I, a Delaware statutory trust, that was initially established in March 2006 by First Community Holding Company, the parent bank holding company for FCB, for the purpose of issuing corporation-obligated mandatorily redeemable preferred capital securities to third-party investors. The trust used the proceeds from the issuance of their preferred capital securities and common securities (collectively referred to as “capital securities”) to buy floating rate junior subordinated debentures issued by FCB (subsequently assumed by the Company through their acquisition of FCB). The debentures are the trust’s only assets and interest payments from the debentures finance the distributions paid on the capital securities. Distributions on the capital securities are payable quarterly at a floating rate of three month LIBOR + 1.77%. The capital securities are subject to mandatory redemption, in whole or in part, upon repayment of the debentures. Under the terms of the Indenture dated March 27, 2006, the junior subordinated debentures will mature on June 15, 2036. Under applicable regulatory guidelines, these junior subordinated debentures qualify as Tier 1 Capital.
NOTE 12. DERIVATIVE FINANCIAL INSTRUMENTS
The Company currently holds interest rate swap contracts to manage exposure against the variability in the expected future cash flows (future interest payments) attributable to changes in the 1-month LIBOR associated with the forecasted issuances of 1-month fixed rate debt arising from a rollover strategy. An interest rate swap is an agreement whereby one party agrees to pay a fixed rate of interest on a notional principal amount in exchange for receiving a floating rate of interest on the same notional amount, for a predetermined period of time, from a second party. The amounts relating to the notional principal amount are not actually exchanged. The maximum length of time over which the Company is currently hedging its exposure to the variability in future cash flows for forecasted transactions is approximately 3.6 years. The total notional amount of the derivative contracts is $50.0 million.
For the year ended December 31, 2016, a gain of $0.4 million, net of a $0.2 million tax expense, was recognized in “Other comprehensive income (loss)” (“OCI”) in the accompanying consolidated statements of other comprehensive income for the change in fair value of the interest rate swap contracts. For both the years ended December 31, 2015 and 2014, a loss of $0.2 million, net of a $0.1 million tax benefit, respectively, was recognized in “Other comprehensive (loss) income” (“OCI”) in the accompanying consolidated statements of other comprehensive income for the change in fair value of the interest rate swap contracts. The swap contracts had a fair value of $8,000 and a negative fair value of $0.6 million at December 31, 2016 and 2015, respectively, and have been recorded in “Other assets” and “Accrued taxes and other liabilities,” respectively, in the accompanying consolidated balance sheets. The accumulated gain of $8,000 included in “Accumulated other comprehensive (loss) income” in the accompanying consolidated balance sheets would be reclassified to current earnings if the hedge transaction becomes probable of not occurring. The Company expects the hedge to remain fully effective during the remaining term of the swap contract.
98
INVESTAR HOLDING CORPORATION
Notes to Consolidated Financial Statements
Preferred Stock
The Company’s Articles of Incorporation give the Company’s board of directors the authority to issue up to 5,000,000 shares of preferred stock. As of December 31, 2016, there are no preferred shares outstanding. The preferred shares are considered “blank check” preferred stock. This type of preferred stock allows the board of directors to fix the designations, preferences and relative, participating, optional or other special rights, and qualifications and limitations or restrictions of any series of preferred stock without further shareholder approval.
Common Stock
The table below displays the Company’s common stock activity for the periods indicated.
|
Common Stock Issued and Outstanding |
|
|
|
|
|
Shares |
|
|
|
Outstanding at December 31, 2013 |
|
3,945,114 |
|
|
Issuances |
|
3,296,176 |
|
|
Stock warrant activity |
|
21,996 |
|
|
Restricted stock activity |
|
(1,201 |
) |
|
Outstanding at December 31, 2014 |
|
7,262,085 |
|
|
Issuances |
|
11,225 |
|
|
Repurchases |
|
(36,856 |
) |
|
Stock option activity |
|
10,125 |
|
|
Restricted stock activity |
|
17,703 |
|
|
Outstanding at December 31, 2015 |
|
7,264,282 |
|
|
Issuances |
|
14,596 |
|
|
Repurchases |
|
(221,901 |
) |
|
Stock option activity |
|
5,500 |
|
|
Restricted stock activity |
|
32,774 |
|
|
Warrant activity |
|
6,600 |
|
|
Outstanding at December 31, 2016 |
|
7,101,851 |
|
In July 2014, the Company issued 3,285,300 shares of its common stock as a result of its initial public offering (the “IPO”).
Warrants
On October 1, 2011, in connection with the SLBB acquisition, the Bank issued 130,875 stock warrants with an exercise price of $13.33 per share. In connection with the share exchange discussed above in Note 1, Summary of Significant Accounting Policies, the warrants were exchanged for a like amount of warrants to acquire shares of Company common stock at the same exercise price. These warrants, which are currently exercisable, expire on July 1, 2018. All other warrants to acquire shares of Company common stock expired on or before December 31, 2014.
99
INVESTAR HOLDING CORPORATION
Notes to Consolidated Financial Statements
The following table summarizes the Company’s warrant activity for the periods indicated.
|
|
|
December 31, |
|
|||||||||
|
|
|
2016 |
|
|
2015 |
|
|
2014 |
|
|||
|
$13.50 Per Share |
|
|
|
|
|
|
|
|
|
|
|
|
|
Issued September 1, 2007, expired September 30, 2014(1) |
|
|
|
|
|
|
|
|
|
|
|
|
|
Balance, beginning of period |
|
|
- |
|
|
|
- |
|
|
|
49,903 |
|
|
Issued |
|
|
- |
|
|
|
- |
|
|
|
- |
|
|
Forfeited |
|
|
- |
|
|
|
- |
|
|
|
(34,990 |
) |
|
Exercised |
|
|
- |
|
|
|
- |
|
|
|
(14,913 |
) |
|
Balance, end of period |
|
|
- |
|
|
|
- |
|
|
|
- |
|
|
|
|
|
|
|
|
|
|
|
|
|
|
|
|
$13.50 Per Share |
|
|
|
|
|
|
|
|
|
|
|
|
|
Issued March 21, 2009, expired December 31, 2014 |
|
|
|
|
|
|
|
|
|
|
|
|
|
Balance, beginning of period |
|
|
- |
|
|
|
- |
|
|
|
12,720 |
|
|
Issued |
|
|
- |
|
|
|
- |
|
|
|
- |
|
|
Forfeited |
|
|
- |
|
|
|
- |
|
|
|
(5,637 |
) |
|
Exercised |
|
|
- |
|
|
|
- |
|
|
|
(7,083 |
) |
|
Balance, end of period |
|
|
- |
|
|
|
- |
|
|
|
- |
|
|
|
|
|
|
|
|
|
|
|
|
|
|
|
|
$13.33 Per Share |
|
|
|
|
|
|
|
|
|
|
|
|
|
Issued October 1, 2011, expire July 1, 2018 |
|
|
|
|
|
|
|
|
|
|
|
|
|
Balance, beginning of period |
|
|
130,875 |
|
|
|
130,875 |
|
|
|
130,875 |
|
|
Issued |
|
|
- |
|
|
|
- |
|
|
|
- |
|
|
Forfeited |
|
|
- |
|
|
|
- |
|
|
|
- |
|
|
Exercised |
|
|
(6,600 |
) |
|
|
- |
|
|
|
- |
|
|
Balance, end of period |
|
|
124,275 |
|
|
|
130,875 |
|
|
|
130,875 |
|
|
|
|
|
|
|
|
|
|
|
|
|
|
|
|
(1) The original expiration date of April 30, 2014 was extended on account of the IPO. |
|
|||||||||||
Equity Incentive Plan. The Company’s 2014 Long-Term Incentive Compensation Plan (the “Plan”) authorizes the grant of various types of equity grants and awards, such as restricted stock, stock options and stock appreciation rights, to eligible participants, which include all of the Company’s and Bank’s employees and non-employee directors. The Plan reserved 600,000 shares of common stock for grant, award or issuance to directors and employees, including shares underlying granted options. The Plan is administered by the Compensation Committee of the Company’s board of directors, which determines, within the provision of the Plan, those eligible employees to whom, and the times at which, awards shall be granted. The Compensation Committee, in its discretion, may delegate its authority and duties under the Plan to specified officers; however, only the Compensation Committee may approve the terms of grants and awards to the Company’s executive officers. At December 31, 2016 and 2015, no stock appreciation rights had been granted. At December 31, 2016, approximately 126,000 shares remain available for grant.
100
INVESTAR HOLDING CORPORATION
Notes to Consolidated Financial Statements
At the completion of the IPO in July 2014, the Company issued 216,000 stock options to key personnel that vest at one-sixth increments on the grant date anniversary of each of the following six years.
During the years ended December 31, 2016 and 2015, the Company issued 46,512 and 64,333 stock options, respectively, to key personnel that vest at one-fifth increments on the grant date anniversary of each of the following five years.
The table below summarizes the Company’s stock option activity for the periods indicated.
|
|
|
|
|
|
|
|
|
|
Weighted |
|
|
|
|
|
|
|
|
|
|
Average |
|
|
|
|
|
|
Weighted |
|
|
Remaining |
|
|
Stock Options |
|
|
|
|
Average |
|
|
Contractual |
|
|
|
Shares |
|
|
Price |
|
|
Term (Years) |
||
|
Outstanding at December 31, 2013 |
|
22,811 |
|
|
$ |
13.33 |
|
|
4.88 |
|
Issued |
|
216,000 |
|
|
|
14.00 |
|
|
|
|
Forfeited |
|
- |
|
|
|
- |
|
|
|
|
Exercised |
|
- |
|
|
|
- |
|
|
|
|
Outstanding at December 31, 2014 |
|
238,811 |
|
|
|
13.94 |
|
|
8.96 |
|
Issued |
|
64,333 |
|
|
|
15.74 |
|
|
|
|
Forfeited |
|
(14,667 |
) |
|
|
14.00 |
|
|
|
|
Exercised |
|
(10,125 |
) |
|
|
13.33 |
|
|
|
|
Outstanding at December 31, 2015 |
|
278,352 |
|
|
|
14.37 |
|
|
8.42 |
|
Issued |
|
46,512 |
|
|
|
14.28 |
|
|
|
|
Forfeited |
|
- |
|
|
|
- |
|
|
|
|
Exercised |
|
(5,500 |
) |
|
|
14.00 |
|
|
|
|
Outstanding at December 31, 2016 |
|
319,364 |
|
|
|
14.36 |
|
|
7.67 |
|
Exercisable at December 31, 2016 |
|
88,049 |
|
|
|
14.16 |
|
|
6.80 |
At December 31, 2016, the shares underlying total outstanding stock options had an intrinsic value of $1.4 million. The shares underlying exercisable stock options had an intrinsic value of approximately $0.4 million.
The Company uses a Black-Scholes option pricing model to estimate the fair value of stock-based awards. The Black-Scholes option pricing model incorporates various and highly subjective assumptions, including expected term and expected volatility. Stock option expense in the accompanying consolidated statements of operations for the years ended December 31, 2016, 2015, and 2014 was $0.2 million, $0.2 million, and $0.1 million, respectively. At December 31, 2016, there was $0.7 million of unrecognized compensation cost related to stock options that is expected to be recognized over a weighted average period of 3.6 years.
The table below shows the assumptions used for the stock options granted during the years ended December 31, 2016 and 2015.
|
|
2016 |
|
|
|
2015 |
|
|
||
|
Dividend yield |
|
0.22 |
% |
|
|
|
0.17 |
% |
|
|
Expected volatility |
|
19.55 |
% |
|
|
|
18.48 |
% |
|
|
Risk-free interest rate |
|
1.62 |
% |
|
|
|
1.79 |
% |
|
|
Expected term (in years) |
|
7.0 |
|
|
|
|
7.0 |
|
|
|
Weighted-average grant date fair value |
$ |
3.44 |
|
|
|
$ |
3.75 |
|
|
Time Vested Restricted Stock Awards. The Company has issued shares of time vested restricted stock with vesting terms ranging from one to six years. The total stock-based compensation expense for these awards is determined based on the market price of the Company’s common stock at the grant date applied to the total number of shares granted and is amortized over the vesting period.
The Company issued a total of 54,837 shares of restricted stock to employees and directors for the year ended December 31, 2016. Of the restricted stock granted in 2016, 49,139 shares will vest over five years and 5,698 shares will vest over two years.
101
INVESTAR HOLDING CORPORATION
Notes to Consolidated Financial Statements
The Company issued a total of 36,434 shares of restricted stock to employees and directors for the year ended December 31, 2015. Of the restricted stock granted in 2015, 30,305 shares will vest over five years and 6,129 shares will vest over two years.
The Company issued a total of 11,824 shares of restricted stock to employees for the year ended December 31, 2014. Of the restricted stock granted in 2014, 3,335 shares will vest over five years and 8,489 shares will vest over six years.
No shares of restricted stock may be sold, assigned, transferred or pledged until vested. The holders of the restricted stock receive dividends and have the right to vote the shares. The unearned compensation related to these awards is amortized to compensation expense over the vesting period.
As of December 31, 2016, 2015, and 2014, unearned stock-based compensation associated with these awards totaled approximately $1.1 million, $0.8 million and $0.5 million, respectively. The $1.1 million of unrecognized compensation cost related to time vested restricted stock at December 31, 2016 is expected to be recognized over a weighted average period of 3.4 years.
The following table summarizes the unvested restricted stock award activity for the years ended December 31, 2016 and December 31, 2015.
|
|
December 31, |
|
|||||||||||||
|
|
2016 |
|
|
2015 |
|
||||||||||
|
|
Shares |
|
|
Weighted Avg Grant Date Fair Value |
|
|
Shares |
|
|
Weighted Avg Grant Date Fair Value |
|
||||
|
|
|
|
|
|
|
|
|
|
|
|
|
|
|
|
|
|
Balance, beginning of period |
|
60,592 |
|
|
$ |
14.85 |
|
|
|
42,889 |
|
|
$ |
13.96 |
|
|
Granted |
|
54,837 |
|
|
|
14.67 |
|
|
|
36,434 |
|
|
|
15.50 |
|
|
Forfeited |
|
(3,238 |
) |
|
|
15.71 |
|
|
|
(5,044 |
) |
|
|
14.29 |
|
|
Earned and issued |
|
(18,825 |
) |
|
|
14.72 |
|
|
|
(13,687 |
) |
|
|
13.99 |
|
|
Balance, end of period |
|
93,366 |
|
|
$ |
14.75 |
|
|
|
60,592 |
|
|
$ |
14.85 |
|
NOTE 14. EMPLOYEE BENEFIT PLANS
The Company maintains a 401(k) defined contribution plan (the “Plan”) which covers employees over the age of twenty-one who have completed 90 days of credited service, as defined by the Plan. The Plan allows employees to defer a percentage of their salaries subject to certain limits based on federal tax laws. The Company makes matching contributions up to 4% of the employee’s annual salary (subject to certain maximum compensation amounts as prescribed in Internal Revenue Service guidance). Contributions by the Company and participants are immediately vested. The Plan also allows for a discretionary Company contribution. Although no such contribution has been made as of December 31, 2016, the discretionary component vests in increments of 20% annually over a period of five years based on the employees’ years of service.
Employer matching contributions to the Plan for each of the years ended December 31, 2016, 2015 and 2014 were approximately $0.4 million.
The Company maintains a deferred compensation plan for a former FCB employee. A single premium immediate annuity policy was purchased in which the former employee is the beneficiary. Under this policy, the beneficiary will receive monthly payments of $2,000 through 2020.
NOTE 15. INCOME TAXES
The income tax expense included in the consolidated statements of operations is displayed in the table below for the years ended December 31, 2016, 2015 and 2014 (dollars in thousands).
|
|
December 31, |
|
|||||||||
|
|
2016 |
|
|
2015 |
|
|
2014 |
|
|||
|
|
|
|
|
|
|
|
|||||
|
Current |
$ |
3,816 |
|
|
$ |
3,897 |
|
|
$ |
1,279 |
|
|
Deferred |
|
(207 |
) |
|
|
(386 |
) |
|
|
(134 |
) |
|
|
$ |
3,609 |
|
|
$ |
3,511 |
|
|
$ |
1,145 |
|
102
INVESTAR HOLDING CORPORATION
Notes to Consolidated Financial Statements
The provision for federal income taxes differs from that computed by applying the federal statutory rate of 35% in 2016 and 2015, and 34% in 2014, as indicated in the following analysis for the years ended December 31, 2016, 2015 and 2014 (dollars in thousands).
|
|
December 31, |
|
|||||||||
|
|
2016 |
|
|
2015 |
|
|
2014 |
|
|||
|
|
|
|
|
|
|
|
|||||
|
Tax based on statutory rate |
$ |
3,921 |
|
|
$ |
3,704 |
|
|
$ |
2,224 |
|
|
Decrease resulting from: |
|
|
|
|
|
|
|
|
|
|
|
|
Effect of tax-exempt income |
|
(273 |
) |
|
|
(142 |
) |
|
|
(118 |
) |
|
Historical tax credits |
|
10 |
|
|
|
(62 |
) |
|
|
(1,002 |
) |
|
Other |
|
(49 |
) |
|
|
11 |
|
|
|
41 |
|
|
Total income tax expense |
$ |
3,609 |
|
|
$ |
3,511 |
|
|
$ |
1,145 |
|
|
Effective rate |
|
31.4 |
% |
|
|
33.2 |
% |
|
|
17.5 |
% |
The Company records deferred income tax on the tax effect of changes in timing differences.
The net deferred tax asset was comprised of the following items as of the dates indicated (dollars in thousands).
|
|
|
December 31, |
|
|||||||||
|
|
|
2016 |
|
|
2015 |
|
|
2014 |
|
|||
|
Deferred tax liabilities: |
|
|
|
|
|
|
|
|
|
|
|
|
|
Depreciation |
|
$ |
(1,650 |
) |
|
$ |
(1,402 |
) |
|
$ |
(1,435 |
) |
|
FHLB stock dividend |
|
|
(20 |
) |
|
|
(5 |
) |
|
|
(16 |
) |
|
Basis difference in acquired assets and liabilities |
|
|
(276 |
) |
|
|
(26 |
) |
|
|
- |
|
|
Unrealized gain on available for sale securities |
|
|
- |
|
|
|
- |
|
|
|
(62 |
) |
|
Gross deferred tax liability |
|
|
(1,946 |
) |
|
|
(1,433 |
) |
|
|
(1,513 |
) |
|
|
|
|
|
|
|
|
|
|
|
|
|
|
|
Deferred tax assets: |
|
|
|
|
|
|
|
|
|
|
|
|
|
Provision for loan losses |
|
|
2,150 |
|
|
|
1,588 |
|
|
|
879 |
|
|
Provision for other real estate losses |
|
|
266 |
|
|
|
328 |
|
|
|
517 |
|
|
Unrealized loss on available for sale securities |
|
|
1,115 |
|
|
|
357 |
|
|
|
- |
|
|
Unamortized start-up cost |
|
|
123 |
|
|
|
147 |
|
|
|
165 |
|
|
Net operating loss carryforward |
|
|
299 |
|
|
|
412 |
|
|
|
617 |
|
|
Deferred gain on sale of other real estate |
|
|
33 |
|
|
|
35 |
|
|
|
- |
|
|
Basis difference in acquired assets and liabilities |
|
|
- |
|
|
|
- |
|
|
|
46 |
|
|
Historical tax credit |
|
|
243 |
|
|
|
247 |
|
|
|
226 |
|
|
Other |
|
|
585 |
|
|
|
234 |
|
|
|
160 |
|
|
Gross deferred tax assets |
|
|
4,814 |
|
|
|
3,348 |
|
|
|
2,610 |
|
|
Net deferred tax asset |
|
$ |
2,868 |
|
|
$ |
1,915 |
|
|
$ |
1,097 |
|
The Company acquired net operating loss (“NOL”) carryforwards through tax free acquisitions. As of December 31, 2016 and December 31, 2015, the Company’s NOL carryforwards were approximately $0.9 million and $1.2 million, respectively, and expire in 2033.
As of December 31, 2016 and December 31, 2015, the Company’s general business credit was $12,000 which expires in 2028.
The Company files income tax returns under U.S. federal jurisdiction and the state of Louisiana, although the state of Louisiana does not assess an income tax on income resulting from banking operations. With few exceptions, the Company is no longer subject to U.S. federal and state examinations by tax authorities for years before 2013.
103
INVESTAR HOLDING CORPORATION
Notes to Consolidated Financial Statements
NOTE 16. FAIR VALUES OF FINANCIAL INSTRUMENTS
In accordance with FASB ASC Topic 820, Fair Value Measurement and Disclosure, disclosure of fair value information about financial instruments, whether or not recognized in the balance sheet, is required. Fair value of a financial instrument is the price that would be received to sell an asset or paid to transfer a liability in an orderly transaction between market participants at the measurement date. Fair value is best determined based upon quoted market prices. In cases where quoted market prices are not available, fair values are based on estimates using present value or other valuation techniques. Those techniques are significantly affected by the assumptions used, including the discount rate and estimates of future cash flows, and the fair value estimates may not be realized in an immediate settlement of the instruments. Accordingly, the aggregate fair value amounts presented do not represent the underlying value of the Company.
The fair value guidance provides a consistent definition of fair value, which focuses on exit price in an orderly transaction (that is, not a forced liquidation or distressed sale) between market participants at the measurement date under current market conditions. If there has been a significant decrease in the volume and level of activity for the asset or liability, a change in valuation technique or the use of multiple valuation techniques may be appropriate. In such instances, determining the price at which willing market participants would transact at the measurement date under current market conditions depends on the facts and circumstances and requires use of significant judgment. The fair value is a reasonable point within the range that is most representative of fair value under current market conditions.
Fair Value Hierarchy
In accordance with this guidance, the Company groups its financial assets and financial liabilities measured at fair value in three levels, based on the markets in which the assets and liabilities are traded and the reliability of the assumptions used to determine fair value.
Level 1—Valuation is based on quoted prices in active markets for identical assets or liabilities that the reporting entity has the ability to access at the measurement date. Level 1 assets and liabilities generally include debt and equity securities that are traded in an active exchange market. Valuations are obtained from readily available pricing sources for market transactions involving identical assets or liabilities.
Level 2—Valuation is based on inputs other than quoted prices included within level 1 that are observable for the asset or liability, either directly or indirectly. The valuation may be based on quoted prices for similar assets or liabilities; quoted prices in markets that are not active; or other inputs that are observable or can be corroborated by observable market data for substantially the full term of the asset or liability.
Level 3—Valuation is based on unobservable inputs that are supported by little or no market activity and that are significant to the fair value of the assets or liabilities. Level 3 assets and liabilities include financial instruments whose value is determined using pricing models, discounted cash flow methodologies, or similar techniques, as well as instruments for which determination of fair value requires significant management judgment or estimation.
A financial instrument’s categorization within the valuation hierarchy is based upon the lowest level of input that is significant to the fair value measurement.
The following methods and assumptions were used by the Company in estimating fair value disclosures for financial instruments:
Cash and Due from Banks – For these short-term instruments, fair value is the carrying value. Cash and due from banks is classified in level 1 of the fair value hierarchy.
Federal Funds Sold/Purchased and Securities Sold under Repurchase Agreements – The fair value is the carrying value based on the short-term nature of these items. The Company classifies these assets in level 1 of the fair value hierarchy.
Investments – Where quoted prices are available in an active market, the Company classifies these securities within level 1 of the valuation hierarchy. Securities are defined as both long and short positions. Level 1 securities include highly liquid government bonds and exchange-traded equities.
104
INVESTAR HOLDING CORPORATION
Notes to Consolidated Financial Statements
If quoted market prices are not available, the Company estimates fair values using pricing models and discounted cash flows that consider standard input factors such as observable market data, benchmark yields, interest rate volatilities, broker/dealer quotes, and credit spreads. Examples of such instruments, which would generally be classified within level 2 of the valuation hierarchy, include Government Sponsored Enterprise obligations, corporate bonds and other securities. Mortgage-backed securities are included in level 2 if observable inputs are available. In certain cases where there is limited activity or less transparency around inputs to the valuation, the Company classifies these securities in level 3.
Loans – For variable-rate loans that re-price frequently and with no significant change in credit risk, fair values are based on carrying values. Fair values for certain mortgage loans (for example, one-to-four family residential), credit card loans, and other consumer loans are based on quoted market prices of similar instruments sold in conjunction with securitization transactions, adjusted for differences in loan characteristics. Fair values for other loans (for example, commercial real estate and investment property mortgage loans, commercial and industrial loans) are estimated using discounted cash flow analyses, using market interest rates for comparable loans. Fair values for nonperforming loans are estimated using discounted cash flow analyses or underlying collateral values, where applicable. The Company classifies loans in level 3 of the fair value hierarchy.
Loans held for sale are measured using quoted market prices when available. If quoted market prices are not available, comparable market values or discounted cash flow analyses may be utilized. The Company classifies these assets in level 3 of the fair value hierarchy.
Other Real Estate Owned – The fair values are estimated based on recent appraisal values of the property less costs to sell the property, as other real estate owned is valued at the lower of cost or fair value of the property, less estimated costs to sell. Certain inputs used in appraisals are not always observable, and therefore other real estate owned may be classified in level 3 within the fair value hierarchy. When inputs are observable, these assets are classified in level 2 of the fair value hierarchy.
Deposit Liabilities—The fair values disclosed for noninterest-bearing demand deposits are, by definition, equal to the amount payable on demand at the reporting date (that is, their carrying amounts). These noninterest-bearing deposits are classified in level 2 of the fair value hierarchy. The carrying amounts of variable-rate deposit accounts (for example interest-bearing checking, savings and money market accounts), fixed-term money market accounts and certificates of deposit approximate their fair values at the reporting date. Fair values for fixed-rate certificates of deposit are estimated using a discounted cash flow calculation that applies market interest rates on comparable instruments to a schedule of aggregated expected monthly maturities on time deposits. All interest-bearing deposits are classified in level 3 of the fair value hierarchy.
Short-Term Borrowings—The carrying amounts of federal funds purchased, borrowings under repurchase agreements, and other short-term borrowings maturing within 90 days approximate their fair values. The Company classifies these borrowings in level 2 of the fair value hierarchy.
Long-Term Borrowings – The fair values of long-term borrowings are estimated using discounted cash flows analyses based on the Company’s current incremental borrowing rates for similar types of borrowing arrangements. The fair value of the Company’s long-term debt is therefore classified in level 3 of the fair value hierarchy.
Commitments – The fair value of commitments to extend credit was not significant.
Derivative Instruments – The fair value for interest rate swap agreements are based upon the amounts required to settle the contracts. These derivative instruments are classified in level 2 of the fair value hierarchy.
105
INVESTAR HOLDING CORPORATION
Notes to Consolidated Financial Statements
Fair Value of Assets and Liabilities Measured on a Recurring Basis
Assets and liabilities measured at fair value on a recurring basis are summarized below as of the dates indicated (dollars in thousands).
|
|
|
|
|
|
|
Quoted Prices in |
|
|
|
|
|
|
Significant |
|
||
|
|
|
|
|
|
|
Active Markets for |
|
|
Significant Other |
|
|
Unobservable |
|
|||
|
|
|
|
|
|
|
Identical Assets |
|
|
Observable Inputs |
|
|
Inputs |
|
|||
|
|
|
Fair Value |
|
|
(Level 1) |
|
|
(Level 2) |
|
|
(Level 3) |
|
||||
|
December 31, 2016 |
|
|
|
|
|
|
|
|
|
|
|
|
|
|
|
|
|
Assets: |
|
|
|
|
|
|
|
|
|
|
|
|
|
|
|
|
|
Obligations of other U.S. government agencies and corporations |
|
$ |
29,490 |
|
|
$ |
- |
|
|
$ |
29,490 |
|
|
$ |
- |
|
|
Obligations of state and political subdivisions |
|
|
27,855 |
|
|
|
- |
|
|
|
10,199 |
|
|
|
17,656 |
|
|
Corporate bonds |
|
|
14,968 |
|
|
|
- |
|
|
|
14,344 |
|
|
|
624 |
|
|
Residential mortgage-backed securities |
|
|
87,588 |
|
|
|
- |
|
|
|
87,588 |
|
|
|
- |
|
|
Commercial mortgage-backed securities |
|
|
2,444 |
|
|
|
- |
|
|
|
2,444 |
|
|
|
- |
|
|
Equity securities |
|
|
706 |
|
|
|
706 |
|
|
|
- |
|
|
|
- |
|
|
Derivative financial instruments |
|
|
8 |
|
|
|
- |
|
|
|
8 |
|
|
|
- |
|
|
Total assets |
|
$ |
163,059 |
|
|
$ |
706 |
|
|
$ |
144,073 |
|
|
$ |
18,280 |
|
|
|
|
|
|
|
|
|
|
|
|
|
|
|
|
|
|
|
|
December 31, 2015 |
|
|
|
|
|
|
|
|
|
|
|
|
|
|
|
|
|
Assets: |
|
|
|
|
|
|
|
|
|
|
|
|
|
|
|
|
|
Obligations of other U.S. government agencies and corporations |
|
$ |
26,473 |
|
|
$ |
- |
|
|
$ |
26,473 |
|
|
$ |
- |
|
|
Obligations of state and political subdivisions |
|
|
21,467 |
|
|
|
- |
|
|
|
11,072 |
|
|
|
10,395 |
|
|
Corporate bonds |
|
|
14,824 |
|
|
|
- |
|
|
|
13,688 |
|
|
|
1,136 |
|
|
Residential mortgage-backed securities |
|
|
47,526 |
|
|
|
- |
|
|
|
47,526 |
|
|
|
- |
|
|
Commercial mortgage-backed securities |
|
|
1,989 |
|
|
|
- |
|
|
|
1,989 |
|
|
|
- |
|
|
Equity securities |
|
|
1,092 |
|
|
|
1,092 |
|
|
|
- |
|
|
|
- |
|
|
Total assets |
|
$ |
113,371 |
|
|
$ |
1,092 |
|
|
$ |
100,748 |
|
|
$ |
11,531 |
|
|
Liabilities: |
|
|
|
|
|
|
|
|
|
|
|
|
|
|
|
|
|
Derivative financial instruments |
|
$ |
581 |
|
|
$ |
- |
|
|
$ |
581 |
|
|
$ |
- |
|
The Company reviews fair value hierarchy classifications on a quarterly basis. Changes in the Company’s ability to observe inputs to the valuation may cause reclassification of certain assets or liabilities within the fair value hierarchy. The table below provides a reconciliation for assets measured at fair value on a recurring basis using significant unobservable inputs, or Level 3 inputs (dollars in thousands).
106
INVESTAR HOLDING CORPORATION
Notes to Consolidated Financial Statements
|
Obligations of |
|
|
|
|
|
|
|
|
|
||
|
|
State and Political |
|
|
Corporate |
|
|
|
|
|
||
|
|
Subdivisions |
|
|
Bonds |
|
|
Total |
|
|||
|
|
|
|
|
|
|
|
|
|
|
|
|
|
Balance at December 31, 2014 |
$ |
- |
|
|
$ |
- |
|
|
$ |
- |
|
|
Realized gains (losses) included in net income |
|
- |
|
|
|
- |
|
|
|
- |
|
|
Unrealized losses included in other comprehensive income |
|
- |
|
|
|
- |
|
|
|
- |
|
|
Purchases |
|
10,395 |
|
|
|
1,136 |
|
|
|
11,531 |
|
|
Sales |
|
- |
|
|
|
- |
|
|
|
- |
|
|
Transfers into Level 3 |
|
- |
|
|
|
- |
|
|
|
- |
|
|
Transfers out of Level 3 |
|
- |
|
|
|
- |
|
|
|
- |
|
|
Balance at December 31, 2015 |
$ |
10,395 |
|
|
$ |
1,136 |
|
|
$ |
11,531 |
|
|
Realized gains (losses) included in net income |
|
- |
|
|
|
- |
|
|
|
- |
|
|
Unrealized losses included in other comprehensive income |
|
(1,684 |
) |
|
|
(27 |
) |
|
|
(1,711 |
) |
|
Purchases |
|
9,065 |
|
|
|
- |
|
|
|
9,065 |
|
|
Sales |
|
- |
|
|
|
- |
|
|
|
- |
|
|
Paydowns |
|
(120 |
) |
|
|
- |
|
|
|
(120 |
) |
|
Transfers into Level 3 |
|
- |
|
|
|
- |
|
|
|
- |
|
|
Transfers out of Level 3 |
|
- |
|
|
|
(485 |
) |
|
|
(485 |
) |
|
Balance at December 31, 2016 |
$ |
17,656 |
|
|
$ |
624 |
|
|
$ |
18,280 |
|
There were no liabilities measured at fair value on a recurring basis using Level 3 inputs at December 31, 2016, 2015 and 2014. For the year ended December 31, 2016, there were no gains or losses included in earnings, nor were there unrealized gains or losses related to the change in fair value of the assets measured on a recurring basis using significant unobservable inputs held at the end of the period.
Fair Value of Assets Measured on a Nonrecurring Basis
Assets measured at fair value on a nonrecurring basis are summarized below as of the dates indicated; there were no liabilities measured on a nonrecurring basis at December 31, 2016 or 2015 (dollars in thousands).
|
|
|
Estimated |
|
|
|
|
|
|
Range of |
|
|
Weighted Average |
|
|||
|
|
|
Fair Value |
|
|
Valuation Technique |
|
Unobservable Inputs |
|
Discounts |
|
|
Discount |
|
|||
|
December 31, 2016 |
|
|
|
|
|
|
|
|
|
|
|
|
|
|
|
|
|
Impaired loans |
|
$ |
801 |
|
|
Discounted cash flows, Underlying collateral value |
|
Collateral discounts and estimated costs to sell |
|
1% - 100% |
|
|
|
32% |
|
|
|
|
|
|
|
|
|
|
|
|
|
|
|
|
|
|
|
|
|
December 31, 2015 |
|
|
|
|
|
|
|
|
|
|
|
|
|
|
|
|
|
Impaired loans |
|
$ |
335 |
|
|
Discounted cash flows, Underlying collateral value |
|
Collateral discounts and estimated costs to sell |
|
2% - 100% |
|
|
|
35% |
|
|
|
Other real estate owned |
|
|
35 |
|
|
Discounted cash flows, Underlying collateral value, Third party appraisals |
|
Collateral discounts and discount rates |
|
|
17% |
|
|
|
17% |
|
107
INVESTAR HOLDING CORPORATION
Notes to Consolidated Financial Statements
The estimated fair values of the Company’s financial instruments at December 31, 2016 and December 31, 2015 are shown below (dollars in thousands).
|
|
December 31, 2016 |
|
|||||||||||||||||
|
|
Carrying |
|
|
Estimated |
|
|
|
|
|
|
|
|
|
|
|
|
|
||
|
|
Amount |
|
|
Fair Value |
|
|
Level 1 |
|
|
Level 2 |
|
|
Level 3 |
|
|||||
|
Financial assets: |
|
|
|
|
|
|
|
|
|
|
|
|
|
|
|
|
|
|
|
|
Cash and due from banks |
$ |
29,342 |
|
|
$ |
29,342 |
|
|
$ |
29,342 |
|
|
$ |
- |
|
|
$ |
- |
|
|
Federal funds sold |
|
106 |
|
|
|
106 |
|
|
|
106 |
|
|
|
- |
|
|
|
- |
|
|
Investment securities |
|
183,142 |
|
|
|
182,663 |
|
|
|
706 |
|
|
|
151,128 |
|
|
|
30,829 |
|
|
Other equity securities |
|
5,362 |
|
|
|
5,362 |
|
|
|
- |
|
|
|
5,362 |
|
|
|
- |
|
|
Loans, net of allowance |
|
886,375 |
|
|
|
890,949 |
|
|
|
- |
|
|
|
- |
|
|
|
890,949 |
|
|
Loan held for sale |
|
- |
|
|
|
- |
|
|
|
- |
|
|
|
- |
|
|
|
- |
|
|
Derivative financial instruments |
|
8 |
|
|
|
8 |
|
|
|
- |
|
|
|
8 |
|
|
|
- |
|
|
|
|
|
|
|
|
|
|
|
|
|
|
|
|
|
|
|
|
|
|
|
Financial liabilities: |
|
|
|
|
|
|
|
|
|
|
|
|
|
|
|
|
|
|
|
|
Deposits, noninterest-bearing |
$ |
108,404 |
|
|
$ |
108,404 |
|
|
$ |
- |
|
|
$ |
108,404 |
|
|
$ |
- |
|
|
Deposits, interest-bearing |
|
799,383 |
|
|
|
779,397 |
|
|
|
- |
|
|
|
- |
|
|
|
779,397 |
|
|
FHLB short-term advances and repurchase agreements |
|
112,690 |
|
|
|
112,690 |
|
|
|
- |
|
|
|
112,690 |
|
|
|
- |
|
|
FHLB long-term advances |
|
9,200 |
|
|
|
9,233 |
|
|
|
- |
|
|
|
- |
|
|
|
9,233 |
|
|
Junior subordinated debt |
|
3,609 |
|
|
|
3,635 |
|
|
|
- |
|
|
|
- |
|
|
|
3,635 |
|
|
Other borrowings |
|
1,000 |
|
|
|
1,001 |
|
|
|
- |
|
|
|
1,001 |
|
|
|
- |
|
|
|
December 31, 2015 |
|
|||||||||||||||||
|
|
Carrying |
|
|
Estimated |
|
|
|
|
|
|
|
|
|
|
|
|
|
||
|
|
Amount |
|
|
Fair Value |
|
|
Level 1 |
|
|
Level 2 |
|
|
Level 3 |
|
|||||
|
Financial assets: |
|
|
|
|
|
|
|
|
|
|
|
|
|
|
|
|
|
|
|
|
Cash and due from banks |
$ |
20,785 |
|
|
$ |
20,785 |
|
|
$ |
20,785 |
|
|
$ |
- |
|
|
$ |
- |
|
|
Federal funds sold |
|
181 |
|
|
|
181 |
|
|
|
181 |
|
|
|
- |
|
|
|
- |
|
|
Investment securities |
|
139,779 |
|
|
|
139,642 |
|
|
|
1,092 |
|
|
|
112,958 |
|
|
|
25,592 |
|
|
Other equity securities |
|
5,835 |
|
|
|
5,835 |
|
|
|
- |
|
|
|
5,835 |
|
|
|
- |
|
|
Loans, net of allowance |
|
739,313 |
|
|
|
738,614 |
|
|
|
- |
|
|
|
- |
|
|
|
738,614 |
|
|
Loan held for sale |
|
80,509 |
|
|
|
80,509 |
|
|
|
- |
|
|
|
- |
|
|
|
80,509 |
|
|
|
|
|
|
|
|
|
|
|
|
|
|
|
|
|
|
|
|
|
|
|
Financial liabilities: |
|
|
|
|
|
|
|
|
|
|
|
|
|
|
|
|
|
|
|
|
Deposits, noninterest-bearing |
$ |
90,447 |
|
|
$ |
89,427 |
|
|
$ |
- |
|
|
$ |
89,427 |
|
|
$ |
- |
|
|
Deposits, interest-bearing |
|
646,959 |
|
|
|
630,613 |
|
|
|
- |
|
|
|
- |
|
|
|
630,613 |
|
|
FHLB short-term advances and repurchase agreements |
|
158,236 |
|
|
|
158,236 |
|
|
|
- |
|
|
|
158,236 |
|
|
|
- |
|
|
FHLB long-term advances |
|
8,360 |
|
|
|
8,455 |
|
|
|
- |
|
|
|
- |
|
|
|
8,455 |
|
|
Junior subordinated debt |
|
3,609 |
|
|
|
3,217 |
|
|
|
- |
|
|
|
- |
|
|
|
3,217 |
|
|
Derivative financial instruments |
|
581 |
|
|
|
581 |
|
|
|
- |
|
|
|
581 |
|
|
|
- |
|
NOTE 17. REGULATORY MATTERS
The Bank is subject to various regulatory capital requirements administered by the federal banking agencies. Failure to meet minimum capital requirements can initiate certain mandatory and possibly additional discretionary actions by regulators that, if undertaken, could have a direct material effect on the financial statements. Under capital adequacy guidelines, the Bank must meet specific capital guidelines that involve quantitative measures of assets, liabilities, and certain off-balance sheet items as calculated under regulatory accounting practices. The capital amounts and classification are also subject to qualitative judgments by the regulators about components, risk weightings, and other factors.
Quantitative measures established by regulation to ensure capital adequacy require the Bank to maintain minimum amounts and ratios (set forth in the table below) of total and Tier 1 capital (as defined in the regulations) to risk-weighted assets (as defined) and to average assets (as defined).
108
INVESTAR HOLDING CORPORATION
Notes to Consolidated Financial Statements
As of December 31, 2016 and 2015, the most recent notifications from the FDIC categorized the Bank as well capitalized under the regulatory framework for prompt corrective action. To be categorized as well capitalized the Bank must maintain minimum total risk-based, Tier 1 leverage capital ratios as set forth in the table below. There are no conditions or events since those notifications that management believes have changed the Bank’s category.
The Company’s and the Bank’s actual capital amounts and ratios as of December 31, 2016 and December 31, 2015 are presented in the tables below (dollars in thousands).
|
|
|
Actual |
|
|
Capital Adequacy |
|
|
Well Capitalized |
|
|||||||||||||||
|
|
|
Amount |
|
|
Ratio |
|
|
Amount |
|
|
Ratio |
|
|
Amount |
|
|
Ratio |
|
||||||
|
December 31, 2016 |
|
|
|
|
|
|
|
|
|
|
|
|
|
|
|
|
|
|
|
|
|
|
|
|
|
Tier 1 leverage capital |
|
|
|
|
|
|
|
|
|
|
|
|
|
|
|
|
|
|
|
|
|
|
|
|
|
Investar Holding Corporation |
|
$ |
115,312 |
|
|
|
10.10 |
% |
|
$ |
45,689 |
|
|
|
4.00 |
% |
|
NA |
|
|
NA |
|
||
|
Investar Bank |
|
$ |
114,417 |
|
|
|
10.03 |
% |
|
$ |
45,651 |
|
|
|
4.00 |
% |
|
$ |
57,063 |
|
|
|
5.00 |
% |
|
|
|
|
|
|
|
|
|
|
|
|
|
|
|
|
|
|
|
|
|
|
|
|
|
|
|
Common Equity Tier 1 risk-based capital |
|
|
|
|
|
|
|
|
|
|
|
|
|
|
|
|
|
|
|
|
|
|
|
|
|
Investar Holding Corporation |
|
$ |
111,812 |
|
|
|
11.40 |
% |
|
$ |
44,144 |
|
|
|
4.50 |
% |
|
NA |
|
|
NA |
|
||
|
Investar Bank |
|
$ |
114,417 |
|
|
|
11.67 |
% |
|
$ |
44,104 |
|
|
|
4.50 |
% |
|
$ |
63,706 |
|
|
|
6.50 |
% |
|
|
|
|
|
|
|
|
|
|
|
|
|
|
|
|
|
|
|
|
|
|
|
|
|
|
|
Tier 1 risk-based capital |
|
|
|
|
|
|
|
|
|
|
|
|
|
|
|
|
|
|
|
|
|
|
|
|
|
Investar Holding Corporation |
|
$ |
115,312 |
|
|
|
11.75 |
% |
|
$ |
58,858 |
|
|
|
6.00 |
% |
|
NA |
|
|
NA |
|
||
|
Investar Bank |
|
$ |
114,417 |
|
|
|
11.67 |
% |
|
$ |
58,806 |
|
|
|
6.00 |
% |
|
$ |
78,408 |
|
|
|
8.00 |
% |
|
|
|
|
|
|
|
|
|
|
|
|
|
|
|
|
|
|
|
|
|
|
|
|
|
|
|
Total risk-based capital |
|
|
|
|
|
|
|
|
|
|
|
|
|
|
|
|
|
|
|
|
|
|
|
|
|
Investar Holding Corporation |
|
$ |
122,363 |
|
|
|
12.47 |
% |
|
$ |
78,478 |
|
|
|
8.00 |
% |
|
NA |
|
|
NA |
|
||
|
Investar Bank |
|
$ |
121,468 |
|
|
|
12.39 |
% |
|
$ |
78,408 |
|
|
|
8.00 |
% |
|
$ |
98,010 |
|
|
|
10.00 |
% |
|
|
|
|
|
|
|
|
|
|
|
|
|
|
|
|
|
|
|
|
|
|
|
|
|
|
|
December 31, 2015 |
|
|
|
|
|
|
|
|
|
|
|
|
|
|
|
|
|
|
|
|
|
|
|
|
|
Tier 1 leverage capital |
|
|
|
|
|
|
|
|
|
|
|
|
|
|
|
|
|
|
|
|
|
|
|
|
|
Investar Holding Corporation |
|
$ |
110,574 |
|
|
|
11.39 |
% |
|
$ |
38,836 |
|
|
|
4.00 |
% |
|
NA |
|
|
NA |
|
||
|
Investar Bank |
|
$ |
107,209 |
|
|
|
11.07 |
% |
|
$ |
38,749 |
|
|
|
4.00 |
% |
|
$ |
48,436 |
|
|
|
5.00 |
% |
|
|
|
|
|
|
|
|
|
|
|
|
|
|
|
|
|
|
|
|
|
|
|
|
|
|
|
Common Equity Tier 1 risk-based capital |
|
|
|
|
|
|
|
|
|
|
|
|
|
|
|
|
|
|
|
|
|
|
|
|
|
Investar Holding Corporation |
|
$ |
107,074 |
|
|
|
11.67 |
% |
|
$ |
41,281 |
|
|
|
4.50 |
% |
|
NA |
|
|
NA |
|
||
|
Investar Bank |
|
$ |
107,209 |
|
|
|
11.71 |
% |
|
$ |
41,200 |
|
|
|
4.50 |
% |
|
$ |
59,511 |
|
|
|
6.50 |
% |
|
|
|
|
|
|
|
|
|
|
|
|
|
|
|
|
|
|
|
|
|
|
|
|
|
|
|
Tier 1 risk-based capital |
|
|
|
|
|
|
|
|
|
|
|
|
|
|
|
|
|
|
|
|
|
|
|
|
|
Investar Holding Corporation |
|
$ |
110,574 |
|
|
|
12.05 |
% |
|
$ |
55,042 |
|
|
|
6.00 |
% |
|
NA |
|
|
NA |
|
||
|
Investar Bank |
|
$ |
107,209 |
|
|
|
11.71 |
% |
|
$ |
54,933 |
|
|
|
6.00 |
% |
|
$ |
73,244 |
|
|
|
8.00 |
% |
|
|
|
|
|
|
|
|
|
|
|
|
|
|
|
|
|
|
|
|
|
|
|
|
|
|
|
Total risk-based capital |
|
|
|
|
|
|
|
|
|
|
|
|
|
|
|
|
|
|
|
|
|
|
|
|
|
Investar Holding Corporation |
|
$ |
116,702 |
|
|
|
12.72 |
% |
|
$ |
73,389 |
|
|
|
8.00 |
% |
|
NA |
|
|
NA |
|
||
|
Investar Bank |
|
$ |
113,337 |
|
|
|
12.38 |
% |
|
$ |
73,244 |
|
|
|
8.00 |
% |
|
$ |
91,555 |
|
|
|
10.00 |
% |
109
INVESTAR HOLDING CORPORATION
Notes to Consolidated Financial Statements
Applicable Federal and State statutes and regulations impose restrictions on the amounts of dividends that may be declared by the Company. In addition to the formal statutes and regulations, regulatory authorities also consider the adequacy of the Company’s total capital in relation to its assets, deposits and other such items and, as a result, capital adequacy considerations could further limit the availability of dividends from the Company. In the event the Company is in default or has deferred interest payments on subordinated debentures, the Company would be restricted from paying dividends.
In July 2013, the federal banking regulatory agencies issued a final rule which revises the regulatory capital framework for financial institutions. The final rule (also known as the Basel III capital rules) covers a number of aspects pertaining to capital requirements.
These include:
|
|
• |
Prompt Corrective Action Capital Category Thresholds - The following thresholds have been established for an institution to be deemed adequately capitalized: |
|
Total Risk-Based Capital Ratio |
|
|
8.0 |
% |
|
Tier 1 Risk-Based Capital Ratio |
|
|
6.0 |
% |
|
Common Equity Tier 1 Capital Ratio |
|
|
4.5 |
% |
|
Tier 1 Leverage Ratio |
|
|
4.0 |
% |
|
|
• |
Establishment of a Capital Conservation Buffer - The Capital Conservation Buffer is phased in through 2019. |
|
|
• |
Changes in risk-weighting of assets. |
|
|
• |
Opt-out Election of Accumulated Other Comprehensive Income from Common Equity Tier 1 Capital. |
Financial institutions became subject to the final rule on January 1, 2015, although the rules will not be fully phased in until January 1, 2019.
Management is currently evaluating the provisions of the final rule and its expected impact on the Company and the Bank. Management believes that at December 31, 2016, the Company and the Bank would have met all new capital adequacy requirements on a fully phased-in basis if such requirements were then effective. There can be no assurances that the Basel III capital rules will not be revised before the effective date and expiration of the phase-in periods.
NOTE 18. COMMITMENTS AND CONTINGENCIES
Unfunded Commitments
The Company is a party to financial instruments with off-balance sheet risk entered into in the normal course of business to meet the financing needs of its customers. These financial instruments include commitments to extend credit consisting of loan commitments and standby letters of credit, which are not included in the accompanying financial statements.
Commitments to extend credit are agreements to lend money with fixed expiration dates or termination clauses. The Company applies the same credit standards used in the lending process when extending these commitments, and periodically reassesses the customer’s creditworthiness through ongoing credit reviews. Since some commitments are expected to expire without being drawn upon, the total commitment amounts do not necessarily represent future cash requirements. Collateral is obtained based on the Company’s assessment of the transaction. Essentially all standby letters of credit issued have expiration dates within one year. At December 31, 2016 and December 31, 2015, the Company’s commitments to extend credit totaled approximately $143.9 million and $149.9 million, respectively.
Additionally, at December 31, 2016, the Company had unfunded commitments of $0.9 million for its investment in Small Business Investment Company qualified funds.
Required Reserves
The Company is required to maintain average reserves at the Federal Reserve Bank. There were approximately $14.5 million and $12.7 million in reserves required at December 31, 2016 and December 31, 2015, respectively.
110
INVESTAR HOLDING CORPORATION
Notes to Consolidated Financial Statements
Effective May 1, 2014, the Company is obligated for certain costs associated with its insurance program for employee health. The Company is self-insured for a substantial portion of its potential claims. The Company recognizes its obligation associated with these costs, up to specified deductible limits in the period in which a claim is incurred, including with respect to both reported claims and claims incurred but not reported. The claims costs are estimated based on historical claims experience. The reserves for insurance claims are reviewed and updated by management on a quarterly basis.
NOTE 19. CONCENTRATIONS OF CREDIT
Substantially all of the Company’s loans and commitments have been granted to customers in the Company’s market area. The concentrations of credit by type of loan are set forth in Note 3, Loans. The distribution of commitments to extend credit approximates the distribution of loans outstanding.
The Company maintains deposit accounts and federal funds sold with correspondent banks which may, periodically, exceed the federally insured amount.
NOTE 20. TRANSACTIONS WITH RELATED PARTIES
The Bank has made, and expects in the future to continue to make in the ordinary course of business, loans to directors and executive officers of the Company, the Bank, and their affiliates. In management’s opinion, these loans were made in the ordinary course of business at normal credit terms, including interest rate and collateral requirements, and do not represent more than normal credit risk. See Note 3, Loans, for more information regarding lending transactions between the Company and these related parties.
During 2016 and 2015, certain executive officers and directors of the Company and the Bank, including companies with which they are affiliated, were deposit customers of the Bank. See Note 9, Deposits, regarding total deposits outstanding to these related parties.
The Company has transactions with related parties for which the Company believes the terms and conditions are comparable to terms that would have been available from a third party that was unaffiliated with the Company. The following describes transactions since January 1, 2014, in addition to the ordinary banking relationships described above, in which the Company has participated in which one or more of its directors, executive officers or other related persons had or will have a direct or indirect material interest.
Thomas C. Besselman, Sr., one of the Company’s directors, is the former owner and previously served as president of The Besselman & Little Agency, Inc. Mr. Besselman sold his interest in The Besselman & Little Agency, Inc. in 2012. Gallagher Benefit Services, successor in interest to The Besselman & Little Agency, wrote the Company’s employee benefits insurance until it became self-insured, effective May 1, 2014. Effective May 1, 2014, the Company pays Gallagher Benefit Services an annual fee of $60,000 for the administration of its benefit programs.
Both The Besselman & Little Agency and Gallagher Benefit Services paid a referral fee to the Company for referrals of clients to The Besselman & Little Agency or Gallagher Benefit Services for their insurance needs. The Company received referral fees of approximately $32,000, $70,000 and $74,000 for the years ended December 31, 2016, 2015 and 2014, respectively, from Gallagher Benefit Services.
Mr. Besselman is also the owner of H.R. Solutions, LLC, located in Baton Rouge, Louisiana, which provides the Company’s payroll processing services. The Company paid fees of approximately $61,000, $76,000 and $44,000 for the years ended December 31, 2016, 2015 and 2014, respectively, to H.R. Solutions, LLC.
The Company has engaged in a number of transactions with Joffrion Commercial Division, LLC, a commercial construction company owned and managed by Gordon H. Joffrion, one of the Company’s directors.
Joffrion Commercial Division, LLC was awarded the bid in the amount of $1.0 million for demolition and renovation of the third floor of the Clerk of Court building the Company purchased in Baton Rouge, Louisiana to serve as the Company’s Operations Center. The Company paid approximately $0.9 million to Joffrion Commercial Division, LLC for the demolition and renovation of this facility, which was completed in 2014.
111
INVESTAR HOLDING CORPORATION
Notes to Consolidated Financial Statements
In December 2013, the Company selected Joffrion Commercial Division, LLC’s bid to construct a new Baton Rouge branch located at 18101 Highland Market Drive, Baton Rouge, Louisiana. The Company paid approximately $0.9 million for the construction of this branch which was completed in 2014.
Joffrion Commercial Division, LLC was awarded the bid in the amount of $0.9 million for the construction of the new location for the Prairieville branch. The Company paid Joffrion Commercial Division, LLC $0.9 million related to the construction of the new branch location, which was completed in February 2015.
In August 2014, the Company selected Joffrion Commercial Division, LLC’s bid to construct a building in Gonzales, Louisiana, which was completed in 2015 and is expected to open in 2017, pending regulatory approval. The Company paid approximately $1.1 million for the construction of this branch.
In January 2016, the Company selected Joffrion Commercial Division, LLC’s bid in the amount of $0.6 million to renovate an existing branch location in Mandeville, Louisiana. The Company paid approximately $0.7 million for the branch renovation which was completed in May 2016.
In February 2016, the Company selected Joffrion Commercial Division, LLC’s bid in the amount of $0.7 million to renovate a building that was purchased in the Company’s New Orleans market as a potential branch location. The Company paid approximately $0.8 million for the building renovation which was completed in July 2016 and is expected to open in 2017, pending regulatory approval.
In August 2016, the Company selected Joffrion Commercial Division, LLC’s bid in the amount of $0.2 million for construction of a freestanding ATM on a tract of land in the Company’s Baton Rouge market. As of December 31, 2016, the Company paid approximately $45,000 for the project.
The Company believes that the terms and conditions of all of its transactions with Joffrion Commercial Division, LLC are comparable to terms that would have been available from a third party unaffiliated with the Company or the Bank.
112
INVESTAR HOLDING CORPORATION
Notes to Consolidated Financial Statements
NOTE 21. PARENT ONLY BALANCE SHEETS, STATEMENTS OF OPERATIONS AND STATEMENTS OF CASH FLOWS
|
BALANCE SHEETS |
|
|
|
|
|
|
|
|
|
December 31, |
|
|||||
|
(dollars in thousands) |
2016 |
|
|
2015 |
|
||
|
ASSETS |
|
|
|
|
|
|
|
|
Cash and due from bank |
$ |
1,038 |
|
|
$ |
1,901 |
|
|
Available for sale securities at fair value (amortized cost of $205 and $677, respectively) |
|
228 |
|
|
|
607 |
|
|
Accounts receivable |
|
26 |
|
|
|
100 |
|
|
Due from bank subsidiary |
|
265 |
|
|
|
509 |
|
|
Investment in bank subsidiary |
|
115,303 |
|
|
|
109,485 |
|
|
Investment in trust |
|
109 |
|
|
|
109 |
|
|
Investment in tax credit entity |
|
169 |
|
|
|
169 |
|
|
Trademark intangible |
|
100 |
|
|
|
- |
|
|
Deferred tax asset |
|
245 |
|
|
|
258 |
|
|
Other assets |
|
61 |
|
|
|
58 |
|
|
Total assets |
$ |
117,544 |
|
|
$ |
113,196 |
|
|
|
|
|
|
|
|
|
|
|
LIABILITIES |
|
|
|
|
|
|
|
|
Junior subordinated debt |
$ |
3,609 |
|
|
$ |
3,609 |
|
|
Other borrowings |
|
1,000 |
|
|
|
- |
|
|
Accounts payable |
|
87 |
|
|
|
170 |
|
|
Accrued interest payable |
|
5 |
|
|
|
4 |
|
|
Dividend payable |
|
86 |
|
|
|
63 |
|
|
Total liabilities |
|
4,787 |
|
|
|
3,846 |
|
|
|
|
|
|
|
|
|
|
|
STOCKHOLDERS’ EQUITY |
|
|
|
|
|
|
|
|
Common stock |
|
7,102 |
|
|
|
7,264 |
|
|
Surplus |
|
81,499 |
|
|
|
84,099 |
|
|
Retained earnings |
|
26,227 |
|
|
|
18,650 |
|
|
Accumulated other comprehensive loss |
|
(2,071 |
) |
|
|
(663 |
) |
|
Total stockholders’ equity |
|
112,757 |
|
|
|
109,350 |
|
|
|
|
|
|
|
|
|
|
|
Total liabilities and stockholders’ equity |
$ |
117,544 |
|
|
$ |
113,196 |
|
113
INVESTAR HOLDING CORPORATION
Notes to Consolidated Financial Statements
|
STATEMENTS OF OPERATIONS |
|
|
|
|
|
|
|
|
|
For the year ended December 31, |
|
|||||
|
(dollars in thousands) |
2016 |
|
|
2015 |
|
||
|
Revenue |
|
|
|
|
|
|
|
|
Dividends received from bank subsidiary |
$ |
2,100 |
|
|
$ |
- |
|
|
Dividends on corporate stock |
|
11 |
|
|
|
8 |
|
|
Gain on sale of investment securities, net |
|
61 |
|
|
|
68 |
|
|
Undistributed net income of bank subsidiary |
|
6,287 |
|
|
|
7,504 |
|
|
Partnership income |
|
- |
|
|
|
2 |
|
|
Interest income from investment in trust |
|
3 |
|
|
|
2 |
|
|
Total revenue |
|
8,462 |
|
|
|
7,584 |
|
|
|
|
|
|
|
|
|
|
|
Expense |
|
|
|
|
|
|
|
|
Interest on borrowings |
|
91 |
|
|
|
75 |
|
|
Management fees to bank subsidiary |
|
299 |
|
|
|
366 |
|
|
Impairment of investment in tax credit entity |
|
11 |
|
|
|
54 |
|
|
Other expense |
|
441 |
|
|
|
358 |
|
|
Total expense |
|
842 |
|
|
|
853 |
|
|
Income before income tax benefit |
|
7,620 |
|
|
|
6,731 |
|
|
|
|
|
|
|
|
|
|
|
Income tax benefit |
|
260 |
|
|
|
342 |
|
|
Net income |
$ |
7,880 |
|
|
$ |
7,073 |
|
114
INVESTAR HOLDING CORPORATION
Notes to Consolidated Financial Statements
|
STATEMENTS OF CASH FLOWS |
|
|
|
|
|
|
|
|
|
For the year ended December 31, |
|
|||||
|
(dollars in thousands) |
2016 |
|
|
2015 |
|
||
|
CASH FLOWS FROM OPERATING ACTIVITIES |
|
|
|
|
|
|
|
|
Net income |
$ |
7,880 |
|
|
$ |
7,073 |
|
|
Adjustments to reconcile net loss to net cash provided by operating activities: |
|
|
|
|
|
|
|
|
Undistributed earnings of bank subsidiary |
|
(6,287 |
) |
|
|
(7,504 |
) |
|
Gain on sale of available for sale securities |
|
(61 |
) |
|
|
(68 |
) |
|
Impairment of investment in tax credit entity |
|
11 |
|
|
|
54 |
|
|
Net change in: |
|
|
|
|
|
|
|
|
Due from bank subsidiary |
|
244 |
|
|
|
655 |
|
|
Other assets |
|
(28 |
) |
|
|
257 |
|
|
Deferred tax asset |
|
(19 |
) |
|
|
5 |
|
|
Accrued other liabilities |
|
448 |
|
|
|
200 |
|
|
Net cash provided by operating activities |
|
2,188 |
|
|
|
672 |
|
|
|
|
|
|
|
|
|
|
|
CASH FLOWS FROM INVESTING ACTIVITIES |
|
|
|
|
|
|
|
|
Capital contributed to bank subsidiary |
|
(1,000 |
) |
|
|
(25,500 |
) |
|
Purchases of investment securities available for sale |
|
(389 |
) |
|
|
(972 |
) |
|
Proceeds from the sale of investment securities available for sale |
|
924 |
|
|
|
364 |
|
|
Net cash used in investing activities |
|
(465 |
) |
|
|
(26,108 |
) |
|
|
|
|
|
|
|
|
|
|
CASH FLOWS FROM FINANCING ACTIVITIES |
|
|
|
|
|
|
|
|
Proceeds from borrowings |
|
1,000 |
|
|
|
- |
|
|
Cash dividends paid on common stock |
|
(278 |
) |
|
|
(221 |
) |
|
Payment to repurchase common stock |
|
(3,473 |
) |
|
|
(572 |
) |
|
Proceeds from stock options and warrants exercised |
|
165 |
|
|
|
135 |
|
|
Net cash used in financing activities |
|
(2,586 |
) |
|
|
(658 |
) |
|
|
|
|
|
|
|
|
|
|
Net decrease in cash |
|
(863 |
) |
|
|
(26,094 |
) |
|
Cash and cash equivalents, beginning of period |
|
1,901 |
|
|
|
27,995 |
|
|
Cash and cash equivalents, end of period |
$ |
1,038 |
|
|
$ |
1,901 |
|
|
|
|
|
|
|
|
|
|
|
SUPPLEMENTAL DISCLOSURES OF CASH FLOW INFORMATION: |
|
|
|
|
|
|
|
|
Cash payments for: |
|
|
|
|
|
|
|
|
Interest on borrowings |
$ |
89 |
|
|
$ |
75 |
|
115
INVESTAR HOLDING CORPORATION
Notes to Consolidated Financial Statements
The following is a summary of the information used in the computation of basic and diluted earnings per common share for the years ended December 31, 2016, 2015 and 2014 (in thousands, except share data).
|
|
December 31, |
|
|||||||||
|
|
2016 |
|
|
2015 |
|
|
2014 |
|
|||
|
|
|
|
|
|
|
|
|
|
|
|
|
|
Net income available to common stockholders |
$ |
7,880 |
|
|
$ |
7,073 |
|
|
$ |
5,397 |
|
|
Weighted average number of common shares outstanding used in computation of basic earnings per common share |
|
7,107,187 |
|
|
|
7,214,045 |
|
|
|
5,533,514 |
|
|
Effect of dilutive securities: |
|
|
|
|
|
|
|
|
|
|
|
|
Restricted stock |
|
10,228 |
|
|
|
5,861 |
|
|
|
41,467 |
|
|
Stock options |
|
19,685 |
|
|
|
21,150 |
|
|
|
22,811 |
|
|
Stock warrants |
|
12,734 |
|
|
|
16,952 |
|
|
|
179,510 |
|
|
Weighted average number of common shares outstanding plus effect of dilutive securities used in computation of diluted earnings per common share |
|
7,149,834 |
|
|
|
7,258,008 |
|
|
|
5,777,302 |
|
|
Basic earnings per share |
$ |
1.11 |
|
|
$ |
0.98 |
|
|
$ |
0.98 |
|
|
Diluted earnings per share |
$ |
1.10 |
|
|
$ |
0.97 |
|
|
$ |
0.93 |
|
NOTE 23. QUARTERLY RESULTS OF OPERATIONS (UNAUDITED)
|
(dollars in thousands, except per share data) |
First Quarter |
|
|
Second Quarter |
|
|
Third Quarter |
|
|
Fourth Quarter |
|
||||
|
Year Ended December 31, 2016 |
|
|
|
|
|
|
|
|
|
|
|
|
|
|
|
|
Total interest income |
$ |
10,378 |
|
|
$ |
10,719 |
|
|
$ |
10,993 |
|
|
$ |
11,062 |
|
|
Total interest expense |
|
1,831 |
|
|
|
2,061 |
|
|
|
2,240 |
|
|
|
2,281 |
|
|
Net interest income |
|
8,547 |
|
|
|
8,658 |
|
|
|
8,753 |
|
|
|
8,781 |
|
|
Provision for loan losses |
|
454 |
|
|
|
800 |
|
|
|
450 |
|
|
|
375 |
|
|
Net interest income after provision for loan losses |
|
8,093 |
|
|
|
7,858 |
|
|
|
8,303 |
|
|
|
8,406 |
|
|
Noninterest income |
|
1,287 |
|
|
|
2,256 |
|
|
|
1,029 |
|
|
|
896 |
|
|
Noninterest expense |
|
6,384 |
|
|
|
7,104 |
|
|
|
6,548 |
|
|
|
6,603 |
|
|
Income before income taxes |
|
2,996 |
|
|
|
3,010 |
|
|
|
2,784 |
|
|
|
2,699 |
|
|
Income tax expense (benefit) |
|
1,006 |
|
|
|
1,005 |
|
|
|
747 |
|
|
|
851 |
|
|
Net income |
$ |
1,990 |
|
|
$ |
2,005 |
|
|
$ |
2,037 |
|
|
$ |
1,848 |
|
|
Earnings per common share - basic |
$ |
0.28 |
|
|
$ |
0.28 |
|
|
$ |
0.29 |
|
|
$ |
0.26 |
|
|
Earnings per common share - diluted |
$ |
0.28 |
|
|
$ |
0.28 |
|
|
$ |
0.29 |
|
|
$ |
0.26 |
|
|
(dollars in thousands, except per share data) |
First Quarter |
|
|
Second Quarter |
|
|
Third Quarter |
|
|
Fourth Quarter |
|
||||
|
Year Ended December 31, 2015 |
|
|
|
|
|
|
|
|
|
|
|
|
|
|
|
|
Total interest income |
$ |
8,800 |
|
|
$ |
9,187 |
|
|
$ |
9,480 |
|
|
$ |
9,873 |
|
|
Total interest expense |
|
1,301 |
|
|
|
1,407 |
|
|
|
1,528 |
|
|
|
1,646 |
|
|
Net interest income |
|
7,499 |
|
|
|
7,780 |
|
|
|
7,952 |
|
|
|
8,227 |
|
|
Provision for loan losses |
|
700 |
|
|
|
400 |
|
|
|
400 |
|
|
|
365 |
|
|
Net interest income after provision for loan losses |
|
6,799 |
|
|
|
7,380 |
|
|
|
7,552 |
|
|
|
7,862 |
|
|
Noninterest income |
|
2,540 |
|
|
|
2,066 |
|
|
|
2,167 |
|
|
|
1,571 |
|
|
Noninterest expense |
|
6,424 |
|
|
|
6,682 |
|
|
|
7,013 |
|
|
|
7,234 |
|
|
Income before income taxes |
|
2,915 |
|
|
|
2,764 |
|
|
|
2,706 |
|
|
|
2,199 |
|
|
Income tax expense (benefit) |
|
965 |
|
|
|
951 |
|
|
|
850 |
|
|
|
745 |
|
|
Net income |
$ |
1,950 |
|
|
$ |
1,813 |
|
|
$ |
1,856 |
|
|
$ |
1,454 |
|
|
Earnings per common share - basic |
$ |
0.27 |
|
|
$ |
0.25 |
|
|
$ |
0.26 |
|
|
$ |
0.20 |
|
|
Earnings per common share - diluted |
$ |
0.27 |
|
|
$ |
0.25 |
|
|
$ |
0.26 |
|
|
$ |
0.20 |
|
116
INVESTAR HOLDING CORPORATION
Notes to Consolidated Financial Statements
On March 8, 2017, the Company announced that it has entered into a definitive agreement (the “Agreement”) to acquire Citizens Bancshares, Inc. (“Citizens”) and its wholly-owned subsidiary, Citizens Bank, in Ville Platte, Louisiana. According to the terms of the Agreement, Investar will pay a total amount of cash merger consideration to shareholders of Citizens equal to $45.8 million.
At December 31, 2016, Citizens had approximately $245.5 million in assets, $126.8 million in net loans, and $208.7 million in deposits and $35.6 million in stockholder’s equity. Citizens offers a full range of banking products and services to the residents of Evangeline Parish through its three branch locations.
Management has evaluated all subsequent events and transactions that occurred after December 31, 2016 up through the date that the financial statements were available to be issued and determined that there were no additional events that require disclosure, other than that described above. No additional events or changes in circumstances were identified that would have an adverse impact on the financial statements.
117
Item 9. Changes in and Disagreements with Accountants on Accounting and Financial Disclosures
None.
Item 9A. Controls and Procedures
Evaluation of Disclosure Controls and Procedures
As of the end of the period covered by this Annual Report on Form 10-K, the Company carried out an evaluation under the supervision and with the participation of its management, including the Chief Executive Officer and Chief Financial Officer (the Company’s principal executive and financial officers), of the effectiveness of the design and operation of the Company’s disclosure controls and procedures as defined in Exchange Act Rules 13a-15(e) and 15d-15(e). Based upon that evaluation, the Chief Executive Officer and Chief Financial Officer concluded that the Company’s disclosure controls and procedures were effective for ensuring that information the Company is required to disclose in reports that it files or submits under the Securities Exchange Act of 1934, as amended, is recorded, processed, summarized and reported within the time periods specified in the Securities and Exchange Commission’s rules and forms.
Changes in Internal Control over Financial Reporting
There were no changes to internal control over financial reporting during the fourth quarter of 2016 that have materially affected, or are reasonably likely to materially affect, the Company’s internal control over financial reporting.
Management’s Report on Internal Control over Financial Reporting
Management’s annual report on internal control over financial reporting and the report thereon of Postlethwaite & Netterville are included herein under Item 8, Financial Statements and Supplementary Data.
None.
118
Item 10. Directors, Executive Officers and Corporate Governance
Our board is currently comprised of 12 directors, each of whom was elected for a one-year term at our Annual Meeting of Shareholders held on May 18, 2016. In addition, the board of directors has nominated Robert Chris Jordan to stand for election as a director at our 2017 Annual Meeting of Shareholders.
Information about Directors and Director Nominees
The following lists each director currently serving on our board or nominated for the election to our board at the 2017 Annual Meeting of Shareholders and includes a brief discussion of the experience, qualifications and skills that led us to conclude that such individual should serve as a member of our board. We believe that our board of directors consists of a diverse collection of individuals who possess the integrity, education, work ethic and ability to work with others necessary to oversee our business effectively and to represent the interests of all shareholders. The information presented below highlights certain notable experience, qualifications and skills for each director and nominee, but does not provide an exhaustive catalog of each and every qualification and skill that a director or nominee possesses.
|
Name |
Age |
Background, Qualifications and Skills
|
|
James M. Baker Director since 2013 |
62 |
Since 1999, Mr. Baker served as the President and CEO of TOPCOR Companies, LLC, a consolidated group of 12 specialty contracting firms servicing the infrastructure and industrial markets, with offices in Houston, Texas, Lake Charles and Baton Rouge, Louisiana, Augusta, Georgia and Tampa, Florida. In 2016, Mr. Baker sold the assets of the firms to Structural Group, LLC, a privately held firm, where he is now employed as the Vice President of a new operating entity called Structural TOPCOR, LLC. Through his business activities, Mr. Baker brings a strong sense of the business conditions in our markets that is valuable to the board. He also understands the capital needs and other challenges that many of our business customers face, and his insights on this topic help us tailor our products and services for business owners.
|
|
Thomas C. Besselman, Sr. Director since 2009 |
67 |
Since 1971, Mr. Besselman has been a licensed Health, Life and Accident Insurance Professional. He is the former owner of The Besselman & Little Agency, L.L.C. in Baton Rouge, Louisiana, which he sold in April 2012. Mr. Besselman has also been the owner of H. R. Solutions, L.L.C., which provides the Bank’s payroll processing services, since June 2006. As a business owner, Mr. Besselman is able to add a borrower’s perspective to board discussions. Mr. Besselman’s extensive relationships in the Baton Rouge community also qualify him to serve on our board.
|
|
James H. Boyce, III Director since 2009 |
50 |
For over 20 years, Mr. Boyce has owned several convenience stores and three consumer loan and sub-prime auto lending companies in Ascension Parish, Louisiana. Consumer loans comprise a significant portion of our lending activities, and Mr. Boyce’s ownership of consumer loan companies allows him to provide sound advice regarding this aspect of our operations. In addition, being located in Ascension Parish, Louisiana, Mr. Boyce’s knowledge of this area helps us shape our policies for this and the other suburban areas of our markets.
|
119
|
Robert M. Boyce, Sr. Director since 2013 |
64 |
Mr. Boyce is retired, having recently sold his interest in Louisiana Machinery Company, L.L.C., a Caterpillar distributor located in Baton Rouge, Louisiana. From 1975 until August 2014, Mr. Boyce was an owner and officer of Louisiana Machinery Co., L.L.C. Mr. Boyce’s extensive experience in the Baton Rouge business community, and his significant contacts within the community, qualify him to serve on our board.
|
|
Director since 2009 |
57 |
Mr. D’Angelo has been the President and Chief Executive Officer of the Company since our organization as a bank holding company in 2013. He has also served as the Bank’s President and Chief Executive Officer since its organization in 2006. Prior to the Bank’s organization, Mr. D’Angelo was manager of the private banking, small business banking, construction lending, brokerage and trust areas of Hibernia National Bank (the predecessor to Capital One, N.A.) for more than six years in the East Baton Rouge Parish, Louisiana, market. From 1996 to 2005, Mr. D’Angelo was president and director of Aegis Lending Corporation, a company with lending operations in 46 states and the District of Columbia. As the founder of the Bank and its current Chief Executive Officer, Mr. D’Angelo has a detailed understanding of our history, current operations and future plans and strategies. His extensive banking experience is an additional qualification to serve on our board.
|
|
William H. Hidalgo, Sr. Director since 2013 |
77 |
Mr. Hidalgo, the Chairman of our board, is the owner and managing member of Halimar Shipyard, LLC, a shipyard management company in Morgan City, Louisiana, and is an active marine consulting engineer. From May 1994 to October 2001, Mr. Hidalgo served as President and CEO of Conrad Industries, Inc., a marine vessel and offshore drilling component construction company in Morgan City. As with a number of other directors, as a business owner, Mr. Hidalgo is able to add a borrower’s perspective to board discussions. His significant experience owning and operating companies also enables him to help the board efficiently manage the Company’s growth.
|
|
Gordon H. Joffrion, III Director since 2013 |
63 |
Mr. Joffrion has been a licensed general contractor since 1979. Since 2006, he has been the General Manager of Joffrion Construction, Inc. in Baton Rouge, Louisiana. Mr. Joffrion’s long-standing business and personal relationships in the Baton Rouge area, as well as his strong sense of the business conditions in Baton Rouge, qualify him to serve on the board.
|
|
Robert Chris Jordan Nominee for directorate |
63 |
Mr. R. Chris Jordan, a resident of New Iberia, Louisiana, currently serves as Managing Member of Vermillion Business Group, a company developing properties for several Fortune 500, a position he has held since 1989. The company also develops gated and non-gated subdivisions and industrial parks. Involved in numerous civic and non-profit associations, Mr. Jordan interacts with many people in the Lafayette region.
|
|
David J. Lukinovich Director since 2013 |
57 |
Mr. Lukinovich is a board certified tax attorney and a board certified estate planning and administration attorney. He has been president of his law firm, David J. Lukinovich, APLC, since 1995. Mr. Lukinovich’s extensive knowledge of tax matters provides the board with valuable insight regarding the tax implications of our strategies. Also, Mr. Lukinovich’s legal practice gives him insight regarding the issues that are important to our individual customers.
|
|
Suzanne O. Middleton Director since 2013 |
57 |
Ms. Middleton is the Chief Financial Officer of Credit One, LLC, a debt buying and Collection Company based in Metairie, Louisiana. She has held such position since April 1999. As a chief financial officer, Ms. Middleton is able to use her understanding of financial and accounting matters to help us shape our business plans. Also, her knowledge of the New Orleans area allows her to provide insight regarding our growth plans in this market.
|
|
Andrew C. Nelson, M.D. Director since 2013 |
51 |
Dr. Nelson is a board certified gastroenterologist. He has been a practicing partner with Gastroenterology Associates in Baton Rouge, Louisiana, since 1997. In addition to the different perspective on our banking operations that Dr. Nelson’s background as a physician gives him, Dr. Nelson is also a small business owner and adds this viewpoint to board discussions.
|
120
|
Director since 2013 |
53 |
Since 2002, Mr. Schneider has served as the Chief Information Officer of Gray and Company, Inc., the parent entity of multiple companies that engage in oil and gas exploration, property and casualty insurance and property management, among other activities, headquartered in Metairie, Louisiana. Since February 2014, he has also served as the presiding manager of Denkmann Interests, a collection of privately-held businesses headquartered in Flowood, Mississippi, that engage in land management, forestry, commercial real estate and oil and gas production. Mr. Schneider also serves on a number of non-profit boards. Mr. Schneider’s significant business experience, as well as his longstanding business and personal relationships in New Orleans, qualify him to serve on our board.
|
|
Frank L. Walker Director since 2013 |
56 |
Mr. Walker has been the Chief Financial Officer of JP Oil Holdings, LLC since 1996. JP Oil Holdings, headquartered in Lafayette, Louisiana, is an oil and gas exploration and production company operating nearly 200 active wells across several states. In addition to his understanding of financial matters resulting from his business experience, Mr. Walker’s knowledge and contacts in Lafayette help us to develop our strategies to further expand our presence in this area.
|
The names, ages, positions and business experience of our executive officers, except for Mr. D’Angelo, are listed below. Because he is also a member of our board, information about Mr. D’Angelo can be found under “Information about Directors and Director Nominees” above. All of our executive officers are appointed annually by the board of directors and serve at the discretion of the board.
|
Name |
Age |
Position |
|
Dane M. Babin |
41 |
Mr. Babin joined the Bank in July 2015 and served as its Operations Manager until October 2015 when he assumed the role of Chief Operations Officer of the Company and the Bank. Prior to joining the Bank, he served as the Chief Information Officer for Business First Bank in Baton Rouge, Louisiana from 2008 to 2015.
|
|
Rachel P. Cherco |
57 |
Ms. Cherco served as Chief Financial Officer of Investar Bank from 2006 to October 2015, when she assumed the role of Chief Accounting Officer of the Company and the Bank, and currently serves as the Treasurer of the Company and the Cashier of the Bank. Prior to 2006, Ms. Cherco was the Chief Financial Officer of United Community Bank from its chartering in 1998 until 2005.
|
|
Ryan P. Finnan |
42 |
Mr. Finnan served as Chief Operations Officer of Investar Bank from 2009 to October 2015, when he assumed his new position as the Bank’s Consumer and Business Banking President. From 2008 to 2009, he served as our Consumer Lending Manager. Prior to joining the Bank, Mr. Finnan was employed by Hibernia National Bank/Capital One as its Indirect Servicing Manager from 2005 through 2007.
|
|
Christopher L. Hufft |
44 |
Mr. Hufft joined the Bank in February 2014 as its Chief Accounting Officer. In October 2015, he assumed the role of Chief Financial Officer of the Company and the Bank. Prior to joining the Bank, Mr. Hufft served as the Vice President of Accounting at Amedisys, Inc., a publicly-traded home health and hospice company, from 2005 to February 2014. Mr. Hufft, a licensed certified public accountant, also spent seven years in public accounting, serving both public and privately-held clients in the banking, healthcare and manufacturing sectors.
|
121
SECTION 16(A) BENEFICIAL OWNERSHIP REPORTING COMPLIANCE
Section 16(a) of the Exchange Act requires our executive officers and directors and persons who own more than 10% of a registered class of our equity securities to file with the SEC and the Nasdaq reports of ownership of our securities and changes in their ownership on Forms 3, 4 and 5. Executive officers, directors and greater than 10% shareholders are required by SEC rules to furnish us with copies of all Section 16(a) reports they file.
Based solely upon a review of the reports on Forms 3 and 4 and amendments thereto furnished to us in 2016 and Forms 5 and amendments thereto furnished to us with respect to 2016, or written representations from reporting persons that no Form 5 filing was required, we believe that in 2016, all of our executive officers, directors and greater than 10% owners timely filed all reports they were required to file under Section 16(a) with the exception of Mr. Lukinovich, who inadvertently failed to timely file one Form 4 to report a purchase of common stock. This transaction was subsequently reported on a Form 4.
Code of Conduct and Ethics
The Company has adopted a Code of Ethics for the Chief Executive Officer and Senior Financial Officers that applies to its chief executive officer, chief financial officer, chief accounting officer and any other senior financial officers, and the Company has also adopted a Code of Conduct that applies to all of the Company’s directors, officers and employees. The full text of the Code of Ethics for the Chief Executive Officer and Senior Financial Officers and the Code of Conduct can be found by clicking on “Corporate Governance” under the “Investor Relations” tab on the Company’s website, www.investarbank.com, and then by clicking on “Code of Ethics for the Chief Executive Officer and Senior Financial Officers” or “Code of Conduct,” as applicable. The Company intends to satisfy the disclosure requirement under Item 5.05(c) of Form 8-K regarding an amendment to, or waiver from, a provision of the Company’s Code of Ethics for the Chief Executive Officer and Senior Financial Officers by posting such information on its website, at the address specified above.
CORPORATE GOVERNANCE
To assist in the performance of its responsibilities, our board of directors has established standing committees. These committees include our executive committee as well as our audit committee, compliance committee, compensation committee and nominating and governance committee. Each of our audit, compliance, compensation, and nominating and governance committees are composed entirely of independent directors. Each committee has adopted a written charter, a copy of which is available at www.investarbank.com by clicking on “Corporate Governance” under the “Investor Relations” tab and then clicking on the appropriate committee charter. The table below reflects the current membership of our standing committees.
122
|
Executive Committee |
Audit Committee |
Compliance Committee |
Compensation Committee |
Nominating and Governance Committee |
|
|
John J. D'Angelo |
Chairman |
|
|
|
|
|
James M. Baker |
|
|
|
X |
X |
|
Thomas C. Besselman, Sr. |
X |
|
|
|
|
|
James H. Boyce, III |
|
|
|
X |
X |
|
Robert M. Boyce, Sr. |
|
|
|
|
X |
|
William H. Hidalgo, Sr. |
X |
|
|
|
|
|
Gordon H. Joffrion, III |
|
|
|
|
|
|
David J. Lukinovich |
|
X |
Chairman |
|
X |
|
Suzanne O. Middleton |
X |
|
|
Chairman |
|
|
Andrew C. Nelson, M.D. |
X |
|
|
X |
Chairman |
|
Carl R. Schneider, Jr. |
|
X |
X |
|
|
|
Frank L. Walker |
|
Chairman |
X |
|
|
Audit Committee Independence and Financial Experts
The board has determined that each member of the audit committee (1) is an “independent director” as defined in Rule 5605(a)(2) of the Nasdaq Marketplace Rules, (2) meets the criteria for independence in Rule 10A-3(b)(1) of the Exchange Act and (3) satisfies the other requirements for audit committee membership under the Nasdaq Marketplace Rules. The board has determined that David J. Lukinovich qualifies as an “audit committee financial expert” under applicable SEC rules and regulations and satisfies the financial sophistication requirements under Rule 5605(c)(2)(A) of the Nasdaq Marketplace Rules.
123
Item 11. Executive Compensation
EXECUTIVE COMPENSATION
The fundamental purpose of our executive compensation program is to assist us in achieving our financial and operating performance objectives. Specifically, we attempt to tailor an executive’s compensation to (1) retain and motivate the executive, (2) reward him or her upon the achievement of company-wide, department and individual performance goals and (3) align the executive’s interest with the creation of long-term shareholder value, without encouraging excessive risk taking. We have compensated our named executive officers through a mix of base salary, cash bonuses, equity-based incentives and other broad-based benefits, primarily consisting of retirement benefits generally available to all employees and insurance. We believe the mix of these compensation elements and the amounts of each element in 2016 provided our named executive officers with compensation that was reasonably competitive with our peers, and appropriately rewarded each named executive officer for his contribution to our performance.
Our compensation committee determines the compensation of our executive officers and our directors and recommends to our full board the amount and type of compensation for our executive officers and our directors.
The compensation committee usually determines its recommendations regarding the compensation to be paid in an upcoming year to our named executive officers either at its December meeting in the prior year or, if circumstances make such a meeting impractical, as soon as possible in the new fiscal year. At this meeting, the committee evaluates the performance of our named executive officers during the past year and recommends adjustments to base salaries and individual equity compensation awards to be made for the upcoming year, including any performance objectives or other restrictions that must be satisfied as a condition of any grant or award. In addition, the committee determines the amount of our named executive officers’ annual cash bonuses for the immediately completed fiscal year and, to the extent any equity compensation for that year was contingent on the attainment of performance goals, determines whether and to what extent the goals have been satisfied.
Role of Our Officers Relating to Executive Compensation
Our executive officers compile and provide information, make recommendations, and assist in the management and administration of our executive compensation plans. Their responsibilities may include, but are not limited to, the following:
|
|
• |
Recommending pay levels and equity compensation awards for key executive officers, other than our chief executive officer; |
|
|
• |
Recommending changes to ensure that our compensation programs remain competitive and aligned with our objectives; and |
|
|
• |
Providing information and data to the committee, including, but not limited to: (1) information concerning Company and individual performance; (2) information concerning the attainment of our strategic objectives; (3) the common stock ownership of each executive and his or her option holdings; (4) information about equity compensation plan dilution; (5) quantification of all forms of compensation payable to our executives; and (6) peer group compensation and performance data. |
Our executive officers may attend meetings at the request of the committee, except that Mr. D’Angelo is not present during the deliberations of his compensation.
Use of Compensation Consultants
Under its charter, the compensation committee has the authority to retain its own independent compensation consultant. In 2015, the Company’s management engaged Creative Compensation Solutions to provide consulting services with respect to developing salary ranges and grades for all positions within Investar and the Bank, including our executive officer positions, based on market data. Prior to its engagement of Creative Compensation Solutions, our management considered the nature of any work previously performed by the Creative Compensation Solutions for us or the compensation committee and evaluated whether there were any relationships between it and the Company or its directors, officers or employees. Our management concluded that the engagement of Creative Compensation Solutions did not raise any conflicts of interest issues. The compensation committee reviewed the information from the consultant regarding all employee positions before making its compensation recommendations to the full board.
Narrative to Summary Compensation Table for 2016
During 2016, our executive compensation program consisted of the five elements described below.
Base salary. Our board of directors sets each named executive officer’s base salary annually, based on the recommendation of the compensation committee. Effective April 1, 2016, the board approved increases to the base salaries of our executives as reflected in the Summary Compensation Table. Adjustments to base salary are based upon a review of a variety of factors, including the following:
|
|
• |
individual and Bank performance, measured against quantitative and qualitative goals, such as our growth, asset quality, profitability and other matters, including the status of our relationship with the banking regulatory agencies; |
124
|
|
• |
the types and amount of each element of compensation to be paid to the named executive officer. |
Cash incentives. We offer annual cash incentives to certain employees, including our named executive officers. The cash incentive is intended to encourage high levels of performance and to enable the Company to recruit, retain and motivate employees by rewarding individuals for the Company’s profitability. The amount of an incentive bonus and the performance goals that must be satisfied to earn a bonus are based on an employee’s position at the Bank and are set at the beginning of each year. The compensation committee approves the total incentive bonus that each employee is eligible to earn, while the individual performance goals are set by Mr. D’Angelo (except that the compensation committee establishes the goals applicable to Mr. D’Angelo’s incentive bonus). For our named executive officers, performance goals for 2016 related to, among other factors, the Bank’s pre-tax net income to the budget, our return on assets and efficiency ratio as well as our regulatory exam results.
Except for sign-on bonuses that we may pay in connection with the hiring of an executive officer, we do not pay discretionary cash bonuses.
Equity Compensation. Equity compensation is awarded under our 2014 Long-Term Incentive Compensation Plan, (the “Equity Incentive Plan”). Awards of equity compensation are intended to align the interests of our executives with the interests of our shareholders in a manner that does not encourage excessive risk-taking. The committee uses restricted stock to provide immediate alignment of executive and shareholder interests, and stock options to incent longer-term performance because options have value only to the extent our share price increases during the exercise period. Our executives may receive equity compensation in the form of one or both of these awards. During 2016, the committee approved the following grants under the Equity Incentive Plan to our named executive officers:
|
Name |
Stock Options |
|
Shares of Restricted Stock |
|
||
|
John J. D'Angelo |
|
29,070 |
|
|
7,003 |
|
|
Christopher L. Hufft |
|
8,721 |
|
|
2,101 |
|
|
Dane M. Babin |
|
- |
|
|
1,050 |
|
Please refer to “Compensation Tables—Outstanding Equity Awards at Fiscal Year End” for information about the terms of our stock option grants and outstanding restricted stock awards.
Perquisites and Welfare Benefits. We maintain a number of broad-based benefit plans that are available to all of our employees, including group medical, dental and life insurance plans, some of which are contributory. Our named executive officers may participate in these plans. In addition, we maintain bank-owned life insurance policies with respect to each of the Company’s named executive officers. Although Investar Bank is the named beneficiary of each of those policies, we have agreed with each of those named executive officers that if the officer dies while employed by Investar Bank, the Company will pay such named executive officer’s estate an amount equal to 130% of that officer’s salary for the year in which his death occurs out of the benefits Investar Bank receives under such policy.
Other perquisites we provide to certain of our named executive officers are an allowance for vehicle expenses and country club dues. In 2016, the value of these perquisites did not exceed $10,000 for any of our executive officers. Although these perquisites involve incidental personal value, we believe both are necessary to advance our business purposes.
Retirement and Termination Benefits. We offer our employees who have completed 90 days of service participation in a tax-qualified defined contribution 401(k) plan sponsored by the Bank, which is intended to incent retirement savings on a tax-advantaged basis. We match voluntary deferrals, not in excess of 4% of each employee’s compensation. Our matching contributions, as well as voluntary employee deferrals, are fully vested at all times. Benefits under the plan are equal to each employee’s account balance and may be distributed upon separation from employment, generally in the form of a single sum.
We do not maintain any defined benefit plan, actuarial benefit plan, supplemental executive retirement plan or deferred compensation plan for any of our executive officers. In addition, we have not entered into any change in control, severance or noncompetition agreements with any executive officer, nor are we otherwise obligated to pay any executive officer any amounts if there is a change in control of the Company or the Bank or if such executive’s employment with us terminates.
Our named executive officers’ base compensation for our 2016 fiscal year is set forth below in the Summary Compensation Table in the section titled “Compensation Tables.”
The following table provides information regarding the compensation paid to our principal executive officer and our two most highly compensated officers other than our principal executive officer, whom we refer to collectively as our “named executive officers,” for our fiscal years ended December 31, 2016 and 2015.
125
|
|
||||||||||||||||||||||||||||
|
Name and Principal Position |
|
Year |
|
|
Salary(1) |
|
|
Stock Awards(2) |
|
|
Option Awards(2) |
|
|
Non-Equity Incentive Plan Compensation(3) |
|
|
All Other Compensation |
|
|
Total |
|
|||||||
|
John J. D'Angelo |
|
|
2016 |
|
|
$ |
367,449 |
|
|
$ |
100,002 |
|
|
$ |
100,000 |
|
|
$ |
86,875 |
|
|
$ |
20,924 |
(4) |
|
$ |
675,250 |
|
|
President and Chief Executive Officer |
|
|
2015 |
|
|
|
342,625 |
|
|
|
37,500 |
|
|
|
112,500 |
|
|
|
65,698 |
|
|
|
19,548 |
|
|
|
577,871 |
|
|
Christopher L. Hufft |
|
|
2016 |
|
|
|
182,600 |
|
|
|
30,000 |
|
|
|
30,000 |
|
|
|
16,263 |
|
|
|
9,080 |
|
|
|
267,943 |
|
|
Chief Financial Officer |
|
|
2015 |
|
|
|
168,547 |
|
|
|
11,250 |
|
|
|
33,750 |
|
|
|
14,835 |
|
|
|
8,350 |
|
|
|
236,732 |
|
|
Dane M. Babin |
|
|
2016 |
|
|
|
168,738 |
|
|
|
15,000 |
|
|
|
- |
|
|
|
26,818 |
|
|
|
14,602 |
|
|
|
225,158 |
|
|
Chief Operations Officer |
|
|
|
|
|
|
|
|
|
|
|
|
|
|
|
|
|
|
|
|
|
|
|
|
|
|
|
|
|
|
|
|
|
|
|
|
|
|
|
|
|
|
|
|
|
|
|
|
|
|
|
|
|
|
|
|
|
|
|
(1) |
Includes amounts deferred under the Company’s 401(k) plan. |
|
(2) |
The dollar amount of our stock option grants and time-based restricted stock awards reflects the aggregate fair value determined as of the date of the grant or award in accordance with Financial Accounting Standards Board Accounting Standards Codification Topic 718, Stock Compensation. Please refer to Note 13, “Stockholders’ Equity” in the Notes to Consolidated Financial Statements in Item 8, Financial Statements and Supplementary Data, for details regarding the assumptions used to derive the fair value of our stock option grants and restricted stock awards. |
|
(3) |
Represents payout of annual cash incentives. |
|
(4) |
Includes Company contributions to our 401(k) plan in the amount of $10,600. |
The following table provides information regarding outstanding stock options and unvested restricted stock awards that our named executive officers held as of December 31, 2016. Each grant listed below was made under our Equity Incentive Plan. Under the terms of the stock option grants and restricted stock awards, if a change in control (as defined in the Equity Incentive Plan) occurs, the options will become fully vested and remain exercisable until their expiration while the shares of restricted stock will remain subject to applicable vesting conditions, except that such conditions lapse if the holder of the shares of restricted stock is involuntarily terminated (other than for cause as defined in the Equity Incentive Plan) during the 24-month period after a change of control. The options and restricted stock, whether or not then vested, are subject to forfeiture in the event of an involuntary termination for cause or voluntary separation from service. The options are exercisable only during the period of employment, except that an extended exercise period is available in the event of the holder’s death, disability, retirement, or involuntary termination of employment without cause.
126
|
|
||||||||||||||||||||||||||
|
Option Awards |
|
Stock Awards |
|
|||||||||||||||||||||||
|
Name |
|
Option Grant Date |
|
|
Number of Securities Underlying Unexercised Options (#) Exercisable |
|
|
Number of Securities Underlying Unexercised Options (#) Unexercisable |
|
|
Option Exercise Price ($) |
|
|
Option Expiration Date |
|
Number of Shares or Unites of Stock That Have Not Vested (#)(1) |
|
|
Market Value of Shares of Units of Stock That Have Not Vested ($)(2) |
|
||||||
|
John J. D'Angelo |
|
07/01/2014 |
|
|
|
23,334 |
|
|
|
46,666 |
(3) |
|
$ |
14.00 |
|
|
07/01/2024 |
|
|
11,125 |
|
|
$ |
207,481 |
|
|
|
|
|
04/30/2015 |
|
|
|
6,000 |
|
|
|
24,000 |
(4) |
|
|
15.74 |
|
|
04/01/2025 |
|
|
|
|
|
|
|
|
|
|
|
|
03/01/2016 |
|
|
|
- |
|
|
|
29,070 |
(5) |
|
|
14.28 |
|
|
03/01/2026 |
|
|
|
|
|
|
|
|
|
|
Christopher L. Hufft |
|
07/01/2014 |
|
|
|
2,166 |
|
|
|
4,334 |
(3) |
|
|
14.00 |
|
|
07/01/2024 |
|
|
3,316 |
|
|
|
61,843 |
|
|
|
|
|
04/30/2015 |
|
|
|
1,800 |
|
|
|
7,200 |
(4) |
|
|
15.74 |
|
|
04/01/2025 |
|
|
|
|
|
|
|
|
|
|
|
|
03/01/2016 |
|
|
|
- |
|
|
|
8,721 |
(5) |
|
|
14.28 |
|
|
03/01/2026 |
|
|
|
|
|
|
|
|
|
|
Dane M. Babin |
|
|
|
|
|
|
|
|
|
|
|
|
|
|
|
|
|
|
|
|
1,827 |
|
|
|
34,074 |
|
|
|
|
|
|
|
|
|
|
|
|
|
|
|
|
|
|
|
|
|
|
|
|
|
|
|
|
|
|
|
|
|
|
|
|
|
|
|
|
|
|
|
|
|
|
|
|
|
|
|
|
|
|
|
|
|
|
|
|
|
|
|
|
|
|
|
|
|
|
|
|
|
|
|
|
|
|
|
|
|
|
|
|
|
|
|
|
|
|
|
|
|
|
|
|
|
|
|
|
|
|
|
|
|
|
|
|
|
|
|
|
|
|
(1) The unvested stock awards will vest as shown in the table below in accordance with the terms of the restricted stock agreement. |
|
|||||||||||||||||||||||||
|
|
|
|
|
|
|
|
|
|
|
|
|
|
|
|
|
|
|
|
|
|
|
|
|
|
|
|
|
Name |
|
Shares |
|
|
Vesting Date |
|
||||||||||||||||||||
|
John J. D'Angelo |
|
|
500 |
|
|
On July 1, 2017 |
|
|||||||||||||||||||
|
|
|
|
1,715 |
|
|
One half of total on each of July 1, 2017 and 2018 |
|
|||||||||||||||||||
|
|
|
|
1,907 |
|
|
One fourth of total on each of April 1, 2017, 2018, 2019, and 2020 |
|
|||||||||||||||||||
|
|
|
|
7,003 |
|
|
One fifth of total on each of March 1, 2017, 2018, 2019, 2020, 2021 |
|
|||||||||||||||||||
|
|
|
|
|
|
|
|
|
|
|
|
|
|
|
|
|
|
|
|
|
|
|
|
|
|
|
|
|
Christopher L. Hufft |
|
|
643 |
|
|
One third of total on each of March 31, 2017, 2018, and 2019 |
|
|||||||||||||||||||
|
|
|
|
572 |
|
|
One fourth of total on each of April 1, 2017, 2018, 2019, and 2020 |
|
|||||||||||||||||||
|
|
|
|
2,101 |
|
|
One fifth of total on each of March 1, 2017, 2018, 2019, 2020, 2021 |
|
|||||||||||||||||||
|
|
|
|
|
|
|
|
|
|
|
|
|
|
|
|
|
|
|
|
|
|
|
|
|
|
|
|
|
Dane M. Babin |
|
|
777 |
|
|
One fourth of total on each of August 1, 2017, 2018, 2019, and 2020 |
|
|||||||||||||||||||
|
|
|
|
1,050 |
|
|
One fifth of total on each of March 1, 2017, 2018, 2019, 2020, 2021 |
|
|||||||||||||||||||
|
|
|
|
|
|
|
|
|
|
|
|
|
|
|
|
|
|
|
|
|
|
|
|
|
|
|
|
|
(2) This column represents the market value of the shares of restricted stock as of December 31, 2016, based on the closing price of our common stock, as reported on the Nasdaq Global Market, of $18.65 per share on December 30, 2016. |
|
|||||||||||||||||||||||||
|
(3) Options vest on a pro rata basis over a six-year service period, beginning July 1, 2015. |
|
|||||||||||||||||||||||||
|
(4) Options vest on a pro rata basis over a five-year service period, beginning April 1, 2016. |
|
|||||||||||||||||||||||||
|
(5) Options vest on a pro rata basis over a five-year service period, beginning March 1, 2017. |
|
|||||||||||||||||||||||||
NON-EMPLOYEE DIRECTOR COMPENSATION
Our non-employee directors are compensated with restricted stock for their service on the board. The restricted stock vests in one-half increments over a two-year vesting period. Directors who are also our employees do not receive additional compensation for their service as directors. On January 1, 2016, our non-employee directors were granted restricted stock with a target grant date fair value of $7,000, or $8,000 for committee chairmen, for their service on our board. The restricted stock vests in equal installments on the first two anniversaries of the grant date.
The following table sets forth compensation paid during 2016 to each of our non-employee directors.
|
Director Compensation Table |
|
|||||||
|
Name(1) |
|
Stock Award(2) |
|
|
Total |
|
||
|
Robert M. Boyce, Sr., William H. Hidalgo, Sr., David J. Lukinovich, Suzanne O. Middleton, Andrew C. Nelson, M.D. |
|
$ |
7,988 |
|
|
$ |
7,988 |
|
|
James M. Baker, Thomas C. Besselman, Sr., James H. Boyce, III, J.E. Brignac, Jr.(3), Gordon H. Joffrion, III, Carl R. Schneider, Jr., and Frank L. Walker |
|
|
6,993 |
|
|
|
6,993 |
|
|
|
|
|
|
|
|
|
|
|
127
|
(2) |
The dollar amount of our stock option grants and time-based restricted stock awards reflects the aggregate fair value determined as of the date of the grant or award in accordance with Financial Accounting Standards Board Accounting Standards Codification Topic 718, Stock Compensation. Please refer to Note 13, “Stockholders’ Equity” in the Notes to Consolidated Financial Statements in Item 8, Financial Statements and Supplementary Data, for details regarding the assumptions used to derive the fair value of our stock option grants and restricted stock awards. |
|
(3) |
Resigned as director effective February 2016, at which time all of his restricted shares vested. |
COMPENSATION COMMITTEE INTERLOCKS AND INSIDER PARTICIPATION
The members of the compensation committee during 2016 were Suzanne O. Middleton (Chairman), James M. Baker, James H. Boyce, III and Andrew C. Nelson, M.D. In 2016, no member of the compensation committee was an officer or employee of the Company or any of its subsidiaries or was formerly an officer of the Company or any of its subsidiaries, and no member had any relationship, other than ordinary course loan and other banking relationships, requiring disclosure as a related person transaction under applicable SEC regulations.
In addition, in 2016, none of our officers served as a member of the compensation committee of another entity, or as a director of another entity, one of whose executive officers served on our compensation committee or as one of our directors.
128
Item 12. Security Ownership of Certain Beneficial Owners and Management and Related Stockholder Matters
STOCK OWNERSHIP OF CERTAIN BENEFICIAL OWNERS
As of February 28, 2017, we had approximately 951 shareholders of record. The following table sets forth information regarding the beneficial ownership of our common stock as of February 28, 2017, by each person or entity, including any group (as that term is used in Section 13(d)(3) of the Securities Exchange Act of 1934, as amended, or the Exchange Act), known to us to be the beneficial owner of 5% or more of our outstanding common stock. Beneficial ownership has been determined in accordance with Rule 13d-3 under the Exchange Act and is based upon the number of shares of our common stock outstanding as of February 28, 2017, which was 7,126,975 shares.
|
Name and Address |
|
Number of Shares Beneficially Owned |
|
|
Percent of Class |
|
|
||
|
|
|
611,938 |
(1) |
|
|
8.6 |
% |
|
|
|
1313 Dolley Madison Boulevard, Suite 306 |
|
|
|
|
|
|
|
|
|
|
McLean, VA 22101 |
|
|
|
|
|
|
|
|
|
|
Maltese Capital Management LLC |
|
|
403,222 |
(2) |
|
|
5.7 |
% |
|
|
150 East 52nd Street, 30th Floor |
|
|
|
|
|
|
|
|
|
|
New York, NY 10022 |
|
|
|
|
|
|
|
|
|
|
Endeavour Capital Advisors Inc. |
|
|
521,270 |
(3) |
|
|
7.3 |
% |
|
|
410 Greenwich Avenue |
|
|
|
|
|
|
|
|
|
|
Greenwich, CT 06830 |
|
|
|
|
|
|
|
|
|
|
Charles J. Moore and Associates |
|
|
446,734 |
(4) |
|
|
6.3 |
% |
|
|
20 North Wacker Drive, Suite 3300 |
|
|
|
|
|
|
|
|
|
|
Chicago, IL 60606 |
|
|
|
|
|
|
|
|
|
|
|
|
|
|
|
|
|
|
|
|
|
(1) |
The amount shown in the table above and the following information are based on a Schedule 13G/A filed with the SEC on February 14, 2017 by FJ Capital Management LLC (“FJ Capital”) reporting beneficial ownership as of December 31, 2016. FJ Capital has shared voting power with respect to all of the shares and shared dispositive power with respect 320,512 of the shares covered by the Schedule 13G/A. FJ Capital is a registered sub-investment advisor to clients of FJ Capital that are the record owners of the shares. To the knowledge of FJ Capital, no client owns more than 5% of our common stock. |
|
(2) |
The amount shown in the table above and the following information are based on a Schedule 13G/A filed with the SEC on February 2, 2017 by Maltese Capital Management LLC (“Maltese Capital”) reporting beneficial ownership as of December 31, 2016. Maltese Capital has shared voting and dispositive power with respect to all of the shares covered by the Schedule 13G/A. Maltese Capital is a registered investment advisor to clients of Maltese Capital that are the record owners of the shares. To the knowledge of Maltese Capital, no client owns more than 5% of our common stock. |
|
(3) |
The amount shown in the table above and the following information are based on a Schedule 13G filed with the SEC on February 14, 2017 by Endeavour Capital Advisors Inc. (“Endeavour Capital”) reporting beneficial ownership as of December 31, 2016. Endeavour Capital has shared voting and dispositive power with respect to all of the shares covered by the Schedule 13. Endeavour Capital is a registered investment advisor to clients of Endeavour Capital that are the record owners of the shares. To the knowledge of Endeavour Capital, no client owns more than 5% of our common stock. |
|
(4) |
The amount shown in the table above and the following information are based on a Schedule 13G filed with the SEC on February 15, 2017 by Banc Fund VI L.P., Banc Fund VII L.P., Banc Fund VIII L.P., and Banc Fund IX L.P. (collectively, the “Funds”) reporting beneficial ownership as of December 31, 2016. Banc Funds Company, L.L.C. ("Banc Funds") is the general partner of each of the Funds. As reported in the Schedule 13G, through his positions as manager of the Funds and principle of Banc Funds, Charles J. Moore has sole voting and dispositive power with respect to all of the shares covered by the Schedule 13G. To the knowledge of Banc Funds, no client owns more than 5% of our common stock. |
STOCK OWNERSHIP OF DIRECTORS AND OFFICERS
The following table includes information about the common stock owned by our directors, nominees and executive officers, as of February 28, 2017, including each individual’s name, position and the number of shares beneficially owned by each. Each of the persons listed in the table below under the heading “Directors and Nominees” currently serves as a director of the Company, with the exception of Robert Chris Jordan who was nominated by the board of directors to stand for election as a director at our 2017 Annual Meeting of Shareholders. Unless otherwise noted, the persons below have sole voting power and investment power with respect to the listed shares (subject to any applicable community property laws). The business address for each of the directors and executive officers listed below is 7244 Perkins Road, Baton Rouge, Louisiana 70808. In computing each listed person’s particular percentage ownership, we deemed as outstanding any shares of common stock subject to options or warrants held by that person that are exercisable currently or within 60 days of February 28, 2017. However in accordance with SEC rules, we did not deem these shares outstanding for the purpose of computing the percentage ownership of any other person.
129
|
|
Number of Shares |
|
|
Number of Shares Subject to Exercisable Options |
|
|
Total Beneficial Ownership |
|
|
Percent of Class(1) |
|
|
|||||
|
Directors and Nominees: |
|
|
|
|
|
|
|
|
|
|
|
|
|
|
|
|
|
|
James M. Baker |
|
|
4,688 |
|
|
|
- |
|
|
|
4,688 |
|
|
* |
|
|
|
|
Thomas C. Besselman, Sr. |
|
|
88,758 |
|
|
|
- |
|
|
|
88,758 |
|
|
|
1.25 |
% |
|
|
James H. Boyce, III |
|
|
9,947 |
|
|
|
- |
|
|
|
9,947 |
|
|
* |
|
|
|
|
Robert M. Boyce, Sr. |
|
|
52,138 |
|
|
|
- |
|
|
|
52,138 |
|
|
* |
|
|
|
|
William H. Hidalgo, Sr. |
|
|
56,454 |
(2) |
|
|
- |
|
|
|
56,454 |
|
|
* |
|
|
|
|
Gordon H. Joffrion, III |
|
|
26,463 |
(3) |
|
|
- |
|
|
|
26,463 |
|
|
* |
|
|
|
|
Robert Chris Jordan |
|
|
21,190 |
|
|
|
- |
|
|
|
21,190 |
|
|
* |
|
|
|
|
David J. Lukinovich |
|
|
44,349 |
(4) |
|
|
- |
|
|
|
44,349 |
|
|
* |
|
|
|
|
Suzanne O. Middleton |
|
|
24,615 |
|
|
|
- |
|
|
|
24,615 |
|
|
* |
|
|
|
|
Andrew C. Nelson, M.D. |
|
|
93,086 |
(5) |
|
|
- |
|
|
|
93,086 |
|
|
|
1.31 |
% |
|
|
Carl R. Schneider, Jr. |
|
|
10,366 |
(6) |
|
|
- |
|
|
|
10,366 |
|
|
* |
|
|
|
|
Frank L. Walker |
|
|
28,102 |
|
|
|
- |
|
|
|
28,102 |
|
|
* |
|
|
|
|
|
|
|
|
|
|
|
|
|
|
|
|
|
|
|
|
|
|
|
Named Executive Officers: |
|
|
|
|
|
|
|
|
|
|
|
|
|
|
|
|
|
|
John J. D'Angelo |
|
|
164,360 |
(7) |
|
|
41,148 |
|
|
|
205,508 |
|
|
|
2.87 |
% |
|
|
Christopher L. Hufft |
|
|
18,447 |
(8) |
|
|
7,510 |
|
|
|
25,957 |
|
|
* |
|
|
|
|
Dane M. Babin |
|
|
8,346 |
(9) |
|
|
- |
|
|
|
8,346 |
|
|
* |
|
|
|
|
All directors, nominees, and executive officers as a group (19 persons total) |
|
|
699,449 |
(10) |
|
|
69,602 |
|
|
|
769,051 |
|
|
|
10.69 |
% |
|
|
|
|
|
|
|
|
|
|
|
|
|
|
|
|
|
|
|
|
|
* |
Represents less than 1%, based on 7,126,975 shares of our common stock outstanding as of February 28, 2017. |
|
(1) |
Ownership percentages reflect the ownership percentage assuming that such person, but no other person, exercises all stock options and warrants to acquire shares of our common stock held by such person that are exercisable currently or within 60 days of February 28, 2017. |
|
(2) |
Includes (i) 19,571 shares registered in the name of William H. Hidalgo Trust and (ii) 4,566 registered in the name of Mr. Hidalgo’s spouse. |
|
(3) |
Includes 11,610 shares registered in the name of Mr. Joffrion’s spouse. |
|
(4) |
Includes (i) 16,651 shares registered in the name of Solomon’s Portico, LLC an affiliate of Mr. Lukinovich and (ii) 17,677 shares registered in the name of Mr. Lukinovich’s spouse and children. |
|
(5) |
Includes 7,689 shares registered in the name of AJ’s Investment Co., LLC, an affiliate of Dr. Nelson. |
|
(6) |
Includes 1,807 shares registered in the name of Mr. Schneider’s spouse. |
|
(7) |
Mr. D’Angelo is also a director. His ownership includes (i) 2,074 shares held in brokerage accounts by John J. D’Angelo for the benefit of his four minor children and 11,125 shares of unvested restricted stock. |
|
(8) |
Includes 3,316 shares of unvested restricted stock. |
|
(9) |
Includes 1,827 shares of unvested restricted stock. |
|
(10) |
Includes 2,244 shares as to which one of our executive officers shares voting and investment power pursuant to a power of attorney. |
Securities Authorized for Issuance under Equity Compensation PLANS
The following table presents certain information regarding our equity compensation plan as of December 31, 2016.
|
Plan category |
|
Number of securities to be issued upon exercise of outstanding options, warrants and rights |
|
|
Weighted-average exercise price of outstanding options, warrants and rights |
|
|
Number of securities remaining available for future issuance under equity compensation plans |
|
|||
|
Equity compensation plans approved by security holders |
|
|
- |
|
|
|
- |
|
|
|
- |
|
|
Equity compensation plans not approved by security holders(1) |
|
|
319,364 |
|
|
$ |
14.36 |
|
|
|
125,932 |
|
|
Total |
|
|
319,364 |
|
|
$ |
14.36 |
|
|
|
125,932 |
|
|
(1) |
The Investar Holding Corporation 2014 Long-Term Incentive Compensation Plan (the “Equity Incentive Plan”) was adopted by the Company’s board of directors on January 15, 2014, and the plan was amended on March 13, 2014. Because the Company was a private corporation at the time of the adoption of the Equity Incentive Plan, shareholder approval of the plan was not required, nor was such approval obtained. A total of 600,000 shares of common stock has been reserved for grant, award or issuance in the form of stock options and restricted stock under the Equity Incentive Plan. As of December 31, 2016, 125,932 shares remain available for grant, award or issuance. No awards may be granted under the Equity Incentive Plan after January 15, 2024. |
130
Item 13. Certain Relationships and Related Transactions, and Directors Independence
We have had banking transactions in the ordinary course of business with our executive officers and directors as well as their immediate families and affiliated companies, and we expect to engage in additional transactions with these persons in the future. These banking transactions include loans, deposits and other financial services-related transactions. All such banking transactions were made in the ordinary course of business, on substantially the same terms, including interest rates and collateral (where applicable), as those prevailing at the time for comparable transactions with persons not related to the Company or the Bank and did not involve more than the normal risk of collectability or present other unfavorable features.
The following describes transactions since January 1, 2016 in addition to the ordinary banking relationships described above in which we have participated and in which one or more of our directors, executive officers or other related persons had or will have a direct or indirect material interest (“related persons” includes the persons or entities included within the definition of “related parties” discussed in the next section):
|
|
• |
Thomas C. Besselman, Sr., one of our directors, owns H.R. Solutions, L.L.C., located in Baton Rouge, Louisiana, which provides our payroll processing services. We paid H.R. Solutions, L.L.C. approximately $61,000 in fees in 2016 and expect to pay the company approximately $70,000 in fees in 2017. In addition, Mr. Besselman is an executive of Gallagher Benefit Services, which wrote our employee benefits insurance until we became self-insured effective May 1, 2014. We pay Gallagher Benefits Services an annual fee of $60,000 for the administration of our benefits programs. |
|
|
• |
We have engaged in transactions with Joffrion Commercial Division, LLC (or “JCD”), a commercial construction company owned and managed by Gordon H. Joffrion, III, one of our directors: |
|
|
• |
In January 2016, we awarded JCD the $0.6 million bid to renovate an existing branch location in Mandeville, Louisiana, which was completed in May 2016. |
|
|
• |
In February 2016, we awarded JCD the $0.7 million bid to renovate a building that was purchased in the Company’s New Orleans market as a potential branch location. Construction was completed in July 2016 and we expect this branch to open in 2017. |
|
|
• |
In August 2016, we awarded JCD the $0.2 million bid to construct a freestanding ATM in the Company’s Baton Rouge market. |
|
|
• |
The Bank employs Mr. Hidalgo’s daughter as its Baton Rouge regional president. The total compensation paid by the Bank to Mr. Hidalgo’s daughter in 2016 was approximately $279,000. Mr. Hidalgo’s daughter also participates in general welfare plans offered to employees of the Bank. |
We believe that the terms and conditions of all of our transactions with each of H.R. Solutions, L.L.C. and Joffrion Commercial Division, LLC are comparable to terms that would have been available from a third party unaffiliated with us or the Bank. The compensation paid to Mr. Hidalgo’s daughter is consistent with the compensation paid to similarly-situated employees of the Bank.
Policies and Procedures for the Review, Approval and Ratification of Related Party Transactions
We have adopted written policies to comply with regulatory requirements and restrictions applicable to us with respect to related party transactions, including Sections 23A and 23B of the Federal Reserve Act (which govern certain transactions by the Bank with its affiliates) and the Federal Reserve’s Regulation O (which governs certain loans by the Bank to its executive officers, directors and principal shareholders).
In addition, our board of directors has adopted a written policy governing the approval of related party transactions that complies with all applicable requirements of the SEC and the Nasdaq Global Market concerning related party transactions. Under our policy, a related party transaction is a transaction, arrangement or relationship or a series of similar transactions, arrangements or relationships where the amount involved exceeds $120,000, in which we or one of our consolidated subsidiaries participates, and in which a “related party” has a direct or indirect material interest. “Related parties” include our directors (including nominees for election as director), executive officers, 5% shareholders (if any) and the immediate family members of these persons as well as any entity that any of them controls or in which any of them has a substantial beneficial ownership interest.
Our related party transaction policy is administered by our audit committee. Under the policy, the audit committee has compiled (and updates as necessary) a master list of all persons related to directors, executive officers and owners of greater than 5% of our common stock. The committee has distributed this list to our loan committee and to our chief compliance officer, who distributes the list to such other individuals as he deems appropriate. Among other things, the loan committee and other individuals use this list to determine if any existing or proposed transaction is a related party transaction. If a proposed related party transaction is identified, then the audit committee will be responsible for gathering relevant information about the transaction, including, among other things, the material
131
facts of the proposed transaction, including the amount involved and an assessment of whether the terms of the proposed transaction are comparable to those available to unrelated third parties. Based on this information, the committee then determines whether the proposed related party transaction should be approved, with any interested committee member barred from participating in the review.
BOARD INDEPENDENCE
Our board has determined that each of James M. Baker, James H. Boyce, III, Robert M. Boyce, Sr., David J. Lukinovich, Suzanne O. Middleton, Andrew C. Nelson, M.D., Carl R. Schneider, Jr. and Frank L. Walker is an “independent director” as defined under Rule 5605(a)(2) of the Nasdaq Marketplace Rules. Mr. John Emmet “J.E.” Brignac, who resigned from the board in February 2016, was also an “independent director.”
The board considered the relationships between our directors and Investar or the Bank when determining each director’s status as an “independent director” under Rule 5605(a)(2) of the Nasdaq Marketplace Rules, including the relationships listed above under “CERTAIN TRANSACTIONS.” Other than the relationships listed above under “CERTAIN TRANSACTIONS,” the board determined that these relationships did not affect any director’s status as an “independent director.” Furthermore, we are not aware of any family relationships between any director, executive officer or person nominated to become a director or executive officer.
Item 14. Principal Accounting Fees and Services
The audit committee has appointed Postlethwaite & Netterville to serve as our independent registered public accountants for the 2017 fiscal year. A representative of Postlethwaite & Netterville is expected to attend the annual meeting. If present, the representative will have the opportunity to make a statement and will be available to respond to appropriate questions. Postlethwaite & Netterville has served as our independent registered public accountants and audited our financial statements since 2006.
Fees related to services performed for us by Postlethwaite & Netterville in fiscal years 2016 and 2015 are as follows:
|
|
|
2016 |
|
|
2015 |
|
||
|
Audit Fees(1) |
|
$ |
221,800 |
|
|
$ |
171,376 |
|
|
Audit-Related Fees(2) |
|
|
24,000 |
|
|
|
- |
|
|
Tax Fees |
|
|
- |
|
|
|
- |
|
|
All Other Fees |
|
|
- |
|
|
|
- |
|
|
Total |
|
$ |
245,800 |
|
|
$ |
171,376 |
|
|
|
|
|
|
|
|
|
|
|
|
(2) |
Audit fees included fees and expenses associated with the audit of our financial statements, the review of the financial statements in our quarterly reports on Form 10-Q, and regulatory and statutory filings. |
|
(3) |
Audit-related fees primarily included fees and expenses associated with the audits of the financial statements of certain employee benefit plans and other required procedures. |
In accordance with the procedures set forth in its charter, the audit committee pre-approves all auditing services and permitted non-audit services (including the fees and terms of those services) to be performed for us by our independent registered public accountants prior to their engagement with respect to such services, subject to the de minimis exceptions for non-audit services permitted by the Exchange Act, which are approved by the audit committee prior to the completion of the audit. The chairman of the audit committee has been delegated the authority by the committee to pre-approve the engagement of the independent registered public accountants when the entire committee is unable to do so. The chairman must report all such pre-approvals to the entire audit committee at the next committee meeting.
132
Item 15. Exhibits and Financial Statement Schedules
|
(a) |
Documents Filed as Part of this Report. |
|
|
(1) |
The following financial statements are incorporated by reference from Item 8 hereof: |
Consolidated Balance Sheets as of December 31, 2016 and 2015
Consolidated Statements of Operations for the Years Ended December 31, 2016, 2015 and 2014
Consolidated Statements of Comprehensive Income for the Years Ended December 31, 2016, 2015 and 2014
Consolidated Statements of Changes in Stockholders’ Equity for the Years Ended December 31, 2016, 2015 and 2014
Consolidated Statements of Cash Flows for the Years Ended December 31, 2016, 2015 and 2014
Notes to Consolidated Financial Statements
|
|
(2) |
All schedules for which provision is made in the applicable accounting regulations of the SEC are omitted because of the absence of conditions under which they are required or because the required information is included in the consolidated financial statements and related notes thereto. |
|
|
(3) |
The following exhibits are filed as part of this Form 10-K, and this list includes the Exhibit Index. |
Item 16. Form 10-K Summary
Not applicable.
133
|
Exhibit Number |
|
Description |
|
Location |
|
2.1 |
|
Agreement and Plan of Exchange dated August 1, 2013, by and between Investar Holding Corporation and Investar Bank, as amended (the “Agreement and Plan of Exchange”) |
|
Exhibit 2.1 to the Registration Statement on Form S-1 of the Company filed May 16, 2014 and incorporated herein by reference |
|
|
|
|
|
|
|
2.2 |
|
Agreement and Plan of Reorganization dated March 8, 2017, by and among Investar Holding Corporation, Citizens Bancshares, Inc. and Investar Acquisition Company |
|
Exhibit 2.1 to the Current Report on Form 8-K of the Company filed March 8, 2017 and incorporated herein by reference |
|
|
|
|
|
|
|
3.1 |
|
Restated Articles of Incorporation of Investar Holding Corporation |
|
Exhibit 3.1 to the Registration Statement on Form S-1 of the Company filed May 16, 2014 and incorporated herein by reference |
|
|
|
|
|
|
|
3.2 |
|
By-laws of Investar Holding Corporation |
|
Exhibit 3.2 to the Pre-Effective Amendment No. 1 to the Registration Statement on Form S-1/A of the Company filed June 4, 2014 and incorporated herein by reference |
|
|
|
|
|
|
|
4.1 |
|
Specimen Common Stock Certificate |
|
Exhibit 4.1 to the Registration Statement on Form S-1 of the Company filed May 16, 2014 and incorporated herein by reference |
|
|
|
|
|
|
|
10.1* |
|
Investar Holding Corporation 2014 Long-Term Incentive Compensation Plan, as amended by Amendment No. 1 to Investar Holding Corporation 2014 Long Term Incentive Plan |
|
Exhibit 10.1 to the Registration Statement on Form S-1 of the Company filed May 16, 2014 and, as to Amendment No.1, Exhibit 99.2 to the Registration Statement on Form S-8 of the Company filed October 31, 2014, each of which is incorporated herein by reference |
|
|
|
|
|
|
|
10.2* |
|
Form of Stock Option Grant Agreement under 2014 Long-Term Incentive Compensation Plan |
|
Exhibit 10.2 to the Registration Statement on Form S-1 of the Company filed May 16, 2014 and incorporated herein by reference |
|
|
|
|
|
|
|
10.3* |
|
Form of Restricted Stock Award Agreement under 2014 Long-Term Incentive Compensation Plan for Employees |
|
Exhibit 10.3 to the Annual Report on Form 10-K of the Company filed March 11, 2016 and incorporated herein by reference |
|
|
|
|
|
|
|
10.4* |
|
Form of Restricted Stock Award Agreement under 2014 Long-Term Incentive Compensation Plan for Non-Employee Directors |
|
Exhibit 10.4 to the Annual Report on Form 10-K of the Company filed March 11, 2016 and incorporated herein by reference |
|
|
|
|
|
|
|
10.5 |
|
Form of Notice of Exchange and Assumption relating to options exchanged in connection with Agreement and Plan of Exchange |
|
Exhibit 10.4 to the Registration Statement on Form S-1 of the Company filed May 16, 2014 and incorporated herein by reference |
|
|
|
|
|
|
|
10.6 |
|
Form of Notice of Exchange and Assumption relating to restricted stock exchanged in connection with Agreement and Plan of Exchange |
|
Exhibit 10.5 to the Registration Statement on Form S-1 of the Company filed May 16, 2014 and incorporated herein by reference |
|
|
|
|
|
|
|
10.7 |
|
Form of Notice of Exchange and Assumption relating to warrants exchanged in connection with Agreement and Plan of Exchange |
|
Exhibit 10.6 to the Registration Statement on Form S-1 of the Company filed May 16, 2014 and incorporated herein by reference |
|
|
|
|
|
|
|
10.8 |
|
Loan Agreement, dated as of June 27, 2016, by and between Investar Holding Corporation, as borrower, and TIB – The Independent Bankers Bank, as lender |
|
Exhibit 10.1 to the Current Report on Form 8-K of the Company filed June 30, 2016 and incorporated herein by reference |
|
|
|
|
|
|
|
10.9 |
|
Promissory Note, dated as of June 27, 2016, by and between Investar Holding Corporation, as maker, and TIB – The Independent Bankers Bank, as payee |
|
Exhibit 10.2 to the Current Report on Form 8-K of the Company filed June 30, 2016 and incorporated herein by reference |
|
|
|
|
|
|
|
21 |
|
Subsidiaries of the Registrant |
|
Exhibit 21 to the Registration Statement on Form S-1 of the Company filed May 16, 2014 and incorporated herein by reference |
|
|
|
|
|
|
|
23 |
|
Consent of Postlethwaite and Netterville, APAC |
|
Filed herewith |
134
|
Exhibit Number |
|
Description |
|
Location |
|
|
|
|
|
|
|
31.1 |
|
Rule 13a-14(a) Certification of Principal Executive Officer of the Company in accordance with Section 302 of the Sarbanes-Oxley Act of 2002 |
|
Filed herewith |
|
|
|
|
|
|
|
31.2 |
|
Rule 13a-14(a) Certification of Principal Financial Officer of the Company in accordance with Section 302 of the Sarbanes-Oxley Act of 2002 |
|
Filed herewith |
|
|
|
|
|
|
|
32.1 |
|
Section 1350 Certification of Principal Executive Officer of the Company in accordance with Section 906 of the Sarbanes-Oxley Act of 2002 |
|
Filed herewith |
|
|
|
|
|
|
|
32.2 |
|
Section 1350 Certification of Principal Financial Officer of the Company in accordance with Section 906 of the Sarbanes-Oxley Act of 2002 |
|
Filed herewith |
|
|
|
|
|
|
|
101.INS |
|
XBRL Instance Document |
|
Filed herewith |
|
|
|
|
|
|
|
101.SCH |
|
XBRL Taxonomy Extension Schema Document |
|
Filed herewith |
|
|
|
|
|
|
|
101.CAL |
|
XBRL Taxonomy Extension Calculation Linkbase Document |
|
Filed herewith |
|
|
|
|
|
|
|
101.DEF |
|
XBRL Taxonomy Extension Definition Linkbase Document |
|
Filed herewith |
|
|
|
|
|
|
|
101.LAB |
|
XBRL Taxonomy Extension Label Linkbase Document |
|
Filed herewith |
|
|
|
|
|
|
|
101.PRE |
|
XBRL Taxonomy Extension Presentation Linkbase Document |
|
Filed herewith |
|
* |
Management contract or compensatory plan or arrangement required to be filed as an exhibit to this Form 10-K pursuant to Item 15(b) of Form 10-K. |
The Company does not have any long-term debt instruments under which securities are authorized exceeding ten percent of the total assets of the Company and its subsidiaries on a consolidated basis. The Company will furnish to the Securities and Exchange Commission, upon its request, a copy of all long-term debt instruments.
135
Pursuant to the requirements of Section 13 or 15(d) of the Securities Exchange Act of 1934, the registrant has duly caused this report to be signed on its behalf by the undersigned, thereunto duly authorized.
|
|
|
INVESTAR HOLDING CORPORATION |
|
||
|
|
|
|
|
|
|
|
Date: |
March 9, 2017 |
by: |
|
/s/John J. D’Angelo |
|
|
|
|
|
|
John J. D’Angelo |
|
|
|
|
|
|
President and |
|
|
|
|
|
|
Chief Executive Officer |
|
Pursuant to the requirements of the Securities Exchange Act of 1934, this report has been signed below by the following persons on behalf of the registrant and in the capacities and on the date indicated.
|
|
|
|
|
|
|
|
|
|
|
|
|
|
|
Date: |
March 9, 2017 |
by: |
|
/s/John J. D’Angelo |
|
|
|
|
|
|
John J. D’Angelo |
|
|
|
|
|
|
President, Chief Executive |
|
|
|
|
|
|
Officer and Director |
|
|
|
|
|
|
(Principal Executive Officer) |
|
|
|
|
|
|
|
|
|
Date: |
March 9, 2017 |
by: |
|
/s/Christopher L. Hufft |
|
|
|
|
|
|
Christopher L. Hufft |
|
|
|
|
|
|
Executive Vice President and |
|
|
|
|
|
|
Chief Financial Officer |
|
|
|
|
|
|
(Principal Financial Officer) |
|
|
|
|
|
|
|
|
|
Date: |
March 9, 2017 |
by: |
|
/s/Rachel P. Cherco |
|
|
|
|
|
|
Rachel P. Cherco |
|
|
|
|
|
|
Executive Vice President and |
|
|
|
|
|
|
Chief Accounting Officer |
|
|
|
|
|
|
(Principal Accounting Officer) |
|
|
|
|
|
|
|
|
|
|
|
|
|
|
|
|
Date: |
March 9, 2017 |
by: |
|
/s/James M. Baker |
|
|
|
|
|
|
James M. Baker |
|
|
|
|
|
|
Director |
|
|
|
|
|
|
|
|
|
Date: |
March 9, 2017 |
by: |
|
/s/Thomas C. Besselman, Sr. |
|
|
|
|
|
|
Thomas C. Besselman, Sr. |
|
|
|
|
|
|
Director |
|
|
|
|
|
|
|
|
|
Date: |
March 9, 2017 |
by: |
|
/s/James H. Boyce, III |
|
|
|
|
|
|
James H. Boyce, III |
|
|
|
|
|
|
Director |
|
136
|
|
|
|
|
|
|
|
Date: |
March 9, 2017 |
by: |
|
/s/Robert M. Boyce, Sr. |
|
|
|
|
|
|
Robert M. Boyce, Sr. |
|
|
|
|
|
|
Director |
|
|
|
|
|
|
|
|
|
Date: |
March 9, 2017 |
by: |
|
/s/William H. Hidalgo, Sr. |
|
|
|
|
|
|
William H. Hidalgo, Sr. |
|
|
|
|
|
|
Chairman of the Board |
|
|
|
|
|
|
|
|
|
Date: |
March 9, 2017 |
by: |
|
/s/Gordon H. Joffrion, III |
|
|
|
|
|
|
Gordon H. Joffrion, III |
|
|
|
|
|
|
Director |
|
|
|
|
|
|
|
|
|
Date: |
March 9, 2017 |
by: |
|
/s/David J. Lukinovich |
|
|
|
|
|
|
David J. Lukinovich |
|
|
|
|
|
|
Director |
|
|
|
|
|
|
|
|
|
Date: |
March 9, 2017 |
by: |
|
/s/Suzanne O. Middleton |
|
|
|
|
|
|
Suzanne O. Middleton |
|
|
|
|
|
|
Director |
|
|
|
|
|
|
|
|
|
Date: |
March 9, 2017 |
by: |
|
/s/Andrew C. Nelson, M.D. |
|
|
|
|
|
|
Andrew C. Nelson, M.D. |
|
|
|
|
|
|
Director |
|
|
|
|
|
|
|
|
|
Date: |
March 9, 2017 |
by: |
|
/s/Carl R. Schneider, Jr. |
|
|
|
|
|
|
Carl R. Schneider, Jr. |
|
|
|
|
|
|
Director |
|
|
|
|
|
|
|
|
|
Date: |
March 9, 2017 |
by: |
|
/s/Frank L. Walker |
|
|
|
|
|
|
Frank L. Walker |
|
|
|
|
|
|
Director |
|
|
|
|
|
|
|
|
|
|
|
|
|
|
|
|
|
|
|
|
|
|
|
|
|
|
|
|
|
137
Similar companies
See also BANK OF NOVA SCOTIASee also Itau Unibanco Holding S.A.
See also Bank of New York Mellon Corp - Annual report 2022 (10-K 2022-12-31) Annual report 2023 (10-Q 2023-09-30)
See also BANK BRADESCO
See also STATE STREET CORP - Annual report 2022 (10-K 2022-12-31) Annual report 2023 (10-Q 2023-09-30)