JOHNSON & JOHNSON - Quarter Report: 2019 September (Form 10-Q)
UNITED STATES
SECURITIES AND EXCHANGE COMMISSION
Washington, D.C. 20549
FORM 10-Q
☑ | Quarterly Report Pursuant to Section 13 or 15(d) of the Securities Exchange Act of 1934 | |
for the quarterly period ended September 29, 2019
or
☐ | Transition Report Pursuant to Section 13 or 15(d) of the Securities Exchange Act of 1934 for the transition period from to | |
Commission file number 1-3215
Johnson & Johnson
(Exact name of registrant as specified in its charter)
New Jersey | 22-1024240 | |
(State or other jurisdiction of incorporation or organization) | (I.R.S. Employer Identification No.) | |
One Johnson & Johnson Plaza
New Brunswick, New Jersey 08933
(Address of principal executive offices)
Registrant’s telephone number, including area code (732) 524-0400
Indicate by check mark whether the registrant (1) has filed all reports required to be filed by Section 13 or 15(d) of the Securities Exchange Act of 1934 during the preceding 12 months (or for such shorter period that the registrant was required to file such reports), and (2) has been subject to such filing requirements for the past 90 days. ☑ Yes ☐ No
Indicate by check mark whether the registrant has submitted electronically every Interactive Data File required to be submitted pursuant to Rule 405 of Regulation S-T during the preceding 12 months (or for such shorter period that the registrant was required to submit such files). ☑ Yes ☐ No
Indicate by check mark whether the registrant is a large accelerated filer, an accelerated filer, a non-accelerated filer, a smaller reporting company, or an emerging growth company. See the definitions of “large accelerated filer,” “accelerated filer,” “smaller reporting company,” and "emerging growth company" in Rule 12b-2 of the Exchange Act.
Large accelerated filer | ☑ | Accelerated filer | ☐ | |
Non-accelerated filer | ☐ | Smaller reporting company | ☐ | |
Emerging growth company | ☐ | |||
If an emerging growth company, indicated by check mark if the registrant has elected not to use the extended transition period for complying with any new or revised financial accounting standards provided pursuant to Section 13(a) of the Exchange Act. ☐
Indicate by check mark whether the registrant is a shell company (as defined in Rule 12b-2 of the Exchange Act). ☐ Yes ☑ No
SECURITIES REGISTERED PURSUANT TO SECTION 12(b) OF THE ACT
Title of each class | Trading Symbol | Name of each exchange on which registered |
Common Stock, Par Value $1.00 | JNJ | New York Stock Exchange |
4.75% Notes Due November 2019 | JNJ | New York Stock Exchange |
0.250% Notes Due January 2022 | JNJ | New York Stock Exchange |
0.650% Notes Due May 2024 | JNJ | New York Stock Exchange |
5.50% Notes Due November 2024 | JNJ | New York Stock Exchange |
1.150% Notes Due November 2028 | JNJ | New York Stock Exchange |
1.650% Notes Due May 2035 | JNJ | New York Stock Exchange |
Indicate the number of shares outstanding of each of the issuer’s classes of common stock, as of the latest practicable date.
On October 22, 2019, 2,631,872,399 shares of Common Stock, $1.00 par value, were outstanding.
JOHNSON & JOHNSON AND SUBSIDIARIES
TABLE OF CONTENTS
Page | ||
No. | ||
CAUTIONARY NOTE REGARDING FORWARD-LOOKING STATEMENTS
This Quarterly Report on Form 10-Q and Johnson & Johnson's other publicly available documents contain “forward-looking statements” within the meaning of the safe harbor provisions of the United States Private Securities Litigation Reform Act of 1995. Management and representatives of Johnson & Johnson and its subsidiaries (the Company) also may from time to time make forward-looking statements. Forward-looking statements do not relate strictly to historical or current facts and reflect management’s assumptions, views, plans, objectives and projections about the future. Forward-looking statements may be identified by the use of words such as “plans,” “expects,” “will,” “anticipates,” “estimates,” and other words of similar meaning in conjunction with, among other things: discussions of future operations, expected operating results, financial performance; impact of planned acquisitions and dispositions; impact and timing of restructuring initiatives including associated cost savings and other benefits; the Company's strategy for growth; product development activities; regulatory approvals; market position and expenditures.
Because forward-looking statements are based on current beliefs, expectations and assumptions regarding future events, they are subject to uncertainties, risks and changes that are difficult to predict and many of which are outside of the Company's control. Investors should realize that if underlying assumptions prove inaccurate, or known or unknown risks or uncertainties materialize, the Company’s actual results and financial condition could vary materially from expectations and projections expressed or implied in its forward-looking statements. Investors are therefore cautioned not to rely on these forward-looking statements. Risks and uncertainties include, but are not limited to:
Risks Related to Product Development, Market Success and Competition
• | Challenges and uncertainties inherent in innovation and development of new and improved products and technologies on which the Company’s continued growth and success depend, including uncertainty of clinical outcomes, additional analysis of existing clinical data, obtaining regulatory approvals, health plan coverage and customer access, and initial and continued commercial success; |
• | Challenges to the Company’s ability to obtain and protect adequate patent and other intellectual property rights for new and existing products and technologies in the United States and other important markets; |
• | The impact of patent expirations, typically followed by the introduction of competing biosimilars and generics and resulting revenue and market share losses; |
• | Increasingly aggressive and frequent challenges to the Company’s patents by competitors and others seeking to launch competing generic, biosimilar or other products and increased receptivity of courts, the United States Patent and Trademark Office and other decision makers to such challenges, potentially resulting in loss of market exclusivity and rapid decline in sales for the relevant product sooner than expected; |
• | Competition in research and development of new and improved products, processes and technologies, which can result in product and process obsolescence; |
• | Competition to reach agreement with third parties for collaboration, licensing, development and marketing agreements for products and technologies; |
• | Competition based on cost-effectiveness, product performance, technological advances and patents attained by competitors; and |
• | Allegations that the Company’s products infringe the patents and other intellectual property rights of third parties, which could adversely affect the Company’s ability to sell the products in question and require the payment of money damages and future royalties. |
Risks Related to Product Liability, Litigation and Regulatory Activity
• | Product efficacy or safety concerns, whether or not based on scientific evidence, potentially resulting in product withdrawals, recalls, regulatory action on the part of the United States Food and Drug Administration (or international counterparts), declining sales, reputational damage, increased litigation expense and share price impact; |
• | Impact, including declining sales and reputational damage, of significant litigation or government action adverse to the Company, including product liability claims and allegations related to pharmaceutical marketing practices and contracting strategies; |
• | Impact of an adverse judgment or settlement and the adequacy of reserves related to legal proceedings, including patent litigation, product liability, personal injury claims, securities class actions, government investigations, employment and other legal proceedings; |
• | Increased scrutiny of the health care industry by government agencies and state attorneys general resulting in investigations and prosecutions, which carry the risk of significant civil and criminal penalties, including, but not limited to, debarment from government business; |
• | Failure to meet compliance obligations in the McNEIL-PPC, Inc. Consent Decree or any other compliance agreements with governments or government agencies, which could result in significant sanctions; |
• | Potential changes to applicable laws and regulations affecting United States and international operations, including relating to: approval of new products; licensing and patent rights; sales and promotion of health care products; access to, and reimbursement and pricing for, health care products and services; environmental protection and sourcing of raw materials; |
• | Compliance with local regulations and laws that may restrict the Company’s ability to manufacture or sell its products in relevant markets including, requirements to comply with medical device reporting regulations and other requirements such as the European Union's Medical Devices Regulation; |
• | Changes in domestic and international tax laws and regulations, including changes related to The Tax Cuts and Jobs Act in the United States, the Federal Act on Tax Reform and AHV Financing in Switzerland, increasing audit scrutiny by tax authorities around the world and exposures to additional tax liabilities potentially in excess of existing reserves; and |
• | Issuance of new or revised accounting standards by the Financial Accounting Standards Board and regulations by the Securities and Exchange Commission. |
Risks Related to the Company’s Strategic Initiatives and Health Care Market Trends
• | Pricing pressures resulting from trends toward health care cost containment, including the continued consolidation among health care providers and other market participants, trends toward managed care, the shift toward governments increasingly becoming the primary payers of health care expenses, significant new entrants to the health care markets seeking to reduce costs and government pressure on companies to voluntarily reduce costs and price increases; |
• | Restricted spending patterns of individual, institutional and governmental purchasers of health care products and services due to economic hardship and budgetary constraints; |
• | Challenges to the Company’s ability to realize its strategy for growth including through externally sourced innovations, such as development collaborations, strategic acquisitions, licensing and marketing agreements, and the potential heightened costs of any such external arrangements due to competitive pressures; |
• | The potential that the expected strategic benefits and opportunities from any planned or completed acquisition or divestiture by the Company may not be realized or may take longer to realize than expected; and |
• | The potential that the expected benefits and opportunities related to past and ongoing restructuring actions may not be realized or may take longer to realize than expected. |
Risks Related to Economic Conditions, Financial Markets and Operating Internationally
• | Market conditions and the possibility that the Company’s share repurchase program may be delayed, suspended or discontinued; |
• | Impact of inflation and fluctuations in interest rates and currency exchange rates and the potential effect of such fluctuations on revenues, expenses and resulting margins; |
• | Potential changes in export/import and trade laws, regulations and policies of the United States and other countries, including any increased trade restrictions or tariffs and potential drug reimportation legislation; |
• | The impact on international operations from financial instability in international economies, sovereign risk, possible imposition of governmental controls and restrictive economic policies, and unstable international governments and legal systems; |
• | Changes to global climate, extreme weather and natural disasters that could affect demand for the Company's products and services, cause disruptions in manufacturing and distribution networks, alter the availability of goods and services within the supply chain, and affect the overall design and integrity of the Company's products and operations; and |
• | The impact of armed conflicts and terrorist attacks in the United States and other parts of the world including social and economic disruptions and instability of financial and other markets. |
Risks Related to Supply Chain and Operations
• | Difficulties and delays in manufacturing, internally through third party providers or otherwise within the supply chain, that may lead to voluntary or involuntary business interruptions or shutdowns, product shortages, withdrawals or suspensions of products from the market, and potential regulatory action; |
• | Interruptions and breaches of the Company's information technology systems or those of the Company's vendors which, could result in reputational, competitive, operational or other business harm as well as financial costs and regulatory action; |
• | Reliance on global supply chains and production and distribution processes that are complex and subject to increasing regulatory requirements that may adversely affect supply, sourcing and pricing of materials used in the Company’s products; and |
• | The potential that the expected benefits and opportunities related to restructuring actions contemplated for the global supply chain may not be realized or may take longer to realize than expected, including due to any required approvals from applicable regulatory authorities. Disruptions associated with the announced global supply chain actions may adversely affect supply and sourcing of materials used in the Company's products. |
Investors also should carefully read the Risk Factors described in Item 1A of the Company's Annual Report on Form 10-K for the fiscal year ended December 30, 2018, for a description of certain risks that could, among other things, cause the Company’s actual results to differ materially from those expressed in its forward-looking statements. Investors should understand that it is not possible to predict or identify all such factors and should not consider the risks described above to be a complete statement of all potential risks and uncertainties. The Company does not undertake to publicly update any forward-looking statement that may be made from time to time, whether as a result of new information or future events or developments.
Part I — FINANCIAL INFORMATION
Item 1 — FINANCIAL STATEMENTS
JOHNSON & JOHNSON AND SUBSIDIARIES
CONSOLIDATED BALANCE SHEETS
(Unaudited; Dollars in Millions Except Share and Per Share Data)
September 29, 2019 | December 30, 2018 | ||||||
ASSETS | |||||||
Current assets: | |||||||
Cash and cash equivalents | $ | 16,249 | 18,107 | ||||
Marketable securities | 1,696 | 1,580 | |||||
Accounts receivable, trade, less allowances for doubtful accounts $227 (2018, $248) | 14,801 | 14,098 | |||||
Inventories (Note 2) | 9,173 | 8,599 | |||||
Prepaid expenses and other | 2,220 | 2,699 | |||||
Assets held for sale (Note 10) | 194 | 950 | |||||
Total current assets | 44,333 | 46,033 | |||||
Property, plant and equipment at cost | 42,625 | 41,851 | |||||
Less: accumulated depreciation | (25,577 | ) | (24,816 | ) | |||
Property, plant and equipment, net | 17,048 | 17,035 | |||||
Intangible assets, net (Note 3) | 47,846 | 47,611 | |||||
Goodwill (Note 3) | 33,291 | 30,453 | |||||
Deferred taxes on income | 7,696 | 7,640 | |||||
Other assets | 5,307 | 4,182 | |||||
Total assets | $ | 155,521 | 152,954 | ||||
LIABILITIES AND SHAREHOLDERS’ EQUITY | |||||||
Current liabilities: | |||||||
Loans and notes payable | $ | 2,299 | 2,796 | ||||
Accounts payable | 7,491 | 7,537 | |||||
Accrued liabilities | 9,004 | 7,601 | |||||
Accrued rebates, returns and promotions | 10,977 | 9,380 | |||||
Accrued compensation and employee related obligations | 2,886 | 3,098 | |||||
Accrued taxes on income | 2,505 | 818 | |||||
Total current liabilities | 35,162 | 31,230 | |||||
Long-term debt (Note 4) | 26,919 | 27,684 | |||||
Deferred taxes on income | 6,526 | 7,506 | |||||
Employee related obligations | 9,830 | 9,951 | |||||
Long-term taxes payable | 7,493 | 8,242 | |||||
Other liabilities | 11,381 | 8,589 | |||||
Total liabilities | 97,311 | 93,202 | |||||
Commitments and Contingencies (Note 11) | |||||||
Shareholders’ equity: | |||||||
Common stock — par value $1.00 per share (authorized 4,320,000,000 shares; issued 3,119,843,000 shares) | $ | 3,120 | 3,120 | ||||
Accumulated other comprehensive income (loss) (Note 7) | (15,533 | ) | (15,222 | ) | |||
Retained earnings | 109,242 | 106,216 | |||||
Less: common stock held in treasury, at cost (488,882,000 and 457,519,000 shares) | 38,619 | 34,362 | |||||
Total shareholders’ equity | 58,210 | 59,752 | |||||
Total liabilities and shareholders' equity | $ | 155,521 | 152,954 | ||||
1
JOHNSON & JOHNSON AND SUBSIDIARIES
CONSOLIDATED STATEMENTS OF EARNINGS
(Unaudited; Dollars & Shares in Millions Except Per Share Amounts)
Fiscal Third Quarter Ended | ||||||||||||||
September 29, 2019 | Percent to Sales | September 30, 2018 | Percent to Sales | |||||||||||
Sales to customers (Note 9) | $ | 20,729 | 100.0 | % | $ | 20,348 | 100.0 | % | ||||||
Cost of products sold | 6,867 | 33.1 | 6,589 | 32.4 | ||||||||||
Gross profit | 13,862 | 66.9 | 13,759 | 67.6 | ||||||||||
Selling, marketing and administrative expenses | 5,374 | 26.0 | 5,543 | 27.3 | ||||||||||
Research and development expense | 2,599 | 12.5 | 2,508 | 12.3 | ||||||||||
In-process research and development | — | — | 1,126 | 5.6 | ||||||||||
Interest income | (89 | ) | (0.4 | ) | (175 | ) | (0.9 | ) | ||||||
Interest expense, net of portion capitalized | 48 | 0.2 | 243 | 1.2 | ||||||||||
Other (income) expense, net | 4,214 | 20.3 | 3 | 0.0 | ||||||||||
Restructuring (Note 12) | 69 | 0.4 | 88 | 0.4 | ||||||||||
Earnings before provision for taxes on income | 1,647 | 7.9 | 4,423 | 21.7 | ||||||||||
Provision for (Benefit from) taxes on income (Note 5) | (106 | ) | (0.6 | ) | 489 | 2.4 | ||||||||
NET EARNINGS | $ | 1,753 | 8.5 | % | $ | 3,934 | 19.3 | % | ||||||
NET EARNINGS PER SHARE (Note 8) | ||||||||||||||
Basic | $ | 0.67 | $ | 1.47 | ||||||||||
Diluted | $ | 0.66 | $ | 1.44 | ||||||||||
AVG. SHARES OUTSTANDING | ||||||||||||||
Basic | 2,635.2 | 2,683.2 | ||||||||||||
Diluted | 2,669.9 | 2,727.6 | ||||||||||||
See Notes to Consolidated Financial Statements
2
JOHNSON & JOHNSON AND SUBSIDIARIES
CONSOLIDATED STATEMENTS OF EARNINGS
(Unaudited; Dollars & Shares in Millions Except Per Share Amounts)
Fiscal Nine Months Ended | ||||||||||||||
September 29, 2019 | Percent to Sales | September 30, 2018 | Percent to Sales | |||||||||||
Sales to customers (Note 9) | $ | 61,312 | 100.0 | % | $ | 61,187 | 100.0 | % | ||||||
Cost of products sold | 20,422 | 33.3 | 20,130 | 32.9 | ||||||||||
Gross profit | 40,890 | 66.7 | 41,057 | 67.1 | ||||||||||
Selling, marketing and administrative expenses | 16,139 | 26.3 | 16,549 | 27.1 | ||||||||||
Research and development expense | 8,123 | 13.3 | 7,551 | 12.3 | ||||||||||
In-process research and development | 890 | 1.4 | 1,126 | 1.8 | ||||||||||
Interest income | (276 | ) | (0.5 | ) | (415 | ) | (0.6 | ) | ||||||
Interest expense, net of portion capitalized | 233 | 0.4 | 755 | 1.2 | ||||||||||
Other (income) expense, net | 2,509 | 4.1 | 427 | 0.7 | ||||||||||
Restructuring (Note 12) | 162 | 0.3 | 187 | 0.3 | ||||||||||
Earnings before provision for taxes on income | 13,110 | 21.4 | 14,877 | 24.3 | ||||||||||
Provision for taxes on income (Note 5) | 2,001 | 3.3 | 2,622 | 4.3 | ||||||||||
NET EARNINGS | $ | 11,109 | 18.1 | % | $ | 12,255 | 20.0 | % | ||||||
NET EARNINGS PER SHARE (Note 8) | ||||||||||||||
Basic | $ | 4.19 | $ | 4.57 | ||||||||||
Diluted | $ | 4.13 | $ | 4.49 | ||||||||||
AVG. SHARES OUTSTANDING | ||||||||||||||
Basic | 2,649.5 | 2,682.6 | ||||||||||||
Diluted | 2,688.1 | 2,729.6 | ||||||||||||
See Notes to Consolidated Financial Statements | ||||||||||||||
3
JOHNSON & JOHNSON AND SUBSIDIARIES
CONSOLIDATED STATEMENTS OF COMPREHENSIVE INCOME
(Unaudited; Dollars in Millions)
Fiscal Third Quarter Ended | Fiscal Nine Months Ended | ||||||||||||
September 29, 2019 | September 30, 2018 | September 29, 2019 | September 30, 2018 | ||||||||||
Net earnings | $ | 1,753 | 3,934 | $ | 11,109 | 12,255 | |||||||
Other comprehensive income (loss), net of tax | |||||||||||||
Foreign currency translation | (667 | ) | (151 | ) | (575 | ) | (1,718 | ) | |||||
Securities: | |||||||||||||
Unrealized holding gain (loss) arising during period | — | — | 1 | — | |||||||||
Reclassifications to earnings | — | (1 | ) | — | (1 | ) | |||||||
Net change | — | (1 | ) | 1 | (1 | ) | |||||||
Employee benefit plans: | |||||||||||||
Prior service cost amortization during period | (6 | ) | (6 | ) | (18 | ) | (17 | ) | |||||
Gain (loss) amortization during period | 142 | 192 | 460 | 574 | |||||||||
Net change | 136 | 186 | 442 | 557 | |||||||||
Derivatives & hedges: | |||||||||||||
Unrealized gain (loss) arising during period | 1,922 | 262 | 1,706 | 37 | |||||||||
Reclassifications to earnings | (1,955 | ) | (166 | ) | (1,885 | ) | (91 | ) | |||||
Net change | (33 | ) | 96 | (179 | ) | (54 | ) | ||||||
Other comprehensive income (loss) | (564 | ) | 130 | (311 | ) | (1,216 | ) | ||||||
Comprehensive income | $ | 1,189 | 4,064 | $ | 10,798 | 11,039 | |||||||
See Notes to Consolidated Financial Statements
The tax effects in other comprehensive income for the fiscal third quarter were as follows for 2019 and 2018, respectively: Foreign Currency Translation: $94 million and $104 million; Employee Benefit Plans: $34 million and $52 million; Derivatives & Hedges: $9 million and $26 million. |
The tax effects in other comprehensive income for the fiscal nine months were as follows for 2019 and 2018, respectively: Foreign Currency Translation: $50 million and $79 million; Employee Benefit Plans: $69 million and $155 million; Derivatives & Hedges: $48 million and $14 million. |
4
JOHNSON & JOHNSON AND SUBSIDIARIES
CONSOLIDATED STATEMENTS OF EQUITY
(Unaudited; Dollars in Millions)
Fiscal Third Quarter Ended September 29, 2019
Total | Retained Earnings | Accumulated Other Comprehensive Income | Common Stock Issued Amount | Treasury Stock Amount | |||||||||||
Balance, June 30, 2019 | $ | 60,785 | 109,809 | (14,969 | ) | 3,120 | (37,175 | ) | |||||||
Net earnings | 1,753 | 1,753 | — | — | — | ||||||||||
Cash dividends paid ($0.95 per share) | (2,499 | ) | (2,499 | ) | — | — | — | ||||||||
Employee compensation and stock option plans | 363 | 179 | — | — | 184 | ||||||||||
Repurchase of common stock | (1,628 | ) | — | — | — | (1,628 | ) | ||||||||
Other comprehensive income (loss), net of tax | (564 | ) | — | (564 | ) | — | — | ||||||||
Balance, September 29, 2019 | $ | 58,210 | 109,242 | (15,533 | ) | 3,120 | (38,619 | ) | |||||||
Fiscal Nine Months Ended September 29, 2019
Total | Retained Earnings | Accumulated Other Comprehensive Income | Common Stock Issued Amount | Treasury Stock Amount | |||||||||||
Balance, December 30, 2018 | $ | 59,752 | 106,216 | (15,222 | ) | 3,120 | (34,362 | ) | |||||||
Net earnings | 11,109 | 11,109 | — | — | — | ||||||||||
Cash dividends paid ($2.80 per share) | (7,417 | ) | (7,417 | ) | — | — | — | ||||||||
Employee compensation and stock option plans | 1,397 | (666 | ) | — | — | 2,063 | |||||||||
Repurchase of common stock | (6,320 | ) | — | — | — | (6,320 | ) | ||||||||
Other comprehensive income (loss), net of tax | (311 | ) | (311 | ) | — | — | |||||||||
Balance, September 29, 2019 | $ | 58,210 | 109,242 | (15,533 | ) | 3,120 | (38,619 | ) | |||||||
See Notes to Consolidated Financial Statements
5
JOHNSON & JOHNSON AND SUBSIDIARIES
CONSOLIDATED STATEMENTS OF EQUITY (cont.)
(Unaudited; Dollars in Millions)
Fiscal Third Quarter Ended September 30, 2018
Total | Retained Earnings | Accumulated Other Comprehensive Income | Common Stock Issued Amount | Treasury Stock Amount | |||||||||||
Balance, July 1, 2018 | $ | 62,889 | 106,123 | (14,777 | ) | 3,120 | (31,577 | ) | |||||||
Cumulative Adjustment to retained earnings | — | — | — | — | — | ||||||||||
Net earnings | 3,934 | 3,934 | — | — | — | ||||||||||
Cash dividends paid ($0.90 per share) | (2,415 | ) | (2,415 | ) | — | — | — | ||||||||
Employee compensation and stock option plans | 560 | (24 | ) | — | — | 584 | |||||||||
Repurchase of common stock | (471 | ) | — | — | — | (471 | ) | ||||||||
Other | (1 | ) | (1 | ) | — | — | — | ||||||||
Other comprehensive income (loss), net of tax | 130 | — | 130 | — | — | ||||||||||
Balance, September 30, 2018 | $ | 64,626 | 107,617 | (14,647 | ) | 3,120 | (31,464 | ) | |||||||
Fiscal Nine Months Ended September 30, 2018
Total | Retained Earnings | Accumulated Other Comprehensive Income | Common Stock Issued Amount | Treasury Stock Amount | |||||||||||
Balance, December 31, 2017 | $ | 60,160 | 101,793 | (13,199 | ) | 3,120 | (31,554 | ) | |||||||
Cumulative Adjustment to retained earnings | 1,264 | 1,496 | (232 | ) | — | — | |||||||||
Net earnings | 12,255 | 12,255 | — | — | — | ||||||||||
Cash dividends paid ($2.64 per share) | (7,083 | ) | (7,083 | ) | — | — | — | ||||||||
Employee compensation and stock option plans | 1,320 | (830 | ) | — | — | 2,150 | |||||||||
Repurchase of common stock | (2,060 | ) | — | — | — | (2,060 | ) | ||||||||
Other | (14 | ) | (14 | ) | — | — | — | ||||||||
Other comprehensive income (loss), net of tax | (1,216 | ) | — | (1,216 | ) | — | — | ||||||||
Balance, September 30, 2018 | $ | 64,626 | 107,617 | (14,647 | ) | 3,120 | (31,464 | ) | |||||||
See Notes to Consolidated Financial Statements
6
JOHNSON & JOHNSON AND SUBSIDIARIES CONSOLIDATED STATEMENTS OF CASH FLOWS (Unaudited; Dollars in Millions) | |||||||
Fiscal Nine Months Ended | |||||||
September 29, 2019 | September 30, 2018 | ||||||
CASH FLOWS FROM OPERATING ACTIVITIES | |||||||
Net earnings | $ | 11,109 | 12,255 | ||||
Adjustments to reconcile net earnings to cash flows from operating activities: | |||||||
Depreciation and amortization of property and intangibles | 5,193 | 5,194 | |||||
Stock based compensation | 817 | 822 | |||||
Asset write-downs | 1,019 | 1,226 | |||||
Net gain on sale of assets/businesses | (2,125 | ) | (443 | ) | |||
Deferred tax provision | (2,126 | ) | 53 | ||||
Accounts receivable allowances | (15 | ) | (3 | ) | |||
Changes in assets and liabilities, net of effects from acquisitions and divestitures: | |||||||
Increase in accounts receivable | (665 | ) | (1,040 | ) | |||
Increase in inventories | (424 | ) | (777 | ) | |||
Increase in accounts payable and accrued liabilities | 2,273 | 731 | |||||
Increase in other current and non-current assets | (81 | ) | (904 | ) | |||
Increase / (Decrease) in other current and non-current liabilities | 2,043 | (1,157 | ) | ||||
NET CASH FLOWS FROM OPERATING ACTIVITIES | 17,018 | 15,957 | |||||
CASH FLOWS FROM INVESTING ACTIVITIES | |||||||
Additions to property, plant and equipment | (2,238 | ) | (2,352 | ) | |||
Proceeds from the disposal of assets/businesses, net | 3,103 | 895 | |||||
Acquisitions, net of cash acquired | (5,562 | ) | (897 | ) | |||
Purchases of investments | (2,684 | ) | (4,155 | ) | |||
Sales of investments | 2,459 | 1,162 | |||||
Other | 72 | (48 | ) | ||||
NET CASH USED BY INVESTING ACTIVITIES | (4,850 | ) | (5,395 | ) | |||
CASH FLOWS FROM FINANCING ACTIVITIES | |||||||
Dividends to shareholders | (7,417 | ) | (7,083 | ) | |||
Repurchase of common stock | (6,320 | ) | (2,060 | ) | |||
Proceeds from short-term debt | 148 | 40 | |||||
Retirement of short-term debt | (87 | ) | (2,365 | ) | |||
Proceeds from long-term debt, net of issuance costs | 1 | 6 | |||||
Retirement of long-term debt | (1,008 | ) | (910 | ) | |||
Proceeds from the exercise of stock options/employee withholding tax on stock awards, net | 580 | 480 | |||||
Other | 160 | (229 | ) | ||||
NET CASH USED BY FINANCING ACTIVITIES | (13,943 | ) | (12,121 | ) | |||
Effect of exchange rate changes on cash and cash equivalents | (83 | ) | (209 | ) | |||
Decrease in cash and cash equivalents | (1,858 | ) | (1,768 | ) | |||
Cash and Cash equivalents, beginning of period | 18,107 | 17,824 | |||||
CASH AND CASH EQUIVALENTS, END OF PERIOD | $ | 16,249 | 16,056 | ||||
Acquisitions | |||||||
Fair value of assets acquired | $ | 6,861 | 1,046 | ||||
Fair value of liabilities assumed and noncontrolling interests | (1,299 | ) | (149 | ) | |||
Net cash paid for acquisitions | $ | 5,562 | 897 | ||||
See Notes to Consolidated Financial Statements
7
NOTES TO CONSOLIDATED FINANCIAL STATEMENTS
NOTE 1 — The accompanying unaudited interim consolidated financial statements and related notes should be read in conjunction with the audited Consolidated Financial Statements of Johnson & Johnson and its subsidiaries (the Company) and related notes as contained in the Company’s Annual Report on Form 10-K for the fiscal year ended December 30, 2018. The unaudited interim financial statements include all adjustments (consisting only of normal recurring adjustments) and accruals necessary in the judgment of management for a fair statement of the results for the periods presented.
Columns and rows within tables may not add due to rounding. Percentages have been calculated using actual, non-rounded figures.
New Accounting Standards
Recently Adopted Accounting Standards
ASU 2016-02: Leases
The Company adopted this standard as of the beginning of fiscal year 2019, on a prospective basis. This update requires the recognition of lease assets and lease liabilities on the balance sheet for all lease obligations and disclosing key information about leasing arrangements. This update requires the recognition of lease assets and lease liabilities by lessees for arrangements that are classified as operating leases. The Company’s operating leases resulted in the recognition of additional assets and the corresponding liabilities on its Consolidated Balance Sheet, however it did not have a material impact on the consolidated financial statements.
The Company determines whether an arrangement is a lease at contract inception by establishing if the contract conveys the right to control the use of identified property, plant, or equipment for a period of time in exchange for consideration.
Right of Use (ROU) Assets and Lease Liabilities for operating leases are included in Other assets, Accrued liabilities, and Other liabilities on the consolidated balance sheet. The ROU Assets represent the right to use an underlying asset for the lease term and lease liabilities represent an obligation to make lease payments arising from the lease. Commitments under finance leases are not significant, and are included in Property, plant and equipment, Loans and notes payable, and Long-term debt on the consolidated balance sheet.
ROU Assets and Lease Liabilities are recognized at the lease commencement date based on the present value of all minimum lease payments over the lease term. The Company uses its incremental borrowing rate based on the information available at commencement date in determining the present value of lease payments, when the implicit rate is not readily determinable. Lease terms may include options to extend or terminate the lease. These options are included in the lease term when it is reasonably certain that the Company will exercise that option. Operating lease expense is recognized on a straight-line basis over the lease term.
The Company has elected the following policy elections on adoption: use of portfolio approach on leases of assets under master service agreements, exclusion of short term leases on the balance sheet, and not separating lease and non-lease components.
The Company primarily has operating leases for space, vehicles, manufacturing equipment, and data processing equipment. Leases have remaining lease terms ranging from 1 year to 55 years, some of which could include options to extend the leases when they are reasonably certain.
As noted in the Company’s 2018 10-K, the approximate minimum rental payments required under operating leases that had initial or remaining non-cancelable lease terms in excess of one year at December 30, 2018 were:
(Dollars in Millions)
2019 | 2020 | 2021 | 2022 | 2023 | After 2023 | Total | ||||||
$223 | 188 | 154 | 116 | 76 | 139 | 896 | ||||||
Commitments under finance leases are not significant.
8
Maturity of Lease Liabilities related to Operating Lease
The minimum rental payments required under operating leases that have initial or remaining non-cancellable lease terms in excess of one year as of September 29, 2019 are:
(Dollars in Millions) | Operating Leases | ||
2019 (for the remainder of fiscal 2019) | $ | 82 | |
2020 | 274 | ||
2021 | 218 | ||
2022 | 160 | ||
2023 | 106 | ||
After 2023 | 241 | ||
Total lease payments | 1,081 | ||
Less: Interest | 89 | ||
Present Value of lease liabilities | $ | 992 | |
The Weighted Average Remaining Lease Term and discount rate:
Operating leases 5.8 years
Weighted Average Discount Rate 3%
For the fiscal third quarter and fiscal nine months ended September 29, 2019, the operating lease costs were $103 million and $227 million, respectively. Cash paid for amounts included in the measurement of lease liabilities were $86 million and $233 million for the fiscal third quarter and fiscal nine months of 2019, respectively. Other supplemental information related to these leases are as follows:
Supplemental balance sheet information (for the fiscal third quarter ended September 29, 2019):
(Dollars in Millions) | ||||
Non-current operating lease right-of-use assets | $ | 963 | ||
Current operating lease liabilities | 266 | |||
Non-current Operating lease liabilities | 726 | |||
Total operating lease liabilities | $ | 992 | ||
ASU 2018-02: Reclassification of Certain Tax Effects from Accumulated Other Comprehensive Income
This update allows a Company to elect to reclassify stranded tax effects resulting from the Tax Cuts and Job Act enacted in December 2017 from accumulated other comprehensive income to retained earnings. The Company has elected not to reclassify the income tax effects of this standard and therefore this standard will not impact the Company's consolidated financial statements.
ASU 2018-16: Derivatives and Hedging (Topic ASC 815)
This update adds the Overnight Index Swap (OIS) rate based on the Secured Overnight Financing Rate (SOFR) as an eligible benchmark interest rate permitted in the application of hedge accounting. The guidance was effective for the Company as of the fiscal fourth quarter of 2018, due to the previous adoption of ASU 2017-12. The impact of the adoption of this guidance did not have a material impact on the Company’s consolidated financial statements and related disclosures. The standard may have an impact in the future as the market for SOFR derivatives develops over time and if SOFR is used to hedge the Company’s financial instruments.
9
Recently Issued Accounting Standards
Not Adopted as of September 29, 2019
ASU 2018-18: Collaborative Arrangements
This update clarifies the interaction between ASC 808, Collaborative Arrangements and ASC 606, Revenue from Contracts with Customers. The update clarifies that certain transactions between participants in a collaborative arrangement should be accounted for under ASC 606 when the counterparty is a customer. In addition, the update precludes an entity from presenting consideration from a transaction in a collaborative arrangement as revenue if the counterparty is not a customer for that transaction. This update will be effective for the Company for fiscal years beginning after December 15, 2019, and interim periods within those fiscal years. ASU 2018-18 should be applied retrospectively to the date of initial application of ASC 606 and early adoption is permitted. The adoption of this standard will not have a material impact on the Company’s consolidated financial statements.
ASU 2016-13: Financial Instruments - Credit Losses
This update introduces the current expected credit loss (CECL) model, which will require an entity to measure credit losses for certain financial instruments and financial assets, including trade receivables. Under this update, on initial recognition and at each reporting period, an entity will be required to recognize an allowance that reflects the entity’s current estimate of credit losses expected to be incurred over the life of the financial instrument. This update will be effective for the Company for fiscal years beginning after December 15, 2019 and interim periods within those fiscal years. Early adoption is permitted. The adoption of this standard will not have a material impact on the Company’s consolidated financial statements.
NOTE 2 — INVENTORIES
(Dollars in Millions) | September 29, 2019 | December 30, 2018 | |||||
Raw materials and supplies | $ | 1,094 | 1,114 | ||||
Goods in process | 2,000 | 2,109 | |||||
Finished goods | 6,079 | 5,376 | |||||
Total inventories(1) | $ | 9,173 | 8,599 | ||||
(1) The balance as of September 29, 2019, does not include the assets held for sale related to the strategic collaboration with Jabil Inc. of approximately $0.2 billion. The balance as of December 30, 2018, does not include the assets held for sale related to the divestiture of the Advanced Sterilization Products (ASP) business of approximately $0.2 billion and $0.3 billion related to the strategic collaboration with Jabil Inc.
NOTE 3 — INTANGIBLE ASSETS AND GOODWILL
Intangible assets that have finite useful lives are amortized over their estimated useful lives. The latest annual impairment assessment of goodwill and indefinite lived intangible assets was completed in the fiscal fourth quarter of 2018. Future impairment tests for goodwill and indefinite lived intangible assets will be performed annually in the fiscal fourth quarter, or sooner, if warranted.
(Dollars in Millions) | September 29, 2019 | December 30, 2018 | |||||
Intangible assets with definite lives: | |||||||
Patents and trademarks — gross | $ | 36,114 | 35,194 | ||||
Less accumulated amortization | 12,158 | 9,784 | |||||
Patents and trademarks — net | 23,956 | 25,410 | |||||
Customer relationships and other intangibles — gross | 21,845 | 21,334 | |||||
Less accumulated amortization | 9,120 | 8,323 | |||||
Customer relationships and other intangibles — net | 12,725 | 13,011 | |||||
Intangible assets with indefinite lives: | |||||||
Trademarks | 6,875 | 6,937 | |||||
Purchased in-process research and development (1) | 4,290 | 2,253 | |||||
Total intangible assets with indefinite lives | 11,165 | 9,190 | |||||
Total intangible assets — net | $ | 47,846 | 47,611 | ||||
10
(1)In the fiscal first quarter of 2019, the Company recorded an IPR&D impairment charge of $0.9 billion for the remaining intangible asset value related to the development program of AL-8176, an investigational drug for the treatment of Respiratory Syncytial Virus (RSV) and human metapneumovirus (hMPV) acquired with the 2014 acquisition of Alios Biopharma Inc. The impairment charge was based on additional information, including clinical data, which became available and led to the Company's decision to abandon the development of AL-8176. A partial impairment charge of $0.8 billion was previously recorded in the fiscal third quarter of 2018 related to the development program of AL-8176. In the fiscal second quarter of 2019, the Company completed the acquisition of Auris Health, Inc. and recorded an in-process research and development intangible asset of $2.9 billion.
Goodwill as of September 29, 2019 was allocated by segment of business as follows:
(Dollars in Millions) | Consumer | Pharm | Med Devices | Total | |||||||||
Goodwill at December 30, 2018 | $ | 8,670 | 9,063 | 12,720 | 30,453 | ||||||||
Goodwill, related to acquisitions | 1,191 | — | 2,018 | 3,209 | |||||||||
Currency translation/Other | (266 | ) | (86 | ) | (19 | ) | (371 | ) | |||||
Goodwill at September 29, 2019 | $ | 9,595 | 8,977 | 14,719 | 33,291 | ||||||||
The weighted average amortization period for patents and trademarks is 12 years. The weighted average amortization period for customer relationships and other intangible assets is 21 years. The amortization expense of amortizable intangible assets included in cost of products sold was $1.1 billion for each of the fiscal third quarters ended September 29, 2019 and September 30, 2018. The amortization expense of amortizable intangible assets included in cost of products sold was $3.3 billion for each of the fiscal nine months ended September 29, 2019 and September 30, 2018. The estimated amortization expense for the five succeeding years approximates $4.4 billion, before tax, per year. Intangible asset write-downs are included in Other (income) expense, net.
See Note 10 to the Consolidated Financial Statements for additional details related to acquisitions and divestitures.
NOTE 4 — FAIR VALUE MEASUREMENTS
The Company uses forward foreign exchange contracts to manage its exposure to the variability of cash flows, primarily related to the foreign exchange rate changes of future intercompany product and third-party purchases of materials denominated in a foreign currency. The Company uses cross currency interest rate swaps to manage currency risk primarily related to borrowings.
Both types of derivatives are designated as cash flow hedges.
Additionally, the Company uses interest rate swaps as an instrument to manage interest rate risk related to fixed rate borrowings. These derivatives are designated as fair value hedges. The Company uses cross currency interest rate swaps and forward foreign exchange contracts designated as net investment hedges. Additionally, the Company uses forward foreign exchange contracts to offset its exposure to certain foreign currency assets and liabilities. These forward foreign exchange contracts are not designated as hedges, and therefore, changes in the fair values of these derivatives are recognized in earnings, thereby offsetting the current earnings effect of the related foreign currency assets and liabilities.
The Company early adopted ASU 2017-12: Targeted Improvements to Accounting for Hedge Activities effective as of the beginning of fiscal second quarter of 2018.
The Company does not enter into derivative financial instruments for trading or speculative purposes, or that contain credit risk related contingent features. The Company maintains credit support agreements (CSA) with certain derivative counterparties establishing collateral thresholds based on respective credit ratings and netting agreements. As of September 29, 2019, the total amount of collateral received under the credit support agreements (CSA) amounted to $68 million, net. On an ongoing basis, the Company monitors counter-party credit ratings. The Company considers credit non-performance risk to be low, because the Company primarily enters into agreements with commercial institutions that have at least an investment grade credit rating. Refer to the table on significant financial assets and liabilities measured at fair value contained in this footnote for receivables and payables with these commercial institutions. As of September 29, 2019, the Company had notional amounts outstanding for forward foreign exchange contracts, cross currency interest rate swaps and interest rate swaps of $47.3 billion, $18.8 billion and $0.5 billion, respectively. As of December 30, 2018, the Company had notional amounts outstanding for forward foreign exchange contracts, cross currency interest rate swaps and interest rate swaps of $41.1 billion, $7.3 billion and $0.5 billion, respectively.
11
All derivative instruments are recorded on the balance sheet at fair value. Changes in the fair value of derivatives are recorded each period in current earnings or other comprehensive income, depending on whether the derivative is designated as part of a hedge transaction, and if so, the type of hedge transaction.
The designation as a cash flow hedge is made at the entrance date of the derivative contract. At inception, all derivatives are expected to be highly effective. Foreign exchange contracts designated as cash flow hedges are accounted for under the forward method and all gains/losses associated with these contracts will be recognized in the income statement when the hedged item impacts earnings. Changes in the fair value of these derivatives are recorded in accumulated other comprehensive income until the underlying transaction affects earnings and are then reclassified to earnings in the same account as the hedged transaction. Gains and losses associated with interest rate swaps and changes in fair value of hedged debt attributable to changes in interest rates are recorded to interest expense in the period in which they occur. Gains and losses on net investment hedges are accounted for through the currency translation account within accumulated other comprehensive income. The portion excluded from effectiveness testing is recorded through interest (income) expense using the spot method. On an ongoing basis, the Company assesses whether each derivative continues to be highly effective in offsetting changes of hedged items. If and when a derivative is no longer expected to be highly effective, hedge accounting is discontinued.
The Company designated its Euro denominated notes issued in May 2016 with due dates ranging from 2022 to 2035 as a net investment hedge of the Company's investments in certain of its international subsidiaries that use the Euro as their functional currency in order to reduce the volatility caused by changes in exchange rates.
As of September 29, 2019, the balance of deferred net loss on derivatives included in accumulated other comprehensive income was $374 million after-tax. For additional information, see the Consolidated Statements of Comprehensive Income and Note 7. The Company expects that substantially all of the amounts related to forward foreign exchange contracts will be reclassified into earnings over the next 12 months as a result of transactions that are expected to occur over that period. The maximum length of time over which the Company is hedging transaction exposure is 18 months, excluding interest rate contracts, net investment hedges and equity collar contracts. The amount ultimately realized in earnings may differ as foreign exchange rates change. Realized gains and losses are ultimately determined by actual exchange rates at maturity of the derivative.
12
The following table is a summary of the activity related to derivatives and hedges for the fiscal third quarters ended in 2019 and 2018:
September 29, 2019 | September 30, 2018 | ||||||||||||||||||||
(Dollars in Millions) | Sales | Cost of Products Sold | R&D Expense | Interest (Income) Expense | Other (Income) Expense | Sales | Cost of Products Sold | R&D Expense | Interest (Income) Expense | Other (Income) Expense | |||||||||||
The effects of fair value, net investment and cash flow hedging: | |||||||||||||||||||||
Gain (Loss) on fair value hedging relationship: | |||||||||||||||||||||
Interest rate swaps contracts: | |||||||||||||||||||||
Hedged items | $ | — | — | — | (3 | ) | — | — | — | — | (7 | ) | — | ||||||||
Derivatives designated as hedging instruments | — | — | — | 3 | — | — | — | — | 7 | — | |||||||||||
Gain (Loss) on net investment hedging relationship: | |||||||||||||||||||||
Cross currency interest rate swaps contracts: | |||||||||||||||||||||
Amount of gain or (loss) recognized in income on derivative amount excluded from effectiveness testing | — | — | — | 39 | — | — | — | — | 25 | — | |||||||||||
Amount of gain or (loss) recognized in AOCI | — | — | — | 39 | — | — | — | — | 25 | — | |||||||||||
Gain (Loss) on cash flow hedging relationship: | |||||||||||||||||||||
Forward foreign exchange contracts: | |||||||||||||||||||||
Amount of gain or (loss) reclassified from AOCI into income | (8 | ) | (77 | ) | 1,911 | — | 1 | 4 | 97 | 10 | — | (3 | ) | ||||||||
Amount of gain or (loss) recognized in AOCI | (23 | ) | (197 | ) | 1,939 | — | 5 | 15 | 192 | (4 | ) | — | (1 | ) | |||||||
Cross currency interest rate swaps contracts: | |||||||||||||||||||||
Amount of gain or (loss) reclassified from AOCI into income | — | — | — | 89 | — | — | — | 34 | — | ||||||||||||
Amount of gain or (loss) recognized in AOCI | $ | — | — | — | 159 | — | — | — | — | 35 | — | ||||||||||
13
The following table is a summary of the activity related to derivatives and hedges for the fiscal nine months ended in 2019 and 2018:
September 29, 2019 | September 30, 2018 | ||||||||||||||||||||
(Dollars in Millions) | Sales | Cost of Products Sold | R&D Expense | Interest (Income) Expense | Other (Income) Expense | Sales | Cost of Products Sold | R&D Expense | Interest (Income) Expense | Other (Income) Expense | |||||||||||
The effects of fair value, net investment and cash flow hedging: | |||||||||||||||||||||
Gain (Loss) on fair value hedging relationship: | |||||||||||||||||||||
Interest rate swaps contracts: | |||||||||||||||||||||
Hedged items | $ | — | — | — | (2 | ) | — | — | — | — | 3 | — | |||||||||
Derivatives designated as hedging instruments | — | — | — | 2 | — | — | — | — | (3 | ) | — | ||||||||||
Gain (Loss) on net investment hedging relationship: | |||||||||||||||||||||
Cross currency interest rate swaps contracts: | |||||||||||||||||||||
Amount of gain or (loss) recognized in income on derivative amount excluded from effectiveness testing | — | — | — | 117 | — | — | — | — | 27 | — | |||||||||||
Amount of gain or (loss) recognized in AOCI | — | — | — | 117 | — | — | — | — | 27 | — | |||||||||||
Gain (Loss) on cash flow hedging relationship: | |||||||||||||||||||||
Forward foreign exchange contracts: | |||||||||||||||||||||
Amount of gain or (loss) reclassified from AOCI into income | (43 | ) | (213 | ) | 1,808 | — | 9 | 50 | 175 | (242 | ) | — | (24 | ) | |||||||
Amount of gain or (loss) recognized in AOCI | (29 | ) | (543 | ) | 1,847 | — | 15 | (3 | ) | 138 | (220 | ) | — | (16 | ) | ||||||
Cross currency interest rate swaps contracts: | |||||||||||||||||||||
Amount of gain or (loss) reclassified from AOCI into income | — | — | — | 207 | — | — | — | — | 106 | — | |||||||||||
Amount of gain or (loss) recognized in AOCI | $ | — | — | — | 299 | — | — | — | — | 111 | — | ||||||||||
14
As of September 29, 2019, and December 30, 2018, the following amounts were recorded on the Consolidated Balance Sheet related to cumulative basis adjustment for fair value hedges:
Line item in the Consolidated Balance Sheet in which the hedged item is included | Carrying Amount of the Hedged Liability | Cumulative Amount of Fair Value Hedging Adjustment Included in the Carrying Amount of the Hedged Liability | |||||||||||
(Dollars in Millions) | September 29, 2019 | December 30, 2018 | September 29, 2019 | December 30, 2018 | |||||||||
Current Portion of Long-term Debt | $ | 502 | 494 | (2 | ) | 5 | |||||||
Long-term Debt | — | — | — | — | |||||||||
The following table is the effect of derivatives not designated as hedging instrument for the fiscal third quarter and fiscal nine months ended in 2019 and 2018: | ||||||||||||||
Gain/(Loss) Recognized In Income on Derivative | Gain/(Loss) Recognized In Income on Derivative | |||||||||||||
(Dollars in Millions) | Location of Gain /(Loss) Recognized in Income on Derivative | Fiscal Third Quarter Ended | Fiscal Nine Months Ended | |||||||||||
Derivatives Not Designated as Hedging Instruments | September 29, 2019 | September 30, 2018 | September 29, 2019 | September 30, 2018 | ||||||||||
Foreign Exchange Contracts | Other (income) expense | $ | (13 | ) | 49 | (101 | ) | (23 | ) | |||||
The following table is the effect of net investment hedges for the fiscal third quarters ended in 2019 and 2018
Gain/(Loss) Recognized In Accumulated OCI | Location of Gain or (Loss) Reclassified from Accumulated Other Comprehensive Income Into Income | Gain/(Loss) Reclassified From Accumulated OCI Into Income | |||||||||||||
(Dollars in Millions) | September 29, 2019 | September 30, 2018 | September 29, 2019 | September 30, 2018 | |||||||||||
Debt | $ | 162 | (50 | ) | Other (income) expense | — | — | ||||||||
Cross Currency interest rate swaps | $ | 152 | (75 | ) | Other (income) expense | — | — | ||||||||
The following table is the effect of net investment hedges for the fiscal nine months ended in 2019 and 2018:
Gain/(Loss) Recognized In Accumulated OCI | Location of Gain or (Loss) Reclassified from Accumulated Other Comprehensive Income Into Income | Gain/(Loss) Reclassified From Accumulated OCI Into Income | |||||||||||||
(Dollars in Millions) | September 29, 2019 | September 30, 2018 | September 29, 2019 | September 30, 2018 | |||||||||||
Debt | $ | 176 | 106 | Other (income) expense | — | — | |||||||||
Cross Currency interest rate swaps | $ | 465 | (37 | ) | Other (income) expense | — | — | ||||||||
15
The Company holds equity investments with readily determinable fair values and equity investments without readily determinable fair values. The Company has elected to measure equity investments that do not have readily determinable fair values at cost minus impairment, if any, plus or minus changes resulting from observable price changes in orderly transactions for the identical or a similar investment of the same issuer.
The following table is a summary of the activity related to equity investments:
(Dollars in Millions) | December 30, 2018 | September 29, 2019 | ||||||||||||||
Carrying Value | Changes in Fair Value Reflected in Net Income (1) | Sales/ Purchases/Other (2) | Carrying Value | Non Current Other Assets | ||||||||||||
Equity Investments with readily determinable value | $ | 511 | 201 | 151 | 863 | 863 | ||||||||||
Equity Investments without readily determinable value | $ | 681 | (28 | ) | 46 | 699 | 699 | |||||||||
(1) Recorded in Other Income/Expense
(2) Other includes impact of currency
For equity investments without readily determinable market values, $29 million of the decrease in the fair value reflected in net income were the result of impairments. There was a $1 million increase in the fair value reflected in net income due to changes in observable prices.
Fair value is the exit price that would be received to sell an asset or paid to transfer a liability. Fair value is a market-based measurement determined using assumptions that market participants would use in pricing an asset or liability. In accordance with ASC 820, a three-level hierarchy was established to prioritize the inputs used in measuring fair value. The levels within the hierarchy are described below with Level 1 inputs having the highest priority and Level 3 inputs having the lowest.
The fair value of a derivative financial instrument (i.e., forward foreign exchange contracts, interest rate contracts) is the aggregation by currency of all future cash flows discounted to its present value at the prevailing market interest rates and subsequently converted to the U.S. Dollar at the current spot foreign exchange rate. The Company does not believe that fair values of these derivative instruments materially differ from the amounts that could be realized upon settlement or maturity, or that the changes in fair value will have a material effect on the Company’s results of operations, cash flows or financial position. The Company also holds equity investments which are classified as Level 1 and debt securities which are classified as Level 2. The Company holds acquisition related contingent liabilities based upon certain regulatory and commercial events, which are classified as Level 3, whose values are determined using discounted cash flow methodologies or similar techniques for which the determination of fair value requires significant judgment or estimations.
The following three levels of inputs are used to measure fair value:
Level 1 — Quoted prices in active markets for identical assets and liabilities.
Level 2 — Significant other observable inputs.
Level 3 — Significant unobservable inputs.
16
The Company’s significant financial assets and liabilities measured at fair value as of September 29, 2019 and December 30, 2018 were as follows:
September 29, 2019 | December 30, 2018 | |||||||||||||||
(Dollars in Millions) | Level 1 | Level 2 | Level 3 | Total | Total(1) | |||||||||||
Derivatives designated as hedging instruments: | ||||||||||||||||
Assets: | ||||||||||||||||
Forward foreign exchange contracts | $ | — | 498 | — | 498 | 501 | ||||||||||
Interest rate contracts (2)(4) | — | 681 | — | 681 | 161 | |||||||||||
Total | — | 1,179 | — | 1,179 | 662 | |||||||||||
Liabilities: | ||||||||||||||||
Forward foreign exchange contracts | — | 635 | — | 635 | 548 | |||||||||||
Interest rate contracts (3)(4) | — | 410 | — | 410 | 292 | |||||||||||
Total | — | 1,045 | — | 1,045 | 840 | |||||||||||
Derivatives not designated as hedging instruments: | ||||||||||||||||
Assets: | ||||||||||||||||
Forward foreign exchange contracts | — | 32 | — | 32 | 32 | |||||||||||
Liabilities: | ||||||||||||||||
Forward foreign exchange contracts | — | 38 | — | 38 | 32 | |||||||||||
Other Investments: | ||||||||||||||||
Equity investments (5) | 863 | — | — | 863 | 511 | |||||||||||
Debt securities(6) | $ | — | 4,327 | — | 4,327 | 9,734 | ||||||||||
Other Liabilities | ||||||||||||||||
Contingent consideration (7) | 1,596 | 1,596 | 335 | |||||||||||||
Gross to Net Derivative Reconciliation | September 29, 2019 | December 30, 2018 | |||||
(Dollars in Millions) | |||||||
Total Gross Assets | $ | 1,211 | 694 | ||||
Credit Support Agreement (CSA) | (1,013 | ) | (423 | ) | |||
Total Net Asset | 198 | 271 | |||||
Total Gross Liabilities | 1,083 | 872 | |||||
Credit Support Agreement (CSA) | (945 | ) | (605 | ) | |||
Total Net Liabilities | $ | 138 | 267 | ||||
Summarized information about changes in liabilities for contingent consideration is as follows:
Nine months ended | ||||||||
September 29, 2019 | September 30, 2018 | |||||||
(Dollars in Millions) | ||||||||
Beginning Balance | $ | 335 | $ | 600 | ||||
Changes in estimated fair value | 129 | (162 | ) | |||||
Additions | 1,132 | 125 | ||||||
Payments | — | (160 | ) | |||||
Ending Balance | $ | 1,596 | $ | 403 | ||||
17
(1) | December 30, 2018 assets and liabilities are all classified as Level 2 with the exception of equity investments of $511 million, which are classified as Level 1 and $335 million, classified as Level 3. |
(2) | Includes $1 million and $6 million of non-current other assets as of September 29, 2019 and December 30, 2018, respectively. |
(3) | Includes $3 million of non-current other liabilities as of December 30, 2018. |
(4) | Includes cross currency interest rate swaps and interest rate swaps. |
(5) | Classified as non-current other assets. The carrying amount of the equity investments were $863 million and $511 million as of September 29, 2019 and December 30, 2018, respectively. |
(6) | Classified within cash equivalents and current marketable securities. |
(7) | Includes $1,453 million (primarily related to Auris Health) and $335 million, classified as non-current other liabilities as of September 29, 2019 and December 30, 2018, respectively. Includes $143 million classified as current liabilities as of September 29, 2019 |
18
The Company's cash, cash equivalents and current marketable securities as of September 29, 2019 comprised:
(Dollars in Millions) | Carrying Amount | Unrecognized Gain | Estimated Fair Value | Cash & Cash Equivalents | Current Marketable Securities | ||||||||||
Cash | $ | 2,667 | — | 2,667 | 2,667 | ||||||||||
Other sovereign securities(1) | 709 | — | 709 | 619 | 90 | ||||||||||
U.S. reverse repurchase agreements | 6,182 | — | 6,182 | 6,182 | |||||||||||
Other reverse repurchase agreements | 241 | — | 241 | 241 | |||||||||||
Corporate debt securities(1) | 1,647 | — | 1,647 | 1,159 | 488 | ||||||||||
Money market funds | 1,481 | — | 1,481 | 1,481 | |||||||||||
Time deposits(1) | 691 | — | 691 | 691 | |||||||||||
Subtotal | 13,618 | — | 13,618 | 13,040 | 578 | ||||||||||
Unrealized Gain | |||||||||||||||
Government securities | 4,050 | 1 | 4,051 | 3,195 | 856 | ||||||||||
Other sovereign securities | 4 | — | 4 | — | 4 | ||||||||||
Corporate debt securities | 272 | — | 272 | 14 | 258 | ||||||||||
Subtotal available for sale debt(2) | $ | 4,326 | 1 | 4,327 | 3,209 | 1,118 | |||||||||
Total cash, cash equivalents and current marketable securities | $ | 17,944 | 1 | 17,945 | 16,249 | 1,696 | |||||||||
(1) Held to maturity investments are reported at amortized cost and gains or losses are reported in earnings.
(2) Available for sale debt securities are reported at fair value with unrealized gains and losses reported net of taxes in other comprehensive income.
In the fiscal year ended December 30, 2018 the carrying amount was the same as the estimated fair value.
Fair value of government securities and obligations and corporate debt securities was estimated using quoted broker prices and significant other observable inputs.
The Company classifies all highly liquid investments with stated maturities of three months or less from date of purchase as cash equivalents and all highly liquid investments with stated maturities of greater than three months from the date of purchase as current marketable securities. Available for sale securities with stated maturities of greater than one year from the date of purchase are available to fund current operations and are classified as cash equivalents and current marketable securities.
The contractual maturities of the available for sale securities as of September 29, 2019 are as follows:
(Dollars in Millions) | Cost Basis | Fair Value | |||||
Due within one year | $ | 4,267 | 4,268 | ||||
Due after one year through five years | 59 | 59 | |||||
Due after five years through ten years | — | — | |||||
Total debt securities | $ | 4,326 | 4,327 | ||||
19
Financial Instruments not measured at Fair Value:
The following financial liabilities are held at carrying amount on the consolidated balance sheet as of September 29, 2019:
(Dollars in Millions) | Carrying Amount | Estimated Fair Value | |||||
Financial Liabilities | |||||||
Current Debt | $ | 2,299 | 2,349 | ||||
Non-Current Debt | |||||||
1.950% Notes due 2020 | 500 | 501 | |||||
3.55% Notes due 2021 | 449 | 461 | |||||
2.45% Notes due 2021 | 349 | 354 | |||||
1.65% Notes due 2021 | 999 | 997 | |||||
0.250% Notes due 2022 (1B Euro 1.0958) | 1,094 | 1,108 | |||||
2.25% Notes due 2022 | 997 | 1,011 | |||||
6.73% Debentures due 2023 | 250 | 298 | |||||
3.375% Notes due 2023 | 804 | 854 | |||||
2.05% Notes due 2023 | 498 | 502 | |||||
0.650% Notes due 2024 (750MM Euro 1.0958) | 819 | 850 | |||||
5.50% Notes due 2024 (500 MM GBP 1.2353) | 613 | 752 | |||||
2.625% Notes due 2025 | 748 | 771 | |||||
2.45% Notes due 2026 | 1,992 | 2,028 | |||||
2.95% Notes due 2027 | 996 | 1,052 | |||||
2.90% Notes due 2028 | 1,494 | 1,573 | |||||
1.150% Notes due 2028 (750MM Euro 1.0958) | 815 | 887 | |||||
6.95% Notes due 2029 | 297 | 416 | |||||
4.95% Debentures due 2033 | 498 | 627 | |||||
4.375% Notes due 2033 | 855 | 1,021 | |||||
1.650% Notes due 2035 (1.5B Euro 1.0958) | 1,628 | 1,916 | |||||
3.55% Notes due 2036 | 989 | 1,082 | |||||
5.95% Notes due 2037 | 992 | 1,394 | |||||
3.625% Notes due 2037 | 1,487 | 1,656 | |||||
3.40% Notes due 2038 | 991 | 1,073 | |||||
5.85% Debentures due 2038 | 696 | 983 | |||||
4.50% Debentures due 2040 | 539 | 668 | |||||
4.85% Notes due 2041 | 297 | 387 | |||||
4.50% Notes due 2043 | 495 | 629 | |||||
3.70% Notes due 2046 | 1,973 | 2,232 | |||||
3.75% Notes due 2047 | 991 | 1,124 | |||||
3.50% Notes due 2048 | 742 | 817 | |||||
Other | 32 | 33 | |||||
Total Non-Current Debt | $ | 26,919 | 30,057 | ||||
The weighted average effective interest rate on non-current debt is 3.20%.
The excess of the estimated fair value over the carrying value of debt was $0.3 billion at December 30, 2018.
20
Fair value of the non-current debt was estimated using market prices, which were corroborated by quoted broker prices and significant other observable inputs.
NOTE 5 — INCOME TAXES
The worldwide effective income tax rates for the fiscal nine months of 2019 and 2018 were 15.3% and 17.6%, respectively. During the third fiscal quarter of 2019, the Company recorded a tax benefit from the enactment of Swiss tax reform which reduced the effective rate for the fiscal nine months of 2019 by 3.0%. This benefit was partially offset by the Company increasing its unrecognized tax benefit liability in the current quarter which increased the effective tax rate for the fiscal nine months of 2019 by approximately 2.0%. Additionally, the Company had less income in higher tax jurisdictions relative to lower tax jurisdictions as compared to the same period in 2018. This was primarily driven by the impact of the agreement in principle to settle opioid litigation (see Note 11 to the Consolidated Financial Statements), in the fiscal third quarter of 2019, which was recorded in the U.S., at an effective tax rate of 23%.
As of September 29, 2019, the Company had approximately $3.6 billion of liabilities from unrecognized tax benefits. The Company believes it is possible that tax audits may be completed over the next twelve months by taxing authorities in some jurisdictions outside of the United States. The Company is not able to provide a reasonably reliable estimate of the timing of any future tax payments relating to these uncertain tax positions. With respect to the United States, the IRS has completed its audit for the tax years through 2009 and is currently auditing the tax years 2010 through 2012. The Company has reassessed its uncertain tax positions based on the best information available and therefore in the fiscal third quarter of 2019 has increased its unrecognized tax benefit liability by approximately $0.2 billion. The Company currently expects substantial completion of the audit and settlement of the related tax liabilities in the next nine months. The completion of this tax audit may result in additional adjustments to the Company’s unrecognized tax benefit liability that may have a material impact on the Company’s future operating results or cash flows in the period that the audit is substantially completed.
Swiss Tax Reform
On September 28, 2018 the Swiss Parliament approved the Federal Act on Tax Reform and AHV Financing (TRAF). On May 19, 2019 a public referendum was held in Switzerland that approved the federal reform proposals. In the fiscal third quarter of 2019, the Swiss Federal Council enacted TRAF. TRAF will become effective on January 1, 2020. The Federal transitional provisions of TRAF allow companies, under certain conditions, to adjust their tax basis adjustments to fair value (i.e., “step-up”) which is used for tax depreciation and amortization purposes resulting in a deduction over the transitional period. The adjustment to the Company’s asset tax basis will require review and approval by the tax authorities.
TRAF also provides for parameters which enable the Swiss cantons to establish localized tax rates and regulations for companies. The new cantonal tax parameters include favorable tax benefits for patents and an additional research and development tax deduction. The cantonal transitional provisions of TRAF are also expected to allow companies to elect either 1) tax basis step-up similar to the Federal transition benefit or 2) alternative statutory tax rate for a period not to exceed 5 years. The Company currently has operations located in various Swiss cantons and enactment may not be uniform in both the substantive nature of the legislation and the timing of enactment. The cantons are expected to implement new local legislation by January 1, 2020 or the new federal law will be directly applied.
The Company recorded a net tax benefit of $0.4 billion related to this federal and certain cantonal enactments in the fiscal third quarter of 2019 consisting of the following provisions:
• | approximately $360 million tax expense relating to the remeasurement of Swiss deferred tax assets and liabilities for the change in Federal and cantonal tax rates, where enactment occurred by September 29, 2019. |
• | a $1.2 billion deferred tax asset related to the estimated value of a Federal tax basis step-up of the Company’s Swiss subsidiaries’ assets. |
• | approximately $450 million deferred tax expense relating to U.S. deferred tax liabilities relating to the Global Intangible Low-Taxed Income (GILTI) tax resulting from the remeasurement of the Swiss deferred tax assets and liabilities and the new deferred tax asset for the Federal step-up. See the 2018 Form 10-K for more discussion on the Company’s policy election to account for GILTI under the deferred method. |
As of September 29, 2019, two cantons in which the Company operates have enacted legislation in response to the TRAF. The Company is currently assessing the elective cantonal transition provisions including discussions with local taxing authorities on the application of the new law. The Company has recorded an estimated impact of the transitional provisions based on the best available information for cantons where enactment has occurred. The estimated cantonal benefit that has been recorded is not material to the results of the Company. The amounts recorded in the current fiscal quarter do not include the impact of cantonal
21
law changes including the transitional provisions which have not yet been enacted. These enactments, which are expected to occur in the fiscal fourth quarter of 2019 or early 2020, may result in a material impact to the future results of the Company.
NOTE 6 — PENSIONS AND OTHER BENEFIT PLANS
Components of Net Periodic Benefit Cost
Net periodic benefit costs for the Company’s defined benefit retirement plans and other benefit plans for the fiscal third quarters and the fiscal nine months of 2019 and 2018 include the following components:
Fiscal Third Quarter Ended | Fiscal Nine Months Ended | ||||||||||||||||||||||||
Retirement Plans | Other Benefit Plans | Retirement Plans | Other Benefit Plans | ||||||||||||||||||||||
(Dollars in Millions) | September 29, 2019 | September 30, 2018 | September 29, 2019 | September 30, 2018 | September 29, 2019 | September 30, 2018 | September 29, 2019 | September 30, 2018 | |||||||||||||||||
Service cost | $ | 275 | 307 | 68 | 67 | 828 | 925 | 205 | 202 | ||||||||||||||||
Interest cost | 273 | 247 | 46 | 37 | 822 | 748 | 138 | 112 | |||||||||||||||||
Expected return on plan assets | (578 | ) | (550 | ) | (2 | ) | (1 | ) | (1,742 | ) | (1,664 | ) | (5 | ) | (5 | ) | |||||||||
Amortization of prior service cost/(credit) | 1 | 1 | (7 | ) | (7 | ) | 3 | 2 | (23 | ) | (23 | ) | |||||||||||||
Recognized actuarial losses | 145 | 213 | 32 | 31 | 435 | 641 | 97 | 92 | |||||||||||||||||
Curtailments and settlements | (4 | ) | — | — | — | 3 | (2 | ) | — | — | |||||||||||||||
Net periodic benefit cost | $ | 112 | 218 | 137 | 127 | 349 | 650 | 412 | 378 | ||||||||||||||||
The service cost component of net periodic benefit cost is presented in the same line items on the Consolidated Statement of Earnings where other employee compensation costs are reported. All other components of net periodic benefit cost are presented as part of Other (income) expense, net on the Consolidated Statement of Earnings.
Company Contributions
For the fiscal nine months ended September 29, 2019, the Company contributed $62 million and $95 million to its U.S. and international retirement plans, respectively. The Company plans to continue to fund its U.S. defined benefit plans to comply with the Pension Protection Act of 2006. International plans are funded in accordance with local regulations.
NOTE 7 — ACCUMULATED OTHER COMPREHENSIVE INCOME
Components of other comprehensive income (loss) consist of the following:
Foreign | Gain/(Loss) | Employee | Gain/(Loss) | Total Accumulated | ||||||||||||
Currency | On | Benefit | On Derivatives | Other Comprehensive | ||||||||||||
(Dollars in Millions) | Translation | Securities | Plans | & Hedges | Income (Loss) | |||||||||||
December 30, 2018 | $ | (8,869 | ) | — | (6,158 | ) | (195 | ) | (15,222 | ) | ||||||
Net change | (575 | ) | 1 | 442 | (179 | ) | (311 | ) | ||||||||
September 29, 2019 | $ | (9,444 | ) | 1 | (5,716 | ) | (374 | ) | (15,533 | ) | ||||||
Amounts in accumulated other comprehensive income are presented net of the related tax impact. Foreign currency translation is not adjusted for income taxes where it relates to permanent investments in international subsidiaries. For additional details on comprehensive income see the Consolidated Statements of Comprehensive Income.
Details on reclassifications out of Accumulated Other Comprehensive Income:
Gain/(Loss) On Securities - reclassifications released to Other (income) expense, net.
Employee Benefit Plans - reclassifications are included in net periodic benefit cost. See Note 6 for additional details.
Gain/(Loss) On Derivatives & Hedges - reclassifications to earnings are recorded in the same account as the underlying transaction. See Note 4 for additional details.
22
NOTE 8 — EARNINGS PER SHARE
The following is a reconciliation of basic net earnings per share to diluted net earnings per share for the fiscal third quarters and the fiscal nine months ended September 29, 2019 and September 30, 2018:
Fiscal Third Quarter Ended | Fiscal Nine Months Ended | ||||||||||||
(Shares in Millions) | September 29, 2019 | September 30, 2018 | September 29, 2019 | September 30, 2018 | |||||||||
Basic net earnings per share | $ | 0.67 | 1.47 | 4.19 | 4.57 | ||||||||
Average shares outstanding — basic | 2,635.2 | 2,683.2 | 2,649.5 | 2,682.6 | |||||||||
Potential shares exercisable under stock option plans | 117.8 | 140.3 | 137.6 | 140.9 | |||||||||
Less: shares which could be repurchased under treasury stock method | (83.8 | ) | (96.7 | ) | (99.7 | ) | (94.7 | ) | |||||
Convertible debt shares | 0.7 | 0.8 | 0.7 | 0.8 | |||||||||
Average shares outstanding — diluted | 2,669.9 | 2,727.6 | 2,688.1 | 2,729.6 | |||||||||
Diluted net earnings per share | $ | 0.66 | 1.44 | 4.13 | 4.49 | ||||||||
The diluted net earnings per share calculation for both the fiscal third quarters ended September 29, 2019 and September 30, 2018 included the dilutive effect of convertible debt that was offset by the related reduction in interest expense. The diluted net earnings per share calculation for the fiscal third quarter ended September 29, 2019 excluded 19 million shares related to stock options, as the exercise price of these options was greater than their average market value. The diluted net earnings per share calculation for the fiscal third quarter ended September 30, 2018 included all shares related to stock options, as there were no options or other instruments which were anti-dilutive.
The diluted net earnings per share calculation for both the fiscal nine months ended September 29, 2019 and September 30, 2018 included the dilutive effect of convertible debt that was offset by the related reduction in interest expense. The diluted net earnings per share calculation for the fiscal nine months ended September 29, 2019 excluded an insignificant number of shares related to stock options, as the exercise price of these options was greater than their average market value. The diluted net earnings per share calculation for the fiscal nine months ended September 30, 2018 included all shares related to stock options, as there were no options or other instruments which were anti-dilutive.
23
NOTE 9 — SEGMENTS OF BUSINESS AND GEOGRAPHIC AREAS
SALES BY SEGMENT OF BUSINESS
Fiscal Third Quarter Ended | Fiscal Nine Months Ended | |||||||||||||||||||
(Dollars in Millions) | September 29, 2019 | September 30, 2018 | Percent Change | September 29, 2019 | September 30, 2018 | Percent Change | ||||||||||||||
CONSUMER | ||||||||||||||||||||
Baby Care | ||||||||||||||||||||
U.S. | $ | 91 | 120 | (24.1 | )% | $ | 277 | 306 | (9.5 | )% | ||||||||||
International | 326 | 352 | (7.3 | ) | 977 | 1,079 | (9.5 | ) | ||||||||||||
Worldwide | 417 | 472 | (11.6 | ) | 1,254 | 1,385 | (9.5 | ) | ||||||||||||
Beauty | ||||||||||||||||||||
U.S. | 559 | 543 | 2.9 | 1,810 | 1,791 | 1.1 | ||||||||||||||
International | 592 | 535 | 10.8 | 1,633 | 1,480 | 10.4 | ||||||||||||||
Worldwide | 1,151 | 1,078 | 6.8 | 3,443 | 3,271 | 5.3 | ||||||||||||||
Oral Care | ||||||||||||||||||||
U.S. | 156 | 158 | (1.1 | ) | 462 | 472 | (2.1 | ) | ||||||||||||
International | 223 | 226 | (1.6 | ) | 673 | 684 | (1.7 | ) | ||||||||||||
Worldwide | 379 | 384 | (1.4 | ) | 1,135 | 1,156 | (1.8 | ) | ||||||||||||
OTC | ||||||||||||||||||||
U.S. | 477 | 440 | 8.4 | 1,468 | 1,359 | 8.0 | ||||||||||||||
International | 621 | 608 | 2.2 | 1,781 | 1,827 | (2.5 | ) | |||||||||||||
Worldwide | 1,098 | 1,048 | 4.8 | 3,249 | 3,186 | 2.0 | ||||||||||||||
Women's Health | ||||||||||||||||||||
U.S. | 3 | 3 | (4.0 | ) | 9 | 10 | (3.8 | ) | ||||||||||||
International | 252 | 266 | (5.4 | ) | 724 | 782 | (7.5 | ) | ||||||||||||
Worldwide | 255 | 269 | (5.3 | ) | 733 | 792 | (7.4 | ) | ||||||||||||
Wound Care/Other | ||||||||||||||||||||
U.S. | 109 | 106 | 1.9 | 343 | 344 | (0.4 | ) | |||||||||||||
International | 59 | 58 | 3.3 | 173 | 183 | (5.0 | ) | |||||||||||||
Worldwide | 168 | 164 | 2.4 | 516 | 527 | (2.0 | ) | |||||||||||||
TOTAL CONSUMER | ||||||||||||||||||||
U.S. | 1,394 | 1,370 | 1.7 | 4,369 | 4,282 | 2.0 | ||||||||||||||
International | 2,075 | 2,045 | 1.4 | 5,962 | 6,035 | (1.2 | ) | |||||||||||||
Worldwide | 3,469 | 3,415 | 1.6 | 10,331 | 10,317 | 0.1 | ||||||||||||||
24
PHARMACEUTICAL | ||||||||||||||||||||
Immunology | ||||||||||||||||||||
U.S. | 2,582 | 2,400 | 7.6 | 7,124 | 6,717 | 6.1 | ||||||||||||||
International | 1,129 | 998 | 13.2 | 3,304 | 3,061 | 8.0 | ||||||||||||||
Worldwide | 3,711 | 3,398 | 9.3 | 10,428 | 9,778 | 6.7 | ||||||||||||||
REMICADE® | ||||||||||||||||||||
U.S. | 749 | 987 | (24.1 | ) | 2,324 | 2,821 | (17.6 | ) | ||||||||||||
U.S. Exports | 88 | 100 | (12.0 | ) | 226 | 346 | (34.7 | ) | ||||||||||||
International | 299 | 292 | 2.5 | 795 | 921 | (13.7 | ) | |||||||||||||
Worldwide | 1,136 | 1,379 | (17.6 | ) | 3,345 | 4,088 | (18.2 | ) | ||||||||||||
SIMPONI / SIMPONI ARIA® | ||||||||||||||||||||
U.S. | 313 | 281 | 11.6 | 857 | 779 | 10.0 | ||||||||||||||
International | 273 | 255 | 7.3 | 816 | 823 | (0.8 | ) | |||||||||||||
Worldwide | 586 | 536 | 9.6 | 1,673 | 1,602 | 4.5 | ||||||||||||||
STELARA® | ||||||||||||||||||||
U.S. | 1,212 | 889 | 36.3 | 3,152 | 2,460 | 28.1 | ||||||||||||||
International | 487 | 421 | 15.7 | 1,509 | 1,252 | 20.5 | ||||||||||||||
Worldwide | 1,698 | 1,310 | 29.6 | 4,661 | 3,712 | 25.6 | ||||||||||||||
TREMFYA® | ||||||||||||||||||||
U.S. | 221 | 143 | 54.3 | 565 | 311 | 81.7% | ||||||||||||||
International | 69 | 28 | * | 177 | 58 | * | ||||||||||||||
Worldwide | 290 | 171 | 69.0 | 742 | 369 | * | ||||||||||||||
OTHER IMMUNOLOGY | ||||||||||||||||||||
U.S. | — | — | — | — | — | — | ||||||||||||||
International | 2 | 2 | (4.4) | 8 | 7 | 13.7 | ||||||||||||||
Worldwide | 2 | 2 | (4.4) | 8 | 7 | 13.7 | ||||||||||||||
Infectious Diseases | ||||||||||||||||||||
U.S. | 418 | 345 | 21.2 | 1,162 | 1,006 | 15.5 | ||||||||||||||
International | 421 | 478 | (12.0 | ) | 1,385 | 1,496 | (7.4 | ) | ||||||||||||
Worldwide | 839 | 823 | 1.9 | 2,547 | 2,502 | 1.8 | ||||||||||||||
EDURANT® / rilpivirine | ||||||||||||||||||||
U.S. | 12 | 13 | (7.3 | ) | 36 | 42 | (14.3 | ) | ||||||||||||
International | 206 | 189 | 9.0 | 603 | 581 | 3.8 | ||||||||||||||
Worldwide | 218 | 202 | 7.9 | 639 | 623 | 2.6 | ||||||||||||||
PREZISTA® / PREZCOBIX® / REZOLSTA® / SYMTUZA® | ||||||||||||||||||||
U.S. | 373 | 297 | 25.4 | 1,032 | 847 | 21.8 | ||||||||||||||
International | 135 | 193 | (29.8 | ) | 534 | 613 | (12.8 | ) | ||||||||||||
Worldwide | 508 | 490 | 3.7 | 1,566 | 1,460 | 7.3 | ||||||||||||||
OTHER INFECTIOUS DISEASES | ||||||||||||||||||||
U.S. | 33 | 35 | (4.3 | ) | 94 | 117 | (19.6 | ) | ||||||||||||
International | 80 | 96 | (17.4 | ) | 248 | 302 | (18.2 | ) | ||||||||||||
Worldwide | 113 | 131 | (13.9 | ) | 342 | 419 | (18.6 | ) | ||||||||||||
25
Neuroscience | ||||||||||||||||||||
U.S. | 785 | 651 | 20.7 | 2,172 | 1,914 | 13.5 | ||||||||||||||
International | 810 | 839 | (3.5 | ) | 2,590 | 2,663 | (2.7 | ) | ||||||||||||
Worldwide | 1,595 | 1,490 | 7.1 | 4,762 | 4,577 | 4.0 | ||||||||||||||
CONCERTA® / methylphenidate | ||||||||||||||||||||
U.S. | 84 | 57 | 48.2 | 196 | 191 | 2.9 | ||||||||||||||
International | 109 | 100 | 9.4 | 348 | 322 | 8.0 | ||||||||||||||
Worldwide | 193 | 157 | 23.5 | 544 | 513 | 6.1 | ||||||||||||||
INVEGA SUSTENNA® / XEPLION® / INVEGA TRINZA® / TREVICTA® | ||||||||||||||||||||
U.S. | 554 | 468 | 18.3 | 1,543 | 1,306 | 18.1 | ||||||||||||||
International | 297 | 281 | 5.9 | 916 | 859 | 6.7 | ||||||||||||||
Worldwide | 851 | 749 | 13.7 | 2,459 | 2,165 | 13.6 | ||||||||||||||
RISPERDAL CONSTA® | ||||||||||||||||||||
U.S. | 79 | 76 | 4.9 | 237 | 238 | (0.5 | ) | |||||||||||||
International | 89 | 99 | (10.5 | ) | 292 | 321 | (9.1 | ) | ||||||||||||
Worldwide | 167 | 175 | (3.8 | ) | 528 | 559 | (5.4 | ) | ||||||||||||
OTHER NEUROSCIENCE | ||||||||||||||||||||
U.S. | 68 | 50 | 35.3 | 196 | 179 | 9.7 | ||||||||||||||
International | 316 | 359 | (12.5 | ) | 1,035 | 1,161 | (10.9 | ) | ||||||||||||
Worldwide | 384 | 409 | (6.6 | ) | 1,231 | 1,340 | (8.2 | ) | ||||||||||||
Oncology | ||||||||||||||||||||
U.S. | 1,171 | 1,250 | (6.3 | ) | 3,146 | 3,268 | (3.7 | ) | ||||||||||||
International | 1,590 | 1,338 | 18.8 | 4,830 | 4,087 | 18.2 | ||||||||||||||
Worldwide | 2,761 | 2,588 | 6.7 | 7,976 | 7,355 | 8.4 | ||||||||||||||
DARZALEX® | ||||||||||||||||||||
U.S. | 402 | 318 | 26.1 | 1,123 | 880 | 27.6 | ||||||||||||||
International | 363 | 180 | * | 1,045 | 561 | 86.2 | ||||||||||||||
Worldwide | 765 | 498 | 53.5 | 2,168 | 1,441 | 50.4 | ||||||||||||||
IMBRUVICA® | ||||||||||||||||||||
U.S. | 447 | 334 | 34.0 | 1,163 | 811 | 43.5 | ||||||||||||||
International | 475 | 371 | 27.6 | 1,373 | 1,101 | 24.6 | ||||||||||||||
Worldwide | 921 | 705 | 30.6 | 2,536 | 1,912 | 32.6 | ||||||||||||||
VELCADE® | ||||||||||||||||||||
U.S. | — | — | — | — | — | — | ||||||||||||||
International | 149 | 271 | (44.8 | ) | 636 | 864 | (26.3 | ) | ||||||||||||
Worldwide | 149 | 271 | (44.8 | ) | 636 | 864 | (26.3 | ) | ||||||||||||
ZYTIGA® / abiraterone acetate | ||||||||||||||||||||
U.S. | 233 | 527 | (55.8 | ) | 616 | 1,420 | (56.6 | ) | ||||||||||||
International | 508 | 431 | 17.8 | 1,502 | 1,292 | 16.2 | ||||||||||||||
Worldwide | 741 | 958 | (22.7 | ) | 2,118 | 2,712 | (21.9 | ) | ||||||||||||
OTHER ONCOLOGY | ||||||||||||||||||||
U.S. | 91 | 71 | 26.7 | 245 | 157 | 54.7 | ||||||||||||||
International | 95 | 85 | 12.2 | 274 | 269 | 2.1 | ||||||||||||||
Worldwide | 186 | 156 | 18.8 | 519 | 426 | 21.6 | ||||||||||||||
26
Pulmonary Hypertension | ||||||||||||||||||||
U.S. | 427 | 425 | 0.5 | 1,296 | 1,215 | 6.6 | ||||||||||||||
International | 227 | 231 | (1.6) | 704 | 691 | 1.9 | ||||||||||||||
Worldwide | 654 | 656 | (0.3) | 2,000 | 1,906 | 4.9 | ||||||||||||||
OPSUMIT® | ||||||||||||||||||||
U.S. | 206 | 182 | 12.9 | 581 | 511 | 13.7 | ||||||||||||||
International | 140 | 128 | 10.1 | 419 | 381 | 10.2 | ||||||||||||||
Worldwide | 347 | 310 | 11.7 | 1,001 | 892 | 12.2 | ||||||||||||||
TRACLEER® / bosentan | ||||||||||||||||||||
U.S. | 19 | 69 | (72.4) | 121 | 208 | (41.8 | ) | |||||||||||||
International | 46 | 70 | (32.8) | 164 | 214 | (23.3 | ) | |||||||||||||
Worldwide | 65 | 139 | (52.7) | 285 | 422 | (32.4 | ) | |||||||||||||
UPTRAVI® | ||||||||||||||||||||
U.S. | 185 | 154 | 20.2 | 536 | 433 | 23.9 | ||||||||||||||
International | 25 | 17 | 52.1 | 75 | 49 | 52.8 | ||||||||||||||
Worldwide | 210 | 171 | 23.4 | 611 | 482 | 26.8 | ||||||||||||||
OTHER | ||||||||||||||||||||
U.S. | 17 | 20 | (10.1) | 58 | 63 | (8.9 | ) | |||||||||||||
International | 15 | 16 | (15.4) | 46 | 47 | (3.0 | ) | |||||||||||||
Worldwide | 31 | 36 | (12.6) | 103 | 110 | (6.4 | ) | |||||||||||||
Cardiovascular / Metabolism / Other | ||||||||||||||||||||
U.S. | 955 | 1,026 | (6.9 | ) | 2,804 | 3,230 | (13.2 | ) | ||||||||||||
International | 360 | 365 | (1.3 | ) | 1,131 | 1,196 | (5.4 | ) | ||||||||||||
Worldwide | 1,316 | 1,391 | (5.4 | ) | 3,936 | 4,426 | (11.1 | ) | ||||||||||||
XARELTO® | ||||||||||||||||||||
U.S. | 613 | 612 | 0.1 | 1,704 | 1,869 | (8.9 | ) | |||||||||||||
International | — | — | — | — | — | — | ||||||||||||||
Worldwide | 613 | 612 | 0.1 | 1,704 | 1,869 | (8.9 | ) | |||||||||||||
INVOKANA® / INVOKAMET® | ||||||||||||||||||||
U.S. | 125 | 150 | (16.6 | ) | 411 | 523 | (21.3 | ) | ||||||||||||
International | 55 | 40 | 33.9 | 147 | 130 | 12.3 | ||||||||||||||
Worldwide | 179 | 190 | (5.8 | ) | 558 | 653 | (14.6 | ) | ||||||||||||
PROCRIT® / EPREX® | ||||||||||||||||||||
U.S. | 126 | 178 | (29.6 | ) | 387 | 523 | (26.1 | ) | ||||||||||||
International | 72 | 77 | (5.7 | ) | 220 | 244 | (9.8 | ) | ||||||||||||
Worldwide | 198 | 255 | (22.4 | ) | 607 | 767 | (20.9 | ) | ||||||||||||
OTHER | ||||||||||||||||||||
U.S. | 91 | 86 | 8.1 | 302 | 315 | (3.8 | ) | |||||||||||||
International | 234 | 248 | (5.7 | ) | 765 | 822 | (6.9 | ) | ||||||||||||
Worldwide | 325 | 334 | (2.2 | ) | 1,067 | 1,137 | (6.1 | ) | ||||||||||||
TOTAL PHARMACEUTICAL | ||||||||||||||||||||
U.S. | 6,340 | 6,097 | 4.0 | 17,705 | 17,350 | 2.0 | ||||||||||||||
International | 4,537 | 4,249 | 6.8 | 13,945 | 13,194 | 5.7 | ||||||||||||||
Worldwide | 10,877 | 10,346 | 5.1 | 31,650 | 30,544 | 3.6 | ||||||||||||||
27
MEDICAL DEVICES | ||||||||||||||||||||
Diabetes Care | ||||||||||||||||||||
U.S. | — | 125 | * | — | 371 | * | ||||||||||||||
International | — | 190 | * | — | 638 | * | ||||||||||||||
Worldwide | — | 315 | * | — | 1,009 | * | ||||||||||||||
Interventional Solutions | ||||||||||||||||||||
U.S. | 357 | 320 | 11.5 | 1,066 | 947 | 12.6 | ||||||||||||||
International | 382 | 333 | 15.3 | 1,156 | 1,013 | 14.2 | ||||||||||||||
Worldwide | 741 | 653 | 13.4 | 2,223 | 1,960 | 13.4 | ||||||||||||||
Orthopaedics | ||||||||||||||||||||
U.S. | 1,301 | 1,284 | 1.2 | 3,950 | 3,923 | 0.7 | ||||||||||||||
International | 837 | 827 | 1.2 | 2,616 | 2,700 | (3.1 | ) | |||||||||||||
Worldwide | 2,138 | 2,111 | 1.2 | 6,566 | 6,623 | (0.9 | ) | |||||||||||||
HIPS | ||||||||||||||||||||
U.S. | 204 | 201 | 1.1 | 633 | 621 | 1.8 | ||||||||||||||
International | 133 | 129 | 2.7 | 428 | 432 | (0.8 | ) | |||||||||||||
Worldwide | 336 | 330 | 1.7 | 1,061 | 1,053 | 0.7 | ||||||||||||||
KNEES | ||||||||||||||||||||
U.S. | 209 | 215 | (2.7 | ) | 650 | 672 | (3.3 | ) | ||||||||||||
International | 136 | 126 | 7.9 | 435 | 438 | (0.6 | ) | |||||||||||||
Worldwide | 344 | 341 | 1.2 | 1,085 | 1,110 | (2.2 | ) | |||||||||||||
TRAUMA | ||||||||||||||||||||
U.S. | 415 | 395 | 5.1 | 1,239 | 1,196 | 3.6 | ||||||||||||||
International | 262 | 259 | 1.0 | 795 | 829 | (4.1 | ) | |||||||||||||
Worldwide | 677 | 654 | 3.5 | 2,034 | 2,025 | 0.4 | ||||||||||||||
SPINE & OTHER | ||||||||||||||||||||
U.S. | 472 | 473 | (0.2 | ) | 1,427 | 1,434 | (0.5 | ) | ||||||||||||
International | 306 | 313 | (2.0 | ) | 957 | 1,001 | (4.4 | ) | ||||||||||||
Worldwide | 778 | 786 | (0.9 | ) | 2,384 | 2,435 | (2.1 | ) | ||||||||||||
Surgery | ||||||||||||||||||||
U.S. | 940 | 1,016 | (7.4 | ) | 2,867 | 3,031 | (5.4 | ) | ||||||||||||
International | 1,371 | 1,360 | 0.8 | 4,192 | 4,283 | (2.1 | ) | |||||||||||||
Worldwide | 2,311 | 2,376 | (2.7 | ) | 7,059 | 7,314 | (3.5 | ) | ||||||||||||
ADVANCED | ||||||||||||||||||||
U.S. | 409 | 421 | (2.8 | ) | 1,209 | 1,216 | (0.6 | ) | ||||||||||||
International | 602 | 555 | 8.3 | 1,811 | 1,731 | 4.6 | ||||||||||||||
Worldwide | 1,010 | 976 | 3.6 | 3,019 | 2,947 | 2.4 | ||||||||||||||
GENERAL | ||||||||||||||||||||
U.S. | 443 | 423 | 4.7 | 1,311 | 1,282 | 2.3 | ||||||||||||||
International | 659 | 657 | 0.2 | 1,998 | 2,094 | (4.6 | ) | |||||||||||||
Worldwide | 1,101 | 1,080 | 1.9 | 3,309 | 3,376 | (2.0 | ) | |||||||||||||
SPECIALTY | ||||||||||||||||||||
U.S. | 88 | 172 | (48.0 | ) | 347 | 533 | (34.9 | ) | ||||||||||||
International | 110 | 148 | (25.0 | ) | 383 | 458 | (16.2 | ) | ||||||||||||
Worldwide | 200 | 320 | (37.4 | ) | 731 | 991 | (26.2 | ) | ||||||||||||
28
Vision | ||||||||||||||||||||
U.S. | 459 | 452 | 1.4 | 1,366 | 1,351 | 1.1 | ||||||||||||||
International | 734 | 680 | 8.0 | 2,117 | 2,069 | 2.3 | ||||||||||||||
Worldwide | 1,193 | 1,132 | 5.4 | 3,483 | 3,420 | 1.8 | ||||||||||||||
CONTACT LENSES / OTHER | ||||||||||||||||||||
U.S. | 339 | 319 | 6.2 | 993 | 948 | 4.7 | ||||||||||||||
International | 555 | 516 | 7.4 | 1,566 | 1,538 | 1.8 | ||||||||||||||
Worldwide | 893 | 835 | 7.0 | 2,559 | 2,486 | 2.9 | ||||||||||||||
SURGICAL | ||||||||||||||||||||
U.S. | 120 | 133 | (10.0 | ) | 373 | 403 | (7.4 | ) | ||||||||||||
International | 180 | 164 | 9.9 | 551 | 531 | 3.7 | ||||||||||||||
Worldwide | 299 | 297 | 0.9 | 923 | 934 | (1.1 | ) | |||||||||||||
TOTAL MEDICAL DEVICES | ||||||||||||||||||||
U.S. | 3,057 | 3,197 | (4.4 | ) | 9,249 | 9,623 | (3.9 | ) | ||||||||||||
International | 3,326 | 3,390 | (1.9 | ) | 10,082 | 10,703 | (5.8 | ) | ||||||||||||
Worldwide | 6,383 | 6,587 | (3.1 | ) | 19,331 | 20,326 | (4.9 | ) | ||||||||||||
WORLDWIDE | ||||||||||||||||||||
U.S. | 10,791 | 10,664 | 1.2 | 31,323 | 31,255 | 0.2 | ||||||||||||||
International | 9,938 | 9,684 | 2.6 | 29,989 | 29,932 | 0.2 | ||||||||||||||
Worldwide | $ | 20,729 | 20,348 | 1.9 | % | $ | 61,312 | 61,187 | 0.2 | % | ||||||||||
*Percentage greater than 100% or not meaningful
EARNINGS BEFORE PROVISION FOR TAXES BY SEGMENT
Fiscal Third Quarter Ended | Fiscal Nine Months Ended | |||||||||||||||||||
(Dollars in Millions) | September 29, 2019 | September 30, 2018 | Percent Change | September 29, 2019 | September 30, 2018 | Percent Change | ||||||||||||||
Consumer (1) | $ | 653 | 510 | 28.0 | % | $ | 1,800 | 1,887 | (4.6 | )% | ||||||||||
Pharmaceutical(2) | (222 | ) | 2,876 | * | 5,786 | 10,193 | (43.2 | ) | ||||||||||||
Medical Devices(3) | 1,392 | 1,267 | 9.9 | 6,078 | 3,642 | 66.9 | ||||||||||||||
Segment earnings before provision for taxes | 1,823 | 4,653 | (60.8 | ) | 13,664 | 15,722 | (13.1 | ) | ||||||||||||
Less: Expense not allocated to segments (4) | 176 | 230 | 554 | 845 | ||||||||||||||||
Worldwide income before tax | $ | 1,647 | 4,423 | (62.8 | )% | $ | 13,110 | 14,877 | (11.9 | )% | ||||||||||
*Percentage greater than 100% or not meaningful
(1) Includes a gain of $0.3 billion related to the Company's previously held equity investment in Ci:z Holdings Co., Ltd. (Dr. Ci: Labo) in the fiscal nine months of 2019. Includes litigation expense of $0.2 billion and restructuring charge of $0.1 billion in the fiscal nine months of 2019. Includes a gain of $0.3 billion from the divestiture of NIZORAL® in the fiscal nine months of 2018. Includes amortization expense of $0.1 billion in both the fiscal third quarter of 2019 and 2018 and $0.3 billion and $0.2 billion in the fiscal nine months of 2019 and 2018, respectively.
(2) Includes litigation expense of $4.0 billion and $4.3 billion primarily related to the agreement in principle to settle opioid litigation in the fiscal third quarter and fiscal nine months of 2019, respectively. Includes an unrealized loss on securities of $0.1 billion in the fiscal third quarter of 2019. Includes an unrealized gain on securities of $0.2 billion, an in-process research and development expense of $0.9 billion related to the Alios asset, a research and development expense of $0.3 billion for an upfront payment related to argenx, Actelion acquisition related costs of $0.1 billion and restructuring charge of $0.1 billion in the fiscal nine months of 2019. Includes an in-process research and development charge of $1.1 billion related to the Alios and XO1 assets and the corresponding XO1 contingent liability reversal of $0.2 billion in the fiscal third quarter and fiscal nine months of 2018. Includes Actelion acquisition related costs of $0.2 billion in the fiscal nine months of 2018 and a gain of $0.1 billion from the divestiture of PANCREASE® in the fiscal nine months of 2018. Includes amortization expense of $0.8 billion and $0.7 billion in the fiscal third quarters and $2.4 billion and $2.3 billion in the fiscal nine months of 2019 and 2018, respectively.
29
(3) Includes a gain of $2.0 billion from the divestiture of the ASP business in the fiscal nine months of 2019. Includes a restructuring related charge of $0.1 billion and $0.2 billion in the fiscal third quarters of 2019 and 2018, respectively and $0.2 billion and $0.4 billion in the fiscal nine months of 2019 and 2018, respectively. Includes litigation expense of $0.3 billion and $0.7 billion in the fiscal nine months of 2019 and 2018, respectively. Includes amortization expense of $0.2 billion and $0.3 billion in the fiscal third quarters of 2019 and 2018, respectively and $0.7 billion and $0.8 billion in the fiscal nine months of 2019 and 2018, respectively.
(4) Amounts not allocated to segments include interest income/expense and general corporate income/expense.
SALES BY GEOGRAPHIC AREA
Fiscal Third Quarter Ended | Fiscal Nine Months Ended | |||||||||||||||||||
(Dollars in Millions) | September 29, 2019 | September 30, 2018 | Percent Change | September 29, 2019 | September 30, 2018 | Percent Change | ||||||||||||||
United States | $ | 10,791 | 10,664 | 1.2 | % | $ | 31,323 | 31,255 | 0.2 | % | ||||||||||
Europe | 4,461 | 4,416 | 1.0 | 13,803 | 14,023 | (1.6 | ) | |||||||||||||
Western Hemisphere, excluding U.S. | 1,488 | 1,550 | (4.0 | ) | 4,446 | 4,657 | (4.5 | ) | ||||||||||||
Asia-Pacific, Africa | 3,989 | 3,718 | 7.3 | 11,740 | 11,252 | 4.3 | ||||||||||||||
Total | $ | 20,729 | 20,348 | 1.9 | % | $ | 61,312 | 61,187 | 0.2 | % | ||||||||||
NOTE 10— BUSINESS COMBINATIONS AND DIVESTITURES
On September 27, 2019, the Company acquired the assets of JointPoint, Inc., a privately held company, with navigation software to enable a more digitally-oriented procedure in hips.
On April 1, 2019, the Company completed the acquisition of Auris Health, Inc. for approximately $3.4 billion, net of cash acquired. Additional contingent payments of up to $2.35 billion, in the aggregate, may be payable upon reaching certain predetermined milestones. Auris Health was a privately held developer of robotic technologies, initially focused in lung cancer, with an FDA-cleared platform currently used in bronchoscopic diagnostic and therapeutic procedures. The Company treated this transaction as a business combination and included it in the Medical Devices segment. The fair value of the acquisition was allocated primarily to amortizable and non-amortizable intangible assets, primarily IPR&D, for $3.0 billion, goodwill for $2.0 billion, marketable securities of $0.2 billion and liabilities assumed of $1.8 billion, which includes the fair value of the contingent payments mentioned above, subject to any subsequent valuation adjustments within the measurement period. The fair value of the contingent consideration was $1.1 billion. A probability of success factor ranging from 55% to 95% was used in the fair value calculation to reflect inherent regulatory and commercial risk of the contingent payments and IPR&D. The discount rate applied was approximately 10%. The goodwill is primarily attributable to synergies expected to arise from the business acquisition and is not expected to be deductible for tax purposes.
On April 1, 2019, the Company completed the divestiture of its ASP business to Fortive Corporation for an aggregate value of approximately $2.8 billion, consisting of $2.7 billion of cash proceeds and $0.1 billion of retained net receivables. The Company recognized a pre-tax gain recorded in Other (income) expense, net, of approximately $2.0 billion.
On October 23, 2018, the Company entered into an agreement to acquire Ci:z Holdings Co., Ltd., (Dr. Ci:Labo) a Japanese company focused on the marketing, development and distribution of a broad range of dermocosmetic, cosmetic and skincare products for a total purchase price of approximately ¥230 billion, which equates to approximately $2.1 billion, using the exchange rate of 109.06 Japanese Yen to each U.S. Dollar on January 16, 2019. The acquisition was completed on January 17, 2019, through a series of transactions that included an all-cash tender offer to acquire the publicly held shares not already held by the Company for ¥5,900 per share. The Company previously held a 20% ownership in Ci:z Holdings Co., Ltd. As of June 2019, the Company became the legal owner of Ci:z Holdings with the completion of the tender offer procedure in Japan. The acquired company was then delisted from the Tokyo Stock Exchange. Additionally, in the fiscal first quarter of 2019, the Company recognized a pre-tax gain recorded in Other (income) expense, net, of approximately $0.3 billion related to the Company's previously held equity investment in Ci:z Holdings Co., Ltd.
The Company treated this transaction as a business combination and included it in the Consumer segment. The allocation of the purchase price included in the current period balance sheet is based on the best estimate of management and is preliminary and subject to change. At September 29, 2019, the fair value of the acquisition was allocated primarily to amortizable intangible assets for $1.5 billion, goodwill for $1.2 billion and liabilities assumed of $0.4 billion subject to any subsequent valuation adjustments
30
within the measurement period. The adjustments made since the date of acquisition were $0.1 billion to intangible assets, accrued liabilities, deferred taxes on income and property, plant and equipment with the offset to goodwill. The amortizable intangible assets were comprised of brand/trademarks and customer relationships with a weighted average life of 15.3 years. The goodwill is primarily attributable to synergies expected to arise from the business acquisition and is not expected to be deductible for tax purposes.
During the fiscal third quarter of 2018, the Company accepted a binding offer to form a strategic collaboration with Jabil Inc., one of the world’s leading manufacturing services providers for health care products and technology products. The Company is expanding a 12-year relationship with Jabil to produce a range of products within the Ethicon Endo-Surgery and DePuy Synthes businesses. This transaction includes the transfer of certain employees and manufacturing sites. Several manufacturing sites were transferred to Jabil in the fiscal nine months of 2019 and the majority of transfers will be completed by year end 2019 with a minor amount remaining in 2020. As of September 29, 2019, the assets held for sale on the Consolidated Balance Sheet were $0.2 billion of inventory. For additional details on the global supply chain restructuring see Note 12 to the Consolidated Financial Statements.
During the fiscal third quarter of 2018, the Company completed the acquisitions of Zarbee’s, Inc., a privately held company that is a leader in naturally-based consumer healthcare products and Medical Enterprises Distribution, a healthcare technology firm focused on surgical procedure innovation.
During the fiscal second quarter of 2018, the Company completed the acquisition BeneVir Biopharm, Inc. (BeneVir), a privately-held, biopharmaceutical company specializing in the development of oncolytic immunotherapies.
Additionally, during the fiscal second quarter of 2018, the Company completed the divestitures of NIZORAL®, PANCREASE® and VALCHLOR® products.
NOTE 11 — LEGAL PROCEEDINGS
Johnson & Johnson and certain of its subsidiaries are involved in various lawsuits and claims regarding product liability; intellectual property; commercial; supplier indemnification and other matters; governmental investigations; and other legal proceedings that arise from time to time in the ordinary course of their business.
The Company records accruals for loss contingencies associated with these legal matters when it is probable that a liability will be incurred, and the amount of the loss can be reasonably estimated. As of September 29, 2019, the Company has determined that the liabilities associated with certain litigation matters are probable and can be reasonably estimated. The Company has accrued for these matters and will continue to monitor each related legal issue and adjust accruals as might be warranted based on new information and further developments in accordance with ASC 450-20-25. For these and other litigation and regulatory matters discussed below for which a loss is probable or reasonably possible, the Company is unable to estimate the possible loss or range of loss beyond the amounts already accrued. Amounts accrued for legal contingencies often result from a complex series of judgments about future events and uncertainties that rely heavily on estimates and assumptions including timing of related payments. The ability to make such estimates and judgments can be affected by various factors, including whether damages sought in the proceedings are unsubstantiated or indeterminate; scientific and legal discovery has not commenced or is not complete; proceedings are in early stages; matters present legal uncertainties; there are significant facts in dispute; or there are numerous parties involved.
In the Company's opinion, based on its examination of these matters, its experience to date and discussions with counsel, the ultimate outcome of legal proceedings, net of liabilities accrued in the Company's balance sheet, is not expected to have a material adverse effect on the Company's financial position. However, the resolution of, or increase in accruals for, one or more of these matters in any reporting period may have a material adverse effect on the Company's results of operations and cash flows for that period.
PRODUCT LIABILITY
Johnson & Johnson and certain of its subsidiaries are involved in numerous product liability claims and lawsuits involving multiple products. Claimants in these cases seek substantial compensatory and, where available, punitive damages. While the Company believes it has substantial defenses, it is not feasible to predict the ultimate outcome of litigation. From time to time, even if it has substantial defenses, the Company considers isolated settlements based on a variety of circumstances. The Company has established accruals for product liability claims and lawsuits in compliance with ASC 450-20 based on currently available information, which in some cases may be limited. The Company accrues an estimate of the legal defense costs needed
31
to defend each matter when those costs are probable and can be reasonably estimated. For certain of these matters, the Company has accrued additional amounts such as estimated costs associated with settlements, damages and other losses. To the extent adverse verdicts have been rendered against the Company, the Company does not record an accrual until a loss is determined to be probable and can be reasonably estimated. Product liability accruals can represent projected product liability for thousands of claims around the world, each in different litigation environments and with different fact patterns. Changes to the accruals may be required in the future as additional information becomes available.
The most significant of these cases include: the DePuy ASR™ XL Acetabular System and DePuy ASR™ Hip Resurfacing System; the PINNACLE® Acetabular Cup System; pelvic meshes; RISPERDAL®; XARELTO®; body powders containing talc, primarily JOHNSONS® Baby Powder; INVOKANA®; and ETHICON PHYSIOMESH® Flexible Composite Mesh. As of September 29, 2019, in the United States there were approximately 1,400 plaintiffs with direct claims in pending lawsuits regarding injuries allegedly due to the DePuy ASR™ XL Acetabular System and DePuy ASR™ Hip Resurfacing System; 10,500 with respect to the PINNACLE® Acetabular Cup System; 19,800 with respect to pelvic meshes; 13,600 with respect to RISPERDAL®; 30,700 with respect to XARELTO®; 16,800 with respect to body powders containing talc; 700 with respect to INVOKANA®; and 3,100 with respect to ETHICON PHYSIOMESH® Flexible Composite Mesh.
In August 2010, DePuy Orthopaedics, Inc. (DePuy) announced a worldwide voluntary recall of its ASR™ XL Acetabular System and DePuy ASR™ Hip Resurfacing System used in hip replacement surgery. Claims for personal injury have been made against DePuy and Johnson & Johnson. The number of pending lawsuits is expected to fluctuate as certain lawsuits are settled or dismissed and additional lawsuits are filed. Cases filed in federal courts in the United States have been organized as a multi-district litigation in the United States District Court for the Northern District of Ohio. Litigation has also been filed in countries outside of the United States, primarily in the United Kingdom, Canada, Australia, Ireland, Germany, India and Italy. In November 2013, DePuy reached an agreement with a Court-appointed committee of lawyers representing ASR Hip System plaintiffs to establish a program to settle claims with eligible ASR Hip patients in the United States who had surgery to replace their ASR Hips, known as revision surgery, as of August 31, 2013. DePuy reached additional agreements in February 2015 and March 2017, which further extended the settlement program to include ASR Hip patients who had revision surgeries after August 31, 2013 and prior to February 15, 2017. This settlement program has resolved more than 10,000 claims, therefore bringing to resolution significant ASR Hip litigation activity in the United States. However, lawsuits in the United States remain, and the settlement program does not address litigation outside of the United States. In Australia, a class action settlement was reached that resolved the claims of the majority of ASR Hip patients in that country. In Canada, the Company has reached agreements to settle two pending class actions which have been approved by the Québec Superior Court and the Supreme Court of British Columbia. The British Columbia order is currently the subject of an appeal. The Company continues to receive information with respect to potential additional costs associated with this recall on a worldwide basis. The Company has established accruals for the costs associated with the United States settlement program and DePuy ASR™ Hip-related product liability litigation.
Claims for personal injury have also been made against DePuy Orthopaedics, Inc. and Johnson & Johnson (collectively, DePuy) relating to the PINNACLE® Acetabular Cup System used in hip replacement surgery. Product liability lawsuits continue to be filed, and the Company continues to receive information with respect to potential costs and the anticipated number of cases. Cases filed in federal courts in the United States have been organized as a multi-district litigation in the United States District Court for the Northern District of Texas. Litigation has also been filed in some state courts and in countries outside of the United States. Several adverse verdicts have been rendered against DePuy, one of which was reversed on appeal and remanded for retrial. During the first quarter of 2019, DePuy established a United States settlement program to resolve these cases. As part of the settlement program, adverse verdicts have been settled. The Company has established an accrual for product liability litigation associated with the PINNACLE® Acetabular Cup System and the related settlement program.
Claims for personal injury have been made against Ethicon, Inc. (Ethicon) and Johnson & Johnson arising out of Ethicon's pelvic mesh devices used to treat stress urinary incontinence and pelvic organ prolapse. The Company continues to receive information with respect to potential costs and additional cases. Cases filed in federal courts in the United States had been organized as a multi-district litigation (MDL) in the United States District Court for the Southern District of West Virginia. The MDL Court is remanding cases for trial to the jurisdictions where the case was originally filed and additional pelvic mesh lawsuits have been filed, and remain, outside of the MDL. The Company has settled or otherwise resolved a majority of the United States cases and the estimated costs associated with these settlements and the remaining cases are reflected in the Company's accruals. In addition, class actions and individual personal injury cases or claims have been commenced in various countries outside of the United States, including claims and cases in the United Kingdom, the Netherlands and Belgium, and class actions in Israel, Australia and Canada, seeking damages for alleged injury resulting from Ethicon's pelvic mesh devices.
32
In Australia, a trial of class action issues has been completed and the parties are awaiting a decision. The Company has established accruals with respect to product liability litigation associated with Ethicon's pelvic mesh products.
Following a June 2016 worldwide market withdrawal of ETHICON PHYSIOMESH® Flexible Composite Mesh, claims for personal injury have been made against Ethicon, Inc. and Johnson & Johnson alleging personal injury arising out of the use of this hernia mesh device. Cases filed in federal courts in the United States have been organized as a multi-district litigation (MDL) in the United States District Court for the Northern District of Georgia. A multi-county litigation (MCL) has also been formed in New Jersey state court and assigned to Atlantic County for cases pending in New Jersey. In addition to the matters in the MDL and MCL, there are additional lawsuits pending in the United States District Court for the Southern District of Ohio, which are part of the MDL for polypropylene mesh devices manufactured by C.R. Bard, Inc., and lawsuits pending outside the United States.
Along with ETHICON PHYSIOMESH® lawsuits, there were a number of filings related to the PROCEED® Mesh and PROCEED® Ventral Patch products. In March 2019, the New Jersey Supreme Court entered an order consolidating all PROCEED® and PROCEED® Ventral Patch cases as an MCL in Atlantic County Superior Court. Additional cases have been filed in various federal and state courts in the US, and in jurisdictions outside the US. The Company continues to receive information with respect to potential costs and the anticipated number of cases. The Company has established accruals with respect to product liability litigation associated with ETHICON PHYSIOMESH® Flexible Composite Mesh, PROCEED® Mesh and PROCEED® Ventral Patch products.
Claims for personal injury have been made against Janssen Pharmaceuticals, Inc. and Johnson & Johnson arising out of the use of RISPERDAL®, indicated for the treatment of schizophrenia, acute manic or mixed episodes associated with bipolar I disorder and irritability associated with autism, and related compounds. Lawsuits have been primarily filed in state courts in Pennsylvania, California, and Missouri. Other actions are pending in various courts in the United States and Canada. Product liability lawsuits continue to be filed, and the Company continues to receive information with respect to potential costs and the anticipated number of cases. The Company has successfully defended a number of these cases but there have been verdicts against the Company including a recent verdict in October 2019 of $8 billion of punitive damages related to one single plaintiff. The Company believes it has strong grounds to overturn this verdict. The Company has settled or otherwise resolved many of the United States cases and the costs associated with these settlements are reflected in the Company's accruals.
Claims for personal injury arising out of the use of XARELTO®, an oral anticoagulant, have been made against Janssen Pharmaceuticals, Inc. (JPI); Johnson & Johnson; and JPI's collaboration partner for XARELTO® Bayer AG and certain of its affiliates. Cases filed in federal courts in the United States have been organized as a multi-district litigation in the United States District Court for the Eastern District of Louisiana. In addition, cases have been filed in state courts across the United States. Many of these cases have been consolidated into a state mass tort litigation in Philadelphia, Pennsylvania and in a coordinated proceeding in California. Class action lawsuits also have been filed in Canada. In March 2019, the Company announced an agreement in principle to the settle the XARELTO® cases in the United States; such agreement was finalized and executed in May 2019 establishing an ongoing United States settlement program. The Company has established accruals for the costs associated with the United States settlement program and XARELTO® related product liability litigation.
Personal injury claims alleging that talc causes cancer have been made against Johnson & Johnson Consumer Inc. and Johnson & Johnson arising out of the use of body powders containing talc, primarily JOHNSON’S® Baby Powder. The number of pending product liability lawsuits continues to increase, and the Company continues to receive information with respect to potential costs and the anticipated number of cases. Lawsuits have been primarily filed in state courts in Missouri, New Jersey and California, as well as outside the United States. Cases filed in federal courts in the United States have been organized as a multi-district litigation in the United States District Court for the District of New Jersey. In the multi-district litigation, the parties have moved to exclude experts, known as Daubert motions. The Court held Daubert hearings in mid-July 2019 and a final round of briefing has been submitted to the Court. The parties are awaiting a decision. The Company has successfully defended a number of these cases but there have been verdicts against the Company, including a verdict in July 2018 of $4.7 billion. The Company believes that it has strong grounds on appeal to overturn these verdicts. The Company has established an accrual for defense costs only in connection with product liability litigation associated with body powders containing talc.
In February 2019, the Company’s talc supplier, Imerys Talc America, Inc. and two of its affiliates, Imerys Talc Vermont, Inc. and Imerys Talc Canada, Inc. (collectively, Imerys) filed a voluntary chapter 11 petition commencing a reorganization under the United States Bankruptcy Code in the United States Bankruptcy Court for the District of Delaware (Imerys Bankruptcy). The Imerys Bankruptcy relates to potential liability on account of Imerys’s sales of talc, including to the Company for the Company’s body powders. In its bankruptcy filing, Imerys noted certain claims it alleged it had against the Company for indemnification and rights to joint insurance proceeds. Based on such claims as well as indemnity and insurance claims the Company has against Imerys, the Company petitioned the United States District Court for the District of Delaware to establish
33
federal jurisdiction of the state court talc lawsuits under the “related to” jurisdictional provisions of the Bankruptcy Code. The Company's petition was denied and the state court talc lawsuits that have been removed to federal court on such basis have been remanded.
In February 2018, a securities class action lawsuit was filed against Johnson & Johnson and certain named officers in the United States District Court for the District of New Jersey, alleging that Johnson & Johnson violated the federal securities laws by failing to adequately disclose the alleged asbestos contamination in body powders containing talc, primarily JOHNSON'S® Baby Powder, and that purchasers of Johnson & Johnson’s shares suffered losses as a result. Plaintiffs are seeking damages. The Company has filed a motion to dismiss and awaits the Court’s schedule for oral argument. In October 2018, a shareholder derivative lawsuit was filed against Johnson & Johnson as the nominal defendant and its current directors as defendants in the United States District Court for the District of New Jersey, alleging a breach of fiduciary duties related to the alleged asbestos contamination in body powders containing talc, primarily JOHNSON’S® Baby Powder, and that Johnson & Johnson has suffered damages as a result of those alleged breaches. In September 2019, the Court granted defendants’ motion to dismiss the shareholder derivative lawsuit, and dismissed the complaint without prejudice. In January 2019, two ERISA class action lawsuits were filed by participants in the Johnson & Johnson Savings Plan against Johnson & Johnson, its Pension and Benefits Committee, and certain named officers in the United States District Court for the District of New Jersey, alleging that the defendants breached their fiduciary duties by offering Johnson & Johnson stock as a Johnson & Johnson Savings Plan investment option when it was imprudent to do so because of failures to disclose alleged asbestos contamination in body powders containing talc, primarily JOHNSON’S® Baby Powder. Plaintiffs are seeking damages and injunctive relief. Defendants have filed a motion to dismiss.
A lawsuit is pending in the United States District Court for the Central District of California alleging violations of Proposition 65, California’s Unfair Competition Law and False Advertising Law. In June 2019, plaintiffs filed a motion for voluntary dismissal of this Proposition 65 action and the Company opposed such motion to the extent it would allow plaintiffs’ counsel to refile such claims with new plaintiffs. The Court granted plaintiff’s motion conditioned upon payment of attorneys’ fees and costs. Another lawsuit alleging violations of Proposition 65, California’s Consumer Legal Remedies Act, was filed in the Superior Court of California for the County of San Diego. In July 2019, Johnson & Johnson filed a notice of removal to the United States District Court for the Southern District of California. In August 2019, plaintiffs filed an amended complaint in the Southern District and the parties stipulated to having any responsive pleading filed in October 2019.
In addition, the Company has received preliminary inquiries and subpoenas to produce documents regarding these matters from Senator Murray, a member of the Senate Committee on Health, Education, Labor and Pensions, the Department of Justice, the Securities and Exchange Commission and the U.S. Congressional Subcommittee on Economic and Consumer Policy. The Company is cooperating with these government inquiries and continues to produce documents in response.
Claims for personal injury have been made against a number of Johnson & Johnson companies, including Janssen Pharmaceuticals, Inc. and Johnson & Johnson, arising out of the use of INVOKANA®, a prescription medication indicated to improve glycemic control in adults with Type 2 diabetes. Lawsuits filed in federal courts in the United States have been organized as a multi-district litigation in the United States District Court for the District of New Jersey. Cases have also been filed in various state courts including Pennsylvania, Louisiana and Utah. Class action lawsuits have been filed in Canada. Product liability lawsuits continue to be filed, and the Company continues to receive information with respect to potential costs and the anticipated number of cases. The Company has settled or otherwise resolved many of the cases and claims in the United States and the costs associated with these settlements are reflected in the Company's accruals.
INTELLECTUAL PROPERTY
Certain subsidiaries of Johnson & Johnson are subject, from time to time, to legal proceedings and claims related to patent, trademark and other intellectual property matters arising out of their businesses. Many of these matters involve challenges to the coverage and/or validity of the patents on various products and allegations that certain of the Company’s products infringe the patents of third parties. Although these subsidiaries believe that they have substantial defenses to these challenges and allegations with respect to all significant patents, there can be no assurance as to the outcome of these matters. A loss in any of these cases could adversely affect the ability of these subsidiaries to sell their products, result in loss of sales due to loss of market exclusivity, require the payment of past damages and future royalties, and may result in a non-cash impairment charge for any associated intangible asset. The most significant of these matters are described below.
Medical Devices
In June 2009, Rembrandt Vision Technologies, L.P. (Rembrandt) filed a patent infringement lawsuit against Johnson & Johnson Vision Care, Inc. (JJVCI) in the United States District Court for the Eastern District of Texas alleging that JJVCI's manufacture
34
and sale of its ACUVUE® ADVANCE and ACUVUE OASYS® Hydrogel Contact Lenses infringed Rembrandt’s United States Patent No. 5,712,327 and seeking monetary relief. The case was transferred to the United States District Court for the Middle District of Florida, where a trial in May 2012 resulted in a verdict of non-infringement that was subsequently upheld on appeal. In July 2014, Rembrandt sought a new trial based on alleged new evidence, which the district court denied. In April 2016, the Court of Appeals overturned that ruling and remanded the case to the district court for a new trial. A new trial was held in August 2017, and the jury returned a verdict of non-infringement in favor of JJVCI. Rembrandt has appealed the verdict to the United States Court of Appeals for the Federal Circuit (CAFC). In February 2019, the CAFC affirmed the judgment in favor of JJVCI.
In March 2013, Medinol Ltd. (Medinol) filed a patent infringement lawsuit against Cordis Corporation (Cordis) and Johnson & Johnson in the United States District Court for the Southern District of New York alleging that Cordis’s sales of the CYPHER™ and CYPHER SELECT™ stents made in the United States since 2005 willfully infringed four of Medinol's patents directed to the geometry of articulated stents. Although Johnson & Johnson has since sold Cordis, it has retained liability for this case. After the trial in January 2014, the district court dismissed the case, finding Medinol unreasonably delayed bringing its claims (the laches defense). In September 2014, the district court denied a motion by Medinol to vacate the judgment and grant it a new trial. Medinol appealed the decision to the United States Court of Appeals for the Federal Circuit. In March 2017, the United States Supreme Court held that the laches defense is not available in patent cases. In April 2018, the United States Court of Appeals for the Federal Circuit remanded the case back to the district court to reconsider Medinol’s motion for a new trial. In March 2019, the district court denied Medinol’s motion for a new trial. In April 2019, Medinol filed a notice of appeal.
In November 2016, MedIdea, L.L.C. (MedIdea) filed a patent infringement lawsuit against DePuy Orthopaedics, Inc. in the United States District Court for the Northern District of Illinois alleging infringement by the ATTUNE® Knee System. In April 2017, MedIdea filed an amended complaint adding DePuy Synthes Products, Inc. and DePuy Synthes Sales, Inc. as named defendants (collectively, DePuy). MedIdea alleges infringement of United States Patent Nos. 6,558,426 (’426); 8,273,132 (’132); 8,721,730 (’730) and 9,492,280 (’280) relating to posterior stabilized knee systems. Specifically, MedIdea alleges that the SOFCAMTM Contact feature of the ATTUNE® posterior stabilized knee products infringes the patents-in-suit. MedIdea is seeking monetary damages and injunctive relief. In June 2017, the case was transferred to the United States District Court for the District of Massachusetts. A claim construction hearing was held in October 2018, and a claim construction order was issued in November 2018. In December 2018, MedIdea stipulated to non-infringement of the ’132, ’730 and ’280 patents, based on the district court’s claim construction and reserving its right to appeal that construction, leaving only the ’426 patent at issue before the district court. In January 2019, the district court stayed the case pending a decision in the Inter Partes Review proceeding on the ’426 patent (see below). In December 2017, DePuy Synthes Products, Inc. filed a petition for Inter Partes Review with the United States Patent and Trademark Office (USPTO), seeking to invalidate the two claims of the ’426 patent asserted in the district court litigation, and in June 2018, the USPTO instituted review of those claims. A hearing was held in March 2019, and in April 2019, the USPTO issued its decision upholding the validity of the patent. In May 2019, DePuy filed a motion for summary judgment of non-infringement of the claims of the ’426 patent.
In December 2016, Ethicon Endo-Surgery, Inc. and Ethicon Endo-Surgery, LLC (now known as Ethicon LLC) sued Covidien, Inc. in the United States District Court for the District of Massachusetts seeking a declaration that United States Patent Nos. 6,585,735 (the ’735 patent); 7,118,587; 7,473,253; 8,070,748 and 8,241,284 (the ’284 patent), are either invalid or not infringed by Ethicon’s ENSEAL® X1 Large Jaw Tissue Sealer product. In April 2017, Covidien LP, Covidien Sales LLC, and Covidien AG (collectively, Covidien) answered and counterclaimed, denying the allegations, asserting willful infringement of the ’735 patent, the ’284 patent and United States Patent Nos. 8,323,310 (the ’310 patent); 9,084,608; 9,241,759 (the ’759 patent) and 9,113,882, and seeking damages and an injunction. Covidien filed a motion for preliminary injunction, which was denied in October 2017. The parties have entered joint stipulations such that only the ’310 patent and the ’759 patent remain in dispute. Trial began in September 2019 and is expected to conclude in the first quarter of 2020.
In December 2016, Dr. Ford Albritton sued Acclarent, Inc. (Acclarent) in United States District Court for the Northern District of Texas alleging that Acclarent’s RELIEVA® Spin and RELIEVEA SpinPlus® products infringe U.S. Patent No. 9,011,412 (the ’412 patent). Dr. Albritton also alleges breach of contract, fraud and that he is the true owner of Acclarent’s U.S. Patent No. 8,414,473. In December 2016, Acclarent filed a petition for Inter Partes Review (IPR) with the United States Patent and Trademark Office (USPTO) challenging the validity of the ’412 patent. The USPTO instituted the IPR in July 2017. In July 2018, the USPTO ruled in favor of Albritton in the IPR, finding that Acclarent had not met its burden of proof that the challenged claims were invalid. In October 2019, the Court of Appeals affirmed the USPTO’s Patent Trial and Appeal Board. In June 2019, the parties filed cross motions for summary judgment in the district court and the parties are awaiting a decision. The district court trial is scheduled for April 2020.
35
In November 2017, Board of Regents, The University of Texas System and Tissuegen, Inc. (collectively, UT) filed a lawsuit in the United States District Court for the Western District of Texas against Ethicon, Inc. and Ethicon US, LLC alleging the manufacture and sale of VICRYL® Plus Antibacterial Sutures, MONOCRYL® Plus Antibacterial Sutures, PDS® Plus Antibacterial Sutures, STRATAFIX® POS® Antibacterial Sutures and STRATAFIX® MONOCRYL® Plus Antibacterial Sutures infringe plaintiffs’ United States Patent Nos. 6,596,296 and 7,033,603 (the ’603 patent) directed to implantable polymer drug releasing biodegradable fibers containing a therapeutic agent. UT is seeking damages and an injunction. In December 2018, Ethicon filed petitions with the USPTO, seeking Inter Partes Review (IPR) of both asserted patents. Those petitions have been stayed by the USPTO pending a decision by the U.S. Supreme Court in an unrelated case. UT dismissed the ’603 patent from the suit. Trial is scheduled for June 2020.
In August 2018, Intuitive Surgical, Inc. and Intuitive Surgical Operations, Inc. (“Intuitive”) filed a patent infringement suit against Auris Health, Inc. (“Auris”) in United States District Court for the District of Delaware. In the suit, Intuitive alleges willful infringement of U.S. Patent Nos. 6,246,200 (’200 patent); 6,491,701 (’701 patent); 6,522,906 (’906 patent); 6,800,056 (’056 patent); 8,142,447 (’447 patent); 8,620,473 (’473 patent); 8,801,601 (’601 patent); and 9,452,276 (’276 patent) based on Auris’ Monarch™ Platform. Auris filed Petitions for Inter Partes Review with the USPTO regarding the ’200, ’056, ’601 ’701, ’447, ’276 and ’906 patents. The trial is scheduled to begin in January 2021.
In August 2019, RSB Spine LLC (“RSB Spine”) filed a patent infringement suit against DePuy Synthes, Inc. in United States District Court for the District of Delaware. In October 2019, RSB Spine amended the complaint to change the named defendants to DePuy Synthes Sales, Inc. and DePuy Synthes Products, Inc. In the suit, RSB Spine alleges willful infringement of United States Patent Nos. 6,984,234 and 9,713, 537 by one or more of the following products: Zero-P-VA™ Spacer, Zero-P® Spacer, Zero- P Natural Plate, Synfix® LR Spacer and Synfix® Evolution System. RSB Spine seeks monetary damages and injunctive relief.
Pharmaceutical
In August 2016, Sandoz Ltd and Hexal AG (collectively, Sandoz) filed a lawsuit in the English High Court against G.D. Searle LLC, a Pfizer company (Searle) and Janssen Sciences Ireland UC (JSI) alleging that Searle’s supplementary protection certificate SPC/GB07/038 (SPC), which is exclusively licensed to JSI, is invalid and should be revoked. Janssen-Cilag Limited sells PREZISTA® (darunavir) in the United Kingdom pursuant to this license. In October 2016, Searle and JSI counterclaimed against Sandoz for threatened infringement of the SPC based on statements of its plans to launch generic darunavir in the United Kingdom. Sandoz admitted that its generic darunavir product would infringe the SPC if it is found valid. Searle and JSI are seeking an order enjoining Sandoz from marketing its generic darunavir before the expiration of the SPC. Following a trial in April 2017, the court entered a decision holding that the SPC is valid and granting a final injunction. Sandoz has appealed the court’s decision and the injunction is stayed pending the appeal. In January 2018, the court referred the issue on appeal to the Court of Justice for the European Union (CJEU) and stayed the proceedings pending the CJEU’s ruling on the issue.
In April 2018, Acerta Pharma B.V., AstraZeneca UK Ltd and AstraZeneca Pharmaceuticals LP filed a patent infringement lawsuit in the United States District Court for the District of Delaware against Pharmacyclics LLC and Abbvie Inc. (collectively, Abbvie), alleging that the manufacture and sale of IMBRUVICA® infringes U.S. Patent No. 7,459,554. Janssen Biotech, Inc., which commercializes IMBRUVICA® jointly with Abbvie, intervened in the action in November 2018. A trial is scheduled to begin in January 2021.
REMICADE® Related Cases
In August 2014, Celltrion Healthcare Co. Ltd. and Celltrion Inc. (collectively, Celltrion) filed an application with the United States Food and Drug Administration (FDA) for approval to make and sell its own infliximab biosimilar. In March 2015, Janssen Biotech, Inc. (JBI) filed a lawsuit in the United States District Court for the District of Massachusetts against Celltrion and Hospira Healthcare Corporation (Hospira), which has exclusive marketing rights for Celltrion’s infliximab biosimilar in the United States, seeking, among other things, a declaratory judgment that their biosimilar product infringes or potentially infringes several JBI patents, including United States Patent No. 6,284,471 relating to REMICADE® (infliximab) (the ’471 patent) and United States Patent No. 7,598,083 (the ’083 patent) directed to the cell culture media used to make Celltrion’s biosimilar. In August 2016, the district court granted both Celltrion’s and Hospira’s motions for summary judgment of invalidity of the ’471 patent. JBI appealed those decisions to the United States Court of Appeals for the Federal Circuit. In January 2018, the Federal Circuit dismissed the appeal as moot based on its affirmance of a decision by the USPTO’s Patent Trial and Appeal Board affirming invalidity of the ’471 patent.
36
In June 2016, JBI filed two additional patent infringement lawsuits asserting the ’083 patent, one against Celltrion and Hospira in the United States District Court for the District of Massachusetts and the other against HyClone Laboratories, Inc., the manufacturer of the cell culture media that Celltrion uses to make its biosimilar product, in the United States District Court for the District of Utah. In July 2018 the district court granted Celltrion’s motion for summary judgment of non-infringement and entered an order dismissing the ’083 lawsuit against Celltrion and Hospira. JBI appealed to the United States Court of Appeals for the Federal Circuit. The litigation against HyClone in Utah is stayed pending the outcome of the Massachusetts actions.
The FDA approved the first infliximab biosimilar for sale in the United States in 2016, and a number of such products have been launched.
Litigation Against Filers of Abbreviated New Drug Applications (ANDAs)
The following summarizes lawsuits pending against generic companies that have filed Abbreviated New Drug Applications (ANDAs) with the FDA or undertaken similar regulatory processes outside of the United States, seeking to market generic forms of products sold by various subsidiaries of Johnson & Johnson prior to expiration of the applicable patents covering those products. These ANDAs typically include allegations of non-infringement and invalidity of the applicable patents. In the event the subsidiaries are not successful in an action, or the automatic statutory stay of the ANDAs expires before the United States District Court rulings are obtained, the third-party companies involved would have the ability, upon approval of the FDA, to introduce generic versions of their products to the market, resulting in the potential for substantial market share and revenue losses for the applicable products, and which may result in a non-cash impairment charge in any associated intangible asset. In addition, from time to time, subsidiaries may settle these types of actions and such settlements can involve the introduction of generic versions of the products at issue to the market prior to the expiration of the relevant patents. The Inter Partes Review (IPR) process with the United States Patent and Trademark Office (USPTO), created under the 2011 America Invents Act, is also being used at times by generic companies in conjunction with ANDAs and lawsuits, to challenge the applicable patents.
ZYTIGA®
In July 2015, Janssen Biotech, Inc., Janssen Oncology, Inc. and Janssen Research & Development, LLC (collectively, Janssen) and BTG International Ltd. (BTG) initiated a patent infringement lawsuit (the main action) in the United States District Court for the District of New Jersey against a number of generic companies (and certain of their affiliates and/or suppliers) who filed ANDAs seeking approval to market a generic version of ZYTIGA® 250mg before the expiration of United States Patent No. 8,822,438 (the ’438 patent). The generic companies include Amneal Pharmaceuticals, LLC and Amneal Pharmaceuticals of New York, LLC (collectively, Amneal); Apotex Inc. and Apotex Corp. (collectively, Apotex); Citron Pharma LLC (Citron); Dr. Reddy’s Laboratories, Ltd. and Dr. Reddy’s Laboratories, Inc. (collectively, Dr. Reddy’s); Mylan Pharmaceuticals Inc. and Mylan Inc. (collectively, Mylan); Par Pharmaceuticals, Inc. and Par Pharmaceutical Companies, Inc. (collectively, Par); Teva Pharmaceuticals USA, Inc. (Teva); Wockhardt Bio A.G.; Wockhardt USA LLC and Wockhardt Ltd. (collectively, Wockhardt); West-Ward Pharmaceutical Corp. (West-Ward) and Hikma Pharmaceuticals, LLC (Hikma).
Janssen and BTG also initiated patent infringement lawsuits in the United States District Court for the District of New Jersey against Amerigen Pharmaceuticals Limited (Amerigen) in May 2016, and Glenmark Pharmaceuticals, Inc. (Glenmark) in June 2016, each of whom filed an ANDA seeking approval to market its generic version of ZYTIGA® before the expiration of the ’438 patent. These lawsuits were consolidated with the main action.
In August 2015, Janssen and BTG filed an additional jurisdictional protective lawsuit against the Mylan defendants in the United States District Court for the Northern District of West Virginia, which has been stayed.
In August 2017, Janssen and BTG initiated a patent infringement lawsuit in the United States District Court for the District of New Jersey against Teva, who filed an ANDA seeking approval to market a generic version of ZYTIGA® 500mg before the expiration of the ’438 patent. This lawsuit has been consolidated with the main action.
In December 2017, Janssen and BTG entered into a settlement agreement with Glenmark.
In February 2018, Janssen and BTG filed a patent infringement lawsuit against MSN Pharmaceuticals, Inc. and MSN Laboratories Private Limited (collectively, MSN) in United States District Court for the District of New Jersey based on its ANDA seeking approval for a generic version of ZYTIGA® prior to the expiration of the ’438 patent. In February 2019, the action was stayed pending the outcome of the main action.
In April 2018, Janssen and BTG entered into a settlement agreement with Apotex.
37
In October 2018, the United States District Court for the District of New Jersey issued a ruling invalidating all asserted claims of the ’438 patent. The court held that the patent claims would be infringed if the patent were valid. Janssen appealed the court’s decision.
In November 2018, Janssen and BTG initiated a patent infringement lawsuit in the United States District Court for the District of New Jersey against Qilu Pharmaceutical Co., Ltd. and Qilu Pharma, Inc. (collectively, Qilu), who filed an ANDA seeking approval to market a generic version of ZYTIGA® before the expiration of the ’438 patent. Janssen is seeking an order enjoining Qilu from marketing its generic version of ZYTIGA® before the expiration of the ’438 patent.
In November 2018, the United States Court of Appeals for the Federal Circuit denied Janssen’s request for an injunction pending appeal. As a result, several generic versions of ZYTIGA® have entered the market.
Several generic companies including Amerigen, Argentum Pharmaceuticals LLC (Argentum), Mylan, Wockhardt, Actavis, Amneal, Dr. Reddy’s, Sun, Teva, West-Ward and Hikma filed Petitions for Inter Partes Review (IPR) with the USPTO, seeking to invalidate the ’438 patent. In January 2018, the USPTO issued decisions finding the ’438 patent claims unpatentable, and Janssen requested rehearing. In December 2018, the USPTO denied Janssen’s request for rehearing of the IPR decisions. Janssen filed an appeal, which was consolidated with the above-mentioned appeal of the decision of the United States District Court for the District of New Jersey. In May 2019, the Federal Circuit issued a decision affirming the USPTO's decision in the Wockhardt IPR that the ’438 patent claims are unpatentable and dismissed the remaining appeals as moot. Subsequently, Janssen dismissed its lawsuits against MSN and Qilu.
In November 2017, Janssen initiated a Notice of Application under Section 6 of the Patented Medicines (Notice of Compliance) Regulations against Apotex Inc. (Apotex) and the Minister of Health in Canada in response to Apotex’s filing of an Abbreviated New Drug Submission (ANDS) seeking approval to market a generic version of ZYTIGA® before the expiration of Canadian Patent No. 2,661,422. The Final Hearing concluded in May 2019.
In January 2019, Janssen initiated a Notice of Application under Section 6 of the Patented Medicines (Notice of Compliance) Regulations against Apotex and the Minister of Health in Canada in response to Apotex’s filing of an Abbreviated New Drug Submission (ANDS) seeking approval to market a film-coated generic version of ZYTIGA® before the expiration of Canadian Patent No. 2,661,422(the ’422 patent). In October 2019, the Court issued an Order prohibiting the Canadian Minister of Health from approving Apotex’s ANDS until the expiration of the ’422 patent.
In January 2019, Janssen initiated a Notice of Application under Section 6 of the Patented Medicines (Notice of Compliance) Regulations against Pharmascience Inc. (Pharmascience) and the Minister of Health in Canada in response to Pharmascience’s filing of an Abbreviated New Drug Submission (ANDS) seeking approval to market a generic version of ZYTIGA® before the expiration of Canadian Patent No. 2,661,422. The Final Hearing is scheduled to begin in October 2020.
In January 2019, Janssen initiated a Notice of Application under Section 6 of the Patented Medicines (Notice of Compliance) Regulations against Sandoz Canada Inc. (Sandoz) and the Minister of Health in Canada in response to Sandoz’s filing of an Abbreviated New Drug Submission (ANDS) seeking approval to market a generic version of ZYTIGA® before the expiration of Canadian Patent No. 2,661,422. In July 2019, the parties entered into a settlement agreement.
In June 2019, Janssen initiated a Notice of Application under Section 6 of the Patented Medicines (Notice of Compliance) Regulations against Dr. Reddy's Laboratories Ltd. and Dr. Reddy's Laboratories, Inc. (collectively, DRL) and the Minister of Health in Canada in response to Apotex’s filing of an Abbreviated New Drug Submission (ANDS) seeking approval to market a generic version of ZYTIGA® before the expiration of Canadian Patent No. 2,661,422. The Final Hearing is scheduled to begin in October 2020.
In each of these Canadian actions, Janssen is seeking an order prohibiting the Minister of Health from issuing a Notice of Compliance with respect to the defendants’ ANDSs before the expiration of Janssen’s patent.
XARELTO®
Beginning in October 2015, Janssen Pharmaceuticals, Inc. (JPI) and Bayer Pharma AG and Bayer Intellectual Property GmbH (collectively, Bayer) filed patent infringement lawsuits in the United States District Court for the District of Delaware against a number of generic companies who filed ANDAs seeking approval to market generic versions of XARELTO® before expiration of Bayer’s United States Patent Nos. 7,157,456, 7,585,860 and 7,592,339 relating to XARELTO®. JPI is the exclusive sublicensee of the asserted patents. The following generic companies are named defendants: Aurobindo Pharma Limited and
38
Aurobindo Pharma USA, Inc. (collectively, Aurobindo); Breckenridge Pharmaceutical, Inc. (Breckenridge); InvaGen Pharmaceuticals Inc. (InvaGen); Micro Labs USA Inc. and Micro Labs Ltd (collectively, Micro); Mylan Pharmaceuticals Inc. (Mylan); Prinston Pharmaceuticals, Inc.; Sigmapharm Laboratories, LLC (Sigmapharm); Torrent Pharmaceuticals, Limited and Torrent Pharma Inc. (collectively, Torrent). The trial concluded in April 2018. In July 2018 the district court entered judgment against Mylan and Sigmapharm, holding that the asserted compound patent is valid and infringed. In September 2018, the district court entered judgment against the remaining defendants. None of the defendants appealed the judgment.
Beginning in April 2017, JPI and Bayer Intellectual Property GmbH and Bayer AG (collectively, Bayer AG) filed patent infringement lawsuits in the United States District Court for the District of Delaware against a number of generic companies who filed ANDAs seeking approval to market generic versions of XARELTO® before expiration of Bayer AG’s United States Patent No. 9,539,218 (’218) relating to XARELTO®. JPI is the exclusive sublicensee of the asserted patent. The following generic companies are named defendants: Alembic Pharmaceuticals Limited, Alembic Global Holding SA and Alembic Pharmaceuticals, Inc. (Alembic); Aurobindo; Breckenridge; InvaGen; Lupin Limited and Lupin Pharmaceuticals, Inc. (collectively, Lupin); Micro; Mylan; Sigmapharm; Taro Pharmaceutical Industries Ltd. and Taro Pharmaceuticals U.S.A., Inc. (collectively, Taro) and Torrent. Lupin counterclaimed for declaratory judgment of noninfringement and invalidity of United States Patent No. 9,415,053, but Lupin dismissed its counterclaims after it was provided a covenant not to sue on that patent. Aurobindo, Taro, Torrent, Micro, Breckenridge, InvaGen, Sigmapharm, Lupin and Alembic have agreed to have their cases stayed and to be bound by the outcome of any final judgment rendered against any of the other defendants. The ’218 cases have been consolidated for discovery and trial. The trial began in April 2019 and closing arguments were heard in June 2019.
In December 2018, JPI and Bayer AG filed a patent infringement lawsuit in the United States District Court for the District of Delaware against Teva Pharmaceuticals USA, Inc. and Teva Pharmaceutical Industries Ltd. (collectively, Teva) who filed an ANDA seeking approval to market a generic version of XARELTO® before expiration of Bayer AG’s ’218 patent. The case against Teva has been consolidated with the other ’218 cases for all purposes, and Teva has agreed to have its case stayed and to be bound by the outcome of any final judgment rendered against any of the other defendants.
In May 2018, Mylan filed a Petition for Inter Partes Review with the USPTO, seeking to invalidate the ’218 patent. In December 2018, the USPTO issued a decision denying institution of Mylan’s Petition for Inter Partes Review.
In May 2019, JPI and Bayer filed suit against Macleods Pharmaceuticals Ltd. and Macleods Pharma USA, Inc. (collectively, Macleods) alleging infringement of the ’218 patent. The case against Macleods has been consolidated with the other ’218 cases for all purposes, and Macleods has agreed to have its case stayed and to be bound by the outcome of any final judgment rendered against any of the other defendants.
The consolidated ’218 cases involving Alembic, Aurobindo, Breckenridge, InvaGen, Lupin, Macleods, Micro, Mylan, Sigmapharm, Taro, Teva, and Torrent have been stayed.
In June 2019, JPI and Bayer filed suit against Accord Healthcare Inc., Accord Healthcare Ltd., and Intas Pharmaceuticals Ltd. (collectively, Accord) alleging infringement of the ’218 patent.
In August 2019, JPI and Bayer filed suit against Sunshine Lake Pharma Co., Ltd. and HEC Pharm USA Inc. alleging infringement of the ’218 patent.
In each of these lawsuits, JPI is seeking an order enjoining the defendants from marketing their generic versions of XARELTO® before the expiration of the relevant patents.
PREZISTA®
In May 2018, Janssen Products, L.P. and Janssen Sciences Ireland UC (collectively, Janssen) initiated a patent infringement lawsuit in the United States District Court for the District of New Jersey against Dr. Reddys Laboratories, Inc., Dr. Reddys Laboratories, Ltd., Laurus Labs, Ltd. and Pharmaq, Inc. (collectively, DRL) who filed an ANDA seeking approval to market generic versions of PREZISTA® before the expiration of United States Patent Nos. 8,518,987; 7,126,015; and 7,595,408. In February 2019, the parties entered into a settlement agreement.
In December 2018, Janssen initiated a patent infringement lawsuit in the United States District Court for the District of New Jersey against Amneal Pharmaceuticals, LLC, Amneal Pharmaceuticals Company GmbH, Amneal Pharmaceuticals of New York, LLC, Amneal Pharmaceuticals Pvt Ltd., and Raks Pharma Pvt. Ltd. (collectively, Amneal), who filed an ANDA seeking approval to market generic versions of PREZISTA® before the expiration of United States Patent Nos. 8,518,987; 7,126,015; and 7,595,408. In April 2019, the parties entered into a settlement agreement.
39
INVOKANA®/INVOKAMET®/INVOKAMET XR®
Beginning in July 2017, Janssen Pharmaceuticals, Inc., Janssen Research & Development, LLC, Cilag GmbH International and Janssen Pharmaceutica NV (collectively, Janssen) and Mitsubishi Tanabe Pharma Corporation (MTPC) filed patent infringement lawsuits in the United States District Court for the District of New Jersey, the United States District Court for the District of Colorado and the United States District Court for the District of Delaware against a number of generic companies who filed ANDAs seeking approval to market generic versions of INVOKANA® and/or INVOKAMET® before expiration of MTPC’s United States Patent Nos. 7,943,582 (the ’582 patent) and/or 8,513,202 (the ’202 patent) relating to INVOKANA® and INVOKAMET®. Janssen is the exclusive licensee of the asserted patents. The following generic companies are named defendants: Apotex Inc. and Apotex Corp. (Apotex); Aurobindo Pharma USA Inc. (Aurobindo); Macleods Pharmaceuticals Ltd. and Macleods Pharma USA, Inc.; InvaGen Pharmaceuticals, Inc. (InvaGen); Prinston Pharmaceuticals Inc.; Dr. Reddy’s Laboratories, Inc. and Dr. Reddy’s Laboratories Ltd; Hetero USA, Inc., Hetero Labs Limited Unit-V and Hetero Labs Limited; MSN Laboratories Private Ltd. and MSN Pharmaceuticals, Inc.; Laurus Labs Ltd.; Indoco Remedies Ltd.; Zydus Pharmaceuticals (USA) Inc. (Zydus); Sandoz, Inc. (Sandoz); Teva Pharmaceuticals USA, Inc.; and Lupin Ltd. and Lupin Pharmaceuticals, Inc. (Lupin).
Beginning in July 2017, Janssen and MTPC filed patent infringement lawsuits in the United States District Court for the District of New Jersey and the United States District Court for the District of Colorado against Sandoz and InvaGen, who filed ANDAs seeking approval to market generic versions of INVOKANA® and/or INVOKAMET® before expiration of MTPC’s United States Patent No. 7,943,788 (the ’788 patent) relating to INVOKANA® and INVOKAMET® and against Zydus, who filed ANDAs seeking approval to market generic versions of INVOKANA® and INVOKAMET® before expiration of the ’788 patent, MTPC's United States Patent No. 8,222,219 relating to INVOKANA® and INVOKAMET® and MTPC’s United States Patent No. 8,785,403 relating to INVOKAMET®, and against Aurobindo, who filed an ANDA seeking approval to market a generic version of INVOKANA® before expiration of the ’788 patent and the ’219 patent relating to INVOKANA®. Janssen is the exclusive licensee of the asserted patents. In October 2017, the Colorado lawsuits against Sandoz were dismissed. In December 2017, the Delaware lawsuits against Apotex and Teva were dismissed.
In April 2018, Janssen and MTPC filed a patent infringement lawsuit in the United States District Court for the District of New Jersey against Prinston, who filed an ANDA seeking approval to market a generic version of INVOKANA® before expiration of the ’788 patent relating to INVOKANA®.
In February 2019, Janssen and MTPC filed a patent infringement lawsuit in the United States District Court for the District of New Jersey against Lupin, who filed an ANDA seeking approval to market a generic version of INVOKAMET XR® before expiration of the ’582 patent and ’202 patent relating to INVOKAMET XR®.
In June 2019, Janssen and MTPC entered into a settlement agreement with Prinston and InvaGen.
In July 2019, Janssen and MTPC filed a patent infringement lawsuit in the United States District Court for the District of New Jersey against MSN, who filed an ANDA seeking approval to market a generic version of INVOKAMET XR® before expiration of the ’582 patent and ’202 patent relating to INVOKAMET XR®.
In July 2019, Janssen and MTPC entered into a settlement agreement with Hetero.
In August 2019, Janssen and MTPC entered into a settlement agreement with Apotex and Teva.
A trial on the ’582 and ’202 patents is scheduled to begin in April 2020, and a trial on the ’788, ’219 and ’403 patents is scheduled to begin in May 2020.
In each of these lawsuits, Janssen and MTPC are seeking an order enjoining the defendants from marketing their generic versions of INVOKANA®, INVOKAMET® and/or, INVOKAMET XR® before the expiration of the relevant patents.
OPSUMIT®
In January 2018, Actelion Pharmaceuticals Ltd (Actelion) initiated a patent infringement lawsuit in the United States District Court for the District of New Jersey against Zydus Pharmaceuticals (USA) Inc. (Zydus) and Amneal Pharmaceuticals LLC (Amneal), each of whom filed an ANDA seeking approval to market a generic version of OPSUMIT® before the expiration of United States Patent No. 7,094,781. In the lawsuit, Actelion is seeking an order enjoining Zydus and Amneal from marketing
40
generic versions of OPSUMIT® before the expiration of the patent. Amneal and Zydus have stipulated to infringement. The trial is scheduled to commence in October 2020.
In July 2019, Actelion Pharmaceuticals Ltd. filed suit against Aurobindo Pharma USA Inc. and Aurobindo Pharma Limited (Aurobindo). Aurobindo filed an ANDA seeking approval to market a generic version of OPSUMIT® before the expiration of the ’781 patent. Actelion is seeking an order enjoining Defendants from marketing a generic version of OPSUMIT® before the expiration of the ’781 patent.
INVEGA SUSTENNA®
In January 2018, Janssen Pharmaceutica NV and Janssen Pharmaceuticals, Inc. (collectively, Janssen) initiated a patent infringement lawsuit in the United States District Court for the District of New Jersey against Teva Pharmaceuticals USA, Inc. (Teva), who filed an ANDA seeking approval to market a generic version of INVEGA SUSTENNA® before the expiration of United States Patent No. 9,439,906.
In August 2019, Janssen Pharmaceutica NV and Janssen Pharmaceuticals, Inc. (collectively, Janssen) initiated a patent infringement lawsuit in the United States District Court for the District of New Jersey against Mylan Laboratories Limited (Mylan), who filed an ANDA seeking approval to market a generic version of INVEGA SUSTENNA® before the expiration of the patent.
In each of these lawsuits, Janssen is seeking an order enjoining the defendant from marketing a generic version of INVEGA SUSTENNA® before the expiration of the patent.
In February 2018, Janssen Inc. and Janssen Pharmaceutica NV (collectively, Janssen) initiated a Notices of Application under Section 6 of the Patented Medicines (Notice of Compliance) Regulations against Teva Canada Limited (Teva) and the Minister of Health in response to Teva's filing of an Abbreviated New Drug Submission (ANDS) seeking approval to market a generic version of INVEGA SUSTENNA® before the expiration of Canadian Patent Nos. 2,309,629 and 2,655,335. Janssen is seeking an order prohibiting the Minister of Health from issuing a Notice of Compliance with respect to Teva’s ANDS before the expiration of these patents. The Final Hearing is scheduled to begin in February 2020.
IMBRUVICA®
Beginning in January 2018, Pharmacyclics LLC (Pharmacyclics) and Janssen Biotech, Inc. (JBI) filed patent infringement lawsuits in the United States District Court for the District of Delaware against a number of generic companies who filed ANDAs seeking approval to market generic versions of IMBRUVICA® 140 mg capsules before expiration of Pharmacyclics’ United States Patent Nos. 8,008,309, 7,514,444, 8,697,711, 8,735,403, 8,957,079, 9,181,257, 8,754,091, 8,497,277, 8,925,015, 8,476,284, 8,754,090, 8,999,999, 9,125,889, 9,801,881, 9,801,883, 9,814,721, 9,795,604, 9,296,753, 9,540,382, 9,713,617 and/or 9,725,455 relating to IMBRUVICA®. JBI is the exclusive licensee of the asserted patents. The following generic companies are named defendants: Cipla Limited and Cipla USA Inc. (Cipla); Fresenius Kabi USA, LLC, Fresenius Kabi USA, Inc., and Fresenius Kabi Oncology Limited (Fresenius Kabi); Sandoz Inc. and Lek Pharmaceuticals d.d. (Sandoz); Shilpa Medicare Limited (Shilpa); Sun Pharma Global FZE and Sun Pharmaceutical Industries Limited (Sun); Teva Pharmaceuticals USA, Inc. (Teva); and Zydus Worldwide DMCC and Cadila Healthcare Limited (Zydus). The trial is scheduled to begin in October 2020.
In October 2018, Pharmacyclics and JBI filed a patent infringement lawsuit in the United States District Court for the District of Delaware against Sun asserting United States Patent No. 10,004,746.
In November 2018, Pharmacyclics and JBI filed a patent infringement lawsuit in the United States District Court for the District of Delaware against Hetero Labs Limited, Hetero Labs Limited Unit-1, Hetero Labs Limited Unit-V, and Hetero USA Inc. (“Hetero”), who filed an ANDA seeking approval to market a generic version of IMBRUVICA® 140 mg capsules, asserting infringement of United States Patent Nos. 8,754,090, 9,296,753, 9,540,382, 9,713,617 and 9,725,455.
In January 2019, Pharmacyclics and JBI amended their complaints against Fresenius Kabi, Zydus, Teva and Sandoz to further allege infringement of U.S. Patent Nos. 10,106,548, and 10,125,140.
In January 2019, Pharmacyclics and JBI filed a patent infringement lawsuit in the United States District Court for the District of Delaware against Zydus, who filed an ANDA seeking approval to market a generic version of IMBRUVICA® 70 mg before the expiration of U.S. Patent Nos. 7,514,444, 8,003,309, 8,476,284, 8,497,277, 8,697,711, 8,753,403, 8,754,090, 8,754,091, 8,952,015, 8,957,079, 9,181,257, 9,296,753, 9,540,382, 9,713,617, 9,725,455, 10,106,548, and 10,125,140.
41
In January 2019, Pharmacyclics and JBI filed a patent infringement lawsuit in the United States District Court for the District of Delaware against Hetero asserting infringement of United States Patent No. 10,106,548.
In February 2019, Pharmacyclics and JBI amended their complaints against Cipla, Shilpa, and Sun to allege infringement of United States Patent Nos. 10,106,548, and 10,125,140.
In February 2019, Pharmacyclics and JBI entered into settlement agreements with Teva and Hetero. In March 2019, Pharmacyclics and JBI entered into a settlement agreement with Shilpa.
In March 2019, Pharmacyclics and JBI filed a patent infringement lawsuit in the United States District Court for the District of Delaware against Alvogen Pine Brook LLC and Natco Pharma Ltd. (Alvogen), who filed an ANDA seeking approval to market generic versions of IMBRUVICA® tablets, asserting infringement of United States Patent Nos. 7,514,444, 8,003,309, 8,476,284, 8,497,277, 8,697,711, 8,753,403, 8,754,090, 8,754,091, 8,952,015, 8,957,079, 9,181,257, 9,296,753, 9,655,857, 9,725,455, 10,010,507, 10,106,548, and 10,125,140.
In May 2019, Pharmacyclics and JBI amended their complaints against Cipla to further allege infringement of United States Patent No. 10,016,435. In June 2019, Pharmacyclics and JBI amended their complaints against Alvogen to further allege infringement of United States Patent No. 10,213,386.
In August 2019, Pharmacyclics and JBI amended their complaints against Cipla, Fresenius, and Sandoz to further allege infringement of U.S. Patent Nos. 10,294,231 and 10,294,232 and amended their complaint against Sun to further allege infringement of U.S. Patent No. 10,294,232.
In each of the lawsuits, Pharmacyclics and JBI are seeking an order enjoining the defendants from marketing generic versions of IMBRUVICA® before the expiration of the relevant patents.
In March 2019, Sandoz filed an Inter Partes Review (IPR) in the USPTO, seeking to invalidate United States Patent No. 9,795,604.
TRACLEER®
In May 2019, Actelion Pharmaceuticals Ltd and Actelion Pharmaceuticals US, Inc. initiated a patent infringement lawsuit in the United States District Court for the District of New Jersey against Natco Pharma Limited and Syneos Health LLC (collectively, Natco), who filed an ANDA seeking approval to market a generic version of TRACLEER®, 32 mg, before the expiration of U.S. Patent No. 8,309,126 (the ’126 patent). In the lawsuit, Actelion is seeking an order enjoining Natco from marketing its generic version of TRACLEER® before the expiration of the ’126 patent.
RISPERDAL CONSTA®
In July 2019, Janssen Pharmaceuticals, Inc., Alkermes Pharma Ireland Limited and Alkermes Controlled Therapeutics, Inc. initiated a patent infringement lawsuit in the United States District Court for the District of Delaware against Luye Pharma Group Ltd., Luye Pharma (USA), Ltd., Nanjing Luye Pharmaceutical Co., Ltd. and Shandong Luye Pharmaceutical Co., Ltd. (collectively, Luye), who filed an ANDA seeking approval to market a generic version of RISPERDAL CONSTA® before the expiration of United States Patent No. 6,667,061. A trial has been scheduled for February 2020.
In this lawsuit, Janssen is seeking an order enjoining Luye from marketing a generic version of RISPERDAL CONSTA® before the expiration of the patent.
GOVERNMENT PROCEEDINGS
Like other companies in the pharmaceutical, consumer and medical devices industries, Johnson & Johnson and certain of its subsidiaries are subject to extensive regulation by national, state and local government agencies in the United States and other countries in which they operate. As a result, interaction with government agencies is ongoing. The most significant litigation brought by, and investigations conducted by, government agencies are listed below. It is possible that criminal charges and substantial fines and/or civil penalties or damages could result from government investigations or litigation.
Average Wholesale Price (AWP) Litigation
42
Johnson & Johnson and several of its pharmaceutical subsidiaries (the J&J AWP Defendants), along with numerous other pharmaceutical companies, were named as defendants in a series of lawsuits in state and federal courts involving allegations that the pricing and marketing of certain pharmaceutical products amounted to fraudulent and otherwise actionable conduct because, among other things, the companies allegedly reported an inflated Average Wholesale Price (AWP) for the drugs at issue. Payors alleged that they used those AWPs in calculating provider reimbursement levels. The plaintiffs in these cases included three classes of private persons or entities that paid for any portion of the purchase of the drugs at issue based on AWP, and state government entities that made Medicaid payments for the drugs at issue based on AWP. Many of these cases, both federal actions and state actions removed to federal court, were consolidated for pre-trial purposes in a multi-district litigation in the United States District Court for the District of Massachusetts, where all claims against the J&J AWP Defendants were ultimately dismissed. The J&J AWP Defendants also prevailed in a case brought by the Commonwealth of Pennsylvania. Other AWP cases have been resolved through court order or settlement. The case brought by Illinois was settled after trial. In New Jersey, a putative class action based upon AWP allegations is pending against Centocor, Inc. and Ortho Biotech Inc. (both now Janssen Biotech, Inc.), Johnson & Johnson and ALZA Corporation. All other cases have been resolved.
Opioid Litigation
Beginning in 2014 and continuing to the present, Johnson & Johnson and Janssen Pharmaceuticals, Inc. (JPI), along with other pharmaceutical companies, have been named in more than 2,500 lawsuits brought by certain state and local governments related to the marketing of opioids, including DURAGESIC®, NUCYNTA® and NUCYNTA® ER. The suits also raise allegations related to previously owned active pharmaceutical ingredient supplier subsidiaries, Tasmanian Alkaloids Pty, Ltd. and Noramco, Inc. (both subsidiaries were divested in 2016). Similar lawsuits have also been filed by the following groups of plaintiffs: individual plaintiffs on behalf of children suffering from Neonatal Abstinence Syndrome; hospitals; and health insurers/payors. To date, complaints against pharmaceutical companies, including Johnson & Johnson and JPI, have been filed in state court by the state Attorneys General in Arkansas, Florida, Illinois, Kentucky, Louisiana, Mississippi, Missouri, New Hampshire, New Jersey, New Mexico, New York, Ohio, Oklahoma, South Dakota, Texas and West Virginia. Complaints against the manufacturers also have been filed in state or federal court by city, county and local government agencies in the following states: Alabama; Arkansas; California; Connecticut; Florida; Georgia; Illinois; Kentucky; Louisiana; Maine; Maryland; Massachusetts; Mississippi; Missouri; Nevada; New Hampshire; New Jersey; New Mexico; New York; North Carolina; Ohio; Oklahoma; Oregon; Pennsylvania; Rhode Island; South Carolina; South Dakota; Tennessee; Texas; Utah; Virginia; Washington; West Virginia and Wisconsin. The Government of Puerto Rico filed suit in Superior Court of San Juan. There are more than 350 cases pending in various state courts. There are over 2,200 federal cases coordinated in a federal Multi-District Litigation (MDL) pending in the U.S. District Court for the Northern District of Ohio (MDL No. 2804). In addition, the Province of British Columbia filed suit in Canada. These actions allege a variety of claims related to opioid marketing practices, including false advertising, unfair competition, public nuisance, consumer fraud violations, deceptive acts and practices, false claims and unjust enrichment. The suits generally seek penalties and/or injunctive and monetary relief and, in some of the suits, the plaintiffs are seeking joint and several liability among the defendants. An adverse judgment in any of these lawsuits could result in the imposition of large monetary penalties and significant damages including, punitive damages, cost of abatement, substantial fines, equitable remedies and other sanctions.
The trial in the matter filed by the Oklahoma Attorney General resulted in a judgment against Johnson & Johnson and JPI in the amount of $572 million, subject to a final order to be issued by the court. Johnson & Johnson and JPI have expressed their intention to appeal the judgment. The Company believes that it has strong grounds to overturn this judgment. In October 2019 Johnson & Johnson and JPI announced a settlement of the first case set for trial in the MDL for two counties in Ohio.
Johnson & Johnson, JPI and other pharmaceutical companies have also received subpoenas or requests for information related to opioids marketing practices from the following state Attorneys General: Alaska, Indiana, Montana, New Hampshire, South Carolina, Tennessee, Texas and Washington. In September 2017, Johnson & Johnson and JPI were contacted by the Texas and Colorado Attorney General’s Offices on behalf of approximately 38 states regarding a multi-state Attorney General investigation. In October 2019, four state attorneys general have also announced a proposed agreement in principle with various companies that would include the Company contributing $4 billion, subject to various conditions and an agreement being finalized. This agreement in principle is not an admission of liability or wrong-doing and would resolve opioid lawsuits filed and future claims by states, cities and counties. The Company cannot predict if or when the agreement will be finalized.
In August 2019, Johnson & Johnson received a grand jury subpoena from the United States Attorney’s Office for the Eastern District of New York for documents related to the Company’s anti-diversion policies and procedures and distribution of its opioid medications, in what the Company understands to be part of a broader investigation into manufacturers’ and distributors’ monitoring programs and reporting under the Controlled Substances Act. In September 2019, Johnson & Johnson received subpoenas from the New York State Department of Financial Services (NYDFS) as part of an industry-wide inquiry into the
43
effect of opioid prescriptions on New York health insurance premiums. The Company is cooperating with NYDFS’s inquiry and producing documents in response to the various subpoenas and requests for information.
Other
In August 2012, DePuy Orthopaedics, Inc., DePuy, Inc. (now known as DePuy Synthes, Inc.), and Johnson & Johnson Services, Inc. (collectively DePuy) received an informal request from the United States Attorney's Office for the District of Massachusetts and the Civil Division of the United States Department of Justice (the United States) for the production of materials relating to the DePuy ASR™ XL Hip device. In July 2014, the United States notified the United States District Court for the District of Massachusetts that it had declined to intervene in a qui tam case filed pursuant to the False Claims Act against the companies. In February 2016, the district court granted the companies’ motion to dismiss with prejudice, unsealed the qui tam complaint, and denied the qui tam relators’ request for leave to file a further amended complaint. The qui tam relators appealed the case to the United States Court of Appeals for the First Circuit. In July 2017, the First Circuit affirmed the district court’s dismissal in part, reversed in part, and affirmed the decision to deny the relators’ request to file a third amended complaint. The relators’ remaining claims are now pending before the district court, and fact discovery is currently scheduled to close in February 2020.
In October 2012, Johnson & Johnson was contacted by the California Attorney General's office regarding a multi-state Attorney General investigation of the marketing of surgical mesh products for hernia and urogynecological purposes by Johnson & Johnson's subsidiary, Ethicon, Inc. (Ethicon). In May 2016, California and Washington filed civil complaints against Johnson & Johnson, Ethicon and Ethicon US, LLC alleging violations of their consumer protection statutes. In April 2019, Johnson & Johnson and Ethicon settled the Washington case. The California case started trial in July 2019 and concluded in September 2019. The parties are awaiting a decision. Similar complaints were filed against the companies by Kentucky in August 2016 and by Mississippi in October 2017. The trial date for the Kentucky case was scheduled for September 2019 but has been adjourned and no new trial date has been scheduled. In October 2019, Johnson & Johnson and Ethicon settled the multi-state investigation with 41 other states and the District of Columbia.
In December 2012, Therakos, Inc. (Therakos), formerly a subsidiary of Johnson & Johnson and part of the Ortho-Clinical Diagnostics, Inc. (OCD) franchise, received a letter from the civil division of the United States Attorney's Office for the Eastern District of Pennsylvania informing Therakos that the United States Attorney's Office was investigating the sales and marketing of Uvadex® (methoxsalen) and the Uvar Xts® and Cellex® Systems during the period 2000 to the present. The United States Attorney's Office requested that OCD and Johnson & Johnson preserve documents that could relate to the investigation. Therakos was subsequently acquired by an affiliate of Gores Capital Partners III, L.P. in January 2013, and OCD was divested in June 2014. Following the divestiture of OCD, Johnson & Johnson retains OCD’s portion of any liability that may result from the investigation for activity that occurred prior to the sale of Therakos. In March 2014 and March 2016, the United States Attorney’s Office requested that Johnson & Johnson produce certain documents, and Johnson & Johnson is cooperating with those requests.
In June 2014, the Mississippi Attorney General filed a complaint in Chancery Court of The First Judicial District of Hinds County, Mississippi against Johnson & Johnson and Johnson & Johnson Consumer Companies, Inc. (now known as Johnson & Johnson Consumer Inc.) (JJCI). The complaint alleges that defendants violated the Mississippi Consumer Protection Act by
failing to disclose alleged health risks associated with female consumers' use of talc contained in JOHNSON'S® Baby Powder and JOHNSON'S® Shower to Shower (a product divested in 2012) and seeks injunctive and monetary relief. The matter is stayed pending interlocutory appeal of a December 2018 denial of Johnson & Johnson and JJCI's motion for summary judgment.
In March 2016, Janssen Pharmaceuticals, Inc. (JPI) received a Civil Investigative Demand from the United States Attorney’s Office for the Southern District of New York related to JPI’s contractual relationships with pharmacy benefit managers over the period from January 1, 2006 to the present with regard to certain of JPI's pharmaceutical products. The demand was issued in connection with an investigation under the False Claims Act.
In July 2016, Johnson & Johnson and Janssen Products LP were served with a qui tam complaint pursuant to the False Claims Act filed in the United States District Court for the District of New Jersey alleging the off-label promotion of two HIV products, PREZISTA® and INTELENCE®, and anti-kickback violations in connection with the promotion of these products. The complaint was filed under seal in December 2012. The federal and state governments have declined to intervene, and the lawsuit is being prosecuted by the relators.
In January 2017, Janssen Pharmaceuticals, Inc. (JPI) received a Civil Investigative Demand from the United States Department of Justice relating to allegations concerning the sales and marketing practices of OLYSIO®. In December 2017, Johnson &
44
Johnson and JPI were served with a whistleblower lawsuit filed in the United States District Court for the Central District of California alleging the off-label promotion of OLYSIO® and additional products, including NUCYNTA®, XARELTO®, LEVAQUIN® and REMICADE®. At this time, the federal and state governments have declined to intervene and the lawsuit, which is related to the Civil Investigative Demand, is being prosecuted by a former company employee. The United States District Court for the Central District of California dismissed the claim in April 2018. In May 2018, the relator filed a notice of appeal to the United States Court of Appeals for the Ninth Circuit. Oral argument for the appeal is scheduled for November 2019.
In November 2018, a second whistleblower lawsuit was unsealed in the United States District Court for the Central District of California. The lawsuit was substantially similar to the lawsuit under appeal but was brought in the name of the original relator. The federal and state governments declined to intervene in the second suit, and the relator moved to dismiss the lawsuit without prejudice. In April 2019, the court granted the relator's motion and dismissed the complaint without prejudice.
In March 2017, Janssen Biotech, Inc. received a Civil Investigative Demand from the United States Department of Justice regarding a False Claims Act investigation concerning management and advisory services provided to rheumatology and gastroenterology practices that purchased REMICADE® or SIMPONI ARIA®.
In April and September 2017, Johnson & Johnson received subpoenas from the United States Attorney for the District of Massachusetts seeking documents broadly relating to pharmaceutical copayment support programs for DARZALEX®, OLYSIO®, REMICADE®, SIMPONI®, STELARA® and ZYTIGA®. The subpoenas also seek documents relating to Average Manufacturer Price and Best Price reporting to the Center for Medicare and Medicaid Services related to those products, as well as rebate payments to state Medicaid agencies.
In June 2017, Johnson & Johnson received a subpoena from the United States Attorney's Office for the District of Massachusetts seeking information regarding practices pertaining to the sterilization of DePuy Synthes, Inc. spinal implants at three hospitals in Boston as well as interactions of employees of Company subsidiaries with physicians at these hospitals. Johnson & Johnson and DePuy Synthes, Inc. have produced documents in response to the subpoena and are fully cooperating with the government’s investigation.
In July 2018 the Public Prosecution Service in Rio de Janeiro and representatives from the Brazilian antitrust authority CADE inspected the offices of more than 30 companies including Johnson & Johnson do Brasil Indústria e Comércio de Produtos para Saúde Ltda. The authorities appear to be investigating allegations of possible anti-competitive behavior and possible improper payments in the medical device industry. The United States Department of Justice and the United States Securities and Exchange Commission have made additional preliminary inquiries about the inspection in Brazil, and Johnson & Johnson do Brasil Indústria e Comércio de Produtos para Saúde Ltda. is cooperating with those requests.
From time to time, the Company has received requests from a variety of United States Congressional Committees to produce information relevant to ongoing congressional inquiries. It is the policy of Johnson & Johnson to cooperate with these inquiries by producing the requested information.
GENERAL LITIGATION
In May 2014, two purported class actions were filed in federal court, one in the United States District Court for the Central District of California and one in the United States District Court for the Southern District of Illinois, against Johnson & Johnson and Johnson & Johnson Consumer Companies, Inc. (now known as Johnson & Johnson Consumer Inc.) (JJCI) alleging violations of state consumer fraud statutes based on nondisclosure of alleged health risks associated with talc contained in JOHNSON'S® Baby Powder and JOHNSON'S® Shower to Shower (a product no longer sold by JJCI). Both cases seek injunctive relief and monetary damages; neither includes a claim for personal injuries. In October 2016, both cases were transferred to the United States District Court for the District Court of New Jersey as part of a newly created federal multi-district litigation. In July 2017, the district court granted Johnson & Johnson's and JJCI’s motion to dismiss one of the cases. In September 2018, the United States Court of Appeals for the Third Circuit affirmed this dismissal. In September 2017, the plaintiff in the second case voluntarily dismissed the complaint. In March 2018, the plaintiff in the second case refiled in Illinois State Court.
In August 2014, United States Customs and Border Protection (US CBP) issued a Penalty Notice against Janssen Ortho LLC (Janssen Ortho), assessing penalties for the alleged improper classification of darunavir ethanolate (the active pharmaceutical ingredient in PREZISTA®) in connection with its importation into the United States. In October 2014, Janssen Ortho submitted a Petition for Relief in response to the Penalty Notice. In May 2015, US CBP issued an Amended Penalty Notice assessing substantial penalties and Janssen Ortho filed a Petition for Relief in July 2015. In May 2019, US CBP issued its Mitigation
45
Decision and determined that Janssen Ortho had negligently misrepresented that darunavir ethanolate is entitled to duty free treatment. In June 2019, Janssen Ortho filed a Supplemental Petition for Relief. The Penalties Proceeding will be impacted by the related Classification Litigation pending in the United States Court of International Trade. The Classification Litigation will determine whether darunavir ethanolate was properly classified as exempt from duties upon importation into the United States. The trial in the Classification Litigation was held in July 2019. The parties are awaiting a decision.
In March and April 2015, over 30 putative class action complaints were filed by contact lens patients in a number of courts around the United States against Johnson & Johnson Vision Care, Inc. (JJVCI) and other contact lens manufacturers, distributors, and retailers, alleging vertical and horizontal conspiracies to fix the retail prices of contact lenses. The complaints allege that the manufacturers reached agreements with each other and certain distributors and retailers concerning the prices at which some contact lenses could be sold to consumers. The plaintiffs are seeking damages and injunctive relief. All of the class action cases were transferred to the United States District Court for the Middle District of Florida in June 2015. The plaintiffs filed a consolidated class action complaint in November 2015. In December 2018, the district court granted the plaintiffs' motion for class certification. Defendants filed two motions for interlocutory appeal of class certification to the United States Court of Appeals for the Eleventh Circuit. Both motions were denied. Defendants' motions for summary judgment are pending in the District Court.
In August 2015, two third-party payors filed a purported class action in the United States District Court for the Eastern District of Louisiana against Janssen Research & Development, LLC, Janssen Ortho LLC, Janssen Pharmaceuticals, Inc., Ortho-McNeil-Janssen Pharmaceuticals, Inc. and Johnson & Johnson (as well as certain Bayer entities), alleging that the defendants improperly marketed and promoted XARELTO® as safer and more effective than less expensive alternative medications while failing to fully disclose its risks. The complaint seeks damages.
In May 2017, Lonza Sales AG (Lonza) filed a Request for Arbitration with the London Court of International Arbitration against Janssen Research & Development, LLC (Janssen R&D). Lonza alleges that Janssen R&D breached a 2005 agreement between the parties by sublicensing certain Lonza technology used in the manufacture of daratumumab without Lonza’s consent. Lonza seeks monetary damages. In May 2019, the arbitration award was issued and the matter has been resolved.
In September 2017, Pfizer, Inc. (Pfizer) filed an antitrust complaint against Johnson & Johnson and Janssen Biotech, Inc. (collectively, Janssen) in United States District Court for the Eastern District of Pennsylvania. Pfizer alleges that Janssen has violated federal antitrust laws through its contracting strategies for REMICADE®. The complaint seeks damages and injunctive relief. Discovery is ongoing.
Beginning in September 2017, multiple purported class actions of direct and indirect purchasers were filed against Johnson & Johnson and Janssen Biotech, Inc. (collectively, Janssen) alleging that Janssen’s REMICADE® contracting strategies violated federal and state antitrust and consumer laws and seeking damages and injunctive relief. In November 2017, the cases were consolidated for pre-trial purposes in United States District Court for the Eastern District of Pennsylvania as In re Remicade Antitrust Litigation. Motions to dismiss were denied in both the direct and indirect purchaser cases. A motion to compel arbitration of the direct purchaser case was denied by the district court. The United States Court of Appeals for the Third Circuit reversed the district court's ruling.
In June 2018, Walgreen Co. and Kroger Co, filed an antitrust complaint against Johnson & Johnson and Janssen Biotech, Inc. (collectively, Janssen) in the United States District Court for the Eastern District of Pennsylvania. The complaint alleges that Janssen has violated federal antitrust laws through its contracting strategies for REMICADE®. The complaint seeks damages and injunctive relief. In March 2019, summary judgment was granted in favor of Janssen. This ruling is on appeal to the United States Court of Appeals for the Third Circuit.
In June 2019, the United States Federal Trade Commission (FTC) issued a Civil Investigative Demand to Johnson & Johnson in connection with its investigation of whether Janssen’s REMICADE® contracting practices violate federal antitrust laws.
In October 2017, certain United States service members and their families brought a complaint against a number of pharmaceutical and medical devices companies, including Johnson & Johnson and certain of its subsidiaries, alleging that the defendants violated the United States Anti-Terrorism Act. The complaint alleges that the defendants provided funding for terrorist organizations through their sales practices pursuant to pharmaceutical and medical device contracts with the Iraqi Ministry of Health. In January 2019, plaintiffs' motion to file a Second Amended Complaint adding plaintiffs to the lawsuit was granted. In April 2019, the Company moved to dismiss the Second Amended Complaint.
In October 2018, two separate putative class actions were filed against Actelion Pharmaceutical Ltd., Actelion Pharmaceuticals US, Inc., and Actelion Clinical Research, Inc. (collectively Actelion) in United States District Court for the District of
46
Maryland and United States District Court for the District of Columbia. The complaints allege that Actelion violated state and federal antitrust and unfair competition laws by allegedly refusing to supply generic pharmaceutical manufacturers with samples of TRACLEER®. TRACLEER® is subject to a Risk Evaluation and Mitigation Strategy, which imposes restrictions on distribution of the product. In January 2019, the plaintiffs dismissed the District of Columbia case and filed a consolidated complaint in the United States District Court for the District of Maryland. In October 2019, the Court granted Actelion’s motion to dismiss the amended complaint.
In December 2018, Janssen Biotech, Inc., Janssen Oncology, Inc, Janssen Research & Development, LLC, and Johnson & Johnson (collectively, Janssen) were served with a qui tam complaint filed on behalf of the United States, 28 states, and the District of Columbia. The complaint, which was filed in December 2017 in United States District Court for the Northern District of California, alleges that Janssen violated the federal False Claims Act and state law when providing pricing information for ZYTIGA® to the government in connection with direct government sales and government-funded drug reimbursement programs. At this time, the federal and state governments have declined to intervene. The case has been transferred to United States District Court for the District of New Jersey. Janssen has moved to dismiss the complaint.
In April 2019, Blue Cross & Blue Shield of Louisiana and HMO Louisiana, Inc. filed a class action complaint against Janssen Biotech, Inc, Janssen Oncology, Inc, Janssen Research & Development, LLC and BTG International Limited in the United States District Court for the Eastern District of Virginia. The complaint alleges that the defendants violated the Sherman Act and the antitrust and consumer protections laws of several states by pursuing patent litigation relating to ZYTIGA® in order to delay generic entry. The case has been transferred to the United States District Court for the District of New Jersey.
In May 2019, a class action antitrust complaint was filed against Janssen R&D Ireland (Janssen) and Johnson & Johnson. The complaint alleges that Janssen violated federal and state antitrust and consumer protection laws by agreeing to exclusivity provisions in its agreements with Gilead concerning the development and marketing of combination antiretroviral therapies (cART) to treat HIV. The complaint also alleges that Gilead entered into similar agreements with Bristol-Myers-Squibb and Japan Tobacco. The case is pending in the United States District Court for the District of Northern California. The defendants have filed motions to dismiss the complaint.
In October 2019, Innovative Health, LLC filed a complaint against Biosense Webster, Inc. (BWI) in the United States District Court for the Middle District of California. The complaint alleges that certain of BWI’s business practices and contractual terms violate the antitrust laws of the United States and the State of California by restricting competition in the sale of High Density Mapping Catheters and Ultrasound Catheters.
Johnson & Johnson or its subsidiaries are also parties to a number of proceedings brought under the Comprehensive Environmental Response, Compensation, and Liability Act, commonly known as Superfund, and comparable state, local or foreign laws in which the primary relief sought is the cost of past and/or future remediation.
47
NOTE 12— RESTRUCTURING
On April 17, 2018, the Company announced plans to implement a series of actions across its Global Supply Chain that are intended to focus resources and increase investments in the critical capabilities, technologies and solutions necessary to manufacture and supply its product portfolio, enhance agility and drive growth. The Global Supply Chain actions will include expanding the use of strategic collaborations and bolstering initiatives to reduce complexity, improve cost-competitiveness, enhance capabilities and optimize the Supply Chain network. For additional details on the global supply chain restructuring strategic collaborations see Note 10 to the Consolidated Financial Statements. In the fiscal third quarter of 2019, the Company recorded a pre-tax charge of $128 million, of which $20 million was included in cost of products sold and $39 million was included in other (income) expense. In the fiscal nine months of 2019, the Company recorded a pre-tax charge of $360 million, of which $81 million was included in cost of products sold and $117 million was included in other (income) expense. Total project costs of approximately $598 million have been recorded since the restructuring was announced. See the following table for additional details on the restructuring program.
In total, the Company expects these actions to generate approximately $0.6 billion to $0.8 billion in annual pre-tax cost savings that will be substantially delivered by 2022. The Company expects to record pre-tax restructuring charges of approximately $1.9 billion to $2.3 billion, over the 4 to 5 year period of this activity. These costs are associated with network optimizations, exit costs and accelerated depreciation and amortization.
The following table summarizes the severance related reserves and the associated spending through the fiscal nine months of 2019:
(Dollars in Millions) | Severance | Asset Write-offs | Other** | Total | |||||
Reserve balance, December 30, 2018 | $ | 194 | — | 48 | 242 | ||||
Current year activity: | |||||||||
Charges | — | 81 | 279 | 360 | |||||
Cash payments | (14 | ) | — | (302 | ) | (316 | ) | ||
Settled non cash | — | (81 | ) | — | (81 | ) | |||
Reserve balance, September 29, 2019* | $ | 180 | — | 25 | 205 | ||||
*Cash outlays for severance are expected to be substantially paid out over the next 2 years in accordance with the Company's plans and local laws.
**Other includes project expense such as salaries for employees supporting the initiative and consulting expenses.
48
Item 2 — MANAGEMENT’S DISCUSSION AND ANALYSIS OF FINANCIAL CONDITION AND RESULTS OF OPERATIONS
RESULTS OF OPERATIONS
Sales to Customers
Analysis of Consolidated Sales
For the fiscal nine months of 2019, worldwide sales were $61.3 billion, a total increase of 0.2%, including operational growth of 2.9% as compared to 2018 fiscal nine months sales of $61.2 billion. Currency fluctuations had a negative impact of 2.7% for the fiscal nine months of 2019. In the fiscal nine months of 2019, the net impact of acquisitions and divestitures on worldwide operational sales growth was a negative 1.9%.
Sales by U.S. companies were $31.3 billion in the fiscal nine months of 2019, which represented an increase of 0.2% as compared to the prior year. In the fiscal nine months of 2019, the net impact of acquisitions and divestitures on the U.S. operational sales growth was a negative 1.9%. Sales by international companies were $30.0 billion, an increase of 0.2%, including operational growth of 5.7%, offset by a negative currency impact of 5.5% as compared to the fiscal nine months sales of 2018. In the fiscal nine months of 2019, the net impact of acquisitions and divestitures on the international operational sales growth was a negative 1.9%.
In the fiscal nine months of 2019, sales by companies in Europe experienced a decline of 1.6%, which included operational growth of 4.8% offset by a negative currency impact of 6.4%. Sales by companies in the Western Hemisphere, excluding the U.S., experienced a sales decline of 4.5%, which included operational growth of 4.6%, offset by a negative currency impact of 9.1%. Sales by companies in the Asia-Pacific, Africa region achieved growth of 4.3%, including operational growth of 7.2% and a negative currency impact of 2.9%.

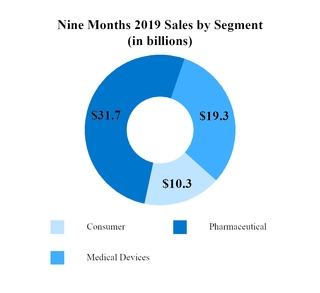
Note: values may have been rounded
49
For the fiscal third quarter of 2019, worldwide sales were $20.7 billion, a total increase of 1.9%, including operational growth of 3.2% as compared to 2018 fiscal third quarter sales of $20.3 billion. Currency fluctuations had a negative impact of 1.3% for the fiscal third quarter of 2019. In the fiscal third quarter of 2019, the net impact of acquisitions and divestitures on worldwide operational sales growth was a negative 2.0%.
Sales by U.S. companies were $10.8 billion in the fiscal third quarter of 2019, which represented an increase of 1.2% as compared to the prior year. In the fiscal third quarter of 2019, the net impact of acquisitions and divestitures on the U.S. operational sales growth was a negative 2.2%. Sales by international companies were $9.9 billion, an increase of 2.6%, including operational growth of 5.4%, offset by a negative currency impact of 2.8% as compared to the fiscal third quarter sales of 2018. In the fiscal third quarter of 2019, the net impact of acquisitions and divestitures on the international operational sales growth was a negative 1.9%.
In the fiscal third quarter of 2019, sales by companies in Europe achieved growth of 1.0%, which included operational growth of 5.2% offset by a negative currency impact of 4.2%. Sales by companies in the Western Hemisphere, excluding the U.S., experienced a sales decline of 4.0%, which included operational growth of 1.0%, offset by a negative currency impact of 5.0%. Sales by companies in the Asia-Pacific, Africa region achieved growth of 7.3%, including operational growth of 7.5% and a negative currency impact of 0.2%.
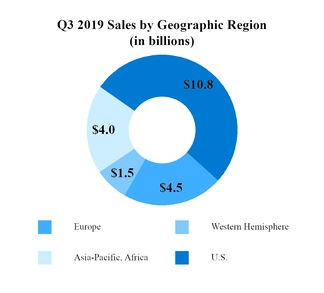

Note: values may have been rounded
50
Analysis of Sales by Business Segments
Consumer
Consumer segment sales in the fiscal nine months of 2019 were $10.3 billion, an increase of 0.1% as compared to the same period a year ago, including operational growth of 3.4% and a negative currency impact of 3.3%. U.S. Consumer segment sales increased by 2.0%. International Consumer segment sales decreased by 1.2%, including an operational increase of 4.3% and a negative currency impact of 5.5%. In the fiscal nine months of 2019, the net impact of acquisitions and divestitures on the Consumer segment operational sales growth was a positive 2.0%.
Major Consumer Franchise Sales — Fiscal Nine Months Ended
(Dollars in Millions) | September 29, 2019 | September 30, 2018 | Total Change | Operations Change | Currency Change | ||||||||||||
Beauty | $ | 3,443 | $ | 3,271 | 5.3 | % | 7.5 | % | (2.2 | )% | |||||||
OTC | 3,249 | 3,186 | 2.0 | 5.0 | (3.0 | ) | |||||||||||
Baby Care | 1,254 | 1,385 | (9.5 | ) | (5.0 | ) | (4.5 | ) | |||||||||
Oral Care | 1,135 | 1,156 | (1.8 | ) | 1.3 | (3.1 | ) | ||||||||||
Women’s Health | 733 | 792 | (7.4 | ) | 0.4 | (7.8 | ) | ||||||||||
Wound Care/Other | 516 | 527 | (2.0 | ) | (0.7 | ) | (1.3 | ) | |||||||||
Total Consumer Sales | $ | 10,331 | $ | 10,317 | 0.1 | % | 3.4 | % | (3.3 | )% | |||||||
Consumer segment sales in the fiscal third quarter of 2019 were $3.5 billion, an increase of 1.6% as compared to the same period a year ago, including operational growth of 3.3% and a negative currency impact of 1.7%. U.S. Consumer segment sales increased by 1.7%. International Consumer segment sales increased by 1.4%, including operational growth of 4.3% offset by a negative currency impact of 2.9%. In the fiscal third quarter of 2019, the net impact of acquisitions and divestitures on the Consumer segment operational sales growth was a positive 2.0%.
Major Consumer Franchise Sales — Fiscal Third Quarter Ended
(Dollars in Millions) | September 29, 2019 | September 30, 2018 | Total Change | Operations Change | Currency Change | ||||||||||||
Beauty | $ | 1,151 | $ | 1,078 | 6.8 | % | 8.1 | % | (1.3 | )% | |||||||
OTC | 1,098 | 1,048 | 4.8 | 6.5 | (1.7 | ) | |||||||||||
Baby Care | 417 | 472 | (11.6 | ) | (9.8 | ) | (1.8 | ) | |||||||||
Oral Care | 379 | 384 | (1.4 | ) | 0.2 | (1.6 | ) | ||||||||||
Women’s Health | 255 | 269 | (5.3 | ) | (1.3 | ) | (4.0 | ) | |||||||||
Wound Care/Other | 168 | 164 | 2.4 | 3.0 | (0.6 | ) | |||||||||||
Total Consumer Sales | $ | 3,469 | $ | 3,415 | 1.6 | % | 3.3 | % | (1.7 | )% | |||||||
The Beauty franchise achieved operational growth of 8.1% as compared to the prior year fiscal third quarter. Growth was primarily driven by sales from the acquisition of Ci:z Holdings Co., Ltd., (DR.CI:LABO) in Japan as well as NEUTROGENA® and AVEENO® products. Growth was partially offset by the divestiture of RoC®.
The OTC franchise achieved operational growth of 6.5% as compared to the prior year fiscal third quarter. Growth was primarily driven by sales from the acquisition of ZARBEES®. Additional contributors to the growth were TYLENOL®, digestive products in India and cough/cold products.
The Baby Care franchise experienced an operational decline of 9.8% as compared to the prior year fiscal third quarter. This was primarily due to prior year comparisons related to the JOHNSON'S® relaunch coupled with competitive pressure in Asia Pacific and declines of wipes in Latin America.
The Oral Care franchise achieved operational growth of 0.2% as compared to the prior year fiscal third quarter primarily driven by the success of new product launches outside the U.S. mostly offset by softness in floss/tapes in the U.S.
51
The Women’s Health franchise experienced an operational decline of 1.3% as compared to the prior year fiscal third quarter driven by liners market decline in Venezuela.
The Wound Care/Other franchise achieved operational growth of 3.0% as compared to the prior year fiscal third quarter. Growth was driven by BAND-AID® Brand Adhesive Bandages and NEOSPORIN® partially offset by the divestiture of COMPEED® outside the U.S.
Pharmaceutical
Pharmaceutical segment sales in the fiscal nine months of 2019 were $31.7 billion, an increase of 3.6% as compared to the same period a year ago, with an operational increase of 6.2% and a negative currency impact of 2.6%. U.S. Pharmaceutical sales increased 2.0% as compared to the same period a year ago. International Pharmaceutical sales increased by 5.7%, including operational growth of 11.7% and a negative currency impact of 6.0%. In the fiscal nine months of 2019, the net impact of acquisitions and divestitures on the Pharmaceutical segment operational sales growth was negligible.
Major Pharmaceutical Therapeutic Area Sales* — Fiscal Nine Months Ended
(Dollars in Millions) | September 29, 2019 | September 30, 2018 | Total Change | Operations Change | Currency Change | ||||||||||||
Total Immunology | $ | 10,428 | $ | 9,778 | 6.7 | % | 8.5 | % | (1.8 | )% | |||||||
REMICADE® | 3,345 | 4,088 | (18.2 | ) | (17.0 | ) | (1.2 | ) | |||||||||
SIMPONI®/ SIMPONI ARIA® | 1,673 | 1,602 | 4.5 | 7.2 | (2.7 | ) | |||||||||||
STELARA® | 4,661 | 3,712 | 25.6 | 27.8 | (2.2 | ) | |||||||||||
TREMFYA® | 742 | 369 | ** | ** | ** | ||||||||||||
Other Immunology | 8 | 7 | 13.7 | 14.4 | (0.7 | ) | |||||||||||
Total Infectious Diseases | 2,547 | 2,502 | 1.8 | 5.5 | (3.7 | ) | |||||||||||
EDURANT®/rilpivirine | 639 | 623 | 2.6 | 8.5 | (5.9 | ) | |||||||||||
PREZISTA®/ PREZCOBIX®/ REZOLSTA®/ SYMTUZA® | 1,566 | 1,460 | 7.3 | 9.9 | (2.6 | ) | |||||||||||
Other Infectious Diseases | 342 | 419 | (18.6 | ) | (14.2 | ) | (4.4 | ) | |||||||||
Total Neuroscience | 4,762 | 4,577 | 4.0 | 7.0 | (3.0 | ) | |||||||||||
CONCERTA®/methylphenidate | 544 | 513 | 6.1 | 9.2 | (3.1 | ) | |||||||||||
INVEGA SUSTENNA®/ XEPLION®/ INVEGA TRINZA®/ TREVICTA® | 2,459 | 2,165 | 13.6 | 16.1 | (2.5 | ) | |||||||||||
RISPERDAL CONSTA® | 528 | 559 | (5.4 | ) | (2.1 | ) | (3.3 | ) | |||||||||
Other Neuroscience | 1,231 | 1,340 | (8.2 | ) | (4.6 | ) | (3.6 | ) | |||||||||
Total Oncology | 7,976 | 7,355 | 8.4 | 12.3 | (3.9 | ) | |||||||||||
DARZALEX® | 2,168 | 1,441 | 50.4 | 55.3 | (4.9 | ) | |||||||||||
IMBRUVICA® | 2,536 | 1,912 | 32.6 | 37.4 | (4.8 | ) | |||||||||||
VELCADE® | 636 | 864 | (26.3 | ) | (22.8 | ) | (3.5 | ) | |||||||||
ZYTIGA®/ abiraterone acetate | 2,118 | 2,712 | (21.9 | ) | (19.1 | ) | (2.8 | ) | |||||||||
Other Oncology | 519 | 426 | 21.6 | 25.9 | (4.3 | ) | |||||||||||
Pulmonary Hypertension | 2,000 | 1,906 | 4.9 | 6.9 | (2.0 | ) | |||||||||||
OPSUMIT® | 1,001 | 892 | 12.2 | 14.9 | (2.7 | ) | |||||||||||
TRACLEER®/ bosentan | 285 | 422 | (32.4 | ) | (31.1 | ) | (1.3 | ) | |||||||||
UPTRAVI® | 611 | 482 | 26.8 | 27.7 | (0.9 | ) | |||||||||||
Other | 103 | 110 | (6.4 | ) | (2.9 | ) | (3.5 | ) | |||||||||
Cardiovascular / Metabolism / Other | 3,936 | 4,426 | (11.1 | ) | (9.8 | ) | (1.3 | ) | |||||||||
XARELTO® | 1,704 | 1,869 | (8.9 | ) | (8.9 | ) | — | ||||||||||
INVOKANA®/ INVOKAMET® | 558 | 653 | (14.6 | ) | (13.4 | ) | (1.2 | ) | |||||||||
PROCRIT®/EPREX® | 607 | 767 | (20.9 | ) | (19.8 | ) | (1.1 | ) | |||||||||
Other | 1,067 | 1,137 | (6.1 | ) | (2.5 | ) | (3.6 | ) | |||||||||
Total Pharmaceutical Sales | $ | 31,650 | $ | 30,544 | 3.6 | % | 6.2 | % | (2.6 | )% | |||||||
52
*Certain prior year amounts have been reclassified to conform to current year presentation
**Percentage greater than 100% or not meaningful
Pharmaceutical segment sales in the fiscal third quarter of 2019 were $10.9 billion, an increase of 5.1% as compared to the same period a year ago, with an operational increase of 6.4% and a negative currency impact of 1.3%. U.S. Pharmaceutical sales increased 4.0% as compared to the same period a year ago. International Pharmaceutical sales increased by 6.8%, including operational growth of 10.0% and a negative currency impact of 3.2%. In the fiscal third quarter of 2019, the net impact of acquisitions and divestitures on the Pharmaceutical segment operational sales growth was negligible.
Major Pharmaceutical Therapeutic Area Sales* — Fiscal Third Quarter Ended
(Dollars in Millions) | September 29, 2019 | September 30, 2018 | Total Change | Operations Change | Currency Change | ||||||||||||
Total Immunology | $ | 3,711 | $ | 3,398 | 9.3 | % | 10.3 | % | (1.0 | )% | |||||||
REMICADE® | 1,136 | 1,379 | (17.6 | ) | (16.9 | ) | (0.7 | ) | |||||||||
SIMPONI®/ SIMPONI ARIA® | 586 | 536 | 9.6 | 10.8 | (1.2 | ) | |||||||||||
STELARA® | 1,698 | 1,310 | 29.6 | 30.9 | (1.3 | ) | |||||||||||
TREMFYA® | 290 | 171 | 69.0 | 70.3 | (1.3 | ) | |||||||||||
Other Immunology | 2 | 2 | (4.4 | ) | (3.0 | ) | (1.4 | ) | |||||||||
Total Infectious Diseases | 839 | 823 | 1.9 | 3.6 | (1.7 | ) | |||||||||||
EDURANT®/rilpivirine | 218 | 202 | 7.9 | 12.1 | (4.2 | ) | |||||||||||
PREZISTA®/ PREZCOBIX®/ REZOLSTA®/ SYMTUZA® | 508 | 490 | 3.7 | 4.4 | (0.7 | ) | |||||||||||
Other Infectious Diseases | 113 | 131 | (13.9 | ) | (12.1 | ) | (1.8 | ) | |||||||||
Total Neuroscience | 1,595 | 1,490 | 7.1 | 8.2 | (1.1 | ) | |||||||||||
CONCERTA®/ methylphenidate | 193 | 157 | 23.5 | 24.3 | (0.8 | ) | |||||||||||
INVEGA SUSTENNA®/ XEPLION®/ INVEGA TRINZA®/ TREVICTA® | 851 | 749 | 13.7 | 15.0 | (1.3 | ) | |||||||||||
RISPERDAL CONSTA® | 167 | 175 | (3.8 | ) | (2.2 | ) | (1.6 | ) | |||||||||
Other Neuroscience | 384 | 409 | (6.6 | ) | (5.8 | ) | (0.8 | ) | |||||||||
Total Oncology | 2,761 | 2,588 | 6.7 | 8.8 | (2.1 | ) | |||||||||||
DARZALEX® | 765 | 498 | 53.5 | 56.6 | (3.1 | ) | |||||||||||
IMBRUVICA® | 921 | 705 | 30.6 | 33.5 | (2.9 | ) | |||||||||||
VELCADE® | 149 | 271 | (44.8 | ) | (44.4 | ) | (0.4 | ) | |||||||||
ZYTIGA®/ abiraterone acetate | 741 | 958 | (22.7 | ) | (21.2 | ) | (1.5 | ) | |||||||||
Other Oncology | 186 | 156 | 18.8 | 21.3 | (2.5 | ) | |||||||||||
Pulmonary Hypertension | 654 | 656 | (0.3 | ) | 0.5 | (0.8 | ) | ||||||||||
OPSUMIT® | 347 | 310 | 11.7 | 13.0 | (1.3 | ) | |||||||||||
TRACLEER®/ bosentan | 65 | 139 | (52.7 | ) | (53.0 | ) | 0.3 | ||||||||||
UPTRAVI® | 210 | 171 | 23.4 | 24.0 | (0.6 | ) | |||||||||||
Other | 31 | 36 | (12.6 | ) | (10.8 | ) | (1.8 | ) | |||||||||
Cardiovascular / Metabolism / Other | 1,316 | 1,391 | (5.4 | ) | (4.8 | ) | (0.6 | ) | |||||||||
XARELTO® | 613 | 612 | 0.1 | 0.1 | — | ||||||||||||
INVOKANA®/ INVOKAMET® | 179 | 190 | (5.8 | ) | (5.0 | ) | (0.8 | ) | |||||||||
PROCRIT®/ EPREX® | 198 | 255 | (22.4 | ) | (22.0 | ) | (0.4 | ) | |||||||||
Other | 325 | 334 | (2.2 | ) | (0.3 | ) | (1.9 | ) | |||||||||
Total Pharmaceutical Sales | $ | 10,877 | $ | 10,346 | 5.1 | % | 6.4 | % | (1.3 | )% | |||||||
*Certain prior year amounts have been reclassified to conform to current year presentation
Immunology products achieved operational growth of 10.3% as compared to the same period a year ago driven by strong uptake of STELARA® (ustekinumab) in Crohn's disease and TREMFYA® (guselkumab) in Psoriasis, expanded indications of
53
SIMPONI ARIA® (golimumab), and U.S. immunology market growth. Immunology was negatively impacted by lower sales of REMICADE® (infliximab) due to increased discounts/rebates and biosimilar competition.
The patents for REMICADE® (infliximab) in certain countries in Europe expired in February 2015. Biosimilar versions of REMICADE® have been introduced in certain markets outside the United States, resulting in a reduction in sales of REMICADE® in those markets. Additional biosimilar competition will likely result in a further reduction in REMICADE® sales in markets outside the United States. In the United States, a biosimilar version of REMICADE® was introduced in 2016, and additional competitors continue to enter the market. Continued infliximab biosimilar competition in the U.S. market will result in a further reduction in U.S. sales of REMICADE®. See Note 11 to the Consolidated Financial Statements for a description of legal matters regarding the REMICADE® patents.
Infectious disease products achieved operational growth of 3.6% as compared to the same period a year ago. Strong sales of SYMTUZA® and the launch of JULUCA® were partially offset by lower sales of PREZISTA® and PREZCOBIX®/REZOLSTA® due to increased competition and loss of exclusivity of PREZISTA® in certain countries outside the U.S.
Neuroscience products achieved operational sales growth of 8.2% as compared to the same period a year ago. Paliperidone long-acting injectables growth was driven by strong sales of INVEGA TRINZA®/TREVICTA® and INVEGA SUSTENNA®/XEPLION® (paliperidone palmitate) and was partially offset by RISPERDAL CONSTA® (risperidone). CONCERTA®/methylphenidate was positively impacted by adjustments to previous reserve estimates.
Oncology products achieved strong operational sales growth of 8.8% as compared to the same period a year ago. Contributors to the growth were strong sales of DARZALEX® (daratumumab) and IMBRUVICA® (ibrutinib) due to increased patient uptake globally. The growth of DARZALEX® (daratumumab) included a comparison to a one-time reimbursement adjustment outside the U.S. in the third quarter of 2018, which positively impacted the third quarter of 2019 by approximately 14.5%.
Growth was negatively impacted from a decline in U.S. sales of ZYTIGA® (abiraterone acetate) driven by generic competition partially offset by increased sales outside the U.S. Additionally, sales from the launch of ERLEADA™ (apalutamide) contributed to the growth. Lower sales of VELCADE® (bortezomib) were due to generic competition.
Pulmonary Hypertension achieved operational sales growth of 0.5% as compared to the same period a year ago. Sales of OPSUMIT® (macitentan) and UPTRAVI® (selexipag) were due to continued market growth and increased share while sales of TRACLEER® (bosentan) were negatively impacted by generics and cannibalization of OPSUMIT®.
Cardiovascular / Metabolism / Other products experienced an operational decline of 4.8% as compared to the same period a year ago. XARELTO® (rivaroxaban) sales volume growth was offset by higher discounts and rebates. Lower sales of INVOKANA®/INVOKAMET® (canagliflozin) were due to share loss from competitive pressure and a safety label update in the U.S. and lower sales of PROCRIT®/ EPREX® (epoetin alfa) were due to biosimilar competition.
54
Medical Devices
The Medical Devices segment sales in the fiscal nine months of 2019 were $19.3 billion, a decrease of 4.9% as compared to the same period a year ago, with an operational decline of 2.4% and a negative currency impact of 2.5%. U.S. Medical Devices sales decreased 3.9%. International Medical Devices sales decreased by 5.8%, including an operational decline of 1.0% and a negative currency impact of 4.8%. In the fiscal nine months of 2019, the net impact of acquisitions and divestitures on the Medical Devices segment operational sales growth was a negative 6.7% of which, the divestitures of LifeScan and ASP had an impact of approximately 5.1% and 1.4%, respectively.
Major Medical Devices Franchise Sales — Fiscal Nine Months Ended
(Dollars in Millions) | September 29, 2019 | September 30, 2018 | Total Change | Operations Change | Currency Change | ||||||||||||
Surgery | $ | 7,059 | $ | 7,314 | (3.5 | )% | (0.4 | )% | (3.1 | )% | |||||||
Advanced | 3,019 | 2,947 | 2.4 | 5.7 | (3.3 | ) | |||||||||||
General | 3,309 | 3,376 | (2.0 | ) | 1.2 | (3.2 | ) | ||||||||||
Specialty | 731 | 991 | (26.2 | ) | (23.9 | ) | (2.3 | ) | |||||||||
Orthopaedics | 6,566 | 6,623 | (0.9 | ) | 1.2 | (2.1 | ) | ||||||||||
Hips | 1,061 | 1,053 | 0.7 | 3.0 | (2.3 | ) | |||||||||||
Knees | 1,085 | 1,110 | (2.2 | ) | (0.2 | ) | (2.0 | ) | |||||||||
Trauma | 2,034 | 2,025 | 0.4 | 2.5 | (2.1 | ) | |||||||||||
Spine & Other | 2,384 | 2,435 | (2.1 | ) | 0.0 | (2.1 | ) | ||||||||||
Vision | 3,483 | 3,420 | 1.8 | 4.1 | (2.3 | ) | |||||||||||
Contact Lenses/Other | 2,559 | 2,486 | 2.9 | 5.4 | (2.5 | ) | |||||||||||
Surgical | 923 | 934 | (1.1 | ) | 0.9 | (2.0 | ) | ||||||||||
Interventional Solutions | 2,223 | 1,960 | 13.4 | 15.9 | (2.5 | ) | |||||||||||
Diabetes Care(1) | — | 1,009 | * | * | * | ||||||||||||
Total Medical Devices Sales | $ | 19,331 | $ | 20,326 | (4.9 | )% | (2.4 | )% | (2.5 | )% | |||||||
*Percentage greater than 100% or not meaningful
(1) LifeScan was divested in the fiscal fourth quarter of 2018
The Medical Devices segment sales in the fiscal third quarter of 2019 were $6.4 billion, a decrease of 3.1% as compared to the same period a year ago, with an operational decline of 2.0% and a negative currency impact of 1.1%. U.S. Medical Devices sales decreased 4.4%. International Medical Devices sales decreased by 1.9%, including operational growth of 0.3% and a negative currency impact of 2.2%. In the fiscal third quarter of 2019, the net impact of acquisitions and divestitures on the Medical Devices segment operational sales growth was a negative 7.3% of which, the divestitures of LifeScan and ASP had an impact of approximately 5.1% and 2.1%, respectively.
55
Major Medical Devices Franchise Sales — Fiscal Third Quarter Ended
(Dollars in Millions) | September 29, 2019 | September 30, 2018 | Total Change | Operations Change | Currency Change | ||||||||||||
Surgery | $ | 2,311 | $ | 2,376 | (2.7 | )% | (1.2 | )% | (1.5 | )% | |||||||
Advanced | 1,010 | 976 | 3.6 | 5.2 | (1.6 | ) | |||||||||||
General | 1,101 | 1,080 | 1.9 | 3.6 | (1.7 | ) | |||||||||||
Specialty | 200 | 320 | (37.4 | ) | (36.5 | ) | (0.9 | ) | |||||||||
Orthopaedics | 2,138 | 2,111 | 1.2 | 2.3 | (1.1 | ) | |||||||||||
Hips | 336 | 330 | 1.7 | 2.9 | (1.2 | ) | |||||||||||
Knees | 344 | 341 | 1.2 | 2.3 | (1.1 | ) | |||||||||||
Trauma | 677 | 654 | 3.5 | 4.7 | (1.2 | ) | |||||||||||
Spine & Other | 778 | 786 | (0.9 | ) | 0.1 | (1.0 | ) | ||||||||||
Vision | 1,193 | 1,132 | 5.4 | 6.1 | (0.7 | ) | |||||||||||
Contact Lenses/Other | 893 | 835 | 7.0 | 7.6 | (0.6 | ) | |||||||||||
Surgical | 299 | 297 | 0.9 | 1.7 | (0.8 | ) | |||||||||||
Interventional Solutions | 741 | 653 | 13.4 | 14.3 | (0.9 | ) | |||||||||||
Diabetes Care(1) | — | 315 | * | * | * | ||||||||||||
Total Medical Devices Sales | $ | 6,383 | $ | 6,587 | (3.1 | )% | (2.0 | )% | (1.1 | )% | |||||||
*Percentage greater than 100% or not meaningful
(1) LifeScan was divested in the fiscal fourth quarter of 2018
The Surgery franchise experienced an operational sales decline of 1.2% as compared to the prior year fiscal third quarter. Operational growth in Advanced Surgery was primarily driven by biosurgery, as well as growth outside the U.S. in energy and endocutter products driven by share gains and new products. Operational growth in General Surgery was primarily driven by growth of wound closure products. The operational decline in Specialty Surgery was primarily driven by the divestiture of the Advanced Sterilization Products (ASP) business partially offset by growth of Mentor products.
The Orthopaedics franchise achieved operational sales growth of 2.3% as compared to the prior year fiscal third quarter. Operational growth in hips was driven by leadership position in the anterior approach, strong market demand for the ACTIS® stem and the KINCISE™ surgical automated system. The growth in knees outside the U.S. from new products was partially offset by U.S. competitive pressure. Trauma growth was due to market growth coupled with the continued uptake of new products. Spine & Other sales were driven by growth in Sports from new products and strong growth in the Asia Pacific region offset by a decline in spine.
The Vision franchise achieved operational sales growth of 6.1% as compared to the prior year fiscal third quarter. Operational growth was primarily driven by the strength of daily disposables lenses in the OASYS® contact lenses category as well as a forward buy ahead of a consumption tax change in Japan. The Surgical operational growth was primarily driven by the strength of cataracts outside the U.S partially offset by competitive pressures in the U.S.
The Interventional Solutions franchise achieved strong operational sales growth of 14.3% as compared to the prior year fiscal third quarter. Strong operational growth in the electrophysiology business was driven by Atrial Fibrillation procedures coupled with strong THERMOCOOL SMARTTOUCH® SF Contact Force Sensing Catheter and diagnostic catheter sales.
56
ANALYSIS OF CONSOLIDATED EARNINGS BEFORE PROVISION FOR TAXES ON INCOME
Consolidated earnings before provision for taxes on income for the fiscal nine months of 2019 was $13.1 billion representing 21.4% of sales as compared to $14.9 billion in the fiscal nine months of 2018, representing 24.3% of sales.
Consolidated earnings before provision for taxes on income for the fiscal third quarter of 2019 was $1.6 billion representing 7.9% of sales as compared to $4.4 billion in the fiscal third quarter of 2018, representing 21.7% of sales.
Cost of Products Sold
Consolidated costs of products sold for the fiscal nine months of 2019 increased to 33.3% from 32.9% of sales as compared to the same period a year ago. Consolidated costs of products sold for the fiscal third quarter of 2019 increased to 33.1% from 32.4% of sales as compared to the same period a year ago. The unfavorable increase in both periods was primarily driven by the negative impact of currency in the Pharmaceutical business. The intangible asset amortization expense for each of the fiscal third quarters of 2019 and 2018 was $1.1 billion. The intangible asset amortization expense for each of the fiscal nine months of 2019 and 2018 was $3.3 billion.
Selling, Marketing and Administrative Expenses
Consolidated selling, marketing and administrative expenses for the fiscal nine months of 2019 decreased to 26.3% from 27.1% of sales as compared to the same period a year ago. The decrease in the fiscal nine months was primarily due to favorable segment mix, planned prioritization in the Consumer business and expense leveraging in the Pharmaceutical business. Consolidated selling, marketing and administrative expenses for the fiscal third quarter of 2019 decreased to 26.0% from 27.3% of sales as compared to the same period a year ago. The decrease in the fiscal third quarter was primarily due to favorable segment mix with a higher percentage of sales coming from the Pharmaceutical business. Additionally, planned prioritization in the Consumer and Medical Devices businesses contributed to the decrease.
Research and Development Expense
Worldwide costs of research and development activities for the fiscal nine months of 2019 increased to 13.3% from 12.3% of sales as compared to the same period a year ago. The increase in the fiscal nine months was due to higher upfront payments, primarily related to argenx and increased investment to advance the pipeline in the Pharmaceutical business as well as increased investment in the Medical Device business related to robotics, digital programs and key growth platforms. Worldwide costs of research and development activities for the fiscal third quarter of 2019 increased to 12.5% from 12.3% of sales as compared to the same period a year ago. The increase in the fiscal third quarter was due to increased investment in the Medical Device business related to robotics, digital programs and key growth platforms.
In-Process Research and Development (IPR&D)
In the fiscal first quarter of 2019, the Company recorded an IPR&D charge of $0.9 billion for the remaining intangible asset value related to the development program of AL-8176, an investigational drug for the treatment of Respiratory Syncytial Virus (RSV) and human metapneumovirus (hMPV) acquired with the 2014 acquisition of Alios Biopharma Inc. The impairment charge was based on additional information, including clinical data, which became available and led to the Company's decision to abandon the development of AL-8176. In the fiscal third quarter of 2018, the Company recorded an impairment charge of $1.1 billion which included a partial impairment charge of $0.8 billion related to the development program of AL-8176 and an impairment charge of $0.3 billion for the discontinuation of the development project for an anti-thrombin antibody associated with the 2015 acquisition of XO1 Limited.
Interest (Income) Expense
Interest (Income) Expense in the fiscal nine months and fiscal third quarter of 2019 was net interest income as compared to an expense in the same periods a year ago. This was primarily due to the positive effect of net investment hedging arrangements and certain cross currency swaps, a lower average debt balance and a higher average interest rate partially offset by a lower average cash, cash equivalents and marketable securities balance. The balance of cash, cash equivalents and current marketable securities was $17.9 billion at the end of the fiscal third quarter of 2019 as compared to $19.4 billion at the end of the fiscal third quarter of 2018. The Company’s debt position was $29.2 billion as of September 29, 2019 as compared to $31.3 billion the same period a year ago.
57
Other (Income) Expense, Net
Other (income) expense, net for the fiscal nine months of 2019 was unfavorable by $2.1 billion as compared to the same period a year ago. This was primarily attributable to the agreement in principle to settle opioid litigation of $4.0 billion partially offset by a gain of $2.0 billion related to the divestiture of the ASP business. In addition the fiscal nine months of 2019 included an equity step-up gain of $0.3 billion related to the Company's previously held equity investment in Ci:z Holdings (Dr. Ci: Labo) and higher unrealized gains on securities of $0.2 billion as compared to the same period a year ago. This was partially offset by higher litigation expense of $0.1 billion in the fiscal nine months of 2019 as litigation expense was $0.8 billion in the fiscal nine months of 2019 as compared to $0.7 billion in the fiscal nine months of 2018. Additionally, the fiscal nine months of 2018 included a reversal of a contingent liability of $0.2 billion. The fiscal nine months of 2018 included divestiture gains of $0.4 billion, primarily NIZORAL®.
Other (income) expense, net for the fiscal third quarter of 2019 was unfavorable by $4.2 billion as compared to the same period a year ago. This was primarily attributable to the agreement in principle to settle opioid litigation of $4.0 billion included in the fiscal third quarter of 2019 and a reversal of a contingent liability of $0.2 billion included in the fiscal third quarter of 2018.
EARNINGS BEFORE PROVISION FOR TAXES BY SEGMENT
Income before tax by segment of business for the fiscal nine months were as follows:
Income Before Tax | Segment Sales | Percent of Segment Sales | ||||||||||||||||||||
(Dollars in Millions) | September 29, 2019 | September 30, 2018 | September 29, 2019 | September 30, 2018 | September 29, 2019 | September 30, 2018 | ||||||||||||||||
Consumer | $ | 1,800 | $ | 1,887 | $ | 10,331 | $ | 10,317 | 17.4 | % | 18.3 | % | ||||||||||
Pharmaceutical | 5,786 | 10,193 | 31,650 | 30,544 | 18.3 | 33.4 | ||||||||||||||||
Medical Devices | 6,078 | 3,642 | 19,331 | 20,326 | 31.4 | 17.9 | ||||||||||||||||
Segment earnings before tax | 13,664 | 15,722 | 61,312 | 61,187 | 22.3 | 25.7 | ||||||||||||||||
Less: Expenses not allocated to segments (1) | 554 | 845 | ||||||||||||||||||||
Worldwide income before tax | $ | 13,110 | $ | 14,877 | $ | 61,312 | $ | 61,187 | 21.4 | % | 24.3 | % | ||||||||||
(1) Amounts not allocated to segments include interest (income) expense and general corporate (income) expense.
Income before tax by segment of business for the fiscal third quarters were as follows:
Income Before Tax | Segment Sales | Percent of Segment Sales | ||||||||||||||||||||
(Dollars in Millions) | September 29, 2019 | September 30, 2018 | September 29, 2019 | September 30, 2018 | September 29, 2019 | September 30, 2018 | ||||||||||||||||
Consumer | $ | 653 | $ | 510 | $ | 3,469 | $ | 3,415 | 18.8 | % | 14.9 | % | ||||||||||
Pharmaceutical | (222 | ) | 2,876 | 10,877 | 10,346 | (2.0 | ) | 27.8 | ||||||||||||||
Medical Devices | 1,392 | 1,267 | 6,383 | 6,587 | 21.8 | 19.2 | ||||||||||||||||
Segment earnings before tax | 1,823 | 4,653 | 20,729 | 20,348 | 8.8 | 22.9 | ||||||||||||||||
Less: Expenses not allocated to segments (1) | 176 | 230 | ||||||||||||||||||||
Worldwide income before tax | $ | 1,647 | $ | 4,423 | $ | 20,729 | $ | 20,348 | 7.9 | % | 21.7 | % | ||||||||||
(1) Amounts not allocated to segments include interest (income) expense and general corporate (income) expense.
Consumer Segment
The Consumer segment income before tax as a percent of sales in the fiscal nine months of 2019 was 17.4% versus 18.3% for the same period a year ago. The fiscal nine months of 2019 included litigation expense of $0.2 billion and higher intangible asset amortization expense of $0.1 billion as compared to the prior year offset by a gain of $0.3 billion related to the Company's previously held equity investment in Ci:z Holdings (Dr Ci: Labo) and planned prioritization in selling, marketing and administrative expense. The fiscal nine months of 2018 included a gain of $0.3 billion related to the divestiture of NIZORAL®. The Consumer segment income before tax as a percent of sales in the fiscal third quarter of 2019 was 18.8% versus 14.9% for the same period a year ago. The increase in the income before tax as a percent of sales in the fiscal third
58
quarter of 2019 was primarily driven by planned prioritization in selling, marketing and administrative expense as compared to the prior year.
Pharmaceutical Segment
The Pharmaceutical segment income before tax as a percent of sales in the fiscal nine months of 2019 was 18.3% versus 33.4% for the same period a year ago. The decrease in the income before tax as a percent of sales for the fiscal nine months of 2019 as compared to the prior year was primarily due to higher litigation expense of $4.3 billion, primarily due to the agreement in principle to settle opioid litigation of $4.0 billion, higher cost of products sold due to the negative impact of currency and increased spending in research and development primarily due to a $0.3 billion upfront payment to argenx. This was partially offset by $0.2 billion of higher unrealized gains on securities, a lower in-process research and development charge of $0.2 billion, lower Actelion acquisition related costs and leveraging in selling, marketing and administrative as compared to the prior year. In addition, the fiscal nine months of 2018 included a contingent liability reversal of $0.2 billion and a gain of $0.1 billion related to the PANCREASE® divestiture. The Pharmaceutical segment income before tax as a percent of sales in the fiscal third quarter of 2019 was (2.0)% versus 27.8% for the same period a year ago. The decrease in the income before tax as a percent of sales for the fiscal third quarter of 2019 was primarily due to the agreement in principle to settle opioid litigation of $4.0 billion and the negative impact of currency recorded in cost of products sold in the third quarter of 2019. The fiscal third quarter of 2018 included an in-process research and development charge of $1.1 billion partially offset by a contingent liability reversal of $0.2 billion.
Medical Devices Segment
The Medical Devices segment income before tax as a percent of sales in the fiscal nine months of 2019 was 31.4% versus 17.9% for the same period a year ago. The increase in the income before tax as a percent of sales for the fiscal nine months was primarily attributable to a gain of $2.0 billion related to the divestiture of the ASP business, lower litigation expense of $0.3 billion, lower restructuring charges of $0.2 billion and lower intangible asset amortization expense of $0.1 billion. This was partially offset by increased investment in robotics and digital solutions. The Medical Devices segment income before tax as a percent of sales in the fiscal third quarter of 2019 was 21.8% versus 19.2% for the same period a year ago. The increase in the income before tax as a percent of sales for the fiscal third quarter was primarily attributable to project and investment prioritization, partially offset by investments in robotics and digital solutions as compared to the prior year.
Restructuring
In the second quarter of 2018, the Company announced plans to implement actions across its global supply chain that are intended to enable the Company to focus resources and increase investments in critical capabilities, technologies and solutions necessary to manufacture and supply its product portfolio of the future, enhance agility and drive growth. The Company expects these supply chain actions will include expanding its use of strategic collaborations, and bolstering its initiatives to reduce complexity, improving cost-competitiveness, enhancing capabilities and optimizing its network. Discussions regarding specific future actions are ongoing and are subject to all relevant consultation requirements before they are finalized. In total, the Company expects these actions to generate approximately $0.6 to $0.8 billion in annual pre-tax cost savings that will be substantially delivered by 2022. The Company expects to record pre-tax restructuring charges of approximately $1.9 to $2.3 billion. In the fiscal third quarter of 2019, the Company recorded a pre-tax charge of $128 million, of which $20 million is included in cost of products sold and $39 million is included in other (income) expense. Restructuring charges of $0.6 billion have been recorded since the restructuring was announced.
See Note 12 to the Consolidated Financial Statements for additional details related to the restructuring.
Provision for Taxes on Income
For discussion on the provision for taxes refer to Note 5 to the Consolidated Financial Statements.
Swiss Tax Reform
On September 28, 2018 the Swiss Parliament approved the Federal Act on Tax Reform and AHV Financing (TRAF). On May 19, 2019 a public referendum was held in Switzerland that approved the federal reform proposals. In the fiscal third quarter of 2019, the Swiss Federal Council enacted TRAF. TRAF will become effective on January 1, 2020. The Federal transitional provisions of TRAF allow companies, under certain conditions, to adjust their tax basis adjustments to fair value (i.e., “step-up”) which is used for tax depreciation and amortization purposes resulting in a deduction over the transitional period. The
59
adjustment to the Company’s asset tax basis will require review and approval by the tax authorities.
TRAF also provides for parameters which enable the Swiss cantons to establish localized tax rates and regulations for companies. The new cantonal tax parameters include favorable tax benefits for patents and an additional research and development tax deduction. The cantonal transitional provisions of TRAF are also expected to allow companies to elect either 1) tax basis step-up similar to the Federal transition benefit or 2) alternative statutory tax rate for a period not to exceed 5 years. The Company currently has operations located in various Swiss cantons and enactment may not be uniform in both the substantive nature of the legislation and the timing of enactment. The cantons are expected to implement new local legislation by January 1, 2020 or the new federal law will be directly applied.
The Company recorded a net tax benefit of $0.4 billion related to this federal and certain cantonal enactments in the fiscal third quarter of 2019 consisting of the following provisions:
• | approximately $360 million tax expense relating to the remeasurement of Swiss deferred tax assets and liabilities for the change in Federal and cantonal tax rates, where enactment has occurred by September 29, 2019. |
• | a $1.2 billion deferred tax asset related to the estimated value of a Federal tax basis step-up of the Company’s Swiss subsidiaries’ assets. |
• | approximately $450 million deferred tax expense relating to U.S. deferred tax liabilities relating to the Global Intangible Low-Taxed Income (GILTI) tax resulting from the remeasurement of the Swiss deferred tax assets and liabilities and the new deferred tax asset for the Federal step-up. See the 2018 Form 10-K for more discussion on the Company’s policy election to account for GILTI under the deferred method. |
As of September 29, 2019, two cantons in which the Company operates have enacted legislation in response to the TRAF. The Company is currently assessing the elective cantonal transition provisions including discussions with local taxing authorities on the application of the new law. The Company has recorded an estimated impact of the transitional provisions based on the best available information for cantons where enactment has occurred. The estimated cantonal benefit that has been recorded is not material to the results of the Company. The amounts recorded in the current fiscal quarter do not include the impact of cantonal law changes including the transitional provisions which have not yet been enacted. These enactments, which are expected to occur in the fiscal fourth quarter of 2019 or early 2020, may result in a material impact to the future results of the Company.
Due to the uncertain nature of the unenacted cantonal legislation, the Company is still assessing the potential transitional provision scenarios it may elect upon enactment and cannot provide a reasonably reliable range on the financial impact upon enactment. However, other than the possible impact of recording the transitional provisions and changes of canton tax rates to the deferred balances, the Company does not believe that TRAF will have a material impact to the Company’s ongoing consolidated effective tax rate beginning in fiscal 2020.
LIQUIDITY AND CAPITAL RESOURCES
Cash Flows
Cash and cash equivalents were $16.2 billion at the end of the fiscal third quarter of 2019 as compared with $18.1 billion at the end of fiscal year 2018. The primary sources and uses of cash that contributed to the $1.9 billion decrease were approximately $17.0 billion of cash generated from operating activities offset by $4.9 billion net cash used by investing activities and $13.9 billion net cash used by financing activities. In addition, the Company had $1.7 billion in marketable securities at the end of the fiscal third quarter of 2019 and $1.6 billion at the end of 2018.
Cash flow from operations of $17.0 billion was the result of $11.1 billion of net earnings and $7.0 billion of non-cash expenses and other adjustments primarily for depreciation and amortization, stock-based compensation and asset write-downs (primarily related to the Alios IPR&D asset) and an increase in accounts payable, accrued liabilities and other liabilities of $4.3 billion. This was reduced by $1.2 billion related to an increase in accounts receivable, an increase in inventories, an increase in other current and non-current assets, and net gain on sale of assets/businesses of $2.1 billion (primarily related to the ASP divestiture) and $2.1 billion for the deferred tax provision.
Investing activities use of $4.9 billion of cash was primarily used for acquisitions of $5.6 billion primarily related to the acquisitions of Auris Health, Inc. and Dr. Ci:Labo, additions to property, plant and equipment of $2.2 billion and $0.2 billion from the net purchases of investments. Investing activities also included a source of $3.1 billion of proceeds from the disposal of assets/businesses, primarily ASP.
60
Financing activities use of $13.9 billion of cash was primarily used for dividends to shareholders of $7.4 billion, the repurchase of common stock of $6.3 billion and the net retirement of short and long term debt of $0.9 billion. Financing activities also included a source of $0.7 billion from proceeds from stock options exercised/employee withholding tax on stock awards and other.
The Company has access to substantial sources of funds at numerous banks worldwide. In September 2019, the Company secured a new 364-day Credit Facility. Total credit available to the Company under the facility, which expires on September 10, 2020, approximates $10.0 billion. Interest charged on borrowings under the credit line agreement is based on either bids provided by banks, the prime rate or London Interbank Offered Rates (LIBOR), plus applicable margins. Commitment fees under the agreement are not material.
On December 17, 2018, the Company announced that its Board of Directors approved a share repurchase program, authorizing the Company to purchase up to $5.0 billion of the Company's shares of common stock. Any shares acquired will be available for general corporate purposes. The Company financed the share repurchase program through available cash. As of September 29, 2019, $5.0 billion was repurchased under the program and the program was completed.
In the fiscal third quarter of 2019, the Company's notes payable and long-term debt was in excess of cash, cash equivalents and marketable securities. As of September 29, 2019, the net debt position was $11.3 billion as compared to the prior year of $11.9 billion. The Company anticipates that operating cash flows, the ability to raise funds from external sources, borrowing capacity from existing committed credit facilities and access to the commercial paper markets will continue to provide sufficient resources to fund operating needs, including the agreement in principle to settle opioid litigation to be potentially paid over multiple years. Additionally, as a result of the TCJA, the Company has access to its cash outside the U.S. at a significantly reduced cost. The Company monitors the global capital markets on an ongoing basis and from time to time may raise capital when market conditions are favorable.
As discussed in Note 5 to the Consolidated Financial Statements, the Company expects substantial completion of the audit and settlement of the related tax liabilities within the next nine months. The settlement of this tax audit may have a material impact on the Company’s future cash flows in the period that the liability is paid.
Dividends
On July 15, 2019, the Board of Directors declared a regular cash dividend of $0.95 per share, payable on September 10, 2019 to shareholders of record as of August 27, 2019.
On October 17, 2019, the Board of Directors declared a regular cash dividend of $0.95 per share, payable on December 10, 2019 to shareholders of record as of November 26, 2019. The Company expects to continue the practice of paying regular quarterly cash dividends.
OTHER INFORMATION
New Accounting Pronouncements
Refer to Note 1 to the Consolidated Financial Statements for new accounting pronouncements.
Economic and Market Factors
The Company operates in certain countries where the economic conditions continue to present significant challenges. The Company continues to monitor these situations and take appropriate actions. Inflation rates and currency exchange rates continue to have an effect on worldwide economies and, consequently, on the way the Company operates. The Company has accounted for operations in Venezuela and Argentina as highly inflationary, as the prior three-year cumulative inflation rate surpassed 100%. This did not have a material impact to the Company's results in the period. In the face of increasing costs, the Company strives to maintain its profit margins through cost reduction programs, productivity improvements and periodic price increases.
In June 2016, the United Kingdom (U.K.) held a referendum in which voters approved an exit from the European Union (E.U.), commonly referred to as “Brexit” and in March 2017 the U.K. formally started the process for the U.K. to leave the E.U. Given the lack of comparable precedent, it is unclear what financial, trade, regulatory and legal implications the
61
withdrawal of the U.K. from the E.U. will have. Brexit creates global political and economic uncertainty, which may cause, among other consequences, volatility in exchange rates and interest rates, additional cost containment by third-party payors and changes in regulations. However, the Company currently does not believe that these and other related effects will have a material impact on the Company’s consolidated financial position or operating results. As of September 29, 2019, the business of the Company’s U.K. subsidiaries represented less than 3% of both the Company’s consolidated assets and fiscal nine months revenue, respectively.
Governments around the world consider various proposals to make changes to tax laws, which may include increasing or decreasing existing statutory tax rates. A change in statutory tax rate in any country would result in the revaluation of the Company’s deferred tax assets and liabilities related to that particular jurisdiction in the period in which the new tax law is enacted. This change would result in an expense or benefit recorded to the Company’s Consolidated Statement of Earnings. The Company closely monitors these proposals as they arise in the countries where it operates. Changes to the statutory tax rate may occur at any time, and any related expense or benefit recorded may be material to the fiscal quarter and year in which the law change is enacted. For discussion on Federal Act on Tax Reform and AHV Financing (Swiss Tax Reform) see Provision for Taxes on Income in Management's Discussion and Analysis of Financial Condition and Results of Operations.
The Company faces various worldwide health care changes that may continue to result in pricing pressures that include health care cost containment and government legislation relating to sales, promotions and reimbursement of health care products.
Changes in the behavior and spending patterns of purchasers of health care products and services, including delaying medical procedures, rationing prescription medications, reducing the frequency of physician visits and foregoing health care insurance coverage, may continue to impact the Company’s businesses.
The Company also operates in an environment increasingly hostile to intellectual property rights. Firms have filed Abbreviated New Drug Applications or Biosimilar Biological Product Applications with the FDA, initiated Inter Partes Review proceedings in the United States Patent and Trademark Office, or otherwise challenged the coverage and/or validity of the Company's patents, seeking to market generic or biosimilar forms of many of the Company’s key pharmaceutical products prior to expiration of the applicable patents covering those products. In the event the Company is not successful in defending the patent claims challenged in these actions, generic or biosimilar versions of the products at issue may be introduced to the market, resulting in the potential for substantial market share and revenue losses for those products, and which may result in a non-cash impairment charge in any associated intangible asset. There is also a risk that one or more competitors could launch a generic or biosimilar version of the product at issue following regulatory approval even though one or more valid patents are in place. For further information, see the discussion on “REMICADE® Related Cases” and “Litigation Against Filers of Abbreviated New Drug Applications” in Note 11 to the Consolidated Financial Statements.
Item 3 — QUANTITATIVE AND QUALITATIVE DISCLOSURES ABOUT MARKET RISK
There has been no material change in the Company’s assessment of its sensitivity to market risk since its presentation set forth in Item 7A, “Quantitative and Qualitative Disclosures About Market Risk,” in its Annual Report on Form 10-K for the fiscal year ended December 30, 2018.
Item 4 — CONTROLS AND PROCEDURES
Disclosure controls and procedures. At the end of the period covered by this report, the Company evaluated the effectiveness of the design and operation of its disclosure controls and procedures. The Company’s disclosure controls and procedures are designed to ensure that information required to be disclosed by the Company in the reports that it files or submits under the Securities Exchange Act is recorded, processed, summarized and reported, within the time periods specified in the SEC’s rules and forms. Disclosure controls and procedures include, without limitation, controls and procedures designed to ensure that information required to be disclosed by the Company in the reports that it files or submits under the Securities Exchange Act is accumulated and communicated to the Company’s management, including its principal executive and principal financial officers, or persons performing similar functions, as appropriate, to allow timely decisions regarding required disclosure. Alex Gorsky, Chairman and Chief Executive Officer, and Joseph J. Wolk, Executive Vice President, Chief Financial Officer, reviewed and participated in this evaluation. Based on this evaluation, Messrs. Gorsky and Wolk concluded that, as of the end of the period covered by this report, the Company’s disclosure controls and procedures were effective.
Internal control. During the period covered by this report, there were no changes in the Company’s internal control over financial reporting that have materially affected, or are reasonably likely to materially affect, the Company’s internal control over financial reporting.
62
The Company is implementing a multi-year, enterprise-wide initiative to integrate, simplify and standardize processes and systems for the human resources, information technology, procurement, supply chain and finance functions. These are enhancements to support the growth of the Company’s financial shared service capabilities and standardize financial systems. This initiative is not in response to any identified deficiency or weakness in the Company’s internal control over financial reporting. In response to this initiative, the Company has and will continue to align and streamline the design and operation of its financial control environment.
Part II — OTHER INFORMATION
Item 1 — LEGAL PROCEEDINGS
The information called for by this item is incorporated herein by reference to Note 11 included in Part I, Item 1, Financial Statements (unaudited) — Notes to Consolidated Financial Statements.
Item 2 — UNREGISTERED SALES OF EQUITY SECURITIES AND USE OF PROCEEDS
(c) Purchases of Equity Securities by the Issuer and Affiliated Purchasers.
On December 17, 2018, the Company announced that its Board of Directors approved a share repurchase program, authorizing the Company to purchase up to $5.0 billion of the Company's Common Stock. Share repurchases take place from time to time on the open market or through privately negotiated transactions. The repurchase program was completed in the fiscal third quarter of 2019.
The following table provides information with respect to Common Stock purchases by the Company during the fiscal third quarter of 2019. The repurchases below also include the stock-for-stock option exercises that settled in the fiscal third quarter.
Fiscal Month Period | Total Number of Shares Purchased(1) | Avg. Price Per Share | Total Number of Shares Purchased as Part of Publicly Announced Plans or Programs(2) | Maximum Number of Shares that May Yet Be Purchased Under the Plans or Programs | |||||||
July 1, 2019 through July 28, 2019 | 3,966,771 | 129.63 | 1,799,829 | — | |||||||
July 29, 2019 through August 25, 2019 | 8,267,553 | 130.73 | 7,388,151 | — | |||||||
August 26, 2019 through September 29, 2019 | 253,971 | 128.30 | 253,971 | — | |||||||
Total | 12,488,295 | 9,441,951 | |||||||||
(1) | During the fiscal third quarter of 2019, the Company repurchased an aggregate of 12,488,295 shares of Johnson & Johnson Common Stock in open-market transactions, of which 9,441,951 shares were purchased pursuant to the repurchase program that was publicly announced on December 17, 2018, and of which 3,046,344 shares were purchased in open-market transactions as part of a systematic plan to meet the needs of the Company’s compensation programs. |
(2) | As of September 29, 2019, the share repurchase program was completed with an aggregate of 37,181,268 shares were purchased for a total of $5.0 billion since the inception of the repurchase program announced on December 17, 2018. |
63
Item 6 — EXHIBITS
Exhibit 31.1 Certification of Chief Executive Officer under Rule 13a-14(a) of the Securities Exchange Act pursuant to Section 302 of the Sarbanes-Oxley Act of 2002 — Filed with this document.
Exhibit 31.2 Certification of Chief Financial Officer under Rule 13a-14(a) of the Securities Exchange Act pursuant to Section 302 of the Sarbanes-Oxley Act of 2002 — Filed with this document.
Exhibit 32.1 Certification of Chief Executive Officer pursuant to Section 906 of the Sarbanes-Oxley Act of 2002 — Furnished with this document.
Exhibit 32.2 Certification of Chief Financial Officer pursuant to Section 906 of the Sarbanes-Oxley Act of 2002 — Furnished with this document.
Exhibit 101:
EX-101.INS | Instance Document - the instance document does not appear in the Interactive Data File because its XBRL tags are embedded within the Inline XBRL document | |
EX-101.SCH | Inline XBRL Taxonomy Extension Schema | |
EX-101.CAL | Inline XBRL Taxonomy Extension Calculation Linkbase | |
EX-101.LAB | Inline XBRL Taxonomy Extension Label Linkbase | |
EX-101.PRE | Inline XBRL Taxonomy Extension Presentation Linkbase | |
EX-101.DEF | Inline XBRL Taxonomy Extension Definition Document | |
Exhibit 104: | Cover Page Interactive Data File––the cover page interactive data file does not appear in the Interactive Data File because its XBRL tags are embedded within the Inline XBRL document. | |
64
SIGNATURES
Pursuant to the requirements of the Securities Exchange Act of 1934, the registrant has duly caused this report to be signed on its behalf by the undersigned thereunto duly authorized.
JOHNSON & JOHNSON (Registrant) | |
Date: October 28, 2019 | By /s/ J. J. WOLK |
J. J. WOLK | |
Executive Vice President, Chief Financial Officer (Principal Financial Officer) | |
Date: October 28, 2019 | By /s/ R. A. KAPUSTA |
R. A. KAPUSTA | |
Controller (Principal Accounting Officer) | |
65
Similar companies
See also ELI LILLY & Co - Annual report 2024 (10-K 2024-12-31) Annual report 2025 (10-Q 2025-06-30)See also PFIZER INC - Annual report 2024 (10-K 2024-12-31) Annual report 2025 (10-Q 2025-03-30)
See also AbbVie Inc. - Annual report 2024 (10-K 2024-12-31) Annual report 2025 (10-Q 2025-06-30)
See also NOVO NORDISK A S
See also Merck & Co., Inc. - Annual report 2024 (10-K 2024-12-31) Annual report 2025 (10-Q 2025-06-30)