Maxar Technologies Inc. - Annual Report: 2021 (Form 10-K)
UNITED STATES
SECURITIES AND EXCHANGE COMMISSION
Washington, D.C. 20549
FORM 10-K
(Mark One) | |
☒ | ANNUAL REPORT PURSUANT TO SECTION 13 OR 15(D) OF THE SECURITIES EXCHANGE ACT OF 1934 |
For the fiscal year ended December 31, 2021 | |
or | |
☐ | TRANSITION REPORT PURSUANT TO SECTION 13 OR 15(D) OF THE SECURITIES EXCHANGE ACT OF 1934 |
For the transition period from to | |
Commission file number: 001-38228
Maxar Technologies Inc.
Delaware | 83-2809420 | |||
(State or Incorporation) | (IRS Employer Identification Number) |
1300 W. 120th Avenue, Westminster, Colorado | 80234 | |
(Address of principal executive offices) | (Zip Code) |
303-684-7660 |
(Registrant’s telephone number, including area code) |
Securities registered pursuant to Section 12(b) of the Act:
Title of Each Class | Trading Symbols | Name of Each Exchange on Which Registered |
Common Stock par value of $0.0001 per share | MAXR | New York Stock Exchange Toronto Stock Exchange |
Securities registered pursuant to section 12(g) of the Act:
None
Indicate by check mark if the registrant is a well-known seasoned issuer, as defined in Rule 405 of the Securities Act. Yes ☒ No ☐
Indicate by check mark if the registrant is not required to file reports pursuant to Section 13 or Section 15(d) of the Exchange Act. Yes ☐ No ☒
Indicate by check mark whether the registrant (1) has filed all reports required to be filed by Section 13 or 15(d) of the Securities Exchange Act during the preceding 12 months (or for such shorter period that the registrant was required to file such reports), and (2) has been subject to such filing requirements for the past 90 days.
Yes ☒ No ☐
Indicate by check mark whether the registrant has submitted electronically every Interactive Data File required to be submitted pursuant to Rule 405 of Regulation S-T (§ 232.405 of this chapter) during the preceding 12 months (or for such shorter period that the registrant was required to submit such files). Yes ☒ No ☐
Indicate by check mark whether the registrant is a large accelerated filer, an accelerated filer, a non-accelerated filer, a smaller reporting company, or an emerging growth company. See the definitions of “large accelerated filer,” “accelerated filer,” “smaller reporting company”, and emerging growth company in Rule 12b-2 of the Exchange Act.
Large accelerated filer ☒ | Accelerated filer ☐ | Non-accelerated filer ☐ | Smaller reporting company ☐ Emerging Growth Company ☐ |
If an emerging growth company, indicate by check mark if the registrant has elected not to use the extended transition period for complying with any new or revised financial accounting standards provided pursuant to Section 13(a) of the Exchange Act. ☐
Indicate by check mark whether the registrant has filed a report on and attestation to its management’s assessment of the effectiveness of its internal control over financial reporting under Section 404(b) of the Sarbanes-Oxley Act (15 U.S.C. 7262(b)) by the registered public accounting firm that prepared or issued its audit report. ☒
Indicate by check mark whether the registrant is a shell company (as defined in Rule 12b-2 of the Act). Yes ☐ No ☒
At June 30, 2021, the aggregate market value of the registrant’s common stock, par value of $0.0001 per share, held by non-affiliates of the registrant was approximately $2,890 million (based upon the closing sale price of the common stock on June 30, 2021 on The New York Stock Exchange).
As of February 16, 2022, there were 72,808,326 shares of the registrant’s common stock, par value of $0.0001 per share, outstanding.
DOCUMENTS INCORPORATED BY REFERENCE
Portions of the registrant’s definitive proxy statement relating to its 2022 annual meeting of stockholders are incorporated by reference into Part III of this Annual Report on Form 10-K where indicated. The 2022 proxy statement will be filed with the U.S. Securities and Exchange Commission within 120 days after the end of the fiscal year to which this report relates.
Maxar Technologies Inc.
Annual Report on Form 10-K
For the Fiscal Year Ended December 31, 2021
Item Number | Table of Contents | ||
PART I | |||
1. | 3 | ||
1A. | 18 | ||
1B. | 42 | ||
2. | 42 | ||
3. | 43 | ||
4. | 43 | ||
PART II | |||
5. | 43 | ||
6. | 43 | ||
7. | Management’s Discussion and Analysis of Financial Condition and Results of Operations | 44 | |
7A. | 63 | ||
8. | 64 | ||
9. | Changes in and Disagreements with Accountants on Accounting and Financial Disclosure | 124 | |
9A. | 124 | ||
9B. | 124 | ||
9C. | Disclosure Regarding Foreign Jurisdictions that Prevent Inspections | 124 | |
PART III | |||
10. | 125 | ||
11. | 125 | ||
12. | Security Ownership of Certain Beneficial Owners and Management and Related Stockholder Matters | 125 | |
13. | Certain Relationships and Related Transactions and Director Independence | 125 | |
14. | 125 | ||
PART IV | |||
15. | 125 | ||
16. | 130 | ||
131 | |||
1
Cautionary Note Regarding Forward-Looking Statements
This Annual Report on Form 10-K contains “forward-looking statements” as defined in Section 27A of the United States Securities Act of 1933, as amended, and Section 21E of the United States Securities Exchange Act of 1934, as amended (the “Exchange Act”). Forward-looking statements usually relate to future events and anticipated revenues, earnings, cash flows or other aspects of our operations or operating results. Forward-looking statements are often identified by the words “believe,” “expect,” “anticipate,” “plan,” “intend,” “foresee,” “should,” “would,” “could,” “may,” “estimate,” “outlook” and similar expressions, including the negative thereof. The absence of these words, however, does not mean that the statements are not forward-looking. These forward-looking statements are based on our current expectations, beliefs and assumptions concerning future developments and business conditions and their potential effect on us. While management believes that these forward-looking statements are reasonable as and when made, there can be no assurance that future developments affecting us will be those that we anticipate.
All of our forward-looking statements involve risks and uncertainties (some of which are significant or beyond our control) and assumptions that could cause actual results to differ materially from our historical experience and our present expectations or projections. Known material factors that could cause actual results to differ materially from those contemplated in the forward-looking statements include those set forth in Part I, Item 1A, “Risk Factors” and elsewhere in this Annual Report on Form 10-K. We caution you not to place undue reliance on any forward-looking statements, which speak only as of the date hereof. We undertake no obligation to publicly update or revise any of our forward-looking statements after the date they are made, whether as a result of new information, future events or otherwise, except to the extent required by law.
*****
Unless stated otherwise or the context otherwise requires, references to the terms “Company,” “Maxar,” “we,” “us,” and “our” to refer collectively to Maxar Technologies Inc. and its consolidated subsidiaries.
2
ITEM 1. BUSINESS
Maxar is a provider of comprehensive space solutions and secure, precise, geospatial intelligence. Maxar helps government and commercial customers monitor, understand and navigate our changing planet; deliver global broadband communications; and explore and advance the use of space. Our approach combines decades of deep mission understanding and a proven commercial and defense foundation to deploy solutions and deliver insights with speed, scale and cost effectiveness. Maxar’s stock trades on the New York Stock Exchange (“NYSE”) and Toronto Stock Exchange (“TSX”) under the symbol “MAXR.”
Segments
We serve our customers and organize our businesses through the following two operating and reportable segments:
| ● | Earth Intelligence—a global leader in high-resolution, high accuracy Earth imagery and other geospatial data sourced from our own advanced satellite constellation and third-party providers to our public sector and enterprise customers, as well as a provider of advanced geospatial information, applications and analytic services for national security and commercial solutions. |
| ● | Space Infrastructure—a supplier of space-based infrastructure, robotics, subsystems and information solutions to satellite operators and government agencies. |
The following is a description of our reportable segments.
Earth Intelligence
Overview
In the Earth Intelligence segment, we are a global leader in high-resolution space-based Earth observation imagery products and analytics. We launched the world’s first high-resolution commercial imaging satellite in 1999 and currently operate a four-satellite imaging constellation, providing us with over two decades and approximately 137 petabytes of imagery over our history (referred to as our “Image Library”) of the highest resolution, commercially available imagery. Our imagery solutions provide customers with timely, accurate and mission-critical information about our changing planet and support a wide variety of government and enterprise applications, including mission planning, mapping and analysis, environmental monitoring, disaster management, crop management, oil and gas exploration and infrastructure management. We continue to innovate as demands for new satellite technology and advanced analytic tools increase. The U.S. government is the largest customer of our Earth Intelligence segment through the EnhancedView Follow On contract (“EnhancedView Contract”), Global Enhanced GEOINT Delivery (“G-EGD”) and One World Terrain (“OWT”) programs and various classified and unclassified contract vehicles. In the commercial satellite Earth observation industry, we are a leader across U.S. government agencies, international government agencies and enterprise customer verticals.
We also provide geospatial services that combine imagery, analytic expertise and innovative technology to deliver intelligence solutions to customers. Our approximately 1,700 cleared personnel support analytic solutions that accurately document change and enable geospatial modeling and analysis that help predict where events will occur. Our primary customer of geospatial services is the U.S. government, but we also support intelligence requirements for other U.S. allied governments, global development organizations and enterprise customers. Through our acquisition of Vricon, Inc. (“Vricon”) in 2020, we are also a global leader in satellite-derived 3D data for defense and intelligence markets, with software and products that enhance 3D mapping, Earth intelligence data, military simulation and training and precision-guided munitions. See Note 5, “Business Combination” to the Consolidated Financial Statements in Part II, Item 8, “Financial Statements and Supplementary Data” for additional detail on the Vricon acquisition.
3
Our Offerings
Customers can license our imagery and data archives or place custom orders to task our satellites for a specific area of interest. We process our imagery to varying levels according to our customers’ specifications and deliver our products using the distribution methods and subscription services that are designed to best suit our customers’ needs. We offer a number of Earth Intelligence solutions, including:
| ● | Satellite access—direct collection and access to our satellite constellation anywhere in the world. The Direct Access Program (“DAP”) enables customers to directly task our satellites using the customer’s own ground station for secure, real-time imagery acquisition and downlink. The Rapid Access Program (“RAP”) allows customers to virtually control our constellation through priority tasking, predictable access and imaging operations with a web interface, while we own and manage the ground infrastructure. Additionally, we support the U.S. government with direct tasking utilizing our integrated imagery production, distribution and operations with U.S. government systems. This offering is currently contracted under our existing EnhancedView Contract. In November 2021, the National Reconnaissance Office (“NRO”) announced the release of the Electro-Optical Commercial Layer (“EOCL”) contract Request for Proposal (“RFP”), which is expected to replace the existing EnhancedView Contract. In December 2021, we submitted our response to the EOCL RFP and we anticipate the NRO to award EOCL contracts prior to the expiration of the EnhancedView Contract, including remaining option years. |
| ● | Geospatial foundation—highest quality foundational satellite imagery, basemaps and 3D data over any location on Earth. This foundation allows our customers to fully understand, immerse and strategically plan outcomes before setting foot in a specific location or to immediately use our robust imagery for their artificial intelligence (“AI”) / machine learning (“ML”) models, real-world metaverse applications and/or training purposes. Our Vivid imagery basemaps stitch high-resolution satellite imagery together into a single cloudless global view that provides an accurate, consistent and actionable foundation to support the leading mapping apps, global-scale environmental governance analytics and risk management decisions. High-definition (“HD”) imagery leverages our proprietary HD technology to improve visual clarity of our native 30cm imagery to 15cm, giving analysts and ML models cleaner and more accurate data to analyze and deliver results. This technology allows us to provide best-in-class accuracy of the world’s terrain in GPS-denied environments or when ground conditions are not ideal for human assessment or navigation. Analysis-Ready Data (“ARD”) is preprocessed time-series stacks of imagery that are aligned and produced at a set standard to provide templated imagery and associated meta data for change detection, mapping and monitoring use cases. Our Precision3D offerings leverage our over two decades high-resolution Image Library to construct an accurate, consistent and fully immersive 3D visualizations at global scale, including 3D surface models, 3D vectors, digital surface models and digital terrain models. |
| ● | Precision mapping—GIS-ready datasets for expedited analysis. These offerings include Persistent-Change Monitoring (“PCM”), BaseVue and Human Landscape. PCM leverages our Image Library and ML models running on our approximately 3.8 million square kilometer daily take to identify change indicators, historical patterns of development and infrastructure changes and provide actionable insights to our customers. BaseVue is the global standard for land classification, including for natural resource management and environmental impact monitoring. Human Landscape utilizes key human geography features to enable analysts to better understand and develop responses that reduce operating costs and enable timely decision making. |
| ● | On-demand intelligence—industry-leading technology, data and expertise to help solve the most complex geospatial challenges. We offer a variety of subscription-based services that maximize the value of our imagery, information products and analytic outputs for a diverse set of customer needs. Our flexible subscription options include cloud-based access to our global image archive, in-house tools to search, exploit and share imagery and simplified integration for existing workflows. These offerings include SecureWatch, Spatial On Demand, Crow’s Nest, WeatherDesk, SeaStar Information Service and our analytic reports. SecureWatch is a subscription SaaS offering that provides customers a cloud-based source |
4
| of near real-time global imagery basemaps, optical and radar imagery and analytics on features (e.g. roads, railways) and objects (e.g. cars, planes). This includes supporting the U.S. government with G-EGD. |
| ● | Geospatial services—We provide advanced geospatial information and analytic services to national security and enterprise customers that combine Maxar imagery and other sources of geospatial data, such as low-resolution satellite imagery, radar, weather and oceanographic data, elevation and social media, to reveal insights that help our customers make better decisions. We also develop applications to support global Intelligence, Surveillance and Reconnaissance (“ISR”) missions with constellation modeling, simulation and mission management, secure ground systems, data analytics to automate object detection, feature extraction, mission planning and predictive analytics. We deploy these services through various cloud and on-premise computing platforms. Our intellectual property portfolio, including U.S. and foreign patents, and Small Business Innovation Research (“SBIR”) Phase III data rights, supports the unique technology we provide to our customers. |
Additionally, we support people, organizations and initiatives dedicated to improving the health and sustainability of our planet. Through our purpose partners, we contribute geospatial data and expertise to nonprofits that significantly benefit from using our data to achieve their missions. These purpose partners include the Amazon Conservation Team, Jane Goodall Institute, International Justice Mission, Team Rubicon and Humanitarian OpenStreetMap Team. With our open data program, when crises occur, we support humanitarian organizations and communities with critical information to assist response efforts. The Maxar News Bureau is a partnership program with trusted media organizations around the world. We provide satellite imagery as visual evidence of ground truth to promote global transparency and expose injustice. Access to our high-resolution satellite imagery has enabled journalists to accurately report on areas that are too remote or dangerous to visit or are otherwise inaccessible.
Our Constellation
As of December 31, 2021, we operated a constellation of four in-orbit and fully commissioned satellites: GeoEye-1, WorldView-1, WorldView-2 and WorldView-3. Our annual collection capacity is approximately 1.4 billion square kilometers. We have collected, and have available for use, approximately 137 petabytes in our Image Library.
We re-evaluate the depreciable lives of our satellites annually based on established methodologies used for accounting purposes. The lives we assign for depreciation purposes are typically shorter than the lives we use for planning purposes and our history shows that in most cases the estimated useful lives of our satellites have increased from the initial lives determined upon launch.
The following table summarizes the primary characteristics of the in-orbit and fully-commissioned satellites in our constellation as of December 31, 2021:
Satellite | Launch Date | Expected End of Depreciable Life | Best Ground Resolution | Orbital Altitude (kilometers) | ||||
WorldView-3 | August 2014 | Q1 2026 | 31-centimeters black and white, or color 1.24-meter multi-spectral | 618 | ||||
WorldView-2 | October 2009 | Q4 2023 | 46-centimeters black and white, or color 1.84-meter multi-spectral | 770 | ||||
WorldView-1 | September 2007 | Q4 2023 | 50-centimeters panchromatic | 496 | ||||
GeoEye-1 | September 2008 | Q3 2023 | 41-centimeters black and white, or color 1.64-meter multi-spectral | 681 |
5
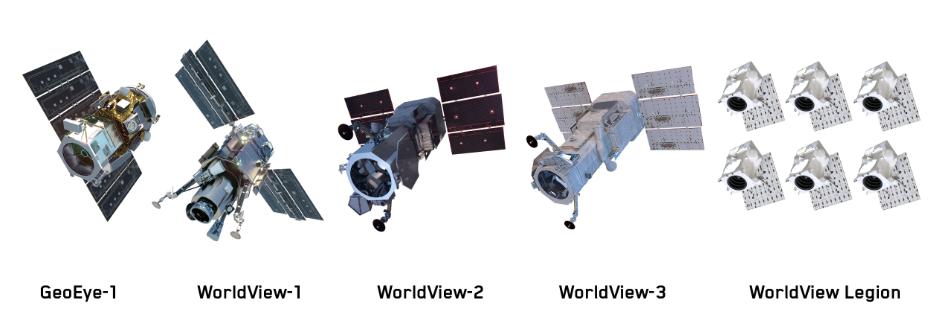
WorldView Legion will be a fleet of six high performing satellites for which our Space Infrastructure segment is acting as prime contractor. With a first launch planned in June to July of 2022, we expect that WorldView Legion, in addition to our current constellation, will revisit rapidly changing areas up to 15 times per day, an increase from four times per day currently, which will more than triple both our capacity to collect 30 cm class imagery and our overall capacity in high demand areas.
Our satellites have advanced technical capabilities, such as maneuverability, size of collection area, collection speed, revisit time, resolution, accuracy and spectral diversity. Additionally, our satellites are designed, manufactured and operated in the U.S. for assurance of U.S. national security missions and data protection.
We procure insurance to protect us from the risks associated with our satellite operations, including the partial or total loss of the functional capacity of the satellite. We insure satellites in our constellation to the extent that insurance is available at acceptable premiums. As of December 31, 2021, we maintained the following insurance coverage on our in-orbit and fully-commissioned satellite constellation:
Satellite | Policy Period | Coverage | |||
WorldView-3 | 10/2021-10/2022 | $ | 255 | ||
WorldView-2 | 10/2021-10/2022 | 220 | |||
WorldView-1 | 10/2021-10/2022 | 220 | |||
GeoEye-1 | 10/2021-10/2022 | 38 | |||
Additionally, as of December 31, 2021, we have procured insurance for our WorldView Legion satellite launches of $520 million. These policies cover the launches plus the first year in orbit. Following the first year in orbit, we will seek to obtain in-orbit coverage similar to the coverage we currently have on our in-orbit and fully-commissioned satellite constellation noted in the table above.
Competitive Conditions and Trends in Industry Demands
Our Earth Intelligence business operates in a highly competitive and rapidly growing industry. Our major existing and potential competitors for our Earth Intelligence business include commercial satellite imagery companies, state-owned imagery providers, aerial imagery companies, free sources of imagery, unmanned aerial vehicles and companies that provide geospatial analytic information and services to the U.S. government, including defense prime contractors.
We compete on the basis of several factors, including: the technical capabilities of our satellites, such as size of collection area, collection speed, revisit time, resolution, accuracy and spectral diversity; satellite availability for tasked orders; the size, comprehensiveness and relevance of our Image Library; on-demand platforms and tools that enable customers to easily access and integrate imagery; value-added services, including harnessing advancements in ML by
6
applying computer vision and pattern analysis technology to geospatial problems; and derivative products such as 3D models and map vector data.
The Earth observation market includes the collection and processing of optical and non-optical imagery data of the Earth. Specifically, the market is segmented into Data, Value-Added Services (“VAS”), Information Products and Big Data Analytics. The Data segment consists of raw imagery transmitted from the satellite to the ground station and products, such as stereo imaging and basic corrections (radiometric and geometric). VAS includes processing through layering or data fusion (such as with traffic information and street names). Big Data Analytics includes statistical analysis, change detection and predictive modeling using large quantities of imagery and meta-data overlays to provide insights over a given period of time.
Our Earth Intelligence business provides Earth observation services to customers in a variety of sectors, including defense and intelligence, energy and natural resources, industrials, social media, mapping, managed living resources (such as agriculture and forestry), public authorities, services (such as finance, insurance, news and media) and weather. Providers of imagery and data in this market generally compete on resolution, accuracy, revisit frequency, delivery (cloud versus traditional) and pricing.
Euroconsult reports that the commercial market for Earth observation data was $1.6 billion in 2020 and is forecasted to top $2.5 billion by 2030, a compound annual growth rate of 4%. According to Euroconsult, defense represents approximately 70% of the Earth observation data, and sales to non-U.S. defense markets are forecasted to be the most significant driver of revenue growth, driven by higher revisit constellations with higher resolutions. Euroconsult reports the commercial market for Earth observation VAS was $2.5 billion in 2020 and is forecasted to top $5 billion by 2030, a compound annual growth rate of 7%. We believe it is increasingly likely that value for the Earth observation services will be driven by downstream services and AI-enabled data analytics.
In addition to the demands for commercial Earth observation data and VAS, we believe our Earth Intelligence offerings address a number of multi-billion dollar military use-cases and sectors, including 3D mapping, precision guided munitions and military simulation and virtual training. Additionally, as we further develop our 3D offerings, we see additional commercial market opportunities for our data and services, particularly within the immersive 3D environments of the augmented reality (“AR”)/virtual reality (“VR”) accessed metaverse. As consumers spend more time in virtual or AR environments for education, gaming, entertainment, news, networking, shopping and more, our global 3D models can help bridge the physical and digital worlds with increased accuracy and realism.
Space Infrastructure
Overview
In the Space Infrastructure segment, we provide solutions for communications, Earth observation, remote sensing, on-orbit servicing, robotic assembly and space exploration. We address a broad spectrum of needs for our customers, including mission systems engineering, product design, spacecraft manufacturing, assembly, integration and testing. Our principal customers in the Space Infrastructure segment are commercial satellite operators and government agencies worldwide. Our approach combines proven success gained over six decades in the industry with the nimbleness and agility of a smaller space company.
Our Offerings
Our products, which are designed and manufactured in the U.S., include:
| ● | Communications and imaging satellites and payloads; |
| ● | Platforms for space exploration and hosting instruments for Earth science; |
| ● | Space subsystems for power, propulsion and communication; |
| ● | Satellite ground systems and support services; |
7
| ● | Space-based remote sensing-solutions; |
| ● | Space robotics; and |
| ● | Defense systems. |
Spacecraft
Today, more than 287 custom Maxar-built spacecraft, including 81 low Earth orbit (“LEO”) satellites, have launched with a combined 2,850 years of service, the majority of the spacecraft are highly complex Geosynchronous Equatorial Orbit (“GEO”) satellites for global communications customers.
Maxar continues as a world leader in commercial GEO communication satellites and a global leader in commercial satellite manufacturing. With three decades of on-orbit heritage, our 1300 spacecraft platform is the world’s most popular GEO satellite; 90 spacecraft are currently in service, providing 99.9993% uptime availability for our customers. We continue to provide a high level of value and partnership to communications customers around the globe. Key platform features include a scalable, lightweight and high-strength structure, fuel-efficient attitude and station-keeping subsystems, high-efficiency and reliable solar arrays and batteries and advanced command and control subsystems. A growing application for commercial geostationary communication satellites is the delivery of data-centric applications (such as consumer broadband, in-flight communication, maritime and 4G/5G cellular backhaul) via high-capacity spot beam satellites commonly referred to as high throughput satellites (or “HTS”). We introduced the first HTS satellite in 2005, which used the 1300 bus, and believe it offers the highest capability for the cost. Maxar is building JUPITER 3, a transformational Ultra High Density Satellite, for Hughes Network Systems (“Hughes”) to be designated EchoStar XXIV. This satellite is expected to be the world’s largest commercial communications satellite when it launches, and will power future generations of Hughes consumer, enterprise and aeronautical services across the Americas.
In addition to continued leadership in the commercial communications sector, we collaborate closely with customers to design and deliver smaller satellites to address growing demand for LEO and medium Earth orbit (“MEO”) constellations. We believe Maxar’s LEO capabilities will be effective for applications that require a multiple satellite constellation of identical satellites produced in a cost-efficient manner.
The 1300 platform is key to our continued and growing partnership with NASA as well. The Psyche mission is a journey to a unique metal asteroid, named 16 Psyche, that appears to be the exposed metal core of an early planet–a building block of a solar system. The spacecraft bus leverages the 1300 platform and solar electric propulsion system, the highly efficient SPT-140. In addition, Maxar is hosting NASA’s Tropospheric Emissions: Monitoring of Pollution (“TEMPO”)— a commercially hosted pollution monitoring payload on a commercial communications satellite Maxar is building for satellite operator Intelsat. By hosting payloads on its commercial satellites, Maxar can help government agencies obtain access to space for instruments, sensors and other small missions without the cost of building a dedicated spacecraft. Similarly, the hosted payload helps commercial customers share the cost of the satellite bus, launch and operations.
Competitive Conditions and Trends in Industry Demands
Our principal customers in the Space Infrastructure segment are commercial satellite operators and government agencies worldwide.
We sell our products and technologies in a highly competitive industry and we compete on the basis of cost, reliability, design life and technological capabilities and efficiencies. Our primary competitors for satellite manufacturing contracts are: The Boeing Company, Lockheed Martin Corporation and Northrop Grumman Corporation in the United States; Thales S.A. and Airbus Defence and Space, a subsidiary of the Airbus Group, in Europe; and Mitsubishi Electric Corporation in Japan. Additionally, we face competition from newer entrants. In addition, many of our competitors are
8
larger and have greater resources than we do. We may also face competition in the future from emerging low-cost competitors in India, Russia and China.
GEO satellites track with the rotation of the Earth and remain over a fixed point over the Earth’s surface. GEO satellites cover more area from a higher vantage point to tend to carry more advanced sensor or communication suites, as used in broad area communications and global-scale weather payloads. Due to this unique property of their orbit, GEO orbit slots are limited, which motivates operators to maximize the use of their slot, leading to generally larger satellites to support the required power and bandwidth, as well as a longer design life to maximize return on investment. Due to their greater distance from earth; however, there is increased latency.
The satellite industry has undergone a significant change with the proliferation of LEO satellites, which have been primarily used for both Earth observation and communications payloads. Typically, LEO constellation satellites are cheaper to launch as they are significantly smaller and require less fuel to reach orbit. Additionally, due to the lower orbital altitude, LEO observation satellites enable higher resolution imagery. This factor also enables LEO communication satellites to reduce latency but require a much larger constellation to ensure coverage over a given area as unlike GEO satellites, LEO satellites move in and out of view of ground locations as they complete their orbit. In addition to altitude class, satellites are classified by functions, such as communications or Earth observation.
Euroconsult projects satellite demand will experience a four and half-fold increase over the next ten years. While LEO and MEO are expected to account for the majority of the demand, Euroconsult expects an average of 13 GEO commercial satellite orders per year over the next ten years, representing one-third of the total market value. According to Euroconsult, the total market for manufacturing and launch services is expected to reach $320 billion over the next decade, a 39% increase from the previous decade of $230 billion in revenue.
LEO proliferation is expected to greatly increase access to space, thus enabling new commercial customers across diversified industries including oil & gas, insurance, agriculture and asset management firms, as well as nonprofit organizations, to benefit from satellite imagery.
Discontinued Operations
On April 8, 2020, we completed the sale of our former Canadian subsidiary (“MDA Business”) to Neptune Acquisition Inc., a corporation existing under the laws of the Province of British Columbia and an affiliate of Northern Private Capital Ltd. See Note 4, “Discontinued Operations”, to the Consolidated Financial Statements in Part II, Item 8, “Financial Statements and Supplementary Data” for additional information regarding our sale of the MDA Business.
Industry Overview
Large and Growing Addressable Market
We believe that there is potential for growth among three key components of our addressable market: the U.S. government, other governments and commercial customers. For both the U.S. and other governments, drivers of growth include persistent global security threats, defense budgets, demand for high-quality imagery and value-added services and a focus on space as an investment. We believe that the U.S. government is interested in expanding the use of commercial alternatives to owned assets and that other governments present an opportunity for growth. We seek to align our products and services with the U.S. Department of Defense (“DoD”)’s National Defense Strategy needs, as well as growing international defense and intelligence demand. For civil customers, in particular NASA, growth is being driven by space exploration programs such as Artemis and Earth science projects. For commercial customers, drivers of growth include strong demand for 3D imagery and more frequent imagery refreshes, as well as insights driven by AI and ML, space-based remote sensing, GEO replacement demand and LEO communications programs.
Diverse Solutions for Diverse End-Market Users
While traditionally spending in space has been dominated by military defense programs and the communications industry, the proliferation of technology and cheaper access to space has led to a diversification in end-market users.
9
ML, AI and cloud computing have given rise to multiple use cases across industries, such as mobility and logistics, insurance, finance, ESG, non-governmental organizations and emerging technologies in simulation, gaming, AR/VR and the metaverse. Concurrently, geopolitical competition in space as a contested domain is leading to further investment by global militaries. We have evolved with this changing environment to serve a multitude of customers.
Government Investment in Space Programs
With more than half of our revenues coming from U.S. government customers, we expect that our Space Infrastructure and Earth Intelligence segments will benefit from growing defense and space infrastructure budgets. We expect the proliferation of space-based intelligence, surveillance and reconnaissance and communications to drive increased government investments in the sector through the mid-2020s.
Global
Euroconsult reports that government space budgets reached $92.5 billion in 2021, an 8% increase over 2020 figures. Additionally, Euroconsult reports the gap between civil and defense space budgets is decreasing, with civil budgets totaling $53.5 billion and defense space programs totaling $38.9 billion in 2021. Euroconsult expects world defense spending to average over 2.5% growth per year until 2030, driven by increasing government defense budgets, an emphasis on space security and a generalized trend of the militarization of space.
United States
In the U.S., there is a concerted effort by the government to accelerate space investment. According to the Congressional Research Service, the President’s fiscal year (“FY”) 2022 budget requested $15.3 billion for the National Security Space (“NSS”) programs, representing growth of 13% from the aggregate funding for NSS programs of $13.5 billion for FY 2021. On December 20, 2019, with the enactment of the FY 2020 National Defense Authorization Act, the U.S. Space Force (“USSF”) was established. The mission of the USSF is to organize, train and equip space forces in order to protect the U.S. and allied interests in space and to provide space capabilities to the joint force.
The NSS budget generally excludes funding for the NRO and NGA. Specific funding levels for these organizations, which are long-term historical customers of our Earth Intelligence segment, are generally classified. However, the NRO and NGA are included in the funding for the National Intelligence Program (“NIP”). The aggregate funding for the NIP was $60.2 billion in FY 2019, $62.7 billion in FY 2020 and $60.8 billion in FY 2021. The NIP funding request for FY 2022 is $62.3 billion. Additionally, the aggregate funding for the Military Intelligence Program (“MIP”) was $21.5 billion in FY 2019, $23.1 billion in FY 2020 and $23.3 billion in FY 2021. The MIP funding request for FY 2022 is $23.3 billion.
Furthermore, NASA requested $24.8 billion in FY 2022, an increase of 7% from FY 2021. The NASA budget further highlights an effort by the government to invest in space exploration and development, with $8.3 billion of the total allocated for deep space exploration systems and space technology. These include the key components of OSAM-1 and the Artemis program that will send astronauts to the Moon and beyond, including the Lunar Gateway.
Growth Strategy
Our vision is to hold leading positions in each of the sectors we serve. We aim to achieve this by applying innovative technologies and capabilities that provide value to our customers across their entire value chain, including components, subsystems, systems, data and services. Specific elements of our strategy across our two segments include:
Earth Intelligence
Driving revenue growth through improvements in our products— we seek to improve and develop new Earth intelligence products with WorldView Legion by productizing technologies and derivative content developed in support of individual customer contracts, such as using more artificial intelligence and machine learning to extract features, detect objects and detect change in our satellite imagery and complementary content. We believe we provide imagery
10
with better than three times the accuracy of the nearest small-sat competitor and we believe that our accuracy advantage is even greater in areas where we have leveraged our 3D and elevation capabilities. We believe we will be able to provide even greater quality imagery and with higher revisit rates upon deployment of our WorldView Legion constellation. The revisit rate and increase in capacity enables a clearer understanding of on ground conditions, allowing for more real time, actionable analysis to deliver insights on rapidly changing environments and populations, while providing for more frequent monitoring for defense and intelligence applications, enhanced emergency responsiveness and maritime surveillance, among other applications. We have developed technology used to enhance the quality and usability of imagery (e.g. eliminate atmospheric distortions, increase positional accuracy, improved interpretability, etc.), create information derivatives (e.g. road vectors, material types, land classification, etc.), fuse multiple types of content (e.g. Internet of Things, optical imagery, synthetic aperture radar imagery, radio frequency information, vectors, social media, etc.), to detect change, understand patterns of life and gain early warning of trending events. We believe this type of high resolution, highly accurate collection capacity will power wide-area, artificial intelligence and machine learning modeling, sensor-to-shooter applications and a reference globe for AR/VR metaverse applications. Additionally, we believe our resolution and accuracy are key enablers for deriving highly accurate and lifelike 3D models, which will allow customers to transition from 2D to 3D capabilities that address critical missions such as GPS-denied navigation, digital twin simulations, synthetic and real-world training environments, autonomous vehicle routing and telco network planning. We believe that creating standard products using this technology will grow our product-based revenue with customers in the technology, defense and intelligence, civil government and global development organization sectors.
Expanding our relationship with the U.S. government—the U.S. government is the largest customer of our Earth Intelligence segment through the EnhancedView Contract, G-EGD and OWT programs and various classified and unclassified contract vehicles. Demand for geospatial intelligence and services continues to grow given the geopolitical environment and the confluence of high-performance computing and machine learning algorithms that allow for insights to be extracted from ever greater levels of data being produced by Earth observation sensors and national and commercial satellite assets. The U.S. government has expressed interest in increasingly relying on commercial partners to harness the rapid pace of commercial innovation more effectively, including the continued use of geospatial data given cost affordability and advances in technology that provide high quality imagery. We seek to grow our business with the U.S. government by leveraging the investments we have made across our capability set, including in ML and AI and our strong record of historic performance.
Growing our installed base and penetration of international defense and intelligence customers—we currently provide service to U.S.-allied nations through our DAP, RAP, SecureWatch, Precision 3D products. These customers use our imagery in their civil and intelligence related missions. Our imagery and services are either complementary to national assets owned by these countries, or in some cases defer the need for a country to invest in owned and operated national assets. We believe there are many prospective customers that have both the mission need and budget for our services which we seek to add to our installed base. We also seek to further penetrate existing customers through the provision of additional data and services. Lastly, we believe there are opportunities to provide our services to U.S. allied nations who might seek a complement to national capabilities in geospatial analytics. Our strategy focuses on those countries that currently have deep and longstanding relationships with our Earth Intelligence segment and other close U.S. allies.
Growing with and expanding our installed base among enterprise customers—we have over 400 enterprise customers that use our data in their products and applications across a variety of industries including technology, telecom, transportation, mining, mapping, social media and oil and gas. The confluence of high-performance computing and ML algorithms are allowing for insights to be extracted from ever greater quantities of imagery and meta data, which in turn is driving innovation across our customer base. We expect this trend to continue, and we seek to grow with our existing customers as well as to grow our install-base in new industry verticals by leveraging our sector leading imagery capabilities. Furthermore, we believe our capabilities in ML, AI and Big Data Analytics products will position us to sell additional solutions and services to our commercial customers.
Providing products that leverage machine learning and artificial intelligence— AI and ML enable us to extract greater insight from our geospatial data to deliver actionable intelligence to our customers. We have continued to refine and improve our approach to AI and ML, which benefit from our large volumes of historical training data and high quality
11
imagery. Productization of this capability will enable delivery of higher value, enriched geospatial data that we expect will facilitate deeper penetration of the U.S. government, international governments and commercial markets.
Delivering 3D products to global defense, intelligence and commercial customers – through Maxar’s acquisition of Vricon, we are expanding the demand for global scale 3D products. 3D products allow decision makers to understand their operational environment in 3D – developing new insights that enable them to make better, faster decisions. We see a growing opportunity to sell 3D data and software products to the military and intelligence community to support virtual training environments and provide better information to the warfighter. U.S. and allied defense and intelligence customers are seeking solutions to support intelligence fusion, maneuver and other mission requirements. We also see significant opportunity with our commercial customers as they look for more accurate 3D geodata to deliver their products through new mediums like AR and VR. Additionally, we have entered into license arrangements related to certain consumer applications. The current investment in 5G networks and Internet of Things provides a unique opportunity to deliver network operators a better data solution to improve their future networks. Additional use cases continue to grow as 3D products and precision data sets become better understood.
Space Infrastructure
Driving revenue through improvement in our products and manufacturing and program capabilities— we are developing differentiated capabilities that are designed for future space exploration, including propulsion, power and robotics. We believe these elements will be critical to helping our customers operate in an increasingly contested space environment and in achieving successful space exploration missions. We are also developing our satellite architectures and manufacturing capabilities as we strive to assure that we can successfully fulfill both government and commercial customer requirements on future programs, including high volume / low mix and variable volume / high mix programs. We plan to team with providers of digital payload technology to enhance our offering if our customers express interest in it. We are also developing relationships across the supply chain to assure that we can seamlessly provide a broad-breadth of mission sets to our customers. Finally, we are working to transform our operations (e.g. location strategy, workforce shaping, technology and systems investment and CAS / FAR compliance) so that we can address a larger set of opportunities across our government and commercial customers.
Growing our U.S. and international civil exposure—we have a long history with civil space programs dating back to the Apollo missions. Current NASA programs include the Power Propulsion Element for the Lunar Gateway, OSAM-1, Psyche and TEMPO. We have also built robotic arms on six of NASA’s Mars rovers and landers. We seek to leverage our investments and expertise in propulsion, power and robotics, as well as our strong legacy of performance, when pursuing further civil work in the U.S. and abroad.
Deepening our penetration of U.S. national programs—to date, we have won several classified and unclassified study contracts with U.S. defense and intelligence customers. We seek to further penetrate these markets by utilizing our flexible satellite architectures, design and engineering capabilities and commercial business practices—all of which we believe can create compelling value propositions.
Providing flexible platforms to our commercial customers—we currently provide components, subsystems and system architectures to our customers for communications and Earth observation satellites in LEO, MEO and GEO orbits. In communications, we offer flexible platforms across various architecture platforms and mission payloads from standard analog to high throughput, and we are investing in digital solutions. In Earth observation, we also offer flexible solutions across various architecture platforms and mission payloads, including electro-optic. Our goal is to be positioned well to compete for future single satellite or full constellation build orders from our customers, across a wide range of the architectures, payloads or Earth orbit chosen to fulfill mission requirements.
Government Contracts and Compliance with Government Regulations
Our operations are heavily regulated under various federal, state, local and international laws. Our operations in the U.S. government market are subject to significant government regulation. We contract with numerous U.S. government agencies and entities, including branches of the U.S. military and NASA. We must comply with, and are affected by, laws and regulations relating to the formation, administration and performance of U.S. government and other
12
governments’ contracts, including foreign governments. Compliance with legislation or regulations promulgated by these authorities could result in material adverse effects on our capital expenditures, earnings and competitive position. In addition, noncompliance with legislation or regulations promulgated by these authorities could result in limitations on, or the suspension or revocation of, our licenses or registrations, the termination or loss of contracts or the imposition of contractual damages, civil fines or criminal penalties, any of which could have a material adverse effect on our business, financial condition and results of operations. Furthermore, any government policy changes, which may be substantial, could increase regulatory uncertainty. The adoption or modification of laws or regulations relating to our business could limit or otherwise adversely affect the manner in which we currently conduct our business. In addition, the manner in which regulations or legislation in these areas may be interpreted and enforced cannot be precisely determined, which in turn could have an adverse effect on our business, financial condition and results of operations. Additional information about the government regulations affecting our business and the risks relating to government contracts and regulations appears in "Risk Factors" in Item 1A of this Annual Report on Form 10-K.
U.S. Government Contracts
All of our reportable segments have contracts with various governmental entities, which are concentrated in a small number of primary contracts. The U.S. government may terminate or suspend our contracts, including the EnhancedView Contract with the U.S. government in our Earth Intelligence segment, at any time with or without cause. The EnhancedView Contract includes three option years that commenced on September 1, 2020. The second option year was exercised on July 15, 2021 for a one-year term ending on August 31, 2022. The final option year, if exercised by the U.S. government, has a term from September 1, 2022 through July 12, 2023. In November 2021, the NRO announced the release of the EOCL RFP, which is expected to replace the existing EnhancedView Contract. In December 2021, we submitted our response to the EOCL RFP and anticipate the NRO to award EOCL contracts prior to the expiration of the EnhancedView Contract, including remaining option years. Any changes in the size, scope or term of the EnhancedView Contract, or any award we receive for the EOCL, could impact our satellite replenishment strategy and our ability to repay or refinance our long-term debt. Although our U.S. government contracts generally involve fixed annual minimum commitments, such commitments, along with all other contracts with the U.S. government, are subject to annual Congressional appropriations and the federal budget process and as a result, the U.S. government may not continue to fund these contracts at current or anticipated levels. The loss or reduction in scope of any one of our primary U.S. government contracts would materially reduce our revenue and adversely impact our operating results and competitive position.
Foreign Operations
Our international contracts may include industrial cooperation agreements requiring specific in-country purchases, investments, manufacturing agreements or other financial obligations, known as offset obligations, and provide for penalties in the event we fail to meet such requirements.
Environmental Regulations
Our operations are regulated under various federal, state, local and international laws governing the environment, including laws governing the discharge of pollutants into the soil, air and water, the management and disposal of hazardous substances and wastes and the cleanup of contaminated sites. We have infrastructure in place to ensure that our operations are in compliance with all applicable environmental regulations. We do not believe that the costs of compliance with these laws and regulations will have a material adverse effect on our capital expenditures, operating results or competitive position. The imposition of more stringent standards or requirements under environmental laws or regulations or a determination that we are responsible for the release of hazardous substances at our sites could result in expenditures in excess of amounts currently estimated to be required for such matters. We have been designated, along with numerous other companies, as a potentially responsible party for the clean-up of several hazardous waste sites. Based on available information, we do not believe that any costs incurred in connection with such sites will have a material adverse effect on our financial condition, results of operations, capital expenditures or competitive position.
13
There can be no assurance that additional environmental matters will not arise in the future, or that costs will not be incurred with respect to sites at which no problem is currently known.
Resources
Intellectual Property
We own a substantial intellectual property portfolio that includes many U.S. and foreign patents, as well as many U.S. and international trademarks, service marks, domain names and copyrights. We actively pursue internal development of intellectual property. In addition to our patent portfolio, we own other intellectual property such as unpatented trade secrets, know-how, data and software. Additionally, we rely on licenses of certain intellectual property to conduct our business operations, including certain proprietary rights to and from third parties. While our intellectual property rights in the aggregate are important to our operations, we do not believe that any particular trade secret, patent, trademark, copyright, license or other intellectual property right is of such importance that its loss, expiration or termination would have a material effect on our business.
Raw Materials
Our businesses are generally engaged in limited manufacturing activities and have minimal near-term exposure to fluctuations in the supply of raw materials. For those businesses that manufacture and sell products and systems, most of the value that we provide is labor oriented, such as design, engineering, assembly and test activities. In manufacturing our products, we use our own production capabilities as well as third-party suppliers and subcontractors. Certain aspects of our manufacturing activities require relatively scarce raw materials or specialty component parts; occasionally, we have experienced difficulty in our ability to procure raw materials, components, sub-assemblies and other supplies required in our manufacturing processes. Recent supply shortages related to electronic chips is an example of some of the challenges we face with materials. As we have several firm fixed price contracts, we bear some risk to supply chain delivery issues and price increases.
Research and Development
We have a history of investing in development of technological advancements in our field of aerospace. We have both internally and externally funded research and development projects. Our current and future business is dependent on developing new enhancements and technology that go into our existing and future products and services. Our annual research and development expenses from continuing operations were $27 million in 2021, $15 million in 2020 and $10 million in 2019. We intend to continue our focus on research and development and product and service enhancements as a key strategy for innovation and growth. One of our current areas of focus is our development of the WorldView Legion program, a capital project, and other new offerings within our Earth Intelligence segment, including 3D technology. In our Space Infrastructure segment, we are also focused on the further development of components to be used in a variety of our products. Our efforts will continue to be directed into fields that we believe offer the greatest opportunities for long-term growth and profitability.
Human Capital
We endeavor to cultivate a positive employee experience as we deliver on Maxar and customer missions by attracting, engaging and growing current and future Maxar team members; creating strong partnerships across the business;
14
championing culture and fostering an inclusive and diverse environment; and impacting the broader community. We take great pride in our values:

Behind the words are leaders, managers and team members who believe in our values and live by them. As of December 31, 2021, we employed 4,400 team members globally of which 96% are U.S. based and 4% are international. Within the U.S., no team members are unionized, while in Europe a small number of team members are represented by a trade union. Additionally, Maxar employs a highly technical workforce, with 77% of our employees working in engineering or operations functions and the remainder in our sales and general and administrative functions.
Attracting Talent
The success of Maxar’s business depends largely on our ability to attract, engage and grow a diverse population of talented technical and skilled team members at all levels. To succeed in highly competitive labor markets and for skill sets that are scarce in the market, we have developed talent acquisition, team member engagement and total rewards strategies, to achieve and maintain a competitive position.
Total Rewards
Our employee rewards programs are designed to provide an innovative, competitive, sustainable and scalable package that allows us to compete for and retain top talent in our industry and markets, aligned with Maxar’s business and strategic objectives.
We strive to offer comprehensive benefits at a highly competitive cost-share to U.S. team members, including health insurance, direct round-the-clock access to doctors virtually and on-site, an array of targeted wellbeing programs, paid and unpaid leave, parental leave for all new parents for birth or adoption, retirement, life and disability programs, voluntary benefit options flexible to individual team member and family needs, tuition reimbursement, student loan forgiveness, adoption reimbursement, pet insurance and enhanced mental and emotional health support.
In order to encourage our value “We Act Like Owners”, we offer an Employee Stock Purchase Plan with a discount for team members in countries where it is practical to offer the program. We also offer short- and long-term incentive programs to eligible team members.
Outside of the U.S., we provide benefits, retirement and time-off in countries where we have a meaningful population of team members, designed based upon, among other things, market-specific practices and culture alignment.
Engaging Talent
We are driving a listening culture at Maxar through programs that regularly seek to engage team members in an ongoing dialogue through town-halls, surveys, quarterly check-ins and listening sessions. We focus on topics including Maxar strategy and business updates, understanding leadership effectiveness, communications clarity and other areas for improvements. In 2021, we devoted special attention to our continued response to the pandemic and how team members were faring. For both ongoing and targeted pulse surveys the results are shared with leaders and team members, and our executive team analyzes areas for future focus and prioritization in response to the feedback to drive meaningful improvement in team member engagement.
15
In 2021, we launched a major leadership development initiative focused on upskilling leadership competencies tied to our Maxar leadership framework. Our outreach included a leader learning series focused on timely leadership topics, entry level manager development and a senior leadership and networking program, Catalyst.
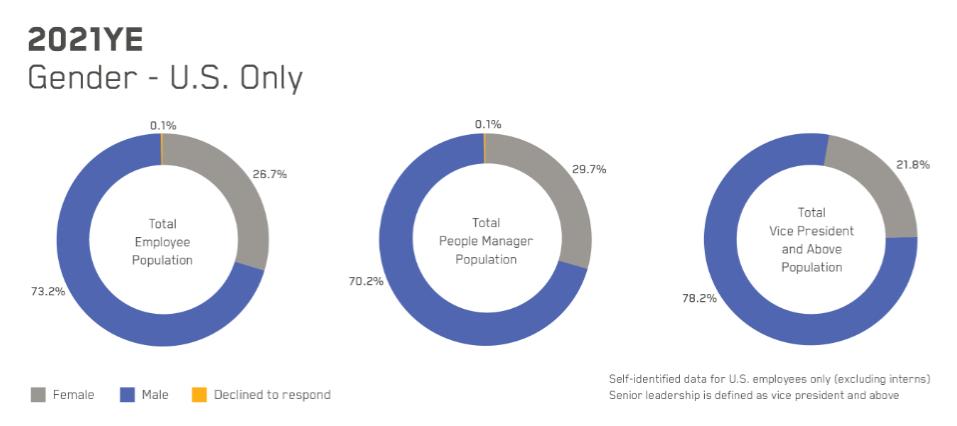
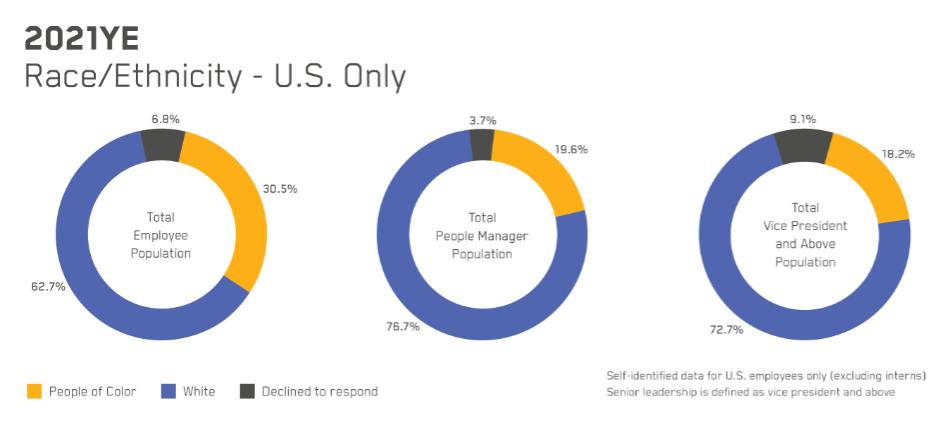
Diversity, Inclusion and Belonging
As a purpose-driven organization built on our values, our Diversity, Inclusion and Belonging (“DIB”) strategy is to foster a culture of inclusion and belonging. We know that our greatest strength comes from our team members. When our team members feel like they belong and their opinions are respected, everyone can perform to their greatest potential.
We are committed to this journey and will stay curious and focused on cultivating an inclusive environment that promotes and values diversity, inclusion and belonging. Maxar, as a values-based company, makes this a priority, not just because it’s the right thing to do, but because it makes Maxar stronger.
The DIB strategy is a three-pronged approach that informs and guides us in this journey to:
| 1. | Build a diverse, high-performing workforce by focusing on increasing diverse candidates in early career roles and in technical positions. |
| 2. | Foster a culture of inclusion and belonging by growing inclusive leaders and increasing cultural awareness. |
| 3. | Make an impact in the community and marketplace through together the efforts of the Maxar Better World Foundation. |
We are committed to transparency along this journey and our 2021 data of our U.S. workforce is below:
16
COVID-19 Response
Team member health and safety is core to our successful operations across all areas of our business including manufacturing and satellite operations environments and our work at customer sites. We have taken significant actions over the past two years to address risk factors associated with COVID-19 and business continuity:
| ● | Our COVID-19 Response Team comprised of facilities, safety, security, HR, IT and business leaders, meets regularly and will continue as the pandemic evolves. |
| ● | We conducted several pulse surveys of our team members, with special focus on our COVID-19 response and opportunities for improvement to ensure we understood team member concerns and could proactively address those concerns. |
| ● | We focused on continuous communication and resources for team members, including open question and answer forums, health & safety updates, benefits and mental health, exposure notifications and travel information. |
| ● | To provide for the health and safety of our workforce and business continuity, we have implemented a Vaccination Policy which requires that Maxar employees are vaccinated for COVID-19 unless they have an approved accommodation. As an interim step to implementing this policy, we provided free daily on-site testing for our unvaccinated population for a portion of 2021. |
| ● | All of our facilities are open and operational to support business operations. We continually monitor and assess the locations and team member status to ensure we continue to operate safely for all stakeholders. |
Available Information
Our website can be accessed at http://www.maxar.com. The website contains information about us and our operations. Through a link on the Investor Relations section of our website, copies of our filings with the U.S. Securities and Exchange Commission (“SEC”), including any Annual Reports on Form 10-K, Quarterly Reports on Form 10-Q, Current Reports on Form 8-K, Proxy Statements and Forms 3, 4 and 5 filed on behalf of directors and executive officers and amendments to each of those reports and statements can be viewed and downloaded free of charge as soon as reasonably practicable after the reports have been filed or furnished with the SEC. The information on our website is not incorporated by reference and is not a part of this Annual Report on Form 10-K. Additionally, our reports, proxy and information statements and other information filed with the SEC are available on the SEC’s website at http://www.sec.gov. Our reports, proxy and information statements and other information filed can also be found under our SEDAR profile at www.sedar.com.
17
ITEM 1A. | RISK FACTORS |
We operate in a changing global environment that involves numerous known and unknown risks and uncertainties that could materially adversely affect our business, financial condition and results of operations. The occurrence of any of the following risks could materially and adversely affect our business, financial condition, prospects, results of operations and cash flows. Additional risks and uncertainties not currently known to us or that we currently deem to be immaterial may also materially adversely affect our business, prospects, financial condition, results of operations and cash flows.
Risk Factors Summary
Below is a summary of the principal risk factors that could adversely affect our business. This summary does not address all the risks that we face. Additional discussion of the risks summarized in this risk factor summary, and other risks, can be found after this summary in Item 1A of this Annual Report on Form 10-K.
| ● | We are unable to predict the extent to which the global COVID-19 pandemic may adversely impact our business operations, financial performance, results of operations and stock price. |
| ● | The future revenue and operating results of the Space Infrastructure segment are dependent on our ability to generate a sustainable order rate for the satellite and space manufacturing operations and develop new technologies to meet the needs of our customers or potential new customers. |
| ● | Our business with various governmental entities is subject to the policies, priorities, regulations, mandates and funding levels of such governmental entities and may be negatively or positively impacted by any change thereto. |
| ● | Our revenue, results of operations and reputation may be negatively impacted if our programs fail to meet contractual requirements or our products contain defects or fail to operate in the expected manner. |
| ● | Any significant disruption in or unauthorized access to our computer systems or those of third parties that we utilize in our operations, including those relating to cybersecurity or arising from cyber-attacks, and security threats could result in a loss or degradation of service, unauthorized disclosure of data, or theft or tampering of intellectual property, any of which could materially adversely impact our business. |
| ● | Satellites are subject to construction and launch delays, launch failures, damage or destruction during launch, the occurrence of which can materially and adversely affect our operations. |
| ● | If our satellites fail to operate as intended, it could have a material adverse effect on our business, financial condition and results of operations. |
| ● | Loss of, or damage to, a satellite and the failure to obtain data or alternate sources of data for our products may have an adverse impact on our results of operations and financial condition. |
| ● | Interruption or failure of our infrastructure or national infrastructure could hurt our ability to effectively perform our daily operations and provide and produce our products and services, which could damage our reputation and harm our operating results. |
| ● | Our business with various governmental entities is concentrated in a small number of primary contracts. The loss or reduction in scope of any one of our primary contracts would materially reduce our revenue. |
| ● | We operate in highly competitive industries and in various jurisdictions across the world, which may cause us to have to reduce our prices or to lose market share. |
| ● | We are a party to legal proceedings, investigations and other claims or disputes, which are costly to defend and, if determined adversely to us, could require us to pay fines or damages, undertake remedial measures or prevent us from taking certain actions, any of which could adversely affect our business. |
| ● | Acquisitions or divestitures could result in adverse impacts on our operations. |
| ● | Disruptions in U.S. government operations and funding could have a material adverse effect on our revenues, earnings and cash flows and otherwise adversely affect our financial condition. |
18
| ● | Changes in U.S. government policy regarding use of commercial data or space infrastructure providers, or material delay or cancellation of certain U.S. government programs, may have a material adverse effect on our revenue and our ability to achieve our growth objectives. |
| ● | Uncertain global macro-economic and political conditions could materially adversely affect our results of operations and financial condition. |
| ● | Our business involves significant risks and uncertainties that may not be covered by insurance. |
| ● | We often rely on a single vendor or a limited number of vendors to provide certain key products or services and the inability of these key vendors to meet our needs could have a material adverse effect on our business. |
| ● | Disruptions in the supply of key raw materials or components and difficulties in the supplier qualification process, as well as increases in prices of raw materials, could adversely impact us. |
| ● | We are dependent on our ability to attract, train and retain employees. Our inability to do so, or the loss of key personnel, would cause serious harm to our business. |
| ● | Changes in our accounting estimates and assumptions could negatively affect our financial position and results of operations. |
| ● | We may be required to recognize impairment charges. |
| ● | Our business is capital intensive, and we may not be able to raise adequate capital to finance our business strategies, including funding future satellites, or we may be able to do so only on terms that significantly restrict our ability to operate our business. |
| ● | Our ability to obtain additional debt or equity financing or government grants to finance operating working capital requirements and growth initiatives may be limited or difficult to obtain, which could adversely affect our operations and financial condition. |
| ● | Our indebtedness and other contractual obligations could adversely affect our financial condition, our ability to raise additional capital to fund our operations, our ability to operate our business, our ability to react to changes in the economy or our industry and our ability to pay our debts and could divert our cash flow from operations for debt payments. |
| ● | Our current financing arrangements contain certain restrictive covenants that impact our future operating and financial flexibility. |
| ● | Our actual operating results may differ significantly from our guidance. |
| ● | We could be adversely impacted by actions of activist stockholders, and such activism could impact the value of our securities. |
| ● | The price of our common stock has been volatile and may fluctuate substantially. |
| ● | Our operations in the U.S. government market are subject to significant regulatory risk. |
| ● | Failure to comply with the requirements of the National Industrial Security Program Operating Manual could result in interruption, delay or suspension of our ability to provide our products and services, and could result in loss of current and future business with the U.S. government. |
| ● | Our business is subject to various regulatory risks that could adversely affect our operations. |
| ● | Changes in tax law, in our tax rates or in exposure to additional income tax liabilities or assessments may materially and adversely affect our financial condition, results of operations and cash flows. |
| ● | Our ability to use our U.S. federal and state net operating loss carryforwards and certain other tax attributes may be limited. |
| ● | Our operations are subject to governmental law and regulations relating to environmental matters, which may expose us to significant costs and liabilities that could negatively impact our financial condition. |
19
Risks Related to Our Business
We are unable to predict the extent to which the global COVID-19 pandemic may adversely impact our business operations, financial performance, results of operations and stock price.
The COVID-19 outbreak, declared a pandemic by the World Health Organization, has impacted nearly all regions of the world. Preventative measures taken to contain or mitigate the outbreak and their impact on the global supply chain have affected, and continue to affect, the global economy and the U.S. economy and have created periods of significant volatility in the global financial markets, the effects of which have adversely impacted our business and the businesses of our customers, including the U.S. and foreign governments and suppliers.
Our supply chain is under stress inside and outside of the U.S., and we continue to monitor and assess the actual and potential COVID-19 or related force majeure impacts on the supply chain, our operations and customer commitments. There is a risk that these schedule delays could result in obligations for material liquidated damages owed to our customers. We have received some force majeure claims from suppliers related to COVID-19; however, at this time we do not expect the claims to result in a material financial impact.
From time to time, we have experienced a variation in the consumption of access minutes by our customers as a result of COVID-19 and the preventative measures instituted by governments and businesses to mitigate its spread, which have resulted in periods of business slowdown. This impact could be more significant in the future, which could negatively impact revenue. In many instances, COVID-19 represents a force majeure event and as such, we have notified certain customers that we will be exercising our contractual legal rights, and in some instances we have made claims exercising such rights, given the uncertain nature of the current pandemic and its near and long-term impacts on the cost and schedule of the numerous programs in our existing backlog. Additionally, our customers may slow down their development of new projects or may experience financial difficulties impacting their ability to fund projects already in backlog.
Changes in our operations in response to COVID-19 and employee illnesses resulting from the pandemic have resulted in inefficiencies and delays of our projects, impacts to service level contracts, including in sales and product development efforts and additional costs related to business continuity initiatives, that cannot be fully mitigated through succession planning or employees working remotely. We have delayed transition of our employees back into Maxar worksites due to increases in COVID-19 cases in the broad population. Additionally, to provide for the health and safety of our workforce and business continuity, we have implemented a Vaccination Policy which requires that Maxar employees are vaccinated for COVID-19 unless they have an approved accommodation. As of January 4, 2022, 99% of our U.S. based employees were in compliance with this policy and have either been vaccinated or received an accommodation.
We cannot predict the degree to which, or the time period that, global economic conditions, the global supply chain and our sales and operations will continue to be affected by COVID-19 and preventative measures imposed from time to time by governments and businesses to prevent its spread. The degree to which COVID-19 will continue to impact us will depend on numerous factors and future developments, including, but not limited to, the unknown duration of the pandemic, the impact of potential future resurgences and new virus variants and any actions that may be taken by governmental authorities to minimize the spread of the pandemic or to stimulate the economy. We also cannot predict the degree to which the disruption of global financial markets could have a negative impact on our ability to raise capital in the future. The long-term impacts of COVID-19 on government budgets and funding priorities that impact demand for our products and services are difficult to predict.
Even after the COVID-19 pandemic has subsided, we may experience an impact to our business as a result of any economic downturn, recession or depression that has occurred or may occur in the future. The effects of these risks on our business, sales, financial condition, liquidity and results of operations could be material.
20
The future revenue and operating results of the Space Infrastructure segment are dependent on our ability to generate a sustainable order rate for the satellite and space manufacturing operations and develop new technologies to meet the needs of our customers or potential new customers.
The Space Infrastructure segment’s financial performance is dependent on its ability to generate a sustainable order rate for its satellite and space manufacturing operations. This can be challenging and may fluctuate on an annual basis as the number of satellite construction contracts awarded varies and in 2018 there was a substantial step down in the total number and dollar value of geostationary communication satellite contracts awarded compared to such historical averages prior to 2015. Many satellite operators in the communications industry have continued to defer new satellite construction awards to evaluate geostationary and other competing satellite system architectures and other market factors. If we are unable to win new awards or execute existing contracts as expected, our business, results of operations and financial position could be further adversely affected.
The cyclical nature of the commercial satellite market could negatively impact our ability to accurately forecast customer demand. The markets that we serve may not grow in the future and we may not be able to maintain adequate gross margins or profits in these markets. Specifically, sales of the 1300 bus have historically been important to our results and there is no assurance that this market will continue to grow or demand levels will increase, nor is there assurance that the market for the smaller bus, which spans a range from 500kg to 1300kg, will offset any decreases in the market for the 1300 bus or provide future growth. Our growth is dependent on the growth in the sales of services provided by our customers, our customers’ ability to anticipate market trends and our ability to anticipate changes in the businesses of our customers and to successfully identify and enter new markets. If we fail to anticipate such changes in demand, our business, results of operations and financial position could be adversely affected.
On January 1, 2019, we completed a reorganization of our corporate structure pursuant to which we directly acquired all of the issued and outstanding shares of Maxar Technologies Ltd. (“Maxar Canada”) and we replaced Maxar Canada as the publicly-held parent company of the Maxar group (“U.S. Domestication”). As part of our U.S. Domestication we believe that we will continue to capitalize on projected benefits within the Space Infrastructure segment. These benefits include anticipated growth within our U.S. government customer base as well as diversifying into national and civil missions. The failure to do so may have a material adverse effect on our business, results of operations and financial condition.
The satellite manufacturing industry is driven by continued investment in technologies to meet changing customer demand for complex and reliable services. Our satellite systems embody complex technologies and may not always be compatible with current and evolving technical standards and systems developed by others. Other satellite manufacturers have developed or are developing digital payloads which increase flexibility for geostationary satellites in circumstances with unpredictable demand. We plan to team with providers of this technology to enhance our offering if our customers express interest in it.
Failure or delays to develop technologies or team with providers to obtain technologies to meet the requisite and evolving industry or user standards could have a material adverse effect on our business, results of operations and financial condition. Failure of suppliers to deliver against end customer requirements could lead to a material adverse effect on our financial results within the Space Infrastructure segment.
Our business with various governmental entities is subject to the policies, priorities, regulations, mandates and funding levels of such governmental entities and may be negatively or positively impacted by any change thereto.
Changes in government policies, priorities, regulations, use of commercial data providers to meet U.S. government imagery needs, government agency mandates, funding levels through agency budget reductions, the imposition of budgetary constraints or a decline in government support or deferment of funding for programs in which we or our customers participate could result in contract terminations, delays in contract awards, reduction in contract scope, performance penalties or breaches of our contracts, the failure to exercise contract options, the cancellation of planned procurements and fewer new business opportunities, all of which could negatively impact our business, financial condition, results of operations and cash flows.
21
We are subject to the procurement policies and procedures set forth in the Federal Acquisition Regulation (“FAR”). FAR governs all aspects of government contracting, including contractor qualifications and acquisition procedures. The FAR provisions in U.S. government contracts must be complied with in order for the contract to be awarded and provides for audits and reviews of contract procurement, performance and administration. Failure to comply with the provisions of the FAR could result in contract termination.
In addition, contracts with any government, including the U.S. government, may be terminated or suspended by the government at any time and could result in significant liability obligations for us. We seek to have in place as standard provisions, termination for convenience language which reimburses us for reasonable costs incurred, subcontractor and employee termination and wind-down costs plus a reasonable amount of profit thereon. However, reparations for termination may fall short of the financial benefit associated with full completion and operation of a contract. In addition, we may not be able to procure new contracts to offset the revenue or backlog lost as a result of any termination of government contracts. The loss of one or more large contracts could have a material adverse impact on our business, financial condition, results of operations and cash flows. See also “Our business with various governmental entities is concentrated in a small number of primary contracts. The loss or reduction in scope of any one of our primary contracts would materially reduce our revenue” below.
Our revenue, results of operations and reputation may be negatively impacted if our programs fail to meet contractual requirements or our products contain defects or fail to operate in the expected manner.
We sell complex and technologically advanced systems, including satellites, products, hardware and software. Sophisticated software, including software developed by us, may contain defects that can unexpectedly interfere with the software’s intended operation. Defects may also occur in components and products that we manufacture or purchase from third parties. Most of the satellites and systems we have developed must function under demanding and unpredictable operating conditions and in harsh and potentially destructive environments. In addition, we may agree to the in-orbit delivery of a satellite, adding further risks to our ability to perform under a contract. Failure to achieve successful in-orbit delivery could result in significant penalties and other obligations on us.
We employ sophisticated design and testing processes and practices, which include a range of stringent factory and on-site acceptance tests with criteria and requirements that are jointly developed with customers. Our systems may not be successfully implemented, pass required acceptance criteria, or operate or give the desired output, or we may not be able to detect and fix all defects in the satellites, products, hardware and software we sell or resolve any delays or availability issues in the launch services we procure. Failure to do so could result in increased costs, lost revenue and damage to our reputation and may adversely affect our ability to win new contract awards. We manufacture satellites with the intention of receiving full contractual value for builds; however, due to the inherent complexity, a number of adverse variables could negatively impact our ability to collect on the full amount of contractual consideration including circumstances where we may work in advance of customer funding. Such variables include, among others, schedule delays, including those caused by suppliers or major subcontractors, contractual disputes, failure to meet technological requirements and customer solvency concerns. These variables could lead to termination for convenience or default on our contracts which could have a material adverse effect on our financial results. Historically, we have experienced significant delays in the building of certain satellites. The schedule delays we from time to time experience in our satellite builds, some of which are significant, are due to a number of factors, inclusive of COVID-19 delays, subcontractor issues and technological requirements and we work closely with our customers to address these delays. We have, where appropriate, asserted force majeure provisions in our contracts but these can be subject to dispute.
Any significant disruption in or unauthorized access to our computer systems or those of third parties that we utilize in our operations, including those relating to cybersecurity or arising from cyber-attacks, and security threats could result in a loss or degradation of service, unauthorized disclosure of data, or theft or tampering of intellectual property, any of which could materially adversely impact our business.
Our operations, products, solutions, analysis and intellectual property are inherently at risk of loss, unauthorized access, tampering by both insider threats and external bad actors, or disruption due to inadvertent misconfiguration of our computers and networks. In particular, our operations face various cyber and other security threats, including those caused by physical or electronic break-ins, computer viruses, malware, worms, attacks by hackers or foreign
22
governments, disruptions from unauthorized access and tampering, including through social engineering such as phishing attacks, coordinated denial-of-service attacks and similar incidents. These cyber and other security threats could result in attempts to gain unauthorized access to sensitive information, intellectual property, mission operations and networks. Our systems (internal, customer and partner systems) and assets may also be subject to damage or interruption from natural and other disaster events or disruptions including tsunamis, floods, earthquakes, fires, water shortages, other extreme weather conditions, epidemics or pandemics, acts of domestic or foreign terrorism, workplace violence, power shortages and blackouts, aging infrastructures and telecommunications failures. In addition, threats to the safety of our directors and employees, threats to the security of our facilities, infrastructure and supply chain, or the release of misleading or deceptive information by criminal, terrorist, or other bad actors, could have a material adverse impact on our business.
Our products, solutions and analysis that we develop or deliver to our customers are also at risk of disruption, loss, or tampering. The integrity of the data (e.g., pixels), information, and analysis in our products and services is at risk of being manipulated either before or after delivery to a customer. Our products with derived information characteristics are also at risk of being incorrect due to errors of deceptive practices by others.
Our customers and partners (including our supply chain and joint ventures) face similar threats. Customer or partner proprietary, classified, or sensitive information stored on our networks is at risk. Assets and intellectual property and products in customer or partner environments are also inherently at risk. We also have risk where we have access to customer and partner networks and face risks of breach, disruption or loss as well. Our supply chain for products and services also is becoming more diverse and therefore the risk is growing.
We have implemented certain systems and processes to help thwart bad actors and protect our data and our systems and assets. The techniques used to gain unauthorized access are constantly evolving, however, and we may be unable to prevent or mitigate all unauthorized access, disruption, loss, or harm. Because of our highly desired intellectual property and our support of the U.S. government and other governments, we (and/or partners we use) may be a particularly attractive target for such attacks by advanced, persistent and highly organized adversaries, including nation states and hostile foreign governments. From time to time, we have experienced attacks on our systems from bad actors that, to date, have not had a material adverse effect on our business. We cannot offer assurances, however, that future attacks will not materially adversely affect our business.
A security event or other significant disruption of our systems, assets, products or solutions could:
| ● | disrupt the proper functioning of our networks, applications and systems and therefore our operations and/or those of certain of our customers, or partners; |
| ● | result in the unauthorized access to, and destruction, loss, theft, misappropriation or release of, our or our customers’ proprietary, confidential, sensitive or otherwise valuable information, including trade secrets, which others could use to compete against us or for disruptive, destructive or otherwise harmful purposes and outcomes; |
| ● | destroy or degrade assets including space, ground and intellectual property assets; |
| ● | manipulate or tamper with our products, solutions, analysis, or other systems delivered to our customers or partners; |
| ● | compromise other sensitive government functions; and |
| ● | damage our reputation with our customers (particularly agencies of various governments) and the public generally. |
A security event that involves classified or other sensitive government information or certain controlled technical information, could subject us to civil or criminal penalties and could result in loss of our secure facility clearance and other accreditations, loss of our government contracts, loss of access to classified information, loss of export privileges or debarment as a government contractor. The risk that these types of events could seriously harm our business is likely to increase as we expand the number of web-based products and services we offer as well as increase the number of countries within which we do business.
23
Satellites are subject to construction and launch delays, launch failures, damage or destruction during launch, the occurrence of which can materially and adversely affect our operations.
Delays in the construction of satellites and the procurement of requisite components and launch vehicles, limited availability of appropriate launch windows, possible delays in obtaining regulatory approvals, satellite damage or destruction during launch, launch failures, or incorrect orbital placement could have a material adverse effect on our business, financial condition and results of operations. The loss of, or damage to, a satellite due to a launch failure could result in significant delays in anticipated revenue to be generated by that satellite. Any significant delay in the commencement of service of a satellite would delay or potentially permanently reduce the revenue anticipated to be generated by that satellite. In addition, if the loss of a satellite were to occur, such as with our loss of WorldView-4, we may not be able to accommodate affected customers with our other satellites or data from another source until a replacement satellite is available, and we may not have on hand, or be able to obtain in a timely manner, the necessary funds to cover the cost of any necessary satellite replacement. We may also dispute with customers the extent and consequences of any loss or delay. Any launch delay, launch failure, underperformance, delay or perceived delay could have a material adverse effect on our results of operations, business prospects and financial condition.
If our satellites fail to operate as intended, it could have a material adverse effect on our business, financial condition and results of operations.
The manufacturing, testing, launching and operation of satellites involves complex processes and technology. Our satellites employ advanced technologies and sensors that are exposed to severe environmental stresses in space that have and could affect the performance of our satellites. Hardware component problems in space could lead to deterioration in performance or loss of functionality of a satellite. In addition, human operators may execute improper implementation commands that may negatively impact a satellite’s performance. Exposure of our satellites to an unanticipated catastrophic event, such as a meteor shower or a collision with space debris, could reduce the performance of, or completely destroy, the affected satellite. In December 2018, our WorldView-4 satellite experienced a failure in its control moment gyros, preventing the satellite from collecting imagery.
We cannot provide assurances that our satellites will continue to operate successfully in space throughout their expected operational lives. Even if a satellite is operated properly, technical flaws in that satellite’s sensors or other technical deficiencies or anomalies could significantly hinder its performance, which could materially affect our ability to collect imagery and market our products and services successfully. While some anomalies are covered by insurance policies, others are not or may not be covered, or may be subject to large deductibles.
If we suffer a partial or total loss of a deployed satellite, such as the failure of WorldView-4, we would need a significant amount of time and would incur substantial expense to replace that satellite. We may experience other problems with our satellites that may reduce their performance. During any period of time in which a satellite is not fully operational, we may lose most or all of the revenue that otherwise would have been derived from that satellite. Our inability to repair or replace a defective satellite or correct any other technical problem in a timely manner could result in a significant loss of revenue. If a satellite experiences a significant anomaly such that it becomes impaired or is no longer functional, it would significantly impact our business, prospects and profitability. Additionally, our review of satellite lives could extend or shorten the depreciable lives of our satellites, which would have an impact on the depreciation we recognize.
Loss of, or damage to, a satellite and the failure to obtain data or alternate sources of data for our products may have an adverse impact on our results of operations and financial condition.
In the Earth Intelligence segment, we rely on data collected from a number of sources including data obtained from satellites. We may become unable or limited in our ability to collect such data. For example, satellites can temporarily go out of service and be recovered, or cease to function for reasons beyond our control, including the quality of design and construction, the supply of fuel, the expected gradual environmental degradation of solar panels, the durability of various satellite components and the orbits and space environments in which the satellites are placed and operated. Electrostatic storms, collisions with other objects or actions by malicious actors, including cyber related, could also damage the satellites. Our satellites may be subject to an increased risk of collision with other space objects due to growth in the number of commercial and government satellites, along with potential adversarial actions that may create more space
24
debris. Additionally, in certain instances, governments may discontinue for periods of time the access to or operation of a satellite for any particular area on the Earth and for various reasons may not permit transmission of certain data, whether from a satellite owned by the government or not.
We cannot offer assurances that each of our satellites will remain in operation. Our satellites have certain redundant systems which can fail partially or in their entirety and accordingly satellites may operate for extended periods without all redundant systems in operation, but with single points of failure. The failure of satellite components could cause damage to or loss of the use of a satellite before the end of its expected operational life. Certain of our satellites are nearing the end of their expected operational lives and we can offer no assurance that our satellites will maintain their prescribed orbits or remain operational and we may not have replacement satellites that are immediately available.
Interruption or failure of our infrastructure or national infrastructure could hurt our ability to effectively perform our daily operations and provide and produce our products and services, which could damage our reputation and harm our operating results.
We are vulnerable to natural disasters and significant disruptions including tsunamis, floods, earthquakes, fires, water shortages, other extreme weather conditions, epidemics or pandemics, acts of domestic or foreign terrorism, workplace violence, power shortages and blackouts, aging infrastructures and telecommunications failures. Furthermore, climate change has increased, and may continue to increase, the rate, size and scope of these natural disasters. In the event of such a natural disaster or other disruption, we could experience: disruptions to our operations or the operations of suppliers, subcontractors, distributors or customers; destruction of facilities; and/or loss of life.
The availability of many of our products and services depends on the continuing operation of our satellite operations infrastructure, satellite manufacturing operations, information technology, communications systems and national infrastructure. Any downtime, damage to or failure of our systems could result in interruptions in our service, which could reduce our revenue and profits. Our systems are vulnerable to damage or interruption from floods, fires, power loss, aging infrastructure, telecommunications failures, computer viruses, computer denial of service attacks or other attempts to harm our systems. We do not currently maintain a fully comprehensive back-up production facility from which we can continue to collect, process and deliver imagery in the event of the loss of our primary facility. In the event we are unable to collect, process and deliver imagery from our facility, our daily operations and operating results would be materially and adversely affected. In addition, our ground terminal centers are vulnerable to damage or interruption from human error, intentional bad acts, earthquakes, hurricanes, floods, fires, war, terrorist attacks, power losses, hardware failures, systems failures, aging infrastructure, telecommunications failures and similar events. Our satellite manufacturing operations are located in California in proximity to the San Andreas fault line, one of the longest and most heavily populated earthquake-prone rifts in the world. Our satellite manufacturing facilities are also subject to risks associated with an aging infrastructure. An infrastructure failure could result in the destruction of satellites under construction or inventory, manufacturing delays or additional costs incurred. We do not maintain back-up manufacturing facilities or operations. The occurrence of any of the foregoing could result in lengthy interruptions in our services and/or damage our reputation, which could have a material adverse effect on our financial condition and results of operations.
Our business with various governmental entities is concentrated in a small number of primary contracts. The loss or reduction in scope of any one of our primary contracts would materially reduce our revenue.
Our business with various governmental entities is concentrated in a small number of primary contracts. We recognize significant revenue from U.S. government agencies and a significant amount of our U.S. government revenue is currently generated from a single contract, the EnhancedView Contract. The EnhancedView Contract is a service level agreement to provide image-tasking capacity on our satellites, and other imagery-derived products and services to the U.S. government. Our ability to service other customers could be negatively impacted if we are unable to maintain our current collection capacity. In addition, any inability on our part to meet the performance requirements of the EnhancedView Contract, or replacement contract, could result in a performance penalty or breach of that contract. A breach of our contract with government customers or reduction in service to our other customers could have a material adverse effect on our business, financial condition and results of operations. The U.S. government may also terminate or suspend our contracts, including the EnhancedView Contract, at any time with or without cause. In November 2021, the
25
NRO announced the release of the EOCL contract RFP. The EOCL contract is expected to replace the existing EnhancedView Contract. In December 2021, we submitted our response to the EOCL RFP and we anticipate the NRO to award EOCL contracts prior to the expiration of the EnhancedView Contract, including remaining option years. Any changes in the size, scope or term of the EnhancedView Contract, or any award we receive for the EOCL Contract, could impact our satellite replenishment strategy and our ability to repay or refinance our long-term debt. Although our contracts generally involve fixed annual minimum commitments, such commitments, along with all other contracts with the U.S. government, are subject to annual Congressional appropriations and the federal budget process, and as a result, the U.S. government may not continue to fund these contracts at current or anticipated levels. Similarly, our contracts in other jurisdictions are also subject to government procurement policies and procedures.
We face competition that may cause us to have to either reduce our prices for imagery and related services or to lose market share.
Our services compete with satellite and aerial imagery and related services offered by a range of private and government providers. Our current or future competitors may have superior technologies or greater financial, personnel and other resources than we have. The value of our imagery may also be diluted by Earth imagery that is available free of charge.
The U.S. government and foreign governments may develop, construct, launch and operate their own imagery satellites, which could reduce their need to rely on us and other commercial suppliers. In addition, such governments could sell or provide free of charge Earth imagery from their satellites and thereby compete with our imagery and related services. Also, governments may at times make our imagery freely available for humanitarian purposes, which could impair our revenue growth with non-governmental organizations. These governments could also subsidize the development, launch and operation of imagery satellites by our current or future competitors.
Our competitors or potential competitors could, in the future, offer satellite-based imagery or other services with more attractive features than our services. The emergence of new remote imaging technologies or the continued growth of low-cost imaging satellites, could negatively affect our marketing efforts. More importantly, if competitors develop and launch satellites or other imagery-content sources with more advanced capabilities and technologies than ours, or offer services at lower prices than ours, our business and results of operations could be harmed. Due to competitive pricing pressures, such as new product introductions by us or our competitors or other factors, the selling price of our services may further decrease. If we are unable to offset decreases in our average selling prices by increasing our sales volumes or by adjusting our service mix, our revenue and operating margins may decline and our financial position may be harmed.
We operate in highly competitive industries and in various jurisdictions across the world, which may cause us to have to reduce our prices.
We operate in highly competitive industries and many of our competitors are larger and have substantially greater resources than we have. Our primary competitors for satellite manufacturing contracts include the Boeing Company, Lockheed Martin Corporation and Northrop Grumman Corporation in the United States and Thales S.A. and Airbus Defence and Space, a subsidiary of the Airbus Group, in Europe. We may also face competition in the future from more emerging low-cost competitors, some of which could be subsidized or well-funded. Competition in our Earth Intelligence segment is highly diverse, and while our competitors offer different products, there is often competition for contracts that are part of governmental budgets. Our major existing and potential competitors for our Earth Intelligence segment include commercial satellite imagery companies, state-owned imagery providers, aerial imagery companies, free sources of imagery and unmanned aerial vehicles. Our Earth Intelligence segment faces competition from companies that provide geospatial analytic information and services to the U.S. government, including defense prime contractors such as L3Harris and Booz Allen Hamilton.
In addition, some of our foreign competitors currently benefit from, and others may benefit in the future from, protective measures by their home countries where governments are providing financial support, including significant investments in the development of new technologies. Government support of this nature greatly reduces the commercial risks associated with satellite development activities for these competitors. This market environment may result in increased pressures on our pricing and other competitive factors.
26
We are a party to legal proceedings, investigations and other claims or disputes, which are costly to defend and, if determined adversely to us, could require us to pay fines or damages, undertake remedial measures or prevent us from taking certain actions, any of which could adversely affect our business.
We are, and in the future may be, a party to legal proceedings, investigations and other claims or disputes, which may relate to subjects including commercial transactions, intellectual property, securities, employee relations, or compliance with applicable laws and regulations.
For instance, in January 2019, a Maxar stockholder filed a putative class action lawsuit in the Federal District Court of Colorado, naming Maxar and members of management as defendants alleging, among other things, that our public disclosures were false or misleading in violation of the Securities Exchange Act of 1934 and seeking monetary damages. An amended consolidated complaint was filed in that case in October 2019. On September 11, 2020, the court granted in part, and denied in part, Maxar’s motion to dismiss. On July 16, 2021, the Federal District Court of Colorado certified a class consisting of investors who purchased or acquired Maxar stock between May 9, 2018 and October 30, 2018, inclusive. Also, in January 2019, a Maxar stockholder resident in Canada issued a putative class action lawsuit in the Ontario Superior Court of Justice against Maxar and members of management claiming misrepresentations in our public disclosures and seeking monetary damages under Canadian securities laws. In November 2019, a second putative class action lawsuit was issued by the same Maxar stockholder resident in Canada, adding a second representative plaintiff and three additional defendants, including Maxar’s auditor KPMG LLP. The action against KPMG LLP was later discontinued. The second claim expands the proposed class period and the breadth of the allegations against us. In February 2020, the January 2019 Canadian lawsuit was discontinued. In October 2019, a Maxar stockholder filed a putative class action lawsuit in California state court, naming Maxar and certain members of management and the board of directors as defendants. The lawsuit is based upon many of the same underlying factual allegations as the federal class action but asserts claims under the Securities Act of 1933. An amended complaint was filed in April 2020. In November 2020, defendants filed a demurrer to the operative complaint, and in January 2021, the court largely overruled the demurrer. On August 20, 2021, the court certified a class consisting of investors who acquired Maxar stock in exchange for DigitalGlobe stock pursuant to the Company’s June 2, 2017 Registration Statement and Prospectus issued in connection with Maxar’s October 2017 acquisition of DigitalGlobe. In November 2019, a purported derivative complaint was filed against Maxar, certain current and former members of management and the board of directors in the Federal District Court of Delaware, also based on the same factual allegations as the federal putative class action. On September 18, 2020, a second purported derivative case was filed in the Federal District Court of Delaware, based on the same allegations as the earlier derivative case. The two derivative cases pending in the Federal District Court of Delaware have been consolidated and are stayed. On September 15, 2021, a third purported derivative complaint was filed against Maxar, certain current and former members of management and the board of directors in the Court of Chancery of the State of Delaware, also based on the same factual allegations as the federal class action. In November 2021, the parties stipulated to a stay of this action.
These legal proceedings could result in substantial costs and diversion of management’s attention and resources and could harm our stock price, business, prospects, results of operations and financial condition. These and other legal proceedings and investigations are inherently uncertain and we cannot predict their duration, scope, outcome or consequences. There can be no assurance that these or any such matters that have been or may in the future be brought against us will be resolved favorably. In connection with any government investigations, in the event the government takes action against us or the parties resolve or settle the matter, we may be required to pay substantial fines or civil and criminal penalties and/or be subject to equitable remedies, including disgorgement or injunctive relief. Other legal or regulatory proceedings, including lawsuits filed by private litigants, may also follow as a consequence. These matters are likely to be expensive and time-consuming to defend, settle and/or resolve and may require us to implement certain remedial measures that could prove costly or disruptive to our business and operations. They may also cause damage to our business reputation. The unfavorable resolution of one or more of these matters could have a material adverse effect on our business, results of operations, financial condition or cash flows.
27
Acquisitions or divestitures could result in adverse impacts on our operations.
In order to grow our business, we may acquire additional assets or companies, including for example, our recent Vricon Acquisition completed on July 1, 2020. In connection with the Vricon Acquisition or any future acquisitions, there can be no assurance that we will be able to identify, acquire, or obtain the required regulatory approvals, or profitably manage the additional businesses or successfully integrate any acquired businesses, products or technologies without substantial expenses, delays or other operational, regulatory, or financial problems. In addition, any acquired businesses, products or technologies may not achieve anticipated revenues and income growth.
Further, acquisitions may involve a number of additional risks, including diversion of management’s attention, failure to retain key personnel, or failure to attract the necessary talent to manage organizational growth. We may become responsible for unexpected liabilities that were not discovered or disclosed in the course of due diligence in connection with historical acquisitions and any future acquisitions. Additionally, acquisitions with international operations such as the Vricon Acquisition with operations in Sweden, expose us to greater international business risks. If we do not realize the expected benefits or synergies of an acquisition, such as revenue gains or cost reductions, there could be a material adverse effect on our business, results of operations and financial condition.
We may also seek to divest portions of our businesses which may no longer be aligned with our strategic initiatives and long-term objectives. Various factors could materially affect our ability to successfully do so, including the availability of buyers willing to purchase the assets on terms acceptable to us, difficulties in the separation of operations, the diversion of management's attention from other business concerns, the disruption of our business, the potential loss of key employees and the retention of uncertain contingent liabilities related to the divested business. We cannot assure that we will be successful in managing these or any other significant risks that we encounter in divesting a business or product line, and any divestiture we undertake could materially and adversely affect our business, financial condition, results of operations and cash flows.
Disruptions in U.S. government operations and funding could have a material adverse effect on our revenues, earnings and cash flows and otherwise adversely affect our financial condition.
Any disruptions in federal government operations could have a material adverse effect on our revenues, earnings and cash flows. A prolonged failure to maintain significant U.S. government operations, particularly those pertaining to our business, could have a material adverse effect on our revenues, earnings and cash flows. Continued uncertainty related to recent and future U.S. federal government shutdowns, the U.S. budget and/or failure of the U.S. government to enact annual appropriations, such as long-term funding under a continuing resolution, could have a material adverse effect on our revenues, earnings and cash flows. Additionally, disruptions in federal government operations may negatively impact regulatory approvals and guidance that are important to our operations.
Changes in U.S. government policy regarding use of commercial data or space infrastructure providers, or material delay or cancellation of certain U.S. government programs, may have a material adverse effect on our revenue and our ability to achieve our growth objectives.
Current U.S. government policy encourages the U.S. government’s use of commercial data and Space Infrastructure providers to support U.S. national security objectives. Under the EnhancedView Contract, our contractual counterparty acquires imagery and imagery-derived products on behalf of our customers within the U.S. government. We are considered by the U.S. government to be a commercial data provider. U.S. government policy is subject to change and any change in policy away from supporting the use of commercial data and Space Infrastructure providers to meet U.S. government imagery and Space Infrastructure needs, or any material delay or cancellation of planned U.S. government programs, including the EnhancedView Contract, could materially adversely affect our revenue and our ability to achieve our growth objectives.
28
Uncertain global macro-economic and political conditions could materially adversely affect our results of operations and financial condition.
Our results of operations are materially affected by economic and political conditions in the United States and internationally, including inflation, deflation, interest rates, availability of capital, energy and commodity prices, trade laws and the effects of governmental initiatives to manage economic conditions. Current or potential customers may delay or decrease spending on our products and services as their business and/or budgets are impacted by economic conditions. The inability of current and potential customers to pay us for our products and services may adversely affect our earnings and cash flows.
Our business involves significant risks and uncertainties that may not be covered by insurance.
A significant portion of our business relates to designing, developing and manufacturing advanced space technology products and systems. New technologies may be untested or unproven. Failure of some of these products and services could result in extensive property damage. Accordingly, we may incur liabilities that are unique to our products and services.
We endeavor to obtain insurance coverage from established insurance carriers to cover these risks and liabilities. However, the amount of insurance coverage that we maintain may not be adequate to cover all claims or liabilities. Existing coverage may be canceled while we remain exposed to the risk and it is not possible to obtain insurance to protect against all operational risks, natural hazards and liabilities.
We have historically insured satellites in our constellation to the extent that insurance was available on acceptable premiums and other terms. The insurance proceeds received in connection with a partial or total loss of the functional capacity of any of our satellites would not be sufficient to cover the replacement cost, if we choose to do so, of an equivalent high-resolution satellite. In addition, this insurance will not protect us against all losses to our satellites due to specified exclusions, deductibles and material change limitations customary in the industry and it may be difficult or impossible to insure against certain risks, including a partial deterioration in satellite performance and satellite re-entry.
The price and availability of insurance fluctuate significantly. Although we have historically been able to obtain insurance coverage for in-orbit satellites, we cannot guarantee that we will be able to do so in the future. We intend to maintain insurance for our operating satellites, but any determination we make as to whether to obtain insurance coverage will depend on a variety of factors, including the availability of insurance in the market, the cost of available insurance and the redundancy of our operating satellites. Insurance market conditions or factors outside our control at the time we are in the market for the required insurance, such as failure of a satellite using similar components, could cause premiums to be significantly higher than current estimates and could reduce amounts of available coverage. The cost of our insurance has been increasing and may continue to increase. Higher premiums on insurance policies will reduce our operating income by the amount of such increased premiums. If the terms of in-orbit insurance policies become less favorable than those currently available, there may be limits on the amount of coverage that we can obtain, or we may not be able to obtain insurance at all.
In addition, even though we carry business interruption insurance policies, any business interruption losses could exceed the coverage available or be excluded from our insurance policies. Any disruption of our ability to operate our business could result in a material decrease in our revenues or significant additional costs to replace, repair or insure our assets, which could have a material adverse impact on our financial condition and results of operations.
We often rely on a single vendor or a limited number of vendors to provide certain key products or services and the inability of these key vendors to meet our needs could have a material adverse effect on our business.
Historically, we have contracted with a single vendor or a limited number of vendors to provide certain key products or services, such as construction of satellites and launch vehicles and management of certain remote ground terminals and direct access facilities. In addition, our manufacturing operations depend on specific technologies and companies for which there may be a limited number of vendors. We are increasingly dependent upon subcontractors and suppliers which subjects our business and results of operations to risks of supplier interruption. If these vendors are unable to meet
29
our needs because they fail to perform adequately, are unable to match new technological requirements or opportunities, or are unable to dedicate engineering and other resources necessary to provide the services contracted for, our business, financial position and results of operations may be adversely affected. While alternative sources for these products, services and technologies may exist, we may not be able to develop these alternative sources quickly and cost-effectively, which could materially impair our ability to operate our business. Furthermore, these vendors may request changes in pricing, payment terms or other contractual obligations, which could cause us to make substantial additional investments.
Additionally, some of our suppliers’ employees are represented by labor unions. Labor union actions at suppliers can also affect us. Work stoppages and instability in our relationships with labor unions could delay the production and/or development of our products, which could strain relationships with customers, cause a loss of revenues and adversely affect our operations.
Disruptions in the supply of key raw materials or components and difficulties in the supplier qualification process, as well as increases in prices of raw materials, could adversely impact us.
Many raw materials, major components and product equipment items, particularly in our Space Infrastructure segment, are procured or subcontracted on a single or sole-source basis. Although we maintain a qualification and performance surveillance process and we believe that near-term sources of supply for raw materials and components are generally adequate, it is difficult to predict what effects shortages or price increases may have in the future. Supply shortages related to electronic chips is an example of some of the challenges we may face with materials. Our ability to manage inventory and meet delivery requirements may be constrained by our suppliers’ inability to scale production and adjust delivery of long-lead time products during times of volatile demand. Our inability to fill our supply needs would jeopardize our ability to fulfill obligations under commercial and government contracts, which could, in turn, result in reduced sales and profits, contract penalties or terminations and damage to customer relationships and could have a material adverse effect on our operating results, financial condition, or cash flows.
Key raw materials used in our operations include metals such as aluminum and titanium, which are usually procured by our suppliers who manufacture parts in accordance with our drawings. We also purchase materials such as chemicals; composites; electronic, electro-mechanical and mechanical components; subassemblies; and subsystems that are integrated with the manufactured parts for final assembly into finished products and systems. We are impacted by increases in the prices of raw materials used in production on fixed-price business.
We monitor sources of supply to attempt to assure that adequate raw materials and other supplies needed in manufacturing processes are available.
Although we have not experienced significant difficulty in our ability to procure raw materials, components, sub-assemblies and other supplies required in our manufacturing processes, prolonged disruptions in the supply of any of our key raw materials or components, difficulty completing qualification of new sources of supply, implementing use of replacement materials, components or new sources of supply, or a continuing increase in the prices of raw materials, energy or components could have a material adverse effect on our operating results, financial condition, or cash flows.
We are dependent on resellers of our services for a portion of our revenue. If these resellers fail to market or sell our services successfully, our business could be harmed.
The Earth Intelligence segment has historically generated a portion of its revenue from foreign and domestic resellers. In the Earth Intelligence segment, we rely on foreign resellers and partners to market and sell the majority of our services in the international market. Our foreign resellers and partners may not have the skill or experience to develop regional commercial markets for our services, or may have competing interests that negatively affect their sales of our services. If we fail to enter into reseller agreements on a timely basis or if our resellers and partners fail to market and sell our services successfully, these failures could negatively impact our business, financial condition and results of operations.
30
We may not be successful in developing new technology and the technology we are successful in developing may not meet the needs of our customers or potential new customers.
The markets in which we operate are characterized by changing technology and evolving industry standards. Despite years of experience in meeting customer systems requirements with the latest in technological solutions, we may not be successful in identifying, developing and marketing products or systems that respond to rapid technological change, evolving technical standards and systems developed by others. Our competitors may develop technology that better meets the needs of our customers. If we do not continue to develop, manufacture and market innovative technologies or applications that meet customers’ requirements, sales may suffer and our business may not continue to grow in line with historical rates or at all. If we are unable to achieve sustained growth, we may be unable to execute our business strategy, expand our business or fund other liquidity needs and our business prospects, financial condition and results of operations could be materially and adversely affected.
Our technology may violate the proprietary rights of third parties and our intellectual property may be misappropriated or infringed upon by third parties, each of which could have a negative impact on our operations.
If any of our technology violates proprietary rights, including copyrights and patents, third parties may assert infringement claims against us. Certain software modules and other intellectual property used by us or in our satellites, systems and products make use of or incorporate licensed software components and other licensed technology. These components are developed by third parties over whom we have no control. Any claims brought against us may result in limitations on our ability to use the intellectual property subject to these claims. We may be required to redesign our satellites, systems or products or to obtain licenses from third parties to continue offering our satellites, systems or products without substantially re-engineering such products or systems.
Our intellectual property rights may be invalidated, circumvented, challenged, infringed or required to be licensed to others. An infringement or misappropriation could harm any competitive advantage we currently derive or may derive from our proprietary rights.
To protect our proprietary rights, we rely on a combination of patent protections, copyrights, trade secrets, trademark laws, confidentiality agreements with employees and third parties and protective contractual provisions such as those contained in license agreements with consultants, subcontractors, vendors and customers. Although we apply rigorous standards, documents and processes to protect our intellectual property, there is no absolute assurance that the steps taken to protect our technology will prevent misappropriation or infringement. Litigation may be necessary to enforce or protect our intellectual property rights, our trade secrets or determine the validity and scope of the proprietary rights of others. Such litigation may be time-consuming and expensive to prosecute or defend and could result in the diversion of our time and resources. In addition, competitors may design around our technology or develop competing technologies.
The acceptance of our imagery services may not continue and our historic growth rates should not be relied upon as an indicator of future growth.
We cannot accurately predict the extent of the market acceptance of our services or whether there will continue to be a market for our services on terms we find acceptable. Market acceptance of our commercial high-resolution Earth imagery and related services depends on a number of factors, including the quality, scope, timeliness, sophistication, price and the availability of substitute services. Changes in the market acceptance of our offerings, or other services that utilize our imagery, failure of new markets to develop, the impact of competitive conditions, or our need to make significant investments to achieve acceptance by the market would negatively affect our business, financial condition and results of operations. We may not continue to grow in line with historical rates or at all. If we are unable to achieve sustained growth, we may be unable to execute our business strategy, expand our business or fund other liquidity needs and our business prospects, financial condition and results of operations could be materially and adversely affected.
31
We are dependent on our ability to attract, train and retain employees. Our inability to do so, or the loss of key personnel, would cause serious harm to our business.
Our success is largely dependent on the abilities and experience of our executive officers and other key personnel to oversee all aspects of our operations and to deliver on our corporate strategies. Competition for highly skilled management, technical, research and development and other personnel is intense in our industry. In order to maintain our ability to compete, we must continuously retain the services of a core group of specialists in a wide variety of disciplines. To the extent that the demand for qualified personnel exceeds supply, we could experience higher labor, recruiting or training costs in order to attract and retain such employees, or could experience difficulties in performing under contracts if our need for such employees is unmet. We may not be able to retain our current executive officers or key personnel or attract and retain additional executive officers or key personnel as needed to deliver on our corporate strategy. Furthermore, the recent volatility in our stock price may undermine the use of our equity as a retention tool and may make it more difficult to retain key personnel.
Changes in our accounting estimates and assumptions could negatively affect our financial position and results of operations.
We prepare our Consolidated Financial Statements in accordance with U.S. GAAP. These accounting principles require us to make estimates and assumptions that affect the reported amounts of assets and liabilities and the disclosure of contingent assets and liabilities at the date of our financial statements. We are also required to make certain judgments that affect the reported amounts of revenues and expenses during each reporting period. We periodically evaluate our estimates and assumptions including, but not limited to, those relating our critical accounting policies of revenue recognition, including our long-term contracts accounted for utilizing the cost-to-cost method and income taxes in addition to other estimates related to restructuring costs, recoverability of assets including customer receivables, valuation of goodwill and intangibles, contingencies and stock-based compensation. We base our estimates on historical experience and various assumptions that we believe to be reasonable based on specific circumstances. These assumptions and estimates involve the exercise of judgment and discretion, which may evolve over time in light of operational experience, regulatory direction, developments in accounting principles and other factors. Actual results could differ from these estimates as a result of changes in circumstances, assumptions, policies or developments in the business, which could materially affect our Consolidated Financial Statements.
We may be required to recognize impairment charges.
Long-lived assets, including goodwill and intangible assets, are tested annually for impairment in the fourth quarter or whenever there is an indication that an asset may be impaired. In the past, we have recognized significant impairment losses related to goodwill, intangible assets, property, plant and equipment, inventory and orbital receivables.
Disruptions to our business, unexpected significant declines in our operating results, adverse technological events or changes in the regulatory markets in which we operate, and significant declines in our stock price have resulted and may result in further impairment charges to our tangible and intangible assets. Any future impairment charges could substantially affect our reported results.
Pension and other postretirement benefit obligations may materially impact our earnings, stockholders’ equity and cash flows from operations, and could have significant adverse impacts in future periods.
We maintain defined benefit pension and other postretirement benefits plans for some of our employees. Potential pension contributions include discretionary contributions to improve the plans’ funded status. The extent of future contributions depends heavily on market factors such as the discount rate and the actual return on plan assets. We estimate future contributions to these plans using assumptions with respect to these and other items. Changes to those assumptions could have a significant effect on future contributions, annual pension and other postretirement costs, the value of plan assets and our benefit obligations.
Significant changes in actual return on pension assets, discount rates and other factors could adversely affect our results of operations and require cash pension contributions in future periods. Changes in discount rates and actual asset returns
32
different than our expected asset returns can result in significant non-cash actuarial gains or losses which we record in the fourth quarter of each fiscal year and, if applicable, in any quarter in which an interim re-measurement is triggered. With regard to cash pension contributions, funding requirements for our pension plans are largely dependent upon interest rates, actual investment returns on pension assets and the impact of legislative or regulatory changes related to pension funding obligations.
We also provide other postretirement benefits to certain of our employees, consisting principally of health care, dental and life insurance for eligible retirees and qualifying dependents. Our estimates of future costs associated with these benefits are also subject to assumptions, including estimates of the level of medical cost increases and discount rates.
Fluctuations in foreign exchange rates could have a negative impact on our business.
Our revenues, expenses, assets and liabilities denominated in currencies other than the U.S. dollar are translated into U.S. dollars for the purposes of compiling our Consolidated Financial Statements. We have in the past and may in the future, use hedging strategies to manage and minimize the impact of exchange rate fluctuations on our cash flow and economic profits. There are complexities inherent in determining whether and when foreign exchange exposures will materialize, in particular given the possibility of unpredictable revenue variations arising from schedule delays and contract postponements. Furthermore, if we use hedging strategies in the future, we could be exposed to the risk of non-performance of our hedging counterparties. We may also have difficulty with our hedging strategy in the future depending on the willingness of hedging counterparties to extend credit. Accordingly, no assurances may be given that our exchange rate hedging strategy would protect us from significant changes or fluctuations in revenues and expenses denominated in U.S. dollars.
Our restructuring activities and cost saving initiatives may not achieve the results we anticipate.
We have previously and may in the future undertake cost reduction initiatives and organizational restructurings to improve operating efficiencies, optimize our asset base and generate cost savings. We cannot be certain that these initiatives have been or will be completed as planned or without business interruption, that these initiatives will not generate additional costs, such as severance or other charges, or that the estimated operating efficiencies or cost savings from such activities will be fully realized or maintained over time.
Risks Related to Our Indebtedness and Our Common Stock
Our business is capital intensive, and we may not be able to raise adequate capital to finance our business strategies, including funding future satellites, or we may be able to do so only on terms that significantly restrict our ability to operate our business.
The implementation of our business strategies, such as expanding our satellite constellation and our products and services offerings, requires a substantial outlay of capital. As we pursue our business strategies and seek to respond to opportunities and trends in our industry, our actual capital expenditures may differ from our expected capital expenditures, and there can be no assurance that we will be able to satisfy our capital requirements in the future. We are highly leveraged, but we currently expect that our ongoing liquidity requirements for sustaining our operations will be satisfied by cash on hand and cash generated from our existing and future operations supplemented, where necessary, by available credit. However, we cannot provide assurances that our businesses will generate sufficient cash flow from operations in the future or that additional capital will be available in amounts sufficient to enable us to execute our business strategies. Our ability to increase our debt financing and/or renew existing credit facilities may be limited by our existing financial and non-financial covenants, credit objectives, or the conditions of the debt capital market generally. Furthermore, our current financing arrangements contain certain restrictive financial and non-financial covenants (e.g., the achievement or maintenance of stated financial ratios) that may impact our access to those facilities and significantly limit future operating and financial flexibility.
33
Our ability to obtain additional debt or equity financing or government grants to finance operating working capital requirements and growth initiatives may be limited or difficult to obtain, which could adversely affect our operations and financial condition.
We need capital to finance operating working capital requirements and growth initiatives and to pay our outstanding debt obligations as they become due for payment. If the cash generated from our businesses, together with the credit available under existing bank facilities, is not sufficient to fund future capital requirements, we will require additional debt or equity financing. Our ability to access capital markets on terms that are acceptable to us will be dependent on prevailing market conditions, as well as our future financial condition. Further, our ability to increase our debt financing and/or renew existing facilities may be limited by our existing leverage, financial and non-financial covenants, credit objectives and debt capital market conditions.
We have in the past, and may continue in the future to, receive government grants for research and development activities and other business initiatives. Any agreement or grant of this nature with government may be accompanied by contractual obligations applicable to us, which may result in the grant money becoming repayable if certain requirements are not met. A failure to meet contractual obligations under such agreements and grants and a consequent requirement to repay money received could negatively impact our results of operations and financial condition.
Our indebtedness and other contractual obligations could adversely affect our financial condition, our ability to raise additional capital to fund our operations, our ability to operate our business, our ability to react to changes in the economy or our industry and our ability to pay our debts and could divert our cash flow from operations for debt payments.
We have a significant amount of indebtedness and leverage. Our level of indebtedness increases the possibility that we may be unable to generate cash sufficient to pay the principal of, interest on, or other amounts due with respect to our indebtedness. Our long-term debt under our Syndicated Credit Facility bears interest at floating rates related to U.S. LIBOR (for U.S. dollar borrowings), plus a margin. As a result, our interest payment obligations on such indebtedness will increase if such interest rates increase to the extent these changes are not mitigated by our interest rate swaps. Our leverage and debt service obligations could adversely impact our business, including by:
| ● | impairing our ability to meet one or more of the financial ratios contained in our credit facilities or to generate cash sufficient to pay interest or principal, including periodic principal payments; |
| ● | increasing our vulnerability to general adverse economic and industry conditions; |
| ● | limiting our ability to obtain additional debt or equity financing on favorable terms, if at all; |
| ● | requiring the dedication of a portion of our cash flow from operations to service our debt, thereby reducing the amount of our cash flow available for other purposes, including capital expenditures, dividends to stockholders or to pursue future business opportunities; |
| ● | requiring us to sell debt or equity securities or to sell some of our core assets, possibly on unfavorable terms, to meet payment obligations; |
| ● | limiting our flexibility in planning for, or reacting to, changes in our business and the industries in which we compete; and |
| ● | placing us at a possible competitive disadvantage with less leveraged competitors and competitors that may have better access to capital resources. |
Any of the forgoing factors could have negative consequences on our financial condition and results of operation.
Our current financing arrangements contain certain restrictive covenants that impact our future operating and financial flexibility.
Our current financing arrangements contain certain restrictive covenants that may impact our future operating and financial flexibility. Our debt funding is provided under our financing agreements, which contains a series of positive and negative covenants with which we must comply, including financial and non-financial covenants. If we fail to comply with any covenants and are unable to obtain a waiver or other cure thereof, the lenders under the Syndicated Credit Facility or the holders of the 2023 Notes or 2027 Notes may be able to take certain actions with respect to the
34
amounts owing under such agreements or notes, as applicable, including requiring early payment thereof. Any such actions could have a material adverse effect on our financial condition. These covenants could also have the effect of limiting our flexibility in planning for or reacting to changes in our business and the markets in which we compete.
Our actual operating results may differ significantly from our guidance.
From time to time, we release guidance regarding our future performance that represents our management’s estimates as of the date of release. This guidance, which consists of forward-looking statements, is prepared by our management and is qualified by, and subject to, the assumptions and the other information contained or referred to in the release. Our guidance is not prepared with a view toward compliance with published guidelines of the American Institute of Certified Public Accountants, and neither any independent registered public accounting firm nor any other independent expert or outside party compiles, examines or reviews the guidance and, accordingly, no such person expresses any opinion or any other form of assurance with respect thereto.
Guidance is based upon a number of assumptions and estimates that, while presented with numerical specificity, is inherently subject to significant business, economic and competitive uncertainties and contingencies, many of which are beyond our control and are based upon specific assumptions with respect to future business decisions, some of which will change. We generally state possible outcomes as high and low ranges which are intended to provide a sensitivity analysis as variables are changed but are not intended to represent that actual results could not fall outside of these ranges. The principal reason that we release this data is to provide a basis for our management to discuss our business outlook with analysts and investors. We do not accept any responsibility for any projections or reports published by any such persons.
Guidance is necessarily speculative in nature, and it can be expected that some or all of the assumptions of the guidance furnished by us will not materialize or will vary significantly from actual results, particularly any guidance relating to the results of operations of acquired businesses or companies as our management will be less familiar with their business, procedures and operations. Accordingly, our guidance is only an estimate of what management believes is realizable as of the date of release. Actual results will vary from the guidance and the variations may be material. Investors should also recognize that the reliability of any forecasted financial data will diminish the farther in the future that the data are forecast. In light of the foregoing, investors are urged to put the guidance in context and not to place undue reliance on it.
Any failure to successfully implement our operating strategy or the occurrence of any of the events or circumstances set forth in this Annual Report on Form 10-K could result in the actual operating results being different than the guidance, and such differences may be adverse and material.
We could be adversely impacted by actions of activist stockholders, and such activism could impact the value of our securities.
We value constructive input from our stockholders and the investment community. However, there is no assurance that the actions taken by our Board of Directors and management in seeking to maintain constructive engagement with our stockholders will be successful. Certain of our stockholders have expressed views with respect to the operation of our business, our business strategy, corporate governance considerations or other matters. Responding to actions by activist stockholders can be costly and time-consuming, disrupting our operations and diverting the attention of management and our employees. The perceived uncertainties as to our future direction due to activist actions could affect the market price of our stock, result in the loss of potential business opportunities and make it more difficult to attract and retain qualified personnel, board members and business partners.
35
The price of our common stock has been volatile and may fluctuate substantially.
Our common stock is listed on the NYSE and the TSX and the price for our common stock has historically been volatile. The market price of our common stock may continue to be highly volatile and may fluctuate substantially due to the following factors (in addition to the other risk factors described in this section):
| ● | general economic conditions; |
| ● | fluctuations in our operating results; |
| ● | variance in our financial performance from the expectations of equity and/or debt research analysts; |
| ● | techniques employed by short sellers to drive down the market price of our common stock; |
| ● | conditions and trends in the markets we serve; |
| ● | additions of or changes to key employees; |
| ● | changes in market valuations or earnings of our competitors; |
| ● | trading volumes of our common stock; |
| ● | future sales of our equity securities and/or future issuances of indebtedness; |
| ● | changes in the estimation of the future sizes and growth rates of our markets; and |
| ● | legislation or regulatory policies, practices or actions. |
In addition, the stock markets in general have experienced extreme price and volume fluctuations that have at times been unrelated or disproportionate to the operating performance of the particular companies affected. Technical factors in the public trading market for our common stock may produce price movements that may or may not comport with macro, industry or company-specific fundamentals, including, without limitation, the sentiment of retail investors (including as may be expressed on financial trading and other social media sites), the amount and status of short interest in our common stock, access to margin debt and trading in options and other derivatives on our common stock. These market and industry factors may materially harm the market price of our common stock irrespective of our operating performance.
A significant or prolonged decrease in our market capitalization, including a decline in stock price, or a negative long-term performance outlook, could result in an impairment of our assets which results when the carrying value of our assets exceed their fair value.
In the past several years, our securities have been the subject of short selling. Reports and information have been published about us that we believe are mischaracterized or incorrect, and which have in the past been followed by a decline in our stock price. If there are short seller allegations in the future, we may have to expend a significant amount of resources to investigate such allegations and/or defend ourselves.
In addition, in the first quarter of 2019, we became subject to certain securities class action litigation as a result of volatility in the price of our common stock, which could result in substantial costs and diversion of management’s attention and resources and could harm our stock price, business, prospects, results of operations and financial condition. See Part I, Item 3, “Legal Proceedings” in this Annual Report on Form 10-K for additional information.
Uncertainty with respect to the cessation of the London Interbank Offered Rate (“LIBOR”) at the end of 2021 could impact our cost of borrowing and interest rate risk.
We have outstanding debt and interest rate swaps with variable interest rates using LIBOR as a factor to determine the interest rates. In July 2017, the United Kingdom’s Financial Conduct Authority announced that it intends to stop persuading or compelling banks to submit LIBOR rates after 2021. In addition, on March 5, 2021, the ICE Benchmark Administration confirmed its intention to cease publication of (i) one week and two month USD LIBOR settings after December 31, 2021 and (ii) the remaining USD LIBOR settings after June 30, 2023. It is unclear if at that time whether or not LIBOR will cease. Recent proposals for alternative overnight and term rates may result in the establishment of new methods of calculating one or more alternative benchmark rates.
36
In the United States, the Alternative Reference Rate Committee ("ARRC"), a group of diverse private-market participants assembled by the Federal Reserve Board and the Federal Reserve Bank of New York, has begun publishing a Secured Overnight Financing Rate (“SOFR”), and has proposed a paced market transition to SOFR from LIBOR. SOFR is a broad measure of the cost of borrowing cash overnight collateralized by Treasury securities in the repurchase agreement market. Since the initial publication of SOFR, daily changes in the rate have, on occasion, been more volatile than daily changes in comparable benchmark or market rates, and SOFR over time may bear little or no relation to the historical actual or historical indicative data. At this time, it is not possible to predict how markets will respond to SOFR or the effect of any changes to LIBOR or the discontinuation of LIBOR.
The cessation of LIBOR, including the exact timing of its cessation, as well as its transition to another benchmark rate, or rates, could have adverse impacts on our outstanding interest rate swaps maturing in 2022 and 2023 and our Syndicated Credit Facility maturing in 2023 and 2024. This change may necessitate updates to our swaps and Syndicated Credit Facility, and ultimately, adversely affect our financial condition and results of operations. For example, if future rates based upon a successor reference rate such as SOFR (or a new method of calculating LIBOR) are higher or more volatile than LIBOR rates as currently determined or if our lenders have increased costs due to changes in LIBOR, we may experience increases in interest rates on our variable rate debt, which could adversely impact our interest expense, results of operations and cash flows.
If securities or industry analysts discontinue publishing research or reports about our business, or publish negative reports about our business, our stock price and trading volume could decline.
The trading market for our common stock depends in part on the research and reports that securities or industry analysts publish about us, our business, our market and our competitors. We do not have any control over these analysts. If one or more of the analysts who cover us downgrade our stock or change their opinion of our stock, our stock price would likely decline. If one or more of these analysts cease coverage of our company or fail to regularly publish reports on us, we could lose visibility in the financial markets, which could cause our stock price or trading volume to decline.
Our amended and restated certificate of incorporation and our amended and restated bylaws may impede or discourage a takeover, changes in management or changes in the Board of Directors, which could reduce the market price of our common stock.
Certain provisions in our amended and restated certificate of incorporation and our amended and restated bylaws may delay or prevent a third-party from acquiring control of us, even if a change in control would be beneficial to our existing stockholders. These provisions include:
| ● | no cumulative voting in the election of directors, which limits the ability of minority stockholders to elect director candidates; |
| ● | the exclusive right of the Board of Directors to elect a director to fill a vacancy created by the expansion of the Board of Directors or the resignation, death or removal of a director, which prevents stockholders from being able to fill vacancies on the Board of Directors; |
| ● | the ability of the Board of Directors to issue shares of preferred stock and to determine the price and other terms of those shares, including preferences and voting rights, without stockholder approval, which could be used to significantly dilute the ownership of a hostile acquirer; |
| ● | a prohibition on stockholder action by written consent, which forces stockholder action to be taken at an annual or special meeting of stockholders; |
| ● | the requirement that a special meeting of stockholders may be called only by the chairman of the Board of Directors or two or more stockholders who hold, in the aggregate, at least ten percent (10%) of the voting power of our outstanding shares, which may delay the ability of our stockholders to force consideration of a proposal or to take action, including the removal of directors; |
| ● | a supermajority vote of our stockholders to amend our amended and restated bylaws and certain provisions of our amended and restated certificate of incorporation; and |
| ● | advance notice procedures that stockholders must comply with in order to nominate candidates to the Board of Directors or to propose matters to be acted upon at a stockholders’ meeting, which may discourage or deter a |
37
| potential acquirer from conducting a solicitation of proxies to elect the acquirer’s own slate of directors or otherwise attempting to obtain control of our business. |
These provisions could impede a merger, takeover or other business combination involving us or discourage a potential acquirer from making a tender offer for our common stock, which, under certain circumstances, could reduce the market price of our common stock.
In addition, our amended and restated certificate of incorporation requires, to the fullest extent permitted by law, that derivative actions brought in our name, actions against our directors, officers and employees for breach of fiduciary duty and other similar actions may be brought only in the Court of Chancery in the State of Delaware (the “Delaware Exclusive Forum Provision”). Our amended and restated bylaws further provide that the federal district courts of the United States of America will, to the fullest extent permitted by law, be the exclusive forum for resolving any complaint asserting a cause of action under the Securities Act of 1933, as amended (the “Federal Forum Provision”).
The Delaware Exclusive Forum Provision is intended to apply to claims arising under Delaware state law and would not apply to claims brought pursuant to the Exchange Act or the Securities Act or any other claim for which the federal courts have exclusive jurisdiction. In addition, the Federal Forum Provision is intended to apply to claims arising under the Securities Act and would not apply to claims brought pursuant to the Exchange Act. These exclusive forum provisions will not relieve us of our duties to comply with the federal securities laws and the rules and regulations thereunder and, accordingly, actions by our stockholders to enforce any duty or liability created by the Exchange Act or the rules and regulations thereunder must be brought in federal courts.
These exclusive forum provisions may limit a stockholders’ ability to bring a claim in a judicial forum of its choosing for disputes with the company or its directors, officers or other employees, which may discourage lawsuits against the Company and its directors, officers and other employees. In addition, stockholders who do bring a claim in the Court of Chancery of the State of Delaware pursuant to the Delaware Exclusive Forum Provision could face additional litigation costs in pursuing any such claim, particularly if they do not reside in or near Delaware. The court in the designated forum under our exclusive forum provisions may also reach different judgments on results than would other courts, including courts where a stockholder would otherwise choose to bring the action, and such judgments or results may be more favorable to the Company than to our stockholders. Further, the enforceability of similar exclusive forum provisions in other companies’ organizational documents has been challenged in legal proceedings, and it is possible that a court could find any of our exclusive forum provisions to be inapplicable to, or unenforceable in respect of, one or more of the specified types of actions or proceedings. If a court were to find all or any part of our exclusive forum provisions to be inapplicable or unenforceable in an action, we might incur additional costs associated with resolving such action in other jurisdictions.
There can be no assurance that we will continue to pay dividends on our common stock.
Our Board of Directors significantly reduced our dividends in the first quarter of 2019. Although our Board of Directors has historically declared a quarterly cash dividend which we have paid, the payment of future dividends is subject to a number of risks and uncertainties, and we may not pay quarterly dividends in the same amounts or at all in the future. The declaration, amount and timing of cash dividends are subject to capital availability and determinations by our Board of Directors that such dividends are in the best interest of our stockholders and are in compliance with all respective laws and applicable agreements. Our ability to pay dividends will depend upon, among other factors, our cash balances and potential future capital requirements for strategic transactions, including acquisitions, debt service requirements, results of operations, financial condition and other factors that our Board of Directors may deem relevant. The elimination of our dividend payments and/or our dividend program could have a negative effect on our stock price.
Risks Related to Legal and Regulatory Matters
Our operations in the U.S. government market are subject to significant regulatory risk.
Our operations in the U.S. government market are subject to significant government regulation. A failure by us to maintain the relevant clearances and approvals could limit our ability to operate in the U.S. market. Further, there can be
38
no assurance that we will continue to be awarded contracts by the U.S. government. In addition, a failure by us to keep current and compliant with relevant U.S. regulations could result in fines, penalties, repayments, or suspension or debarment from U.S. government contracting or subcontracting for a period of time and could have an adverse effect on our standing and eligibility for future U.S. government contracts.
Failure to comply with the requirements of the National Industrial Security Program Operating Manual could result in interruption, delay or suspension of our ability to provide our products and services, and could result in loss of current and future business with the U.S. government.
We and our subsidiaries are parties to certain contracts with various departments and agencies of the U.S. government, including the U.S. Department of Defense, which require that certain of our legal entities be issued facility security clearances under the National Industrial Security Program. The National Industrial Security Program requires that a corporation maintaining a facility security clearance be effectively insulated from foreign ownership, control or influence (“FOCI”). Prior to the U.S. Domestication, we were incorporated under the laws of Canada, and had entered into a Security Control Agreement, dated January 26, 2017, by and among us, our wholly owned subsidiary, Maxar Technologies Holdings Inc. and the U.S. Department of Defense (“SCA”), as a suitable FOCI mitigation arrangement under the National Industrial Security Program Operating Manual. Upon U.S. Domestication, the SCA was dissolved and we entered into a Board Resolution to mitigate remaining FOCI risks as seen by the U.S. government. Failure to maintain an agreement with the U.S. Department of Defense regarding the appropriate FOCI mitigation arrangement could result in invalidation or termination of the facility security clearances, which in turn would mean that our U.S. subsidiaries would not be able to enter into future contracts with the U.S. government requiring facility security clearances, and may result in the loss of the ability of those subsidiaries to complete existing contracts with the U.S. government.
Our business is subject to various regulatory risks that could adversely affect our operations.
The environment in which we operate is highly regulated due to the sensitive nature of our complex and technologically advanced systems, including satellites, products, hardware and software, in addition to those regulations broadly applicable to publicly listed corporations. There are numerous regulatory risks that could adversely affect operations, including but not limited to:
| ● | Changes in laws and regulations. It is possible that the laws and regulations governing our business and operations will change in the future. A substantial portion of our revenue is generated from customers outside of the U.S. There may be a material adverse effect on our financial condition and results of operations if we are required to alter our business to comply with changes in both domestic and foreign regulations, telecommunications standards, foreign policy, tariffs or taxes and other trade barriers that reduce or restrict our ability to sell our products and services on a global basis, or by political and economic instability in the countries in which we conduct business. Any failure to comply with such regulatory requirements could also subject us to various fines, penalties or sanctions. |
| ● | Export Restrictions. Certain of our businesses and satellites, systems, products, services or technologies we have developed require the implementation or acquisition of products or technologies from third parties, including those in other jurisdictions. In addition, certain of our satellites, systems, products or technologies may be required to be forwarded or exported to other jurisdictions. In certain cases, if the use of the technologies can be viewed by the jurisdiction in which that supplier or subcontractor resides as being subject to export constraints or restrictions relating to national security, we may not be able to obtain the technologies and products that we require from suppliers or subcontractors who would otherwise be our preferred choice or may not be able to obtain the export permits necessary to transfer or export our technology. To the extent that we are able, we obtain pre-authorization for re-export prior to signing contracts which oblige us to export subject technologies, including specific foreign government approval as needed. In the event of export restrictions, we may have the ability through contract force majeure provisions to be excused from our obligations. Notwithstanding these provisions, the inability to obtain export approvals, export restrictions or changes during contract execution or non-compliance by our customers could have an adverse effect on our revenues and margins. |
39
| ● | U.S. Government Approval Requirements. For certain aspects of our business operations, we are required to obtain U.S. government licenses and approvals to enter into agreements or engage in commercial transactions with various end users (including government bodies) in order to export satellites and related equipment, disclose technical data or provide defense services to foreign persons. The delayed receipt of or the failure to obtain the necessary U.S. government licenses, approvals and agreements may prohibit entry into or interrupt the completion of contracts which could lead to a customer’s termination of a contract for default, monetary penalties and/or the loss of incentive payments. |
| ● | Competitive Impact of U.S. Regulations on Satellite Sales. Some of our customers and potential customers, along with insurance underwriters and brokers, have asserted that U.S. export control laws and regulations governing disclosures to foreign persons excessively restrict their access to information about the satellite during construction and on-orbit. Office of Foreign Assets Control (“OFAC”) sanctions and requirements may also limit certain business opportunities or delay or restrict our ability to contract with potential foreign customers or operators. To the extent that our non-U.S. competitors are not subject to OFAC or similar export control or economic sanctions laws and regulations, they may enjoy a competitive advantage with foreign customers, and it could become increasingly difficult for the U.S. satellite manufacturing industry, including us, to recapture this lost market share. Customers concerned over the possibility that the U.S. government may deny the export license necessary for us to deliver their purchased satellite to them, or the restrictions or delays imposed by the U.S. government licensing requirements, even where an export license is granted, may elect to choose a satellite that is purportedly free of International Traffic in Arms Regulations (“ITAR”) offered by a non-U.S. supplier. We are further disadvantaged by the fact that a purportedly “ITAR-free” satellite may be launched less expensively in China on the Chinese Long March rocket, a launch vehicle that, because of ITAR restrictions, is not available to us. |
| ● | Anti-Corruption Laws. As part of the regulatory and legal environments in which we operate, we are subject to global anti-corruption laws that prohibit improper payments directly or indirectly to government officials, authorities or persons defined in those anti-corruption laws in order to obtain or retain business or other improper advantages in the conduct of business. Our policies mandate compliance with anti-corruption laws. Failure by our employees, agents, subcontractors, suppliers and/or partners to comply with anti-corruption laws could impact us in various ways that include, but are not limited to, criminal, civil and administrative fines and/or legal sanctions and the inability to bid for or enter into contracts with certain entities, all of which could have a significant adverse effect on our reputation, operations and financial results. |
Changes in tax law, in our tax rates or in exposure to additional income tax liabilities or assessments may materially and adversely affect our financial condition, results of operations and cash flows.
Changes in law and policy relating to taxes, including those with retroactive effect, may materially and adversely affect our financial condition, results of operations and cash flows. For example, the Administration and Congress could make changes to existing tax law, such as increasing the corporate tax rate and enacting a minimum tax on worldwide book income. We continue to monitor tax law developments and assess the impact on the Company.
The U.S. enacted the Tax Cuts and Jobs Act of 2017 (“2017 Tax Act”) on December 22, 2017, which significantly changed the U.S. federal income taxation of U.S. corporations. The 2017 Tax Act remains unclear in many respects and has been, and may continue to be, the subject of amendments and technical corrections, as well as interpretations and implementing regulations by the Treasury and IRS, which have mitigated or increased certain adverse impacts of the 2017 Tax Act and may continue to do so in the future.
Our ability to use our U.S. federal and state net operating loss carryforwards and certain other tax attributes may be limited.
As of December 31, 2021, we had approximately $520 million, $874 million and $12 million of federal, state and foreign net operating loss (“NOL”) carryforwards and $83 million of U.S. tax credit carryforwards primarily related to research and development expenditures, net of unrecognized tax benefits.
40
Under Sections 382 and 383 of the Internal Revenue Code of 1986, as amended (“Code”), if a corporation undergoes an “ownership change,” the corporation’s ability to use its pre-change U.S. federal NOL carryforwards and other tax attributes (such as research tax credits) to offset its post-change income and taxes may be limited. In general, an “ownership change” occurs if there is a greater than 50 percentage point change (by value) in a corporation’s equity ownership by certain stockholders over a rolling three-year period. Similar provisions of state tax law may also apply to limit our use of accumulated state tax attributes. While we do not believe that we have experienced ownership changes in the past that would materially limit our ability to utilize our NOL carryforwards, the Section 382 rules are complex and there is no assurance our view is correct. In the event that we experience ownership changes in the future, our ability to use pre-change NOL carryforwards and other tax attributes to offset post-change taxable income will be subject to limitations. As a result, we may be unable to use a material portion of our NOL carryforwards and other tax attributes, which could adversely affect our future cash flows.
Our operations are subject to governmental law and regulations relating to environmental matters, which may expose us to significant costs and liabilities that could negatively impact our financial condition.
We are subject to various federal, state, provincial and local environmental laws and regulations relating to the operation of our businesses, including those governing pollution, the handling, storage, disposal and transportation of hazardous substances and the ownership and operation of real property. In addition, we could be affected by future regulations imposed in response to concerns over climate change, other aspects of the environment or natural resources. We have been designated, along with other companies, as a named discharger potentially responsible for the cleanup of groundwater contamination at certain sites in California where we operate and there can be no assurance that the previous owners of those properties strictly complied with such environmental laws and regulations. Such laws and regulations may result in significant liabilities and costs to us due to the actions or inactions of the previous owners. In addition, new laws and regulations, more stringent enforcement of existing laws and regulations or the discovery of previously unknown contamination could result in additional costs.
We have incurred and will continue to incur increased costs and demands in order to comply with laws and regulations applicable to public companies.
In January 2019, we became a “domestic issuer” for SEC reporting purposes and a reporting issuer in each of the jurisdictions in Canada in which Maxar Canada was a reporting issuer. The obligations of being a public company in the U.S. and Canada require significant expenditures and will place significant demands on our management and other personnel, including costs resulting from public company reporting obligations under the U.S. Securities Exchange Act of 1934, as amended, applicable Canadian securities laws, and the rules and regulations regarding corporate governance practices, including those under the Sarbanes-Oxley Act of 2002, the Dodd-Frank Wall Street Reform and Consumer Protection Act, and the listing requirements of the NYSE and the TSX. These rules require that we maintain effective disclosure and financial controls and procedures, internal control over financial reporting and changes in corporate governance practices, among many other complex rules that are often difficult to monitor and maintain compliance with. Additionally, new standards, as well as investor expectations are developing around environmental, social and governance matters (“ESG”) and other emerging socioeconomic trends and matters, which require continual monitoring and compliance. Our management and other personnel will continue to devote a substantial amount of time to ensure compliance with all of these requirements and to keep pace with new regulations, otherwise we may fall out of compliance and risk becoming subject to reputational damage, litigation or being delisted, among other potential problems.
Our international business exposes us to risks relating to regulation, currency fluctuations and political or economic instability in foreign markets, which could adversely affect our revenue, earnings, cash flows and our financial condition.
A significant portion of our revenue is derived from non-U.S. sales, and we intend to continue to pursue international contracts. International operations are subject to certain risks, such as: changes in domestic and foreign governmental regulations and licensing requirements; deterioration of relations between the U.S. and/or a particular foreign country; increases in tariffs and taxes and other trade barriers; foreign currency fluctuations; changes in political and economic stability both in the U.S. and internationally; effects of austerity programs or similar significant budget reduction
41
programs; potential preferences by prospective customers to purchase from local (non-U.S.) sources; difficulties in obtaining or enforcing judgments in foreign jurisdictions; and unforeseen developments and conditions, including war, epidemics and pandemics and international tensions and conflicts.
In addition, our international contracts may include industrial cooperation agreements requiring specific in-country purchases, investments, manufacturing agreements or other financial obligations, known as offset obligations, and provide for penalties if we fail to meet such requirements. The impact of these factors is difficult to predict, but one or more of them could adversely affect our financial position, results of operations, or cash flows.
Exposure to United Kingdom political developments, including the effect of its withdrawal from the European Union, could be costly and difficult to comply with and could harm our business.
In June 2016, a referendum was passed in the United Kingdom to leave the European Union, commonly referred to as “Brexit.” This decision created an uncertain political and economic environment in the United Kingdom and other European Union countries. The United Kingdom formally left the European Union on January 31, 2020 and the transition period provided for in the withdrawal agreement entered by the United Kingdom and the European Union ended on December 31, 2020. In December 2020, the United Kingdom and the European Union agreed on a trade and cooperation agreement that will apply provisionally after the end of the transition period until it is ratified by the parties to the agreement. On December 31, 2020, the United Kingdom passed legislation giving effect to the trade and cooperation agreement, with the European Union formally adopting the agreement in April 2021. The trade and cooperation agreement covers the general objectives and framework of the relationship between the United Kingdom and the European Union. Depending on the application of the terms of the trade and cooperation agreement, we could face new regulatory costs and challenges.
Our United Kingdom operations service customers in the United Kingdom as well as in other countries in the EU, and these operations could be disrupted by Brexit. The political and economic instability created by Brexit has caused and may continue to cause significant volatility in global financial markets and uncertainty regarding the regulation of data protection in the United Kingdom. In particular, the United Kingdom enacted a Data Protection Act in May 2018 that is consistent with the EU General Data Protection Regulation. In June 2021, the European Union determined that the United Kingdom’s Data Protection Act was adequate to permit the flow of certain data between the European Union and the United Kingdom without additional restrictions for a period of up to four years. This decision temporarily reduces the uncertainty surrounding how data transfers between the European Union and the United Kingdom will be regulated. Brexit could also have the effect of disrupting the free movement of goods, services, capital and people between the United Kingdom, the European Union and elsewhere including, for example, the United Kingdom’s documentation requirements on goods imported from the European Union.
ITEM 1B. UNRESOLVED STAFF COMMENTS
None.
ITEM 2.PROPERTIES
Our corporate headquarters are located at a leased facility in Westminster, Colorado. As of December 31, 2021, we had approximately two million square feet of total leased floor space at multiple locations in the United States, Europe, the Middle East and Asia, used for manufacturing, warehousing, research and testing, administrative and various other uses.
As of December 31, 2021, we had major operations in the following locations:
Space Infrastructure
Our Space Infrastructure segment primarily operates out of multiple locations in California. We lease approximately one million square feet of manufacturing and office space.
42
Earth Intelligence
Our Earth Intelligence segment primarily operates out of our U.S. locations in Colorado, Virginia, Michigan, Florida and Missouri, our Sweden location and small sales offices located internationally. We lease approximately one million square feet of office and operations space.
We maintain our properties in good operating condition and believe that the productive capacity of our properties is adequate to meet our current requirements and those for the foreseeable future. See Note 10, “Leases”, to the Consolidated Financial Statements in Part II, Item 8, “Financial Statements and Supplementary Data” for additional information regarding our lease commitments.
ITEM 3.LEGAL PROCEEDINGS
Currently, we are involved in a number of legal proceedings. For a discussion of material legal proceedings, see Note 23, “Commitments and Contingencies” to the Consolidated Financial Statements in Part II, Item 8, “Financial Statements and Supplementary Data” in this Annual Report on Form 10-K, which is hereby incorporated by reference.
ITEM 4.MINE SAFETY DISCLOSURE
Not applicable.
ITEM 5.MARKET FOR REGISTRANT’S COMMON EQUITY, RELATED STOCKHOLDER MATTERS AND ISSUER PURCHASES OF EQUITY SECURITIES
Maxar’s common stock trades on the NYSE and TSX under the ticker “MAXR”. As of February 16, 2022, there were approximately 92 stockholders of record of our common stock. This stockholder figure does not include a substantially greater number of "street name" holders or beneficial holders of our common stock whose shares are held of record by banks, brokers and other financial institutions.
Dividends
Dividends are declared at the discretion of our board of directors and will depend on our financial position, results of operations, cash flows, capital requirements, credit facility and other indebtedness covenants (which include limits on distributions by us), applicable law and other factors as our board of directors deems relevant. Holders of our common stock receive dividends when and as declared by our board of directors. We may modify, suspend, or cancel our cash dividends in any manner and at any time. We declared and paid dividends of $0.04 per share of common stock during 2021 and 2020.
ITEM 6.[RESERVED]
43
ITEM 7.MANAGEMENT’S DISCUSSION AND ANALYSIS OF FINANCIAL CONDITION AND RESULTS OF OPERATIONS
OVERVIEW
We are a provider of comprehensive space solutions and secure, precise, geospatial intelligence. We help government and commercial customers monitor, understand and navigate our changing planet; deliver global broadband communications; and explore and advance the use of space. Our approach combines decades of deep mission understanding and a proven commercial and defense foundation to deploy solutions and deliver insights with speed, scale and cost effectiveness. Our businesses are organized and managed in two reportable segments: Earth Intelligence and Space Infrastructure, as described below under “Segment Results”.
RECENT DEVELOPMENTS
Common stock offering
On March 22, 2021, we completed an underwritten public offering of 10 million shares of our common stock at a public offering price of $40 per share (“Offering”). We received proceeds of $380 million, net of $20 million of transaction fees. The underwriters did not exercise the option to purchase an additional 1.5 million shares of our common stock prior to the expiration of the option.
On March 26, 2021, we redeemed $350 million aggregate principal amount of our 9.75% Senior Secured Notes due 2023 (“2023 Notes”) using a portion of the net proceeds from the Offering. Additionally, we paid premiums of approximately $34 million related to the early redemption.
COVID-19 operational posture and current impact
We continue to monitor and adapt our pandemic crisis response plan, while maintaining a focus on the protection of the health and safety of our employees, families, customers and communities. All our locations continue to operate through a combination of work from home and personnel working on-site, though in some cases capacity utilization and productivity are below normalized levels. We are observing stress in our supplier base inside and outside the U.S. and will continue to monitor and assess the actual and potential COVID-19 impacts on employees, customers, suppliers and the productivity of the work being done, all of which to some extent will affect revenues, estimated costs to complete projects, earnings and cash flow. Our results of operations for the year ended December 31, 2021, were not materially impacted by COVID-19.
Changes in our operations in response to COVID-19 and employee illnesses resulting from the pandemic have resulted in inefficiencies and delays of our projects, impacts to service level contracts, including in sales and product development efforts and additional costs related to business continuity initiatives that cannot be fully mitigated through succession planning or employees working remotely. We have delayed transition of our employees back into Maxar worksites due to increases in COVID-19 cases in the broad population. Additionally, to provide for the health and safety of our workforce and business continuity, we have implemented a Vaccination Policy which requires that Maxar employees are vaccinated for COVID-19 unless they have an approved accommodation. As of January 4, 2022, 99% of our U.S. based employees were in compliance with this policy and have either been vaccinated or received an accommodation.
WorldView Legion satellites update
We continue to make progress during the test and integration phase. During January 2022, we experienced delays related to COVID-19 protocols and now, assuming no major issues arise, anticipate the first launch of the WorldView Legion satellites in the June to July, 2022 timeframe. We plan on having three launches in total and expect the second and third launches to be within three and six months, respectively, after the first launch.
44
SEGMENT RESULTS
Our Chief Operating Decision Maker measures performance of our reportable segments based on revenue and Adjusted EBITDA. Our operating and reportable segments are: Earth Intelligence and Space Infrastructure.
Earth Intelligence
In the Earth Intelligence segment, we are a global leader in high-resolution space-based Earth observation imagery products and analytics. We launched the world’s first high-resolution commercial imaging satellite in 1999 and currently operate a four-satellite imaging constellation, providing us with over two decades and approximately 137 petabytes of imagery over our history (referred to as our “Image Library”) of the highest-resolution, commercially available imagery. Our imagery solutions provide customers with timely, accurate and mission-critical information about our changing planet and support a wide variety of government and enterprise applications, including mission planning, mapping and analysis, environmental monitoring, disaster management, crop management, oil and gas exploration and infrastructure management. We continue to innovate as demands for new satellite technology and advanced analytic tools increase. We are a leader in commercial satellite imagery, and our commitment to accuracy, clarity and recency of foundational mapping enables us to provide the highest quality imagery basemaps for our customers. The high-quality satellite also enables us to provide advanced 3D modeling for augmented reality (“AR”), virtual reality (“VR”) and interactive engagement through our Precision3D Suite of tools. The U.S. government is the largest customer of our Earth Intelligence segment through the EnhancedView Contract, G-EGD and OWT programs and various classified and unclassified contract vehicles. In the commercial satellite Earth observation industry, we are a leader across U.S. government agencies, international government agencies and enterprise customer verticals.
We also provide geospatial services that combine imagery, analytic expertise and innovative technology to deliver intelligence solutions to customers. Our approximately 1,700 cleared personnel support analytic solutions that accurately document change and enable geospatial modeling and analysis that help predict where events will occur. Our primary customer of geospatial services is the U.S. government, but we also support intelligence requirements for other U.S. allied governments, global development organizations and enterprise customers.
Space Infrastructure
In the Space Infrastructure segment, we provide solutions for communications, Earth observation, remote sensing, on-orbit servicing, robotic assembly and space exploration. We address a broad spectrum of needs for our customers, including mission systems engineering, product design, spacecraft manufacturing, assembly, integration and testing. Our principal customers in the Space Infrastructure segment are commercial satellite operators and government agencies worldwide. Our approach combines proven success gained over six decades in the industry with the nimbleness and agility of a smaller space company.
45
RESULTS OF OPERATIONS
The following table provides selected annual financial information for the years ended December 31, 2021, 2020 and 2019.
Year Ended December 31, | $ Change | % Change | $ Change | % Change | ||||||||||||||||||
| 2021 |
| 2020 | 2019 |
| 2020 to 2021 | 2019 to 2020 | |||||||||||||||
($ millions) |
|
|
|
| ||||||||||||||||||
Revenues: | ||||||||||||||||||||||
Product | $ | 678 | $ | 633 | $ | 560 | $ | 45 | 7 | % | $ | 73 | 13 | % | ||||||||
Service | 1,092 | 1,090 | 1,106 | 2 | 0 | (16) | (1) | |||||||||||||||
Total revenues | $ | 1,770 | $ | 1,723 | $ | 1,666 | $ | 47 | 3 | % | $ | 57 | 3 | % | ||||||||
Costs and expenses: | ||||||||||||||||||||||
Product costs, excluding depreciation and amortization | 601 | 615 | 593 | (14) | (2) | 22 | 4 | |||||||||||||||
Service costs, excluding depreciation and amortization | 383 | 378 | 382 | 5 | 1 | (4) | (1) | |||||||||||||||
Selling, general and administrative | 369 | 332 | 325 | 37 | 11 | 7 | 2 | |||||||||||||||
Depreciation and amortization | 290 | 348 | 376 | (58) | (17) | (28) | (7) | |||||||||||||||
(Gain) loss on orbital receivables allowance | (49) | 14 | 14 | (63) | * | - | - | |||||||||||||||
Impairment loss | — | 33 | — | (33) | (100) | 33 | * | |||||||||||||||
Satellite insurance recovery | — | — | (183) | — | * | 183 | (100) | |||||||||||||||
Loss (gain) on sale of assets | — | 1 | (136) | (1) | (100) | 137 | (101) | |||||||||||||||
Operating income | $ | 176 | $ | 2 | $ | 295 | $ | 174 | * | % | $ | (293) | (99) | % | ||||||||
Interest expense, net | 151 | 175 | 219 | (24) | (14) | (44) | (20) | |||||||||||||||
Other income, net | (8) | (104) | (1) | 96 | (92) | (103) | * | |||||||||||||||
Income (loss) before taxes | $ | 33 | $ | (69) | $ | 77 | $ | 102 | (148) | % | $ | (146) | (190) | % | ||||||||
Income tax (benefit) expense | (13) | (22) | 5 | 9 | (41) | (27) | * | |||||||||||||||
Equity in income from joint ventures, net of tax | — | (1) | (11) | 1 | (100) | 10 | (91) | |||||||||||||||
Income (loss) from continuing operations | $ | 46 | $ | (46) | $ | 83 | $ | 92 | (200) | % | $ | (129) | (155) | % | ||||||||
Discontinued operations: | ||||||||||||||||||||||
Income from operations of discontinued operations, net of tax | — | 32 | 26 | (32) | (100) | 6 | 23 | |||||||||||||||
Gain on disposal of discontinued operations, net of tax | — | 317 | — | (317) | (100) | 317 | * | |||||||||||||||
Income from discontinued operations, net of tax | — | 349 | 26 | (349) | (100) | 323 | * | |||||||||||||||
Net income | $ | 46 | $ | 303 | $ | 109 | $ | (257) | (85) | % | $ | 194 | 178 | % | ||||||||
*Not meaningful.
Product and service revenues
Year Ended December 31, | $ Change |
|
| % Change | $ Change |
|
| % Change | ||||||||||||||
| 2021 |
| 2020 |
| 2019 |
| 2020 to 2021 |
| 2019 to 2020 | |||||||||||||
($ millions) | ||||||||||||||||||||||
Product revenues |
| $ | 678 | $ | 633 | $ | 560 | $ | 45 | 7 | % | $ | 73 | 13 | % | |||||||
Service revenues | 1,092 | 1,090 | 1,106 | 2 | 0 | (16) | (1) | |||||||||||||||
Total revenues |
| $ | 1,770 | $ | 1,723 | $ | 1,666 | $ | 47 | 3 | % | $ | 57 | 3 | % | |||||||
Total revenues increased to $1,770 million from $1,723 million, or by $47 million, for the year ended December 31, 2021 compared to 2020. The increase was primarily driven by an increase in revenues in our Space Infrastructure and Earth Intelligence segments.
46
Total revenues increased to $1,723 million from $1,666 million, or by $57 million, for the year ended December 31, 2020 compared to 2019. The increase was primarily driven by an increase in revenue in our Space Infrastructure segment partially offset by a decrease in revenue in our Earth Intelligence segment. The revenue decrease in our Earth Intelligence segment was primarily driven by a $40 million decrease in the recognition of deferred revenue related to the EnhancedView Contract. We recognized $120 million of deferred revenue from the EnhancedView Contract for the year ended December 31, 2019, compared to $80 million for the year ended December 31, 2020, as it was fully recognized as of August 31, 2020.
Further discussion of the drivers behind the increase in revenues is included within the “Results by Segment” section below.
See Note 16, “Revenues” to the Consolidated Financial Statements in Part II, Item 8, “Financial Statements and Supplementary Data” for product and service revenues by segment.
Product and service costs
Year Ended December 31, | $ Change |
| % Change | $ Change | % Change | ||||||||||||||||||
| 2021 |
| 2020 |
| 2019 |
|
| 2020 to 2021 |
| 2019 to 2020 | |||||||||||||
($ millions) |
|
| |||||||||||||||||||||
Product costs, excluding depreciation and amortization |
| $ | 601 |
| $ | 615 | $ | 593 | $ | (14) | (2) | % | $ | 22 | 4 | % | |||||||
Service costs, excluding depreciation and amortization | 383 | 378 | 382 | 5 | 1 | (4) | (1) | ||||||||||||||||
Total costs |
| $ | 984 |
| $ | 993 | $ | 975 | $ | (9) | (1) | % | $ | 18 | 2 | % | |||||||
Total cost of product and services decreased to $984 million from $993 million, or by $9 million, for the year ended December 31, 2021 compared to 2020. The decrease in costs was driven by a decrease in product costs within our Space Infrastructure segment partially offset by an increase in service costs within our Earth Intelligence segment.
Total cost of product and services increased to $993 million from $975 million, or by $18 million, for the year ended December 31, 2020 compared to 2019. The increase in costs was primarily driven by an increase in costs within our Earth Intelligence segment partially offset by a decrease within our Space Infrastructure segment.
Selling, general and administrative
Year Ended December 31, | $ Change |
|
| % Change |
| $ Change | % Change | |||||||||||||||
| 2021 |
| 2020 |
| 2019 |
| 2020 to 2021 | | 2019 to 2020 | |||||||||||||
($ millions) |
|
| ||||||||||||||||||||
Selling, general and administrative |
| $ | 369 |
| $ | 332 | $ | 325 | $ | 37 |
| 11 | % | $ | 7 | 2 | % | |||||
Selling, general and administrative costs increased to $369 million from $332 million, or by $37 million, for the year ended December 31, 2021 compared to 2020. The increase was primarily due to an increase in labor related expenses of $28 million, an increase in research and development expenses within the Space Infrastructure segment of $11 million and an increase in other expenses of $4 million. The increase in labor related expenses was primarily driven by an increase in headcount, employee compensation and fringe benefits. These increases were partially offset by a $6 million decrease in transaction and integration related expenses.
Selling, general and administrative costs increased to $332 million from $325 million, or by $7 million, for the year ended December 31, 2020 compared to 2019. The increase was primarily due to an increase in stock-based compensation expense of $23 million. Stock-based compensation expense increased primarily due to a higher stock price. The increase was also due to an increase in labor related expenses of $16 million driven primarily by an increase in headcount and employee compensation. These increases were partially offset by a $15 million decrease in restructuring expenses, a $9 million decrease in transaction and integration related expenses and a $7 million decrease in travel related expenses driven by our COVID-19 operating posture.
47
Depreciation and amortization
Year Ended December 31, | $ Change | % Change | $ Change | % Change | ||||||||||||||||||
| 2021 |
| 2020 |
| 2019 |
| 2020 to 2021 | | 2019 to 2020 | |||||||||||||
($ millions) |
|
|
| |||||||||||||||||||
Property, plant and equipment |
| $ | 86 |
| $ | 93 | $ | 107 | $ | (7) | (8) | % | $ | (14) | (13) | % | ||||||
Intangible assets |
| 204 |
| 255 | 269 | (51) | (20) | (14) | (5) | |||||||||||||
Depreciation and amortization expense |
| $ | 290 |
| $ | 348 | $ | 376 | $ | (58) | (17) | % | $ | (28) | (7) | % | ||||||
Depreciation and amortization expense decreased to $290 million from $348 million, or by $58 million, for the year ended December 31, 2021 compared to 2020. The decrease was primarily driven by a decrease in amortization expense for backlog acquired as part of the acquisition of DigitalGlobe, Inc. on October 5, 2017. We recognized ten months of amortization expense for the year ended December 30, 2020, compared to none for the year ended December 31, 2021, as all of the U.S. government acquired backlog was fully amortized as of October 2020. The decrease was also driven by a decrease in depreciation expense related to the extension of the useful lives of two satellites in the fourth quarter of 2020 and three satellites in the fourth quarter of 2021. These decreases were partially offset by the inclusion of a full year of depreciation and amortization expense from property, plant and equipment and intangible assets acquired as part of the Vricon Acquisition on July 1, 2020, compared to two quarters of expense in 2020.
Depreciation and amortization expense decreased to $348 million from $376 million, or by $28 million, for the year ended December 31, 2020 compared to 2019. The decrease was primarily driven by a decrease in amortization expense for backlog acquired as part of the DigitalGlobe acquisition. We recognized a full year of amortization expense for the year ended December 31, 2019, compared to approximately nine months for the year ended December 31, 2020, as all of the U.S. government acquired backlog was fully amortized in October 2020. The decrease was also driven by a decrease in depreciation expense related to asset retirements made in the second half of 2019 and in the first quarter of 2020, the extension of the useful life of one satellite in the fourth quarter of 2019 and two satellites in the fourth quarter of 2020 and the sale of our owned properties in Palo Alto in December 2019. These decreases were partially offset due to the inclusion of depreciation and amortization expense from property, plant and equipment and intangible assets acquired as part of the Vricon Acquisition on July 1, 2020, compared to no such expense in 2019.
(Gain) loss on orbital receivables allowance
Year ended December 31, | $ Change | % Change | $ Change | % Change | ||||||||||||||||||
|
| 2021 |
| 2020 |
| 2019 |
| 2020 to 2021 | | 2019 to 2020 | ||||||||||||
($ millions) |
|
|
|
| ||||||||||||||||||
(Gain) loss on orbital receivables allowance |
| $ | (49) |
| $ | 14 | $ | 14 | $ | (63) | * | % | $ | — | — | % | ||||||
*Not meaningful.
During the year ended December 31, 2021, as a result of an increased certainty of collections of the outstanding orbital receivables from our largest customer, due to their emergence from bankruptcy, we recognized a $49 million reversal of our orbital receivables allowance.
During each of the years ended December 31, 2020 and 2019, we recognized a $14 million loss on our orbital receivables allowance within the Space Infrastructure segment. The losses were primarily due to a decrease in the credit rating associated with our largest orbital receivables customer.
48
Impairment loss
Year Ended December 31, | $ Change | % Change | $ Change | % Change | ||||||||||||||||||
| 2021 |
| 2020 | 2019 |
| 2020 to 2021 | | 2019 to 2020 | ||||||||||||||
($ millions) |
|
|
| |||||||||||||||||||
Impairment loss |
| $ | — |
| $ | 33 | $ | — | $ | (33) | (100) | % | $ | 33 | * | % | ||||||
*Not meaningful.
During the year ended December 31, 2020, we recognized an impairment loss of $33 million related to the write-off of a $33 million prepaid asset with a commercial provider of ground station services under a contract which was above current market value. In December 2020, we executed a new multi-year contract with the provider for services at reduced cost. As a result of the prior contract being terminated and the new contract being at market value, we concluded the remaining prepaid asset from the prior contract with the provider had no continuing value. There were no impairment losses recorded for the year ended December 31, 2021 or 2019.
Satellite insurance recovery
During the year ended December 31, 2019, we received a satellite insurance recovery of $183 million related to the loss of imaging capability of our WorldView-4 satellite in December 2018. There was no satellite insurance recovery during the year ended December 31, 2021 or 2020.
Loss (gain) on sale of assets
Year ended December 31, | $ Change | % Change | $ Change | % Change | ||||||||||||||||||
|
| 2021 |
| 2020 |
| 2019 |
| 2020 to 2021 | | 2019 to 2020 | ||||||||||||
($ millions) |
|
|
|
| ||||||||||||||||||
Loss (gain) on sale of assets |
| $ | — |
| $ | 1 | $ | (136) | $ | (1) | (100) | % | $ | 137 | (101) | % | ||||||
During the year ended December 31, 2021, we recognized no loss (gain) on sale of assets. During the year ended December 31, 2020, we recognized a $1 million loss on sale of assets. During the year ended December 31, 2019, we recorded a gain of $136 million related to the sale and subsequent leaseback of our owned properties in Palo Alto, California.
49
Interest expense, net
Year Ended December 31, | $ Change | % Change | $ Change | % Change | ||||||||||||||||||
| 2021 |
| 2020 |
| 2019 |
| 2020 to 2021 |
| 2019 to 2020 | |||||||||||||
($ millions) |
| |||||||||||||||||||||
Interest expense: | ||||||||||||||||||||||
Interest on long-term debt |
| $ | 144 |
| $ | 191 | $ | 194 | $ | (47) | (25) | % | $ | (3) | (2) | % | ||||||
Loss on debt extinguishment | 41 | 7 | 22 | 34 | * | (15) | (68) | |||||||||||||||
Interest on orbital securitization liability | 4 | 5 | 7 | (1) | (20) | (2) | (29) | |||||||||||||||
Imputed interest and other | 2 | 2 | — | — | — | 2 | * | |||||||||||||||
Interest expense on advance payments from customers1 | — | 3 | 15 | (3) | (100) | (12) | (80) | |||||||||||||||
Capitalized interest | (40) | (33) | (19) | (7) | 21 | (14) | 74 | |||||||||||||||
Interest expense, net |
| $ | 151 |
| $ | 175 | $ | 219 | $ | (24) | (14) | % | $ | (44) | (20) | % | ||||||
*Not meaningful.
1 | Under the EnhancedView Contract, we received advanced payments from the U.S. government during the construction phase of the WorldView-1 satellite, which was more than one year before capacity was made available to them. The effect of imputing interest on these advanced payments was to increase contract liabilities with an offsetting charge to interest expense. As capacity was provided to the customer, revenue was recognized and the contract liabilities balance decreased. The remaining revenue was fully recognized as of August 31, 2020. |
Interest expense, net decreased to $151 million from $175 million, or by $24 million, for the year ended December 31, 2021 compared to 2020. The decrease was primarily due to a $47 million decrease in interest on long-term debt primarily driven by lower principal balances on the 2023 Notes and Term Loan B (as defined below) due to a repurchase of a portion of the 2023 Notes in the second quarter of 2020, a partial redemption of the 2023 Notes in the first quarter of 2021 and a repayment made on Term Loan B in the second quarter of 2020. These decreases in interest on long-term debt were partially offset by an increase in interest expense following our issuance of the 2027 Notes (as defined below). There was also an increase in capitalized interest of $7 million related to the building of our WorldView Legion satellites. These decreases were partially offset by a $41 million loss on debt extinguishment from the partial redemption of our 2023 Notes using proceeds from the Offering for the year ended December 31, 2021, compared to a $7 million loss on debt extinguishment for 2020.
Interest expense, net decreased to $175 million from $219 million, or by $44 million, for the year ended December 31, 2020 compared to 2019. The decrease was primarily due to a $15 million increase in the loss on debt extinguishment for the year ended December 31, 2019 compared to 2020, an increase in capitalized interest of $14 million related to the building of our WorldView Legion satellites and a $12 million decrease in interest on advance payments from customers.
Other income, net
Year Ended December 31, | $ Change | % Change | $ Change | % Change | ||||||||||||||||||
|
| 2021 |
| 2020 |
| 2019 |
| 2020 to 2021 |
| 2019 to 2020 | ||||||||||||
($ millions) |
|
| ||||||||||||||||||||
Other income, net |
| $ | (8) |
| $ | (104) | $ | (1) | $ | 96 | (92) | % | $ | (103) | * | % | ||||||
*Not meaningful.
Other income, net decreased to $8 million from $104 million, or by $96 million, for the year ended December 31, 2021 compared to 2020. The decrease was primarily driven by a gain of $85 million recorded as a result of the remeasurement of our previously held equity interest in Vricon due to the Vricon Acquisition for the year ended December 31, 2020 which did not recur in 2021. In addition, the decrease was driven by a $3 million foreign exchange loss for the year ended December 31, 2021 compared to a $5 million foreign exchange gain for the year ended December 31, 2020.
Other income, net increased to $104 million from $1 million, or by $103 million, for the year ended December 31, 2020 compared to 2019. The increase was primarily driven by a gain of $85 million recorded as a result of the remeasurement
50
of our previously held equity interest in Vricon due to the Vricon Acquisition. In addition, the increase was driven by a $5 million foreign exchange gain for the year ended December 31, 2020, compared to a $2 million foreign exchange loss for the year ended December 31, 2019.
Income tax (benefit) expense
Year Ended December 31, | $ Change | % Change | $ Change | % Change | ||||||||||||||||||
|
| 2021 |
| 2020 | 2019 |
| 2020 to 2021 |
| 2019 to 2020 | |||||||||||||
($ millions) |
|
| ||||||||||||||||||||
Income tax (benefit) expense |
| $ | (13) |
| $ | (22) | $ | 5 | $ | 9 | (41) | % | $ | (27) | * | % | ||||||
*Not meaningful.
Income tax benefit decreased to $13 million from $22 million, or by $9 million, for the year ended December 31, 2021, compared to 2020. This change was primarily due to a $13 million reduction in the December 31, 2020 estimated federal Base Erosion and Anti-Abuse Tax (“BEAT”) driven by a change in tax strategy enabled by a reduction in forecasted interest expense.
Income tax (benefit) expense changed to a benefit of $22 million from an expense of $5 million, or by $27 million, for the year ended December 31, 2020, compared to 2019. This change was primarily due to the release of a $17 million valuation allowance related to the deferred tax liability recorded in connection with the Vricon Acquisition and the reduction of BEAT estimated at December 31, 2019.
Equity in income from joint ventures, net of tax
Year Ended December 31, | $ Change | % Change | $ Change | % Change | ||||||||||||||||||
| 2021 |
| 2020 |
| 2019 |
| 2020 to 2021 |
| 2019 to 2020 | |||||||||||||
($ millions) |
|
| ||||||||||||||||||||
Equity in income from joint ventures, net of tax |
| $ | — |
| $ | (1) | $ | (11) | $ | 1 | (100) | % | $ | 10 | (91) | % | ||||||
There was no equity in income from joint ventures, net of tax for the year ended December 31, 2021 compared to $1 million for 2020. As we acquired Vricon effective July 1, 2020, Vricon’s results were included in our consolidated results from that date forward and are no longer presented in equity in income from joint ventures, net of tax. See Note 5, “Business Combination” to the Consolidated Financial Statements in Part II, Item 8, “Financial Statements and Supplementary Data” for additional detail on the Vricon Acquisition.
Equity in income from joint ventures, net of tax for the year ended December 31, 2019, was primarily related to our Vricon joint venture of which we owned an approximately 50% interest prior to completion of the Vricon Acquisition in 2020.
Income (loss) from discontinued operations, net of tax
Year Ended December 31, | $ Change | % Change | $ Change | % Change | ||||||||||||||||||
|
| 2021 |
| 2020 |
| 2019 |
| 2020 to 2021 |
| 2019 to 2020 |
| |||||||||||
($ millions) |
|
| ||||||||||||||||||||
Discontinued operations: |
|
| ||||||||||||||||||||
Income from operations of discontinued operations, net of tax | $ | — | $ | 32 | $ | 26 | $ | (32) | (100) | % | $ | 6 | 23 | % | ||||||||
Gain on disposal of discontinued operations, net of tax | — | 317 | — | (317) | (100) | 317 | * | |||||||||||||||
Income from discontinued operations, net of tax | $ | — | $ | 349 | $ | 26 | $ | (349) | (100) | % | $ | 323 | * | % | ||||||||
*Not meaningful.
51
There was no income from discontinued operations, net of tax for the year ended December 30, 2021 as the sale of our MDA Business was completed in the second quarter of 2020.
Income (loss) from discontinued operations, net of tax increased to $349 million from $26 million, or by $323 million, for the year ended December 31, 2020, compared to 2019. The increase is primarily driven by the after-tax gain on disposal of the MDA Business of $317 million. The increase was also impacted by a $39 million recovery of a previously recorded liability in relation to the Company’s dispute with a Ukrainian customer for the year ended December 31, 2020.
RESULTS BY SEGMENT
We analyze financial performance by segments, which group related activities within our business. We report our financial performance based on two reportable segments: Earth Intelligence and Space Infrastructure. Intrasegment transactions have been eliminated from the segmented financial information discussed below.
Year Ended December 31, | | $ Change | | % Change | | $ Change | | % Change | | |||||||||||
| 2021 |
| 2020 | 2019 |
| | 2020 to 2021 | | 2019 to 2020 | | ||||||||||
($ millions) | | |||||||||||||||||||
Revenues: |
|
|
|
|
|
| | |||||||||||||
Earth Intelligence | $ | 1,093 | $ | 1,081 | $ | 1,085 | $ | 12 | 1 | % | $ | (4) | (0) | % | ||||||
Space Infrastructure |
| 740 |
| 721 |
| 706 |
| 19 | 3 | |
| 15 | 2 | | ||||||
Intersegment eliminations | (63) | (79) | (125) | 16 | (20) | 46 | (37) | |||||||||||||
Total revenues | $ | 1,770 | $ | 1,723 | $ | 1,666 | $ | 47 | 3 | % | $ | 57 | 3 | % | ||||||
Adjusted EBITDA: | ||||||||||||||||||||
Earth Intelligence | $ | 492 | $ | 513 | $ | 548 | $ | (21) | (4) | % | $ | (35) | (6) | % | ||||||
Space Infrastructure | 46 | (3) | (17) | 49 | * | | 14 | (82) | | |||||||||||
Intersegment eliminations | (25) | (27) | (29) | 2 | (7) | 2 | (7) | |||||||||||||
Corporate and other expenses | (89) | (61) | (86) | (28) | 46 | | 25 | (29) | | |||||||||||
Total Adjusted EBITDA | $ | 424 | $ | 422 | $ | 416 | $ | 2 | 0 | % | $ | 6 | 1 | % | ||||||
*Not meaningful.
Adjusted EBITDA disclosures throughout this section, “Management’s Discussion and Analysis of Financial Condition and Results of Operations” are non-GAAP measures. See “Non-GAAP Financial Measures” below for further discussion of Adjusted EBITDA disclosures.
Earth Intelligence
The following table provides selected financial information for the Earth Intelligence segment.
Year Ended December 31, | $ Change | | % Change | | $ Change | | % Change | |||||||||||||
|
| 2021 |
| 2020 | 2019 |
| | 2020 to 2021 |
| | 2019 to 2020 |
| ||||||||
($ millions) |
|
|
|
|
| |||||||||||||||
Total revenues | $ | 1,093 |
| $ | 1,081 | $ | 1,085 |
| $ | 12 |
| 1 | % | $ | (4) |
| (0) | % | ||
Adjusted EBITDA | $ | 492 |
| $ | 513 | $ | 548 |
| $ | (21) | (4) | % | $ | (35) | (6) | % | ||||
Adjusted EBITDA margin | 45.0 | % | 47.5 | % | 50.5 | % | ||||||||||||||
Revenues from the Earth Intelligence segment increased to $1,093 million from $1,081 million, or by $12 million, for the year ended December 31, 2021, compared to 2020. The increase was primarily driven by a $48 million increase in revenue from international defense and intelligence customers, a $36 million increase in new and expanded commercial programs and a $7 million increase in revenue from new contracts with the U.S. government. These increases were
52
partially offset by an $80 million decrease in the recognition of deferred revenue related to the EnhancedView Contract. We recognized $80 million of deferred revenue from the EnhancedView Contract for the year ended December 31, 2020, compared to none for the year ended December 31, 2021, as it was fully recognized as of August 31, 2020.
Revenues from the Earth Intelligence segment revenues decreased to $1,081 million from $1,085 million, or by $4 million, for the year ended December 31, 2020, compared to 2019. The decrease was primarily driven by a $40 million decrease in the recognition of deferred revenue related to the EnhancedView Contract. We recognized $120 million of deferred revenue from the EnhancedView Contract for the year ended December 31, 2019, compared to $80 million for the year ended December 31, 2020, as it was fully recognized as of August 31, 2020. These decreases were partially offset by a $15 million increase in revenue from new contracts with the U.S. government, an $11 million increase in revenue from international defense and intelligence customers and a $10 million increase in revenue driven by the inclusion of Vricon’s revenue for two quarters in 2020 compared to none in 2019 as it was accounted for as an equity method investment. Revenue from international defense and intelligence customers increased primarily due to the usage of new direct access facilities which became operational and contracts that signed in the second half of 2019.
Adjusted EBITDA decreased to $492 million from $513 million, or by $21 million, for the year ended December 31, 2021, compared to 2020. The decrease was primarily driven by a decrease in the recognition of deferred revenue related to the EnhancedView Contract as mentioned above. The decrease was also driven by an increase in selling, general and administrative costs due to an increase in labor related expenses driven by an increase in headcount, employee compensation and fringe benefits for the year ended December 31, 2021, compared to 2020. These decreases were partially offset by the expansion of contracts with existing commercial and international defense and intelligence customers contributing to positive program margin growth.
Adjusted EBITDA decreased to $513 million from $548 million, or by $35 million, for the year ended December 31, 2020, compared to 2019. The decrease was primarily driven by a $40 million decrease in the recognition of revenue related to the EnhancedView Contract and a $10 million decrease related to equity in income from our Vricon joint venture which was acquired and consolidated in our results in 2020. These decreases were partially offset by an increase in revenue from new contracts with the U.S. government.
Space Infrastructure
The following table provides selected financial information for the Space Infrastructure segment.
Year Ended December 31, | $ Change | % Change | $ Change | % Change | ||||||||||||||||
|
| 2021 |
| 2020 | 2019 | 2020 to 2021 |
| 2019 to 2020 |
| |||||||||||
($ millions) |
|
|
|
|
| |||||||||||||||
Total revenues | $ | 740 | $ | 721 | $ | 706 | $ | 19 |
| 3 | % | $ | 15 |
| 2 | % | ||||
Adjusted EBITDA | $ | 46 | $ | (3) | $ | (17) | $ | 49 | * | $ | 14 | (82) | % | |||||||
Adjusted EBITDA margin | 6.2 | % | (0.4) | % | (2.4) | % | ||||||||||||||
*Not meaningful.
Changes in revenues from year to year are influenced by the size, timing and number of satellite contracts awarded in the current and preceding years and the length of the construction period for satellite contracts awarded. Revenues on satellite contracts are recognized using the cost-to-cost method to determine the percentage of completion over the construction period, which typically ranges between 20 to 36 months, and up to 48 months in certain situations. Adjusted EBITDA margins can vary from quarter to quarter due to the mix of our revenues and changes in our estimated total costs at completion (“EAC”) as our risks are retired and as our EACs are increased or decreased based on contract performance. Adjusted EBITDA margins are also impacted by estimated contractual consideration.
Revenues from the Space Infrastructure segment increased to $740 million from $721 million, or by $19 million, for the year ended December 31, 2021, compared to 2020. Revenues increased primarily as a result of an increase in revenues from commercial programs of $87 million due to higher volumes and lower EAC growth primarily due to no COVID-19
53
program impacts for the year ended December 31, 2021. Revenues were negatively impacted by a $19 million decrease year over year related to our contract with Sirius XM Holdings Inc. (“Sirius XM”). The year ended December 31, 2021, included a $30 million cumulative adjustment to revenue primarily related to the loss of final milestone and expected orbital payments from Sirius XM due to the non-performance of the SXM-7 satellite and other adjustments that were recorded in 2021. After exhausting efforts to fully recover the SXM-7 satellite and further discussions with Sirius XM, in April 2021, we made the determination to record the cumulative adjustment to revenue. In addition, there were $3 million of costs incurred in the first quarter of 2021 related to attempts to repair and fully recover the SXM-7 satellite. The aggregate impact for the year ended December 30, 2021, was $33 million. The $33 million decrease was partially offset by the non-reoccurrence of a $14 million adjustment to revenue due to the identification of a design anomaly on the commercial satellite program, which was recorded for the year ended December 31, 2020. In addition, the total increase in revenues from the Space Infrastructure segment was partially offset by a $49 million decrease in revenues from U.S. government contracts.
Revenues from the Space Infrastructure segment increased to $721 million from $706 million, or by $15 million, for the year ended December 31, 2020, compared 2019. Revenues increased primarily as a result of an increase in volume related to U.S. government contracts of $137 million during the year ended December 31, 2020, compared to the same period in 2019. This increase in revenue was partially offset by the impact of reduced volumes on commercial programs of $122 million including a $9 million impact due to increases in estimated costs and an associated change in the EAC profit margin of a commercial satellite program due to the identification of a design anomaly in the final stage of a testing process. Revenues were also negatively impacted by $27 million of estimated COVID-19 related EAC growth during the period and are included in the above-mentioned results. The increases in the EACs are due to increases in estimated program costs associated with the COVID-19 operating posture and the estimated impact of certain items such as supplier delays and increased labor hours. These costs are considered incremental and separable from normal operations.
Adjusted EBITDA increased to $46 million from a loss of $3 million, or by $49 million, for the year ended December 31, 2021, compared to 2020. The increase in the Space Infrastructure segment was primarily related to a $92 million increase driven by increased volumes on commercial programs which resulted in increased margins and fewer negative EAC impacts during the year as compared to the year ended December 31, 2020, which included negative EAC impacts due to COVID-19. The increase in commercial program margins has been driven by a change in program mix related to the completion of less profitable programs offset by new, more profitable programs. These increases were partially offset by the $19 million reduction in revenue related to the above-mentioned SXM-7 satellite impacts and a $19 million increase in indirect costs and selling, general and administrative costs which was primarily driven by an $11 million increase in research and development expenses.
Adjusted EBITDA was a loss of $3 million compared to a loss of $17 million, or an increase of $14 million, for the year ended December 31, 2020, compared to 2019. The increase in the Space Infrastructure segment is primarily related to higher margins and favorable EACs outside of the estimated COVID-19 impacts discussed below, on commercial programs of $68 million. This has been driven by a change in program mix related to the completion of less profitable programs offset by new, more profitable programs along with $8 million less of program losses on a developmental program for the year ended December 31, 2020, compared to the same period in 2019. The increase in commercial programs are partially offset by an estimated $27 million negative impact related to our COVID-19 operating posture. The increase is also partially offset by a $16 million increase in costs due to a change in the compensation structure from retention payments to bonuses which were not included in segment Adjusted EBITDA in 2019, a $9 million negative impact on the above-mentioned commercial satellite program with a design anomaly and a recovery of a previously reserved amount of $7 million in 2019 which did not reoccur in 2020. The remainder of the change was related to a decrease in cost of product and services and selling, general and administrative expenses.
Corporate and other expenses
Corporate and other expenses include items such as corporate office costs, regulatory costs, executive and director compensation, foreign exchange gains and losses, retention costs and fees for legal and consulting services.
54
Corporate and other expenses for the year ended December 31, 2021 increased to $89 million from $61 million, or by $28 million, compared to 2020. The increase was primarily driven by a $14 million increase in selling, general and administrative costs primarily due to an increase in labor related expenses driven by an increase in employee compensation and fringe benefits. There was also an increase in stock-based compensation expense of $5 million primarily due to a higher fair market value of equity awards granted. The increase was also driven by a $3 million foreign exchange loss for the year ended December 31, 2021, compared to a $5 million foreign exchange gain for the year ended December 31, 2020.
Corporate and other expenses for the year ended December 31, 2020 decreased to $61 million from $86 million, or by $25 million, compared to 2019. The decrease was primarily driven by a $24 million decrease in retention costs related to a 2019 program within the Space Infrastructure segment. The decrease was also driven by a $5 million foreign exchange gain for the year ended December 31, 2020, compared to a $2 million foreign exchange loss for the year ended December 31, 2019. These decreases were partially offset by a $13 million increase in stock-based compensation expense primarily driven by a higher stock price.
Intersegment eliminations
Intersegment eliminations are related to projects between our segments, primarily WorldView Legion. Intersegment eliminations decreased for the year ended December 31, 2021 compared to 2020, primarily related to a decrease in satellite construction activity.
Intersegment eliminations decreased for the year ended December 31, 2020 compared to 2019, primarily related to a decrease in satellite construction activity.
BACKLOG
Our backlog by segment from continuing operations is as follows:
December 31, | December 31, | |||||
2021 | 2020 | |||||
($ millions) | ||||||
Earth Intelligence | $ | 1,028 | $ | 880 | ||
Space Infrastructure | 865 | 1,024 | ||||
Total backlog | 1,893 | 1,904 | ||||
Unfunded contract options | 650 | 856 | ||||
Total | $ | 2,543 | $ | 2,760 | ||
Order backlog, representing the estimated dollar value of firm contracts for which work has not yet been performed (also known as the remaining performance obligations on a contract), was $1,893 million as of December 31, 2021 compared to $1,904 million as of December 31, 2020. Order backlog generally does not include unexercised contract options and potential orders under indefinite delivery/indefinite quantity contracts. Approximately 66% of the total $1,893 million backlog as of December 31, 2021 is expected to be converted into revenue in 2022.
Backlog in the Space Infrastructure segment is primarily comprised of multi-year awards, such as satellite builds. Fluctuations in backlog are driven primarily by the timing of large program wins. Backlog in the Earth Intelligence segment consists of both multi-year and annual contracts, which renew at various times throughout the year. As a result, the timing of when contracts are awarded and when option years are exercised may cause backlog to fluctuate significantly from period to period.
Although backlog reflects business that is considered to be firm, terminations, amendments or cancellations may occur, which could result in a reduction in our total backlog.
Our unfunded contract options totaled $650 million and $856 million as of December 31, 2021 and 2020, respectively. Unfunded contract options represent estimated amounts of revenue to be earned in the future from negotiated contracts
55
with unexercised contract options and indefinite delivery/indefinite quantity contracts. Unfunded contract options as of December 31, 2021 were primarily comprised of the option year in the EnhancedView Contract (September 1, 2022 through July 12, 2023) and other U.S. government and commercial customer contracts. In November 2021, the National Reconnaissance Office (“NRO”) announced the release of the Electro-Optical Commercial Layer (“EOCL”) contract Request for Proposal (“RFP”) which is expected to replace the existing EnhancedView Contract. In December 2021, we submitted our response to the EOCL RFP and anticipate the NRO to award EOCL contracts prior to the expiration of the EnhancedView Contract, including remaining option years.
LIQUIDITY & CAPITAL RESOURCES
Our sources of liquidity include cash provided by operations, access to existing credit facilities, collection or securitization of orbital receivables and, when available and efficient, access to the capital markets. We generally maintain limited cash on hand and use available cash to pay down borrowings on our Syndicated Credit Facility (as defined below). Our primary short-term cash requirements are to fund working capital, including requirements on long-term construction contracts (including our geostationary satellite contracts), fixed overhead costs and to fund increased capital expenditures, including the construction of our WorldView Legion satellites. Working capital requirements can vary significantly from period to period, particularly as a result of the timing of receipts and disbursements related to long-term construction contracts.
Our medium-term to long-term cash requirements are to service and repay debt and make investments, including in facilities, equipment, technologies and research and development for growth initiatives. These capital investments include investments to replace the capability or capacity of satellites which have or will go out of service in the future. Over the near-term to medium-term, it is also possible that our customers may fully or partially fund the construction of additional Legion satellites. Cash is also used to pay dividends and finance other long-term strategic business initiatives.
Our first maturity of long-term debt is in the fourth quarter of 2023 and relates to the 2023 Notes and Revolving Credit Facility. We had a significant partial debt redemption of the 2023 Notes in the first quarter of 2021 using proceeds from our Offering. On March 26, 2021, we redeemed $350 million aggregate principal amount of our 2023 Notes using a portion of the net proceeds from the Offering.
We have significant purchase obligations in the normal course of business for goods and services, under agreements with defined terms as to quantity, price and timing of delivery. Purchase obligations represent open purchase orders and other commitments for the purchase or construction of property, plant and equipment or intangible assets, operational commitments related to remote ground terminals, or with subcontractors on long-term construction contracts that we have with customers in the normal course of business. As of the year ended December 31, 2021, we had total short-term purchase obligations of $324 million and total long-term purchase obligations of $127 million. These amounts are based on volumes consistent with anticipated requirements to fulfill purchase orders or contracts for product deliveries received, or expected to be received, from customers.
We also have short and long-term requirements to fund our pension plans within the Space Infrastructure segment. Funding requirements under applicable laws and regulations are a major consideration in making contributions to our pension plans. Failure to satisfy the minimum funding thresholds with respect to appropriate laws and regulations could result in restrictions on our ability to amend the plans or make benefit payments. With respect to our qualified pension plan, we intend to contribute annually not less than the required minimum funding thresholds. In December 2020, we prefunded $16 million related to our qualified pension plan. Due to the December 2020 prefunding, there were no required contributions for our qualified pension plan for the year ended December 31, 2021. In addition, the American Rescue Plan Act of 2021 includes provisions for pension funding relief in future periods. We have elected to take advantage of these provisions and anticipate lower required contributions for our qualified pension plan in the upcoming years. The Company has no further required contributions on its qualified pension plan for the year ended December 31, 2022.
Our ability to fund our cash needs will depend, in part, on our ability to generate cash in the future, which depends on our future financial results. Our future results are subject to general economic, financial, competitive, legislative and
56
regulatory factors that may be outside of our control. Our future access to, and the availability of credit on acceptable terms and conditions is impacted by many factors, including capital market liquidity and overall economic conditions.
We believe that our cash from operating activities generated from continuing operations, together with available borrowings under our Revolving Credit Facility, will be adequate for the next twelve months and the foreseeable future to meet our anticipated uses of cash flow, including working capital, capital expenditure, debt service costs, dividend and other commitments. While we intend to reduce debt over time using cash provided by operations, we may also seek to meet long-term debt obligations, if necessary, and fund future capital investments by obtaining capital from a variety of additional sources or by refinancing existing obligations. These sources include public or private capital markets, bank financings, proceeds from dispositions or other third-party sources.
Summary of cash flows
Year Ended December 31, | |||||||||
| 2021 |
| 2020 | 2019 | |||||
($ millions) | |||||||||
Cash provided by operating activities - continuing operations |
| $ | 294 |
| $ | 243 | $ | 258 | |
Cash (used in) provided by operating activities - discontinued operations | (13) | (54) | 59 | ||||||
Cash provided by operating activities | 281 | 189 | 317 | ||||||
Cash used in investing activities - continuing operations |
| (234) |
| (406) | (6) | ||||
Cash provided by (used in) investing activities - discontinued operations | — | 723 | (7) | ||||||
Cash (used in) provided by investing activities | (234) | 317 | (13) | ||||||
Cash used in financing activities - continuing operations |
| (31) |
| (555) | (208) | ||||
Cash used in financing activities - discontinued operations | — | (24) | (30) | ||||||
Cash used in financing activities | (31) | (579) | (238) | ||||||
Effect of foreign exchange on cash, cash equivalents, and restricted cash | — | (5) | — | ||||||
Cash, cash equivalents, and restricted cash, beginning of year |
| 31 |
| 109 | 43 | ||||
Cash, cash equivalents, and restricted cash, end of period |
| $ | 47 |
| $ | 31 | $ | 109 | |
Operating activities
Cash flows from operating activities can vary significantly from period to period as a result of our working capital requirements, given our portfolio of large construction programs and the timing of milestone receipts and payments with customers and suppliers in the ordinary course of business. Investment in working capital is also necessary to build our business and manage lead times in construction activities. We expect working capital account balances to continue to vary from period to period. We efficiently fund our working capital requirements with the Revolving Credit Facility (as defined below).
Cash provided by operating activities related to continuing operations increased to $294 million from $243 million, or by $51 million, for the year ended December 31, 2021 compared to 2020. This change was primarily driven by favorable changes in working capital for the year ended December 31, 2021, compared to 2020.
Cash provided by operating activities related to continuing operations decreased to $243 million from $258 million, or by $15 million, for the year ended December 31, 2020 compared to 2019. This change was primarily driven by favorable changes in working capital for the year ended December 31, 2020, compared to 2019, offset by the insurance proceeds of $183 million related to the loss of the WorldView-4 satellite received in the year ended December 31, 2019.
Investing activities
Cash used in investing activities related to continuing operations decreased to $234 million from $406 million, or by $172 million, in the year ended December 31, 2021 compared to 2020. The primary investing activities included expenditures on property, plant and equipment of $135 million and $221 million, for the years ended December 31, 2021 and 2020, respectively, and investments in software of $99 million and $87 million, for the years ended December 31, 2021 and 2020, respectively. Property, plant and equipment expenditures in 2021 and 2020 primarily related to the build
57
of our WorldView Legion satellites. During the year ended December 31, 2020, we also used cash of $120 million, net of cash received, to acquire the remaining interest in Vricon
Cash used in investing activities related to continuing operations increased to $406 million from $6 million, or by $400 million, for the year ended December 31, 2020 compared to 2019. The primary investing activities included expenditures on property, plant and equipment of $221 million and $257 million, for the years ended December 31, 2020 and 2019, respectively, and investments in software of $87 million and $57 million, for the years ended December 31, 2020 and 2019, respectively. Property, plant and equipment expenditures in 2020 and 2019 primarily related to the build of our WorldView Legion satellites. During the year ended December 31, 2020, we also used cash of $120 million, net of cash received, to acquire the remaining interest in Vricon. In 2019, these expenditures were partially offset by net proceeds of $280 million from the sale and subsequent leaseback of our properties in Palo Alto, California. California. Cash used in investing activities was also partially offset by a return of capital from discontinued operations of $20 million and $28 million, for the years ended December 31, 2020 and 2019, respectively.
Financing activities
Cash used in financing activities related to continuing operations decreased to $31 million from $555 million, or by $524 million, for the year ended December 31, 2021 compared to 2020. During the year ended December 31, 2021, cash used in financing activities from continuing operations included a repurchase of the 2023 Notes of $384 million, settlement of a securitization liability of $13 million and debt repayments of $10 million, partially offset by proceeds from issuance of common stock of $380 million. During the year ended December 31, 2020, cash used in financing activities from continuing operations included debt repayments of $525 million, a repurchase of the 2023 Notes of $169 million and settlement of securitization liability of $11 million, partially offset by net proceeds from bank borrowings of $147 million.
Cash used in financing activities related to continuing operations increased to $555 million from $208 million, or by $347 million, for the year ended December 31, 2020 compared to 2019. During the year ended December 31, 2020, cash used in financing activities from continuing operations included debt repayments of $525 million, a repurchase of the 2023 Notes of $169 million, and settlement of securitization liability of $11 million, partially offset by net proceeds from the issuance of the 2027 Notes of $147 million. During the year ended December 31, 2019, cash used in financing activities from continuing operations included net proceeds from bank borrowings of $980 million offset by debt repayments of $1,115 million, debt issuance costs and fees paid to creditors of $24 million, repurchases of orbital receivables of $24 million and settlement of securitization liability of $20 million.
Long-term debt
The following table summarizes our long-term debt:
December 31, | December 31, | |||||
| 2021 |
| 2020 | |||
($ millions) | ||||||
Syndicated Credit Facility: |
| |||||
Term Loan B | $ | 1,444 | 1,444 | |||
2023 Notes |
| 500 |
| 850 | ||
2027 Notes | 150 | 150 | ||||
Deferred financing | 26 | 32 | ||||
Debt discount and issuance costs |
| (39) |
| (57) | ||
Obligations under finance leases and other |
| 5 |
| 3 | ||
Total long-term debt |
| $ | 2,086 |
| $ | 2,422 |
Syndicated Credit Facility
As of December 31, 2021, the senior secured syndicated credit facility (“Syndicated Credit Facility”) is composed of: (i) a senior secured first lien revolving credit facility in an aggregate capacity of up to $500 million maturing in December
58
2023 (“Revolving Credit Facility”) and (ii) a senior secured first lien term B facility in an original aggregate principal amount of $2.0 billion maturing in October 2024 (“Term Loan B”). The Revolving Credit Facility includes an aggregate $200 million sub limit under which letters of credit can be issued. As of December 31, 2021 and December 31, 2020, we had $28 million and $31 million, respectively, of issued and undrawn letters of credit outstanding under the Revolving Credit Facility.
Senior Secured Notes due 2023
In December 2019, we issued $1.0 billion in aggregate principal amount of 2023 Notes in a private placement to institutional buyers. The 2023 Notes were issued at a price of 98% and are recorded as long-term debt in our Consolidated Financial Statements. The 2023 Notes bear interest at the rate of 9.75% per year, payable semi-annually in cash in arrears, for which interest payments commenced in June 2020. The 2023 Notes are guaranteed on a senior secured basis by each of the Company’s existing and future subsidiaries that guarantee the Syndicated Credit Facility.
Senior Secured Notes due 2027
In June 2020, we issued $150 million in aggregate principal amount of 7.54% Senior Secured Notes due 2027 (“2027 Notes”) in a private placement to institutional buyers. The 2027 Notes were issued at a price of 98.25% and are recorded as long-term debt in our Consolidated Financial Statements. The 2027 Notes bear interest at the rate of 7.54% per year, payable semi-annually in cash in arrears, for which interest payments commenced in December 2020. The 2027 Notes are guaranteed on a senior secured basis by each of the Company’s existing and future subsidiaries that guarantee the Syndicated Credit Facility and the 2023 Notes.
Leaseback Deferred Financing
In December 2019, we completed the sale and subsequent leaseback of our owned properties in Palo Alto, California for proceeds of $291 million. We determined that the leaseback terms were off-market. In accordance with Accounting Standards Codification 842 – Leases, we accounted for the excess of the leaseback payments over the present value of market rental payments as additional financing, separate from the lease liability. This resulted in recognition of a deferred financing liability of $33 million which is repayable over the 10-year leaseback term.
See Note 12, “Long-term debt and interest expense, net” to the Consolidated Financial Statements in Part II, Item 8, “Financial Statements and Supplementary Data” for further details on our long-term debt.
Securitization liability
We have in place a revolving securitization facility agreement with an international financial institution. Under the terms of the Syndicated Credit Facility, we may offer to sell eligible orbital receivables from time to time with terms of seven years or less, discounted to face value using prevailing market rates. During the years ended December 31, 2021 and 2020, we did not sell or repurchase any orbital receivables. During the year ended December 31, 2019, we did not sell any eligible receivables and repurchased $24 million of specifically identified orbital receivables. The orbital receivables were repurchased as a result of our customer transferring the obligation to another entity which did not meet the credit criteria of our lenders.
The orbital receivables that were securitized remain on our balance sheet as the accounting criteria for surrendering control of the orbital receivables were not met. The net proceeds received have been recognized as a securitization liability that has been subsequently measured at amortized cost using the effective interest rate method. The securitized orbital receivables and the securitization liabilities are being drawn down as payments are received from customers and passed on to the international financial institution. We continue to recognize orbital revenue on the orbital receivables that are subject to the securitization transactions and recognize interest expense to accrete the securitization liability.
59
Off-balance sheet arrangements
As of December 31, 2021, we had no outstanding foreign exchange sales contracts. As of December 31, 2021, we had certain letters of credit of $28 million guaranteed by the Syndicated Credit Facility, while indemnified by us. Such arrangements are not expected to have a material effect on our liquidity or capital resources, financial position or results of operations.
We use, from time to time, derivative financial instruments to manage existing foreign currency exposures. We consider the management of financial risks to be an important part of our overall corporate risk management policy. Foreign exchange forward contracts are used to hedge our exposure to currency risk on sales, purchases, cash, net investments and loans denominated in a currency other than the functional currency of our domestic and foreign operations.
CRITICAL ACCOUNTING POLICIES AND ESTIMATES
Management’s Discussion and Analysis of Financial Condition and Results of Operations discusses our Consolidated Financial Statements, which have been prepared in accordance with U.S. GAAP. The preparation of these financial statements requires management to make judgments, assumptions and estimates that affect the amounts reported in the Consolidated Financial Statements and accompanying notes. For a summary of our significant accounting policies, see Note 2, “Summary of significant accounting policies” to the Consolidated Financial Statements in Part II, Item 8, “Financial Statements and Supplementary Data”.
We consider the following accounting policies to be critical to an understanding of our financial condition and results of operations because these policies require the most difficult, subjective or complex judgments on the part of management in their application. Actual results could differ from our estimates and assumptions, and any such differences could be material to our Consolidated Financial Statements.
Revenue recognition
The recognition and measurement of revenue requires the use of judgments and estimates. Specifically, judgment is used in interpreting complex arrangements with nonstandard terms and conditions and determining when all criteria for revenue recognition have been met.
Space Infrastructure
Revenue in the Space Infrastructure segment is primarily generated from long-term construction contracts. Due to the long-term nature of these contracts, we generally recognize revenue over time using the cost-to-cost method to measure progress. Under the cost-to-cost method, revenue is recognized based on the proportion of total costs incurred to EAC. Revenue recognition is also contingent on estimated contractual consideration. An EAC includes all direct costs and indirect costs directly attributable to a program or allocable based on program cost pooling arrangements. Estimates regarding the Company’s cost associated with the design, manufacture and delivery of products and services are used in determining the EAC. Changes to an EAC or estimated contractual consideration are recorded as a cumulative adjustment to revenue.
Our cost estimation process is based on the professional knowledge of our engineering, program management and financial professionals and draws on their significant experience and judgment. We prepare EACs for our contracts and calculate estimated revenues and costs over the life of our contracts. Since our contracts typically span a period of several years, estimation of revenue, cost and progress toward completion requires the use of judgment. Judgments and estimates are re-assessed at least quarterly with most estimates being updated on a monthly basis. Adjustments in estimates could have a material impact on revenue recognition based on the significance of the adjustments. Factors considered in these estimates include our historical performance, the availability, productivity and cost of labor, the nature and complexity of work to be performed, availability and cost of materials, components and subcontracts, the risk and impact of delayed performance and the level of indirect cost allocations.
60
Earth Intelligence
Revenue in the Earth Intelligence segment is generated from imagery and geospatial intelligence service contracts. Revenue from imagery service contracts is recognized based on satellite capacity made available to the customer in a particular period, when imagery is delivered to the customer, or ratably over the subscription period. Many of our imagery service contracts relate to the transfer of a series of distinct goods or services over time for which management has determined are a single performance obligation. Revenue from our geospatial intelligence service contracts is recognized from the rendering of services that compensate us at a cost-plus-fixed-fee, firm fixed price, or on a time and materials basis.
Some of our contracts contain multiple performance obligations, which requires us to estimate the standalone selling price of each performance obligation in order to allocate consideration transferred from the customer. We have not historically been able to use third-party evidence for determining standalone selling price due to the unique nature of our products and services and lack of visibility into competitor pricing. Standalone selling prices are determined based on management estimates that involve significant judgment. Multiple factors are considered based on the nature of the deliverables included within the contract, which include market conditions, competitive landscape, geographic or regional specific factors, internal costs, profit margin objectives and pricing practices used by us.
Income Taxes
We are subject to income taxes in the United States, Sweden and other foreign jurisdictions. We compute the provision for income taxes using the asset and liability method, under which deferred tax assets and liabilities are determined based on the temporary differences between the financial reporting and tax bases of assets and liabilities. Deferred tax assets and liabilities are measured at the currently enacted tax rates that are expected to apply in years in which they are expected to be paid for or realized. All deferred income taxes are classified as non-current on our Consolidated Balance Sheets. Significant judgments are required in order to determine the realizability of tax assets. In assessing the need for a valuation allowance, we evaluate all significant available positive and negative evidence, including historical operating results, estimates of future sources of taxable income, carry-forward periods available, the existence of prudent and feasible tax planning strategies and other relevant factors.
For further information regarding our deferred tax assets and liabilities see Note 2, “Summary of significant accounting policies” and Note 21, “Income taxes” to the Consolidated Financial Statements in Part II, Item 8, “Financial Statements and Supplementary Data.”
RECENT ACCOUNTING PRONOUNCEMENTS
See Note 3, “New standards and interpretations not yet adopted” to the Consolidated Financial Statements in Part II, Item 8, “Financial Statements and Supplementary Data” for a discussion of recent accounting pronouncements.
NON-GAAP FINANCIAL MEASURES
In addition to results reported in accordance with U.S. GAAP, we use certain non-GAAP financial measures as supplemental indicators of our financial and operating performance. These non-GAAP financial measures include EBITDA, Adjusted EBITDA and Adjusted EBITDA margin.
We define EBITDA as earnings before interest, taxes, depreciation and amortization, Adjusted EBITDA as EBITDA adjusted for certain items affecting the comparability of our ongoing operating results as specified in the calculation and Adjusted EBITDA margin as Adjusted EBITDA divided by revenue. Certain items affecting the comparability of our ongoing operating results between periods include restructuring, impairments, insurance recoveries, gain (loss) on sale of assets, CEO severance, (gain) loss on orbital receivables allowance and transaction and integration related expense. Transaction and integration related expense includes costs associated with de-leveraging activities, acquisitions and dispositions and the integration of acquisitions. Management believes that exclusion of these items assists in providing a more complete understanding of our underlying results and trends, and management uses these measures along with the corresponding U.S. GAAP financial measures to manage our business, evaluate our performance compared to prior
61
periods and the marketplace, and to establish operational goals. Adjusted EBITDA is a measure being used as a key element of our incentive compensation plan. The Syndicated Credit Facility also uses Adjusted EBITDA in the determination of our debt leverage covenant ratio. The definition of Adjusted EBITDA in the Syndicated Credit Facility includes a more comprehensive set of adjustments that may result in a different calculation therein.
We believe that these non-GAAP measures, when read in conjunction with our U.S. GAAP results, provide useful information to investors by facilitating the comparability of our ongoing operating results over the periods presented, the ability to identify trends in our underlying business, and the comparison of our operating results against analyst financial models and operating results of other public companies.
EBITDA, Adjusted EBITDA and Adjusted EBITDA margin are not recognized terms under U.S. GAAP and may not be defined similarly by other companies. EBITDA and Adjusted EBITDA should not be considered alternatives to net (loss) income as indications of financial performance or as alternate to cash flows from operations as measures of liquidity. EBITDA and Adjusted EBITDA have limitations as an analytical tool and should not be considered in isolation or as a substitute for our results reported under U.S. GAAP.
The table below reconciles our net income (loss) to EBITDA and Adjusted EBITDA for the years ended December 31, 2021, 2020 and 2019:
Year Ended December 31, | ||||||||||
| 2021 |
| 2020 |
| 2019 | |||||
($ millions) | ||||||||||
Net income | $ | 46 | $ | 303 | $ | 109 | ||||
Income tax (benefit) expense | (13) | (22) | 5 | |||||||
Interest expense, net | 151 | 175 | 219 | |||||||
Interest income | (3) | (3) | (2) | |||||||
Depreciation and amortization | 290 | 348 | 376 | |||||||
EBITDA | $ | 471 | $ | 801 | $ | 707 | ||||
Income from discontinued operations, net of tax | — | (349) | (26) | |||||||
Restructuring | 2 | — | 18 | |||||||
Transaction and integration related expense | 1 | 7 | 16 | |||||||
(Gain) loss on orbital receivables allowance | (49) | 14 | 14 | |||||||
Impairment losses, including inventory | — | 33 | 3 | |||||||
Insurance recoveries | (1) | — | (183) | |||||||
Loss (gain) on sale of assets | — | 1 | (136) | |||||||
CEO severance | — | — | 3 | |||||||
Gain on remeasurement of Vricon equity interest | — | (85) | — | |||||||
Total Adjusted EBITDA | $ | 424 | $ | 422 | $ | 416 | ||||
Adjusted EBITDA: | ||||||||||
Earth Intelligence | 492 | 513 | 548 | |||||||
Space Infrastructure | 46 | (3) | (17) | |||||||
Intersegment eliminations | (25) | (27) | (29) | |||||||
Corporate and other expenses |
| (89) | (61) |
| (86) | |||||
Total Adjusted EBITDA | $ | 424 | $ | 422 | $ | 416 | ||||
Net income margin | 2.6 | % | 17.6 | % | 6.5 | % | ||||
Total Adjusted EBITDA margin | 24.0 | % | 24.5 | % | 25.0 | % | ||||
62
ITEM 7A.QUANTITATIVE AND QUALITATIVE DISCLOSURES ABOUT MARKET RISK
Interest Rate Risk
We are exposed to interest rate risk on our variable-rate borrowings under our Syndicated Credit Facility, which is comprised of the Revolving Credit Facility and Term Loan B. We use interest rate swap agreements to manage interest rate risk associated with cash outflows from long-term debt.
There was $1.44 billion outstanding under our Syndicated Credit Facility as of December 31, 2021 and 2020, respectively. Term Loan B bears interest equal to, at our option, either (i) U.S. dollar LIBOR plus 275 basis points per annum, or (ii) adjusted base rate, plus a margin of 175 basis points per annum. In April 2018, we entered into interest rate swap agreements in order to fix the base interest rate to be paid over an aggregate amount of $1 billion of our variable rate long-term debt, at an average rate of 2.56% (excluding the margin specified in the Syndicated Credit Facility). In April 2021, $500 million of these interest rate swaps matured and on June 15, 2021, we entered into new interest rate swap agreements at a notional value of $500 million. As of December 31, 2021, an aggregate amount of $1 billion of our variable rate long-term debt is fixed at an average rate of 1.43% plus the applicable margin described below.
The Revolving Credit Facility bears interest at a rate equal to, at our option, either (i) U.S. dollar LIBOR, plus a margin of 120 - 425 basis points per annum, based on our total leverage ratio, or (ii) adjusted base rate, plus a margin of 20 - 325 basis points per annum, based on our total leverage ratio.
Based upon the amounts outstanding under the Syndicated Credit Facility, net of the interest rate swaps and assuming the amounts were outstanding for a full calendar year, a 50 basis point increase in interest rates would increase interest expense under the Syndicated Credit Facility by approximately $2 million for both the years ended December 31, 2021 and 2020. We may decide in future periods to engage in hedging transactions to further mitigate the interest rate risk under our Syndicated Credit Facility.
Foreign Currency Risk
Although the majority of our transactions are denominated in U.S. dollars, some of our transactions are denominated in foreign currencies. Certain contractual relationships with customers and vendors mitigate risks from currency exchange rate changes that arise from normal purchasing and normal sales activities. Our revenue and purchase contracts are primarily denominated in U.S. dollars. However, fluctuations in the value of foreign currencies may make payments in U.S. dollars, as provided for under our existing contracts, more difficult for foreign customers. In addition, fluctuations in foreign currencies could introduce volatility into our financial statements for contracts denominated in a foreign currency.
63
ITEM 8.FINANCIAL STATEMENTS AND SUPPLEMENTARY DATA
INDEX TO CONSOLIDATED FINANCIAL STATEMENTS
| |
Page | |
Reports of Independent Registered Public Accounting Firm (Auditor Firm ID: 185) | 65 |
| |
69 | |
| |
70 | |
71 | |
72 | |
73 | |
| |
74 |
64
REPORT OF INDEPENDENT REGISTERED PUBLIC ACCOUNTING FIRM
To the Stockholders and Board of Directors
Maxar Technologies Inc.:
Opinion on the Consolidated Financial Statements
We have audited the accompanying consolidated balance sheets of Maxar Technologies Inc. and subsidiaries (the Company) as of December 31, 2021 and 2020, the related consolidated statements of operations, comprehensive income, cash flows, and changes in stockholders’ equity for each of the years in the three-year period ended December 31, 2021, and the related notes (collectively, the consolidated financial statements). In our opinion, the consolidated financial statements present fairly, in all material respects, the financial position of the Company as of December 31, 2021 and 2020, and the results of its operations and its cash flows for each of the years in the three-year period ended December 31, 2021, in conformity with U.S. generally accepted accounting principles.
We also have audited, in accordance with the standards of the Public Company Accounting Oversight Board (United States) (PCAOB), the Company’s internal control over financial reporting as of December 31, 2021, based on criteria established in Internal Control – Integrated Framework (2013) issued by the Committee of Sponsoring Organizations of the Treadway Commission, and our report dated February 22, 2022 expressed an unqualified opinion on the effectiveness of the Company’s internal control over financial reporting.
Change in Accounting Principle
As discussed in Note 2 to the consolidated financial statements, the Company has elected to change its method of accounting for income taxes due to the adoption of Accounting Standards Update No. 2019-12, Simplifying the Accounting for Income Taxes (Topic 740) as of January 1, 2020.
Basis for Opinion
These consolidated financial statements are the responsibility of the Company’s management. Our responsibility is to express an opinion on these consolidated financial statements based on our audits. We are a public accounting firm registered with the PCAOB and are required to be independent with respect to the Company in accordance with the U.S. federal securities laws and the applicable rules and regulations of the Securities and Exchange Commission and the PCAOB.
We conducted our audits in accordance with the standards of the PCAOB. Those standards require that we plan and perform the audit to obtain reasonable assurance about whether the consolidated financial statements are free of material misstatement, whether due to error or fraud. Our audits included performing procedures to assess the risks of material misstatement of the consolidated financial statements, whether due to error or fraud, and performing procedures that respond to those risks. Such procedures included examining, on a test basis, evidence regarding the amounts and disclosures in the consolidated financial statements. Our audits also included evaluating the accounting principles used and significant estimates made by management, as well as evaluating the overall presentation of the consolidated financial statements. We believe that our audits provide a reasonable basis for our opinion.
Critical Audit Matter
The critical audit matter communicated below is a matter arising from the current period audit of the consolidated financial statements that was communicated or required to be communicated to the audit committee and that: (1) relates to accounts or disclosures that are material to the consolidated financial statements and (2) involved our especially challenging, subjective, or complex judgments. The communication of a critical audit matter does not alter in any way our opinion on the consolidated financial statements, taken as a whole, and we are not, by communicating the critical audit matter below, providing a separate opinion on the critical audit matter or on the accounts or disclosures to which it relates.
65
Revenue recognition for certain long-term fixed-price contracts in the Space Infrastructure segment
As discussed in Notes 2 and 16 to the consolidated financial statements, the Company generally recognizes revenue over time using the cost-to-cost method to measure progress. Under the cost-to-cost method, revenue is recognized based on the proportion of total costs incurred to estimated total costs-at-completion (EAC). An EAC includes all direct costs and indirect costs directly attributable to a program or allocable based on program cost pooling arrangements. Estimates regarding the Company’s cost associated with the design, manufacture and delivery of products and services are used in determining the EAC. Changes to an EAC are recorded as a cumulative adjustment to revenue.
We identified the evaluation of revenue recognition for certain long-term fixed-price contracts in the Space Infrastructure segment as a critical audit matter. In particular, evaluating the Company’s estimated costs to complete, specifically estimated labor and subcontractor costs, required a high degree of subjective auditor judgment given the nature and complexity of the work to be performed. The determination of, and changes to, those estimates may have a significant impact on revenue recorded.
The following are the primary procedures we performed to address this critical audit matter. We evaluated the design and tested the operating effectiveness of certain internal controls over the Company’s process to estimate costs to complete for fixed-price, long-term contracts. This included controls over estimated labor and subcontractor costs. For certain contracts, we compared the Company’s original or prior period estimate of total contract costs to be incurred to changes in total actual and estimated future contract costs to be incurred to assess the Company’s ability to estimate costs. We inquired of financial and operational personnel of the Company and inspected supporting documents to identify factors that should be considered within the cost to complete estimates for indications of possible management bias. We evaluated the Company’s estimated costs to complete by:
| ● | reading the underlying contracts and related amendments to obtain an understanding of the contractual requirements and related performance obligations |
| ● | considering costs incurred to-date and the relative progress towards completion of the contracts |
| ● | considering, if relevant, the estimated costs to complete on similar or historical contracts |
| ● | considering, if relevant, the estimated reserves on specific contracts that include estimation uncertainty based on the nature of the contract |
| ● | inspecting correspondence, if any, between the Company and the customer regarding actual cost to date and expected performance remaining |
| ● | evaluating the Company’s assessment of contract performance risks included within the estimated costs to complete. |
/s/ KPMG LLP
We have served as the Company’s auditor since 2018.
Denver, Colorado
February 22, 2022
66
REPORT OF INDEPENDENT REGISTERED PUBLIC ACCOUNTING FIRM
To the Stockholders and Board of Directors
Maxar Technologies Inc.:
Opinion on Internal Control Over Financial Reporting
We have audited Maxar Technologies Inc. and subsidiaries’ (the Company) internal control over financial reporting as of December 31, 2021, based on criteria established in Internal Control – Integrated Framework (2013) issued by the Committee of Sponsoring Organizations of the Treadway Commission. In our opinion, the Company maintained, in all material respects, effective internal control over financial reporting as of December 31, 2021, based on criteria established in Internal Control – Integrated Framework (2013) issued by the Committee of Sponsoring Organizations of the Treadway Commission.
We also have audited, in accordance with the standards of the Public Company Accounting Oversight Board (United States) (PCAOB), the consolidated balance sheets of the Company as of December 31, 2021 and 2020, the related consolidated statements of operations, comprehensive income, cash flows, and changes in stockholders’ equity for each of the years in the three-year period ended December 31, 2021, and the related notes (collectively, the consolidated financial statements), and our report dated February 22, 2022 expressed an unqualified opinion on those consolidated financial statements.
Basis for Opinion
The Company’s management is responsible for maintaining effective internal control over financial reporting and for its assessment of the effectiveness of internal control over financial reporting, included in the accompanying Management’s Report on Internal Control over Financial Reporting. Our responsibility is to express an opinion on the Company’s internal control over financial reporting based on our audit. We are a public accounting firm registered with the PCAOB and are required to be independent with respect to the Company in accordance with the U.S. federal securities laws and the applicable rules and regulations of the Securities and Exchange Commission and the PCAOB.
We conducted our audit in accordance with the standards of the PCAOB. Those standards require that we plan and perform the audit to obtain reasonable assurance about whether effective internal control over financial reporting was maintained in all material respects. Our audit of internal control over financial reporting included obtaining an understanding of internal control over financial reporting, assessing the risk that a material weakness exists, and testing and evaluating the design and operating effectiveness of internal control based on the assessed risk. Our audit also included performing such other procedures as we considered necessary in the circumstances. We believe that our audit provides a reasonable basis for our opinion.
Definition and Limitations of Internal Control Over Financial Reporting
A company’s internal control over financial reporting is a process designed to provide reasonable assurance regarding the reliability of financial reporting and the preparation of financial statements for external purposes in accordance with generally accepted accounting principles. A company’s internal control over financial reporting includes those policies and procedures that (1) pertain to the maintenance of records that, in reasonable detail, accurately and fairly reflect the transactions and dispositions of the assets of the company; (2) provide reasonable assurance that transactions are recorded as necessary to permit preparation of financial statements in accordance with generally accepted accounting principles, and that receipts and expenditures of the company are being made only in accordance with authorizations of management and directors of the company; and (3) provide reasonable assurance regarding prevention or timely detection of unauthorized acquisition, use, or disposition of the company’s assets that could have a material effect on the financial statements.
Because of its inherent limitations, internal control over financial reporting may not prevent or detect misstatements. Also, projections of any evaluation of effectiveness to future periods are subject to the risk that controls may become
67
inadequate because of changes in conditions, or that the degree of compliance with the policies or procedures may deteriorate.
/s/ KPMG LLP
Denver, Colorado
February 22, 2022
68
MAXAR TECHNOLOGIES INC.
Consolidated Statements of Operations
(In millions, except per share amounts)
Year Ended | |||||||||
December 31, | |||||||||
| 2021 |
| 2020 | 2019 | |||||
Revenues: | |||||||||
Product | $ | 678 | $ | 633 | $ | 560 | |||
Service | 1,092 | 1,090 | 1,106 | ||||||
Total revenues | 1,770 | 1,723 | 1,666 | ||||||
Costs and expenses: | |||||||||
Product costs, excluding depreciation and amortization | 601 | 615 | 593 | ||||||
Service costs, excluding depreciation and amortization | 383 | 378 | 382 | ||||||
Selling, general and administrative | 369 | 332 | 325 | ||||||
Depreciation and amortization |
| 290 |
| 348 | 376 | ||||
(Gain) loss on orbital receivables allowance | (49) | 14 | 14 | ||||||
Impairment loss | — | 33 | — | ||||||
Satellite insurance recovery | — | — | (183) | ||||||
Loss (gain) on sale of assets | — | 1 | (136) | ||||||
Operating income |
| 176 |
| 2 | 295 | ||||
Interest expense, net |
| 151 |
| 175 | 219 | ||||
Other income, net | (8) | (104) | (1) | ||||||
Income (loss) before taxes |
| 33 | (69) | 77 | |||||
Income tax (benefit) expense |
| (13) |
| (22) | 5 | ||||
Equity in income from joint ventures, net of tax | — | (1) | (11) | ||||||
Income (loss) from continuing operations | 46 | (46) | 83 | ||||||
Discontinued operations: | |||||||||
Income from operations of discontinued operations, net of tax | — | 32 | 26 | ||||||
Gain on disposal of discontinued operations, net of tax | — | 317 | — | ||||||
Income from discontinued operations, net of tax | — | 349 | 26 | ||||||
Net income | $ | 46 | $ | 303 | $ | 109 | |||
Basic net income per common share: |
|
|
|
| |||||
Income (loss) from continuing operations | $ | 0.65 | $ | (0.76) | $ | 1.39 | |||
Income from discontinued operations, net of tax | — | 5.75 | 0.44 | ||||||
Basic net income per common share | $ | 0.65 | $ | 4.99 | $ | 1.83 | |||
Diluted net income per common share: |
|
|
|
| |||||
Income (loss) from continuing operations | $ | 0.63 | $ | (0.76) | $ | 1.38 | |||
Income from discontinued operations, net of tax | — | 5.75 | 0.43 | ||||||
Diluted net income per common share | $ | 0.63 | $ | 4.99 | $ | 1.81 | |||
See accompanying notes to the Consolidated Financial Statements.
69
MAXAR TECHNOLOGIES INC.
Consolidated Statements of Comprehensive Income
(In millions)
Year Ended | |||||||||
December 31, | |||||||||
| 2021 | 2020 |
| 2019 | |||||
Net income | $ | 46 | $ | 303 | $ | 109 | |||
Other comprehensive (income) loss, net of tax: |
|
|
|
|
| ||||
Foreign currency translation adjustments |
| (2) | (47) |
| 15 | ||||
Reclassification of currency translation adjustment to gain on disposal of discontinued operations | — | (68) | — | ||||||
Unrealized gain (loss) on interest rate swaps |
| 19 | (3) |
| (12) | ||||
Gain (loss) on pension and other postretirement benefit plans | 50 | (43) | (26) | ||||||
Other comprehensive income (loss), net of tax |
| 67 | (161) |
| (23) | ||||
Comprehensive income, net of tax | $ | 113 | $ | 142 | $ | 86 | |||
1 | Included within Foreign currency translation adjustments is a net gain on hedge of net investment in foreign operations of $47 million and $5 million for the years ended December 31, 2020 and 2019. |
See accompanying notes to the Consolidated Financial Statements.
70
MAXAR TECHNOLOGIES INC.
Consolidated Balance Sheets
(In millions)
| December 31, |
| December 31, | |||
2021 | 2020 | |||||
Assets | ||||||
Current assets: | ||||||
Cash and cash equivalents |
| $ | 47 | $ | 27 | |
Trade and other receivables, net |
|
| 355 |
| 327 | |
Inventory, net |
|
| 39 |
| 31 | |
Advances to suppliers | 31 | 24 | ||||
Prepaid assets | 35 | 38 | ||||
Other current assets | 22 | 21 | ||||
Total current assets |
|
| 529 |
| 468 | |
Non-current assets: |
|
|
|
| ||
Orbital receivables, net |
|
| 368 | 361 | ||
Property, plant and equipment, net |
|
| 940 | 883 | ||
Intangible assets, net |
|
| 787 | 895 | ||
Non-current operating lease assets | 145 | 163 | ||||
Goodwill |
|
| 1,627 | 1,627 | ||
Other non-current assets | 102 | 86 | ||||
Total assets |
| $ | 4,498 | $ | 4,483 | |
Liabilities and stockholders’ equity |
|
| ||||
Current liabilities: |
|
| ||||
Accounts payable |
| $ | 75 | $ | 115 | |
Accrued liabilities | 43 | 65 | ||||
Accrued compensation and benefits |
|
| 111 |
| 105 | |
Contract liabilities |
|
| 289 |
| 278 | |
Current portion of long-term debt |
|
| 24 |
| 8 | |
Current operating lease liabilities | 42 | 41 | ||||
Other current liabilities | 38 | 51 | ||||
Total current liabilities |
| 622 |
| 663 | ||
Non-current liabilities: |
|
| ||||
Pension and other postretirement benefits |
|
| 134 | 192 | ||
Operating lease liabilities | 138 | 158 | ||||
Long-term debt |
|
| 2,062 | 2,414 | ||
Other non-current liabilities | 79 | 120 | ||||
Total liabilities |
|
| 3,035 |
| 3,547 | |
Commitments and contingencies | ||||||
Stockholders’ equity: |
|
| ||||
Common stock ($0.0001 par value, 240 million common shares authorized; 72.7 million and 61.2 million and at December 31, 2021 and 2020, respectively) |
|
| ||||
Additional paid-in capital |
|
| 2,235 | 1,818 | ||
Accumulated deficit |
|
| (720) | (763) | ||
Accumulated other comprehensive loss |
|
| (53) | (120) | ||
Total Maxar stockholders' equity | 1,462 | 935 | ||||
Noncontrolling interest | 1 | 1 | ||||
Total stockholders' equity |
|
| 1,463 |
| 936 | |
Total liabilities and stockholders' equity |
| $ | 4,498 | $ | 4,483 | |
See accompanying notes to the Consolidated Financial Statements.
71
MAXAR TECHNOLOGIES INC.
Consolidated Statements of Cash Flows
(In millions)
Year Ended | |||||||||
December 31, | |||||||||
| 2021 |
| 2020 | 2019 | |||||
Cash flows (used in) provided by: | |||||||||
Operating activities: |
|
|
|
|
| ||||
Net income | $ | 46 | $ | 303 | $ | 109 | |||
Income from operations of discontinued operations, net of tax | — | (32) | (26) | ||||||
Gain on disposal of discontinued operations, net of tax | — | (317) | — | ||||||
Income (loss) from continuing operations | 46 | (46) | 83 | ||||||
Adjustments to reconcile net income (loss) to net cash (used in) provided by operating activities: |
|
|
|
| |||||
Depreciation and amortization |
| 290 |
| 348 | 376 | ||||
Stock-based compensation expense | 45 | 43 | 20 | ||||||
Amortization of debt issuance costs and other non-cash interest expense | 15 | 16 | 11 | ||||||
Gain on remeasurement of Vricon equity interest | — | (85) | — | ||||||
Loss from early extinguishment of debt | 41 | 7 | 22 | ||||||
(Gain) loss on orbital receivables allowance | (49) | 14 | 14 | ||||||
Cumulative adjustment to SXM-7 revenue | 30 | — | — | ||||||
Impairment losses, including inventory | — | 33 | 3 | ||||||
Deferred income tax benefit | — | (17) | — | ||||||
Loss (gain) on sale of assets | — | 1 | (136) | ||||||
Other | 15 | 1 | (4) | ||||||
Changes in operating assets and liabilities: |
|
| |||||||
Trade and other receivables, net | (20) | 33 | (20) | ||||||
Accounts payable and liabilities | (95) | (84) | 17 | ||||||
Contract liabilities | 10 | 5 | (117) | ||||||
Prepaid and other assets | (18) | (19) | (21) | ||||||
Other | (16) | (7) | 10 | ||||||
Cash provided by operating activities - continuing operations |
| 294 |
| 243 |
| 258 | |||
Cash (used in) provided by operating activities - discontinued operations | (13) | (54) | 59 | ||||||
Cash provided by operating activities | 281 | 189 | 317 | ||||||
Investing activities: |
|
|
|
|
|
| |||
Purchase of property, plant and equipment and development or purchase of software |
| (234) |
| (308) | (314) | ||||
Acquisition, net of cash acquired | — | (120) | — | ||||||
Return of capital from discontinued operations | — | 20 | 28 | ||||||
Sale of assets | — | — | 280 | ||||||
Other | — | 2 | — | ||||||
Cash used in investing activities - continuing operations |
| (234) |
| (406) |
| (6) | |||
Cash provided by (used in) investing activities - discontinued operations | — | 723 | (7) | ||||||
Cash (used in) provided by investing activities | (234) | 317 | (13) | ||||||
Financing activities: |
|
|
|
|
|
| |||
Repurchase of 2023 Notes, including premium | (384) | (169) | — | ||||||
Net proceeds from issuance of common stock | 380 | — | — | ||||||
Net proceeds from issuance of 2027 Notes and 2023 Notes | — | 147 | 980 | ||||||
Net payment from Revolving Credit Facility | — | — | (595) | ||||||
Settlement of securitization liability | (13) | (11) | (20) | ||||||
Repurchase of orbital receivables | — | — | (24) | ||||||
Refinancing fees paid to creditors | — | — | (20) | ||||||
Repayments of long-term debt | (10) | (525) | (523) | ||||||
Other | (4) | 3 | (6) | ||||||
Cash used in financing activities - continuing operations | (31) | (555) | (208) | ||||||
Cash used in financing activities - discontinued operations | — | (24) | (30) | ||||||
Cash used in financing activities | (31) | (579) | (238) | ||||||
Increase (decrease) in cash, cash equivalents, and restricted cash | 16 | (73) | 66 | ||||||
Effect of foreign exchange on cash, cash equivalents, and restricted cash | — | (5) | — | ||||||
Cash, cash equivalents, and restricted cash, beginning of year | 31 | 109 | 43 | ||||||
Cash, cash equivalents, and restricted cash, end of period | $ | 47 | $ | 31 | $ | 109 | |||
Reconciliation of cash flow information: | |||||||||
Cash and cash equivalents | $ | 47 | $ | 27 | $ | 105 | |||
Restricted cash included in prepaid and other current assets | — | 4 | 1 | ||||||
Restricted cash included in other non-current assets | — | — | 3 | ||||||
Total cash, cash equivalents, and restricted cash | $ | 47 | $ | 31 | $ | 109 | |||
See accompanying notes to the Consolidated Financial Statements.
72
MAXAR TECHNOLOGIES INC.
Consolidated Statements of Changes in Stockholders’ Equity
(In millions, except per share amounts)
Accumulated other | ||||||||||||||||||||
Common stock | Additional | Accumulated | comprehensive | Noncontrolling | Total stockholders’ | |||||||||||||||
| Shares |
| Amount |
| paid-in capital |
| deficit |
| income (loss) |
| interest |
| equity | |||||||
Balance as of December 31, 2018 | 59.4 | $ | 1,713 | $ | 59 | $ | (1,170) | $ | 64 | $ | 1 | $ | 667 | |||||||
Reclassification of APIC due to domestication | — | (1,713) | 1,713 | — | — | — | — | |||||||||||||
Common stock issued under employee stock purchase plan | 0.2 | — | 1 | — | — | — | 1 | |||||||||||||
Common stock issued upon vesting or exercise of stock-based compensation awards | 0.3 | — | — | — | — | — | — | |||||||||||||
Equity classified stock-based compensation expense | — | — | 11 | — | — | — | 11 | |||||||||||||
Dividends ($0.04 per common share) | — | — | — | (3) | — | — | (3) | |||||||||||||
Comprehensive income (loss) | — | — | — | 109 | (23) | — | 86 | |||||||||||||
Balance as of December 31, 2019 | 59.9 | $ | — | $ | 1,784 | $ | (1,064) | $ | 41 | $ | 1 | $ | 762 | |||||||
Reclassification of stock-based compensation awards | — | — | 4 | — | — | — | 4 | |||||||||||||
Common stock issued under employee stock purchase plan | 0.6 | — | 6 | — | — | — | 6 | |||||||||||||
Common stock issued upon vesting or exercise of stock-based compensation | 0.7 | — | — | — | — | — | — | |||||||||||||
Equity classified stock-based compensation expense | — | — | 24 | — | — | — | 24 | |||||||||||||
Dividends ($0.04 per common share) | — | — | — | (2) | — | — | (2) | |||||||||||||
Comprehensive income (loss) | — | — | — | 303 | (161) | — | 142 | |||||||||||||
Balance as of December 31, 2020 | 61.2 | $ | — | $ | 1,818 | $ | (763) | $ | (120) | $ | 1 | $ | 936 | |||||||
Common stock issuance, net of transaction fees | 10.0 | — | 380 | — | — | — | 380 | |||||||||||||
Common stock issued under employee stock purchase plan | 0.3 | — | 8 | — | — | — | 8 | |||||||||||||
Equity classified stock-based compensation expense | 1.2 | — | 29 | — | — | — | 29 | |||||||||||||
Dividends ($0.04 per common share) | — | — | — | (3) | — | — | (3) | |||||||||||||
Comprehensive income | — | — | — | 46 | 67 | — | 113 | |||||||||||||
Balance as of December 31, 2021 | 72.7 | $ | — | $ | 2,235 | $ | (720) | $ | (53) | $ | 1 | $ | 1,463 | |||||||
See accompanying notes to the Consolidated Financial Statements.
73
MAXAR TECHNOLOGIES INC.
Notes to Consolidated Financial Statements
(Tabular amounts in millions of dollars, unless otherwise noted)
1. GENERAL BUSINESS DESCRIPTION
Maxar Technologies Inc. (the “Company” or “Maxar”) is a provider of comprehensive space solutions and secure, precise, geospatial intelligence. Maxar helps government and commercial customers monitor, understand and navigate our changing planet; deliver global broadband communications; and explore and advance the use of space. The Company’s approach combines decades of deep mission understanding and a proven commercial and defense foundation to deploy solutions and deliver insights with speed, scale and cost effectiveness. Maxar’s stock trades on the New York Stock Exchange and Toronto Stock Exchange under the symbol “MAXR.”
On January 1, 2019, the Company completed a reorganization of its corporate structure pursuant to which the Company directly acquired all of the issued and outstanding shares of Maxar Technologies Ltd. (“Maxar Canada”), and the Company replaced Maxar Canada as the publicly-held parent company of the Maxar group (“U.S. Domestication”).
Completion of the sale of MDA
On April 8, 2020, the Company completed the sale of its former Canadian subsidiary (“MDA Business”), to Neptune Acquisition Inc. (“MDA Purchaser”), a corporation existing under the laws of the Province of British Columbia and an affiliate of Northern Private Capital Ltd. (“MDA Transaction”). This divestiture represented a strategic shift in the Company’s business and, in accordance with U.S. GAAP, the MDA Business qualified as a discontinued operation. As a result, the operating results and cash flows related to the MDA Business have been reflected as discontinued operations in the Consolidated Statements of Operations and the Consolidated Statements of Cash Flows. The assets and liabilities sold met the requirements to be classified within the Consolidated Balance Sheets under a held for sale designation as of December 31, 2019. See Note 4 for details.
Acquisition of Vricon
On July 1, 2020, the Company closed the acquisition of Vricon, Inc. (“Vricon”) by purchasing the remaining 50% ownership interest in Vricon (“Vricon Acquisition”). See Note 5 for details.
2. SUMMARY OF SIGNIFICANT ACCOUNTING POLICIES
Basis of preparation
The Consolidated Financial Statements include the accounts of Maxar Technologies Inc., and all consolidated subsidiary entities. The Company’s Consolidated Financial Statements have been prepared in accordance with generally accepted accounting principles in the United States (“U.S. GAAP”) and the rules and regulations of the U.S. Securities and Exchange Commission. All intercompany balances and transactions are eliminated on consolidation.
The Company's Consolidated Financial Statements are presented in U.S. dollars and have been prepared on a historical cost basis, except for certain financial assets and liabilities including derivative financial instruments which are stated at fair value.
Unless otherwise indicated, amounts provided in the Notes to the Consolidated Financial Statements pertain to continuing operations (See Note 4 for information on discontinued operations).
Use of estimates, assumptions and judgments
The preparation of the Consolidated Financial Statements in accordance with U.S. GAAP requires the Company to make estimates and judgments that affect the reported amounts of assets and liabilities and the disclosure of contingencies at the reporting date, as well as the reported amounts of revenues and expenses during the reporting
74
MAXAR TECHNOLOGIES INC.
Notes to Consolidated Financial Statements Continued
(Tabular amounts in millions of dollars, unless otherwise noted)
period. Estimates have been prepared using the most current and best available information; however, actual results could differ materially from those estimates.
Leases
The Company has both operating and finance leases. The majority of the Company’s leases are operating leases related to buildings. The Company’s finance leases are primarily related to furniture and equipment.
The Company determines if a contract is or contains a lease at inception based on whether it conveys the right to control the use of an identified asset. The Company recognizes lease liabilities and right-of-use assets based on the present value of the future minimum lease payments over the lease term at the commencement date. Right-of-use assets are adjusted for any prepayments, lease incentives received and initial direct costs incurred. If the rate implicit in the lease is not readily determinable, the Company’s incremental borrowing rate with a similar term to the lease term is used to determine the present value of future payments and appropriate lease classification. The lease term includes renewal options that are reasonably certain to be exercised. The Company elected the practical expedient not to separate lease and non-lease components. The Company also elected to include in minimum lease payments any executory costs that are part of the fixed lease payment.
Some of the Company’s building lease agreements contain incentives for leasehold improvements. If the leasehold improvement has been determined to be owned by the lessee, the Company generally recognizes the incentive as a reduction to the right-of-use asset. The Company uses the date of initial possession as the commencement date, which is generally when the Company has been given rights to access the space.
Leases with an initial term of 12 months or less are not recorded on the Company’s Consolidated Balance Sheets and are recognized as lease expense on a straight-line basis in the Consolidated Statements of Operations. Certain leasing arrangements require variable payments, such as insurance and tax payments. Variable lease payments that do not depend on an index or rate are excluded from lease payments in the measurement of the right-of-use asset and lease liability and are recognized as expense in the period in which the payment occurs.
The Company does not have any material restrictions or covenants in our lease agreements, sale leaseback transactions or residual value guarantees. The Company recognizes fixed lease expense for operating leases on a straight-line basis over the lease term. The Company recognizes amortization expense on finance lease right-of-use assets and interest expense on finance lease liabilities over the lease term.
Business combinations and divestitures
Business combinations are accounted for using the acquisition method. The consideration for an acquisition is measured at the fair values of the assets transferred, the liabilities assumed and the equity interests issued at the acquisition date. The excess of the consideration over the fair value of the identifiable net assets acquired is recorded as goodwill. Transaction costs that are incurred in connection with a business combination, other than costs associated with the issuance of debt or equity securities, are expensed as incurred.
The Company reports the results of operations of a business as discontinued operations if a disposal represents a strategic shift that has (or will have) a major effect on the Company’s operations and financial results when the business is classified as held for sale. The results of discontinued operations are reported in Income from discontinued operations, net of tax in the Consolidated Statements of Operations for current and prior periods, including any gain or loss recognized on closing or adjustment of the carrying amount to fair value less cost to sell. Assets and liabilities of a discontinued operation are reported separately in the Consolidated Balance Sheets as held for sale and classified as either current or non-current in the prior periods. If it is probable that the sale will occur and proceeds will be collected within
75
MAXAR TECHNOLOGIES INC.
Notes to Consolidated Financial Statements Continued
(Tabular amounts in millions of dollars, unless otherwise noted)
one year of meeting the held for sale criteria both assets and liabilities classified as held for sale are reported in the current period Consolidated Balance Sheet as current.
Foreign currency
Assets and liabilities of non-U.S. subsidiaries that operate in local currencies are translated to U.S. dollars at exchange rates in effect at the balance sheet date, with the resulting translation adjustments, net of tax, recorded in Accumulated other comprehensive income (loss) within the Stockholders’ equity section of the Consolidated Balance Sheets. Income and expense accounts are translated at average monthly exchange rates during the year.
Revenue recognition
Revenue is recognized in accordance with the five-step model set forth by Accounting Standards Codification (“ASC”) 606, which involves identification of the contract(s), identification of performance obligations in the contract, determination of the transaction price, allocation of the transaction price to the previously identified performance obligations and recognition of revenue as the performance obligations are satisfied.
Revenue is measured at the fair value of consideration received or receivable, net of discounts as of the date of the transaction. When consideration received from customers includes advance payments that contain a financing element, the Company imputes interest on such advance payments and recognizes such amounts as a component of revenue.
Contract costs generally include direct costs such as materials, labor and subcontract costs. Costs are expensed as incurred except for incremental costs incurred to obtain or fulfill a contract, which are capitalized and amortized on a systematic basis consistent with the transfer of goods or services to the customer to which the capitalized costs relate. As of December 31, 2021 and 2020, current costs to obtain or fulfill a contract were $8 million and $6 million, respectively, and are included in Other current assets within the Consolidated Balance Sheets. As of December 31, 2021 and 2020, non-current costs to obtain or fulfill a contract were $47 million and $41 million, respectively, and are included in Other non-current assets within the Consolidated Balance Sheets.
Space Infrastructure
Revenue in the Space Infrastructure segment is primarily generated from long-term construction contracts. Due to the long-term nature of these contracts, the Company generally recognizes revenue over time using the cost-to-cost method to measure progress. Under the cost-to-cost method, revenue is recognized based on the proportion of total costs incurred to estimated total costs at completion ("EAC"). Revenue recognition is also contingent on estimated contractual consideration. An EAC includes all direct costs and indirect costs directly attributable to a program or allocable based on program cost pooling arrangements. Estimates regarding the Company’s cost associated with the design, manufacture and delivery of products and services are used in determining the EAC. Changes to an EAC or estimated contractual consideration are recorded as a cumulative adjustment to revenue.
Satellite construction contracts may include performance incentives whereby payment for a portion of the purchase price is contingent upon in-orbit performance of the satellite. These performance incentives are structured in two forms. As a warranty payback, the customer pays the entire amount of the performance incentive during the period of the satellite construction and such incentives are subject to refund if satellite performance does not achieve certain predefined operating specifications. As an orbital receivable, the customer makes payment of performance incentives over the in-orbit life of the satellite. Performance incentives, whether warranty payback or orbital receivables, are included in revenue during the construction period to the extent it is probable that a significant reversal in the amount of cumulative revenue recognized will not occur when the uncertainty associated with the variable consideration is subsequently resolved. In addition to the in-orbit performance incentives, satellite construction contracts may include liquidated damages clauses. Liquidated damages can be incurred on programs as a result of delays due to slippage or for programs
76
MAXAR TECHNOLOGIES INC.
Notes to Consolidated Financial Statements Continued
(Tabular amounts in millions of dollars, unless otherwise noted)
which fail to meet all milestone requirements as outlined within the contractual arrangements with customers. Losses related to liquidated damages result in a reduction of revenue recognized and are recorded in the period in which, based on available facts and circumstances, management believes it is probable that liquidated damages will be incurred and enforced.
Construction contracts have termination clauses. If a contract is terminated for convenience by a customer, the Company is typically entitled to costs incurred plus a reasonable profit.
Earth Intelligence
Revenue in the Earth Intelligence segment is generated from imagery and geospatial intelligence service contracts. Revenue from imagery service contracts is recognized based on satellite capacity made available to the customer in a particular period, when imagery is delivered to the customer, or ratably over the subscription period. Many of our imagery service contracts relate to the transfer of a series of distinct goods or services over time for which management has determined are a single performance obligation.
EnhancedView Follow-On Contract – The EnhancedView Follow-On contract (“EnhancedView Contract”) includes one performance obligation to deliver a certain amount of capacity to the U.S. government over the contractual term that ended on August 31, 2020. While other promised goods or services exist in the EnhancedView Contract, none are considered distinct and, thus, do not represent separate performance obligations. Revenue is recognized as capacity is provided to the customer. As a consistent amount of capacity is being made available, revenue is recognized on a ratable basis. In 2018, the Company signed an agreement that added option years to the EnhancedView Contract extending the term to August 21, 2023. The Company determined that these option years do not provide a material right to the customer, and therefore do not give rise to additional performance obligations. As each option year is exercised, the consideration payable by the U.S. government will be recognized as revenue as capacity is provided over that option year. The second option year was exercised on July 15, 2021, for a one-year term ending on August 31, 2022. In November 2021, the National Reconnaissance Office (“NRO”) announced the release of the Electro-Optical Commercial Layer (“EOCL”) contract Request for Proposal (“RFP”) which is expected to replace the existing EnhancedView Contract. In December 2021, the Company submitted a response to the EOCL RFP and anticipates the NRO to award EOCL contracts prior to expiration of the EnhancedView Contract, including remaining option years.
Direct Access Program – Direct Access Program arrangements generally include construction of the direct access facility, access to the satellites to task and download imagery and facility maintenance services. The facility is generally delivered at the beginning of the contractual period of performance with access and maintenance services delivered over the duration of the contractual term. Under ASC 606, the Company has determined that two performance obligations exist; the access and related non-distinct promised goods and services are included together as a combined performance obligation with maintenance services representing a standalone performance obligation. Where a direct access facility is to be constructed under a new Direct Access Program or upgraded to maintain an existing level of service, the access and the facility are considered a single combined performance obligation as the customer cannot benefit from the facility on its own or with other readily available resources. The transaction price allocated to the combined performance obligation is recognized as access minutes are consumed during the contractual period. The remaining transaction price allocated to the maintenance services is recognized ratably over the maintenance period.
Other Imagery Arrangements – Revenue is recognized for imagery licenses when the imagery is delivered to the customer. Revenues related to online imagery subscriptions are generally recognized ratably over the subscription period. Other imagery arrangements transfer a series of distinct goods or services over time for which management has determined are a single performance obligation or include multiple performance obligations.
Revenue from geospatial intelligence service contracts is recognized from the rendering of services that compensate the Company at a cost-plus-fixed-fee, firm fixed price, or on a time and materials basis. Revenue is typically recognized for
77
MAXAR TECHNOLOGIES INC.
Notes to Consolidated Financial Statements Continued
(Tabular amounts in millions of dollars, unless otherwise noted)
these contracts over time based on the stage of services completed to date as a percentage of total services to be performed, or on the basis of time plus reimbursable costs incurred during the period. As the customer typically controls the related work-in-progress, an input measure is the most appropriate basis with which to measure progress. Finally, as cost of labor is the predominant measure by which these contracts are structured, the Company recognizes revenue using a cost-incurred approach.
Contract liabilities
Contract liabilities primarily consist of advance payments from customers and deferred revenue. Changes in contract liabilities are primarily due to the timing difference between the Company’s performance of services and payments from customers. To determine revenue recognized from contract liabilities during the reporting periods, the Company allocates revenue to individual contract liability balances and applies revenue recognized during the reporting periods first to the beginning balances of contract liabilities until the revenue exceeds the balances.
Net income (loss) per common share
Net income (loss) per common share is computed by dividing net income (loss) by the sum of the weighted average number of common shares outstanding during the period.
Diluted income per common share is computed by adjusting the basic income per common share calculation, as described above, for the effects of all potentially dilutive shares. The Company calculates the effects of all potentially dilutive shares using the treasury stock method unless they are anti-dilutive.
Research and development
Research and development costs are expensed in the period incurred. For the years ended December 31, 2021, 2020 and 2019, the Company expensed research and development costs of $27 million, $15 million, and $10 million, respectively, in Selling, general and administrative expense within the Consolidated Statements of Operations.
Implementation costs incurred in cloud computing arrangements
Deferred implementation costs for hosted cloud computing service arrangements are stated at historical cost and amortized on a straight-line basis over the term of the hosting arrangement to which the implementation costs relate to, including any probable renewals. Deferred implementation costs for these arrangements are included in Prepaid assets and Other non-current assets in the Consolidated Balance Sheets and amortized to the same line item as the related hosting fees in the Consolidated Statements of Operations. There was no amortization for the years ended December 31, 2021, 2020 or 2019. The cash flows for deferred implementation costs and fees for the associated hosting arrangements are reporting in the same line within operating activities in the Consolidated Statements of Cash Flows. As of December 31, 2021 and 2020, deferred implementation costs for cloud computing arrangements were $20 million and $2 million, respectively.
Interest expense, net
Interest expense, net is comprised of borrowing cost on debt, interest expense on advance payments from customers and other liabilities, interest expense on the orbital securitization liability and losses incurred on the extinguishment of debt, net of capitalized interest.
Debt issuance costs related to the Company’s revolving line of credit are recorded in Prepaid assets and in Other non-current assets in the Consolidated Balance Sheets. Debt issuance costs and debt discount related to the Company’s term loan and senior secured notes are recorded as a direct deduction from the carrying amount of the related debt.
78
MAXAR TECHNOLOGIES INC.
Notes to Consolidated Financial Statements Continued
(Tabular amounts in millions of dollars, unless otherwise noted)
Derivative financial instruments and hedging activities
Derivative financial instruments used by the Company consist of foreign currency forward contracts and interest rate swap agreements. The Company uses foreign currency forward contracts to manage foreign exchange risk associated with the cash flows from long-term construction contracts where some portion of the cash flows are denominated in foreign currencies as part of the normal course of business. The Company uses interest rate swap agreements to manage interest rate risk associated with cash outflows from long-term debt. Derivative financial instruments are measured at fair value and are included as components of Other current liabilities and Other non-current liabilities in the Consolidated Balance Sheets. When derivative financial instruments are designated in a qualifying hedging relationship and hedge accounting is applied, the effectiveness of the hedges is measured at the end of each reporting period and the effective portion of changes in fair value are deferred in Accumulated other comprehensive income (loss). Amounts deferred in Accumulated other comprehensive income (loss) are reclassified to income when the hedged transaction has occurred. The ineffective portion of the change in the fair value of the derivative is recorded in income in each period. Cash transactions related to the Company’s derivative contracts accounted for as hedges are classified in the same category as the item being hedged in the Consolidated Statements of Cash Flows. For foreign exchange contracts not in a qualifying hedging relationship, changes in fair value are recognized immediately as a foreign exchange gain or loss in Other (income) expense, net within the Consolidated Statements of Operations.
Hedge accounting is discontinued when the hedging instrument expires or is sold, terminated, exercised or no longer qualifies for hedge accounting. At that time, if the forecasted transaction within a cash flow hedge remains probable, any cumulative gain or loss on the hedging instrument recognized in Other comprehensive income (loss) is retained in equity until the forecasted transaction occurs. If the forecasted transaction is no longer expected to occur, the net cumulative gain or loss previously recognized in other comprehensive income is transferred to income. As of January 1, 2019, the Company discontinued hedge accounting on foreign exchange forward contracts related to its manufacturing and service programs.
The Company does not offset the fair value amounts recognized with derivative instruments against the change in fair value of assets, liabilities or firm commitments executed with the same counterparty under a master netting agreement.
Cash, cash equivalents and restricted cash
Cash and cash equivalents is comprised of cash on hand, cash balances with banks and similar institutions and term deposits redeemable within three months or less from date of acquisition with banks and similar institutions. Restricted cash is excluded from cash and cash equivalents and is included in Other current assets or Other non-current assets in the Consolidated Balance Sheets.
Trade and other receivables, net
Trade and other receivables include amounts billed to customers, unbilled receivables in which the Company’s right to consideration is unconditional and current portion of orbital receivables, net of allowance for expected credit losses. The Company bills customers as work progresses in accordance with agreed-upon contractual terms, either at periodic intervals, upon achievement of contractual milestones or upon deliveries.
The Company maintains an allowance for expected credit losses for estimated losses resulting from the inability of its customers to make required payments, which results in bad debt expense. The Company periodically determines the adequacy of this allowance by evaluating the comprehensive risk profiles of all individual customer receivable balances including, but not limited to, the customer’s financial condition, credit agency reports, financial statements, credit limit and overall current economic conditions.
79
MAXAR TECHNOLOGIES INC.
Notes to Consolidated Financial Statements Continued
(Tabular amounts in millions of dollars, unless otherwise noted)
Orbital Receivables
Orbital receivables relate to performance incentives due under certain satellite construction contracts that are paid over the in-orbit life of the satellite. Orbital receivables are recognized as revenue when measuring progress under the cost-to-cost method during the construction period. The interest portion of the in-orbit payments is recognized as orbital revenue. Current orbital receivables are included in Trade and other receivables, net and long-term orbital receivables are included in Non-current assets, net of allowances in the Consolidated Balance Sheets.
The Company records an allowance on its orbital receivables when, based on current events and circumstances, it believes it is probable that the outstanding amounts will not be collected. The Company utilizes customer credit ratings, expected credit loss and other credit quality indicators, as well as contractual terms to evaluate the collectability of orbital receivables on a quarterly basis. When qualitative factors indicate that all or a portion of an outstanding orbital receivable is uncollectable, a fair value assessment is performed using a discounted cash flow model as an indicator to determine whether an increase in the allowance is necessary. Increases and decreases in the orbital receivables allowance are included in (Gain) loss on orbital receivables allowance in the Consolidated Statements of Operations.
If the Company does not fulfill its performance obligation associated with its orbital receivables, a write-off of those orbital receivables will occur resulting in a reduction in the contractual value and revenue recognition associated with the performance obligation.
The Company has a revolving securitization facility agreement with an international financial institution. Under the terms of the agreement, the Company may offer to sell eligible orbital receivables from time to time with terms of seven years or less, discounted to face value using prevailing market rates.
The Company has sold certain orbital receivables in tranches that span multiple years and include longer-term maturities. The orbital receivables that have been securitized remain recognized on the Consolidated Balance Sheets as the Company does not meet the accounting criteria for surrendering control of the receivables. The net proceeds received on the orbital receivables have been recognized as securitization liabilities and are subsequently measured at amortized cost using the effective interest rate method. Securitization liabilities are presented in Other current liabilities and Other non-current liabilities on the Consolidated Balance Sheets. The securitized orbital receivables and the securitization liabilities are being drawn down as payments are received from the customers and passed on to the purchaser of the tranche. The Company continues to recognize orbital revenue on the orbital receivables that are subject to the securitization transactions and recognizes interest expense to accrete the securitization liability.
Investments
Short-term investments consist of mutual funds and financial instruments purchased with a term to maturity at inception between three months and one year. Short-term investments are measured at fair value through net income. Short-term investments are included within Other current assets in the Consolidated Balance Sheets.
The Company has investments in joint ventures where it does not have a controlling financial interest but has the ability to exercise significant influence. These investments are accounted for under the equity method and are included within Other non-current assets in the Consolidated Balance Sheets. The Company’s share of the joint venture’s net income or loss is included within Equity in (income) loss from joint ventures, net of tax in the Consolidated Statements of Operations.
The Company’s most significant joint venture was Vricon, a joint venture with Saab AB, specializing in the production of 3D models using high resolution imagery. On July 1, 2020, the Company closed the acquisition of Vricon by purchasing the remaining 50% ownership interest in Vricon. The operating results of Vricon are included in the Company’s Consolidated Statement of Operations beginning July 1, 2020. The following table presents summarized
80
MAXAR TECHNOLOGIES INC.
Notes to Consolidated Financial Statements Continued
(Tabular amounts in millions of dollars, unless otherwise noted)
financial information for Vricon for the year ended December 31, 2019. Equity method investments are insignificant for the years ended December 31, 2021 and 2020.
Summarized Consolidated Statement of Operations
|
| December 31, | ||
2019 | ||||
Revenues |
|
| $ | 54 |
Gross profit | $ | 51 | ||
Income from operations |
| $ | 32 | |
Net income | $ | 24 | ||
Inventory
Inventories are measured at the lower of cost or net realizable value and consist primarily of parts and sub-assemblies used in the manufacturing of satellites. The cost of inventories is determined on a first-in-first-out basis or weighted average cost basis, depending on the nature of the inventory. Net realizable value is the estimated selling price in the ordinary course of business, less the estimated costs of completion and selling expense. Inventory is impaired when it is probable inventory values exceed their net realizable value.
Property, plant and equipment
Property, plant and equipment is measured at cost less accumulated depreciation. Cost for satellite assets includes amounts related to design, construction, launch and commissioning. Cost for ground system assets include amounts related to construction and testing. Interest expense is capitalized on certain qualifying assets that take a substantial period of time to prepare for their intended use. When the costs of certain components of an item of property, plant and equipment are significant in relation to the total cost of the item and the components have different useful lives, they are accounted for and depreciated separately. Property, plant and equipment under construction are measured at cost less any impairment losses.
Depreciation expense is recognized in income on a straight-line basis over the estimated useful life of the related asset to its residual value. Expected useful lives are reviewed at least annually. Land is not depreciated.
The estimated useful lives are as follows:
| Estimated useful life | ||
Land improvements | 20 years | ||
Buildings | 7 - 45 years | ||
Leasehold improvements | lesser of useful life or term of lease | ||
Equipment | 2 - 40 years | ||
Satellites 1 | 11.5 - 16 years | ||
Furniture and fixtures | 2 - 10 years | ||
Computer hardware | 2 - 13 years | ||
1 | The estimated useful life over which the Company depreciates its satellites is determined once a satellite has been placed into orbit. The initial determination of a satellites useful life involves an analysis that considers design life, random part failure probabilities, expected component degradation and cycle life, predicted fuel consumption and experience with satellite parts, vendors and similar assets. |
81
MAXAR TECHNOLOGIES INC.
Notes to Consolidated Financial Statements Continued
(Tabular amounts in millions of dollars, unless otherwise noted)
Intangible assets
Intangible assets consist of customer relationships, backlog, acquired technologies and software, image library, trade names, licenses and non-compete agreements. Intangible assets are generally amortized on a straight-line basis over their estimated useful lives and are recorded at fair value at the time of acquisition, or in the case of internally developed software, at cost. Image library intangibles assets are amortized using the double declining balance method. Intangible assets are currently amortized over the following estimated useful lives:
| Estimated useful life | ||
Customer relationships | 9 - 21 years | ||
Backlog | 2 - 5 years | ||
Technologies | 5 - 13 years | ||
Software | 2 - 10 years | ||
Image library | 5 years | ||
Trade names and other | 1 - 20 years | ||
Non-compete agreements | 2 years | ||
Impairment
Intangible assets and property, plant and equipment and other long-lived assets
Finite-lived intangible assets, property, plant and equipment and other long-lived assets are tested for impairment at least annually on October 1, or whenever events or changes in circumstances indicate that the carrying amount may not be recoverable.
Finite-lived intangible assets and property, plant and equipment and other long-lived assets are reviewed for impairment at least annually or whenever events or changes in circumstances indicate that the carrying amount of an asset may not be recoverable. An impairment loss is recognized when the undiscounted cash flows expected to be generated by an asset (or group of assets) are less than the asset’s carrying value. Any required impairment loss is measured as the amount by which the asset’s carrying value exceeds its fair value and recorded as a reduction in the carrying value of the related asset.
If an owned satellite were to fail during launch or while in-orbit, the resulting loss would be charged to expense in the period it is determined the satellite is not recoverable. The amount of loss would be reduced to the extent of insurance proceeds received. The timing of the loss and the insurance recovery will likely differ, as an insurance recovery generally cannot be recognized until final settlement with the insurance company is reached.
In December 2018, the Company experienced a loss of the WorldView-4 satellite and in 2019, the Company received insurance recoveries of $183 million. The insurance proceeds are included in operating cash flows as they are considered business interruption insurance and represent the Company’s satellite’s loss of capacity to produce imagery for sale to the Company’s customers.
Goodwill
Goodwill is tested for impairment at least annually on October 1, or whenever events or changes in circumstances indicate that its carrying amount may be less than its recoverable amount.
Goodwill is tested for impairment at the reporting unit level. The Company may use either a qualitative or quantitative approach when testing a reporting unit’s goodwill for impairment. Where a qualitative approach is used, an evaluation of events and circumstances impacting the reporting unit is performed to determine the likelihood of goodwill impairment.
82
MAXAR TECHNOLOGIES INC.
Notes to Consolidated Financial Statements Continued
(Tabular amounts in millions of dollars, unless otherwise noted)
Based on that qualitative evaluation if it is determined that it is more likely than not that the fair value of a reporting unit exceeds its carrying amount, no further evaluation is necessary. Otherwise, a quantitative impairment test is performed.
Where a quantitative approach is used, management typically uses an income approach to estimate the fair value of a reporting unit, which requires the use of significant judgments and estimates, including future cash flows, terminal growth rates and discount rates. Any changes to these inputs could have a material impact on the impairment calculation. An impairment loss is recognized to the extent that the carrying value of a reporting unit exceeds its fair value. Management assesses the reasonableness of the results by reconciling the sum of the estimated fair values of the reporting units, including the Company’s Corporate balance sheet, to the Company’s market capitalization and market value of invested capital as of the date of our annual impairment test.
The Company used a qualitative approach for its goodwill impairment assessment as of October 1, 2021 and 2020 and determined that no impairment existed.
Warranty and after-sale service costs
A liability for warranty and after-sale service costs is recognized when the underlying product or service is sold. Warranty and after-sale service provisions are based on management’s best estimate of the expected obligation using historical warranty data and experience. Warranty and after-sale service liabilities related to products and services delivered under construction contracts are included in the EAC for revenue recognition. Warranty and after-sale service liabilities are presented in Other current liabilities and Other non-current liabilities on the Consolidated Balance Sheets. Warranty and after-sale service costs are recognized within Product and Service costs, excluding depreciation and amortization in the Consolidated Statement of Operations.
Restructuring costs
A liability for restructuring costs is recognized when the Company has approved a detailed and formal restructuring plan and the restructuring either has commenced or has been announced publicly. Restructuring liabilities are presented in Other current liabilities and Other non-current liabilities on the Consolidated Balance Sheets. Restructuring costs are recognized within Selling, general and administrative expense and within Product costs and Service costs, excluding depreciation and amortization in the Consolidated Statements of Operations.
Employee benefits
Defined benefit pension and other postretirement benefit plans
The Company maintains defined benefit pension and other postretirement benefit plans for certain employees within its Space Infrastructure segment. The pension and other postretirement plan benefits were frozen on December 31, 2013.
The Company recognizes the funded status of each pension and other postretirement benefit plan in the Consolidated Balance Sheets. The calculation of pension and other postretirement benefit obligations is performed annually by qualified actuaries using the projected unit credit actuarial cost method. The projected benefit obligation is the sum of the actuarial present value of all pension benefits attributed to benefit service completed to the determination date.
Pension and other postretirement plan liabilities are revalued annually, or when an event occurs that requires remeasurement, based on updated assumptions and information about the individuals covered by the plan. The Company’s net obligation in respect of the pension and other postretirement benefit plans is calculated separately for each plan by estimating the amount of future benefit that employees have earned in the prior periods, discounting that amount and deducting the fair value of associated plan assets.
83
MAXAR TECHNOLOGIES INC.
Notes to Consolidated Financial Statements Continued
(Tabular amounts in millions of dollars, unless otherwise noted)
The Company uses the net asset value (“NAV”) practical expedient to measure the fair value of the plan’s commingled fund investments. These commingled fund investments for which the fair value is measured using the NAV practical expedient are excluded from the fair value hierarchy.
The Company recognizes the amortization of prior service costs as a component of Selling, general and administrative expense. All other costs are recognized outside of operating income within Other (income) expense, net. The Company recognizes administrative expenses related to frozen plans outside of Operating income (loss) within Other (income) expense, net.
When the benefits of a plan are changed or when a plan is curtailed, the resulting change in the net benefit liability that relates to past service or the gain or loss on curtailment is recognized immediately in Accumulated other comprehensive income (loss). The Company recognizes gains or losses on the settlement of a defined benefit plan when settlement occurs.
For the Company’s pension and other postretirement benefit plans, accumulated actuarial gains and losses in excess of a 10 percent corridor and the prior service cost are amortized on a straight-line basis from the date recognized over the average remaining service period of active participants or over the average life expectancy for plans with significant inactive participants.
Defined contribution plans
The Company also maintains defined contribution plans for some of its employees whereby the Company pays contributions based on a percentage of the employees’ annual salary. Obligations for contributions to defined contribution pension plans are recognized as an employee benefit expense in Operating income (loss) as the services are provided.
Stock-based compensation plans
The Company maintains a number of stock-based compensation plans for certain employees and directors that may be settled with cash and/or equity. For certain stock-based compensation plans, the Company has the ability to mandate equity settlement by issuing reserved shares. Stock-based compensation plans are measured at fair value using either the Black-Scholes option pricing model, the closing price of the Company’s common stock on the grant date or Monte Carlo simulation model and the fair value is expensed on a graded vesting schedule over the vesting period. Management uses judgment to determine the inputs to the models including the expected plan lives, underlying stock price volatility and forfeiture rates. Volatility is estimated by considering the Company’s historic stock price volatility over similar periods to the expected life of the awards under consideration. Changes in these assumptions will impact the calculation of fair value and the amount of compensation expense recognized within Selling, general and administrative expense in the Consolidated Statements of Operations.
The fair value of liability classified awards is recognized as a liability within Accrued compensation and benefits and Pension and other postretirement benefit liabilities in the Consolidated Balance Sheets. The Company classifies stock-based compensation awards as liability when the expectation is the awards will be settled in cash. The liability is re-measured and charged to income at each reporting date until the award is settled.
The fair value of equity-settled plans is recognized in Additional paid-in capital in the Consolidated Balance Sheets. Equity-settled plans are measured based on the grant date fair value of the award including the impact of estimated forfeitures and are not re-measured. The Company classifies stock-based compensation awards as equity when the expectation is the awards will be settled in equity.
84
MAXAR TECHNOLOGIES INC.
Notes to Consolidated Financial Statements Continued
(Tabular amounts in millions of dollars, unless otherwise noted)
Income taxes
The Company is subject to income taxes in the United States, Sweden and other foreign jurisdictions. The Company computes its provision for income taxes using the asset and liability method, under which deferred tax assets and liabilities are determined based on the temporary differences between the financial reporting and tax bases of assets and liabilities. Deferred tax assets and liabilities are measured at the currently enacted tax rates that are expected to apply in years in which they are expected to be paid for or realized. All deferred income taxes are classified as non-current in the Company's Consolidated Balance Sheets. Significant judgments are required in order to determine the realizability of deferred tax assets. In assessing the need for a valuation allowance, the Company's management evaluates all significant available positive and negative evidence, including historical operating results, estimates of future sources of taxable income, carry-forward periods available, the existence of prudent and feasible tax planning strategies and other relevant factors.
The recognition of uncertain tax positions is evaluated based on whether it is considered more likely than not that the position taken, or expected to be taken, on a tax return will be sustained upon examination through litigation or appeal. For those positions that meet the recognition criteria, they are measured as the largest amount that is more than 50 percent likely to be realized upon ultimate settlement. The Company believes that the reserves for unrecognized tax benefits are adequate to cover all open tax years based on its assessment. If the expected outcome of the matter changes, the Company will adjust income tax expense (benefit) or the deferred tax asset accordingly in the period in which the expected outcome has changed. The Company classifies interest and penalties related to income taxes as income tax expense.
Reclassifications
Certain amounts in the prior year financial statements have been reclassified to conform to the current year presentation.
Recently Adopted Accounting Pronouncements
Financial Instruments
In June 2016, the Financial Accounting Standards Board (“FASB”) issued Accounting Standards Update (“ASU”) 2016-13, Financial Instruments-Credit Losses (Topic 326): Measurement of Credit Losses on Financial Instruments (“ASU 2016-13”) which together with subsequent amendments is included in ASC 326 – Financial Instruments – Credit Losses. ASC 326, as amended, significantly changes the impairment model for most financial assets and certain other instruments. ASC 326, as amended, requires immediate recognition of estimated credit losses expected to occur over the remaining life of many financial assets, which will generally result in earlier recognition of allowances for credit losses on loans and other financial instruments. These updates were effective for annual and interim financial statement periods beginning after December 15, 2019, with early adoption permitted for financial statement periods beginning after December 15, 2018. The Company adopted this standard and related amendments effective January 1, 2020, using the modified retrospective approach. The adoption of this standard resulted in additional disclosures related to the Company’s orbital receivables. Refer to Note 6 for details. There were no impacts to the Consolidated Financial Statements as a result of adoption.
Simplifying the Accounting for Income Taxes
In December 2019, the FASB issued ASU 2019-12, Income Taxes (Topic 740): Simplifying the Accounting for Income Taxes (“ASU 2019-12”). ASU 2019-12 simplifies the accounting for income taxes by removing certain exceptions to the general principles in Topic 740. ASU 2019-12 also simplifies aspects of accounting for franchise taxes and clarifies the accounting for transactions that result in a step-up in the tax basis of goodwill. ASU 2019-12 is effective for annual and interim financial statement periods beginning after December 15, 2020, with early adoption permitted. The Company
85
MAXAR TECHNOLOGIES INC.
Notes to Consolidated Financial Statements Continued
(Tabular amounts in millions of dollars, unless otherwise noted)
early adopted this standard and related amendments effective January 1, 2020 on a prospective basis, in order to utilize the simplifying provision that removes the exception to the incremental approach for intraperiod tax allocation when a loss is incurred from continuing operations and income or a gain results from another item such as discontinued operations. There were no additional material impacts to the Consolidated Financial Statements as a result of adoption.
3. NEW STANDARDS AND INTERPRETATIONS NOT YET ADOPTED
Reference Rate Reform
In March 2020, FASB issued ASU 2020-04, Reference Rate Reform (Topic 848): Facilitation of the Effects of Reference Rate Reform on Financial Reporting (“ASU 2020-04”) which together with subsequent amendments is intended to provide temporary optional expedients and exceptions to the U.S. GAAP guidance on contract modifications and hedge accounting to ease the financial reporting burdens related to the expected market transition from the London Interbank Offered Rate and other interbank offered rates to alternative reference rates. This guidance was effective beginning on March 12, 2020, and the Company may elect to apply the amendments prospectively through December 31, 2022. The Company expects that it will elect to apply some of the expedients and exceptions in ASU 2020-04. However, the Company is still evaluating the guidance and the impact that adoption of ASU 2020-04 will have on the Company's financial statements.
4. DISCONTINUED OPERATIONS
On April 8, 2020, the Company completed the sale of the MDA Business to MDA Purchaser for an aggregate purchase price of $729 million ($1.0 billion Canadian dollars). The Company recognized an after-tax gain on disposal of discontinued operations of $317 million, net of $12 million in taxes, on the MDA Transaction for the year ended December 31, 2020. The tax on the MDA Transaction was primarily due to the estimated U.S. federal Base Erosion and Anti-Abuse Tax and California legislation suspending the use of net operating loss (“NOL”) carryforwards. The gain on the MDA Transaction includes a reclassification primarily related to the foreign currency translation adjustment balance of $68 million from Accumulated other comprehensive (loss) income. See Note 12 for details on the use of proceeds from the MDA Transaction.
In addition, the Company and the MDA Purchaser entered into a Transition Services Agreement pursuant to which the MDA Purchaser received certain services (“Services”). The Services were provided based on an agreed upon fee arrangement that ended on April 8, 2021.
The Company determined that as of December 29, 2019, the MDA Business met the criteria to be classified as held for sale. The MDA Business was a separate reportable segment prior to the announcement of the MDA Transaction and constituted all the Company’s Canadian operations. As the MDA Transaction represented a strategic shift that had a major effect on the Company’s operations, the MDA Business results met the criteria to be reported as discontinued operations in accordance with ASC 205-20 – Discontinued Operations.
The results of MDA are classified as discontinued operations in the Consolidated Statements of Operations and the Consolidated Statements of Cash Flows for all periods presented. For the year ended December 31, 2020, the Company reported the operating results and cash flows related to the MDA Business through April 7, 2020. There was no activity within discontinued operations in the Consolidated Statements of Operations for the year ended December 31, 2021. For the year ended December 31, 2021, the Company made $13 million in payments on a previously recorded liability in relation to the Company’s dispute with a Ukrainian customer that is reflected within discontinued operations in the Consolidated Statements of Cash Flows.
86
MAXAR TECHNOLOGIES INC.
Notes to Consolidated Financial Statements Continued
(Tabular amounts in millions of dollars, unless otherwise noted)
Income from discontinued operations, net of tax for the MDA Business in the Consolidated Statements of Operations consists of the following:
Year Ended | ||||||
December 31, | ||||||
| 2020 1 | 2019 | ||||
Revenues: | ||||||
Product | $ | 44 | $ | 206 | ||
Service | 42 | 161 | ||||
Total revenues | 86 | 367 | ||||
Costs and expenses: | ||||||
Product costs, excluding depreciation and amortization | 38 | 149 | ||||
Service costs, excluding depreciation and amortization | 24 | 84 | ||||
Selling, general and administrative | 13 | 88 | ||||
Depreciation and amortization |
| 4 |
| 11 | ||
Impairment loss | 12 | 12 | ||||
Operating (loss) income |
| (5) |
| 23 | ||
Interest expense, net |
| 1 |
| 1 | ||
Other (income) expense, net2 | (34) | 3 | ||||
Income before taxes |
| 28 |
| 19 | ||
Income tax benefit | (4) | (7) | ||||
Income from operations of discontinued operations, net of tax | 32 | 26 | ||||
Gain on disposal of discontinued operations, net of tax | 317 | — | ||||
Income from discontinued operations, net of tax | $ | 349 | $ | 26 | ||
1For the year ended December 31, 2020, MDA Business results are presented through April 7, 2020.
2 | Other (income) expense, net includes the $39 million recovery of the previously recorded liability in relation to the Company’s dispute with the Ukrainian Customer for the year ended December 31, 2020. |
MDA held an investment in a privately held company in which it did not have significant influence and the fair value of which could not be reliably measured through external indicators. The investment was evaluated quarterly for impairment. In 2019, the Company noted an observable price change related to its investment and, as a result, recorded an impairment loss of $12 million. There were no investment impairment losses recognized for the year ended December 31, 2020.
5. BUSINESS COMBINATION
The Company did not close any transactions qualifying as a business combination during the years ended December 31, 2021 or 2019.
On July 1, 2020, the Company closed the acquisition of Vricon by purchasing the remaining 50% ownership interest in Vricon for $143 million or, excluding Vricon cash on hand of $23 million, for $120 million. Vricon is a global leader in satellite-derived 3D data for defense and intelligence markets, with software and products that enhance 3D mapping, Earth intelligence data, military simulation and training and precision-guided munitions. Vricon was formed as a joint venture between Maxar and Saab AB in 2015 to combine patented Saab AB intellectual property with the Company’s commercial satellite imagery to build highly accurate, immersive 3D products at scale. Prior to the closing of the Vricon Acquisition, Vricon was the Company’s most significant joint venture.
To fund the Vricon Acquisition, the Company issued $150 million in aggregate principal amount of 7.54% senior secured notes due 2027 (“2027 Notes”). See Note 12 for additional details on the issuance of the 2027 Notes. As part of
87
MAXAR TECHNOLOGIES INC.
Notes to Consolidated Financial Statements Continued
(Tabular amounts in millions of dollars, unless otherwise noted)
the Vricon Acquisition, Vricon’s stock-based awards vested upon the consummation of the Vricon Acquisition and were settled in cash for $26 million. The unvested awards were forfeited.
The Vricon Acquisition was achieved in stages, which required the Company to remeasure its previously held equity interest in Vricon at its acquisition date fair value. As no material control premium was determined to exist, the call option purchase price of $117 million paid in the Vricon Acquisition was used to estimate the fair value of the previously held equity interest. The Company performed a business enterprise valuation to corroborate the resulting total implied purchase consideration. This remeasurement resulted in a gain of approximately $85 million which was recorded in Other (income) expense within the Company’s Consolidated Statements of Operations for the year ended December 31, 2020.
The operating results of Vricon are included in the Company’s Consolidated Statements of Operations beginning July 1, 2020. Vricon results are consolidated within the Earth Intelligence Segment. See Note 2 for summarized financial information for Vricon for periods prior to the date of acquisition.
The following table presents unaudited pro forma financial information as if Vricon had been included in the Company’s financial results as of January 1, 2019, through the year ended December 31, 2020:
Year Ended | ||||||
December 31, | ||||||
| 2020 |
| 2019 | |||
Revenues | $ | 1,734 | $ | 1,706 | ||
Net income | $ | 302 | $ | 119 | ||
Purchase Price Allocation
The following table summarizes the fair value of the consideration transferred and the fair values of the major classes of assets acquired and liabilities assumed at the acquisition date. The fair value of the intangible assets acquired has been determined using valuation techniques that require significant judgment, including the amount and timing of future net cash flows and discount rates. During the three months ended March 31, 2021, the Company finalized the purchase price
88
MAXAR TECHNOLOGIES INC.
Notes to Consolidated Financial Statements Continued
(Tabular amounts in millions of dollars, unless otherwise noted)
allocation related to the Vricon Acquisition. There were no adjustments from the preliminary purchase price allocation determined as of December 31, 2020.
| July 1, 2020 | ||
Call option purchase price | $ | 117 | |
Fair value of existing equity interest | 117 | ||
Cash settlement of equity awards | 26 | ||
Purchase consideration | $ | 260 | |
Assets | |||
Cash and cash equivalents | $ | 23 | |
Trade and other receivables, net | 9 | ||
Property, plant and equipment, net | 3 | ||
Intangible assets, net | 73 | ||
Other assets | 7 | ||
Total assets | $ | 115 | |
Liabilities | |||
Accounts payable | 1 | ||
Accrued liabilities | 3 | ||
Deferred income tax liability | 17 | ||
Other current liabilities | 6 | ||
Total liabilities | 27 | ||
Fair value of net identifiable assets acquired | 88 | ||
Goodwill | $ | 172 | |
The following table summarizes the intangible assets acquired from the Vricon Acquisition by class and useful life:
Carrying value | Remaining useful life | |||||
Finite-lived intangible assets: | ||||||
Backlog | $ | 21 | 2 years | |||
Trademarks | 1 | 1 year | ||||
Existing technology | 49 | 9 years | ||||
Existing software | 2 | - 3 years | ||||
Total intangible assets | $ | 73 | ||||
The goodwill of $172 million is attributable primarily to the synergies expected to be achieved from integrating Vricon with the Company’s existing capabilities. Due to the nature of the Vricon Acquisition, the Company did not receive a step-up in tax basis on the fixed assets, intangible assets or goodwill recorded in the purchase price allocation.
6. TRADE AND OTHER RECEIVABLES, NET
89
MAXAR TECHNOLOGIES INC.
Notes to Consolidated Financial Statements Continued
(Tabular amounts in millions of dollars, unless otherwise noted)
December 31, | December 31, | ||||
2021 |
| 2020 | |||
U.S. government receivables: |
|
|
| ||
Billed | $ | 65 | $ | 84 | |
Unbilled |
| 124 |
| 76 | |
189 | 160 | ||||
Other governments and commercial receivables: | |||||
Billed | 97 | 97 | |||
Unbilled | 19 | 19 | |||
116 | 116 | ||||
Total trade receivables | 305 | 276 | |||
Orbital receivables, current portion | 49 | 49 | |||
Other | 2 | 3 | |||
Allowance for doubtful accounts | (1) | (1) | |||
Trade and other receivables, net | $ | 355 | $ | 327 | |
During the year ended December 31, 2021, the Company reduced its outstanding receivables related to the SXM-7 satellite for the final milestone and expected orbital payments by $15 million and $14 million, respectively. See Note 16 for additional details regarding the adjustment to revenue.
As of December 31, 2021 and 2020, non-current orbital receivables, net of allowances were $368 million and $361 million, respectively.
The Company has orbital receivables from 13 customers for which the largest customer’s value represents 30% and 19% of the stated current and non-current balance sheet values for the years ended December 31, 2021 and 2020, respectively.
For the year ended December 31, 2021, as a result of an increased certainty of collections of the outstanding orbital receivables from the Company’s largest customer, due to their emergence from bankruptcy, the Company reversed its $49 million allowance for expected credit losses. The changes in allowance for expected credit losses related to non-current orbital receivables for the years ended December 31, 2021 and 2020, consist of the following:
Orbital Receivables Allowance | |||
Allowance as of December 31, 2019 | $ | (35) | |
Additions | (14) | ||
Allowance as of December 31, 2020 | $ | (49) | |
Reversals |
| 49 | |
Allowance as of December 31, 2021 | $ | — | |
The expected timing of total contractual cash flows, including principal and interest payments for orbital receivables is as follows:
2022 |
| 2023 |
| 2024 | 2025 | 2026 | Thereafter | Total | ||||||||||||
Contractual cash flows from orbital receivables | $ | 68 | $ | 74 | $ | 73 | $ | 70 | $ | 63 | $ | 309 | $ | 657 | ||||||
During the years ended December 31, 2021 and 2020, the Company did not sell any eligible orbital receivables or repurchase any orbital receivables. The net proceeds received on previously sold orbital receivables have been recognized as securitization liabilities.
90
MAXAR TECHNOLOGIES INC.
Notes to Consolidated Financial Statements Continued
(Tabular amounts in millions of dollars, unless otherwise noted)
Securitization liabilities as of December 31, 2021 and 2020, are as follows:
December 31, | December 31, | ||||
2021 |
| 2020 | |||
Current portion | $ | 16 | $ | 14 | |
Non-current portion |
| 32 |
| 47 | |
Total securitization liabilities | $ | 48 | $ | 61 | |
7. INVENTORY, NET
December 31, | December 31, | |||||
| 2021 |
| 2020 | |||
Raw materials | $ | 34 | $ | 22 | ||
Work in process | 6 | 9 | ||||
Total | $ | 40 | $ | 31 | ||
Inventory reserve | (1) | — | ||||
Inventory, net | $ | 39 | $ | 31 | ||
8. PROPERTY, PLANT AND EQUIPMENT, NET
December 31, | December 31, | |||||
| 2021 |
| 2020 | |||
Satellites | $ | 397 | $ | 397 | ||
Equipment | 221 | 207 | ||||
Computer hardware | 95 | 78 | ||||
Leasehold improvements | 83 | 81 | ||||
Furniture and fixtures | 16 | 15 | ||||
Construction in process1 | 668 | 572 | ||||
Property, plant and equipment, at cost | 1,480 | 1,350 | ||||
Accumulated depreciation |
| (540) | (467) | |||
Property, plant and equipment, net | $ | 940 | $ | 883 | ||
1 | Construction in process is primarily related to the construction of the Company’s WorldView Legion satellites. |
Depreciation expense for property, plant and equipment was $86 million, $93 million and $107 million for the years ended December 31, 2021, 2020 and 2019, respectively.
Sale leaseback
During the fourth quarter of 2019, the Company completed the sale and subsequent leaseback of Company owned properties in Palo Alto, California for net proceeds of $280 million. The Company recognized a gain on the sale of the properties of $136 million, which was adjusted for off-market leaseback terms, and is included in Loss (gain) on sale of assets in the Company’s Consolidated Statement of Operations. During 2020, the Company recognized a $4 million reduction in the gain due to the extension of the lease term on one of the properties, which is included in Loss (gain) on sale of assets in the Company’s Consolidated Statement of Operations.
91
MAXAR TECHNOLOGIES INC.
Notes to Consolidated Financial Statements Continued
(Tabular amounts in millions of dollars, unless otherwise noted)
9. INTANGIBLE ASSETS AND GOODWILL
December 31, 2021 | December 31, 2020 | |||||||||||||||||
| Gross |
| Accumulated |
| Net |
| Gross |
| Accumulated |
| Net | |||||||
Customer relationships | $ | 615 | $ | (190) | $ | 425 | $ | 615 | $ | (146) | $ | 469 | ||||||
Software | 379 | (152) | 227 | 298 | (125) | 173 | ||||||||||||
Technologies | 367 | (278) | 89 | 369 | (211) | 158 | ||||||||||||
Backlog |
| 107 |
| (89) |
| 18 |
| 129 |
| (79) |
| 50 | ||||||
Image library | 80 | (71) | 9 | 80 | (58) | 22 | ||||||||||||
Trade names and other | 37 | (18) | 19 | 38 | (15) | 23 | ||||||||||||
Intangible assets | $ | 1,585 | $ | (798) | $ | 787 | $ | 1,529 | $ | (634) | $ | 895 | ||||||
The gross carrying value and accumulated amortization balances for fully amortized backlog were removed from the Consolidated Balance Sheets and excluded from the table above as of December 31, 2021. Amortization expense related to intangible assets was $204 million, $255 million and $269 million for the years ended December 31, 2021, 2020 and 2019, respectively.
The estimated annual amortization expense related to finite-lived intangible assets as of December 31, 2021, is as follows:
2022 | 2023 | 2024 | 2025 | 2026 | 2027 and thereafter | |||||||||||||
Amortization expense | $ | 185 | $ | 99 | $ | 103 | $ | 72 | $ | 70 | $ | 258 |
Goodwill balances for each reporting segment are as follows:
Earth Intelligence | Space Infrastructure | Total | |||||||
Balance as of December 31, 2019 | |||||||||
Goodwill | $ | 1,597 | $ | 17 | $ | 1,614 | |||
Accumulated impairment losses | (142) | (17) | (159) | ||||||
1,455 | — | 1,455 | |||||||
Acquisition of Vricon | 172 | — | 172 | ||||||
Balance as of December 31, 2020 | |||||||||
Goodwill | 1,769 | 17 | 1,786 | ||||||
Accumulated impairment losses | | (142) | | | (17) | | | (159) | |
1,627 | — | 1,627 | |||||||
Balance as of December 31, 2021 | |||||||||
Goodwill | 1,769 | 17 | 1,786 | ||||||
Accumulated impairment losses | (142) | (17) | (159) | ||||||
| $ | 1,627 | $ | — | $ | 1,627 | |||
92
MAXAR TECHNOLOGIES INC.
Notes to Consolidated Financial Statements Continued
(Tabular amounts in millions of dollars, unless otherwise noted)
10. LEASES
The Company’s leases have remaining lease up to 13 years, some of include to extend the lease anywhere from six months to ten years.
Sale Leaseback
During the fourth quarter of 2019, the Company completed the sale and subsequent leaseback of Company owned properties in Palo Alto, California. The Company determined the leaseback of both properties to be operating leases, as the criteria to be classified as financing leases were not met. The Company recorded operating lease assets and of $63 million, representing the fair value of the minimum lease payments associated with the agreements to lease the assets back over a period of to ten years. The Company also recorded a deferred financing liability representing the off-market terms of the lease. See Note 12 for additional details. During the third quarter of 2020, the Company recognized a reduction in the gain due to the extension of the lease term on one of the properties.
The Company recorded the current portions of the operating lease liabilities and the deferred financing liability in Current lease liabilities and Current portion of long-term debt, respectively, in the Consolidated Balance Sheets. The non-current portions of the operating lease assets, the operating lease liabilities and the deferred financing liability have been recorded in Non-current operating lease assets, Non-current operating lease liabilities and Long-term debt, respectively, in the Consolidated Balance Sheets. Interest expense on the financial liability has been recorded in Interest expense, net in the Consolidated Statements of Operations.
Finance lease expense, variable lease expense, short-term lease expense and sublease income are not material. The components of operating lease expense are as follows:
Year ended December 31, | ||||||||||||
| Classification |
| 2021 |
| 2020 |
| 2019 | |||||
Operating lease expense | Selling, general, and administrative expense, Product costs, and Service costs1 | $ | 44 | $ | 47 | $ | 27 | |||||
1Excluding depreciation and amortization
Supplemental lease balance sheet information consists of the following:
December 31, | December 31, | ||||||||
Classification | 2021 | 2020 | |||||||
Assets: | |||||||||
Operating | $ | 145 | $ | 163 | |||||
Finance | 5 | 4 | |||||||
Total lease assets | $ | 150 | $ | 167 | |||||
Liabilities: | |||||||||
Current | |||||||||
Operating | $ | 42 | $ | 41 | |||||
Finance | 3 | 2 | |||||||
Non-current | |||||||||
Operating | 138 | 158 | |||||||
Finance | 2 | 1 | |||||||
Total lease liabilities | $ | 185 | $ | 202 | |||||
93
MAXAR TECHNOLOGIES INC.
Notes to Consolidated Financial Statements Continued
(Tabular amounts in millions of dollars, unless otherwise noted)
Supplemental lease cash flow information is as follows:
Year ended December 31, | ||||||
2021 | 2020 | |||||
Cash paid for amounts included in the measurement of lease liabilities: | ||||||
Operating cash flows from operating leases | $ | 44 | $ | 43 | ||
Loss on sale of assets | — | 1 | ||||
Right-of-use assets obtained in exchange for lease obligations: | ||||||
Operating leases | 12 | 16 | ||||
Other supplemental lease information consists of the following:
December 31, |
| December 31, | ||||
2021 | 2020 | |||||
Weighted average remaining lease term (in years) | ||||||
Operating leases | 7 | 8 | ||||
Finance leases | 2 | 2 | ||||
Weighted average discount rate | | | | |||
Operating leases | 6.4% | 6.5% | ||||
Finance leases | 3.2% | 4.1% | ||||
Maturities of lease liabilities are as follows:
2022 |
| 2023 | | 2024 | | 2025 | | 2026 | | Thereafter | | Less: imputed interest | | Total minimum lease payments | ||||||||||
Operating leases | $ | 43 | $ | 34 | | $ | 29 | | $ | 26 | | $ | 24 | | $ | 70 | $ | (46) | $ | 180 | ||||
Finance leases | 3 | 2 | | — | | — | | — | | — | — | 5 | ||||||||||||
11. WARRANTY OBLIGATIONS
Changes to warranty obligations during the years ended December 31, 2021 and 2020, are as follows:
Warranty and after-sale service | |||
Balance as of December 31, 2019 | $ | 41 | |
Obligations incurred | 1 | ||
Payments/uses | (4) | ||
Balance as of December 31, 2020 | $ | 38 | |
Obligations incurred | 2 | ||
Payments/uses | (6) | ||
Balance as of December 31, 2021 | $ | 34 | |
94
MAXAR TECHNOLOGIES INC.
Notes to Consolidated Financial Statements Continued
(Tabular amounts in millions of dollars, unless otherwise noted)
12. LONG-TERM DEBT AND INTEREST EXPENSE, NET
December 31, | December 31, | |||||
| 2021 |
| 2020 | |||
Syndicated Credit Facility: |
| |||||
Term Loan B | $ | 1,444 | 1,444 | |||
2023 Notes | 500 | 850 | ||||
2027 Notes | 150 | 150 | ||||
Deferred financing | 26 | 32 | ||||
Debt discount and issuance costs |
| (39) |
| (57) | ||
Obligations under finance leases and other |
| 5 |
| 3 | ||
Total long-term debt |
| 2,086 |
| 2,422 | ||
Current portion of long-term debt |
| (24) |
| (8) | ||
Non-current portion of long-term debt | $ | 2,062 | $ | 2,414 | ||
Syndicated Credit Facility
As of December 31, 2021, the Company’s senior secured syndicated credit facility (“Syndicated Credit Facility”) is composed of: (i) a senior secured first lien revolving credit facility in an aggregate capacity of up to $500 million maturing in December 2023 (“Revolving Credit Facility”) and (ii) a senior secured first lien term B facility in an original aggregate principal amount of $2.0 billion maturing in October 2024 (“Term Loan B”).
In October 2017, in connection with the acquisition of DigitalGlobe, the Company entered into the Syndicated Credit Facility in the aggregate principal amount of $3.75 billion, which was comprised of: (i) a four-year senior secured first lien revolving credit facility, (ii) a four-year senior secured first lien operating facility, (iii) a senior secured first lien term A facility (“Term Loan A”) and (iv) the Term Loan B. The net proceeds of the Syndicated Credit Facility were used, along with cash on hand, to consummate the acquisition of DigitalGlobe, to refinance all amounts outstanding under the Company’s existing syndicated credit facility and senior term loans, to repay DigitalGlobe’s outstanding indebtedness, to pay transaction fees and expenses, to fund working capital and for general corporate purposes.
In December 2018, the Company amended the Syndicated Credit Facility (“Second Amending Agreement”). The Second Amending Agreement provided that, so long as certain conditions were satisfied (the period during which such conditions are satisfied, the “Covenant Relief Period”) the maximum consolidated debt leverage ratios permitted under the Syndicated Credit Facility were increased and the interest rate incurred by the Company thereunder at certain consolidated debt leverage ratios were increased. The Second Amending Agreement also adjusted the definition of EBITDA for the purpose of calculating the financial ratios under U.S. GAAP. In addition to the above, during the Covenant Relief Period, the Second Amending Agreement restricted the use of certain asset sale proceeds, limited the type of new debt issuances and limited certain restricted payments and permitted acquisitions under the Syndicated Credit Facility.
In November 2019, the Company further amended the Syndicated Credit Facility (“Third Amending Agreement”), certain portions of which became effective immediately and certain portions of which became effective in December 2019 upon the issuance of the 2023 Notes. The Third Amending Agreement, during the Covenant Relief Period, (i) modified the priority of the application of certain voluntary prepayments resulting from certain asset sales (but which did not affect the prepayments owed to the Term Loan B), and (ii) restricted use of proceeds of future borrowings. In addition, the Third Amending Agreement increased the maximum consolidated debt leverage ratios permitted under the Syndicated Credit Facility to 7.25x at the end of the fiscal quarter ended December 31, 2019, 7.50x at the end of the fiscal quarter ending March 31, 2020, 7.75x at the end of each fiscal quarter thereafter until the fiscal quarter ending September 30, 2021, 7.50x at the end of each fiscal quarter thereafter until the quarter ending September 30, 2022, 6.50x at the end of each fiscal quarter thereafter until the fiscal quarter ending March 31, 2023, and 5.75x for each fiscal
95
MAXAR TECHNOLOGIES INC.
Notes to Consolidated Financial Statements Continued
(Tabular amounts in millions of dollars, unless otherwise noted)
quarter thereafter (subject to a 0.25x reduction in each maximum level upon a disposition of a business line for greater than $500 million). The Third Amending Agreement also extended the maturity of the Revolving Credit Facility by two years to December 2023, updated the Interest Coverage Ratio to be less than 2.0x at the end of each fiscal quarter, restricted investment capacity in certain permitted investments, restricted future increases in quarterly dividend payment levels and modified certain margin and standby fee terms. In addition, the Company canceled the operating credit facility and reduced committed borrowing capacity under the Revolving Credit Facility from $1.25 billion to $500 million. As of December 31, 2021 and 2020, the Company was in compliance with its debt covenants.
The Syndicated Credit Facility is guaranteed by the Company and certain designated subsidiaries (“Subsidiary Guarantors”) of the Company. The security for the Syndicated Credit Facility, subject to customary exceptions, includes substantially all the tangible and intangible assets of the Company and its Subsidiary Guarantors. The Company is required to make mandatory prepayments of the outstanding principal and accrued interest of the Syndicated Credit Facility (i) upon the occurrence of certain events and (ii) to the extent of a specified percentage of annual excess cash flow that is not reinvested or used for other specified purposes. The Syndicated Credit Facility is subject to customary affirmative and negative covenants, default provisions, representations and warranties and other terms and conditions.
Term Loan A
The Company used the proceeds from the 2023 Notes and the previously announced closing of its Palo Alto real estate sale leaseback transaction to repay the Syndicated Credit Facility borrowings under Term Loan A that were outstanding as of September 30, 2019. This resulted in a loss on debt extinguishment of $22 million for the year ended December 31, 2019, which is included as part of Interest expense, net within the Consolidated Statements of Operations.
Term Loan B
The Term Loan B bears interest at the Company’s option, either (i) U.S. dollar LIBOR plus 275 basis points per annum or (ii) adjusted base rate, plus a margin of 175 basis points per annum. The Company must make equal quarterly installment payments in amounts equal to 0.25% of the original principal amount of the Term Loan B, after giving effect to any Term Loan B prepayments under the Syndicated Credit Facility, with the final balance payable at maturity on October 5, 2024. The Term Loan B may be repaid by the Company, in whole or in part, together with accrued interest, without premium or penalty.
During the year ended December 31, 2020, the Company repaid $511 million of borrowings under Term Loan B using proceeds from the MDA Transaction. The Company expensed $7 million of unamortized debt issuance costs attributed to the partial pay down, which is included in Interest expense, net in the Consolidated Statements of Operations.
Revolving Credit Facility
The Revolving Credit Facility includes an aggregate $200 million sub limit under which letters of credit can be issued. As of December 31, 2021 and December 31, 2020, the Company had $28 million and $31 million of issued and undrawn letters of credit outstanding under the Revolving Credit Facility.
Borrowings under the Revolving Credit Facility bear interest at a rate equal to, at the Company’s option, either (i) U.S. dollar LIBOR, plus a margin of 120 - 425 basis points per annum, based on the Company’s total leverage ratio, or (ii) adjusted base rate, plus a margin of 20 - 325 basis points per annum, based on the Company’s total leverage ratio. The Revolving Credit Facility is payable at maturity on December 10, 2023. The Revolving Credit Facility may be repaid by the Company, in whole or in part, together with accrued interest, without premium or penalty.
96
MAXAR TECHNOLOGIES INC.
Notes to Consolidated Financial Statements Continued
(Tabular amounts in millions of dollars, unless otherwise noted)
Senior Secured Notes due 2023
On December 2, 2019, the Company issued $1.0 billion in aggregate principal amount of 9.75% Senior Secured Notes due 2023 (“2023 Notes”). The 2023 Notes were offered and sold to qualified institutional buyers in the U.S. pursuant to Rule 144A and outside the U.S. pursuant to Regulation S under the Securities Act of 1933, as amended. The 2023 Notes were issued at a price of 98% and are recorded as long-term debt in the Consolidated Financial Statements. The 2023 Notes bear interest at the rate of 9.75% per year, payable semi-annually in cash in arrears, which interest payments commenced in June 2020.
On June 25, 2020, the Company repurchased $150 million aggregate principal amount of its 2023 Notes using proceeds from the MDA Transaction. The 2023 Notes were repurchased (“2023 Notes Repurchase”) at a price of approximately 112.45% of the principal amount repurchased.
On March 26, 2021, the Company redeemed $350 million aggregate principal amount of its 2023 Notes using a portion of the net proceeds from an underwritten offering of 10 million shares of its common stock (“Offering”). The Company paid premiums of approximately $34 million related to the early redemption. This resulted in a loss on debt extinguishment of $41 million that was recorded in the first quarter of 2021, which is included as part of Interest expense, net within the Consolidated Statements of Operations for the year ended December 31, 2021.
The 2023 Notes are guaranteed (“Guarantees”) on a senior secured basis by each of the Company’s existing and future subsidiaries that guarantees the Syndicated Credit Facility (“2023 Guarantors”). The 2023 Notes are secured, equally and ratably with the Syndicated Credit Facility and any future first lien debt, by liens on the same assets that secure the Revolving Credit Facility and the Term Loan B.
The 2023 Notes and the Guarantees are the Company’s general senior secured obligations and rank equally in right of payment with all of the Company’s and the 2023 Guarantors’ existing and future unsubordinated debt (including the Syndicated Credit Facility). The 2023 Notes and the Guarantees are effectively senior to all of the Company’s and the 2023 Guarantors’ existing and future unsecured debt as well as to all of any permitted junior lien debt that may be incurred in the future, in each case to the extent of the value of the assets securing the 2023 Notes and the Guarantees. The 2023 Notes and the Guarantees are effectively subordinated to any obligations that are secured by liens on assets that do not constitute a part of the collateral securing the 2023 Notes or the Guarantees, are structurally subordinated to all existing and future liabilities (including trade payables) of the Company’s subsidiaries that do not guarantee the 2023 Notes, and are senior in right of payment to all of the Company’s and the 2023 Guarantors’ existing and future subordinated indebtedness.
The indenture governing the 2023 Notes limits, among other things, the Company and the Company’s restricted subsidiaries’ ability to: incur, assume or guarantee additional debt; issue redeemable stock and preferred stock; pay dividends, make distributions or redeem or repurchase capital stock; prepay, redeem or repurchase subordinated debt; make loans and investments; grant or incur liens; restrict dividends, loans or asset transfers from restricted subsidiaries; sell or otherwise dispose of assets; enter into transactions with affiliates; reduce the Company’s satellite insurance; and consolidate or merge with, or sell substantially all of the Company’s assets to, another person. The 2023 Notes are also subject to compliance with a financial maintenance covenant in respect of the Company’s Consolidated Total Debt Ratio which was 7.25x at the end of the fiscal quarter ended December 31, 2019, 7.50x at the end of the fiscal quarter ending March 31, 2020, 7.75x at the end of each fiscal quarter thereafter until the fiscal quarter ending September 30, 2021, 7.50x at the end of each fiscal quarter thereafter until the quarter ending September 30, 2022, 6.50x at the end of each fiscal quarter thereafter until the fiscal quarter ending March 31, 2023, and 5.75x for each fiscal quarter thereafter (subject to a 0.25x reduction in each maximum level upon a disposition of a business line for greater than $500 million).
The 2023 Notes may be redeemed, in whole or in part, at any time during the 12 months beginning on December 15, 2021 at a redemption price of 107.313%, during the 12 months beginning on December 15, 2022 at a redemption price
97
MAXAR TECHNOLOGIES INC.
Notes to Consolidated Financial Statements Continued
(Tabular amounts in millions of dollars, unless otherwise noted)
of 103.656%, and at any time on or after December 15, 2023 at a redemption price of 100%, in each case plus accrued and unpaid interest, if any, thereon to the redemption date.
In the event a change of control occurs (as defined in the indenture governing the 2023 Notes), each holder will have the right to require us to repurchase all or any part of such holder’s 2023 Notes at a purchase price in cash equal to 101% of the aggregate principal amount of the 2023 Notes repurchased, plus accrued and unpaid interest, if any, to the date of purchase (subject to the right of holders of record on the relevant record date to receive interest due on the relevant interest payment date).
Senior Secured Notes due 2027
On June 25, 2020, the Company issued $150 million in aggregate principal amount of the 2027 Notes. The 2027 Notes were offered and sold to qualified institutional buyers in the U.S. pursuant to Rule 144A and outside the U.S. pursuant to Regulation S under the Securities Act of 1933, as amended. The 2027 Notes were issued at a price of 98.25% and are recorded as long-term debt in the Consolidated Financial Statements. The 2027 Notes bear interest at the rate of 7.54% per year, payable semi-annually in cash in arrears, for which interest payments commenced in December 2020.
The Company accounted for the issuance of the 2027 Notes and 2023 Notes Repurchase as debt modifications. As a result, the 12.45% premium paid on the repurchase of the $150 million aggregate principal amount of 2023 Notes is accounted for as an incremental discount that is amortized over the life of the 2027 Notes. Separately, the previously incurred unamortized debt discount and debt issuance costs are amortized over the remaining life of the outstanding 2023 Notes.
The 2027 Notes are guaranteed (“2027 Guarantees”) on a senior secured basis by each of the Company’s existing and future subsidiaries that guarantees the 2023 Notes and the Syndicated Credit Facility (“2027 Guarantors”). The 2027 Notes are secured, equally and ratably with the 2023 Notes, the Syndicated Credit Facility and any future first lien debt, by liens on the same assets that secure the Revolving Credit Facility and Term Loan B.
The 2027 Notes and the 2027 Guarantees are the Company’s general senior secured obligations and rank equally in right of payment with all of the Company’s and the 2027 Guarantors’ existing and future unsubordinated debt (including the 2023 Notes and the Syndicated Credit Facility). The 2027 Notes and the 2027 Guarantees are effectively senior to all of the Company’s and the 2027 Guarantors’ existing and future unsecured debt as well as to all of any permitted junior lien debt that may be incurred in the future, in each case to the extent of the value of the assets securing the 2027 Notes and the 2027 Guarantees. The 2027 Notes and the 2027 Guarantees are effectively subordinated to any obligations that are secured by liens on assets that do not constitute a part of the collateral securing the 2027 Notes or the 2027 Guarantees, are structurally subordinated to all existing and future liabilities (including trade payables) of the Company’s subsidiaries that do not guarantee the 2027 Notes, and are senior in right of payment to all of the Company’s and the Guarantors’ existing and future subordinated indebtedness.
The indenture governing the 2027 Notes limits, among other things, the Company’s and the Company’s restricted subsidiaries’ ability to: incur, assume or guarantee additional debt; issue redeemable stock and preferred stock; pay dividends, make distributions or redeem or repurchase capital stock; prepay, redeem or repurchase subordinated debt; make loans and investments; grant or incur liens; restrict dividends, loans or asset transfers from restricted subsidiaries; sell or otherwise dispose of assets; enter into transactions with affiliates; reduce the Company’s satellite insurance; and consolidate or merge with, or sell substantially all of the Company’s assets to, another person.
The 2027 Notes may be redeemed, in whole or in part, at any time during the 12 months beginning on June 25, 2024, at a redemption price of 105.655%, during the 12 months beginning on June 25, 2025, at a redemption price of 103.770%, and at any time on or after June 25, 2026, at a redemption price of 101.885%, in each case plus accrued and unpaid interest, if any, thereon to the redemption date. The Company may also redeem the 2027 Notes, in whole or in part, at
98
MAXAR TECHNOLOGIES INC.
Notes to Consolidated Financial Statements Continued
(Tabular amounts in millions of dollars, unless otherwise noted)
the Company’s option at any time prior to June 25, 2024, at a price equal to 100% of the principal amount of such 2027 Notes plus a “make-whole” premium, together with accrued but unpaid interest, if any, to, but excluding, the date of redemption. In addition, the Company may redeem up to 40% of the aggregate principal amount of the 2027 Notes at any time before June 25, 2024, with the net cash proceeds from certain equity offerings at a specified redemption price, plus accrued and unpaid interest, if any, to, but excluding, the date of redemption.
In the event a change of control occurs (as defined in the indenture governing the 2027 Notes), each holder will have the right to require us to repurchase all or any part of such holder’s 2027 Notes at a purchase price in cash equal to 101% of the aggregate principal amount of the 2027 Notes repurchased, plus accrued and unpaid interest, if any, to the date of purchase (subject to the right of holders of record on the relevant record date to receive interest due on the relevant interest payment date).
Leaseback Deferred Financing
In December 2019, the Company completed the sale and subsequent leaseback of company owned properties in Palo Alto, California for proceeds of $291 million. The Company determined that the leaseback terms were off-market. In accordance with ASC 842 – Leases, the Company accounted for the excess of the leaseback payments over the present value of market rental payments as additional financing, separate from the lease liability. This resulted in recognition of a deferred financing liability of $33 million, which is repayable over the leaseback term. This liability was calculated using a weighted average discount rate of 4.62%. The deferred financing liability is recorded as part of Current portion of long-term debt and Long-term debt within the Consolidated Balance Sheets. Refer to Note 8 and 10 for additional information.
Interest expense, net on long-term debt and other obligations are as follows:
Year Ended December 31, | |||||||||
2021 |
| 2020 |
| 2019 | |||||
Interest on long-term debt | $ | 144 | $ | 191 | $ | 194 | |||
Loss on debt extinguishment | 41 | 7 | 22 | ||||||
Interest on orbital securitization liability | 4 | 5 | 7 | ||||||
Imputed interest and other | 2 | 2 | — | ||||||
Interest expense on advance payments from customers | — | 3 | 15 | ||||||
Capitalized interest | (40) | (33) | (19) | ||||||
Interest expense, net | $ | 151 | $ | 175 | $ | 219 | |||
Scheduled minimum debt repayments for the year ended December 31, 2021 are as follows:
| 2022 |
| 2023 |
| 2024 |
| 2025 |
| 2026 |
| Thereafter |
| Total | ||||||||
Syndicated Credit Facility | $ | 15 | $ | 20 | $ | 1,409 | $ | — | $ | — | $ | — | $ | 1,444 | |||||||
2023 Notes | — | 500 | — | — | — | — | 500 | ||||||||||||||
2027 Notes | — | — | — | — | — | 150 | 150 | ||||||||||||||
Deferred financing | 7 | 2 | 2 | 2 | 3 | 10 | 26 | ||||||||||||||
Finance leases and other | 3 | 2 | — | — | — | — | 5 | ||||||||||||||
Debt discount and issuance costs | (11) | (11) | (7) | (3) | (3) | (4) | (39) | ||||||||||||||
$ | 14 | $ | 513 | $ | 1,404 | $ | (1) | $ | — | $ | 156 | $ | 2,086 |
99
MAXAR TECHNOLOGIES INC.
Notes to Consolidated Financial Statements Continued
(Tabular amounts in millions of dollars, unless otherwise noted)
13. FINANCIAL INSTRUMENTS AND FAIR VALUE DISCLOSURES
Factors used in determining the fair value of financial assets and liabilities are summarized into three categories in accordance with ASC 820 - Fair Value Measurements:
Level 1: Unadjusted quoted prices in active markets that are accessible at the measurement date for identical, unrestricted assets or liabilities
Level 2: Inputs other than quoted prices included within Level 1 that are observable for the asset or liability, either directly (i.e. as prices) or indirectly (i.e. derived from prices)
Level 3: Inputs for the asset or liability that are based on unobservable inputs
The following tables present assets and liabilities that are measured at fair value on a recurring basis (at least annually) by level within the fair value hierarchy. A financial asset or liability’s classification within the hierarchy is determined based on the lowest level input that is significant to the fair value measurement.
Recurring Fair Value Measurements as of December 31, 2021 | |||||||||||||
| Level 1 |
|
| Level 2 |
| Level 3 |
| Total | |||||
Assets |
|
|
|
| |||||||||
Orbital receivables 1 | $ | — | $ | 481 | $ | — | $ | 481 | |||||
Interest rate swaps | — | 3 | — | 3 | |||||||||
$ | — | $ | 484 | $ | — | $ | 484 | ||||||
Liabilities | |||||||||||||
Interest rate swaps | $ | — | $ | 4 | $ | — | $ | 4 | |||||
Long-term debt 2 | — | 2,132 | — | 2,132 | |||||||||
$ | — | $ | 2,136 | $ | — | $ | 2,136 | ||||||
Recurring Fair Value Measurements as of December 31, 2020 | ||||||||||||
| Level 1 |
| Level 2 |
| Level 3 |
| Total | |||||
Assets |
| |||||||||||
Orbital receivables 1 | $ | — | $ | 410 | $ | — | $ | 410 | ||||
$ | — | $ | 410 | $ | — | $ | 410 | |||||
Liabilities | ||||||||||||
Interest rate swaps | $ | — | $ | 20 | $ | — | $ | 20 | ||||
Long-term debt 2 | — | 2,556 | — | 2,556 | ||||||||
$ | — | $ | 2,576 | $ | — | $ | 2,576 | |||||
1 | The carrying value of orbital receivables was $417 million and $410 million at December 31, 2021 and December 31, 2020, respectively. See Note 6 regarding the (Gain) loss on orbital receivables allowance. |
2 | Long-term debt excludes finance leases, deferred financing and other and is carried at amortized cost. The outstanding carrying value was $2,055 million and $2,387 million at December 31, 2021 and 2020, respectively. The carrying value of borrowings under the Revolving Credit Facility approximates their fair value. |
The Company determines the fair value of its orbital receivables using a discounted cash flow model, based on stated interest rates and observable market yield curves associated with the instruments.
The Company determines fair value of its derivative financial instruments based on internal valuation models, such as discounted cash flow analysis, using management estimates and observable market-based inputs, as applicable. Management estimates include assumptions concerning the amount and timing of estimated future cash flows and
100
MAXAR TECHNOLOGIES INC.
Notes to Consolidated Financial Statements Continued
(Tabular amounts in millions of dollars, unless otherwise noted)
application of appropriate discount rates. Observable market-based inputs are sourced from third parties and include interest rates and yield curves, currency spot and forward rates and credit spreads, as applicable.
The Company determines fair value of long-term debt that is actively traded in the secondary market using external pricing data, including any available quoted market prices and other observable inputs from available market information. For debt that is not actively traded in the secondary market, the fair value is based on the Company’s indicative borrowing cost derived from dealer quotes or discounted cash flows.
Cash and cash equivalents, accounts receivable, accounts payable and accrued liabilities are all short-term in nature; therefore, the carrying value of these items approximates their fair value.
There were no transfers into or out of each of the levels of the fair value hierarchy during the years ended December 31, 2021 or December 31, 2020.
14. DERIVATIVES AND HEDGING
Cash Flow Hedges
The Company is exposed to fluctuations in interest rates under the Syndicated Credit Facility. On April 5, 2018, the Company entered into several interest rate swap agreements in order to fix the base interest rate to be paid over an aggregate amount of the Company’s variable rate long-term debt. On April 30, 2021, $500 million of the Company’s interest rate swaps matured. On June 15, 2021, the Company entered into interest rate swaps at a notional value of $500 million. In total, an aggregate amount of $1.0 billion of the Company’s variable rate long-term debt is fixed at an average rate of 1.43% (excluding the margin specified in the Syndicated Credit Facility). In both April 2022 and June 2023, the Company will have interest rate swap maturities of $500 million.
The Company is also exposed to foreign exchange risks on certain sales and purchase contracts. The Company enters into foreign exchange forward contracts to hedge the exposure arising from expected foreign currency denominated cash flows on these sales and purchase contracts. As of January 1, 2019, the Company discontinued hedge accounting related to these sales and purchase contracts. The Company continued to hedge foreign exchange exposure on sales and purchase contracts for economic purposes. The Company had no foreign exchange forward contracts at December 31, 2021 or 2020.
December 31, 2021 | |||||
| Notional amount |
| Maximum Contract term | ||
Derivatives designated as hedging instruments | |||||
Interest rate swaps | $ | 1,000 | 1.5 years | ||
December 31, 2020 | |||||
Notional amount |
| Maximum Contract term | |||
Derivatives designated as hedging instruments | |||||
Interest rate swaps | $ | 1,000 | 1.3 years | ||
The effective portion of gains included in Other comprehensive income (loss), net of tax related to the Company’s interest rate swaps was $19 million for the year ended December 31, 2021. The effective portion of losses included in Other comprehensive income (loss), net of tax related to the Company’s interest rate swaps was $3 million and $13 million for the years ended December 31, 2020 and 2019, respectively. The gain (loss) from foreign exchange forward contracts was not material for the years ended December 31, 2021, 2020 and 2019. As of December 31, 2021, the estimated loss included in Accumulated other comprehensive income (loss) expected to be recognized in Net income (loss) in the next twelve months is $3 million.
101
MAXAR TECHNOLOGIES INC.
Notes to Consolidated Financial Statements Continued
(Tabular amounts in millions of dollars, unless otherwise noted)
In implementing all its derivative financial instruments, the Company deals with counterparties and is therefore exposed to credit related losses in the event of non-performance by these counterparties. However, the Company deals with counterparties that are major financial institutions and does not expect any of the counterparties to fail to meet their obligations.
Net Investment Hedge
At December 31, 2018, the Company had designated $271 million of its Term Loan B as a hedge of its investment in certain U.S. subsidiaries. Foreign exchange gains and losses arising from the translation of the designated portion of the Term Loan B were recognized in Other comprehensive income (loss), net of tax to the extent that the hedges were effective and were recognized in the Consolidated Statements of Operations to the extent that the hedges were ineffective. The fair value of the designated portion of Term Loan B was $256 million as of December 31, 2018. As a result of the Company’s U.S. Domestication on January 1, 2019, and the associated change from a Canadian parent company to a U.S. parent company, the Company’s Syndicated Credit Facility was changed to a U.S. dollar functional currency entity. Due to this change, the net investment hedge was no longer necessary from the domestication date onwards.
15. STOCKHOLDERS’ EQUITY
On March 22, 2021, the Company completed the Offering of 10 million shares of common stock at a public offering price of $40 per share. The Company received proceeds of $380 million, net of $20 million of transaction fees.
As of December 31, 2020, the Company had 2.4 million shares authorized and no shares outstanding of the Series A Preferred Stock. On May 17, 2021, the Company filed a Certificate of Elimination of Series A Junior Participating Preferred Stock with the Delaware Secretary of State, thereby removing the Certificate of Designations of the Series A Preferred Stock from the Company’s Amended and Restated Certificate of Incorporation. Therefore, as of December 31, 2021, the Company had no shares authorized and no shares outstanding of the Series A Preferred Stock.
Changes in the components of Accumulated other comprehensive income (loss) are as follows:
| Foreign Currency Translation Adjustments1 |
| Unrealized Loss on Interest Rate Swaps2 |
| Loss on Pension and Other Postretirement Plans |
| Total Accumulated Other Comprehensive Income (Loss) | |||||
Balance as of December 31, 2018 | $ | 111 | $ | — | $ | (47) | $ | 64 | ||||
Other comprehensive income (loss) | 14 | (12) | (26) | (24) | ||||||||
Tax benefit | 1 | — | — | 1 | ||||||||
Balance as of December 31, 2019 | $ | 126 | $ | (12) | $ | (73) | $ | 41 | ||||
Other comprehensive loss | (47) | (3) | (43) | (93) | ||||||||
Reclassification to gain on disposal of discontinued operations3 | (78) | (5) | 15 | (68) | ||||||||
Tax benefit (expense) | — | — | — | — | ||||||||
Balance as of December 31, 2020 | $ | 1 | $ | (20) | $ | (101) | $ | (120) | ||||
Other comprehensive (loss) income | (2) | 19 | 50 | 67 | ||||||||
Tax benefit (expense) | — | — | — | — | ||||||||
Balance as of December 31, 2021 | $ | (1) | $ | (1) | $ | (51) | $ | (53) | ||||
1 | As a result of the Company’s U.S. Domestication on January 1, 2019, and the associated change from a Canadian parent company to a U.S. parent company, the Company’s net investment hedge was no longer necessary from the domestication date onwards. As |
102
MAXAR TECHNOLOGIES INC.
Notes to Consolidated Financial Statements Continued
(Tabular amounts in millions of dollars, unless otherwise noted)
of December 31, 2018, there was a $51 million net loss on hedge investments in foreign operations which is included in Foreign Currency Translation Adjustments.
2 | As of January 1, 2019, the Company discontinued hedge accounting related to the Company’s foreign exchange contracts. The Company still applies hedge accounting to the interest rate swaps related to long-term debt. As of December 31, 2020 and 2021, the balance consisted of unrecognized loss on the Company’s interest rate swaps. |
3Relates to the reclassification of foreign currency translation from Accumulated other comprehensive (loss) income to the gain on disposal of discontinued operations due to the completion of the MDA Transaction. See Note 4 for details.
16. REVENUES
As of December 31, 2021, the Company had $1.9 billion of remaining performance obligations, which represents the transaction price of firm orders less inception to date revenues recognized. Remaining performance obligations generally exclude unexercised contract options and indefinite delivery/indefinite quantity contracts. The Company expects to recognize revenues relating to existing performance obligations of approximately $1.3 , $0.5 , and $0.1 for the fiscal years 2022, 2023 and thereafter, respectively.
Contract liabilities by segment are as follows:
As of December 31, 2021 |
| Earth Intelligence |
| Space Infrastructure |
| Total | |||
Contract liabilities | $ | 32 | $ | 257 | $ | 289 | |||
As of December 31, 2020 |
| Earth Intelligence |
| Space Infrastructure |
| Total | |||
Contract liabilities | $ | 45 | $ | 234 | $ | 279 | |||
Contract liabilities increased to $289 million as of December 31, 2021 from $279 million as of December 31, 2020. The increase in contract liabilities is primarily due to cash received on commercial contracts in the Space Infrastructure segment in advance of services performed. The increase is partially offset by revenues recognized based upon the satisfaction of performance obligations within the Earth Intelligence segment. The Company had an immaterial balance of non-current contract liabilities as of December 31, 2021. The Company had $1 million of non-current contract liabilities as of December 31, 2020. Non-current contract liabilities are included in Other non-current liabilities on the Consolidated Balance Sheets.
103
MAXAR TECHNOLOGIES INC.
Notes to Consolidated Financial Statements Continued
(Tabular amounts in millions of dollars, unless otherwise noted)
The Company’s primary sources of revenues are as follows:
Year Ended December 31, 2021 |
| Earth Intelligence |
| Space Infrastructure |
| Eliminations |
| Total | ||||
Product revenues | $ | — | $ | 678 | $ | — | $ | 678 | ||||
Service revenues |
| 1,092 |
| — |
| — |
| 1,092 | ||||
Intersegment | 1 |
| 62 |
| (63) |
| — | |||||
$ | 1,093 | $ | 740 | $ | (63) | $ | 1,770 | |||||
Year Ended December 31, 2020 |
| Earth Intelligence |
| Space Infrastructure |
| Eliminations |
| Total | ||||
Product revenues | $ | — | $ | 633 | $ | — | $ | 633 | ||||
Service revenues |
| 1,081 |
| 9 |
| — |
| 1,090 | ||||
Intersegment | — | 79 | (79) | — | ||||||||
$ | 1,081 | $ | 721 | $ | (79) | $ | 1,723 | |||||
Year Ended December 31, 2019 |
| Earth Intelligence |
| Space Infrastructure |
| Eliminations |
| Total | ||||
Product revenues | $ | — | $ | 560 | $ | — | $ | 560 | ||||
Service revenues |
| 1,085 |
| 21 |
| — |
| 1,106 | ||||
Intersegment | — | 125 | (125) | — | ||||||||
$ | 1,085 | $ | 706 | $ | (125) | $ | 1,666 | |||||
Certain of the Company’s contracts with customers in the Space Infrastructure segment include a significant financing component since payments are received from the customer more than one year after delivery of the promised goods or services. The Company recognized orbital interest revenue of $27 million, $30 million and $31 million for the years ended December 31, 2021, 2020 and 2019, respectively, which is included in product revenues.
Revenue in the Space Infrastructure segment is primarily generated from long-term construction contracts. Due to the long-term nature of these contracts, the Company generally recognizes revenue over time using the cost-to-cost method to measure progress. Under the cost-to-cost method, revenue is recognized based on the proportion of total costs incurred to EAC. Revenue recognition is also contingent on estimated contractual consideration. An EAC includes all direct costs and indirect costs directly attributable to a program or allocable based on program cost pooling arrangements. Estimates regarding the Company’s cost associated with the design, manufacture and delivery of products and services are used in determining the EAC. Changes to an EAC or estimated contractual consideration are recorded as a cumulative adjustment to revenue.
The Company recognized a cumulative adjustment to revenue of $30 million for the year ended December 31, 2021, respectively, related to the Sirius XM contract with Sirius XM Holdings Inc. (“Sirius XM”). This resulted primarily from adjusting the EAC transaction price for the amount of the final milestone and expected orbital payments from Sirius XM due to the non-performance of the SXM-7 satellite and other adjustments. In addition to the cumulative adjustment recognized for the year ended December 31, 2021, incremental costs of $3 million were incurred related to the SXM-7 recovery efforts during the first quarter of 2021. See Note 6 for additional details regarding the adjustment to trade and other receivables.
The Company did not incur COVID-19 related EAC growth for the year ended December 31, 2021. The Company incurred estimated COVID-19 related EAC growth of $27 million for the year ended December 31, 2020.
The Company has certain programs in the Space Infrastructure segment which contain significant development efforts that have experienced delays and cost growth primarily due to the complexity of the programs resulting in an overall loss position. The Company recorded $32 million in EAC adjustments on loss contracts for the year ended December 31,
104
MAXAR TECHNOLOGIES INC.
Notes to Consolidated Financial Statements Continued
(Tabular amounts in millions of dollars, unless otherwise noted)
2021. The Company recorded $42 million in EAC adjustments on a commercial satellite loss contract which included significant development efforts further delayed by COVID-19 for the year ended December 31, 2020.
The approximate revenue based on geographic location of customers is as follows:
Year Ended December 31, | ||||||||
2021 |
| 2020 | 2019 | |||||
United States | $ | 1,431 | $ | 1,406 | $ | 1,240 | ||
Asia | 97 | 96 |
| 161 | ||||
Europe | 80 | 84 |
| 69 | ||||
Australia | 70 | 37 | 22 | |||||
Middle East | 54 | 54 | 57 | |||||
South America | 17 | 25 |
| 97 | ||||
Canada | 10 | 10 | 10 | |||||
Other | 11 | 11 |
| 10 | ||||
Total revenues | $ | 1,770 | $ | 1,723 | $ | 1,666 | ||
Revenues from significant customers is as follows:
Year Ended December 31, 2021 | Earth Intelligence | Space Infrastructure | Eliminations | Total | ||||||||
U.S. federal government and agencies | $ | 701 | $ | 235 | $ | — | $ | 936 | ||||
Commercial and other | 392 | 505 | (63) |
| 834 | |||||||
Total revenues | $ | 1,093 | $ | 740 | $ | (63) | $ | 1,770 | ||||
Year Ended December 31, 2020 |
| Earth Intelligence |
| Space Infrastructure | Eliminations |
| Total | |||||
U.S. federal government and agencies | $ | 774 | $ | 288 | $ | — | $ | 1,062 | ||||
Commercial and other | 307 | 433 | (79) |
| 661 | |||||||
Total revenues | $ | 1,081 | $ | 721 | $ | (79) | $ | 1,723 | ||||
Year Ended December 31, 2019 | Earth Intelligence | Space Infrastructure | Eliminations | Total | ||||||||
U.S. federal government and agencies | $ | 790 | $ | 151 | $ | (1) | $ | 940 | ||||
Commercial and other | 295 | 555 | (124) |
| 726 | |||||||
Total revenues | $ | 1,085 | $ | 706 | $ | (125) | $ | 1,666 | ||||
The Company had revenues from a commercial customer in the Space Infrastructure segment that represented 19% and 11% of total revenues for the years ended December 31, 2021 and 2020, respectively. The revenues from this commercial customer in the Space Infrastructure segment were less than 10% of the Company’s total revenues for the year ended December 31, 2019.
17. SEGMENT INFORMATION
The Company’s business is organized into two reportable segments: Earth Intelligence and Space Infrastructure. The Earth Intelligence reportable segment is a supplier of high-resolution, high accuracy Earth imagery and other geospatial data sourced from the Company’s advanced satellite constellation and third-party providers, as well as a provider of advanced geospatial information applications and analytic services for national security and commercial solutions. The Space Infrastructure reportable segment is a supplier of space-based infrastructure, robotics, subsystems and information solutions to satellite operators and government agencies.
The Company’s Chief Operating Decision Maker measures the performance of each segment based on revenue and Adjusted EBITDA. Adjusted EBITDA is defined as earnings before interest, tax, depreciation and amortization
105
MAXAR TECHNOLOGIES INC.
Notes to Consolidated Financial Statements Continued
(Tabular amounts in millions of dollars, unless otherwise noted)
(“EBITDA”) adjusted for certain items affecting comparability of our ongoing operating results as specified in the calculation. Certain items affecting the comparability of our ongoing operating results between periods include restructuring, impairments, insurance recoveries, gain (loss) on sale of assets, CEO severance, (gain) loss on orbital receivables allowance and transaction and integration related expense. Transaction and integration related expense includes costs associated with de-leveraging activities, acquisitions and dispositions and the integration of acquisitions. Corporate and other expenses include items such as corporate office costs, regulatory costs, executive and director compensation, foreign exchange gains and losses and fees for audit, legal and consulting services.
Intersegment sales are generally recorded at cost-plus a specified margin, which may differ from what the segment may be able to obtain on sales to external customers.
The following table summarizes the operating performance of the Company’s segments:
Year Ended December 31, | |||||||||
2021 |
| 2020 | 2019 | ||||||
Revenues: |
|
|
| ||||||
Earth Intelligence | $ | 1,093 | $ | 1,081 | $ | 1,085 | |||
Space Infrastructure |
| 740 |
| 721 |
| 706 | |||
Intersegment eliminations | (63) | (79) | (125) | ||||||
Total revenues | $ | 1,770 | $ | 1,723 | $ | 1,666 | |||
Adjusted EBITDA: | |||||||||
Earth Intelligence | $ | 492 | $ | 513 | $ | 548 | |||
Space Infrastructure | 46 | (3) | (17) | ||||||
Intersegment eliminations | (25) | (27) | (29) | ||||||
Corporate and other expenses | (89) | (61) | (86) | ||||||
Restructuring | (2) | — | (18) | ||||||
Transaction and integration related expense | (1) | (7) | (16) | ||||||
Gain (loss) on orbital receivables allowance | 49 | (14) | (14) | ||||||
Impairment losses, including inventory | — | (33) | (3) | ||||||
Insurance recoveries 1 | 1 | — | 183 | ||||||
(Loss) gain on sale of assets | — | (1) | 136 | ||||||
CEO severance | — | — | (3) | ||||||
Gain on remeasurement of Vricon equity interest 2 | — | 85 | — | ||||||
Depreciation and amortization | (290) | (348) | (376) | ||||||
Interest expense, net | (151) | (175) | (219) | ||||||
Interest income 3 | 3 | 3 | 2 | ||||||
Equity in income from joint ventures, net of tax | — | (1) | (11) | ||||||
Income (loss) from continuing operations before taxes | $ | 33 | $ | (69) | $ | 77 |
1 | Insurance recoveries for the year ended December 31, 2021 are included in Other income, net on the Consolidated Statement of Operations. |
2 | As a result of the Vricon Acquisition, the Company was required to remeasure its previously held equity interest in Vricon at its acquisition date fair value which resulted in a gain of $85 million. The gain is included in Other (income) expense, net on the Consolidated Statements of Operations. |
3 | Included in Other (income) expense, net on the Consolidated Statements of Operations. |
106
MAXAR TECHNOLOGIES INC.
Notes to Consolidated Financial Statements Continued
(Tabular amounts in millions of dollars, unless otherwise noted)
The Company’s capital expenditures are as follows:
Year Ended December 31, 2021 | Earth Intelligence |
| Space Infrastructure |
| Corporate and eliminations | Total | ||||||
Capital expenditures: | ||||||||||||
Property, plant and equipment | $ | 79 | $ | 16 | $ | 40 | $ | 135 | ||||
Intangible assets |
| 87 |
| — |
| 12 |
| 99 | ||||
| $ | 166 | $ | 16 | $ | 52 | $ | 234 | ||||
Year Ended December 31, 2020 | Earth Intelligence |
| Space Infrastructure |
| Corporate and eliminations | Total | ||||||
Capital expenditures: | | | | | | | | | | | | |
Property, plant and equipment | $ | 147 | $ | 21 | $ | 53 | $ | 221 | ||||
Intangible assets |
| 79 |
| 1 |
| 7 |
| 87 | ||||
| $ | 226 | $ | 22 | $ | 60 | $ | 308 | ||||
| ||||||||||||
Year Ended December 31, 2019 | Earth Intelligence |
| Space Infrastructure |
| Corporate and eliminations | Total | ||||||
Capital expenditures: | | | | | | | | | | | | |
Property, plant and equipment | $ | 237 | $ | 16 | $ | 4 | $ | 257 | ||||
Intangible assets |
| 56 |
| 3 |
| (2) |
| 57 | ||||
| $ | 293 | $ | 19 | $ | 2 | $ | 314 | ||||
Substantially all of the Company’s long-lived tangible assets were in the United States as of December 31, 2021, 2020 and 2019.
18. IMPAIRMENT LOSSES
Inventory impairment
There were no inventory impairment losses recognized for the years ended December 31, 2021 or 2020.
For the year ended December 31, 2019, the Company recognized inventory impairment losses of $3 million, which are included in Product costs, excluding depreciation and amortization on the Consolidated Statements of Operations.
Other impairment
There were no impairment losses recognized for the year ended December 31, .
For the year ended December 31, 2020, the Company recognized an impairment loss of $33 million within the Earth Intelligence segment related to the write-off of a prepaid asset with a commercial provider of ground station services under a contract which was above current market value. In December 2020, the Company executed a new multi-year contract with the provider for services at reduced cost. As a result of the prior contract being terminated and the new contract being at market value, the Company concluded the remaining prepaid asset from the prior contract with the provider had no continuing value.
For each of the years ended December 31, 2020 and 2019, the Company recognized orbital receivable impairment losses of $14 million, within the Space Infrastructure segment primarily due to a decrease in customer credit ratings. See Note 6 for details related to the reversal of the orbital receivables allowance.
107
MAXAR TECHNOLOGIES INC.
Notes to Consolidated Financial Statements Continued
(Tabular amounts in millions of dollars, unless otherwise noted)
19. EMPLOYEE BENEFIT PLANS
Defined contribution plan
The Company maintains a defined contribution plan for some of its employees in the U.S., whereby the Company pays contributions based on a percentage of the employees’ annual salary. For the years ended December 31, 2021, 2020 and 2019, the Company recorded expense of $19 million, $16 million and $16 million, respectively, related to the plan.
Pension and other postretirement benefit plans
The Company maintains a defined benefit pension plan covering a portion of its employees within the Space Infrastructure segment. The pension and other postretirement plan benefits were frozen on December 31, 2013. The defined benefit plan provides pension benefits based on various factors including prior earnings and length of service. The defined benefit plan is funded and the Company’s funding requirements are based on the plans’ actuarial measurement framework as established by the plan agreements or applicable laws. The funded plans’ assets are legally separated from the Company and are held by an independent trustee. The trustee is responsible for ensuring that the funds are protected as per applicable laws.
The Company also provides for other postretirement benefits, comprised of life insurance covering a portion of its employees within the Space Infrastructure segment. The cost of these benefits is primarily funded out of Operating income.
The table below summarizes changes in the benefit obligation, the fair value of plan assets and funded status for the Company’s pension and other postretirement benefit plans, as well as the aggregate balance sheet impact.
Pension | Other Postretirement | |||||||||||
2021 | 2020 | 2021 | 2020 | |||||||||
Change in benefit obligation: | ||||||||||||
Benefit obligation at beginning of year | $ | 624 | $ | 583 | $ | 14 | $ | 14 | ||||
Service cost | 3 | 2 | — | — | ||||||||
Interest cost | 14 | 17 | — | — | ||||||||
Actuarial (gains) losses | (23) | 55 | (1) | — | ||||||||
Benefits paid | (33) | (33) | — | — | ||||||||
Benefit obligation at end of year | $ | 585 | $ | 624 | $ | 13 | $ | 14 | ||||
Change in fair value of plan assets: | ||||||||||||
Fair value of plan assets at beginning of year | $ | 444 | $ | 404 | $ | — | $ | — | ||||
Actual return on assets | 51 | 40 | — | — | ||||||||
Employer contributions | 1 | 34 | — | — | ||||||||
Benefits paid | (31) | (31) | — | — | ||||||||
Expenses paid | (3) | (3) | — | — | ||||||||
Fair value of plan assets at end of year | 462 | 444 | — | — | ||||||||
Unfunded status at end of year | $ | (123) | $ | (180) | $ | (13) | $ | (14) | ||||
Liabilities recognized in the Consolidated Balance Sheets: | ||||||||||||
Accrued compensation and benefits | $ | (1) | $ | (1) | $ | (1) | $ | (1) | ||||
Pension and other postretirement benefits | (122) | (179) | (12) | (13) | ||||||||
| $ | (123) | $ | (180) | $ | (13) | $ | (14) | ||||
108
MAXAR TECHNOLOGIES INC.
Notes to Consolidated Financial Statements Continued
(Tabular amounts in millions of dollars, unless otherwise noted)
The $39 million decrease in the pension benefit obligation from 2020 to 2021 was primarily due to the increase in the discount rate. The $18 million increase in the fair value of plan assets from 2020 to 2021 was primarily due to the return on assets.
The accumulated benefit obligation for the defined pension benefit plans was $585 million and $624 million at December 31, 2021 and 2020, respectively.
The following table provides the net pension and other postretirement benefits recognized in Accumulated other comprehensive (loss) income at December 31:
Pension | Other Postretirement | |||||||||||
| 2021 |
| 2020 |
| 2021 |
| 2020 | |||||
Net (loss) gain | $ | (60) | $ | (110) | $ | 9 | $ | 9 | ||||
The following table summarizes the weighted average assumptions used to determine the benefit obligations for the Company’s pension and other postretirement plans at December 31:
Pension | Other Postretirement | ||||||||||||
| 2021 |
| 2020 |
| 2021 |
| 2020 | ||||||
Discount rate | 2.6 | % | 2.2 | % | 2.6 | % | 2.2 | % | |||||
The following table summarizes the components of net periodic benefit (credit) cost for the Company’s pension and other postretirement benefit plans for the years ended December 31:
Pension | Other Postretirement | ||||||||||||||||||
2021 | 2020 | 2019 | 2021 | 2020 | 2019 | ||||||||||||||
Interest cost | $ | 14 | $ | 17 | $ | 21 | $ | 1 | $ | — | $ | 1 | |||||||
Expected return on plan assets | (29) | (24) | (24) | — | — | — | |||||||||||||
Amortization of net loss (gain) | 6 | 1 | — | (1) | — | (1) | |||||||||||||
Settlement gain | — | — | — | — | (4) | — | |||||||||||||
Expenses paid | 3 | 2 | 2 | — | — | — | |||||||||||||
Net periodic benefit credit | $ | (6) | $ | (4) | $ | (1) | $ | — | $ | (4) | $ | — | |||||||
The following table summarizes the components recognized in Other comprehensive (income) loss for the Company’s pension and other postretirement benefit plans for the years ended December 31:
Pension | Other Postretirement | ||||||||||||||||||
| 2021 |
| 2020 |
| 2019 | 2021 |
| 2020 |
| 2019 | |||||||||
Net (gain) loss | $ | (44) | $ | 40 | $ | 25 | $ | (1) | $ | 4 | $ | — | |||||||
Amortization of net (loss) gain | (6) | (1) | — | 1 | — | 1 | |||||||||||||
Total recognized in other comprehensive (income) loss | $ | (50) | $ | 39 | $ | 25 | $ | — | $ | 4 | $ | 1 | |||||||
Total recognized in net periodic benefit credit and other comprehensive (income) loss | $ | (56) | $ | 35 | $ | 24 | $ | — | $ | — | $ | 1 | |||||||
109
MAXAR TECHNOLOGIES INC.
Notes to Consolidated Financial Statements Continued
(Tabular amounts in millions of dollars, unless otherwise noted)
The following table summarizes the weighted average assumptions used to determine the net periodic benefit (credit) cost for the Company’s pension and other postretirement benefit plans for the years ended December 31:
Pension | Other Postretirement | |||||||||||||||||||
2021 | 2020 | 2019 | 2021 | 2020 | 2019 | |||||||||||||||
Discount rate | 2.2 | % | 3.0 | % | 4.1 | % | 2.2 | % | 3.0 | % | 4.1 | % | ||||||||
Expected long-term return on plan assets | 6.5 | % | 6.5 | % | 7.0 | % | N/A | N/A | N/A | |||||||||||
The expected long-term return on plan assets assumption represents the average rate that the Company expects to earn over the long-term on the assets of the Company’s benefit plans, including those from dividends, interest income and capital appreciation. The Company utilizes a third-party consultant to assist in the development of the expected long-term return on plan assets, which is based on expectations regarding future long-term rates of return for the plans’ investment portfolio, with consideration given to the allocation of investments by asset class and historical rates of return for each individual asset class.
Plan Assets. The Company’s Pension Committee (the “Committee”) has the responsibility to formulate the investment policies and strategies for the plan assets. The Committee structures the investment of plan assets to maximize the plans long-term rate of return for an acceptable level of risk and limit the volatility of investment returns. In the pursuit of these goals, the Committee has formulated the following investment policies and objectives: (1) preserve the plan assets; (2) maintain sufficient liquidity to fund benefit payments and pay plan expenses; and (3) achieve a minimum total rate of return equal to the established benchmarks for each asset category.
The Committee has established a target allocation that the plan assets may be invested in for each major asset category and has established guidelines regarding diversification within asset categories to limit risk and exposure to a single or limited number of securities. The investment manager is required to rebalance the portfolio within two percentage points for any individual asset or combination of assets defined within policy targets. Asset allocation targets are re-balanced quarterly and re-assessed annually for the upcoming year. The investments of the plan include a diversified portfolio of both equity and fixed income investments. Equity investments are further diversified across U.S. and international stocks, small to large capitalization stocks and growth and value stocks. Fixed income assets are diversified across U.S. and international issuers, corporate and governmental issuers and credit quality.
The following table presents a summary of target asset allocations for each major category of the plan assets as well as the actual asset allocations at December 31, 2021:
Asset Allocation | Target | Actual | |||||
Cash and cash equivalents | - | % | 1 | % | |||
U.S. and global equity securities | 71 | % |
| 71 | % | ||
Fixed income | 29 | % |
| 28 | % | ||
100 | % | 100 | % | ||||
Cash and cash equivalents consist of cash and short-term investments. U.S. and global equity securities, fixed income and other investment assets are primarily commingled fund investments. The pension plans’ commingled fund investments are managed by several fund managers and are valued at the net asset value per share for each fund. Although the majority of the underlying assets in the funds consist of actively traded equity securities and bonds, the unit of account is considered to be at the fund level. These funds are traded daily and settled the following day at the net asset value per share.
110
MAXAR TECHNOLOGIES INC.
Notes to Consolidated Financial Statements Continued
(Tabular amounts in millions of dollars, unless otherwise noted)
The Committee regularly monitors the investment of plan assets to ensure that the actual asset allocation remains in proximity to the target. The Committee also regularly measures and monitors investment risk through ongoing performance reporting and investment manager reviews.
The following table presents the fair value of the Company’s pension plan assets by asset category segregated by level within the fair value hierarchy, as described below:
December 31, 2021 | December 31, 2020 | |||||||||||||||||||||||
Asset Category | Level 1 | Level 2 | Level 3 | Total |
| Level 1 | Level 2 | Level 3 | Total | |||||||||||||||
Cash and cash equivalents | $ | 3 | $ | — | $ | — |
| $ | 3 | $ | 3 | $ | — | $ | — | $ | 3 | |||||||
Commingled funds 1 | 459 | 441 | ||||||||||||||||||||||
Total assets at fair value | $ | 3 | $ | — | $ | — | $ | 462 | $ | 3 | $ | — | $ | — | $ | 444 | ||||||||
1 | Investments that are measured at fair value using the net asset value per share (or its equivalent) as a practical expedient are not required to be classified in the fair value hierarchy table. The total fair value of these amounts are presented in this table to permit reconciliation of the fair value hierarchy to the amounts presented for total defined benefit pension plan assets. |
Contributions. The funding policy for the Company’s pension and postretirement benefit plans is to contribute at least the minimum required by applicable laws and regulations or to directly make benefit payments where appropriate. At December 31, 2021, all legal funding requirements had been met.
The American Rescue Plan Act of 2021 (“ARPA Act”) was enacted on March 11, 2021 in the United States. The ARPA Act includes provisions for pension funding relief in future periods. The Company has elected to take advantage of these provisions and anticipates lower required contributions for the qualified pension plan in the upcoming fiscal years. Due to the Company’s election, there are no required contributions for the Company’s qualified pension plan for the year ending December 31, 2022.
Estimated Future Benefit Payments. The following table presents expected pension and other postretirement benefit payments which reflect expected future service, as appropriate.
| 2022 |
| 2023 |
| 2024 |
| 2025 |
| 2026 |
| 2027 through 2031 | ||||||||
Pension | $ | 32 | $ | 32 | $ | 32 | $ | 32 | $ | 32 | $ | 159 | |||||||
Other postretirement | 1 | 1 | 1 | 1 | 1 | 4 | |||||||||||||
$ | 33 | $ | 33 | $ | 33 | $ | 33 | $ | 33 | $ | 163 |
20. STOCK-BASED COMPENSATION PLANS
The Company’s stock-based compensation plans were established to attract and retain key personnel by providing them the opportunity to acquire an equity interest in the Company or other incentive compensation measured by reference to the value of shares or other performance objectives and align the interests of key personnel with those of stockholders.
Long-Term Incentive Plans – The Company’s long-term incentive plans (“LTIP Plans”) include long-term incentive plans initiated before 2017 (“Pre-2017 Plans”) and the 2017 Long-Term Incentive Plan (“2017 Plan”) pursuant to which shares may be issued by the Company from treasury. Under the LTIP Plans, awards of stock appreciation rights (“SARs”) may be granted to employees of the Company and its subsidiaries; however, no LTIP award may be issued to any director of a subsidiary of the Company who is not an employee. An aggregate of 6,820,000 LTIP awards were authorized under the Pre-2017 Plans and an aggregate of 1,900,000 LTIP awards were authorized under the 2017 Plan. No further awards shall be granted under the LTIP Plans.
111
MAXAR TECHNOLOGIES INC.
Notes to Consolidated Financial Statements Continued
(Tabular amounts in millions of dollars, unless otherwise noted)
Omnibus Equity Incentive Plan – The Company adopted the Omnibus Equity Incentive Plan (“Omnibus Plan”) in February 2017 and the stockholders approved the Omnibus Plan in July 2017. The Omnibus Plan provides for grants to eligible employees, officers, consultants or advisors of the Company and its subsidiaries of stock options, long-term incentive units, restricted stock units (“RSUs”), SARs and performance stock units (“PSUs”) in order to provide a long-term incentive compensation to such persons. No awards will be made under the Omnibus Plan to non-employee directors. 1,100,000 shares were reserved for issuance under the Omnibus Plan. The Omnibus Plan has a term of ten years and shares may be issued by the Company from treasury. As of December 31, 2019, no further awards shall be granted under the Omnibus Plan.
2019 Incentive Award Plan – The Company adopted the 2019 Incentive Award Plan (“2019 Plan”) in March 2019 and the stockholders approved the 2019 Plan in May 2019. The 2019 Plan provides for grants to eligible employees, officers, consultants, directors or advisors of the Company and its subsidiaries of stock options, SARs, restricted stock award, RSUs, deferred stock award and PSUs in order to provide a long-term incentive compensation to such persons. 2,525,000 shares were reserved for issuance under the 2019 Plan. In addition, any shares subject to a prior plan that are forfeited, cancelled, or expired shall be available for future grants under the 2019 Plan. Only awards settled in equity count against the share reserve. Awards are actively being granted out of the 2019 Plan as of December 31, 2021.
Deferred Stock Unit Plan – On October 1, 2003, the Company established a Deferred Share Unit (“DSU”) Plan (“DSU Plan”) whereby the Company’s independent directors received some or all of their annual retainers in DSUs. DSUs are granted at a price equal to the closing price of the common shares on the day before the date of grant. The DSUs are settled in cash at retirement at the closing price of the common shares of the Company on the retirement date of the director. Under the DSU Plan, 100,000 DSUs were reserved for issuance.
Legacy Employee Stock Purchase Plan – On October 1, 2001, the Company implemented an employee stock purchase plan. Under this plan, the Company could issue 1,500,000 common shares to certain eligible employees. The maximum number of common shares that could be issued under the plan in any one year was 300,000. Under the terms of the plan, employees could purchase shares of the Company at 85% of the market value of the shares. Employees could allocate a maximum of 10% of their salary to the plan to a maximum of $20,000 Canadian dollars per annum. During the year ended December 31, 2019, 22,541 common shares were issued at an average price of $6.20 Canadian dollars under the legacy employee stock purchase plan. As of December 31, 2019, the Legacy Employee Stock Purchase Plan was discontinued.
Maxar Technologies Inc. Employee Stock Purchase Plan – On March 27, 2019, the Company implemented an employee stock purchase plan. Under this plan, the Company may issue 5,000,000 common shares to certain eligible employees. Under the terms of the plan, employees can purchase shares of the Company at 85% of the market value of the shares on the lower closing price of either the first or last day of the purchase period. Employees can allocate a maximum of 10% of their salary to the plan to a maximum of $25,000 per annum. During the years ended December 31, 2021, 2020 and 2019, 308,554, 543,184 and 89,398 common shares were issued, respectively, at an average price of $27.71, $9.75 and $6.09, respectively, under the employee stock purchase plan.
DigitalGlobe Equity Plan – The Employee Stock Option Plan (“DigitalGlobe Equity Plan”) was assumed as a result of the DigitalGlobe acquisition, effective as of October 5, 2017. As of December 31, 2017, no further awards shall be granted under the DigitalGlobe Equity Plan.
Stock Appreciation Rights
Certain awards issued under the 2017 Plan and Omnibus Plan remain outstanding as of December 31, 2021. The SARs under the Plan and Omnibus Plan vest over a period of four years, in the amount of -quarter each year, and expire ten years their grant date.
112
MAXAR TECHNOLOGIES INC.
Notes to Consolidated Financial Statements Continued
(Tabular amounts in millions of dollars, unless otherwise noted)
SARs Accounted for as Liability and Equity Classified Awards
A summary of the SARs accounted for as liability and equity classified awards for the year ended December 31, 2021 is presented below:
Number of Awards | Weighted Average Exercise Price | Weighted Average Remaining Contractual Term (in years) | Aggregate Intrinsic Value | ||||||||
SARs outstanding at December 31, 2020 | 1,192,747 | $ | 53.93 | ||||||||
Exercised | (20,450) | 48.91 | | ||||||||
Cancelled or expired | (251,161) | 61.29 | | ||||||||
SARs outstanding at December 31, 2021 | 921,136 | 51.13 | 5.28 | $ | — | ||||||
SARs vested and expected to vest at December 31, 2021 | 921,136 | 51.13 | 5.28 | $ | — | ||||||
SARs exercisable at December 31, 2021 | 918,559 | $ | 51.18 | 5.28 | $ | 76,246 | |||||
No SARs were granted during the years ended December 31, 2021 or 2020. There were 20,450 SARs exercised during the year ended December 31, 2021. There were no SARs exercised during the year ended December 31, 2020. There were 44,370 liability and 876,766 equity classified awards outstanding as of December 31, 2021.
As of December 31, 2021, total unrecognized compensation expense related to nonvested SARs was not significant.
Restricted Share Units
The Company issues RSUs to certain employees under the 2019 Plan. The RSUs vest over a period of either three years, in the amount of -third each year, or one year, and are settled either in cash or equity on the vesting date.
RSUs Accounted for as Liability Classified Awards
There were no RSU liability classified awards granted during the year ended December 31, 2021. During the fourth quarter of 2020, the Company modified its outstanding 532,365 RSUs accounted for as liability classified awards to be equity settled on the vesting date. This modification resulted in an incremental share-based compensation expense of $3 million on the modification date and affected 37 employees. As a result of the modification, there were no remaining outstanding nonvested RSU liability classified awards as of December 31, 2020.
For the year ended December 31, 2020, the Company paid $4 million for the vesting of RSUs accounted for as liability classified awards. No liability classified RSU awards vested for the year ended December 31, 2019.
RSUs Accounted for as Equity Classified Awards
As part of the acquisition of DigitalGlobe, the Company provided replacement RSUs for a certain portion of the unvested RSUs previously granted to DigitalGlobe employees under the DigitalGlobe Equity Plan. The remaining replacement RSUs fully vested in 2021.
113
MAXAR TECHNOLOGIES INC.
Notes to Consolidated Financial Statements Continued
(Tabular amounts in millions of dollars, unless otherwise noted)
A summary of the status of the Company’s nonvested RSU awards under the 2019 Plan, Omnibus Plan and the DigitalGlobe Equity Plan as of December 31, 2021 and changes for the year ended December 31, 2021 is presented below:
Weighted Average | Weighted Average | Weighted Average | |||||||||||||||
Number of | Grant Date | Number of | Grant Date | Number of | Grant Date | ||||||||||||
| Awards 1 |
| Fair Value 1 |
| Awards 2 |
| Fair Value 2 |
| Awards 3 |
| Fair Value 3 | ||||||
Nonvested RSUs at December 31, 2020 | 2,949,969 | $ | 15.33 | 70,373 | $ | 12.41 | 26,316 | $ | 54.57 | ||||||||
Granted | 807,628 | 43.53 | — | — | — | — | |||||||||||
Vested | (1,129,781) | 15.90 | (44,717) | 16.98 | (26,151) | 54.57 | |||||||||||
Cancelled or expired | (328,683) | 21.03 | (718) | 23.10 | (165) | 54.57 | |||||||||||
Nonvested RSUs at December 31, 2021 | 2,299,133 | $ | 24.15 | 24,938 | $ | 3.99 | - | $ | — | ||||||||
1RSUs under the 2019 Plan
2RSUs under the Omnibus Plan
3RSUs under the DigitalGlobe Equity Plan
During the years ended December 31, 2021, 2020, and 2019, the total fair value of RSUs that vested was $20 million, $14 million and $14 million, respectively. During the year ended December 31, 2021, there were 1,200,649 RSU awards that vested.
As of December 31, 2021, total unrecognized compensation expense related to nonvested RSUs was $18 million and is expected to be recognized over a weighted average remaining period of 0.8 years.
Performance Share Units
The Company issues PSUs to certain employees under the Omnibus Plan and 2019 Plan. The PSUs vest over a period of three years from the beginning date of a pre-determined performance period to the extent the Company has met its adjusted cash leverage (“ACL”) and total shareholder return (“TSR”) performance criteria during the performance period. Each unit has the ability to earn up to two common shares and the total number of shares earned is based upon both the ACL and TSR, which compares the Company's relative TSR performance against the total shareholder return of the Russell 2000 index over the term of the award. Performance related to both the ACL and TSR can be 0-200%. The total payout is the average of the ACL and TSR and the maximum payout percentage for all PSUs granted by the Company is 200%. For PSUs granted in 2019, the payout for performance up to 100% will be in equity and any performance greater than 100% will be paid in cash. For PSUs granted in 2020 and 2021, the payout for performance is settled completely in equity.
A summary of the PSU awards for the year ended December 31, 2021 is presented below:
Weighted Average | |||||
Number of | Grant Date | ||||
Awards | Fair Value | ||||
Nonvested PSUs at December 31, 2020 | 1,040,680 | $ | 11.76 | ||
Granted | 155,902 | 61.93 | |||
Vested | (223,053) | 4.73 | |||
Cancelled or expired | (69,964) | 14.88 | |||
114
MAXAR TECHNOLOGIES INC.
Notes to Consolidated Financial Statements Continued
(Tabular amounts in millions of dollars, unless otherwise noted)
Nonvested PSUs at December 31, 2021 | 903,565 | $ | 20.42 |
The Company paid $8 million and $3 million from the vesting of PSUs for the years ended December 31, 2021 and 2020, respectively. There were no vesting of PSU awards for the year ended December 31, 2019.
As of December 31, 2021, total unrecognized compensation expense related to nonvested PSUs was $7 million and is expected to be recognized over a weighted average remaining period of 0.8 years.
Deferred Share Units
A summary of the DSU awards for the year ended December 31, 2021 is presented below:
Number of Awards | Weighted Average Issuance Price | ||||
DSUs outstanding at December 31, 2020 | 32,895 | C$ | 56.01 | ||
Issued | — | — | |||
Redeemed | — | — | |||
DSUs outstanding at December 31, 2021 | 32,895 | C$ | 56.01 | ||
1References to “C$” refer to Canadian currency.
There were no DSUs redeemed for the year ended December 31, 2021. The total intrinsic value of redeemed DSUs was not material during the year ended December 31, 2020. There were 32,715 DSUs and 41,993 DSUs redeemed for the years ended December 31, 2020 and 2019, respectively.
Expense related to DSUs is recognized fully as stock-based compensation expense at the time they are issued. There were no DSUs issued for the years ended December 31, 2021 or 2020.
Stock-based compensation expense
The following table presents stock-based compensation expense (benefit) from continuing operations included in the Company’s Consolidated Statements of Operations:
Year Ended December 31, | ||||||||||||
| Classification | | 2021 | 2020 | 2019 | |||||||
Stock-based compensation expense | Selling, general, and administrative expense, Product costs, and Service costs | $ | 45 | $ | 43 | $ | 20 | |||||
115
MAXAR TECHNOLOGIES INC.
Notes to Consolidated Financial Statements Continued
(Tabular amounts in millions of dollars, unless otherwise noted)
Valuation of stock-based compensation awards
Valuation of Liability Classified SARs
The fair value of the SARs were estimated at each reporting period using the Black-Scholes option pricing model with the following weighted average assumptions:
Year Ended December 31, | |||||||||
2021 1 | 2020 1 | 2019 | |||||||
Risk-free interest rate | — | % | — | % | 1.7 - 1.9 | % | |||
Dividend yield | — | % | — | % | 0.5 | % | |||
Volatility | — | % | — | % | 57 - 130 | % | |||
Expected lives (in years) | — | — | 0.2 - 4.6 | ||||||
1No liability classified SARs were granted in 2021 or 2020.
Valuation of Equity Classified SARs and DSUs
The fair value of equity classified SARs and DSUs are estimated on the date of the grant or the date of accounting reclassification using the Black-Scholes option pricing model. There were no equity classified SARs or DSUs granted for the years ended December 31, 2021, 2020 and 2019.
Valuation of PSUs and RSUs
The fair value of PSUs not subject to a market condition (ACL) and equity classified RSUs is determined based on the closing price of the Company’s common stock on the grant date.
PSUs that are subject to the market condition (TSR) are valued using a Monte Carlo simulation model, which requires certain assumptions, including the risk-free interest rate, expected volatility and the expected term of the award. The risk-free interest rate used in the Monte Carlo simulation model is based on zero-coupon yields implied by U.S. Treasury issues with remaining terms similar to the performance period on the PSUs. The performance period of the PSUs represents the period of time between the PSU grant date and the end of the performance period. Expected volatility is based on historical data of the Company and peer companies over the most recent time period equal to the performance period.
For PSU grants during the years ended December 31, 2021, 2020 and 2019 the assumptions used in the Monte Carlo simulation are as follows:
Year Ended December 31, | |||||||||
2021 | 2020 | 2019 | |||||||
Risk-free interest rate | 0.3 | % | 0.9 | % | 2.2 - 2.3 | % | |||
Dividend yield | 0.1 | % | 0.3 | % | 0.5 - 0.9 | % | |||
Volatility | 98 - 104 | % | 79 | % | 63 - 67 | % | |||
Expected lives (in years) | 2.6 - 2.8 | 2.8 | 2.9 - 3.0 | ||||||
The risk-free interest rate for 2021, 2020 and 2019 is based on the U.S. Treasury yield with the remaining term equal to the expected life assumed at the date of the grant. The dividend yield is based on the expected annual dividend yield at date of grant. The expected lives are based on the Company’s actual historical exercise experience. Volatility is calculated using a rate based upon the historical volatility of the Company’s common stock.
116
MAXAR TECHNOLOGIES INC.
Notes to Consolidated Financial Statements Continued
(Tabular amounts in millions of dollars, unless otherwise noted)
Forfeitures are estimated at the time of grant based upon historical information. Forfeitures will be revised, if necessary, in subsequent periods if actual forfeitures differ from estimates.
21. INCOME TAXES
The amounts disclosed within the income tax footnote represent those attributable to continuing operations.
The components of income (loss) before income taxes were:
Year Ended December 31, | |||||||||
| 2021 |
| 2020 | | 2019 | ||||
U.S. | $ | 25 | $ | (69) | $ | 77 | |||
Non-U.S. | 8 | — | — | ||||||
Income (loss) before taxes | $ | 33 | $ | (69) | | $ | 77 | ||
Income tax (benefit) expense is comprised of the following:
Year Ended December 31, | |||||||||
| 2021 |
| 2020 | | 2019 | ||||
Current tax (benefit) expense | | ||||||||
Federal | $ | (12) | $ | (5) | $ | 5 | |||
State | (1) | — | — | ||||||
Non-U.S. | 1 | — | — | ||||||
(12) | (5) | | 5 | ||||||
Deferred tax benefit | | ||||||||
Federal | (1) | (17) | — | ||||||
State | — | — | — | ||||||
Non-U.S. | — | — | — | ||||||
(1) | (17) | | — | ||||||
Income tax (benefit) expense | $ | (13) | $ | (22) | | $ | 5 | ||
117
MAXAR TECHNOLOGIES INC.
Notes to Consolidated Financial Statements Continued
(Tabular amounts in millions of dollars, unless otherwise noted)
A reconciliation of the U.S. federal tax rate to the Company’s effective income tax rate is as follows:
Year Ended December 31, | ||||||||||
2021 |
| 2020 | 2019 | |||||||
U.S. statutory income tax rate | 21 | % | 21 | % | 21 | % | ||||
Expected income tax (benefit) expense at statutory rate | $ | 7 | $ | (14) | $ | 16 | ||||
State tax (net of federal benefit) | (1) | — | — | |||||||
Non-deductible expenses | 2 | 2 | 12 | |||||||
Tax on international operations | — | — | (1) | |||||||
Change in valuation allowance | (10) | 49 | (108) | |||||||
Base Erosion and Anti-Abuse Tax | (13) | (5) | 5 | |||||||
Outside basis difference in assets held for sale | — | (39) | 78 | |||||||
Tax credits | 1 | (3) | (1) | |||||||
Stock-based compensation | 1 | 6 | 3 | |||||||
Remeasurement of Vricon equity interest | — | (18) | — | |||||||
Other | — | — | 1 | |||||||
Income tax (benefit) expense | $ | (13) | $ | (22) | $ | 5 | ||||
Effective income tax rate | (39) | % | 32 | % | 6 | % | ||||
Significant components of deferred tax assets and liabilities are as follows:
Year Ended December 31, | |||||||||
2021 |
| 2020 | | 2019 | |||||
Tax benefit of losses carried forward | $ | 153 | $ | 209 | $ | 219 | |||
Interest expense carried forward | 32 | — | 27 | ||||||
Tax credits | 81 | 84 | 75 | ||||||
Construction contract liabilities | — | — | 94 | ||||||
Trade and other payables | 41 | 35 | 9 | ||||||
Employee benefits | 41 | 52 | 41 | ||||||
Unrealized gains and losses | 3 | 20 | 6 | ||||||
Leasing transactions | 51 | 55 | 61 | ||||||
Other | — | 1 | 18 | ||||||
Deferred tax assets | 402 | 456 | | 550 | |||||
Valuation allowance | (215) | (228) | (231) | ||||||
Deferred tax assets, net of valuation allowance | 187 | 228 | | 319 | |||||
| | ||||||||
Construction contract liabilities | (5) | (10) | | — | |||||
Property, plant and equipment | (64) | (72) | (66) | ||||||
Goodwill and intangibles | (81) | (106) | (124) | ||||||
Outside basis difference in assets held for sale | — | — | (78) | ||||||
Leasing transactions | (35) | (38) | (43) | ||||||
Other | — | — | (9) | ||||||
Deferred tax liabilities | (185) | (226) | | (320) | |||||
Deferred tax assets, net | $ | 2 | $ | 2 | | $ | (1) | ||
The Company assesses the deferred tax assets for recoverability and, based upon all available evidence, establishes a valuation allowance to reduce the deferred tax assets to the amount that is more-likely-than-not realizable. The valuation allowance decreased $13 million from December 31, 2020 to December 31, 2021. This decrease was primarily due to the impact of current year operations and adjustments to prior year deferred taxes.
118
MAXAR TECHNOLOGIES INC.
Notes to Consolidated Financial Statements Continued
(Tabular amounts in millions of dollars, unless otherwise noted)
During 2019, in connection with the MDA Transaction, the Company re-evaluated its prior permanent reinvestment assertion and concluded that it could no longer assert that the basis difference related to its investment was permanently reinvested. Accordingly, the Company established a deferred tax liability of approximately $78 million on the taxable temporary difference associated with its investment. In connection with the completion of the MDA Transaction, taxable gain was recognized in 2020 resulting in a release of the taxable temporary difference associated with its investment.
As of December 31, 2021, the Company has approximately $520 million, $874 million, and $12 million of federal, state and non-U.S. net operating loss (“NOL”) carryforwards.
The following table summarizes the NOL carryforwards by jurisdiction:
Expiration Period | | | | Year Ended December 31, 2021 | |||||
Federal | 2036 - 2037 | | $ | 273 | |||||
None | | | 247 | ||||||
State | 2025 - 2040 | | | 713 | |||||
None | | | 161 | ||||||
Non-U.S. | None | | | 12 |
The Company also has U.S. federal and state tax credits, net of unrecognized tax benefits, carried forward of $71 million and $9 million as of December 31, 2021, relating to research and development expenditures set to expire between 2022 and 2041 and state research credits with no expiration. Additionally, the Company has U.S. foreign tax credits carried forward of $3 million set to expire between 2022 and 2026.
The Company has evaluated its tax positions and has determined that it has certain unrecognized tax benefits. Accordingly, the Company has reduced certain tax attributes to the extent they would be utilized to offset an unrecognized tax benefit. The following table summarizes the changes in unrecognized tax benefits:
Year Ended December 31, | |||||||||
2021 |
| 2020 | | 2019 | |||||
Balance, beginning of year | $ | 9 | $ | 7 | | $ | — | ||
Gross increases related to prior period tax positions | 7 | 2 | | | 6 | ||||
Gross increases related to current period tax positions | 1 | 1 | | | 1 | ||||
Gross decreases related to prior period tax positions | — | (1) | | | — | ||||
Balance, end of year | $ | 17 | $ | 9 | | $ | 7 | ||
As of December 31, 2021, there were $17 million of unrecognized tax benefits that, if recognized, would be offset by changes in the deferred tax assets. It is not anticipated that a material increase or reduction of unrecognized tax benefits will occur within the next twelve months.
The Company records interest and penalties accrued or recovered in relation to unrecognized tax benefits in income tax expense. The Company has not recognized any interest and penalties in the three-year comparative period due to available tax attributes.
The Company and its subsidiaries file income tax returns in the United States and various foreign jurisdictions. We are not currently under any income tax examinations. The Company is open to federal and state income tax examinations until the applicable statute of limitations expires, generally three years after tax return filing; however, the ability for the taxing authority to adjust tax attribute carryforwards will continue until generally three years after tax attribute utilization.
119
MAXAR TECHNOLOGIES INC.
Notes to Consolidated Financial Statements Continued
(Tabular amounts in millions of dollars, unless otherwise noted)
22. NET INCOME (LOSS) PER COMMON SHARE
The following table includes the calculation of basic and diluted net income (loss) per common share:
Year Ended December 31, | |||||||||
| 2021 |
| 2020 | 2019 | |||||
Income (loss) from continuing operations | $ | 46 | $ | (46) | $ | 83 | |||
Income from discontinued operations, net of tax | — | 349 | 26 | ||||||
Net income | $ | 46 | $ | 303 | $ | 109 | |||
Weighted average number of common shares outstanding-basic | 70.6 | 60.7 | 59.6 | ||||||
Weighted dilutive effect of equity awards |
| 2.6 |
| — | 0.6 | ||||
Weighted average number of common shares outstanding-diluted | 73.2 | 60.7 | 60.2 | ||||||
Basic net income per common share: | |||||||||
Income (loss) from continuing operations | $ | 0.65 | $ | (0.76) | $ | 1.39 | |||
Income from discontinued operations, net of tax | — | 5.75 | 0.44 | ||||||
Basic net income per common share | $ | 0.65 | $ | 4.99 | $ | 1.83 | |||
Diluted net income per common share: | |||||||||
Income (loss) from continuing operations | $ | 0.63 | $ | (0.76) | $ | 1.38 | |||
Income from discontinued operations, net of tax | — | 5.75 | 0.43 | ||||||
Diluted net income per common share | $ | 0.63 | $ | 4.99 | $ | 1.81 | |||
The weighted average number of common shares outstanding for the year ended December 31, 2021 includes 10 million shares of the Company’s common stock issued in connection with the Offering completed on March 22, 2021. See Note 15 for further details.
For the years ended December 31, 2021, 2020 and 2019 approximately 1 million, 4 million and 2 million awards, respectively, were excluded from the diluted weighted average number of ordinary common shares outstanding calculation because their effect would have been anti-dilutive.
23. COMMITMENTS AND CONTINGENCIES
Contingencies in the Normal Course of Business
Satellite construction contracts may include performance incentives whereby payment for a portion of the purchase price of the satellite is contingent upon in-orbit performance of the satellite. The Company’s ultimate receipt of orbital performance incentives is subject to the continued performance of its satellites generally over the contractually stipulated life of the satellites. A complete or partial loss of a satellite’s functionality can result in loss of orbital receivable payments or repayment of amounts received by the Company under a warranty payback arrangement. The Company generally receives the present value of the orbital receivables if there is a launch failure or a failure caused by a customer error, but will forfeit some or all of the orbital receivables if the loss is caused by satellite failure or as a result of Company error. The Company recognizes orbital performance incentives in the financial statements based on the amounts that are expected to be received and believes that it will not incur a material loss relating to the incentives recognized. With respect to the Company’s securitized liability for the orbital receivables, upon the occurrence of an event of default under the securitization facility agreement or upon the occurrence of limited events, the Company may be required to repurchase on demand any effected receivables at their then net present value.
120
MAXAR TECHNOLOGIES INC.
Notes to Consolidated Financial Statements Continued
(Tabular amounts in millions of dollars, unless otherwise noted)
The Company may incur liquidated damages on programs as a result of delays due to slippage, or for programs which fail to meet all milestone requirements as outlined within the contractual arrangements with customers. Losses on programs related to liquidated damages result in a reduction of revenue. Changes in estimates related to contracts accounted for using the cost-to-cost method are recognized in the period in which such changes are made for the inception-to-date effect of the changes. Unrecoverable costs on contracts that are expected to be incurred in future periods are recorded in program cost in the current period. Additionally, construction contracts may have termination for default clauses, which if triggered, could result in potential losses and legal disputes.
The Company enters into agreements in the ordinary course of business with resellers and others. Most of these agreements require the Company to indemnify the other party against third-party claims alleging that one of its products infringes or misappropriates a patent, copyright, trademark, trade secret or other intellectual property right. Certain of these agreements require the Company to indemnify the other party against claims relating to property damage, personal injury or acts or omissions by the Company, its employees, agents or representatives.
From time to time, the Company has made guarantees regarding the performance of its systems to its customers. Some of these agreements do not limit the maximum potential future payments the Company could be obligated to make. The Company evaluates and estimates potential losses from such indemnification based on the likelihood that the future event will occur. The Company has not incurred any material costs as a result of such obligations and has not accrued any liabilities related to such indemnification and guarantees in the Consolidated Financial Statements.
The Company has entered into industrial cooperation agreements, sometimes referred to as offset agreements, as a condition to entering into contracts for its products and services from certain customers in foreign countries. These agreements are designed to return economic value to the foreign country and may be satisfied through activities that do not require a direct cash payment, including transferring technology and providing manufacturing, training and other consulting support to in-country projects. These agreements may provide for penalties in the event the Company fails to perform in accordance with offset requirements. The Company has historically not been required to pay any such penalties.
Risks and uncertainties related to COVID-19
The near and long-term impacts of the current pandemic on the cost and schedule of the numerous programs in the Company’s existing backlog and the timing of new awards remain uncertain. The Company is observing stress in its supplier base inside and outside the U.S. and will continue to monitor and assess the actual and potential COVID-19 impacts on employees, customers, suppliers and the productivity of the work being done, all of which to some extent could affect revenues, estimated costs to complete projects, earnings and cash flow. The Company has received some force majeure claims from suppliers related to COVID-19; however, at this time the Company does not expect the claims to result in a material financial impact.
In many instances, COVID-19 represents a force majeure event and as such, the Company has notified certain customers that it will be exercising its legal rights, and in some instances the Company has made claims exercising such rights, given the uncertain nature of the current pandemic and the near and long-term impacts on the cost and schedule of the numerous programs in the existing backlog.
Legal proceedings
On January 14, 2019, a Maxar stockholder filed a putative class action lawsuit captioned Oregon Laborers Employers Pension Trust Fund, et al. v. Maxar Technologies Inc., No. 1:19-cv-00124-WJM-SKC in the United States District Court for the District of Colorado (“Colorado Action”), naming Maxar and members of management as defendants alleging, among other things, that the Company’s public disclosures were deficient in violation of the federal securities laws and
121
MAXAR TECHNOLOGIES INC.
Notes to Consolidated Financial Statements Continued
(Tabular amounts in millions of dollars, unless otherwise noted)
seeking monetary damages. On October 7, 2019, the lead plaintiff filed a consolidated amended complaint alleging violations of Sections 10(b) and 20(a) of the Securities Exchange Act of 1934 against the Company and members of management in connection with the Company’s public disclosures between March 26, 2018 and January 6, 2019. The consolidated complaint alleges that the Company’s statements regarding the AMOS-8 contract, accounting for its GEO communications assets and WorldView-4 were allegedly false and/or misleading during the class period. On September 11, 2020, the court granted in part, and denied in part, defendants’ motion to dismiss. On July 16, 2021, the court in the Colorado Action certified a class consisting of investors who purchased or acquired Maxar stock between May 9, 2018 and October 30, 2018, inclusive. Also, in January 2019, a Maxar stockholder resident in Canada issued a putative class action lawsuit captioned Charles O’Brien v. Maxar Technologies Inc., No. CV-19-00613564-00CP in the Ontario Superior Court of Justice against Maxar and members of management claiming misrepresentations in Maxar’s public disclosures and seeking monetary damages. On November 15, 2019, Mr. O’Brien and another Maxar stockholder resident in Canada issued a new putative class action lawsuit captioned Charles O’Brien v. Maxar Technologies Inc., No. CV-19-00631107-00CP, naming Maxar and certain members of management and the board of directors as defendants as well as Maxar’s auditor, KPMG LLP. On February 7, 2020, the January 2019 lawsuit was discontinued. The Statement of Claim alleges that the Company’s statements regarding the AMOS-8 contract, accounting for its GEO communications assets, and WorldView-4 were false and/or misleading during the class period and claims damages of $700 million. On April 24, 2020, the plaintiffs served their motion record for leave under the Securities Act (Ontario) and to certify the action as a class proceeding, which motion is currently pending. By order dated September 23, 2021, the action against KPMG LLP was discontinued. The Company intends to vigorously defend against these cases.
On October 21, 2019, a Maxar stockholder filed a putative class action lawsuit captioned McCurdy v. Maxar Technologies Inc., et al., No. I9CV35070 in the Superior Court of the State of California, County of Santa Clara, naming Maxar, and certain members of management and the board of directors as defendants. The lawsuit alleges violations of Sections 11, 12(a)(2) and 15 of the Securities Act of 1933 in connection with the Company’s June 2, 2017 Registration Statement and Prospectus (“Offering Materials”) filed in anticipation of its October 5, 2017 merger with DigitalGlobe, Inc. (the “DigitalGlobe Merger”). On April 30, 2020, the plaintiff filed an amended complaint alleging the same causes of action against the same set of defendants as set forth in his original complaint. The lawsuit is based upon many of the same underlying factual allegations as the Colorado Action. Specifically, the lawsuit alleges the Company’s statements regarding its accounting methods and risk factors, including those related to the GEO communications business, were false and/or misleading when made. On January 24, 2021, the court granted in part, and denied in part, defendants’ motion to dismiss. On August 20, 2021, the court certified a class consisting of investors who acquired Maxar stock in exchange for DigitalGlobe stock pursuant to the Offering Materials issued in connection with the DigitalGlobe Merger. The Company intends to vigorously defend against this lawsuit.
On November 14, 2019, a derivative action was filed against Maxar and certain current and former members of management and the board of directors in United States District Court for the District of Delaware, captioned as Dorling, Derivatively on Behalf of Nominal Defendant Maxar Technologies Inc. v. Lance, et al., No. 19-cv-02134-UNA. On September 18, 2020, another purported derivative action was filed in the same court against Maxar and certain current and former members of management and the board of directors, captioned as Golub, Derivatively on Behalf of Maxar Technologies Inc. v. Lance, et al., No. 20-cv-01251-UNA. Both complaints concern the same factual allegations as asserted in the Colorado Action. The court has consolidated and stayed both derivative cases.
On September 15, 2021, a derivative action was filed against Maxar and certain current and former members of management and the board of directors in the Court of Chancery of the State of Delaware, captioned as Egan, on behalf of Maxar Technologies, Inc., v. Lance et al., C.A. No. 2021-0796-PAF. The complaint concerns the same factual allegations as asserted in the Colorado Action. The action is currently stayed by stipulation of the parties.
The Company is a party to various other legal proceedings and claims that arise in the ordinary course of business as either a plaintiff or defendant. As a matter of course, the Company is prepared both to litigate these matters to judgment,
122
MAXAR TECHNOLOGIES INC.
Notes to Consolidated Financial Statements Continued
(Tabular amounts in millions of dollars, unless otherwise noted)
as well as to evaluate and consider all reasonable settlement opportunities. The Company establishes accrued liabilities for these matters where losses are deemed probable and reasonably estimable. The outcome of any of these other proceedings, either individually or in the aggregate, is not expected to have a material adverse effect on the Company’s financial position, results of operations or liquidity. The Company expenses legal fees related to contingencies as incurred.
The Company maintains insurance policies for settlements and judgments, as well as legal defense costs, for lawsuits such as those described in the preceding paragraphs, although the amount of insurance coverage that we maintain may not be adequate to cover all claims or liabilities. In addition, provisions of the Company’s Certificate of Incorporation, Bylaws and indemnification agreements entered into with current and former directors and officers require the Company, among other things, to indemnify these directors and officers against certain liabilities that may arise by reason of their status or service as directors or officers and to advance expenses to such directors or officers in connection therewith.
24. SUPPLEMENTAL CASH FLOW
Selected cash payments and non-cash activities are as follows:
Year Ended December 31, | |||||||||
| 2021 |
| 2020 |
| 2019 | ||||
Supplemental cash flow information: | |||||||||
Cash paid for interest | $ | 133 | $ | 205 | $ | 193 | |||
Income tax payments, net of (refunds) | (14) | 1 | 1 | ||||||
Supplemental non-cash investing and financing activities: | |||||||||
Accrued capital expenditures | $ | 14 | $ | 13 | $ | 19 | |||
123
ITEM 9.CHANGES IN AND DISAGREEMENTS WITH ACCOUNTANTS ON ACCOUNTING AND FINANCIAL DISCLOSURE
None.
ITEM 9A. CONTROLS AND PROCEDURES
Evaluation of Disclosure Controls and Procedures
We performed an evaluation of the effectiveness of our disclosure controls and procedures as of December 31, 2021. The evaluation was performed with the participation of senior management of each business segment and key corporate functions, under the supervision of the Chief Executive Officer (CEO) and Chief Financial Officer (CFO). Based on this evaluation, the CEO and CFO concluded that our disclosure controls and procedures were effective as of December 31, 2021.
Management’s Report on Internal Control over Financial Reporting
Management is responsible for establishing and maintaining adequate internal control over financial reporting as defined in Exchange Act Rule 13a-15(f). Our internal control over financial reporting is designed to provide reasonable assurance regarding the reliability of financial reporting and the preparation of financial statements for external purposes in accordance with United States generally accepted accounting principles.
Under the supervision and with the participation of our management, including our Chief Executive Officer and Chief Financial Officer, we conducted an evaluation of the effectiveness of our internal control over financial reporting based on the criteria set by the Committee of Sponsoring Organizations of the Treadway Commission (“COSO”) in Internal Control—Integrated Framework (2013). Based on this assessment, management concluded that our internal control over financial reporting was effective as of December 31, 2021.
Our independent registered public accounting firm has issued a report on the effectiveness of our internal control over financial reporting, which is included in this Annual Report on Form 10-K.
Changes in Internal Control over Financial Reporting
There were no changes to our internal control over financial reporting that occurred during the quarter ended December 31, 2021, that have materially affected, or are reasonably likely to materially affect, our internal control over financial reporting.
Limitations on the Effectiveness of Controls
Because of the inherent limitations in a cost-effective control system, any control system, no matter how well designed and operated, can provide only reasonable, not absolute, assurance that it will prevent or detect all misstatements, due to error or fraud, from occurring in the Consolidated Financial Statements. Additionally, management is required to use judgment in evaluating controls and procedures.
ITEM 9B. OTHER INFORMATION
None.
ITEM 9C. DISCLOSURE REGARDING FOREIGN JURISDICTIONS THAT PREVENT INSPECTIONS
None.
124
ITEM 10.DIRECTORS, EXECUTIVE OFFICERS AND CORPORATE GOVERNANCE
Information required under Item 10 will be included in the Proxy Statement for the 2022 Annual Meeting of Stockholders and is incorporated herein by reference.
CODE OF ETHICS
Our Board of Directors has adopted a Code of Ethics and Business Conduct that governs our Board of Directors, senior officers (including our Chief Executive Officer and Chief Financial Officer), and employees. Copies of our Code of Ethics and Business Conduct can be found on the Company Information page of our website under Investors, Corporate Governance, Governance Documents at http://investor.maxar.com. We will post to our website any amendments and waivers to the Code of Ethics and Business Conduct that are required to be disclosed by the rules of either the SEC, the NYSE, or the TSX.
ITEM 11.EXECUTIVE COMPENSATION
The information required by Item 11 will be included in the Proxy Statement for the 2022 Annual Meeting of Shareholders and is incorporated herein by reference.
ITEM 12.SECURITY OWNERSHIP OF CERTAIN BENEFICIAL OWNERS AND MANAGEMENT AND RELATED STOCKHOLDER MATTERS
The information required by Item 12 will be included in the Proxy Statement for the 2022 Annual Meeting of Shareholders and is incorporated herein by reference.
ITEM 13.CERTAIN RELATIONSHIPS AND RELATED TRANSACTIONS, AND DIRECTOR INDEPENDENCE
The information required by Item 13 will be included in the Proxy Statement for the 2022 Annual Meeting of Shareholders and is incorporated herein by reference.
ITEM 14.PRINCIPAL ACCOUNTANT FEES AND SERVICES
The information required by Item 14 will be included in the Proxy Statement for the 2022 Annual Meeting of Shareholders and is incorporated herein by reference.
ITEM 15.EXHIBITS AND FINANCIAL STATEMENT SCHEDULES
| (a) | Documents filed as part of this Annual Report on Form 10-K: |
| 1) | All financial statements: |
125
| 2) | Financial statement schedules: |
Financial statement schedules are omitted because they are not applicable or the required information is shown in our Consolidated Financial Statements or the notes thereto.
| 3) | Exhibits: |
| Incorporated by Reference | Filed or Furnished | |||||||||||
|---|---|---|---|---|---|---|---|---|---|---|---|---|---|
Exhibit No |
| Exhibit Description |
| Form |
| SEC File No. |
| Exhibit |
| Filing Date |
| Herewith | |
2.1 | 8-K | 001-38228 | 2.1 | 12/30/2019 | |||||||||
3.1 | 8-K | 001-38228 | 3.1 | 1/2/19 | |||||||||
|
|
|
|
|
| ||||||||
3.2 | Second Amended and Restated Bylaws of Maxar Technologies Inc. | 8-K | 001-38228 | 3.1 | 10/29/20 |
| |||||||
|
|
|
|
|
|
| |||||||
4(vi)1 | Description of Securities Registered Pursuant to Section 12 of the Exchange Act | 10-K | 001-38228 | 4.1 | 2/24/2021 | ||||||||
4.1 | 6-K | 001-38228 | 10.1 | 10/16/17 |
| ||||||||
4.2 | 10-K | 001-38228 | 4.2 | 3/1/19 | |||||||||
4.3 | 6-K | 001-38228 | 99.2 | 12/21/18 | |||||||||
|
|
| |||||||||||
4.4 | 8-K | 001-38228 | 4.2 | 12/11/19 | |||||||||
4.5 | 10-K | 001-38226 | 4.5 | 3/2/20 | |||||||||
4.6 | 10-K | 001-38228 | 4.6 | 3/2/20 | |||||||||
126
| Incorporated by Reference | Filed or Furnished | |||||||||||
|---|---|---|---|---|---|---|---|---|---|---|---|---|---|
Exhibit No |
| Exhibit Description |
| Form |
| SEC File No. |
| Exhibit |
| Filing Date |
| Herewith | |
4.7 | 10-Q | 001-38228 | 4.2 | 8/5/20 | |||||||||
4.8 | 8-K | 001-38228 | 4.1 | 12/2/19 | |||||||||
4.9 | Supplemental Indenture No. 1, dated as of December 11, 2019 (Notes due 2023). | 8-K | 001-38228 | 4.1 | 12/11/19 | ||||||||
4.10 | Supplemental Indenture No. 2, dated as of May 21, 2020 (Notes due 2023). | 10-Q | 001-38228 | 4.1 | 8/5/20 | ||||||||
4.11 | 8-K | 001-38228 | 4.1 | 6/26/20 | |||||||||
10.1* | 10-Q | 001-38228 | 10.2 | 5/11/20 | |||||||||
10.2* | 8-K | 001-38228 | 10.12 | 1/2/19 | |||||||||
10.3.1* | 10-K | 001-38228 | 10.3.1 | 3/1/19 | |||||||||
10.3.2* | Amended and Restated Employment Agreement of Daniel Jablonsky. | 10-Q | 001-38228 | 10.1 | 5/11/20 | ||||||||
10.4* | S-8 | 333-220853 | 4.3 | 10/6/17 | |||||||||
10.4.1* | Amendment to the Maxar Technologies Ltd. Omnibus Equity Incentive Plan. | S-8 | 001-38228 | 4.3 | 5/15/18 | ||||||||
10.4.2* | Amendment to the Maxar Technologies Ltd. Omnibus Equity Incentive Plan. | S-8 | 333-219296 333-220853 333-224934 | 4.13 | 1/2/19 | ||||||||
10.4.3* | Form of LTIP Award Omnibus Equity Incentive Plan (U.S. Employees). | 10-K | 001-38228 | 10.4.3 | 3/1/19 | ||||||||
10.4.4* | Form of LTIP Award Omnibus Equity Incentive Plan (Canadian Employees). | 10-K | 00138228 | 10.4.4 | 3/1/19 | ||||||||
10.4.5* | Form of RSU Award Omnibus Equity Incentive Plan (U.S. Employees). | 10-K | 001-38228 | 10.4.5 | 3/1/19 | ||||||||
10.4.6* | Form of RSU Award Omnibus Equity Incentive Plan (Canadian Employees). | 10-K | 001-38228 | 10.4.6 | 3/1/19 | ||||||||
10.5* | S-8 | 333-220853 | 4.2 | 10/6/17 | |||||||||
127
| Incorporated by Reference | Filed or Furnished | |||||||||||
|---|---|---|---|---|---|---|---|---|---|---|---|---|---|
Exhibit No |
| Exhibit Description |
| Form |
| SEC File No. |
| Exhibit |
| Filing Date |
| Herewith | |
10.5.1* | Form of Restricted Share Unit Award Agreement Employee Stock Option Plan. | S-8 | 333-220853 | 4.5 | 10/6/17 | ||||||||
10.5.2* | S-8 | 333-220853 | 4.6 | 10/6/17 | |||||||||
10.5.3* | S-8 | 333-220853 | 4.7 | 10/6/17 | |||||||||
10.6* | MacDonald, Dettwiler and Associates Ltd. 2017 Long-Term Incentive Plan. | S-8 | 333-220853 | 4.4 | 10/6/17 | ||||||||
10.6.1* | Amendment to MacDonald, Dettwiler and Associates Ltd. 2017 Long-Term Incentive Plan. | S-8 | 333-219296 333-220853 333-224934 | 4.14 | 1/2/19 | ||||||||
10.7* | Form of Restricted Share Unit Award Agreement for Non-U.S. Grantees. | 10-Q | 001-34299 | 10.5 | 5/2/17 | ||||||||
10.8* | S-8 | 333-231296 | 4.3 | 5/8/19 | |||||||||
10.8.1* | 10-Q | 001-38228 | 10.4 | 5/9/19 | |||||||||
10.8.2* | 10-Q | 001-38228 | 10.5 | 5/9/19 | |||||||||
10.8.3* | 10-Q | 001-38228 | 10.6 | 5/9/19 | |||||||||
10.8.4* | Form of RSU Award Grant Notice – 1 year vesting – 2019 Plan. | 10-Q | 001-38228 | 10.7 | 5/9/19 | ||||||||
10.8.5* | 10-Q | 001-38228 | 10.8 | 5/9/19 | |||||||||
10.8.6* | 10-Q | 001-38228 | 10.9 | 5/9/19 | |||||||||
10.8.7* | First Amendment to the Maxar Technologies Inc. 2019 Incentive Award Plan. | 8-K | 001-38228 | 10.1 | 5/15/20 | ||||||||
10.8.8* | 10-Q | 001-38228 | 10.3 | 5/11/20 | |||||||||
10.8.9* | 10-Q | 001-38228 | 10.1 | 5/3/21 | |||||||||
128
| Incorporated by Reference | Filed or Furnished | |||||||||||
|---|---|---|---|---|---|---|---|---|---|---|---|---|---|
Exhibit No |
| Exhibit Description |
| Form |
| SEC File No. |
| Exhibit |
| Filing Date |
| Herewith | |
10.8.10* | Second Amendment to the Maxar Technologies Inc. 2019 Incentive Award Plan | 8-K | 001-38228 | 10.1 | 5/13/21 | ||||||||
10.9 | S-8 | 333-231296 | 4.4 | 5/8/19 | |||||||||
10.10# | F-4/A | 001-38228 | 10.4 | 6/2/17 | |||||||||
21.1 | X | ||||||||||||
23.1 | Consent of KPMG LLP, Independent Registered Public Accounting Firm. | X | |||||||||||
31.1 | X | ||||||||||||
31.2 | X | ||||||||||||
32.1 † | X | ||||||||||||
32.2 † | X | ||||||||||||
101+ | The following materials for the Maxar Technologies Inc. Annual Report on Form 10-K for the year ended December 31, 2021, formatted in Inline eXtensible Business Reporting Language (iXBRL): (i.) Audited Consolidated Statements of Operations (ii.) Audited Consolidated Balance Sheets (iii.) Audited Consolidated Statements of Cash Flows (iv.) Audited Consolidated Statements of Stockholders’ Equity and Statement of Comprehensive Income (Loss) (v.) Related notes, tagged or blocks of text | X | |||||||||||
129
| Incorporated by Reference | Filed or Furnished | |||||||||||
|---|---|---|---|---|---|---|---|---|---|---|---|---|---|
Exhibit No |
| Exhibit Description |
| Form |
| SEC File No. |
| Exhibit |
| Filing Date |
| Herewith | |
104 | Cover Page Interactive Data File (the cover page XBRL tags are embedded in the Inline XBRL document) | ||||||||||||
#Certain portions of this exhibit have been omitted by redacting a portion of the text. This exhibit has been filed separately with the U.S. Securities and Exchange Commission pursuant to a request for confidential treatment.
*Management contract or compensatory plan arrangement.
†Furnished herewith
+XBRL (eXtensible Business Reporting Language) Information is furnished and not filed or a part of a registration statement or prospectus for purposes of Sections 11 or 12 of the Securities Act of 1933, as amended, is deemed not filed for purposes of Section 18 of the Securities Exchange Act of 1934, as amended, and otherwise is not subject to liability under these sections.
ITEM 16.FORM 10-K SUMMARY
None.
130
SIGNATURES
Pursuant to the requirements of Section 13 or 15(d) of the Securities Exchange Act of 1934, the registrant has duly caused this report to be signed on its behalf by the undersigned, thereunto duly authorized.
February 22, 2022 | Maxar Technologies Inc. | ||
By: | /s/ Biggs C. Porter | ||
Biggs C. Porter | |||
Executive Vice President and Chief Financial Officer | |||
(Principal Financial Officer and Duly Authorized Officer) | |||
131
Pursuant to the requirements of the Securities Exchange Act of 1934, this report has been signed by the following persons in the capacities and on the dates indicated.
Signature |
| Title |
| Date |
/s/ Daniel L. Jablonsky | President and Chief Executive Officer | February 22, 2022 | ||
Daniel L. Jablonsky | (Principal Executive Officer), | |||
Director | ||||
/s/ Biggs C. Porter | Executive Vice President and Chief Financial Officer | February 22, 2022 | ||
Biggs C. Porter | (Principal Financial Officer) | |||
/s/ Carolyn K. Pittman | Senior Vice President and Chief Accounting Officer | February 22, 2022 | ||
Carolyn K. Pittman | (Principal Accounting Officer) | |||
/s/ General Howell M. Estes III | Director | February 22, 2022 | ||
General Howell M. Estes III | ||||
/s/ Nick S. Cyprus | Director | February 22, 2022 | ||
Nick S. Cyprus | ||||
/s/ Roxanne J. Decyk | Director | February 22, 2022 | ||
Roxanne J. Decyk | ||||
/s/ Joanne O. Isham | Director | February 22, 2022 | ||
Joanne O. Isham | ||||
/s/ General C. Robert Kehler | Director | February 22, 2022 | ||
General C. Robert Kehler | ||||
/s/ Gilman Louie | Director | February 22, 2022 | ||
Gilman Louie | ||||
/s/ Dr. L. Roger Mason, Jr. | Director | February 22, 2022 | ||
Dr. L. Roger Mason, Jr. | ||||
/s/ Dr. Heather A. Wilson | Director | February 22, 2022 | ||
Dr. Heather A. Wilson | ||||
/s/ Eric J. Zahler | Director | February 22, 2022 | ||
Eric J. Zahler | ||||
/s/ Eddy Zervigon | Director | February 22, 2022 | ||
Eddy Zervigon |
132
Similar companies
See also QUALCOMM INC/DE - Annual report 2024 (10-K 2024-09-29) Annual report 2025 (10-Q 2025-06-29)See also Motorola Solutions, Inc. - Annual report 2022 (10-K 2022-12-31) Annual report 2023 (10-Q 2023-09-30)
See also NOKIA CORP
See also ERICSSON LM TELEPHONE CO
See also Ubiquiti Inc. - Annual report 2023 (10-K 2023-06-30) Annual report 2023 (10-Q 2023-09-30)