| % |
| | | | | | | | | | | | | | | | | | | | | | | | | | |
| Systemwide sales increases/(decreases)* |
| | | | | | | | |
| | | | | | | Increase/(decrease)
excluding currency
translation |
| | 2023 | | 2022 | | 2023 | | 2022 |
| U.S. | | 9 | % | | 6 | % | | 9 | % | | 6 | % |
| International Operated Markets | | 11 | | | — | | | 10 | | | 11 | |
| International Developmental Licensed Markets & Corporate | | 9 | | | 10 | | | 12 | | | 21 | |
| Total | | 10 | % | | 5 | % | | 10 | % | | 11 | % |
*Unlike comparable sales, the Company has not excluded sales from hyperinflationary markets from Systemwide sales as these sales are the basis on which the Company calculates and records revenues.
Franchised sales are not recorded as revenues by the Company, but are the basis on which the Company calculates and records franchised revenues and are indicative of the financial health of the franchisee base. The following table presents franchised sales and the related increases/(decreases):
Franchised sales
| | | | | | | | | | | | | | | | | | | | | | | | | | | | | | | | | | | | | | | | | | | | | | | |
| | Amount | | Increase/(decrease) | | Increase/(decrease)
excluding currency
translation | |
| Dollars in millions | | 2023 | | 2022 | | 2021 | | 2023 | | 2022 | | 2023 | | 2022 | |
| U.S. | | $ | 49,914 | | | $ | 45,898 | | | $ | 43,344 | | | 9 | % | | 6 | % | | 9 | % | | 6 | % | |
| International Operated Markets | | 38,264 | | | 34,537 | | 33,097 | | 11 | | | 4 | | | 10 | | | 15 | | |
| International Developmental Licensed Markets & Corporate | | 31,572 | | 29,038 | | 26,234 | | 9 | | | 11 | | | 12 | | | 21 | | |
| Total | | $ | 119,750 | | | $ | 109,473 | | | $ | 102,675 | | | 9 | % | | 7 | % | | 10 | % | | 13 | % | |
| | | | | | | | | | | | | | | |
| Ownership type | | | | | | | | | | | | | | | |
| Conventional franchised | | $ | 87,809 | | | $ | 80,066 | | | $ | 75,956 | | | 10 | % | | 5 | % | | 10 | % | | 10 | % | |
| Developmental licensed | | 20,045 | | | 18,444 | | | 15,151 | | | 9 | | | 22 | | | 9 | | | 31 | | |
| Foreign affiliated | | 11,896 | | | 10,963 | | | 11,568 | | | 9 | | | (5) | | | 9 | | | 6 | | |
| Total | | $ | 119,750 | | | $ | 109,473 | | | $ | 102,675 | | | 9 | % | | 7 | % | | 10 | % | | 13 | % | |
McDonald's Corporation 2023 Annual Report 15
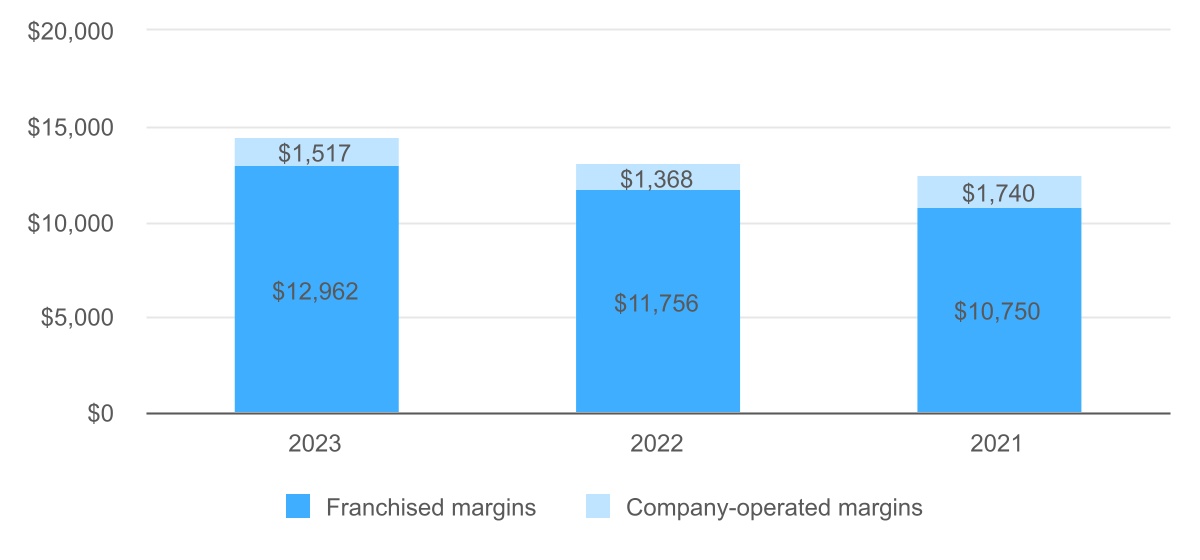
RESTAURANT MARGINS
Franchised restaurant margins are measured as revenues from franchised restaurants less franchised restaurant occupancy costs. Franchised revenues include rent and royalties based on a percent of sales, and initial fees. Franchised restaurant occupancy costs include lease expense and depreciation, as the Company generally owns or secures a long-term lease on the land and building for the restaurant location.
Company-operated restaurant margins are measured as sales from Company-operated restaurants less costs for food & paper, payroll & employee benefits and occupancy & other operating expenses necessary to run an individual restaurant. Company-operated margins exclude costs that are not allocated to individual restaurants, primarily payroll & employee benefit costs of non-restaurant support staff, which are included in Selling, general and administrative expenses.
Restaurant margins
| | | | | | | | | | | | | | | | | | | | | | | | | | | | | | | | | | | | | | | | | |
| | Amount | | Increase/(decrease) | | Increase/(decrease) excluding currency translation |
| Dollars in millions | 2023 | | 2022 | | 2021 | | 2023 | | 2022 | | 2023 | | 2022 |
| Franchised: | | | | | | | | | | | | | |
| U.S. | $ | 5,877 | | | $ | 5,341 | | | $ | 4,906 | | | 10 | % | | 9 | % | | 10 | % | | 9 | % |
| International Operated Markets | 5,379 | | | 4,900 | | | 4,516 | | | 10 | | | 8 | | | 9 | | | 20 | |
| International Developmental Licensed Markets & Corporate | 1,706 | | | 1,515 | | | 1,328 | | | 13 | | | 14 | | | 15 | | | 23 | |
| Total | $ | 12,962 | | | $ | 11,756 | | | $ | 10,750 | | | 10 | % | | 9 | % | | 10 | % | | 15 | % |
| Company-operated: | | | | | | | | | | | | | |
| U.S. | $ | 489 | | | $ | 429 | | | $ | 511 | | | 14 | % | | (16 | %) | | 14 | % | | (16 | %) |
| International Operated Markets | 995 | | | 913 | | | 1,208 | | | 9 | | | (24) | | | 9 | | | (17) | |
| International Developmental Licensed Markets & Corporate | n/m | | n/m | | n/m | | n/m | | n/m | | n/m | | n/m |
| Total | $ | 1,517 | | | $ | 1,368 | | | $ | 1,740 | | | 11 | % | | (21 | %) | | 11 | % | | (16 | %) |
| Total restaurant margins: | | | | | | | | | | | | | |
| U.S. | $ | 6,366 | | | $ | 5,770 | | | $ | 5,417 | | | 10 | % | | 7 | % | | 10 | % | | 7 | % |
| International Operated Markets | 6,374 | | | 5,813 | | | 5,724 | | | 10 | | | 2 | | | 9 | | | 12 | |
| International Developmental Licensed Markets & Corporate | n/m | | n/m | | n/m | | n/m | | n/m | | n/m | | n/m |
| Total | $ | 14,479 | | | $ | 13,124 | | | $ | 12,490 | | | 10 | % | | 5 | % | | 10 | % | | 11 | % |
n/m Not meaningful
In 2023, total restaurant margins increased 10% (10% in constant currencies), which reflected strong sales performance across all segments.
Franchised margins represented approximately 90% of restaurant margin dollars.
Company-operated margins in the U.S. and International Operated Markets segment reflected strong sales performance, with results partly offset by ongoing inflationary cost pressures. Results in the International Operated Markets segment were also partly offset by the impact of the Company's exit from Russia in the second quarter of 2022.
Total restaurant margins included $1,597 billion of depreciation and amortization expenses in 2023.
RESTAURANT MARGINS BY TYPE (In millions)
McDonald's Corporation 2023 Annual Report 16
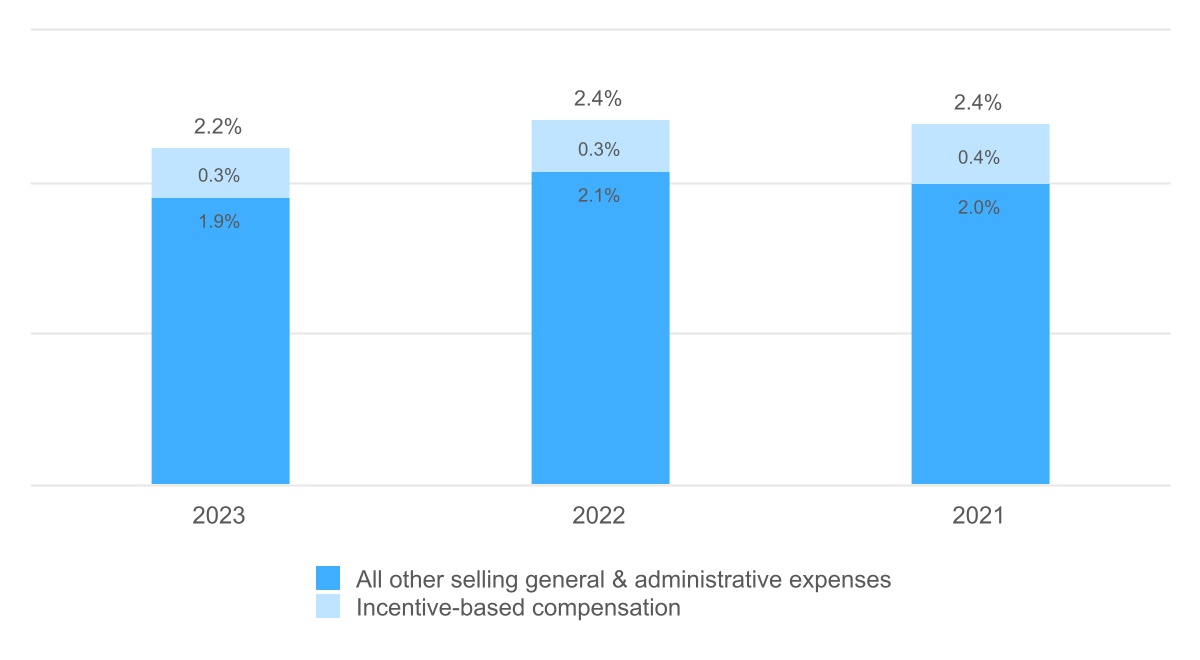
SELLING, GENERAL & ADMINISTRATIVE EXPENSES
Selling, general & administrative expenses
| | | | | | | | | | | | | | | | | | | | | | | | | | | | | | | | | | | | | | | | | | | | |
| | Amount | | Increase/(decrease) | | Increase/(decrease)
excluding currency
translation | |
| Dollars in millions | 2023 | | 2022 | | 2021 | | 2023 | | 2022 | | 2023 | | 2022 | |
| U.S. | $ | 661 | | | $ | 692 | | | $ | 696 | | | (5 | %) | | (1 | %) | | (5 | %) | | (1 | %) | |
International Operated Markets
| 635 | | | 629 | | | 692 | | | 1 | | | (9) | | | — | | | — | | |
International Developmental Licensed Markets & Corporate(1) | 1,521 | | | 1,541 | | | 1,320 | | | (1) | | | 17 | | | (1) | | | 17 | | |
| Total Selling, General & Administrative Expenses | $ | 2,817 | | | $ | 2,862 | | | $ | 2,708 | | | (2 | %) | | 6 | % | | (2 | %) | | 8 | % | |
| | | | | | | | | | | | | | |
Less: Incentive-Based Compensation(2) | 424 | | | 404 | | | 439 | | | 5 | | | (8) | | | 5 | | | (6 | %) | |
| Total Excluding Incentive-Based Compensation | $ | 2,393 | | | $ | 2,458 | | | $ | 2,269 | | | (3 | %) | | 8 | % | | (3 | %) | | 11 | % | |
(1)Includes corporate office support costs in areas such as facilities, finance, human resources, investments in strategic technology initiatives, legal, marketing, restaurant operations, supply chain and training.
(2)Includes all cash incentives and share-based compensation expense.
In 2023, consolidated selling, general and administrative expenses decreased 2% (2% in constant currencies), reflecting lower employee costs as a result of Accelerating the Organization and the comparison to prior year costs related to the 2022 Worldwide Owner/Operator convention and proxy contest. These results were partly offset by investments in digital and technology under our Accelerating the Arches strategy in the current year.
Management believes that analyzing selling, general and administrative expenses as a percent of Systemwide sales is meaningful because these costs are incurred to support the overall McDonald's business.
SELLING, GENERAL & ADMINISTRATIVE EXPENSES AS A PERCENT OF SYSTEMWIDE SALES
McDonald's Corporation 2023 Annual Report 17
OTHER OPERATING (INCOME) EXPENSE, NET
Other operating (income) expense, net
| | | | | | | | | | | | | | | | | |
| In millions | 2023 | | 2022 | | 2021 |
| Gains on sales of restaurant businesses | $ | (103) | | | $ | (60) | | | $ | (96) | |
| Equity in earnings of unconsolidated affiliates | (153) | | | (113) | | | (177) | |
| Asset dispositions and other (income) expense, net | (7) | | | 137 | | | 75 | |
| Impairment and other charges (gains), net | 362 | | | 1,010 | | | (285) | |
| Total | $ | 99 | | | $ | 974 | | | $ | (483) | |
•Gains on sales of restaurant businesses
In 2023, gains on sales of restaurant businesses increased primarily due to an increased number of restaurants sold to franchisees in the International Operated Markets segment.
•Equity in earnings of unconsolidated affiliates
In 2023, equity in earnings of unconsolidated affiliates increased primarily due to recovery from the impact of COVID-19 in China in the prior year.
•Asset dispositions and other (income) expense, net
Asset dispositions and other (income) expense, net reflected higher property sale gains and the comparison to prior year costs incurred to support the Company's business in Ukraine and higher asset write-offs.
•Impairment and other charges (gains), net
In 2023, impairment and other charges (gains), net reflected $72 million of pre-tax charges related to the write-off of impaired software no longer in use and pre-tax charges of $290 million related to the Company's Accelerating the Arches growth strategy
◦The Company incurred $250 million of restructuring costs associated with Accelerating the Organization, the Company’s internal effort to modernize ways of working
◦The Company incurred $40 million of accelerated restaurant closing charges, representing expenses associated with the Lease Right of Use Asset and fixed asset write-offs
Results in 2022 reflected $1,281 million of pre-tax charges related to the sale of the Company's business in Russia and a pre-tax gain of $271 million related to the Company's sale of its Dynamic Yield business.
OPERATING INCOME
Operating income
| | | | | | | | | | | | | | | | | | | | | | | | | | | | | | | | | | | | | | | | | |
| | Amount | | Increase/(decrease) | | Increase/(decrease) excluding currency translation |
| Dollars in millions | 2023 | | 2022 | | 2021 | | 2023 | | 2022 | | 2023 | | 2022 |
| U.S. | $ | 5,694 | | | $5,136 | | $4,755 | | 11 | % | | 8 | % | | 11 | % | | 8 | % |
| International Operated Markets | 5,832 | | 3,926 | | 5,130 | | 49 | | | (23) | | | 47 | | | (13) | |
| International Developmental Licensed Markets & Corporate | 121 | | 309 | | 471 | | (61) | | | (34) | | | (47) | | | (5) | |
| Total | $ | 11,647 | | | $9,371 | | $ | 10,356 | | | 24 | % | | (10 | %) | | 24 | % | | (3 | %) |
| | | | | $ | (483) | | | | | | | | | |
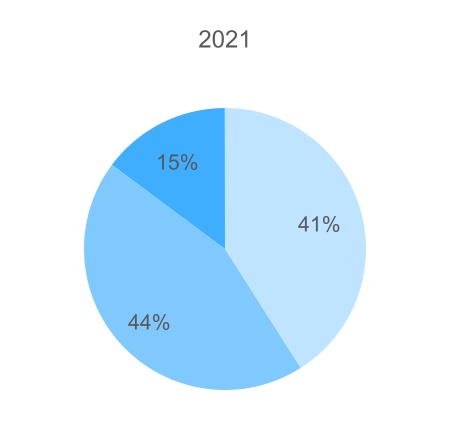
| Operating margin | 45.7 | % | 40.4 | % | 44.6 | % | | | | | | | |
| | | | | | | | | | | | | |
Operating income reconciliation*
| | | | | | | | | | | | | | | | | | | | | | | |
| | Amount | | Increase/(decrease) | Increase/(decrease) excluding currency translation |
| Dollars in millions | 2023 | | 2022 | | 2023 | | 2023 |
| GAAP operating income | $ | 11,647 | | | $ | 9,371 | | | 24 | % | | 24 | % |
| (Gains)/charges | 362 | | | — | | | | | |
| Russia sale charge | — | | | 1,281 | | | | | |
| Dynamic Yield sale gain | — | | | (271) | | | | | |
| Non-GAAP operating income | $ | 12,009 | | | $ | 10,381 | | | 16 | % | | 16 | % |
| | | | | | | |
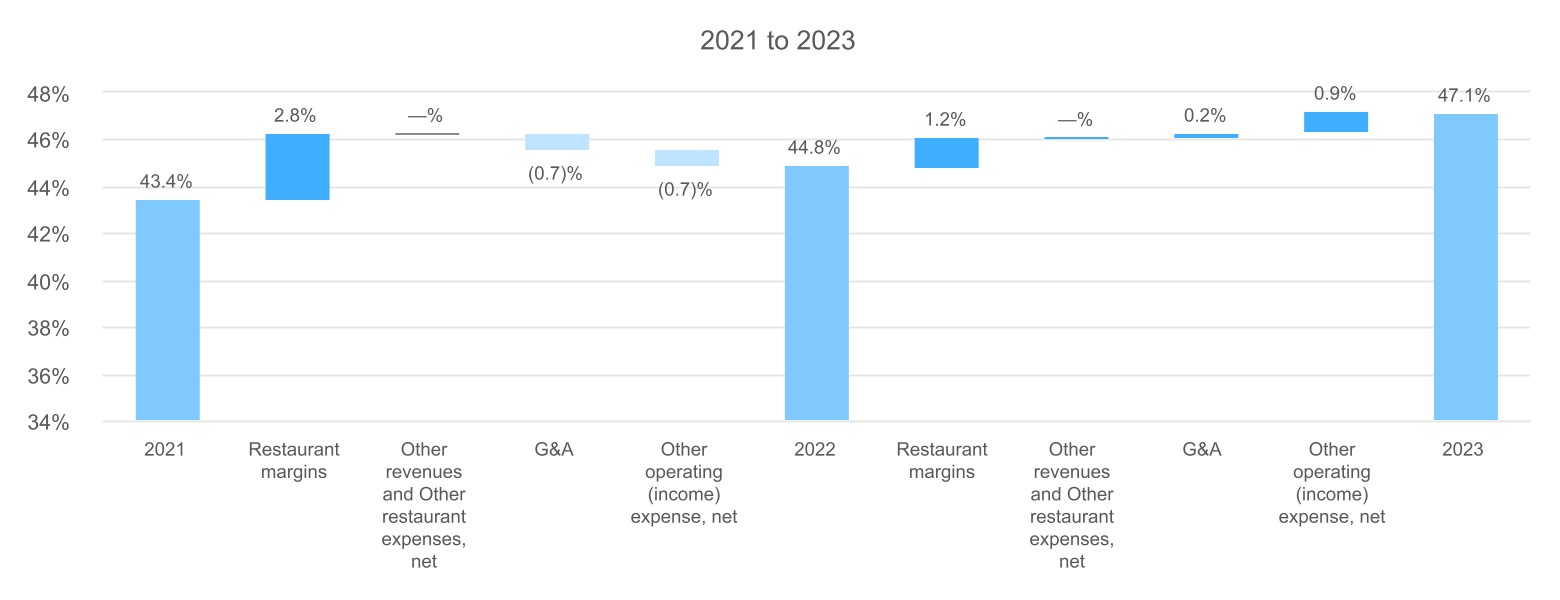
| Non-GAAP operating margin | 47.1 | | % | 44.8 | | % | | | |
| | | | | | | |
*Refer to the Impairment and other charges (gains), net line within the Other Operating (Income) Expense, Net section above for details of the gains and charges in this table.
•Operating Income: Operating income increased 24% (24% in constant currencies). Excluding the current year and prior year items in the table above, operating income increased 16% (16% in constant currencies) for 2023. Positive operating results across all segments were primarily due to strong sales-driven growth in Franchised margins.
McDonald's Corporation 2023 Annual Report 18
•Operating margin: Operating margin is defined as operating income as a percent of total revenues. The contributions to operating margin differ by segment due to each segment's ownership structure, primarily due to the relative percentage of franchised versus Company-operated restaurants. Additionally, temporary restaurant closures, which vary by segment, impact the contribution of each segment to the consolidated operating margin.
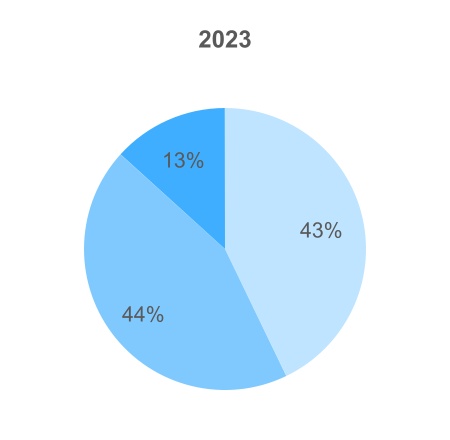
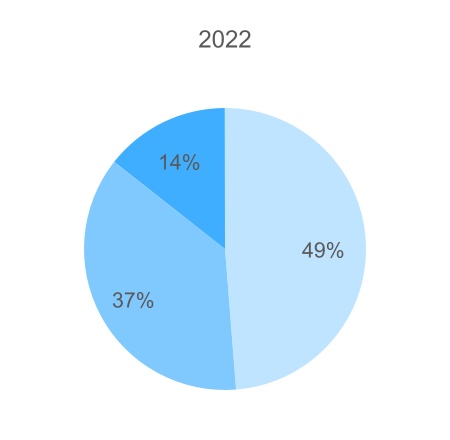
OPERATING INCOME BY SEGMENT*
| | | | | | | | | | | |
| | U.S. | |
| | | |
| | International Operated Markets | |
| | | |
| | International Developmental Licensed Markets & Corporate* | |
*The IDL segment data in this graphic excludes Corporate activities, which is a Non-GAAP presentation.
NON-GAAP OPERATING MARGIN PERCENT ROLL-FORWARD*
*Refer to the Operating Income section on page 18 in this Form 10-K for details regarding operating margin percent for 2023 and 2022.
McDonald's Corporation 2023 Annual Report 19
INTEREST EXPENSE
Interest expense increased 13% (13% in constant currencies) and 2% (4% in constant currencies) in 2023 and 2022, respectively. Results in 2023 reflected higher average debt balances and higher average interest rates.
NONOPERATING (INCOME) EXPENSE, NET
Nonoperating (income) expense, net
| | | | | | | | | | | | | | | | | | | | |
| In millions | 2023 | 2022 | 2021 |
| Interest income | | $ | (186) | | | $ | (44) | | | $ | (9) | |
| Foreign currency and hedging activity | | (19) | | | (134) | | | 37 | |
| Other expense | | (31) | | | 517 | | | 14 | |
| Total | | $ | (236) | | | $ | 339 | | | $ | 42 | |
In 2023, Interest income increased due to higher average interest rates.
Foreign currency and hedging activity includes net gains or losses on certain hedges that reduce the exposure to variability on certain intercompany foreign currency cash flow streams.
In 2022, Other (income) expense, net included $537 million of nonoperating expense related to the settlement of a tax audit in France.
PROVISION FOR INCOME TAXES
In 2023 and 2022, the reported effective income tax rates were 19.5% and 21.1%, respectively.
Results for 2022 reflected $239 million of net tax benefits related to the sale of the Company’s Russia and Dynamic Yield businesses and the unfavorable impact of the non-deductible $537 million of nonoperating expense related to the settlement of a tax audit in France. Excluding these items, the effective tax rate was 20.1% for the year ended 2022.
Consolidated deferred tax assets, net of valuation allowance, was $6.9 billion in 2023 and $6.1 billion in 2022. Substantially all of the net tax assets are expected to be realized in the U.S. and other profitable markets.
As of December 31, 2023, numerous countries have enacted the Organization of Economic Corporation and Development’s framework on a global minimum tax (referred to as “Pillar 2”), with the earliest effective date for taxable years beginning after December 31, 2023. While the Company does not expect this enactment will have a material impact on the consolidated financial statements, we will continue to evaluate and monitor as additional guidance and clarification becomes available.
RECENTLY ISSUED ACCOUNTING PRONOUNCEMENTS
Recently issued accounting pronouncements are included on page 43 of this Form 10-K.
CASH FLOWS
The Company has a long history of generating significant cash from operations and has substantial credit capacity to fund operating and discretionary spending to invest in opportunities to grow the business, such as restaurant development, in addition to funding debt service payments, dividends and share repurchases.
Cash provided by operations totaled $9.6 billion in 2023, an increase of $2.2 billion or 30%. Free cash flow was $7.3 billion in 2023, an increase of $1.8 billion or 32%. The Company’s free cash flow conversion rate was 86% in 2023 and 89% in 2022. Cash provided by operations increased in 2023 compared to 2022 primarily due to improved operating results.
Cash used for investing activities totaled $3.2 billion in 2023, an increase of $506 million compared with 2022. The increase was primarily due to higher capital expenditures as a result of the addition of Restaurant Development to the Company’s growth pillars under our Accelerating the Arches strategy.
Cash used for financing activities totaled $4.4 billion in 2023, a decrease of $2.2 billion compared with 2022. The decrease was primarily due to increased bond issuances in the current year.
The Company’s cash and equivalents balance was $4.6 billion and $2.6 billion at year end 2023 and 2022, respectively. In addition to cash and equivalents on hand and cash provided by operations, the Company can meet short-term funding needs through its continued access to commercial paper borrowings and line of credit agreements.
McDonald's Corporation 2023 Annual Report 20
RESTAURANT DEVELOPMENT AND CAPITAL EXPENDITURES
In 2023, the Company opened 2,067 restaurants and closed 520 restaurants. In 2022, the Company opened 1,576 restaurants and closed 1,332 restaurants. The increase in openings in 2023 is a result of the addition of Restaurant Development to the Company's growth pillars under our Accelerating the Arches Strategy. The significant number of closures in 2022 was primarily due to the closure of 855 restaurants as a result of the sale of the Company's business in Russia.
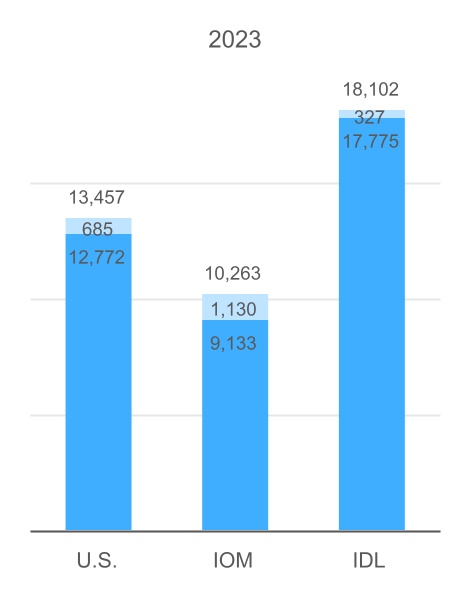
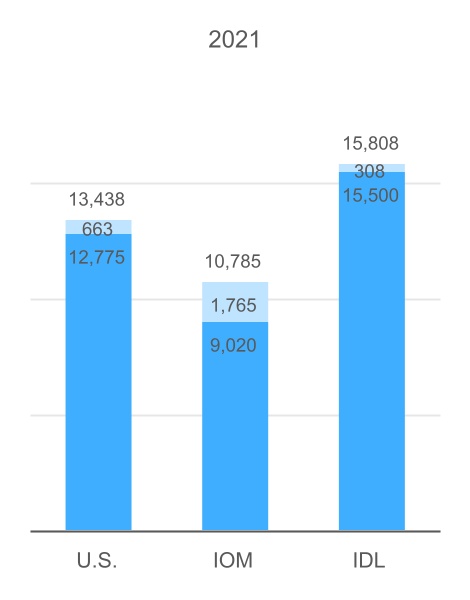
Systemwide restaurants at year end
| | | | | | | | | | | | | | | | | |
| 2023 | | 2022 | | 2021 |
| U.S. | 13,457 | | | 13,444 | | | 13,438 | |
| International Operated Markets | 10,263 | | | 10,103 | | | 10,785 | |
| International Developmental Licensed Markets & Corporate | 18,102 | | | 16,728 | | | 15,808 | |
| Total | 41,822 | | | 40,275 | | | 40,031 | |
RESTAURANTS BY OWNERSHIP TYPE
| | | | | | | | | | | | | | | | | |
| | Franchised restaurants | | Company-operated restaurants | |
Approximately 95% of the restaurants at year-end 2023 were franchised, including 95% in the U.S., 89% in International Operated Markets and 98% in the International Developmental Licensed Markets.
Capital expenditures increased $458 million or 24% in 2023 primarily due to increased investment in restaurant openings as a result of the addition of Restaurant Development to the Company's growth pillars under our Accelerating the Arches Strategy.
McDonald's Corporation 2023 Annual Report 21
CAPITAL EXPENDITURES BY TYPE (In millions)
* Primarily corporate equipment and other office-related expenditures.
New restaurant investments in all years presented were concentrated in markets with strong returns and/or opportunities for long-term growth. Average development costs vary widely by market depending on the types of restaurants built and the real estate and construction costs within each market. These costs, which include land, buildings and equipment, are managed through the use of optimally-sized restaurants, construction and design efficiencies, as well as leveraging the Company's global sourcing network and best practices.
As of December 31, 2023 and 2022, the Company owned approximately 57% of the land and approximately 80% of the buildings for restaurants in its consolidated markets.
SHARE REPURCHASES AND DIVIDENDS
In 2023, the Company returned approximately $7.6 billion to shareholders through a combination of dividends paid and shares repurchased.
Shares repurchased and dividends
| | | | | | | | | | | | | | | | | |
| In millions, except per share data | 2023 | | 2022 | | 2021 |
| Number of shares repurchased | 11.1 | | | 15.8 | | | 3.4 | |
| Shares outstanding at year end | 723 | | | 731 | | | 745 | |
| Dividends declared per share | $ | 6.23 | | | $ | 5.66 | | | $ | 5.25 | |
Treasury stock purchases (in Shareholders' equity) | $ | 3,105 | | | $ | 3,896 | | | $ | 846 | |
| Dividends paid | 4,533 | | | 4,168 | | | 3,919 | |
| Total returned to shareholders | $ | 7,638 | | | $ | 8,064 | | | $ | 4,765 | |
In December 2019, the Company's Board of Directors approved a share repurchase program, effective January 1, 2020, that authorized the purchase of up to $15 billion of the Company's outstanding stock, with no specified expiration date. In 2023, approximately 11.1 million shares were repurchased for $3.1 billion, bringing total purchases under the program to approximately 34.6 million shares or $8.7 billion.
The Company has paid dividends on its common stock for 48 consecutive years and has increased the dividend amount every year. The 2023 full year dividend of $6.23 per share reflects the quarterly dividend paid for each of the first three quarters of $1.52 per share, with an increase to $1.67 per share paid in the fourth quarter. This 10% increase in the quarterly dividend equates to a $6.68 per share annual dividend and reflects the Company’s confidence in the ongoing strength and reliability of its cash flow. As in the past, future dividend amounts will be considered after reviewing profitability expectations and financing needs, and will be declared at the discretion of the Company’s Board of Directors.
McDonald's Corporation 2023 Annual Report 22
FINANCIAL POSITION AND CAPITAL RESOURCES
TOTAL ASSETS AND RETURN
Total assets increased $5.7 billion or 11% in 2023, primarily due to an increase in Cash and equivalents driven by higher cash from operations, as well as increased net debt issuances and decreased treasury stock purchases. Net property and equipment increased $1.1 billion in 2023, primarily due to increased capital expenditures as a result of the addition of Restaurant Development to the Company's growth pillars under our Accelerating the Arches strategy. Net property and equipment and the Lease right-of-use asset, net represented approximately 44% and approximately 24%, respectively, of total assets at year-end. Approximately 83% of total assets were in the U.S. and International Operated Markets at year-end 2023.
The Company’s after-tax ROIC from continuing operations is a metric that management believes measures capital-allocation effectiveness over time and was 25.2%, 22.6% and 21.5% as of December 31, 2023, 2022 and 2021, respectively. Refer to the reconciliation in Exhibit 99.1 to this Form 10-K.
FINANCING AND MARKET RISK
The Company generally borrows on a long-term basis and is exposed to the impact of interest rate changes and foreign currency fluctuations. Debt obligations at December 31, 2023 totaled $39.3 billion, compared with $35.9 billion at December 31, 2022. The net increase in 2023 was primarily due to net issuances of $3.0 billion and the impact of changes in exchange rates on foreign currency denominated debt of $432 million.
Debt highlights(1)
| | | | | | | | | | | | | | | | | |
| 2023 | | 2022 | | 2021 |
Fixed-rate debt as a percent of total debt(2,3) | 96 | % | | 96 | % | | 95 | % |
Weighted-average annual interest rate of total debt(3) | 3.7 | | | 3.5 | | | 3.2 | |
Foreign currency-denominated debt as a percent of total debt(2) | 38 | | | 36 | | | 36 | |
Total debt as a percent of total capitalization (total debt and total Shareholders' equity)(2) | 114 | | | 120 | | | 115 | |
Cash provided by operations as a percent of total debt(2) | 24 | | | 20 | | | 26 | |
(1)All percentages are as of December 31, except for the weighted-average annual interest rate, which is for the year. See reconciliation in Exhibit 99.1.
(2)Based on debt obligations before the effects of fair value hedging adjustments and deferred debt costs. These effects are excluded as they have no impact on the obligation at maturity. See the Debt Financing footnote on page 58 of this Form 10-K. (3)Includes the effect of interest rate swaps used to hedge debt.
Standard & Poor's and Moody's currently rate the Company’s commercial paper A-2 and P-2, respectively, and its long-term debt BBB+ and Baa1, respectively. To access the debt capital markets, the Company relies on credit-rating agencies to assign short-term and long-term credit ratings.
Certain of the Company’s debt obligations contain cross-acceleration provisions and restrictions on Company and subsidiary mortgages and the long-term debt of certain subsidiaries. There are no provisions in the Company’s debt obligations that would accelerate repayment of debt as a result of a change in credit ratings or a material adverse change in the Company’s business. In December 2022, the Company's Board of Directors authorized $15 billion of borrowing capacity with no specified expiration date, of which $9.7 billion remained outstanding as of December 31, 2023. These borrowings may include (i) public or private offering of debt securities; (ii) direct borrowing from banks or other financial institutions; and (iii) other forms of indebtedness. In addition to debt securities available through a medium-term notes program registered with the SEC and a Global Medium-Term Notes program, the Company is authorized to issue up to $5.0 billion of commercial paper, and has $4.0 billion available under a committed line of credit agreement (see the Debt Financing footnote on page 58 of this Form 10-K). As of December 31, 2023, the Company's subsidiaries also had $122.0 million of borrowings outstanding, primarily under uncommitted foreign currency line of credit agreements. The Company uses major capital markets, bank financings and derivatives to meet its financing requirements. The Company manages its debt portfolio in response to changes in interest rates and foreign currency rates by periodically retiring, redeeming and repurchasing debt, terminating swaps and using derivatives. The Company does not hold or issue derivatives for trading purposes. All swaps are over-the-counter instruments.
In managing the impact of interest rate changes and foreign currency fluctuations, the Company uses interest rate swaps and finances in the currencies in which assets are denominated. The Company uses foreign currency debt and derivatives to hedge the foreign currency risk associated with certain royalties, intercompany financings and long-term investments in foreign subsidiaries and affiliates. This reduces the impact of fluctuating foreign currencies on cash flows and shareholders’ equity. Total foreign currency-denominated debt was $15.1 billion and $13.0 billion for the years ended December 31, 2023 and 2022, respectively. In addition, where practical, the Company’s restaurants purchase goods and services in local currencies resulting in natural hedges. See the Summary of significant accounting policies footnote related to financial instruments and hedging activities on page 46 of this Form 10-K for additional information regarding the accounting impact and use of derivatives. The Company does not have significant exposure to any individual counterparty and has master agreements that contain netting arrangements. Certain of these agreements also require each party to post collateral if credit ratings fall below, or aggregate exposures exceed, certain contractual limits. At December 31, 2023, the Company was required to post $82.8 million of collateral due to the negative fair value of certain derivative positions. The Company's counterparties were not required to post collateral on any derivative position, other than on certain hedges of the Company’s supplemental benefit plan liabilities where the counterparties were required to post collateral on their liability positions.
McDonald's Corporation 2023 Annual Report 23
The Company’s net asset exposure is diversified among a broad basket of currencies. The Company’s largest net asset exposures (defined as foreign currency assets less foreign currency liabilities) at year end were as follows:
Foreign currency net asset exposures
| | | | | | | | | | | |
| In millions of U.S. Dollars | 2023 | | 2022 |
| British Pounds Sterling | $ | 1,080 | | | $ | 1,167 | |
| Australian Dollars | 1,015 | | | 884 | |
| Canadian Dollars | 703 | | | 575 |
| Polish Zloty | 571 | | | 444 |
| New Zealand Dollars | 238 | | | 275 |
The Company prepared sensitivity analyses of its financial instruments to determine the impact of hypothetical changes in interest rates and foreign currency exchange rates on the Company’s results of operations, cash flows and the fair value of its financial instruments. The interest rate analysis assumed a one percentage point adverse change in interest rates on all financial instruments, but did not consider the effects of the reduced level of economic activity that could exist in such an environment. The foreign currency rate analysis assumed that each foreign currency rate would change by 10% in the same direction relative to the U.S. Dollar on all financial instruments; however, the analysis did not include the potential impact on revenues, local currency prices or the effect of fluctuating currencies on the Company’s anticipated foreign currency royalties and other payments received from the markets. Based on the results of these analyses of the Company’s financial instruments, neither a one percentage point adverse change in interest rates from 2023 levels nor a 10% adverse change in foreign currency rates from 2023 levels would materially affect the Company’s results of operations, cash flows or the fair value of its financial instruments.
LIQUIDITY AND USES OF CASH
The Company generates significant cash from operations and expects available cash and cash equivalents, future operating cash flows and its ability to issue debt to be sufficient to finance its foreseeable operating needs and other cash requirements.
Consistent with prior years, the Company expects existing domestic cash and equivalents, domestic cash flows from operations, the ability to issue domestic debt and repatriation of a portion of foreign earnings to continue to be sufficient to fund its domestic operating, investing and financing activities. The Company also continues to expect existing foreign cash and equivalents and foreign cash flows from operations to be sufficient to fund its foreign operating, investing and financing activities. In the future, should more capital be required to fund activities in the U.S. than is generated by domestic operations and is available through the issuance of domestic debt, the Company could elect to repatriate a greater portion of future periods' earnings from foreign jurisdictions.
The Company has significant operations outside the U.S. where it earns approximately 65% of its operating income. A significant portion of these historical earnings have been reinvested in foreign jurisdictions where the Company has made, and will continue to make, substantial investments to support the ongoing development and growth of its international operations.
Sources of Liquidity
The Company has long-term revenue and cash flow streams that relate to its franchise arrangements. Minimum rent payments under franchise arrangements are based on the Company’s underlying investment in owned sites and parallel the Company’s underlying lease obligations and escalations on properties that are leased. The Company believes that control over the real estate enables it to achieve restaurant performance levels that are among the highest in the industry. Refer to the Franchise Arrangements footnote on page 50 of this Form 10-K for additional information on future gross minimum payments due to the Company under existing conventional franchise arrangements. Additionally, the Company is authorized to utilize up to $15 billion of borrowing capacity in various forms by the Board of Directors, of which $9.7 billion remained outstanding as of December 31, 2023. The Company is also authorized to issue up to $5.0 billion of commercial paper, and has $4.0 billion available under a committed line of credit agreement. Refer to the Financing and Market Risk section on page 58 of this Form 10-K. Material Cash Requirements and Uses of Cash
Material cash requirements primarily consist of lease obligations (related to both Company-operated and franchised restaurants) and debt obligations. Refer to the Leasing Arrangements footnote on page 51 and the Debt Financing footnote on page 58 of this Form 10-K for more information. The Company also records liabilities related to supplemental benefit plans maintained in the U.S. as well as liabilities for gross unrecognized tax benefits on certain tax positions. Details related to these obligations are provided in the Employee Benefit Plan footnote on page 57 and the Income Taxes footnote on page 55 of this Form 10-K. The Company contracts with vendors and suppliers in the normal course of business. These contracts may include items related to construction projects, inventory, energy, marketing, technology and other services. Generally, these items are shorter term in nature and have no minimum payment requirements. These expenses, along with other standard operating expenses incurred, are funded from operating cash flows and reflected in other areas of this Form 10-K (e.g., franchised margins, Company-operated margins and selling, general & administrative expenses that are reflected in the Consolidated Statement of Income and capital expenditures that are reflected on the Consolidated Statement of Cash Flows).
Additionally, the Company has guaranteed certain loans totaling approximately $193 million at December 31, 2023. These guarantees are contingent commitments generally issued by the Company to support borrowing arrangements of the System. At December 31, 2023, there was no carrying value for obligations under these guarantees in the Consolidated Balance Sheet.
McDonald's Corporation 2023 Annual Report 24
OTHER MATTERS
CRITICAL ACCOUNTING POLICIES AND ESTIMATES
Management’s Discussion and Analysis of Financial Condition and Results of Operations is based upon the Company’s consolidated financial statements, which have been prepared in accordance with accounting principles generally accepted in the U.S. The preparation of these financial statements requires the Company to make estimates and judgments that affect the reported amounts of assets, liabilities, revenues and expenses as well as related disclosures. On an ongoing basis, the Company evaluates its estimates and judgments based on historical experience and various other factors that are believed to be reasonable under the circumstances. Actual results may differ from these estimates.
The Company reviews its financial reporting and disclosure practices and accounting policies quarterly to confirm that they provide accurate and transparent information relative to the current economic and business environment. The Company believes that of its significant accounting policies, the following involve a higher degree of judgment and/or complexity:
•Property and equipment
Property and equipment are depreciated or amortized on a straight-line basis over their useful lives based on management’s estimates of the period over which the assets will generate revenue (not to exceed lease term plus options for leased property). The useful lives are estimated based on historical experience with similar assets, taking into account anticipated technological or other changes. Refer to the Property and Equipment section in the Summary of Significant Accounting Policies footnote on page 44 of this Form 10-K and the Property and Equipment footnote on page 50 of this Form 10-K for additional information. •Leasing Arrangements
The Lease right-of-use asset and Lease liability include an assumption on renewal options that have not yet been exercised by the Company. The Company also uses an incremental borrowing rate in calculating the Lease liability that represents an estimate of the interest rate the Company would incur to borrow on a collateralized basis over the term of a lease within a particular currency environment. Refer to the Leasing section in the Summary of Significant Accounting Policies footnote on page 44 of this Form 10-K and the Leasing Arrangements footnote on page 51 of this Form 10-K for additional information. •Long-lived assets impairment review
Long-lived assets are reviewed for impairment annually. If qualitative indicators of impairment are present, such as changes in global and local business and economic conditions, operating costs, inflation, competition, and consumer and demographic trends, the Company will use these and other factors in estimating future cash flows when testing for the recoverability of its long-lived assets. Estimates of future cash flows are highly subjective judgements based on the Company’s experience and knowledge of its operations. A key assumption impacting estimated future cash flows is the estimated change in comparable sales. If the Company’s estimates or underlying assumptions change in the future, it may be required to record impairment charges. Refer to the Long-lived Assets section in the Summary of Significant Accounting Policies footnote on page 44 of this Form 10-K for additional information. •Litigation accruals
In the ordinary course of business, the Company is subject to proceedings, lawsuits and other claims primarily related to competitors, customers, employees, franchisees, government agencies, intellectual property, shareholders and suppliers. The Company is required to assess the likelihood of any adverse judgments or outcomes to these matters as well as potential ranges of probable losses. Refer to the Contingencies footnote on page 53 of this Form 10-K for additional information. •Income taxes
The Company records a valuation allowance to reduce its deferred tax assets if it is considered more likely than not that some portion or all of the deferred tax assets will not be realized.
The Company operates within, and is subject to audit in, multiple taxing jurisdictions. The Company records accruals for the estimated outcomes of these audits, and the accruals may change in the future due to new developments in each matter.
Refer to the Income Taxes section in the Summary of Significant Accounting Policies footnote on page 45 of this Form 10-K and the Income Taxes footnote on page 55 of this Form 10-K for additional information.
EFFECTS OF CHANGING PRICES — INFLATION
As broader inflationary pressures in the economy begin to ease, the restaurant industry is expected to experience some relief in supply chain and other cost challenges. Although the challenges of an inflationary environment may still exist, the Company has demonstrated an ability to manage these inflationary cost increases effectively through its rapid inventory turnover, ability to adjust menu prices, cost controls and substantial property holdings, many of which are at fixed costs.
McDonald's Corporation 2023 Annual Report 25
STOCK PERFORMANCE GRAPH
At least annually, McDonald's considers which companies comprise a readily identifiable investment peer group. The Company is included in published restaurant indices; however, unlike most other companies included in these indices, which have no or limited international operations, McDonald's does business in more than 100 countries and a substantial portion of its revenues and income is generated outside the U.S. In addition, because of its size, McDonald's inclusion in those indices tends to skew the results. Therefore, the Company believes that such a comparison is not meaningful.
The Company's market capitalization, trading volume and importance in an industry that is vital to the U.S. economy have resulted in McDonald's inclusion in the Dow Jones Industrial Average ("DJIA") since 1985. Like McDonald's, many DJIA companies generate meaningful revenues and income outside the U.S. and some manage global brands. Thus, the Company believes that the use of the DJIA companies as the group for comparison purposes is appropriate.
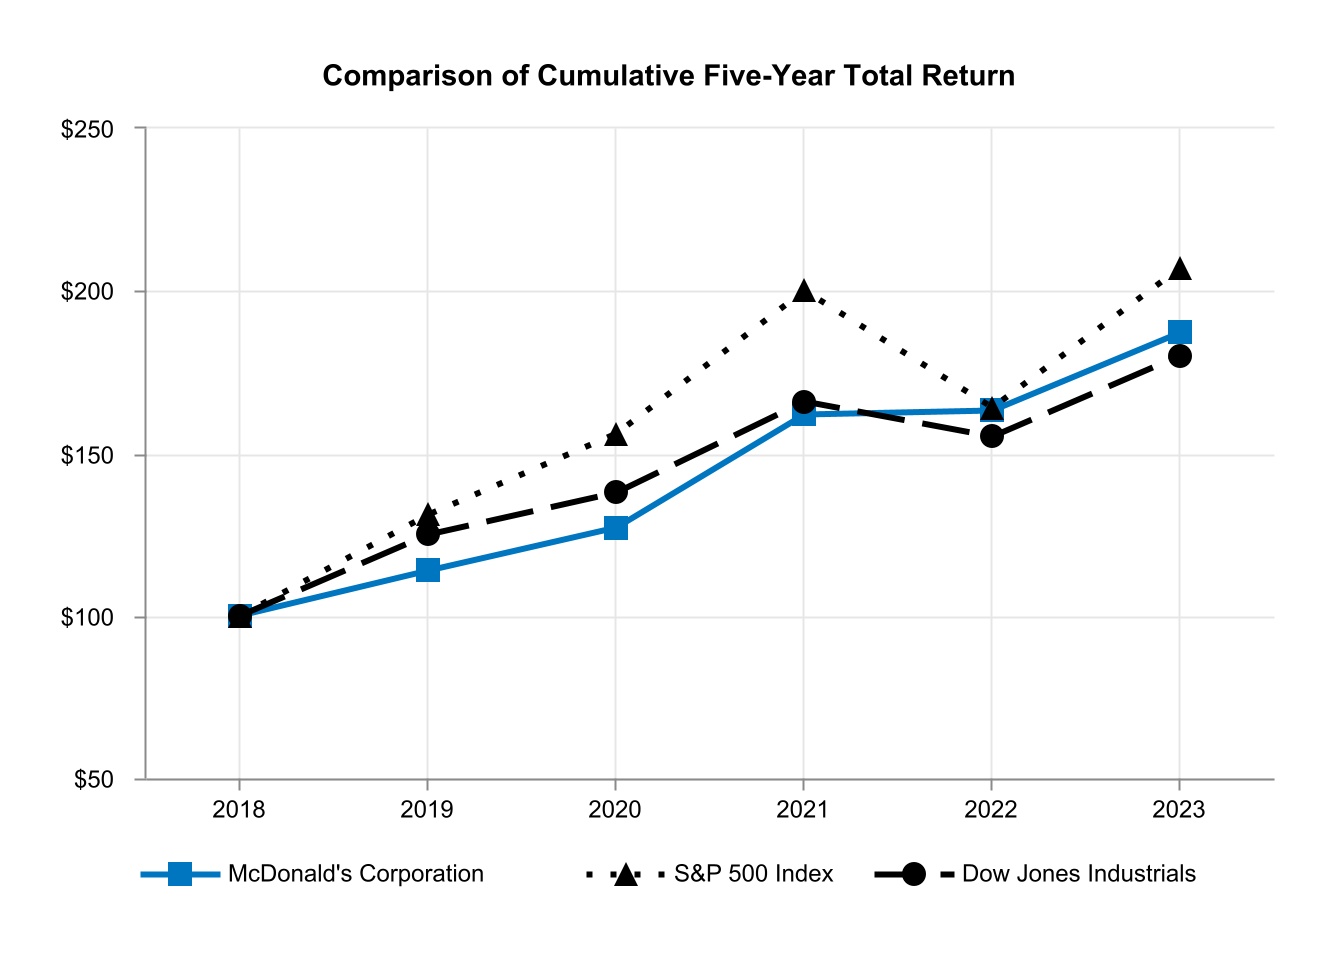
The following performance graph shows McDonald's cumulative total shareholder returns (i.e., price appreciation and reinvestment of dividends) relative to the Standard & Poor's 500 Stock Index ("S&P 500 Index") and to the DJIA companies for the five-year period ended December 31, 2023. The graph assumes that the value of an investment in McDonald's common stock, the S&P 500 Index and the DJIA companies (including McDonald's) was $100 at December 31, 2018. For the DJIA companies, returns are weighted for market capitalization as of the beginning of each period indicated. These returns may vary from those of the DJIA Index, which is not weighted by market capitalization and may be composed of different companies during the period under consideration.
| | | | | | | | | | | | | | | | | | | | |
| Company/Index | 12/31/2018 | 12/31/2019 | 12/31/2020 | 12/31/2021 | 12/31/2022 | 12/31/2023 |
| McDonald's Corporation | $100 | $114 | $127 | $162 | $163 | $187 |
| S&P 500 Index | $100 | $131 | $156 | $200 | $164 | $207 |
| Dow Jones Industrials | $100 | $125 | $138 | $166 | $155 | $180 |
Source: S&P Capital IQ
McDonald's Corporation 2023 Annual Report 26
MARKET FOR REGISTRANT'S COMMON EQUITY, RELATED STOCKHOLDER MATTERS AND ISSUER PURCHASES OF EQUITY SECURITIES
MARKET INFORMATION AND DIVIDEND POLICY
The Company’s common stock trades under the symbol MCD and is listed on the New York Stock Exchange in the U.S.
The number of shareholders of record and beneficial owners of the Company’s common stock as of January 31, 2024 was estimated to be 4,500,000.
Given the Company’s returns on its capital investments and significant cash provided by operations, management believes it is prudent to reinvest in the business to drive profitable growth and use excess cash flow to return cash to shareholders over time through dividends and share repurchases. The Company has paid dividends on common stock for 48 consecutive years through 2023 and has increased the dividend amount at least once every year. As in the past, future dividend amounts will be considered after reviewing profitability expectations and financing needs, and will be declared at the discretion of the Company’s Board of Directors.
ISSUER PURCHASES OF EQUITY SECURITIES
The following table presents information related to repurchases of common stock the Company made during the quarter ended December 31, 2023*:
| | | | | | | | | | | | | | | | | | | | | | | | | | | | | |
| Date | Total Number of
Shares Purchased | | Average Price
Paid per Share | | Total Number of Shares Purchased as Part of Publicly Announced Plans or Programs(1) | | Approximate Dollar Value of Shares that May Yet Be Purchased Under the Plans or Programs(1) |
| October 1-31, 2023 | 1,167,891 | | | 257.19 | | | 1,167,891 | | | | $ | 6,837,906,052 | |
| November 1-30, 2023 | 1,040,997 | | | 275.80 | | | 1,040,997 | | | | 6,550,798,529 | |
| December 1-31, 2023 | 931,481 | | | 291.50 | | | 931,481 | | | | 6,279,274,911 | |
| | | | | | |
| | | | | | |
| | | | | | |
| | | | | | |
| | | | | | |
| | | | | | |
| | | | | | |
| | | | | | |
| | | | | | |
| | | | | | |
| | | | | | |
| | | | | | |
| | | | | | |
| | | | | | |
| | | | | | |
| | | | | | |
| | | | | | |
| | | | | | |
| | | | | | |
| | | | | | |
| | | | | | |
| | | | | | |
| | | | | | |
| | | | | | |
| | | | | | |
| | | | | | |
| | | | | | |
| | | | | | |
| | | | | | |
| | | | | | |
| | | | | | |
| | | | | | |
| | | | | | |
| | | | | | |
| | | | | | |
| | | | | | |
| | | | | | |
| | | | | | |
| | | | | | |
| | | | | | |
| | | | | | |
| | | | | | |
| | | | | | |
| | | | | | |
| | | | | | |
| | | | | | |
| | | | | | |
| | | | | | |
| | | | | | |
| | | | | | |
| | | | | | |
| | | | | | |
| | | | | | |
| | | | | | |
| | | | | | |
| | | | | | |
| | | | | | |
| | | | | | |
| | | | | | |
| | | | | | |
| | | | | | |
| | | | | | |
| | | | | | |
| | | | | | |
| | | | | | |
| | | | | | |
| | | | | | |
| | | | | | |
| | | | | | |
| | | | | | |
| | | | | | |
| | | | | | |
| | | | | | |
| | | | | | |
| | | | | | |
| | | | | | |
| | | | | | |
| | | | | | |
| | | | | | |
| | | | | | |
| | | | | | |
| | | | | | |
| | | | | | |
| | | | | | |
| | | | | | |
| | | | | | |
| | | | | | |
| | | | | | |
| | | | | | |
| | | | | | |
| Total | 3,140,369 | | | 273.53 | | | 3,140,369 | | | | |
* Subject to applicable law, the Company may repurchase shares directly in the open market, in privately negotiated transactions, or pursuant to derivative instruments and plans complying with Rule 10b5-1, among other types of transactions and arrangements.
(1)On December 31, 2019, the Company's Board of Directors approved a share repurchase program, effective January 1, 2020 with no specified expiration date, that authorized the purchase of up to $15 billion of the Company's outstanding common stock.
McDonald's Corporation 2023 Annual Report 27
Cautionary Statement Regarding Forward-Looking Statements
The information in this report contains forward-looking statements about future events and circumstances and their effects upon revenues, expenses and business opportunities. Generally speaking, any statement in this report not based upon historical fact is a forward-looking statement. Forward-looking statements can also be identified by the use of forward-looking or conditional words, such as “could,” “should,” “can,” “continue,” "aim," “estimate,” “forecast,” “intend,” “look,” “may,” “will,” “expect,” “believe,” “anticipate,” “plan,” “remain,” “confident,” “commit,” “potential” and "trajectory" or similar expressions. In particular, statements regarding our plans, strategies, prospects and expectations regarding our business and industry are forward-looking statements. They reflect our expectations, are not guarantees of performance and speak only as of the dates the statements are made. Except as required by law, we do not undertake to update such forward-looking statements. You should not rely unduly on forward-looking statements.
Risk Factors
Our business results are subject to a variety of risks, including those that are described below and elsewhere in our filings with the
Securities and Exchange Commission. The risks described below are not the only risks we face. Additional risks not currently known to us or that we currently deem to be immaterial may also significantly adversely affect our business. If any of these risks were to materialize or intensify, our expectations (or the underlying assumptions) may change and our performance may be adversely affected.
STRATEGY AND BRAND
If we do not successfully evolve and execute against our business strategies, we may not be able to drive business growth.
To drive Systemwide sales, operating income and free cash flow growth, our business strategies – including the components of our Accelerating the Arches growth strategy – must be effective in maintaining and strengthening customer appeal and capturing additional market share. Whether these strategies are successful depends mainly on our System’s continued ability to:
•capitalize on our global scale, iconic brand and local market presence to build upon our historic strengths and competitive advantages, including by maximizing our marketing, committing to our core menu items, and doubling down on digital, delivery, drive thru and restaurant development;
•innovate and differentiate the McDonald’s experience, including by preparing and serving our food in a way that balances value and convenience to our customers with profitability;
•build upon our investments to transform and enhance the customer experience;
•run great restaurants by driving efficiencies and expanding capacities while prioritizing health and safety;
•accelerate our existing strategies, including through growth opportunities; and
•evolve and adjust our strategies in response to, among other things, changing consumer behavior, and other events impacting our results of operations and liquidity.
If we are delayed or unsuccessful in evolving or executing against our strategies, if the execution of our strategies proves to be more difficult, costly or time consuming than expected, or if our strategies do not yield the desired results, our business, financial condition and results of operations may suffer.
Failure to preserve the value or relevance of our brand could have an adverse impact on our financial results.
To continue to be successful in the future, we believe we must preserve, enhance and leverage the value and relevance of our brand, including our corporate purpose, mission and values. Brand value is based in part on consumer perceptions, which are affected by a variety of factors, including the nutritional content and preparation of our food, the ingredients we use, the manner in which we source commodities and general business practices across the System, including the people practices at McDonald’s restaurants. Consumer acceptance of our offerings is subject to change for a variety of reasons, and some changes can occur rapidly. For example, nutritional, health, environmental and other scientific studies and conclusions, which continuously evolve and may have contradictory implications, drive popular opinion, litigation and regulation (including initiatives intended to drive consumer behavior) in ways that affect the “informal eating out” (“IEO”) segment or perceptions of our brand, generally or relative to available alternatives. Our business could also be impacted by business incidents or practices, whether actual or perceived, particularly if they receive considerable publicity or result in litigation, as well as by our position or perceived lack of position on environmental, social responsibility, public policy, geopolitical and similar matters. In addition, we cannot ensure that franchisees or business partners will not take actions that adversely affect the value and relevance of our brand. Consumer perceptions may also be affected by adverse commentary from third parties, including through social media or conventional media outlets, regarding the quick-service category of the IEO segment or our brand, culture, operations, suppliers or franchisees. If we are unsuccessful in addressing adverse commentary or perceptions, whether or not accurate, our brand and financial results may suffer.
If we do not anticipate and address industry trends and evolving consumer preferences and effectively execute our pricing, promotional and marketing plans, our business could suffer.
Our continued success depends on our System’s ability to build upon our historic strengths and competitive advantages. In order to do so, we need to anticipate and respond effectively to continuously shifting consumer demographics and industry trends in food sourcing, food preparation, food offerings, and consumer behavior and preferences, including with respect to the use of digital channels and environmental and social responsibility matters. If we are not able to predict, or quickly and effectively respond to, these changes, or if our competitors are able to do so more effectively, our financial results could be adversely impacted.
Our ability to build upon our strengths and advantages also depends on the impact of pricing, promotional and marketing plans across the System, and the ability to adjust these plans to respond quickly and effectively to evolving customer behavior and preferences, as well as shifting economic and competitive conditions. Existing or future pricing strategies and marketing plans, as well as the value proposition they represent, are expected to continue to be important components of our business strategy. However, they may not be successful, or may not be as successful as the efforts of our competitors, which could negatively impact sales, guest counts and market share.
McDonald's Corporation 2023 Annual Report 28
Additionally, we operate in a complex and costly advertising environment. Our marketing and advertising programs may not be successful in reaching consumers in the way we intend. Our success depends in part on whether the allocation of our advertising and marketing resources across different channels, including digital, allows us to reach consumers effectively, efficiently and in ways that are meaningful to them. If our advertising and marketing programs are not successful, or are not as successful as those of our competitors, our sales, guest counts and market share could decrease.
Our investments to transform and enhance the customer experience, including through technology, may not generate the expected results.
Our long-term business objectives depend on the successful Systemwide execution of our strategies. We continue to build upon our investments in restaurant development, technology, digital engagement and delivery in order to transform and enhance the customer experience. As part of these investments, we are continuing to place emphasis on improving our service model and strengthening relationships with customers, in part through digital channels and loyalty initiatives, mobile ordering and payment systems, and enhancing our drive thru technologies, which efforts may not generate expected results. We also continue to expand and refine our delivery initiatives, including through integrating delivery and mobile ordering. Utilizing a third-party delivery service may not have the same level of profitability as a non-delivery transaction, and may introduce additional food quality, food safety and customer satisfaction risks. If these customer experience initiatives are not successfully executed, or if we do not fully realize the intended benefits of these significant investments, our business results may suffer.
We face intense competition in our markets, which could hurt our business.
We compete primarily in the IEO segment, which is highly competitive. We also face sustained, intense competition from traditional, fast casual and other competitors, which may include many non-traditional market participants such as convenience stores, grocery stores, coffee shops and online retailers. We expect our environment to continue to be highly competitive, and our results in any particular reporting period may be impacted by a contracting IEO segment or by new or continuing actions, product offerings, technologies or consolidation of our competitors and third-party partners, which may have a short- or long-term impact on our results.
We compete primarily on the basis of product choice, quality, affordability, service and location. In particular, we believe our ability to compete successfully in the current market environment depends on our ability to improve existing products, successfully develop and introduce new products, price our products appropriately, deliver a relevant customer experience, manage the complexity of our restaurant operations, manage our investments in restaurant development, technology, digital engagement and delivery, and respond effectively to our competitors’ actions or offerings or to unforeseen disruptive actions. There can be no assurance these strategies will be effective, and some strategies may be effective at improving some metrics while adversely affecting others, which could have the overall effect of harming our business.
We may not be able to adequately protect our intellectual property or adequately ensure that we are not infringing the intellectual property of others, which could harm the value of the McDonald’s brand and our business.
Our success depends on our continued ability to use our existing trademarks and service marks in order to increase brand awareness and further develop our branded products in both domestic and international markets. We rely on a combination of trademarks, copyrights, service marks, trade secrets, patents and other intellectual property rights to protect our brand and branded products.
We have registered certain trademarks and have other trademark registrations pending in the U.S. and certain foreign jurisdictions. The trademarks that we currently use have not been, and may never be, registered in all of the countries outside of the U.S. in which we do business or may do business in the future. It may be costly and time consuming to protect our intellectual property, particularly in rapidly evolving areas, and the steps we have taken to do so in the U.S. and foreign countries may not be adequate. In addition, the steps we have taken may not adequately ensure that we do not infringe the intellectual property of others, and third parties may claim infringement by us in the future. In particular, we may be involved in intellectual property claims, including often aggressive or opportunistic attempts to enforce patents used in information technology systems, which might affect our operations and results. Any claim of infringement, whether or not it has merit, could, particularly in rapidly evolving areas, be time consuming, or result in costly litigation and could also have an adverse impact on our business.
In addition, we cannot ensure that franchisees and other third parties who hold licenses to our intellectual property will not take actions that adversely affect the value of our intellectual property.
OPERATIONS
The global scope of our business subjects us to risks that could negatively affect our business.
We encounter differing cultural, regulatory, geopolitical and economic environments within and among the more than 100 countries where McDonald’s restaurants operate, and our ability to achieve our business objectives depends on the System’s success in these environments. Meeting customer expectations is complicated by the risks inherent in our global operating environment, and our global success is partially dependent on our System’s ability to leverage operating successes across markets and brand perceptions. Planned initiatives may not have appeal across multiple markets with McDonald’s customers and could drive unanticipated changes in customer perceptions and market share.
Disruptions in operations or price volatility in a market can also result from governmental actions, such as price, foreign exchange or trade-related tariffs or controls, trade policies and regulations, sanctions and counter sanctions, government-mandated closure of our, our franchisees’ or our suppliers’ operations, and asset seizures. Such disruptions or volatility can also result from acts of war, terrorism or other hostilities. For example, the wars in Ukraine and the Middle East have resulted in unpredictable conditions in regions throughout the world. The impacts of these wars on already-volatile macroeconomic conditions, geopolitical tensions, supply chain availability, consumer demand and the ability of us and our franchisees to operate in certain geographic areas, may also continue to have an adverse impact on our business and financial results.
While we may face challenges and uncertainties in any of the markets in which we operate, such challenges and uncertainties are often heightened in developing markets, which may entail a relatively higher risk of political instability, economic volatility, crime, corruption
McDonald's Corporation 2023 Annual Report 29
and social and ethnic unrest. In many cases, such challenges may be exacerbated by the lack of an independent and experienced judiciary and uncertainty in how local law is applied and enforced, including in areas most relevant to commercial transactions and foreign investment. An inability to manage effectively the risks associated with our international operations could adversely affect our business and financial results.
Supply chain interruptions may increase costs or reduce revenues.
We depend on the effectiveness of our supply chain management to assure a reliable and sufficient supply of quality products, equipment and other materials on favorable terms. Although many of these items are sourced from a wide variety of suppliers in countries around the world, certain items have limited suppliers, which may increase our reliance on those suppliers. Supply chain interruptions and related price increases have in the past and may in the future adversely affect us as well as our suppliers and franchisees, whose performance may have a significant impact on our results. Such interruptions and price increases could be caused by shortages, inflationary pressures, unexpected increases in demand, transportation-related issues, labor-related issues, technology-related issues, weather-related events, natural disasters, acts of war, terrorism or other hostilities, or other factors beyond the control of us or our suppliers or franchisees. Interruptions in our System’s supply chain or ineffective contingency planning can increase our costs and/or limit the availability of products, equipment and other materials that are critical to our System’s operations or to restaurant development.
Our franchise business model presents a number of risks.
Our success as a heavily franchised business relies to a large degree on the financial success and cooperation of our franchisees, including our developmental licensees and affiliates. Our restaurant margins arise from two sources: fees from franchised restaurants (e.g., rent and royalties based on a percentage of sales) and, to a lesser degree, sales from Company-operated restaurants. Our franchisees and developmental licensees manage their businesses independently and therefore are responsible for the day-to-day operation of their restaurants. The revenues we realize from franchised restaurants are largely dependent on the ability of our franchisees to grow their sales. Business risks affecting our operations also affect our franchisees. If franchisee sales trends worsen, or any of such risks materialize or intensify, our financial results could be negatively affected, which may be material.
Our success also relies on the willingness and ability of our independent franchisees and affiliates to implement major initiatives, which may include financial investment, and to remain aligned with us on operating, value/promotional and capital-intensive reinvestment plans. The ability of franchisees to contribute to the achievement of our plans is dependent in large part on the availability to them of funding at reasonable interest rates and may be negatively impacted by the financial markets in general, by their or our creditworthiness or by banks’ lending practices. If our franchisees are unwilling or unable to invest in major initiatives or are unable to obtain financing at commercially reasonable rates, or at all, our future growth and results of operations could be adversely affected.
Our operating performance could also be negatively affected if our franchisees experience food safety or other operational problems or project an image inconsistent with our brand and values, particularly if our contractual and other rights and remedies are limited, costly to exercise or subjected to litigation and potential delays. If franchisees do not successfully operate restaurants in a manner consistent with our required standards, our brand’s image and reputation could be harmed, which in turn could hurt our business and operating results.
Our ownership mix also affects our results and financial condition. The decision to own restaurants or to operate under franchise or license agreements is driven by many factors whose interrelationship is complex. The benefits of our more heavily franchised structure depend on various factors, including whether we have effectively selected franchisees, licensees and/or affiliates that meet our rigorous standards, whether we are able to successfully integrate them into our structure and whether their performance and the resulting ownership mix supports our brand and financial objectives.
Continued challenges with respect to labor, including availability and cost, could adversely impact our business and results of operations.
Our success depends in part on our System’s ability to effectively attract, recruit, develop, motivate and retain qualified individuals to work in McDonald’s restaurants and to maintain appropriately-staffed restaurants in an intensely competitive labor market. We and our franchisees have experienced and may continue to experience challenges in adequately staffing certain McDonald’s restaurants, which can negatively impact operations, including speed of service to customers, and customer satisfaction levels. The System’s ability to meet its labor needs as they evolve is generally subject to a variety of factors, including the availability of sufficient workforce, unemployment levels and prevailing wages in the markets in which we operate.
Further, our System has experienced increased costs and competition associated with attracting, recruiting, developing, motivating and retaining qualified employees, as well as with promoting awareness of the opportunities of working at McDonald’s restaurants. We and our franchisees also continue to be impacted by increasingly complex U.S. and international laws and regulations affecting our respective workforces. These laws and regulations are increasingly focused on, and in certain cases impose requirements with respect to, employment matters such as wages and hours, healthcare, immigration, retirement and other employee benefits and workplace practices. Such laws and regulations can expose us and our franchisees to increased costs and other effects of compliance, including potential liability, and all such labor and compliance costs could have a negative impact on our Company-operated margins and franchisee profitability.
Our potential exposure to reputational and other harm regarding our workplace practices or conditions or those of our independent franchisees or suppliers, including those giving rise to claims of harassment or discrimination (or perceptions thereof) or workplace safety, could have a negative impact on consumer perceptions of us and our business. Additionally, economic action, such as boycotts, protests, work stoppages or campaigns by labor organizations, could adversely affect us (including our ability to attract, recruit, develop, motivate and retain talent) or our franchisees and suppliers, whose performance may have a significant impact on our results.
Effective succession planning is important to our continued success.
Effective succession planning for management is important to our long-term success. Failure to effectively attract, recruit, develop, motivate and retain qualified key personnel, or to execute smooth personnel transitions, could disrupt our business and adversely affect our results.
McDonald's Corporation 2023 Annual Report 30
Food safety concerns may have an adverse effect on our business.
Our ability to increase sales and profits depends on our System’s ability to meet expectations for safe food and on our ability to manage the potential impact on McDonald’s of food-borne illnesses and food or product safety issues that may arise in the future, including in the supply chain, restaurants or delivery. Food safety is a top priority, and we dedicate substantial resources aimed at ensuring that our customers enjoy safe food products, including as our menu and service model evolve. However, food safety events, including instances of food-borne illness, occur within the food industry and our System from time to time and could occur in the future. Instances of food tampering, food contamination or food-borne illness, whether actual or perceived, could adversely affect our brand, reputation and financial results.
If we do not effectively manage our real estate portfolio, our operating results may be negatively impacted.
We have significant real estate operations, primarily in connection with our restaurant business. We generally own or secure a long-term lease on the land and building for conventional franchised and Company-operated restaurant sites. We seek to identify and develop restaurant locations that offer convenience to customers and long-term sales and profit potential. As we generally secure long-term real estate interests for our restaurants, we have limited flexibility to quickly alter our real estate portfolio. The competitive business landscape continues to evolve in light of changing business trends, consumer preferences, trade area demographics, consumer use of digital, delivery and drive thru, local competitive positions and other economic factors. If our restaurants are not located in desirable locations, or if we do not evolve in response to these factors, it could adversely affect Systemwide sales and profitability.
Our real estate values and the costs associated with our real estate operations are also impacted by a variety of other factors, including governmental regulations, insurance, zoning, tax and eminent domain laws, interest rate levels, the cost of financing, natural disasters, acts of war, terrorism or other hostilities, or other factors beyond our control. A significant change in real estate values, or an increase in costs as a result of any of these factors, could adversely affect our operating results.
Information technology system failures or interruptions, or breaches of network security, may impact our operations or cause reputational harm.
We are increasingly reliant upon technology systems, such as point-of-sale, that support our business operations, including our digital and delivery solutions, and technologies that facilitate communication and collaboration with affiliated entities, customers, employees, franchisees, suppliers, service providers or other independent third parties to conduct our business, whether developed and maintained by us or provided by third parties. Any failure or interruption of these systems could significantly impact our or our franchisees’ operations, or our customers’ experiences and perceptions. In addition, the artificial intelligence tools we are incorporating into certain aspects of our restaurant operations may not generate the intended efficiencies and may impact our business results.
Security incidents or breaches have from time to time occurred and may in the future occur involving our systems, the systems of the parties with whom we communicate or collaborate (including franchisees) or the systems of third-party providers. These may include such things as unauthorized access, phishing attacks, account takeovers, denial of service, computer viruses, deepfakes and other malicious uses of artificial intelligence, introduction of malware or ransomware and other disruptive problems caused by hackers. Certain of these technology systems contain personal, financial and other information of our customers, employees, franchisees and their employees, suppliers and other third parties, as well as financial, proprietary and other confidential information related to our business. Despite response procedures and measures in place in the event of an incident, a security breach could result in disruptions, shutdowns, or the theft or unauthorized disclosure of such information. The actual or alleged occurrence of any of these incidents could result in mitigation costs, reputational damage, adverse publicity, loss of consumer confidence, reduced sales and profits, complications in executing our growth initiatives and regulatory and legal risk, including administrative fines, criminal or civil penalties or civil liabilities.
Despite the implementation of business continuity measures, any of these technology systems could become vulnerable to damage, disability or failures due to fire, power loss, telecommunications failure or other catastrophic events. Certain technology systems may also become vulnerable, unreliable or inefficient in cases where technology vendors limit or terminate product support and maintenance. Our increasing reliance on third-party systems also subjects us to risks faced by those third-party businesses, including operational, security and credit risks. If technology systems were to fail or otherwise be unavailable, or if business continuity or disaster recovery plans were not effective, and we were unable to recover in a timely manner, we could experience an interruption in our or our franchisees’ operations.
LEGAL AND REGULATORY
Increasing regulatory and legal complexity may adversely affect our business and financial results.
Our regulatory and legal environment worldwide exposes us to complex compliance, litigation and similar risks that could affect our operations and results in material ways. Many of our markets are subject to increasing, conflicting and highly prescriptive regulations involving, among other matters, restaurant operations, product packaging, marketing, use of information technology systems, the nutritional and allergen content and safety of our food and other products, labeling and other disclosure practices. Compliance efforts with those regulations may be affected by ordinary variations in food preparation among our own restaurants and the need to rely on the accuracy and completeness of information from third-party suppliers. We also are subject to increasing public focus, including by governmental and non-governmental organizations, on environmental, social responsibility and corporate governance matters. Our success depends in part on our ability to manage the impact of regulations and other initiatives that can affect our business plans and operations, which have increased and may continue to increase our costs of doing business and exposure to litigation, governmental investigations or other proceedings.
We are also subject to legal proceedings that may adversely affect our business, including, but not limited to, class actions, administrative proceedings, government investigations and proceedings, shareholder proceedings, employment and personal injury claims, landlord/tenant disputes, supplier-related disputes, and claims by current or former franchisees. Regardless of whether claims against us are valid or whether we are found to be liable, claims may be expensive to defend and may divert management’s attention away from operations.
Litigation, legislative and regulatory action concerning our relationship with franchisees and the legal distinction between our franchisees and us for employment law or other purposes, if determined adversely, could challenge our franchise business model, increase costs, negatively impact our business operations and the business prospects of our franchisees and subject us to incremental liability for
McDonald's Corporation 2023 Annual Report 31
their actions. Similarly, although our commercial relationships with our suppliers remain independent, there may be attempts to challenge that independence, which, if determined adversely, could also increase costs, negatively impact the business prospects of our suppliers, and subject us to incremental liability for their actions.
Our results could also be affected by the following:
•the relative level of our defense costs, which vary from period to period depending on the number, nature and procedural status of pending proceedings;
•the cost and other effects of settlements, judgments or consent decrees, which may require us to make disclosures or take other actions that may affect perceptions of our brand and products; and
•adverse results of pending or future litigation, including litigation challenging the composition and preparation of our products, or the appropriateness or accuracy of our marketing or other communication practices.
A judgment significantly in excess of any applicable insurance coverage or third-party indemnity could materially adversely affect our financial condition or results of operations. Further, adverse publicity resulting from claims may hurt our business. If we are unable to effectively manage the risks associated with our complex regulatory and legal environment, it could have a material adverse effect on our business and financial condition.
Changes in tax laws and unanticipated tax liabilities could adversely affect the taxes we pay and our profitability.
We are subject to income and other taxes in the U.S. and foreign jurisdictions, and our operations, plans and results are affected by tax and other initiatives around the world. In particular, we are affected by the impact of changes to tax laws or policy or related authoritative interpretations. We are also impacted by settlements of pending or any future adjustments proposed by taxing and governmental authorities inside and outside of the U.S. in connection with our tax audits, all of which will depend on their timing, nature and scope. Any significant increases in income tax rates, changes in income tax laws or unfavorable resolution of tax matters could have a material adverse impact on our financial results.
Changes in accounting standards or the recognition of impairment or other charges may adversely affect our future operations and results.
New accounting standards or changes in financial reporting requirements, accounting principles or practices, including with respect to our critical accounting estimates, could adversely affect our future results. We may also be affected by the nature and timing of decisions about underperforming markets or assets, including decisions that result in impairment or other charges that reduce our earnings.
In assessing the recoverability of our long-lived assets, we consider changes in economic conditions and make assumptions regarding estimated future cash flows and other factors. These estimates are highly subjective and can be significantly impacted by many factors such as global and local business and economic conditions, operating costs, inflation, interest rate levels, competition, consumer and demographic trends and our restructuring activities. If our estimates or underlying assumptions change in the future, we may be required to record impairment charges. Any such changes could have a significant adverse effect on our reported results for the affected periods.
If we fail to comply with privacy and data protection laws, we could be subject to legal proceedings and penalties, which could negatively affect our financial results or brand perceptions.
We are subject to legal and compliance risks and associated liability related to privacy and data protection requirements, including those associated with our technology-related services and platforms made available to business partners, customers, employees, franchisees or other third parties. An increasing number of our markets have enacted new privacy and data protection requirements (including the European Union’s General Data Protection Regulation and various U.S. state-level laws), and further requirements are likely to be proposed or enacted in the future. Failure to comply with these privacy and data protection laws could result in legal proceedings and substantial administrative fines, criminal or civil penalties or civil liabilities and materially adversely impact our financial results or brand perceptions.
MACROECONOMIC AND MARKET CONDITIONS
Unfavorable general economic conditions could adversely affect our business and financial results.
Our results of operations are substantially affected by economic conditions, including inflationary pressures, which can vary significantly by market and can impact consumer disposable income levels and spending habits. Economic conditions can be impacted by a variety of factors, including hostilities, epidemics, pandemics and actions taken by governments to manage national and international economic matters, whether through austerity, stimulus measures or trade measures, and initiatives intended to control wages, unemployment, credit availability, inflation, taxation and other economic drivers. Sustained adverse economic conditions or periodic adverse changes in economic conditions put pressure on our operating performance and business continuity disruption planning, and our business and financial results may suffer as a result.
Our results of operations are also affected by fluctuations in currency exchange rates, and unfavorable currency fluctuations could adversely affect reported earnings.
Health epidemics or pandemics could adversely affect our business and financial results.
Health epidemics or pandemics have in the past and may in the future impact macroeconomic conditions, consumer behavior, labor availability and supply chain management, as well as local operations in impacted markets, all of which can adversely affect our business, financial results and outlook. Governmental responses to health epidemics or pandemics, including operational restrictions, can also affect the foregoing items and adversely affect our business and financial results. The duration and scope of a health epidemic or pandemic can be difficult to predict and depends on many factors, including the emergence of new variants and the availability, acceptance and effectiveness of preventative measures. A health epidemic or pandemic may also heighten other risks disclosed in these Risk Factors, including, but not limited to, those related to the availability and costs of labor and commodities, supply chain interruptions, consumer behavior, and consumer perceptions of our brand and industry.
McDonald's Corporation 2023 Annual Report 32
Changes in commodity and other operating costs could adversely affect our results of operations.
The profitability of our Company-operated restaurants depends in part on our ability to anticipate and react to changes in commodity costs, including food, paper, supplies, fuel and utilities, as well as distribution and other operating costs, including labor. Volatility in certain commodity prices and fluctuations in labor costs have adversely affected and in the future could adversely affect our operating results by impacting restaurant profitability. The commodity markets for some of the ingredients we use, such as beef, chicken and pork, are particularly volatile due to factors such as seasonal shifts, climate conditions, industry demand and other macroeconomic conditions, international commodity markets, food safety concerns, product recalls, government regulation, and acts of war, terrorism or other hostilities, all of which are beyond our control and, in many instances, unpredictable. Our System can only partially address future price risk through hedging and other activities, and therefore increases in commodity costs could have an adverse impact on our profitability.
A decrease in our credit ratings or an increase in our funding costs could adversely affect our profitability.
Our credit ratings may be negatively affected by our results of operations or changes in our debt levels. As a result, our interest expense, the availability of acceptable counterparties, our ability to obtain funding on favorable terms, our collateral requirements and our operating or financial flexibility could all be negatively affected, especially if lenders were to impose new operating or financial covenants.
Our operations may also be impacted by regulations affecting capital flows, financial markets or financial institutions, which can limit our ability to manage and deploy our liquidity or increase our funding costs. Any such events could have a material adverse effect on our business and financial condition.
The trading volatility and price of our common stock may be adversely affected by many factors.
Many factors affect the trading volatility and price of our common stock in addition to our operating results and prospects. These factors, many of which are beyond our control, include the following:
•the unpredictable nature of global economic and market conditions;
•governmental action or inaction in light of key indicators of economic activity or events that can significantly influence financial markets, particularly in the U.S., which is the principal trading market for our common stock, and media reports and commentary about economic, trade or other matters, even when the matter in question does not directly relate to our business;
•trading activity in our common stock, in derivative instruments with respect to our common stock or in our debt securities, which can be affected by: market commentary (including commentary that may be unreliable or incomplete); unauthorized disclosures about our performance, plans or expectations about our business; our actual performance and creditworthiness; investor confidence, driven in part by expectations about our performance; actions by shareholders and others seeking to influence our business strategies; portfolio transactions in our common stock by significant shareholders; and trading activity that results from the ordinary course rebalancing of stock indices in which McDonald’s may be included, such as the S&P 500 Index and the Dow Jones Industrial Average;
•the impact of our stock repurchase program or dividend rate; and
•the impact of corporate actions, including changes to our corporate structure, and market and third-party perceptions and assessments of such actions, including those we may take from time to time as we implement our business strategies in light of changing business, legal and tax considerations.
Our business is subject to an increasing focus on environmental and social impact matters.
In recent years, there has been an increasing focus by stakeholders – including employees, franchisees, customers, suppliers, governmental and non-governmental organizations and investors – on environmental and social impact matters. A failure, whether real or perceived, to address environmental and social impact matters or to achieve progress on our environmental and social impact initiatives on the anticipated timing or at all, could adversely affect our business, including by heightening other risks disclosed in these Risk Factors, such as those related to consumer behavior, consumer perceptions of our brand, labor availability and costs, supply chain interruptions, commodity costs, and legal and regulatory complexity. Conversely, our taking a position, whether real or perceived, on environmental and social impact, public policy, geopolitical and similar matters could also adversely impact our business.
The standards we set for ourselves regarding environmental and social impact matters, and our ability to meet such standards, may also impact our business. For example, we are working to manage risks and costs to our System related to climate change, greenhouse gases, and diminishing energy and water resources, and we have announced initiatives relating to, among other things, climate action, sustainability, and responsible sourcing. In addition, we are engaging in social impact initiatives, including community engagement and philanthropy; as well as diversity, equity and inclusion efforts. We have faced increased scrutiny related to reporting on and achieving these initiatives, as well as continued public focus on similar matters, such as packaging and waste, animal health and welfare, deforestation and land use. We have also experienced increased pressure from stakeholders to provide expanded disclosure and establish additional commitments, targets or goals, and take actions to meet them, which could expose us to additional market, operational, execution and reputational costs and risks. Moreover, addressing environmental and social impact matters requires Systemwide as well as third party coordination and alignment, over which we do not have complete control and which may be unpredictable. The standards by which certain environmental and social impact matters are measured are also evolving and subject to assumptions that could change over time.
Events such as severe weather conditions, natural disasters, hostilities, social unrest and climate change, among others, can adversely affect our results and prospects.
Severe weather conditions, natural disasters, acts of war, terrorism or other hostilities, social unrest or climate change (or expectations about them) can adversely affect consumer behavior and confidence levels, supply availability and costs and local operations in impacted markets, all of which can affect our results and prospects. Climate change may also increase the frequency and severity of weather-related events and natural disasters. Our receipt of proceeds under any insurance we maintain with respect to some of these risks may be delayed or the proceeds may be insufficient to cover our losses fully.
McDonald's Corporation 2023 Annual Report 33
Governance
Management has primary responsibility for enterprise-wide risk management (“ERM”), including cybersecurity risk, within our Company, as detailed below. Our Board of Directors is responsible for overseeing our ERM framework and exercises this oversight both as a full Board and through its standing committees. Our Board’s Public Policy & Strategy Committee (“PPS Committee”) has oversight responsibility for our strategy and processes relating to cybersecurity risk management. Our PPS Committee receives updates at regular intervals on cybersecurity matters from management, including our Global Chief Information Officer (“CIO”) and Chief Information Security Officer (“CISO”) who, as discussed below, are responsible for assessing and managing material cybersecurity risks. Such updates include a discussion of the status of our cybersecurity landscape and our cybersecurity strategies, including potential risks and mitigation efforts. If a cybersecurity incident meets our established internal escalation threshold, accelerated reporting of the incident is provided to the applicable members of the Board. The PPS Committee also considers potential remedies to any strategic or process gaps that may be identified during the Company’s review of specific cybersecurity incidents.
Our Board of Directors recognizes the importance to the Company of effectively identifying, assessing and managing risks that could have a significant impact on our business strategy. The ERM framework leverages internal risk committees comprised of cross-functional leadership who meet regularly to evaluate and prioritize risks, including cybersecurity risk, in the context of our strategy, with further escalation to our CEO, Board and/or Committees, as appropriate. Effective management of cybersecurity risks is critical to the successful execution of our business strategy.
Risk Management and Strategy
Our CIO and CISO are responsible for assessing and implementing our cybersecurity risk management programs, which are informed by the National Institute of Standards and Technology (NIST) Cybersecurity Framework. These leaders and their teams have significant relevant experience in various fields, such as incident response, application security, data protection, network security and identity and access management, and have implemented and executed security programs across multiple industries at Fortune 100 companies. Our programs are designed to create a comprehensive, cross-functional approach to identify and mitigate cybersecurity risks as well as to prevent cybersecurity incidents in an effort to support business continuity and achieve operational resiliency.
We leverage certain third-party providers and local technology support teams to help execute certain aspects of our cybersecurity risk management programs. We also engage third parties in assessments and testing of our policies, processes and standards that are designed to identify and remediate cybersecurity incidents. These efforts include a wide range of activities focused on evaluating the effectiveness of the program, including audits, modeling, tabletop exercises and vulnerability testing. We also periodically engage independent third parties to perform assessments and evaluations of certain aspects of our information security control environment and operation of our program. Further, we have various processes and programs to manage cybersecurity risks associated with our use of third-party vendors and suppliers.
We provide regular, mandatory training for employees regarding cybersecurity threats to bring awareness on how they can help prevent and report potential cybersecurity incidents. In addition, key stakeholders involved with our cybersecurity risk management programs receive additional training and regularly participate in scenario-based training exercises to support the effective administration of our programs.
We have established and regularly tested incident response processes and controls that identify and risk-rank incidents through a centralized system to promote timely escalation of cybersecurity incidents that exceed a particular level of risk, including escalation of incidents of sufficient magnitude or severity to our CIO and CISO. In evaluating cybersecurity incidents, management considers the potential impact to our results of operations, control framework, and financial condition, as well as the potential impact, if any, to our business strategy or reputation.
Cybersecurity threats, including as a result of our previous cybersecurity incidents, have not materially affected our results of operations or financial condition, including our business strategy, in 2023. For additional information on risks from cybersecurity threats, please see our Risk Factors beginning on page 28.
McDonald's Corporation 2023 Annual Report 34
LEGAL PROCEEDINGS
The Company has pending a number of claims and lawsuits that have been filed in various jurisdictions. These claims and lawsuits cover a broad variety of allegations spanning the Company’s business. The following is a brief description of the more significant types of such claims and lawsuits. In addition, the Company is subject to various laws and regulations that impact its business, as discussed under “Government Regulations” below. While the Company does not believe that any such claims, lawsuits, laws or regulations will have a material adverse effect on its financial condition or results of operations, unfavorable rulings could occur. Were an unfavorable ruling to occur, it could result in a material adverse impact on the Company’s net income for the period in which it occurs and/or future periods.
•Franchising
Most McDonald’s restaurants are franchised to independent owner/operators and developmental licensees under contractual arrangements with the Company. In the course of the franchise relationship, occasional disputes arise between the Company and its current or former franchisees relating to a broad range of subjects, including, but not limited to, quality, service, cleanliness, menu pricing, alleged discrimination, delinquent payments of rents and fees, and franchise grants, renewals and terminations. Occasional disputes also arise between the Company and individuals or entities who claim they should be (or should have been) granted a franchise or who challenge the legal distinction between the Company and its franchisees for employment law purposes.
•Suppliers
The Company and its affiliates and subsidiaries generally do not supply food, paper or related items to any McDonald’s restaurants. The Company relies upon numerous independent suppliers, including service providers, that are required to meet and maintain the Company’s high standards and specifications. Occasional disputes arise between the Company and its current or former suppliers relating to, for example, compliance with product specifications and the Company’s business relationship with suppliers. Occasional disputes also arise between the Company and individuals or entities who claim they should be (or should have been) granted the opportunity to supply products or services to the Company or its restaurants.
•Employees
Hundreds of thousands of people are employed by the Company and in restaurants owned and operated by its subsidiaries. In addition, thousands of people from time to time seek employment in such restaurants. In the ordinary course of business, occasional disputes arise relating to hiring, termination, promotion and pay practices, including, but not limited to, wage and hour disputes, alleged discrimination and compliance with labor and employment laws.
•Customers
McDonald’s restaurants – whether owned by subsidiaries of the Company, independent owner/operators or developmental licensees – regularly serve a broad segment of the public around the world. In so doing, disputes occasionally arise relating to products, service, incidents, pricing, advertising, disclosures (including relating to nutrition) and other matters common to an extensive restaurant business such as that of the Company.
•Intellectual Property
The Company has registered trademarks, service marks, patents and copyrights, some of which it considers to be of material importance to its business. From time to time, the Company may become involved in litigation to protect its intellectual property and defend against the alleged use of third-party intellectual property.
•Government Regulations
National and local governments have adopted laws and regulations relating to various aspects of the restaurant business, including, but not limited to, advertising, franchising, health, safety, environment, competition, zoning, employment and taxation. The Company is occasionally involved in litigation or other proceedings regarding these matters. While the Company strives to comply with all applicable existing statutory and administrative requirements, it cannot predict the effect on its operations of these matters or the issuance or enactment of any future additional requirements.
PROPERTIES
The Company owns and leases real estate primarily in connection with its restaurant business. The Company identifies and develops sites that offer convenience to customers and long-term sales and profit potential to the System. To assess potential, the Company analyzes traffic and walking patterns, census data and other relevant data. The Company’s experience and access to advanced technology aid in evaluating this information. The Company generally owns or secures a long-term lease on the land and building for conventional franchised and Company-operated restaurant sites, which facilitates long-term occupancy rights and helps control related costs. Restaurant profitability for both the Company and franchisees is important; therefore, ongoing efforts are made to control average development costs through construction and design efficiencies, standardization and by leveraging the Company’s global sourcing network.
In addition, the Company primarily leases real estate in connection with its corporate headquarters, field and other offices.
Additional information about the Company’s properties is included in the Management’s Discussion and Analysis of Financial Condition and Results of Operations section beginning on page 8 of this Form 10-K and in the Financial Statements and Supplementary Data section beginning on page 37 of this Form 10-K.
McDonald's Corporation 2023 Annual Report 35
INFORMATION ABOUT OUR EXECUTIVE OFFICERS
The following are the executive officers of the Company as of the date of this filing:
Jonathan Banner, 56, is Executive Vice President – Chief Global Impact Officer, a position he has held since September 2022. Prior to joining the Company, Mr. Banner served as Executive Vice President, Communications for PepsiCo, Inc., a food and beverage company, from May 2014 to August 2022.
Ian Borden, 55, is Executive Vice President – Global Chief Financial Officer, a position he has held since September 2022. Prior to that, Mr. Borden served as President, International, from January 2020 to August 2022, as President – International Developmental Licensed Markets from January 2019 to December 2019. Mr. Borden has served the Company for 29 years.
Heidi Capozzi, 54, is Executive Vice President – Global Chief People Officer, a position she has held since April 2020. Prior to joining the Company, Ms. Capozzi served as Senior Vice President of Human Resources for The Boeing Company, a manufacturer of commercial jetliners and defense, space and security systems, from March 2016 to April 2020.
Joseph Erlinger, 50, is Executive Vice President – President, McDonald's USA, a position he has held since November 2019. Prior to that, Mr. Erlinger served as President – International Operated Markets from January 2019 to October 2019. Mr. Erlinger has served the Company for 21 years.
Morgan Flatley, 49, is Executive Vice President – Global Chief Marketing Officer and New Business Ventures, a position she has held since February 2023. Prior to that, Ms. Flatley served as Senior Vice President - Global Chief Marketing Officer from November 2021 to January 2023 and as Senior Vice President - Chief Marketing and Digital Customer Experience Officer from May 2017 to November 2021.
Marion Gross, 63, is Executive Vice President – Global Chief Supply Chain Officer, a position she has held since September 2022. Prior to that, Ms. Gross served as Senior Vice President – Chief Supply Chain Officer, North America from May 2013 to August 2022. Ms. Gross has served the Company for 30 years.
Catherine Hoovel, 52, is Senior Vice President – Corporate Controller, a position she has held since July 2021. Prior to that, Ms. Hoovel served as Vice President – Chief Accounting Officer from October 2016 to July 2021. Ms. Hoovel has served the Company for 27 years.
Christopher Kempczinski, 55, is President and Chief Executive Officer, a position he has held since November 2019. Prior to that, Mr. Kempczinski served as President, McDonald’s USA from January 2017 to October 2019. Mr. Kempczinski has served the Company for eight years.
Jill McDonald, 59, is Executive Vice President – President, International Operated Markets, a position she has held since September 2022. Prior to re-joining the Company, Ms. McDonald served as Chief Executive Officer for Costa Coffee, a beverage company, from December 2019 to July 2022, as Managing Director, Clothing, Home & Beauty for Marks and Spencer Group plc, a multinational clothing and home products retailer, from October 2017 to July 2019. Ms. McDonald previously worked at the Company from June 2006 to March 2015.
Desiree Ralls-Morrison, 57, is Executive Vice President – Global Chief Legal Officer and Secretary, a position she has held since April 2021. Prior to joining the Company, Ms. Ralls-Morrison served as Senior Vice President, General Counsel and Corporate Secretary for Boston Scientific Corporation, a medical device manufacturer, from November 2017 to April 2021.
Brian Rice, 60, is Executive Vice President – Global Chief Information Officer, a position he has held since August 2022. Prior to joining the Company, Mr. Rice served as Executive Vice President, Chief Information Officer and Global Business Services for Cardinal Health, Inc., a healthcare services company, from February 2019 to August 2022, and as Senior Vice President, Chief Information Officer and Global Business Services for the Kellogg Company, a food manufacturing company, from February 2009 to February 2019.
Jo Sempels, 56, is Senior Vice President and President, International Developmental Licensed Markets, a position he has held since September 2022. Prior to that, Mr. Sempels served as Senior Vice President - International Developmental Licensed Markets from December 2019 to August 2022, as Vice President, Business Unit Lead International Developmental Licensed Markets Europe from January 2019 to December 2019. Mr. Sempels has served the Company for 31 years.
Manu Steijaert, 53, is Executive Vice President – Global Chief Customer Officer, a position he has held since August 2021. Prior to that, Mr. Steijaert served as Vice President, International Operated Markets from January 2019 to July 2021. Mr. Steijaert has served the Company for 21 years.
McDonald's Corporation 2023 Annual Report 36
AVAILABILITY OF COMPANY INFORMATION
The Company is subject to the requirements of the Securities Exchange Act of 1934, as amended (the "Exchange Act"), and therefore files periodic reports, proxy statements and other information with the SEC. Such information may be obtained by visiting the SEC's website at www.sec.gov.
The Company also uses its investor website at www.investor.mcdonalds.com as a primary channel for disclosing key information to its investors, some of which may contain material and previously non-public information. The Company makes available on such website, free of charge, copies of its Annual Reports on Form 10-K, Quarterly Reports on Form 10-Q and Current Reports on Form 8-K, as well as amendments to those reports, filed or furnished pursuant to Section 13(a) or 15(d) of the Exchange Act as soon as reasonably practicable after filing or furnishing such material to the SEC. Copies of such information and reports are also available free of charge by calling (800) 228-9623.
The Company also posts the following documents on the “Corporate Governance” section of its investor website: the Company’s Corporate Governance Principles; the charters for each standing committee of the Company's Board of Directors, including the Audit & Finance Committee, Compensation Committee, Governance Committee, Public Policy & Strategy Committee, and Sustainability & Corporate Responsibility Committee; the Code of Conduct for the Company’s Board of Directors; and the Company’s Standards of Business Conduct, which applies to all officers and employees. Copies of these documents are also available free of charge by calling (800) 228-9623. The Company intends to satisfy the disclosure requirements regarding any applicable amendment to, or waiver from, a provision of its Standards of Business Conduct by disclosing such information at the website address specified above.
The websites included in this Form 10-K, including those of the Company and the SEC, are provided for convenience only. Information contained on or accessible through such websites is not incorporated herein and does not constitute a part of this Form 10-K or the Company's other filings with the SEC.
| | | | | | | | |
Financial Statements and Supplementary Data | | |
| | |
| Index to consolidated financial statements | | Page reference |
| | |
| Consolidated statement of income for each of the three years in the period ended December 31, 2023 | |
| Consolidated statement of comprehensive income for each of the three years in the period ended December 31, 2023 | |
| Consolidated balance sheet at December 31, 2023 and 2022 | |
| Consolidated statement of cash flows for each of the three years in the period ended December 31, 2023 | |
| Consolidated statement of shareholders’ equity for each of the three years in the period ended December 31, 2023 | |
| Notes to consolidated financial statements | |
|
| Management’s assessment of internal control over financial reporting | |
Report of independent registered public accounting firm-PCAOB ID: | | |
| Report of independent registered public accounting firm on internal control over financial reporting | |
| | |
McDonald's Corporation 2023 Annual Report 37
Consolidated Statement of Income
| | | | | | | | | | | | | | | | | | | | |
| In millions, except per share data | Years ended December 31, 2023 | | 2022 | | 2021 |
| REVENUES | | | | | |
| Sales by Company-operated restaurants | $ | | | | $ | | | | $ | | |
| Revenues from franchised restaurants | | | | | | | | |
| Other revenues | | | | | | | | |
| Total revenues | | | | | | | | |
| OPERATING COSTS AND EXPENSES | | | | | |
| Company-operated restaurant expenses | | | | | |
| Food & paper | | | | | | | | |
| Payroll & employee benefits | | | | | | | | |
| Occupancy & other operating expenses | | | | | | | | |
| Franchised restaurants-occupancy expenses | | | | | | | | |
| Other restaurant expenses | | | | | | | | |
| Selling, general & administrative expenses | | | | | |
| Depreciation and amortization | | | | | | | | |
| Other | | | | | | | | |
| | | |
| Other operating (income) expense, net | | | | | | | () | |
| Total operating costs and expenses | | | | | | | | |
| Operating income | | | | | | | | |
Interest expense-net of capitalized interest of $, $ and $ | | | | | | | | |
| Nonoperating (income) expense, net | () | | | | | | | |
| Income before provision for income taxes | | | | | | | | |
| Provision for income taxes | | | | | | | | |
| Net income | $ | | | | $ | | | | $ | | |
| Earnings per common share–basic | $ | | | | $ | | | | $ | | |
| Earnings per common share–diluted | $ | | | | $ | | | | $ | | |
| Dividends declared per common share | $ | | | | $ | | | | $ | | |
| Weighted-average shares outstanding–basic | | | | | | | | |
| Weighted-average shares outstanding–diluted | | | | | | | | |
See Notes to consolidated financial statements.
McDonald's Corporation 2023 Annual Report 38
Consolidated Statement of Comprehensive Income | | | | | | | | | | | | | | | | | | | | | | | |
| In millions | Years ended December 31, 2023 | | 2022 | | 2021 |
| Net income | | | $ | | | | $ | | | | $ | | |
| Other comprehensive income (loss), net of tax | | | | | | | |
| Foreign currency translation adjustments: | | | | | | | |
Gain (loss) recognized in accumulated other comprehensive income (AOCI), including net investment hedges | | | | | () | | | () | |
| Reclassification of (gain) loss to net income | | | | | | | | | |
Foreign currency translation adjustments-net of tax benefit (expense) of $, $(), and $() | | | | | | | () | |
| Cash flow hedges: | | | | | | | |
| Gain (loss) recognized in AOCI | | () | | | | | | | |
| Reclassification of (gain) loss to net income | | () | | | () | | | | |
Cash flow hedges-net of tax benefit (expense) of $, $(), and $() | () | | | | | | | |
| Defined benefit pension plans: | | | | | | | |
| Gain (loss) recognized in AOCI | | () | | | () | | | | |
| Reclassification of (gain) loss to net income | | | | | | | | | |
Defined benefit pension plans-net of tax benefit (expense) of $, $, and $() | () | | | () | | | | |
| | | | | | | |
| Total other comprehensive income (loss), net of tax | | | | | | | | |
| | | | | | | |
| | | | | | | |
| Comprehensive income | | | $ | | | | $ | | | | $ | | |
| | | | | | | |
See Notes to consolidated financial statements.
McDonald's Corporation 2023 Annual Report 39
Consolidated Balance Sheet
| | | | | | | | | | | | | | |
| In millions, except per share data | December 31, 2023 | | 2022 |
| ASSETS | | | |
| Current assets | | | |
| Cash and equivalents | $ | | | | $ | | |
| Accounts and notes receivable | | | | | |
| Inventories, at cost, not in excess of market | | | | | |
| Prepaid expenses and other current assets | | | | | |
| |
| Total current assets | | | | | |
| Other assets | | | |
| Investments in and advances to affiliates | | | | | |
| Goodwill | | | | | |
| Miscellaneous | | | | | |
| Total other assets | | | | | |
| Lease right-of-use asset, net | | | | | |
| Property and equipment | | | |
| Property and equipment, at cost | | | | | |
| Accumulated depreciation and amortization | () | | | () | |
| Net property and equipment | | | | | |
| Total assets | $ | | | | $ | | |
| LIABILITIES AND SHAREHOLDERS’ EQUITY (DEFICIT) | | | |
| Current liabilities | | | |
| Short-term borrowings and current maturities of long-term debt | $ | | | | $ | | |
| Accounts payable | | | | | |
| Lease liability | | | | | |
| Income taxes | | | | | |
| Other taxes | | | | | |
| Accrued interest | | | | | |
| Accrued payroll and other liabilities | | | | | |
| |
| |
| Total current liabilities | | | | | |
| Long-term debt | | | | | |
| Long-term lease liability | | | | | |
| Long-term income taxes | | | | | |
| Deferred revenues - initial franchise fees | | | | | |
| Other long-term liabilities | | | | | |
| Deferred income taxes | | | | | |
| Shareholders’ equity (deficit) | | | |
Preferred stock, par value; authorized – million shares; issued – | | | | | |
Common stock, $ par value; authorized – billion shares; issued – million shares | | | | | |
| Additional paid-in capital | | | | | |
| Retained earnings | | | | | |
| Accumulated other comprehensive income (loss) | () | | | () | |
Common stock in treasury, at cost; and million shares | () | | | () | |
| Total shareholders’ equity (deficit) | () | | | () | |
| Total liabilities and shareholders’ equity (deficit) | $ | | | | $ | | |
See Notes to consolidated financial statements.
McDonald's Corporation 2023 Annual Report 40
Consolidated Statement of Cash Flows
| | | | | | | | | | | | | | | | | | | | |
| In millions | Years ended December 31, 2023 | | 2022 | | 2021 |
| Operating activities | | | | | |
| Net income | $ | | | | $ | | | | $ | | |
| Adjustments to reconcile to cash provided by operations | | | | | |
| Charges and credits: | | | | | |
| Depreciation and amortization | | | | | | | | |
| Deferred income taxes | () | | | () | | | () | |
| Share-based compensation | | | | | | | | |
| Net (gain) loss on sale of restaurant and other businesses | () | | | | | | () | |
| Other | () | | | () | | | () | |
| Changes in working capital items: | | | | | |
| Accounts receivable | () | | | () | | | | |
| Inventories, prepaid expenses and other current assets | | | | | | | () | |
| Accounts payable | | | | | | | | |
| Income taxes | () | | | () | | | () | |
| Other accrued liabilities | | | | | | | | |
| Cash provided by operations | | | | | | | | |
| Investing activities | | | | | |
| Capital expenditures | () | | | () | | | () | |
| Purchases of restaurant businesses | () | | | () | | | () | |
| Sales of restaurant and other businesses | | | | | | | | |
| | | |
| Sales of property | | | | | | | | |
| Other | () | | | () | | | () | |
| Cash used for investing activities | () | | | () | | | () | |
| Financing activities | | | | | |
| Net short-term borrowings | | | | | | | | |
| Long-term financing issuances | | | | | | | | |
| Long-term financing repayments | () | | | () | | | () | |
| Treasury stock purchases | () | | | () | | | () | |
| Common stock dividends | () | | | () | | | () | |
| Proceeds from stock option exercises | | | | | | | | |
| Other | () | | | | | | () | |
| Cash used for financing activities | () | | | () | | | () | |
| Effect of exchange rates on cash and equivalents | () | | | () | | | () | |
| Cash and equivalents increase (decrease) | | | | () | | | | |
| | | |
| Cash and equivalents at beginning of year | | | | | | | | |
| Cash and equivalents at end of year | $ | | | | $ | | | | $ | | |
| Supplemental cash flow disclosures | | | | | |
| Interest paid | $ | | | | $ | | | | $ | | |
| Income taxes paid | | | | | | | | |
See Notes to consolidated financial statements.
McDonald's Corporation 2023 Annual Report 41
Consolidated Statement of Shareholders’ Equity (Deficit)
| | | | | | | | | | | | | | | | | | | | | | | | | | | | | | | | | | | | | | | | | | | | | | | | | | | | | | | | | | | |
| | Common stock
issued | | | | | | Accumulated other
comprehensive income (loss) | | Common stock in
treasury | Total
shareholders’
equity (deficit) |
Additional
paid-in
capital | | Retained
earnings | Pensions | Cash flow
hedges | Foreign
currency
translation | |
| In millions, except per share data | Shares | Amount | Shares | | Amount |
| Balance at December 31, 2020 | | | | $ | | | | $ | | | | $ | | | | $ | () | | | $ | () | | | $ | () | | | () | | | $ | () | | | $ | () | |
| Net income | | | | | | | | | | | | | | | | | | | | | |
Other comprehensive income (loss),
net of tax | | | | | | | | | | | | | | | () | | | | | | | | |
Comprehensive income | | | | | | | | | | | | | | | | | | | | |
Common stock cash dividends ($ per share) | | | | | | | () | | | | | | | | | | | | | () | |
| Treasury stock purchases | | | | | | | | | | | | | | | () | | | () | | | () | |
| Share-based compensation | | | | | | | | | | | | | | | | | | | | | |
| Stock option exercises and other | | | | | | | | | | | | | | | | | | | | | | | |
| Balance at December 31, 2021 | | | | | | | | | | | | | () | | | () | | | () | | | () | | | () | | | () | |
| Net income | | | | | | | | | | | | | | | | | | | | | |
Other comprehensive income (loss), net of tax | | | | | | | | | () | | | | | | | | | | | | | | |
Comprehensive income | | | | | | | | | | | | | | | | | | | | |
Common stock cash dividends ($ per share) | | | | | | | () | | | | | | | | | | | | | () | |
| Treasury stock purchases | | | | | | | | | | | | | | | () | | | () | | | () | |
| Share-based compensation | | | | | | | | | | | | | | | | | | | | | |
| Stock option exercises and other | | | | | | | | | | | | | | | | | | | | | | | |
| Balance at December 31, 2022 | | | | | | | | | | | | | () | | | | | | () | | | () | | | () | | | () | |
| Net income | | | | | | | | | | | | | | | | | | | | | |
Other comprehensive income (loss), net of tax | | | | | | | | | () | | | () | | | | | | | | | | | |
Comprehensive income | | | | | | | | | | | | | | | | | | | | |
Common stock cash dividends ($ per share) | | | | | | | () | | | | | | | | | | | | | () | |
| Treasury stock purchases | | | | | | | | | | | | | | | () | | | () | | | () | |
| Share-based compensation | | | | | | | | | | | | | | | | | | | | | |
| Stock option exercises and other | | | | | | | | | | | | | | | | | | | | | | | |
| Balance at December 31, 2023 | | | | $ | | | | $ | | | | $ | | | | $ | () | | | $ | () | | | $ | () | | | () | | | $ | () | | | $ | () | |
See Notes to consolidated financial statements.
McDonald's Corporation 2023 Annual Report 42
| | |
| Notes to Consolidated Financial Statements |
|
| | | | | | |