MONRO, INC. - Annual Report: 2021 (Form 10-K)
UNITED STATES
SECURITIES AND EXCHANGE COMMISSION
Washington, D.C. 20549
_________________________________________
FORM 10-K
_________________________________________
(Mark One)
|
|
x | ANNUAL REPORT PURSUANT TO SECTION 13 OR 15(d) OF THE SECURITIES EXCHANGE ACT OF 1934 |
For the fiscal year ended March 27, 2021
OR
|
|
o | TRANSITION REPORT PURSUANT TO SECTION 13 OR 15(d) OF THE SECURITIES EXCHANGE ACT OF 1934 |
Commission File Number 0-19357
_________________________________________

Monro, Inc.
(Exact name of Registrant as specified in its Charter)
|
|
|
|
|
| New York |
| 16-0838627 |
|
| (State or other jurisdiction |
| (I.R.S. Employer |
|
|
|
|
|
|
| 200 Holleder Parkway, |
|
|
|
| Rochester, New York |
| 14615 |
|
| (Address of principal executive offices) |
| (Zip Code) |
|
Registrant’s telephone number, including area code: (585) 647-6400
_________________________________________
Securities registered pursuant to Section 12(b) of the Act:
Title of each class |
| Trading Symbol(s) |
| Name of each exchange on which registered |
Common Stock, par value $.01 per share |
| MNRO |
| The Nasdaq Stock Market |
Securities registered pursuant to Section 12(g) of the Act: None
Indicate by check mark if the registrant is a well-known seasoned issuer, as defined in Rule 405 of the Securities Act. YES NO o
Indicate by check mark if the registrant is not required to file reports pursuant to Section 13 or 15(d) of the Act. YES o NO
Indicate by check mark whether the registrant (1) has filed all reports required to be filed by Section 13 or 15(d) of the Securities Exchange Act of 1934 during the preceding 12 months (or for such shorter period that the Registrant was required to file such reports), and (2) has been subject to such filing requirements for the past 90 days. YES NO o
Indicate by check mark whether the registrant has submitted electronically every Interactive Data File required to be submitted pursuant to Rule 405 of Regulation S-T (§232.405 of this chapter) during the preceding 12 months (or for such shorter period that the Registrant was required to submit such files). YES NO o
Indicate by check mark whether the registrant is a large accelerated filer, an accelerated filer, a non-accelerated filer, smaller reporting company, or an emerging growth company. See the definitions of “large accelerated filer,” “accelerated filer,” “smaller reporting company,” and “emerging growth company” in Rule 12b-2 of the Exchange Act.
|
|
|
|
|
Large Accelerated Filer | x |
| Accelerated Filer | o |
Non-Accelerated Filer | o |
| Smaller Reporting Company | o |
Emerging Growth Company | o |
|
|
|
If an emerging growth company, indicate by check mark if the registrant has elected not to use the extended transition period for complying with any new or revised financial accounting standards provided pursuant to Section 13(a) of the Exchange Act. o
Indicate by check mark whether the registrant has filed a report on and attestation to its management’s assessment of the effectiveness of its internal control over financial reporting under Section 404(b) of the Sarbanes Oxley Act (15 U.S.C. 7262(b)) by the registered public accounting firm that prepared or issued its audit report. x
Indicate by check mark whether the Registrant is a shell company (as defined in Rule 12b-2 of the Exchange Act). YES o NO x
The aggregate market value of the voting and non-voting common equity held by non-affiliates of the Registrant, based on the closing price of the shares of common stock on The Nasdaq Stock Market on September 25, 2020 was $1,331,800,000.
The number of shares of Registrant’s Common Stock outstanding as of May 21, 2021 was 33,492,878.
DOCUMENTS INCORPORATED BY REFERENCE
Portions of the registrant’s definitive Proxy Statement for its 2021 Annual Meeting of Shareholders to be held hereafter are incorporated by reference into Part III of this report.
TABLE OF CONTENTS
PART I
Cautionary Note Regarding Forward-Looking Statements
This Annual Report on Form 10-K contains “forward-looking statements” as that term is used in the Private Securities Litigation Reform Act of 1995. Forward-looking statements can be identified by the fact that they address future events, developments and results and do not relate strictly to historical facts. Any statements contained herein that are not statements of historical fact may be deemed to be forward-looking statements. Forward-looking statements include, without limitation, statements preceded by, followed by or including words such as “anticipate,” “appear,” “believe,” “contemplate,” “could,” “estimate,” “expect,” “intend,” “may,” “plan,” “potential,” “see,” “strategy,” “vision,” “will,” “would” and variations thereof and similar expressions. Forward-looking statements are subject to risks, uncertainties and other important factors that could cause actual results to differ materially from those expressed. For example, our forward-looking statements include, without limitation, statements regarding:
•the potential effect of general business or economic conditions on our business, including the direct and indirect effects of the novel strain of coronavirus (“COVID-19”) pandemic on the economy, consumer spending levels, and unemployment in our markets;
•the uncertainty of the impact of the COVID-19 pandemic and public health measures on our business and results of operations, including uncertainties surrounding possible disruptions in our supply chain or sources of supply, the physical and financial health of our customers, the effectiveness and duration of government assistance programs to individuals, households and businesses to support consumer spending, levels of traffic in our stores, changes in customer demand for our services, and increased expenses for higher wages and compensation paid to employees and the cost of personal protective equipment and additional cleaning supplies and protocols for the safety of our employees;
•our expectations regarding cost increases in the future, including costs relating to our COVID-19 response initiatives, increases in the minimum wage by states and localities, potential federal minimum wage legislation, increases in distribution and fuel costs and potential new legal requirements to provide increased pay for employees who work during pandemic restrictions;
•the effect of economic conditions, seasonality and the impact of weather conditions and natural disasters on customer demand;
•the dependence on and our expectation regarding competition within the primary markets in which our stores are located;
•our growth plans, including our plans to add, renovate, re-brand, expand, remodel, relocate or close stores and any related costs or charges, our leasing strategy for future expansion, and our ability to renew leases at existing store locations;
•the impact of competitive services and pricing;
•the reliability of, and cost associated with, our sources of parts supply, particularly imported goods such as those sourced from China;
•the impact of trade relations and the ongoing trade dispute between the United States and China, including the actual and potential effect of Section 301 tariffs on Chinese goods imposed by the United States Trade Representative, uncertainties surrounding the policies of the new presidential administration, and other potential impediments to imports;
•the impact of industry regulation;
•our ability to service our debt obligations, including our expected annual interest expense;
•our cash needs, including our ability to fund our future capital expenditures and working capital requirements;
•our anticipated sales, comparable store sales, gross profit margin, costs of goods sold (including product mix), operating, selling, general and administrative expenses and other fixed costs, and our ability to leverage those costs;
•advances in automotive technologies;
•risks relating to disruption or unauthorized access to our computer systems;
•our failure to protect customer and employee personal data;
•business interruptions;
•potential outcomes related to pending or future litigation matters;
•risks relating to acquisitions and the integration of acquired businesses with ours;
•the effect of changes in labor laws, and the effect of the Fair Labor Standards Act as it relates to the qualification of our managers for exempt status, minimum wage and health care law;
•our assessment of the materiality and impact on our business of recent accounting pronouncements adopted by the Financial Accounting Standards Board (“FASB”);
•management’s estimates and expectations as they relate to income tax liabilities, deferred income taxes and uncertain tax positions; and
•management’s estimates associated with our critical accounting policies, including business combinations, self-insurance liabilities and valuations for our goodwill and indefinite-lived intangible assets impairment analyses.
Any of these factors, as well as such other factors as discussed in Part I, Item 1A., “Risk Factors” and throughout Part II, Item 7., “Management’s Discussion and Analysis of Financial Condition and Results of Operations” of this Annual Report on Form 10-K (“Form 10-K”), as well as in our periodic filings with the Securities and Exchange Commission (the “SEC”), could cause our actual results to differ materially from our anticipated results. The information provided in this Form 10-K is based upon the facts and circumstances known as of the date of this report, and any forward-looking statements made by us in this Form 10-K speak only as of the date on which they are made. Except as required by law, we undertake no obligation to update these forward-looking statements after the date of this Form 10-K to reflect events or circumstances after such date, or to reflect the occurrence of unanticipated events.
Introductory Note
Unless otherwise stated, references to “we,” “our,” “us,” “Monro” or the “Company” generally refer to Monro, Inc. and its direct and indirect subsidiaries on a consolidated basis. Unless specifically indicated otherwise, any references to “2021” or “fiscal 2021,” “2020” or “fiscal 2020,” and “2019” or “fiscal 2019” relate to the years ended March 27, 2021, March 28, 2020 and March 30, 2019, respectively.
Available Information
Our annual reports on Form 10-K, quarterly reports on Form 10-Q, current reports on Form 8-K and amendments to those reports filed or furnished pursuant to Section 13(a) or 15(d) of the Securities Exchange Act of 1934 are available free of charge on our website at www.monro.com as soon as reasonably practicable after electronic filing of such reports with the SEC.
Our investor presentation regarding the financial results for the fiscal year ended March 27, 2021 is available and accessible at Monro's Investor Relations page at https://corporate.monro.com/investors. Information available on our website is not a part of, and is not incorporated into, this Form 10-K. We intend to make future investor presentations available exclusively through our Investor Relations page.
Item 1. Business
General
We are a leading nation-wide operator of retail tire and automotive repair stores in the United States. We offer to our customers, referred to as “guests”, replacement tires and tire related services, automotive undercar repair services as well as a broad range of routine maintenance services, primarily on passenger cars, light trucks and vans. We also provide other products and services for brakes; mufflers and exhaust systems; and steering, drive train, suspension and wheel alignment.
We believe the convenience and value we offer are key factors in serving and growing our base of customers. At March 27, 2021, we operated 1,263 retail tire and automotive repair stores and serviced approximately 4.8 million vehicles in fiscal 2021.
Our retail tire and automotive repair stores operate primarily under the names “Monro Auto Service and Tire Centers,” “Tire Choice Auto Service Centers,” “Mr. Tire Auto Service Centers,” “Car-X Tire & Auto,” “Tire Warehouse Tires for Less,” “Ken Towery’s Tire & Auto Care,” “Tire Barn Warehouse,” and “Free Service Tire & Auto Centers.”
|
|
|
|
|
|
Company-operated Store Brands as of March 27, 2021 |
| Stores |
Monro Auto Service and Tire Centers |
| 375 |
Tire Choice Auto Service Centers |
| 358 |
Mr. Tire Auto Service Centers |
| 321 |
Car-X Tire & Auto |
| 57 |
Tire Warehouse Tires for Less |
| 55 |
Ken Towery's Tire & Auto Care |
| 34 |
Tire Barn Warehouse |
| 27 |
Free Service Tire & Auto Centers |
| 10 |
Other (a) |
| 26 |
Total |
| 1,263 |
(a)Recent 2021 and 2020 acquisition stores to be converted to Tire Choice Auto Service Centers brand.
The typical format for a Monro store is a free-standing building consisting of a sales area, fully-equipped service bays and a parts/tires storage area. Most service bays are equipped with above-ground electric vehicle lifts. Generally, each store is located within 25 miles of a “key” store which carries approximately double the inventory of a typical store and serves as a mini-distribution point for slower moving inventory for other stores in its area. Individual store sizes, number of bays and stocking levels vary greatly and are dependent primarily on the availability of suitable store locations, population, demographics and intensity of competition among other factors.
A certain number of our retail locations also service commercial customers. Our locations that serve commercial customers generally operate consistently with our other retail locations, except that the sales mix for these locations includes a higher number of commercial tires.
As of March 27, 2021, Monro had seven wholesale locations and three retread facilities. The wholesale locations, in most cases, sell tires to customers for resale, although these tire sales do not include installation or other tire related services. The retread facilities re-manufacture tires through the replacement of tread on worn tires that are later sold to customers. Monro also had 95 Car-X franchised locations as of March 27, 2021. (Two franchised locations were closed during 2021.)
Our operations are organized and managed in one operating segment. The internal management financial reporting that is the basis for evaluation in order to assess performance and allocate resources by our chief operating decision maker consists of consolidated data that includes the results of our retail, commercial and wholesale locations. As such, our one operating segment reflects how our operations are managed, how resources are allocated, how operating performance is evaluated by senior management and the structure of our internal financial reporting.
Monro incorporated in New York in 1959. We maintain our corporate headquarters in Rochester, New York.
Business Strategy
Our vision is to be America’s leading auto and tire service center, trusted by consumers as the best place in their neighborhoods for quality automotive service and tires. We believe that success in this vision will position Monro to deliver consistent and sustainable organic growth as well as lead to strong, long-term financial performance. Specifically, we are committed to seeing this vision executed across all aspects of the business, through the following actions:
•Exceed guest expectations. We will continue to invest in and execute strategic initiatives to improve our guests’ in-store experience. This ranges from modernized store infrastructure through rebranding and reimaging investments, new tire pricing and category management technology to match customer demand and building an omni-channel presence.
•Provide consistent value. We intend to be able to offer better value than new car dealers to more price-sensitive consumers. Vehicles generally need more service and repairs as they advance in age. However, as consumers’ vehicles age, the consumers’ willingness to pay higher prices decreases. Monro’s service menu is focused on items that are purchased frequently, like oil changes and other scheduled services, along with higher value services like tires, brakes and other undercar services. Our tire pricing and category management system allows us to dynamically track demand trends and make rapid adjustments to optimize our tire assortment by leveraging the breadth of our tire brand portfolio to offer the right tires at what we believe are the right price points.
•Build a committed, knowledgeable organization of friendly and professional teammates. We will continue to invest in technology and training to accelerate productivity and team engagement. This includes our data-driven cloud-based store staffing and scheduling software that re-balances our store technician labor to meet customer demand as well as utilizing Monro University, an extensive cloud-based learning curriculum, to provide our employees, referred to as “teammates,” with the technical training needed to effectively serve our customers today and into the future.
We are committed to building an omni-channel presence through our primary retail websites in order to create a seamless buying experience for our customers. With responsive optimized design for mobile users, a streamlined tire search and improved content and functionality, our retail websites better position us to address our customers’ needs. These websites, aligned with our primary retail names, help customers search for store locations, access coupons, make service appointments, shop for tires and access information on our services and products, as well as car care tips. Importantly, they better showcase the solutions we provide to our customers, including our Good, Better, Best product and service packages.
To minimize the impact of the COVID-19 pandemic on our business, we modified our plans for some of our strategic initiatives, including temporarily suspending all reimaging and rebranding investments related to our store transformation program during the first three months of fiscal 2021. With sales improvement throughout the year, we resumed these investments and completed the store transformation of 147 stores in fiscal 2021. To date, we have completed the transformation of 366 stores.
Growth Strategy
Executing on accretive acquisition opportunities remains a key element of our growth strategy. We have a robust pipeline and believe the fragmentation of our industry allows for many opportunities for consolidation. Using consumer demographic analytics, we believe we are able to better identify targets that operate in the markets with favorable demographics and customer trends, allowing us to enter regions from which we are poised to benefit most. Additionally, to ensure we are capitalizing on these opportunities, we have added talent and an organizational structure to our mergers and acquisitions team, who will work with our management team to ensure we capitalize on the momentum in the market.
During the last five years, we have completed 19 acquisitions, adding 262 locations and approximately $411 million in annualized revenue. Additionally, during this time, we have entered seven states, solidifying our presence in the Southern markets as well as expanding into the Western region. As of March 27, 2021, we have stores in 32 states.
Although acquisition activity was temporarily paused in response to the COVID-19 pandemic during the first six months of fiscal 2021, we continued to evaluate potential acquisition candidates that we believe would fit our growth strategy while maintaining financial discipline, and we acquired 17 retail tire and automotive repair stores located in California during December 2020.
Subsequent to March 27, 2021, we acquired 30 retail tire and automotive repair stores located in California from Mountain View Tire & Service, Inc. on April 25, 2021.
In addition to our plan to continue to seek suitable acquisitions, we plan to add new greenfield stores. Greenfield stores include new construction as well as the acquisition of one to four store operations.
Key factors in market and site selection for selecting new greenfield store locations include population, demographic characteristics, vehicle population and the intensity of competition. We partner with a customer analytics firm to provide market segmentation and demographic data specific to a geographic area in close proximity to a Monro location to identify high value lookalike customers and market directly to them. We attempt to cluster stores in market areas in order to achieve economies of scale in advertising, supervision and distribution costs. All new greenfield sites presently under consideration are within our established market areas.
Purchasing and Distribution
We believe that our substantial buying power and our flexibility in making sourcing decisions contributes to our successful purchasing strategy. We also believe our ability to negotiate with our vendor partners allows us to ensure we are receiving competitive pricing and terms as well as minimize the margin impact of economic pressures such as tariffs.
We select and purchase tires, parts and supplies for all Company-operated stores on a centralized basis through an automatic replenishment system based on operational data we collect from stores on a daily basis. This allows us to control store inventory on a near real-time basis. Additionally, each store has access to the inventory carried by up to the 14 stores or distribution center nearest to it. Management believes that this feature improves customer satisfaction and store productivity by reducing the time required to locate out-of-stock parts and tires. It also improves profitability because it reduces the amount of inventory which must be purchased outside Monro from local vendors. Purchases outside Monro are made when needed at the store level and accounted for approximately 18 percent of all parts and tires used in 2021.
Our ten largest vendors accounted for approximately 73 percent of our total stocking purchases, with the largest vendor accounting for approximately 24 percent of total stocking purchases in 2021. In 2021, Monro imported approximately 26 percent of our parts (excluding batteries, oil and supplies) and tire purchases. We purchase parts, oil and tires from 98 vendors. Management believes that our relationships with vendors are excellent and that alternative sources of supply exist, at comparable cost, for substantially all parts used in our business.
We enter into contracts with certain parts and tire suppliers, some of which require us to buy (at market competitive prices) up to 100 percent of our annual purchases of specific products. These agreements expire at various dates. We believe these agreements provide us with high quality, branded merchandise at preferred pricing, along with strong marketing and training support.
The majority of our parts supply is distributed to our stores through our network of distribution centers, and vendors ship the majority of our tires supply directly to our stores. Stores are generally replenished at least bi-weekly, and such replenishment fills, on average, 96 percent of all items ordered by the automatic replenishment system. Monro operates eleven distribution centers in California, Kentucky, Maryland, New Hampshire, New York, North Carolina, South Carolina and Tennessee.
Human Capital
At Monro, our business success is built upon our dedicated, passionate and diverse teammates who work and live in the communities we serve. We are committed to providing a safe, healthy, inclusive and supportive work environment where teammates embrace our core value of collaboration, feel empowered and are motivated to have enriching and successful careers. We seek to be an employer of choice to attract and retain top talent. To that end, we strive to provide an engaging work experience that excites and motivates our teammates to deliver their best every day as well as provides opportunities for learning and growth, to ensure our team is always the best in the business.
As of March 27, 2021, Monro had approximately 7,800 employees, of whom 7,270 were employed in the field organization, 210 were employed at the distribution centers, 260 were employed at our corporate headquarters, referred to as store support center, and 60 were employed in other offices. Monro's employees are not members of any union. Due to the impact of the COVID-19 pandemic, we reduced our workforce through furlough or other reduction. With sales improvement, we adjusted our workforce to meet demand.
Teammate Retention
We understand that our teammates will benefit from a clear path to advancement and from investments in their continuous learning to allow them to achieve their personal development needs and career growth. To that end, we invest in training and development programs at all levels within the Company. We also leverage annual processes that support individual performance planning, individual professional development planning and a broad review of talent throughout our organization. Our continuous efforts are reflected in our turnover rates, which are our lowest since 2015.
During fiscal 2020 our online training platform, Monro University, was initially focused on the technical and operational excellence training that technicians need to effectively serve our customers today and prepare them to handle future requirements. We have since expanded the platform across a wide variety of topics accessible to our teammates in our stores, distribution centers and store support center.
New technician development has been an area of particular focus for Monro to increase productivity and retention and make it easier for technicians to overcome barriers of joining the industry. One way we do this is by offering a tool purchase program through which trainee technicians can acquire their own set of tools. We also provide Automotive Service Excellence (“ASE”) certification in eight different categories as technicians advance in their careers.
Store and operations managers also have courses available through Monro University that are supplemented with live and on-line vendor training courses. Management training covers topics including safety, customer service, human resources, leadership and scheduling, and is delivered on a regular basis. We believe that involving operations management in the development and delivery of these sessions results in more relevant and actionable training for store managers, helping improve staff retention as well as overall performance.
Monro University also provides targeted training for corporate management and staff, including diversity training, harassment training and people manager training.
We also foster development through annual reviews at which time employees can discuss with their manager goals for aligning their own development with our business objectives.
The compensation for our teammates is tied to, and increases with, increased productivity. Our store compensation plan also streamlines bonus programs, creating consistency and providing us the ability to use human capital more productively across our stores.
In fiscal 2022, we will provide all teammates with an engagement and satisfaction survey, and intend to use those results to inform further strategy and goal-setting.
In addition to providing ongoing learning and development opportunities, ensuring our teammates feel supported is also important in teammate retention. Besides standard employee benefits we offer a confidential Employee Assistance Program with 24/7 support, financial counseling, estate planning, and online resources for parents whose children struggle with developmental disabilities, as well as other services aimed at enhancing our teammates’ well-being.
Workplace Safety
We are committed to providing a safe and secure work environment and have specific safety programs. To identify elevated safety-related risk areas more effectively, we have increased our focus on data gathering, tracking and analysis. With greater insight into real-time data, we can prioritize focus on areas that present the biggest potential hazards to our teammates and identify process improvements. Another important component of our risk analysis is conducting formal and thorough investigations into safety-related incidents. Investigations are analyzed by our Vice President of Risk and Safety as well as our Risk Management Team to determine a root cause, and pro-active plans are in place to improve safety related patterns that emerge, determining the next steps to address these patterns.
Monro’s training programs are key to our strong safety culture. Training increases awareness and helps to reduce and eliminate workplace accidents and injuries. Our Monro University platform has allowed us to conduct more robust and structured trainings based on a teammates’ job position, and Monro’s safety manuals are available at every workstation within our stores and distribution centers and serve as the basis for our safety training and protocols.
COVID-19
Given the significant impact of the COVID-19 pandemic, the end of fiscal 2020 and all of fiscal 2021 presented a unique set of challenges. In February 2020, we formed a COVID-19 Crisis Committee comprised of members of management that has been leading and coordinating the Company’s overall response. This team leads efforts to develop and monitor mitigation and business continuity plans; track all relevant state and local government guidelines, directives and regulations; develop work-from-home plans for non-store teammates; implement safe working protocols for store teams; assess appropriate return-to-office protocols; and provide timely and transparent communications to teammates and key stakeholders. We also incurred additional costs in procuring and distributing the supplies necessary to keep our teammates safe, such as cleaning supplies, face masks and other protective equipment, including sneeze guards installed at each sales counter, as well as investments in technology to allow our teammates to work remotely.
Diversity, Equity and Inclusion
Diversity is one of our core values and we are committed to driving diversity, equity and inclusion across our Company. This commitment will continue to be supported by training and awareness programs as well as focused efforts to recruit, retain, develop and promote a diverse workforce. Our Code of Ethics lays out a zero-tolerance policy for discrimination or harassment behavior.
We are taking action to increase the focus on our diversity efforts and are committed to making continuous progress. In 2020, we formed a Team Resource Group (“TRG”), comprised of a cross-functional coalition of teammates to educate and provide resources and training to help Monro build and maintain an inclusive culture where every teammate feels they belong, can contribute and are
able to reach their full potential. A Diversity, Equity & Inclusion (“DE&I”) expert consultant and the TRG have also been working with the Senior Leadership Team to assist in the formulation of an official DE&I strategy which will include goals and a long-term plan.
We have also added resources to our recruitment team to help launch new hiring initiatives aimed at reaching diverse groups and are also expanding the recruitment platforms we use to broaden our pool of candidates.
We also view training as a tool to foster inclusion and, through Monro University, we provide Unconscious Bias Diversity and Inclusion Awareness courses to our teammates.
Competition
Our segment of the retail industry is fragmented and highly competitive, and the number, size and strength of competitors vary widely from region to region. We operate in the automotive repair service and tire industry, which is currently and is expected to continue to be highly competitive with respect to price, store location, name awareness and customer service. Monro's primary competitors include national and regional undercar, tire specialty and general automotive service chains, both franchised and company-operated; car dealerships, mass merchandisers’ operating service centers; and, to a lesser extent, gas stations, independent garages and Internet tire sellers. Monro considers TBC Corporation (operating primarily under the NTB, Midas and Tire Kingdom brands), Firestone Complete Auto Care service stores, The Pep Boys – Manny, Moe and Jack service stores, Meineke, and Mavis Discount Tire to be direct competitors.
Regulation
We maintain programs to facilitate compliance with various federal, state and local laws and governmental regulations relating to the operation of our business, including, among other things, those regarding employment and labor practices, workplace safety, building and zoning requirements, the handling, storage and disposal of hazardous substances contained in the products that we sell and use in our service bays, the recycling of batteries, tires and used lubricants, and the ownership and operation of real property. We believe that we are in compliance with these applicable laws and regulations, and our related compliance costs are not material.
Monro stores new oil and recycled antifreeze and generates and/or handles used tires and automotive oils, antifreeze and certain solvents, which are disposed of by licensed third-party contractors. In certain states, as required, we also recycle oil filters. Accordingly, we are subject to numerous federal, state and local environmental laws including the Comprehensive Environmental Response Compensation and Liability Act. In addition, the United States Environmental Protection Agency (the "EPA"), under the Resource Conservation and Recovery Act ("RCRA"), as well as various state and local environmental protection agencies, regulate our handling and disposal of certain waste products and other materials. The EPA, under the Clean Air Act, also regulates the installation of catalytic converters, engines and equipment sold or distributed in the United States by periodically spot checking repair jobs, and may impose sanctions, including but not limited to civil penalties of approximately $45,000 per violation (or approximately $45,000 per day for certain willful violations or failures to cooperate with authorities), for violations of RCRA and the Clean Air Act.
Monro strives to maintain an environmentally conscious corporate culture, demonstrated by our recycling policies at our offices, distribution centers and stores. In 2021, Monro recycled approximately 2.5 million gallons of oil and 3.3 million tires, as well as approximately 73,000 vehicle batteries and 316 tons of cardboard, all as part of our commitment to the environment.
Seasonality
Although our business is not highly seasonal, customers do purchase more undercar service during the period of March through October than the period of November through February, when miles driven tend to be lower. Sales of tires are more heavily weighted in the months of May through August, and October through December. The slowest months are typically January through April and September. As a result, profitability is typically lower during slower sales months, or months where mix is more heavily weighted toward tires, which is a lower margin category.
Sales can also be volatile in areas in which we operate as a result of warmer weather in winter months, which typically causes a decline in tire sales, or severe weather, which can result in store closures.
Given our use of a fiscal calendar, there may be some fluctuations between quarters due to holiday shifts in the calendar year and the number of days in a particular fiscal quarter or year. In addition, the COVID-19 outbreak has had an impact on consumer behaviors and customer traffic that may result in temporary changes in the seasonal fluctuations of our business.
Item 1A. Risk Factors
In addition to the risks discussed elsewhere in this annual report, the following are the important factors that could cause Monro’s actual results to differ materially from those projected in any forward looking statements:
Risks Related to our Business
Matters related to the COVID-19 pandemic have and will continue to significantly and adversely impact our business, financial position, results of operations and cash flows.
The spread of COVID-19 has created a global public health crisis that has resulted in widespread volatility and deteriorations in household, business, economic and market conditions. We have experienced negative impacts to demand for our products and services from the COVID-19 pandemic, which has and will continue to adversely affect our results of operations, and we are continuing to experience significant disruption to our normal business operations and may experience further disruption to our planned implementation of certain strategic initiatives.
Our business will continue to be affected by the broader economic effects from the COVID-19 pandemic and related regulatory and individual actions, including customer demand for our products and services. Because more people in the United States are working from home, those workers will likely drive less often, and are less likely to require our services or will require our services less often. If this trend continues, we may see a permanent decline in demand for our services. Although travel by car may replace air travel as the preferred means of transportation because of fear of the spread of COVID-19, the recessionary economic environment resulting from the COVID-19 pandemic may reduce levels of leisure travel, which would reduce the demand for our products and services. We anticipate disruption to the demand for our products and services throughout the course of the pandemic. For example, in fiscal 2021, we experienced significant declines in comparable store sales compared to 2020 due to lower store traffic and reduced store hours as a result of our, individuals’, and governmental responses to the COVID-19 pandemic. Additionally, our growth strategy was impacted by the pandemic, as we paused all store acquisition, rebrand, and reimage initiatives during the first quarter of fiscal 2021 in order to focus our efforts on determining the full impact of the COVID-19 pandemic on our business before restarting them later in fiscal 2021. Given the continuing uncertainty during the pandemic, we may have to pause these initiatives again if necessary to mitigate the effects of the pandemic.
While we have so far been able to source required products at reasonable cost, the pandemic may also affect our supply chain in ways that are beyond our control. We may also incur costs or experience further disruption to comply with new or changing regulations in response to the pandemic.
In addition, our continuing response to the pandemic could divert management’s attention from our key strategic priorities, increase costs as we prioritize health and safety matters for our employees and customers, cause us to reduce, delay, alter or abandon initiatives that may otherwise increase our long-term value, increase vulnerability to information technology or cybersecurity related risks as certain of our employees work remotely and otherwise continue to disrupt our business operations. For example, we have and expect to continue to incur additional costs and investments in supplies necessary to keep our employees and customers safe, such as face masks, hand sanitizer and cleaning supplies. We expect to encounter labor inefficiencies as we adjust to new operating models to adapt to operating during the pandemic while experiencing what we believe will be an increase in sales activity from 2021. Those labor inefficiencies may include difficulty in hiring employees if enhanced unemployment benefits are signed into law. As our employees return to more normalized store hours, there will also be increased risks to the health and safety of our employees and customers, particularly if there were to be one or more clusters of COVID-19 cases occurring at any of our stores or our corporate headquarters. We may also be subject to enhanced legal risks, including potential litigation related to the COVID-19 pandemic.
The overall magnitude of the COVID-19 pandemic, including the extent of its direct and indirect impact on our business, financial position, results of operations or liquidity is inherently uncertain due to the fluidity of the situation. Further, the ultimate impact of the COVID-19 pandemic depends on many factors that are not within our control, including, but not limited to: governmental, business and individuals' actions that have been and continue to be taken in response to the COVID-19 pandemic; the severity and duration of outbreaks of the virus; the effectiveness of vaccines; the impact of the COVID-19 pandemic and actions taken in response on global and regional economies, travel, and economic activity; the availability of federal, state, local or non-U.S. funding programs; general economic uncertainty in key global markets and financial market volatility; global economic conditions and levels of economic growth; and the pace of recovery, particularly in our markets, when the COVID-19 pandemic subsides.
We are unable to estimate the impact of the COVID-19 pandemic with certainty on our business and operations at this time. The pandemic could cause us to experience impairment of our goodwill and other financial assets, further reduce demand for our products and services and other adverse impacts on our financial position, results of operations and cash flows. Sustained adverse effects may also prevent us from satisfying financial covenants in our credit agreement, which would prevent us from paying dividends, or result in downgrades in our credit ratings.
We operate in the highly competitive automotive repair industry.
The automotive repair industry in which we operate is generally highly competitive and fragmented, and the number, size and strength of our competitors vary widely from region to region. We believe that competition in the industry is based primarily on customer service, reputation, store location, name awareness and price. Our primary competitors include national and regional undercar, tire specialty and general automotive service chains, both franchised and company-operated, car dealerships, mass merchandisers operating service centers and, to a lesser extent, gas stations, independent garages and Internet tire sellers. Some of our competitors have greater financial resources, are more geographically diverse and have better name recognition than we do, which might place us at a competitive disadvantage to those competitors. Because we seek to offer competitive prices, if our competitors reduce prices, we may be forced to reduce our prices, which could have a material adverse effect on our business, financial condition and results of operations. Further, our success within this industry also depends upon our ability to respond in a timely manner to changes in customer demands for both products and services. We cannot assure that we, or any of our stores, will be able to compete effectively. If we are unable to compete successfully in new and existing markets, we may not achieve our projected revenue and profitability targets.
We are subject to cycles in the general economy and customers’ use of vehicles and seasonality, which may impact demand for our products and services.
Our industry is influenced by the number of miles driven by automobile owners. Factors that may cause the number of miles driven by automobile owners to decrease include the weather, travel patterns, gas prices and fluctuations in the general economy. For example, as a result of the COVID-19 pandemic, there has been a marked decrease in the number of miles driven by automobile owners due to the various stay-at-home orders across the regions in which we operate. As a result of this reduction in the number of miles driven by automobile owners, there has been a negative effect on the demand for our products and services. As another example, when the retail cost of gasoline increases, the number of miles driven by automobile owners may decrease, which could result in less frequent service intervals and fewer repairs. The number of vehicle miles driven may also decrease if consumers begin to rely more heavily on mass transportation.
Sales can decline in areas in which we operate as a result of warmer weather in winter months or severe weather, which can result in store closures. Although our business is not highly seasonal, our customers typically purchase more undercar services during the period of March through October than the period of November through February, when miles driven tend to be lower. Further, customers may defer or forego vehicle maintenance at any time during periods of inclement weather. Sales of tires are more heavily weighted in the months of May through August, and October through December. The slowest months are typically January through April and September. As a result, profitability is typically lower during slower sales months or months where mix is more heavily weighted toward tires, which is a lower margin category.
Any continued significant reduction in the number of miles driven by automobile owners will have a material adverse effect on our business and results of operations.
Our business is affected by advances in automotive technology.
The demand for our products and services could be adversely affected by continuing developments in automotive technology. Automotive manufacturers are producing cars that last longer and require service and maintenance at less frequent intervals in certain cases. Quality improvement of manufacturers’ original equipment parts has in the past reduced, and may in the future reduce, demand for our products and services, adversely affecting our sales. For example, manufacturers’ use of stainless steel exhaust components has significantly increased the life of those parts, thereby decreasing the demand for exhaust repairs and replacements. Longer and more comprehensive warranty or service programs offered by automobile manufacturers and other third parties also could adversely affect the demand for our products and services. We believe that a majority of new automobile owners have their cars serviced by a dealer during the period that the car is under warranty.
Advances in electric vehicle technology and production may adversely affect the demand for our services because electric vehicles do not have traditional engines, transmissions, and certain related parts. An increase in the proportion of electric vehicles sold could decrease our service-related revenue. In addition, advances in automotive technology continue to require us to incur additional costs to update our diagnostic capabilities and technical training programs. Changes in vehicle and powertrain technology and advances in accident avoidance technology, electric vehicles, autonomous vehicles and mobility could have a negative effect on our business, results of operations or investors’ perception of our business, any of which could have an adverse effect upon the price of our common stock.
Changes in economic conditions that impact consumer spending could harm our business.
The automotive repair industry and our financial performance are sensitive to changes in overall economic conditions that impact consumer spending, including the economic volatility resulting from the COVID-19 pandemic. Future economic conditions affecting consumer income such as employment levels, business conditions, interest rates, inflation and tax rates could reduce consumer spending or cause consumers to shift their spending to other products. During periods of good economic conditions, consumers may decide to purchase new vehicles rather than servicing their older vehicles. In addition, if automobile manufacturers offer lower pricing on new or leased cars, more consumers may purchase or lease new vehicles rather than servicing older vehicles. A general reduction in the level of consumer spending or shifts in consumer spending to other services could have a material adverse effect on our growth, sales and profitability.
Changes in the U.S. trade environment, including the imposition of import tariffs, could adversely affect our consolidated results of operations and cash flows.
In recent years, trade tensions between the U.S. government and China have increased as the U.S. government has implemented and proposed tariffs and the Chinese government proposed retaliatory tariffs. Although we have no foreign operations and do not manufacture any products, tariffs imposed on products that we sell, such as tires, may cause our expenses to increase, which could adversely affect our profitability unless we are able to raise our prices for these products. If we increase the price of products impacted by tariffs, our service offerings may become less attractive relative to services offered by our competitors or cause our customers to delay needed maintenance. Given the uncertainty regarding the scope and duration of these trade actions by the U.S. or other countries, the impact of these trade actions on our operations or results remains uncertain. However, the tariffs, along with any additional tariffs or retaliatory trade restrictions implemented by other countries, could adversely affect the operating profits of our business, which could have an adverse effect on our consolidated results of operations and cash flows.
We depend on our relationships with our vendors, including foreign sources, for certain inventory. Our business may be negatively affected by the risks associated with such relationships and international trade.
We depend on close relationships with our vendors for parts, tires and supplies and for our ability to purchase products at competitive prices and terms. Our ability to purchase at competitive prices and terms results from the volume of our purchases from these vendors. We have entered into various contracts with parts suppliers that require us to buy from them (at market competitive prices) up to 100 percent of our annual purchases of specific products. These agreements expire at various dates.
We believe that alternative sources exist for most of the products we sell or use at our stores, and we would not expect the loss of any one supplier to have a material adverse effect on our business, financial condition or results of operations. If any of our suppliers do not perform adequately or otherwise fail to distribute parts or other supplies to our stores, our inability to replace the suppliers in a timely manner and on acceptable terms could increase our costs and could cause shortages or interruptions that could have a material adverse effect on our business, financial condition and results of operations.
Because we purchase products such as oil and tires, which are subject to cost variations related to commodity costs, if we cannot pass along cost increases, our profitability would be negatively impacted.
In addition, we depend on a number of products (e.g. brake parts, tires, oil filters) produced in foreign markets. Any changes in U.S. trade policies, or uncertainty with respect to the future of U.S. trade policies, resulting in increased costs which we are not able to offset with pricing increases of our own could adversely affect our financial performance.
We also face other risks associated with the delivery of inventory originating outside the United States, including:
potential economic and political instability in countries where our suppliers are located;
increases in shipping costs;
transportation delays and interruptions, including those occurring as a result of the COVID-19 pandemic;
compliance with the United States Foreign Corrupt Practices Act, which generally prohibits U.S. companies from engaging in bribery or making other prohibited payments to foreign officials; and
significant fluctuations in exchange rates between the U.S. dollar and foreign currencies.
If we are unable to generate sufficient cash flows from our operations, our liquidity will suffer and we may be unable to satisfy our obligations.
We currently rely on cash flow from operations and our $600 million revolving credit facility with eight banks (the “Credit Facility”) to fund our business. Amounts outstanding on the Credit Facility are reported as debt on our balance sheet. While we believe that we have the ability to sufficiently fund our planned operations and capital expenditures for the foreseeable future, various risks to our business could result in circumstances that would materially affect our liquidity. For example, cash flows from our operations could be affected by changes in consumer spending habits, the failure to maintain favorable vendor payment terms or our inability to successfully implement sales growth initiatives, among other factors. We may be unsuccessful in securing alternative financing when needed on terms that we consider acceptable.
On March 27, 2020, we borrowed $350 million available under the Credit Facility in order to enhance liquidity and financial flexibility given the uncertain market conditions caused by the COVID-19 pandemic. We subsequently repaid the $350 million previously borrowed during 2021 and there is $190.0 million outstanding under the Credit Facility as of March 27, 2021. A significant increase in our leverage could have the following risks:
our ability to obtain additional financing for working capital, capital expenditures, store renovations, acquisitions or general corporate purposes may be impaired in the future;
our failure to comply with the financial and other restrictive covenants governing our debt, which, among other things, require us to comply with certain financial ratios and limit our ability to incur additional debt and sell assets, could result in an event of default that, if not cured or waived, could have a material adverse effect on our business, financial condition and results of operations; and
our exposure to certain financial market risks, including fluctuations in interest rates associated with bank borrowings could become more significant.
Although we believe that we will remain in compliance with our debt covenants, if we are not able to do so our lenders may restrict our ability to draw on our Credit Facility, which could have a negative impact on our operations, ability to pay dividends, and growth potential, including our ability to complete acquisitions.
Legal, Regulatory and Technological Risks
Our industry is subject to environmental, consumer protection and other regulation.
We are subject to various federal, state and local environmental laws, building and zoning requirements, employment and labor laws and other governmental regulations regarding the operation of our business. For example, we are subject to rules governing the handling, storage and disposal of hazardous substances contained in some of the products such as motor oil that we sell and use at our stores, the recycling of batteries, tires and used lubricants, and the ownership and operation of real property. These laws and regulations can impose fines and criminal sanctions for violations as well as require the installation of pollution control equipment or operational changes to decrease the likelihood of accidental hazardous substance releases. Accordingly, we could become subject to material liabilities relating to the investigation and cleanup of contaminated properties, and to claims alleging personal injury or property damage as a result of exposure to, or release of, hazardous substances. In addition, stricter interpretation of existing laws and regulations, new laws and regulations, the discovery of previously unknown contamination or the imposition of new or increased requirements could require us to incur costs or become the basis of new or increased liabilities that could have a material adverse effect on our business, financial condition and results of operations.
National automotive repair chains have also been the subject of investigations and reports by consumer protection agencies and the Attorneys General of various states. Publicity in connection with these kinds of investigations could have an adverse effect on our sales and, consequently, our business, financial condition and results of operations. State and local governments have also enacted numerous consumer protection laws with which we must comply.
The costs of operating our stores may increase if there are changes in laws governing minimum hourly wages, working conditions, overtime, workers’ compensation and health insurance rates, unemployment tax rates or other laws and regulations. We have experienced and expect further increases in payroll expenses as a result of federal, state and local mandated increases in the minimum wage. In addition, our vendors may be affected by higher minimum wage standards, which may increase the prices we pay for their products. A material increase in these costs that we were unable to offset by increasing our prices or by other means could have a material adverse effect on our business, financial condition and results of operations.
We are involved in litigation from time to time arising from the operation of our business and, as such, we could incur substantial judgments, fines, legal fees or other costs.
We are sometimes the subject of complaints or litigation from customers, employees or other third parties for various actions. From time to time, we are involved in litigation involving claims related to, among other things, breach of contract, negligence, tortious conduct and employment and labor law matters, including payment of wages. We may also face claims related to the COVID-19 pandemic, including claims from employees or customers who contract COVID-19 at our stores or offices. The damages sought against us in some of these litigation proceedings could be substantial.
As disclosed in Part I, Item 3, “Legal Proceedings,” an action has been brought against us by an individual seeking to represent a putative class of store managers for unpaid overtime wages, damages and attorneys’ fees under the Fair Labor Standards Act and class certification under Pennsylvania law for alleged violations of state wage payment laws. Plaintiff alleges that improper deductions were made from store managers’ pay. If we settle these claims or the action is not resolved in our favor, we may suffer reputational damage and incur legal costs, settlements or judgments that exceed the amounts covered by our existing insurance policies. We can provide no assurances that our insurer will insure the legal costs, settlements or judgements we incur in excess of our deductible. If we are unsuccessful in defending ourselves from these claims or if our insurer does not insure us against legal costs we incur in excess of our deductible, the result may materially adversely affect our business, results of operations and financial condition.
Although we maintain liability insurance for some litigation claims, if one or more of the claims were to greatly exceed our insurance coverage limits or if our insurance policies do not cover a claim, this could have a material adverse effect on our business, financial condition, results of operations and cash flows.
Business interruptions may negatively impact our store operations, availability of products and/or the operability of our computer systems, which may have a material negative effect on our business and results of operations. A breach of our computer systems could damage our reputation and have a material adverse effect on our business and results of operations.
If any of our locations in a particular region are unexpectedly closed permanently or for a period of time, it could have a negative impact on our business. Such closures could occur as a result of circumstances out of our control, including war, acts of terrorism, global health crises, extreme weather conditions and other natural disasters. Further, if our ability to obtain products and merchandise for use in our stores is impeded, it could have a negative impact on our business. Factors that could negatively affect our ability to obtain products and merchandise include the sudden inability to import goods into the United States for any reason and the curtailment or delay of commercial transportation. While we do maintain business interruption insurance, there is no guarantee that we will be able to use such insurance for any particular location closure or other interruption in operations.
Additionally, given the number of individual transactions we process each year, it is critical that we maintain uninterrupted operation of our computer and communications hardware and software systems. Our systems could be subject to damage or interruption from power outages, computer and telecommunications failures, computer viruses, security breaches, including breaches of our transaction processing or other systems that result in the compromise of confidential customer data, catastrophic events such as fires, tornadoes and hurricanes, and usage errors by our employees. If our systems are breached, damaged or cease to function properly, we may have to make a significant investment to fix or replace them, we may suffer interruptions in our operations in the interim, we may face costly litigation, and our reputation with our customers may be harmed. The risk of disruption is increased in periods where complex and significant systems changes are undertaken. Any material interruption in our computer operations may have a material adverse effect on our business or results of operations.
If we experience a data security breach and confidential customer or employee information is disclosed, we may be subject to penalties and experience negative publicity, which could affect our customer relationships and have a material adverse effect on our business. We may incur increasing costs in an effort to minimize these cyber security risks.
The nature of our business involves the receipt and storage of personally identifiable data of our customers and employees. This type of data is subject to legislation and regulation in various jurisdictions. We have been subject to cyber-attacks in the past and we may suffer data security breaches arising from future attacks. We may currently be at a higher risk of a security breach due to the COVID-19 pandemic and the increased number of our employees who are working remotely. Data security breaches suffered by well-known companies and institutions have attracted a substantial amount of media attention, prompting state and federal legislative proposals addressing data privacy and security. We may become exposed to potential liabilities with respect to the data that we collect, manage and process, and may incur legal costs if our information security policies and procedures are not effective or if we are required to defend our methods of collection, processing and storage of personal data. Future investigations, lawsuits or adverse publicity relating to our methods of handling personal data could adversely affect our business, results of operations, financial condition and cash flows due to the costs and negative market reaction relating to such developments.
We may not have the resources or technical expertise to anticipate or prevent rapidly evolving types of cyber-attacks. Attacks have been targeted at us, our customers, or others who have entrusted us with information. Actual or anticipated attacks will cause us to incur increased costs, including costs to hire additional personnel, purchase additional protection technologies, train employees, and engage third-party experts and consultants. In addition, data and security breaches can also occur as a result of non-technical issues, including breach by us or by persons with whom we have commercial relationships that result in the unauthorized release of personal or confidential information. Any compromise or breach of our security could result in violation of applicable privacy and other laws, significant legal and financial exposure, and a loss of confidence in our security measures, which could have a material adverse effect on our results of operations and our reputation.
Risks Related to our Strategic Initiatives
We may not be successful in integrating new and acquired stores.
Management believes that our continued growth in sales and profit is dependent, in large part, upon our ability to operate new stores that we open or acquire on a profitable basis. In order to do so, we must find reasonably priced new store locations and acquisition candidates that meet our criteria and we must integrate any new stores (opened or acquired) into our system. Our growth and profitability could be adversely affected if we are unable to open or acquire new stores or if new or existing stores do not operate at a sufficient level of profitability. In addition, our profitability could be adversely affected if we fail to retain key personnel from acquired stores or assume unanticipated liabilities of acquired businesses. To the extent we acquire stores or expand into new geographic regions, we must anticipate the needs of customers and the vehicle population in those regions, which may differ from our existing customers and the vehicle populations we serve, while integrating the stores in the new geographic region into our existing network of stores. If new stores do not achieve expected levels of profitability or we are unable to integrate stores in new geographic regions into our business, our ability to remain in compliance with our debt covenants or to make required payments under our credit facility may be adversely impacted.
If our capital investments in remodeling existing or acquired stores, building new stores, and improving technology do not achieve appropriate returns, our competitive position, financial condition and results of operations could be adversely affected.
Our business depends, in part, on our ability to remodel existing or acquired stores and build new stores in a manner that achieves appropriate returns on our capital investment. Pursuing the wrong remodel or new store opportunities and any delays, cost increases, disruptions or other uncertainties related to those opportunities could adversely affect our results of operations.
We are currently making, and expect to continue to make, significant investments in technology to improve customer experience and certain management systems. The effectiveness of these investments can be less predictable than remodeling stores, and might not provide the anticipated benefits or desired rates of return.
Pursuing the wrong investment opportunities, making an investment commitment significantly above or below our needs, or failing to effectively incorporate acquired businesses into our business could result in the loss of our competitive position and adversely affect our financial condition or results of operations.
Any impairment of goodwill, other intangible assets or long-lived assets could negatively impact our results of operations.
Our goodwill is subject to an impairment test on an annual basis. Goodwill, other intangible assets and long-lived assets are also tested whenever events and circumstances indicate that goodwill, other intangible assets and/or long-lived assets may be impaired. Any excess goodwill resulting from the impairment test must be written off in the period of determination. Intangible assets (other than goodwill and indefinite-lived intangible assets) and other long-lived assets are generally amortized or depreciated over the useful life of such assets. In addition, from time to time, we may acquire or make an investment in a business that will require us to record goodwill based on the purchase price and the value of the acquired tangible and intangible assets. We have significantly increased our goodwill as a result of our acquisitions. We may subsequently experience unforeseen issues with the businesses we acquire, which may adversely affect the anticipated returns of the business or value of the intangible assets and trigger an evaluation of recoverability of the recorded goodwill and intangible assets. Future determinations of significant write-offs of goodwill, intangible assets or other long-lived assets, as a result of an impairment test or any accelerated amortization or depreciation of other intangible assets or other long-lived assets, including those caused by the impact of the COVID-19 pandemic, could have a material negative impact on our results of operations and financial condition.
Planned store closings have resulted in acceleration of costs and future store closings could result in additional costs.
From time to time, in the ordinary course of our business, we close certain stores, generally based on considerations of store profitability, competition, strategic factors and other considerations. The economic impact of the COVID-19 pandemic may require us
to close certain stores either temporarily or permanently. Closing a store could subject us to costs including the write-down of leasehold improvements, equipment, furniture and fixtures. In addition, we could remain liable for future lease obligations.
General Risk Factors
We may not pay or may reduce the dividends on our common stock.
Holders of our common stock are only entitled to receive such dividends as our Board of Directors may declare out of funds legally available for such payments. Although we have historically declared cash dividends on our common stock, we are not required to do so and may reduce or eliminate our common stock dividend in the future. This could adversely affect the market price of our common stock.
We rely on an adequate supply of skilled field personnel.
In order to continue to provide high quality services, we require an adequate supply of skilled field managers and technicians. Trained and experienced automotive field personnel are in high demand, and may be in short supply in some areas. We cannot assure that we will be able to attract, motivate and maintain an adequate skilled workforce necessary to operate our existing and future stores efficiently, or that labor expenses will not increase as a result of a shortage in the supply of skilled field personnel, thereby adversely impacting our financial performance. While the automotive repair industry generally operates with high field employee turnover, any material increases in employee turnover rates in our stores, inability to recruit new employees or any widespread employee dissatisfaction could also have a material adverse effect on our business, financial condition and results of operations.
We depend on the services of our key executives.
Our senior executives are important to our success because they have been instrumental in setting our strategic direction, operating our business, identifying, recruiting and training key personnel, identifying expansion opportunities and arranging necessary financing. Losing the services of any of these individuals could adversely affect our business until a suitable replacement is found. It may be difficult to replace them quickly with executives of comparable experience and capabilities. Although we have employment agreements with certain of our executives, we cannot prevent them from terminating their employment with us. To the extent we have turnover within our management team, we may have to spend more time and resources training new members of management and integrating them in our company. The loss of service of any one of our key executives would likely cause a disruption in our business plans and may adversely impact our results of operations.
We have had significant changes in executive leadership, and more changes could occur. Changes to strategic or operating goals, which can occur with the appointment of new executives, can create uncertainty, and may ultimately be unsuccessful. In addition, executive leadership transition periods, including adding new personnel, could be difficult as new executives gain an understanding of our business and strategy. Difficulty integrating new executives, or the loss of key individuals could limit our ability to successfully execute our business strategy and could have an adverse effect on our overall financial condition.
The market price of our common stock may be volatile and could expose us to shareholder action including securities class action litigation.
The stock market and the price of our common stock may be subject to wide fluctuations based upon general economic and market conditions. Downturns in the stock market may cause the price of our common stock to decline. The market price of our stock may also be affected by our ability to meet analysts’ expectations. Failure to meet such expectations, even slightly, could have an adverse effect on the price of our common stock. In the past, following periods of volatility in the market price of a company’s securities, shareholder action including securities class action litigation has often been instituted against such a company. If similar litigation were instituted against us, it could result in substantial costs and a diversion of our management’s attention and resources, which could have an adverse effect on our business.
Item 1B. Unresolved Staff Comments
None.
Item 2. Properties
|
|
|
|
|
|
|
Company-operated Stores as of March 27, 2021 |
| Stores |
| Company-operated Stores as of March 27, 2021 |
| Stores |
Arkansas |
| 2 |
| Minnesota |
| 9 |
California |
| 68 |
| Missouri |
| 26 |
Connecticut |
| 36 |
| Nevada |
| 14 |
Delaware |
| 6 |
| New Hampshire |
| 29 |
Florida |
| 107 |
| New Jersey |
| 44 |
Georgia |
| 13 |
| New York |
| 145 |
Idaho |
| 4 |
| North Carolina |
| 56 |
Illinois |
| 33 |
| Ohio |
| 142 |
Indiana |
| 39 |
| Pennsylvania |
| 130 |
Iowa |
| 3 |
| Rhode Island |
| 11 |
Kentucky |
| 33 |
| South Carolina |
| 18 |
Louisiana |
| 17 |
| Tennessee |
| 17 |
Maine |
| 18 |
| Vermont |
| 7 |
Maryland |
| 70 |
| Virginia |
| 70 |
Massachusetts |
| 40 |
| West Virginia |
| 10 |
Michigan |
| 31 |
| Wisconsin |
| 15 |
|
|
|
| Total |
| 1,263 |
|
|
|
|
|
|
|
|
|
|
|
|
|
|
Company-operated Stores and Other Properties as of March 27, 2021 |
|
|
| Distribution |
| Retread |
|
| Stores |
| Centers |
| Facilities |
Owned |
| 329 |
| 2 |
| 1 |
Leased |
| 871 |
| 9 |
| 2 |
Owned buildings on leased land |
| 63 |
| — |
| — |
Total |
| 1,263 |
| 11 |
| 3 |
Our policy is to situate new Company-operated stores in the best locations, without regard to the form of ownership required to develop the locations. In general, we lease store sites for a ten-year period with several renewal options (up to ten years). Giving effect to all renewal options, approximately 63 percent of the leases (587 stores) expire after March 2031. Certain leases provide for contingent rental payments if a percentage of annual gross sales exceed the base fixed rental amount. The highest contingent percentage rent of any lease is 7.5 percent, and no such lease has adversely affected profitability of the store subject thereto.
Our seven wholesale locations are situated within distribution centers that are leased.
We own our corporate headquarters building located in Rochester, New York, and we lease and own additional office space elsewhere in the U.S.
Item 3. Legal Proceedings
From time to time we are a party to or otherwise involved in legal proceedings arising out of the normal course of business. Legal matters are subject to inherent uncertainties and there exists the possibility that the ultimate resolution of one or more of these matters could have a material adverse impact on the Company, its financial condition and results of operations.
On June 12, 2020, former service store manager Mark Cerini filed suit in the U.S. District Court for the Western District of Pennsylvania. The Plaintiff is seeking nationwide collective action certification to represent similarly-situated store managers for unpaid overtime wages, damages and attorneys’ fees under the Fair Labor Standards Act and class certification under Pennsylvania law for alleged violations of state wage payment laws. Plaintiff alleges that improper deductions were made from store managers’ pay. We dispute and believe we have meritorious defenses against these claims and plan to vigorously defend ourselves.
Item 4. Mine Safety Disclosures
Not applicable.
PART II
Item 5. Market for the Company's Common Equity, Related Stockholder Matters and Issuer Purchases of Equity Securities
Market Information
Monro’s common stock, par value $.01 per share, (the “Common Stock”) is traded on the Nasdaq Stock Market under the symbol "MNRO".
Holders of Record
At May 14, 2021, Monro’s Common Stock was held by approximately 43 shareholders of record. This figure does not include an estimate of the indeterminate number of beneficial holders whose shares may be held of record by brokerage firms and clearing agencies.
Dividends
The declaration of and determination as to the payment of future dividends will be at the discretion of the Board of Directors and will depend on our financial condition, results of operations, capital requirements, compliance with charter and contractual restrictions, and such other factors as the Board of Directors deems relevant. We currently expect that comparable cash dividends will continue to be paid in the future. Under our Credit Facility, we may declare, make or pay any dividend or distribution up to $38.5 million in the aggregate for the period from June 30, 2020 to June 30, 2021 if we are in compliance with the financial covenants and other restrictions in the Credit Facility, as amended. For additional information regarding our Credit Facility, see Note 7 to the Company’s consolidated financial statements.
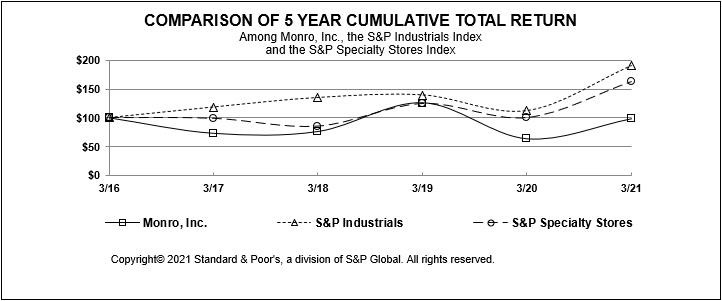
|
|
|
|
|
|
|
|
|
|
|
|
|
|
|
|
|
|
|
|
|
|
|
|
|
|
|
|
|
|
|
|
|
|
|
|
|
|
|
| Fiscal Years Ended March | ||||||||||||||||
|
|
| 2016 |
|
| 2017 |
|
| 2018 |
|
| 2019 |
|
| 2020 |
|
| 2021 |
Monro, Inc. |
| $ | 100.00 |
| $ | 73.76 |
| $ | 76.97 |
| $ | 125.70 |
| $ | 64.51 |
| $ | 98.46 |
S&P Industrials Index |
|
| 100.00 |
|
| 118.38 |
|
| 134.89 |
|
| 139.25 |
|
| 112.14 |
|
| 190.20 |
S&P Specialty Stores Index |
|
| 100.00 |
|
| 98.60 |
|
| 85.19 |
|
| 124.31 |
|
| 99.97 |
|
| 162.33 |
The graph above compares the cumulative total shareholder return on our common stock for the last five fiscal years ended March with (1) the cumulative return on the S&P Industrials Index and (2) the cumulative return on the S&P Specialty Stores Index. The graph assumes the investment of $100 in Monro common stock, the S&P Industrials Index and the S&P Specialty Stores Index, and reinvestment of all dividends.
Item 6. Selected Financial Data
Not applicable.
Item 7. Management's Discussion and Analysis of Financial Condition and Results of Operations
Executive Overview
While our business was materially affected by the COVID-19 pandemic, resulting in significantly lower sales and profits in 2021, we continued to make strategic investments to support our operating and financial model designed to drive sustainable sales and profit growth. We have done this through our Monro.Forward investment strategy focused on the following four key pillars:
Improve Guest Experience
We transformed 147 stores through rebranding and reimaging investments during 2021.
We made significant investments in the health and safety of our teammates and guests.
Enhance Customer-Centric Engagement
We completed the installation of our store digital phone and customer communication system in 2021.
We realigned our marketing spend toward higher return-on-investment (“ROI”) digital channel during 2021.
Optimizing Product and Service Offering
We completed the rollout of our tire pricing and category management technology in 2021.
Accelerating Productivity and Team Engagement
We completed the rollout of our technology-based labor model, with data-driven cloud based store staffing and scheduling software, during 2021.
We leveraged Monro University to facilitate onboarding and training required of new teammates in order to reach full productivity.
Growth through Acquisitions
In addition to our Monro.Forward investment strategy, executing on strategically located acquisitions with attractive valuations remains a key element of our growth strategy in support of our operating and financial model. We are committed to executing on attractive opportunities in our highly fragmented industry and are actively evaluating acquisition targets. We have continued to capitalize on a robust acquisition pipeline as we acquired 17 stores in 2021 and, subsequent to March 27, 2021, we completed the acquisition of 30 stores on April 25, 2021.
Financial Summary
2021 included the following notable items:
Diluted earnings per common share (“EPS”) were $1.01.
Adjusted diluted EPS, a non-GAAP measure, were $1.14.
Sales decreased 10.4 percent, driven by a decrease in comparable store sales.
Comparable store sales decreased 11.1 percent, driven primarily by a decline in guest traffic, partially offset by an increase in average ticket amount spent.
Operating income of $72.2 million was 29.0 percent lower than the prior year.
Net income was $34.3 million.
Adjusted net income, a non-GAAP measure, was $38.7 million.
Operating cash flow of $184.9 million was 52.3 percent higher than the prior year.
|
|
|
|
|
|
|
|
|
|
Earnings Per Common Share |
|
|
|
|
|
|
| Percent Change |
|
|
|
| 2021 |
|
| 2020 |
| 2021/2020 |
|
Diluted EPS |
| $ | 1.01 |
| $ | 1.71 |
| (40.9) | % |
Adjustments |
|
| 0.12 |
|
| 0.29 |
|
|
|
Adjusted diluted EPS |
| $ | 1.14 |
| $ | 2.00 |
| (43.0) | % |
Note: Amounts may not foot due to rounding.
Adjusted diluted EPS and adjusted net income, each of which are a measure not derived in accordance with generally accepted accounting principles in the U.S. (“GAAP”), exclude the impact of certain items. Management believes that adjusted diluted EPS and adjusted net income are useful in providing period-to-period comparisons of the results of our operations by excluding certain non-recurring items and items related to our Monro.Forward or acquisition initiatives. Reconciliations of these non-GAAP financial measures to GAAP measures are provided beginning on page 24 under “Non-GAAP Financial Measures.”
We define comparable store sales, or same store sales, as sales for stores that have been opened or owned at least one full fiscal year. We believe this period is generally required for new store sales levels to begin to normalize. Management uses comparable store sales to assess the operating performance of the Company’s stores and believes the metric is useful to investors because our overall results are dependent upon the results of our stores.
Recent Development and Trends
Our Company-operated stores have experienced improvement in sales to date from the low point during April 2020. The following table presents fiscal monthly information about our recent comparable store sales trends. There is no assurance that these trends will continue.
|
|
|
|
|
|
|
|
|
|
|
|
|
|
|
|
|
|
|
|
|
|
|
|
|
|
|
|
|
|
|
|
|
|
|
|
|
|
|
|
|
|
|
|
|
|
|
|
|
|
|
|
|
|
Comparable Store Sales |
| 2021 |
| 2022 | ||||||||||||||||||||||
(Year-over-Year) |
| Apr. |
| May |
| Jun. |
| Jul. |
| Aug. |
| Sep. |
| Oct. |
| Nov. |
| Dec. |
| Jan. |
| Feb. |
| Mar. |
| Apr. |
Increase/(decrease) |
| (41)% |
| (24)% |
| (14)% |
| (12)% |
| (13)% |
| (8)% |
| (12)% |
| (18)% |
| (6)% |
| 3% |
| (2)% |
| 32% |
| 76% |
As we move through this transition and anticipate comparable store sales trends to improve, we expect to incur some labor inefficiencies as we adjust to new operating models and federal and local health and safety protocols with a goal to remain as efficient as possible while still offering safe and high quality service to our guests. Those labor inefficiencies may include difficulty in hiring employees required to maintain store staffing levels needed to meet demand. We will also incur additional costs and investments in supplies necessary to keep our teams and guests safe, such as face masks, hand sanitizer and cleaning supplies, which are all expected to be ongoing costs for the duration of the COVID-19 pandemic and recovery period.
Given the level of volatility and uncertainty surrounding the future impact of COVID-19, we cannot estimate with certainty the long-term impacts of COVID-19 on our business, financial condition, results of operations, or cash flows in the future. Please see the risks set forth in Part I, Item 1A. “Risk Factors” above for further discussion of the risks that may impact our longer-term operational and financial performance.
Impact of COVID-19
In response to the unprecedented and rapid spread of COVID-19, many U.S. state governments, in states in which we operate, enacted stay-at-home restrictions and social distancing measures during fiscal 2021. State and local governments ordered restrictions on the operations of certain businesses, including temporary closures of some businesses, and numerous other businesses temporarily closed voluntarily or transitioned their workforces to working remotely. Further, individuals’ ability to travel was curtailed through mandated travel restrictions throughout the year.
As a result, demand for automotive undercar repair services as well as replacement tires and tire related services declined at a rapid pace and has remained below normal levels, which has had an unprecedented and materially adverse impact on our results of operations and business operations. Although demand improved in 2021 from the low point during April 2020, we experienced a significant decline in guest traffic throughout the year, as compared to the prior year, which we believe is due to the COVID-19 pandemic. During 2021, comparable store sales decreased 11.1 percent from the prior year. As an essential business, our stores and distribution centers remained open during the pandemic, however, substantially all Company-operated retail stores operated under a reduced schedule throughout the year to match lower demand. We continue to address the ongoing business challenges and shifting economic dynamics as the COVID-19 pandemic and recovery efforts have continued to evolve.
Despite the challenges, some positive signs have begun to emerge. Since the low point during April 2020, we have experienced improvement in sales driven by improvement in store traffic. However, there can be no assurance as to the time required to fully recover operations and sales to pre-pandemic levels or if we will reach those levels again.
Liquidity
Given the uncertainties surrounding the impacts of the COVID-19 pandemic on our future financial condition, results of operations and cash flows, we have taken a number of actions in response to prevailing uncertain market conditions. In order to enhance our
liquidity position, we took a precautionary measure and borrowed $350 million available to us under our credit facility in March 2020. We subsequently repaid the $350 million previously borrowed during 2021. To improve our liquidity, we took the following measures during 2021 to reduce costs and improve cash flows: (i) reduced store hours and store labor to align with reduced demand across our store locations; (ii) undertook significant reductions in operating expenses across the Company, including compensation expense through the continued furlough of or other reduction to certain members of our workforce as well as advertising expense through realigned marketing spend toward digital channels; and (iii) negotiated rent deferrals for a significant number of our stores, as well as other rent reductions. Although acquisition activity was paused during the first six months of fiscal 2021, we continued to evaluate potential acquisition candidates that we believe would fit our growth strategy while maintaining financial discipline. We acquired 17 retail tire and automotive repair stores located in California in December 2020 and financed the acquisition through our Credit Facility. Additionally, with sales improvement throughout 2021, we resumed our rebrand and reimage initiatives and have substantially completed the transformation of 147 stores during the year, after pausing these initiatives during the first three months of fiscal 2021.
Enhanced Safety Standards
As the COVID-19 pandemic has continued to evolve, our priority has been and continues to be, the health and safety of our teammates and guests. To protect our teammates and guests, we have implemented strict cleaning and sanitation measures. In addition, we have provided face masks and other protective equipment, including sneeze guards installed at each sales counter, necessary to ensure the safety of our teammates and guests. We have also implemented various measures intended to reduce the spread of COVID-19 among our non-store workforce including working from home and encouraging teammates to adhere to prevention measures recommended by the Centers for Disease Control and the World Health Organization. Since our non-store workforce is able to work remotely using various technology tools, we are able to maintain our operations and internal controls over financial reporting and disclosures.
Analysis of Results of Operations
|
|
|
|
|
|
|
|
|
|
|
|
|
|
|
|
|
|
|
|
Summary of Operating Income |
|
|
|
|
|
|
| Percent Change |
|
(thousands) |
|
| 2021 |
|
| 2020 |
| 2021/2020 |
|
Sales |
| $ | 1,125,721 |
| $ | 1,256,524 |
| (10.4) | % |
Cost of sales, including distribution and occupancy costs |
|
| 730,526 |
|
| 779,866 |
| (6.3) |
|
Gross profit |
|
| 395,195 |
|
| 476,658 |
| (17.1) |
|
Operating, selling, general and administrative expenses |
|
| 322,957 |
|
| 374,956 |
| (13.9) |
|
Operating income |
| $ | 72,238 |
| $ | 101,702 |
| (29.0) | % |
We have elected to omit discussion on the earliest of the three years covered by the consolidated financial statements presented. The discussion of the fiscal year ended March 30, 2019 is incorporated herein by reference to Part II, Item 7., “Management’s Discussion and Analysis of Financial Condition and Results of Operations” located in our Form 10-K for the fiscal year ended March 28, 2020, filed on June 12, 2020.
Sales
Sales include automotive undercar repair, tire replacement and tire related service sales, net of discounts, returns, etc., and revenue from the sale of warranty agreements and commissions earned from the delivery of tires. See Note 8 to the Company’s consolidated financial statements for further information. We use comparable store sales to evaluate the performance of our existing stores by measuring the change in sales for a period over the comparable, prior-year period of equivalent length. There were 361 selling days in both 2021 and 2020. Comparable sales measures vary across the retail industry. As a result, our comparable sales calculation is not necessarily comparable to similarly titled measures reported by other companies.
Sales growth – from both comparable store sales and new stores – represents an important driver of our long-term profitability. We expect that comparable store sales growth will significantly impact our total sales growth. We believe that our ability to successfully differentiate our guests’ experience through a careful combination of merchandise assortment, price, convenience, guest experience, and other factors will over the long-term drive both increasing guest traffic and the average ticket amount spent.
|
|
|
|
|
|
|
|
|
|
|
|
|
|
|
|
Sales |
|
|
|
|
|
|
|
(thousands) |
|
| 2021 |
|
|
| 2020 |
Sales |
| $ | 1,125,721 |
|
| $ | 1,256,524 |
Dollar change compared to prior year |
| $ | (130,803) |
|
|
|
|
Percentage change compared to prior year |
|
| (10.4) | % |
|
|
|
The sales decrease was primarily due to a decrease in comparable store sales from a substantial decrease in traffic as a result of the COVID-19 pandemic, partially offset by new store sales. Additionally, there was a decrease in sales from closed stores. The following table shows the drivers of the change in sales between 2020 and 2021.
|
|
|
|
|
|
|
|
Sales Percentage Change |
| 2021 |
|
Sales change |
| (10.4) | % |
Primary drivers of change in sales |
|
|
|
Comparable stores sales |
| (11.1) | % |
New store sales (a) |
| 2.3 | % |
Closed store sales |
| (1.8) | % |
(a)Sales from 2021 and 2020 acquisitions represented 2.0 percent of the changes between 2020 and 2021.
As a result of the impact of the unprecedented and rapid spread of COVID-19, demand for automotive undercar repair services as well as replacement tires and tire related services declined at a rapid pace and has remained below normal levels. During 2021, substantially all Company-operated retail stores operated under a reduced schedule for a majority of the year to match lower demand. Although demand improved in 2021 from the low point during April 2020, we experienced a significant decline in guest traffic throughout the year, as compared to the prior year, which we believe is due to the COVID-19 pandemic. Comparable store sales were impacted by lower guest traffic, offset by higher average ticket amount spent.
During 2021, the completed rollout of our tire category management and pricing tool contributed to outperformance in our largest product category, as compared to the prior year, as shown below:
|
|
|
|
|
|
|
|
|
|
|
|
|
|
Sales by Product Category |
| 2021 |
|
| 2020 |
|
Brakes |
| 11 | % |
| 13 | % |
Exhaust |
| 2 |
|
| 2 |
|
Steering |
| 8 |
|
| 8 |
|
Tires |
| 55 |
|
| 51 |
|
Maintenance |
| 24 |
|
| 26 |
|
Total |
| 100 | % |
| 100 | % |
Comparable store front end/shocks and maintenance services category sales for 2021 both decreased by approximately 19 percent from the prior year. Additionally, brakes and alignment category sales decreased by approximately 24 percent and 13 percent, respectively, on a comparable store basis as compared to the prior year. Comparable store tire category sales for 2021 decreased by approximately 3 percent from the prior year.
|
|
|
|
|
|
Change in Number of Stores |
| 2021 |
Beginning store count |
| 1,283 |
Opened (a) |
| 22 |
Closed (b) |
| (42) |
Ending store count |
| 1,263 |
(a)Includes 17 stores opened related to the 2021 acquisition as well as one store from the 2020 acquisitions that was opened upon completion of store construction.
(b)Includes four stores temporarily closed due to storm damage.
Cost of Sales and Gross Profit
|
|
|
|
|
|
|
|
|
|
|
|
|
|
|
|
|
|
Gross Profit |
|
|
|
|
|
|
|
|
(thousands) |
|
| 2021 |
|
|
| 2020 |
|
Gross profit |
| $ | 395,195 |
|
| $ | 476,658 |
|
Percentage of sales |
|
| 35.1 | % |
|
| 37.9 | % |
Dollar change compared to prior year |
| $ | (81,463) |
|
|
|
|
|
Percentage change compared to prior year |
|
| (17.1) | % |
|
|
|
|
The decrease in gross profit, as a percentage of sales, was primarily due to an increase in material costs, as a percentage of sales, as a result of a shift in sales mix to tires. However, we expanded our gross profit per tire from the prior year with the completed rollout of
our tire category management and pricing tool. The decrease in gross profit, as a percentage of sales, was also partially due to an increase in distribution and occupancy costs, as a percentage of sales. Although we were able to reduce these largely fixed costs through rent concessions from landlords, we lost leverage on these costs with lower overall comparable store sales. Partially offsetting these increases was a decrease in technician labor costs, which decreased as a percentage of sales, due to improved labor productivity.
|
|
|
|
|
|
|
|
Gross Profit as a Percentage of Sales Change |
| 2021 |
|
Gross profit change |
| (2.8) | % |
Drivers of change in gross profit as a percentage of sales |
|
|
|
Material costs |
| (2.6) | % |
Distribution and occupancy costs |
| (1.1) | % |
Technician labor costs |
| 0.9 | % |
Operating, Selling, General and Administrative Expenses
|
|
|
|
|
|
|
|
|
|
|
|
|
|
|
|
|
|
Operating, Selling, General and Administrative Expenses |
|
|
|
|
|
|
|
|
(thousands) |
|
| 2021 |
|
|
| 2020 |
|
Operating, Selling, General and Administrative Expenses |
| $ | 322,957 |
|
| $ | 374,956 |
|
Percentage of sales |
|
| 28.7 | % |
|
| 29.8 | % |
Dollar change compared to prior year |
| $ | (51,999) |
|
|
|
|
|
Percentage change compared to prior year |
|
| (13.9) | % |
|
|
|
|
The decrease of $52.0 million in operating, selling, general and administrative (“OSG&A”) expenses from the prior year is primarily due to decreased expenses from comparable stores mainly as a result of focused cost reduction against lower overall comparable stores sales, including actively managing our store management staffing levels to match demand and realigning marketing spend toward digital channels, as well as a $6.4 million reduction in impairment charge. The decrease in OSG&A expenses from the prior year also reflects lower expenses from 42 closed stores compared to the prior year. Partially offsetting these decreases was an increase in expenses from new stores.
|
|
|
|
|
|
|
|
OSG&A Expenses Change |
|
|
|
(thousands) |
|
| 2021 |
OSG&A expenses change |
| $ | (51,999) |
Drivers of change in OSG&A expenses |
|
|
|
Reduction from comparable stores |
| $ | (41,634) |
Reduction in impairment charge |
| $ | (6,435) |
Reduction from closed stores |
| $ | (6,826) |
Increase from new stores |
| $ | 2,896 |
Other Performance Factors
Net Interest Expense
Net interest expense of $28.2 million for 2021 remained relatively flat as compared to the prior year, and increased as a percentage of sales from 2.2 percent to 2.5 percent. Weighted average debt outstanding for 2021 increased by approximately $219 million as compared to 2020. This increase is primarily related to an increase in debt outstanding under our Credit Facility that was borrowed in response to the COVID-19 pandemic in late 2020, as well as an increase in finance lease debt recorded in connection with the 2021 and 2020 acquisitions and greenfield expansion, along with renegotiated leases. Partially offsetting these increases was a decrease in the weighted average interest rate of approximately 190 basis points from the prior year due to lower borrowing rates associated with new leases as well as a decrease in Credit Facility borrowing rates.
Provision for Income Taxes
Our 2021 effective income tax rate was 22.3 percent compared to 21.9 percent for 2020, as discrete items, primarily related to employee share-based compensation, resulted in a larger tax rate benefit in the prior year period. The effective tax rate for 2021 reflects an income tax benefit of $0.5 million due to the difference in statutory tax rates from loss years to years in which such net operating losses may be carried back.
Note 9 to the Company’s consolidated financial statements provides additional information.
Non-GAAP Financial Measures
In addition to reporting net income and diluted EPS, which are GAAP measures, this Form 10-K includes adjusted net income and adjusted diluted EPS, which are non-GAAP financial measures. We have included reconciliations to adjusted net income and adjusted diluted EPS from our most directly comparable GAAP measures, net income and diluted EPS, below. Management views these non-GAAP financial measures as indicators to better assess comparability between periods because management believes these non-GAAP financial measures reflect our core business operations while excluding certain non-recurring items and items related to store closings as well as Monro.Forward or acquisition initiatives.
These non-GAAP financial measures are not intended to represent, and should not be considered more meaningful than, or as an alternative to, their most directly comparable GAAP measures. These non-GAAP financial measures may be different from similarly titled non-GAAP financial measures used by other companies.
Adjusted net income is summarized as follows:
|
|
|
|
|
|
|
|
|
|
|
|
|
|
Reconciliation of Adjusted Net Income |
|
|
|
|
|
|
(thousands) |
|
| 2021 |
|
| 2020 |
Net income |
| $ | 34,319 |
| $ | 58,024 |
Store impairment charge |
|
| 144 |
|
| 6,579 |
Store closing costs |
|
| 2,738 |
|
| — |
Monro.Forward initiative costs |
|
| 2,243 |
|
| 3,976 |
Acquisition due diligence and integration costs |
|
| 260 |
|
| 1,363 |
Management transition costs |
|
| 614 |
|
| — |
Litigation reserve |
|
| (250) |
|
| 250 |
Headquarters expansion costs |
|
| — |
|
| 346 |
Provision for income taxes on adjustments |
|
| (1,351) |
|
| (3,023) |
Adjusted net income |
| $ | 38,717 |
| $ | 67,515 |
Adjusted diluted EPS is summarized as follows:
|
|
|
|
|
|
|
|
|
|
|
|
|
|
Reconciliation of Adjusted Diluted EPS |
|
| 2021 |
|
| 2020 |
Diluted EPS |
| $ | 1.01 |
| $ | 1.71 |
Store impairment charge (a) |
|
| — |
|
| 0.15 |
Store closing costs |
|
| 0.06 |
|
| — |
Monro.Forward initiative costs |
|
| 0.05 |
|
| 0.09 |
Acquisition due diligence and integration costs |
|
| 0.01 |
|
| 0.03 |
Management transition costs |
|
| 0.01 |
|
| — |
Litigation reserve |
|
| (0.01) |
|
| 0.01 |
Headquarters expansion costs |
|
| — |
|
| 0.01 |
Adjusted diluted EPS |
| $ | 1.14 |
| $ | 2.00 |
(a)For 2021, store impairment charge is too minor in amount, net of the impact from income taxes, to have an impact on the calculation of adjusted diluted EPS.
Note: The calculation of the impact of non-GAAP adjustments on diluted EPS is performed on each line independently. The table may not add down by +/- $0.01 due to rounding.
The adjustments to diluted EPS reflect adjusted effective tax rates of 23.5 percent and 24.2 percent for 2021 and 2020, respectively. These adjusted effective tax rates exclude the income tax impacts from share-based compensation and differences in statutory tax rates for net operating loss carrybacks. See adjustments from the Reconciliation of Adjusted Net Income table above for pre-tax amounts.
Analysis of Financial Condition
Capital Resources, Contractual Obligations and Liquidity
Capital Resources
Our primary capital requirements for 2021 were divided among the funding of acquisitions for $17.2 million, as well as the upgrading of facilities and systems and the funding of our store transformation program totaling $51.7 million. In 2020, our primary capital requirements were divided among the funding of acquisitions for $104.4 million, as well as the upgrading of facilities and systems and the funding of our store transformation program totaling $55.9 million. In both 2021 and 2020, capital requirements were primarily met by cash flow from operations and from our Credit Facility.
We paid dividends of $29.8 million in 2021. In May 2021, Monro’s Board of Directors declared a cash dividend of $0.24 per share or share equivalent to be paid to shareholders of record as of June 7, 2021. The dividend will be paid on June 21, 2021.
The acquisition subsequent to March 27, 2021 was financed through our existing credit facility. See Note 3 to the Company’s consolidated financial statements.
Through rebranding and reimaging investments, we have completed the transformation of 366 stores since the launch of the current program in 2019.
We continue to evaluate potential acquisition targets that we believe would fit our growth strategy while maintaining financial discipline. We believe we have sufficient resources available (including cash flow from operations and, if necessary, cash on hand and/or bank financing) to expand our business as currently planned for the next twelve months.
Contractual Obligations
|
|
|
|
|
|
|
|
|
|
|
|
|
|
|
|
|
|
|
|
|
|
|
|
|
|
|
|
|
|
|
|
Commitments Due by Period |
|
|
|
|
| Within |
|
| 2 to |
|
| 4 to |
|
| After |
(thousands) |
|
| Total |
|
| 1 Year |
|
| 3 Years |
|
| 5 Years |
|
| 5 Years |
Principal payments on long-term debt |
| $ | 190,000 |
|
|
|
|
|
|
| $ | 190,000 |
|
|
|
Finance lease commitments/financing obligations (a) |
|
| 516,579 |
| $ | 55,389 |
| $ | 109,892 |
|
| 100,486 |
| $ | 250,812 |
Operating lease commitments (a) |
|
| 239,546 |
|
| 36,451 |
|
| 66,066 |
|
| 53,575 |
|
| 83,454 |
Accrued rent |
|
| 1,807 |
|
| 1,563 |
|
| 132 |
|
| 42 |
|
| 70 |
Other liabilities |
|
| 1,133 |
|
| 800 |
|
| 333 |
|
| — |
|
| — |
Total |
| $ | 949,065 |
| $ | 94,203 |
| $ | 176,423 |
| $ | 344,103 |
| $ | 334,336 |
(a)Finance and operating lease commitments represent future undiscounted lease payments and include $108.4 million and $61.0 million, respectively, related to options to extend lease terms that are reasonably certain of being exercised.
During 2021, we negotiated rent deferrals, with repayment at later dates, for a significant number of our store leases. These concessions provide a deferral of rent payments with no substantive changes to the original contract. Consistent with updated guidance from the FASB in April 2020, we have elected to treat the rent deferrals as accrued liabilities. The accrued rent reflected in the table above includes $0.8 million related to rent deferrals due primarily in the first and second quarter of 2022 and $1.0 million due to timing of other lease related expenses. We will continue to recognize expense during the deferral periods.
In addition, during 2021, we negotiated rent reductions with certain landlords on approximately 23 percent of our lease contracts in exchange for extending our current lease term. As these agreements represent substantive changes to our contractual obligations, the leases were remeasured. As a result, finance lease and financing obligation assets, net and finance leases and financing obligations were increased by $67.7 million and $64.0 million, respectively, and operating lease assets, net and operating lease liabilities were increased by $16.2 million and $20.0 million, respectively. The negotiated terms were generally consistent with terms of typical renewal agreements.
Liquidity
Interest only is payable monthly throughout the term of our Credit Facility. The borrowing capacity for the Credit Facility of $600 million includes an accordion feature permitting us to request an increase in availability of up to an additional $250 million.
On June 11, 2020, we entered into a First Amendment to the Credit Facility (the “First Amendment”), which, among other things, amended the terms of certain of the financial and restrictive covenants in the credit agreement through the first quarter of 2022 to provide us with additional flexibility to operate our business. The First Amendment permanently amended the interest rate charged on
borrowings to be based on the greater of adjusted one-month LIBOR or 0.75 percent. For the period from June 30, 2020 to June 30, 2021, the minimum interest rate spread charged on borrowings will be 225 basis points over LIBOR. Additionally, during the same period, we may declare, make or pay any dividend or distribution up to $38.5 million in the aggregate and the acquisition of stores or other businesses up to $100 million in the aggregate are permitted if we are in compliance with the financial covenants and other restrictions in the First Amendment and Credit Facility. The Credit Facility requires fees payable quarterly throughout the term between 0.125 percent and 0.35 percent of the amount of the average net availability under the Credit Facility during the preceding quarter. Except as amended by the First Amendment, the remaining terms of the credit agreement remain in full force and effect.
Within the Credit Facility, we have a sub-facility of $80 million available for the purpose of issuing standby letters of credit. The line requires fees aggregating 87.5 to 212.5 basis points annually of the face amount of each standby letter of credit, payable quarterly in arrears. There was a $33.6 million outstanding letter of credit at March 27, 2021.
Mortgages and specific lease financing arrangements with other parties (with certain limitations) are permitted under the Credit Facility. Other specific terms and the maintenance of specified ratios are generally consistent with our prior financing agreement. Additionally, the Credit Facility is not secured by our real property, although we have agreed not to encumber our real property, with certain permissible exceptions.
In order to enhance our liquidity position during the COVID-19 pandemic, we took a precautionary measure and borrowed $350 million available to us under our Credit Facility in March 2020, which we subsequently repaid in 2021. There was $190.0 million outstanding and $376.4 million available under the Credit Facility at March 27, 2021.
We were in compliance with all debt covenants at March 27, 2021.
As of May 21, 2021, we had approximately $18.0 million in cash on hand. We believe that we can fulfill our commitments and working capital needs utilizing our cash flow from operations and, if necessary, cash on hand and/or bank financing for at least the next 12 months and the foreseeable future.
Off Balance Sheet Arrangements
We do not have any material off-balance sheet arrangements at March 27, 2021.
Critical Accounting Policies
Our consolidated financial statements are prepared in accordance with GAAP, which requires us to make estimates and apply judgments that affect the reported amounts. In Note 1 to the Company’s consolidated financial statements, we describe the significant accounting policies used in preparing the consolidated financial statements. Our management believes that the accounting policies listed below are those that are most critical to the portrayal of our financial condition and results of operations, and that required management’s most difficult, subjective and complex judgments in estimating the effect of inherent uncertainties.
Business Combinations
We use the acquisition method in accounting for acquired businesses. Under the acquisition method, our financial statements reflect the operations of an acquired business starting from the completion of the acquisition. The assets acquired and liabilities assumed are recorded at their respective estimated fair values at the date of the acquisition. Any excess of the purchase price over the estimated fair values of the identifiable net assets acquired is recorded as goodwill. Significant judgment is often required in estimating the fair value of assets acquired, particularly the right of use (“ROU”) assets and intangible assets, including trade names and customer relationships. ROU assets are recorded at the present value of remaining lease payments adjusted to reflect favorable or unfavorable market terms of the lease. As a result, in the case of significant acquisitions, we normally obtain the assistance of a third-party valuation specialist in estimating the value of the ROU assets as well as intangible assets. The fair value measurements are based on available historical information and on expectations and assumptions about the future, considering the perspective of marketplace participants. Favorable or unfavorable market terms used to value the ROU assets are estimated based on comparable market data. Fair values of acquired trade names are estimated using an income approach, specifically the relief-from-royalty method. Customer relationships are valued using the cost approach or an income approach such as the excess earnings method. Assumptions utilized in the determination of fair value include forecasted sales, discount rates, royalty rates (trade names) and customer attrition rates (customer relationships). While we believe the expectations and assumptions about the future are reasonable, they are inherently uncertain. Unanticipated market or macroeconomic events and circumstances, like the COVID-19 pandemic, may occur, which could affect the accuracy or validity of the estimates and assumptions.
Carrying Values of Goodwill and Long-Lived Assets
We have a history of growth through acquisitions. Assets and liabilities of acquired businesses are recorded at their estimated fair values as of the date of acquisition. Goodwill represents consideration paid in excess of fair values assigned to the underlying net assets of acquired businesses. The carrying value of goodwill is subject to an annual impairment test, which we perform in the third quarter of the fiscal year. Impairment tests may also be triggered by any significant events or changes in circumstances affecting our business.
We have one reporting unit which encompasses all operations including new acquisitions. In performing our annual goodwill impairment test, we perform a qualitative assessment to determine if it is more likely than not that the fair value is less than the carrying value of goodwill. The qualitative assessment includes a review of business changes, economic outlook, financial trends and forecasts, growth rates, industry data, market capitalization and other relevant qualitative factors. If the qualitative factors indicate a potential impairment, we compare the fair value of our reporting unit to the carrying value of our reporting unit. If the fair value is less than its carrying value, an impairment charge is recognized in an amount equal to that excess. The loss recognized cannot exceed the carrying amount of goodwill. We believe there is little risk of impairment of our goodwill.
Our intangible assets primarily represent allocations of purchase price to identifiable intangible assets of acquired businesses and are amortized over their estimated useful lives. All intangibles and other long-lived assets, which include property and equipment as well as ROU assets, are reviewed whenever events or changes in circumstances indicate that an impairment may exist. If such indicators are present, it is determined whether the sum of the estimated undiscounted future cash flows attributable to such assets is less than their carrying values.
A deterioration of macroeconomic conditions may not only negatively impact the estimated operating cash flows used in our cash flow models, but may also negatively impact other assumptions used in our analyses, including, but not limited to, the estimated cost of capital and/or discount rates. Additionally, we are required to ensure that assumptions used to determine fair value in our analyses are consistent with the assumptions a hypothetical marketplace participant would use. As a result, the cost of capital and/or discount rates used in our analyses may increase or decrease based on market conditions and trends, regardless of whether our actual cost of capital has changed. Therefore, we may recognize an impairment of an intangible asset or assets even though realized actual cash flows are approximately equal to or greater than our previously forecasted amounts.
Self-Insurance Reserves
We are largely self-insured with respect to workers’ compensation, general liability and employee medical claims. In order to reduce our risk and better manage our overall loss exposure, we purchase stop-loss insurance that covers individual claims in excess of the deductible amounts, and caps total losses in a fiscal year. We maintain an accrual for the estimated cost to settle open claims as well as an estimate of the cost of claims that have been incurred but not reported. These estimates take into consideration the historical average claim volume, the average cost for settled claims, current trends in claim costs, changes in our business and workforce, and general economic factors. These accruals are reviewed on a quarterly basis. For more complex reserve calculations, such as workers’ compensation, we periodically use the services of an actuary to assist in determining the required reserve for open claims.
Income Taxes
We estimate our provision for income taxes, deferred tax assets and liabilities, income taxes payable and unrecognized tax benefit liabilities based on a number of factors including, but not limited to, historical pre-tax operating income, future estimates of pre-tax operating income, tax planning strategies, differences between tax laws and accounting rules of various items of income and expense, statutory tax rates and credits, uncertain tax positions and valuation allowances. We use significant judgment and estimates in evaluating our tax positions.
We record deferred tax assets and liabilities based upon the expected future tax outcome of differences between tax laws and accounting rules of various items of income and expense recognized in our results of operations using enacted tax rates in effect for the year in which the future tax outcome is expected. We evaluate our ability to realize the tax benefits associated with deferred tax assets and establish valuation allowances when we believe it is more likely than not that some portion of our deferred tax assets will not be realized.
We file U.S. federal income tax returns and income tax returns in various state jurisdictions. Monro’s 2020, 2019 and 2018 U.S. federal tax years and various state tax years remain subject to income tax examinations by tax authorities. We establish tax liabilities in accordance with the accounting guidance on income taxes. Under the accounting guidance, we measure and recognize the tax benefit from an uncertain tax position taken or expected to be taken on an income tax return based on the largest benefit that is more likely than not of being realized upon settlement. An uncertain income tax position will not be recognized in the financial statements unless it is more likely than not to be sustained. We adjust these tax liabilities for unrecognized tax benefits, as well as the related
interest and penalties, based on the latest facts and circumstances, including recently published rulings, court cases and outcomes of tax audits. Due to the complexity of some of these uncertainties, the ultimate resolution may result in an actual tax liability that differs from our estimated tax liabilities for unrecognized tax benefits and our effective tax rate may be materially impacted. While it is often difficult to predict the final outcome of, the timing of, or the tax treatment of any particular uncertain tax position, we believe that our tax balances reflect the more likely than not outcome of known tax contingencies.
Accounting Standards
See “Recent Accounting Pronouncements” in Note 1 to the Company’s consolidated financial statements for a discussion of the impact of recently issued accounting standards on our consolidated financial statements as of March 27, 2021 and for the year then ended, as well as the expected impact on the consolidated financial statements for future periods.
Item 7A. Quantitative and Qualitative Disclosures about Market Risk
We are exposed to market risk from potential changes in interest rates. As of March 27, 2021, excluding finance leases and financing obligations, we had no debt financing at fixed interest rates, for which the fair value would be affected by changes in market interest rates. Our cash flow exposure on floating rate debt would result in annual interest expense fluctuations of approximately $1.9 million, based upon our debt position as of March 27, 2021, given a change in LIBOR of 100 basis points.
Debt financing had a carrying amount and a fair value of $190.0 million as of March 27, 2021, as compared to a carrying amount and a fair value of $566.4 million as of March 28, 2020.
Item 8. Financial Statements and Supplementary Data
|
|
| Page |
Report on Management’s Assessment on Internal Control Over Financial Reporting | 30 |
31 | |
Audited Financial Statements: |
|
33 | |
34 | |
35 | |
36 | |
37 | |
Note 1 Description of Business, Basis of Presentation and Summary of Significant Accounting Policies | 37 |
41 | |
42 | |
45 | |
45 | |
46 | |
46 | |
47 | |
48 | |
49 | |
50 | |
51 | |
52 | |
53 | |
56 | |
56 |
Report on Management’s Assessment of Internal Control Over Financial Reporting
Management of Monro, Inc. (the “Company”) is responsible for establishing and maintaining adequate internal control over financial reporting as such term is defined in Rules 13a-15(f) and 15d-15(f) under the Securities Exchange Act of 1934, as amended. The Company’s internal control over financial reporting is designed to provide reasonable assurance regarding the reliability of financial reporting and the preparation of the financial statements for external purposes in accordance with generally accepted accounting principles.
Because of its inherent limitations, internal control over financial reporting may not prevent or detect misstatements. Also, projections of any evaluation of effectiveness to future periods are subject to the risk that controls may become inadequate because of changes in conditions, or that the degree of compliance with the policies or procedures may deteriorate.
Management assessed the effectiveness of the Company’s internal control over financial reporting as of March 27, 2021. In making this assessment, management used the criteria set forth by the Committee of Sponsoring Organizations of the Treadway Commission in Internal Control - Integrated Framework (2013). Based on our assessment, management determined that the Company maintained effective internal control over financial reporting as of March 27, 2021.
The Company’s independent registered public accounting firm, PricewaterhouseCoopers LLP, is appointed by the Company’s Audit Committee. PricewaterhouseCoopers LLP has audited the consolidated financial statements included in this Annual Report on Form 10-K and the effectiveness of the Company’s internal control over financial reporting as of March 27, 2021, and as a part of their integrated audit, has issued their report, included herein, on the effectiveness of the Company’s internal control over financial reporting.
/s/ Michael T. Broderick /s/ Brian J. D’Ambrosia
Michael T. Broderick Brian J. D’Ambrosia
Chief Executive Officer Chief Financial Officer
(Principal Executive Officer) (Principal Financial Officer)
May 26, 2021
Report of Independent Registered Public Accounting Firm
To the Board of Directors and Shareholders of Monro, Inc.
Opinions on the Financial Statements and Internal Control over Financial Reporting
We have audited the accompanying consolidated balance sheets of Monro, Inc. and its subsidiaries (the “Company”) as of March 27, 2021 and March 28, 2020, and the related consolidated statements of income and comprehensive income, of changes in shareholders’ equity and of cash flows for each of the three years in the period ended March 27, 2021, including the related notes (collectively referred to as the “consolidated financial statements”). We also have audited the Company's internal control over financial reporting as of March 27, 2021, based on criteria established in Internal Control - Integrated Framework (2013) issued by the Committee of Sponsoring Organizations of the Treadway Commission (COSO).
In our opinion, the consolidated financial statements referred to above present fairly, in all material respects, the financial position of the Company as of March 27, 2021 and March 28, 2020, and the results of its operations and its cash flows for each of the three years in the period ended March 27, 2021 in conformity with accounting principles generally accepted in the United States of America. Also in our opinion, the Company maintained, in all material respects, effective internal control over financial reporting as of March 27, 2021, based on criteria established in Internal Control - Integrated Framework (2013) issued by the COSO.
Change in Accounting Principle
As discussed in Note 1 to the consolidated financial statements, the Company changed the manner in which it accounts for leases at the beginning of the year ended March 28, 2020.
Basis for Opinions
The Company's management is responsible for these consolidated financial statements, for maintaining effective internal control over financial reporting, and for its assessment of the effectiveness of internal control over financial reporting, included in the accompanying Report on Management’s Assessment of Internal Control Over Financial Reporting. Our responsibility is to express opinions on the Company’s consolidated financial statements and on the Company's internal control over financial reporting based on our audits. We are a public accounting firm registered with the Public Company Accounting Oversight Board (United States) (PCAOB) and are required to be independent with respect to the Company in accordance with the U.S. federal securities laws and the applicable rules and regulations of the Securities and Exchange Commission and the PCAOB.
We conducted our audits in accordance with the standards of the PCAOB. Those standards require that we plan and perform the audits to obtain reasonable assurance about whether the consolidated financial statements are free of material misstatement, whether due to error or fraud, and whether effective internal control over financial reporting was maintained in all material respects.
Our audits of the consolidated financial statements included performing procedures to assess the risks of material misstatement of the consolidated financial statements, whether due to error or fraud, and performing procedures that respond to those risks. Such procedures included examining, on a test basis, evidence regarding the amounts and disclosures in the consolidated financial statements. Our audits also included evaluating the accounting principles used and significant estimates made by management, as well as evaluating the overall presentation of the consolidated financial statements. Our audit of internal control over financial reporting included obtaining an understanding of internal control over financial reporting, assessing the risk that a material weakness exists, and testing and evaluating the design and operating effectiveness of internal control based on the assessed risk. Our audits also included performing such other procedures as we considered necessary in the circumstances. We believe that our audits provide a reasonable basis for our opinions.
Definition and Limitations of Internal Control over Financial Reporting
A company’s internal control over financial reporting is a process designed to provide reasonable assurance regarding the reliability of financial reporting and the preparation of financial statements for external purposes in accordance with generally accepted accounting principles. A company’s internal control over financial reporting includes those policies and procedures that (i) pertain to the maintenance of records that, in reasonable detail, accurately and fairly reflect the transactions and dispositions of the assets of the company; (ii) provide reasonable assurance that transactions are recorded as necessary to permit preparation of financial statements in accordance with generally accepted accounting principles, and that receipts and expenditures of the company are being made only in accordance with authorizations of management and directors of the company; and (iii) provide reasonable assurance regarding prevention or timely detection of unauthorized acquisition, use, or disposition of the company’s assets that could have a material effect on the financial statements.
Because of its inherent limitations, internal control over financial reporting may not prevent or detect misstatements. Also, projections of any evaluation of effectiveness to future periods are subject to the risk that controls may become inadequate because of changes in conditions, or that the degree of compliance with the policies or procedures may deteriorate.
Critical Audit Matters
The critical audit matter communicated below is a matter arising from the current period audit of the consolidated financial statements that was communicated or required to be communicated to the audit committee and that (i) relates to accounts or disclosures that are material to the consolidated financial statements and (ii) involved our especially challenging, subjective, or complex judgments. The communication of critical audit matters does not alter in any way our opinion on the consolidated financial statements, taken as a whole, and we are not, by communicating the critical audit matter below, providing a separate opinion on the critical audit matter or on the accounts or disclosures to which it relates.
Valuation of Acquired Right of Use Assets
As described in Note 3 to the consolidated financial statements, the Company recorded $5 million of finance lease and financing obligation assets, net and $9 million of operating lease assets, net (collectively “right of use assets”) relating to a business combination completed during the year ended March 27, 2021. The right of use assets acquired are recorded at the present value of remaining lease payments adjusted to reflect favorable or unfavorable market terms of the lease. Management applied significant judgment in estimating the favorable or unfavorable market terms used to value the acquired right of use assets, which is estimated based on comparable market data.
The principal considerations for our determination that performing procedures relating to the valuation of acquired right of use assets is a critical audit matter are the significant judgment by management in estimating the favorable or unfavorable market terms used to value the acquired right of use assets and the comparable market data assumption. This in turn led to a high degree of auditor judgment, effort, and subjectivity in performing procedures related to the favorable or unfavorable market terms used to value the acquired right of use assets and the comparable market data assumption. In addition, the audit effort involved the use of professionals with specialized skill and knowledge.
Addressing the matter involved performing procedures and evaluating audit evidence in connection with forming our overall opinion on the consolidated financial statements. These procedures included testing the effectiveness of controls over the estimation of the value of the acquired right of use assets, including controls over the estimate of favorable or unfavorable market terms. These procedures also included, among others, (i) reading the purchase agreement; (ii) testing management’s process for estimating the value of the acquired right of use assets; and (iii) evaluating the appropriateness of the valuation method and testing the completeness and accuracy of the underlying data. Professionals with specialized skill and knowledge were used to assist in evaluating the reasonableness of the comparable market data assumption.
/s/ PricewaterhouseCoopers LLP
Rochester, New York
May 26, 2021
We have served as the Company’s auditor since at least 1984. We have not been able to determine the specific year we began serving as auditor of the Company.
Consolidated Balance Sheets
|
|
|
|
|
|
|
|
|
|
|
|
|
|
(thousands, except footnotes) |
|
| March 27, 2021 |
|
| March 28, 2020 |
Assets |
|
|
|
|
|
|
Current assets |
|
|
|
|
|
|
Cash and equivalents |
| $ | 29,960 |
| $ | 345,476 |
Accounts receivable |
|
| 15,324 |
|
| 14,510 |
Federal and state income taxes receivable |
|
| 10,844 |
|
| 8,056 |
Inventories |
|
| 162,282 |
|
| 187,441 |
Other current assets |
|
| 48,115 |
|
| 40,537 |
Total current assets |
|
| 266,525 |
|
| 596,020 |
Property and equipment, net |
|
| 327,063 |
|
| 328,637 |
Finance lease and financing obligation assets, net |
|
| 275,360 |
|
| 196,575 |
Operating lease assets, net |
|
| 203,329 |
|
| 199,729 |
Goodwill |
|
| 689,524 |
|
| 671,843 |
Intangible assets, net |
|
| 26,068 |
|
| 29,781 |
Other non-current assets |
|
| 18,332 |
|
| 20,688 |
Long-term deferred income tax assets |
|
| 5,613 |
|
| 6,184 |
Total assets |
| $ | 1,811,814 |
| $ | 2,049,457 |
Liabilities and shareholders' equity |
|
|
|
|
|
|
Current liabilities |
|
|
|
|
|
|
Current portion of finance leases and financing obligations |
| $ | 37,803 |
| $ | 32,257 |
Current portion of operating lease liabilities |
|
| 30,903 |
|
| 30,181 |
Accounts payable |
|
| 112,378 |
|
| 99,504 |
Accrued payroll, payroll taxes and other payroll benefits |
|
| 20,842 |
|
| 14,429 |
Accrued insurance |
|
| 49,681 |
|
| 43,387 |
Deferred revenue |
|
| 11,956 |
|
| 13,129 |
Other current liabilities |
|
| 27,053 |
|
| 22,049 |
Total current liabilities |
|
| 290,616 |
|
| 254,936 |
Long-term debt |
|
| 190,000 |
|
| 566,400 |
Long-term finance leases and financing obligations |
|
| 366,330 |
|
| 298,373 |
Long-term operating lease liabilities |
|
| 177,724 |
|
| 170,954 |
Other long-term liabilities |
|
| 16,649 |
|
| 12,873 |
Long-term deferred income tax liabilities |
|
| 19,783 |
|
| 10,069 |
Long-term income taxes payable |
|
| 1,028 |
|
| 1,412 |
Total liabilities |
|
| 1,062,130 |
|
| 1,315,017 |
Commitments and contingencies – Note 15 |
|
|
|
| ||
Shareholders' equity |
|
|
|
|
|
|
Class C Convertible Preferred Stock |
|
| 29 |
|
| 33 |
Common Stock |
|
| 398 |
|
| 396 |
Treasury Stock |
|
| (108,729) |
|
| (108,729) |
Additional paid-in capital |
|
| 238,244 |
|
| 229,774 |
Accumulated other comprehensive loss |
|
| (4,619) |
|
| (6,889) |
Retained earnings |
|
| 624,361 |
|
| 619,855 |
Total shareholders' equity |
|
| 749,684 |
|
| 734,440 |
Total liabilities and shareholders' equity |
| $ | 1,811,814 |
| $ | 2,049,457 |
Class C Convertible Preferred Stock Authorized 150,000 shares, $1.50 par value, $0.064 conversion value: 19,664 shares issued and outstanding at March 27, 2021; 21,802 shares issued and outstanding at March 28, 2020
Common Stock Authorized 65,000,000 shares, $0.01 par value; 39,848,093 shares issued as of March 27, 2021; 39,644,228 shares issued at March 28, 2020
Treasury Stock 6,359,871 shares, at cost
See accompanying Notes to Consolidated Financial Statements.
Consolidated Statements of Income and Comprehensive Income
|
|
|
|
|
|
|
|
|
|
|
|
|
|
|
|
|
|
|
|
(thousands, except per share data) |
|
| 2021 |
|
| 2020 |
|
| 2019 |
Sales |
| $ | 1,125,721 |
| $ | 1,256,524 |
| $ | 1,200,230 |
Cost of sales, including distribution and occupancy costs |
|
| 730,526 |
|
| 779,866 |
|
| 735,002 |
Gross profit |
|
| 395,195 |
|
| 476,658 |
|
| 465,228 |
Operating, selling, general and administrative expenses |
|
| 322,957 |
|
| 374,956 |
|
| 338,485 |
Operating income |
|
| 72,238 |
|
| 101,702 |
|
| 126,743 |
Interest expense, net of interest income |
|
| 28,235 |
|
| 28,213 |
|
| 27,013 |
Other income, net of other loss |
|
| (188) |
|
| (785) |
|
| (630) |
Income before income taxes |
|
| 44,191 |
|
| 74,274 |
|
| 100,360 |
Provision for income taxes |
|
| 9,872 |
|
| 16,250 |
|
| 20,608 |
Net income |
| $ | 34,319 |
| $ | 58,024 |
| $ | 79,752 |
Other comprehensive income (loss) |
|
|
|
|
|
|
|
|
|
Changes in pension, net of tax provision (benefit) |
|
| 2,270 |
|
| (2,353) |
|
| (288) |
Other comprehensive income (loss) |
|
| 2,270 |
|
| (2,353) |
|
| (288) |
Comprehensive income |
| $ | 36,589 |
| $ | 55,671 |
| $ | 79,464 |
Earnings per share |
|
|
|
|
|
|
|
|
|
Basic |
| $ | 1.02 |
| $ | 1.73 |
| $ | 2.41 |
Diluted |
| $ | 1.01 |
| $ | 1.71 |
| $ | 2.37 |
Weighted average common shares outstanding |
|
|
|
|
|
|
|
|
|
Basic |
|
| 33,329 |
|
| 33,246 |
|
| 32,980 |
Diluted |
|
| 33,876 |
|
| 33,953 |
|
| 33,675 |
See accompanying Notes to Consolidated Financial Statements.
Consolidated Statements of Changes in Shareholders’ Equity
|
|
|
|
|
|
|
|
|
|
|
|
|
|
|
|
|
|
|
|
|
|
|
|
|
|
|
|
|
|
|
|
|
|
|
|
|
|
|
|
|
|
|
|
|
|
|
|
|
|
|
|
|
|
|
|
|
| Class C Convertible |
|
|
|
|
|
|
|
|
|
|
| Additional |
| Accumulated Other |
|
|
|
|
|
| |||||
|
| Preferred Stock |
| Common Stock |
| Treasury Stock |
| Paid-In |
| Comprehensive |
| Retained |
| Total | |||||||||||||
(thousands) |
| Shares |
| Amount |
| Shares |
| Amount |
| Shares |
| Amount |
| Capital |
| Loss |
| Earnings |
| Equity | |||||||
Balance at March 31, 2018 |
| 22 |
| $ | 33 |
| 39,166 |
| $ | 392 |
| 6,330 |
| $ | (106,563) |
| $ | 199,576 |
| $ | (4,248) |
| $ | 539,286 |
| $ | 628,476 |
Net income |
|
|
|
|
|
|
|
|
|
|
|
|
|
|
|
|
|
|
|
|
|
|
| 79,752 |
|
| 79,752 |
Other comprehensive loss |
|
|
|
|
|
|
|
|
|
|
|
|
|
|
|
|
|
|
|
|
|
|
|
|
|
|
|
Pension liability adjustment |
|
|
|
|
|
|
|
|
|
|
|
|
|
|
|
|
|
|
|
| (288) |
|
|
|
|
| (288) |
Dividends declared |
|
|
|
|
|
|
|
|
|
|
|
|
|
|
|
|
|
|
|
|
|
|
|
|
|
|
|
Preferred |
|
|
|
|
|
|
|
|
|
|
|
|
|
|
|
|
|
|
|
|
|
|
| (408) |
|
| (408) |
Common |
|
|
|
|
|
|
|
|
|
|
|
|
|
|
|
|
|
|
|
|
|
|
| (26,406) |
|
| (26,406) |
Dividend payable |
|
|
|
|
|
|
|
|
|
|
|
|
|
|
|
|
|
|
|
|
|
|
| (50) |
|
| (50) |
Stock options and restricted stock (a) |
|
|
|
|
|
| 345 |
|
| 3 |
| 30 |
|
| (2,166) |
|
| 16,575 |
|
|
|
|
|
|
|
| 14,412 |
Share-based compensation |
|
|
|
|
|
|
|
|
|
|
|
|
|
|
|
|
| 4,022 |
|
|
|
|
|
|
|
| 4,022 |
Balance at March 30, 2019 |
| 22 |
| $ | 33 |
| 39,511 |
| $ | 395 |
| 6,360 |
| $ | (108,729) |
| $ | 220,173 |
| $ | (4,536) |
| $ | 592,174 |
| $ | 699,510 |
Cumulative effect of accounting change |
|
|
|
|
|
|
|
|
|
|
|
|
|
|
|
|
|
|
|
|
|
|
| (582) |
|
| (582) |
Net income |
|
|
|
|
|
|
|
|
|
|
|
|
|
|
|
|
|
|
|
|
|
|
| 58,024 |
|
| 58,024 |
Other comprehensive loss |
|
|
|
|
|
|
|
|
|
|
|
|
|
|
|
|
|
|
|
|
|
|
|
|
|
|
|
Pension liability adjustment |
|
|
|
|
|
|
|
|
|
|
|
|
|
|
|
|
|
|
|
| (2,353) |
|
|
|
|
| (2,353) |
Dividends declared |
|
|
|
|
|
|
|
|
|
|
|
|
|
|
|
|
|
|
|
|
|
|
|
|
|
|
|
Preferred |
|
|
|
|
|
|
|
|
|
|
|
|
|
|
|
|
|
|
|
|
|
|
| (449) |
|
| (449) |
Common |
|
|
|
|
|
|
|
|
|
|
|
|
|
|
|
|
|
|
|
|
|
|
| (29,266) |
|
| (29,266) |
Dividend payable |
|
|
|
|
|
|
|
|
|
|
|
|
|
|
|
|
|
|
|
|
|
|
| (46) |
|
| (46) |
Stock options and restricted stock |
|
|
|
|
|
| 134 |
|
| 1 |
|
|
|
|
|
|
| 5,788 |
|
|
|
|
|
|
|
| 5,789 |
Share-based compensation |
|
|
|
|
|
|
|
|
|
|
|
|
|
|
|
|
| 3,813 |
|
|
|
|
|
|
|
| 3,813 |
Balance at March 28, 2020 |
| 22 |
| $ | 33 |
| 39,645 |
| $ | 396 |
| 6,360 |
| $ | (108,729) |
| $ | 229,774 |
| $ | (6,889) |
| $ | 619,855 |
| $ | 734,440 |
Net income |
|
|
|
|
|
|
|
|
|
|
|
|
|
|
|
|
|
|
|
|
|
|
| 34,319 |
|
| 34,319 |
Other comprehensive loss |
|
|
|
|
|
|
|
|
|
|
|
|
|
|
|
|
|
|
|
|
|
|
|
|
|
|
|
Pension liability adjustment |
|
|
|
|
|
|
|
|
|
|
|
|
|
|
|
|
|
|
|
| 2,270 |
|
|
|
|
| 2,270 |
Dividends declared |
|
|
|
|
|
|
|
|
|
|
|
|
|
|
|
|
|
|
|
|
|
|
|
|
|
|
|
Preferred |
|
|
|
|
|
|
|
|
|
|
|
|
|
|
|
|
|
|
|
|
|
|
| (438) |
|
| (438) |
Common |
|
|
|
|
|
|
|
|
|
|
|
|
|
|
|
|
|
|
|
|
|
|
| (29,344) |
|
| (29,344) |
Dividend payable |
|
|
|
|
|
|
|
|
|
|
|
|
|
|
|
|
|
|
|
|
|
|
| (31) |
|
| (31) |
Conversion of Class C Preferred Stock |
| (2) |
|
| (4) |
| 50 |
|
| 1 |
|
|
|
|
|
|
| 3 |
|
|
|
|
|
|
|
| - |
Stock options and restricted stock |
|
|
|
|
|
| 153 |
|
| 1 |
|
|
|
|
|
|
| 6,076 |
|
|
|
|
|
|
|
| 6,077 |
Share-based compensation |
|
|
|
|
|
|
|
|
|
|
|
|
|
|
|
|
| 2,391 |
|
|
|
|
|
|
|
| 2,391 |
Balance at March 27, 2021 |
| 20 |
| $ | 29 |
| 39,848 |
| $ | 398 |
| 6,360 |
| $ | (108,729) |
| $ | 238,244 |
| $ | (4,619) |
| $ | 624,361 |
| $ | 749,684 |
(a)
We declared $0.88, $0.88 and $0.80 dividends per common share or equivalent for the years ended March 27, 2021, March 28, 2020 and March 30, 2019, respectively.
See accompanying Notes to Consolidated Financial Statements.
Consolidated Statements of Cash Flows
|
|
|
|
|
|
|
|
|
|
|
|
|
|
|
|
|
|
|
|
(thousands) |
|
| 2021 |
|
| 2020 |
|
| 2019 |
Operating activities: |
|
|
|
|
|
|
|
|
|
Net income |
| $ | 34,319 |
| $ | 58,024 |
| $ | 79,752 |
Adjustments to reconcile net income to net cash provided by operating activities: |
|
|
|
|
|
|
|
|
|
Depreciation and amortization |
|
| 77,304 |
|
| 64,986 |
|
| 55,531 |
Share-based compensation expense |
|
| 2,391 |
|
| 3,813 |
|
| 4,022 |
(Gain) loss on disposal of assets |
|
| (491) |
|
| (257) |
|
| 56 |
Impairment of long-lived assets |
|
| 144 |
|
| 6,579 |
|
| — |
Deferred income tax expense |
|
| 10,854 |
|
| 11,473 |
|
| 12,517 |
Change in operating assets and liabilities (excluding acquisitions) |
|
|
|
|
|
|
|
|
|
Accounts receivable |
|
| (814) |
|
| 107 |
|
| (1,361) |
Inventories |
|
| 26,570 |
|
| (11,841) |
|
| (9,126) |
Other current assets |
|
| 22,566 |
|
| 5,379 |
|
| (514) |
Other non-current assets |
|
| 3,331 |
|
| 24,968 |
|
| (427) |
Accounts payable |
|
| 12,874 |
|
| (4,090) |
|
| 19,037 |
Accrued expenses |
|
| 21,355 |
|
| (3,871) |
|
| (3,019) |
Federal and state income taxes receivable |
|
| (2,788) |
|
| (2,470) |
|
| (1,401) |
Other long-term liabilities |
|
| (22,326) |
|
| (31,100) |
|
| (1,967) |
Long-term income taxes payable |
|
| (384) |
|
| (371) |
|
| (209) |
Cash provided by operating activities |
|
| 184,905 |
|
| 121,329 |
|
| 152,891 |
Investing activities |
|
|
|
|
|
|
|
|
|
Capital expenditures |
|
| (51,725) |
|
| (55,918) |
|
| (44,468) |
Acquisitions, net of cash acquired |
|
| (17,154) |
|
| (104,436) |
|
| (62,427) |
Proceeds from the disposal of assets |
|
| 659 |
|
| 967 |
|
| 723 |
Other |
|
| 1,960 |
|
| 576 |
|
| 289 |
Cash used for investing activities |
|
| (66,260) |
|
| (158,811) |
|
| (105,883) |
Financing activities: |
|
|
|
|
|
|
|
|
|
Proceeds from borrowings |
|
| — |
|
| 814,181 |
|
| 433,460 |
Principal payments on long-term debt, capital leases and financing obligations |
|
| (409,783) |
|
| (412,725) |
|
| (463,989) |
Exercise of stock options |
|
| 6,278 |
|
| 6,171 |
|
| 14,640 |
Dividends paid |
|
| (29,782) |
|
| (29,715) |
|
| (26,814) |
Deferred financing costs |
|
| (874) |
|
| (1,168) |
|
| — |
Cash (used for) provided by financing activities |
|
| (434,161) |
|
| 376,744 |
|
| (42,703) |
Net (decrease) increase in cash |
|
| (315,516) |
|
| 339,262 |
|
| 4,305 |
Cash at beginning of year |
|
| 345,476 |
|
| 6,214 |
|
| 1,909 |
Cash at end of year |
| $ | 29,960 |
| $ | 345,476 |
| $ | 6,214 |
Supplemental information: |
|
|
|
|
|
|
|
|
|
Interest paid, net |
| $ | 26,376 |
| $ | 27,250 |
| $ | 25,422 |
Income taxes |
|
| 2,334 |
|
| 12,745 |
|
| 9,680 |
Leased assets obtained in exchange for new finance lease liabilities |
|
| 104,165 |
|
| 64,393 |
|
| 14,632 |
Leased assets obtained in exchange for new operating lease liabilities |
|
| 24,409 |
|
| 6,980 |
|
| — |
See accompanying Notes to Consolidated Financial Statements.
Note 1 – Description of Business, Basis of Presentation and Summary of Significant Accounting Policies
Description of business
Monro, Inc. and its direct and indirect subsidiaries (together, “Monro”, the “Company”, “we”, “us”, or “our”), are engaged principally in providing automotive undercar repair and tire replacement sales and tire related services in the United States. Monro had 1,263 Company-operated stores, 96 franchised locations, seven wholesale locations and three retread facilities located in 32 states as of March 27, 2021.
Monro’s operations are organized and managed in one operating segment. The internal management financial reporting that is the basis for evaluation in order to assess performance and allocate resources by our chief operating decision maker consists of consolidated data that includes the results of our retail, commercial and wholesale locations. As such, our one operating segment reflects how our operations are managed, how resources are allocated, how operating performance is evaluated by senior management and the structure of our internal financial reporting.
Basis of presentation
Principles of consolidation
The consolidated financial statements include the accounts of Monro, Inc. and its direct and indirect subsidiaries. All intercompany accounts and transactions have been eliminated in consolidation.
Management’s use of estimates
The consolidated financial statements have been prepared in accordance with accounting principles generally accepted in the United States of America. The preparation of financial statements in conformity with such principles requires the use of estimates by management during the reporting period. Actual results could differ from those estimates.
Fiscal year
We operate on a 52/53 week fiscal year ending on the last Saturday in March. Fiscal years 2021 and 2020 each contained 52 weeks and fiscal year 2019 contained 53 weeks. Unless specifically indicated otherwise, any references to “2021” or “fiscal 2021,” “2020” or “fiscal 2020,” and “2019” or “fiscal 2019” relate to the years ended March 27, 2021, March 28, 2020 and March 30, 2019, respectively.
Recent accounting pronouncements
In August 2018, the Financial Accounting Standards Board (“FASB”) issued new accounting guidance which eliminates, adds and modifies certain disclosure requirements for fair value measurements. This guidance is effective for fiscal years and interim periods within those years beginning after December 15, 2019. Early adoption is permitted. We adopted this guidance during the first quarter of 2021. The adoption of this guidance did not have a material impact on our consolidated financial statements.
In December 2019, the FASB issued new accounting guidance intended to simplify the accounting for income taxes. The new guidance removes certain exceptions to the general principles in Accounting Standards Codification (“ASC”) Topic 740, “Income Taxes,” and amends existing guidance to improve consistent application. This guidance is effective for fiscal years and interim periods within those years beginning after December 15, 2020. Early adoption is permitted. The adoption of this guidance is not expected to have a material impact on our consolidated financial statements.
Other recent authoritative guidance issued by the FASB (including technical corrections to the ASC) and the Securities and Exchange Commission (“SEC”) did not, or are not expected to have a material effect on Monro’s consolidated financial statements.
Summary of significant accounting policies
Cash and cash equivalents
Cash consists primarily of cash on hand and deposits with banks. Cash equivalents include highly liquid investments with an original maturity of three months or less from the time of purchase. Cash equivalents also include amounts due from third-party financial institutions for credit and debit card transactions. These receivables typically settle in three days or less.
Inventories
Our inventories, which consist of automotive parts and oil as well as tires, are valued at the lower of weighted average cost or net realizable value.
Property and equipment, net
Property and equipment, net is stated at historical cost less accumulated depreciation. Property and equipment is depreciated using the straight-line method over estimated useful lives. Leasehold improvements are depreciated over the shorter of their estimated useful lives or the related lease terms. When assets are disposed of, the resulting gain or loss is recognized in other income, net of other loss on the Consolidated Statement of Income and Comprehensive Income. Expenditures for maintenance and repairs are expensed as incurred.
|
|
|
|
|
|
Estimated Useful Lives |
| Life (Years) |
Buildings and improvements |
| 10 - 39 |
Equipment, signage and fixtures |
| 3 - 15 |
Vehicles |
| 5 - 10 |
Valuation of long-lived assets
We assess potential impairments to our long-lived assets, which include property and equipment and operating right-of-use (“ROU”) assets, whenever events or circumstances indicate that the carrying value of an asset may not be recoverable. Long-lived assets are grouped and evaluated for impairment at the lowest level for which there are identifiable cash flows that are independent of the cash flows of other groups of assets. If it is determined that the carrying amounts of such long-lived assets are not recoverable, the assets are written down to their estimated fair values. Fair value of the assets is determined based on the highest and best use of the asset group, considering external market participant assumptions. Since the determination of future cash flows is an estimate of future performance, there may be future impairments in the event that future cash flows do not meet expectations.
During 2020, we evaluated certain stores having indicators of impairment based on operating performance and taking into consideration the negative impact of the novel coronavirus strain (“COVID-19”) pandemic on forecasted store performance. Based on the estimate of future recoverable cash flows, we recorded an impairment charge totaling $6.6 million of which $4.3 million was related to 36 stores that closed in 2021. As part of the impairment charge, we wrote off $4.4 million of operating lease ROU assets, $0.6 million of finance lease ROU assets and $1.6 million of leasehold improvements and equipment.
No material impairment charges were recorded during 2021 or 2019.
Leases
We determine if an arrangement is or contains a lease at inception. We record ROU assets and lease obligations for our finance and operating leases, which are initially based on the discounted future minimum lease payments over the term of the lease. As the rate implicit in our leases is not easily determinable, our applicable incremental borrowing rate is used in calculating the present value of the lease payments. We estimate our incremental borrowing rate considering the market rates of our outstanding borrowings and comparisons to comparable borrowings of similar terms.
Lease term is defined as the non-cancelable period of the lease plus any option to extend the lease when it is reasonably certain that it will be exercised. For leases with an initial term of 12 months or less, no ROU assets or lease obligations are recorded on the balance sheet and we recognize short-term lease expense for these leases on a straight-line basis over the lease term.
Certain of our lease agreements include rental payments based on a percentage of retail sales over specified levels and others include rental payments adjusted periodically for inflation. Our lease agreements do not contain any material residual value guarantees or material restrictive covenants. For the majority of all classes of underlying assets, we have elected to separate lease from non-lease components. We have elected to combine lease and non-lease components for certain classes of equipment. We generally sublease excess space to third parties.
Operating lease expense is recognized on a straight-line basis over the lease term and is included in cost of sales, including distribution and occupancy costs (“cost of sales”) or operating, selling, general and administrative (“OSG&A”) expense. Amortization expense for
finance leases is recognized on a straight-line basis over the lease term and is included in cost of sales or OSG&A expense. Interest expense for finance leases is recognized using the effective interest method, and is included in interest expense, net of interest income. Variable payments, short-term rentals and payments associated with non-lease components are expensed as incurred.
Effective March 31, 2019, we adopted using the modified retrospective approach an accounting standards update with new guidance related to leases. The adoption of this guidance resulted in a $165.3 million increase to total assets, a $165.9 million increase to total liabilities and a $0.6 million decrease in shareholder’s equity as of March 31, 2019. Periods prior to fiscal 2020 have not been restated for the adoption of this standard update.
Goodwill and intangible assets
We have a history of growth through acquisitions. Assets and liabilities of acquired businesses are recorded at their estimated fair values as of the date of acquisition. Goodwill represents costs in excess of fair values assigned to the underlying net assets of acquired businesses. The carrying value of goodwill is subject to an annual impairment test, which we perform in the third quarter of the fiscal year. Impairment tests may also be triggered by any significant events or changes in circumstances affecting our business.
We have one reporting unit which encompasses all operations including new acquisitions. In performing our annual goodwill impairment test, we perform a qualitative assessment to determine if it is more likely than not that the fair value is less than the carrying value of goodwill. The qualitative assessment includes a review of business changes, economic outlook, financial trends and forecasts, growth rates, industry data, market capitalization and other relevant qualitative factors. If the qualitative factors indicate a potential impairment, we compare the fair value of our reporting unit to the carrying value of our reporting unit. If the fair value is less than its carrying value, an impairment charge is recognized in an amount equal to that excess. The loss recognized cannot exceed the carrying amount of goodwill. As a result of our annual qualitative assessment performed in the third quarter of 2021, we determined that it is not more likely than not that the fair value is less than the carrying value.
Subsequent to our prior year assessment performed in the third quarter of 2020, and due to developments associated with the COVID-19 pandemic, we considered our business performance expectations, as well as our share price as of 2020 year end in relation to the share price when the annual qualitative assessment was performed in the third quarter of 2020. Based on our analysis, we concluded that the events and circumstances related to the COVID-19 pandemic did not indicate an impairment of goodwill was more likely than not as of March 28, 2020.
Our intangible assets primarily represent allocations of purchase price to identifiable intangible assets of acquired businesses and are amortized over their estimated useful lives. All intangible assets are evaluated for impairment whenever events or changes in circumstances indicate that an impairment may exist. If such indicators are present, it is determined whether the sum of the estimated undiscounted future cash flows attributable to such assets is less than their carrying values. Based on our review as of March 27, 2021, we concluded that the carrying values of our intangible assets were not impaired. No impairment was recorded in 2021, 2020 or 2019.
A deterioration of macroeconomic conditions may not only negatively impact the estimated operating cash flows used in our cash flow models, but may also negatively impact other assumptions used in our analyses, including, but not limited to, the estimated cost of capital and/or discount rates. Additionally, we are required to ensure that assumptions used to determine fair value in our analyses are consistent with the assumptions a hypothetical marketplace participant would use. As a result, the cost of capital and/or discount rates used in our analyses may increase or decrease based on market conditions and trends, regardless of whether our actual cost of capital has changed. Therefore, we may recognize an impairment of an intangible asset or assets even though realized actual cash flows are approximately equal to or greater than our previously forecasted amounts.
Self-insurance reserves
We are largely self-insured with respect to workers’ compensation, general liability and employee medical claims. In order to reduce our risk and better manage our overall loss exposure, we purchase stop-loss insurance that covers individual claims in excess of the deductible amounts, and caps total losses in a fiscal year. We maintain an accrual for the estimated cost to settle open claims as well as an estimate of the cost of claims that have been incurred but not reported. These estimates take into consideration the historical average claim volume, the average cost for settled claims, current trends in claim costs, changes in our business and workforce, and general economic factors. These accruals are reviewed on a quarterly basis, or more frequently if factors dictate a more frequent review is warranted. For more complex reserve calculations, such as workers’ compensation, we periodically use the services of an actuary to assist in determining the required reserve for open claims.
Warranty
We provide an accrual for estimated future warranty costs for parts that we install based upon the historical relationship of warranty costs to sales. Warranty expense related to all product warranties for the fiscal years ended March 2021, 2020 and 2019 was not material to our financial position or results of operations. See Note 8 for additional information on tire road hazard warranty agreements.
Comprehensive income
As it relates to Monro, comprehensive income is defined as net income as adjusted for pension liability adjustments and is reported net of related taxes in the Consolidated Statements of Income and Comprehensive Income and in the Consolidated Statements of Changes in Shareholders’ Equity.
Income taxes
We account for income taxes pursuant to the asset and liability method which requires the recognition of deferred tax assets and liabilities related to the expected future tax consequences arising from temporary differences between the carrying amounts and tax bases of assets and liabilities based on enacted statutory tax rates applicable to the periods in which the temporary differences are expected to reverse. Any effects of changes in income tax rates or laws are included in income tax expense in the period of enactment. A valuation allowance is recognized if we determine it is more likely than not that all or a portion of a deferred tax asset will not be recognized. In making such determination, the Company considers all available evidence, including scheduled reversals of deferred tax liabilities, projected future taxable income, tax planning strategies and recent and expected future results of operation. Monro recognizes a tax benefit from an uncertain tax position in the financial statements only when it is more likely than not that the position will be sustained upon examination, including resolution of any related appeals or litigation processes, based on the technical merits and a consideration of the relevant taxing authority's administrative practices and precedents.
On March 27, 2020, the U.S. government enacted the Coronavirus Aid, Relief and Economic Security Act (“CARES Act”) to provide certain relief as a result of the COVID-19 pandemic. The CARES Act provides tax relief, along with other stimulus measures, including an employer deferral of the deposit of the employer’s share of social security taxes during the period beginning March 27, 2020 and ending December 31, 2020. We deferred the employer paid portion of social security taxes as permitted by the CARES Act during fiscal 2021 and may continue to defer payment prior to the applicable date the deposits must be paid.
Treasury stock
Treasury stock is accounted for using the par value method.
Share-based compensation
We provide share-based compensation through non-qualified stock options, restricted stock awards and restricted stock units. We measure compensation cost arising from the grant of share-based payments to an employee at fair value, and recognize such cost in income over the period during which the employee is required to provide service in exchange for the award, usually the vesting period. The fair value of each option award is estimated on the date of grant primarily using the Black-Scholes option valuation model. The assumptions used to estimate fair value require judgment and are subject to change in the future due to factors such as employee exercise behavior, stock price trends, and changes to type or provisions of share-based awards. Any material change in one or more of these assumptions could have an impact on the estimated fair value of a future award.
|
|
|
|
|
|
|
|
|
|
|
|
|
|
|
|
|
|
|
|
Black-Scholes Valuation Model Assumptions |
|
|
|
|
|
|
|
|
|
(weighted-average) |
| 2021 |
|
| 2020 |
|
| 2019 |
|
Risk-free interest rate (a) |
| 0.27 | % |
| 1.85 | % |
| 2.81 | % |
Expected term (years) (b) |
| 4 |
|
| 4 |
|
| 4 |
|
Expected volatility (c) |
| 33.3 | % |
| 30.4 | % |
| 28.3 | % |
Dividend yield (d) |
| 1.60 | % |
| 1.12 | % |
| 1.24 | % |
(a)
(b)
(c)
(d)
The fair value of restricted stock awards and restricted stock units (collectively “restricted stock”) is determined based on the stock price at the date of grant.
We are required to estimate forfeitures and only record compensation costs for those awards that are expected to vest. The assumptions for forfeitures were determined based on type of award and historical experience. Forfeiture assumptions are adjusted at the point in time a significant change is identified, with any adjustment recorded in the period of change, and the final adjustment at the end of the requisite service period to equal actual forfeitures.
We recognize compensation expense related to stock options and restricted stock using the straight-line approach. Option awards and restricted stock generally vest equally over the service period established in the award, typically three years or four years. In 2020 and 2019, the Company issued a limited number of restricted stock units to members of senior management which may vest upon the achievement of a three year average return on invested capital target.
Earnings per common share
Basic earnings per common share amounts are calculated by dividing income available to common shareholders, after deducting preferred stock dividends, by the weighted average number of shares of common stock outstanding. Diluted earnings per common share amounts are calculated by dividing net income by the weighted average number of shares of common stock and common stock equivalents outstanding. Common stock equivalents represent shares issuable upon the assumed exercise of common stock options outstanding.
Advertising
The cost of advertising is generally expensed at the first time the advertising takes place, except for direct response advertising which is capitalized and amortized over its expected period of future benefit.
Direct response advertising consists primarily of coupons for Monro’s services. The capitalized costs of this advertising are amortized over the period of the coupon’s validity, which is typically two months.
Prepaid advertising at March 27, 2021 and March 28, 2020, and advertising expense for 2021, 2020 and 2019, were not material to these financial statements.
Vendor rebates
We receive vendor support in the form of allowances through a variety of vendor-sponsored programs, such as volume rebates, promotions, and advertising allowances, referred to as “vendor rebates”. Vendor rebates are recorded as a reduction of cost of sales.
We establish a receivable for vendor rebates that are earned but not yet received. Based on purchase data and the terms of the applicable vendor-sponsored programs, we estimate the amount earned. The majority of the year-end vendor rebates receivable is collected within the following first quarter. See Note 4 for additional information.
Note 2 – Impact of the COVID-19 Pandemic
In response to the unprecedented and rapid spread of COVID-19, many U.S. state governments, in states in which we operate, enacted stay-at-home restrictions and social distancing measures during fiscal 2021. State and local governments ordered restrictions on the operations of certain businesses, including temporary closures of some businesses, and numerous other businesses temporarily closed voluntarily or transitioned their workforces to working remotely.
Further, individuals’ ability to travel was curtailed through mandated travel restrictions. Throughout 2021, store traffic changed significantly and unpredictably in reaction to the COVID-19 pandemic. Substantially all Company-operated retail stores operated under a reduced schedule throughout the year to match demand.
Given the uncertainties surrounding the impacts of the COVID-19 pandemic on our future financial condition, results of operations and cash flows, we have taken a number of actions in response to prevailing uncertain market conditions. In order to enhance our liquidity position, we took a precautionary measure and borrowed $350 million available to us under our Credit Facility (as defined in Note 7 below) in March 2020. We subsequently repaid the $350 million previously borrowed in March 2020 during 2021.
Additionally, we negotiated rent deferrals for a significant number of our stores, as well as other rent reductions. See additional discussion of these rent deferrals and reductions in Note 15.
Note 3 – Acquisitions
Monro’s acquisitions are strategic moves in our plan to fill in and expand our presence in our existing and contiguous markets, expand into new markets and leverage fixed operating costs such as distribution, advertising and administration. Acquisitions in this footnote include acquisitions of five or more locations as well as acquisitions of one to four locations that are part of our greenfield store growth strategy.
Subsequent Event
On April 25, 2021, we acquired 30 retail tire and automotive repair stores located in California from Mountain View Tire & Service, Inc. These stores will operate under the Mountain View Tire & Service name. The acquisition was financed through our Credit Facility.
2021
On December 6, 2020, we acquired 17 retail tire and automotive repair stores located in California from Fred Allen Enterprises, Inc. for $17.1 million. These stores will operate under the Tire Choice name. The acquisition was financed through our Credit Facility. The results of operation for the acquisition are included in our financial results from the acquisition date.
Prior to this acquisition, our acquisition activity was paused due to the impact of the COVID-19 pandemic.
The acquisition resulted in goodwill related to, among other things, growth opportunities, synergies and economies of scale expected from combining the business with ours, as well as unidentifiable intangible assets. All of the goodwill is expected to be deductible for tax purposes. We have recorded a customer list intangible asset with a useful life of seven years at its estimated fair value of approximately $0.4 million. We have recorded acquired ROU assets at the present value of remaining lease payments adjusted to reflect favorable or unfavorable market terms of the lease.
We expensed all costs related to the acquisition during 2021. The total costs related to the completed acquisition were $0.3 million and these costs are included in the Consolidated Statement of Income and Comprehensive Income primarily under OSG&A expenses.
Sales and net income related to the completed acquisition totaled $5.8 million and $0.1 million, respectively for the period from acquisition date through March 27, 2021. The net income of $0.1 million includes an allocation of certain traditional corporate related items, including vendor rebates, interest expense and income taxes.
Supplemental pro forma information for the current or prior reporting periods has not been presented due to the impracticability of obtaining detailed, accurate or reliable data for the periods the acquired entity was not owned by Monro.
We accounted for the acquisition as a business combination using the acquisition method of accounting in accordance with the FASB ASC Topic 805, “Business Combinations.” The acquired assets and liabilities assumed were recorded at their acquisition-date fair values and were consolidated with those of the Company as of the acquisition date. The acquisition-date fair values were assigned based on preliminary valuations and estimates, and the consideration transferred and net liabilities assumed were recorded as goodwill.
|
|
|
|
|
|
|
|
2021 Acquisition-date Fair Values Assigned |
|
|
|
(thousands) |
|
|
|
Inventory |
| $ | 1,046 |
Other current assets |
|
| 172 |
Property and equipment |
|
| 674 |
Finance lease and financing obligation assets, net |
|
| 5,089 |
Operating lease assets, net |
|
| 8,980 |
Intangible asset |
|
| 418 |
Other non-current assets |
|
| 30 |
Long-term deferred income tax assets |
|
| 1,331 |
Total assets acquired |
|
| 17,740 |
Current portion of finance leases and financing obligations |
|
| 748 |
Current portion of operating lease liabilities |
|
| 976 |
Deferred revenue |
|
| 697 |
Other current liabilities |
|
| 4 |
Long-term finance leases and financing obligations |
|
| 7,911 |
Long-term operating lease liabilities |
|
| 7,433 |
Other long-term liabilities |
|
| 536 |
Total liabilities assumed |
|
| 18,305 |
Total net identifiable liabilities assumed |
| $ | (565) |
Total consideration transferred |
| $ | 17,112 |
Less: total net identifiable liabilities assumed |
|
| (565) |
Goodwill |
| $ | 17,677 |
The total consideration of $17.1 million is comprised of $16.3 million in cash, and a $0.8 million payable to the seller. The payable is due upon finalization of a lease assignment for one store location.
We continue to refine the valuation data and estimates primarily related to inventory, warranty reserves, intangible assets and real property leases and certain liabilities for the 2021 acquisition and expect to complete the valuations no later than the first anniversary date of the acquisition. We anticipate that adjustments will continue to be made to the fair values of identifiable assets acquired and liabilities assumed and those adjustments may or may not be material.
2020
During 2020, we acquired the following businesses for an aggregate purchase price of $103.7 million. The acquisitions were financed through our Credit Facility. The results of operations for these acquisitions are included in our financial results from the respective acquisition dates.
On November 17, 2019, we acquired 18 retail tire and automotive repair stores located in Nevada and Idaho from Nevada Tire Holdings, LLC and Idaho Tire Holdings, LLC. These stores operate under the Tire Choice name.
On October 27, 2019, we acquired six retail tire and automotive repair stores located in California from S & S Unlimited, Inc. Once converted, expected in fiscal 2022, these stores will operate under the Tire Choice name.
On October 27, 2019, we acquired three retail tire and automotive repair stores located in California from Lloyd’s Tire Service, Inc. Once converted, expected in fiscal 2022, these stores will operate under the Tire Choice name.
On August 25, 2019, we acquired one retail tire and automotive repair store located in Louisiana from Atlas Tire Center, Inc. This store operates under the Tire Choice name.
On August 25, 2019, we acquired two retail tire and automotive repair stores located in Louisiana from LRZ3 Auto, LLC. These stores operate under the Tire Choice name.
On August 25, 2019, we acquired one retail tire and automotive repair store located in Louisiana from T-Boy's Tire and Automotive, LLC. This store operates under the Tire Choice name.
On August 25, 2019, we acquired two retail tire and automotive repair stores located in Louisiana from Twin Tire & Auto Care, Inc. These stores operate under the Tire Choice name.
On August 25, 2019, we acquired one retail tire and automotive repair store located in Louisiana from Twin Tire & Auto Care Team, Inc. This store operates under the Tire Choice name.
On August 25, 2019, we acquired one retail tire and automotive repair store located in Louisiana from Scotty's Tire & Automotive, Inc. This store operates under the Tire Choice name.
On June 23, 2019, we acquired two retail tire and automotive repair stores located in California from BAW LLC. These stores operate under the Tire Choice name.
On May 19, 2019, we acquired 40 retail tire and automotive repair stores and one distribution center located in California from Certified Tire & Service Centers, Inc. These stores operate under the Tire Choice name.
On March 31, 2019, we acquired 12 retail tire and automotive repair stores located in Louisiana from Allied Discount Tire & Brake, Inc. These stores operate under the Tire Choice name.
These acquisitions resulted in goodwill related to, among other things, growth opportunities, synergies and economies of scale expected from combining these businesses with ours, as well as unidentifiable intangible assets. All of the goodwill is expected to be deductible for tax purposes. We have recorded certain customer list intangible assets with an average useful life of seven years at their total estimated fair value of approximately $2.8 million. We have recorded acquired ROU assets at the present value of remaining lease payments adjusted to reflect favorable or unfavorable market terms of the lease.
We expensed all costs related to these acquisitions during 2020. The total costs related to the completed acquisitions were $1.4 million for the year ended March 28, 2020. These costs are included in the Consolidated Statement of Income and Comprehensive Income primarily under OSG&A expense.
Sales and net loss for the 2020 acquired locations totaled $59.3 million and ($3.9) million, respectively, for the period from acquisition date through March 28, 2020. The net loss of ($3.9) million includes an allocation of certain traditional corporate related items, including vendor rebates, interest expense and the benefit from income taxes.
Supplemental pro forma information for the current or prior reporting periods has not been presented due to the impracticability of obtaining detailed, accurate or reliable data for the periods the acquired entities were not owned by Monro.
We accounted for each 2020 acquisition as a business combination using the acquisition method of accounting and we finalized the purchase accounting related to the 2020 acquisitions during 2021. As a result of the final purchase accounting, certain of the fair value amounts previously estimated were adjusted during the measurement period. These measurement period adjustments resulted from updated valuation reports and appraisals received from our external valuation specialists, as well as revisions to internal estimates. The measurement period adjustments were not material to the Consolidated Balance Sheet as of March 27, 2021 and March 28, 2020 and the Consolidated Statement of Income and Comprehensive Income for 2021 and 2020.
The acquired assets and liabilities assumed were recorded at their assigned acquisition-date fair values and were consolidated with those of the Company as of the acquisition date. The consideration transferred and net liabilities assumed were recorded as goodwill.
|
|
|
|
|
|
|
|
2020 Acquisition-date Fair Values Assigned |
|
|
|
(thousands) |
|
|
|
Inventories |
| $ | 4,433 |
Other current assets |
|
| 706 |
Property and equipment |
|
| 2,405 |
Finance lease and financing obligation assets, net |
|
| 29,147 |
Operating lease assets, net |
|
| 42,680 |
Intangible assets |
|
| 2,847 |
Other non-current assets |
|
| 374 |
Long-term deferred income tax assets |
|
| 4,870 |
Total assets acquired |
|
| 87,462 |
Current portion of finance leases and financing obligations |
|
| 2,672 |
Current portion of operating lease liabilities |
|
| 4,416 |
Deferred revenue |
|
| 1,618 |
Other current liabilities |
|
| 358 |
Long-term finance leases and financing obligations |
|
| 36,225 |
Long-term operating lease liabilities |
|
| 43,668 |
Other long-term liabilities |
|
| 1,747 |
Total liabilities assumed |
|
| 90,704 |
Total net identifiable liabilities assumed |
| $ | (3,242) |
Total consideration transferred |
| $ | 103,692 |
Less: total net identifiable liabilities assumed |
|
| (3,242) |
Goodwill |
| $ | 106,934 |
Note 4 – Other Current Assets
|
|
|
|
|
|
|
|
|
|
|
|
|
|
Other Current Assets |
|
|
|
|
|
|
(thousands) |
|
| March 27, 2021 |
|
| March 28, 2020 |
Vendor rebates receivable |
| $ | 15,068 |
| $ | 16,232 |
Other |
|
| 33,047 |
|
| 24,305 |
Total |
| $ | 48,115 |
| $ | 40,537 |
Note 5 – Property and Equipment
The major classifications of property, plant and equipment are as follows:
|
|
|
|
|
|
|
|
|
|
|
|
|
|
Property and Equipment |
|
|
|
|
|
|
(thousands) |
|
| March 27, 2021 |
|
| March 28, 2020 |
Land |
| $ | 84,485 |
| $ | 84,765 |
Buildings and improvements |
|
| 289,328 |
|
| 272,724 |
Equipment, signage and fixtures |
|
| 291,179 |
|
| 278,324 |
Vehicles |
|
| 37,684 |
|
| 38,356 |
Construction-in-progress |
|
| 7,073 |
|
| 8,763 |
Property and equipment |
|
| 709,749 |
|
| 682,932 |
Less - Accumulated depreciation |
|
| 382,686 |
|
| 354,295 |
Property and equipment, net |
| $ | 327,063 |
| $ | 328,637 |
Depreciation expense totaled $42.9 million, $39.2 million and $35.5 million for 2021, 2020 and 2019, respectively.
Note 6 – Goodwill and Intangible Assets
|
|
|
|
|
|
|
|
|
|
|
|
|
|
Reconciliation of Changes in Goodwill |
|
|
|
|
|
|
(thousands) |
|
| 2021 |
|
| 2020 |
Balance at beginning of period |
| $ | 671,843 |
| $ | 565,503 |
Current fiscal year acquisitions |
|
| 17,677 |
|
| 106,930 |
Adjustments to prior fiscal year acquisitions |
|
| 4 |
|
| (590) |
Balance at end of period |
| $ | 689,524 |
| $ | 671,843 |
|
|
|
|
|
|
|
|
|
|
|
|
|
|
|
|
|
|
|
|
|
|
|
|
|
|
Intangible Assets |
| March 27, 2021 |
| March 28, 2020 | ||||||||
|
|
| Gross |
|
| Accumulated |
|
| Gross |
|
| Accumulated |
(thousands) |
|
| Carrying Amount |
|
| Amortization |
|
| Carrying Amount |
|
| Amortization |
Customer lists |
| $ | 36,000 |
| $ | 21,932 |
| $ | 42,511 |
| $ | 26,333 |
Trade names |
|
| 18,452 |
|
| 10,321 |
|
| 21,252 |
|
| 12,072 |
Franchise agreements |
|
| 7,100 |
|
| 3,231 |
|
| 7,220 |
|
| 2,805 |
Other intangible assets |
|
| 50 |
|
| 50 |
|
| 590 |
|
| 582 |
Total |
| $ | 61,602 |
| $ | 35,534 |
| $ | 71,573 |
| $ | 41,792 |
|
|
|
|
|
|
Estimated Weighted Average Useful Lives |
| Life (Years) |
Customer lists |
| 10 |
Trade names |
| 15 |
Franchise agreements |
| 13 |
Other intangible assets |
| 20 |
Amortization expense was $4.1 million, $4.8 million and $5.3 million for 2021, 2020 and 2019, respectively.
|
|
|
|
|
|
|
|
|
|
Estimated Future Amortization Expense |
|
|
|
|
(thousands) |
|
| Amortization |
|
2022 |
| $ | 3,838 |
|
2023 |
|
| 3,583 |
|
2024 |
|
| 3,223 |
|
2025 |
|
| 2,866 |
|
2026 |
|
| 2,646 |
|
Note 7 – Long-term Debt
Credit Facility
In April 2019, we entered into a new five year $600 million revolving credit facility agreement with eight banks (the “Credit Facility”). Interest only is payable monthly throughout the Credit Facility’s term. The borrowing capacity for the Credit Facility of $600 million includes an accordion feature permitting us to request an increase in availability of up to an additional $250 million. The Credit Facility bears interest at 75 to 200 basis points over LIBOR (or replacement index) or at the prime rate, depending on the type of borrowing and the rates then in effect.
On June 11, 2020, we entered into a First Amendment to the Credit Facility (the “First Amendment”), which, among other things, amended the terms of certain of the financial and restrictive covenants in the credit agreement through the first quarter of 2022 to provide us with additional flexibility to operate our business. The First Amendment permanently amended the interest rate charged on borrowings to be based on the greater of adjusted one-month LIBOR or 0.75 percent. For the period from June 30, 2020 to June 30, 2021, the minimum interest rate spread charged on borrowings will be 225 basis points over LIBOR. Additionally, during the same period, we may declare, make or pay any dividend or distribution up to $38.5 million in the aggregate and the acquisition of stores or other businesses up to $100 million in the aggregate are permitted if we are in compliance with the financial covenants and other restrictions in the First Amendment and Credit Facility. The Credit Facility requires fees payable quarterly throughout the term between 0.125 percent and 0.35 percent of the amount of the average net availability under the Credit Facility during the preceding quarter. Except as amended by the First Amendment, the remaining terms of the credit agreement remain in full force and effect.
At March 27, 2021 and March 28, 2020, the interest rate spread paid by the Company was 225 basis points and 100 basis points over LIBOR, respectively.
Within the Credit Facility, we have a sub-facility of $80 million available for the purpose of issuing standby letters of credit. The sub-facility requires fees aggregating 87.5 to 212.5 basis points annually of the face amount of each standby letter of credit, payable quarterly in arrears. There was a $33.6 million outstanding letter of credit at March 27, 2021.
Mortgages and specific lease financing arrangements with other parties (with certain limitations) are permitted under the Credit Facility. Other specific terms and the maintenance of specified ratios are generally consistent with our prior financing agreement that was replaced with the new agreement entered into in April 2019. Additionally, the Credit Facility is not secured by our real property, although we have agreed not to encumber our real property, with certain permissible exceptions.
There was $190.0 million outstanding and $376.4 million available under the Credit Facility at March 27, 2021.
We were in compliance with all debt covenants at March 27, 2021.
Long-term debt had a carrying amount and a fair value of $190.0 million as of March 27, 2021, as compared to a carrying amount and a fair value of $566.4 million as of March 28, 2020. The carrying value of our debt approximated its fair value due to the variable interest nature of the debt.
Note 8 – Revenue
Automotive undercar repair, tire replacement sales and tire related services represent the vast majority of our revenues. We also earn revenue from the sale of tire road hazard warranty agreements as well as commissions earned from the delivery of tires on behalf of certain tire vendors.
Revenue from automotive undercar repair, tire replacement sales and tire related services is recognized at the time the customers take possession of their vehicle or merchandise. For sales to certain customers that are financed through the offering of credit on account, payment terms are established for customers based on our pre-established credit requirements. Payment terms vary depending on the customer and generally range from 15 to 45 days. Based on the nature of receivables, no significant financing components exist. Sales are recorded net of discounts, sales incentives and rebates, sales taxes and estimated returns and allowances. We estimate the reduction to sales and cost of sales for returns based on current sales levels and our historical return experience. Such amounts are immaterial to our consolidated financial statements.
|
|
|
|
|
|
|
|
|
|
|
|
|
|
|
|
|
|
|
|
Revenues |
|
|
|
|
|
|
|
|
|
(thousands) |
|
| 2021 |
|
| 2020 |
|
| 2019 |
Brakes |
| $ | 130,179 |
| $ | 169,138 |
| $ | 162,709 |
Exhaust |
|
| 20,201 |
|
| 25,058 |
|
| 28,713 |
Steering |
|
| 85,290 |
|
| 100,230 |
|
| 95,711 |
Tires (a) |
|
| 617,815 |
|
| 634,513 |
|
| 601,295 |
Maintenance |
|
| 269,337 |
|
| 324,494 |
|
| 308,668 |
Other |
|
| 2,899 |
|
| 3,091 |
|
| 3,134 |
Total |
| $ | 1,125,721 |
| $ | 1,256,524 |
| $ | 1,200,230 |
(a)
Revenue from the sale of tire road hazard warranty agreements is initially deferred and is recognized over the contract period as costs are expected to be incurred in performing such services, typically 21 to 36 months. The deferred revenue balances at March 27, 2021 and March 28, 2020 were $16.7 million and $18.5 million, respectively, of which $12.0 million and $13.1 million, respectively, are reported in Deferred revenue and $4.7 million and $5.4 million, respectively, are reported in Other long-term liabilities in our Consolidated Balance Sheets.
|
|
|
|
|
|
|
|
|
|
|
|
|
|
Changes in Deferred Revenue |
|
|
|
|
|
|
(thousands) |
|
| 2021 |
|
| 2020 |
Balance at beginning of period |
| $ | 18,506 |
| $ | 17,150 |
Deferral of revenue |
|
| 14,958 |
|
| 17,466 |
Deferral of revenue from acquisitions |
|
| 1,225 |
|
| 2,916 |
Recognition of revenue |
|
| (17,977) |
|
| (19,026) |
Balance at end of period |
| $ | 16,712 |
| $ | 18,506 |
We expect to recognize $12.0 million of deferred revenue related to road hazard warranty agreements during our fiscal year ending March 26, 2022, and $4.7 million of such deferred revenue thereafter.
Under various arrangements, we receive from certain tire vendors a delivery commission and reimbursement for the cost of the tire that we may deliver to customers on behalf of the tire vendor. The commission we earn from these transactions is as an agent and the net amount retained is recorded as sales.
Note 9 – Income Taxes
|
|
|
|
|
|
|
|
|
|
|
|
|
|
|
|
|
|
|
|
Provision for Income Taxes |
|
|
|
|
|
|
|
|
|
(thousands) |
|
| 2021 |
|
| 2020 |
|
| 2019 |
Current: |
|
|
|
|
|
|
|
|
|
Federal |
| $ | (1,809) |
| $ | 2,783 |
| $ | 5,682 |
State |
|
| 827 |
|
| 1,994 |
|
| 2,409 |
Total current |
|
| (982) |
|
| 4,777 |
|
| 8,091 |
Deferred: |
|
|
|
|
|
|
|
|
|
Federal |
|
| 10,169 |
|
| 11,397 |
|
| 11,563 |
State |
|
| 685 |
|
| 76 |
|
| 954 |
Total deferred |
|
| 10,854 |
|
| 11,473 |
|
| 12,517 |
Total provision |
| $ | 9,872 |
| $ | 16,250 |
| $ | 20,608 |
|
|
|
|
|
|
|
|
|
|
|
|
|
|
|
|
|
|
|
|
Income Tax Rate Reconciliation |
| 2021 |
|
| 2020 |
|
| 2019 |
|
Expected U.S. federal income taxes at statutory rate |
| 21.0 | % |
| 21.0 | % |
| 21.0 | % |
State income taxes, net of federal tax benefit |
| 2.9 |
|
| 1.9 |
|
| 2.8 |
|
Tax settlements and adjustments (a) |
| (1.1) |
|
| — |
|
| (1.9) |
|
Other |
| (0.5) |
|
| (1.0) |
|
| (1.4) |
|
Effective tax rate |
| 22.3 | % |
| 21.9 | % |
| 20.5 | % |
(a)
|
|
|
|
|
|
|
|
|
|
|
|
|
|
Net Deferred Tax Asset/(Liability) |
|
|
|
|
|
|
(thousands) |
|
| March 27, 2021 |
|
| March 28, 2020 |
Gross deferred tax assets: |
|
|
|
|
|
|
Lease liabilities |
| $ | 186,168 |
| $ | 169,366 |
Insurance reserves |
|
| 11,441 |
|
| 10,192 |
Other |
|
| 15,282 |
|
| 14,765 |
Total gross deferred tax assets |
|
| 212,891 |
|
| 194,323 |
Gross deferred tax liabilities: |
|
|
|
|
|
|
Leased assets |
|
| (148,496) |
|
| (131,484) |
Goodwill |
|
| (56,623) |
|
| (47,204) |
Property and equipment |
|
| (21,032) |
|
| (18,232) |
Other |
|
| (910) |
|
| (1,288) |
Total deferred tax liabilities |
|
| (227,061) |
|
| (198,208) |
Total net deferred tax liability |
| $ | (14,170) |
| $ | (3,885) |
We have $7.5 million of state net operating loss carryforwards and $3.5 million of federal net operating loss carrybacks available as of March 27, 2021. The state net operating loss carryforwards expire in varying amounts through 2041. The federal net operating loss may be carried back to 2016, as permitted under the CARES Act.
We evaluate the realizability of our deferred tax assets on a quarterly basis and establish valuation allowances when it is more likely than not that all or a portion of a deferred tax asset may not be realized. As of March 27, 2021, we concluded, based on the weight of all available positive and negative evidence, that all of our deferred tax assets are more likely than not to be realized.
|
|
|
|
|
|
|
|
|
|
|
|
|
|
|
|
|
|
|
|
Changes in Liability for Unrecognized Tax Benefits |
|
|
|
|
|
|
|
|
|
(thousands) |
|
| 2021 |
|
| 2020 |
|
| 2019 |
Balance at beginning of period |
| $ | 5,212 |
| $ | 6,424 |
| $ | 6,209 |
Additions based on tax positions related to the current year |
|
| 915 |
|
| 644 |
|
| 1,178 |
Additions for tax positions of prior years |
|
| — |
|
| — |
|
| 166 |
Reductions for tax positions of prior years |
|
| — |
|
| (30) |
|
| (6) |
Settlements |
|
| — |
|
| — |
|
| — |
Lapse in statutes of limitation |
|
| (1,092) |
|
| (1,826) |
|
| (1,123) |
Balance at end of period |
| $ | 5,035 |
| $ | 5,212 |
| $ | 6,424 |
The total amount of unrecognized tax benefits was $5.0 million, $5.2 million and $6.4 million at March 27, 2021, March 28, 2020 and March 30, 2019, respectively, the majority of which, if recognized, would affect the effective tax rate.
In the normal course of business, Monro provides for uncertain tax positions and the related interest and penalties, and adjusts its unrecognized tax benefits and accrued interest and penalties and, accordingly, we had approximately $0.2 million and $0.3 million of interest and penalties associated with uncertain tax benefits accrued as of March 27, 2021 and March 28, 2020, respectively.
We file U.S. federal income tax returns and income tax returns in various state jurisdictions. Monro’s fiscal 2020, 2019 and 2018 U.S. federal tax year and various state tax years remain subject to income tax examinations by tax authorities.
Note 10 – Stock Ownership
Holders of at least 60 percent of the Class C preferred stock must approve any action authorized by the holders of Common Stock. In addition, there are certain restrictions on the transferability of shares of Class C preferred stock. In the event of a liquidation, dissolution or winding-up of Monro, the holders of the Class C preferred stock would be entitled to receive $1.50 per share out of the assets of Monro before any amount would be paid to holders of Common Stock. The conversion value of the Class C convertible preferred stock was $0.064 per share at March 27, 2021 and March 28, 2020.
Note 11 – Share-based Compensation
We maintain a long-term incentive plan whereby eligible employees and non-employee directors may be granted non-qualified service condition stock options, non-qualified market condition stock options, restricted stock awards and restricted stock units. We grant share-based awards to continue to attract and retain employees and to better align employees’ interests with those of our shareholders. Monro issues new shares of Common Stock upon the exercise of stock options.
Share-based compensation expense included in cost of sales and OSG&A expense in Monro’s Consolidated Statements of Income and Comprehensive Income for 2021, 2020 and 2019 was $2.4 million, $3.8 million and $4.0 million, respectively, and the related income tax benefit for each year was $0.6 million, $0.9 million and $1.0 million, respectively.
Monro currently grants stock option awards and restricted stock under the 2007 Incentive Stock Option Plan (the “2007 Plan”), as amended and restated effective August 2017. At March 27, 2021, there were a total of 5,001,620 shares and 1,064,945 shares that were authorized and available for grant under the 2007 Plan, respectively.
Non-Qualified Stock Options
Generally, employee options vest over a four year period, and have a duration of six years. Outstanding options are exercisable for various periods through March 2027.
|
|
|
|
|
|
|
|
|
|
|
|
|
|
|
|
|
|
|
|
Stock Option Activity |
|
|
|
|
|
| Weighted-average |
|
|
|
|
|
|
|
|
| Remaining |
|
|
|
| Stock |
|
| Weighted-average |
| Contractual |
| Aggregate Intrinsic |
|
| Options |
|
| Exercise Price |
| Term (years) |
| Value (a) |
Outstanding as of March 28, 2020 |
| 802,766 |
| $ | 58.55 |
|
|
|
|
Granted |
| 166,193 |
|
| 55.29 |
|
|
|
|
Exercised |
| (130,998) |
|
| 47.93 |
|
|
|
|
Canceled |
| (324,094) |
|
| 56.14 |
|
|
|
|
Outstanding as of March 27, 2021 |
| 513,867 |
| $ | 61.75 |
| 3.12 | $ | 3,483,001 |
Vested and exercisable as of March 27, 2021 |
| 286,549 |
| $ | 61.30 |
| 1.93 | $ | 1,805,603 |
(a)
As of March 27, 2021, the total unrecognized compensation expense related to unvested stock option awards was $2.7 million, which is expected to be recognized over a weighted average period of approximately three years. The weighted-average grant date fair value of options granted during 2021, 2020 and 2019 was $12.53, $18.92 and $15.44, respectively. The total fair value of stock options vested during 2021, 2020 and 2019 was $2.0 million, $2.0 million and $2.8 million, respectively.
|
|
|
|
|
|
|
|
|
Stock Option Exercises |
|
|
|
|
|
|
|
|
(millions) |
| 2021 |
|
| 2020 |
|
| 2019 |
Total intrinsic value of stock options exercised | $ | 1.5 |
| $ | 2.9 |
| $ | 7.4 |
Cash received for exercise price |
| 6.3 |
|
| 6.2 |
|
| 14.6 |
Income tax benefit |
| — |
|
| 0.4 |
|
| 1.0 |
|
|
|
|
|
|
|
|
|
|
|
|
|
|
|
|
|
|
|
|
|
|
|
|
|
|
|
|
|
|
Stock Options Outstanding |
| Options Outstanding |
| Options Exercisable | ||||||||||
and Exercisable |
|
|
| Weighted- |
|
|
|
|
|
| Weighted- |
|
|
|
|
|
|
| average |
|
| Weighted- |
|
|
| average |
|
| Weighted- |
|
| Shares |
| Remaining |
|
| average |
| Shares |
| Remaining |
|
| average |
|
| Outstanding |
| Contractual |
|
| Exercise |
| Exercisable |
| Contractual |
|
| Exercise |
Range of Exercise Prices |
| at 3/27/2021 |
| Term (years) |
|
| Price |
| at 3/27/2021 |
| Term (years) |
|
| Price |
$40.71 - $55.15 |
| 129,817 |
| 3.77 |
| $ | 50.86 |
| 53,993 |
| 2.35 |
| $ | 47.88 |
$55.16 - $57.78 |
| 131,696 |
| 2.93 |
|
| 56.97 |
| 66,393 |
| 0.86 |
| $ | 57.28 |
$57.79 - $66.90 |
| 134,126 |
| 2.36 |
|
| 64.38 |
| 113,151 |
| 2.03 |
| $ | 64.37 |
$66.91 - $87.17 |
| 118,228 |
| 3.49 |
|
| 76.04 |
| 53,012 |
| 2.62 |
| $ | 73.44 |
Restricted Stock
Monro issues restricted stock to certain members of senior management as well as non-employee directors of the Company. Restricted stock units represent shares issued upon vesting in the future whereas restricted stock awards represent shares issued upon grant that are restricted. The fair value for restricted stock units and restricted stock awards is calculated based on the stock price on the date of grant. Restricted stock units do not have voting rights but earn dividends during the vesting period. The recipients of the restricted stock awards have voting rights and earn dividends during the vesting period. The dividends are paid to the recipient at the time the restricted stock becomes vested. If the recipient leaves Monro prior to the vesting date for any reason, the shares of restricted stock and the dividends accrued on those shares will be forfeited and returned to Monro. The restricted stock units and awards vest equally over three years or four years. In 2020 and 2019, the Company issued a limited number of restricted stock units to members of senior management which may vest upon the achievement of a three year average return on invested capital target.
Subsequent to fiscal 2021, the Company granted 40,000 restricted stock units in connection with the appointment of its new President and Chief Executive Officer effective April 5, 2021. The restricted stock units will vest upon time or the Company’s common stock price meeting certain market conditions between April 2021 and December 2023.
|
|
|
|
|
|
|
|
|
|
|
|
Non-vested Restricted Stock Activity |
|
|
|
| Weighted-average |
|
| Restricted Stock |
|
| Grant-date |
|
| Shares |
|
| Fair Value per Share |
Outstanding as of March 28, 2020 |
| 55,730 |
| $ | 64.96 |
Granted |
| 35,019 |
|
| 52.75 |
Vested |
| (26,333) |
|
| 56.52 |
Forfeited |
| (12,703) |
|
| 63.90 |
Outstanding as of March 27, 2021 |
| 51,713 |
| $ | 61.24 |
As of March 27, 2021, the total unrecognized compensation expense related to unvested restricted stock shares was $1.4 million, which is expected to be recognized over a weighted average period of approximately two years. The weighted-average grant date fair value of restricted stock shares granted during 2021, 2020 and 2019 was $52.75, $75.33 and $67.80, respectively. The total fair value of restricted stock shares vested during 2021, 2020 and 2019 was $1.4 million, $1.8 million and $1.0 million, respectively.
Note 12 – Earnings per Common Share
|
|
|
|
|
|
|
|
|
|
|
|
|
|
|
|
|
|
|
|
Earnings per Common Share |
|
|
|
|
|
|
|
|
|
(thousands, except per share data) |
|
| 2021 |
|
| 2020 |
|
| 2019 |
Numerator for earnings per common share calculation: |
|
|
|
|
|
|
|
|
|
Net income |
| $ | 34,319 |
| $ | 58,024 |
| $ | 79,752 |
Less: Preferred stock dividends |
|
| (438) |
|
| (449) |
|
| (408) |
Income available to common stockholders |
| $ | 33,881 |
| $ | 57,575 |
| $ | 79,344 |
Denominator for earnings per common share calculation: |
|
|
|
|
|
|
|
|
|
Weighted average common shares - basic |
|
| 33,329 |
|
| 33,246 |
|
| 32,980 |
Effect of dilutive securities: |
|
|
|
|
|
|
|
|
|
Preferred stock |
|
| 503 |
|
| 510 |
|
| 510 |
Stock options |
|
| 26 |
|
| 167 |
|
| 154 |
Restricted stock |
|
| 18 |
|
| 30 |
|
| 31 |
Weighted average common shares - diluted |
|
| 33,876 |
|
| 33,953 |
|
| 33,675 |
|
|
|
|
|
|
|
|
|
|
Basic earnings per common share |
| $ | 1.02 |
| $ | 1.73 |
| $ | 2.41 |
Diluted earnings per common share |
| $ | 1.01 |
| $ | 1.71 |
| $ | 2.37 |
The computation of diluted earnings per common share for 2021, 2020 and 2019 excludes the effect of assumed exercise of approximately 456,000, 177,000 and 146,000 of stock options, respectively, as the exercise price of these options was greater than the average market value of our common stock for those periods, resulting in an anti-dilutive effect on diluted earnings per common share.
Note 13 – Leases
We lease certain retail stores, distribution centers, office space and land as well as service contracts that are considered leases.
Our leases have remaining lease terms, including renewals reasonably certain to be exercised, of less than one year to approximately 37 years. Most of our leases include one or more options to extend the lease, for periods ranging from three years to 25 years or more.
Historical failed sale leasebacks that were assumed through acquisitions and do not qualify for sale leaseback accounting continue to be accounted for as financing obligations. As of March 27, 2021 and March 28, 2020, net assets of $4.4 million and $4.5 million, respectively, and liabilities of $7.2 million and $7.5 million, respectively, due to failed sale leaseback arrangements were included with finance lease assets and liabilities, respectively, on the Consolidated Balance Sheets.
|
|
|
|
|
|
|
|
|
|
|
|
|
|
Lease Cost |
|
|
|
|
|
|
(thousands) |
|
| 2021 |
|
| 2020 |
Operating lease cost |
| $ | 35,998 |
| $ | 38,525 |
Finance lease/financing obligations cost: |
|
|
|
|
|
|
Amortization of leased assets |
|
| 30,428 |
|
| 21,033 |
Interest on lease liabilities |
|
| 18,344 |
|
| 21,330 |
Short term and variable lease cost |
|
| 321 |
|
| 2,194 |
Sublease income |
|
| (95) |
|
| (166) |
Total lease cost |
| $ | 84,996 |
| $ | 82,916 |
As reported under the previous accounting standard, net rental expense and amortization of finance lease assets was $38.0 million and $14.7 million, respectively, for 2019.
|
|
|
|
|
|
|
|
|
|
|
|
|
|
Maturity of Lease Liabilities |
|
|
|
|
| Finance Leases and |
(thousands) |
|
| Operating Leases (a) |
|
| Financing Obligations (b) |
2022 |
| $ | 36,451 |
| $ | 55,389 |
2023 |
|
| 34,381 |
|
| 55,487 |
2024 |
|
| 31,685 |
|
| 54,405 |
2025 |
|
| 28,414 |
|
| 51,494 |
2026 |
|
| 25,161 |
|
| 48,992 |
Thereafter |
|
| 83,454 |
|
| 250,812 |
Total undiscounted lease obligations |
| $ | 239,546 |
| $ | 516,579 |
Less: imputed interest |
|
| (30,919) |
|
| (112,446) |
Present value of lease obligations |
| $ | 208,627 |
| $ | 404,133 |
(a)
(b)
Total lease payments exclude $2.4 million of legally binding minimum lease payments for leases signed but not yet commenced.
|
|
|
|
|
|
|
|
|
|
|
|
|
|
Lease Term and Discount Rate |
| 2021 |
|
| 2020 |
|
Weighted average remaining lease term (years) |
|
|
|
|
|
|
Operating leases |
| 8.6 |
|
| 9.4 |
|
Finance leases and financing obligations |
| 10.3 |
|
| 9.9 |
|
Weighted average discount rate |
|
|
|
|
|
|
Operating leases |
| 2.96 | % |
| 3.51 | % |
Finance leases and financing obligations |
| 6.20 | % |
| 8.73 | % |
|
|
|
|
|
|
|
|
|
|
|
|
|
|
Other Information |
|
|
|
|
|
|
(thousands) |
|
| 2021 |
|
| 2020 |
Cash paid for amounts included in measurement of lease obligations: |
|
|
|
|
|
|
Operating cash flows from operating leases |
| $ | 34,931 |
| $ | 36,808 |
Operating cash flows from finance leases and financing obligations |
|
| 18,602 |
|
| 21,340 |
Financing cash flows from finance leases and financing obligations |
|
| 33,032 |
|
| 27,212 |
0
Note 14 – Defined Benefit and Defined Contribution Plans
Defined Benefit Plan
We have a defined benefit pension plan covering employees who meet eligibility requirements. This plan is closed to new participants. Eligibility and the level of benefits under the plan are primarily dependent on date of hire, age, length of service and compensation. The funding policy for our plan is consistent with the funding requirements of U.S. federal law and regulations. The measurement date used to determine the pension plan measurements disclosed herein is March 31 for both 2021 and 2020.
The underfunded status of Monro’s defined benefit plan is recognized as an Other long-term liability in the Consolidated Balance Sheets as of March 27, 2021 and March 28, 2020, respectively.
|
|
|
|
|
|
|
Underfunded Status |
|
|
|
|
|
|
(thousands) |
|
| 2021 |
|
| 2020 |
Projected benefit obligations |
| $ | 22,096 |
| $ | 21,646 |
Fair value of plan assets |
|
| 21,666 |
|
| 18,611 |
Underfunded status |
| $ | (430) |
| $ | (3,035) |
Contributions and Estimated Future Benefit Payment
Our obligations to plan participants can be met over time through a combination of company contributions to these plans and earnings on plan assets. There are no required or expected contributions in fiscal 2022 to the plan. However, depending on investment performance and plan funded status, we may elect to make a contribution.
|
|
|
|
|
|
|
|
Estimated Future Benefit Payments |
|
|
|
(thousands) |
|
| Pension Benefits |
2022 |
| $ | 1,065 |
2023 |
|
| 1,098 |
2024 |
|
| 1,114 |
2025 |
|
| 1,147 |
2026 |
|
| 1,188 |
2027 - 2031 |
|
| 6,322 |
Cost of Plans
|
|
|
|
|
|
|
|
|
|
|
|
|
|
|
|
|
|
|
|
Net Pension Benefits Expense (Income) |
|
|
|
|
|
|
|
|
|
(thousands) |
|
| 2021 |
|
| 2020 |
|
| 2019 |
Interest cost on projected benefit obligation |
| $ | 692 |
| $ | 752 |
| $ | 781 |
Expected return on plan assets |
|
| (1,162) |
|
| (1,423) |
|
| (1,409) |
Amortization of unrecognized actuarial loss |
|
| 892 |
|
| 455 |
|
| 403 |
Total |
| $ | 422 |
| $ | (216) |
| $ | (225) |
Assumptions
|
|
|
|
|
|
|
|
|
|
|
|
|
|
Benefit Obligation Weighted Average Assumption |
| 2021 |
|
| 2020 |
|
Discount rate |
| 3.01 | % |
| 3.34 | % |
|
|
|
|
|
|
|
|
|
|
|
|
|
|
|
|
|
|
|
|
Net Periodic Benefit Expense Weighted Average Assumptions |
| 2021 |
|
| 2020 |
|
| 2019 |
|
Discount rate |
| 3.34 | % |
| 3.72 | % |
| 3.89 | % |
Expected long-term rate of return on plan assets |
| 6.50 | % |
| 7.00 | % |
| 7.00 | % |
Our expected long-term rate of return on plan assets assumption is based upon historical returns and the future expectations for returns for each asset class, as well as the target asset allocation of the pension portfolio.
Benefit Obligation
|
|
|
|
|
|
|
|
|
|
|
|
|
|
Change in Projected Benefit Obligation |
|
|
|
|
|
|
(thousands) |
|
| 2021 |
|
| 2020 |
Benefit obligation at beginning of year |
| $ | 21,646 |
| $ | 20,972 |
Interest cost |
|
| 692 |
|
| 752 |
Actuarial loss |
|
| 391 |
|
| 642 |
Benefits paid |
|
| (633) |
|
| (720) |
Benefit obligation at end of year (a) |
| $ | 22,096 |
| $ | 21,646 |
(a)
Plan Assets
|
|
|
|
|
|
|
|
|
|
|
|
|
|
Change in Plan Assets |
|
|
|
|
|
|
(thousands) |
|
| 2021 |
|
| 2020 |
Fair value of plan assets at beginning of year |
| $ | 18,611 |
| $ | 20,838 |
Actual return (loss) on plan assets |
|
| 3,688 |
|
| (1,507) |
Benefits paid |
|
| (633) |
|
| (720) |
Fair value of plan assets at end of year |
| $ | 21,666 |
| $ | 18,611 |
Our asset allocation strategy is to conservatively manage the assets in order to meet the plan’s long-term obligations while maintaining sufficient liquidity to pay current benefits. This is achieved by holding equity investments while investing a portion of assets in long duration bonds to match the long-term nature of the liabilities.
|
|
|
|
|
|
|
|
|
|
|
|
|
|
|
|
|
|
|
|
Asset Category |
| Current Targeted |
|
| Actual Allocation | ||||
|
| Allocation |
|
| 2021 |
|
| 2020 |
|
Cash and cash equivalents |
|
|
|
| 53.3 | % |
| 4.1 | % |
Fixed income |
| 50.0 | % |
| 24.7 | % |
| 37.9 | % |
Equity securities |
| 50.0 | % |
| 22.0 | % |
| 58.0 | % |
Total |
| 100.0 | % |
| 100.0 | % |
| 100.0 | % |
The allocation of assets as of March 2021 was weighted heavier in cash and cash equivalents as the Plan’s assets were transferred from its previous custodian to a new custodian late in 2021 by the Plan’s new asset manager. As such, cash and cash equivalent assets were being reinvested into new assets in accordance with our asset allocation strategy late in fiscal 2021 and into 2022.
|
|
|
|
|
|
|
|
|
|
|
|
|
|
|
|
|
|
|
|
Fair Value Measurements |
|
|
|
| Fair Value at | ||||
(thousands) |
|
| Pricing Category (a) |
|
| March 27, 2021 |
|
| March 28, 2020 |
Cash equivalents |
|
| Level 1 |
| $ | 11,542 |
| $ | 761 |
Equity securities: |
|
|
|
|
|
|
|
|
|
U.S. companies |
|
| Level 1 |
|
| 3,372 |
|
| 7,383 |
U.S. companies |
|
| Level 2 |
|
| — |
|
| 283 |
International companies |
|
| Level 1 |
|
| 1,391 |
|
| 3,137 |
Fixed income: |
|
|
|
|
|
|
|
|
|
U.S. corporate bonds |
|
| Level 2 |
|
| 5,361 |
|
| 6,686 |
International bonds |
|
| Level 2 |
|
| — |
|
| 361 |
Total plan assets |
|
|
|
| $ | 21,666 |
| $ | 18,611 |
(a)
Amounts included in Shareholders’ Equity
|
|
|
|
|
|
|
|
|
|
|
|
|
|
Amounts in Accumulated Other Comprehensive Loss |
|
|
|
|
|
|
(thousands) |
|
| 2021 |
|
| 2020 |
Unamortized net actuarial loss |
| $ | 6,147 |
| $ | 9,174 |
Amounts in Accumulated Other Comprehensive Loss (a) |
| $ | 6,147 |
| $ | 9,174 |
(a)
Amounts included in Comprehensive Income
|
|
|
|
|
|
|
|
|
|
|
|
|
|
|
|
|
|
|
|
Amounts in Other Comprehensive Income (Loss) |
|
|
|
|
|
|
|
|
|
(thousands) |
|
| 2021 |
|
| 2020 |
|
| 2019 |
Net actuarial income (loss) |
| $ | 3,027 |
| $ | (3,117) |
| $ | (382) |
Amounts in Other Comprehensive Income (Loss) (a) |
| $ | 3,027 |
| $ | (3,117) |
| $ | (382) |
(a)
Defined Contribution Plan
Our employees are eligible to participate in a defined contribution 401(k) plan that covers full-time employees who meet the age and service requirements of the plan. The plan is funded by employee and employer contributions. We match 50 percent of the first 6 percent of employee contributions. Employer contributions totaled approximately $1.6 million, $1.7 million and $1.4 million for 2021, 2020 and 2019, respectively. We may also make annual profit sharing contributions to the plan at the discretion of Monro’s Compensation Committee of the Board of Directors.
In addition, we maintain a deferred compensation plan (the “Deferred Compensation Plan”) for a broad management group whose participation in our 401(k) plan is limited by statute or regulation. The Deferred Compensation Plan permits participants to defer all or any portion of the compensation that would otherwise be payable to them for the calendar year. We credit to the participants’ accounts such amounts as would have been contributed to Monro’s 401(k) plan but for the limitations that are imposed by statute or regulation. The Deferred Compensation Plan is an unfunded arrangement and the participants or their beneficiaries have an unsecured claim against the general assets of Monro to the extent of their Deferred Compensation Plan benefits. We maintain accounts to reflect the amounts owed to each participant. At least annually, the accounts are credited with earnings or losses calculated on the basis of an interest rate or other formula as determined by Monro’s Compensation Committee. The total liability recorded in our financial statements at March 27, 2021 and March 28, 2020 related to the Deferred Compensation Plan was approximately $2.1 million and $2.2 million, respectively.
Note 15 – Commitments and Contingencies
Commitments
|
|
|
|
|
|
|
|
|
|
|
|
|
|
|
|
|
|
|
|
|
|
|
|
|
|
|
|
|
|
|
|
Commitments Due by Period |
|
|
|
|
| Within |
|
| 2 to |
|
| 4 to |
|
| After |
(thousands) |
|
| Total |
|
| 1 Year |
|
| 3 Years |
|
| 5 Years |
|
| 5 Years |
Principal payments on long-term debt |
| $ | 190,000 |
|
|
|
|
|
|
| $ | 190,000 |
|
|
|
Finance lease commitments/financing obligations (a) |
|
| 516,579 |
| $ | 55,389 |
| $ | 109,892 |
|
| 100,486 |
| $ | 250,812 |
Operating lease commitments (a) |
|
| 239,546 |
|
| 36,451 |
|
| 66,066 |
|
| 53,575 |
|
| 83,454 |
Accrued rent |
|
| 1,807 |
|
| 1,563 |
|
| 132 |
|
| 42 |
|
| 70 |
Other liabilities |
|
| 1,133 |
|
| 800 |
|
| 333 |
|
| — |
|
| — |
Total |
| $ | 949,065 |
| $ | 94,203 |
| $ | 176,423 |
| $ | 344,103 |
| $ | 334,336 |
(a)
During 2021, we negotiated rent deferrals, with repayment at later dates, for a significant number of our store leases. These concessions provide a deferral of rent payments with no substantive changes to the original contract. Consistent with updated guidance from the FASB in April 2020, we have elected to treat the rent deferrals as accrued liabilities. The accrued rent reflected in the table above includes $0.8 million related to rent deferrals due primarily in the first and second quarter of 2022 and $1.0 million due to timing of other lease related expenses. We will continue to recognize expense during the deferral periods.
In addition, during 2021, we negotiated rent reductions with certain landlords on approximately 23 percent of our lease contracts in exchange for extending our current lease term. As these agreements represent substantive changes to our contractual obligations, the leases were remeasured. As a result, finance lease and financing obligation assets, net and finance leases and financing obligations were increased by $67.7 million and $64.0 million, respectively, and operating lease assets, net and operating lease liabilities were increased by $16.2 million and $20.0 million, respectively. The negotiated terms were generally consistent with terms of normal renewal agreements.
We believe that we can fulfill our commitments utilizing our cash flow from operations and, if necessary, cash on hand and/or bank financing.
Contingencies
We are currently a party to various claims and legal proceedings incidental to the conduct of our business. If management believes that a loss arising from any of these matters is probable and can reasonably be estimated, we will record the amount of the loss, or the minimum estimated liability when the loss is estimated using a range, and no point within the range is more probable than another. As additional information becomes available, any potential liability related to these matters is assessed and the estimates are revised, if necessary. Litigation is subject to inherent uncertainties, and unfavorable rulings could occur and may include monetary damages. If an unfavorable ruling were to occur, there exists the possibility of a material adverse impact on the financial position and results of operations of the period in which any such ruling occurs, or in future periods.
As disclosed in Part I, Item 3, “Legal Proceedings,” an action has been brought against us by an individual seeking to represent a putative class of store managers for unpaid overtime wages, damages and attorneys’ fees under the Fair Labor Standards Act and class certification under Pennsylvania law for alleged violations of state wage payment laws. Plaintiff alleges that improper deductions were made from store managers’ pay.
Note 16 – Subsequent Events
On April 5, 2021, Michael T. Broderick joined Monro as President and Chief Executive Officer. See Note 11 for a discussion of restricted stock units granted subsequent to March 27, 2021.
In May 2021, Monro’s Board of Directors declared a cash dividend of $0.24 per share or share equivalent to be paid to shareholders of record as of June 7, 2021. The dividend will be paid on June 21, 2021.
See Note 3 for a discussion of an acquisition subsequent to March 27, 2021.
Item 9. Changes in and Disagreements with Accountants on Accounting and Financial Disclosure
None.
Item 9A. Controls and Procedures
Disclosure Controls and Procedures
Disclosure controls and procedures are designed with the objective of ensuring that information required to be disclosed in the Company’s reports filed under the Exchange Act, such as this report, is recorded, processed, summarized, and reported within the time periods specified in the SEC’s rules and forms. Disclosure controls and procedures are also designed with the objective of ensuring that such information is accumulated and communicated to the Company’s management, including the Company’s principal executive officer and principal financial officer, as appropriate, to allow timely decisions regarding required disclosure.
Conclusion Regarding the Effectiveness of Disclosure Controls and Procedures
As of the end of the period covered by this report, the Company carried out an evaluation, under the supervision and with the participation of the Company’s principal executive officer and principal financial officer, of the effectiveness of disclosure controls and procedures as defined in Rules 13a-15(e) and 15d-15(e) of the Exchange Act. Based on such evaluation, the Company’s principal executive officer and principal financial officer have concluded that as of March 27, 2021, the end of the period covered by this report, the Company’s disclosure controls and procedures were effective.
Internal Control Over Financial Reporting
Management is responsible for establishing and maintaining adequate internal control over financial reporting. Monro’s internal control over financial reporting is a process designed to provide reasonable assurance regarding the reliability of financial reporting and the preparation of financial statements for external reporting purposes in accordance with accounting principles generally accepted in the United States of America. Management conducted an evaluation of the effectiveness of internal control over financial reporting based on the framework in Internal Control – Integrated Framework (2013) issued by the Committee of Sponsoring Organizations of the Treadway Commission. Based on this evaluation, management concluded that Monro’s internal control over financial reporting was effective as of March 27, 2021, the end of our fiscal year. The effectiveness of Monro’s internal control over financial reporting as of March 27, 2021 has been audited by PricewaterhouseCoopers LLP, an independent registered public accounting firm, as stated in their report which appears herein. For the Report on Management’s Assessment of Internal Control Over Financial Reporting and the Report of Independent Registered Public Accounting Firm, see Part II, Item 8, “Financial Statements and Supplementary Data”.
Changes in Internal Control Over Financial Reporting
The Company also carried out an evaluation of the internal control over financial reporting to determine whether any changes occurred during the fiscal quarter ended March 27, 2021. Based on such evaluation, there have been no changes in the Company’s internal control over financial reporting that occurred during the Company’s most recently completed fiscal quarter ended March 27, 2021, that materially affected, or are reasonably likely to materially affect, the Company’s internal control over financial reporting.
Item 9B. Other Information
In March 2021, the Company changed benefit plan administrators for the Monro, Inc. 401(k) Plan, and from March 25 to April 14, 2021, plan participants were temporarily unable to move money between funds, change the funds in which the participant invests, or request withdrawals or distributions. Beginning February 25, 2021, the Company’s officers and directors were also prohibited from transacting in the Company’s common stock pursuant to our Insider Trading Policy.
On January 22, 2021, Donna G. Maxwell resigned from her position as Senior Vice President – Chief Human Resource Officer.
PART III
Certain information required by Part III is incorporated by reference from Monro’s Definitive Proxy Statement for its 2021 Annual Meeting of Shareholders to be held on August 17, 2021 (“Proxy Statement”).
Item 10. Directors, Executive Officers and Corporate Governance
The following sections of the Proxy Statement are incorporated herein by reference:
Proposal No. 1 – Election of Directors
Corporate Governance Practices and Policies
Our Executive Officers
Delinquent Section 16(a) Reports
Monro’s directors and executive officers are subject to the provisions of Monro’s Code of Ethics for All Board Members, Executive Officers and Management Teammates (the “Code”), which is available in the Investor Information section of Monro’s website, https://corporate.monro.com/investors. Changes to the Code and any waivers are also posted on Monro’s website in the Investor Information section.
Item 11. Executive Compensation
The following sections of the Proxy Statement are incorporated herein by reference:
Proposal No. 2 – Advisory Vote to Approve Executive Compensation
Executive Compensation
Item 12. Security Ownership of Certain Beneficial Owners and Management and Related Stockholder Matters
The following sections of the Proxy Statement are incorporated herein by reference:
Security Ownership of Certified Beneficial Owners and Management
Information concerning Monro’s shares authorized for issuance under its equity-based compensation plans at March 27, 2021 is incorporated herein by reference to the section captioned “Executive Compensation – Equity Compensation Plan Information” in the Proxy Statement.
Item 13. Certain Relationships and Related Transactions, and Director Independence
The following sub-sections within the Corporate Governance Practices and Policies section of the Proxy Statement are incorporated herein by reference:
Board and Committee Independence
Certain Relationships and Related Party Transactions
Item 14. Principal Accountant Fees and Services
The following sections of the Proxy Statement are incorporated herein by reference:
Proposal No. 3 – Ratification of Appointment of Independent Registered Public Accounting Firm
PART IV
Item 15. Exhibits and Financial Statement Schedules
The following information required under this item is filed as part of this report:
(a)Financial Statements
oConsolidated Balance Sheets as of March 27, 2021 and March 28, 2020
oConsolidated Statements of Income and Comprehensive Income for the Years Ended March 27, 2021, March 28, 2020 and March 30, 2019
oConsolidated Statements of Changes in Shareholders’ Equity for the Years Ended March 27, 2021, March 28, 2020 and March 30, 2019
oConsolidated Statements of Cash Flows for the Years Ended March 27, 2021, March 28, 2020 and March 30, 2019
oNotes to Consolidated Financial Statements
oReport of Independent Registered Public Accounting Firm
Financial Statement Schedules
None.
Other schedules have not been included either because they are not applicable or because the information is included elsewhere in this Report.
(b)Exhibits
|
|
|
|
|
|
|
|
|
Exhibit No. |
| Document |
3.01 |
| Restated Certificate of Incorporation of the Company, dated July 23, 1991, with Certificate of Amendment, dated November 1, 1991. (Filed in paper form as SEC File No: 0-19357, 1992 Form 10-K, Exhibit No. 3.01) |
3.01a |
| |
3.01b |
| |
3.01c |
| |
3.01d |
| |
3.01e |
| |
3.02 |
| |
4.01 |
| Description of Registrant’s Securities (2019 Form 10-K, Exhibit No. 4.01) |
10.01 |
| 2007 Stock Incentive Plan, effective as of June 29, 2007. (May 2008 Form S-8, Exhibit No. 4)* |
10.01a |
| |
10.01b |
| |
10.01c |
| |
10.01d |
| |
10.01e |
| Amendment No. 5 to the 2007 Stock Incentive Plan, dated June 28, 2013. (2013 Proxy, Exhibit A)* |
10.01f |
| |
10.02 |
| |
10.03 |
| |
10.04 |
| |
10.04a |
| |
10.04b |
| |
10.04c |
| |
10.05 |
| |
10.05a |
| |
10.19 |
| |
10.20 |
| |
10.21 |
| |
10.22 |
| Amended Credit Agreement, dated as of April 25, 2019 (April 2019 Form 8-K, Exhibit No. 10.22) |
10.22a |
| |
10.60 |
| |
10.61 |
| |
10.67 |
| |
10.68 |
|
Exhibit No. |
| Document |
10.69 |
| |
10.70 |
| |
10.71 |
| Employment Agreement by and between the Company and Michael T. Broderick, dated March 12, 2021.* |
10.73† |
| |
10.77 |
| |
21.01 |
| |
23.01 |
| |
24.01 |
| |
31.1 |
| Certification of Michael T. Broderick, President and Chief Executive Officer. |
31.2 |
| |
32.1 |
| Certification Pursuant to 18 U.S.C. Section 1350 (Section 906 of the Sarbanes-Oxley Act of 2002). |
101.INS |
| XBRL Instance Document |
101.LAB |
| XBRL Taxonomy Extension Label Linkbase |
101.PRE |
| XBRL Taxonomy Extension Presentation Linkbase |
101.SCH |
| XBRL Taxonomy Extension Schema Linkbase |
101.DEF |
| XBRL Taxonomy Extension Definition Linkbase |
101.CAL |
| XBRL Taxonomy Extension Calculation Linkbase |
104 |
| Cover Page Interactive Data File (formatted as inline XBRL and contained in Exhibit 101) |
|
|
* | Management contract or compensatory plan or arrangement. |
|
|
† | Certain portions of this exhibit have been omitted (indicated by asterisks) pursuant to Item 601(b) of Regulation S-K of the Securities Act of 1933, as amended, because such omitted information is (i) not material and (ii) would be competitively harmful if publicly disclosed. |
Item 16. Form 10-K Summary
None.
SIGNATURES
Pursuant to the requirements of Section 13 or 15(d) of the Securities Exchange Act of 1934, the registrant has duly caused this report to be signed on its behalf by the undersigned, thereunto duly authorized.
|
|
|
|
|
| MONRO, INC. |
|
|
|
|
|
|
|
|
|
| By: | /s/ Michael T. Broderick |
|
|
| Michael T. Broderick |
|
|
| Chief Executive Officer and President |
|
|
|
|
|
Date: May 26, 2021
Pursuant to the requirements of the Securities Exchange Act of 1934, this report has been signed below by the following persons on behalf of the registrant and in the capacities and on the date indicated.
|
|
|
|
|
Signature |
| Title |
| Date |
|
|
|
|
|
/s/ Michael T. Broderick |
| President and Chief Executive Officer |
| May 26, 2021 |
Michael T. Broderick |
| (Principal Executive Officer) |
|
|
|
|
|
|
|
/s/ Brian J. D’Ambrosia |
| Executive Vice President – Finance, |
| May 26, 2021 |
Brian J. D’Ambrosia |
| Chief Financial Officer and Treasurer |
|
|
|
| (Principal Financial Officer and |
|
|
|
| Principal Accounting Officer) |
|
|
|
|
|
|
|
/s/ Robert E. Mellor* |
| Chairman of the Board, Director |
| May 26, 2021 |
Robert E. Mellor |
|
|
|
|
|
|
|
|
|
/s/ John L. Auerbach* |
| Director |
| May 26, 2021 |
John L. Auerbach |
|
|
|
|
|
|
|
|
|
/s/ Frederick M. Danziger* |
| Director |
| May 26, 2021 |
Frederick M. Danziger |
|
|
|
|
|
|
|
|
|
/s/ Donald Glickman* |
| Director |
| May 26, 2021 |
Donald Glickman |
|
|
|
|
|
|
|
|
|
/s/ Lindsay N. Hyde* |
| Director |
| May 26, 2021 |
Lindsay N. Hyde |
|
|
|
|
|
|
|
|
|
/s/ Leah C. Johnson* |
| Director |
| May 26, 2021 |
Leah C. Johnson |
|
|
|
|
|
|
|
|
|
/s/ Stephen C. McCluski* |
| Director |
| May 26, 2021 |
Stephen C. McCluski |
|
|
|
|
|
|
|
|
|
/s/ Peter J. Solomon* |
| Director |
| May 26, 2021 |
Peter J. Solomon |
|
|
|
|
|
|
|
|
|
|
|
|
|
|
|
| * By: /s/ Michael T. Broderick |
|
|
|
| Michael T. Broderick, as Attorney-in-Fact |
|
|
|
|
|
|
| |
| Monro, Inc. |
Similar companies
See also Driven Brands Holdings Inc. - Annual report 2022 (10-K 2022-12-31) Annual report 2023 (10-Q 2023-09-30)See also Mister Car Wash, Inc. - Annual report 2022 (10-K 2022-12-31) Annual report 2023 (10-Q 2023-09-30)
See also EVgo Inc. - Annual report 2022 (10-K 2022-12-31) Annual report 2023 (10-Q 2023-09-30)
See also Maison Luxe, Inc. - Annual report 2011 (10-K 2011-03-31) Annual report 2011 (10-Q 2011-12-31)
See also Pony Group Inc. - Annual report 2022 (10-K 2022-12-31) Annual report 2023 (10-Q 2023-09-30)