|
|
|
|
|
|
|
| | |
| | |
| | |
| | |
| | |
| | |
| | |
|
| | |
| | | |
| | |
| | | | |
| | | | |
| | | | |
| | | | |
| | | | |
| | | | |
| | | | |
| | | | |
| | | | |
| 3,895 | | | $ | 3,582 | | | $ | 3,420 | | | 8.7 | % | 4.7 | % |
The following chart presents our Capital Access Platforms, Financial Technology and Market Services segments as a percentage of our total revenues, less transaction-based expenses. 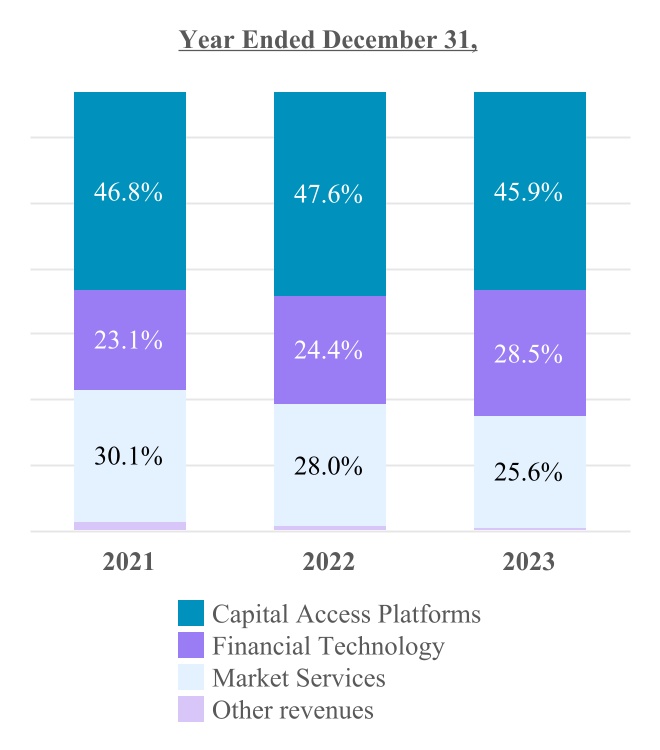
CAPITAL ACCESS PLATFORMS
The following table presents revenues from our Capital Access Platforms segment:
| | | | | | | | | | | | | | | | | | | | | | | | | | |
| |
| | |
| |
| | | |
| | | |
| | | |
| | | |
| | | |
|
| |
| |
| |
| |
| |
| |
| |
| |
| |
| |
| |
| | Year Ended December 31, |
| | 2023 | | 2022 | | 2021 |
| IPOs | | | | | | |
The Nasdaq Stock Market - operating companies | | 103 | | | 87 | | | 319 |
The Nasdaq Stock Market - SPACs | | 27 | | | 74 | | | 433 |
| Exchanges that comprise Nasdaq Nordic and Nasdaq Baltic | | 7 | | | 38 | | | 174 |
| Total new listings | | | | | | |
| The Nasdaq Stock Market | | 330 | | | 366 | | | 1,000 | |
| Exchanges that comprise Nasdaq Nordic and Nasdaq Baltic | | 23 | | | 63 | | | 207 |
| Number of listed companies | | | | | | |
| The Nasdaq Stock Market | | 4,044 | | | 4,230 | | | 4,178 | |
| Exchanges that comprise Nasdaq Nordic and Nasdaq Baltic | | 1,218 | | | 1,251 | | | 1,235 | |
| | As of December 31, |
| | 2023 | | 2022 | | 2021 |
ARR (in millions) | | $ | 682 | | | $ | 664 | | | $ | 627 | |
In the tables above:
•Number of total listed companies on The Nasdaq Stock Market for the years ended December 31, 2023, 2022 and 2021 included 600, 528 and 441 ETPs, respectively.
•IPOs, new listings (which includes IPOs) and total listed companies for exchanges that comprise Nasdaq Nordic and Nasdaq Baltic represent companies listed on the Nasdaq Nordic and Nasdaq Baltic exchanges and companies on the alternative markets of Nasdaq First North.
Data & Listing Services revenues increased in 2023 compared with 2022 primarily due to an increase in proprietary data revenues driven largely by higher international demand and annual listing fee growth, partially offset by lower initial listings fees.
Index Revenues
The following table presents key drivers from our Index business:
| | | | | | | | | | | | | | | | | | | | |
| | As of or
Three Months Ended December 31, |
| | 2023 | | 2022 | | 2021 |
| Number of licensed ETPs | | 388 | | | 379 | | | 362 |
TTM change in period end ETP AUM tracking Nasdaq indices (in billions) | | |
| Beginning balance | | $ | 315 | | | $ | 424 | | | $ | 359 | |
| Net appreciation (depreciation) | | 128 | | | (142) | | | 83 | |
| Net impact of ETP sponsor switches | | (1) | | | (1) | | | (92) | |
| Net inflows | | 31 | | | 34 | | | 74 | |
| Ending balance | | $ | 473 | | | $ | 315 | | | $ | 424 | |
Quarterly average ETP AUM tracking Nasdaq indices (in billions) | | $ | 436 | | | $ | 326 | | | $ | 400 | |
| |
| ARR | | $ | 72 | | | $ | 68 | | | $ | 67 | |
In the table above, TTM represents trailing twelve months.
Index revenues increased in 2023 compared with 2022 primarily due to higher AUM in exchange traded products linked to Nasdaq indices.
Workflow & Insights Revenues
The following table presents key drivers from our Workflow & Insights business:
| | | | | | | | | | | | | | | | | |
| As of or Three Months Ended December 31 |
| 2023 | | 2022 | | 2021 |
| (in millions) |
| ARR | $ | 481 | | | $ | 458 | | | $ | 417 | |
| Quarterly annualized SaaS revenues | 411 | | | 388 | | | 356 | |
Workflow & Insights revenues increased in 2023 compared with 2022 due to an increase in both analytics and corporate solutions revenues. The increase in analytics revenues was primarily due to the growth in our eVestment and Solovis product offerings. The increase in our corporate solutions revenues was primarily due to continued demand for our ESG solutions.
FINANCIAL TECHNOLOGY
The following table presents revenues from our Financial Technology segment:
| | | | | | | | | | | | | | | | | | | | | | | | | | |
| |
| | |
| |
| | | |
| | | |
| | | |
| | Year Ended December 31, | | Percentage Change |
| | 2023 | | 2022 | | 2021 | | 2023 vs. 2022 | 2022 vs. 2021 |
| | (in millions) | | | |
Financial Crime Management Technology | $ | 223 | | | $ | 176 | | | $ | 104 | | | 26.7 | % | 69.2 | % |
Regulatory Technology | 212 | | | 130 | | | 127 | | | 63.1 | % | 2.4 | % |
Capital Markets Technology | 664 | | | 558 | | | 541 | | | 19.0 | % | 3.1 | % |
| Total Financial Technology | $ | 1,099 | | | $ | 864 | | | $ | 772 | | | 27.2 | % | 11.9 | % |
|
| | | |
| | | |
| | | |
|
|
|
|
|
|
|
Regulatory Technology revenues increased in 2023 compared with 2022 primarily due to the inclusion of revenues from our acquisition of Adenza and strong performance from our surveillance offerings in new sales to existing clients and new customer acquisitions. The strong performance of our surveillance offerings was also the key driver of the increase in 2022 compared with 2021.
Capital Markets Technology Revenues
The following table presents key drivers for Capital Markets Technology business:
| | | | | | | | | | | | | | | | | | | | |
| | As of or
Three Months Ended December 30, |
| | 2023 | | 2022 | | 2021 |
| | (in millions) |
| ARR | | $ | 799 | | | $ | 499 | | | $ | 475 | |
| Quarterly annualized SaaS revenues | | 108 | | | 39 | | | 31 | |
| |
| |
|
| |
|
| |
Capital Markets Technology revenues increased in 2023 compared with 2022 and 2022 compared with 2021. The increase in 2023 was primarily due to the inclusion of revenues from our acquisition of Adenza, higher trade management services revenues mainly driven by demand for colocation and connectivity services and higher market technology revenues due to higher support revenues and higher professional services fees. The increase in 2022 was primarily due to higher trade management services revenues associated with increased demand for connectivity services, partially offset by lower market technology revenues. The decrease in market technology revenues in 2022 was due to the successful completion of long-term contracts in 2021 and the unfavorable impact of changes in foreign exchange rates of $10 million, partially offset by growth in SaaS-based revenues.
MARKET SERVICES
The following table presents revenues from our Market Services segment:
| | | | | | | | | | | | | | | | | | | | | | | | | | |
| |
| | |
| |
| | | |
|
| | | |
| | | |
| | | |
| | | |
| | Year Ended December 31, | | Percentage Change |
| | 2023 | | 2022 | | 2021 | | 2023 vs. 2022 | 2022 vs. 2021 |
| | (in millions) | | | |
Market Services | $ | 3,156 | | | $ | 3,632 | | | $ | 3,471 | | | (13.1) | % | 4.6 | % |
| Transaction-based expenses: | | | | | |
| Transaction rebates | (1,838) | | | (2,092) | | | (2,168) | | | (12.1) | % | (3.5) | % |
Brokerage, clearance and exchange fees | (331) | | | (552) | | | (298) | | | (40.0) | % | 85.2 | % |
Total Market Services, net | $ | 987 | | | $ | 988 | | | $ | 1,005 | | | (0.1) | % | (1.7) | % |
Our Market Services segment includes equity derivatives trading, cash equity trading, Nordic fixed income trading & clearing, U.S. Tape plans and other revenues. The following tables present net revenues by product from our Market Services segment:
| | | | | | | | | | | | | | | | | | | | | | | | | | |
| |
| | |
| |
| | | |
| | | |
| | | |
| | | |
| | | |
| | | |
| | Year Ended December 31, | | Percentage Change |
| | 2023 | | 2022 | | 2021 | | 2023 vs. 2022 | 2022 vs. 2021 |
| | (in millions) | | | |
| U.S. Equity Derivative Trading | $ | 374 | | | $ | 371 | | | $ | 343 | | | 0.8 | % | 8.2 | % |
| Cash Equity Trading | 397 | | | 397 | | | 429 | | | — | % | (7.5) | % |
| U.S. Tape plans | 141 | | | 149 | | | 155 | | | (5.4) | % | (3.9) | % |
| Other | 75 | | | 71 | | | 78 | | | 5.6 | % | (9.0) | % |
Total Market Services, net | $ | 987 | | | $ | 988 | | | $ | 1,005 | | | (0.1) | % | (1.7) | % |
In the table above, Other includes Nordic fixed income trading & clearing, Nordic derivatives and Canadian cash equities trading.
U.S. Equity Derivative Trading
The following tables present total revenues, transaction-based expenses, and total revenues less transaction-based expenses as well as key drivers from our U.S. Equity Derivative Trading business:
| | | | | | | | | | | | | | | | | | | | | | | | | | |
| |
| | |
| |
| | | |
| | | |
|
| | | |
| | | |
| | | |
| | | |
| | | |
| | Year Ended December 31, | | Percentage Change |
| | 2023 | | 2022 | | 2021 | | 2023 vs. 2022 | 2022 vs. 2021 |
| | (in millions) | | | |
| U.S. Equity Derivative Trading Revenues | $ | 1,257 | | | $ | 1,252 | | | $ | 1,367 | | | 0.4 | % | (8.4) | % |
Section 31 fees | 55 | | | 89 | | | 32 | | | (38.2) | % | 178.1 | % |
| Transaction-based expenses: | | | | | |
| Transaction rebates | (879) | | | (878) | | | (1,018) | | | 0.1 | % | (13.8) | % |
Section 31 fees | (55) | | | (89) | | | (32) | | | (38.2) | % | 178.1 | % |
| Brokerage and clearance fees | (4) | | | (3) | | | (6) | | | 33.3 | % | (50.0) | % |
| U.S. Equity derivative trading revenues, net | $ | 374 | | | $ | 371 | | | $ | 343 | | | 0.8 | % | 8.2 | % |
Section 31 fees are recorded as U.S. equity derivative and cash equity trading revenues with a corresponding amount recorded in transaction-based expenses. We are assessed these fees from the SEC and pass them through to our customers in the form of incremental fees. Pass-through fees can increase or decrease due to rate changes by the SEC, our percentage of the overall industry volumes processed on our systems, and differences in actual dollar value traded. Section 31 fees decreased in 2023 compared with 2022 primarily due to lower average SEC fee rates. Since the amount recorded in revenues is equal to the amount recorded as Section 31 fees, there is no impact on our net revenues.
| | | | | | | | | | | | | | | | | |
|
|
|
|
|
|
|
|
|
|
|
|
| Year Ended December 31, |
| | 2023 | | 2022 | | 2021 |
| U.S. equity options | | | | | |
| Total industry average daily volume (in millions) | 40.4 | | | 38.2 | | | 37.2 | |
| Nasdaq PHLX matched market share | 11.3 | % | | 11.6 | % | | 12.4 | % |
| The Nasdaq Options Market matched market share | 6.1 | % | | 8.0 | % | | 8.1 | % |
| Nasdaq BX Options matched market share | 3.3 | % | | 2.8 | % | | 1.4 | % |
| Nasdaq ISE Options matched market share | 5.9 | % | | 5.7 | % | | 6.6 | % |
| Nasdaq GEMX Options matched market share | 2.4 | % | | 2.3 | % | | 4.3 | % |
| Nasdaq MRX Options matched market share | 2.0 | % | | 1.6 | % | | 1.6 | % |
| Total matched market share executed on Nasdaq’s exchanges | 31.0 | % | | 32.0 | % | | 34.4 | % |
U.S. equity derivative trading revenues, transaction rebates, in which we credit a portion of the execution charge to the market participant, and U.S. equity derivative trading revenues less transaction-based expenses remained relatively flat in 2023 compared with 2022 primarily due to higher industry trading volumes, partially offset by lower overall matched market share executed on Nasdaq’s exchanges and lower gross capture rate.
Cash Equity Trading Revenues
The following tables present total revenues, transaction-based expenses, and total revenues less transaction-based expenses as well as key drivers and other metrics from our Cash Equity Trading business:
| | | | | | | | | | | | | | | | | | | | | | | | | | | | | |
| | |
| | | |
| | |
| | | | |
| | | | |
| | | | |
| | | | |
| | | | |
| | | | |
| | | | |
| | | | |
| Year Ended December 31, | | Percentage Change |
| 2023 | | 2022 | | 2021 | | 2023 vs. 2022 | | 2022 vs. 2021 |
| (in millions) | | | | |
| Cash Equity Trading Revenues | $ | 1,355 | | | $ | 1,605 | | | 1,578 | | | (15.6) | % | | 1.7 | % |
Section 31 fees | 253 | | | 436 | | | 229 | | | (42.0) | % | | 90.4 | % |
| Transaction-based expenses: | | | | | | | | | |
| Transaction rebates | (939) | | | (1,184) | | | (1,118) | | | (20.7) | % | | 5.9 | % |
Section 31 fees | (253) | | | (436) | | | (229) | | | (42.0) | % | | 90.4 | % |
| Brokerage and clearance fees | (19) | | | (24) | | | (31) | | | (20.8) | % | | (22.6) | % |
| Cash equity trading revenues, net | $ | 397 | | | $ | 397 | | | $ | 429 | | | — | % | | (7.5) | % |
See the discussion in "U.S. Equity Derivative Trading" for an explanation of Section 31 fees for 2023 as compared to 2022. Since the amount recorded in revenues is equal to the amount recorded as Section 31 fees, there is no impact on our net revenues.
| | | | | | | | | | | | | | | | | |
|
|
|
|
|
|
|
|
|
|
|
|
|
|
|
|
| Year Ended December 31, |
| | 2023 | | 2022 | | 2021 |
| Total U.S.-listed securities | | | | | |
| Total industry average daily share volume (in billions) | 11.0 | | | 11.9 | | | 11.4 | |
| Matched share volume (in billions) | 455.6 | | | 522.8 | | | 491.9 | |
| The Nasdaq Stock Market matched market share | 15.8 | % | | 16.2 | % | | 15.8 | % |
| Nasdaq BX matched market share | 0.4 | % | | 0.5 | % | | 0.6 | % |
| Nasdaq PSX matched market share | 0.3 | % | | 0.8 | % | | 0.7 | % |
| Total matched market share executed on Nasdaq’s exchanges | 16.5 | % | | 17.5 | % | | 17.1 | % |
| Market share reported to the FINRA/Nasdaq Trade Reporting Facility | 36.7 | % | | 35.2 | % | | 34.9 | % |
| Total market share | 53.2 | % | | 52.7 | % | | 52.0 | % |
| Nasdaq Nordic and Nasdaq Baltic securities | | |
| Average daily number of equity trades executed on Nasdaq’s exchanges | 666,411 | | 908,813 | | 1,036,523 | |
| Total average daily value of shares traded (in billions) | $ | 4.5 | | | $ | 5.4 | | | $ | 6.4 | |
| Total market share executed on Nasdaq’s exchanges | 71.0 | % | | 71.5 | % | | 76.9 | % |
In the tables above, total market share includes transactions executed on The Nasdaq Stock Market’s, Nasdaq BX’s and Nasdaq PSX’s systems plus trades reported through the FINRA/Nasdaq Trade Reporting Facility.
Cash equity trading revenues decreased in 2023 compared with 2022 primarily due to lower industry trading volumes, lower overall U.S. matched market share executed on Nasdaq’s exchanges, as well as lower gross capture rates.
Cash equity trading revenues less transaction-based expenses remained flat in 2023 compared with 2022 primarily due to lower industry trading volumes and lower overall U.S. matched market share executed on Nasdaq’s exchanges, partially offset by higher U.S. capture rate.
Transaction rebates decreased in 2023 compared with 2022. For The Nasdaq Stock Market and Nasdaq PSX, we credit a portion of the per share execution charge to the market participant that provides the liquidity, and for Nasdaq BX, we credit a portion of the per share execution charge to the market participant that takes the liquidity. The decrease was primarily due to lower rebate capture rate, lower U.S.
industry volumes, and lower U.S. matched market share executed on Nasdaq's exchanges.
U.S. Tape Plans
The following table presents revenues from our U.S. Tape plans business:
| | | | | | | | | | | | | | | | | | | | | | | | | | |
| |
| | |
| |
| | | |
| | | |
| | Year Ended December 31, | | Percentage Change |
| | 2023 | | 2022 | | 2021 | | 2023 vs. 2022 | 2022 vs. 2021 |
| | (in millions) | | | |
| U.S. Tape plans | $ | 141 | | | $ | 149 | | | $ | 155 | | | (5.4) | % | (3.9) | % |
U.S. Tape plans revenues decreased in 2023 compared with 2022 primarily due to lower market share and usage.
Other
Other includes Nordic fixed income trading and clearing, Nordic derivatives and Canadian cash equities trading. The following tables present revenue and a key driver from our Other business:
| | | | | | | | | | | | | | | | | | | | | | | | | | |
| |
| | |
| |
| | | |
| | | |
| | Year Ended December 31, | | Percentage Change |
| | 2023 | | 2022 | | 2021 | | 2023 vs. 2022 | 2022 vs. 2021 |
| | (in millions) | | | |
| Other | $ | 75 | | | $ | 71 | | | $ | 78 | | | 5.6 | % | (9.0) | % |
In the table above, other includes transaction rebates of $20 million, $30 million, and $32 million in 2023, 2022, and 2021 respectively.
| | | | | | | | | | | | | | | | | |
|
|
|
|
|
| Year Ended December 31, |
| | 2023 | | 2022 | | 2021 |
| Nasdaq Nordic and Nasdaq Baltic options and futures | | |
| Total average daily volume of options and futures contracts | 301,320 | | 296,626 | | 287,182 | |
In the tables above, Nasdaq Nordic and Nasdaq Baltic total average daily volume of options and futures contracts include Finnish option contracts traded on Eurex for which Nasdaq and Eurex have a revenue sharing arrangement.
Other revenues increased in 2023 compared with 2022 primarily due to increased revenues in our Nordic derivatives trading, higher collateral management services revenues, partially offset by lower revenue from Canadian cash equities trading.
OTHER REVENUES
For the years ended December 31, 2023, 2022 and 2021, other revenues include revenues related to our European power trading and clearing business, following our announcement in June 2023 to sell this business to the European Energy Exchange, subject to regulatory approval. Prior to June 2023, these revenues were included in our Market Services and Capital Access Platforms segments. Also for the years ended December 31, 2023, 2022 and 2021, other revenues include a transitional services agreement associated with a divested business. For the year ended December 31, 2022 and 2021, other revenues also include
revenues related to our Nordic broker services business for which we completed the wind-down in June 2022. Prior to June 2022, these revenues were included in our Market Services segment. Additionally, for the year ended December 31, 2021, other revenues include revenues associated with the NPM business which we contributed in July 2021 to a standalone, independent company, of which we own the largest minority interest, together with a consortium of third-party financial institutions. Prior to July 2021, these revenues were included in our Capital Access Platforms segment.
EXPENSES
Operating Expenses
The following table presents our operating expenses:
| | | | | | | | | | | | | | | | | | | | | | | | | | | | | |
|
| |
| | |
| | | | |
| | | | |
| | | | |
| | | | |
| | | | |
| | | | |
| | | | |
| | | | |
| | | | |
| | | | |
| | | | |
| | | | |
| | Year Ended December 31, | | Percentage Change |
| | 2023 | | 2022 | | 2021 | | 2023 vs. 2022 | | 2022 vs. 2021 |
| | (in millions) | | | | |
| Compensation and benefits | $ | 1,082 | | | $ | 1,003 | | | $ | 938 | | | 7.9% | | 6.9% |
| Professional and contract services | 128 | | | 140 | | | 144 | | | (8.6)% | | (2.8)% |
| Computer operations and data communications | 233 | | | 207 | | | 186 | | | 12.6% | | 11.3% |
| Occupancy | 129 | | | 104 | | | 109 | | | 24.0% | | (4.6)% |
| General, administrative and other | 113 | | | 125 | | | 85 | | | (9.6)% | | 47.1% |
| Marketing and advertising | 47 | | | 51 | | | 57 | | | (7.8)% | | (10.5)% |
| Depreciation and amortization | 323 | | | 258 | | | 278 | | | 25.2% | | (7.2)% |
| Regulatory | 34 | | | 33 | | | 64 | | | 3.0% | | (48.4)% |
| Merger and strategic initiatives | 148 | | | 82 | | | 87 | | | 80.5% | | (5.7)% |
| Restructuring charges | 80 | | | 15 | | | 31 | | | 433.3% | | (51.6)% |
| Total operating expenses | $ | 2,317 | | | $ | 2,018 | | | $ | 1,979 | | | 14.8% | | 2.0% |
The increase in compensation and benefits expense for the year ended December 31, 2023 compared with the same period in 2022 was primarily driven by increased headcount. The increase in the year ended December 31, 2023 was partially offset by a favorable impact from foreign exchange rates of $12 million.
Headcount, including employees of non-wholly owned consolidated subsidiaries, increased to 8,525 employees as of December 31, 2023 from 6,377 as of December 31, 2022, primarily due to our acquisition of Adenza.
Professional and contract services expense decreased in 2023 compared with 2022 primarily due to reduced consulting costs and reduced legal fees.
Computer operations and data communications expense increased in 2023 compared with 2022 primarily due to higher costs related to our cloud initiatives.
Occupancy expense increased in 2023 compared with 2022 primarily due to a review of our real estate and facility capacity requirements due to our new and evolving work models initiated in the first quarter of 2023. As a result of this ongoing review, for the year ended December 31, 2023, we recorded $18 million in impairment charges and exit related costs following the abandonment of leased office space.
General, administrative and other expense decreased in 2023 compared with the same period in 2022 primarily due to an insurance recovery related to a legal matter in 2023 and a loss on extinguishment of debt recorded in 2022.
Marketing and advertising expense decreased in 2023 compared with 2022 primarily due to lower client incentives resulting from lower IPO activity.
Depreciation and amortization expense increased in 2023 compared with 2022 primarily due to an increase in amortization due to the intangible assets acquired as part of the Adenza acquisition.
Regulatory expense remained relatively flat in 2023 compared with 2022.
We have pursued various strategic initiatives and completed acquisitions and divestitures in recent years, which have resulted in expenses which would not have otherwise been incurred. These expenses generally include integration costs, as well as legal, due diligence and other third-party transaction costs and vary based on the size and frequency of the activities described above. The increase for the year ended December 31, 2023 compared with 2022 primarily reflects higher expenses related to the Adenza acquisition.
Restructuring charges increased in 2023 compared with 2022 as a result of charges from our 2022 divisional alignment program as well as the launch of our 2023 Adenza restructuring program. See Note 20, “Restructuring Charges,” to the consolidated financial statements for further discussion. By 2025, we expect to achieve benefits of the 2022 divisional alignment program through combined annual run-rate operating efficiencies and revenue synergies of approximately $30 million annually. We expect to achieve $80 million of net expense synergies two years following the closing of the Adenza acquisition.
Non-operating Income and Expenses
The following table presents our non-operating income and expenses:
| | | | | | | | | | | | | | | | | | | | | | | | | | |
| |
| | |
| |
| | | |
| | | |
| | | |
| | | |
| | | |
| | | |
| | | |
| | | |
| | | |
| | Year Ended December 31, | | Percentage Change |
| | 2023 | | 2022 | | 2021 | | 2023 vs. 2022 | 2022 vs. 2021 |
| | (in millions) | | | |
| Interest income | $ | 115 | | | $ | 7 | | | $ | 1 | | | 1,542.9 | % | 600.0 | % |
| Interest expense | (284) | | | (129) | | | (125) | | | 120.2 | % | 3.2 | % |
| Net interest expense | (169) | | | (122) | | | (124) | | | 38.5 | % | (1.6) | % |
| | | |
| Net gain on divestiture of business | — | | | — | | | 84 | | | — | % | (100.0) | % |
| Other income (loss) | (1) | | | 2 | | | 81 | | | (150.0) | % | (97.5) | % |
| Net income (loss) from unconsolidated investees | (7) | | | 31 | | | 52 | | | (122.6) | % | (40.4) | % |
Total non-operating income (expenses) | $ | (177) | | | $ | (89) | | | $ | 93 | | | 98.9 | % | (195.7) | % |
The following table presents our interest expense:
| | | | | | | | | | | | | | | | | | | | | | | | | | |
| |
| | |
| |
| | | |
| | | |
| | | |
| | | |
| | | |
| | Year Ended December 31, | | Percentage Change |
| | 2023 | | 2022 | | 2021 | | 2023 vs. 2022 | 2022 vs. 2021 |
| | (in millions) | | | |
| Interest expense on debt | $ | 272 | | | $ | 120 | | | $ | 115 | | | 126.7 | % | 4.3 | % |
| Accretion of debt issuance costs and debt discount | 9 | | | 7 | | | 7 | | | 28.6 | % | — | % |
| Other fees | 3 | | | 2 | | | 3 | | | 50.0 | % | (33.3) | % |
| Interest expense | $ | 284 | | | $ | 129 | | | $ | 125 | | | 120.2 | % | 3.2 | % |
Interest income increased in 2023 compared with 2022 primarily due to a higher average cash balance during the period between the issuance of the senior unsecured notes in June 2023 and the closing of the Adenza acquisition, and an increase in interest rates.
Interest expense increased in 2023 compared with 2022 primarily due to debt issued in June 2023 to finance the Adenza acquisition as well as an increase in interest rates. See “Financing of the Adenza Acquisition,” of Note 9, “Debt Obligations,” to the consolidated financial statements for further discussion.
The net gain on divestiture of business in 2021 relates to the sale of our U.S. Fixed Income business, which was part of our FICC business within our Market Services segment. We recognized a pre-tax gain on the sale of $84 million, net of disposal costs.
Other income (loss) primarily represents realized and unrealized gains and losses from strategic investments related to our corporate venture program.
Net income (loss) from unconsolidated investees decreased in 2023 compared with 2022 primarily due to lower income recognized from our equity method investments in OCC and NPM. See “Equity Method Investments,” of Note 6, “Investments,” to the consolidated financial statements for further discussion.
Tax Matters
The following table presents our income tax provision and effective tax rate:
LIQUIDITY AND CAPITAL RESOURCES
Historically, we have funded our operating activities and met our commitments through cash generated by operations, augmented by the periodic issuance of debt. Currently, our cost and availability of funding remain healthy. We continue to prudently assess our capital deployment strategy through balancing acquisitions, internal investments, debt repayments, and shareholder return activity, including share repurchases and dividends.
We expect that our current cash and cash equivalents combined with cash flows provided by operating activities, supplemented with our borrowing capacity and access to additional financing, including our revolving credit facility and our commercial paper program, provides us additional flexibility to meet our ongoing obligations and the capital deployment strategic actions described above, while allowing us to invest in activities and product development that support the long-term growth of our operations.
Principal factors that could affect the availability of our internally-generated funds include:
• deterioration of our revenues in any of our business segments;
• changes in regulatory and working capital requirements; and
•an increase in our expenses.
Principal factors that could affect our ability to obtain cash from external sources include:
• operating covenants contained in our credit facilities that limit our total borrowing capacity;
• credit rating downgrades, which could limit our access to additional debt;
• a significant decrease in the market price of our common stock; and
• volatility or disruption in the public debt and equity markets.
The following table summarizes selected measures of our liquidity and capital resources:
| | | | | | | | | | | | | | |
| | | December 31, 2023 | | December 31, 2022 |
| | | (in millions) |
| Cash and cash equivalents | | $ | 453 | | | $ | 502 | |
|
|
| | | | | | | | | |
|
|
| | | | | | | | | |
| | | | | | | | | |
| | | | | | | | | |
| | | | | | | | | |
| | | | | | | | | |
| | | | | | | | | |
| | | | | | | | | |
|
|
| | | | | | | | | |
| | | | | | | | | |
| | | | | | | | | |
| | | | | | | | | |
| | | | | | | | | |
| | | | | | | | | |
|
|
|
|
|
|
|
|
| | | | | | | | | |
|
|
|
|
|
|
|
|
|
|
|
|
|
|
|
|
|
|
|
|
|
|
|
|
|
|
|
|
|
|
|
|
|
|
|
|
|
|
|
|
|
|
|
|
|
|
|
|
Pursuant to the requirements of the Securities Exchange Act of 1934, this report has been signed below by the following persons on behalf of the registrant and in the capacities indicated as of February 21, 2024.
| | | | | | | | |
| By: | /s/ Adena T. Friedman |
| Name: | Adena T. Friedman |
| Title: | Chief Executive Officer and Chair of the Board |
| | |
| By: | /s/ Sarah Youngwood |
| Name: | Sarah Youngwood |
| Title: | Executive Vice President and Chief Financial Officer |
| | |
| By: | /s/ Michelle Daly |
| Name: | Michelle Daly |
| Title: | Senior Vice President, Controller and Principal Accounting Officer |
| | |
| By: | * |
| Name: | Michael R. Splinter |
| Title: | Director |
| | |
| By: | * |
| Name: | Melissa M. Arnoldi |
| Title: | Director |
| | |
| By: | * |
| Name: | Charlene T. Begley |
| Title: | Director |
| | |
| By: | * |
| Name: | Steven D. Black |
| Title: | Director |
| | |
| By: | * |
| Name: | Essa Kazim |
| Title: | Director |
| | |
| | | | | | | | |
| By: | * |
| Name: | Thomas A. Kloet |
| Title: | Director |
| | |
| By: | * |
| Name: | Holden Spaht |
| Title: | Director |
| | |
| By: | * |
| Name: | Johan Torgeby |
| Title: | Director |
| | |
| By: | * |
| Name: | Toni Townes-Whitley |
| Title: | Director |
| | |
| By: | * |
| Name: | Jeffery W. Yabuki |
| Title: | Director |
| | |
| By: | * |
| Name: | Alfred W. Zollar |
| Title: | Director |
| | |
* Pursuant to Power of Attorney |
| By: | /s/ John A. Zecca |
| Name: | John A. Zecca |
| Title: | Attorney-in-Fact |
Nasdaq, Inc.
INDEX TO CONSOLIDATED FINANCIAL STATEMENTS
The following consolidated financial statements of Nasdaq, Inc. and its subsidiaries are presented herein on the page indicated:
Report of Independent Registered Public Accounting Firm
To the Shareholders and the Board of Directors of Nasdaq, Inc.
Opinion on the Financial Statements
We have audited the accompanying consolidated balance sheets of Nasdaq, Inc. (the Company) as of December 31, 2023 and 2022, the related consolidated statements of income, comprehensive income, changes in stockholders’ equity and cash flows for each of the three years in the period ended December 31, 2023, and the related notes (collectively referred to as the “consolidated financial statements”). In our opinion, the consolidated financial statements present fairly, in all material respects, the financial position of the Company at December 31, 2023 and 2022, and the results of its operations and its cash flows for each of the three years in the period ended December 31, 2023, in conformity with U.S. generally accepted accounting principles.
We also have audited, in accordance with the standards of the Public Company Accounting Oversight Board (United States) (PCAOB), the Company’s internal control over financial reporting as of December 31, 2023, based on criteria established in Internal Control-Integrated Framework issued by the Committee of Sponsoring Organizations of the Treadway Commission (2013 framework), and our report dated February 21, 2024 expressed an unqualified opinion thereon.
Basis for Opinion
These financial statements are the responsibility of the Company’s management. Our responsibility is to express an opinion on the Company’s financial statements based on our audits. We are a public accounting firm registered with the PCAOB and are required to be independent with respect to the Company in accordance with the U.S. federal securities laws and the applicable rules and regulations of the Securities and Exchange Commission and the PCAOB.
We conducted our audits in accordance with the standards of the PCAOB. Those standards require that we plan and perform the audit to obtain reasonable assurance about whether the financial statements are free of material misstatement, whether due to error or fraud. Our audits included performing procedures to assess the risks of material misstatement of the financial statements, whether due to error or fraud, and performing procedures that respond to those risks. Such procedures included examining, on a test basis, evidence regarding the amounts and disclosures in the financial statements. Our audits also included evaluating the accounting principles used and significant estimates made by management, as well as evaluating the overall presentation of the financial statements. We believe that our audits provide a reasonable basis for our opinion.
Critical Audit Matter
The critical audit matter communicated below is a matter arising from the current period audit of the financial statements that was communicated or required to be communicated to the audit committee and that: (1) relates to accounts or disclosures that are material to the financial statements and (2) involved our especially challenging, subjective or complex judgments. The communication of the critical audit matter does not alter in any way our opinion on the consolidated financial statements, taken as a whole, and we are not, by communicating the critical audit matter below, providing a separate opinion on the critical audit matter or on the accounts or disclosures to which it relates.
| | | | | |
| Accounting for the Acquisition of Adenza |
| Description of the Matter | As described in Note 4 to the consolidated financial statements, during 2023 the Company completed its acquisition of Adenza, which was accounted for as a business combination for total purchase consideration of $5,750 million in cash consideration (subject to customary post-closing adjustments) and the issuance of 85,608,414 shares of Nasdaq common stock at a price of $48.71 per share. The transaction resulted in the recognition of $5,933 million of goodwill and $5,050 million of intangible assets. Intangible assets consisted of customer relationships of $3,740 million, technology of $950 million and trade names of $360 million.
Auditing the Company’s accounting for its acquisition of Adenza was complex due to the significant estimation uncertainty in the Company’s determination of the fair value of identified intangible assets. The significant estimation uncertainty was primarily due to the sensitivity of the fair value of the customer relationships intangible asset to certain underlying assumptions. The Company used the income approach, specifically the excess earnings method, to measure the fair value of the customer relationships intangible asset, and the significant assumptions used in estimating its fair value included customer attrition rate, revenue growth, EBITDA margin, and the discount rate. These significant assumptions are forward looking and could be affected by future economic and market conditions.
|
| | | | | |
How We Addressed the Matter in Our Audit | We obtained an understanding, evaluated the design and tested the operating effectiveness of controls over the Company’s processes with respect to estimates that impact the accounting for the Adenza acquisition. For example, we tested controls over the estimation process supporting the recognition and measurement of the identified intangible assets, including the customer relationships intangible asset, which encompassed testing controls over management’s review of assumptions used in the valuation model.
To test the estimated fair value of the customer relationship intangible asset, we performed audit procedures that included, among others, evaluating the Company’s use of valuation methodologies, evaluating significant assumptions utilized by the Company, and evaluating the completeness and accuracy of the underlying data supporting those significant assumptions. We involved our valuation specialists to assist with our evaluation of the methodology used by the Company and significant assumptions included in the fair value estimate, including testing the customer attrition rate, revenue growth, EBITDA margin that form the basis of the forecasted results, and the discount rate. Additionally, we compared the significant assumptions to current industry, market and economic trends, to the historical results of the acquired business, and to the Company’s budgets and forecasts, in addition to performing sensitivity analyses over these assumptions. We also evaluated the adequacy of the Company’s disclosures included in Note 4 in relation to these acquisition matters.
|
/s/
We have served as the Company’s auditor since 1986.
February 21, 2024
Nasdaq, Inc.
Consolidated Balance Sheets
(in millions, except share and par value amounts) | | | | | | | | | | | |
| December 31, 2023 | | December 31, 2022 |
|
|
|
| 2022 | | 2021 |
| | | | |
)) ) | | () | | | () | |
| | | | |
| | | | | | |
| | | | |
))
|
)
|
|
|
)
|
)))
|
) )
|
)
|
)
| | $ | | | | | | | $ | | | | | | | $ | | |
| | | | | | | | | | | | | | |
| | | | | | | | | | | | | | |
| | | | | | | | | | | | | | |
See accompanying notes to consolidated financial statements.
Nasdaq, Inc.
Consolidated Statements of Cash Flows
(in millions)
| | | | | | | | | | | | | | | | | |
| Year Ended December 31, |
| 2023 | | 2022 | | 2021 |
|
| Cash flows from operating activities: | | | | | |
| Net income | $ | | | | $ | | | | $ | | |
| Adjustments to reconcile net income to net cash provided by operating activities: | | | | | |
| Depreciation and amortization | | | | | | | | |
| Share-based compensation | | | | | | | | |
| Deferred income taxes | | | | | | | | |
|
| Extinguishment of debt and bridge fees | | | | | | | | |
| Net gain on divestiture of business | | | | | | | () | |
|
| Non-cash restructuring charges | | | | | | | | |
|
Net (income) loss from unconsolidated investees | | | | () | | | () | |
| Operating lease asset impairments | | | | | | | | |
| Other reconciling items included in net income | | | | | | | | |
| Net change in operating assets and liabilities, net of effects of acquisitions: | | | | | |
| Receivables, net | | | | () | | | () | |
| Other assets | | | | | | | () | |
| Accounts payable and accrued expenses | | | | | | | () | |
| Section 31 fees payable to SEC | () | | | | | | () | |
| Accrued personnel costs | | | | | | | | |
| Deferred revenue | | | | | | | | |
| Other liabilities | () | | | () | | | () | |
|
| Net cash provided by operating activities | | | | | | | | |
| Cash flows from investing activities: | | | | | |
| Purchases of securities | () | | | () | | | () | |
| Proceeds from sales and redemptions of securities | | | | | | | | |
|
|
| Proceeds from divestiture of business, net of cash divested | | | | | | | | |
|
| Acquisition of businesses, net of cash and cash equivalents acquired | () | | | () | | | () | |
| Purchases of property and equipment | () | | | () | | | () | |
Investments related to default funds and margin deposits, net(1) | () | | | | | | () | |
| Other investing activities | () | | | | | | () | |
Net cash provided by (used in) investing activities | () | | | | | | () | |
| Cash flows from financing activities: | | | | | |
Proceeds from (repayments of) commercial paper, net | () | | | | | | | |
| Repayments of debt and credit commitment | () | | | () | | | () | |
| Payment of debt extinguishment cost and bridge fees | () | | | () | | | () | |
|
| Proceeds from issuances of debt, net of issuance costs | | | | | | | | |
| Repurchases of common stock | () | | | () | | | () | |
| ASR agreement | | | | () | | | () | |
| Dividends paid | () | | | () | | | () | |
| Proceeds received from employee stock activity and other issuances | | | | | | | | |
| Payments related to employee shares withheld for taxes | () | | | () | | | () | |
| Default funds and margin deposits | | | | | | | | |
| Other financing activities | () | | | | | | | |
| Net cash provided by financing activities | | | | | | | | |
| Effect of exchange rate changes on cash and cash equivalents and restricted cash and cash equivalents | | | | () | | | () | |
Net increase (decrease) in cash and cash equivalents and restricted cash and cash equivalents | | | | | | | () | |
Cash and cash equivalents, restricted cash and cash equivalents at beginning of period | | | | | | | | |
| Cash and cash equivalents, restricted cash and cash equivalents at end of period | $ | | | | $ | | | | $ | | |
| Reconciliation of Cash, Cash Equivalents and Restricted Cash and Cash Equivalents | | | | | |
| Cash and cash equivalents | $ | | | | $ | | | | $ | | |
| Restricted cash and cash equivalents | | | | | | | | |
| Restricted cash and cash equivalents (default funds and margin deposits) | | | | | | | | |
| Total | $ | | | | $ | | | | $ | | |
| Supplemental Disclosure Cash Flow Information | | | | | |
|
| Interest paid | $ | | | | $ | | | | $ | | |
| Income taxes paid, net of refund | $ | | | | $ | | | | $ | | |
__________________________(1)
See accompanying notes to consolidated financial statements.
Nasdaq, Inc.
Notes to Consolidated Financial Statements
1.
business segments: Capital Access Platforms, Financial Technology and Market Services.
For further discussion of our businesses, see “Products and Services,” of “Part 1, Item 1. Business.”
Capital Access Platforms
Our Capital Access Platforms segment includes Data & Listing Services, Index and Workflow & Insights.
Our Data business distributes historical and real-time market data to the sell-side, the institutional investing community, retail online brokers, proprietary trading firms and other venues, as well as internet portals and data distributors. Our data products can enhance transparency of market activity within our exchanges and provide critical information to professional and non-professional investors globally.
Our Listing Services business operates in the U.S. and Europe on a variety of listing platforms around the world to provide multiple global capital raising solutions for public companies. Our main listing markets are The Nasdaq Stock Market and the Nasdaq Nordic and Nasdaq Baltic exchanges. Through Nasdaq First North, our Nordic and Baltic operations also offer alternative marketplaces for smaller companies and growth companies.
As of December 31, 2023, there were total listings on The Nasdaq Stock Market, including ETPs. The combined market capitalization was approximately $ trillion. In Europe, the Nasdaq Nordic and Nasdaq Baltic exchanges, together with Nasdaq First North, were home to listed companies with a combined market capitalization of approximately $ trillion.
Workflow & Insights includes our analytics and corporate solutions businesses. Our analytics business provides asset managers, investment consultants and institutional asset owners with information and analytics to make data-driven investment decisions, deploy their resources more productively, and provide liquidity solutions for private funds. Through our eVestment and Solovis solutions, we provide a suite of cloud-based solutions that help institutional investors and consultants conduct pre-investment due diligence, and monitor their portfolios post-investment. The eVestment platform also enables asset managers to efficiently distribute information about their firms and funds to asset owners and consultants worldwide.
Through our Solovis platform, endowments, foundations, pensions and family offices transform how they collect and aggregate investment data, analyze portfolio performance, model and predict future outcomes, and share meaningful portfolio insights with key stakeholders. The Nasdaq Fund Network and Nasdaq Data Link are additional platforms in our suite of investment data analytics offerings and data management tools.
Our corporate solutions business includes our Investor Relations Intelligence, ESG Solutions and Governance Solutions products, which serve both public and private companies and organizations. Our public company clients can be companies listed on our exchanges or other U.S. and global exchanges. Our private company clients include a diverse group of organizations ranging from family-owned companies, government organizations, law firms, privately held entities, and various non-profit organizations to hospitals and healthcare systems. We help organizations enhance their ability to understand and expand their global shareholder base, improve corporate governance, and navigate the evolving ESG landscape through our suite of advanced technology, analytics, reporting and consulting services.
Financial Technology
Financial Technology comprises Financial Crime Management Technology, Regulatory Technology and Capital Markets Technology solutions.
Financial Crime Management Technology includes our Verafin solution, a cloud-based anti-financial crime management platform, which helps financial institutions detect, investigate, and report money laundering and financial fraud.
2.
See “Equity Method Investments,” of Note 6, “Investments,” for further discussion of our equity method investments.
million as of December 31, 2023 and $ million as of December 31, 2022. Cash equivalents are carried at cost plus accrued interest, which approximates fair value due to the short maturities of these investments.
million as of December 31, 2023 and $ million as of December 31, 2022, is restricted from withdrawal due to a contractual or regulatory requirement or not available for general use and as such is classified as restricted in the Consolidated Balance Sheets. As of December 31, 2023 and 2022, restricted cash and cash equivalents primarily includes funds held for regulatory capital for our trading and clearing businesses. The total allowance netted against receivables in the Consolidated Balance Sheets was $ million as of December 31, 2023 and $ million as of December 31, 2022. Any provision for bad debt or write-off recorded during the year was immaterial.
material adjustments were made to the carrying value of our equity securities.Our investments in equity securities are included in other non-current assets in the Consolidated Balance Sheets, as we intend to hold these investments for more than one year.
Equity Method Investments
In general, the equity method of accounting is used when we own 20% to 50% of the outstanding voting stock of a company or when we are able to exercise significant influence over the operating and financial policies of a company. We have certain investments in which we have determined that we have significant influence and as such account for the investments under the equity method of accounting. We record our estimated pro-rata share of earnings or losses each reporting period and record any dividends as a reduction in the investment balance. We evaluate our equity method investments for other-than-temporary declines in value by considering a variety of factors such as the earnings capacity of the investment and the fair value of the investment compared to its carrying amount. In addition, for investments where the market value is readily determinable, we consider the underlying stock price. If the estimated fair value of the investment is less than the carrying amount and management considers the decline in value to be other than temporary, the excess of the carrying amount over the estimated fair value is recognized in net income in the period the impairment occurs. See Note 6, “Investments,” for further discussion of our equity method investments.
material impairments were recorded to reduce the carrying value of our equity method investments in 2023, 2022 or 2021.
See “Net Investment Hedge” of Note 9, “Debt Obligations,” for further discussion.
to years for buildings and improvements, to years for data processing equipment, and to years for furniture and equipment.
Leasehold improvements are amortized using the straight-line method over the shorter of their estimated useful lives or the remaining term of the related lease.
We develop systems solutions for both internal and external use. Certain costs incurred in connection with developing or obtaining internal use software are capitalized. In addition, certain costs of computer software to be sold, leased, or otherwise marketed as a separate product or as part of a product or process are capitalized beginning when a product’s technological feasibility has been established and ending when a product is available for general release. Technological feasibility is established upon completion of a detailed program design or, in its absence, completion. Prior to reaching technological feasibility, all costs are charged to expense. Unamortized capitalized costs are included in data processing equipment and software, within property and equipment, net in the Consolidated Balance Sheets. Capitalized software costs are amortized on a straight-line basis over the estimated useful lives of the software, generally to years. Amortization of these costs is included in depreciation and amortization expense in the Consolidated Statements of Income.
Implementation costs incurred in a cloud computing arrangement that is a service contract are capitalized as a prepaid asset, included in other assets in our Consolidated Balance Sheets, and are amortized over the expected service
See Note 7, “Property and Equipment, net,” for further discussion.
years. Operating lease balances are included in operating lease assets, other current liabilities, and operating lease liabilities in our Consolidated Balance Sheets. We do not have any leases classified as finance leases. Operating lease assets represent our right to use an underlying asset for the lease term and lease liabilities represent our obligation to make lease payments arising from the lease. Operating lease assets and liabilities are recognized at commencement date based on the present value of lease payments over the lease term. Since our leases do not provide an implicit rate, we use our incremental borrowing rate based on the estimated rate of interest for collateralized borrowing over a similar term of the lease payments at commencement date in determining the present value of lease payments. The operating lease asset also includes any lease payments made and excludes lease incentives. Our lease terms include options to extend or terminate the lease when we are reasonably certain that we will exercise that option. Lease expense for lease payments is recognized on a straight-line basis over the lease term. Certain of our lease agreements include rental payments adjusted periodically for inflation based on an index or rate. These payments are included in the initial measurement of the operating lease liability and operating lease asset. However, rental payments that are based on a change in an index or a rate are considered variable lease payments and are expensed as incurred.
We have lease agreements with lease and non-lease components, which are accounted for as a single performance obligation to the extent that the timing and pattern of transfer are similar for the lease and non-lease components and the lease component qualifies as an operating lease. We do not recognize lease liabilities and operating lease assets for leases with a term of 12 months or less. We recognize these lease payments on a straight-line basis over the lease term.
See Note 16, “Leases,” for further discussion.
impairment of goodwill or indefinite-lived intangible assets for the years ended December 31, 2023, 2022 and 2021. Future disruptions to our business and events, such as prolonged economic weakness or unexpected significant declines in operating results of any of our reporting units or businesses, may result in goodwill or indefinite-lived intangible asset impairment charges in the future.
There were material finite-lived impairment charges in 2023 and 2022. We recorded pre-tax, non-cash finite-lived intangible assets impairment charges of $ million in 2021 related to a finite-lived intangible asset for customer relationships associated with the wind down of a previous acquisition. In addition, we also recorded pre-tax, non-cash property and equipment asset impairment charges of $ million in 2023, $ million in 2022, and $ million in 2021.
Revenue Recognition and Transaction-Based Expenses
million as of December 31, 2023 and $ million as of December 31, 2022. The activity during the period relating to changes in the allowance for credit losses was immaterial. We do not have obligations for warranties, returns or refunds to customers.The majority of our contracts with customers do not have significant variable consideration. We do not have a material amount of revenues recognized from performance obligations that were satisfied in prior periods. We do not provide disclosures about transaction price allocated to unsatisfied performance obligations if contract durations are less than one year.
For contract durations that are one-year or greater, the portion of transaction price allocated to unsatisfied performance obligations is included in Note 3, “Revenue From Contracts With Customers.” Our deferred revenue primarily arises from contract liabilities related to our fees for annual and initial listings, workflow & insights, regulatory technology, and capital markets technology contracts. Deferred revenue is the only significant contract asset or liability as of December 31, 2023 and 2022. See Note 8, “Deferred Revenue,” for our
period, which is based on contract terms, with the remaining revenue recognized ratably over which is based on our historical listing experience and projected future listing duration.
period since the customer receives and consumes the benefit as Nasdaq provides the service. Annual fees are charged to newly listed companies on a pro-rata basis, based on outstanding shares at the time of listing and recognized over the remainder of the year. European annual renewal fees, which are received from companies listed on our Nasdaq Nordic and Nasdaq Baltic exchanges and Nasdaq First North, are directly related to the listed companies’ market capitalization on a trailing basis and are recognized ratably over the following period since the customer receives and consumes the benefit as Nasdaq provides the service.Index
We develop and license Nasdaq-branded indices and financial products and provide index data products for third-party clients. Revenues primarily include license fees from these branded indices and financial products in the U.S. and abroad. We primarily have types of license agreements: asset-based licenses and transaction-based licenses. Asset-based licenses are generally renewable agreements. Customers are charged based on a percentage of AUM for licensed products, per the agreement, on a monthly or quarterly basis. These revenues are recognized over the term of the license agreement since the customer receives and consumes the benefit as Nasdaq provides the service. Revenue from index data subscriptions are recognized on a monthly basis. Transaction-based licenses are also generally renewable agreements. Customers are charged based on transaction volume or a minimum contract amount, or both. If a customer is charged based on transaction volume, we recognize revenue when the transaction occurs. If a customer is charged based on a minimum contract amount, we recognize revenue on a pro-rata basis over the licensing term since the customer receives and consumes the benefit as Nasdaq provides the service.
Workflow & Insights
Analytics revenues are earned from investment content and analytics products. We earn revenues primarily based on the number of content and analytics subscribers and distributors.
Subscription agreements are generally one to in term, payable in advance, and provide for automatic renewal. Subscription-based revenues are recognized over time on a ratable basis over the contract period beginning on the date that our service is made available to the customer since the customer receives and consumes the benefit as Nasdaq provides the service.
Our corporate solutions business includes our Investor Relations Intelligence, ESG Services and Governance Solutions businesses, which serve both public and private companies and organizations.
Corporate solutions revenues primarily include subscription and transaction-based income from our investor relations intelligence and governance solutions products and services. Subscription-based revenues earned are recognized over time on a ratable basis over the contract period beginning on the date that our service is made available to the customer since the customer receives and consumes the benefit as Nasdaq provides the service. Generally, fees are billed in advance and the contract provides for automatic renewal. As part of subscription agreements, customers can also be charged usage fees based upon actual usage of the services provided. Revenues from usage fees are recognized at a point in time when the service is provided.
Financial Technology
Financial Crime Management Technology
Our financial crime management technology solution primarily consists of SaaS revenues. We enter into subscription agreements which allow customers access to our cloud platform. Subscription agreements are generally in term, payable in advance, with the option of automatic renewal for some products. Subscription-based revenues are recognized over time on a ratable basis over the contract period beginning on the date that our service is made available to the customer since the customer receives and consumes the benefit as Nasdaq provides the service.
Regulatory Technology
Our surveillance solutions primarily consist of SaaS revenues and we enter into subscription agreements which allow customers access to our cloud platform or a connection to our servers to access the software. We recognize revenue from these agreements similarly to our revenue recognition for the Financial Crime Management Technology agreements discussed above.
AxiomSL provides financial institutions with risk & financial regulatory reporting and risk management solutions. The products can be offered as an on-premise or as a cloud service agreement.
A license for on-premise software provides customers with the right to use the software at its current state at the time made available to the customer. These contracts generally consist of the following distinct performance obligations: license, professional services and maintenance.
In allocating the contractual price to each performance obligation, we have used our best estimate of the stand-alone selling price. Consideration is first allocated to performance obligations with established stand-alone selling prices based on observable evidence such as professional services with the residual being split between license and maintenance.
million, $ million and $ million, respectively, related to the market technology contracts described above.Contract modifications are routine in the performance of our contracts. Contracts are often modified to account for changes in contract specifications or requirements. In most instances, contract modifications are for goods and services that are not distinct, and, therefore, are accounted for as part of the existing contract.
For our long-term contracts, payments are generally made throughout the contract life and can be dependent on either reaching certain milestones or paid upfront in advance of the service period depending on the stage of the contract. For subscription agreements, contract payment terms can be quarterly, annually or monthly, in advance. For all other contracts, payment terms vary.
We generally recognize revenue over time as our customers simultaneously receive and consume the benefits provided by our performance because our customer controls the asset for which we are creating, our performance does not create an asset with alternative use, and we have a right to payment for performance completed to date. For these services, we recognize revenue over time using costs incurred to date relative to total estimated costs at completion to measure progress toward satisfying our performance obligation. Incurred costs represent work performed, which corresponds with, and thereby depicts, the transfer of control to the customer. Contract costs generally include labor and direct overhead. For software support and update services, and for
See Note 13, “Earnings Per Share,” for further discussion.
intervals, called offering periods, at % of the lower of the fair market value on the first or the last day of each offering period. The % discount given to our employees is included in compensation and benefits expense in the Consolidated Statements of Income.See Note 11, “Share-Based Compensation,” for further discussion of our share-based compensation plans.
See Note 14, “Fair Value of Financial Instruments,” for further discussion.
3.
| | $ | | | | $ | | | | Index | | | | | | | | |
| Workflow & Insights | | | | | | | | |
| Financial Technology | | | | | |
| Financial Crime Management Technology | | | | | | | | |
Regulatory Technology | | | | | | | | |
Capital Markets Technology | | | | | | | | |
Market Services, net | | | | | | | | |
| Other revenues | | | | | | | | |
| Revenues less transaction-based expenses | $ | | | | $ | | | | $ | | | Substantially all revenues from the Capital Access Platforms segment are recognized over time for the years ended December 31, 2023, 2022 and 2021. For 2023, % of the Financial Technology segment revenues were recognized at a point in time. This relates to AxiomSL and Calypso license revenues for the two months since acquisition. The remaining Financial Technology revenues were recognized over time. For the years ended December 31, 2023, 2022 and 2021 approximately %, %, and % respectively, of Market Services revenues were recognized at a point in time and %, % and %, respectively, were recognized over time.
Contract Balances
Substantially all of our revenues are considered to be revenues from contracts with customers. The related accounts receivable balances are recorded in our Consolidated Balance Sheets as receivables, which are net of allowance for doubtful accounts of $ million as of December 31, 2023 and $ million as of December 31, 2022. There were no material upward or downward adjustments to the allowance during the year ended December 31, 2023. We do not have obligations for warranties, returns or refunds to customers.
For the majority of our contracts with customers, except for our market technology and listing services contracts, our performance obligations range from to and there is no significant variable consideration.
Deferred revenue is the only significant contract asset or liability as of December 31, 2023. Deferred revenue represents consideration received that is yet to be recognized as revenue for unsatisfied performance obligations. Deferred revenue primarily represents our contract liabilities related to
| | $ | | | | $ | | | | $ | | | | $ | | |
| 2025 | | | | | | | | | | | | | | |
| 2026 | | | | | | | | | | | | | | |
| 2027 | | | | | | | | | | | | | | |
| 2028 | | | | | | | | | | | | | | |
2029+ | | | | | | | | | | | | | | |
| Total | $ | | | | $ | | | | $ | | | | $ | | | | $ | | |
4.
billion in cash (subject to customary post-closing adjustments) and a fixed amount of million shares of Nasdaq common stock, based on the volume-weighted average price per share over consecutive trading days prior to signing. Nasdaq issued $ billion of debt and entered into a $ million term loan and used the proceeds for the cash portion of the consideration. See “
Senior Unsecured Notes” and “2023 Term Loan” in “Financing of the Adenza Acquisition” of Note 9, “Debt Obligations,” for further discussion.
|
Closing price per share of Nasdaq common stock on November 1, 2023 | $ | | |
Fair value of equity portion of the purchase consideration | $ | | |
Cash consideration | $ | | |
Total purchase consideration | $ | | |
At the closing of the transaction, the million shares of Nasdaq common stock were issued to Thoma Bravo, the sole shareholder of Adenza, and represented approximately % of the outstanding shares of Nasdaq. For further discussion on the rights of common stockholders refer to “Common Stock” of Note 12, “Nasdaq Stockholders’ Equity.” Adenza is part of our Financial Technology segment.
The amounts in the table below represent the preliminary allocation of the purchase price to the acquired intangible assets, the deferred tax liability on the acquired intangible assets and other assets acquired and liabilities assumed based on their preliminary respective estimated fair values on the date of acquisition. The excess purchase price over the net tangible and acquired intangible assets has been recorded as goodwill. The goodwill recognized is attributable primarily to expected synergies and is assigned to our Financial Technology segment.
|
Acquired intangible assets | | |
Receivables, net | | |
Other net assets acquired | | |
Cash and cash equivalents | | |
Accrued personnel costs | () | |
Deferred revenue | () | |
Deferred tax liability on acquired intangible assets | () | |
Total purchase consideration | $ | | |
The primary areas of the preliminary purchase price allocation that are not yet finalized relate to the valuation of the identifiable intangible assets and income taxes. The allocation of the purchase price will be finalized within one year of the date of acquisition.
Intangible Assets
| $ | | | $ | | | $ | | | | Discount rate used | | % | | % | | % | |
| Estimated average useful life | years | years | years | |
Customer Relationships
Customer relationships represent the contractual relationships with customers.
Methodology
Customer relationships were valued using the income approach, specifically an excess earnings method. The excess earnings method examines the economic returns contributed by the identified tangible and intangible assets of a company, and then isolates the excess return that is attributable to the intangible asset being valued.
Discount Rate
The discount rate used reflects the amount of risk associated with the hypothetical cash flows for the customer relationships relative to the overall business. In developing a discount rate for the customer relationships, we estimated a weighted-average cost of capital for the overall business and we utilized this rate as an input when discounting the cash flows. The resulting discounted cash flows were then tax-effected at the applicable statutory rate.
A discounted tax amortization benefit was added to the fair value of the assets under the assumption that the customer relationships would be amortized for tax purposes over a period of years.
Technology
As part of our acquisition of Adenza, we acquired developed technology relating to AxiomSL and Calypso.
Methodology
The developed technology was valued using the income approach, specifically the relief-from-royalty method, or RFRM. The RFRM is used to estimate the cost savings that accrue to the owner of an intangible asset who would otherwise have to pay royalties or license fees on revenues earned through the use of the asset. The royalty rate is applied to the projected revenue over the expected remaining life of the intangible asset to estimate royalty savings. The net after-tax royalty savings are calculated for each year in the remaining economic life of the technology and discounted to present value.
million were included in Financial Technology revenues in the Consolidated Statement of Income and Adenza operating income of $ million was included in our operating income in the Consolidated Statement of Income.Acquisition-related costs were expensed as incurred and are included in merger and strategic initiatives expense in the Consolidated Statements of Income.
Supplemental Pro Forma Information (Unaudited)
The unaudited supplemental pro forma financial information presented below is for illustrative purposes only and is not necessarily indicative of the financial position or results of operations that would have been realized if the acquisition had been completed on the date indicated, does not reflect synergies that might have been achieved, nor is it indicative of future operating results or financial position.
The following supplemental pro forma financial information presents the combined results of operations as if Adenza had been acquired as of January 1, 2022. The pro forma adjustments are based upon currently available information and certain assumptions we believe are reasonable under the circumstances. These adjustments primarily include a net increase in amortization expense that would have been recognized due to acquired identifiable intangible assets, a net increase to interest expense to reflect the additional borrowings for the financing of the Adenza acquisition net of the interest expense relating to the repayment of Adenza’s historical debt, and the related income tax effects of the adjustments noted above.
| | $ | | | Pro forma operating income | | | | | |
Pro forma net income attributable to Nasdaq | | | | | |
2022 Acquisition
In June 2022, we acquired Metrio, a provider of ESG data collection, analytics and reporting services based in Montreal, Canada. Metrio is part of our Workflow & Insights business in our Capital Access Platforms segment.
The consolidated financial statements for the years ended December 31, 2023 and 2022 include the financial results of the Metrio acquisition from the date of the acquisition. Pro forma financial results have not been presented as this acquisition was not material to our financial results.
Acquisition-related costs were expensed as incurred and are included in merger and strategic initiatives expense in the Consolidated Statements of Income.
5.
| |
|
|
| Foreign currency translation adjustments | | |
| Balance at December 31, 2023 | $ | | |
Financial Technology | |
| Balance at December 31, 2022 | $ | | |
| Goodwill acquired | | |
|
|
| Foreign currency translation adjustments | | |
| Balance at December 31, 2023 | $ | | |
|
|
|
|
|
|
|
Market Services | |
| Balance at December 31, 2022 | $ | | |
|
|
|
| Foreign currency translation adjustments | | |
| Balance at December 31, 2023 | $ | | |
| |
| Total | |
| Balance at December 31, 2022 | $ | | |
| Goodwill acquired | | |
|
|
| Foreign currency translation adjustments | | |
| Balance at December 31, 2023 | $ | | |
Goodwill represents the excess of purchase price over the value assigned to the net assets, including identifiable intangible assets, of a business acquired. Goodwill is allocated to our reporting units based on the assignment of the fair values of each reporting unit of the acquired company. We test goodwill for impairment at the reporting unit level annually, or in interim periods if certain events occur indicating that the carrying amount may be impaired, such as changes in the business climate, poor indicators of operating performance or the sale or disposition of a significant portion of a reporting unit. There was impairment of goodwill for the years ended December 31, 2023, 2022 and 2021; however, events such as prolonged economic weakness or unexpected significant declines in operating results of any of our reporting units or businesses may result in goodwill impairment charges in the future.
| | $ | | | | | | | | | Customer relationships | | | | | | | | | | |
| Trade names and other | | | | | | | | | | |
| Foreign currency translation adjustment | () | | | () | | | | | | |
| Total gross amount | $ | | | | $ | | | | | | | |
| Accumulated Amortization | | | | | | | | |
| Technology | $ | () | | | $ | () | | | | | | |
| Customer relationships | () | | | () | | | | | | |
| Trade names and other | () | | | () | | | | | | |
| Foreign currency translation adjustment | | | | | | | | | | |
| Total accumulated amortization | $ | () | | | $ | () | | | | | | |
| Net Amount | | | | | | | | |
| Technology | $ | | | | $ | | | | | | | |
| Customer relationships | | | | | | | | | | |
| Trade names and other | | | | | | | | | | |
| Foreign currency translation adjustment | () | | | () | | | | | | |
| Total finite-lived intangible assets | $ | | | | $ | | | | | | | |
| | | | | | | | |
| Indefinite-Lived Intangible Assets | | | | | | | |
| Exchange and clearing registrations | $ | | | | $ | | | | | | | |
| Trade names | | | | | | | | | | |
| Licenses | | | | | | | | | | |
| Foreign currency translation adjustment | () | | | () | | | | | | |
| Total indefinite-lived intangible assets | $ | | | | $ | | | | | | | |
| Total intangible assets, net | $ | | | | $ | | | | | | | |
| | | | | | | | | There was impairment of indefinite-lived intangible assets for 2023, 2022 and 2021. There were material finite-lived impairment charges in 2023, 2022 and 2021.
million as of December 31, 2023) of acquired finite-lived intangible assets as of December 31, 2023: | | | | | |
| (in millions) |
| 2024 | $ | | |
| 2025 | | |
| 2026 | | |
| 2027 | | |
| 2028 | | |
| 2029+ | | |
| Total | $ | | |
6.
| | $ | | | |
|
|
| Equity method investments | | | | | |
| Equity securities | | | | | |
Financial Investments
Financial investments are comprised of trading securities, primarily highly rated European government debt securities, of which $ million as of December 31, 2023 and $ million as of December 31, 2022 are assets primarily utilized to meet regulatory capital requirements, mainly for our clearing operations at Nasdaq Clearing.
Equity Method Investments
We record our estimated pro-rata share of earnings or losses each reporting period and record any dividends as a reduction in the investment balance. As of December 31, 2023 and 2022, our equity method investments primarily included our % equity interest in OCC.
The carrying amounts of our equity method investments are included in other non-current assets in the Consolidated Balance Sheets. material impairments were recorded for the years ended December 31, 2023, 2022 and 2021.
) million, $ million, and $ million for the years ended December 31, 2023, 2022 and 2021, respectively. For the year ended December 31, 2023, equity interest in the earnings of OCC was offset by our equity interest in the loss of NPM and another equity method investment. For the year ended December 31, 2022, lower equity interest in the earnings of OCC, as compared to 2021, was primarily driven by a reduction in the clearing fee rate that OCC charges its customers, partially offset by elevated U.S. industry trading volumes.
Equity Securities
The carrying amounts of our equity securities are included in other non-current assets in the Consolidated Balance Sheets. We elected the measurement alternative for substantially all of our equity securities as they do not have a readily determinable fair value. No material adjustments were made to the carrying value of our equity securities for the years ended December 31, 2023, 2022 and 2021. As of December 31, 2023 and December 31, 2022, our equity securities primarily represent various strategic investments made through our corporate venture program.
7.
| | $ | | | | Furniture, equipment and leasehold improvements | | | | | |
| Total property and equipment | | | | | |
| Less: accumulated depreciation and amortization and impairment charges | () | | | () | |
| Total property and equipment, net | $ | | | | $ | | |
Depreciation and amortization expense for property and equipment was $ million for the year ended December 31, 2023, $ million for the year ended December 31, 2022, and $ million for the year ended December 31, 2021. These amounts are included in depreciation and amortization expense in the Consolidated Statements of Income.
million in 2023, $ million in 2022 and $ million in 2021. These charges are included in restructuring charges in the Consolidated Statements of Income. See Note 20, “Restructuring Charges,” for further discussion. There were other material impairments of property and equipment recorded in 2023, 2022 and 2021.
As of December 31, 2023 and 2022, we did not own any real estate properties.
8.
| $ | | | $ | () | | $ | | | $ | | | | | | | Annual Listings | | | | | () | | | | | | | | |
| Workflow & Insights | | | | | () | | | | | | | | |
| Financial Technology: | | | | | | | |
| Financial Crime Management Technology | | | | | () | | | | | | | | |
Regulatory Technology | | | | | () | | | | | | | | |
Capital Markets Technology | | | | | () | | | | | | | | |
| Other | | | | | () | | | | | | | | |
| Total | $ | | | $ | | | $ | () | | $ | | | $ | | | | | |
| | | | | | | | |
| | | | | | | | |
| | | | | | | | |
| | | | | | | | |
| | | | | | | | |
| | | | | | | | | In the above table:
•Additions reflect deferred revenue billed in the current period, net of recognition. Regulatory Technology and Capital Markets Technology additions include deferred revenue acquired as part of the acquisition of Adenza.
•Revenue recognized includes revenue recognized during the current period that was included in the beginning balance.
•Adjustments reflect foreign currency translation adjustments.
| $ | | | $ | | | $ | | | $ | | | $ | | | $ | | | | | Annual Listings | | | | | | | | | | | | | | | |
| | | | | | | | |
| Workflow & Insights | | | | | | | | | | | | | | | |
| Financial Technology: | | | | | | |
| Financial Crime Management Technology | | | | | | | | | | | | | | | |
| Regulatory Technology | | | | | | | | | | | | | | | |
| Capital Markets Technology | | | | | | | | | | | | | | | |
| Other | | | | | | | | | | | | | | | |
| Total | $ | | | $ | | | $ | | | $ | | | $ | | | $ | | | $ | | | |
| | | | | | | | |
| | | | | | | | |
| | | | | | | | |
| | | | | | | | |
| | | | | | | | |
| | | | | | | | |
| | | | | | | | |
| | | | | | | | |
|
|
| Long-term debt - senior unsecured notes: |
2025 Notes, $ million, % notes due June 28, 2025 | | | | | |
2026 Notes, $ million, % notes due June 30, 2026 | | | | | |
2028 Notes, $ billion, % notes due June 28, 2028 | | | | | |
2029 Notes, € million, % notes due March 28, 2029 | | | | | |
2030 Notes, € million, % notes due February 13, 2030 | | | | | |
2031 Notes, $ million, % notes due January 15, 2031 | | | | | |
2032 Notes, € million, % notes due February 15, 2032 | | | | | |
2033 Notes, € million, % notes due July 30, 2033 | | | | | |
2034 Notes $ billion, % notes due February 15, 2034 | | | | | |
2040 Notes, $ million, % notes due December 21, 2040 | | | | | |
2050 Notes, $ million, % notes due April 28, 2050 | | | | | |
2052 Notes, $ million, % notes due March 7, 2052 | | | | | |
2053 Notes, $ million, % notes due August 15, 2053 | | | | | |
2063 Notes, $ million, % notes due June 28, 2063 | | | | | |
2023 Term Loan | | | | | |
2022 Revolving Credit Facility | () | | | () | |
| Total long-term debt | $ | | | | $ | | |
| Total debt obligations | $ | | | | $ | | |
Commercial Paper Program
Our U.S. dollar commercial paper program is supported by our 2022 Revolving Credit Facility, which provides liquidity support for the repayment of commercial paper issued through this program. See “2022 Revolving Credit Facility” below for further discussion. The effective interest rate of commercial paper issuances fluctuates as short-term interest rates and demand fluctuate. The fluctuation of these rates may impact our interest expense. As of December 31, 2023, we had $ million outstanding under the commercial paper program.
million for the year ended December 31, 2023. Our Euro denominated notes are adjusted for the impact of foreign currency translation. Our senior unsecured notes are general unsecured obligations which rank equally with all of our existing and future unsubordinated obligations and are not guaranteed by any of our subsidiaries. The senior unsecured notes were issued under indentures that, among other things, limit our ability to consolidate, merge or sell all or substantially all of our assets, create liens, and enter into sale and leaseback transactions. The senior unsecured notes may be redeemed by Nasdaq at any time, subject to a make-whole amount. Upon a change of control triggering event (as defined in the various supplemental indentures governing the applicable notes), the terms require us to repurchase all or part of each holder’s notes for cash equal to % of the aggregate principal amount purchased plus accrued and unpaid interest, if any.
The 2029 Notes, 2030 Notes, 2032 Notes and 2033 Notes pay interest annually. All other notes pay interest semi-annually. The U.S senior unsecured notes coupon rates may vary with Nasdaq’s debt rating, to the extent Nasdaq is downgraded below investment grade, up to an upward rate adjustment not to exceed %.
Net Investment Hedge
Our Euro denominated notes have been designated as a hedge of our net investment in certain foreign subsidiaries to mitigate the foreign exchange risk associated with certain investments in these subsidiaries. Accordingly, the remeasurement of these notes is recorded in accumulated other comprehensive loss within Nasdaq’s stockholders’ equity in the Consolidated Balance Sheets. For the year ended December 31, 2023, the impact of translation decreased the U.S. dollar value of our Euro denominated notes by $ million.
series of notes for total proceeds of $ million, net of debt issuance costs of $ million, with various maturity dates ranging from 2025 to 2063. During the second half of 2023, we incurred an additional $ million in debt issuance costs, for total net proceeds from the issuance of the six series of notes of $ million as of December 31, 2023. The net proceeds from these notes were used to finance the majority of the cash consideration due in connection with the Adenza acquisition. For further discussion of the Adenza acquisition, see “2023 Acquisition,” of Note 4, “Acquisitions.”2023 Term Loan
In June 2023, in connection with the financing of the Adenza acquisition, we entered into a term loan credit agreement, or the 2023 Term Loan. The 2023 Term Loan provided us with the ability to borrow up to $ million to finance a portion of the cash consideration for the Adenza acquisition, for repayment of certain debt of Adenza and its subsidiaries, and to pay fees, costs and expenses related to the transaction. Under the 2023 Term Loan, borrowings bear interest on the principal amount outstanding at a variable interest rate based on the SOFR plus an applicable margin that varies with Nasdaq’s credit rating. On November 1, 2023, we borrowed $ million, net of fees, under this term loan towards payment of the cash consideration due in connection with the Adenza acquisition. We made a partial repayment during the fourth quarter of $ million. As of December 31, 2023, we had $ million outstanding under this term loan.
Credit Facilities
2022 Revolving Credit Facility
In December 2022, Nasdaq amended and restated its previously issued $ billion revolving credit facility, with a new maturity date of December 16, 2027. Nasdaq intends to use funds available under the 2022 Revolving Credit Facility for general corporate purposes and to provide liquidity support for the repayment of commercial paper issued through the commercial paper program. Nasdaq is permitted to repay borrowings under our 2022 Revolving Credit Facility at any time in whole or in part, without penalty.
As of December 31, 2023, amounts were outstanding on the 2022 Revolving Credit Facility. The $() million balance represents unamortized debt issuance costs which are being accreted through interest expense over the life of the credit facility.
Borrowings under the revolving credit facility and swingline borrowings bear interest on the principal amount outstanding at a variable interest rate based on either the SOFR (or a successor rate to SOFR), the base rate (as defined in the 2022 Revolving Credit Facility agreement), or other applicable rate with respect to non-dollar borrowings, plus an applicable margin that varies with Nasdaq’s debt rating. We are charged commitment fees of % to %, depending on our credit rating, whether or not amounts have been borrowed. These commitment fees are included in interest expense and were not material for the years ended December 31, 2023 and 2022.
The 2022 Revolving Credit Facility contains financial and operating covenants. Financial covenants include a maximum leverage ratio. Operating covenants include, among other things, limitations on Nasdaq’s ability to incur additional indebtedness, grant liens on assets, dispose of assets and make certain restricted payments. The facility also contains customary affirmative covenants, including access to financial statements, notice of defaults and certain other material events, maintenance of properties and insurance, and customary events of default, including cross-defaults to our material indebtedness.
The 2022 Revolving Credit Facility includes an option for Nasdaq to increase the available aggregate amount by up to $ million, subject to the consent of the lenders funding the increase and certain other conditions.
Other Credit Facilities
Certain of our European subsidiaries have several other credit facilities, which are available in multiple currencies, primarily to support our Nasdaq Clearing operations in Europe, as well as to provide a cash pool credit line for one subsidiary. These credit facilities, in aggregate, totaled $ million as of December 31, 2023 and $ million as of December 31, 2022 in available liquidity, of which was utilized. Generally, these facilities each have a term. The amounts borrowed under these various credit facilities bear interest on the principal amount outstanding at a variable interest rate based on a base rate (as defined in the applicable credit agreement), plus an applicable margin. We are charged commitment fees (as defined in the applicable credit agreement), whether or not amounts have been borrowed. These commitment fees are included in interest expense and were not material for the years ended December 31, 2023 and 2022.
These facilities include customary affirmative and negative operating covenants and events of default.
Debt Covenants
As of December 31, 2023, we were in compliance with the covenants of all of our debt obligations.
10.
% of the first % of eligible employee contributions.
| | $ | | | | $ | | |
Pension and Supplemental Executive Retirement Plans
We maintain non-contributory, a defined-benefit pension plan, non-qualified SERPs for certain senior executives and other post-retirement benefit plans for eligible employees in the U.S. Our pension plan and SERPs are frozen. Future service and salary for all participants do not count toward an accrual of benefits under the pension plan and SERPs. Most employees outside the U.S. are covered by local retirement plans or by applicable social laws. Benefits under social laws are generally expensed in the periods in which the costs are incurred. In June 2023, we terminated our U.S. pension plan and are taking steps to wind down the plan and transfer the resulting liability to an insurance company which started in 2023 and will be completed in 2024. These steps include settling all future obligations under our U.S. pension plan through a combination of lump sum payments to eligible, electing participants (completed in 2023) and the transfer of any remaining benefits to a third-party insurance company through a group annuity contract. In connection with the plan termination and partial settlement, a loss of $ million was recorded to compensation and benefits expense in the Consolidated Statement of Income. We expect to incur an additional settlement loss upon the finalization of the group annuity purchase during the first half of 2024.
| | $ | | | | $ | | | Nasdaq recognizes the funded status of our U.S. defined-benefit pension plan, measured as the difference between the fair value of the plan assets and the benefit obligation, in the Consolidated Balance Sheets.
As of December 31, 2023, the fair value of our U.S. defined-benefit pension plan’s assets was $ million and the benefit obligation was $ million. As a result, the U.S. defined-benefit pension plan is fully funded as of December 31, 2023.
million and the benefit obligation was $ million. As a result, the U.S. defined-benefit pension plan was underfunded by $ million as of December 31, 2022.
During 2023 and 2022, we did make any contributions to our U.S. defined-benefit pension plan. For our SERP and other post-retirement benefit plans, the net underfunded liability was $ million as of December 31, 2023 and $ million as of December 31, 2022. The underfunded liability for the above plans is included in accrued personnel costs and other non-current liabilities in the Consolidated Balance Sheets. The U.S. pension plan’s assets are invested per target allocations adopted by Nasdaq’s Pension and 401(k) Committee and are primarily invested in liability driven portfolios that have underlying investments in fixed income securities. More specifically, the plan has investments in long duration cash bonds, as well co-mingled investment options referred to as a separate account under a life insurance company group annuity contract. The life insurance company owns the underlying financial instruments held within the separate accounts and plan sponsors gain access to them through the purchase of a group annuity contract. These group annuity contracts are valued on a daily basis and offer daily liquidity, and use a unit value system of recordkeeping to track a plan sponsor’s interest in the separate account investment.
Accumulated Other Comprehensive Loss
As of December 31, 2023, accumulated other comprehensive
loss for the U.S. pension plan was $ million reflecting an unrecognized net loss of $ million, partially offset by an income tax benefit of $ million.
Estimated Future Benefit Payments
We expect to make future benefit payments to participants in SERPs of approximately $ million over the next ten years.
Nonqualified Deferred Compensation Plan
In June 2022, we established the Nasdaq, Inc. Nonqualified Deferred Compensation Plan. This plan provides certain eligible employees with the opportunity to defer a portion of their annual salary and bonus up to certain approval limits. All deferrals and associated earnings are our general unsecured obligations and were immaterial for the year ended December 31, 2023 and 2022.
11.
% discount for the ESPP for the years ended December 31, 2023, 2022 and 2021, which is included in compensation and benefits expense in the Consolidated Statements of Income:Common Shares Available Under Our Equity Plan
As of December 31, 2023, we had approximately million shares of common stock authorized for future issuance under our Equity Plan.
Restricted Stock
We grant restricted stock to most employees. The grant date fair value of restricted stock awards is based on the closing stock price at the date of grant less the present value of future cash dividends. Restricted stock awards granted to employees below the manager level generally vest % on the first anniversary of the grant date, % on the second anniversary of the grant date, and the remainder on the third anniversary of the grant date. Restricted stock awards granted to employees at or above the manager level generally vest % on the second anniversary of the grant date, % on the third anniversary of the grant date, and the remainder on the fourth anniversary of the grant date.
Summary of Restricted Stock Activity
| | $ | | | | Granted | | | | | |
| Vested | () | | | | |
| Forfeited | () | | | | |
| Unvested at December 31, 2021 | | | | $ | | |
| Granted | | | | | |
| Vested | () | | | | |
| Forfeited | () | | | | |
| Unvested at December 31, 2022 | | | | $ | | |
| Granted | | | | | |
| Vested | () | | | | |
| Forfeited | () | | | | |
| Unvested at December 31, 2023 | | | | $ | | |
As of December 31, 2023, $ million of total unrecognized compensation cost related to restricted stock is expected to be recognized over a weighted-average period of years.
PSUs
PSUs are based on performance measures that impact the amount of shares that each recipient will receive upon vesting. Prior to April 1, 2020, we had performance-based PSU programs for certain officers, a performance-based program and a cumulative performance-based program that focuses on TSR. Effective April 1, 2020, to better align the equity programs for eligible officers, the performance-based program was eliminated and all eligible officers now participate in the cumulative performance-based program. The performance periods are complete for all PSUs granted under the performance-based program, and all shares underlying these PSUs have vested as of December 31, 2022.
PSU ProgramThe grant date fair value of PSUs under the performance-based program was based on the closing stock price at the date of grant less the present value of future cash dividends. Under this program, an eligible employee received a target grant of PSUs, but could have received from % to % of the target amount granted, depending on the achievement of performance measures. These awards vest ratably on an annual basis over a period commencing with the end of the performance period. Compensation cost was recognized over the performance period and the vesting period based on the probability that such performance measures will be achieved, taking into account an estimated forfeiture rate.
PSU Program
Under the performance-based program, each eligible individual receives PSUs, subject to the satisfaction of applicable market performance conditions, with a cumulative performance period that vest at the end of the performance period and which settle in shares of our common stock. Compensation cost is recognized over the performance period, taking into account an estimated forfeiture rate, regardless of whether the market condition is satisfied, provided that the requisite service period has been completed. Performance will be determined by comparing Nasdaq’s TSR to peer groups, each weighted %. The first peer group consists of exchange companies, and the second peer group consists of all companies in the S&P 500. For the PSU awards that will be granted in 2024, we will replace the exchange company peer group with the S&P 500 GICS 4020 Index, which is a blend of exchanges, as well as data, financial technology and banking companies to align more closely with Nasdaq’s diverse business and competitors. The PSU award granted to our Chief Financial Officer in December 2023, in connection with the commencement of her employment, also included this new peer group. Nasdaq’s relative performance ranking against each of these groups will determine the final number of shares delivered to each individual under the program. The award issuance under this program will be between % and % of the number of PSUs granted and will be determined by Nasdaq’s overall performance against both peer groups. However, if Nasdaq’s TSR is negative for the performance period, regardless of TSR ranking, the award issuance will not exceed % of the number of PSUs granted. We estimate the fair value of PSUs granted under the PSU program using the Monte Carlo simulation model, as these awards contain a market condition.
Grants of PSUs that were issued in 2021 with a performance period exceeded the applicable performance parameters. As a result, an additional units above the original target were granted in the first quarter of 2024 and were fully vested upon issuance.
PSU program during the years ended December 31, 2023 and 2022:
| | | | | | | | | | | |
| Year Ended December 31, |
| 2023 | | 2022 |
| Weighted-average risk-free interest rate | | % | | | % |
Expected volatility | | % | | | % |
| Weighted-average grant date share price | $ | | | | $ | | |
| Weighted-average fair value at grant date | $ | | | | $ | | |
In the table above, the risk-free interest rate for periods within the expected life of the award is based on the U.S. Treasury yield curve in effect at the time of grant; and we use historic volatility for PSU awards issued under the PSU program, as implied volatility data could not be obtained for all the companies in the peer groups used for relative performance measurement within the program.
In addition, the annual dividend assumption utilized in the Monte Carlo simulation model is based on Nasdaq’s dividend yield at the date of grant.
Summary of PSU Activity
| | $ | | | | | | | $ | | | | Granted | | | | | | | | | | | |
| Vested | () | | | | | | () | | | | |
| Forfeited | () | | | | | | () | | | | |
| Unvested at December 31, 2021 | | | | $ | | | | | | | $ | | |
| Granted | | | | | | | | | | | |
| Vested | () | | | | | | () | | | | |
| Forfeited | () | | | | | | () | | | | |
| Unvested at December 31, 2022 | | | | $ | | | | | | | $ | | |
| Granted | | | | | | | | | | | |
| Vested | | | | | | | () | | | | |
| Forfeited | | | | | | | () | | | | |
| Unvested at December 31, 2023 | | | | $ | | | | | | | $ | | |
million and is expected to be recognized over a weighted-average period of years.
Stock Options
In January 2022, in connection with a new five year employment agreement, our Chief Executive Officer received an aggregate of performance-based non-qualified stock options, which will vest as follows:
•% will vest contingent upon the achievement of certain performance conditions; and
•% will vest after the grant date, subject to continued employment through such date.
The fair value of stock options are estimated using the Black-Scholes option-pricing model. These options expire years after the date of grant. There were no stock option awards granted for the years ended December 31, 2023 and 2021.
| $ | | | | | |
| Exercised | () | | | | | |
| Forfeited | () | | | | | |
| Outstanding at December 31, 2021 | | | $ | | | | $ | | |
| Granted | | | | | | |
|
|
| Outstanding at December 31, 2022 | | | $ | | | | $ | | |
|
|
|
| Outstanding at December 31, 2023 | | | $ | | | | $ | | |
| Exercisable at December 31, 2023 | | | $ | | | | $ | | |
There were no stock options exercised in 2023 and 2022. The net cash proceeds from the exercise of stock options for the year ended December 31, 2021 was $ million. The total pre-tax intrinsic value of stock options exercised was $ million for the year ended December 31, 2021.
million and represents the difference between our closing stock price on December 31, 2023 of $ and the exercise price, times the number of shares that would have been received by the option holder had the option holder exercised the stock options on that date. This amount can change based on the fair market value of our common stock. As of December 31, 2023 and 2022, million outstanding stock options were exercisable and the weighted-average exercise price was $.
ESPP
We have an ESPP under which approximately million shares of our common stock were available for future issuance as of December 31, 2023. Under our ESPP, employees may purchase shares having a value not exceeding % of their annual compensation, subject to applicable annual Internal Revenue Service limitations. We record compensation expense related to the % discount that is given to our employees.
| | | | | | | | Weighted-average price of shares purchased | | $ | | | | $ | | | | $ | | |
Compensation expense (in millions) | | $ | | | | $ | | | | $ | | |
12.
shares of our common stock were authorized, shares were issued and shares were outstanding. As of December 31, 2022, shares of our common stock were authorized, shares were issued and shares were outstanding. The holders of common stock are entitled to vote per share, except that our certificate of incorporation limits the ability of any shareholder to vote in excess of % of the then-outstanding shares of Nasdaq common stock.
shares of common stock in treasury as of December 31, 2023 and shares as of December 31, 2022, most of which are related to shares of our common stock withheld for the settlement of employee tax withholding obligations arising from the vesting of restricted stock and PSUs. Share Repurchase Program
In September 2023, our board of directors authorized an increase to our share repurchase program, bringing the aggregate authorized amount to $ billion. As of December 31, 2023, the remaining aggregate authorized amount under the existing share repurchase program was $ billion.
These repurchases may be made from time to time at prevailing market prices in open market purchases, privately-negotiated transactions, block purchase techniques, an accelerated share repurchase program or otherwise, as determined by our management. The repurchases are primarily funded from existing cash balances. The share repurchase program may be suspended, modified or discontinued at any time, and has no defined expiration date.
| Average price paid per share | | $ | | |
Total purchase price (in millions) | | $ | | | In the table above, the number of shares of common stock repurchased excludes an aggregate of shares withheld to satisfy tax obligations of the grantee upon the vesting of restricted stock and PSUs for the year ended December 31, 2023.
As discussed above in “Common Stock in Treasury, at Cost,” shares repurchased under our share repurchase program are currently retired and cancelled.
Preferred Stock
Our certificate of incorporation authorizes the issuance of shares of preferred stock, par value $ per share, issuable from time to time in one or more series. As of December 31, 2023 and December 31, 2022, shares of preferred stock were issued or outstanding.
Cash Dividends on Common Stock
| | March 17, 2023 | | $ | | | | March 31, 2023 |
| April 18, 2023 | | | | | June 16, 2023 | | | | | June 30, 2023 |
| July 18, 2023 | | | | | September 15, 2023 | | | | | September 29, 2023 |
| October 17, 2023 | | | | | December 8, 2023 | | | | | December 22, 2023 |
| | | | | | $ | | | | |
The total amount paid of $ million was recorded in retained earnings within Nasdaq’s stockholders’ equity in the Consolidated Balance Sheets at December 31, 2023.
In January 2024, the board of directors approved a regular quarterly cash dividend of $ per share on our outstanding common stock. The dividend is payable on March 28, 2024 to shareholders of record at the close of business on March 14, 2024. The estimated aggregate payment of this dividend is $ million. Future declarations of quarterly dividends and the establishment of future record and payment dates are subject to approval by the board of directors.
The board of directors maintains a dividend policy with the intention to provide shareholders with regular and increasing dividends as earnings and cash flows increase.
13.
| | $ | | | | $ | | | | Denominator: | | | | | |
| Weighted-average common shares outstanding for basic earnings per share | | | | | | | | |
|
| Weighted-average effect of dilutive securities - Employee equity awards | | | | | | | | |
|
| Weighted-average common shares outstanding for diluted earnings per share | | | | | | | | |
| Basic and diluted earnings per share: |
| Basic earnings per share | $ | | | | $ | | | | $ | | |
| Diluted earnings per share | $ | | | | $ | | | | $ | | |
Securities that were included in the computation of diluted earnings per share because their effect was antidilutive were immaterial for the years ended December 31, 2023, 2022 and 2021.
14.
| | $ | | | | $ | | | | $ | | | | | | | State-owned enterprises and municipal securities | | | | | | | | | | | | | | | |
Swedish mortgage bonds | | | | | | | | | | | | | | | |
| | | | | | | | | | | |
| | | | | | | | | | | |
| | | | | | | | | | | |
| Total assets at fair value | $ | | | | $ | | | | $ | | | | $ | | | | | | |
| | | | | | | | | | | |
| December 31, 2022 | | | | |
| Total | | Level 1 | | Level 2 | | Level 3 | | | | |
| (in millions) | | | | |
European government debt securities | $ | | | | $ | | | | $ | | | | $ | | | | | | |
State-owned enterprises and municipal securities | | | | | | | | | | | | | | | |
Swedish mortgage bonds | | | | | | | | | | | | | | | |
Corporate debt securities | | | | | | | | | | | | | | | |
| | | | | | | | | | | |
| Total assets at fair value | $ | | | | $ | | | | $ | | | | $ | | | | | | |
| | | | | | | | | | | |
| | | | | | | | | | | |
| | | | | | | | | | | |
| | | | | | | | | | | |
| | | | | | | | | | | | Financial Instruments Not Measured at Fair Value on a Recurring Basis
Some of our financial instruments are not measured at fair value on a recurring basis but are recorded at amounts that approximate fair value due to their liquid or short-term nature. Such financial assets and financial liabilities include: cash and cash equivalents, restricted cash and cash equivalents, receivables, net, certain other current assets, accounts payable and accrued expenses, Section 31 fees payable to SEC, accrued personnel costs, commercial paper and certain other current liabilities.
We have certain investments, primarily our investment in OCC, which are accounted for under the equity method of accounting. We have elected the measurement alternative for the majority of our equity securities, which primarily represent various strategic investments made through our corporate venture program. See “Equity Method Investments,” and “Equity Securities,” of Note 6, “Investments,” for further discussion.
billion as of December 31, 2023 and $ billion as of December 31, 2022. The discounted cash flow analyses are based on borrowing rates currently available to us for debt with similar terms and maturities. Our commercial paper and our fixed rate and floating rate debt are categorized as Level 2 in the fair value hierarchy.
For further discussion of our debt obligations, see Note 9, “Debt Obligations.”
Non-Financial Assets Measured at Fair Value on a Non-Recurring Basis
Our non-financial assets, which include goodwill, intangible assets, and other long-lived assets, are not required to be carried at fair value on a recurring basis. Fair value measures of non-financial assets are primarily used in the impairment analysis of these assets. Any resulting asset impairment would require that the non-financial asset be recorded at its fair value. Nasdaq uses Level 3 inputs to measure the fair value of the above assets on a non-recurring basis. As of December 31, 2023 and December 31, 2022, there were non-financial assets measured at fair value on a non-recurring basis.
15.
Default Fund Contributions and Margin Deposits
| | $ | | | | $ | | |
| Margin deposits | | | | | | | | |
| Total | $ | | | | $ | | | | $ | | |
Of the total default fund contributions of $ million, Nasdaq Clearing can utilize $ million as capital resources in the event of a counterparty default. The remaining balance of $ million pertains to member posted surplus balances.
Our clearinghouse holds material amounts of clearing member cash deposits which are held or invested primarily to provide security of capital while minimizing credit, market and liquidity risks. While we seek to achieve a reasonable rate of return, we are primarily concerned with preservation of capital and managing the risks associated with these deposits.
to days and are secured with highly rated government securities and multilateral development banks. The carrying value of these securities approximates their fair value due to the short-term nature of the instruments and reverse repurchase agreements. million as of December 31, 2023 and $ million as of December 31, 2022, in accordance with its investment policy as follows: | | | | | | | | | | | |
| | December 31, 2023 | | December 31, 2022 |
| | (in millions) |
| Demand deposits | $ | | | | $ | | |
| Central bank certificates | | | | | |
| Restricted cash and cash equivalents | $ | | | | $ | | |
| European government debt securities | | | | | |
| Reverse repurchase agreements | | | | | |
|
| Multilateral development bank debt securities | | | | | |
| Investments | $ | | | | $ | | |
| Total | $ | | | | $ | | |
In the table above, the change from December 31, 2022 to December 31, 2023 includes currency translation adjustments of $ million for restricted cash and cash equivalents and $ million for investments.
For the years ended December 31, 2023, 2022 and 2021 investments related to default funds and margin deposits, net includes purchases of investment securities of $ million and $ million, and $ million respectively, and proceeds from sales and redemptions of investment securities of $ million, $ million and $ million respectively.
In the investment activity related to default fund and margin contributions, we are exposed to counterparty risk related to reverse repurchase agreement transactions, which reflect the risk that the counterparty might become insolvent and, thus, fail to meet its obligations to Nasdaq Clearing. We mitigate this risk by only engaging in transactions with high credit quality reverse repurchase agreement counterparties and by limiting the acceptable collateral under the reverse repurchase agreement to high quality issuers, primarily government securities and other securities explicitly guaranteed by a government. The value of the underlying security is monitored during the lifetime of the contract, and in the event the market value of the underlying security falls below the reverse repurchase amount, our clearinghouse may require additional collateral or a reset of the contract.
Default Fund Contributions
Required contributions to the default funds are proportional to the exposures of each clearing member. When a clearing member is active in more than one market, contributions must be made to all markets’ default funds in which the member is active. Clearing members’ eligible contributions may include cash and non-cash contributions. Cash contributions received are maintained in demand deposits held at central banks and large, highly rated financial institutions or invested by Nasdaq Clearing, in accordance with its investment policy, either in central bank certificates, highly rated government debt securities, reverse repurchase agreements with highly rated government debt securities as collateral, or multilateral development bank debt securities. Nasdaq Clearing maintains and manages all cash deposits related to margin collateral. All risks and rewards of collateral ownership, including interest, belong to Nasdaq Clearing. Clearing members’ cash contributions are included in default funds and margin deposits in the Consolidated Balance Sheets as both a current asset and a current liability. Non-cash contributions include highly rated government debt securities that must meet specific criteria approved by Nasdaq Clearing. Non-cash contributions are pledged assets that are not recorded in the Consolidated Balance Sheets as Nasdaq Clearing does not take legal ownership of these assets and the risks and rewards remain with the clearing members. These balances may fluctuate over time due to changes in the amount of deposits required and whether members choose to provide cash or non-cash contributions. Assets pledged are held at a nominee account in Nasdaq Clearing’s name for the benefit of the clearing members and are immediately accessible by Nasdaq Clearing in the event of a default.
million to the liability waterfall and overall regulatory capital, in the form of government debt securities, which are recorded as financial investments in the Consolidated Balance Sheets. The combined regulatory capital of the clearing members and Nasdaq Clearing is intended to secure the obligations of a clearing member exceeding such member’s own margin and default fund deposits and may be used to cover losses sustained by a clearing member in the event of a default.Margin Deposits
Nasdaq Clearing requires all clearing members to provide collateral, which may consist of cash and non-cash contributions, to guarantee performance on the clearing members’ open positions, or initial margin. In addition, clearing members must also provide collateral to cover the daily margin call if needed. See “Default Fund Contributions” above for further discussion of cash and non-cash contributions.
Similar to default fund contributions, Nasdaq Clearing maintains and manages all cash deposits related to margin collateral. All risks and rewards of collateral ownership, including interest, belong to Nasdaq Clearing and are recorded in revenues. These cash deposits are recorded in default funds and margin deposits in the Consolidated Balance Sheets as both a current asset and a current liability. Pledged margin collateral is not recorded in our Consolidated Balance Sheets as all risks and rewards of collateral ownership, including interest, belong to the counterparty. Assets pledged are held at a nominee account in Nasdaq Clearing’s name for the benefit of the clearing members and are immediately accessible by Nasdaq Clearing in the event of a default.
Nasdaq Clearing marks to market all outstanding contracts and requires payment from clearing members whose positions have lost value. The mark-to-market process helps identify any clearing members that may not be able to satisfy their financial obligations in a timely manner allowing Nasdaq Clearing the ability to mitigate the risk of a clearing member defaulting due to exceptionally large losses. In the event of a default, Nasdaq Clearing can access the defaulting member’s margin and default fund deposits to cover the defaulting member’s losses.
Regulatory Capital and Risk Management Calculations
Nasdaq Clearing manages risk through a comprehensive counterparty risk management framework, which comprises policies, procedures, standards and financial resources. The level of regulatory capital is determined in accordance with Nasdaq Clearing’s regulatory capital and default fund policy, as approved by the SFSA. Regulatory capital calculations are continuously updated through a proprietary capital-at-risk calculation model that establishes the appropriate level of capital.
As mentioned above, Nasdaq Clearing is the legal counterparty for each contract cleared and thereby guarantees the fulfillment of each contract. Nasdaq Clearing accounts for this guarantee as a performance guarantee. We determine the fair value of the performance guarantee by considering daily settlement of contracts and other margining and default fund requirements, the risk management program, historical evidence of default payments, and the estimated probability of potential default payouts. The calculation is determined using proprietary risk management software that simulates gains and losses based on historical market prices, extreme but plausible market scenarios, volatility and other factors present at that point in time for those particular unsettled contracts. Based on this analysis, excluding any liability related to the Nasdaq commodities clearing default (see discussion above), the estimated liability was nominal and liability was recorded as of December 31, 2023.
Power of Assessment
To further strengthen the contingent financial resources of the clearinghouse, Nasdaq Clearing has power of assessment that provides the ability to collect additional funds from its clearing members to cover a defaulting member’s remaining obligations up to the limits established under the terms of the clearinghouse rules. The power of assessment corresponds to % of the clearing member’s aggregate contribution to the financial, commodities and seafood markets’ default funds.
Liability Waterfall
The liability waterfall is the priority order in which the capital resources would be utilized in the event of a default where the defaulting clearing member’s collateral and default fund contribution would not be sufficient to cover the cost to settle its portfolio. If a default occurs and the defaulting clearing member’s collateral, including cash deposits and pledged assets, is depleted, then capital is utilized in the following amount and order:
•junior capital contributed by Nasdaq Clearing, which totaled $ million as of December 31, 2023;
•a loss-sharing pool related only to the financial market that is contributed to by clearing members and only applies if the defaulting member’s portfolio includes interest rate swap products;
million as of December 31, 2023.
If additional funds are needed after utilization of the liability waterfall, or if part of the waterfall has been utilized and needs to be replenished, then Nasdaq Clearing will utilize its power of assessment and additional capital contributions will be required by non-defaulting members up to the limits established under the terms of the clearinghouse rules.
During 2022, Nasdaq Clearing updated its recovery plan and rule book by introducing additional recovery tools, in line with the new European Union regulations for the recovery and resolution of central counterparties, which became effective during 2022.
In addition to the capital held to withstand counterparty defaults described above, Nasdaq Clearing also has committed capital of $ million to ensure that it can handle an orderly wind-down of its operation, and that it is adequately protected against investment, operational, legal, and business risks.
Market Value of Derivative Contracts Outstanding
| | Fixed-income options and futures | | |
| Stock options and futures | | |
| Index options and futures | | |
| Total | $ | | |
In the table above:
•We determined the fair value of our option contracts using standard valuation models that were based on market-based observable inputs including implied volatility, interest rates and the spot price of the underlying instrument.
•We determined the fair value of our futures contracts based upon quoted market prices and average quoted market yields.
•We determined the fair value of our forward contracts using standard valuation models that were based on market-based observable inputs including benchmark rates and the spot price of the underlying instrument.
| | | | | Fixed-income options and futures | | | | | |
| Stock options and futures | | | | | |
| Index options and futures | | | | | |
| Total | | | | | |
In the table above, the total volume in cleared power related to commodity contracts was Terawatt hours (TWh) and TWh for the years ended December 31, 2023 and 2022, respectively.
Resale and Repurchase Agreements Contracts Outstanding and Cleared
The outstanding contract value of resale and repurchase agreements was $ million and $ million as of December 31, 2023 and 2022, respectively. The total number of resale and repurchase agreements contracts cleared was and for the years ended December 31, 2023 and 2022, respectively.
16.
| | $ | | | | | | | | | |
| Liabilities: | | | | | | |
| Current lease liabilities | | Other current liabilities | | $ | | | | $ | | |
| Non-current lease liabilities | | Operating lease liabilities | | | | | | |
| Total lease liabilities | | | | $ | | | | $ | | |
| | $ | | | | $ | | | | | | | | | |
) | | () | | | () | |
| | | | $ | | | | $ | | | In the table above, operating lease costs include short-term lease cost, which was immaterial.
In the first quarter of 2023, we initiated a review of our real estate and facility capacity requirements due to our new and evolving work models. As a result of this ongoing review, for the year ended December 31, 2023, we recorded impairment charges of $ million, of which $ million related to operating lease asset impairment and is included in operating lease cost in the table above, $ million related to exit costs and is included in variable lease cost in the table above and $ million related to impairment of leasehold improvements, which are recorded in depreciation and amortization expense in the Consolidated Statements of Income. We fully impaired our lease assets for locations that we vacated with no intention to sublease. Substantially all of the property, equipment and leasehold improvements associated with the vacated leased office space were fully impaired as there are no expected future cash flows for these items.
|
2025 | | | |
2026 | | | |
2027 | | | |
2028 | | | |
2029+ | | | |
| Total lease payments | | | |
| Less: interest | | () | |
| Present value of lease liabilities | | $ | | |
In the table above, interest is calculated using the interest rate for each lease. Present value of lease liabilities includes the current portion of $ million.
Total lease payments in the table above exclude $ million of legally binding minimum lease payments for leases signed but not yet commenced.
| | |
| Weighted-average discount rate | | | % |
The following table provides supplemental cash flow information related to Nasdaq’s operating leases:
| | | | | | | | | | | | | | | | | |
| Year Ended December 31, |
| 2023 | | 2022 | | 2021 |
| (in millions) |
| Cash paid for amounts included in the measurement of operating lease liabilities | $ | | | | $ | | | | $ | | |
| | | | | |
| Lease assets obtained in exchange for operating lease liabilities | $ | | | | $ | | | | $ | | |
17.
| | $ | | | | $ | | | | Foreign | | | | | | | | |
| Income before income tax provision | $ | | | | $ | | | | $ | | |
Income Tax Provision
| | $ | | | | $ | | | | State | | | | | | | | |
| Foreign | | | | | | | | |
| Total current income taxes provision | | | | | | | | |
| Deferred income taxes provision (benefit): | | | | | |
| Federal | | | | | | | | |
| State | | | | | | | | |
| Foreign | | | | () | | | () | |
| Total deferred income taxes provision | | | | | | | | |
| Total income tax provision | $ | | | | $ | | | | $ | | |
% | | | % | | | % | | State income tax provision, net of federal effect | | % | | | % | | | % |
| Deduction for foreign derived intangible income | () | % | | () | % | | () | % |
| Excess tax benefits related to employee share-based compensation | () | % | | () | % | | () | % |
| Non-U.S. subsidiary earnings | | % | | | % | | | % |
| Tax credits and deductions | () | % | | () | % | | () | % |
| Change in unrecognized tax benefits | | % | | | % | | | % |
| Other, net | () | % | | () | % | | () | % |
| Actual income tax provision | | % | | | % | | | % |
The increase in our effective tax rate in 2023 compared to 2022 was primarily due to increased US tax on overseas earnings. The increase in our effective tax rate in 2022 compared to 2021 was primarily due to an increase in state unrecognized tax benefits.
The effective tax rate may vary from period to period depending on, among other factors, the geographic and business mix of earnings and losses. These same and other factors, including history of pre-tax earnings and losses, are taken into account in assessing the ability to realize deferred tax assets.
Deferred Income Taxes
| | $ | | | U.S. federal net operating loss | | | | | |
| Foreign net operating loss | | | | | |
| State net operating loss | | | | | |
| Compensation and benefits | | | | | |
Deferred interest expense | | | | | |
| Tax credits | | | | | |
Federal benefit of uncertain tax positions | | | | | |
| Operating lease liabilities | | | | | |
|
| Other | | | | | |
| Gross deferred tax assets | | | | | |
| Less: valuation allowance | () | | | () | |
| Total deferred tax assets, net of valuation allowance | $ | | | | $ | | |
| | | |
| Deferred tax liabilities: | | | |
| Amortization of software development costs and depreciation | $ | () | | | $ | () | |
| Amortization of acquired intangible assets and goodwill | () | | | () | |
| Investments | () | | | () | |
| Unrealized gains | () | | | () | |
| Operating lease assets | () | | | () | |
| Other | () | | | () | |
| Gross deferred tax liabilities | $ | () | | | $ | () | |
Net deferred tax liabilities | $ | () | | | $ | () | |
Reported as: | | | |
| Non-current deferred tax assets | $ | | | | $ | | |
Deferred tax liabilities, net | () | | | () | |
Net deferred tax liabilities | $ | () | | | $ | () | |
In the table above, non-current deferred tax assets are included in other non-current assets in the Consolidated Balance Sheets.
We recognized a valuation allowance of $ million as of December 31, 2023 and 2022 due to recurring operating losses in a foreign jurisdiction. Based on all available positive and negative evidence, we believe the sources of future taxable income are sufficient to realize the remainder of Nasdaq’s deferred tax asset inventory.
| 2039-2043 | |
U.S. state and local NOL | | | 2025-2042 |
Unrecognized Tax Benefits
| | $ | | | | $ | | | | Additions as a result of tax positions taken in prior periods | | | | | | | | |
| Additions as a result of tax positions taken in the current period | | | | | | | | |
| Reductions related to settlements with taxing authorities | () | | | () | | | () | |
| Reductions as a result of lapses of the applicable statute of limitations | () | | | () | | | () | |
| Ending balance | $ | | | | $ | | | | $ | | |
We had $ million of unrecognized tax benefits as of December 31, 2023, $ million as of December 31, 2022, and $ million as of December 31, 2021 which, if recognized in the future, would affect our effective tax rate. Nasdaq does not believe that our unrecognized tax benefits will materially change over the next 12 months.
We recognize interest and/or penalties related to income tax matters in the provision for income taxes in our Consolidated Statements of Income, which was $ million tax expense for the year ended December 31, 2023 and less than $ million for the year ended December 31, 2022 and $ million tax benefit for the year ended for December 31, 2021. Accrued interest and penalties, net of tax effect were $ million as of December 31, 2023 and $ million as of December 31, 2022.
Tax Audits
Nasdaq and its eligible subsidiaries file a consolidated U.S. federal income tax return and applicable state and local income tax returns and non-U.S. income tax returns. We are subject to examination by federal, state and local, and foreign tax authorities. Our Federal income tax return is under audit for tax year 2018 and is subject to examination by the Internal Revenue Service for the years 2020 through 2022. Several state tax returns are currently under examination by the respective tax authorities for the years 2014 through 2022. Non-U.S. tax returns are subject to examination by the respective tax authorities for the years 2018 through 2023. We regularly assess the likelihood of additional assessments by each jurisdiction and have established tax reserves that we believe are adequate in relation to the potential for additional assessments. Examination outcomes and the timing of
18.
million as of December 31, 2023 and 2022. As discussed in “Other Credit Facilities,” of Note 9, “Debt Obligations,” we also have credit facilities primarily related to our Nasdaq Clearing operations, which are available in multiple currencies, and totaled $ million as of December 31, 2023 and $ million as of December 31, 2022 in available liquidity, of which was utilized.
Other Guarantees
Through our clearing operations in the financial markets, Nasdaq Clearing is the legal counterparty for, and guarantees the performance of, its clearing members. See Note 15, “Clearing Operations,” for further discussion of Nasdaq Clearing performance guarantees.
We have provided a guarantee related to lease obligations for The Nasdaq Entrepreneurial Center, Inc., which is a not-for-profit organization designed to convene, connect and engage aspiring and current entrepreneurs. This entity is not included in the consolidated financial statements of Nasdaq.
We believe that the potential for us to be required to make payments under these arrangements is unlikely. Accordingly, no contingent liability is recorded in the Consolidated Balance Sheets for the above guarantees.
Routing Brokerage Activities
One of our broker-dealer subsidiaries, Nasdaq Execution Services, provides a guarantee to securities clearinghouses and exchanges under its standard membership agreements, which require members to guarantee the performance of other members. If a member becomes unable to satisfy its obligations to a clearinghouse or exchange, other members would be required to meet its shortfalls. To mitigate these performance risks, the exchanges and clearinghouses often require members to post collateral, as well as meet certain minimum financial standards. Nasdaq Execution Services’ maximum potential liability under these arrangements cannot be quantified. However, we believe that the potential for Nasdaq Execution Services to be required to make payments under these arrangements is unlikely. Accordingly, no contingent liability is recorded in the Consolidated Balance Sheets for these arrangements.
listed companies, breached its obligation under certain provisions of the Market Abuse Regulation and the Swedish Securities Market Act. In January 2024, the SFSA notified Nasdaq Stockholm AB that the review will continue, and in February the SFSA sent a request for submission to Nasdaq for our review and response. Nasdaq Stockholm AB is cooperating fully and is engaged in ongoing communications with the SFSA.Other Matters
Except as disclosed above and in our prior reports filed under the Exchange Act, we are not currently a party to any litigation or proceeding that we believe could have a material adverse effect on our business, consolidated financial condition, or operating results. However, from time to time, we have been threatened with, or named as a defendant in, lawsuits or involved in regulatory proceedings.
In the normal course of business, Nasdaq discusses matters with its regulators raised during regulatory examinations or otherwise subject to their inquiries. Management believes that censures, fines, penalties or other sanctions that could result from any ongoing examinations or inquiries will not have a material impact on its consolidated financial position or results of operations. However, we are unable to predict the outcome or the timing of the ultimate resolution of these matters, or the potential fines, penalties or injunctive or other equitable relief, if any, that may result from these matters.
Related to the legal and regulatory matters described above we have recorded immaterial legal accruals during the year ended 2023.
19.
business segments: Market Platforms, Capital Access Platforms and Anti-Financial Crime. After the closing of the Adenza acquisition, we realigned our reportable segments to Capital Access Platforms, Financial Technology and Market Services. See Note 1, “Organization and Nature of Operations,” for further discussion of our reportable segments.
This Annual Report on Form 10-K presents our results in alignment with the new corporate structure. All periods presented are restated to reflect the new structure.
Our management allocates resources, assesses performance and manages these businesses as separate segments. We evaluate the performance of our segments based on several factors, of which the primary financial measure is operating income. Results of individual businesses are presented based on our management accounting practices and structure. Our chief operating decision maker does not review total assets or statements of income below operating income by segments as key performance metrics; therefore, such information is not presented below.
| | $ | | | | $ | | | | Depreciation and amortization* | | | | | | | | |
| Operating income | | | | | | | | |
| Purchase of property and equipment | | | | | | | | |
| Financial Technology | | | | | |
| Total revenues | | | | | | | | |
| Depreciation and amortization* | | | | | | | | |
| Operating income | | | | | | | | |
| Purchase of property and equipment | | | | | | | | |
Market Services | | | | | |
| Total revenues | | | | | | | | |
| Transaction-based expenses | () | | | () | | | () | |
| Revenues less transaction-based expenses | | | | | | | | |
| Depreciation and amortization* | | | | | | | | |
| Operating income | | | | | | | | |
| Purchase of property and equipment | | | | | | | | |
| Corporate Items | | | | | |
| Total revenues | | | | | | | | |
| Depreciation and amortization | | | | | | | | |
| Operating loss | () | | | () | | | () | |
| | | | | |
| Consolidated | | | | | |
| Total revenues | $ | | | | $ | | | | $ | | |
| Transaction-based expenses | () | | | () | | | () | |
| Revenues less transaction-based expenses | $ | | | | $ | | | | $ | | |
| Depreciation and amortization | $ | | | | $ | | | | $ | | |
| Operating income | $ | | | | $ | | | | $ | | |
| Purchase of property and equipment | $ | | | | $ | | | | $ | | |
| Expenses: | | | | | |
| Amortization expense of acquired intangible assets | | | | | | | | |
| Merger and strategic initiatives expense | | | | | | | | |
| Restructuring charges | | | | | | | | |
| Lease asset impairments | | | | | | | | |
Legal and regulatory matters | | | | | | | | |
| Extinguishment of debt | | | | | | | | |
Pension Settlement | | | | | | | | |
| Expenses - divested businesses | | | | | | | | |
| Other | | | | | | | () | |
| Total expenses | | | | | | | | |
| Operating loss | $ | () | | | $ | () | | | $ | () | |
| | $ | | | All other countries | | | | | |
| Total | $ | | | | $ | | |
| 2022: | | | |
| United States | $ | | | | $ | | |
All other countries | | | | | |
| Total | $ | | | | $ | | |
2021: | | | |
| United States | $ | | | | $ | | |
All other countries | | | | | |
| Total | $ | | | | $ | | |
Property and equipment, net for all other countries primarily includes assets held in Sweden. No single customer accounted for 10.0% or more of our revenues in 2023, 2022 and 2021.
20.
million in pre-tax charges principally related to employee-related costs, contract terminations, real estate impairments and other related costs. We expect to achieve benefits primarily in the form of expense and revenue synergies. Costs related to the 2023 Adenza Restructuring program will be recorded as restructuring charges in the Consolidated Statements of Income.
In October 2022, following our September 2022 announcement to realign our segments and leadership, we initiated a divisional alignment program with a focus on realizing the full potential of this structure. In connection with the program, we expect to incur $ million to $ million in pre-tax charges principally related to employee-related costs, consulting, asset impairments and contract terminations over a period. Costs related to the divisional alignment program will be recorded as restructuring charges in the Consolidated Statements of Income.
In September 2019, we initiated the transition of certain technology platforms to advance the Company’s strategic opportunities as a technology and analytics provider and continue the realignment of certain business areas. In connection with these restructuring efforts, we retired certain elements of our market infrastructure and technology product offerings as we implemented Nasdaq Financial Framework and other technologies internally and externally. This represented a fundamental shift in our strategy and technology as well as executive realignment. In June 2021, we completed our 2019 restructuring plan and recognized total pre-tax charges of $ million over a two-year period. Total pre-tax charges related primarily to non-cash items such as asset impairments and accelerated depreciation, and third-party consulting costs. Severance and employee-related charges were also incurred.
| | $ | | | | $ | | | 2019 program | | | | | | | | |
| Consulting services | | | | | |
Adenza restructuring | | | | | | | | |
Divisional realignment | | | | | | | | |
| 2019 program | | | | | | | | |
| Employee-related costs | | | | | — | |
Adenza restructuring | | | | | | | | |
Divisional realignment | | | | | | | | |
| 2019 program | | | | | | | | |
| Other | — | | | — | | | — | |
Adenza restructuring | | | | | | | | |
Divisional realignment | | | | | | | | |
| 2019 program | | | | | | | | |
| Total restructuring charges | $ | | | | $ | | | | $ | | |
| | | | | |
| Total Program Costs Incurred | | |
Adenza restructuring | $ | | | | | | |
Divisional realignment | $ | | | | | | |
| 2019 program | $ | | | | | | |

Similar companies
See also CME GROUP INC. -
Annual report 2022 (10-K 2022-12-31)
Annual report 2023 (10-Q 2023-09-30)
See also Intercontinental Exchange, Inc. -
Annual report 2022 (10-K/A 2022-12-31)
Annual report 2023 (10-Q 2023-09-30)
See also LPL Financial Holdings Inc. -
Annual report 2022 (10-K 2022-12-31)
Annual report 2023 (10-Q 2023-09-30)
See also Tradeweb Markets Inc. -
Annual report 2022 (10-K 2022-12-31)
Annual report 2023 (10-Q 2023-09-30)
See also Cboe Global Markets, Inc. -
Annual report 2022 (10-K 2022-12-31)
Annual report 2023 (10-Q 2023-09-30)