|
-25-
| | | | | |
| ITEM 5. | MARKET FOR OWENS CORNING’S COMMON EQUITY, RELATED STOCKHOLDER MATTERS AND ISSUER PURCHASES OF EQUITY SECURITIES (continued)
|
Performance Graph
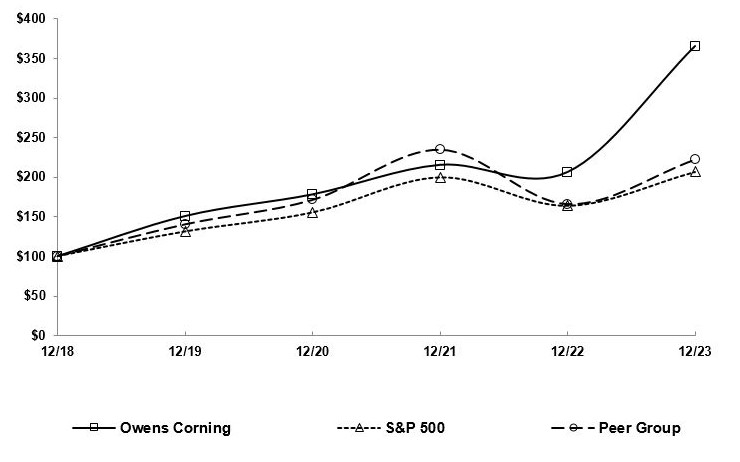
The annual changes for the five-year period shown in the graph on this page are based on the assumption that $100 had been invested in Owens Corning (OC) stock, the Standard & Poor’s 500 Stock Index (“S&P 500”), and a peer group index on December 31, 2018, and that all quarterly dividends were reinvested. The total cumulative dollar returns shown on the graph represent the value that such investments would have had on December 31, 2023. We chose to use a self-selected peer group consisting of the companies noted below to include in the performance graph as we believe this peer group aligns with our specific industry, markets, and global exposure. The criteria used in determining this peer group included the size of the companies (measured in terms of annual revenue and market capitalization), industries and geographies in which the companies operate, stock price correlation and volatility relative to Owens Corning, and increased representation of comparator companies used by shareholder advisory firms.
Performance Graph
| | | | | | | | | | | | | | | | | | | | | | | | | | | | | | | | | | | |
| 2018 | | 2019 | | 2020 | | 2021 | | 2022 | | 2023 |
| OC | $ | 100 | | | $ | 151 | | | $ | 178 | | | $ | 215 | | | $ | 206 | | | $ | 365 | |
| S&P 500 | $ | 100 | | | $ | 131 | | | $ | 156 | | | $ | 200 | | | $ | 164 | | | $ | 207 | |
| | | | | | | | |
| Peer Group | $ | 100 | | | $ | 140 | | | $ | 171 | | | $ | 235 | | | $ | 166 | | | $ | 222 | |
The peer group index is comprised of the following companies: A.O. Smith Corporation; Advance Drainage Systems, Inc.; Allegion plc; Armstrong World Industries, Inc.; Ball Corporation; Builders FirstSource, Inc.; Carlisle Companies Incorporated; Carrier Global Corporation; Celanese Corporation; Eastman Chemical Company; Fortune Brands Innovations, Inc.; Greif, Inc.; JELD-WEN Holding, Inc.; Johnson Controls International plc; Lennox International Inc.; Louisiana-Pacific Corporation; Masco Corporation; Masonite International Corporation; Mohawk Industries, Inc.; O-I Glass, Inc.; PPG Industries, Inc.; Resideo Technologies, Inc.; RPM International Inc.; Stanley Black & Decker, Inc.; The Sherwin-Williams Company; Trane Technologies; Trex Company, Inc.; and UFP Industries, Inc.
-26-
| | | | | |
| ITEM 7. | MANAGEMENT’S DISCUSSION AND ANALYSIS OF FINANCIAL CONDITION AND RESULTS OF OPERATIONS |
This Management’s Discussion and Analysis (“MD&A”) is intended to help investors understand Owens Corning, our operations and our present business environment. MD&A is provided as a supplement to, and should be read in conjunction with, our Consolidated Financial Statements and the accompanying Notes thereto contained in this report. Unless the context requires otherwise, the terms “Owens Corning,” “Company,” “we,” “its,” and “our” in this Annual Report on Form 10-K refer to Owens Corning and its subsidiaries.
This section of this Annual Report on Form 10-K generally discusses 2023 and 2022 items and year-to-year comparisons between 2023 and 2022. Discussions of 2021 items and year-to-year comparisons between 2022 and 2021 that are not included in this Form 10-K can be found in “Management's Discussion and Analysis of Financial Condition and Results of Operations” in Part II, Item 7 of the Company's Annual Report on Form 10-K for the fiscal year ended December 31, 2022.
GENERAL
Owens Corning is a global building and construction materials leader committed to building a sustainable future through material innovation. The Company has three reporting segments: Roofing, Insulation and Composites. Through these lines of business, the Company manufactures and sells products worldwide. We are a market leader in many of our major product categories.
EXECUTIVE OVERVIEW
Net earnings attributable to Owens Corning were $1,196 million in 2023, compared to $1,241 million in 2022. The Company generated $1,805 million in adjusted earnings before interest and taxes (“Adjusted EBIT”) in 2023 compared to $1,762 million in 2022. See the Adjusted Earnings Before Interest and Taxes paragraph of the MD&A for further information regarding Adjusted EBIT, including the reconciliation to net earnings attributable to Owens Corning. Segment earnings before interest and taxes (“EBIT”) performance compared to 2022 increased $343 million in our Roofing segment, increased $7 million in our Insulation segment and decreased $256 million in our Composites segment. Within our Corporate, Other and Eliminations category, General corporate expenses and other increased by $51 million.
Cash and cash equivalents were $1.6 billion as of December 31, 2023, compared to $1.1 billion as of December 31, 2022. In 2023, the Company's operating activities provided $1,719 million of cash flow, compared to $1,760 million in 2022.
On February 8, 2024, the Company entered into a definitive agreement to purchase all of the outstanding shares of Masonite. The purchase price for the acquisition of Masonite is approximately $3.9 billion in cash, which we expect to fund with cash on hand and new committed financing. Masonite is a leading global designer, manufacturer, marketer and distributor of interior and exterior doors and door systems for the new construction and repair, renovation and remodeling sectors of the residential and non-residential building construction markets. The transaction was unanimously approved by the board of directors of both companies and is expected to close mid-2024, subject to regulatory and other customary closing conditions, including the approval of Masonite shareholders.
On February 9, 2024, the Company announced the decision to review strategic alternatives for its global glass reinforcements (“GR”) business, consistent with our strategy to focus on building and construction materials. The GR business, which operates within our Composites segment, supplies a wide variety of glass fiber products for applications in wind energy, infrastructure, industrial, transportation, and consumer markets. The GR business generates annual revenues of approximately $1.3 billion and has operations in 11 countries, with 18 manufacturing facilities. While a range of options are under consideration, including a potential sale, spin-off or other strategic option, there can be no assurance that the strategic review will result in any transaction or other outcome.
In the fourth quarter of 2023, the Company entered into two agreements to purchase non-participating annuity contracts from insurance companies to transfer $291 million of the Company's outstanding pension projected benefit obligations related to certain U.S. and non-U.S. pension plans. These transactions were funded with pension plan assets of $268 million. As a result of these transactions, the Company recognized a pre-tax settlement charge of $145 million in the fourth quarter of 2023 from the accelerated recognition of a pro rata portion of plan actuarial losses. This charge was recorded in Non-operating expense (income), net on the Consolidated Statements of Earnings. These transactions did not have a material effect on the plans' funded statuses.
-27-
| | | | | |
| ITEM 7. | MANAGEMENT’S DISCUSSION AND ANALYSIS OF FINANCIAL CONDITION AND RESULTS OF OPERATIONS (continued) |
During the second quarter of 2023, the Company’s subsidiary, Paroc Group OY (“Paroc”), which the Company acquired in 2018, notified the appropriate European maritime regulatory authorities that specific products in its marine insulation product line may not meet certain fire safety requirements in accordance with their certifications. Paroc voluntarily withdrew these specific products from the market, issued recalls, and suspended distribution and sales of these products. Paroc continues to cooperate with the applicable regulatory and government authorities and work with its customers and end-users to assist with remediation. During 2023, the Company established an estimated liability for expected future costs related to the marine recall on our Consolidated Balance Sheet as of December 31, 2023.
As part of its review of the Paroc insulation product portfolio, the Company discovered potential nonconformances relating to certain ventilation duct insulation products. In January 2024, Paroc suspended sales of the affected insulation products as a precautionary measure while it reviews the potential nonconformances. The Company is continuing its review.
In May 2023, the Company made the decision to exit the Protective Packaging business within the Roofing segment, including the production and sale of wood packaging, metal packaging and custom products. Exiting Protective Packaging will allow the Company to focus resources on the growth of its building materials products, which supports the future growth aspirations of the enterprise. With the exit of the Protective Packaging business, the Company closed its plants in Dorval, Quebec and Mission, British Columbia, Canada. The Company also ceased operations at its Qingdao, China facility. In connection with the exit of the Protective Packaging business, the Company estimates that it will incur cash charges of approximately $15 million, primarily related to severance and other exit costs. Additionally, the Company expects to incur total non-cash charges in the range of $70 to $75 million, primarily related to accelerated depreciation of property, plant and equipment and accelerated amortization of definite-lived intangibles. The Company has exited the majority of the business and expects to generate savings of approximately $7 million annually beginning 2024. During the twelve months ended 2023, the Company recorded $78 million of charges, primarily related to accelerated depreciation, accelerated amortization and severance.
In March 2023, the Company finalized the sale of its Insulation site in Santa Clara, California for total proceeds of $234 million, net of transaction fees. Total proceeds included a non-refundable deposit of $50 million received in the third quarter 2021. As a result, the Company recognized a pre-tax gain of $189 million in the first quarter of 2023, which is recorded in Gain on sale of site on the Consolidated Statements of Earnings.
In 2023, the Company repurchased 5.4 million shares of the Company’s common stock for $629 million, inclusive of applicable taxes, under previously announced repurchase authorizations. As of December 31, 2023, 8.9 million shares remained available for repurchase under the repurchase authorizations.
-28-
| | | | | |
| ITEM 7. | MANAGEMENT’S DISCUSSION AND ANALYSIS OF FINANCIAL CONDITION AND RESULTS OF OPERATIONS (continued) |
RESULTS OF OPERATIONS
Consolidated Results (in millions) | | | | | | | | | | | | | | | | | |
| | Twelve Months Ended December 31, |
| | 2023 | | 2022 | | 2021 |
| Net sales | $ | 9,677 | | | $ | 9,761 | | | $ | 8,498 | |
| Gross margin | $ | 2,683 | | | $ | 2,616 | | | $ | 2,217 | |
| % of net sales | 28 | % | | 27 | % | | 26 | % |
| Marketing and administrative expenses | $ | 831 | | | $ | 803 | | | $ | 757 | |
| | |
| Gain on equity method investment | $ | — | | | $ | (130) | | | $ | — | |
| Gain on sale of site | $ | (189) | | | $ | — | | | $ | — | |
| Other expense (income), net | $ | 106 | | | $ | 123 | | | $ | (69) | |
| Non-operating expense (income), net | $ | 145 | | | $ | (9) | | | $ | (10) | |
| Earnings before interest and taxes | $ | 1,667 | | | $ | 1,723 | | | $ | 1,448 | |
| Interest expense, net | $ | 76 | | | $ | 109 | | | $ | 126 | |
| Loss on extinguishment of debt | $ | — | | | $ | — | | | $ | 9 | |
| Income tax expense | $ | 401 | | | $ | 373 | | | $ | 319 | |
| Net earnings attributable to Owens Corning | $ | 1,196 | | | $ | 1,241 | | | $ | 995 | |
The Consolidated Results discussion below provides a summary of our results and the trends affecting our business, and should be read in conjunction with the more detailed Segment Results discussion that follows.
NET SALES
Net sales decreased $84 million in 2023 compared to 2022. The decrease in net sales was driven by lower sales volumes in both Insulation and Composites segments, partially offset by higher selling prices across all three segments. The remaining variance was driven by favorable customer mix, which was partially offset by the unfavorable net impact of acquisitions and divestitures.
GROSS MARGIN
Gross margin increased $67 million in 2023 compared to 2022. The increase in gross margin was driven by higher selling prices across all three segments, which was partially offset by lower sales volumes in both Insulation and Composites segments and higher production downtime. Favorable delivery and favorable customer and product mix more than offset higher input costs and the unfavorable net impact of acquisitions and divestitures.
MARKETING AND ADMINISTRATIVE EXPENSES
Marketing and administrative expenses increased $28 million in 2023 compared to 2022. The increase was driven primarily by ongoing inflationary pressures, as well as higher general corporate expenses.
GAIN ON EQUITY METHOD INVESTMENT
In 2022, the Company recognized a non-cash gain of $130 million from the remeasurement of the previously held equity method investment in Fiberteq, LLC upon the Company’s acquisition of the remaining 50% of the joint venture with IKO.
GAIN ON SALE OF SITE
In the first quarter of 2023, the Company finalized the sale of the Company's Insulation site in Santa Clara, California resulting in the recognition of a pre-tax gain of $189 million.
-29-
| | | | | |
| ITEM 7. | MANAGEMENT’S DISCUSSION AND ANALYSIS OF FINANCIAL CONDITION AND RESULTS OF OPERATIONS (continued) |
OTHER EXPENSE (INCOME), NET
Other expense (income), net decreased $17 million in 2023 compared to 2022. Higher restructuring costs, lower gains on the sale of precious metals and the establishment of the estimated liability for the Paroc marine recall matter in 2023 were more than offset by the favorable comparison year-over-year to indefinite-lived intangible asset impairment charges of $96 million and the net loss from divestiture related activities.
NON-OPERATING EXPENSE (INCOME), NET
Non-operating expense (income), net increased $154 million in 2023 compared to 2022. The increase was driven by the pension settlement loss in the fourth quarter of 2023.
INTEREST EXPENSE, NET
Interest expense, net decreased $33 million in 2023 compared to 2022. The decrease was driven by higher interest income related to the increase in cash and interest rates, as well as higher capitalized interest resulting from higher construction in progress balances.
INCOME TAX EXPENSE
Income tax expense for 2023 was $401 million compared to $373 million in 2022. The Company’s effective tax rate for 2023 was 25% on pre-tax income of $1,591 million. The difference between the 25% effective tax rate and the U.S. federal statutory tax rate of 21% is primarily due to U.S. state and local income tax expense.
The Company’s effective tax rate for 2022 was 23% on pre-tax income of $1,614 million. The difference between the 23% effective tax rate and the U.S. federal statutory tax rate of 21% is primarily attributable to U.S. state and local income tax expense, adjustments to R&D tax credits, and other adjustments.
See Note 20 for additional information.
-30-
| | | | | |
| ITEM 7. | MANAGEMENT’S DISCUSSION AND ANALYSIS OF FINANCIAL CONDITION AND RESULTS OF OPERATIONS (continued) |
Restructuring, Acquisition and Divestiture-Related Costs
The Company has incurred restructuring, transaction and integration costs related to acquisitions and divestitures, along with restructuring and other exit costs in connection with its global cost reduction, product line and productivity initiatives and growth strategy. These costs are recorded within Corporate, Other and Eliminations. Please refer to Note 12 of the Consolidated Financial Statements for further information on the nature of these costs.
The following table presents the impact and respective location of total restructuring, acquisition and divestiture-related costs on the Consolidated Statements of Earnings (in millions): | | | | | | | | | | | | | | | | | | | | | | | |
| | | | Twelve Months Ended December 31, |
| Location | | 2023 | | 2022 | | 2021 |
| Restructuring costs | Cost of sales | | $ | (102) | | | $ | (42) | | | $ | (14) | |
| Restructuring costs | Marketing and administrative expenses | | (2) | | | — | | | (2) | |
| Severance | Other expense (income), net | | (34) | | | (1) | | | (11) | |
| Other exit costs | Other expense (income), net | | (31) | | | (5) | | | (5) | |
| Gain on sale of land in India | Other expense (income), net | | — | | | — | | | 15 | |
| Restructuring costs | Non-operating (income) expense | | — | | | — | | | (2) | |
| | | | |
| | | | |
| Recognition of acquisition inventory fair value step-up | Cost of sales | | — | | | — | | | (1) | |
| Acquisition and divestiture-related costs | Marketing and administrative expenses | | — | | | (7) | | | — | |
| | | | |
| Gain on sale of Santa Clara, California site | Gain on sale of site | | 189 | | | — | | | — | |
| Gain on sale of Shanghai, China facility | Other expense (income), net | | — | | | 27 | | | — | |
| Loss on sale of Chambery, France DUCS business | Other expense (income), net | | — | | | (30) | | | — | |
| Gain on remeasurement of Fiberteq equity investment | Gain on equity method investment | | — | | | 130 | | | — | |
| Loss on sale of Russian operations | Other expense (income), net | | — | | | (33) | | | — | |
| Total restructuring, acquisition and divestiture-related gains (costs) | | | $ | 20 | | | $ | 39 | | | $ | (20) | |
-31-
| | | | | |
| ITEM 7. | MANAGEMENT’S DISCUSSION AND ANALYSIS OF FINANCIAL CONDITION AND RESULTS OF OPERATIONS (continued) |
Adjusted Earnings Before Interest and Taxes (“Adjusted EBIT”)
Adjusted EBIT is a non-GAAP measure that excludes certain items that management does not allocate to our segment results because it believes they are not representative of the Company’s ongoing operations. Adjusted EBIT is used internally by the Company for various purposes, including reporting results of operations to the Board of Directors of the Company, analysis of performance and related employee compensation measures. Although management believes that these adjustments result in a measure that provides a useful representation of our operational performance, the adjusted measure should not be considered in isolation or as a substitute for Net earnings (loss) attributable to Owens Corning as prepared in accordance with accounting principles generally accepted in the United States.
Adjusting (expense) income items to EBIT are shown in the table below (in millions): | | | | | | | | | | | | | | | | | |
| | Twelve Months Ended December 31, |
| | 2023 | | 2022 | | 2021 |
| Restructuring costs | $ | (169) | | | $ | (48) | | | $ | (34) | |
| Gain on sale of land in India | — | | | — | | | 15 | |
| Gains on sale of certain precious metals | 2 | | | 18 | | | 53 | |
| | |
| Intangible assets impairment charge | — | | | (96) | | | — | |
| | |
| Recognition of acquisition inventory fair value step-up | — | | | — | | | (1) | |
| | |
| | |
| | |
| | |
| | |
| Pension settlement losses | (145) | | | — | | | — | |
| | |
| Acquisition and divestiture-related costs | — | | | (7) | | | — | |
| | |
| Gain on sale of Santa Clara, California site | 189 | | | — | | | — | |
| Gain on sale of Shanghai, China facility | — | | | 27 | | | — | |
| Gain on remeasurement of Fiberteq equity investment | — | | | 130 | | | — | |
| Paroc marine recall | (15) | | | — | | | — | |
| Loss on sale of Chambery, France DUCS business | — | | | (30) | | | — | |
| Loss on sale of Russian operations | — | | | (33) | | | — | |
| Total adjusting items | $ | (138) | | | $ | (39) | | | $ | 33 | |
The reconciliation from Net earnings (loss) attributable to Owens Corning to EBIT and Adjusted EBIT is shown in the table below (in millions): | | | | | | | | | | | | | | | | | |
| | Twelve Months Ended December 31, |
| | 2023 | | 2022 | | 2021 |
| NET EARNINGS ATTRIBUTABLE TO OWENS CORNING | $ | 1,196 | | | $ | 1,241 | | | $ | 995 | |
| Net loss attributable to non-redeemable and redeemable noncontrolling interests | (3) | | | — | | | — | |
| NET EARNINGS | 1,193 | | | 1,241 | | | 995 | |
| Equity in net earnings of affiliates | 3 | | | — | | | 1 | |
| Income tax expense | 401 | | | 373 | | | 319 | |
| EARNINGS BEFORE TAXES | 1,591 | | | 1,614 | | | 1,313 | |
| Interest expense, net | 76 | | | 109 | | | 126 | |
| Loss on extinguishment of debt | — | | | — | | | 9 | |
| EARNINGS BEFORE INTEREST AND TAXES | 1,667 | | | 1,723 | | | 1,448 | |
| Less: Adjusting items from above | (138) | | | (39) | | | 33 | |
| ADJUSTED EBIT | $ | 1,805 | | | $ | 1,762 | | | $ | 1,415 | |
-32-
| | | | | |
| ITEM 7. | MANAGEMENT’S DISCUSSION AND ANALYSIS OF FINANCIAL CONDITION AND RESULTS OF OPERATIONS (continued) |
Segment Results
EBIT by segment consists of net sales less related costs and expenses and is presented on a basis that is used internally for evaluating segment performance. Certain items, such as general corporate expenses or income and certain other expense or income items, are excluded from the internal evaluation of segment performance. Accordingly, these items are not reflected in EBIT for our reportable segments and are included in the Corporate, Other and Eliminations category, which is presented following the discussion of our reportable segments.
Earnings before interest, taxes, depreciation and amortization (“EBITDA”) by segment is a non-GAAP measure that consists of EBIT plus depreciation and amortization. Segment EBITDA is used internally by the Company for analysis of our performance.
Roofing
The table below provides a summary of net sales, EBIT, depreciation and amortization expense, and EBITDA for the Roofing segment (in millions): | | | | | | | | | | | | | | | | | |
| | Twelve Months Ended December 31, |
| | 2023 | | 2022 | | 2021 |
| Net sales | $ | 4,030 | | | $ | 3,658 | | | $ | 3,209 | |
| % change from prior year | 10 | % | | 14 | % | | 19 | % |
| EBIT | $ | 1,174 | | | $ | 831 | | | $ | 753 | |
| EBIT as a % of net sales | 29 | % | | 23 | % | | 23 | % |
| Depreciation and amortization expense | $ | 64 | | | $ | 62 | | | $ | 59 | |
| EBITDA | $ | 1,238 | | | $ | 893 | | | $ | 812 | |
| EBITDA as a % of net sales | 31 | % | | 24 | % | | 25 | % |
NET SALES
In our Roofing segment, net sales increased $372 million in 2023 compared to 2022 due to higher sales volumes of approximately 5% and higher selling prices of $166 million. Favorable product and customer mix were partially offset by lower third-party asphalt sales of $44 million.
EBIT
In our Roofing segment, EBIT increased $343 million in 2023 compared to 2022 driven primarily by higher selling prices of $166 million. The remaining improvement was driven by favorable input costs and delivery of $80 million, higher sales volumes, and favorable customer and product mix of $48 million, which were partially offset by higher selling, general and administrative expenses and $8 million of higher production costs.
OUTLOOK
In our Roofing segment, the Company expects North American new residential construction market to temporarily remain soft. Other uncertainties that may impact Roofing demand include demand from storms and other weather-related events, demand from repair and remodeling activity, competitive pricing pressure and the cost and availability of raw materials, particularly asphalt. The Company will continue to focus on managing costs, capital expenditures and working capital.
-33-
| | | | | |
| ITEM 7. | MANAGEMENT’S DISCUSSION AND ANALYSIS OF FINANCIAL CONDITION AND RESULTS OF OPERATIONS (continued) |
Insulation
The table below provides a summary of net sales, EBIT, depreciation and amortization expense and EBITDA for the Insulation segment (in millions): | | | | | | | | | | | | | | | | | |
| | Twelve Months Ended December 31, |
| | 2023 | | 2022 | | 2021 |
| Net sales | $ | 3,668 | | | $ | 3,714 | | | $ | 3,184 | |
| % change from prior year | -1 | % | | 17 | % | | 22 | % |
| EBIT | $ | 619 | | | $ | 612 | | | $ | 446 | |
| EBIT as a % of net sales | 17 | % | | 16 | % | | 14 | % |
| Depreciation and amortization expense | $ | 210 | | | $ | 206 | | | $ | 208 | |
| EBITDA | $ | 829 | | | $ | 818 | | | $ | 654 | |
| EBITDA as a % of net sales | 23 | % | | 22 | % | | 21 | % |
NET SALES
In our Insulation segment, 2023 net sales decreased $46 million compared to 2022. The decrease was driven by lower sales volumes of approximately 10%, which more than offset higher selling prices of $245 million and favorable customer and product mix. The favorable net impact of acquisitions and divestitures and $5 million of favorable impact of translating sales denominated in foreign currencies into United States dollars also contributed to the offset of decreased volumes.
EBIT
In our Insulation segment, EBIT increased $7 million in 2023 compared to 2022. Higher selling prices of $245 million more than offset lower sales volumes and $57 million of input cost inflation. Higher manufacturing costs of $29 million and higher production downtime were partially offset by favorable delivery of $21 million and favorable customer and product mix. The remaining variance was driven by the $7 million negative impact of translating profits denominated in foreign currencies into United States dollars and higher start-up costs.
OUTLOOK
The outlook for Insulation demand is driven by North American new residential construction, remodeling and repair activity, as well as commercial and industrial construction activity in the United States, Canada, Europe, Asia-Pacific and Latin America. Demand in commercial and industrial insulation markets is most closely correlated to industrial production growth and overall economic activity in the global markets we serve. Demand for residential insulation is most closely correlated to U.S. housing starts.
During the fourth quarter of 2023, the average Seasonally Adjusted Annual Rate (“SAAR”) of U.S. housing starts was approximately 1.454 million starts, which is up from 1.403 million starts in the fourth quarter of 2022.
The Company expects both the North American new residential construction market and global commercial and industrial construction markets to temporarily remain soft with the weaker macro-economic outlook, higher interest rates and continued input cost inflation. The Company remains focused on managing costs, capital expenditures, and working capital.
-34-
| | | | | |
| ITEM 7. | MANAGEMENT’S DISCUSSION AND ANALYSIS OF FINANCIAL CONDITION AND RESULTS OF OPERATIONS (continued) |
Composites
The table below provides a summary of net sales, EBIT, depreciation and amortization expense and EBITDA for the Composites segment (in millions):
| | | | | | | | | | | | | | | | | |
| | Twelve Months Ended December 31, |
| | 2023 | | 2022 | | 2021 |
| | |
| Net sales | $ | 2,286 | | | $ | 2,660 | | | $ | 2,341 | |
| % change from prior year | -14 | % | | 14 | % | | 19 | % |
| EBIT | $ | 242 | | | $ | 498 | | | $ | 376 | |
| EBIT as a % of net sales | 11 | % | | 19 | % | | 16 | % |
| Depreciation and amortization expense | $ | 172 | | | $ | 175 | | | $ | 162 | |
| EBITDA | $ | 414 | | | $ | 673 | | | $ | 538 | |
| EBITDA as a % of net sales | 18 | % | | 25 | % | | 23 | % |
NET SALES
Net sales in our Composites segment decreased $374 million in 2023 compared to 2022. The decrease was primarily driven by lower sales volumes of approximately 12% and the net unfavorable impact of divestitures and acquisitions. Unfavorable customer mix of $16 million was partially offset by higher selling prices of $9 million and the favorable impact of translating sales denominated in foreign currencies into United States dollars.
EBIT
EBIT in our Composites segment decreased $256 million in 2023 compared to 2022. The decrease was driven by lower sales volumes, $83 million of higher production downtime and the net unfavorable impact of divestitures and acquisitions of $37 million. Higher input cost inflation of $41 million was offset by favorable delivery and higher selling prices. The remaining variance was driven by unfavorable customer mix, higher rebuild costs and the $5 million negative impact of translating profits denominated in foreign currencies into United States dollars, which was partially offset by favorable manufacturing costs.
OUTLOOK
Global glass reinforcements market demand has several economic indicators, including residential, non-residential construction and manufacturing production indices, as well as global wind installations. The Company anticipates continued impacts of economic uncertainty in a dynamic global environment, as well as competitive pricing pressure. The Company remains focused on managing costs, capital expenditures, and working capital.
-35-
| | | | | |
| ITEM 7. | MANAGEMENT’S DISCUSSION AND ANALYSIS OF FINANCIAL CONDITION AND RESULTS OF OPERATIONS (continued) |
Corporate, Other and Eliminations
The table below provides a summary of EBIT and depreciation and amortization expense for the Corporate, Other and Eliminations category (in millions): | | | | | | | | | | | | | | | | | |
| | Twelve Months Ended December 31, |
| | 2023 | | 2022 | | 2021 |
| Restructuring costs | $ | (169) | | | $ | (48) | | | $ | (34) | |
| Gain on sale of land in India | — | | | — | | | 15 | |
| Gains on sale of certain precious metals | 2 | | | 18 | | | 53 | |
| | |
| Intangible assets impairment charge | — | | | (96) | | | — | |
| | |
| Recognition of acquisition inventory fair value step-up | — | | | — | | | (1) | |
| | |
| Pension settlement losses | (145) | | | — | | | — | |
| | |
| Acquisition and divestiture-related costs | — | | | (7) | | | — | |
| | |
| Gain on sale of Santa Clara, California site | 189 | | | — | | | — | |
| Gain on sale of Shanghai, China facility | — | | | 27 | | | — | |
| Gain on remeasurement of Fiberteq equity investment | — | | | 130 | | | — | |
| Paroc marine recall | (15) | | | — | | | — | |
| Loss on sale of Chambery, France DUCS business | — | | | (30) | | | — | |
| Loss on sale of Russian operations | — | | | (33) | | | — | |
| | |
|
|
| 796 | | $ | 279 | |
The Receivables Securitization Facility and Senior Revolving Credit Facility mature in 2024 and 2026, respectively. The Company's 4.2% senior notes mature in the fourth quarter of 2024. As of December 31, 2023, the Company had $3.0 billion of total debt and cash and cash equivalents of $1.6 billion. The agreements governing our Senior Revolving Credit Facility and Receivables Securitization Facility contain various covenants that we believe are usual and customary. These covenants include a maximum allowed leverage ratio. We were in compliance with these covenants as of December 31, 2023.
On February 8, 2024, the Company entered into a commitment letter with Morgan Stanley Senior Funding, Inc. (“MSSF”), pursuant to which MSSF has committed to provide, subject to the satisfaction of customary closing conditions, a 364-day senior unsecured term loan facility in an aggregate principal amount of up to $3.0 billion for purposes of funding a substantial portion of the Masonite acquisition. We expect to assume up to $875 million of Masonite’s outstanding senior unsecured notes. On February 9, 2024, the three major credit rating agencies reaffirmed our investment-grade debt ratings.
Cash and cash equivalents held by foreign subsidiaries may be subject to foreign withholding taxes upon repatriation to the U.S. As of December 31, 2023 and December 31, 2022, the Company had $114 million and $188 million, respectively, in cash and cash equivalents in certain of its foreign subsidiaries. The Company continues to assert indefinite reinvestment in accordance with Accounting Standards Codification (“ASC”) 740 based on the laws as of enactment of the tax legislation commonly known as the U.S. Tax Cuts and Jobs Act of 2017.
As a holding company, we have no operations of our own and most of our assets are held by our direct and indirect subsidiaries. Dividends and other payments or distributions from our subsidiaries will be used to meet our debt service and other obligations and to enable us to pay dividends to our stockholders. Please refer to the Risk Factors disclosed in Item 1A of this Annual Report on Form 10-K for details on the factors that could inhibit our subsidiaries' abilities to pay dividends or make other distributions to the parent company.
We have no material off-balance sheet arrangements that have or are reasonably likely to have a material current or future effect on our financial condition, results of operations, liquidity, capital expenditures or other resources.
Material Cash Requirements
Our anticipated uses of cash include capital expenditures, working capital needs, share repurchases, meeting financial obligations, payments of any dividends authorized by our Board of Directors, acquisitions, including the planned acquisition of Masonite, restructuring actions and pension contributions. We expect that our cash on hand, coupled with future cash flows from operations and other available sources of liquidity, including our Senior Revolving Credit Facility and our Receivables Securitization Facility, will provide ample liquidity to enable us to meet our cash requirements for at least the next 12 months and foreseeable future thereafter. We expect to use cash on hand and new committed financing to fund the purchase price of the Masonite acquisition and for any required repurchases of Masonite's outstanding senior unsecured notes.
The following discussion of material cash requirements evaluates known contractual and other obligations, but does not include amounts that are contingent on events or other factors that are uncertain or unknown at this time including legal contingencies, and uncertain tax positions among others. The amounts presented are based on various estimates, including estimates regarding the timing of payments, prevailing interest rates, the occurrence of certain events and other factors. Actual results may vary materially from the amounts discussed below.
Capital Expenditures: Our capital expenditures are primarily related to the maintenance and rebuild of our long-term assets, as well as investing in projects that support growth and innovation to further our enterprise strategy. Our capital expenditures on a
-37-
| | | | | |
| ITEM 7. | MANAGEMENT’S DISCUSSION AND ANALYSIS OF FINANCIAL CONDITION AND RESULTS OF OPERATIONS (continued) |
cash basis were $526 million in 2023. Without considering the effect of the planned acquisition of Masonite, we expect to have capital expenditures on a cash basis of approximately $550 million in 2024. The anticipated increase in capital expenditures in 2024 is primarily driven by growth, manufacturing productivity and sustainability projects across all three segments. We expect that capital expenditures will be funded through cash flows from operations. See Note 2 and Note 6 of the Consolidated Financial Statements for additional information on property, plant and equipment.
Long-term debt obligations, including current portion of long-term debt: As of December 31, 2023, total long-term debt of $3.0 billion primarily consists of various outstanding senior notes. The current portion of long-term debt includes $399 million of 4.2% senior notes maturing in the fourth quarter of 2024. Further discussion of the amount and timing of the future scheduled maturities of our senior notes can be found in Note 13 of the Consolidated Financial Statements. There were no borrowings on our Senior Revolving Credit Facility or our Receivables Securitization Facility as of December 31, 2023.
Interest on debt: We are obligated to make periodic interest payments at fixed rates, depending on the terms of the applicable debt agreements. Based on interest rates and scheduled maturities as of December 31, 2023, these interest obligations range from $99 million to $130 million annually over the next five years.
Finance lease obligations: Our finance lease obligations primarily consist of real estate, oxygen plants, computers and software, and fleet vehicles. As of December 31, 2023 we had a total of $196 million of minimum finance lease payments. Further discussion of the future maturities of these lease liabilities can be found in Note 9 of the Consolidated Financial Statements.
Operating lease obligations: Our operating lease obligations primarily consist of real estate and material handling equipment. As of December 31, 2023, we had a total of $248 million of minimum operating lease payments. Further discussion of the future maturities of these lease liabilities can be found in Note 9 of the Consolidated Financial Statements.
Purchase obligations: Purchase obligations are commitments to suppliers to purchase goods or services, and include take-or-pay arrangements, capital expenditures, and contractual commitments to purchase equipment. As of December 31, 2023, the total of these obligations was $328 million, inclusive of $241 million payable in the next 12 months. The Company did not include ordinary course of business purchase orders in this amount as the majority of such purchase orders may be canceled and are reflected in historical operating cash flow trends. The Company does not believe such purchase orders will adversely affect our liquidity position.
Pension Contributions: The Company has several defined benefit pension plans. The Company made cash contributions of $18 million and $8 million to the plans during the twelve months ended December 31, 2023 and 2022, respectively. The Company expects to contribute $20 million in cash to its pension plans during 2024. Actual contributions to the plans may change as a result of several factors, including changes in laws that impact funding requirements. The ultimate cash flow impact to the Company, if any, of the pension plan liability and the timing of any such impact will depend on numerous variables, including future changes in actuarial assumptions, legislative changes to pension funding laws, and market conditions. Further discussion of the Company's defined benefit pension plans can be found in Note 14 of the Consolidated Financial Statements.
Other Strategic Uses of Cash: We have outstanding share repurchase authorizations and will evaluate and consider repurchasing shares of our common stock, as well as payments of any dividends authorized by our Board of Directors, strategic acquisitions, joint ventures, debt repurchases or repayments and other transactions to create stockholder value and enhance financial performance. Such transactions may require cash expenditures beyond current sources of liquidity or generated proceeds.
-38-
| | | | | |
| ITEM 7. | MANAGEMENT’S DISCUSSION AND ANALYSIS OF FINANCIAL CONDITION AND RESULTS OF OPERATIONS (continued) |
Supplier Finance Programs
We review supplier terms and conditions on an ongoing basis, and have negotiated payment terms extensions in recent years in connection with our efforts to reduce working capital and improve cash flow. Separate from those terms extension actions, certain of our subsidiaries have entered into paying agency agreements with third-party administrators. These voluntary supply chain finance programs (collectively, the “Programs”) generally give participating suppliers the ability to sell, or otherwise pledge as collateral, their receivables from the Company to the participating financial institutions, at the sole discretion of both the suppliers and financial institutions. The Company is not a party to the arrangements between the suppliers and the financial institutions. The Company’s obligations to its suppliers, including amounts due and scheduled payment dates, are not impacted by the suppliers’ decisions to sell, or otherwise pledge as collateral, amounts under these arrangements. The Company's payment terms to the financial institutions, including the timing and amount of payments, are based on the original supplier invoices. One of our Programs includes a parent guarantee to the participating financial institution for a certain U.S. subsidiary that, at the time of the respective Program’s inception in 2015, was a guarantor subsidiary of the Company’s Credit Agreement. The obligations are presented as Accounts payable within Total current liabilities on the Consolidated Balance Sheets and all activity related to the obligations is presented within operating activities on the Consolidated Statements of Cash Flow.
The desire of suppliers and financial institutions to participate in the Programs could be negatively impacted by, among other factors, the availability of capital committed by the participating financial institutions, the cost and availability of our suppliers’ capital, a credit rating downgrade or deteriorating financial performance of the Company or its participating subsidiaries, or other changes in financial markets beyond our control. We do not expect these risks, or potential long-term growth of our Programs, to materially affect our overall financial condition, as we expect a significant portion of our payments to continue to be made outside of the Programs. Accordingly, we do not believe the Programs have materially impacted our current period liquidity, and do not believe that the Programs are reasonably likely to materially affect liquidity in the future.
Please refer to the Supplier Finance Programs section in Note 1 of the Consolidated Financial Statements for a rollforward of outstanding obligations under the supplier finance programs.
Cash Flows
The following table presents a summary of our cash balance, cash flows, and availability on credit facilities (in millions): | | | | | | | | | | | | | | | | | |
| | Twelve Months Ended December 31, |
| | 2023 | | 2022 | | 2021 |
| Cash and cash equivalents | $ | 1,615 | | | $ | 1,099 | | | $ | 959 | |
| Net cash flow provided by operating activities | $ | 1,719 | | | $ | 1,760 | | | $ | 1,503 | |
| Net cash flow used for investing activities | $ | (356) | | | $ | (623) | | | $ | (377) | |
| Net cash flow used for financing activities | $ | (877) | | | $ | (974) | | | $ | (881) | |
| Availability on the Senior Revolving Credit Facility | $ | 796 | | | $ | 796 | | | $ | 796 | |
| Availability on the Receivables Securitization Facility | $ | 279 | | | $ | 279 | | | $ | 279 | |
| | |
|
|
|
|
|
|
|
|
|
|
|
|
| 3% | 6% | 7% | 10% | 15% | 15% |
Commodity Price Risk
The Company is exposed to changes in prices of commodities used in its operations, primarily associated with energy, such as natural gas, and raw materials, such as asphalt and polystyrene. The Company enters into cash-settled natural gas swap contracts in certain markets to protect against changes in natural gas prices that mature within 15 months; however, no financial instruments are currently used to protect against changes in raw material costs. At December 31, 2023 and 2022, the net fair value of such swap contracts was a liability of $15 million and a liability of $30 million, respectively. The potential change in fair value at December 31, 2023 and 2022 resulting from an increase (decrease) of 10% in the underlying commodity prices would be an increase (decrease) of $4 million for 2023 and an increase (decrease) of $8 million for 2022. This amount excludes the offsetting impact of the price risk inherent in the physical purchase of the underlying commodities.
| | | | | |
| ITEM 8. | FINANCIAL STATEMENTS AND SUPPLEMENTARY DATA |
Pages 61 through 115 of this filing are incorporated herein by reference.
| | | | | |
| ITEM 9. | CHANGES IN AND DISAGREEMENTS WITH ACCOUNTANTS ON ACCOUNTING AND FINANCIAL DISCLOSURE |
None.
| | | | | |
| ITEM 9A. | CONTROLS AND PROCEDURES |
The Company maintains (a) disclosure controls and procedures (as such term is defined in Rules 13a-15(e) and 15d-15(e) under the Exchange Act), and (b) internal control over financial reporting (as such term is defined in Rules 13a-15(f) and 15d-15(f) under the Exchange Act).
The Company’s management, with the participation of the Company’s Chief Executive Officer and Chief Financial Officer, has evaluated the effectiveness of the Company’s disclosure controls and procedures as of the end of the period covered by this Annual Report on Form 10-K. Based on such evaluation, the Company’s Chief Executive Officer and Chief Financial Officer have concluded that, as of the end of such period, the Company’s disclosure controls and procedures are effective.
There has been no change in the Company's internal control over financial reporting during the quarter ended December 31, 2023 that materially affected, or is reasonably likely to materially affect, the Company's internal control over financial reporting.
A report of the Company’s management on the Company’s internal control over financial reporting is contained on page 58 hereof and is incorporated here by reference. PricewaterhouseCoopers LLP’s report on the effectiveness of internal control over financial reporting is included in the Report of Independent Registered Public Accounting Firm beginning on page 59 hereof.
| | | | | |
| ITEM 9B. | OTHER INFORMATION |
, , the Company's , into a written plan for the sale of shares of Company common stock, intended to satisfy the affirmative defense conditions of Rule 10b5-1(c) under the Securities Exchange Act of 1934 (the “Exchange Act”). Mr. Smith’s plan provides for the sale of shares of Company common stock in the aggregate underlying future vesting restricted stock units and performance stock units (“PSUs”) that are expected to vest during the term of the plan. The amount of shares disclosed above has not been reduced by the number of shares that may be withheld for income taxes, and assumes that the PSUs will vest at 100% attainment. The actual number of PSUs that may vest can vary between 0% - 200% of the target award amount, subject to the achievement of certain performance conditions as set forth in the PSU award agreement, and the number of shares sold pursuant to Mr. Smith’s plan may increase or decrease accordingly. This plan is scheduled to terminate no later than October 25, 2024.
, , the Company's , into a written plan for the sale of up to shares of Company common stock, intended to satisfy the affirmative defense conditions of Rule 10b5-1(c) under the Exchange Act. This plan is scheduled to terminate no later than December 13, 2024.
, , the Company's , into a written plan for the sale of up to shares of Company common stock, intended to satisfy the affirmative defense conditions of Rule 10b5-1(c) under the Exchange Act. This plan is scheduled to terminate no later than November 29, 2024.
| | | | | |
| ITEM 9C. | DISCLOSURE REGARDING FOREIGN JURISDICTIONS THAT PREVENT INSPECTIONS |
Not applicable.
Part III
| | | | | |
| ITEM 10. | DIRECTORS, EXECUTIVE OFFICERS AND CORPORATE GOVERNANCE |
Information with respect to directors, corporate governance, and compliance with Section 16(a) of the Exchange Act will be presented in the 2024 Proxy Statement in the sections titled “Information Concerning Directors,” “Governance Information,” and “Delinquent Section 16(a) Reports,” and such information is incorporated herein by reference.
Information with respect to our executive officers is included herein under Part I, “Information about our Executive Officers”.
Code of Ethics
Owens Corning has adopted an Ethics Policy for Chief Executive and Senior Financial Officers (“Ethics Policy”) that applies to our Chief Executive Officer, Chief Financial Officer and Controller. This Ethics Policy is available on our website (www.owenscorning.com) under the “Corporate Governance” tab located in the “Investing in Owens Corning” section and print copies will be made available free of charge upon request to the Corporate Secretary of the Company. To the extent required by applicable SEC rules or New York Stock Exchange listing standards, the Company intends to post any amendments or waivers to the above referenced codes of ethics to our website, under the tab entitled “Corporate Governance.”
| | | | | |
| ITEM 11. | EXECUTIVE COMPENSATION |
Information regarding executive officer and director compensation will be presented in the 2024 Proxy Statement under the section titled “Executive Compensation,” exclusive of the subsection titled “Compensation Committee Report,” and the section titled “2023 Non-Management Director Compensation,” and such information is incorporated herein by reference.
| | | | | |
| ITEM 12. | SECURITY OWNERSHIP OF CERTAIN BENEFICIAL OWNERS AND MANAGEMENT AND RELATED STOCKHOLDER MATTERS |
Information regarding security ownership of certain beneficial owners and management and related stockholder matters, as well as equity compensation plan information, will be presented in the 2024 Proxy Statement under the sections titled “Beneficial Ownership of Shares,” “Security Ownership of Executive Officers and Directors” and “Equity Compensation Plan Information,” and such information is incorporated herein by reference.
| | | | | |
| ITEM 13. | CERTAIN RELATIONSHIPS AND RELATED TRANSACTIONS, AND DIRECTOR INDEPENDENCE |
Information regarding certain relationships and related transactions and director independence will be presented in the 2024 Proxy Statement under the sections titled “Review of Transactions with Related Persons,” “Director Qualifications Standards” and “Director Independence,” and such information is incorporated herein by reference.
| | | | | |
| ITEM 14. | PRINCIPAL ACCOUNTANT FEES AND SERVICES |
Information regarding principal accounting fees and services will be presented in the 2024 Proxy Statement under the sections titled “Principal Accountant Fees and Services,” and such information is incorporated herein by reference.
Part IV
| | | | | |
| ITEM 15. | EXHIBITS AND FINANCIAL STATEMENT SCHEDULES |
(a)DOCUMENTS FILED AS PART OF THIS REPORT
1.See Index to Consolidated Financial Statements on page 57 hereof. 2.See Index to Financial Statement Schedules on page 116 hereof. EXHIBIT INDEX
Pursuant to the rules and regulations of the SEC, the Company has filed or incorporated by reference certain agreements as exhibits to this Annual Report on Form 10-K. These agreements may contain representations and warranties by the parties. These representations and warranties have been made solely for the benefit of the other party or parties to such agreements and (i) may have been qualified by disclosures made to such other party or parties, (ii) were made only as of the date of such agreements or such other date(s) as may be specified in such agreements and are subject to more recent developments, which may not be fully reflected in the Company’s public disclosure, (iii) may reflect the allocation of risk among the parties to such agreements and (iv) may apply materiality standards different from what may be viewed as material to investors. Accordingly, these representations and warranties may not describe the Company’s actual state of affairs at the date hereof and should not be relied upon. | | | | | | | | |
Exhibit Number | | Description |
| 2.1 | | |
| | |
| 3.1 | | |
| | |
| 3.2 | | |
| | |
| 4.1 | | |
| | |
| 4.2 | | |
| | |
| 4.3 | | |
| | |
| 4.4 | | |
| | |
| 4.5 | | |
| | |
| 4.6 | | |
| | |
| | | | | | | | |
| 4.7 | | |
| | |
| 4.8 | | |
| | |
| 4.9 | | |
| | |
| 4.10 | | |
| | |
| 4.11 | | |
| | |
| 4.12 | | |
| | |
| 4.13 | | |
| | |
| 4.14 | | |
| | |
| 4.15 | | |
| | |
| 4.16 | | |
| | |
| 4.17 | | |
| | |
| 4.18 | | |
| | |
| 4.19 | | |
| | |
| 4.20 | | |
| | |
| | | | | | | | |
| 4.21 | | |
| | |
| 4.22 | |
|
| | |
| 4.23 | | |
| | |
| 4.24 | | |
| | |
| 4.25 | | |
| | |
| 4.26 | | |
| | |
| 4.27 | | |
| | |
| 10.1 | | |
| | |
| 10.2 | | |
| | |
| 10.3 | | |
| | |
| 10.4 | | |
| | |
| 10.5 | | |
| | |
| 10.6 | | |
| | |
| 10.7 | | |
| | |
| 10.8 | | |
| | | | | | | | |
| | |
| 10.9 | | |
| | |
| 10.10 | | |
| | |
| 10.11 | |
|
| | |
| 10.12 | | |
| | |
| 10.13 | | |
| | |
| 10.14 | | |
| | |
| 10.15 | | |
| | |
| 10.16 | | |
| | |
| 10.17 | | |
| | |
| 10.18 | | |
| | |
| 10.19 | | |
| | |
| 10.20 | | |
| | |
| 10.21 | | |
| | |
| 10.22 | | |
| | |
| 10.23 | | |
| | |
| 10.24 | | |
| | |
| | | | | | | | |
| 10.25 | |
|
| | |
| 10.26 | | |
| | |
| 10.27 | | |
| | |
| 10.28 | | |
| | |
| 10.29 | | |
| | |
| 10.30 | | |
| | |
| 10.31 | | |
| | |
| 10.32 | | |
| | |
| 10.33 | | |
| | |
| 10.34 | | |
| | |
| 10.35 | | |
| | |
| 10.36 | | |
| | |
| 10.37 | | |
| | |
| 21.1 | | |
| | |
| 23.1 | | |
| | |
| 31.1 | | |
| | |
| | | | | | | | |
| 31.2 | | |
| | |
| 32.1 | | |
| | |
| 32.2 | | |
| | |
| 97.1 | | |
| | |
| 101 | | The following materials from the Annual Report on Form 10-K for Owens Corning for the period ended December 31, 2023, formatted in iXBRL (Inline Extensible Business Reporting Language): (i) Consolidated Statements of Earnings; (ii) Consolidated Statements of Comprehensive Earnings; (iii) Consolidated Balance Sheets; (iv) Consolidated Statements of Stockholders' Equity, (v) Consolidated Statements of Cash Flows; (vi) related notes to these financial statements; and (vii) document and entity information. |
| | |
| 104 | | The cover page from this Annual Report on Form 10-K, formatted as Inline XBRL |
| | | | | | | | |
| + | Schedules and similar attachments have been omitted from this filing pursuant to Item 601(a)(5) of Regulation S-K. A copy of any omitted schedule or similar attachment will be furnished to the Securities and Exchange Commission upon request. |
| * | Denotes management contract or compensatory plan or arrangement required to be filed as an exhibit pursuant to Form 10-K. |
Owens Corning agrees to furnish to the U.S. Securities and Exchange Commission, upon request, copies of all instruments defining the rights of holders of long-term debt of Owens Corning where the total amount of securities authorized under each issue does not exceed 10% of the total assets of Owens Corning and its subsidiaries on a consolidated basis.
| | | | | |
| ITEM 16. | FORM 10-K SUMMARY |
None.
SIGNATURES
Pursuant to the requirements of Section 13 or 15(d) of the Securities Exchange Act of 1934, the Registrant has duly caused this report to be signed on its behalf by the undersigned, thereunto duly authorized.
OWENS CORNING | | | | | | | | | | | | | | |
| | | | |
| By | | /s/ Brian D. Chambers | | February 14, 2024 |
| | Brian D. Chambers | | |
| | Chief Executive Officer
(Principal Executive Officer) | | |
Pursuant to the requirements of the Securities Exchange Act of 1934, this report has been signed below by the following persons on behalf of the Registrant and in the capacities and on the dates indicated.
| | | | | | | | | | | | | | |
| | | | |
| | /s/ Brian D. Chambers | | February 14, 2024 |
| | Brian D. Chambers, | | |
| | Chief Executive Officer and Director
(Principal Executive Officer) | | |
| | | | |
| | /s/ Todd W. Fister | | February 14, 2024 |
| | Todd W. Fister, | | |
| | Chief Financial Officer
(Principal Financial Officer) | | |
| | | | |
| | /s/ Mari K. Doerfler | | February 14, 2024 |
| | Mari K. Doerfler, | | |
| | Vice President and Controller | | |
| | | | |
| | /s/ Eduardo E. Cordeiro | | February 14, 2024 |
| | Eduardo E. Cordeiro, | | |
| | Director | | |
| | | | |
| | /s/ Adrienne D. Elsner | | February 14, 2024 |
| | Adrienne D. Elsner, | | |
| | Director | | |
| | | | |
| | /s/ Alfred E. Festa | | February 14, 2024 |
| | Alfred E. Festa, | | |
| | Director | | |
| | | | |
| | /s/ Edward F. Lonergan | | February 14, 2024 |
| | Edward F. Lonergan, | | |
| | Director | | |
| | | | |
| | /s/ Maryann T. Mannen | | February 14, 2024 |
| | Maryann T. Mannen, | | |
| | Director | | |
| | | | |
| | /s/ Paul E. Martin | | February 14, 2024 |
| | Paul E. Martin, | | |
| | Director | | |
| | | | | | | | | | | | | | |
| | | | |
| | /s/ W. Howard Morris | | February 14, 2024 |
| | W. Howard Morris, | | |
| | Director | | |
| | | | |
| | /s/ Suzanne P. Nimocks | | February 14, 2024 |
| | Suzanne P. Nimocks, | | |
| | Director | | |
| | | | |
| | /s/ John D. Williams | | February 14, 2024 |
| | John D. Williams, | | |
| | Director | | |
| | | | |
| | | | |
| | | | |
INDEX TO CONSOLIDATED FINANCIAL STATEMENTS
Management’s Report on Internal Control Over Financial Reporting
Management of the Company is responsible for establishing and maintaining adequate internal control over financial reporting as such term is defined in Rules 13a-15(f) and 15d-15(f) under the Securities Exchange Act of 1934.
Management has assessed the effectiveness of the Company’s internal control over financial reporting as of December 31, 2023 based on criteria established in the Internal Control-Integrated Framework in 2013 issued by the Committee of Sponsoring Organizations of the Treadway Commission (COSO).
PricewaterhouseCoopers LLP has audited the effectiveness of the internal controls over financial reporting as of December 31, 2023 as stated in their Report of Independent Registered Public Accounting Firm on page 59 hereof. Based on our assessment, management determined that, as of December 31, 2023, the Company’s internal control over financial reporting was effective.
| | | | | | | | | | | | | | |
| | | | |
| | /s/ Brian D. Chambers | | February 14, 2024 |
| | Brian D. Chambers, | | |
| | Chief Executive Officer
(Principal Executive Officer) | | |
| | | | |
| | /s/ Todd W. Fister | | February 14, 2024 |
| | Todd W. Fister, | | |
| | Chief Financial Officer
(Principal Financial Officer) | | |
Report of Independent Registered Public Accounting Firm
To the Board of Directors and Stockholders of Owens Corning
Opinions on the Financial Statements and Internal Control over Financial Reporting
We have audited the accompanying consolidated balance sheets of Owens Corning and its subsidiaries (the “Company”) as of December 31, 2023 and 2022, and the related consolidated statements of earnings, of comprehensive earnings, of stockholders’ equity and of cash flows for each of the three years in the period ended December 31, 2023, including the related notes and schedule of valuation and qualifying accounts and reserves for each of the three years in the period ended December 31, 2023 appearing on page 117 (collectively referred to as the “consolidated financial statements”). We also have audited the Company's internal control over financial reporting as of December 31, 2023, based on criteria established in Internal Control - Integrated Framework (2013) issued by the Committee of Sponsoring Organizations of the Treadway Commission (COSO).
In our opinion, the consolidated financial statements referred to above present fairly, in all material respects, the financial position of the Company as of December 31, 2023 and 2022, and the results of its operations and its cash flows for each of the three years in the period ended December 31, 2023 in conformity with accounting principles generally accepted in the United States of America. Also in our opinion, the Company maintained, in all material respects, effective internal control over financial reporting as of December 31, 2023, based on criteria established in Internal Control - Integrated Framework (2013) issued by the COSO.
Basis for Opinions
The Company's management is responsible for these consolidated financial statements, for maintaining effective internal control over financial reporting, and for its assessment of the effectiveness of internal control over financial reporting, included in the accompanying Management’s Report on Internal Control Over Financial Reporting. Our responsibility is to express opinions on the Company’s consolidated financial statements and on the Company's internal control over financial reporting based on our audits. We are a public accounting firm registered with the Public Company Accounting Oversight Board (United States) (PCAOB) and are required to be independent with respect to the Company in accordance with the U.S. federal securities laws and the applicable rules and regulations of the Securities and Exchange Commission and the PCAOB.
We conducted our audits in accordance with the standards of the PCAOB. Those standards require that we plan and perform the audits to obtain reasonable assurance about whether the consolidated financial statements are free of material misstatement, whether due to error or fraud, and whether effective internal control over financial reporting was maintained in all material respects.
Our audits of the consolidated financial statements included performing procedures to assess the risks of material misstatement of the consolidated financial statements, whether due to error or fraud, and performing procedures that respond to those risks. Such procedures included examining, on a test basis, evidence regarding the amounts and disclosures in the consolidated financial statements. Our audits also included evaluating the accounting principles used and significant estimates made by management, as well as evaluating the overall presentation of the consolidated financial statements. Our audit of internal control over financial reporting included obtaining an understanding of internal control over financial reporting, assessing the risk that a material weakness exists, and testing and evaluating the design and operating effectiveness of internal control based on the assessed risk. Our audits also included performing such other procedures as we considered necessary in the circumstances. We believe that our audits provide a reasonable basis for our opinions.
Definition and Limitations of Internal Control over Financial Reporting
A company’s internal control over financial reporting is a process designed to provide reasonable assurance regarding the reliability of financial reporting and the preparation of financial statements for external purposes in accordance with generally accepted accounting principles. A company’s internal control over financial reporting includes those policies and procedures that (i) pertain to the maintenance of records that, in reasonable detail, accurately and fairly reflect the transactions and dispositions of the assets of the company; (ii) provide reasonable assurance that transactions are recorded as necessary to permit preparation of financial statements in accordance with generally accepted accounting principles, and that receipts and expenditures of the company are being made only in accordance with authorizations of management and directors of the company; and (iii) provide reasonable assurance regarding prevention or timely detection of unauthorized acquisition, use, or disposition of the company’s assets that could have a material effect on the financial statements.
Because of its inherent limitations, internal control over financial reporting may not prevent or detect misstatements. Also, projections of any evaluation of effectiveness to future periods are subject to the risk that controls may become inadequate because of changes in conditions, or that the degree of compliance with the policies or procedures may deteriorate.
Critical Audit Matters
The critical audit matter communicated below is a matter arising from the current period audit of the consolidated financial statements that was communicated or required to be communicated to the audit committee and that (i) relates to accounts or disclosures that are material to the consolidated financial statements and (ii) involved our especially challenging, subjective, or complex judgments. The communication of critical audit matters does not alter in any way our opinion on the consolidated financial statements, taken as a whole, and we are not, by communicating the critical audit matter below, providing a separate opinion on the critical audit matter or on the accounts or disclosures to which it relates.
Goodwill Impairment Assessment – Composites Reporting Unit
As described in Notes 1 and 5 to the consolidated financial statements, the Company’s consolidated goodwill balance was $1,392 million as of December 31, 2023, and the goodwill associated with the Composites reporting unit was $425 million. Management tests goodwill for impairment as of October 1 each year, or more frequently should circumstances change or events occur that would more likely than not reduce the fair value of a reporting unit below its carrying amount. Management estimates fair value using a discounted cash flow approach from the perspective of a market participant. Significant assumptions used in the discounted cash flow approach are revenue growth rates and earnings before interest and taxes (“EBIT”) margins used in estimating the discrete period cash flow forecasts of the reporting unit, the discount rate, and the long-term revenue growth rate and EBIT margin used in estimating the terminal business value.
The principal considerations for our determination that performing procedures relating to the goodwill impairment assessment of the Composites reporting unit is a critical audit matter are (i) the significant judgment by management when developing the fair value estimate of the Composites reporting unit; (ii) a high degree of auditor judgment, subjectivity and effort in performing procedures and evaluating management’s significant assumptions related to the revenue growth rates and EBIT margins used in estimating the discrete period cash flow forecasts of the reporting unit, the discount rate, and the long-term revenue growth rate and EBIT margin used in estimating the terminal business value; and (iii) the audit effort involved the use of professionals with specialized skill and knowledge.
Addressing the matter involved performing procedures and evaluating audit evidence in connection with forming our overall opinion on the consolidated financial statements. These procedures included testing the effectiveness of controls relating to management’s goodwill impairment assessment, including controls over the valuation of the Composites reporting unit. These procedures also included, among others (i) testing management’s process for developing the fair value estimate; (ii) evaluating the appropriateness of the discounted cash flow approach used by management; (iii) testing the completeness and accuracy of underlying data used in the discounted cash flow approach; and (iv) evaluating the reasonableness of the significant assumptions used by management related to the revenue growth rates and EBIT margins used in estimating the discrete period cash flow forecasts, the discount rate, and the long-term revenue growth rate and EBIT margin used in estimating the terminal business value. Evaluating management’s assumptions related to the revenue growth rates and EBIT margins used in estimating the discrete period cash flow forecasts and EBIT margin used in estimating the terminal business value involved evaluating whether the assumptions used by management were reasonable considering (i) the current and past performance of the reporting unit; (ii) the consistency with external market and industry data; and (iii) whether the assumptions were consistent with evidence obtained in other areas of the audit. Professionals with specialized skill and knowledge were used to assist in evaluating (i) the appropriateness of management’s discounted cash flow approach and (ii) the reasonableness of the discount rate assumption and the long-term revenue growth rate assumption.
We have served as the Company’s auditor since 2002.
OWENS CORNING AND SUBSIDIARIES
CONSOLIDATED STATEMENTS OF EARNINGS
(in millions, except per share amounts)
| | | | | | | | | | | | | | | | | |
| | Twelve Months Ended December 31, |
| | 2023 | | 2022 | | 2021 |
| NET SALES | $ | | | | $ | | | | $ | | |
| COST OF SALES | | | | | | | | |
| Gross margin | | | | | | | | |
| OPERATING EXPENSES | | | | | |
| Marketing and administrative expenses | | | | | | | | |
| Science and technology expenses | | | | | | | | |
| | |
| Gain on sale of site | () | | | | | | | |
| Gain on equity method investment | | | | () | | | | |
| Other expense (income), net | | | | | | | () | |
| Total operating expenses | | | | | | | | |
| OPERATING INCOME | | | | | | | | |
| Non-operating expense (income), net | | | | () | | | () | |
| EARNINGS BEFORE INTEREST AND TAXES | | | | | | | | |
| Interest expense, net | | | | | | | | |
| Loss on extinguishment of debt | | | | | | | | |
| EARNINGS BEFORE TAXES | | | | | | | | |
| Income tax expense | | | | | | | | |
| Equity in net earnings of affiliates | | | | | | | | |
| NET EARNINGS | | | | | | | | |
| Net loss attributable to non-redeemable and redeemable noncontrolling interests | () | | | | | | | |
| NET EARNINGS ATTRIBUTABLE TO OWENS CORNING | $ | | | | $ | | | | $ | | |
| EARNINGS PER COMMON SHARE ATTRIBUTABLE TO OWENS CORNING COMMON STOCKHOLDERS | | | | | |
| Basic | $ | | | | $ | | | | $ | | |
| Diluted | $ | | | | $ | | | | $ | | |
| | |
| WEIGHTED AVERAGE COMMON SHARES | | | | | |
| Basic | | | | | | | | |
| Diluted | | | | | | | | |
| | |
The accompanying Notes to the Consolidated Financial Statements are an integral part of these Statements.
OWENS CORNING AND SUBSIDIARIES
CONSOLIDATED STATEMENTS OF COMPREHENSIVE EARNINGS
(in millions)
| | | | | | | | | | | | | | | | | | | | |
| | | Twelve Months Ended December 31, |
| | | 2023 | | 2022 | | 2021 |
| NET EARNINGS | $ | | | | $ | | | | $ | | |
| Other comprehensive income (loss), net of tax | | | | | |
| Currency translation adjustment (net of tax of $(), $() and $(), for the periods ended December 31, 2023, 2022 and 2021, respectively) | | | | () | | | () | |
| Pension and other postretirement adjustment (net of tax of $(), $() and $(), for the periods ended December 31, 2023, 2022 and 2021, respectively) | | | | | | | | |
| Hedging adjustment (net of tax of $(), $ and $(), for the periods ended December 31, 2023, 2022 and 2021, respectively) | | | | () | | | | |
| Total other comprehensive income (loss), net of tax | | | | () | | | | |
| TOTAL COMPREHENSIVE EARNINGS | | | | | | | | |
| Comprehensive loss attributable to non-redeemable and redeemable noncontrolling interests | () | | | () | | | | |
| COMPREHENSIVE EARNINGS ATTRIBUTABLE TO OWENS CORNING | $ | | | | $ | | | | $ | | |
| | | |
The accompanying Notes to the Consolidated Financial Statements are an integral part of these Statements.
OWENS CORNING AND SUBSIDIARIES
CONSOLIDATED BALANCE SHEETS
(in millions)
| | | | | | | | | | | |
| December 31, | | December 31, |
| ASSETS | 2023 | | 2022 |
|
| CURRENT ASSETS | | | |
| Cash and cash equivalents | $ | | | | $ | | |
Receivables, less allowances of $ at December 31, 2023 and 2022 | | | | | |
| Inventories | | | | | |
| Assets held for sale | | | | | |
| Other current assets | | | | | |
| Total current assets | | | | | |
| Property, plant and equipment, net | | | | | |
| Operating lease right-of-use assets | | | | | |
| Goodwill | | | | | |
| Intangible assets, net | | | | | |
| Deferred income taxes | | | | | |
| Other non-current assets | | | | | |
| TOTAL ASSETS | $ | | | | $ | | |
| LIABILITIES AND EQUITY | | | |
| CURRENT LIABILITIES | | | |
| Accounts payable | $ | | | | $ | | |
|
| Current operating lease liabilities | | | | | |
| Long-term debt – current portion | | | | | |
| Other current liabilities | | | | | |
| Total current liabilities | | | | | |
| Long-term debt, net of current portion | | | | | |
| Pension plan liability | | | | | |
| Other employee benefits liability | | | | | |
| Non-current operating lease liabilities | | | | | |
| Deferred income taxes | | | | | |
| Other liabilities | | | | | |
| Total liabilities | | | | | |
| Redeemable noncontrolling interest | | | | | |
| OWENS CORNING STOCKHOLDERS’ EQUITY | | | |
Preferred stock, par value $ per share (a) | | | | | |
Common stock, par value $ per share (b) | | | | | |
| Additional paid in capital | | | | | |
| Accumulated earnings | | | | | |
| Accumulated other comprehensive deficit | () | | | () | |
| Cost of common stock in treasury (c) | () | | | () | |
| Total Owens Corning stockholders’ equity | | | | | |
| Noncontrolling interests | | | | | |
| Total equity | | | | | |
| TOTAL LIABILITIES AND EQUITY | $ | | | | $ | | |
(a) shares authorized; issued or outstanding at December 31, 2023 and December 31, 2022
(b) shares authorized; issued and outstanding at December 31, 2023; issued and outstanding at December 31, 2022
(c) shares at December 31, 2023 and shares at December 31, 2022
The accompanying Notes to the Consolidated Financial Statements are an integral part of these Statements.
OWENS CORNING AND SUBSIDIARIES
CONSOLIDATED STATEMENTS OF STOCKHOLDERS’ EQUITY
(in millions)
| | | | | | | | | | | | | | | | | | | | | | | | | | | | | | | | | | | | | | | | | | | | | | | | | | | | | |
| | Common Stock
Outstanding | | Treasury
Stock | | APIC (a) | | Accumulated
Earnings | | AOCI (b) | | NCI (c) | | Total |
| | Shares | | Par Value | | Shares | | Cost | |
| Balance at December 31, 2020 | | | | $ | | | | | | | $ | () | | | $ | | | | $ | | | | $ | () | | | $ | | | | $ | | |
| Net earnings attributable to Owens Corning | — | | | — | | | — | | | — | | | — | | | | | | — | | | — | | | | |
| | | | | | | | | | | | | | |
| Currency translation adjustment | — | | | — | | | — | | | — | | | — | | | — | | | () | | | () | | | () | |
Pension and other postretirement adjustment (net of tax) | — | | | — | | | — | | | — | | | — | | | — | | | | | | — | | | | |
Deferred gain on hedging transactions (net of tax) | — | | | — | | | — | | | — | | | — | | | — | | | | | | — | | | | |
| | | | | | | | | | | | | | |
Issuance of common stock under share-based payment plans | | | | — | | | () | | | | | | () | | | — | | | — | | | — | | | | |
| Purchases of treasury stock | () | | | — | | | | | | () | | | — | | | — | | | — | | | — | | | () | |
| Stock-based compensation expense | — | | | — | | | — | | | — | | | | | | — | | | — | | | — | | | | |
| | | | | | | | | | | | | | |
| Dividends declared (d) | — | | | — | | | — | | | — | | | — | | | () | | | — | | | — | | | () | |
| Balance at December 31, 2021 | | | | $ | | | | | | | $ | () | | | $ | | | | $ | | | | $ | () | | | $ | | | | $ | | |
| Net earnings attributable to Owens Corning | — | | | — | | | — | | | — | | | — | | | | | | — | | | — | | | | |
| Net earnings attributable to non-redeemable noncontrolling interests | — | | | — | | | — | | | — | | | — | | | — | | | — | | | | | | | |
| Redeemable noncontrolling interest adjustment to redemption value | — | | | — | | | — | | | — | | | () | | | — | | | — | | | — | | | () | |
| Currency translation adjustment | — | | | — | | | — | | | — | | | — | | | — | | | () | | | () | | | () | |
Pension and other postretirement adjustment (net of tax) | — | | | — | | | — | | | — | | | — | | | — | | | | | | — | | | | |
Deferred loss on hedging transactions (net of tax) | — | | | — | | | — | | | — | | | — | | | — | | | () | | | — | | | () | |
| Purchases of noncontrolling interest | — | | | — | | | — | | | — | | | | | | — | | | — | | | () | | | () | |
Issuance of common stock under share-based payment plans | | | | — | | | () | | | | | | () | | | — | | | — | | | — | | | | |
| | | | | | | | | | | | | | |
| Purchases of treasury stock | () | | | — | | | | | | () | | | — | | | — | | | — | | | — | | | () | |
| Stock-based compensation expense | — | | | — | | | — | | | — | | | | | | — | | | — | | | — | | | | |
| | | | | | | | | | | | | | |
| | | | | | | | | | | | | | |
| Dividends declared (d) | — | | | — | | | — | | | — | | | — | | | () | | | — | | | — | | | () | |
| Balance at December 31, 2022 | | | | $ | | | | | | | $ | () | | | $ | | | | $ | | | | $ | () | | | $ | | | | $ | | |
| Net earnings attributable to Owens Corning | — | | | — | | | — | | | — | | | — | | | | | | — | | | — | | | | |
| Net earnings attributable to non-redeemable noncontrolling interests | — | | | — | | | — | | | — | | | — | | | — | | | — | | | | | | | |
| Redeemable noncontrolling interest adjustment to redemption value | — | | | — | | | — | | | — | | | () | | | — | | | — | | | — | | | () | |
| Dividends distributed to non-redeemable noncontrolling interests | — | | | — | | | — | | | — | | | — | | | — | | | — | | | () | | | () | |
| Currency translation adjustment | — | | | — | | | — | | | — | | | — | | | — | | | | | | () | | | | |
Pension and other postretirement adjustment (net of tax) | — | | | — | | | — | | | — | | | — | | | — | | | | | | — | | | | |
| Deferred gain on hedging transactions (net of tax) | — | | | — | | | — | | | — | | | — | | | — | | | | | | — | | | | |
| | | | | | | | | | | | | | |
| | | | | | | | | | | | | | |
Issuance of common stock under share-based payment plans | | | | — | | | () | | | | | | () | | | — | | | — | | | — | | | | |
| Purchases of treasury stock | () | | | — | | | | | | () | | | — | | | — | | | — | | | — | | | () | |
| Stock-based compensation expense | — | | | — | | | — | | | — | | | | | | — | | | — | | | — | | | | |
| | | | | | | | | | | | | | |
|
|
|
|
|
|
|
| | | |
| | | |
|
| | | |
|
|
| | | |
|
| | | |
|
|
|
|
|
|
|
|
|
|
|
| | | |
|
|
| | | |
|
|
|
|
|
|
|
| | | |
| | | |
| | | |
|
|
|
| | | |
| | | |
| | | |
| | | |
| | | |
|
|
|
| | | |
|
|
|
|
|
|
|
|
|
|
|
The accompanying Notes to the Consolidated Financial Statements are an integral part of these Statements.
OWENS CORNING AND SUBSIDIARIES
NOTES TO CONSOLIDATED FINANCIAL STATEMENTS
1.
segments: Roofing, Insulation and Composites. Through these lines of business, Owens Corning manufactures and sells products worldwide. The Company maintains leading market positions in many of its major product categories.
General
On February 1, 2024, the Board of Directors declared a quarterly dividend of $ per common share payable on April 4, 2024 to shareholders of record as of March 4, 2024.
-67-
OWENS CORNING AND SUBSIDIARIES
NOTES TO CONSOLIDATED FINANCIAL STATEMENTS (continued)
1. BUSINESS AND SUMMARY OF SIGNIFICANT ACCOUNTING POLICIES (continued)
to years. On an annual basis, we expect to recognize approximately $ million of revenue associated with these extended warranty contracts. Additionally, in certain limited cases, we receive consideration before goods or services are transferred to the customer. These customer down payments and deposits are deferred, and typically recognized as revenue in the following quarters when we satisfy the related performance obligations. As of December 31, 2023, our contract liability balances (for extended warranties, down payments and deposits, collectively) totaled $ million. As of December 31, 2022, our contract liability balances totaled $ million, of which $ million was recognized as revenue throughout 2023. As of December 31, 2021, our contract liability balances (for extended warranties, down payments and deposits, collectively) totaled $ million, of which $ million was recognized as revenue throughout 2022. As of December 31, 2020, our contract liability balances (for extended warranties, down payments and deposits, collectively) totaled $ million, of which $ million was recognized as revenue throughout 2021.
Marketing and advertising expenses for the years ended December 31, 2023, 2022 and 2021 were $ million, $ million and $ million, respectively.
-68-
OWENS CORNING AND SUBSIDIARIES
NOTES TO CONSOLIDATED FINANCIAL STATEMENTS (continued)
1. BUSINESS AND SUMMARY OF SIGNIFICANT ACCOUNTING POLICIES (continued)
On the Consolidated Statements of Cash Flows, the total of Cash, cash equivalents and restricted cash includes restricted cash of $ million, $ million and $ million as of December 31, 2023, 2022 and 2021, respectively. Restricted cash primarily represents amounts received from a counterparty related to its performance assurance on an executory contract, and is included in Other current assets on the Consolidated Balance Sheets. These amounts are contractually required to be set aside, and the counterparty can exchange the cash for another form of performance assurance at its discretion.
Investments in affiliates are recorded in Other non-current assets on the Consolidated Balance Sheets, and as of December 31, 2023 and 2022, the total value of investments was $ million and $ million, respectively.
-69-
OWENS CORNING AND SUBSIDIARIES
NOTES TO CONSOLIDATED FINANCIAL STATEMENTS (continued)
1. BUSINESS AND SUMMARY OF SIGNIFICANT ACCOUNTING POLICIES (continued)
% of the outstanding value and is recorded in Cost of sales on the Consolidated Statements of Earnings. – years| Machinery and equipment | |
| Furnaces | – years |
| Information systems | – years |
| Equipment | – years |
-70-
OWENS CORNING AND SUBSIDIARIES
NOTES TO CONSOLIDATED FINANCIAL STATEMENTS (continued)
1. BUSINESS AND SUMMARY OF SIGNIFICANT ACCOUNTING POLICIES (continued)
| | $ | | | | Invoices confirmed during the year | | | | | |
| Confirmed invoices paid during the year | () | | | () | |
| Confirmed obligations outstanding at the end of the year | $ | | | | $ | | |
-71-
OWENS CORNING AND SUBSIDIARIES
NOTES TO CONSOLIDATED FINANCIAL STATEMENTS (continued)
1. BUSINESS AND SUMMARY OF SIGNIFICANT ACCOUNTING POLICIES (continued)
As discussed in the Derivative Financial Instruments section above, the Company uses non-designated foreign currency derivative financial instruments to mitigate this risk. The Company recorded foreign currency transactional (losses)/gains, net of associated derivative activity, of $() million, $() million and $ million during the years ended December 31, 2023, 2022, and 2021, respectively. Please refer to Note 4 for additional disclosures related to non-designated derivatives.
-72-
OWENS CORNING AND SUBSIDIARIES
NOTES TO CONSOLIDATED FINANCIAL STATEMENTS (continued)
1. BUSINESS AND SUMMARY OF SIGNIFICANT ACCOUNTING POLICIES (continued)
Purchases from the related party supplier were $ million for the year ended December 31, 2023. As of December 31, 2023, amounts due to the related party supplier were $ million. Purchases from the related party supplier were $ million and $ million for the years ended December 31, 2022 and December 31, 2021, respectively. As of December 31, 2022 and December 31, 2021, amounts due to the related party supplier were $ million and $ million, respectively.
million. The Company then, on the same day, entered into an agreement to lease the facility from the municipality of Fort Smith over for a total lease liability of $ million and immediately purchased municipal bonds at % interest issued by the municipality of Fort Smith with cash of $ million. In the Consolidated Statements of Cash Flows, the cash proceeds from the sale of the facility and the cash used for the bond purchase are presented on a net basis within the Net cash flows used by investing activities.
The monthly lease payments under the financing lease obligation and the semi-annual bond coupon payments associated with the bond investment are legally offset and, as such, the offset lease obligation and bond investment amounts are presented on a net basis on the Consolidated Balance Sheets. There will be no cash payments made by either party over the period. At the termination of the lease agreement, a non-cash exchange will occur where the municipality will call the bond and return title of the facility to the Company.
The transaction did not qualify for sale-leaseback treatment under ASC 842 and, therefore, the plant’s net book value, as well as the net book value of the equipment sold, remains in Property, plant and equipment, net on the Consolidated Balance Sheets. Depreciation expense on the assets sold remains within Cost of Sales on the Consolidated Statements of Earnings.
-73-
OWENS CORNING AND SUBSIDIARIES
NOTES TO CONSOLIDATED FINANCIAL STATEMENTS (continued)
2.
Roofing – Within our Roofing segment, the Company manufactures and sells residential roofing shingles, oxidized asphalt materials, and roofing components used in residential and commercial construction and specialty applications.
Insulation – Within our Insulation segment, the Company manufactures and sells thermal and acoustical batts, loosefill insulation, spray foam insulation, foam sheathing and accessories. It also manufactures and sells glass fiber pipe insulation, energy efficient flexible duct media, bonded and granulated stone wool insulation, cellular glass insulation, and foam insulation used in above- and below-grade construction applications.
Composites – Within our Composites segment, the Company manufactures, fabricates and sells glass reinforcements in the form of fiber. Glass reinforcement materials are also used by the Composites segment to manufacture and sell high value applications in the form of non-wovens, fabrics and composite lumber.
NET SALES
| $ | | | $ | | | $ | () | | $ | | | | U.S. commercial and industrial | | | | | | | () | | $ | | |
| Total United States | | | | | | | () | | $ | | |
| Europe | | | | | | | () | | $ | | |
| Asia-Pacific | | | | | | | | | $ | | |
| Rest of world | | | | | | | | | $ | | |
| NET SALES | $ | | | $ | | | $ | | | $ | () | | $ | | |
| | | | | | | | | | | | | | | | | |
| Twelve Months Ended December 31, 2022 |
| Reportable Segments | Roofing | Insulation | Composites | Eliminations | Consolidated |
| Disaggregation Categories | | | | | |
| U.S. residential | $ | | | $ | | | $ | | | $ | () | | $ | | |
| U.S. commercial and industrial | | | | | | | () | | $ | | |
| Total United States | | | | | | | () | | $ | | |
| Europe | | | | | | | () | | $ | | |
| Asia-Pacific | | | | | | | | | $ | | |
| Rest of world | | | | | | | | | $ | | |
| NET SALES | $ | | | $ | | | $ | | | $ | () | | $ | | |
-74-
OWENS CORNING AND SUBSIDIARIES
NOTES TO CONSOLIDATED FINANCIAL STATEMENTS (continued)
2. SEGMENT INFORMATION (continued)
| $ | | | $ | | | $ | () | | $ | | | | U.S. commercial and industrial | | | | | | | | | $ | | |
| Total United States | | | | | | | () | | $ | | |
| Europe | | | | | | | () | | $ | | |
| Asia-Pacific | | | | | | | | | $ | | |
| Rest of world | | | | | | | | | $ | | |
| NET SALES | $ | | | $ | | | $ | | | $ | () | | $ | | |
Our contracts with customers are broadly similar in nature throughout our reportable segments, but the amount, timing and uncertainty of revenue and cash flows may vary in each reportable segment due to geographic and end-market economic factors.
Sales to major customer - One customer, which is a customer of both the Roofing and Insulation segments, accounted for $ billion (%) and $ million (%) of consolidated sales in 2023 and 2021, respectively. No individual customers accounted for 10% or more of consolidated sales in 2022.
In the United States, sales are primarily related to the residential housing market and commercial and industrial applications. Residential market demand is driven by housing starts and repair and remodeling activity (influenced by existing home sales, seasonal home improvement and damage from major storms). Significant portions of our residential products across our reportable segments are used interchangeably in both new construction and repair and remodeling, and our customers typically distribute (or use) the products for both applications. U.S. commercial and industrial revenues are largely driven by U.S. industrial production growth, commercial construction activity and overall economic conditions in the U.S.
Outside of the United States (Europe, Asia-Pacific and Rest of world), sales are primarily related to commercial and industrial applications and, to a lesser extent, residential applications in certain countries. Throughout the international regions, demand is primarily driven by industrial production growth, commercial construction activity and overall economic conditions in each respective geographical region.
-75-
OWENS CORNING AND SUBSIDIARIES
NOTES TO CONSOLIDATED FINANCIAL STATEMENTS (continued)
2. SEGMENT INFORMATION (continued)
| | $ | | | | $ | | | | Insulation | | | | | | | | |
| Composites | | | | | | | | |
| Total reportable segments | | | | | | | | |
| Corporate, Other and Eliminations | | | | | |
| Restructuring costs | () | | | () | | | () | |
| Gain on sale of Santa Clara, California site | | | | | | | | |
| Pension settlement losses | () | | | | | | | |
| Gain on sale of land in India | | | | | | | | |
| Gain on sale of Shanghai, China facility | | | | | | | | |
| Gains on sale of certain precious metals | | | | | | | | |
| | |
| Intangible assets impairment charge | | | | () | | | | |
| Acquisition and divestiture-related costs | | | | () | | | | |
| | |
| | |
| Recognition of acquisition inventory fair value step-up | | | | | | | () | |
| | |
| | |
| | |
| Paroc marine recall | () | | | | | | | |
| Loss on sale of Chambery, France DUCS business | | | | () | | | | |
| Loss on sale of Russian operations | | | | () | | | | |
| Gain on remeasurement of Fiberteq equity investment | | | | | | | | |
| | |
| General corporate expense and other | () | | | () | | | () | |
| Total Corporate, other and eliminations | () | | | () | | | () | |
| EBIT | $ | | | | $ | | | | $ | | |
-76-
OWENS CORNING AND SUBSIDIARIES
NOTES TO CONSOLIDATED FINANCIAL STATEMENTS (continued)
2. SEGMENT INFORMATION (continued)
| | $ | | | | Insulation | | | | | |
| Composites | | | | | |
| Total reportable segments | | | | | |
|
| Cash and cash equivalents | | | | | |
| Noncurrent deferred income taxes | | | | | |
| Investments in affiliates | | | | | |
| Assets held for sale | | | | | |
| Corporate property, plant and equipment, other assets and eliminations | | | | | |
| CONSOLIDATED TOTAL ASSETS | $ | | | | $ | | |
| | $ | | | | Europe | | | | | |
| Asia-Pacific | | | | | |
| Rest of world | | | | | |
| CONSOLIDATED PROPERTY, PLANT AND EQUIPMENT | $ | | | | $ | | |
PROVISION FOR DEPRECIATION AND AMORTIZATION
| | $ | | | | $ | | | | Insulation | | | | | | | | |
| Composites | | | | | | | | |
| Total reportable segments | | | | | | | | |
| General corporate depreciation and amortization (a) | | | | | | | | |
CONSOLIDATED PROVISION FOR DEPRECIATION AND AMORTIZATION | $ | | | | $ | | | | $ | | |
(a)In 2023, 2022 and 2021, General corporate depreciation and amortization expense included $ million, $ million and $ million, respectively, of accelerated depreciation and amortization related to restructuring actions further explained in Note 12 to the Consolidated Financial Statements.
-77-
OWENS CORNING AND SUBSIDIARIES
NOTES TO CONSOLIDATED FINANCIAL STATEMENTS (continued)
2. SEGMENT INFORMATION (continued)
| | $ | | | | $ | | | | Insulation | | | | | | | | |
| Composites | | | | | | | | |
| Total reportable segments | | | | | | | | |
| General corporate additions | | | | | | | | |
CONSOLIDATED ADDITIONS TO PROPERTY, PLANT AND EQUIPMENT | $ | | | | $ | | | | $ | | |
3.
| | $ | | | | Materials and supplies | | | | | |
| Total inventories | $ | | | | $ | | |
4.
-78-
OWENS CORNING AND SUBSIDIARIES
NOTES TO CONSOLIDATED FINANCIAL STATEMENTS (continued)
4. DERIVATIVE FINANCIAL INSTRUMENTS (continued)
| | $ | | | | | |
| | |
| | |
| | |
| | |
| Derivative liabilities designated as hedging instruments: | | | | | |
| | |
| | |
| | |
| | |
| | |
| | |
| | |
| Cash flow hedges: | | | | | |
| Natural gas forward swaps | Other current liabilities | | $ | | | | $ | | |
| | |
| | |
| | |
| | |
| | |
| | |
| Derivative assets not designated as hedging instruments: | | | | | |
| | |
| Foreign exchange forward contracts | Other current assets | | $ | | | | $ | | |
| | |
| Derivative liabilities not designated as hedging instruments: | | | | | |
| | |
| Foreign exchange forward contracts | Other current liabilities | | $ | | | | $ | | |
Consolidated Statements of Earnings Activity
| $ | () | | $ | () | | | |
| |
| |
| Cross-currency swap net investment hedges: | | | | |
| Amount of gain recognized in earnings on derivative amounts excluded from effectiveness testing | Interest expense, net | $ | | | $ | () | | $ | () | |
| |
| |
| |
Derivative activity not designated as hedging instruments: | | | | |
| |
| |
| Foreign currency: | | | | |
| Amount of loss (gain) recognized in earnings (b) | Other expense (income), net | $ | | | $ | () | | $ | () | |
| Treasury interest rate lock: | | | | |
| Amount of gain recognized in earnings | Other expense (income), net | $ | | | $ | () | | $ | | |
(a)Accumulated Other Comprehensive Earnings (Deficit) (“AOCI”)
-79-
OWENS CORNING AND SUBSIDIARIES
NOTES TO CONSOLIDATED FINANCIAL STATEMENTS (continued)
4. DERIVATIVE FINANCIAL INSTRUMENTS (continued)
| $ | | | | Cash flow hedge | Natural gas forward swaps | $ | | | $ | () | |
| Cash flow hedge | Treasury interest rate lock | $ | | | $ | | |
|
|
|
Cash Flow Hedges
The Company uses a combination of derivative financial instruments, which qualify as cash flow hedges, and physical contracts to manage forecasted exposure to electricity and natural gas prices. As of December 31, 2023, the notional amounts of these natural gas forward swaps were million MMBTu (or MMBTu equivalent based on U.S. and European indices), compared with the notional amounts of million MMBTu at December 31, 2022. The Company has designated these natural gas forward swaps as cash flow hedges, with the last hedge maturing no later than March 2025. A net unrecognized loss of $ million related to these natural gas forward swaps was included in AOCI as of December 31, 2023, $ million of which is expected to be reclassified into earnings in the next 12 months.
In 2020, the Company entered into a $ million forward U.S. Treasury rate lock agreement to manage the U.S. Treasury portion of its interest rate risk associated with the anticipated issuance of certain 10-year fixed rate senior notes. The Company designated this outstanding forward U.S. Treasury rate lock agreement, which expired on December 15, 2022, as a cash flow hedge. The locked fixed rate of this agreement was %. In September 2022, a gain of $ million was recognized as a result of a change in the forecasted issuance of certain senior notes. In December 2022, the Company received cash of $ million upon the settlement of the rate lock agreement, of which $ million will be amortized as a component of interest expense upon the future issuance of senior notes. This unrecognized gain of $ million was included in AOCI as of December 31, 2023.
Net Investment Hedges
The Company has translation exposure resulting from translating the financial statements of foreign subsidiaries into U.S. Dollars, which is recognized in Currency translation adjustment (a component of AOCI). In the second quarter of 2022, the Company terminated the remaining cross-currency forward contracts related to the hedged portions of the net investment in foreign subsidiaries, resulting in cash proceeds of $ million.
Other Derivatives
The Company uses forward currency exchange contracts to manage existing exposures to foreign exchange risk related to assets and liabilities recorded on the Consolidated Balance Sheets. As of December 31, 2023, the Company had notional amounts of $ million for non-designated derivative financial instruments related to foreign currency exposures in U.S. Dollars primarily related to the Brazilian Real, Indian Rupee, Chinese Yuan, Hong Kong Dollar, South Korean Won, and the European Euro. In addition, the Company had notional amounts of $ million for non-designated derivative financial instruments related to foreign currency exposures in European Euro primarily related to the Polish Złoty, British Pound Sterling, and the U.S. Dollar.
-80-
OWENS CORNING AND SUBSIDIARIES
NOTES TO CONSOLIDATED FINANCIAL STATEMENTS (continued)
5.
| | $ | | | | $ | | | | $ | | |
Acquisitions (see Note 7) | | | | | | | () | | | () | |
| | | | |
| | | | |
| Foreign currency translation | | | | | | | | | | | |
Gross carrying amount at December 31, 2023 | | | | | | | | | | | |
| | | | | | | |
Accumulated impairment losses at December 31, 2022 | | | | () | | | | | | () | |
| | | | |
| Foreign currency translation | | | | () | | | | | | () | |
Accumulated impairment losses at December 31, 2023 | | | | () | | | | | | () | |
| | | | | | | |
Balance, net of impairment at December 31, 2023 | $ | | | | $ | | | | $ | | | | $ | | |
| | | | | | | | | | | | | | | | | | | | | | | |
| Roofing | | Insulation | | Composites | | Total |
Gross carrying amount at December 31, 2021 | $ | | | | $ | | | | $ | | | | $ | | |
Acquisitions (see Note 7) | | | | | | | | | | | |
| | | | |
| | | | |
| Foreign currency translation | () | | | () | | | () | | | () | |
Gross carrying amount at December 31, 2022 | | | | | | | | | | | |
| | | | | | | |
Accumulated impairment losses at December 31, 2021 | | | | () | | | | | | () | |
| | | | |
| Foreign currency translation | | | | | | | | | | | |
Accumulated impairment losses at December 31, 2022 | | | | () | | | | | | () | |
| | | | | | | |
Balance, net of impairment at December 31, 2022 | $ | | | | $ | | | | $ | | | | $ | | |
The annual tests performed in the fourth quarter of 2023 and 2022 resulted in impairment of goodwill. The annual 2023 testing indicated that the business enterprise values for the Roofing and Insulation reporting units substantially exceeded their respective carrying values. The business enterprise value of the Composites reporting unit exceeded its carrying value by approximately 5%. There is uncertainty surrounding the macroeconomic factors that impact this reporting unit and a sustained downturn in these factors or a change in the long-term revenue growth or profitability for this reporting unit could increase the likelihood of a future impairment.
-81-
OWENS CORNING AND SUBSIDIARIES
NOTES TO CONSOLIDATED FINANCIAL STATEMENTS (continued)
5. GOODWILL AND OTHER INTANGIBLE ASSETS (continued)
| | $ | — | | | $ | | | | $ | | | | $ | — | | | $ | | | | Amortizable intangible assets | | | | | | | | | | | |
| Customer relationships | | | | () | | | | | | | | | () | | | | |
| Technology | | | | () | | | | | | | | | () | | | | |
| Trademarks | | | | () | | | | | | | | | | | | | |
| Other (a) | | | | () | | | | | | | | | () | | | | |
| Total other intangible assets | $ | | | | $ | () | | | $ | | | | $ | | | | $ | () | | | $ | | |
Indefinite-Lived Intangible Assets
Fair values used in testing for potential impairment of our trademarks and trade names are calculated using the relief-from-royalty method by applying an estimated market value royalty rate to the forecasted revenues of the businesses that utilize those assets. The assumed cash flows from this calculation are discounted at a rate based on a market participant discount rate.
The annual test performed in the fourth quarter of 2023 resulted in impairment of indefinite-lived intangible assets.
There are indefinite-lived intangible assets that are at an increased risk of impairment, both of which are used by our Insulation segment and were partially impaired in the fourth quarter of 2022. A change in the estimated long-term revenue growth rate or discount rate for the segment could increase the likelihood of a future impairment.
| | Global cellular glass insulation trademark | $ | | |
All remaining indefinite-lived intangible assets substantially exceeded their carrying values as of December 31, 2023.
The annual tests performed in the fourth quarter of 2022 resulted in impairment of of the Company's indefinite-lived intangible assets. Based on the results of this testing, the Company recorded pre-tax non-cash impairment charges totaling $ million in the fourth quarter of 2022. These charges were recorded in Other expense (income), net on the Consolidated Statements of Earnings, and were included in the Corporate, Other and Eliminations reporting category.
These charges included the following within the Insulation segment: a pre-tax impairment charge of $ million for a trade name used by our European building and technical insulation business due to the effect of a higher discount rate, associated with rising interest rates, and general economic and geopolitical uncertainty within the European markets resulting in a slightly lower profitability outlook; a pre-tax impairment charge of $ million related to a trademark used on global cellular glass insulation products due to the effect of a higher discount rate, associated with rising interest rates, and general economic and geopolitical uncertainty within the European markets; a pre-tax impairment charge of $ million for a trademark used on stone wool insulation products sold in the United States due to forecasted profitability of the product line.
-82-
OWENS CORNING AND SUBSIDIARIES
NOTES TO CONSOLIDATED FINANCIAL STATEMENTS (continued)
5. GOODWILL AND OTHER INTANGIBLE ASSETS (continued)
million pre-tax impairment charge for trademarks used within the components business in our Roofing segment was due to the effect of a higher discount rate, associated with rising interest rates, and forecasted profitability of a specific product line. Definite-Lived Intangible Assets
The Company amortizes the cost of other intangible assets over their estimated useful lives which, individually, range up to years. The Company's future cash flows are not materially impacted by its ability to extend or renew agreements related to its amortizable intangible assets.
Amortization expense for intangible assets for the years ended December 31, 2023, 2022 and 2021 was $ million, $ million, and $ million, respectively. In 2023, amortization expense included $ million of accelerated amortization related to restructuring actions further explained in Note 12 to the Consolidated Financial Statements.
| | 2025 | $ | | |
| 2026 | $ | | |
| 2027 | $ | | |
| 2028 | $ | | |
6.
| | $ | | | | Buildings and leasehold improvements | | | | | |
| Machinery and equipment | | | | | |
| Construction in progress | | | | | |
| | | | | |
| Accumulated depreciation | () | | | () | |
| Property, plant and equipment, net | $ | | | | $ | | |
Machinery and equipment includes certain precious metals used in our production tooling, which comprise approximately % of total machinery and equipment as of December 31, 2023 and December 31, 2022.
-83-
OWENS CORNING AND SUBSIDIARIES
NOTES TO CONSOLIDATED FINANCIAL STATEMENTS (continued)
6. PROPERTY, PLANT AND EQUIPMENT (continued)
For the years ended December 31, 2023, 2022 and 2021, depreciation expense was $ million, $ million and $ million, respectively, which includes depletion expense related to precious metals used in our production tooling. In 2023, 2022 and 2021, depreciation expense included $ million, $ million and $ million, respectively, of accelerated depreciation related to restructuring actions further explained in Note 12 to the Consolidated Financial Statements.
7.
% interest in Fiberteq, LLC (“Fiberteq”), the joint venture between Owens Corning and IKO Industries, Ltd, which produces high-quality wet-formed fiberglass mat for roofing applications for $ million, net of cash acquired. During the third quarter of 2023, an additional $ million of consideration was paid as a result of final working capital adjustments. The acquisition advances the Composites strategy to focus on high-value material solutions and expands Owens Corning's capacity to produce non-woven mat. The Company's % interest in Fiberteq was accounted for as an equity-method investment and had a carrying value of $ million at the acquisition date. The Company used the discounted cash flow method to remeasure the previously held equity method investment to its fair value of $ million, resulting in the recognition of a gain of $ million, which is recorded in Gain on equity method investment on the 2022 Consolidated Statements of Earnings. The operating results for Fiberteq have been included in the Composites segment within the Consolidated Financial Statements since the date of the acquisition. The purchase price allocation included $ million in intangible assets, which primarily consists of customer relationships with an estimated weighted average life of years, a $ million unfavorable contract liability and $ million in goodwill, of which % is tax deductible. The factors contributing to the recognition of the amount of goodwill are based on several strategic and synergistic benefits that are expected to be realized from the acquisition. The pro-forma effect of this acquisition on revenues and earnings was not material.
On August 1, 2022, the Company acquired Natural Polymers, LLC (“Natural Polymers”), an innovative manufacturer of spray polyurethane foam insulation for building and construction applications for $ million, net of cash acquired. The acquisition advances the Owens Corning strategy to strengthen the Company's core building and construction products and expand its addressable markets into higher-growth segments. The operating results for Natural Polymers have been included in the Insulation segment within the Consolidated Financial Statements since the date of the acquisition. The purchase price allocation included $ million in intangible assets and $ million in goodwill, of which all is tax deductible. The intangible assets consist of definite-lived trademarks of $ million with an estimated weighted average life of years, technology of $ million with an estimated weighted average life of years and customer relationships of $ million with an estimated weighted average life of years. The factors contributing to the recognition of the amount of goodwill are based on several strategic and synergistic benefits that are expected to be realized from the acquisition. The pro-forma effect of this acquisition on revenues and earnings was not material. On June 1, 2022, the Company acquired all of the outstanding assets of WearDeck®, a premium producer of composite weather-resistant decking for commercial and residential applications, for $ million, net of cash acquired. The acquisition advances the Composites business growth strategy to focus on high-value material solutions within the building and construction industry. The operating results for WearDeck® have been included in the Composites segment within the Consolidated Financial Statements since the date of the acquisition. The purchase price allocation included $ million in intangible assets and $ million in goodwill, of which $ million is tax deductible. The intangible assets consist of definite-lived trademarks of $ million with an estimated average life of years, technology of $ million with an estimated weighted average life of years and customer relationships of $ million with an estimated weighted average life of years. The factors contributing to the recognition of the amount of goodwill are based on several strategic and synergistic benefits that are expected to be realized from the acquisition. The pro-forma effect of this acquisition on revenues and earnings was not material.
-84-
OWENS CORNING AND SUBSIDIARIES
NOTES TO CONSOLIDATED FINANCIAL STATEMENTS (continued)
7. ACQUISITIONS (continued)
million, net of cash acquired. The acquisition broadens the Company’s global non-wovens portfolio to better serve European customers and accelerate growth of building and construction market applications in the region. The operating results for vliepa have been included in the Company’s Composites segment within the Consolidated Financial Statements since the date of the acquisition. The acquisition resulted in the recognition of $ million in intangible assets, primarily consisting of customer relationships with an estimated weighted average life of years, and $ million in goodwill. The pro-forma effect of this acquisition on revenues and earnings was not material.
8.
million and primarily consisted of land. In March 2023, the Company finalized the sale for total proceeds of $ million, net of transaction fees. Total proceeds included a non-refundable deposit of $ million received in the third quarter of 2021. As a result, the Company recognized a pre-tax gain of $ million in the first quarter of 2023, which is recorded in Gain on sale of site on the Consolidated Statements of Earnings.
On November 24, 2022, the Company finalized the sale of its Russian operations within the Composites and Insulation segments. As a result of this sale, the Company received $ million, net of cash sold, in consideration and recorded a pre-tax loss of $ million in Other expense (income), net on the Consolidated Statements of Earnings.
On July 1, 2022, the Company finalized the sale of the European portion of the dry-use chopped strands (“DUCS”) product line located in Chambéry, France, within the Composites segment. As a result of this sale, the Company received $ million, net of cash sold, in consideration and recorded a pre-tax loss of $ million in Other expense (income), net on the Consolidated Statements of Earnings.
-85-
OWENS CORNING AND SUBSIDIARIES
NOTES TO CONSOLIDATED FINANCIAL STATEMENTS (continued)
9.
| | $ | | | | Finance lease assets | Other non-current assets | | | | | |
| Total lease assets | | $ | | | | $ | | |
| | | | |
| Liabilities | | | | |
| Current | | | | |
| Operating | Current operating lease liabilities | $ | | | | $ | | |
| Finance | Long-term debt – current portion | | | | | |
| Non-current | | | | |
| Operating | Non-current operating lease liabilities | | | | | |
| Finance | Long-term debt, net of current portion | | | | | |
| Total lease liabilities | | $ | | | | $ | | |
-86-
OWENS CORNING AND SUBSIDIARIES
NOTES TO CONSOLIDATED FINANCIAL STATEMENTS (continued)
9. LEASES (continued)
| | $ | | | | $ | | | | Finance lease cost | | | | | |
| Amortization of right-of-use asset | $ | | | | $ | | | | $ | | |
| Interest on lease liabilities | $ | | | | $ | | | | $ | | |
| Short-term lease cost | $ | | | | $ | | | | $ | | |
| Variable lease cost | $ | | | | $ | | | | $ | | |
Cash paid for operating leases included $ million, $ million and $ million in the years ended December 31, 2023, 2022 and 2021, respectively. Cash paid for finance leases included $ million for financing activities and $ million for operating activities for the year ended December 31, 2023. Cash paid for finance leases included $ million for financing activities and $ million for operating activities for the year ended December 31, 2022. Cash paid for finance leases included $ million for financing activities and $ million for operating activities for the year ended December 31, 2021.
We added $ million, $ million and $ million of operating lease liabilities as a result of obtaining operating lease right-of-use assets in the years ended December 31, 2023, 2022 and 2021 respectively. We added $ million, $ million and $ million of finance lease liabilities as a result of obtaining finance lease right-of-use assets in the years ended December 31, 2023, 2022 and 2021 respectively.
Other Information
| | | | | Finance leases | | | | | |
| | | | | | | | | | | | | | | | | |
| December 31, |
| Weighted-average discount rate | 2023 | | 2022 | | 2021 |
| Operating leases | | % | | | % | | | % |
| Finance leases | | % | | | % | | | % |
-87-
OWENS CORNING AND SUBSIDIARIES
NOTES TO CONSOLIDATED FINANCIAL STATEMENTS (continued)
9. LEASES (continued)
| $ | | | | 2025 | | | | |
| 2026 | | | | |
| 2027 | | | | |
| 2028 | | | | |
| 2029 and beyond | | | | |
| Total minimum lease payments | | | | |
| Less: implied interest | | | | |
| Present value of future minimum lease payments | | | | |
| Less: current lease obligations | | | | |
| Long-term lease obligations | $ | | | $ | | |
10.
| | $ | | | | Income, property, and other non-payroll taxes | | | | | |
| Other | | | | | |
| Total other current liabilities | $ | | | | $ | | |
11.
| | $ | | | | Amounts accrued for current year | | | | | |
| Settlements of warranty claims | () | | | () | |
| Ending balance | $ | | | | $ | | |
-88-
OWENS CORNING AND SUBSIDIARIES
NOTES TO CONSOLIDATED FINANCIAL STATEMENTS (continued)
12.
million to $ million, primarily related to severance and other exit costs, including termination costs, and non-cash charges in the range of $ million to $ million, primarily related to accelerated depreciation.
During 2023, the Company recorded $ million of charges, of which $ million were non-cash charges, primarily related to accelerated depreciation and $ million of cash charges, primarily related to severance.
Building Materials Asia-Pacific Optimization
In December 2023, the Company took actions to further its ongoing cost optimization strategy for the Insulation segment by permanently closing the Xi'an, China facility, which had previously ceased operations, and permanently closing one idled production line at the Guangde, China facility. These actions are expected to result in cumulative costs of approximately $ million, primarily related to accelerated depreciation.
During 2023, the Company recorded $ million of charges primarily related to accelerated depreciation. The Company does not expect to recognize significant incremental costs related to these actions.
Protective Packaging Exit
In May 2023, the Company made the decision to exit the Protective Packaging business within the Roofing segment, including the production and sale of wood packaging, metal packaging and custom products. Exiting Protective Packaging will allow the Company to focus resources on the growth of its building materials products, which supports the future growth aspirations of the enterprise. With the exit of the Protective Packaging business, the Company closed its plants in Dorval, Quebec and Mission, British Columbia, Canada. The Company also ceased operations at its Qingdao, China facility.
In connection with the exit of the Protective Packaging business, the Company estimates that it will incur cash charges of approximately $ million, primarily related to severance and other exit costs. Additionally, the Company will incur total non-cash charges in the range of $ to $ million, primarily related to accelerated depreciation of property, plant and equipment and accelerated amortization of definite-lived intangibles.
During 2023, the Company recorded $ million of charges, of which $ million were non-cash charges, primarily related to accelerated depreciation, amortization and inventory write-offs and $ million of cash charges, primarily related to severance.
Wabash Facility Closure
In April 2023, the Company took actions to support its strategy to operate a flexible and cost-efficient manufacturing network through decisions to relocate the Wabash, Indiana mineral wool operations to Joplin, Missouri, and to exit the U.S. granulated mineral wool market. These actions are expected to result in cumulative costs of approximately $ million, primarily related to severance and accelerated depreciation.
During 2023, the Company recorded $ million of charges, primarily related to accelerated depreciation, severance and other exit costs. The Company does not expect to recognize significant incremental costs related to these actions.
-89-
OWENS CORNING AND SUBSIDIARIES
NOTES TO CONSOLIDATED FINANCIAL STATEMENTS (continued)
12. RESTRUCTURING, ACQUISITION AND DIVESTITURE-RELATED COSTS (continued)
During 2023, the Company recorded $ million of charges primarily related to severance costs.
Composites Strategic Realignment Actions
On July 1, 2022, the Company finalized the sale of the European portion of the DUCS product line located in Chambéry, France, within the Company's Composites segment. The Company recorded a pre-tax charge of $ million in Other expense (income), net on the Consolidated Statements of Earnings in 2022 to reflect the fair value less cost to sell the assets. The Company also took actions to convert the DUCS manufacturing facilities located in Anderson, South Carolina and Kimchon, Korea to produce other glass fiber products needed to support our growth strategy in building and construction applications.
As a result, during 2023, the Company recorded $ million of charges primarily related to other exit costs. The Company does not expect to recognize significant incremental costs related to these actions.
Roofing Restructuring Actions
In December 2021, the Company took actions to restructure operations within the Roofing segment's components product line by relocating production assets from China to India, which allowed the business to optimize its manufacturing network and support a tariff mitigation strategy.
During 2023, the Company recorded $ million of charges primarily related to other exit costs. The Company does not expect to recognize significant incremental charges related to these actions.
Santa Clara Insulation Site
During the third quarter of 2021, the Company entered into a sales agreement for the Company's Insulation site in Santa Clara, California as part of the Company's on-going strategy to operate a flexible, cost-efficient manufacturing network and geographically locate its assets to better serve its customers. On March 3, 2023, the Company finalized the sale of this site for total proceeds of $ million, net of transaction fees. Total proceeds included a non-refundable deposit of $ million received in the third quarter of 2021.
During 2023, the Company recorded $ million of charges, primarily related to other exit costs. The Company does not expect to recognize significant incremental costs related to this action.
-90-
OWENS CORNING AND SUBSIDIARIES
NOTES TO CONSOLIDATED FINANCIAL STATEMENTS (continued)
12. RESTRUCTURING, ACQUISITION AND DIVESTITURE-RELATED COSTS (continued)
) | $ | () | | $ | () | | | Other exit (costs) gains | Cost of sales | () | | () | | () | |
| Recognition of acquisition inventory fair value step-up | Cost of sales | | | | | () | |
| Other exit (costs) gains | Marketing and administrative expenses | () | | | | () | |
| Acquisition and divestiture-related (costs) gains | Marketing and administrative expenses | | | () | | | |
| Severance | Other expense (income), net | () | | () | | () | |
| Other exit (costs) gains | Other expense (income), net | () | | () | | | |
| Accelerated amortization | Other expense (income), net | () | | | | | |
| Acquisition and divestiture-related (costs) gains | Gain on equity method investment | | | | | | |
| Gain on sale of Santa Clara, California site | Gain on sale of site | | | | | | |
| Other exit (costs) gains | Non-operating expense (income), net | | | | | () | |
| Total restructuring, acquisition and divestiture-related gains (costs) | | $ | | | $ | | | $ | () | |
-91-
OWENS CORNING AND SUBSIDIARIES
NOTES TO CONSOLIDATED FINANCIAL STATEMENTS (continued)
12. RESTRUCTURING, ACQUISITION AND DIVESTITURE-RELATED COSTS (continued)
| $ | | | $ | | | $ | | | | | | | Restructuring costs | | | | | | | | | | | |
| Payments | | | () | | () | | () | | | | |
| Accelerated depreciation and other non-cash items | () | | () | | () | | () | | | | |
| Balance at December 31, 2023 | $ | | | $ | | | $ | | | $ | | | | | |
| Cumulative charges incurred | $ | | | $ | | | $ | | | $ | | | | | |
| | | | | | | | | | | | | | |
| December 31, 2023 (continued) |
| European Operating Structure Optimization | Composites Strategic Realignment Actions | Roofing Restructuring Actions | Santa Clara Insulation Site |
| Balance at December 31, 2022 | $ | | | $ | | | $ | | | $ | | |
| Restructuring costs | | | | | | | | |
| Payments | () | | () | | () | | () | |
| Accelerated depreciation and other non-cash items | | | | | | | () | |
| Balance at December 31, 2023 | $ | | | $ | | | $ | | | $ | | |
| Cumulative charges incurred | $ | | | $ | | | $ | | | $ | | |
As of December 31, 2023, the remaining liability balance is comprised of $ million of severance, which the Company expects to pay over the next twelve months.
| $ | | | $ | | | $ | | | $ | | |
| Restructuring costs (gains) | | | | | | | | | () | |
| Payments | () | | | | () | | () | | () | |
| Accelerated depreciation and other non-cash items | () | | () | | () | | () | | | |
| Balance at December 31, 2022 | $ | | | $ | | | $ | | | $ | | | $ | | |
| Cumulative charges incurred | $ | | | $ | | | $ | | | $ | | | $ | | |
As of December 31, 2022, the remaining liability balance is comprised of $ million of severance, which the Company expects to pay over the next twelve months.
-92-
OWENS CORNING AND SUBSIDIARIES
NOTES TO CONSOLIDATED FINANCIAL STATEMENTS (continued)
% senior notes, net of discount and financing fees, due 2024$ | | | | % | | $ | | | | % | % senior notes, net of discount and financing fees, due 2026 | | | | % | | | | | % |
% senior notes, net of discount and financing fees, due 2029 | | | | % | | | | | % |
% senior notes, net of discount and financing fees, due 2030 | | | | % | | | | | % |
% senior notes, net of discount and financing fees, due 2036 | | | | % | | | | | % |
% senior notes, net of discount and financing fees, due 2047 | | | | % | | | | | % |
% senior notes, net of discount and financing fees, due 2048 | | | | % | | | | | % |
| | |
| | |
|
|
| | | $ | | |
Debt Maturities
| | 2025 | | |
| 2026 | | |
| 2027 | | |
| 2028 | | |
| 2029 and beyond | | |
| Total | $ | | |
Short-Term Debt
At December 31, 2023 and December 31, 2022, short-term borrowings were $ million. The short-term borrowings for both periods consisted of various operating lines of credit. The weighted average interest rate on all short-term borrowings was approximately % and % for December 31, 2023 and December 31, 2022, respectively.
-95-
OWENS CORNING AND SUBSIDIARIES
NOTES TO CONSOLIDATED FINANCIAL STATEMENTS (continued)
14.
agreements to purchase non-participating annuity contracts from insurance companies to transfer $ million of the Company's outstanding pension projected benefit obligation (“PBO”) related to certain U.S. and non-U.S. pension plans. These transactions were funded with pension plan assets of $ million. As a result of these transactions, the Company recognized a pre-tax settlement charge of $ million in the fourth quarter of 2023 from the accelerated recognition of a pro rata portion of plan actuarial losses. This charge was recorded in Non-operating expense (income), net on the Consolidated Statements of Earnings. These transactions did not have a material effect on the plans' funded statuses. | | $ | | | | $ | | | | $ | | | | $ | | | | $ | | | | Service cost | | | | | | | | | | | | | | | | | |
| Interest cost | | | | | | | | | | | | | | | | | |
| Actuarial (gain) loss | () | | | | | | () | | | () | | | () | | | () | |
| Currency loss (gain) | | | | | | | | | | | | | () | | | () | |
| Benefits paid | () | | | () | | | () | | | () | | | () | | | () | |
| | | | | | | | |
| Settlements/curtailments | () | | | () | | | () | | | | | | () | | | () | |
| | | | | | | | |
| Other | | | | | | | | | | | | | () | | | () | |
| Benefit obligation at end of period | $ | | | | $ | | | | $ | | | | $ | | | | $ | | | | $ | | |
| | $ | | | | $ | | | | $ | | | | $ | | | | $ | | | | Actual return on plan assets | | | | | | | | | | () | | | () | | | () | |
| Currency gain (loss) | | | | | | | | | | | | | () | | | () | |
| Company contributions | | | | | | | | | | | | | | | | | |
| Benefits paid | () | | | () | | | () | | | () | | | () | | | () | |
| Settlements/curtailments | () | | | () | | | () | | | | | | () | | | () | |
| | | | | | | | |
| | | | | | | | |
| Fair value of assets at end of period | | | | | | | | | | | | | | | | | |
| Funded status | $ | () | | | $ | () | | | $ | () | | | $ | () | | | $ | () | | | $ | () | |
-96-
OWENS CORNING AND SUBSIDIARIES
NOTES TO CONSOLIDATED FINANCIAL STATEMENTS (continued)
14. PENSION PLANS (continued)
| | $ | | | | $ | | | | $ | | | | $ | | | | $ | | | | Accrued pension cost – current | Other current liabilities | | | | () | | | () | | | () | | | () | | | () | |
| Accrued pension cost – non-current | Pension plan liability | () | | | () | | | () | | | () | | | () | | | () | |
| Total amount recorded | | $ | () | | | $ | () | | | $ | () | | | $ | () | | | $ | () | | | $ | () | |
) | | $ | () | | | $ | () | | | $ | () | | | $ | () | | | $ | () | | | Net prior service cost | | | | () | | | () | | | | | | () | | | () | |
| Total amount recorded | $ | () | | | $ | () | | | $ | () | | | $ | () | | | $ | () | | | $ | () | |
For the year ended December 31, 2023, the actuarial gain of $ million was largely the result of the impacts related to the annuity purchase settlement offset by losses due to decreased discount rates. In the U.S. plan, the actuarial gain was primarily driven by the settling of the annuity purchase at a lower value relative to the PBO held at the time. The gain was slightly offset by an actuarial loss due to the decrease in the discount rate. In the Non-U.S. plans, the actuarial loss was primarily driven by a decrease in the discount rates across all the plans.
For the year ended December 31, 2022, the actuarial gain of $ million was largely the result of increases in discount rates across all plans. In the U.S. plan, the actuarial gain was primarily driven by the increase in the discount rate. The gain was slightly offset by the unfavorable impact of differences between expected and actual pension experience. In the Non-U.S. plans, the actuarial gain was driven by an increase in the discount rate of the U.K. and Canada plans, partially offset by the unfavorable impact of differences between expected and actual pension experience.
| | $ | | | | $ | | | | $ | | | | $ | | | | $ | | | | Fair value of plan assets | $ | | | | $ | | | | $ | | | | $ | | | | $ | | | | $ | | |
| Plans with ABO in excess of fair value of plan assets: | | | | | | | | | | | |
| Accumulated benefit obligation | $ | | | | $ | | | | $ | | | | $ | | | | $ | | | | $ | | |
| Fair value of plan assets | $ | | | | $ | | | | $ | | | | $ | | | | $ | | | | $ | | |
-97-
OWENS CORNING AND SUBSIDIARIES
NOTES TO CONSOLIDATED FINANCIAL STATEMENTS (continued)
14. PENSION PLANS (continued)
% | | | % | | Cash balance interest crediting rate | | % | | | % |
| Non-United States Plans | | | |
| Discount rate | | % | | | % |
| Rate of compensation increase | | % | | | % |
Components of Net Periodic Pension Cost
| | $ | | | | $ | | | | Interest cost | | | | | | | | |
| Expected return on plan assets | () | | | () | | | () | |
| Amortization of actuarial loss | | | | | | | | |
| Settlement/curtailment | | | | | | | | |
| Other | | | | | | | | |
| Net periodic pension cost | $ | | | | $ | | | | $ | | |
| | | | | |
| Non-United States Plans | | | | | |
| Service cost | $ | | | | $ | | | | $ | | |
| Interest cost | | | | | | | | |
| Expected return on plan assets | () | | | () | | | () | |
| Amortization of actuarial loss | | | | | | | | |
| Settlement/curtailment | | | | () | | | | |
| Other | | | | | | | | |
| Net periodic pension cost | $ | | | | $ | | | | $ | | |
| | | | | |
| Total | | | | | |
| Service cost | $ | | | | $ | | | | $ | | |
| Interest cost | | | | | | | | |
| Expected return on plan assets | () | | | () | | | () | |
| Amortization of actuarial loss | | | | | | | | |
| Settlement/curtailment | | | | () | | | | |
| Other | | | | | | | | |
| Net periodic pension cost | $ | | | | $ | | | | $ | | |
-98-
OWENS CORNING AND SUBSIDIARIES
NOTES TO CONSOLIDATED FINANCIAL STATEMENTS (continued)
14. PENSION PLANS (continued)
% | | | | | % | | | | | % | | | | Expected return on plan assets | | % | | | | | % | | | | | % | | |
| Cash balance interest crediting rate | | % | | | | | % | | | | | % | | |
| Rate of compensation increase | N/A | | (a) | | N/A | | (a) | | N/A | | (a) |
| Non-United States Plans | | | | | | | | | | | |
| Discount rate | | % | | | | | % | | | | | % | | |
| Expected return on plan assets | | % | | | | | % | | | | | % | | |
| Rate of compensation increase | | % | | | | | % | | | | | % | | |
(a) Not applicable due to changes in plan made on August 1, 2009 that were effective beginning January 1, 2010.
The expected return on plan assets assumption is derived by taking into consideration the target plan asset allocation, historical rates of return on those assets, projected future asset class returns and net outperformance of the market by active investment managers. An asset return model is used to develop an expected range of returns on plan investments over a year period, with the expected rate of return selected from a best estimate range within the total range of projected results. The result is then rounded down to the nearest basis points.
Items Measured at Fair Value
The Company classifies and discloses pension plan assets in one of the following three categories:
Level 1: Quoted market prices in active markets for identical assets.
Level 2: Observable market-based inputs or unobservable inputs that are corroborated by market data.
Level 3: Unobservable inputs that are not corroborated by market data.
Plan Assets
The tables in this section show pension plan asset fair values and fair value leveling information. The assets are categorized into one of the three levels of the fair value hierarchy or are not subject to leveling, in the case of investments that are valued using the net asset value per share (or its equivalent) practical expedient (“NAV”).
-99-
OWENS CORNING AND SUBSIDIARIES
NOTES TO CONSOLIDATED FINANCIAL STATEMENTS (continued)
14. PENSION PLANS (continued)
| | $ | | | | $ | | | | $ | | | | | | | | | | | | |
| Fixed income and cash equivalents: | | | | | | | | |
| Corporate bonds | | | | | | | | | | | | |
| Government debt | | | | | | | | | | | | |
| | | | | | | | |
| Total United States plan assets subject to leveling | $ | | | | $ | | | | $ | | | | | | |
| | | | | | | | |
| Plan assets measured at NAV: | | | | | | | | |
| Equities | | | | | | | | | |
| Real assets | | | | | | | | | |
| Fixed income and cash equivalents | | | | | | | | | |
| Absolute return strategies | | | | | | | | | |
| Total United States plan assets | | | | | | | $ | | | |
| | | | | | | | | | | | | | | | | | | | | | | |
| | December 31, 2022 |
| Asset Category | Level 1 | | Level 2 | | Level 3 | | Total |
| Equities: | | | | | | | |
| Domestic | $ | | | | $ | | | | $ | | | | $ | | |
| | | | |
| Fixed income and cash equivalents: | | | | | | | |
| Corporate bonds | | | | | | | | | | | |
| Government debt | | | | | | | | | | | |
| | | | |
| Total United States plan assets subject to leveling | $ | | | | $ | | | | $ | | | | | |
| | | | | | | |
| Plan assets measured at NAV: | | | | | | | |
| Equities | | | | | | | | |
| Real assets | | | | | | | | |
| Fixed income and cash equivalents | | | | | | | | |
| Absolute return strategies | | | | | | | | |
| Total United States plan assets | | | | | | | $ | | |
-100-
OWENS CORNING AND SUBSIDIARIES
NOTES TO CONSOLIDATED FINANCIAL STATEMENTS (continued)
14. PENSION PLANS (continued)
| | $ | | | | $ | | | | $ | | | |
| | | | | | | | |
| Fixed income and cash equivalents: | | | | | | | | |
| Cash and cash equivalents | | | | | | | | | | | | |
| Fixed income | | | | | | | | | | | | |
| Total non-United States plan assets subject to leveling | $ | | | | $ | | | | $ | | | | | | |
| | | | | | | | |
| Plan assets measured at NAV: | | | | | | | | |
| Equities | | | | | | | | | |
| | | | | | | | |
| Fixed income and cash equivalents | | | | | | | | | |
| Absolute return strategies and other | | | | | | | | | |
| Total non-United States plan assets | | | | | | | $ | | | |
| | | | | | | | | | | | | | | | | | | | | | | |
| | December 31, 2022 |
| Asset Category | Level 1 | | Level 2 | | Level 3 | | Total |
| | | | |
| Equities | $ | | | | $ | | | | $ | | | | $ | | |
| | | | |
| Fixed income and cash equivalents: | | | | | | | |
| Cash and cash equivalents | | | | | | | | | | | |
| Corporate bonds | | | | | | | | | | | |
| Total non-United States plan assets subject to leveling | $ | | | | $ | | | | $ | | | | | |
| | | | | | | |
| Plan assets measured at NAV: | | | | | | | |
| Equities | | | | | | | | |
| | | | |
| Fixed income and cash equivalents | | | | | | | | |
| Absolute return strategies | | | | | | | | |
| Total non-United States plan assets | | | | | | | $ | | |
| | | | | | | |
Investment Strategy
The current targeted asset allocation for the United States pension plan is to have % of assets invested in equities, % in intermediate and long-term fixed income securities, high yield and cash and % in other strategies. Assets are rebalanced at least quarterly to conform to policy tolerances. The Company actively evaluates the reasonableness of its asset mix given changes in the projected benefit obligation and market dynamics. Our investment policy and asset mix for the non-United States pension plans varies by location and is based on projected benefit obligation and market dynamics.
-101-
OWENS CORNING AND SUBSIDIARIES
NOTES TO CONSOLIDATED FINANCIAL STATEMENTS (continued)
14. PENSION PLANS (continued)
|
| 2025 | | $ | | |
| 2026 | | $ | | |
| 2027 | | $ | | |
| 2028 | | $ | | |
| 2029-2033 | | $ | | |
Contributions
The Company expects to contribute $ million in cash to its defined benefit pension plans during 2024. Actual contributions to the plans may change as a result of a variety of factors, including changes in laws that impact funding requirements.
Defined Contribution Plans
The Company sponsors defined contribution plans which are available to substantially all United States employees. The Company matches a percentage of employee contributions up to a maximum level and contributes up to % of an employee’s wages regardless of employee contributions. The Company recognized expense of $ million, $ million and $ million during the years ended December 31, 2023, 2022 and 2021, respectively, related to these plans.
-102-
OWENS CORNING AND SUBSIDIARIES
NOTES TO CONSOLIDATED FINANCIAL STATEMENTS (continued)
15.
years of service after age , or , depending on the category of employee. For employees hired after December 31, 2005, the Company does not provide subsidized retiree health care. Some of the plans are contributory, with some retiree contributions adjusted annually. The Company has reserved the right to change or eliminate these benefit plans subject to the terms of collective bargaining agreements. | | $ | | | | $ | | | | $ | | | | $ | | | | $ | | | | Service cost | | | | | | | | | | | | | | | | | |
| Interest cost | | | | | | | | | | | | | | | | | |
| Actuarial gain | () | | | | | | () | | | () | | | () | | | () | |
| Currency gain | | | | | | | | | | | | | () | | | () | |
| | | | | | | | |
| Benefits paid | () | | | | | | () | | | () | | | | | | () | |
| | | | | | | | |
| | | | | | | | |
| Benefit obligation at end of period | $ | | | | $ | | | | $ | | | | $ | | | | $ | | | | $ | | |
| Funded status | $ | () | | | $ | () | | | $ | () | | | $ | () | | | $ | () | | | $ | () | |
) | | $ | () | | | $ | () | | | $ | () | | | $ | () | | | $ | () | | | Accrued benefit obligation – non-current | Other employee benefits liability | () | | | () | | | () | | | () | | | () | | | () | |
| Net amount recorded | | $ | () | | | $ | () | | | $ | () | | | $ | () | | | $ | () | | | $ | () | |
-103-
OWENS CORNING AND SUBSIDIARIES
NOTES TO CONSOLIDATED FINANCIAL STATEMENTS (continued)
15. POSTEMPLOYMENT AND POSTRETIREMENT BENEFITS OTHER THAN PENSIONS (continued)
) | | $ | () | | | $ | () | | | $ | | | | $ | | | | $ | | | | Net prior service credit | | | | | | | | | | | | | | | | | |
| Total amount recorded | $ | () | | | $ | () | | | $ | () | | | $ | | | | $ | | | | $ | | |
| | | | | | | | |
Weighted-Average Assumptions Used to Determine Benefit Obligations
% | | | % |
| Rate of compensation increase | N/A | | N/A |
| Non-United States plans | | | |
| Discount rate | | % | | | % |
| Rate of compensation increase | | % | | | % |
Components of Net Periodic Postretirement Benefit Income
| | $ | | | | $ | | | | Interest cost | | | | | | | | |
| Amortization of prior service credit | | | | | | | () | |
| Amortization of actuarial loss | () | | | () | | | () | |
| | |
| Net periodic postretirement benefit income | $ | () | | | $ | () | | | $ | () | |
There was no significant net periodic postretirement income attributable to non-U.S. plans.
-104-
OWENS CORNING AND SUBSIDIARIES
NOTES TO CONSOLIDATED FINANCIAL STATEMENTS (continued)
15. POSTEMPLOYMENT AND POSTRETIREMENT BENEFITS OTHER THAN PENSIONS (continued)
% | | | % | | | % | | Non-United States plans | | % | | | % | | | % |
% | | | % | | | % | | Ultimate rate | | % | | | % | | | % |
| Year in which ultimate rate is reached | | | | | |
| Non-United States plans: | | | | | |
| Initial rate at end of year | | % | | | % | | | % |
| Ultimate rate | | % | | | % | | | % |
| Year in which ultimate rate is reached | | | | | |
Estimated Future Benefit Payments
| | 2025 | $ | | |
| 2026 | $ | | |
| 2027 | $ | | |
| 2028 | $ | | |
| 2029-2033 | $ | | |
Postemployment Benefits
The Company may also provide benefits to former or inactive employees after employment but before retirement under certain conditions. These benefits include continuation of benefits such as health care and life insurance coverage. The accrued postemployment benefits liability was $ million at December 31, 2023 and 2022. The net periodic postemployment benefit expense/(income) for the years ended December 31, 2023, 2022 and 2021 were less than $ million, less than $ million and less than $() million, respectively.
-105-
OWENS CORNING AND SUBSIDIARIES
NOTES TO CONSOLIDATED FINANCIAL STATEMENTS (continued)
16.
-106-
OWENS CORNING AND SUBSIDIARIES
NOTES TO CONSOLIDATED FINANCIAL STATEMENTS (continued)
16. CONTINGENT LIABILITIES AND OTHER MATTERS (continued)
million for these costs, of which the current portion is $ million. Changes in required remediation procedures or timing of those procedures, or discovery of contamination at additional sites, could result in material increases to the Company’s environmental obligations.
17.
million.
Prior to the 2023 Stock Plan, employees were eligible to receive stock awards under the Owens Corning 2019 Stock Plan.
Total Stock-Based Compensation Expense
| | $ | | | | $ | | | | Income tax benefit recognized on stock-based compensation expense | $ | | | | $ | | | | $ | | |
Stock Options
The Company has granted stock options under its stockholder approved stock plans. The Company calculates a weighted-average grant-date fair value using a Black-Scholes valuation model for options granted. Compensation expense for options is measured based on the fair market value of the option on the date of grant, and is recognized on a straight-line basis over a vesting period. In general, the exercise price of each option awarded was equal to the closing market price of the Company’s common stock on the date of grant and an option’s maximum term is years. The volatility assumption was based on a benchmark study of our peers prior to 2014. Starting with the options granted in 2014, the volatility was based on the Company’s historic volatility.
The Company has not granted stock options since the year ended December 31, 2014. As of December 31, 2023, there was unrecognized compensation cost related to stock options and the exercise prices on outstanding stock options was $.
-107-
OWENS CORNING AND SUBSIDIARIES
NOTES TO CONSOLIDATED FINANCIAL STATEMENTS (continued)
17. STOCK COMPENSATION (continued)
| | $ | | | | | | $ | | | | | | | |
| Exercised | () | | | | | | | | |
| | | | |
| | | | |
Outstanding, December 31, 2023 | | | | $ | | | | | | $ | | |
Exercisable, December 31, 2023 | | | | $ | | | | | | $ | | |
| | $ | | | | $ | | | | Income tax benefit received for stock option awards exercised | $ | | | | $ | | | | $ | | |
Restricted Stock Units
The Company has granted restricted stock units (“RSUs”) under its stockholder-approved stock plans. Generally, all outstanding RSUs will fully settle in stock. Compensation expense for RSUs is measured based on the closing market price of the stock at date of grant and is recognized on a straight-line basis over the vesting period, which is typically three or . The Stock Plan allows alternate vesting schedules for death, disability and retirement.
The weighted average grant date fair value of RSUs granted in 2023, 2022 and 2021 was $, $ and $, respectively.
| | $ | | | | Granted | | | | | |
| Vested | () | | | | |
| Forfeited | () | | | | |
Balance at December 31, 2023 | | | | $ | | |
As of December 31, 2023, there was $ million of total unrecognized compensation cost related to RSUs. That cost is expected to be recognized over a weighted-average period of years. The total grant date fair value of stock vested during the years ended December 31, 2023, 2022 and 2021 was $ million, $ million and $ million, respectively.
Performance Share Units
The Company has granted performance share units (“PSUs”) as a part of its long-term incentive plan. All outstanding PSUs will fully settle in stock. The amount of shares ultimately distributed from the 2023, 2022 and 2021 grants is contingent on meeting internal company-based metrics or an external-based stock performance metric.
In 2023, 2022 and 2021, the Company granted both internal company-based and external-based metric PSUs.
-108-
OWENS CORNING AND SUBSIDIARIES
NOTES TO CONSOLIDATED FINANCIAL STATEMENTS (continued)
17. STOCK COMPENSATION (continued)
The initial fair value for all internal company-based metric PSUs assumes that the performance goals will be achieved and is based on the grant date stock price. This assumption is monitored quarterly and if it becomes probable that such goals will not be achieved or will be exceeded, compensation expense recognized will be adjusted and previous surplus compensation expense recognized will be reversed or additional expense will be recognized. The expected term represents the period from the grant date to the end of the three-year performance period. Pro-rata vesting may be utilized in the case of death, disability or retirement, and awards, if earned, will be paid at the end of the period.
| $ | | $ | External based metrics
The external-based metric PSUs vest after a period. Outstanding grants issued in or after 2018 until 2022 were based on the Company’s total stockholder return relative to the performance of the Dow Jones U.S. Construction & Materials Index. Outstanding grants issued in 2023 are based on the Company’s total stockholder return relative to a peer group. The amount of stock distributed will vary from % to % of PSUs awarded depending on the relative stockholder return performance. The fair value of external-based metric PSUs has been estimated at the grant date using a Monte Carlo simulation that uses various assumptions.
% | % | | % — % | | Risk free interest rate | % | | % | | % — % |
| Expected term (in years) | | | | | — |
| Grant date fair value of units granted | $ | | $ | | $ — $ |
The risk-free interest rate was based on zero-coupon United States Treasury STRIPS at the grant date. The expected term represents the period from the grant date to the end of the performance period.
PSU Summary
As of December 31, 2023, there was $ million total unrecognized compensation cost related to PSUs. That cost is expected to be recognized over a weighted-average period of years. The total grant date fair value of shares vested during the years ended December 31, 2023, 2022 and 2021, was $ million, $ million and $ million, respectively.
-109-
OWENS CORNING AND SUBSIDIARIES
NOTES TO CONSOLIDATED FINANCIAL STATEMENTS (continued)
17. STOCK COMPENSATION (continued)
| | $ | | | | Granted | | | | | |
| Vested | () | | | | |
| Forfeited | () | | | | |
Balance as of December 31, 2023 | | | | $ | | |
Employee Stock Purchase Plan
The Owens Corning Employee Stock Purchase Plan (“ESPP”) is a tax-qualified plan under Section 423 of the Internal Revenue Code. The purchase price of shares purchased under the ESPP is equal to % of the lower of the fair market value of shares of Owens Corning common stock at the beginning or ending of the offering period, which is a period ending on May 31 and November 30 of each year. On April 16, 2020, the Company's stockholders approved the Amended and Restated Owens Corning Employee Stock Purchase Plan which increased the number of shares available for issuance under the plan by million shares. As of December 31, 2023, million shares remain available for purchase.
Included in total stock-based compensation expense is $ million, $ million and $ million of expense related to the Company's ESPP for the years ended December 31, 2023, 2022 and 2021, respectively. As of December 31, 2023, the Company had $ million of total unrecognized compensation costs related to the ESPP. Under the outstanding ESPP as of February 9, 2024, employees have contributed $ million to purchase shares for the current purchase period ending May 31, 2024.
| | | | | | | | Average purchase price | $ | | | | $ | | | | $ | | |
-110-
OWENS CORNING AND SUBSIDIARIES
NOTES TO CONSOLIDATED FINANCIAL STATEMENTS (continued)
18.
) | $ | () | | | Net investment hedge amounts classified into AOCI, net of tax | | | | |
| Gain (loss) on foreign currency translation | | | () | |
|
|
|
|
| Other comprehensive income (loss), net of tax | | | () | |
| Ending balance | $ | () | | $ | () | |
| Pension and Other Postretirement Adjustment | | |
| Beginning balance | $ | () | | $ | () | |
|
|
|
|
|
|
| Amounts reclassified from AOCI to net earnings, net of tax (a) | | | | |
|
|
|
| Pension annuity settlement charge reclassified from AOCI, net of tax (b) | | | | |
| Amounts classified into AOCI, net of tax | () | | | |
| Other comprehensive income, net of tax | | | | |
| Ending balance | $ | () | | $ | () | |
| Hedging Adjustment | | |
| Beginning balance | $ | | | $ | | |
|
|
| Amounts reclassified from AOCI to net earnings, net of tax (c) | | | () | |
|
|
|
|
|
| Amounts classified into AOCI, net of tax | () | | | |
| Other comprehensive income (loss), net of tax | | | () | |
| Ending balance | $ | | | $ | | |
| Total AOCI ending balance | $ | () | | $ | () | |
(a)These AOCI components are included in the computation of total Pension and Other Postretirement cost and are recorded in Non-operating expense (income), net. See Notes 14 and 15 for additional information.
(b)These amounts reclassified from AOCI relate to a pension annuity settlement which occurred in the fourth quarter of 2023. See Note 14 for additional information.
(c)Amounts reclassified from (loss) gain on cash flow hedges are reclassified from AOCI to income when the hedged item affects earnings and is recognized in Cost of sales or Interest expense, net depending on the hedged item. See Note 4 for additional information.
-111-
OWENS CORNING AND SUBSIDIARIES
NOTES TO CONSOLIDATED FINANCIAL STATEMENTS (continued)
19.
| | $ | | | | $ | | | | Weighted-average number of shares outstanding used for basic earnings per share | | | | | | | | |
| Non-vested restricted and performance shares | | | | | | | | |
| | |
| Weighted-average number of shares outstanding and common equivalent shares used for diluted earnings per share | | | | | | | | |
| Earnings per common share attributable to Owens Corning common stockholders: | | | | | |
| Basic | $ | | | | $ | | | | $ | | |
| Diluted | $ | | | | $ | | | | $ | | |
| | | Basic earnings per share is calculated by dividing earnings attributable to Owens Corning by the weighted-average number of shares of the Company’s common stock outstanding during the period. Outstanding shares consist of issued shares less treasury stock.
The Board of Directors approved share repurchase programs in 2022 under which the Company is authorized to repurchase up to an aggregate of million shares of the Company’s outstanding common stock (the “Repurchase Authorization”). The Repurchase Authorization enables the Company to repurchase shares through the open market, privately negotiated, or other transactions. The actual number of shares repurchased will depend on timing, market conditions and other factors and will be at the Company’s discretion. The Company repurchased million shares of its common stock for $ million, inclusive of applicable taxes, during the year ended December 31, 2023 under the Repurchase Authorization. As of December 31, 2023, million shares remained available for repurchase under the Repurchase Authorization.
For the year ended December 31, 2023, the Company did t have any non-vested restricted stock units or non-vested performance share units that had an anti-dilutive effect on earnings per share. For the year ended December 31, 2022, the Company did t have any non-vested restricted stock units or non-vested performance share units that had an anti-dilutive effect on earnings per share. For the year ended December 31, 2021, the number of shares used in the calculation of diluted earnings per share did not include million shares of Company stock underlying unvested performance share units due to their anti-dilutive effect.
-112-
OWENS CORNING AND SUBSIDIARIES
NOTES TO CONSOLIDATED FINANCIAL STATEMENTS (continued)
20.
| | $ | | | | $ | | |
| Foreign | | | | | | | | |
| Total | $ | | | | $ | | | | $ | | |
| | | | | $ | | | | $ | | |
| State and local | | | | | | | | |
| Foreign | | | | | | | | |
| Total current | | | | | | | | |
| Deferred | | | | | |
| United States | () | | | | | | | |
| State and local | | | | () | | | () | |
| Foreign | () | | | () | | | | |
| Total deferred | () | | | | | | | |
| Total income tax expense | $ | | | | $ | | | | $ | | |
% | | | % | | | % | | State and local income taxes, net of federal tax benefit | | | | | | | | |
| | |
| | |
| | |
| Foreign tax credits | | | | | | | () | |
| | |
| R&D Credits | | | | () | | | | |
| | |
| | |
| | |
| | |
| | |
| Other, net | | | | | | | | |
| Effective tax rate | | % | | | % | | | % |
The Company continues to assert indefinite reinvestment in accordance with ASC 740 based on the laws as of enactment of the Tax Act. As of December 31, 2023, the Company has not provided for withholding or income taxes on approximately $ billion of undistributed reserves of its foreign subsidiaries and affiliates as they are considered by management to be permanently reinvested. Quantification of the deferred tax liability associated with these undistributed reserves is not practicable.
-113-
OWENS CORNING AND SUBSIDIARIES
NOTES TO CONSOLIDATED FINANCIAL STATEMENTS (continued)
20. INCOME TAXES (continued)
| | $ | — | | | $ | | | | $ | — | | | Pension plans | | | | — | | | | | | — | |
| Operating loss and tax credit carryforwards | | | | — | | | | | | — | |
| Depreciation | — | | | | | | — | | | | |
| Capitalized R&D | | | | — | | | | | | — | |
| Leases - right of use assets | — | | | | | | — | | | | |
| Leases - liabilities | | | | — | | | | | | — | |
| Amortization | — | | | | | | — | | | | |
| Inventory | | | | — | | | | | | — | |
| Foreign tax credit carryforwards | | | | — | | | | | | — | |
| | | | |
| Other | | | | — | | | | | | — | |
| Subtotal | | | | | | | | | | | |
| Valuation allowances | () | | | — | | | () | | | — | |
| Total deferred taxes | $ | | | | $ | | | | $ | | | | $ | | |
| |
| Foreign loss and tax credit carryforwards (b) | 2024 - Indefinite | | | |
|
|
|
|
| Total operating loss and tax credit carryforwards | | | $ | | |
|
|
|
|
|
| | |
(a)

Similar companies
See also ReTo Eco-Solutions, Inc.
