PFIZER INC - Quarter Report: 2020 June (Form 10-Q)
UNITED STATES
SECURITIES AND EXCHANGE COMMISSION
WASHINGTON, D.C. 20549
FORM 10-Q
☒ QUARTERLY REPORT PURSUANT TO SECTION 13 OR 15(d)
OF THE SECURITIES EXCHANGE ACT OF 1934
For the quarterly period ended June 28, 2020
OR
☐ TRANSITION REPORT PURSUANT TO SECTION 13
OR 15(d) OF THE SECURITIES EXCHANGE ACT OF 1934
For the transition period from _______ to _______
COMMISSION FILE NUMBER 1-3619
----
PFIZER INC.
(Exact name of registrant as specified in its charter)
Delaware | 13-5315170 |
(State of Incorporation) | (I.R.S. Employer Identification No.) |
235 East 42nd Street, New York, New York 10017
(Address of principal executive offices) (zip code)
(212) 733-2323
(Registrant’s telephone number)
Securities registered pursuant to Section 12(b) of the Act: | ||||
Title of each class | Trading Symbol(s) | Name of each exchange on which registered | ||
Common Stock, $.05 par value | PFE | New York Stock Exchange | ||
0.250% Notes due 2022 | PFE22 | New York Stock Exchange | ||
1.000% Notes due 2027 | PFE27 | New York Stock Exchange | ||
Indicate by check mark whether the registrant (1) has filed all reports required to be filed by Section 13 or 15(d) of the Securities Exchange Act of 1934 during the preceding 12 months (or for such shorter period that the registrant was required to file such reports), and (2) has been subject to such filing requirements for the past 90 days.
Yes | x | No | ☐ |
Indicate by check mark whether the registrant has submitted electronically every Interactive Data File required to be submitted pursuant to Rule 405 of Regulation S-T (§232.405 of this chapter) during the preceding 12 months (or for such shorter period that the registrant was required to submit such files).
Yes | x | No | ☐ |
Indicate by check mark whether the registrant is a large accelerated filer, an accelerated filer, a non-accelerated filer, smaller reporting company, or an emerging growth company. See the definitions of “large accelerated filer,” “accelerated filer,” “smaller reporting company,” and “emerging growth company” in Rule 12b-2 of the Exchange Act:
Large Accelerated filer x Accelerated filer ☐ Non-accelerated filer ☐ Smaller reporting company ☐ Emerging growth company ☐
If an emerging growth company, indicate by check mark if the registrant has elected not to use the extended transition period for complying with any new or revised financial accounting standards provided pursuant to Section 13(a) of the Exchange Act. ☐
Indicate by check mark whether the registrant is a shell company (as defined in Rule 12b-2 of the Exchange Act).
Yes | ☐ | No | x |
At August 3, 2020, 5,556,879,807 shares of the issuer’s voting common stock were outstanding.
Table of Contents
Page | |
Condensed Consolidated Statements of Income for the three and six months ended June 28, 2020 and June 30, 2019 | |
Condensed Consolidated Statements of Comprehensive Income for the three and six months ended June 28, 2020 and June 30, 2019 | |
Condensed Consolidated Balance Sheets as of June 28, 2020 and December 31, 2019 | |
Condensed Consolidated Statements of Equity for the three and six months ended June 28, 2020 and June 30, 2019 | |
Condensed Consolidated Statements of Cash Flows for the six months ended June 28, 2020 and June 30, 2019 | |
2
GLOSSARY OF DEFINED TERMS
Unless the context requires otherwise, references to “Pfizer,” “the Company,” “we,” “us” or “our” in this Quarterly Report on Form 10-Q (defined below) refer to Pfizer Inc. and its subsidiaries. We also have used several other terms in this Quarterly Report on Form 10-Q, most of which are explained or defined below:
2019 Financial Report | Financial Report for the fiscal year ended December 31, 2019, which was filed as Exhibit 13 to the Annual Report on Form 10-K for the fiscal year ended December 31, 2019 |
2019 Form 10-K | Annual Report on Form 10-K for the fiscal year ended December 31, 2019 |
ACA (Also referred to as U.S. Healthcare Legislation) | U.S. Patient Protection and Affordable Care Act, as amended by the Health Care and Education Reconciliation Act |
ACIP | Advisory Committee on Immunization Practices |
ALK | anaplastic lymphoma kinase |
Alliance revenues | Revenues from alliance agreements under which we co-promote products discovered or developed by other companies or us |
Allogene | Allogene Therapeutics, Inc. |
AML | Acute Myeloid Leukemia |
Anacor | Anacor Pharmaceuticals, Inc. |
Array | Array BioPharma Inc. |
Astellas | Astellas Pharma Inc., Astellas US LLC and Astellas Pharma US, Inc. |
ATTR-CM | transthyretin amyloid cardiomyopathy |
Bamboo | Bamboo Therapeutics, Inc. |
BioNTech | BioNTech SE |
Biopharma | Pfizer Biopharmaceuticals Group |
BMS | Bristol-Myers Squibb Company |
CDC | U.S. Centers for Disease Control and Prevention |
cGMP | current Good Manufacturing Practices |
COVID-19 | novel coronavirus disease of 2019 |
Developed Markets | U.S., Western Europe, Japan, Canada, South Korea, Australia, Scandinavian countries, Finland and New Zealand |
EMA | European Medicines Agency |
Emerging Markets | Includes, but is not limited to, the following markets: Asia (excluding Japan and South Korea), Latin America, Eastern Europe, Africa, the Middle East, Central Europe and Turkey |
EPS | earnings per share |
EU | European Union |
Exchange Act | Securities Exchange Act of 1934, as amended |
FASB | Financial Accounting Standards Board |
FDA | U.S. Food and Drug Administration |
GAAP | Generally Accepted Accounting Principles |
GIST | gastrointestinal stromal tumors |
GPD | Global Product Development organization |
GSK | GlaxoSmithKline plc |
hGH-CTP | human growth hormone |
Hospira | Hospira, Inc. |
IBT | Income before tax |
ICU Medical | ICU Medical, Inc. |
IPR&D | in-process research and development |
IRS | U.S. Internal Revenue Service |
IV | intravenous |
J&J | Johnson & Johnson |
JV | Joint Venture |
King | King Pharmaceuticals LLC (formerly King Pharmaceuticals, Inc.) |
LDL | low density lipoprotein |
LIBOR | London Interbank Offered Rate |
Lilly | Eli Lilly & Company |
MCO | managed care organization |
mCRC | metastatic colorectal cancer |
MD&A | Management’s Discussion and Analysis of Financial Condition and Results of Operations |
Medivation | Medivation LLC (formerly Medivation, Inc.) |
3
Meridian | Meridian Medical Technologies, Inc. |
Moody’s | Moody’s Investors Service |
Mylan | Mylan N.V. |
NDA | new drug application |
NSCLC | non-small cell lung cancer |
OPKO | OPKO Health, Inc. |
PARP | poly ADP ribose polymerase |
PBM | pharmacy benefit manager |
Pharmacia | Pharmacia Corporation |
PP&E | property, plant & equipment |
PsA | psoriatic arthritis |
Quarterly Report on Form 10-Q | Quarterly Report on Form 10-Q for the quarterly period ended June 28, 2020 |
RA | rheumatoid arthritis |
RCC | renal cell carcinoma |
R&D | research and development |
Sandoz | Sandoz, Inc., a division of Novartis AG |
SEC | U.S. Securities and Exchange Commission |
SI&A | selling, informational and administrative |
S&P | Standard and Poor’s |
TCJA | legislation commonly referred to as the U.S. Tax Cuts and Jobs Act of 2017 |
Therachon | Therachon Holding AG |
UC | ulcerative colitis |
U.K. | United Kingdom |
U.S. | United States |
Valneva | Valneva SE |
ViiV | ViiV Healthcare Limited |
VBP | Volume-based procurement |
WRDM | Worldwide Research, Development and Medical |
4
PART I - FINANCIAL INFORMATION
Item 1. Financial Statements
PFIZER INC. AND SUBSIDIARY COMPANIES
CONDENSED CONSOLIDATED STATEMENTS OF INCOME
(UNAUDITED)
Three Months Ended | Six Months Ended | |||||||||||||||
(MILLIONS, EXCEPT PER COMMON SHARE DATA) | June 28, 2020 | June 30, 2019 | June 28, 2020 | June 30, 2019 | ||||||||||||
Revenues | $ | 11,801 | $ | 13,264 | $ | 23,829 | $ | 26,382 | ||||||||
Costs and expenses: | ||||||||||||||||
Cost of sales(a) | 2,281 | 2,576 | 4,658 | 5,009 | ||||||||||||
Selling, informational and administrative expenses(a) | 3,030 | 3,511 | 5,903 | 6,850 | ||||||||||||
Research and development expenses(a) | 2,132 | 1,842 | 3,856 | 3,544 | ||||||||||||
Amortization of intangible assets | 905 | 1,184 | 1,790 | 2,367 | ||||||||||||
Restructuring charges and certain acquisition-related costs | 362 | (115 | ) | 431 | (69 | ) | ||||||||||
(Gain) on completion of Consumer Healthcare JV transaction | — | — | (6 | ) | — | |||||||||||
Other (income)/deductions––net | (862 | ) | 126 | (641 | ) | 218 | ||||||||||
Income from continuing operations before provision/(benefit) for taxes on income | 3,953 | 4,141 | 7,838 | 8,463 | ||||||||||||
Provision/(benefit) for taxes on income | 519 | (915 | ) | 993 | (481 | ) | ||||||||||
Income from continuing operations | 3,434 | 5,056 | 6,845 | 8,945 | ||||||||||||
Discontinued operations––net of tax | — | — | — | — | ||||||||||||
Net income before allocation to noncontrolling interests | 3,434 | 5,056 | 6,845 | 8,945 | ||||||||||||
Less: Net income attributable to noncontrolling interests | 8 | 10 | 17 | 15 | ||||||||||||
Net income attributable to Pfizer Inc. | $ | 3,426 | $ | 5,046 | $ | 6,828 | $ | 8,929 | ||||||||
Earnings per common share––basic: | ||||||||||||||||
Income from continuing operations attributable to Pfizer Inc. common shareholders | $ | 0.62 | $ | 0.91 | $ | 1.23 | $ | 1.59 | ||||||||
Discontinued operations––net of tax | — | — | — | — | ||||||||||||
Net income attributable to Pfizer Inc. common shareholders | $ | 0.62 | $ | 0.91 | $ | 1.23 | $ | 1.59 | ||||||||
Earnings per common share––diluted: | ||||||||||||||||
Income from continuing operations attributable to Pfizer Inc. common shareholders | $ | 0.61 | $ | 0.89 | $ | 1.22 | $ | 1.56 | ||||||||
Discontinued operations––net of tax | — | — | — | — | ||||||||||||
Net income attributable to Pfizer Inc. common shareholders | $ | 0.61 | $ | 0.89 | $ | 1.22 | $ | 1.56 | ||||||||
Weighted-average shares––basic | 5,554 | 5,562 | 5,550 | 5,598 | ||||||||||||
Weighted-average shares––diluted | 5,619 | 5,672 | 5,616 | 5,711 | ||||||||||||
(a) | Excludes amortization of intangible assets, except as disclosed in Note 9A. Identifiable Intangible Assets and Goodwill: Identifiable Intangible Assets. |
Amounts may not add due to rounding.
See Notes to Condensed Consolidated Financial Statements.
5
PFIZER INC. AND SUBSIDIARY COMPANIES
CONDENSED CONSOLIDATED STATEMENTS OF COMPREHENSIVE INCOME
(UNAUDITED)
Three Months Ended | Six Months Ended | |||||||||||||||
(MILLIONS OF DOLLARS) | June 28, 2020 | June 30, 2019 | June 28, 2020 | June 30, 2019 | ||||||||||||
Net income before allocation to noncontrolling interests | $ | 3,434 | $ | 5,056 | $ | 6,845 | $ | 8,945 | ||||||||
Foreign currency translation adjustments, net(a) | (242 | ) | (485 | ) | (1,513 | ) | (161 | ) | ||||||||
Reclassification adjustments | — | — | — | 2 | ||||||||||||
(242 | ) | (485 | ) | (1,513 | ) | (159 | ) | |||||||||
Unrealized holding gains/(losses) on derivative financial instruments, net | 213 | (176 | ) | (288 | ) | 91 | ||||||||||
Reclassification adjustments for gains included in net income(b) | (186 | ) | (81 | ) | (167 | ) | (343 | ) | ||||||||
27 | (256 | ) | (455 | ) | (252 | ) | ||||||||||
Unrealized holding gains/(losses) on available-for-sale securities, net | 42 | (7 | ) | (9 | ) | 33 | ||||||||||
Reclassification adjustments for losses included in net income(c) | 44 | 26 | 59 | 37 | ||||||||||||
87 | 19 | 50 | 70 | |||||||||||||
Benefit plans: actuarial gains/(losses), net | 5 | (4 | ) | (160 | ) | (4 | ) | |||||||||
Reclassification adjustments related to amortization | 67 | 60 | 133 | 121 | ||||||||||||
Reclassification adjustments related to settlements, net | 13 | 2 | 66 | 2 | ||||||||||||
Other | 68 | 41 | 84 | 18 | ||||||||||||
153 | 100 | 122 | 137 | |||||||||||||
Benefit plans: prior service costs and other, net | — | (1 | ) | — | (1 | ) | ||||||||||
Reclassification adjustments related to amortization of prior service costs and other, net | (45 | ) | (46 | ) | (89 | ) | (93 | ) | ||||||||
Other | 5 | 1 | 4 | 2 | ||||||||||||
(40 | ) | (46 | ) | (85 | ) | (92 | ) | |||||||||
Other comprehensive loss, before tax | (14 | ) | (669 | ) | (1,882 | ) | (296 | ) | ||||||||
Tax provision/(benefit) on other comprehensive loss | 113 | (59 | ) | (265 | ) | (34 | ) | |||||||||
Other comprehensive loss before allocation to noncontrolling interests | $ | (127 | ) | $ | (610 | ) | $ | (1,617 | ) | $ | (262 | ) | ||||
Comprehensive income before allocation to noncontrolling interests | $ | 3,307 | $ | 4,446 | $ | 5,227 | $ | 8,683 | ||||||||
Less: Comprehensive income/(loss) attributable to noncontrolling interests | (4 | ) | 12 | 5 | 13 | |||||||||||
Comprehensive income attributable to Pfizer Inc. | $ | 3,312 | $ | 4,434 | $ | 5,222 | $ | 8,669 | ||||||||
(a) | Amounts in the second quarter of 2020 include losses from the weakening of certain major currencies against the U.S. dollar, partially offset by a gain of approximately $380 million pre-tax ($291 million after-tax) related to foreign currency translation adjustments and the impact of our net investment hedging program, both attributable to our equity method investment in the GSK Consumer Healthcare joint venture. Amounts in the first six months of 2020 include a loss of approximately $1.2 billion pre-tax ($902 million after-tax) related to foreign currency translation adjustments and the impact of our net investment hedging program, both attributable to our equity method investment in the GSK Consumer Healthcare joint venture and losses from the weakening of certain major currencies against the U.S. dollar, partially offset by the results of our net investment hedging program. For additional information on the GSK Consumer Healthcare joint venture, see Note 2B. Acquisition, Equity-Method Investment and Licensing Arrangements: Equity-Method Investment. |
(b) | Reclassified into Other (income)/deductions—net and Cost of sales in the condensed consolidated statements of income. For additional information on amounts reclassified into Other (income)/deductions—net and Cost of sales, see Note 7E. Financial Instruments: Derivative Financial Instruments and Hedging Activities. |
(c) | Reclassified into Other (income)/deductions—net. |
Amounts may not add due to rounding.
See Notes to Condensed Consolidated Financial Statements.
6
PFIZER INC. AND SUBSIDIARY COMPANIES
CONDENSED CONSOLIDATED BALANCE SHEETS
(MILLIONS OF DOLLARS) | June 28, 2020 | December 31, 2019 | ||||||
(Unaudited) | ||||||||
Assets | ||||||||
Cash and cash equivalents | $ | 1,801 | $ | 1,305 | ||||
Short-term investments | 9,581 | 8,525 | ||||||
Restricted short-term investments(a) | 11,412 | — | ||||||
Trade accounts receivable, less allowance for doubtful accounts: 2020—$525; 2019—$527 | 9,128 | 8,724 | ||||||
Inventories | 8,564 | 8,283 | ||||||
Current tax assets | 3,426 | 3,344 | ||||||
Other current assets | 2,513 | 2,622 | ||||||
Total current assets | 46,424 | 32,803 | ||||||
Equity-method investments | 15,578 | 17,133 | ||||||
Long-term investments | 3,142 | 3,014 | ||||||
Property, plant and equipment, less accumulated depreciation: 2020—$16,889; 2019—$16,789 | 14,113 | 13,967 | ||||||
Identifiable intangible assets, less accumulated amortization | 33,541 | 35,370 | ||||||
Goodwill | 58,449 | 58,653 | ||||||
Noncurrent deferred tax assets and other noncurrent tax assets | 2,360 | 2,099 | ||||||
Other noncurrent assets | 4,327 | 4,450 | ||||||
Total assets | $ | 177,934 | $ | 167,489 | ||||
Liabilities and Equity | ||||||||
Short-term borrowings, including current portion of long-term debt: 2020—$1,481; 2019—$1,462 | $ | 13,084 | $ | 16,195 | ||||
Trade accounts payable | 3,872 | 4,220 | ||||||
Dividends payable | 2,111 | 2,104 | ||||||
Income taxes payable | 1,445 | 980 | ||||||
Accrued compensation and related items | 2,042 | 2,720 | ||||||
Other current liabilities | 10,168 | 11,083 | ||||||
Total current liabilities | 32,723 | 37,304 | ||||||
Long-term debt(a) | 50,529 | 35,955 | ||||||
Pension benefit obligations, net | 5,344 | 5,638 | ||||||
Postretirement benefit obligations, net | 1,086 | 1,124 | ||||||
Noncurrent deferred tax liabilities | 5,409 | 5,578 | ||||||
Other taxes payable | 11,468 | 12,126 | ||||||
Other noncurrent liabilities | 6,812 | 6,317 | ||||||
Total liabilities | 113,370 | 104,042 | ||||||
Commitments and Contingencies | ||||||||
Preferred stock | — | 17 | ||||||
Common stock | 470 | 468 | ||||||
Additional paid-in capital | 87,886 | 87,428 | ||||||
Treasury stock | (110,978 | ) | (110,801 | ) | ||||
Retained earnings | 100,203 | 97,670 | ||||||
Accumulated other comprehensive loss | (13,246 | ) | (11,640 | ) | ||||
Total Pfizer Inc. shareholders’ equity | 64,336 | 63,143 | ||||||
Equity attributable to noncontrolling interests | 228 | 303 | ||||||
Total equity | 64,564 | 63,447 | ||||||
Total liabilities and equity | $ | 177,934 | $ | 167,489 | ||||
(a) |
Amounts may not add due to rounding.
See Notes to Condensed Consolidated Financial Statements.
7
PFIZER INC. AND SUBSIDIARY COMPANIES
CONDENSED CONSOLIDATED STATEMENTS OF EQUITY
(UNAUDITED)
PFIZER INC. SHAREHOLDERS | |||||||||||||||||||||||||||||||||||||||||||||
Preferred Stock | Common Stock | Treasury Stock | |||||||||||||||||||||||||||||||||||||||||||
(MILLIONS, EXCEPT PREFERRED SHARES) | Shares | Stated Value | Shares | Par Value | Add’l Paid-In Capital | Shares | Cost | Retained Earnings | Accum. Other Comp. Loss | Share- holders’ Equity | Non-controlling interests | Total Equity | |||||||||||||||||||||||||||||||||
Balance, March 29, 2020 | 417 | $ | 17 | 9,393 | $ | 470 | $ | 87,680 | (3,841 | ) | $ | (111,010 | ) | $ | 101,000 | $ | (13,131 | ) | $ | 65,026 | $ | 312 | $ | 65,338 | |||||||||||||||||||||
Net income | 3,426 | 3,426 | 8 | 3,434 | |||||||||||||||||||||||||||||||||||||||||
Other comprehensive income/(loss), net of tax | (115 | ) | (115 | ) | (12 | ) | (127 | ) | |||||||||||||||||||||||||||||||||||||
Cash dividends declared: | |||||||||||||||||||||||||||||||||||||||||||||
Common stock | (4,223 | ) | (4,223 | ) | (4,223 | ) | |||||||||||||||||||||||||||||||||||||||
Preferred stock | — | — | — | ||||||||||||||||||||||||||||||||||||||||||
Noncontrolling interests | — | (80 | ) | (80 | ) | ||||||||||||||||||||||||||||||||||||||||
Share-based payment transactions | 2 | — | 221 | — | 1 | 222 | 222 | ||||||||||||||||||||||||||||||||||||||
Purchases of common stock | — | — | — | — | |||||||||||||||||||||||||||||||||||||||||
Preferred stock conversions and redemptions(a) | (417 | ) | (17 | ) | (14 | ) | 1 | 31 | — | — | |||||||||||||||||||||||||||||||||||
Other | — | — | — | — | — | — | — | ||||||||||||||||||||||||||||||||||||||
Balance, June 28, 2020 | — | $ | — | 9,394 | $ | 470 | $ | 87,886 | (3,840 | ) | $ | (110,978 | ) | $ | 100,203 | $ | (13,246 | ) | $ | 64,336 | $ | 228 | $ | 64,564 | |||||||||||||||||||||
PFIZER INC. SHAREHOLDERS | |||||||||||||||||||||||||||||||||||||||||||||
Preferred Stock | Common Stock | Treasury Stock | |||||||||||||||||||||||||||||||||||||||||||
(MILLIONS, EXCEPT PREFERRED SHARES) | Shares | Stated Value | Shares | Par Value | Add’l Paid-In Capital | Shares | Cost | Retained Earnings | Accum. Other Comp. Loss | Share- holders’ Equity | Non-controlling interests | Total Equity | |||||||||||||||||||||||||||||||||
Balance, March 31, 2019 | 466 | $ | 19 | 9,358 | $ | 468 | $ | 86,635 | (3,801 | ) | $ | (110,781 | ) | $ | 93,388 | $ | (10,923 | ) | $ | 58,806 | $ | 352 | $ | 59,158 | |||||||||||||||||||||
Net income | 5,046 | 5,046 | 10 | 5,056 | |||||||||||||||||||||||||||||||||||||||||
Other comprehensive income/(loss), net of tax | (613 | ) | (613 | ) | 3 | (610 | ) | ||||||||||||||||||||||||||||||||||||||
Cash dividends declared: | |||||||||||||||||||||||||||||||||||||||||||||
Common stock | (3,994 | ) | (3,994 | ) | (3,994 | ) | |||||||||||||||||||||||||||||||||||||||
Preferred stock | — | — | — | ||||||||||||||||||||||||||||||||||||||||||
Noncontrolling interests | — | (8 | ) | (8 | ) | ||||||||||||||||||||||||||||||||||||||||
Share-based payment transactions | 5 | — | 329 | — | (6 | ) | 324 | 324 | |||||||||||||||||||||||||||||||||||||
Purchases of common stock | — | — | — | — | |||||||||||||||||||||||||||||||||||||||||
Preferred stock conversions and redemptions | (8 | ) | — | (1 | ) | — | — | (1 | ) | (1 | ) | ||||||||||||||||||||||||||||||||||
Other | — | — | — | — | — | — | — | ||||||||||||||||||||||||||||||||||||||
Balance, June 30, 2019 | 458 | $ | 18 | 9,363 | $ | 468 | $ | 86,963 | (3,801 | ) | $ | (110,786 | ) | $ | 94,440 | $ | (11,535 | ) | $ | 59,568 | $ | 357 | $ | 59,924 | |||||||||||||||||||||
See end of tables for notes.
See Notes to Condensed Consolidated Financial Statements.
8
PFIZER INC. AND SUBSIDIARY COMPANIES
CONDENSED CONSOLIDATED STATEMENTS OF EQUITY
(UNAUDITED)
PFIZER INC. SHAREHOLDERS | |||||||||||||||||||||||||||||||||||||||||||||
Preferred Stock | Common Stock | Treasury Stock | |||||||||||||||||||||||||||||||||||||||||||
(MILLIONS, EXCEPT PREFERRED SHARES) | Shares | Stated Value | Shares | Par Value | Add’l Paid-In Capital | Shares | Cost | Retained Earnings | Accum. Other Comp. Loss | Share- holders’ Equity | Non-controlling interests | Total Equity | |||||||||||||||||||||||||||||||||
Balance, January 1, 2020 | 431 | $ | 17 | 9,369 | $ | 468 | $ | 87,428 | (3,835 | ) | $ | (110,801 | ) | $ | 97,670 | $ | (11,640 | ) | $ | 63,143 | $ | 303 | $ | 63,447 | |||||||||||||||||||||
Net income | 6,828 | 6,828 | 17 | 6,845 | |||||||||||||||||||||||||||||||||||||||||
Other comprehensive income/(loss), net of tax | (1,605 | ) | (1,605 | ) | (12 | ) | (1,617 | ) | |||||||||||||||||||||||||||||||||||||
Cash dividends declared: | |||||||||||||||||||||||||||||||||||||||||||||
Common stock | (4,294 | ) | (4,294 | ) | (4,294 | ) | |||||||||||||||||||||||||||||||||||||||
Preferred stock | — | — | — | ||||||||||||||||||||||||||||||||||||||||||
Noncontrolling interests | — | (80 | ) | (80 | ) | ||||||||||||||||||||||||||||||||||||||||
Share-based payment transactions | 25 | 1 | 473 | (6 | ) | (208 | ) | 266 | 266 | ||||||||||||||||||||||||||||||||||||
Purchases of common stock | — | — | — | — | |||||||||||||||||||||||||||||||||||||||||
Preferred stock conversions and redemptions(a) | (431 | ) | (17 | ) | (15 | ) | 1 | 31 | (1 | ) | (1 | ) | |||||||||||||||||||||||||||||||||
Other | — | — | — | — | — | — | — | ||||||||||||||||||||||||||||||||||||||
Balance, June 28, 2020 | — | $ | — | 9,394 | $ | 470 | $ | 87,886 | (3,840 | ) | $ | (110,978 | ) | $ | 100,203 | $ | (13,246 | ) | $ | 64,336 | $ | 228 | $ | 64,564 | |||||||||||||||||||||
PFIZER INC. SHAREHOLDERS | |||||||||||||||||||||||||||||||||||||||||||||
Preferred Stock | Common Stock | Treasury Stock | |||||||||||||||||||||||||||||||||||||||||||
(MILLIONS, EXCEPT PREFERRED SHARES) | Shares | Stated Value | Shares | Par Value | Add’l Paid-In Capital | Shares | Cost | Retained Earnings | Accum. Other Comp. Loss | Share- holders’ Equity | Non-controlling interests | Total Equity | |||||||||||||||||||||||||||||||||
Balance, January 1, 2019 | 478 | $ | 19 | 9,332 | $ | 467 | $ | 86,253 | (3,615 | ) | $ | (101,610 | ) | $ | 89,554 | $ | (11,275 | ) | $ | 63,407 | $ | 351 | $ | 63,758 | |||||||||||||||||||||
Net income | 8,929 | 8,929 | 15 | 8,945 | |||||||||||||||||||||||||||||||||||||||||
Other comprehensive income/(loss), net of tax | (260 | ) | (260 | ) | (2 | ) | (262 | ) | |||||||||||||||||||||||||||||||||||||
Cash dividends declared: | |||||||||||||||||||||||||||||||||||||||||||||
Common stock | (4,062 | ) | (4,062 | ) | (4,062 | ) | |||||||||||||||||||||||||||||||||||||||
Preferred stock | (1 | ) | (1 | ) | (1 | ) | |||||||||||||||||||||||||||||||||||||||
Noncontrolling interests | — | (8 | ) | (8 | ) | ||||||||||||||||||||||||||||||||||||||||
Share-based payment transactions | 31 | 2 | 712 | (7 | ) | (312 | ) | 402 | 402 | ||||||||||||||||||||||||||||||||||||
Purchases of common stock | (180 | ) | (8,865 | ) | (8,865 | ) | (8,865 | ) | |||||||||||||||||||||||||||||||||||||
Preferred stock conversions and redemptions | (20 | ) | (1 | ) | (1 | ) | — | — | (2 | ) | (2 | ) | |||||||||||||||||||||||||||||||||
Other(b) | — | — | — | 19 | 19 | — | 19 | ||||||||||||||||||||||||||||||||||||||
Balance, June 30, 2019 | 458 | $ | 18 | 9,363 | $ | 468 | $ | 86,963 | (3,801 | ) | $ | (110,786 | ) | $ | 94,440 | $ | (11,535 | ) | $ | 59,568 | $ | 357 | $ | 59,924 | |||||||||||||||||||||
(a) | On May 4, 2020, all outstanding shares of Pfizer’s Series A convertible perpetual preferred stock were converted into shares of Pfizer common stock. See Note 11. Equity for additional information. |
(b) | The increase to Retained earnings represents the cumulative effect of the adoption of a new accounting standard in the first quarter of 2019 for leases. For additional information, see Notes to Consolidated Financial Statements––Note 1B. Basis of Presentation and Significant Accounting Policies: Adoption of New Accounting Standards in 2019 in our 2019 Financial Report. |
Amounts may not add due to rounding.
See Notes to Condensed Consolidated Financial Statements.
9
PFIZER INC. AND SUBSIDIARY COMPANIES
CONDENSED CONSOLIDATED STATEMENTS OF CASH FLOWS
(UNAUDITED)
Six Months Ended | ||||||||
(MILLIONS OF DOLLARS) | June 28, 2020 | June 30, 2019 | ||||||
Operating Activities | ||||||||
Net income before allocation to noncontrolling interests | $ | 6,845 | $ | 8,945 | ||||
Adjustments to reconcile net income before allocation to noncontrolling interests to net cash provided by operating activities: | ||||||||
Depreciation and amortization | 2,469 | 3,073 | ||||||
Asset write-offs and impairments | 58 | 178 | ||||||
TCJA impact(a) | — | (285 | ) | |||||
Gain on completion of Consumer Healthcare JV transaction, net of cash conveyed | (6 | ) | — | |||||
Deferred taxes from continuing operations | 71 | (160 | ) | |||||
Share-based compensation expense | 258 | 384 | ||||||
Benefit plan contributions in excess of expense/income | (418 | ) | (313 | ) | ||||
Other adjustments, net | (361 | ) | (462 | ) | ||||
Other changes in assets and liabilities, net of acquisitions and divestitures | (2,229 | ) | (7,051 | ) | ||||
Net cash provided by operating activities | 6,688 | 4,309 | ||||||
Investing Activities | ||||||||
Purchases of property, plant and equipment | (942 | ) | (939 | ) | ||||
Purchases of short-term investments | (5,141 | ) | (4,063 | ) | ||||
Proceeds from redemptions/sales of short-term investments | 4,595 | 6,001 | ||||||
Net (purchases of)/proceeds from redemptions/sales of short-term investments with original maturities of three months or less(b) | (11,949 | ) | 4,717 | |||||
Purchases of long-term investments | (168 | ) | (123 | ) | ||||
Proceeds from redemptions/sales of long-term investments | 536 | 142 | ||||||
Acquisitions of intangible assets | (33 | ) | (267 | ) | ||||
Other investing activities, net | 19 | 179 | ||||||
Net cash provided by/(used in) investing activities | (13,082 | ) | 5,648 | |||||
Financing Activities | ||||||||
Proceeds from short-term borrowings | 12,352 | 3,956 | ||||||
Principal payments on short-term borrowings | (13,166 | ) | (2,375 | ) | ||||
Net (payments on)/proceeds from short-term borrowings with original maturities of three months or less | (2,273 | ) | 2,719 | |||||
Proceeds from issuance of long-term debt(b) | 16,606 | 4,942 | ||||||
Principal payments on long-term debt | (2,181 | ) | (5,355 | ) | ||||
Purchases of common stock | — | (8,865 | ) | |||||
Cash dividends paid | (4,216 | ) | (4,047 | ) | ||||
Proceeds from exercise of stock options | 158 | 248 | ||||||
Other financing activities, net | (321 | ) | (541 | ) | ||||
Net cash provided by/(used in) financing activities | 6,959 | (9,318 | ) | |||||
Effect of exchange-rate changes on cash and cash equivalents and restricted cash and cash equivalents | (70 | ) | (28 | ) | ||||
Net increase in cash and cash equivalents and restricted cash and cash equivalents | 495 | 612 | ||||||
Cash and cash equivalents and restricted cash and cash equivalents, at beginning of period | 1,350 | 1,225 | ||||||
Cash and cash equivalents and restricted cash and cash equivalents, at end of period | $ | 1,845 | $ | 1,837 | ||||
Supplemental Cash Flow Information | ||||||||
Cash paid (received) during the period for: | ||||||||
Income taxes | $ | 1,290 | $ | 2,136 | ||||
Interest paid | 910 | 809 | ||||||
Interest rate hedges | (66 | ) | (72 | ) | ||||
(a) | As a result of the enactment of the TCJA in December 2017, Pfizer’s Provision/(benefit) for taxes on income for the six months ended June 30, 2019 was favorably impacted by approximately $285 million, primarily as a result of additional guidance issued by the U.S. Department of Treasury. |
(b) | Includes $11.4 billion of proceeds from the Upjohn long-term debt issuances in the second quarter of 2020, which are included in Restricted short-term investments in the condensed consolidated balance sheet. For additional information, see Notes 7A. Financial Instruments: Fair Value Measurements and Financial Instruments: 7D. Long-Term Debt). |
Amounts may not add due to rounding.
See Notes to Condensed Consolidated Financial Statements.
10
PFIZER INC. AND SUBSIDIARY COMPANIES
NOTES TO CONDENSED CONSOLIDATED FINANCIAL STATEMENTS
(UNAUDITED)
Note 1. Basis of Presentation and Significant Accounting Policies
A. Basis of Presentation
See the Glossary of Defined Terms at the beginning of this Quarterly Report on Form 10-Q for terms used throughout the condensed consolidated financial statements and related notes in this Quarterly Report on Form 10-Q.
We prepared the condensed consolidated financial statements following the requirements of the SEC for interim reporting. As permitted under those rules, certain footnotes or other financial information that are normally required by U.S. GAAP can be condensed or omitted.
The financial information included in our condensed consolidated financial statements for subsidiaries operating outside the U.S. is as of and for the three and six months ended May 24, 2020 and May 26, 2019. The financial information included in our condensed consolidated financial statements for U.S. subsidiaries is as of and for the three and six months ended June 28, 2020 and June 30, 2019.
Revenues, expenses, assets and liabilities can vary during each quarter of the year. Therefore, the results and trends in these interim financial statements may not be representative of those for the full year.
We are responsible for the unaudited financial statements included in this Quarterly Report on Form 10-Q. The interim financial statements include all normal and recurring adjustments that are considered necessary for the fair statement of results for the interim periods presented. The information included in this Quarterly Report on Form 10-Q should be read in conjunction with the consolidated financial statements and accompanying notes included in our 2019 Financial Report.
At the beginning of our 2019 fiscal year, we began to manage our commercial operations through a new global structure consisting of three business segments––Pfizer Biopharmaceuticals Group (Biopharma), Upjohn and through July 31, 2019, Consumer Healthcare. Biopharma and Upjohn are the only reportable segments. For additional information, see Note 14.
Beginning in 2020, Upjohn began managing our Meridian subsidiary, the manufacturer of EpiPen and other auto-injector products, and a pre-existing strategic collaboration between Pfizer and Mylan for generic drugs in Japan (Mylan-Japan). As a result, revenues and expenses associated with Meridian and Mylan-Japan are reported in our Upjohn business beginning in the first quarter of 2020. In 2019, revenues and expenses from Meridian and Mylan-Japan were recorded in our Biopharma business. We performed certain reclassifications between the Biopharma and Upjohn segments to conform 2019 segment revenues and expenses associated with Meridian and Mylan-Japan to the current presentation. There was no impact to our consolidated financial statements. For additional information, see Note 14.
Acquisitions and other business development activities completed in 2019 and in the first half of 2020, including the contribution of our Consumer Healthcare business to the GSK Consumer Healthcare joint venture, impacted financial results in the periods presented. For additional information, see Notes to Consolidated Financial Statements—Note 1A. Basis of Presentation and Significant Accounting Policies: Basis of Presentation in our 2019 Financial Report, and Note 2.
Certain amounts in the condensed consolidated financial statements and associated notes may not add due to rounding. All percentages have been calculated using unrounded amounts.
In the first quarter of 2020, as of January 1, 2020, we adopted four new accounting standards. See Note 1B for further information.
B. Adoption of New Accounting Standards in 2020
On January 1, 2020, we adopted four new accounting standards.
Credit Losses on Financial Instruments––We adopted a new accounting standard for credit losses on financial instruments, which replaces the probable initial recognition threshold for incurred loss estimates under prior guidance with a methodology that reflects expected credit loss estimates. The standard generally impacts financial assets that have a contractual right to receive cash and are not accounted for at fair value through net income, such as accounts receivable and held-to-maturity debt securities. The new guidance requires us to identify, analyze, document and support new methodologies for quantifying expected credit loss estimates for certain financial instruments, using information such as historical experience, current economic conditions and information, and the use of reasonable and supportable forecasted information. The standard also
11
PFIZER INC. AND SUBSIDIARY COMPANIES
NOTES TO CONDENSED CONSOLIDATED FINANCIAL STATEMENTS
(UNAUDITED)
amends existing impairment guidance for available-for-sale debt securities to incorporate a credit loss allowance and allows for reversals of credit impairments in the event the issuer’s credit improves.
We adopted the new accounting standard utilizing the modified retrospective method and, therefore, no adjustments were made to amounts in our prior period financial statements. The cumulative effect of adopting the standard as an adjustment to the opening balance of Retained earnings was not material. The impact of adoption did not have a material impact on our condensed consolidated statement of income for the three and six months ended June 28, 2020 or condensed consolidated statement of cash flows for the six months ended June 28, 2020, nor on our condensed consolidated balance sheet as of June 28, 2020. For additional information, see Note 1C.
Goodwill Impairment Testing––We prospectively adopted the new standard, which eliminates the requirement to perform a hypothetical purchase price allocation to measure goodwill impairment. Under the new guidance, the goodwill impairment test is performed by comparing the fair value of a reporting unit with its carrying amount, and recognizing an impairment charge for the amount by which the carrying amount of the reporting unit exceeds its fair value. There was no impact to our condensed consolidated financial statements from the adoption of this new standard.
Implementation Costs in a Cloud Computing Arrangement––We prospectively adopted the new standard related to customers’ accounting for implementation costs incurred in a cloud computing arrangement that is considered a service contract. The new guidance aligns the requirements for capitalizing implementation costs incurred to develop or obtain internal-use software. The adoption of this guidance did not have a material impact on our condensed consolidated financial statements.
Collaboration Agreements––We prospectively adopted the new standard, which provides new guidance clarifying the interaction between the accounting for collaborative arrangements and revenue from contracts with customers. There was no impact to our condensed consolidated financial statements from the adoption of this new standard.
On January 1, 2019, we adopted four new accounting standards. For additional information, see Notes to Consolidated Financial Statements––Note 1B. Basis of Presentation and Significant Accounting Policies: Adoption of New Accounting Standards in 2019 included in our 2019 Financial Report.
C. Revenues and Trade Accounts Receivable
Deductions from Revenues––Our accruals for Medicare rebates, Medicaid and related state program rebates, performance-based contract rebates, chargebacks, sales allowances and sales returns and cash discounts totaled $5.5 billion as of June 28, 2020 and $5.7 billion as of December 31, 2019.
The following table provides information about the balance sheet classification of these accruals: | ||||||||
(MILLIONS OF DOLLARS) | June 28, 2020 | December 31, 2019 | ||||||
Reserve against Trade accounts receivable, less allowance for doubtful accounts | $ | 1,129 | $ | 1,257 | ||||
Other current liabilities: | ||||||||
Accrued rebates | 3,210 | 3,285 | ||||||
Other accruals | 576 | 581 | ||||||
Other noncurrent liabilities | 598 | 565 | ||||||
Total accrued rebates and other accruals | $ | 5,512 | $ | 5,689 | ||||
Trade Accounts Receivable––Trade accounts receivable are stated at their net realizable value. The allowance for credit losses against gross trade accounts receivable reflects the best estimate of expected credit losses of the receivables portfolio determined on the basis of historical experience, current information, and forecasts of future economic conditions. In developing the estimate for expected credit losses, trade accounts receivables are segmented into pools of assets depending on market (U.S. versus international), delinquency status, and customer type (high risk versus low risk and government versus non-government), and fixed reserve percentages are established for each pool of trade accounts receivables.
In determining the reserve percentages for each pool of trade accounts receivables, we considered our historical experience with certain customers and customer types, regulatory and legal environments, country and political risk, and other relevant current and future forecasted macroeconomic factors. These credit risk indicators are monitored on a quarterly basis to determine whether there have been any changes in the economic environment that would indicate the established reserve percentages should be adjusted, and are considered on a regional basis to reflect more geographic-specific metrics. Additionally, write-offs and recoveries of customer receivables are tracked against collections on a quarterly basis to determine whether the reserve percentages remain appropriate. When management becomes aware of certain customer-specific factors that impact credit risk,
12
PFIZER INC. AND SUBSIDIARY COMPANIES
NOTES TO CONDENSED CONSOLIDATED FINANCIAL STATEMENTS
(UNAUDITED)
specific allowances for these known troubled accounts are recorded. Trade accounts receivable are written off after all reasonable means to collect the full amount (including litigation, where appropriate) have been exhausted.
During the three and six months ended June 28, 2020, additions to the allowance for credit losses, write-offs and recoveries of customer receivables were not material to our condensed consolidated financial statements.
Note 2. Acquisition, Equity-Method Investment and Licensing Arrangements
A. Acquisition
Array BioPharma Inc.
On July 30, 2019, we acquired Array, a commercial stage biopharmaceutical company focused on the discovery, development and commercialization of targeted small molecule medicines to treat cancer and other diseases of high unmet need, for $48 per share in cash. The total fair value of the consideration transferred for Array was approximately $11.2 billion ($10.9 billion, net of cash acquired). Array’s portfolio includes Braftovi (encorafenib) and Mektovi (binimetinib). The allocation of the consideration transferred to the assets acquired and the liabilities assumed has not yet been finalized.
B. Equity-Method Investment
Formation of GSK Consumer Healthcare Joint Venture
On July 31, 2019, we completed the transaction in which we and GSK combined our respective consumer healthcare businesses into a new consumer healthcare joint venture that operates globally under the GSK Consumer Healthcare name. In exchange for contributing our Consumer Healthcare business to the joint venture, we received a 32% equity stake in the new company and GSK owns the remaining 68%. Upon the closing of the transaction, we deconsolidated our Consumer Healthcare business and recognized a pre-tax gain of $8.1 billion ($5.4 billion, net of tax) in our fiscal third quarter of 2019 in (Gain) on completion of Consumer Healthcare JV transaction for the difference in the fair value of our 32% equity stake in the new company and the carrying value of our Consumer Healthcare business. We may record additional adjustments to the gain in future periods, which we do not expect to have a material impact on our consolidated financial statements. Our financial results, and our Consumer Healthcare segment’s operating results, for the second quarter of 2019 reflect three months of Consumer Healthcare segment operations and for the first six months of 2019 reflect six months of Consumer Healthcare segment operations, while financial results for the second quarter and first six months of 2020 do not reflect any contribution from the Consumer Healthcare business.
We are accounting for our interest in GSK Consumer Healthcare as an equity-method investment. The carrying value of our investment in GSK Consumer Healthcare is approximately $15.4 billion as of June 28, 2020 and $17.0 billion as of December 31, 2019 and is reported as a private equity investment in the Equity-method investments line in our condensed consolidated balance sheet. We record our share of earnings from the GSK Consumer Healthcare joint venture on a quarterly basis on a one-quarter lag in Other (income)/deductions––net commencing from August 1, 2019. Therefore, we recorded our share of the joint venture’s earnings generated in the first quarter of 2020, which totaled approximately $129 million, in our operating results in the second quarter of 2020. Our total share of the joint venture’s earnings generated in the fourth quarter of 2019 and the first quarter of 2020, which we recorded in our operating results for the first six months of 2020, was approximately $140 million. See Note 4. As of the July 31, 2019 closing date, we estimated that the fair value of our investment in GSK Consumer Healthcare was approximately $15.7 billion and that 32% of the underlying equity in the carrying value of the net assets of GSK Consumer Healthcare was approximately $11.2 billion, resulting in an initial basis difference of approximately $4.5 billion. In the fourth quarter of 2019, we preliminarily completed the allocation of the basis difference, which resulted from the excess of the initial fair value of our investment over the underlying equity in the carrying value of the net assets of the joint venture, primarily to inventory, definite-lived intangible assets, indefinite-lived intangible assets, related deferred tax liabilities and equity method goodwill within the investment account. We recorded the amortization of basis differences allocated to inventory, definite-lived intangible assets and related deferred tax liabilities in Other (income)/deductions––net commencing August 1, 2019. During the fourth quarter of 2019, GSK Consumer Healthcare revised the initial carrying value of the net assets of the joint venture and our 32% share of the underlying equity in the carrying value of the net assets of GSK Consumer Healthcare was reduced to approximately $11.0 billion and our initial basis difference was increased to approximately $4.8 billion. The adjustment was allocated to equity method goodwill within the investment account. The amortization of these basis differences for the first quarter of 2020 totaling approximately $4 million of expense is included in our operating results in Other (income)/deductions––net in the second quarter of 2020. The total amortization of these basis differences for the fourth quarter of 2019 and the first quarter of 2020, which was included in our operating results in the first six months of 2020, was approximately $48 million of expense. See Note 4. Amortization of
13
PFIZER INC. AND SUBSIDIARY COMPANIES
NOTES TO CONDENSED CONSOLIDATED FINANCIAL STATEMENTS
(UNAUDITED)
basis differences on inventory and related deferred tax liabilities has been completely recognized by the second quarter of 2020. Basis differences on definite-lived intangible assets and related deferred tax liabilities are being amortized over the lives of the underlying assets, which range from 6 to 20 years. GSK Consumer Healthcare is a foreign investee whose reporting currency is the U.K. pound, and therefore we translate its financial statements into U.S. dollars and recognize the impact of foreign currency translation adjustments in the carrying value of our investment and in Other comprehensive income. The decrease in the value of our investment from December 31, 2019 to June 28, 2020 is primarily due to approximately $1.1 billion in pre-tax foreign currency translation adjustments (see Note 6), as well as a dividend of approximately $519 million, which was received from the GSK Consumer Healthcare joint venture in June 2020.
As a part of Pfizer, pre-tax income on a management business unit basis for the Consumer Healthcare business was $274 million for the second quarter of 2019 and $554 million for the six months ended June 30, 2019.
Summarized financial information for our equity method investee, GSK Consumer Healthcare, as of and for the three and six months ending March 31, 2020, the most recent period available, is as follows: | ||||
(MILLIONS OF DOLLARS) | March 31, 2020 | |||
Current assets | $ | 8,213 | ||
Noncurrent assets | 37,627 | |||
Total assets | $ | 45,840 | ||
Current liabilities | $ | 5,524 | ||
Noncurrent liabilities | 5,152 | |||
Total liabilities | $ | 10,677 | ||
Equity attributable to shareholders | $ | 35,031 | ||
Equity attributable to noncontrolling interests | 133 | |||
Total net equity | $ | 35,163 | ||
(MILLIONS OF DOLLARS) | Three Months Ended March 31, 2020 | Six Months Ended March 31, 2020 | ||||||
Net sales | $ | 3,503 | $ | 6,691 | ||||
Cost of sales | (1,394 | ) | (3,205 | ) | ||||
Gross profit | $ | 2,109 | $ | 3,486 | ||||
Income from continuing operations | 425 | 471 | ||||||
Net income | 425 | 471 | ||||||
Income attributable to shareholders | 405 | 441 | ||||||
C. Licensing Arrangements
Agreement with Valneva SE
On April 30, 2020, we signed an agreement to co-develop and commercialize Valneva’s Lyme disease vaccine candidate VLA15. VLA15 is the only active Lyme disease vaccine program in clinical development today, and covers six serotypes that are prevalent in North America and Europe. Valneva and Pfizer will work closely together throughout the development of VLA15. Valneva is eligible to receive a total of $308 million in cash payments consisting of a $130 million upfront payment, which was paid and recorded in Research and development expenses in our fiscal second quarter of 2020, as well as $35 million in development milestones and $143 million in early commercialization milestones. Under the terms of the agreement, Valneva will fund 30% of all development costs through completion of the development program, and in return we will pay Valneva tiered royalties. We will lead late-stage development and have sole control over commercialization.
Agreement with BioNTech SE
On April 9, 2020, we signed a global agreement with BioNTech to co-develop a potential first-in-class, mRNA-based coronavirus vaccine program, BNT162, aimed at preventing COVID-19 infection. The collaboration aims to rapidly advance multiple COVID-19 vaccine candidates into human clinical testing based on BioNTech’s proprietary mRNA vaccine platforms, with the objective of ensuring rapid worldwide access to the vaccine, if approved. The collaboration will leverage our broad expertise in vaccine R&D, regulatory capabilities, and global manufacturing and distribution network. In connection with the agreement, we paid BioNTech an upfront cash payment of $72 million, which was recorded in Research and development expenses in our fiscal second quarter of 2020, and we made an equity investment of $113 million in common stock of BioNTech. BioNTech is eligible to receive potential future milestone payments of up to $563 million for a total consideration of
14
PFIZER INC. AND SUBSIDIARY COMPANIES
NOTES TO CONDENSED CONSOLIDATED FINANCIAL STATEMENTS
(UNAUDITED)
$748 million. While Pfizer and BioNTech will share development costs equally if the vaccine is approved and successfully commercialized, Pfizer will be responsible for all of the development costs until commercialization of the vaccine. Thereafter, BioNTech would repay Pfizer its 50 percent share of these development costs through reductions in gross profit sharing and milestone payments to BioNTech over time. BioNTech and Pfizer will also work jointly to commercialize the vaccine worldwide (excluding China, which is subject to a separate collaboration between BioNTech and Shanghai Fosun Pharmaceutical (Group) Co., Ltd) if development is successful and regulatory approval is obtained. We made an additional investment of $50 million in common stock of BioNTech as part of an underwritten equity offering by BioNTech, which closed in July 2020 in our fiscal third quarter of 2020.
Note 3. Restructuring Charges and Other Costs Associated with Acquisitions and Cost-Reduction/Productivity Initiatives
We incur significant costs in connection with acquiring, integrating and restructuring businesses and in connection with our global cost-reduction/productivity initiatives. For example:
• | In connection with acquisition activity, we typically incur costs associated with executing the transactions, integrating the acquired operations (which may include expenditures for consulting and the integration of systems and processes), and restructuring the combined company (which may include charges related to employees, assets and activities that will not continue in the combined company); and |
• | In connection with our cost-reduction/productivity initiatives, we typically incur costs and charges associated with site closings and other facility rationalization actions, workforce reductions and the expansion of shared services, including the development of global systems. |
All of our businesses and functions may be impacted by these actions, including sales and marketing, manufacturing and R&D, as well as groups such as information technology, shared services and corporate operations.
Transforming to a More Focused Company Program
With the formation of the GSK Consumer Healthcare joint venture and the anticipated combination of Upjohn, our global, primarily off-patent branded and generics business, with Mylan, Pfizer is transforming itself into a more focused, global leader in science-based innovative medicines. As a result, we began in the fourth quarter of 2019, to identify and undertake efforts to ensure our cost base aligns appropriately with our Biopharmaceutical revenue base as a result of both the completed GSK Consumer Healthcare and expected Upjohn transactions. While certain direct costs have transferred or will transfer to the GSK Consumer Healthcare joint venture and to the Upjohn entities, there are indirect costs which are not expected to transfer. In addition, we are taking steps to restructure our organizations to appropriately support and drive the purpose of the three core functions of our focused innovative medicines business: R&D, Manufacturing and Commercial.
We expect the costs associated with this multi-year program to be incurred from 2020 through 2022 and to total approximately $1.2 billion on a pre-tax basis, with substantially all of the costs to be cash expenditures. Actions may include, among others, changes in location of certain activities, expanded use and co-location of centers of excellence and shared services, and increased use of digital technologies. The associated actions and the specific costs will primarily include severance and benefit plan impacts, exit costs as well as associated implementation costs.
Also as part of this program, in connection with the legacy cost reduction initiatives, primarily related to manufacturing activities, we expect to incur costs of approximately $400 million, with approximately 20% of the costs to be non-cash. The costs associated with this effort are expected to be incurred from 2020 through 2022, and will primarily include implementation costs, product transfer costs, exit costs, as well as accelerated depreciation.
From the start of this program in the fourth quarter of 2019 through June 28, 2020, we incurred approximately $549 million associated with this program.
Current-Period Key Activities
For the first six months of 2020, we incurred costs of $566 million composed primarily of the Transforming to a More Focused Company program. For the first six months of 2019, we incurred costs of $32 million composed of $180 million associated with the 2017-2019 and Organizing for Growth initiatives, $51 million associated with the integration of Hospira, and income of $199 million primarily due to the reversal of certain accruals upon the effective favorable settlement of an IRS audit for multiple tax years and other acquisition-related initiatives.
15
PFIZER INC. AND SUBSIDIARY COMPANIES
NOTES TO CONDENSED CONSOLIDATED FINANCIAL STATEMENTS
(UNAUDITED)
The following table provides the components of costs associated with acquisitions and cost-reduction/productivity initiatives: | ||||||||||||||||
Three Months Ended | Six Months Ended | |||||||||||||||
(MILLIONS OF DOLLARS) | June 28, 2020 | June 30, 2019 | June 28, 2020 | June 30, 2019 | ||||||||||||
Restructuring charges/(credits): | ||||||||||||||||
Employee terminations | $ | 346 | $ | (166 | ) | $ | 371 | $ | (167 | ) | ||||||
Asset impairments | (8 | ) | (9 | ) | 23 | — | ||||||||||
Exit costs | 1 | 31 | 1 | 34 | ||||||||||||
Restructuring charges(a) | 340 | (144 | ) | 396 | (134 | ) | ||||||||||
Transaction costs(b) | 11 | — | 14 | — | ||||||||||||
Integration costs and other(c) | 11 | 29 | 21 | 64 | ||||||||||||
Restructuring charges and certain acquisition-related costs | 362 | (115 | ) | 431 | (69 | ) | ||||||||||
Net periodic benefit costs recorded in Other (income)/deductions––net | 5 | 4 | 29 | 10 | ||||||||||||
Additional depreciation––asset restructuring recorded in our condensed consolidated statements of income as follows(d): | ||||||||||||||||
Cost of sales | 4 | 7 | 10 | 15 | ||||||||||||
Selling, informational and administrative expenses | — | 1 | — | 2 | ||||||||||||
Research and development expenses | 2 | 2 | (3 | ) | 5 | |||||||||||
Total additional depreciation––asset restructuring | 6 | 10 | 6 | 23 | ||||||||||||
Implementation costs recorded in our condensed consolidated statements of income as follows(e): | ||||||||||||||||
Cost of sales | 11 | 17 | 21 | 31 | ||||||||||||
Selling, informational and administrative expenses | 63 | 16 | 78 | 25 | ||||||||||||
Research and development expenses | 1 | 9 | 1 | 13 | ||||||||||||
Total implementation costs | 75 | 42 | 99 | 69 | ||||||||||||
Total costs associated with acquisitions and cost-reduction/productivity initiatives | $ | 449 | $ | (59 | ) | $ | 566 | $ | 32 | |||||||
(a) | In the second quarter and first six months of 2020, restructuring charges mainly represent employee termination costs associated with our Transforming to a More Focused Company cost reduction program. In the second quarter and first six months of 2019, restructuring credits mostly represent the reversal of certain accruals related to our acquisition of Wyeth upon the effective favorable settlement of an IRS audit for multiple tax years. See Notes to Consolidated Financial Statements––Note 5D. Tax Matters: Tax Contingencies in our 2019 Financial Report. |
The restructuring activities for 2020 are associated with the following:
• | For the second quarter of 2020, Biopharma ($12 million credit); Upjohn ($1 million credit); and Other ($352 million charge). |
• | For the first six months of 2020, Biopharma ($9 million credit); Upjohn ($12 million charge); and Other ($393 million charge). |
The restructuring activities for 2019 are associated with the following:
• | For the second quarter of 2019, Biopharma ($62 million credit); Upjohn ($9 million credit); and Other ($74 million credit). |
• | For the first six months of 2019, Biopharma ($48 million credit); Upjohn ($22 million credit); and Other ($63 million credit). |
Restructuring costs identified as Other are for restructuring activities associated with corporate enabling functions, WRDM, GPD and other manufacturing and commercial operations, as applicable. For the second quarter and first six months of 2020, restructuring costs identified as Other primarily relate to corporate enabling functions.
(b) | Transaction costs represent external costs for banking, legal, accounting and other similar services. |
(c) | Integration costs and other represent external, incremental costs directly related to integrating acquired businesses, such as expenditures for consulting and the integration of systems and processes, and certain other qualifying costs. In the second quarter and first six months of 2020, integration costs and other were mostly related to our acquisition of Array. In the second quarter and first six months of 2019, integration costs and other were primarily related to our acquisition of Hospira. |
(d) | Additional depreciation––asset restructuring represents the impact of changes in the estimated useful lives of assets involved in restructuring actions. |
(e) | Implementation costs represent external, incremental costs directly related to implementing our non-acquisition-related cost-reduction/productivity initiatives. |
The following table provides the components of and changes in our restructuring accruals: | ||||||||||||||||
(MILLIONS OF DOLLARS) | Employee Termination Costs | Asset Impairment Charges | Exit Costs | Accrual | ||||||||||||
Balance, December 31, 2019(a) | $ | 887 | $ | — | $ | 46 | $ | 933 | ||||||||
Provision | 371 | 23 | 1 | 396 | ||||||||||||
Utilization and other(b) | (341 | ) | (23 | ) | (14 | ) | (378 | ) | ||||||||
Balance, June 28, 2020(c) | $ | 918 | $ | — | $ | 34 | $ | 951 | ||||||||
(a) | Included in Other current liabilities ($714 million) and Other noncurrent liabilities ($219 million). |
16
PFIZER INC. AND SUBSIDIARY COMPANIES
NOTES TO CONDENSED CONSOLIDATED FINANCIAL STATEMENTS
(UNAUDITED)
(b) | Includes adjustments for foreign currency translation. |
(c) | Included in Other current liabilities ($625 million) and Other noncurrent liabilities ($326 million). |
Note 4. Other (Income)/Deductions—Net
The following table provides components of Other (income)/deductions––net: | ||||||||||||||||
Three Months Ended | Six Months Ended | |||||||||||||||
(MILLIONS OF DOLLARS) | June 28, 2020 | June 30, 2019 | June 28, 2020 | June 30, 2019 | ||||||||||||
Interest income(a) | $ | (19 | ) | $ | (59 | ) | $ | (53 | ) | $ | (125 | ) | ||||
Interest expense(a) | 372 | 389 | 762 | 750 | ||||||||||||
Net interest expense | 353 | 330 | 709 | 625 | ||||||||||||
Royalty-related income(b) | (191 | ) | (231 | ) | (311 | ) | (320 | ) | ||||||||
Net (gains)/losses on asset disposals | 1 | — | 2 | (1 | ) | |||||||||||
Net gains recognized during the period on equity securities(c) | (732 | ) | (36 | ) | (478 | ) | (147 | ) | ||||||||
Income from collaborations, out-licensing arrangements and sales of compound/product rights(d) | (100 | ) | (22 | ) | (215 | ) | (104 | ) | ||||||||
Net periodic benefit credits other than service costs(e) | (108 | ) | (51 | ) | (175 | ) | (91 | ) | ||||||||
Certain legal matters, net | 17 | 15 | 26 | 19 | ||||||||||||
Certain asset impairments(f) | — | 10 | — | 160 | ||||||||||||
Business and legal entity alignment costs(g) | — | 137 | — | 256 | ||||||||||||
Net losses on early retirement of debt | — | — | — | 138 | ||||||||||||
GSK Consumer Healthcare JV equity method (income)/loss(h) | (126 | ) | — | (92 | ) | — | ||||||||||
Other, net(i) | 25 | (27 | ) | (107 | ) | (318 | ) | |||||||||
Other (income)/deductions––net | $ | (862 | ) | $ | 126 | $ | (641 | ) | $ | 218 | ||||||
(a) |
(b) | Royalty-related income for the second quarter and first six months of 2019 included a one-time favorable resolution in the second quarter of 2019 of a legal dispute for $82 million. |
(c) | The gains in the second quarter of 2020 include, among other things, unrealized gains of $508 million related to our investment in Allogene and unrealized gains of $61 million related to our investment in BioNTech. The gains in the first six months of 2020 include, among other things, unrealized gains of $374 million related to our investment in Allogene and unrealized gains of $127 million related to our investment in BioNTech. The gains in the first six months of 2019 included, among other things, unrealized gains of $104 million related to our investment in Cortexyme, Inc. For additional information on investments, see Note 7B. |
(d) | Includes income from upfront and milestone payments from our collaboration partners and income from out-licensing arrangements and sales of compound/product rights. In the second quarter and first six months of 2020, mainly includes, among other things, $40 million of milestone income from Puma Biotechnology, Inc. related to Neratinib regulatory approvals in the EU, and $30 million of milestone income from Lilly related to the first commercial sale in the U.S. of LOXO-292 for the treatment of RET fusion-positive NSCLC. The first six months of 2020 also includes an upfront payment to us of $75 million from our sale of our CK1 assets to Biogen, Inc. In the first six months of 2019, primarily included $68 million in milestone income from Mylan Pharmaceuticals Inc. related to the FDA’s approval and launch of Wixela Inhub®, a generic of Advair Diskus®. |
(e) | For additional information, see Note 10. |
(f) | The first six months of 2019 included intangible asset impairment charges of: (i) $90 million related to WRDM IPR&D, for a pre-clinical stage asset from our acquisition of Bamboo for gene therapies for the potential treatment of patients with certain rare diseases, which was the result of a determination to not use certain Bamboo IPR&D acquired in future rare disease development, (ii) $40 million related to an Upjohn finite-lived developed technology right, acquired in connection with our acquisition of King, for government defense products and reflected, among other things, updated commercial forecasts including manufacturing cost assumptions, and (iii) $10 million related to a finite-lived developed technology right, acquired in connection with our acquisition of Anacor, for the treatment for toenail fungus marketed in the U.S. market only, associated with Biopharma and reflected, among other things, updated commercial forecasts. In addition, the first six months of 2019 included other asset impairments of $20 million. |
(g) | In the second quarter and first six months of 2019, represents incremental costs associated with the design, planning and implementation of our new organizational structure, effective in the beginning of 2019, and primarily includes consulting, legal, tax and advisory services. |
(h) | Includes our share of the GSK Consumer Healthcare joint venture’s earnings and the amortization of basis differences, which resulted from the excess of the initial fair value of our investment over the underlying equity in the carrying value of the net assets of the joint venture. See Note 2B for additional information. |
(i) | The second quarter of 2020 includes, among other things, dividend income of $76 million from our investment in ViiV, and charges of $86 million, reflecting the change in the fair value of contingent consideration. The first six months of 2020 includes, among other things, dividend income of $153 million from our investment in ViiV and charges of $99 million, reflecting the change in the fair value of contingent consideration. The second quarter of 2019 included, among other things, charges of $81 million, reflecting the change in the fair value of contingent consideration, dividend income of $76 million from our investment in ViiV, and $25 million of income from insurance recoveries related to Hurricane Maria. The first six months of 2019 included, among other things, dividend income of $140 million from our investment in ViiV and $50 million of income from insurance recoveries related to Hurricane Maria. |
17
PFIZER INC. AND SUBSIDIARY COMPANIES
NOTES TO CONDENSED CONSOLIDATED FINANCIAL STATEMENTS
(UNAUDITED)
Note 5. Tax Matters
A. Taxes on Income from Continuing Operations
Our effective tax rate for continuing operations was 13.1% for the second quarter of 2020, compared to (22.1)% for the second quarter of 2019 and was 12.7% for the first six months of 2020, compared to (5.7)% for the first six months of 2019.
The higher effective tax rate for the second quarter and first six months of 2020 in comparison with the same periods in 2019 was primarily due to:
• | the non-recurrence of the $1.4 billion tax benefit, representing taxes and interest, recorded in the second quarter of 2019 due to the favorable settlement of an IRS audit for multiple tax years (see Notes to Consolidated Financial Statements––Note 5D. Tax Matters: Tax Contingencies in our 2019 Financial Report); and |
• | the non-recurrence of the tax benefit recorded in the first six months of 2019 as a result of additional guidance issued by the U.S. Department of Treasury related to the TCJA, |
partially offset by:
• | the favorable change in the jurisdictional mix of earnings as a result of operating fluctuations in the normal course of business. |
Our initial estimated $15 billion repatriation tax liability on accumulated post-1986 foreign earnings for which we elected, with the filing of our 2018 U.S. Federal Consolidated Income Tax Return, payment over eight years through 2026 is reported in current Income taxes payable (approximately $1.4 billion) and the remaining liability is reported in noncurrent Other taxes payable in our condensed consolidated balance sheet as of June 28, 2020. The second installment of $680 million was paid in July 2020, which was originally due to be paid in April 2020 but was extended to July 2020 by the IRS in response to the COVID-19 pandemic. The third installment of approximately $750 million is due in April 2021. Our obligations may vary as a result of changes in our uncertain tax positions and/or availability of attributes such as foreign tax and other credit carryforwards.
On March 27, 2020, the Coronavirus Aid, Relief, and Economic Security Act (CARES Act) was signed into law in the U.S. to provide certain relief as a result of the COVID-19 pandemic. In addition, governments around the world have enacted or implemented various forms of tax relief measures in response to the economic conditions in the wake of COVID-19. As of June 28, 2020, neither the CARES Act nor changes to income tax laws or regulations in other jurisdictions had a significant impact on our effective tax rate.
B. Tax Contingencies
We are subject to income tax in many jurisdictions, and a certain degree of estimation is required in recording the assets and liabilities related to income taxes. All of our tax positions are subject to audit by the local taxing authorities in each tax jurisdiction. These tax audits can involve complex issues, interpretations and judgments and the resolution of matters may span multiple years, particularly if subject to negotiation or litigation. Our assessments are based on estimates and assumptions that have been deemed reasonable by management, but our estimates of unrecognized tax benefits and potential tax benefits may not be representative of actual outcomes, and variation from such estimates could materially affect our financial statements in the period of settlement or when the statutes of limitations expire, as we treat these events as discrete items in the period of resolution.
The U.S. is one of our major tax jurisdictions, and we are regularly audited by the IRS. With respect to Pfizer, the IRS has issued a Revenue Agent’s Report (RAR) for tax years 2011-2013. We are not in agreement with the RAR and are currently appealing certain disputed issues. Tax years 2014-2015 are currently under audit. Tax years 2016-2020 are open, but not under audit. All other tax years are closed.
In addition to the open audit years in the U.S., we have open audit years in other major tax jurisdictions, such as Canada (2013-2020), Japan (2017-2020), Europe (2011-2020, primarily reflecting Ireland, the U.K., France, Italy, Spain and Germany), Latin America (1998-2020, primarily reflecting Brazil) and Puerto Rico (2015-2020).
18
PFIZER INC. AND SUBSIDIARY COMPANIES
NOTES TO CONDENSED CONSOLIDATED FINANCIAL STATEMENTS
(UNAUDITED)
C. Tax Provision/(Benefit) on Other Comprehensive Loss
The following table provides the components of Tax provision/(benefit) on other comprehensive loss: | ||||||||||||||||
Three Months Ended | Six Months Ended | |||||||||||||||
(MILLIONS OF DOLLARS) | June 28, 2020 | June 30, 2019 | June 28, 2020 | June 30, 2019 | ||||||||||||
Foreign currency translation adjustments, net(a) | $ | 60 | $ | (17 | ) | $ | (192 | ) | $ | 10 | ||||||
Unrealized holding gains/(losses) on derivative financial instruments, net | 51 | (53 | ) | (82 | ) | 6 | ||||||||||
Reclassification adjustments for gains included in net income | (35 | ) | (4 | ) | (20 | ) | (59 | ) | ||||||||
16 | (57 | ) | (102 | ) | (53 | ) | ||||||||||
Unrealized holding gains/(losses) on available-for-sale securities, net | 5 | (1 | ) | (1 | ) | 4 | ||||||||||
Reclassification adjustments for losses included in net income | 6 | 3 | 7 | 5 | ||||||||||||
11 | 2 | 6 | 9 | |||||||||||||
Benefit plans: actuarial gains/(losses), net | 2 | (1 | ) | (19 | ) | (1 | ) | |||||||||
Reclassification adjustments related to amortization | 16 | 15 | 31 | 18 | ||||||||||||
Reclassification adjustments related to settlements, net | 2 | — | 12 | 1 | ||||||||||||
Other | 16 | 8 | 20 | 3 | ||||||||||||
35 | 23 | 43 | 21 | |||||||||||||
Reclassification adjustments related to amortization of prior service costs and other, net | (11 | ) | (11 | ) | (21 | ) | (22 | ) | ||||||||
Other | 1 | — | 1 | — | ||||||||||||
(9 | ) | (11 | ) | (20 | ) | (22 | ) | |||||||||
Tax provision/(benefit) on other comprehensive loss | $ | 113 | $ | (59 | ) | $ | (265 | ) | $ | (34 | ) | |||||
(a) | Taxes are not provided for foreign currency translation adjustments relating to investments in international subsidiaries that will be held indefinitely. |
Note 6. Accumulated Other Comprehensive Loss, Excluding Noncontrolling Interests
The following table provides the changes, net of tax, in Accumulated other comprehensive loss: | ||||||||||||||||||||||||
Net Unrealized Gains/(Losses) | Benefit Plans | |||||||||||||||||||||||
(MILLIONS OF DOLLARS) | Foreign Currency Translation Adjustments | Derivative Financial Instruments | Available-For-Sale Securities | Actuarial Gains/(Losses) | Prior Service (Costs)/Credits and Other | Accumulated Other Comprehensive Income/(Loss) | ||||||||||||||||||
Balance, December 31, 2019 | $ | (5,952 | ) | $ | 20 | $ | (35 | ) | $ | (6,257 | ) | $ | 584 | $ | (11,640 | ) | ||||||||
Other comprehensive income/(loss)(a) | (1,310 | ) | (353 | ) | 44 | 79 | (65 | ) | (1,605 | ) | ||||||||||||||
Balance, June 28, 2020 | $ | (7,262 | ) | $ | (333 | ) | $ | 9 | $ | (6,178 | ) | $ | 518 | $ | (13,246 | ) | ||||||||
(a) | Amounts do not include foreign currency translation adjustments attributable to noncontrolling interests of $12 million loss for the first six months of 2020. Includes after-tax losses of approximately $902 million related to foreign currency translation adjustments and the impact of our net investment hedging program, both attributable to our equity method investment in GSK Consumer Healthcare (see Note 2B), and losses from the weakening of certain major currencies against the U.S. dollar. These losses were partially offset by the results of our net investment hedging program. |
19
PFIZER INC. AND SUBSIDIARY COMPANIES
NOTES TO CONDENSED CONSOLIDATED FINANCIAL STATEMENTS
(UNAUDITED)
Note 7. Financial Instruments
A. Fair Value Measurements
Financial Assets and Liabilities Measured at Fair Value on a Recurring Basis
The following table presents the financial assets and liabilities measured at fair value using a market approach on a recurring basis by balance sheet categories and fair value hierarchy level as defined in Notes to Consolidated Financial Statements––Note 1E. Basis of Presentation and Significant Accounting Policies: Fair Value in our 2019 Financial Report: | ||||||||||||||||||||||||
June 28, 2020 | December 31, 2019 | |||||||||||||||||||||||
(MILLIONS OF DOLLARS) | Total | Level 1 | Level 2 | Total | Level 1 | Level 2 | ||||||||||||||||||
Financial assets measured at fair value on a recurring basis: | ||||||||||||||||||||||||
Short-term investments | ||||||||||||||||||||||||
Classified as equity securities with readily determinable fair values: | ||||||||||||||||||||||||
Money market funds(a) | $ | 13,033 | $ | — | $ | 13,033 | $ | 705 | $ | — | $ | 705 | ||||||||||||
Classified as available-for-sale debt securities: | ||||||||||||||||||||||||
Government and agency—non-U.S. | 6,218 | — | 6,218 | 4,863 | — | 4,863 | ||||||||||||||||||
Government and agency—U.S. | 14 | — | 14 | 811 | — | 811 | ||||||||||||||||||
Corporate and other | 1,440 | — | 1,440 | 1,013 | — | 1,013 | ||||||||||||||||||
7,672 | — | 7,672 | 6,687 | — | 6,687 | |||||||||||||||||||
Total short-term investments | 20,705 | — | 20,705 | 7,392 | — | 7,392 | ||||||||||||||||||
Other current assets | ||||||||||||||||||||||||
Derivative assets: | ||||||||||||||||||||||||
Interest rate contracts | 17 | — | 17 | 53 | — | 53 | ||||||||||||||||||
Foreign exchange contracts | 413 | — | 413 | 413 | — | 413 | ||||||||||||||||||
Total other current assets | 431 | — | 431 | 465 | — | 465 | ||||||||||||||||||
Long-term investments | ||||||||||||||||||||||||
Classified as equity securities with readily determinable fair values(b) | 2,072 | 2,046 | 26 | 1,902 | 1,863 | 39 | ||||||||||||||||||
Classified as available-for-sale debt securities: | ||||||||||||||||||||||||
Government and agency—U.S. | 243 | — | 243 | 303 | — | 303 | ||||||||||||||||||
Corporate and other | 11 | — | 11 | 11 | — | 11 | ||||||||||||||||||
254 | — | 254 | 315 | — | 315 | |||||||||||||||||||
Total long-term investments | 2,326 | 2,046 | 280 | 2,216 | 1,863 | 354 | ||||||||||||||||||
Other noncurrent assets | ||||||||||||||||||||||||
Derivative assets: | ||||||||||||||||||||||||
Interest rate contracts | 140 | — | 140 | 266 | — | 266 | ||||||||||||||||||
Foreign exchange contracts | 221 | — | 221 | 261 | — | 261 | ||||||||||||||||||
Total derivative assets | 362 | — | 362 | 526 | — | 526 | ||||||||||||||||||
Insurance contracts(c) | 578 | — | 578 | 575 | — | 575 | ||||||||||||||||||
Total other noncurrent assets | 940 | — | 940 | 1,102 | — | 1,102 | ||||||||||||||||||
Total assets | $ | 24,402 | $ | 2,046 | $ | 22,355 | $ | 11,176 | $ | 1,863 | $ | 9,313 | ||||||||||||
Financial liabilities measured at fair value on a recurring basis: | ||||||||||||||||||||||||
Other current liabilities | ||||||||||||||||||||||||
Derivative liabilities: | ||||||||||||||||||||||||
Foreign exchange contracts | $ | 127 | $ | — | $ | 127 | $ | 114 | $ | — | $ | 114 | ||||||||||||
Total other current liabilities | 127 | — | 127 | 114 | — | 114 | ||||||||||||||||||
Other noncurrent liabilities | ||||||||||||||||||||||||
Derivative liabilities: | ||||||||||||||||||||||||
Foreign exchange contracts | 866 | — | 866 | 604 | — | 604 | ||||||||||||||||||
Total other noncurrent liabilities | 866 | — | 866 | 604 | — | 604 | ||||||||||||||||||
Total liabilities | $ | 993 | $ | — | $ | 993 | $ | 718 | $ | — | $ | 718 | ||||||||||||
(a) | As of June 28, 2020, $11.4 billion of proceeds from the Upjohn debt transactions (see Note 7D) are invested in money market funds and included in Restricted short-term investments in the condensed consolidated balance sheet. |
(b) | As of June 28, 2020, long-term equity securities of $163 million and as of December 31, 2019, long-term equity securities of $176 million were held in restricted trusts for benefits attributable to various U.S. non-qualified employee benefit plans. |
(c) | Other noncurrent assets include life insurance policies held in restricted trusts attributable to the funding of various U.S. non-qualified employee benefit plans. The underlying invested assets in these insurance contracts are marketable securities, which are carried at fair value, with changes in fair value recognized in Other (income)/deductions––net in the condensed consolidated statements of income (see Note 4). |
20
PFIZER INC. AND SUBSIDIARY COMPANIES
NOTES TO CONDENSED CONSOLIDATED FINANCIAL STATEMENTS
(UNAUDITED)
Financial Assets and Liabilities Not Measured at Fair Value on a Recurring Basis
The following table presents the financial liabilities not measured at fair value on a recurring basis, including the carrying values and estimated fair values using a market approach: | ||||||||||||||||||||||||
June 28, 2020 | December 31, 2019 | |||||||||||||||||||||||
Carrying Value | Estimated Fair Value | Carrying Value | Estimated Fair Value | |||||||||||||||||||||
(MILLIONS OF DOLLARS) | Total | Level 2 | Total | Level 2 | ||||||||||||||||||||
Financial Liabilities | ||||||||||||||||||||||||
Long-term debt, excluding the current portion(a) | $ | 50,529 | $ | 59,121 | $ | 59,121 | $ | 35,955 | $ | 40,842 | $ | 40,842 | ||||||||||||
(a) | As of June 28, 2020, $11.4 billion of proceeds from the Upjohn debt transactions (see Note 7D) are invested in money market funds and included in Restricted short-term investments in the condensed consolidated balance sheet. |
The differences between the estimated fair values and carrying values of held-to-maturity debt securities, private equity securities, and short-term borrowings not measured at fair value on a recurring basis were not significant as of June 28, 2020 or December 31, 2019. The fair value measurements of our held-to-maturity debt securities and our short-term borrowings are based on Level 2 inputs. The fair value measurements of our private equity securities, which represent investments in the life sciences sector, are based on Level 3 inputs using a market approach.
In addition, as of June 28, 2020 and December 31, 2019, we had long-term receivables whose fair value is based on Level 3 inputs. As of June 28, 2020 and December 31, 2019, the differences between the estimated fair values and carrying values of these receivables were not significant.
Total Short-Term and Long-Term Investments and Equity-Method Investments
The following table represents our investments by classification type: | ||||||||
(MILLIONS OF DOLLARS) | June 28, 2020 | December 31, 2019 | ||||||
Short-term investments | ||||||||
Equity securities with readily determinable fair values(a) | $ | 13,033 | $ | 705 | ||||
Available-for-sale debt securities | 7,672 | 6,687 | ||||||
Held-to-maturity debt securities | 288 | 1,133 | ||||||
Total Short-term investments | $ | 20,993 | $ | 8,525 | ||||
Long-term investments | ||||||||
Equity securities with readily determinable fair values | $ | 2,072 | $ | 1,902 | ||||
Available-for-sale debt securities | 254 | 315 | ||||||
Held-to-maturity debt securities | 43 | 42 | ||||||
Private equity securities at cost | 772 | 756 | ||||||
Total Long-term investments | $ | 3,142 | $ | 3,014 | ||||
Equity-method investments | 15,578 | 17,133 | ||||||
Total long-term investments and equity-method investments | $ | 18,720 | $ | 20,147 | ||||
Held-to-maturity cash equivalents | $ | 119 | $ | 163 | ||||
(a) | As of June 28, 2020 and December 31, 2019, equity securities with readily determinable fair values included money market funds primarily invested in U.S. Treasury and government debt. As of June 28, 2020, $11.4 billion of proceeds from the Upjohn debt transactions (see Note 7D) are invested in money market funds and included in Restricted short-term investments in the condensed consolidated balance sheet. |
.
21
PFIZER INC. AND SUBSIDIARY COMPANIES
NOTES TO CONDENSED CONSOLIDATED FINANCIAL STATEMENTS
(UNAUDITED)
B. Investments
Debt Securities
At June 28, 2020, our investment securities portfolio consisted of debt securities that were virtually all investment-grade. Information on investments in debt securities at June 28, 2020 and December 31, 2019 is as follows, including, as of June 28, 2020, the contractual maturities, or as necessary, the estimated maturities, of the available-for-sale and held-to-maturity debt securities: | ||||||||||||||||||||||||||||||||||||||||||||||||
June 28, 2020 | December 31, 2019 | |||||||||||||||||||||||||||||||||||||||||||||||
Gross Unrealized | Maturities (in Years) | Gross Unrealized | ||||||||||||||||||||||||||||||||||||||||||||||
(MILLIONS OF DOLLARS) | Amortized Cost | Gains | Losses | Fair Value | Within 1 | Over 1 to 5 | Over 5 | Total | Amortized Cost | Gains | Losses | Fair Value | ||||||||||||||||||||||||||||||||||||
Available-for-sale debt securities | ||||||||||||||||||||||||||||||||||||||||||||||||
Government and agency––non-U.S. | $ | 6,209 | $ | 12 | $ | (3 | ) | $ | 6,218 | $ | 6,218 | $ | — | $ | — | $ | 6,218 | $ | 4,895 | $ | 6 | $ | (38 | ) | $ | 4,863 | ||||||||||||||||||||||
Government and agency––U.S. | 257 | 1 | (1 | ) | 257 | 14 | 243 | — | 257 | 1,120 | — | (6 | ) | 1,114 | ||||||||||||||||||||||||||||||||||
Corporate and other(a) | 1,450 | 2 | (1 | ) | 1,451 | 1,440 | 11 | — | 1,451 | 1,027 | — | (2 | ) | 1,025 | ||||||||||||||||||||||||||||||||||
Held-to-maturity debt securities | ||||||||||||||||||||||||||||||||||||||||||||||||
Time deposits and other | 228 | — | — | 228 | 189 | 9 | 30 | 228 | 535 | — | — | 535 | ||||||||||||||||||||||||||||||||||||
Government and agency––non-U.S. | 222 | — | — | 222 | 218 | — | 4 | 222 | 803 | — | — | 803 | ||||||||||||||||||||||||||||||||||||
Total debt securities | $ | 8,366 | $ | 16 | $ | (5 | ) | $ | 8,376 | $ | 8,079 | $ | 263 | $ | 35 | $ | 8,376 | $ | 8,380 | $ | 6 | $ | (47 | ) | $ | 8,340 | ||||||||||||||||||||||
(a) | Primarily issued by a diverse group of corporations. |
For our portfolio of available-for-sale and held-to-maturity debt securities, any expected credit losses would be immaterial to the financial statements.
Equity Securities
The following table presents the calculation of the portion of unrealized gains for the period that relates to equity securities, excluding equity method investments, still held at the reporting date: | ||||||||||||||||
Three Months Ended | Six Months Ended | |||||||||||||||
(MILLIONS OF DOLLARS) | June 28, 2020 | June 30, 2019 | June 28, 2020 | June 30, 2019 | ||||||||||||
Net gains recognized during the period on equity securities(a) | $ | (732 | ) | $ | (36 | ) | $ | (478 | ) | $ | (147 | ) | ||||
Less: Net (gains)/losses recognized during the period on equity securities sold during the period | 1 | (6 | ) | (18 | ) | (10 | ) | |||||||||
Net unrealized gains during the reporting period on equity securities still held at the reporting date(b) | $ | (733 | ) | $ | (31 | ) | $ | (459 | ) | $ | (137 | ) | ||||
(a) | The net gains on investments in equity securities are reported in Other (income)/deductions––net. For additional information, see Note 4. |
(b) | Included in net unrealized gains are observable price changes on equity securities without readily determinable fair values. Since January 1, 2018, there were cumulative impairments and downward adjustments of $67 million and upward adjustments of $66 million. Impairments, downward and upward adjustments were not significant in the second quarter and the first six months of 2020 and 2019. |
C. Short-Term Borrowings
Short-term borrowings include: | ||||||||
(MILLIONS OF DOLLARS) | June 28, 2020 | December 31, 2019 | ||||||
Commercial paper | $ | 10,660 | $ | 13,915 | ||||
Current portion of long-term debt, principal amount | 1,481 | 1,458 | ||||||
Other short-term borrowings, principal amount(a) | 956 | 860 | ||||||
Total short-term borrowings, principal amount | 13,097 | 16,233 | ||||||
Net fair value adjustments related to hedging and purchase accounting | 1 | 5 | ||||||
Net unamortized discounts, premiums and debt issuance costs | (14 | ) | (43 | ) | ||||
Total Short-term borrowings, including current portion of long-term debt, carried at historical proceeds, as adjusted | $ | 13,084 | $ | 16,195 | ||||
(a) | Other short-term borrowings primarily include cash collateral. For additional information, see Note 7E. |
22
PFIZER INC. AND SUBSIDIARY COMPANIES
NOTES TO CONDENSED CONSOLIDATED FINANCIAL STATEMENTS
(UNAUDITED)
D. Long-Term Debt
New Issuances
In the second quarter of 2020, we issued the following senior unsecured notes: | ||||||
(MILLIONS OF DOLLARS) | ||||||
Principal | ||||||
Interest Rate | Maturity Date | As of June 28, 2020 | ||||
Pfizer Inc.(a) | ||||||
0.800% | May 28, 2025 | $ | 750 | |||
1.700% | May 28, 2030 | 1,000 | ||||
2.550% | May 28, 2040 | 1,000 | ||||
2.700% | May 28, 2050 | 1,250 | ||||
$ | 4,000 | |||||
Upjohn Inc., a wholly-owned subsidiary of Pfizer Inc.(b) | ||||||
1.125% | June 22, 2022 | $ | 1,000 | |||
1.650% | June 22, 2025 | 750 | ||||
2.300% | June 22, 2027 | 750 | ||||
2.700% | June 22, 2030 | 1,450 | ||||
3.850% | June 22, 2040 | 1,500 | ||||
4.000% | June 22, 2050 | 2,000 | ||||
$ | 7,450 | |||||
Upjohn Finance B.V., a wholly-owned subsidiary of Upjohn Inc.(b) | ||||||
0.816% | June 23, 2022 | € | 750 | |||
1.023% | June 23, 2024 | 750 | ||||
1.362% | June 23, 2027 | 850 | ||||
1.908% | June 23, 2032 | 1,250 | ||||
€ | 3,600 | |||||
(a) | The notes may be redeemed by us at any time, in whole, or in part, at varying redemption prices plus accrued and unpaid interest. The weighted-average effective interest rate for the notes at issuance was 2.11%. |
(b) | In June 2020, Upjohn Inc. and Upjohn Finance B.V. completed privately placed debt offerings in connection with the previously announced proposed Reverse Morris Trust transaction that will ultimately combine Upjohn and Mylan to form a new company, Viatris. The notes may be redeemed by Upjohn Inc. and Upjohn Finance B.V., as applicable, at any time, in whole, or in part, at varying redemption prices plus accrued and unpaid interest. The weighted-average effective interest rates at issuance were 2.95% for the $7.45 billion notes and 1.37% for the €3.60 billion notes. If the proposed transaction with Mylan does not close on or prior to February 1, 2021, or if, prior to such date, Upjohn Inc. and Mylan notify the trustee that the business combination agreement for the proposed transaction with Mylan is terminated, or the transaction will not otherwise be pursued, the notes must be redeemed at redemption prices equal to 101% of their respective principal amounts, plus accrued and unpaid interest. Pfizer has guaranteed these notes, and such guarantees will automatically and unconditionally terminate without the consent of holders of the notes upon the proposed distribution to Pfizer’s stockholders of all of the issued and outstanding shares of Upjohn Inc.’s common stock held by Pfizer (the Distribution). Upjohn Inc. has guaranteed the notes issued by Upjohn Finance B.V., and Upjohn Inc. will remain a guarantor of such notes post Distribution. Following the separation, Upjohn Inc. and Upjohn Finance B.V., as applicable, will remain the obligor. The proceeds from the financings will be used in part to fund a cash distribution from Upjohn Inc. to Pfizer immediately prior to the Distribution. In the interim, the $11.4 billion of proceeds are classified as Restricted short-term investments in the condensed consolidated balance sheet as of June 28, 2020 pursuant to the terms of the transaction agreements. |
In the first quarter of 2020, we issued the following senior unsecured notes: | ||||||
(MILLIONS OF DOLLARS) | Principal | |||||
Interest Rate | Maturity Date | As of June 28, 2020 | ||||
2.625%(a) | April 1, 2030 | $ | 1,250 | |||
Total long-term debt issued in the first quarter of 2020(b) | $ | 1,250 | ||||
(a) | The notes may be redeemed by us at any time, in whole, or in part, at a redemption price plus accrued and unpaid interest. |
(b) | The effective interest rate for the notes at issuance was 2.67%. |
23
PFIZER INC. AND SUBSIDIARY COMPANIES
NOTES TO CONDENSED CONSOLIDATED FINANCIAL STATEMENTS
(UNAUDITED)
The following table provides the aggregate principal amount of our senior unsecured long-term debt, and adjustments to report our aggregate long-term debt: | ||||||||
(MILLIONS OF DOLLARS) | June 28, 2020 | December 31, 2019 | ||||||
Total long-term debt, principal amount(a) | $ | 49,187 | $ | 34,820 | ||||
Net fair value adjustments related to hedging and purchase accounting | 1,654 | 1,305 | ||||||
Net unamortized discounts, premiums and debt issuance costs | (317 | ) | (176 | ) | ||||
Other long-term debt | 5 | 5 | ||||||
Total long-term debt, carried at historical proceeds, as adjusted | $ | 50,529 | $ | 35,955 | ||||
Current portion of long-term debt, carried at historical proceeds, as adjusted (not included above) | $ | 1,481 | $ | 1,462 | ||||
(a) | As of June 28, 2020, $11.4 billion of proceeds from the Upjohn debt transactions are invested in money market funds and included in Restricted short-term investments in the condensed consolidated balance sheet. |
Retirements
In March 2020, we repurchased at par all $1.065 billion principal amount outstanding of our senior unsecured notes that were due in 2047 before the maturity date, which did not have a material impact on our condensed consolidated financial statements.
E. Derivative Financial Instruments and Hedging Activities
Foreign Exchange Risk
A significant portion of our revenues, earnings and net investments in foreign affiliates is exposed to changes in foreign exchange rates. We manage our foreign exchange risk, in part, through operational means, including managing same-currency revenues in relation to same-currency costs and same-currency assets in relation to same-currency liabilities. We also manage our foreign exchange risk, depending on market conditions, through fair value, cash flow, and net investment hedging programs through the use of derivative financial instruments and foreign currency debt. These financial instruments serve to protect net income against the impact of remeasurement into another currency, or against the impact of translation into U.S. dollars of certain foreign exchange-denominated transactions.
The derivative financial instruments primarily hedge or offset exposures in the euro, U.K. pound, Japanese yen, Swedish krona and Chinese renminbi.
As a part of our cash flow hedging program, we designate foreign exchange contracts to hedge a portion of our forecasted euro, Japanese yen, Chinese renminbi, Canadian dollar, U.K. pound and Australian dollar-denominated intercompany inventory sales expected to occur no more than two years from the date of each hedge.
Interest Rate Risk
Our interest-bearing investments and borrowings are subject to interest rate risk. With respect to our investments, we strive to maintain a predominantly floating-rate basis position, but our strategy may change based on prevailing market conditions. We currently borrow primarily on a long-term, fixed-rate basis. From time to time, depending on market conditions, we will change the profile of our outstanding debt by entering into derivative financial instruments like interest rate swaps. We entered into derivative financial instruments to hedge or offset the fixed interest rates on the hedged item, matching the amount and timing of the hedged item. The derivative financial instruments primarily hedge U.S. dollar fixed-rate debt.
The following table provides the fair value of the derivative financial instruments and the related notional amounts presented between those derivatives that are designated as hedging instruments and those that are not designated as hedging instruments: | ||||||||||||||||||||||||
(MILLIONS OF DOLLARS) | June 28, 2020 | December 31, 2019 | ||||||||||||||||||||||
Fair Value | Fair Value | |||||||||||||||||||||||
Notional | Asset | Liability | Notional | Asset | Liability | |||||||||||||||||||
Derivatives designated as hedging instruments: | ||||||||||||||||||||||||
Foreign exchange contracts(a) | $ | 22,543 | $ | 551 | $ | 914 | $ | 25,193 | $ | 591 | $ | 662 | ||||||||||||
Interest rate contracts | 1,995 | 158 | — | 6,645 | 318 | — | ||||||||||||||||||
708 | 914 | 909 | 662 | |||||||||||||||||||||
Derivatives not designated as hedging instruments: | ||||||||||||||||||||||||
Foreign exchange contracts | $ | 14,433 | 84 | 79 | $ | 19,623 | 82 | 55 | ||||||||||||||||
Total | $ | 792 | $ | 993 | $ | 992 | $ | 718 | ||||||||||||||||
24
PFIZER INC. AND SUBSIDIARY COMPANIES
NOTES TO CONDENSED CONSOLIDATED FINANCIAL STATEMENTS
(UNAUDITED)
(a) | The notional amount of outstanding foreign currency forward-exchange contracts hedging our intercompany forecasted inventory sales was $5.2 billion as of June 28, 2020 and $5.9 billion as of December 31, 2019. |
The following table provides information about the gains/(losses) incurred to hedge or offset operational foreign exchange or interest rate risk: | ||||||||||||||||||||||||
Amount of Gains/(Losses) Recognized in OID(a) | Amount of Gains/(Losses) Recognized in OCI(a), (b) | Amount of Gains/(Losses) Reclassified from OCI into OID and COS(a), (b) | ||||||||||||||||||||||
(MILLIONS OF DOLLARS) | June 28, 2020 | June 30, 2019 | June 28, 2020 | June 30, 2019 | June 28, 2020 | June 30, 2019 | ||||||||||||||||||
Three Months Ended | ||||||||||||||||||||||||
Derivative Financial Instruments in Cash Flow Hedge Relationships: | ||||||||||||||||||||||||
Foreign exchange contracts(c) | $ | — | $ | — | $ | 187 | $ | (204 | ) | $ | 172 | $ | 48 | |||||||||||
Amount excluded from effectiveness testing recognized in earnings based on an amortization approach(d) | — | — | 13 | 28 | 14 | 32 | ||||||||||||||||||
Derivative Financial Instruments in Fair Value Hedge Relationships: | ||||||||||||||||||||||||
Interest rate contracts | 6 | 483 | — | — | — | — | ||||||||||||||||||
Hedged item | (6 | ) | (483 | ) | — | — | — | — | ||||||||||||||||
Foreign exchange contracts | — | — | — | — | — | — | ||||||||||||||||||
Hedged item | — | — | — | — | — | — | ||||||||||||||||||
Derivative Financial Instruments in Net Investment Hedge Relationships: | ||||||||||||||||||||||||
Foreign exchange contracts | — | — | (144 | ) | (48 | ) | — | — | ||||||||||||||||
The portion on foreign exchange contracts excluded from the assessment of hedge effectiveness(d) | — | — | 29 | 52 | 42 | 31 | ||||||||||||||||||
Non-Derivative Financial Instruments in Net Investment Hedge Relationships: | ||||||||||||||||||||||||
Foreign currency short-term borrowings(e) | — | — | — | (16 | ) | — | — | |||||||||||||||||
Foreign currency long-term debt(e) | — | — | (42 | ) | (27 | ) | — | — | ||||||||||||||||
Derivative Financial Instruments Not Designated as Hedges: | ||||||||||||||||||||||||
Foreign exchange contracts | 8 | (4 | ) | — | — | — | — | |||||||||||||||||
All other net(d) | — | — | 12 | — | — | — | ||||||||||||||||||
$ | 8 | $ | (4 | ) | $ | 56 | $ | (216 | ) | $ | 228 | $ | 111 | |||||||||||
25
PFIZER INC. AND SUBSIDIARY COMPANIES
NOTES TO CONDENSED CONSOLIDATED FINANCIAL STATEMENTS
(UNAUDITED)
Amount of Gains/(Losses) Recognized in OID(a) | Amount of Gains/(Losses) Recognized in OCI(a), (b) | Amount of Gains/(Losses) Reclassified from OCI into OID and COS(a), (b) | ||||||||||||||||||||||
(MILLIONS OF DOLLARS) | June 28, 2020 | June 30, 2019 | June 28, 2020 | June 30, 2019 | June 28, 2020 | June 30, 2019 | ||||||||||||||||||
Six Months Ended | ||||||||||||||||||||||||
Derivative Financial Instruments in Cash Flow Hedge Relationships: | ||||||||||||||||||||||||
Foreign exchange contracts(c) | $ | — | $ | — | $ | (341 | ) | $ | 6 | $ | 126 | $ | 257 | |||||||||||
Amount excluded from effectiveness testing recognized in earnings based on an amortization approach(d) | — | — | 42 | 84 | 41 | 86 | ||||||||||||||||||
Derivative Financial Instruments in Fair Value Hedge Relationships: | ||||||||||||||||||||||||
Interest rate contracts | 392 | 813 | — | — | — | — | ||||||||||||||||||
Hedged item | (392 | ) | (813 | ) | — | — | — | — | ||||||||||||||||
Foreign exchange contracts | — | — | — | — | — | — | ||||||||||||||||||
Hedged item | — | — | — | — | — | — | ||||||||||||||||||
Derivative Financial Instruments in Net Investment Hedge Relationships: | ||||||||||||||||||||||||
Foreign exchange contracts | — | — | 240 | (25 | ) | — | — | |||||||||||||||||
The portion of foreign exchange contracts excluded from the assessment of hedge effectiveness(d) | — | — | 176 | 93 | 84 | 55 | ||||||||||||||||||
Non-Derivative Financial Instruments in Net Investment Hedge Relationships: | ||||||||||||||||||||||||
Foreign currency short-term borrowings(e) | — | — | 8 | 19 | — | — | ||||||||||||||||||
Foreign currency long-term debt(e) | — | — | 3 | 11 | — | — | ||||||||||||||||||
Derivative Financial Instruments Not Designated as Hedges: | ||||||||||||||||||||||||
Foreign exchange contracts | (51 | ) | (124 | ) | — | — | — | — | ||||||||||||||||
All other net(d) | — | — | 12 | 1 | (1 | ) | — | |||||||||||||||||
$ | (51 | ) | $ | (124 | ) | $ | 139 | $ | 188 | $ | 251 | $ | 398 | |||||||||||
(a) | OID = Other (income)/deductions—net, included in Other (income)/deductions—net in the condensed consolidated statements of income. COS = Cost of Sales, included in Cost of sales in the condensed consolidated statements of income. OCI = Other comprehensive income/(loss), included in the condensed consolidated statements of comprehensive income. |
(b) | For derivative financial instruments in cash flow hedge relationships, the gains and losses are included in Other comprehensive loss––Unrealized holding gains/(losses) on derivative financial instruments, net. For derivative financial instruments in net investment hedge relationships and for foreign currency debt designated as hedging instruments, the gains and losses are included in Other comprehensive loss––Foreign currency translation adjustments, net. |
(c) | The amounts reclassified from OCI into COS were: |
• | a net gain of $80 million in the second quarter of 2020; |
• | a net gain of $150 million in the first six months of 2020; |
• | a net gain of $59 million in the second quarter of 2019; and |
• | a net gain of $103 million in the first six months of 2019. |
The remaining amounts were reclassified from OCI into OID. Based on quarter-end foreign exchange rates that are subject to change, we expect to reclassify a pre-tax gain of $102 million within the next 12 months into income. The maximum length of time over which we are hedging future foreign exchange cash flow relates to our $1.8 billion U.K. pound debt maturing in 2043.
(d) | The amounts reclassified from OCI were reclassified into OID. |
(e) | Long-term debt includes foreign currency long-term borrowings with carrying values of $2.0 billion as of June 28, 2020, which are used as hedging instruments in net investment hedges. |
26
PFIZER INC. AND SUBSIDIARY COMPANIES
NOTES TO CONDENSED CONSOLIDATED FINANCIAL STATEMENTS
(UNAUDITED)
The following table provides the amounts recorded in our condensed consolidated balance sheet related to cumulative basis adjustments for fair value hedges: | ||||||||||||||||||||||||
June 28, 2020 | December 31, 2019 | |||||||||||||||||||||||
Cumulative Amount of Fair Value Hedging Adjustment Increase/(Decrease) to Carrying Amount | Cumulative Amount of Fair Value Hedging Adjustment Increase/(Decrease) to Carrying Amount | |||||||||||||||||||||||
(MILLIONS OF DOLLARS) | Carrying Amount of Hedged Assets/Liabilities(a) | Active Hedging Relationships | Discontinued Hedging Relationships | Carrying Amount of Hedged Assets/Liabilities(a) | Active Hedging Relationships | Discontinued Hedging Relationships | ||||||||||||||||||
Short-term investments | $ | 45 | $ | — | $ | — | $ | — | $ | — | $ | — | ||||||||||||
Long-term investments | — | — | — | 45 | — | — | ||||||||||||||||||
Long-term debt | 2,023 | 140 | 1,181 | 7,092 | 266 | 690 | ||||||||||||||||||
(a) | Carrying amounts exclude the cumulative amount of fair value hedging adjustments. |
Certain of our derivative financial instruments are covered by associated credit-support agreements that have credit-risk-related contingent features designed to reduce both counterparties’ exposure to risk of defaulting on amounts owed by the other party. As of June 28, 2020, the aggregate fair value of these derivative financial instruments that are in a net liability position was $928 million, for which we have posted collateral of $922 million in the normal course of business. If there had been a downgrade to below an A rating by S&P or the equivalent rating by Moody’s, we would not have been required to post any additional collateral to our counterparties.
As of June 28, 2020, we received cash collateral of $858 million from various counterparties. The collateral primarily supports the approximate fair value of our derivative contracts. With respect to the collateral received, the obligations are reported in Short-term borrowings, including current portion of long-term debt.
F. Credit Risk
On an ongoing basis, we review the creditworthiness of counterparties to our foreign exchange and interest rate agreements and do not expect to incur a significant loss from failure of any counterparties to perform under the agreements. There are no significant concentrations of credit risk related to our financial instruments with any individual counterparty. For additional information about concentrations of certain credit risk related to certain significant customers, see Notes to Consolidated Financial Statements––Note 17C. Segment, Geographic and Other Revenue Information: Other Revenue Information in Pfizer’s 2019 Financial Report. As of June 28, 2020, we had amounts due from a well-diversified, high quality group of banks ($1.9 billion) from around the world. For details about our investments, see Note 7B above.
In general, there is no requirement for collateral from customers. However, derivative financial instruments are executed under credit-support agreements that provide for the ability to request to receive cash collateral, depending on levels of exposure, our credit rating and the credit rating of the counterparty, see Note 7E above.
Note 8. Inventories
The following table provides the components of Inventories: | ||||||||
(MILLIONS OF DOLLARS) | June 28, 2020 | December 31, 2019 | ||||||
Finished goods | $ | 3,002 | $ | 2,750 | ||||
Work-in-process | 4,810 | 4,743 | ||||||
Raw materials and supplies | 752 | 790 | ||||||
Inventories(a) | $ | 8,564 | $ | 8,283 | ||||
Noncurrent inventories not included above(b) | $ | 962 | $ | 714 | ||||
(a) | The change from December 31, 2019 reflects increases for certain products, including inventory build for new product launches, network strategy and market demand, partially offset by a decrease due to foreign exchange. |
(b) | Included in Other noncurrent assets. There are no recoverability issues associated with these amounts. |
27
PFIZER INC. AND SUBSIDIARY COMPANIES
NOTES TO CONDENSED CONSOLIDATED FINANCIAL STATEMENTS
(UNAUDITED)
Note 9. Identifiable Intangible Assets and Goodwill
A. Identifiable Intangible Assets
Balance Sheet Information
The following table provides the components of Identifiable intangible assets: | ||||||||||||||||||||||||
June 28, 2020 | December 31, 2019 | |||||||||||||||||||||||
(MILLIONS OF DOLLARS) | Gross Carrying Amount | Accumulated Amortization | Identifiable Intangible Assets, less Accumulated Amortization | Gross Carrying Amount | Accumulated Amortization | Identifiable Intangible Assets, less Accumulated Amortization | ||||||||||||||||||
Finite-lived intangible assets | ||||||||||||||||||||||||
Developed technology rights(a) | $ | 89,927 | $ | (64,683 | ) | $ | 25,244 | $ | 88,730 | $ | (63,106 | ) | $ | 25,625 | ||||||||||
Brands | 922 | (757 | ) | 165 | 922 | (741 | ) | 181 | ||||||||||||||||
Licensing agreements and other(b) | 2,327 | (1,226 | ) | 1,101 | 1,772 | (1,191 | ) | 582 | ||||||||||||||||
93,176 | (66,667 | ) | 26,509 | 91,425 | (65,037 | ) | 26,387 | |||||||||||||||||
Indefinite-lived intangible assets | ||||||||||||||||||||||||
Brands | 1,991 | 1,991 | 1,991 | 1,991 | ||||||||||||||||||||
IPR&D(a) | 4,518 | 4,518 | 5,919 | 5,919 | ||||||||||||||||||||
Licensing agreements and other(b) | 523 | 523 | 1,073 | 1,073 | ||||||||||||||||||||
7,032 | 7,032 | 8,983 | 8,983 | |||||||||||||||||||||
Identifiable intangible assets(c) | $ | 100,208 | $ | (66,667 | ) | $ | 33,541 | $ | 100,408 | $ | (65,037 | ) | $ | 35,370 | ||||||||||
(a) | The changes in the gross carrying amount of Developed technology rights and IPR&D primarily reflect the transfer of $1.4 billion from IPR&D to Developed technology rights to reflect the approval of Braftovi in combination with Erbitux® (cetuximab), for the treatment of BRAFV600E-mutant metastatic colorectal cancer after prior therapy. |
(b) | The changes in the gross carrying amount of Licensing agreements and other primarily reflect the transfer of $550 million from Indefinite-lived Licensing agreements and other to finite-lived Licensing agreements and other to reflect the approval in the U.S. of several products subject to out-licensing arrangements acquired from Array. |
(c) | The decrease in Identifiable intangible assets, less accumulated amortization, is primarily due to amortization. |
Our identifiable intangible assets are associated with the following, as a percentage of total identifiable intangible assets, less accumulated amortization: | |||||||||
June 28, 2020 | |||||||||
Biopharma | Upjohn | WRDM | |||||||
Developed technology rights | 99 | % | 1 | % | — | ||||
Brands, finite-lived | 100 | % | — | — | |||||
Brands, indefinite-lived | 42 | % | 58 | % | — | ||||
IPR&D | 94 | % | — | 6 | % | ||||
Licensing agreements and other, finite-lived | 99 | % | 1 | % | 1 | % | |||
Licensing agreements and other, indefinite-lived | 100 | % | — | — | |||||
Amortization
Total amortization expense for finite-lived intangible assets was $917 million for the second quarter of 2020 and $1.2 billion for the second quarter of 2019, and $1.8 billion for the first six months of 2020 and $2.4 billion for the first six months of 2019.
B. Goodwill
The following table provides the components of and changes in the carrying amount of Goodwill: | ||||||||||||
(MILLIONS OF DOLLARS) | Biopharma | Upjohn | Total | |||||||||
Balance, December 31, 2019 | $ | 48,202 | $ | 10,451 | $ | 58,653 | ||||||
Other(a) | (155 | ) | (49 | ) | (204 | ) | ||||||
Balance, June 28, 2020 | $ | 48,047 | $ | 10,401 | $ | 58,449 | ||||||
(a) | Primarily represents the impact of foreign exchange. |
28
PFIZER INC. AND SUBSIDIARY COMPANIES
NOTES TO CONDENSED CONSOLIDATED FINANCIAL STATEMENTS
(UNAUDITED)
Note 10. Pension and Postretirement Benefit Plans
The following table provides the components of net periodic benefit cost/(credit): | ||||||||||||||||||||||||||||||||
Three Months Ended | ||||||||||||||||||||||||||||||||
Pension Plans | ||||||||||||||||||||||||||||||||
U.S. Qualified | U.S. Supplemental (Non-Qualified) | International | Postretirement Plans | |||||||||||||||||||||||||||||
(MILLIONS OF DOLLARS) | June 28, 2020 | June 30, 2019 | June 28, 2020 | June 30, 2019 | June 28, 2020 | June 30, 2019 | June 28, 2020 | June 30, 2019 | ||||||||||||||||||||||||
Service cost | $ | — | $ | — | $ | — | $ | — | $ | 36 | $ | 31 | $ | 10 | $ | 9 | ||||||||||||||||
Interest cost | 131 | 157 | 8 | 12 | 40 | 54 | 13 | 19 | ||||||||||||||||||||||||
Expected return on plan assets | (251 | ) | (223 | ) | — | — | (75 | ) | (80 | ) | (9 | ) | (8 | ) | ||||||||||||||||||
Amortization of: | ||||||||||||||||||||||||||||||||
Actuarial losses | 32 | 37 | 4 | 2 | 30 | 20 | — | 1 | ||||||||||||||||||||||||
Prior service credits | (1 | ) | (1 | ) | — | — | (1 | ) | (1 | ) | (43 | ) | (45 | ) | ||||||||||||||||||
Settlements | 6 | 2 | 6 | — | 1 | — | — | — | ||||||||||||||||||||||||
Special termination benefits | — | 1 | 1 | 3 | — | — | — | 1 | ||||||||||||||||||||||||
Net periodic benefit cost/(credit) reported in income | $ | (83 | ) | $ | (27 | ) | $ | 19 | $ | 17 | $ | 32 | $ | 25 | $ | (30 | ) | $ | (23 | ) | ||||||||||||
Six Months Ended | ||||||||||||||||||||||||||||||||
Pension Plans | ||||||||||||||||||||||||||||||||
U.S. Qualified | U.S. Supplemental (Non-Qualified) | International | Postretirement Plans | |||||||||||||||||||||||||||||
(MILLIONS OF DOLLARS) | June 28, 2020 | June 30, 2019 | June 28, 2020 | June 30, 2019 | June 28, 2020 | June 30, 2019 | June 28, 2020 | June 30, 2019 | ||||||||||||||||||||||||
Service cost | $ | — | $ | — | $ | — | $ | — | $ | 72 | $ | 63 | $ | 19 | $ | 19 | ||||||||||||||||
Interest cost | 262 | 315 | 18 | 25 | 82 | 109 | 25 | 38 | ||||||||||||||||||||||||
Expected return on plan assets | (503 | ) | (445 | ) | — | — | (153 | ) | (160 | ) | (18 | ) | (16 | ) | ||||||||||||||||||
Amortization of: | ||||||||||||||||||||||||||||||||
Actuarial losses | 64 | 74 | 7 | 5 | 62 | 41 | — | 2 | ||||||||||||||||||||||||
Prior service credits | (1 | ) | (2 | ) | — | — | (1 | ) | (2 | ) | (86 | ) | (89 | ) | ||||||||||||||||||
Settlements | 20 | 2 | 44 | — | 2 | — | — | — | ||||||||||||||||||||||||
Special termination benefits | — | 1 | 2 | 9 | — | — | — | 1 | ||||||||||||||||||||||||
Net periodic benefit cost/(credit) reported in income | $ | (159 | ) | $ | (55 | ) | $ | 71 | $ | 37 | $ | 63 | $ | 51 | $ | (60 | ) | $ | (46 | ) | ||||||||||||
The following table provides the amounts we contributed, and the amounts we expect to contribute during 2020, to our pension and postretirement plans from our general assets for the periods indicated: | ||||||||||||||||
Pension Plans | ||||||||||||||||
(MILLIONS OF DOLLARS) | U.S. Qualified | U.S. Supplemental (Non-Qualified) | International | Postretirement Plans | ||||||||||||
Contributions from our general assets for the six months ended June 28, 2020 | $ | 3 | $ | 150 | $ | 116 | $ | 64 | ||||||||
Expected contributions from our general assets during 2020(a) | 1,253 | 183 | 185 | 137 | ||||||||||||
(a) | Contributions expected to be made for 2020 are inclusive of amounts contributed during the six months ended June 28, 2020. The U.S. supplemental (non-qualified) pension plan, international pension plan and the postretirement plan contributions from our general assets include direct employer benefit payments. For the U.S. qualified plans, we plan to make a $1.25 billion voluntary contribution in the second half of 2020. |
Note 11. Equity
A. Preferred Stock
Prior to May 4, 2020, Pfizer’s Series A convertible perpetual preferred stock (the Series A Preferred Stock) was held by an employee stock ownership plan trust (the Trust). All outstanding shares of Series A Preferred Stock were converted, at the direction of the independent fiduciary under the Trust and in accordance with the certificate of designations for the Series A Preferred Stock, into shares of Pfizer common stock on May 4, 2020. The Trust received an aggregate of 1,070,369 shares of Pfizer common stock upon conversion, with zero shares of Series A Preferred Stock remaining outstanding as a result of the conversion.
29
PFIZER INC. AND SUBSIDIARY COMPANIES
NOTES TO CONDENSED CONSOLIDATED FINANCIAL STATEMENTS
(UNAUDITED)
B. Dividends
The following table summarizes quarterly cash dividends: | ||||||||||||
2020 | 2019 | |||||||||||
Date Declared | Payment Date | Dividend Per Share | Date Declared | Payment Date | Dividend Per Share | |||||||
December 13, 2019 | March 6, 2020 | 0.38 | December 14, 2018 | March 1, 2019 | 0.36 | |||||||
April 23, 2020 | June 5, 2020 | 0.38 | April 25, 2019 | June 7, 2019 | 0.36 | |||||||
June 25, 2020 | September 1, 2020 | 0.38 | June 27, 2019 | September 3, 2019 | 0.36 | |||||||
September 24, 2019 | December 2, 2019 | 0.36 | ||||||||||
Note 12. Earnings Per Common Share Attributable to Pfizer Inc. Common Shareholders
The following table provides the detailed calculation of EPS: | ||||||||||||||||
Three Months Ended | Six Months Ended | |||||||||||||||
(IN MILLIONS) | June 28, 2020 | June 30, 2019 | June 28, 2020 | June 30, 2019 | ||||||||||||
EPS Numerator––Basic | ||||||||||||||||
Income from continuing operations | $ | 3,434 | $ | 5,056 | $ | 6,845 | $ | 8,945 | ||||||||
Less: Net income attributable to noncontrolling interests | 8 | 10 | 17 | 15 | ||||||||||||
Income from continuing operations attributable to Pfizer Inc. | 3,426 | 5,046 | 6,828 | 8,929 | ||||||||||||
Less: Preferred stock dividends––net of tax | — | — | — | — | ||||||||||||
Income from continuing operations attributable to Pfizer Inc. common shareholders | 3,426 | 5,045 | 6,828 | 8,929 | ||||||||||||
Discontinued operations––net of tax | — | — | — | — | ||||||||||||
Net income attributable to Pfizer Inc. common shareholders | $ | 3,426 | $ | 5,045 | $ | 6,828 | $ | 8,929 | ||||||||
EPS Numerator––Diluted | ||||||||||||||||
Income from continuing operations attributable to Pfizer Inc. common shareholders and assumed conversions | $ | 3,426 | $ | 5,046 | $ | 6,828 | $ | 8,929 | ||||||||
Discontinued operations––net of tax, attributable to Pfizer Inc. common shareholders and assumed conversions | — | — | — | — | ||||||||||||
Net income attributable to Pfizer Inc. common shareholders and assumed conversions | $ | 3,426 | $ | 5,046 | $ | 6,828 | $ | 8,929 | ||||||||
EPS Denominator | ||||||||||||||||
Weighted-average number of common shares outstanding––Basic | 5,554 | 5,562 | 5,550 | 5,598 | ||||||||||||
Common-share equivalents: stock options, stock issuable under employee compensation plans and convertible preferred stock | 65 | 110 | 66 | 112 | ||||||||||||
Weighted-average number of common shares outstanding––Diluted | 5,619 | 5,672 | 5,616 | 5,711 | ||||||||||||
Anti-dilutive common stock equivalents(a) | 6 | 1 | 4 | 2 | ||||||||||||
(a) | These common stock equivalents were outstanding for the periods presented, but were not included in the computation of diluted EPS for those periods because their inclusion would have had an anti-dilutive effect. |
30
PFIZER INC. AND SUBSIDIARY COMPANIES
NOTES TO CONDENSED CONSOLIDATED FINANCIAL STATEMENTS
(UNAUDITED)
Note 13. Contingencies and Certain Commitments
We and certain of our subsidiaries are subject to numerous contingencies arising in the ordinary course of business, including tax and legal contingencies. For a discussion of our tax contingencies, see Note 5B. For a discussion of our legal contingencies, see below.
A. Legal Proceedings
Our legal contingencies include, but are not limited to, the following:
• | Patent litigation, which typically involves challenges to the coverage and/or validity of patents on various products, processes or dosage forms. We are the plaintiff in the majority of these actions. An adverse outcome in actions in which we are the plaintiff could result in loss of patent protection for a drug, a significant loss of revenues from that drug or impairment of the value of associated assets. |
• | Product liability and other product-related litigation, which can include personal injury, consumer, off-label promotion, securities, antitrust and breach of contract claims, among others, often involves highly complex issues relating to medical causation, label warnings and reliance on those warnings, scientific evidence and findings, actual, provable injury and other matters. |
• | Commercial and other matters, which can include merger-related and product-pricing claims and environmental claims and proceedings, can involve complexities that will vary from matter to matter. |
• | Government investigations, which often are related to the extensive regulation of pharmaceutical companies by national, state and local government agencies in the U.S. and in other jurisdictions. |
Certain of these contingencies could result in losses, including damages, fines and/or civil penalties, which could be substantial, and/or criminal charges.
We believe that our claims and defenses in matters in which we are a defendant are substantial, but litigation is inherently unpredictable and excessive verdicts do occur. We do not believe that any of these matters will have a material adverse effect on our financial position. However, we could incur judgments, enter into settlements or revise our expectations regarding the outcome of certain matters, and such developments could have a material adverse effect on our results of operations in the period in which the amounts are accrued and/or our cash flows in the period in which the amounts are paid.
We have accrued for losses that are both probable and reasonably estimable. Substantially all of our contingencies are subject to significant uncertainties and, therefore, determining the likelihood of a loss and/or the measurement of any loss can be complex. Consequently, we are unable to estimate the range of reasonably possible loss in excess of amounts accrued. Our assessments are based on estimates and assumptions that have been deemed reasonable by management, but the assessment process relies heavily on estimates and assumptions that may prove to be incomplete or inaccurate, and unanticipated events and circumstances may occur that might cause us to change those estimates and assumptions.
Amounts recorded for legal and environmental contingencies can result from a complex series of judgments about future events and uncertainties and can rely heavily on estimates and assumptions.
The principal pending matters to which we are a party are discussed below. In determining whether a pending matter is a principal matter, we consider both quantitative and qualitative factors in order to assess materiality, such as, among other things, the amount of damages and the nature of any other relief sought in the proceeding, if such damages and other relief are specified; our view of the merits of the claims and of the strength of our defenses; whether the action purports to be, or is, a class action and, if not certified, our view of the likelihood that a class will be certified by the court; the jurisdiction in which the proceeding is pending; whether related actions have been transferred to multidistrict litigation; any experience that we or, to our knowledge, other companies have had in similar proceedings; whether disclosure of the action would be important to a reader of our financial statements, including whether disclosure might change a reader’s judgment about our financial statements in light of all of the information that is available to the reader; the potential impact of the proceeding on our reputation; and the extent of public interest in the matter. In addition, with respect to patent matters in which we are the plaintiff, we consider, among other things, the financial significance of the product protected by the patent(s) at issue. As a result of considering qualitative factors in our determination of principal matters, there are some matters discussed below with respect to which management believes that the likelihood of possible loss in excess of amounts accrued is remote.
31
PFIZER INC. AND SUBSIDIARY COMPANIES
NOTES TO CONDENSED CONSOLIDATED FINANCIAL STATEMENTS
(UNAUDITED)
A1. Legal Proceedings––Patent Litigation
Like other pharmaceutical companies, we are involved in numerous suits relating to our patents, including but not limited to, those discussed below. Most of the suits involve claims by generic drug manufacturers that patents covering our products, processes or dosage forms are invalid and/or do not cover the product of the generic drug manufacturer. Also, counterclaims, as well as various independent actions, have been filed alleging that our assertions of, or attempts to enforce, patent rights with respect to certain products constitute unfair competition and/or violations of antitrust laws. In addition to the challenges to the U.S. patents on a number of our products that are discussed below, patent rights to certain of our products are being challenged in various other jurisdictions. We are also party to patent damages suits in various jurisdictions pursuant to which generic drug manufacturers, payers, governments or other parties are seeking damages from us for allegedly causing delay of generic entry. Additionally, our licensing and collaboration partners face challenges by generic drug manufacturers to patents covering products for which we have licenses or co-promotion rights. We also are often involved in other proceedings, such as inter partes review, post-grant review, re-examination or opposition proceedings, before the U.S. Patent and Trademark Office, the European Patent Office, or other foreign counterparts relating to our intellectual property or the intellectual property rights of others. Also, if one of our patents is found to be invalid by such proceedings, generic or competitive products could be introduced into the market resulting in the erosion of sales of our existing products. For example, several of the patents in our pneumococcal vaccine portfolio were challenged in inter partes review and post-grant review proceedings in the U.S. In October 2017, the Patent Trial and Appeal Board (PTAB) refused to initiate proceedings as to two patents. In June 2018, the PTAB ruled on another patent, holding that one claim was valid and that all other claims were invalid. The party challenging that patent appealed the decision. In November 2019, the U.S. Court of Appeals for the Federal Circuit vacated the PTAB’s ruling and requested that the PTAB redecide the challenge. In March and June 2019, an additional patent was found invalid in separate proceedings by the PTAB. We appealed. In January 2020, the U.S. Court of Appeals for the Federal Circuit vacated the original decision and requested that the PTAB redecide the case. Challenges to other patents remain pending in jurisdictions outside the U.S. The invalidation of all of the patents in our pneumococcal portfolio could potentially allow a competitor pneumococcal vaccine into the marketplace. In the event that any of the patents are found valid and infringed, a competitor pneumococcal vaccine might be prohibited from entering the market or required to pay Pfizer a royalty. We are also subject to patent litigation pursuant to which one or more third parties seek damages and/or injunctive relief to compensate for alleged infringement of its patents by our commercial or other activities. For example, our Hospira subsidiaries are involved in patent and patent-related disputes over their attempts to bring generic pharmaceutical and biosimilar products to market. If one of our marketed products is found to infringe valid patent rights of a third party, such third party may be awarded significant damages, or we may be prevented from further sales of that product. Such damages may be enhanced as much as three-fold in the event that we or one of our subsidiaries, like Hospira, is found to have willfully infringed valid patent rights of a third party.
Actions In Which We Are The Plaintiff
EpiPen
In July 2010, King, which we acquired in 2011 and is a wholly-owned subsidiary, brought a patent-infringement action against Sandoz in the U.S. District Court for the District of New Jersey in connection with Sandoz’s abbreviated new drug application filed with the FDA seeking approval to market an epinephrine injectable product. Sandoz is challenging patents, which expire in 2025, covering the next-generation autoinjector for use with epinephrine that is sold under the EpiPen brand name.
Xeljanz (tofacitinib)
Beginning in 2017, we brought patent-infringement actions against several generic manufacturers that filed separate abbreviated new drug applications with the FDA seeking approval to market their generic versions of tofacitinib tablets in one or both of 5 mg and 10 mg dosage strengths, and in both immediate and extended release forms. To date, actions against the following generic manufacturers have been settled on terms not material to Pfizer: (i) MicroLabs USA Inc. and MicroLabs Ltd.; (ii) Sun Pharmaceutical Industries Ltd.; (iii) Prinston Pharmaceutical Inc., Zhejiang Huahai Pharmaceutical Co., Ltd., Huahai US Inc. and Solco Healthcare US, LLC; (iv) Breckenridge Pharmaceutical Inc., Pensa Pharma S.A. and Laboratorios Del Dr. Esteve, S.A.; and (v) Ajanta Pharma Ltd. and Ajanta Pharma USA Inc. The remaining actions continue as described below.
In March 2017, we brought a patent-infringement action against Zydus Pharmaceuticals (USA) Inc. and Cadila Healthcare Ltd. (collectively, Zydus) in the U.S. District Court for the District of Delaware asserting the infringement and validity of three patents: the patent covering the active ingredient expiring in December 2025, the patent covering an enantiomer of tofacitinib expiring in 2022, and the patent covering a polymorphic form of tofacitinib expiring in 2023, which Zydus challenged in its abbreviated new drug application seeking approval to market a generic version of tofacitinib 5 mg tablets.
In December 2018, we brought a separate patent infringement action against Teva Pharmaceuticals USA, Inc. (Teva) in the U.S. District Court for the District of Delaware asserting the infringement and validity of our patent covering extended release
32
PFIZER INC. AND SUBSIDIARY COMPANIES
NOTES TO CONDENSED CONSOLIDATED FINANCIAL STATEMENTS
(UNAUDITED)
formulations of tofacitinib that was challenged by Teva in its abbreviated new drug application seeking approval to market a generic version of tofacitinib 11 mg extended release tablets.
Inlyta (axitinib)
In April 2018, Apotex Inc. notified us that it had filed an abbreviated new drug application with the FDA seeking approval to market a generic version of Inlyta. Apotex Inc. asserts the invalidity and non-infringement of the crystalline form patent for Inlyta that expires in 2030. In May 2018, we filed suit against Apotex Inc. in the U.S. District Court for the District of Delaware, asserting the validity and infringement of the crystalline form patent for Inlyta.
In May 2019, Glenmark Pharmaceuticals Limited (Glenmark) notified us that it had filed an abbreviated new drug application with the FDA seeking approval to market a generic version of Inlyta. Glenmark asserts the invalidity and non-infringement of the crystalline form patent for Inlyta that expires in 2030. In June 2019, we filed suit against Glenmark in the U.S. District Court for the District of Delaware, asserting the validity and infringement of the crystalline form patent for Inlyta.
Kerydin (tavaborole)
In September 2018, several generic companies notified us that they had filed abbreviated new drug applications with the FDA seeking approval to market generic versions of Kerydin. The generic companies assert the invalidity and non-infringement of methods of use and formulation patents for tavaborole that expire in 2026 and 2027, including pediatric exclusivity. In October 2018, Anacor, our wholly-owned subsidiary, filed infringement lawsuits against each of the generic filers in the U.S. District Court for the District of Delaware and the U.S. District Court for the District of West Virginia.
Ibrance (palbociclib)
In March 2019, several generic companies notified us that they had filed abbreviated new drug applications with the FDA seeking approval to market generic versions of Ibrance. The generic companies assert the invalidity and non-infringement of two composition of matter patents and a method of use patent covering palbociclib, each of which expire in 2023. In April 2019, we brought patent infringement actions against each of the generic filers in various federal courts, asserting the validity and infringement of the patents challenged by the generic companies.
Chantix (varenicline)
In January 2020, we brought a patent infringement action against Viwit Pharmaceutical Co. Ltd. (Viwit) in the U.S. District Court for the District of Delaware asserting the validity and infringement of three patents challenged by Viwit in its abbreviated new drug application seeking approval to market a generic version of varenicline, 0.5 mg and 1.0 mg tablets.
Lyrica (pregabalin)
In June 2014, Generics (U.K.) Ltd (trading as Mylan) filed an invalidity action against the Lyrica pain use patent in the High Court of Justice in London. Subsequently, Actavis Group PTC ehf filed an invalidity action in the same court, and Pfizer sued for infringement against Actavis Group PTC ehf, Actavis U.K. Ltd and Caduceus Pharma Ltd (together, Actavis), in addition to requesting preliminary relief. Our request for preliminary relief was denied in a January 2015 hearing, and the denial subsequently was confirmed on appeal.
In February 2015, the National Health Service (NHS) England was ordered by the High Court, as an intermediary, to issue guidance for prescribers and pharmacists directing the prescription and dispensing of Lyrica by brand when pregabalin was prescribed for the treatment of neuropathic pain. NHS Wales and NHS Northern Ireland also issued prescribing guidance. The guidance to prescribe and dispense Lyrica for neuropathic pain was withdrawn upon patent expiration in July 2017.
We also filed infringement actions against (i) Teva UK Ltd, and (ii) Dr. Reddy’s Laboratories (UK) Ltd and Caduceus Pharma Ltd (together, Dr. Reddy’s) in February 2015, seeking the same relief as in the action against Actavis. Dr. Reddy’s filed an invalidity counterclaim. These actions were stayed pending the outcome of the Mylan and Actavis cases.
The Mylan and Actavis invalidity actions were heard in the High Court at the same time as the Actavis infringement action. The High Court ruled against us, holding that the asserted claims were either not infringed or invalid, and appeals followed. In November 2018, the U.K. Supreme Court ruled that all the relevant claims directed to neuropathic pain were invalid.
In October 2015, after Sandoz GmbH and Sandoz Ltd (together, Sandoz) launched a full label generic pregabalin product, we obtained from the High Court a preliminary injunction enjoining Sandoz from further sales of the product and ordering Sandoz to identify the parties holding its product. Sandoz identified wholesaler AAH Pharmaceuticals Ltd and pharmacy chain Lloyds Pharmacy Ltd (supplied by AAH), and we requested that these parties cease further sales and withdraw the Sandoz full label product. In October 2015, Lloyds was added to the Sandoz action, and we obtained a preliminary order from the High Court requiring Lloyds to advise its pharmacists that the Sandoz full label product should not be dispensed. In November 2015, the High Court confirmed the preliminary injunction against Sandoz and Lloyds. Sandoz filed an invalidity counterclaim. Upon
33
PFIZER INC. AND SUBSIDIARY COMPANIES
NOTES TO CONDENSED CONSOLIDATED FINANCIAL STATEMENTS
(UNAUDITED)
agreement of the parties, in December 2015, the proceedings against Lloyds were discontinued, and the proceedings against Sandoz were stayed pending outcome of the Mylan and Actavis cases. The preliminary injunction against Sandoz remained in place until patent expiration in July 2017.
In May 2020, Dr. Reddy’s filed a claim for damages in connection with the above-referenced legal actions. In July 2020, the Scottish Ministers and fourteen Scottish Health Boards (together, NHS Scotland) filed a claim for damages in connection with the above-referenced legal action concerning Sandoz.
Matter Involving Our Collaboration/Licensing Partners
Eliquis
In February, March, and April 2017, twenty-five generic companies sent BMS Paragraph-IV certification letters informing BMS that they had filed abbreviated new drug applications seeking approval of generic versions of Eliquis, challenging the validity and infringement of one or more of the three patents listed in the Orange Book for Eliquis. One of the patents expired in December 2019 and the remaining patents currently are set to expire in 2026 and 2031. Eliquis has been jointly developed and is being commercialized by BMS and Pfizer. In April 2017, BMS and Pfizer filed patent-infringement actions against all generic filers in the U.S. District Court for the District of Delaware and the U.S. District Court for the District of West Virginia, asserting that each of the generic companies’ proposed products would infringe each of the patent(s) that each generic filer challenged. Some generic filers challenged only the 2031 patent, some challenged both the 2031 and 2026 patent, and one generic company challenged all three patents. In August 2020, the U.S. District Court for the District of Delaware ruled that both the 2026 patent and the 2031 patent are valid and infringed by the proposed generic products. The decision is subject to appeal. Prior to the August 2020 ruling, we and BMS settled with certain of the generic companies on terms not material to Pfizer, and we and BMS may settle with other generic companies in the future.
A2. Legal Proceedings––Product Litigation
Like other pharmaceutical companies, we are defendants in numerous cases, including but not limited to those discussed below, related to our pharmaceutical and other products. Plaintiffs in these cases seek damages and other relief on various grounds for alleged personal injury and economic loss.
Asbestos
Between 1967 and 1982, Warner-Lambert owned American Optical Corporation (American Optical), which manufactured and sold respiratory protective devices and asbestos safety clothing. In connection with the sale of American Optical in 1982, Warner-Lambert agreed to indemnify the purchaser for certain liabilities, including certain asbestos-related and other claims. Claims against American Optical and numerous other defendants are pending in various federal and state courts seeking damages for alleged personal injury from exposure to asbestos and other allegedly hazardous materials. Warner-Lambert was acquired by Pfizer in 2000 and is a wholly owned subsidiary of Pfizer. Warner-Lambert is actively engaged in the defense of, and will continue to explore various means of resolving, these claims.
Numerous lawsuits are pending against Pfizer in various federal and state courts seeking damages for alleged personal injury from exposure to products allegedly containing asbestos and other allegedly hazardous materials sold by Pfizer and certain of its previously owned subsidiaries.
There also are a small number of lawsuits pending in various federal and state courts seeking damages for alleged exposure to asbestos in facilities owned or formerly owned by Pfizer or its subsidiaries.
Effexor
Beginning in May 2011, actions, including purported class actions, were filed in various federal courts against Wyeth and, in certain of the actions, affiliates of Wyeth and certain other defendants relating to Effexor XR, which is the extended-release formulation of Effexor. The plaintiffs in each of the class actions seek to represent a class consisting of all persons in the U.S. and its territories who directly purchased, indirectly purchased or reimbursed patients for the purchase of Effexor XR or generic Effexor XR from any of the defendants from June 14, 2008 until the time the defendants’ allegedly unlawful conduct ceased. The plaintiffs in all of the actions allege delay in the launch of generic Effexor XR in the U.S. and its territories, in violation of federal antitrust laws and, in certain of the actions, the antitrust, consumer protection and various other laws of certain states, as the result of Wyeth fraudulently obtaining and improperly listing certain patents for Effexor XR in the Orange Book, enforcing certain patents for Effexor XR and entering into a litigation settlement agreement with a generic drug manufacturer with respect to Effexor XR. Each of the plaintiffs seeks treble damages (for itself in the individual actions or on behalf of the putative class in the purported class actions) for alleged price overcharges for Effexor XR or generic Effexor XR in the U.S. and its territories since June 14, 2008. All of these actions have been consolidated in the U.S. District Court for the District of New Jersey.
34
PFIZER INC. AND SUBSIDIARY COMPANIES
NOTES TO CONDENSED CONSOLIDATED FINANCIAL STATEMENTS
(UNAUDITED)
In October 2014, the District Court dismissed the direct purchaser plaintiffs’ claims based on the litigation settlement agreement, but declined to dismiss the other direct purchaser plaintiff claims. In January 2015, the District Court entered partial final judgments as to all settlement agreement claims, including those asserted by direct purchasers and end-payer plaintiffs, which plaintiffs appealed to the U.S. Court of Appeals for the Third Circuit. In August 2017, the U.S. Court of Appeals for the Third Circuit reversed the District Court’s decisions and remanded the claims to the District Court.
Lipitor
• | Antitrust Actions |
Beginning in November 2011, purported class actions relating to Lipitor were filed in various federal courts against, among others, Pfizer, certain affiliates of Pfizer, and, in most of the actions, Ranbaxy, Inc. (Ranbaxy) and certain affiliates of Ranbaxy. The plaintiffs in these various actions seek to represent nationwide, multi-state or statewide classes consisting of persons or entities who directly purchased, indirectly purchased or reimbursed patients for the purchase of Lipitor (or, in certain of the actions, generic Lipitor) from any of the defendants from March 2010 until the cessation of the defendants’ allegedly unlawful conduct (the Class Period). The plaintiffs allege delay in the launch of generic Lipitor, in violation of federal antitrust laws and/or state antitrust, consumer protection and various other laws, resulting from (i) the 2008 agreement pursuant to which Pfizer and Ranbaxy settled certain patent litigation involving Lipitor, and Pfizer granted Ranbaxy a license to sell a generic version of Lipitor in various markets beginning on varying dates, and (ii) in certain of the actions, the procurement and/or enforcement of certain patents for Lipitor. Each of the actions seeks, among other things, treble damages on behalf of the putative class for alleged price overcharges for Lipitor (or, in certain of the actions, generic Lipitor) during the Class Period. In addition, individual actions have been filed against Pfizer, Ranbaxy and certain of their affiliates, among others, that assert claims and seek relief for the plaintiffs that are substantially similar to the claims asserted and the relief sought in the purported class actions described above. These various actions have been consolidated for pre-trial proceedings in a Multi-District Litigation (In re Lipitor Antitrust Litigation MDL-2332) in the U.S. District Court for the District of New Jersey.
In September 2013 and 2014, the District Court dismissed with prejudice the claims by direct purchasers. In October and November 2014, the District Court dismissed with prejudice the claims of all other Multi-District Litigation plaintiffs. All plaintiffs have appealed the District Court’s orders dismissing their claims with prejudice to the U.S. Court of Appeals for the Third Circuit. In addition, the direct purchaser class plaintiffs appealed the order denying their motion to amend the judgment and for leave to amend their complaint to the U.S. Court of Appeals for the Third Circuit. In August 2017, the U.S. Court of Appeals for the Third Circuit reversed the District Court’s decisions and remanded the claims to the District Court.
Also, in January 2013, the State of West Virginia filed an action in West Virginia state court against Pfizer and Ranbaxy, among others, that asserts claims and seeks relief on behalf of the State of West Virginia and residents of that state that are substantially similar to the claims asserted and the relief sought in the purported class actions described above.
• | Personal Injury Actions |
A number of individual and multi-plaintiff lawsuits have been filed against us in various federal and state courts alleging that the plaintiffs developed type 2 diabetes purportedly as a result of the ingestion of Lipitor. Plaintiffs seek compensatory and punitive damages.
In February 2014, the federal actions were transferred for consolidated pre-trial proceedings to a Multi-District Litigation (In re Lipitor (Atorvastatin Calcium) Marketing, Sales Practices and Products Liability Litigation (No. II) MDL-2502) in the U.S. District Court for the District of South Carolina. Since 2016, certain cases in the Multi-District Litigation were remanded to certain state courts. In January 2017, the District Court granted our motion for summary judgment, dismissing substantially all of the remaining cases pending in the Multi-District Litigation. In January 2017, the plaintiffs appealed the District Court’s decision to the U.S. Court of Appeals for the Fourth Circuit. In June 2018, the U.S. Court of Appeals for the Fourth Circuit affirmed the District Court’s decision.
Viagra
Since April 2016, a Multi-District Litigation has been pending in the U.S. District Court for the Northern District of California (In Re: Viagra (Sildenafil Citrate) Products Liability Litigation, MDL-2691), in which plaintiffs allege that they developed melanoma and/or the exacerbation of melanoma purportedly as a result of the ingestion of Viagra. Additional cases filed against Lilly with respect to Cialis have also been consolidated in the Multi-District Litigation (In re: Viagra (Sildenafil Citrate) and Cialis (Tadalafil) Products Liability Litigation, MDL-2691). In January 2020, the District Court granted our and Lilly’s motion to exclude all of plaintiffs’ general causation opinions. As a result, in April 2020, the District Court entered summary judgment in favor of defendants and dismissed all of plaintiffs’ claims. In April 2020, plaintiffs filed a notice of appeal in the U.S. Court of Appeals for the Ninth Circuit.
35
PFIZER INC. AND SUBSIDIARY COMPANIES
NOTES TO CONDENSED CONSOLIDATED FINANCIAL STATEMENTS
(UNAUDITED)
EpiPen
Beginning in February 2017, purported class actions were filed in various federal courts by indirect purchasers of EpiPen against Pfizer, and/or its affiliates King and Meridian, and/or various entities affiliated with Mylan, and Mylan Chief Executive Officer, Heather Bresch. The plaintiffs in these actions seek to represent U.S. nationwide classes comprising persons or entities who paid for any portion of the end-user purchase price of an EpiPen between 2009 until the cessation of the defendants’ allegedly unlawful conduct. In February 2020, a similar lawsuit was filed in the U.S. District Court for the District of Kansas against Pfizer, King, Meridian and the Mylan entities on behalf of a purported U.S. nationwide class of direct purchaser plaintiffs who purchased EpiPen devices directly from the defendants (the 2020 Lawsuit). Against Pfizer and/or its affiliates, plaintiffs in these actions generally allege that Pfizer’s and/or its affiliates’ settlement of patent litigation regarding EpiPen delayed market entry of generic EpiPen in violation of federal antitrust laws and various state antitrust laws. At least one lawsuit also alleges that Pfizer and/or Mylan violated the federal Racketeer Influenced and Corrupt Organizations Act (RICO). Plaintiffs also filed various federal antitrust, state consumer protection and unjust enrichment claims against, and relating to conduct attributable solely to, Mylan and/or its affiliates regarding EpiPen. Plaintiffs seek treble damages for alleged overcharges for EpiPen since 2011. In August 2017, all of these actions, except for the 2020 Lawsuit, were consolidated for coordinated pre-trial proceedings in a Multi-District Litigation (In re: EpiPen (Epinephrine Injection, USP) Marketing, Sales Practices and Antitrust Litigation, MDL-2785) in the U.S. District Court for the District of Kansas with other EpiPen-related actions against Mylan and/or its affiliates to which Pfizer, King and Meridian are not parties.
In July 2020, a new lawsuit was filed in the District of Colorado on behalf of indirect purchasers. Plaintiff represents a putative U.S. nationwide class of persons or entities who paid for any portion of the end-user purchase price of certain refill or replacement EpiPens since 2010. Plaintiff alleges that Pfizer and Meridian misrepresented the shelf-life and expiration date of EpiPen, in violation of the federal RICO statute. Plaintiff seeks treble damages for alleged unnecessary replacement or refill purchases of EpiPens by members of the putative class.
Nexium 24HR and Protonix
A number of individual and multi-plaintiff lawsuits have been filed against Pfizer, certain of its subsidiaries and/or other pharmaceutical manufacturers in various federal and state courts alleging that the plaintiffs developed kidney-related injuries purportedly as a result of the ingestion of certain proton pump inhibitors. The cases against Pfizer involve Protonix and/or Nexium 24HR and seek compensatory and punitive damages and, in some cases, treble damages, restitution or disgorgement. In August 2017, the federal actions were ordered transferred for coordinated pre-trial proceedings to a Multi-District Litigation (In re: Proton-Pump Inhibitor Products Liability Litigation (No. II)) in the U.S. District Court for the District of New Jersey. On July 31, 2019, we completed the transaction in which we and GSK combined our respective consumer healthcare businesses into a new consumer healthcare joint venture that operates globally under the GSK Consumer Healthcare name. As part of the joint venture transaction, the joint venture has agreed to assume, and to indemnify Pfizer for, liabilities arising out of such litigation to the extent related to Nexium 24HR.
Docetaxel
• | Personal Injury Actions |
A number of lawsuits have been filed against Hospira and Pfizer in various federal and state courts alleging that plaintiffs who were treated with Docetaxel developed permanent hair loss. The significant majority of the cases also name other defendants, including the manufacturer of the branded product, Taxotere. Plaintiffs seek compensatory and punitive damages.
In October 2016, the federal cases were transferred for coordinated pre-trial proceedings to a Multi-District Litigation (In re Taxotere (Docetaxel) Products Liability Litigation, MDL-2740) in the U.S. District Court for the Eastern District of Louisiana.
• | Mississippi Attorney General Government Action |
In October 2018, the Attorney General of Mississippi filed a complaint in Mississippi state court against the manufacturer of the branded product and eight other manufacturers including Pfizer and Hospira, alleging, with respect to Pfizer and Hospira, a failure to warn about a risk of permanent hair loss in violation of the Mississippi Consumer Protection Act. The action seeks civil penalties and injunctive relief.
Array Securities Litigation
In November 2017, two purported class actions were filed in the U.S. District Court for the District of Colorado alleging that Array, which we acquired in July 2019 and is our wholly owned subsidiary, and certain of its former officers violated federal securities laws in connection with certain disclosures made, or omitted, by Array regarding the NRAS-mutant melanoma program. In March 2018, the actions were consolidated into a single proceeding.
36
PFIZER INC. AND SUBSIDIARY COMPANIES
NOTES TO CONDENSED CONSOLIDATED FINANCIAL STATEMENTS
(UNAUDITED)
Zantac
A number of lawsuits have been filed against Pfizer in various federal and state courts alleging that plaintiffs developed various types of cancer, or face an increased risk of developing cancer, purportedly as a result of the ingestion of Zantac. The significant majority of these cases also name other defendants that have historically manufactured and/or sold Zantac. Pfizer has not sold Zantac since 2006, and only sold an over-the-counter version of the product. Plaintiffs seek compensatory and punitive damages and, in some cases, treble damages, restitution or disgorgement.
In February 2020, the federal actions were transferred for coordinated pre-trial proceedings to a Multi-District Litigation (In re Zantac/Ranitidine NDMA Litigation, MDL-2924) in the U.S. District Court for the Southern District of Florida. In June 2020: (i) plaintiffs in the Multi-District Litigation filed against Pfizer and many other defendants a consolidated consumer class action complaint alleging, among other things, violations of the RICO statute and consumer protection statutes of all 50 states, and a consolidated third-party payor class action complaint alleging violation of the RICO statute and seeking reimbursement for payments made for the prescription version of Zantac; (ii) Pfizer received service of a Canadian class action complaint naming Pfizer and other defendants, and seeking compensatory and punitive damages for personal injury and economic loss, allegedly arising from the defendants’ sale of Zantac in Canada; and (iii) the State of New Mexico filed a civil action against Pfizer and many other defendants, alleging various state statutory and common law claims in connection with the defendants’ alleged sale of Zantac in New Mexico.
A3. Legal Proceedings––Commercial and Other Matters
Monsanto-Related Matters
In 1997, Monsanto Company (Former Monsanto) contributed certain chemical manufacturing operations and facilities to a newly formed corporation, Solutia Inc. (Solutia), and spun off the shares of Solutia. In 2000, Former Monsanto merged with Pharmacia & Upjohn Company to form Pharmacia. Pharmacia then transferred its agricultural operations to a newly created subsidiary, named Monsanto Company (New Monsanto), which it spun off in a two-stage process that was completed in 2002. Pharmacia was acquired by Pfizer in 2003 and is a wholly owned subsidiary of Pfizer.
In connection with its spin-off that was completed in 2002, New Monsanto assumed, and agreed to indemnify Pharmacia for, any liabilities related to Pharmacia’s former agricultural business. New Monsanto has defended and/or is defending Pharmacia in connection with various claims and litigation arising out of, or related to, the agricultural business, and has been indemnifying Pharmacia when liability has been imposed or settlement has been reached regarding such claims and litigation.
In connection with its spin-off in 1997, Solutia assumed, and agreed to indemnify Pharmacia for, liabilities related to Former Monsanto’s chemical businesses. As the result of its reorganization under Chapter 11 of the U.S. Bankruptcy Code, Solutia’s indemnification obligations relating to Former Monsanto’s chemical businesses are primarily limited to sites that Solutia has owned or operated. In addition, in connection with its spin-off that was completed in 2002, New Monsanto assumed, and agreed to indemnify Pharmacia for, any liabilities primarily related to Former Monsanto’s chemical businesses, including, but not limited to, any such liabilities that Solutia assumed. Solutia’s and New Monsanto’s assumption of, and agreement to indemnify Pharmacia for, these liabilities apply to pending actions and any future actions related to Former Monsanto’s chemical businesses in which Pharmacia is named as a defendant, including, without limitation, actions asserting environmental claims, including alleged exposure to polychlorinated biphenyls. Solutia and/or New Monsanto are defending Pharmacia in connection with various claims and litigation arising out of, or related to, Former Monsanto’s chemical businesses, and have been indemnifying Pharmacia when liability has been imposed or settlement has been reached regarding such claims and litigation.
Environmental Matters
In 2009, we submitted to the U.S. Environmental Protection Agency (EPA) a corrective measures study report with regard to Pharmacia’s discontinued industrial chemical facility in North Haven, Connecticut. In September 2010, our corrective measures study report was approved by the EPA, and we commenced construction of the site remedy in late 2011 under an Updated Administrative Order on Consent with the EPA. In September 2019, the EPA acknowledged that construction of the site remedy has been completed.
Also, in 2009, we submitted a revised site-wide feasibility study with regard to Wyeth Holdings Corporation’s (formerly, American Cyanamid Company) discontinued industrial chemical facility in Bound Brook, New Jersey. In July 2011, Wyeth Holdings Corporation finalized an Administrative Settlement Agreement and Order on Consent for Removal Action (the 2011 Administrative Settlement Agreement) with the EPA with regard to the Bound Brook facility. In May 2012, we completed construction of an interim remedy to address the discharge of impacted groundwater from that facility to the Raritan River. In September 2012, the EPA issued a final remediation plan for the Bound Brook facility’s main plant area, which is generally in accordance with one of the remedies evaluated in our revised site-wide feasibility study. In March 2013, Wyeth Holdings Corporation (now Wyeth Holdings LLC) entered into an Administrative Settlement Agreement and Order on Consent with the
37
PFIZER INC. AND SUBSIDIARY COMPANIES
NOTES TO CONDENSED CONSOLIDATED FINANCIAL STATEMENTS
(UNAUDITED)
EPA to allow us to undertake detailed engineering design of the remedy for the main plant area and to perform a focused feasibility study for two adjacent lagoons. In September 2015, the U.S., on behalf of the EPA, filed a complaint and consent decree with the federal District Court for the District of New Jersey that allows Wyeth Holdings LLC to complete the design and to implement the remedy for the main plant area. In December 2015, the consent decree (which supersedes the 2011 Administrative Settlement Agreement) was entered by the District Court. In September 2018, the EPA issued a final remediation plan for the two adjacent lagoons, which is generally in accordance with one of the remedies evaluated in our focused feasibility study, and in September 2019, Wyeth Holdings LLC entered into an Administrative Settlement Agreement and Order on Consent with the EPA to allow us to undertake detailed engineering design of the remedy for the lagoons.
We have accrued for the estimated costs of the site remedies for the North Haven and Bound Brook facilities.
We are a party to a number of other proceedings brought under the Comprehensive Environmental Response, Compensation, and Liability Act of 1980, as amended, and other state, local or foreign laws in which the primary relief sought is the cost of past and/or future remediation.
Contracts with Iraqi Ministry of Health
In October 2017, a number of United States service members, civilians, and their families brought a complaint in the U.S. District Court for the District of Columbia against a number of pharmaceutical and medical devices companies, including Pfizer and certain of its subsidiaries, alleging that the defendants violated the United States Anti-Terrorism Act. The complaint alleges that the defendants provided funding for terrorist organizations through their sales practices pursuant to pharmaceutical and medical device contracts with the Iraqi Ministry of Health, and seeks monetary relief. In July 2020, the District Court granted defendants’ motions to dismiss and dismissed all of plaintiffs’ claims. In July 2018, the U.S. Department of Justice requested documents related to this matter, which have been provided.
Allergan Complaint for Indemnity
In August 2018, Pfizer was named as a defendant in a third-party complaint for indemnity, along with King, filed by Allergan Finance LLC (Allergan) in a Multi-District Litigation (In re National Prescription Opiate Litigation MDL 2804) in the U.S. District Court for the Northern District of Ohio. The lawsuit asserted claims for indemnity related to Kadian, which was owned for a short period by King in 2008, prior to Pfizer's acquisition of King in 2010. In December 2018, the District Court dismissed the lawsuit. In February 2019, Allergan filed a similar complaint in the Supreme Court of the State of New York, asserting claims for indemnity related to Kadian.
Breach of Contract––Xalkori
Pfizer is a defendant in a breach of contract action brought by New York University (NYU) in the Supreme Court of the State of New York (Supreme Court). NYU alleges that it is entitled to royalties on Pfizer’s sales of Xalkori under the terms of a Research and License Agreement between NYU and Sugen, Inc. Sugen, Inc. was acquired by Pharmacia in August 1999, and Pharmacia was acquired by Pfizer in 2003 and is a wholly owned subsidiary of Pfizer. The action was originally filed in 2013. In December 2015, the Supreme Court dismissed the action and, in May 2017, the New York State Appellate Division reversed the decision and remanded the proceedings to the Supreme Court. In January 2020, the Supreme Court denied both parties’ summary judgment motions.
A4. Legal Proceedings––Government Investigations
Like other pharmaceutical companies, we are subject to extensive regulation by government agencies in the U.S., other developed markets and multiple emerging markets in which we operate. Criminal charges, substantial fines and/or civil penalties, limitations on our ability to conduct business in applicable jurisdictions, corporate integrity or deferred prosecution agreements, as well as reputational harm and increased public interest in the matter could result from government investigations in the U.S. and other jurisdictions in which we do business. In addition, in a qui tam lawsuit in which the government declines to intervene, the relator may still pursue a suit for the recovery of civil damages and penalties on behalf of the government. Among the investigations by government agencies are the matters discussed below.
Greenstone Investigations
• | U.S. Department of Justice Antitrust Division Investigation |
Since July 2017, the U.S. Department of Justice's Antitrust Division has been investigating our Greenstone generics business. We believe this is related to an ongoing broader antitrust investigation of the generic pharmaceutical industry. The government has been obtaining information from Greenstone.
• | State Attorneys General Generics Antitrust Litigation |
In April 2018, Greenstone received requests for information from the Antitrust Department of the Connecticut Office of the Attorney General. In May 2019, Attorneys General of more than 40 states plus the District of Columbia and Puerto Rico filed a
38
PFIZER INC. AND SUBSIDIARY COMPANIES
NOTES TO CONDENSED CONSOLIDATED FINANCIAL STATEMENTS
(UNAUDITED)
complaint against a number of pharmaceutical companies, including Greenstone and Pfizer. The matter has been consolidated with a Multi-District Litigation (In re: Generic Pharmaceuticals Pricing Antitrust Litigation MDL No. 2724) in the Eastern District of Pennsylvania. As to Greenstone and Pfizer, the complaint alleges anticompetitive conduct in violation of federal and state antitrust laws and state consumer protection laws. In June 2020, the State Attorneys General filed a new complaint against a large number of companies, including Greenstone and Pfizer, making similar allegations, but concerning a new set of drugs. This complaint was transferred to the Multi-District Litigation in July 2020.
Subpoena relating to Manufacturing of Quillivant XR
In October 2018, we received a subpoena from the U.S. Attorney’s Office for the Southern District of New York (SDNY) seeking records relating to our relationship with another drug manufacturer and its production and manufacturing of drugs including, but not limited to, Quillivant XR. We have produced records pursuant to the subpoena.
Government Inquiries relating to Meridian Medical Technologies
In February 2019, we received a civil investigative demand from the U.S. Attorney’s Office for the SDNY. The civil investigative demand seeks records and information related to alleged quality issues involving the manufacture of auto-injectors at our Meridian site. In August 2019, we received a HIPAA subpoena from the U.S. Attorney’s Office for the Eastern District of Missouri seeking similar records and information. We are producing records in response to these requests.
U.S. Department of Justice/SEC Inquiry relating to Russian Operations
In June 2019, we received an informal request from the U.S. Department of Justice’s FCPA Unit seeking documents relating to our operations in Russia. In September 2019, we received a similar request from the SEC’s FCPA unit. We are producing records pursuant to these requests.
Contracts with Iraqi Ministry of Health
See Note 13A3. Contingencies and Certain Commitments: Legal Proceedings––Commercial and Other Matters––Contracts with Iraqi Ministry of Health above for information regarding U.S. government investigations related to contracts with the Iraqi Ministry of Health.
Docetaxel––Mississippi Attorney General Government Action
See Note 13A2. Contingencies and Certain Commitments: Legal Proceedings––Product Litigation––Docetaxel––Mississippi Attorney General Government Action above for information regarding a government action related to Docetaxel marketing practices.
U.S. Department of Justice Inquiries relating to India Operations
In March 2020, we received an informal request from the U.S. Department of Justice's Consumer Protection Branch seeking documents relating to our manufacturing operations in India, including at our former facility located at Irrungattukottai in India. In April 2020, we received a similar request from the U.S. Attorney’s Office for the SDNY regarding a civil investigation concerning operations at our facilities in India. We are producing records pursuant to these requests.
U.S. Department of Justice Inquiry relating to China Operations
In June 2020, we received an informal request from the U.S. Department of Justice's FCPA Unit seeking documents relating to our operations in China. We will be producing records pursuant to this request.
Zantac––State of New Mexico Civil Action
See Note 13A2. Contingencies and Certain Commitments: Legal Proceedings––Product Litigation––Zantac above for information regarding a civil action filed by the State of New Mexico alleging various state statutory and common law claims in connection with the defendants’ alleged sale of Zantac in New Mexico.
A5. Legal Proceedings––Matters Resolved During the First Six Months of 2020
During the first six months of 2020, certain matters, including the matter discussed below, were resolved or were the subject of definitive settlement agreements or settlement agreements-in-principle.
Hormone Therapy Consumer Class Action
A certified consumer class action was pending against Wyeth in the U.S. District Court for the Southern District of California based on the alleged off-label marketing of its hormone therapy products. The case was originally filed in December 2003. The class consisted of California consumers who purchased Wyeth’s hormone-replacement products between January 1995 and January 2003 and who did not seek personal injury damages therefrom. The class sought compensatory and punitive damages, including a full refund of the purchase price. In March 2020, the parties reached an agreement, and obtained preliminary court approval, to resolve this matter for $200 million, which was paid in full in the second quarter of 2020.
39
PFIZER INC. AND SUBSIDIARY COMPANIES
NOTES TO CONDENSED CONSOLIDATED FINANCIAL STATEMENTS
(UNAUDITED)
B. Guarantees and Indemnifications
In the ordinary course of business and in connection with the sale of assets and businesses and other transactions, we often indemnify our counterparties against certain liabilities that may arise in connection with the transaction or that are related to events and activities prior to or following a transaction. If the indemnified party were to make a successful claim pursuant to the terms of the indemnification, we may be required to reimburse the loss. These indemnifications are generally subject to various restrictions and limitations. Historically, we have not paid significant amounts under these provisions and, as of June 28, 2020, the estimated fair value of these indemnification obligations was not significant.
In addition, in connection with our entry into certain agreements, our counterparties may agree to indemnify us. For example, our collaboration agreement with EMD Serono, Inc. to co-promote Rebif in the U.S. expired at the end of 2015 and included certain indemnity provisions. Patent litigation brought by Biogen Idec MA Inc. against EMD Serono Inc. and Pfizer is pending in the U.S. District Court for the District of New Jersey and the United States Court of Appeals for the Federal Circuit. EMD Serono Inc. has acknowledged that it is obligated to satisfy any award of damages.
Pfizer Inc. has also guaranteed the long-term debt of certain companies that it acquired and that now are subsidiaries of Pfizer. See Note 7D for additional information.
C. Contingent Consideration for Acquisitions
We may be required to make contingent consideration payments to sellers for certain prior business combinations. For additional information, see Notes to Consolidated Financial Statements––Note 1D. Basis of Presentation and Significant Accounting Policies: Acquisitions in our 2019 Financial Report. The estimated fair value of contingent consideration as of June 28, 2020 is $727 million, of which $157 million is recorded in Other current liabilities and $570 million is recorded in Other noncurrent liabilities in our condensed consolidated balance sheet. The estimated fair value of contingent consideration as of December 31, 2019 was $711 million, of which $160 million was recorded in Other current liabilities and $551 million was recorded in Other noncurrent liabilities in our condensed consolidated balance sheet. The increase in the contingent consideration balance from December 31, 2019 is primarily due to fair value adjustments, partially offset by payments made upon the achievement of certain milestones.
Note 14. Segment, Geographic and Other Revenue Information
A. Segment Information
At the beginning of our fiscal year 2019, we reorganized our commercial operations and began to manage our commercial operations through a new global structure consisting of three distinct business segments: Pfizer Biopharmaceuticals Group (Biopharma), Upjohn and through July 31, 2019, Pfizer’s Consumer Healthcare business (Consumer Healthcare), each led by a single manager. Each operating segment has responsibility for its commercial activities. Upjohn is, and through July 31, 2019 Consumer Healthcare was, responsible for its own R&D activities while Biopharma receives its R&D services from GPD and WRDM. These services include IPR&D projects for new investigational products and additional indications for in-line products. Each business has a geographic footprint across developed and emerging markets. Our chief operating decision maker uses the revenues and earnings of the operating segments, among other factors, for performance evaluation and resource allocation. Biopharma and Upjohn are the only reportable segments.
Beginning in 2020, Upjohn began managing our Meridian subsidiary, the manufacturer of EpiPen and other auto-injector products, and a pre-existing strategic collaboration between Pfizer and Mylan for generic drugs in Japan (Mylan-Japan). As a result, revenues and expenses associated with Meridian and Mylan-Japan are reported in our Upjohn business beginning in the first quarter of 2020. In 2019, revenues and expenses from Meridian and Mylan-Japan were recorded in our Biopharma business. We have revised prior-period information (Revenues and Earnings, as defined by management) to conform to the current management structure.
Acquisitions and other business development activities completed in 2019 and in the first half of 2020, including the contribution of our Consumer Healthcare business to the GSK Consumer Healthcare joint venture, impacted financial results in the periods presented. For additional information, see Notes to Consolidated Financial Statements—Note 1A. Basis of Presentation and Significant Accounting Policies: Basis of Presentation in our 2019 Financial Report, and Note 2.
40
PFIZER INC. AND SUBSIDIARY COMPANIES
NOTES TO CONDENSED CONSOLIDATED FINANCIAL STATEMENTS
(UNAUDITED)
Operating Segments
Some additional information about our Biopharma and Upjohn business segments follows: | |||
 | Pfizer Biopharmaceuticals Group |  | |
Biopharma is a science-based innovative medicines business that includes six business units – Oncology, Inflammation & Immunology, Rare Disease, Hospital, Vaccines and Internal Medicine. The Hospital unit commercializes our global portfolio of sterile injectable and anti-infective medicines and includes Pfizer’s contract manufacturing operation, Pfizer CentreOne. Each business unit is committed to delivering breakthroughs that change patients’ lives. | Upjohn is a global, primarily off-patent branded and generic medicines business, which includes a portfolio of 20 globally recognized solid oral dose brands, as well as a U.S.-based generics platform, Greenstone. | ||
Select products include: - Ibrance - Eliquis - Prevnar 13/Prevenar 13 - Xeljanz - Enbrel (outside the U.S. and Canada) - Vyndaqel/Vyndamax - Chantix/Champix - Xtandi - Sutent | Select products include: - Lipitor - Lyrica - Norvasc - Celebrex - Viagra - Certain generic medicines | ||
Other Costs and Business Activities
Certain pre-tax costs are not allocated to our operating segment results, such as costs associated with the following:
• | WRDM––the R&D and Medical expenses managed by our WRDM organization, which is generally responsible for research projects for our Biopharma portfolio until proof-of-concept is achieved and then for transitioning those projects to the GPD organization for possible clinical and commercial development. R&D spending may include upfront and milestone payments for intellectual property rights. The WRDM organization also has responsibility for certain science-based and other platform-services organizations, which provide end-to-end technical expertise and other services to the various R&D projects, as well as the Worldwide Medical and Safety group, which ensures that Pfizer provides all stakeholders––including patients, healthcare providers, pharmacists, payers and health authorities––with complete and up-to-date information on the risks and benefits associated with Pfizer products so that they can make appropriate decisions on how and when to use Pfizer’s medicines. |
• | GPD––the costs associated with our GPD organization, which is generally responsible for clinical trials from WRDM in the Biopharma portfolio, including late stage portfolio spend. GPD also provides technical support and other services to Pfizer R&D projects. GPD is responsible for facilitating all regulatory submissions and interactions with regulatory agencies. |
• | Other––the operating results of our Consumer Healthcare business, through July 31, 2019, and costs associated with other commercial activities not managed as part of Biopharma or Upjohn, including all strategy, business development, portfolio management and valuation capabilities, which previously had been reported in various parts of the organization. |
• | Corporate and Other Unallocated––the costs associated with corporate enabling functions (such as digital, global real estate operations, legal, finance, human resources, worldwide public affairs, compliance, and worldwide procurement), patient advocacy activities and certain compensation and other corporate costs, such as interest income and expense, and gains and losses on investments, as well as overhead expenses associated with our manufacturing (which include manufacturing variances associated with production) and commercial operations that are not directly assessed to an operating segment, as business unit (segment) management does not manage these costs. Corporate and Other Unallocated also includes our share of earnings from the GSK Consumer Healthcare joint venture and other charges related to the GSK Consumer Healthcare joint venture, primarily representing our pro-rata share of restructuring and business combination accounting charges recorded by the GSK Consumer Healthcare joint venture. |
• | Certain transactions and events such as (i) purchase accounting adjustments, where we incur expenses associated with the amortization of fair value adjustments to inventory, intangible assets and PP&E; (ii) acquisition-related costs, where we incur costs for executing the transaction, integrating the acquired operations and restructuring the combined company; and (iii) certain significant items, representing substantive and/or unusual, and in some cases recurring, items (such as gains on the completion of joint venture transactions, restructuring charges, legal charges or gains and losses from equity securities) that |
41
PFIZER INC. AND SUBSIDIARY COMPANIES
NOTES TO CONDENSED CONSOLIDATED FINANCIAL STATEMENTS
(UNAUDITED)
are evaluated on an individual basis by management and that, either as a result of their nature or size, would not be expected to occur as part of our normal business on a regular basis. Such items can include, but are not limited to, non-acquisition-related restructuring costs, as well as costs incurred for legal settlements, asset impairments and disposals of assets or businesses, including, as applicable, any associated transition activities.
Segment Assets
We manage our assets on a Total Company basis, not by operating segment, as many of our operating assets are shared or commingled (such as accounts receivable, as many of our customers are served by multiple operating segments). Therefore, our chief operating decision maker does not regularly review any asset information by operating segment and, accordingly, we do not report asset information by operating segment. Total assets were approximately $178 billion as of June 28, 2020 and $167 billion as of December 31, 2019.
Selected Income Statement Information
The following table provides selected income statement information by reportable segment: | ||||||||||||||||
Three Months Ended | ||||||||||||||||
Revenues | Earnings(a) | |||||||||||||||
(MILLIONS OF DOLLARS) | June 28, 2020 | June 30, 2019 | June 28, 2020 | June 30, 2019 | ||||||||||||
Reportable Segments: | ||||||||||||||||
Biopharma | $ | 9,795 | $ | 9,432 | $ | 6,650 | $ | 6,071 | ||||||||
Upjohn | 2,006 | 2,970 | 1,168 | 1,973 | ||||||||||||
Total reportable segments | 11,801 | 12,402 | 7,818 | 8,044 | ||||||||||||
Other business activities | — | 862 | (1,530 | ) | (1,193 | ) | ||||||||||
Reconciling Items: | ||||||||||||||||
Corporate and other unallocated | — | — | (1,136 | ) | (1,399 | ) | ||||||||||
Purchase accounting adjustments | — | — | (910 | ) | (1,178 | ) | ||||||||||
Acquisition-related costs | — | — | (21 | ) | 176 | |||||||||||
Certain significant items(b) | — | — | (268 | ) | (309 | ) | ||||||||||
$ | 11,801 | $ | 13,264 | $ | 3,953 | $ | 4,141 | |||||||||
Six Months Ended | ||||||||||||||||
Revenues | Earnings(a) | |||||||||||||||
(MILLIONS OF DOLLARS) | June 28, 2020 | June 30, 2019 | June 28, 2020 | June 30, 2019 | ||||||||||||
Reportable Segments: | ||||||||||||||||
Biopharma | $ | 19,802 | $ | 18,477 | $ | 13,379 | $ | 11,954 | ||||||||
Upjohn | 4,027 | 6,184 | 2,359 | 4,251 | ||||||||||||
Total reportable segments | 23,829 | 24,661 | 15,738 | 16,206 | ||||||||||||
Other business activities | — | 1,721 | (3,019 | ) | (2,306 | ) | ||||||||||
Reconciling Items: | ||||||||||||||||
Corporate and other unallocated | — | — | (2,245 | ) | (2,676 | ) | ||||||||||
Purchase accounting adjustments | — | — | (1,722 | ) | (2,217 | ) | ||||||||||
Acquisition-related costs | — | — | (34 | ) | 148 | |||||||||||
Certain significant items(b) | — | — | (879 | ) | (691 | ) | ||||||||||
$ | 23,829 | $ | 26,382 | $ | 7,838 | $ | 8,463 | |||||||||
(a) | Income from continuing operations before provision/(benefit) for taxes on income. Biopharma’s earnings include dividend income of $76 million in the second quarter of 2020 and $76 million in the second quarter of 2019, and $153 million in the first six months of 2020 and $140 million in the first six months of 2019 from our investment in ViiV. For additional information, see Note 4. |
(b) | Certain significant items are substantive and/or unusual, and in some cases recurring, items (as noted above) that, either as a result of their nature or size, would not be expected to occur as part of our normal business on a regular basis. |
Equity in the net income of investees accounted for by the equity method is not significant for any of our operating segments.
The operating segment information does not purport to represent the revenues, costs and income from continuing operations before provision for taxes on income that each of our operating segments would have recorded had each segment operated as a standalone company during the periods presented.
42
PFIZER INC. AND SUBSIDIARY COMPANIES
NOTES TO CONDENSED CONSOLIDATED FINANCIAL STATEMENTS
(UNAUDITED)
B. Geographic Information
The following table provides revenues by geographic area: | ||||||||||||||||||||||
Three Months Ended | Six Months Ended | |||||||||||||||||||||
(MILLIONS OF DOLLARS) | June 28, 2020 | June 30, 2019 | % Change | June 28, 2020 | June 30, 2019 | % Change | ||||||||||||||||
United States | $ | 5,402 | $ | 6,335 | (15 | ) | $ | 11,053 | $ | 12,510 | (12 | ) | ||||||||||
Developed Europe(a) | 2,088 | 2,228 | (6 | ) | 4,009 | 4,315 | (7 | ) | ||||||||||||||
Developed Rest of World(b) | 1,552 | 1,639 | (5 | ) | 3,008 | 3,174 | (5 | ) | ||||||||||||||
Emerging Markets(c) | 2,759 | 3,062 | (10 | ) | 5,759 | 6,383 | (10 | ) | ||||||||||||||
Revenues | $ | 11,801 | $ | 13,264 | (11 | ) | $ | 23,829 | $ | 26,382 | (10 | ) | ||||||||||
(a) | Developed Europe region includes the following markets: Western Europe, Scandinavian countries and Finland. Revenues denominated in euros were $1.7 billion in the second quarter of 2020 and $1.8 billion in the second quarter of 2019, and were $3.2 billion in the first six months of 2020 and $3.5 billion in the first six months of 2019. |
(b) | Developed Rest of World region includes the following markets: Japan, Canada, South Korea, Australia and New Zealand. |
(c) | Emerging Markets region includes, but is not limited to, the following markets: Asia (excluding Japan and South Korea), Latin America, Eastern Europe, Africa, the Middle East, Central Europe and Turkey. |
C. Other Revenue Information
Significant Product Revenues
The following table provides detailed revenue information for several of our major products:
(MILLIONS OF DOLLARS) | Three Months Ended | Six Months Ended | ||||||||||||||||
PRODUCT | PRIMARY INDICATION OR CLASS | June 28, 2020 | June 30, 2019 | June 28, 2020 | June 30, 2019 | |||||||||||||
TOTAL REVENUES | $ | 11,801 | $ | 13,264 | $ | 23,829 | $ | 26,382 | ||||||||||
PFIZER BIOPHARMACEUTICALS GROUP (BIOPHARMA) | $ | 9,795 | $ | 9,432 | $ | 19,802 | $ | 18,477 | ||||||||||
Internal Medicine(a) | $ | 2,279 | $ | 2,243 | $ | 4,610 | $ | 4,380 | ||||||||||
Eliquis alliance revenues and direct sales | Nonvalvular atrial fibrillation, deep vein thrombosis, pulmonary embolism | 1,272 | 1,085 | 2,572 | 2,096 | |||||||||||||
Chantix/Champix | An aid to smoking cessation treatment in adults 18 years of age or older | 235 | 276 | 505 | 549 | |||||||||||||
Premarin family | Symptoms of menopause | 152 | 193 | 304 | 361 | |||||||||||||
BMP2 | Development of bone and cartilage | 57 | 79 | 127 | 145 | |||||||||||||
Toviaz | Overactive bladder | 64 | 65 | 124 | 125 | |||||||||||||
All other Internal Medicine | Various | 498 | 544 | 978 | 1,103 | |||||||||||||
Oncology | $ | 2,647 | $ | 2,236 | $ | 5,082 | $ | 4,198 | ||||||||||
Ibrance | Metastatic breast cancer | 1,349 | 1,261 | 2,598 | 2,394 | |||||||||||||
Xtandi alliance revenues | Non-metastatic and metastatic castration-resistant prostate cancer and metastatic castration-sensitive prostate cancer | 266 | 201 | 475 | 369 | |||||||||||||
Sutent | Advanced and/or metastatic RCC, adjuvant RCC, refractory GIST (after disease progression on, or intolerance to, imatinib mesylate) and advanced pancreatic neuroendocrine tumor | 209 | 248 | 414 | 480 | |||||||||||||
Inlyta | Advanced RCC | 195 | 104 | 364 | 177 | |||||||||||||
Xalkori | ALK-positive and ROS1-positive advanced NSCLC | 138 | 133 | 287 | 255 | |||||||||||||
Bosulif | Philadelphia chromosome–positive chronic myelogenous leukemia | 113 | 97 | 213 | 177 | |||||||||||||
Retacrit(b) | Anemia | 87 | 51 | 176 | 82 | |||||||||||||
Braftovi | In combination with Mektovi for metastatic melanoma for patients who test positive for a BRAF genetic mutation and, in combination with Erbitux® (cetuximab), for the treatment of BRAFV600E-mutant metastatic colorectal cancer after prior therapy | 36 | — | 74 | — | |||||||||||||
Mektovi | In combination with Braftovi for metastatic melanoma for patients who test positive for a BRAF genetic mutation | 32 | — | 69 | — | |||||||||||||
All other Oncology | Various | 221 | 140 | 412 | 262 | |||||||||||||
Hospital(a), (c) | $ | 1,794 | $ | 1,838 | $ | 3,807 | $ | 3,665 | ||||||||||
Sulperazon | Bacterial infections | 102 | 165 | 289 | 342 | |||||||||||||
Medrol | Anti-inflammatory glucocorticoid | 78 | 120 | 207 | 240 | |||||||||||||
Zithromax | Bacterial infections | 55 | 73 | 193 | 177 | |||||||||||||
Precedex | Sedation agent in surgery or intensive care | 114 | 40 | 156 | 80 | |||||||||||||
Vfend | Fungal infections | 75 | 94 | 149 | 178 | |||||||||||||
Panzyga | Primary humoral immunodeficiency | 63 | 44 | 136 | 61 | |||||||||||||
43
PFIZER INC. AND SUBSIDIARY COMPANIES
NOTES TO CONDENSED CONSOLIDATED FINANCIAL STATEMENTS
(UNAUDITED)
(MILLIONS OF DOLLARS) | Three Months Ended | Six Months Ended | ||||||||||||||||
PRODUCT | PRIMARY INDICATION OR CLASS | June 28, 2020 | June 30, 2019 | June 28, 2020 | June 30, 2019 | |||||||||||||
Zyvox | Bacterial infections | 55 | 71 | 125 | 134 | |||||||||||||
Fragmin | Treatment/prevention of venous thromboembolism | 58 | 63 | 118 | 123 | |||||||||||||
Pfizer CentreOne(d) | Various | 224 | 204 | 376 | 380 | |||||||||||||
All other Anti-infectives | Various | 367 | 420 | 811 | 825 | |||||||||||||
All other Hospital(c) | Various | 603 | 544 | 1,245 | 1,124 | |||||||||||||
Vaccines | $ | 1,247 | $ | 1,375 | $ | 2,857 | $ | 2,988 | ||||||||||
Prevnar 13/Prevenar 13 | Pneumococcal disease | 1,116 | 1,179 | 2,566 | 2,665 | |||||||||||||
Nimenrix | Meningococcal disease | 56 | 58 | 130 | 107 | |||||||||||||
All other Vaccines | Various | 75 | 138 | 161 | 215 | |||||||||||||
Inflammation & Immunology (I&I) | $ | 1,149 | $ | 1,219 | $ | 2,127 | $ | 2,256 | ||||||||||
Xeljanz | RA, PsA, UC | 635 | 613 | 1,086 | 1,036 | |||||||||||||
Enbrel (Outside the U.S. and Canada) | RA, juvenile idiopathic arthritis, PsA, plaque psoriasis, pediatric plaque psoriasis, ankylosing spondylitis and nonradiographic axial spondyloarthritis | 337 | 420 | 684 | 871 | |||||||||||||
Inflectra/Remsima(b) | Crohn’s disease, pediatric Crohn’s disease, UC, pediatric UC, RA in combination with methotrexate, ankylosing spondylitis, PsA and plaque psoriasis | 150 | 153 | 308 | 291 | |||||||||||||
All other I&I | Various | 26 | 34 | 48 | 59 | |||||||||||||
Rare Disease | $ | 681 | $ | 521 | $ | 1,319 | $ | 991 | ||||||||||
Vyndaqel/Vyndamax | ATTR-cardiomyopathy and polyneuropathy | 277 | 63 | 508 | 104 | |||||||||||||
BeneFIX | Hemophilia B | 109 | 121 | 230 | 247 | |||||||||||||
Genotropin | Replacement of human growth hormone | 106 | 125 | 209 | 232 | |||||||||||||
Refacto AF/Xyntha | Hemophilia A | 91 | 108 | 181 | 214 | |||||||||||||
Somavert | Acromegaly | 67 | 68 | 131 | 128 | |||||||||||||
All other Rare Disease | Various | 31 | 35 | 61 | 66 | |||||||||||||
UPJOHN(a) | $ | 2,006 | $ | 2,970 | $ | 4,027 | $ | 6,184 | ||||||||||
Lipitor | Reduction of LDL cholesterol | 431 | 407 | 836 | 1,029 | |||||||||||||
Lyrica | Epilepsy, post-herpetic neuralgia and diabetic peripheral neuropathy, fibromyalgia, neuropathic pain due to spinal cord injury | 349 | 1,175 | 706 | 2,362 | |||||||||||||
Norvasc | Hypertension | 222 | 216 | 419 | 516 | |||||||||||||
Celebrex | Arthritis pain and inflammation, acute pain | 139 | 174 | 295 | 347 | |||||||||||||
Viagra | Erectile dysfunction | 94 | 114 | 222 | 259 | |||||||||||||
Effexor | Depression and certain anxiety disorders | 86 | 86 | 163 | 163 | |||||||||||||
Zoloft | Depression and certain anxiety disorders | 79 | 73 | 157 | 143 | |||||||||||||
EpiPen(a) | Epinephrine injection used in treatment of life-threatening allergic reactions | 64 | 67 | 136 | 123 | |||||||||||||
Xalatan/Xalacom | Glaucoma and ocular hypertension | 65 | 72 | 126 | 133 | |||||||||||||
All other Upjohn | Various | 476 | 587 | 968 | 1,109 | |||||||||||||
CONSUMER HEALTHCARE BUSINESS(e) | $ | — | $ | 862 | $ | — | $ | 1,721 | ||||||||||
Total Alliance revenues | $ | 1,404 | $ | 1,187 | $ | 2,786 | $ | 2,277 | ||||||||||
Total Biosimilars(b) | $ | 289 | $ | 217 | $ | 578 | $ | 396 | ||||||||||
Total Sterile Injectable Pharmaceuticals(f) | $ | 1,237 | $ | 1,218 | $ | 2,644 | $ | 2,455 | ||||||||||
(a) | Beginning in 2020, Upjohn began managing our Meridian subsidiary, the manufacturer of EpiPen and other auto-injector products, and a pre-existing strategic collaboration between Pfizer and Mylan for generic drugs in Japan (Mylan-Japan). As a result, revenues associated with our Meridian subsidiary, except for product revenues for EpiPen sold in Canada, and Mylan-Japan, are reported in our Upjohn business beginning in the first quarter of 2020. We have reclassified revenues associated with our Meridian subsidiary and Mylan-Japan from the Hospital and Internal Medicine categories to the Upjohn business to conform 2019 product revenues to the current presentation. |
(b) | Biosimilars are highly similar versions of approved and authorized biological medicines and primarily include revenues from Inflectra/Remsima and Retacrit. |
(c) | Hospital is a business unit that commercializes our global portfolio of sterile injectable and anti-infective medicines. Hospital also includes Pfizer CentreOne(d). All other Hospital primarily includes revenues from legacy Sterile Injectables Pharmaceuticals (SIP) products (that are not anti-infective products) and, to a much lesser extent, solid oral dose products (that are not anti-infective products). SIP anti-infective products that are not individually listed above are recorded in “All other Anti-infectives”. |
(d) | Pfizer CentreOne includes revenues from our contract manufacturing and active pharmaceutical ingredient sales operation, including sterile injectables contract manufacturing, and revenues related to our manufacturing and supply agreements. |
(e) | On July 31, 2019, Pfizer’s Consumer Healthcare business, an over-the-counter medicines business, was combined with GSK’s consumer healthcare business to form a new consumer healthcare joint venture. For additional information, see Note 2B. |
(f) | Total Sterile Injectable Pharmaceuticals represents the total of all branded and generic injectable products in the Hospital business, including anti-infective sterile injectable pharmaceuticals. |
44
Report of Independent Registered Public Accounting Firm
To the Board of Directors and Shareholders of Pfizer Inc.:
Results of Review of Interim Financial Information
We have reviewed the condensed consolidated balance sheet of Pfizer Inc. and subsidiaries (the Company) as of June 28, 2020, the related condensed consolidated statements of income, comprehensive income and equity for the three-month and six-month periods ended June 28, 2020 and June 30, 2019, the related condensed consolidated statements of cash flows for the six-month periods ended June 28, 2020 and June 30, 2019 and the related notes (collectively, the consolidated interim financial information). Based on our reviews, we are not aware of any material modifications that should be made to the consolidated interim financial information for it to be in conformity with U.S. generally accepted accounting principles.
We have previously audited, in accordance with the standards of the Public Company Accounting Oversight Board (United States) (PCAOB), the consolidated balance sheet of the Company as of December 31, 2019, and the related consolidated statements of income, comprehensive income, equity, and cash flows for the year then ended (not presented herein); and in our report dated February 27, 2020, we expressed an unqualified opinion on those consolidated financial statements. In our opinion, the information set forth in the accompanying condensed consolidated balance sheet as of December 31, 2019 is fairly stated, in all material respects, in relation to the consolidated balance sheet from which it has been derived.
Basis for Review Results
This consolidated interim financial information is the responsibility of the Company’s management. We are a public accounting firm registered with the PCAOB and are required to be independent with respect to the Company in accordance with the U.S. federal securities laws and the applicable rules and regulations of the Securities and Exchange Commission and the PCAOB.
We conducted our reviews in accordance with the standards of the PCAOB. A review of consolidated interim financial information consists principally of applying analytical procedures and making inquiries of persons responsible for financial and accounting matters. It is substantially less in scope than an audit conducted in accordance with the standards of the PCAOB, the objective of which is the expression of an opinion regarding the financial statements taken as a whole. Accordingly, we do not express such an opinion.
/s/ KPMG LLP
New York, New York
August 6, 2020
45
Item 2. Management’s Discussion and Analysis of Financial Condition and Results of Operations
Introduction
See the Glossary of Defined Terms at the beginning of this Quarterly Report on Form 10-Q for terms used throughout this MD&A. Our MD&A is provided in addition to the accompanying condensed consolidated financial statements and footnotes to assist readers in understanding Pfizer’s results of operations, financial condition and cash flows. All trademarks in this MD&A are the property of their respective owners. The MD&A is organized as follows:
● | Beginning on page 47 | ||||
This section provides information about the following: Our Business; Our Business Development Initiatives; our performance during the second quarter and first six months of 2020 and 2019; Our Operating Environment; The Global Economic Environment; Our Strategy; and Our Financial Guidance for 2020. | |||||
● | Beginning on page 57 | ||||
This section discusses our disclosures for those accounting policies and estimates that we consider important in understanding our consolidated financial statements. | |||||
● | Beginning on page 58 | ||||
This section includes the following sub-sections: | |||||
Beginning on page 59 | |||||
This sub-section provides an overview of revenues by operating segment and geography as well as revenue deductions. | |||||
Beginning on page 64 | |||||
This sub-section provides an overview of several of our biopharmaceutical products. | |||||
Beginning on page 69 | |||||
This sub-section provides an overview of important biopharmaceutical product developments. | |||||
Beginning on page 72 | |||||
This sub-section provides a discussion about our costs and expenses. | |||||
Beginning on page 75 | |||||
This sub-section provides a discussion of items impacting our tax provisions. | |||||
Beginning on page 75 | |||||
This sub-section provides a discussion of an alternative view of performance used by management. | |||||
● | Beginning on page 81 | ||||
This section provides a discussion of the performance of each of our operating segments. | |||||
● | Beginning on page 88 | ||||
This section provides an analysis of our cash flows for the first six months of 2020 and 2019. | |||||
● | Beginning on page 89 | ||||
This section provides an analysis of selected measures of our liquidity and of our capital resources as of June 28, 2020 and December 31, 2019, as well as a discussion of our outstanding debt and other commitments that existed as of June 28, 2020 and December 31, 2019. Included in the discussion of outstanding debt is a discussion of the amount of financial capacity available to help fund Pfizer’s future activities. | |||||
● | Beginning on page 93 | ||||
This section discusses accounting standards that we have recently adopted, as well as those that recently have been issued, but not yet adopted. | |||||
● | Beginning on page 93 | ||||
This section provides a description of the risks and uncertainties that could cause actual results to differ materially from those discussed in forward-looking statements presented in this MD&A. | |||||
Certain amounts in this MD&A may not add due to rounding. All percentages have been calculated using unrounded amounts.
46
OVERVIEW OF OUR PERFORMANCE, OPERATING ENVIRONMENT, STRATEGY AND OUTLOOK
Our Business
We apply science and our global resources to bring therapies to people that extend and significantly improve their lives through the discovery, development, manufacture and distribution of healthcare products, including innovative medicines and vaccines. We work across developed and emerging markets to advance wellness, prevention, treatments and cures that challenge the most feared diseases of our time. We collaborate with healthcare providers, governments and local communities to support and expand access to reliable, affordable healthcare around the world. Our revenues are derived from the sale of our products and, to a much lesser extent, from alliance agreements, under which we co-promote products discovered or developed by other companies or us (Alliance revenues).
At the beginning of our 2019 fiscal year, we began to manage our commercial operations through a new global structure consisting of three business segments––Pfizer Biopharmaceuticals Group (Biopharma), Upjohn and, through July 31, 2019, Consumer Healthcare. Biopharma and Upjohn are the only reportable segments. For additional information about this operating structure, see Notes to Condensed Consolidated Financial Statements––Note 14A. Segment, Geographic and Other Revenue Information: Segment Information and the “Commercial Operations” section in Part I, Item 1, “Business” of our 2019
Form 10-K.
Beginning in 2020, Upjohn began managing our Meridian subsidiary, the manufacturer of EpiPen and other auto-injector products, and a pre-existing strategic collaboration between Pfizer and Mylan for generic drugs in Japan (Mylan-Japan). As a result, revenues and expenses associated with Meridian and Mylan-Japan are reported in our Upjohn business beginning in the first quarter of 2020. In 2019, revenues and expenses from Meridian and Mylan-Japan were recorded in our Biopharma business. We performed certain reclassifications between the Biopharma and Upjohn segments to conform 2019 segment revenues and expenses associated with Meridian and Mylan-Japan to the current presentation. There was no impact to our consolidated financial statements.
The majority of our revenues come from the manufacture and sale of biopharmaceutical products. As explained more fully in our 2019 Form 10-K, the biopharmaceutical industry is highly competitive and highly regulated. As a result, we face a number of industry-specific factors and challenges, which can significantly impact our results. These factors include, among others: the loss or expiration of intellectual property rights and the expiration of co-promotion and licensing rights, the ability to replenish innovative biopharmaceutical products, healthcare legislation, pipeline productivity, the regulatory environment, pricing and access pressures, product manufacturing and competition. We also face challenges as a result of the global economic environment. For additional information about these factors and challenges, see the “Our Operating Environment” and “The Global Economic Environment” sections of this MD&A and in our 2019 Financial Report and Part I, Item 1A, “Risk Factors” of our 2019 Form 10-K and Part II, Item 1A, “Risk Factors” of this Quarterly Report on Form 10-Q.
The financial information included in our condensed consolidated financial statements for our subsidiaries operating outside the U.S. is as of and for the three and six months ended May 24, 2020 and May 26, 2019. The financial information included in our condensed consolidated financial statements for U.S. subsidiaries is as of and for the three and six months ended June 28, 2020 and June 30, 2019.
References to operational variances in this MD&A pertain to period-over-period growth rates that exclude the impact of foreign exchange. The operational variances are determined by multiplying or dividing, as appropriate, our current period U.S. dollar results by the current period average foreign exchange rates and then multiplying or dividing, as appropriate, those amounts by the prior-year period average foreign exchange rates. Although exchange rate changes are part of our business, they are not within our control. Exchange rate changes, however, can mask positive or negative trends in the business; therefore, we believe presenting operational variances provides useful information to evaluate the results of our business.
Our Business Development Initiatives
We are committed to capitalizing on growth opportunities by advancing our own pipeline and maximizing the value of our in-line products, as well as through various forms of business development, which can include alliances, licenses, joint ventures, collaborations, equity- or debt-based investments, dispositions, mergers and acquisitions. We view our business development activity as an enabler of our strategies, and we seek to generate earnings growth and enhance shareholder value by pursuing a disciplined, strategic and financial approach to evaluating business development opportunities. We continue to evaluate business development transactions that have the potential to strengthen our businesses and their capabilities, such as our acquisitions of Array, Therachon, Hospira, Medivation, Anacor and AstraZeneca’s small molecule anti-infectives business, as well as collaborations, and alliance and license agreements with other companies. We assess our businesses, assets and scientific capabilities/portfolio as part of our regular, ongoing portfolio review process and also continue to consider business development activities that will advance our businesses.
47
Our significant recent business development activities include:
• | Agreement with Valneva SE––On April 30, 2020, we signed an agreement to co-develop and commercialize Valneva’s Lyme disease vaccine candidate VLA15, which is currently in Phase 2 clinical studies. In June 2020, Valneva announced that the antitrust-related condition precedent was met and, consequently, the agreement became effective. VLA15 is the only active Lyme disease vaccine program in clinical development today, and covers six serotypes that are prevalent in North America and Europe. For additional information, see Notes to Condensed Consolidated Financial Statements––Note 2C. Acquisition, Equity-Method Investment and Licensing Arrangements: Licensing Arrangements. |
• | Agreement with BioNTech SE––On April 9, 2020, we signed a global agreement with BioNTech to co-develop a potential first-in-class, mRNA-based coronavirus vaccine program, BNT162, aimed at preventing COVID-19 infection. The collaboration aims to rapidly advance multiple COVID-19 vaccine candidates into human clinical testing based on BioNTech’s proprietary mRNA vaccine platforms, with the objective of ensuring rapid worldwide access to the vaccine, if approved. The collaboration will leverage our broad expertise in vaccine R&D, regulatory capabilities, and global manufacturing and distribution network. We and BioNTech plan to jointly conduct clinical trials for the COVID-19 vaccine candidates initially in the U.S. and Europe across multiple sites. For additional information, including information regarding our COVID-19 vaccine development program, see the “Overview of Our Performance, Operating Environment, Strategy and Outlook––The Global Economic Environment” and “Product Developments—Biopharmaceutical” sections of this MD&A and Notes to Condensed Consolidated Financial Statements––Note 2C. Acquisition, Equity-Method Investment and Licensing Arrangements: Licensing Arrangements. |
• | Formation of a New Consumer Healthcare Joint Venture––On July 31, 2019, we completed the transaction in which we and GSK combined our respective consumer healthcare businesses into a new consumer healthcare joint venture that operates globally under the GSK Consumer Healthcare name. The joint venture develops and markets brands in the oral health, pain relief, respiratory, nutrition/gastro-intestinal and skin health categories and is one of the world’s leading over-the-counter healthcare companies. Our financial results, and our Consumer Healthcare segment’s operating results, for the second quarter of 2019 reflect three months of Consumer Healthcare segment operations and for the first six months of 2019 reflect six months of Consumer Healthcare segment operations, while financial results for the second quarter and first six months of 2020 do not reflect any contribution from the Consumer Healthcare business. For additional information, see Notes to Condensed Consolidated Financial Statements––Note 2B. Acquisition, Equity-Method Investment and Licensing Arrangements: Equity-Method Investment. |
• | Agreement to Combine Upjohn with Mylan N.V.––On July 29, 2019, we announced that we entered into a definitive agreement to combine Upjohn with Mylan, creating a new global pharmaceutical company, Viatris. Under the terms of the agreement, which is structured as an all-stock, Reverse Morris Trust transaction, Upjohn is expected to be spun off to Pfizer’s shareholders and, immediately thereafter, combined with Mylan. Pfizer shareholders would own 57% of the combined new company, and former Mylan shareholders would own 43%. The transaction is expected to be tax free to Pfizer and Pfizer shareholders. The transaction was approved by Mylan’s shareholders in June 2020 and is anticipated to close in the fourth quarter of 2020, subject to customary closing conditions, including receipt of the remaining required regulatory approvals. In June 2020, Upjohn Inc. and Upjohn Finance B.V. (a wholly-owned subsidiary of Upjohn Inc.) completed privately placed debt offerings in connection with the transaction. For additional information, see Notes to Condensed Consolidated Financial Statements––Note 7D. Financial Instruments: Long-Term Debt and the “Analysis of Financial Condition, Liquidity and Capital Resources” section of this MD&A. We expect to incur costs of approximately $700 million in connection with separating Upjohn, of which approximately 30% has been incurred since inception and through the first six months of 2020. Such charges include costs and expenses related to separation of legal entities and anticipated transaction costs. |
For a description of the more significant recent transactions through February 27, 2020, the filing date of our 2019 Form 10-K, see the “Our Business Development Initiatives” section of our 2019 Financial Report.
Our Second Quarter 2020 and First Six Months of 2020 Performance
Revenues
Revenues decreased $1.5 billion, or 11%, in the second quarter of 2020, compared to the same period in 2019, reflecting an operational decrease of $1.2 billion, or 9%, as well as an unfavorable impact of foreign exchange of $277 million, or 2%. Excluding the impact of the Consumer Healthcare transaction, revenues decreased 3% operationally, reflecting a 31% operational decline in our Upjohn business mainly due to the U.S. loss of exclusivity of Lyrica, which was partially offset by 6% operational growth in our Biopharma business. Excluding the impact of Lyrica in the U.S., Upjohn revenues declined 6% operationally. Revenues for the second quarter of 2020 included an estimated net unfavorable impact of approximately $500 million, or 4%, due to COVID-19, primarily reflecting unfavorable disruptions to wellness visits for pediatric and adult patients in the U.S. and lower demand for certain products in China, partially offset by increased U.S. demand for certain sterile injectable products as well as increased adult demand for Prevenar 13 in certain international markets.
48
Revenues decreased $2.6 billion, or 10%, in the first six months of 2020, compared to the same period in 2019, reflecting an operational decrease of $2.1 billion, or 8%, as well as an unfavorable impact of foreign exchange of $411 million, or 2%. Excluding the impact of the Consumer Healthcare transaction, revenues decreased 2% operationally, reflecting a 34% operational decline in our Upjohn business mainly due to the U.S. loss of exclusivity of Lyrica, which was partially offset by 9% operational growth in our Biopharma business. Excluding the impact of Lyrica in the U.S., Upjohn revenues declined 11% operationally. Revenues for the first six months of 2020 included an estimated net unfavorable impact of approximately $350 million, or 1%, due to COVID-19, primarily reflecting unfavorable disruptions to wellness visits for pediatric and adult patients in the U.S. and lower demand for certain products in China, partially offset by increased U.S. demand for certain sterile injectable products as well as increased adult demand for Prevenar 13 in certain international markets.
See the “Analysis of the Condensed Consolidated Statements of Income––Revenues by Operating Segment and Geography” section below for more information, including a discussion of key drivers of our revenue performance.
For worldwide revenues and revenues by geography, for selected products, see the discussion in the “Analysis of the Condensed Consolidated Statements of Income––Revenues––Selected Product Discussion” section of this MD&A. For additional information regarding the primary indications or class of certain products, see Notes to Condensed Consolidated Financial Statements––Note 14C. Segment, Geographic and Other Revenue Information: Other Revenue Information.
Income from Continuing Operations Before Provision/(Benefit) for Taxes on Income
The following provides an analysis of the decrease in Income from continuing operations before provision/(benefit) for taxes on income for the second quarter and first six months of 2020:
(MILLIONS OF DOLLARS) | Three Months | Six Months | ||||||
Income from continuing operations before provision/(benefit) for taxes on income, for the three and six months ended June 30, 2019 | $ | 4,141 | $ | 8,463 | ||||
Unfavorable change in revenues | (1,463 | ) | (2,552 | ) | ||||
Favorable/(Unfavorable) changes: | ||||||||
Lower Cost of sales(a) | 295 | 351 | ||||||
Lower Selling, informational and administrative expenses(b) | 481 | 947 | ||||||
Higher Research and development expenses(c) | (290 | ) | (311 | ) | ||||
Lower Amortization of intangible assets(d) | 279 | 577 | ||||||
Higher Restructuring charges and certain acquisition-related costs(e) | (478 | ) | (500 | ) | ||||
Higher net gains recognized during the period on equity-securities(f) | 696 | 331 | ||||||
Lower business and legal entity alignment costs(f) | 137 | 256 | ||||||
Lower asset impairment charges(f) | 10 | 160 | ||||||
Non-recurrence of net losses on early retirement of debt(f) | — | 138 | ||||||
Higher income from collaborations, out-licensing arrangements and sales of compound/product rights(f) | 78 | 111 | ||||||
GSK Consumer Healthcare JV equity method income(f) | 126 | 92 | ||||||
Higher net periodic benefit credits other than service costs(f) | 57 | 85 | ||||||
Unfavorable change in the fair value of contingent consideration(f) | (5 | ) | (89 | ) | ||||
Higher net interest expense(f) | (23 | ) | (84 | ) | ||||
Non-recurrence of insurance recoveries related to Hurricane Maria in 2019 | (25 | ) | (50 | ) | ||||
All other items, net | (65 | ) | (86 | ) | ||||
Income from continuing operations before provision/(benefit) for taxes on income, for the three and six months ended June 28, 2020 | $ | 3,953 | $ | 7,838 | ||||
(a) | See the “Costs and Expenses––Cost of Sales” section of this MD&A. |
(b) | See the “Costs and Expenses––Selling, Informational and Administrative (SI&A) Expenses” section of this MD&A. |
(c) | See the “Costs and Expenses––Research and Development (R&D) Expenses” section of this MD&A. |
(d) | See the “Costs and Expenses––Amortization of Intangible Assets” section of this MD&A. |
(e) | See the “Costs and Expenses––Restructuring Charges and Other Costs Associated with Acquisitions and Cost-Reduction/Productivity Initiatives” section of this MD&A. |
(f) | See Notes to Condensed Consolidated Financial Statements––Note 4. Other (Income)/Deductions—Net. |
For information on our tax provision and effective tax rate see the “Provision/(Benefit) for Taxes on Income” section of this MD&A and Notes to Condensed Consolidated Financial Statements––Note 5. Tax Matters.
49
Our Operating Environment
Industry-Specific Challenges
Intellectual Property Rights and Collaboration/Licensing Rights
The loss, expiration or invalidation of intellectual property rights, patent litigation settlements with manufacturers and the expiration of co-promotion and licensing rights can have a material adverse effect on our revenues. Certain of our current products have experienced patent-based expirations or loss of regulatory exclusivity in certain markets in the last few years, and we expect certain products to face significantly increased generic competition over the next few years. For example, Lyrica lost patent protection in the U.S. in June 2019 and multi-source generic competition began in July 2019. Also, the basic product patent for Chantix in the U.S. will expire in November 2020. We expect the impact of reduced revenues due to patent expiries will be significant in 2020, then moderating downward to a much lower level from 2021 through 2025.
For additional information, including the patent rights we consider most significant in relation to our business as a whole, together with the year in which the basic product patent expires and recent and expected losses of product exclusivity, see the “Patents and Other Intellectual Property Rights” section in Part I, Item 1, “Business” of our 2019 Form 10-K.
We will continue to aggressively defend our patent rights whenever we deem appropriate. For a discussion of certain recent developments with respect to patent litigation, see Notes to Condensed Consolidated Financial Statements––Note 13A1. Contingencies and Certain Commitments: Legal Proceedings––Patent Litigation.
Regulatory Environment/Pricing and Access––U.S. Healthcare Legislation
In March 2010, the ACA was enacted in the U.S. For additional information, see the “Government Regulation and Price Constraints” section in Part I, Item 1, “Business”, of our 2019 Form 10-K.
We recorded the following amounts as a result of the U.S. Healthcare Legislation: | ||||||||||||||||
Three Months Ended | Six Months Ended | |||||||||||||||
(MILLIONS OF DOLLARS) | June 28, 2020 | June 30, 2019 | June 28, 2020 | June 30, 2019 | ||||||||||||
Reduction to Revenues, related to the Medicare “coverage gap” discount provision | $ | 216 | $ | 154 | $ | 350 | $ | 289 | ||||||||
Selling, informational and administrative expenses, related to the fee payable to the federal government (which is not deductible for U.S. income tax purposes), based on our prior-calendar-year share relative to other companies of branded prescription drug sales to specified government programs. | 71 | 70 | 110 | 121 | ||||||||||||
Regulatory Environment/Pricing and Access––Government and Other Payer Group Pressures
The pricing of medicines by pharmaceutical manufacturers and the cost of healthcare, which includes medicines, medical services and hospital services, continues to be important to payers, governments, patients, and other stakeholders. Governments, MCOs and other payor groups continue to seek increasing discounts on our products through a variety of means and could have a material adverse impact on our results of operations. We believe that medicines are amongst the most powerful tools for patients in curing, treating and preventing illness and disability, and that all patients should have appropriate access to the medicines their doctors prescribe. We may consider a number of factors when determining a medicine’s price, including, for example, its impact on patients and their disease, other available treatments, the medicine’s potential to reduce other healthcare costs (such as hospital stays), and affordability. Within the U.S., in particular, we may also engage with patients, doctors and healthcare plans regarding their views. We also negotiate with insurers, including PBMs and MCOs, often providing significant discounts to them from the list price. The price that patients pay in the U.S. for the medicines their physicians prescribe is ultimately set by healthcare providers and insurers. On average, in the U.S., insurers impose a higher out-of-pocket burden on patients for prescription medicines than for comparably-priced medical services. Private third-party payers and federal and state governments in the U.S. continue to take action to manage the utilization of drugs and control the cost of drugs, including increasingly employing formularies to control costs by taking into account discounts in connection with decisions about formulary inclusion or favorable formulary placement. For example, in July 2020, President Trump announced that he had signed four Executive Orders related to drug pricing, including orders addressing Part D rebate reform, the provision of deeply discounted insulin and/or an EpiPen to patients of Federally Qualified Health Centers, drug importation from Canada, and most favored nation pricing for Medicare. We will continue to work with insurance providers, governments and others to improve access to today’s innovative treatments. Certain governments, including the different EU member states, the U.K., China, Japan, Canada, South Korea and some other international markets, provide healthcare at low-to-zero direct cost to consumers at the point of care and have significant power as large single payers to regulate pharmaceutical prices or patient reimbursement levels to control costs for the government-sponsored healthcare system, particularly under recent global
50
financing pressures. Governments may use a variety of cost-containment measures for our pharmaceutical products, including price cuts, mandatory rebates, health technology assessments, forced localization as a condition of market access, “international reference pricing” (i.e., the practice of a country linking its regulated medicine prices to those of other countries), quality consistency evaluation processes and volume-based procurement.
In China, a centralized VBP program was initiated in 2018. Under this procurement model, a tender process has been established where a certain portion of included molecule volumes are guaranteed to tender winners. The program is intended to contain healthcare costs by driving utilization of generics that have passed quality consistency evaluation, which has resulted in dramatic price cuts for off-patent medicines. Upjohn and most off-patent originators were not successful in the first bidding process under this pilot, which was finalized in December 2018 and implemented in March 2019, and most contracts went to local generic companies. This pilot program covered 25 molecules, including atorvastatin calcium tablets (Lipitor) and amlodipine besylate tablets (Norvasc). In April 2020, China implemented another round of expansion of the national VBP program, which covers 33 new molecules, including Biopharma’s Zithromax tablets and Diflucan capsules and no Upjohn products. Biopharma was not successful in the bidding process for this expansion. In June 2020, China announced the latest round of the expansion of the VBP program, which is expected to be implemented in November 2020 and includes Biopharma’s Xeljanz and Zyvox tablets and Upjohn’s Viagra, Zoloft and Celebrex.
For additional information, see the “Government Regulation and Price Constrains” section in Part I, Item 1, “Business” of our 2019 Form 10-K.
Other Industry-Specific Challenges
Regulatory agencies periodically inspect our drug manufacturing facilities to evaluate compliance with cGMP or other applicable requirements. Failure to comply with these requirements may subject us to possible legal or regulatory actions, such as warning letters, suspension of manufacturing, seizure of product, injunctions, debarment, recall of a product, delays or denials of product approvals, import bans or denials of import certifications, any of which could have a material adverse effect on our business, financial condition and results of operations. In December 2019-January 2020, for example, the FDA conducted an inspection of our McPherson facility and issued an inspection report noting several findings to which Pfizer responded. Based on the outcome of this inspection, the FDA upgraded the inspection classification of the McPherson site to Voluntary Action Indicated (VAI) from Official Action Indicated. VAI status will allow supplements, including those for manufacturing changes/improvements and new products, to proceed for approval following the normal FDA process for a site with an acceptable compliance status. For additional information, see the “Overview of Our Performance, Operating Environment, Strategy and Outlook––Our Operating Environment––Industry-Specific Challenges––Product Manufacturing” section of our 2019 Financial Report.
We and other pharmaceutical companies continue to face industry-specific challenges that can significantly impact our business, including, among others, the regulatory environment, pipeline productivity, product manufacturing and competition. For additional information, see the “Overview of Our Performance, Operating Environment, Strategy and Outlook––Our Operating Environment––Industry-Specific Challenges––Regulatory Environment––Pipeline Productivity”, “––Product Manufacturing” and “––Competition” sections of our 2019 Financial Report and Part I, Item 1A, “Risk Factors” of our 2019 Form 10-K and Part II, Item 1A, “Risk Factors” of this Quarterly Report on Form 10-Q.
The Global Economic Environment
In addition to the industry-specific factors discussed above, we, like other businesses of our size, are exposed to the economic cycle, which impacts our biopharmaceutical operations globally.
COVID-19 Pandemic. In December 2019, illnesses associated with COVID-19 were reported and the virus has since caused widespread and significant disruptions to daily life and economies across geographies. The World Health Organization has classified the outbreak as a pandemic. Our business, operations and financial condition and results have been impacted to varying degrees, primarily during the second quarter of 2020. We currently anticipate an ongoing, gradual global recovery from the first-half 2020 macroeconomic and healthcare impacts of the COVID-19 pandemic. For additional information on the impact of COVID-19 on our revenues, please see the “Overview of Our Performance, Operating Environment, Strategy and Outlook––Our Second Quarter 2020 and First Six Months of 2020 Performance” section of this MD&A.
Pfizer’s Response to COVID-19
We are fully committed to confronting the public health challenge posed by the COVID-19 pandemic by collaborating with industry partners and academic institutions to develop potential approaches to prevent and treat COVID-19. Our researchers and scientists also have been exploring potential new uses of existing medicines in our portfolio that may be able to help infected patients.
51
In response to the COVID-19 pandemic, in March 2020, we issued a five-point plan calling on the biopharmaceutical industry to join us in committing to unprecedented collaboration to combat COVID-19. Subsequently, we announced some important advances in the battle against the COVID-19 pandemic, including, among others:
• | We and The Pfizer Foundation announced the commitment of $40 million in medical and charitable cash grants to help combat the health effects of the COVID-19 pandemic in the U.S. and around the world. The Pfizer Foundation is a charitable organization established by Pfizer Inc. It is a separate legal entity from Pfizer Inc. with distinct legal restrictions. |
• | We confirmed a lead compound and analogues in our portfolio are potent inhibitors of the SARS-CoV-2 3C-like protease, based on the results of initial screening assays. In addition, preliminary data suggest the lead protease inhibitor shows antiviral activity against SARS-CoV-2, the virus that causes COVID-19. Consequently, we are continuing to perform pre-clinical confirmatory studies, including further anti-viral profiling and assessment of the suitability of the lead molecule for IV administration clinically. In July 2020, we published the chemical structure of a 3C-like (3CL) protease inhibitor and its in vitro activity against coronaviruses, including SARS-CoV-2. In parallel, we are also investing in materials with the aim of accelerating the start of a potential clinical study of the lead molecule to the third quarter of 2020, subject to positive completion of the pre-clinical confirmatory studies and regulatory approval. |
• | We entered into a global agreement with BioNTech to co-develop a potential first-in-class, mRNA-based coronavirus vaccine program, BNT162, aimed at preventing COVID-19 infection. As part of this co-development program, which we refer to as Project Lightspeed, we and BioNTech announced in July 2020 the start of a global (except for China) Phase 2/3 safety and efficacy clinical study to evaluate a single nucleoside-modified messenger RNA candidate. After extensive review of preclinical and clinical data from Phase 1/2 clinical trials, and in consultation with the FDA’s Center for Biologics Evaluation and Research and other global regulators, we and BioNTech chose to advance the BNT162b2 vaccine candidate into the Phase 2/3 study, at a 30 µg dose level in a 2 dose regimen. BNT162b2, which received Fast Track designation from the FDA in July 2020, encodes an optimized SARS-CoV-2 full length spike glycoprotein, which is the target of virus neutralizing antibodies. If the Phase 2/3 trial is successful, we and BioNTech expect to be ready to seek Emergency Use Authorization or some form of regulatory approval as early as October 2020. If authorization or approval is obtained, the companies currently aim to supply globally (excluding China) up to 100 million doses by the end of 2020 and approximately 1.3 billion doses by the end of 2021. Also in July and August 2020, we and BioNTech announced agreements with the following governments: (i) with the U.K. government for 30 million doses of BNT162, to be delivered in 2020 and 2021, subject to clinical success and regulatory approval or authorization; (ii) with the U.S. government, under which the U.S. government will pay $1.95 billion, in installments as vaccine quantities are delivered, for the first 100 million doses of BNT162, subject to regulatory approval or Emergency Use Authorization from the FDA, as well as the ability for the U.S. government to acquire up to an additional 500 million doses; (iii) with the government of Japan to supply 120 million doses of BNT162, subject to clinical success and regulatory approval, beginning in 2021; and (iv) with the government of Canada to supply BNT162, subject to clinical success and Health Canada approval, over the course of 2021. For additional information on our collaboration with BioNTech, see the “Overview of Our Performance, Operating Environment, Strategy and Outlook––Our Business Development Initiatives” section of this MD&A and Notes to Condensed Consolidated Financial Statements––Note 2C. Acquisition, Equity-Method Investment and Licensing Arrangements: Licensing Arrangements. |
Despite our significant investments and efforts, our development programs for any potential treatment or vaccine for COVID-19 may not be successful as the risk of failure is significant and there can be no certainty these efforts will yield a successful product or that these costs will ultimately be recouped. In addition, we may change the way we approach or provide additional research funding for potential drug and/or vaccine development related to COVID-19. We will continue to share information from our research that could benefit the global effort to respond to this unprecedented healthcare crisis.
Impact of COVID-19 on Pfizer’s Business and Operations
We are continuing to monitor the latest developments regarding the COVID-19 pandemic on our business, operations, and financial condition and results, and have made certain assumptions regarding the pandemic for purposes of our operational planning and financial projections, including assumptions regarding the duration and severity of the pandemic and the global macroeconomic impact of the pandemic. For additional information, please also see our financial guidance set forth in the “Overview of Our Performance, Operating Environment, Strategy and Outlook––Our Financial Guidance for 2020” section of this MD&A. Despite careful tracking and planning, however, we are unable to accurately predict the extent of the impact of the pandemic on our business, operations and financial condition and results due to the uncertainty of future developments. In particular, we believe the ultimate impact on our business, operations and financial condition and results will be affected by the speed and extent of the continued spread of the coronavirus globally, the duration of the pandemic, new information that may emerge concerning the severity and incidence of COVID-19, the safety, efficacy and availability of a vaccine and treatments for COVID-19, the global macroeconomic impact of the pandemic and governmental or regulatory actions to contain the virus or control supply of medicines. We are focused on all aspects of our business and are implementing measures aimed at mitigating issues where possible, including by using digital technology to assist in operations for our commercial, manufacturing, R&D and enabling functions globally.
52
• | Our Colleagues. Our colleagues and customers have both experienced disruptions to the normal ways of working. At this time, our colleagues in most locations who are able to perform their job functions outside of our facilities continue to work remotely. Certain of our colleagues, primarily those in the Pfizer Global Supply and Worldwide Research and Development organizations, have roles for which their physical presence at our facilities is required to perform their job functions. These colleagues continue to report to work and are subject to strict protocols intended to reduce the risk of transmission, including social distancing, maintaining contact logs, increased cleaning and use of personal protective equipment as necessary. |
• | Our Sales and Marketing. We have experienced an impact on our sales and marketing activities due to widespread restrictions on in-person meetings with healthcare professionals and the refocused attention of the medical community on fighting COVID-19. Access to prescribers for sales force colleagues during the second quarter of 2020 was mixed, with those in most international markets able to meet with healthcare professionals for most of the quarter, while those in the U.S. were unable to meet in-person with healthcare professionals for nearly all of the quarter. At this time, no U.S. sales force colleagues are meeting in-person with healthcare professionals due to COVID-19-related safety concerns. We are actively reviewing and assessing epidemiological data and our colleagues remain ready to resume in-person engagements with healthcare professionals on a location-by-location basis as soon as it is safe to do so. |
As a result of the lower number of in-person meetings with prescribers and restrictions on patient movements due to government-mandated work-from-home or shelter-in-place policies, the rate of new prescriptions for certain products and of vaccination rates for most vaccines slowed in certain markets, which negatively impacted our second quarter 2020 financial results. These declines were partially offset by certain of our medicines and vaccines that saw increased demand in certain markets compared to the prior-year quarter, including Prevenar 13 for streptococcus pneumoniae in adults in international markets as well as certain sterile injectable products utilized in the intubation and ongoing treatment of mechanically-ventilated COVID-19 patients.
During the pandemic, we have adapted our promotional platform by amplifying our existing digital capabilities to reach healthcare professionals and customers to provide critical education and information, including increasing the scale of our remote engagement. All of our U.S. sales representatives are digitally enabled, and we are currently conducting virtual detailing and remote sampling, which has proven to be an efficient way to interact with healthcare providers during the crisis.
• | Our Manufacturing and Supply Chain. Our manufacturing and supply chain professionals have been working continuously in an effort to ensure continued patient access to our medicines and vaccines. Across our plant network, we have implemented our preparedness plan to control site operations. To date, we have not seen a significant disruption in our supply chain, and all of our manufacturing sites around the world have continued to operate at or near normal levels. So far, we have been able to mitigate distribution issues that have arisen, including by using newly available excess capacity in commercial airplanes to transport inventory. In addition, we have taken steps to scale up manufacturing operations at risk to accelerate our ability to supply a potential novel treatment or potential vaccine for COVID-19 if we receive regulatory approval. We are also committed to offering any excess manufacturing capacity and to potentially shifting production in order to support others’ efforts to manufacture any lifesaving breakthroughs that may be developed to combat COVID-19. |
• | Our Clinical Trials. After a brief pause to the recruitment portion of certain ongoing clinical studies and a delay to most new study starts, in late-April 2020 we restarted recruitment across the development portfolio, including new study starts. We continue to work closely with clinical trial sites to understand their needs and are performing remote monitoring, where appropriate, to oversee study conduct. In addition, processes to enable tele-health and home healthcare are being utilized where appropriate to continue the data collection process and support patient safety. |
• | Our Products. Our portfolio of products comprises medicines and vaccines which may experience varying impacts from the COVID-19 pandemic. Some of our products, such as Eliquis and Ibrance, are medically necessary but also more reliant on maintenance therapy with continuing patients in addition to new patients. Certain other products, such as Vyndaqel/Vyndamax, Chantix/Champix and products used in certain elective surgeries, are more reliant on new patient starts and typically require doctor visits, including wellness visits. Other medicines have been identified as medically necessary for treatment in the pandemic, such as certain of our Hospital sterile injectable products. A large proportion of our portfolio comprises oral or self-injected medicines that do not require a visit to an infusion center or a physician’s office for administration, but vaccines and physician-administered medicines which do require office visits were impacted by COVID-19-related mobility restrictions or limitations during the second quarter of 2020. Specialty pharmacy channels, from which we derive a majority of our revenue, enable direct delivery of these specialty medicines to patients. |
• | Our Financial Condition and Access to Capital Markets. Due to our significant operating cash flows, as well as our financial assets, access to capital markets and revolving credit agreements, we believe we have, and will maintain, the ability to meet liquidity needs for the foreseeable future. |
We will continue to pursue efforts to maintain the continuity of our operations while monitoring for new developments related to the COVID-19 pandemic, which are unpredictable. Future COVID-19 developments could result in additional favorable or unfavorable impacts on our business, operations or financial condition and results. If we experience significant disruption in our manufacturing or supply chains or significant disruptions in clinical trials or other operations, or if demand for our products is
53
ultimately significantly reduced as a result of the COVID-19 pandemic, we could experience a material adverse impact on our business, operations and financial condition and results. For additional information, please also see Part II, Item 1A, “Risk Factors” of this Quarterly Report on Form 10-Q.
For other global economic environment matters impacting our business, see the “Overview of Our Performance, Operating Environment, Strategy and Outlook––The Global Economic Environment” section of our 2019 Financial Report.
These and other industry-wide factors that may affect our businesses should be considered along with information presented in the “Forward-Looking Information and Factors That May Affect Future Results” section of this MD&A and in Part I, Item 1A, “Risk Factors” of our 2019 Form 10-K and Part II, Item 1A, “Risk Factors” of this Quarterly Report on Form 10-Q.
Our Strategy
We believe that our medicines provide significant value for both healthcare providers and patients, not only from the improved treatment of diseases but also from a reduction in other healthcare costs, such as emergency room or hospitalization costs, as well as improvements in health, wellness and productivity. We continue to actively engage in dialogues about the value of our medicines and how we can best work with patients, physicians and payers to prevent and treat disease and improve outcomes. We continue to work within the current legal and pricing structures, as well as continue to review our pricing arrangements and contracting methods with payers, to maximize patient access and minimize any adverse impact on our revenues. We remain firmly committed to fulfilling our Company’s purpose: Breakthroughs that change patients’ lives. By doing so, we expect to create value for the patients we serve and for our colleagues and shareholders. For a more comprehensive discussion of our strategy including additional discussion of certain items below, see the “Overview of Our Performance, Operating Environment, Strategy and Outlook––Our Strategy” section of our 2019 Financial Report.
Organizing for Growth
We believe we have one of the strongest pipelines we have had in over a decade, and believe we are well positioned for future growth. Additional patent expiries will continue over several years, and we expect the impact of reduced revenues due to patent expiries will be significant in 2020, then moderating downward to a much lower level from 2021 through 2025. This confluence of events has provided us an opportunity to look at and refine how we organize our business to best achieve sustainable growth and to deliver our medicines and vaccines to the maximum number of people who need them.
At the beginning of our fiscal year 2019, we began to manage our commercial operations through a new global structure consisting of three businesses, each led by a single manager—Pfizer Biopharmaceuticals Group (Biopharma), Upjohn and, through July 31, 2019, Pfizer’s Consumer Healthcare business. We designed this new global structure to take advantage of new growth opportunities driven by the evolving and unique dynamics of relevant markets. For additional information about each business, see Notes to Condensed Consolidated Financial Statements—Note 14A. Segment, Geographic and Other Revenue Information: Segment Information. As part of our Organizing for Growth initiative, we also reorganized our R&D operations, as explained in the “Overview of Our Performance, Operating Environment, Strategy and Outlook––Our Strategy––Organizing for Growth” section of our 2019 Financial Report.
Subsequent to the re-alignment of our commercial operations in 2019, on July 29, 2019, we announced that we entered into a definitive agreement to combine Upjohn with Mylan, creating a new global pharmaceutical company, Viatris. For additional information, see the “Overview of Our Performance, Operating Environment, Strategy and Outlook––Our Business Development Initiatives” section above in this MD&A. We believe the new company will transform and accelerate Upjohn’s and Mylan’s ability to serve patients’ needs and expand their capabilities across more than 165 markets. The combination will drive a sustainable, diverse and differentiated portfolio of prescription medicines, complex generics, over-the-counter products and biosimilars supported by commercial and regulatory expertise, established infrastructure, R&D capabilities and manufacturing and supply chain excellence.
As we prepare for expected growth, we are focused on creating a simpler, more efficient organization by streamlining structures, processes and governance within each business and the functions that support them. As our innovative pipeline matures based on anticipated progression of current trials and the initiation of new pivotal trials, including new trials for medicines we may acquire or in-license, we will need to increase our R&D investments. In addition, as our pipeline potentially delivers new commercialization opportunities, we will need to increase our investments in new-market-creation activities. We have initiated an enterprise-wide digital effort to accelerate drug development, enhance experiences (patient and physician) and access and leverage technology and robotics to simplify and automate our processes.
Transforming to a More Focused Company
With the formation of the GSK Consumer Healthcare joint venture and the anticipated combination of Upjohn, our global, primarily off-patent branded and generics business, with Mylan, Pfizer is transforming itself into a more focused, global leader in science-based innovative medicines. As a result, we began, in the fourth quarter of 2019, to identify and undertake efforts to ensure our cost base aligns appropriately with our Biopharmaceutical revenue base, which is expected to be 20% less (based on
54
the midpoint of the range for 2020 New Pfizer revenue guidance, compared to 2019 Total Company reported revenue) as a result of both the completed GSK Consumer Healthcare and expected Upjohn transactions. While certain direct costs have transferred or will transfer to the GSK Consumer Healthcare joint venture and to the Upjohn entities, there are indirect costs which are not expected to transfer. In addition, we are taking steps to restructure our organizations to appropriately support and drive the purpose of the three core functions of our focused innovative medicines business: R&D, Manufacturing and Commercial. For additional information, see the “Costs and Expenses––Restructuring Charges and Other Costs Associated with Acquisitions and Cost-Reduction/Productivity Initiatives” section of this MD&A.
Our Financial Guidance for 2020
On July 28, 2020, we increased our 2020 financial guidance for Total Company and New Pfizer revenues and Adjusted diluted EPS and reaffirmed all other financial guidance components.
The guidance reflects management’s current expectations for operational performance, foreign exchange rates as well as various COVID-19-related uncertainties, primarily those related to the severity, duration and global macroeconomic impact of the pandemic. Key guidance assumptions regarding these uncertainties broadly reflect an ongoing, gradual global recovery from the first half of 2020 macroeconomic and healthcare impacts of the COVID-19 pandemic. Specific COVID-19-related assumptions include:
▪ | Patient visits with physicians, vaccination rates and the number of elective surgical procedures will gradually increase from second-quarter 2020 levels, beginning in the third quarter of 2020; |
▪ | New-to-brand prescription trends for certain key products will gradually improve from second-quarter 2020 levels, beginning in the third quarter of 2020; |
▪ | Gradual improvement in access to U.S. healthcare professionals for sales force colleagues; |
▪ | Clinical trial enrollment, including new study starts, continues throughout the remainder of 2020; |
▪ | Pfizer’s manufacturing and supply chain activities continue to not be materially disrupted; and |
▪ | Pfizer’s investments in potential treatments and a potential vaccine for COVID-19 continue throughout 2020. |
However, updated financial guidance does not include any revenues from a potential COVID-19 vaccine.
Based on results to date and these assumptions for the remainder of the year, Pfizer increased its 2020 financial guidance for Total Company revenues and Adjusted diluted EPS and reaffirmed all other Total Company financial guidance components.
Pfizer’s updated 2020 financial guidance is presented below(a), (b): | |
Revenues | $48.6 to $50.6 billion |
(previously $48.5 to $50.5 billion) | |
Adjusted cost of sales as a percentage of revenues | 19.5% to 20.5% |
Adjusted selling, informational and administrative expenses | $11.5 to $12.5 billion |
Adjusted research and development expenses | $8.6 to $9.0 billion |
Adjusted other (income)/deductions | Approximately $800 million of income |
Effective tax rate on adjusted income | Approximately 15.0% |
Adjusted diluted EPS | $2.85 to $2.95 |
(previously $2.82 to $2.92) | |
(a) | The 2020 financial guidance reflects the following: |
• | Financial guidance for Total Company reflects a full-year 2020 contribution from Biopharma and Upjohn, the current construct of the company, and excludes any impact from the pending Upjohn combination with Mylan. |
• | Does not assume the completion of any business development transactions not completed as of June 28, 2020, including any one-time upfront payments associated with such transactions. |
• | Includes Pfizer’s pro rata share of the GSK Consumer Healthcare joint venture anticipated earnings, which is recorded in Adjusted other (income)/deductions on a one-quarter lag. Therefore, 2020 financial guidance for Adjusted other (income)/deductions and Adjusted diluted EPS reflects Pfizer’s share of the joint venture’s earnings that were generated in the fourth quarter of 2019 and in the first quarter of 2020 (recorded by Pfizer in the first six months of 2020) as well as Pfizer’s share of the joint venture’s projected earnings during the second and third quarters of 2020. |
• | Reflects an anticipated negative revenue impact of $2.4 billion due to recent and expected generic and biosimilar competition for certain products that have recently lost or are anticipated to soon lose patent protection. |
• | Exchange rates assumed are a blend of actual exchange rates in effect through second-quarter 2020 and mid-July 2020 rates for the remainder of the year. Financial guidance reflects the anticipated unfavorable impact of approximately $0.6 billion on revenues and approximately $0.05 on Adjusted diluted EPS as a result of changes in foreign exchange rates relative to the U.S. dollar compared to foreign exchange rates from 2019. |
• | Guidance for adjusted diluted EPS assumes diluted weighted-average shares outstanding of approximately 5.6 billion shares, which assumes no share repurchases in 2020. |
(b) | For an understanding of Adjusted income and its components and Adjusted diluted EPS (all of which are non-GAAP financial measures), see the “Non-GAAP Financial Measure (Adjusted Income)” section of this MD&A. |
55
Beginning in 2020, Upjohn began managing Pfizer’s Meridian subsidiary, the manufacturer of EpiPen and other auto-injector products, and a pre-existing strategic collaboration between Pfizer and Mylan for generic drugs in Japan (Mylan-Japan). As a result, revenues and expenses associated with Meridian and Mylan-Japan are reported in Pfizer’s Upjohn business beginning in the first quarter of 2020.
Pfizer, Upjohn and Mylan agreed (simultaneous with their entry into the transaction agreements governing the proposed combination of Upjohn and Mylan) to review and negotiate in good faith a potential transfer of Pfizer’s Meridian Medical Technologies business (the Meridian Business) to Upjohn, such that it would be sold to Mylan in the pending transaction for the Upjohn business. The Meridian Business supplies EpiPen Auto-Injectors to Mylan under a supply agreement expiring December 31, 2020 (the EpiPen Supply Agreement). Instead of entering into an agreement to transfer the Meridian Business to Mylan, the parties have agreed to extend the EpiPen Supply Agreement for an additional four-year period through December 31, 2024, with an option for Mylan to further extend the term for an additional one-year period thereafter.
Pfizer and Mylan have also reached a preliminary agreement on the general terms under which Pfizer would transfer certain Pfizer assets that currently form part of the Mylan-Japan collaboration to Mylan or, following the proposed combination of Upjohn and Mylan, to Viatris. Any such proposed transaction would be subject to the finalization and execution of a definitive agreement that would contain customary closing conditions, including but not limited to, receipt of any necessary regulatory approvals. There can be no assurance that any agreement or transaction will result from these negotiations, and if the parties are unsuccessful in their efforts to negotiate the terms of such potential transactions, the Pfizer assets that currently form part of the Mylan-Japan collaboration will remain with Pfizer.
2020 Financial Guidance for New Pfizer
2020 updated financial guidance for New Pfizer is presented below(a), (b): | |
Revenues | $40.8 to $42.4 billion |
(previously $40.7 to $42.3 billion) | |
Adjusted IBT Margin(c) | Approximately 37.0% |
Adjusted Diluted EPS | $2.28 to $2.38 |
(previously $2.25 to $2.35) | |
Operating Cash Flow(d) | $10.0 to $11.0 billion |
(a) | The financial guidance for New Pfizer reflects a full-year 2020 view of the company assuming the pending Upjohn combination with Mylan was completed at the beginning of 2020 and reflects contributions from the Biopharma business as it is presently being managed, which excludes contributions from Pfizer’s Meridian subsidiary and the Pfizer-Mylan strategic collaboration in Japan (Mylan-Japan). Pfizer’s Meridian subsidiary and Mylan-Japan were managed by Pfizer’s Biopharma business in 2019, but were moved to Upjohn in 2020. Financial guidance for New Pfizer also includes the full-year effect of the following items that assume the completion of the Upjohn combination with Mylan: (i) $12 billion of net proceeds from Upjohn to be retained by Pfizer, which Pfizer will use to repay its own existing indebtedness; and (ii) other transaction-related items, such as income from transition services agreements between Pfizer and Viatris. In addition, 2020 financial guidance for New Pfizer Adjusted IBT Margin and Adjusted diluted EPS reflects Pfizer’s share of the GSK Consumer Healthcare joint venture’s earnings that were generated in the fourth quarter of 2019 and in the first quarter of 2020 (recorded by Pfizer in the first six months of 2020), as well as Pfizer’s share of the GSK Consumer Healthcare joint venture’s projected earnings during the second and third quarters of 2020. |
(b) | For additional information regarding an understanding of Adjusted income and its components and Adjusted diluted EPS (all of which are non-GAAP financial measures), see the “Non-GAAP Financial Measure (Adjusted Income)” section of this MD&A. |
(c) | Adjusted income before tax margin (Adjusted IBT margin) is defined as revenue less the sum of Adjusted cost of sales, Adjusted SI&A expenses, Adjusted R&D expenses, Adjusted amortization of intangible assets and Adjusted other (income)/deductions as a percentage of revenue. Adjusted IBT margin is presented because management believes this performance measure supplements investors’ and other readers’ understanding and assessment of the financial performance of New Pfizer. Adjusted IBT margin is not, and should not be viewed as, a substitute for U.S. GAAP income before tax margin. |
(d) | Includes a $1.25 billion voluntary contribution to the U.S. qualified pension plans, planned for the second half of 2020. |
2020 Financial Guidance for Upjohn
2020 reaffirmed financial guidance for Upjohn is presented below(a): | |
Revenues | $8.0 to $8.5 billion |
Adjusted EBITDA(b) | $3.8 to $4.2 billion |
(a) | Financial guidance for Upjohn reflects a full-year 2020 contribution from the Upjohn business as it is presently being managed, which includes contributions from Pfizer’s Meridian subsidiary and the Pfizer-Mylan strategic collaboration in Japan (Mylan-Japan). Pfizer’s Meridian subsidiary and Mylan-Japan were managed by Pfizer’s Biopharma business in 2019 but were moved to Upjohn in 2020. |
(b) | Adjusted Earnings Before Interest, Tax, Depreciation and Amortization (EBITDA) is defined as reported U.S. GAAP net income, and its components, adjusted for interest expense, provision for taxes on income and depreciation and amortization, further adjusted to exclude purchase accounting adjustments, acquisition-related costs, discontinued operations and certain significant items (some of which may recur, such as gains on the completion of joint venture transactions, restructuring charges, legal charges or net gains and losses on equity securities, but which management does not believe are reflective of ongoing core operations). Adjusted EBITDA is presented because management believes this performance measure supplements investors’ and other readers’ understanding and assessment of the financial performance of Upjohn. Adjusted EBITDA as defined is not a measurement of financial performance under GAAP, and should not be considered as an alternative to net income or cash flow from operations determined in accordance with GAAP. |
56
Pfizer does not provide guidance for GAAP Reported financial measures (other than revenues) or a reconciliation of forward-looking non-GAAP financial measures to the most directly comparable GAAP Reported financial measures on a forward-looking basis because it is unable to predict with reasonable certainty the ultimate outcome of pending litigation, unusual gains and losses, acquisition-related expenses, gains and losses from equity securities and potential future asset impairments without unreasonable effort. These items are uncertain, depend on various factors, and could have a material impact on GAAP Reported results for the guidance period.
For information about our actual costs and anticipated costs and cost savings associated with our Transforming to a More Focused Company program, see the “Costs and Expenses––Restructuring Charges and Other Costs Associated with Acquisitions and Cost-Reduction/Productivity Initiatives” section of this MD&A and Notes to Condensed Consolidated Financial Statements––Note 3. Restructuring Charges and Other Costs Associated with Acquisitions and Cost-Reduction/Productivity Initiatives.
Our 2020 financial guidance is subject to a number of assumptions, as well as factors and uncertainties as described in the “Our Operating Environment”, “The Global Economic Environment”, “Our Strategy” and “Forward-Looking Information and Factors That May Affect Future Results” sections of this MD&A; Part I, Item 1A, “Risk Factors” of our 2019 Form 10-K, and Part II, Item 1A, “Risk Factors” of this Quarterly Report on Form 10-Q.
SIGNIFICANT ACCOUNTING POLICIES AND APPLICATION OF CRITICAL ACCOUNTING ESTIMATES AND ASSUMPTIONS
For a description of our significant accounting policies, see Notes to Consolidated Financial Statements––Note 1. Basis of Presentation and Significant Accounting Policies in our 2019 Financial Report. Of these policies, the following are considered critical to an understanding of our consolidated financial statements as they require the application of the most subjective and the most complex judgments: Acquisitions (Note 1D); Fair Value (Note 1E); Revenues (Note 1G); Asset Impairments (Note 1L); Tax Assets and Liabilities and Income Tax Contingencies (Note 1P); Pension and Postretirement Benefit Plans (Note 1Q); and Legal and Environmental Contingencies (Note 1R).
For a discussion about the critical accounting estimates and assumptions impacting our consolidated financial statements, see the “Significant Accounting Policies and Application of Critical Accounting Estimates and Assumptions” section of our 2019 Financial Report. See also Notes to Consolidated Financial Statements––Note 1C. Basis of Presentation and Significant Accounting Policies: Estimates and Assumptions in our 2019 Financial Report for a discussion about the risks associated with estimates and assumptions.
For a discussion of recently adopted accounting standards and significant accounting policies, see Notes to Condensed Consolidated Financial Statements––Note 1B. Basis of Presentation and Significant Accounting Policies: Adoption of New Accounting Standards in 2020 and Note 1C. Basis of Presentation and Significant Accounting Policies: Revenues and Trade Accounts Receivable.
57
ANALYSIS OF THE CONDENSED CONSOLIDATED STATEMENTS OF INCOME
The following table provides the components of the condensed consolidated statements of income: | ||||||||||||||||||||||
Three Months Ended | Six Months Ended | |||||||||||||||||||||
(MILLIONS OF DOLLARS, EXCEPT PER COMMON SHARE DATA) | June 28, 2020 | June 30, 2019 | % Change | June 28, 2020 | June 30, 2019 | % Change | ||||||||||||||||
Revenues | $ | 11,801 | $ | 13,264 | (11 | ) | $ | 23,829 | $ | 26,382 | (10 | ) | ||||||||||
Cost of sales(a) | 2,281 | 2,576 | (11 | ) | 4,658 | 5,009 | (7 | ) | ||||||||||||||
% of revenues | 19.3 | % | 19.4 | % | 19.5 | % | 19.0 | % | ||||||||||||||
Selling, informational and administrative expenses(a) | 3,030 | 3,511 | (14 | ) | 5,903 | 6,850 | (14 | ) | ||||||||||||||
% of revenues | 25.7 | % | 26.5 | % | 24.8 | % | 26.0 | % | ||||||||||||||
Research and development expenses(a) | 2,132 | 1,842 | 16 | 3,856 | 3,544 | 9 | ||||||||||||||||
% of revenues | 18.1 | % | 13.9 | % | 16.2 | % | 13.4 | % | ||||||||||||||
Amortization of intangible assets | 905 | 1,184 | (24 | ) | 1,790 | 2,367 | (24 | ) | ||||||||||||||
% of revenues | 7.7 | % | 8.9 | % | 7.5 | % | 9.0 | % | ||||||||||||||
Restructuring charges and certain acquisition-related costs | 362 | (115 | ) | * | 431 | (69 | ) | * | ||||||||||||||
% of revenues | 3.1 | % | (0.9 | )% | 1.8 | % | (0.3 | )% | ||||||||||||||
(Gain) on completion of Consumer Healthcare JV transaction | — | — | — | (6 | ) | — | * | |||||||||||||||
% of revenues | — | — | — | — | ||||||||||||||||||
Other (income)/deductions––net | (862 | ) | 126 | * | (641 | ) | 218 | * | ||||||||||||||
Income from continuing operations before provision/(benefit) for taxes on income | 3,953 | 4,141 | (5 | ) | 7,838 | 8,463 | (7 | ) | ||||||||||||||
% of revenues | 33.5 | % | 31.2 | % | 32.9 | % | 32.1 | % | ||||||||||||||
Provision/(benefit) for taxes on income | 519 | (915 | ) | * | 993 | (481 | ) | * | ||||||||||||||
Effective tax rate | 13.1 | % | (22.1 | )% | 12.7 | % | (5.7 | )% | ||||||||||||||
Income from continuing operations | 3,434 | 5,056 | (32 | ) | 6,845 | 8,945 | (23 | ) | ||||||||||||||
% of revenues | 29.1 | % | 38.1 | % | 28.7 | % | 33.9 | % | ||||||||||||||
Discontinued operations––net of tax | — | — | — | — | — | — | ||||||||||||||||
Net income before allocation to noncontrolling interests | 3,434 | 5,056 | (32 | ) | 6,845 | 8,945 | (23 | ) | ||||||||||||||
% of revenues | 29.1 | % | 38.1 | % | 28.7 | % | 33.9 | % | ||||||||||||||
Less: Net income attributable to noncontrolling interests | 8 | 10 | (19 | ) | 17 | 15 | 10 | |||||||||||||||
Net income attributable to Pfizer Inc. | $ | 3,426 | $ | 5,046 | (32 | ) | $ | 6,828 | $ | 8,929 | (24 | ) | ||||||||||
% of revenues | 29.0 | % | 38.0 | % | 28.7 | % | 33.8 | % | ||||||||||||||
Earnings per common share––basic: | ||||||||||||||||||||||
Income from continuing operations attributable to Pfizer Inc. common shareholders | $ | 0.62 | $ | 0.91 | (32 | ) | $ | 1.23 | $ | 1.59 | (23 | ) | ||||||||||
Net income attributable to Pfizer Inc. common shareholders | $ | 0.62 | $ | 0.91 | (32 | ) | $ | 1.23 | $ | 1.59 | (23 | ) | ||||||||||
Earnings per common share––diluted: | ||||||||||||||||||||||
Income from continuing operations attributable to Pfizer Inc. common shareholders | $ | 0.61 | $ | 0.89 | (31 | ) | $ | 1.22 | $ | 1.56 | (22 | ) | ||||||||||
Net income attributable to Pfizer Inc. common shareholders | $ | 0.61 | $ | 0.89 | (31 | ) | $ | 1.22 | $ | 1.56 | (22 | ) | ||||||||||
* Indicates calculation not meaningful or result is equal to or greater than 100%.
(a) | Excludes amortization of intangible assets, except as disclosed in Notes to Condensed Consolidated Financial Statements––Note 9A. Identifiable Intangible Assets and Goodwill: Identifiable Intangible Assets. |
58
Revenues by Operating Segment and Geography
The following graphs show revenues by operating segment and geography:
Second Quarter
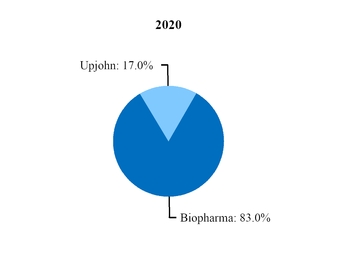

2020 Revenues by Geography | % of Total | |
U.S. | 46% | |
International | 54% | |
2019 Revenues by Geography | % of Total | |
U.S. | 48% | |
International | 52% | |
First Six Months
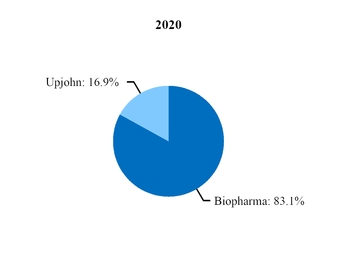
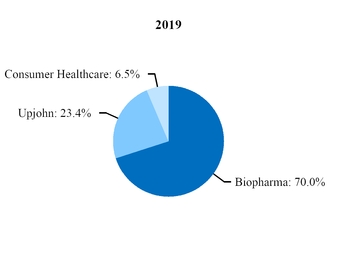
2020 Revenues by Geography | % of Total | |
U.S. | 46% | |
International | 54% | |
2019 Revenues by Geography | % of Total | |
U.S. | 47% | |
International | 53% | |
59
The following tables provide worldwide revenues by operating segment and geography: | |||||||||||||||||||||||||||||||||
Three Months Ended | |||||||||||||||||||||||||||||||||
Worldwide | U.S. | International | World-wide | U.S. | Inter-national | ||||||||||||||||||||||||||||
(MILLIONS OF DOLLARS) | June 28, 2020 | June 30, 2019 | June 28, 2020 | June 30, 2019 | June 28, 2020 | June 30, 2019 | % Change in Revenues | ||||||||||||||||||||||||||
Operating Segments(a): | |||||||||||||||||||||||||||||||||
Biopharma | $ | 9,795 | $ | 9,432 | $ | 5,045 | $ | 4,667 | $ | 4,750 | $ | 4,765 | 4 | 8 | — | ||||||||||||||||||
Upjohn | 2,006 | 2,970 | 357 | 1,245 | 1,648 | 1,725 | (32 | ) | (71 | ) | (4 | ) | |||||||||||||||||||||
Consumer Healthcare | — | 862 | — | 423 | — | 439 | (100 | ) | (100 | ) | (100 | ) | |||||||||||||||||||||
Total revenues | $ | 11,801 | $ | 13,264 | $ | 5,402 | $ | 6,335 | $ | 6,399 | $ | 6,929 | (11 | ) | (15 | ) | (8 | ) | |||||||||||||||
Six Months Ended | |||||||||||||||||||||||||||||||||
Worldwide | U.S. | International | World-wide | U.S. | Inter-national | ||||||||||||||||||||||||||||
(MILLIONS OF DOLLARS) | June 28, 2020 | June 30, 2019 | June 28, 2020 | June 30, 2019 | June 28, 2020 | June 30, 2019 | % Change in Revenues | ||||||||||||||||||||||||||
Operating Segments(a): | |||||||||||||||||||||||||||||||||
Biopharma | $ | 19,802 | $ | 18,477 | $ | 10,258 | $ | 9,128 | $ | 9,544 | $ | 9,349 | 7 | 12 | 2 | ||||||||||||||||||
Upjohn | 4,027 | 6,184 | 795 | 2,518 | 3,232 | 3,666 | (35 | ) | (68 | ) | (12 | ) | |||||||||||||||||||||
Consumer Healthcare | — | 1,721 | — | 864 | — | 857 | (100 | ) | (100 | ) | (100 | ) | |||||||||||||||||||||
Total revenues | $ | 23,829 | $ | 26,382 | $ | 11,053 | $ | 12,510 | $ | 12,776 | $ | 13,872 | (10 | ) | (12 | ) | (8 | ) | |||||||||||||||
(a) | For additional information about each operating segment, see the “Analysis of Operating Segment Information” section of this MD&A and Notes to Condensed Consolidated Financial Statements––Note 14A. Segment, Geographic and Other Revenue Information: Segment Information. |
60
Second Quarter of 2020 vs. Second Quarter of 2019
The following provides an analysis of the worldwide change in revenues by geographic areas in the second quarter of 2020: | ||||||||||||
Three Months Ended June 28, 2020 | ||||||||||||
(MILLIONS OF DOLLARS) | Worldwide | U.S. | International | |||||||||
Operational growth/(decline): | ||||||||||||
Continued growth from certain key brands(a) | $ | 351 | $ | 192 | $ | 159 | ||||||
Higher revenues for the rare disease business driven by the U.S. launches of Vyndaqel in May 2019 and Vyndamax in September 2019 for ATTR-CM; and in international markets, primarily driven by the March 2019 launch of the ATTR-CM indication in Japan and the February 2020 approval of the ATTR-CM indication in the EU | 175 | 128 | 47 | |||||||||
Higher revenues for Inlyta, primarily in the U.S., driven by increased demand resulting from the second quarter of 2019 U.S. FDA approvals for the combinations of certain immune checkpoint inhibitors plus Inlyta for the first-line treatment of patients with advanced RCC | 93 | 72 | 21 | |||||||||
Higher revenues for Biosimilars, primarily in the U.S., driven by strong volume performance from Retacrit and new product launches | 78 | 55 | 23 | |||||||||
Higher revenues for Xtandi primarily driven by continued strong demand in the metastatic and non-metastatic castration-resistant prostate cancer indications as well as the metastatic (mCSPC) castration-sensitive prostate cancer indication, which was approved in the U.S. in December 2019 | 64 | 64 | — | |||||||||
Growth in revenues for Lipitor and Norvasc, reflecting significant revenue declines in the prior-year period associated with the VBP program in China, which was initially implemented in certain cities in March 2019, and expanded nationwide beginning in December 2019, resulting in significant volume and price erosion | 55 | 10 | 45 | |||||||||
Lower revenues for Consumer Healthcare reflecting the July 31, 2019 completion of the Consumer Healthcare joint venture transaction with GSK. As a result, for the second quarter of 2019, revenues reflect three months of Consumer Healthcare segment operations, while for the second quarter of 2020, there is no contribution from the Consumer Healthcare business | (862 | ) | (423 | ) | (439 | ) | ||||||
Lower worldwide revenues for Lyrica, primarily in the U.S., reflecting the expected significantly lower volumes associated with multi-source generic competition that began in the U.S. in July 2019 | (826 | ) | (784 | ) | (42 | ) | ||||||
Lower revenues for Enbrel internationally, primarily reflecting continued biosimilar competition in most developed Europe markets, as well as in Japan and Brazil, all of which is expected to continue | (66 | ) | — | (66 | ) | |||||||
Decline in revenues for Revatio driven by lower U.S. Oral Suspension formulation sales and pricing pressures due to multi-source generic competition | (34 | ) | (33 | ) | (1 | ) | ||||||
Decline in Prevnar 13/Prevenar 13 revenues primarily in the U.S., reflecting the expected unfavorable impact of disruptions to wellness visits for pediatric and adult patients due to COVID-19-related mobility restrictions or limitations, partially offset by the favorable impact of timing associated with government purchases for the pediatric indication, compared to the prior-year period. The decline in the U.S. was partially offset by growth in international markets primarily reflecting significantly increased adult uptake in Germany and certain other markets resulting from greater vaccine awareness for respiratory illnesses, including specifically pneumococcal disease, due to the COVID-19 pandemic, as well as continued strong pediatric uptake in China | (28 | ) | (132 | ) | 103 | |||||||
Other operational factors, net | (185 | ) | (82 | ) | (103 | ) | ||||||
Operational growth/(decline), net | (1,186 | ) | (933 | ) | (253 | ) | ||||||
Unfavorable impact of foreign exchange | (277 | ) | — | (277 | ) | |||||||
Revenues decrease | $ | (1,463 | ) | $ | (933 | ) | $ | (530 | ) | |||
(a) | Certain key brands represent Ibrance, Eliquis and Xeljanz. See the “Analysis of the Condensed Consolidated Statements of Income––Revenues––Selected Product Discussion” section of this MD&A for product analysis information. |
Revenues for the second quarter of 2020 included an estimated net unfavorable impact of approximately $500 million, or 4%, due to COVID-19, primarily reflecting unfavorable disruptions to wellness visits for pediatric and adult patients in the U.S. and lower demand for certain products in China, partially offset by increased U.S. demand for certain sterile injectable products as well as increased adult demand for Prevenar 13 in certain international markets.
Emerging markets revenues decreased $303 million, or 10%, in the second quarter of 2020 to $2.8 billion from $3.1 billion in the second quarter of 2019, reflecting an operational decrease of $95 million, or 3%, and an unfavorable impact from foreign exchange of approximately 7%. The operational decrease in emerging markets was primarily driven by lower revenues for
61
Consumer Healthcare reflecting the July 31, 2019 completion of the Consumer Healthcare joint venture transaction with GSK and Sulperazon, in our Biopharma segment, partially offset primarily by growth from Prevenar 13 and Eliquis in our Biopharma segment and Lipitor and Norvasc in our Upjohn segment.
Revenues––First Six Months of 2020 vs. First Six Months of 2019
The following provides an analysis of the change in worldwide revenues by geographic areas in the first six months of 2020: | ||||||||||||
Six Months Ended June 28, 2020 | ||||||||||||
(MILLIONS OF DOLLARS) | Worldwide | U.S. | International | |||||||||
Operational growth/(decline): | ||||||||||||
Continued growth from certain key brands(a) | $ | 812 | $ | 494 | $ | 318 | ||||||
Higher revenues for the rare disease business driven by the U.S. launches of Vyndaqel in May 2019 and Vyndamax in September 2019 for ATTR-CM; and in international markets, primarily driven by the March 2019 launch of the ATTR-CM indication in Japan and the February 2020 approval of the ATTR-CM indication in the EU | 353 | 268 | 85 | |||||||||
Higher revenues for the Hospital business in the U.S., primarily driven by increased demand for certain sterile injectable products utilized in the intubation and ongoing treatment of mechanically-ventilated COVID-19 patients as well as continued growth from Panzyga following its November 2018 U.S. launch | 212 | 207 | 6 | |||||||||
Higher revenues for Inlyta, primarily in the U.S., driven by increased demand resulting from the second quarter of 2019 U.S. FDA approvals for the combinations of certain immune checkpoint inhibitors plus Inlyta for the first-line treatment of patients with advanced RCC | 191 | 155 | 35 | |||||||||
Higher revenues for Biosimilars, primarily in the U.S., driven by strong volume performance from Retacrit, new product launches and steady volume and share growth in the U.S. for Inflectra, across hospital channels, clinics and alternate sites of care | 190 | 149 | 41 | |||||||||
Higher revenues for Xtandi primarily driven by continued strong demand in the metastatic and non-metastatic castration-resistant prostate cancer indications as well as the metastatic (mCSPC) castration-sensitive prostate cancer indication, which was approved in the U.S. in December 2019 | 106 | 106 | — | |||||||||
Lower revenues for Consumer Healthcare reflecting the July 31, 2019 completion of the Consumer Healthcare joint venture transaction with GSK. As a result, for the first six months of 2019, revenues reflect six months of Consumer Healthcare segment operations, while for the first six months of 2020, there is no contribution from the Consumer Healthcare business | (1,721 | ) | (864 | ) | (857 | ) | ||||||
Lower worldwide revenues for Lyrica, primarily in the U.S., reflecting the expected significantly lower volumes associated with multi-source generic competition that began in the U.S. in July 2019 | (1,655 | ) | (1,592 | ) | (63 | ) | ||||||
Declines in revenues for Lipitor and Norvasc, primarily resulting from the VBP program in China, which was initially implemented in certain cities in March 2019, and expanded nationwide beginning in December 2019, resulting in significant volume and price erosion | (254 | ) | 12 | (266 | ) | |||||||
Lower revenues for Enbrel internationally, primarily reflecting continued biosimilar competition in most developed Europe markets, as well as in Brazil and Japan, all of which is expected to continue | (159 | ) | — | (159 | ) | |||||||
Decline in revenues for Revatio driven by lower U.S. Oral Suspension formulation sales and pricing pressures due to multi-source generic competition | (58 | ) | (55 | ) | (2 | ) | ||||||
Decline in Prevnar 13/Prevenar 13 revenues primarily in the U.S., reflecting the expected unfavorable impact of disruptions to wellness visits for pediatric and adult patients due to COVID-19-related mobility restrictions or limitations, partially offset by the favorable impact of timing associated with government purchases for the pediatric indication, compared to the prior-year period. The decline in the U.S. was partially offset by growth in international markets primarily reflecting significantly increased adult uptake in Germany and certain other markets resulting from greater vaccine awareness for respiratory illnesses, including specifically pneumococcal disease, due to the COVID-19 pandemic, as well as continued strong pediatric uptake in China | (47 | ) | (215 | ) | 169 | |||||||
Other operational factors, net | (113 | ) | (121 | ) | 8 | |||||||
Operational growth/(decline), net | (2,141 | ) | (1,457 | ) | (684 | ) | ||||||
Unfavorable impact of foreign exchange | (411 | ) | — | (411 | ) | |||||||
Revenues decrease | $ | (2,552 | ) | $ | (1,457 | ) | $ | (1,096 | ) | |||
62
(a) | Certain key brands represent Ibrance, Eliquis and Xeljanz. See the “Analysis of the Condensed Consolidated Statements of Income––Revenues––Selected Product Discussion” section of this MD&A for product analysis information. |
Revenues for the first six months of 2020 included an estimated net unfavorable impact of approximately $350 million, or 1%, due to COVID-19, primarily reflecting unfavorable disruptions to wellness visits for pediatric and adult patients in the U.S. and lower demand for certain products in China, partially offset by increased U.S. demand for certain sterile injectable products as well as increased adult demand for Prevenar 13 in certain international markets.
Emerging markets revenues decreased $624 million, or 10%, in the first six months of 2020 to $5.8 billion from $6.4 billion in the first six months of 2019, reflecting an operational decrease of $328 million, or 5%. Foreign exchange had an unfavorable impact of approximately 5% on emerging markets revenues. The operational decrease in emerging markets was primarily driven by lower revenues for Consumer Healthcare reflecting the July 31, 2019 completion of the Consumer Healthcare joint venture transaction with GSK, Lipitor and Norvasc in our Upjohn segment and Sulperazon in our Biopharma segment, partially offset by growth from Prevenar 13, Eliquis, certain anti-infective products, primarily Zavicefta and Zithromax, Ibrance and Xalkori in our Biopharma segment.
Revenue Deductions
Our gross product revenues are subject to a variety of deductions, which generally are estimated and recorded in the same period that the revenues are recognized. Such variable consideration represents chargebacks, rebates, sales allowances and sales returns. These deductions represent estimates of related obligations and, as such, knowledge and judgment are required when estimating the impact of these revenue deductions on gross sales for a reporting period. Historically, our adjustments of estimates, to reflect actual results or updated expectations, have not been material to our overall business. On a quarterly basis, our adjustments of estimates to reflect actual results generally have been less than 1% of revenues, and have resulted in either a net increase or a net decrease in revenues. Product-specific rebates, however, can have a significant impact on year-over-year individual product growth trends.
The following table provides information about revenue deductions: | ||||||||||||||||
Three Months Ended | Six Months Ended | |||||||||||||||
(MILLIONS OF DOLLARS) | June 28, 2020 | June 30, 2019 | June 28, 2020 | June 30, 2019 | ||||||||||||
Medicare rebates(a) | $ | 164 | $ | 351 | $ | 359 | $ | 785 | ||||||||
Medicaid and related state program rebates(a) | 317 | 459 | 634 | 1,028 | ||||||||||||
Performance-based contract rebates(a), (b) | 972 | 972 | 1,882 | 1,861 | ||||||||||||
Chargebacks(c) | 1,368 | 1,368 | 2,787 | 2,924 | ||||||||||||
Sales allowances(d) | 1,236 | 1,454 | 2,666 | 2,814 | ||||||||||||
Sales returns and cash discounts | 271 | 477 | 542 | 804 | ||||||||||||
Total(e) | $ | 4,329 | $ | 5,082 | $ | 8,871 | $ | 10,216 | ||||||||
(a) | Rebates are product-specific and, therefore, for any given year are impacted by the mix of products sold. |
(b) | Performance-based contract rebates include contract rebates with MCOs within the U.S., including health maintenance organizations and PBMs, who receive rebates based on the achievement of contracted performance terms and claims under these contracts. Outside the U.S., performance-based contract rebates include rebates to wholesalers/distributors based on achievement of contracted performance for specific products or sales milestones. |
(c) | Chargebacks primarily represent reimbursements to U.S. wholesalers for honoring contracted prices to third parties. |
(d) | Sales allowances primarily represent price reductions that are contractual or legislatively mandated outside the U.S., discounts and distribution fees. |
(e) | For the three months ended June 28, 2020, associated with the following segments: Biopharma ($3.2 billion) and Upjohn ($1.1 billion). For the three months ended June 30, 2019, associated with the following segments: Biopharma ($3.0 billion), Upjohn ($1.9 billion) and Other ($0.2 billion). For the six months ended June 28, 2020, associated with the following segments: Biopharma ($6.6 billion) and Upjohn ($2.3 billion). For the six months ended June 30, 2019, associated with the following segments: Biopharma ($5.7 billion), Upjohn ($4.2 billion) and Other ($0.3 billion). |
Total revenue deductions for the second quarter of 2020 decreased 15%, compared to the second quarter of 2019, and total revenue deductions for the first six months of 2020 decreased 13%, compared to the first six months of 2019, primarily as a result of:
• | a decrease in Medicaid and Medicare rebates, driven by a significant decrease in Lyrica sales in the U.S. due to multi-source generic competition that began in July 2019; and |
• | a decrease in sales returns and cash discounts, primarily due to the non-recurrence of a sales return reserve recorded for Lyrica in the prior year in advance of anticipated multi-source generic competition that began in the U.S. in July 2019. |
For information on our accruals for Medicare rebates, Medicaid and related state program rebates, performance-based contract rebates, chargebacks, sales allowances and sales returns and cash discounts, including the balance sheet classification of these accruals, see Notes to Condensed Consolidated Financial Statements––Note 1C. Basis of Presentation and Significant Accounting Policies: Revenues and Trade Accounts Receivable.
63
Revenues––Selected Product Discussion
The tables below provide worldwide revenues and revenues by geography, for selected products. References to total change pertain to period-over-period growth rates that include foreign exchange. The difference between the total change and operational change represents the impact of foreign exchange. Amounts may not add due to rounding. All percentages have been calculated using unrounded amounts. An asterisk (*) indicates the calculation is not meaningful or results are equal to or greater than 100%.
• | Ibrance (Biopharma): |
Three Months Ended | Six Months Ended | ||||||||||||||||||||||||
% Change | % Change | ||||||||||||||||||||||||
(MILLIONS OF DOLLARS) | June 28, 2020 | June 30, 2019 | Total | Oper. | June 28, 2020 | June 30, 2019 | Total | Oper. | |||||||||||||||||
U.S. | $ | 927 | $ | 831 | 11 | $ | 1,779 | $ | 1,572 | 13 | |||||||||||||||
International | 422 | 430 | (2 | ) | 3 | 819 | 822 | — | 4 | ||||||||||||||||
Worldwide revenues | $ | 1,349 | $ | 1,261 | 7 | 9 | $ | 2,598 | $ | 2,394 | 9 | 10 | |||||||||||||
The operational growth in the second quarter and first six months of 2020 in the U.S. was mainly driven by increased cyclin-dependent kinase (CDK) class penetration and Ibrance’s continued CDK market share leadership in metastatic breast cancer. The operational growth in the second quarter and first six months of 2020 internationally reflects the continued strong volume growth in most markets, partially offset by pricing pressures in certain developed Europe markets.
• | Eliquis alliance revenues and direct sales (Biopharma): Eliquis has been jointly developed and is commercialized by Pfizer and BMS. Pfizer funds between 50% and 60% of all development costs depending on the study. Profits and losses are shared equally on a global basis, except in certain countries where Pfizer commercializes Eliquis and pays BMS compensation based on a percentage of net sales. We have full commercialization rights in certain smaller markets. BMS supplies the product to us at cost plus a percentage of the net sales to end-customers in these markets. Eliquis is part of the Novel Oral Anticoagulant market; the agents in this class were developed as alternative treatment options to warfarin in appropriate patients. |
Three Months Ended | Six Months Ended | |||||||||||||||||||||||
% Change | % Change | |||||||||||||||||||||||
(MILLIONS OF DOLLARS) | June 28, 2020 | June 30, 2019 | Total | Oper. | June 28, 2020 | June 30, 2019 | Total | Oper. | ||||||||||||||||
U.S. | $ | 722 | $ | 626 | 15 | $ | 1,527 | $ | 1,227 | 24 | ||||||||||||||
International | 550 | 459 | 20 | 25 | 1,045 | 869 | 20 | 24 | ||||||||||||||||
Worldwide revenues | $ | 1,272 | $ | 1,085 | 17 | 19 | $ | 2,572 | $ | 2,096 | 23 | 24 | ||||||||||||
The worldwide operational growth in the second quarter and first six months of 2020 was primarily driven by higher demand due to continued adoption in non-valvular atrial fibrillation as well as oral anti-coagulant market share gains, partially offset by a lower net price. In the second quarter of 2020, U.S. growth was also unfavorably impacted by a lower net price and COVID-19-related wholesaler buying patterns.
• | Prevnar 13/Prevenar 13 (Biopharma): |
Three Months Ended | Six Months Ended | |||||||||||||||||||||||||||
% Change | % Change | |||||||||||||||||||||||||||
(MILLIONS OF DOLLARS) | June 28, 2020 | June 30, 2019 | Total | Oper. | June 28, 2020 | June 30, 2019 | Total | Oper. | ||||||||||||||||||||
U.S. | $ | 481 | $ | 612 | (22 | ) | $ | 1,275 | $ | 1,490 | (14 | ) | ||||||||||||||||
International | 636 | 567 | 12 | 18 | 1,291 | 1,175 | 10 | 14 | ||||||||||||||||||||
Worldwide revenues | $ | 1,116 | $ | 1,179 | (5 | ) | (2 | ) | $ | 2,566 | $ | 2,665 | (4 | ) | (2 | ) | ||||||||||||
The decline in the second quarter and first six months of 2020 in the U.S. primarily reflects the expected unfavorable impact of disruptions to wellness visits for pediatric and adult patients due to COVID-19-related mobility restrictions or limitations, partially offset by the favorable impact of timing associated with government purchases for the pediatric indication, compared to the prior-year period.
The operational growth in the second quarter and first six months of 2020 internationally primarily reflects significantly increased adult uptake in Germany and certain other markets resulting from greater vaccine awareness for respiratory illnesses, including specifically pneumococcal disease, due to the COVID-19 pandemic, as well as continued strong pediatric uptake in China.
On June 26, 2019, the ACIP voted to revise the pneumococcal vaccination guidelines and recommend Prevnar 13 for adults 65 and older based on the shared clinical decision making of the provider and patient, which means the decision to
64
vaccinate should be made at the individual level between health care providers and their patients, maintaining reimbursement. The recommendation reaffirms that there remains vaccine preventable pneumococcal disease in the population of adults 65 years or older, which may be prevented through direct vaccination. The ACIP’s recommendation was approved by the directors at the CDC and U.S. Department of Health and Human Services, and published by the CDC in the Morbidity and Mortality Weekly Report in the fourth quarter of 2019. The ACIP’s latest recommendation did not have an impact on Prevnar 13 revenues in 2019, due to timing of the Morbidity and Mortality Weekly Report publication, nor was there impact in the first half of 2020. We expect Prevnar 13 revenues from the adult indication to decline through the remainder of the year.
• | Xeljanz (Biopharma): |
Three Months Ended | Six Months Ended | ||||||||||||||||||||||||
% Change | % Change | ||||||||||||||||||||||||
(MILLIONS OF DOLLARS) | June 28, 2020 | June 30, 2019 | Total | Oper. | June 28, 2020 | June 30, 2019 | Total | Oper. | |||||||||||||||||
U.S. | $ | 458 | $ | 458 | — | $ | 744 | $ | 756 | (2 | ) | ||||||||||||||
International | 177 | 155 | 14 | 20 | 343 | 279 | 23 | 28 | |||||||||||||||||
Worldwide revenues | $ | 635 | $ | 613 | 4 | 5 | $ | 1,086 | $ | 1,036 | 5 | 6 | |||||||||||||
U.S. revenue was flat in the second quarter of 2020 and declined in the first six months of 2020 primarily due to a lower net price due to higher rebating from commercial contracts signed in 2019. These declines were offset by continued strong demand across all approved indications.
The operational growth internationally in the second quarter and first six months of 2020 was mainly driven by continued uptake in the RA indication and, to a lesser extent, from the recent launch of the UC indication in certain developed markets.
• | Lipitor (Upjohn): |
Three Months Ended | Six Months Ended | |||||||||||||||||||||||||
% Change | % Change | |||||||||||||||||||||||||
(MILLIONS OF DOLLARS) | June 28, 2020 | June 30, 2019 | Total | Oper. | June 28, 2020 | June 30, 2019 | Total | Oper. | ||||||||||||||||||
U.S. | $ | 43 | $ | 30 | 44 | $ | 67 | $ | 51 | 33 | ||||||||||||||||
International | 388 | 377 | 3 | 7 | 768 | 979 | (21 | ) | (19 | ) | ||||||||||||||||
Worldwide revenues | $ | 431 | $ | 407 | 6 | 10 | $ | 836 | $ | 1,029 | (19 | ) | (16 | ) | ||||||||||||
The worldwide operational growth in the second quarter primarily reflects significant revenue declines in the prior-year period associated with the VBP program in China, which was initially implemented in certain cities in March 2019, and expanded nationwide beginning in December 2019, resulting in significant volume and price erosion. The worldwide operational decline in the first six months of 2020 primarily resulted from the VBP program mentioned above.
• | Lyrica (Upjohn): |
Three Months Ended | Six Months Ended | |||||||||||||||||||||||||||
% Change | % Change | |||||||||||||||||||||||||||
(MILLIONS OF DOLLARS) | June 28, 2020 | June 30, 2019 | Total | Oper. | June 28, 2020 | June 30, 2019 | Total | Oper. | ||||||||||||||||||||
U.S. | $ | 51 | $ | 835 | (94 | ) | $ | 132 | $ | 1,724 | (92 | ) | ||||||||||||||||
International | 298 | 340 | (13 | ) | (12 | ) | 574 | 638 | (10 | ) | (10 | ) | ||||||||||||||||
Worldwide revenues | $ | 349 | $ | 1,175 | (70 | ) | (70 | ) | $ | 706 | $ | 2,362 | (70 | ) | (70 | ) | ||||||||||||
The worldwide decline in the second quarter and first six months of 2020 was primarily driven by the U.S. due to the expected significantly lower volumes driven by multi-source generic competition that began in the U.S. in July 2019.
• | Enbrel (Biopharma, outside the U.S. and Canada): |
Three Months Ended | Six Months Ended | |||||||||||||||||||||||||||
% Change | % Change | |||||||||||||||||||||||||||
(MILLIONS OF DOLLARS) | June 28, 2020 | June 30, 2019 | Total | Oper. | June 28, 2020 | June 30, 2019 | Total | Oper. | ||||||||||||||||||||
U.S. | $ | — | $ | — | — | $ | — | $ | — | — | ||||||||||||||||||
International | 337 | 420 | (20 | ) | (16 | ) | 684 | 871 | (21 | ) | (18 | ) | ||||||||||||||||
Worldwide revenues | $ | 337 | $ | 420 | (20 | ) | (16 | ) | $ | 684 | $ | 871 | (21 | ) | (18 | ) | ||||||||||||
65
The worldwide operational decline in the second quarter and first six months of 2020 was primarily due to continued biosimilar competition in most developed Europe markets as well as in Brazil and Japan, all of which is expected to continue.
• | Vyndaqel/Vyndamax (Biopharma): |
Three Months Ended | Six Months Ended | |||||||||||||||||||||||
% Change | % Change | |||||||||||||||||||||||
(MILLIONS OF DOLLARS) | June 28, 2020 | June 30, 2019 | Total | Oper. | June 28, 2020 | June 30, 2019 | Total | Oper. | ||||||||||||||||
U.S. | $ | 145 | $ | 8 | * | $ | 272 | $ | 8 | * | ||||||||||||||
International | 131 | 55 | * | * | 236 | 96 | * | * | ||||||||||||||||
Worldwide revenues | $ | 277 | $ | 63 | * | * | $ | 508 | $ | 104 | * | * | ||||||||||||
The growth in the U.S. in the second quarter and first six months of 2020 was driven by the launches of Vyndaqel in May 2019 and Vyndamax in September 2019 for the treatment of ATTR-CM. The operational growth in international markets in the second quarter and first six months of 2020 was primarily driven by the March 2019 launch of the ATTR-CM indication in Japan and the February 2020 approval of the ATTR-CM indication in the EU.
• | Chantix/Champix (Biopharma): |
Three Months Ended | Six Months Ended | |||||||||||||||||||||||||||
% Change | % Change | |||||||||||||||||||||||||||
(MILLIONS OF DOLLARS) | June 28, 2020 | June 30, 2019 | Total | Oper. | June 28, 2020 | June 30, 2019 | Total | Oper. | ||||||||||||||||||||
U.S. | $ | 179 | $ | 227 | (21 | ) | $ | 390 | $ | 439 | (11 | ) | ||||||||||||||||
International | 56 | 49 | 15 | 20 | 115 | 110 | 5 | 8 | ||||||||||||||||||||
Worldwide revenues | $ | 235 | $ | 276 | (15 | ) | (14 | ) | $ | 505 | $ | 549 | (8 | ) | (7 | ) | ||||||||||||
The worldwide operational revenue decline in the second quarter and first six months of 2020 was driven by the U.S. and primarily reflects expected lower demand resulting from reduced doctor visits, including wellness visits when Chantix is typically prescribed, due to COVID-19-related mobility restrictions or limitations. The decline was partially offset by increased demand in Spain as a result of government reimbursement starting in January 2020.
• | Xtandi alliance revenues (Biopharma): Xtandi is being developed and commercialized through a collaboration with Astellas. The two companies share equally in the gross profits (losses) related to U.S. net sales of Xtandi. Subject to certain exceptions, Pfizer and Astellas also share equally all Xtandi commercialization costs attributable to the U.S. market. Pfizer and Astellas also share certain development and other collaboration expenses, and Pfizer receives tiered royalties as a percentage of international Xtandi net sales (recorded in Other (income)/deductions—net). |
Three Months Ended | Six Months Ended | |||||||||||||||||||||||
% Change | % Change | |||||||||||||||||||||||
(MILLIONS OF DOLLARS) | June 28, 2020 | June 30, 2019 | Total | Oper. | June 28, 2020 | June 30, 2019 | Total | Oper. | ||||||||||||||||
U.S. | $ | 266 | $ | 201 | 32 | $ | 475 | $ | 369 | 29 | ||||||||||||||
International | — | — | — | — | — | — | — | — | ||||||||||||||||
Worldwide revenues | $ | 266 | $ | 201 | 32 | 32 | $ | 475 | $ | 369 | 29 | 29 | ||||||||||||
The growth in the U.S. in the second quarter and first six months of 2020 was primarily driven by continued strong demand for Xtandi in the metastatic (mCRPC) and non-metastatic (nmCRPC) castration-resistant prostate cancer indications, as well as the metastatic (mCSPC) castration-sensitive prostate cancer indication, which was approved in the U.S. in December 2019.
• | Norvasc (Upjohn): |
Three Months Ended | Six Months Ended | ||||||||||||||||||||||||||
% Change | % Change | ||||||||||||||||||||||||||
(MILLIONS OF DOLLARS) | June 28, 2020 | June 30, 2019 | Total | Oper. | June 28, 2020 | June 30, 2019 | Total | Oper. | |||||||||||||||||||
U.S. | $ | 7 | $ | 11 | (32 | ) | $ | 16 | $ | 21 | (23 | ) | |||||||||||||||
International | 215 | 205 | 5 | 9 | 403 | 495 | (19 | ) | (16 | ) | |||||||||||||||||
Worldwide revenues | $ | 222 | $ | 216 | 3 | 7 | $ | 419 | $ | 516 | (19 | ) | (16 | ) | |||||||||||||
The worldwide operational growth in the second quarter of 2020 reflects significant revenue declines in the prior-year period associated with the VBP program in China, which was initially implemented in certain cities in March 2019, and
66
expanded nationwide beginning in December 2019, resulting in significant volume and price erosion. The worldwide operational decline in the first six months of 2020 primarily resulted from the VBP program mentioned above.
• | Sutent (Biopharma): |
Three Months Ended | Six Months Ended | |||||||||||||||||||||||||||
% Change | % Change | |||||||||||||||||||||||||||
(MILLIONS OF DOLLARS) | June 28, 2020 | June 30, 2019 | Total | Oper. | June 28, 2020 | June 30, 2019 | Total | Oper. | ||||||||||||||||||||
U.S. | $ | 61 | $ | 82 | (26 | ) | $ | 113 | $ | 153 | (26 | ) | ||||||||||||||||
International | 148 | 166 | (11 | ) | (6 | ) | 301 | 327 | (8 | ) | (4 | ) | ||||||||||||||||
Worldwide revenues | $ | 209 | $ | 248 | (16 | ) | (13 | ) | $ | 414 | $ | 480 | (14 | ) | (11 | ) | ||||||||||||
The worldwide operational decline in the second quarter and first six months of 2020 reflects continued erosion as a result of increased competition in the U.S. and key international developed markets, partially offset by growth in certain emerging markets.
• | Inlyta (Biopharma): |
Three Months Ended | Six Months Ended | |||||||||||||||||||||||
% Change | % Change | |||||||||||||||||||||||
(MILLIONS OF DOLLARS) | June 28, 2020 | June 30, 2019 | Total | Oper. | June 28, 2020 | June 30, 2019 | Total | Oper. | ||||||||||||||||
U.S. | $ | 132 | $ | 60 | * | $ | 248 | $ | 93 | * | ||||||||||||||
International | 63 | 44 | 43 | 48 | 116 | 84 | 38 | 42 | ||||||||||||||||
Worldwide revenues | $ | 195 | $ | 104 | 87 | 89 | $ | 364 | $ | 177 | * | * | ||||||||||||
The worldwide operational growth in the second quarter and first six months of 2020 was primarily due to increased demand in the U.S. from the FDA approvals in the second quarter of 2019 for combinations of certain immune checkpoint inhibitors plus Inlyta for the first-line treatment of patients with advanced RCC.
• | Inflectra/Remsima (Biopharma): |
Three Months Ended | Six Months Ended | ||||||||||||||||||||||||||
% Change | % Change | ||||||||||||||||||||||||||
(MILLIONS OF DOLLARS) | June 28, 2020 | June 30, 2019 | Total | Oper. | June 28, 2020 | June 30, 2019 | Total | Oper. | |||||||||||||||||||
U.S. | $ | 72 | $ | 74 | (3 | ) | $ | 156 | $ | 132 | 18 | ||||||||||||||||
International | 78 | 78 | — | 5 | 153 | 159 | (4 | ) | (1 | ) | |||||||||||||||||
Worldwide revenues | $ | 150 | $ | 153 | (2 | ) | 1 | $ | 308 | $ | 291 | 6 | 8 | ||||||||||||||
The worldwide operational revenue growth in the second quarter and first six months of 2020 was primarily driven by switch-to-biosimilar products policies implemented in Canada and steady volume and share growth in the U.S. across hospital channels, clinics and alternate sites of care, partially offset by pricing pressures globally as well as competitive pressures internationally.
While Inflectra has achieved parity access to Remicade® (infliximab) in Medicare Part B, in the U.S., nearly half of all commercial patients are not able to access Inflectra due to exclusionary conduct by J&J. In September 2017, Pfizer filed suit in the U.S. District Court for the Eastern District of Pennsylvania against J&J alleging that J&J’s exclusionary contracts and other anticompetitive practices concerning Remicade violate federal antitrust laws. In June 2019, Pfizer received a Civil Investigative Demand from the Federal Trade Commission (FTC) seeking documents and information relating to the alleged conduct and market conditions at issue in Pfizer’s lawsuit against J&J. Pfizer understands that the FTC’s investigation is focused on J&J’s alleged conduct at issue in Pfizer’s lawsuit against J&J.
• | The Premarin family of products (Biopharma): |
Three Months Ended | Six Months Ended | |||||||||||||||||||||||||||
% Change | % Change | |||||||||||||||||||||||||||
(MILLIONS OF DOLLARS) | June 28, 2020 | June 30, 2019 | Total | Oper. | June 28, 2020 | June 30, 2019 | Total | Oper. | ||||||||||||||||||||
U.S. | $ | 142 | $ | 182 | (22 | ) | $ | 283 | $ | 340 | (17 | ) | ||||||||||||||||
International | 10 | 11 | (7 | ) | 1 | 20 | 21 | (3 | ) | 1 | ||||||||||||||||||
Worldwide revenues | $ | 152 | $ | 193 | (21 | ) | (21 | ) | $ | 304 | $ | 361 | (16 | ) | (16 | ) | ||||||||||||
67
The worldwide operational decline in the second quarter and first six months of 2020 was primarily driven by continued competitive pressures in the U.S., which is expected to continue.
• | Celebrex (Upjohn): |
Three Months Ended | Six Months Ended | |||||||||||||||||||||||||||
% Change | % Change | |||||||||||||||||||||||||||
(MILLIONS OF DOLLARS) | June 28, 2020 | June 30, 2019 | Total | Oper. | June 28, 2020 | June 30, 2019 | Total | Oper. | ||||||||||||||||||||
U.S. | $ | 10 | $ | 16 | (33 | ) | $ | 22 | $ | 30 | (28 | ) | ||||||||||||||||
International | 129 | 158 | (18 | ) | (17 | ) | 274 | 317 | (14 | ) | (13 | ) | ||||||||||||||||
Worldwide revenues | $ | 139 | $ | 174 | (20 | ) | (18 | ) | $ | 295 | $ | 347 | (15 | ) | (14 | ) | ||||||||||||
The worldwide operational decline in the second quarter and first six months of 2020 was primarily driven by lower volume in certain developed markets, primarily in Japan, in anticipation of generic competition that began in June 2020, Pfizer’s third quarter for international subsidiaries, following patent expiration in November 2019, partially offset by higher volumes in China. The first six months of 2020 were also impacted by pricing pressures and lower volumes in certain other emerging markets.
• | Sulperazon (Biopharma): |
Three Months Ended | Six Months Ended | |||||||||||||||||||||||||||
% Change | % Change | |||||||||||||||||||||||||||
(MILLIONS OF DOLLARS) | June 28, 2020 | June 30, 2019 | Total | Oper. | June 28, 2020 | June 30, 2019 | Total | Oper. | ||||||||||||||||||||
U.S. | $ | — | $ | — | — | $ | — | $ | — | — | ||||||||||||||||||
International | 102 | 165 | (38 | ) | (36 | ) | 289 | 342 | (16 | ) | (13 | ) | ||||||||||||||||
Worldwide revenues | $ | 102 | $ | 165 | (38 | ) | (36 | ) | $ | 289 | $ | 342 | (16 | ) | (13 | ) | ||||||||||||
The international operational decline in the second quarter and first six months of 2020 was primarily driven by lower demand in China due to lower infection rates driven by fewer elective surgical procedures, shorter in-patient hospital stays and improved infection control compared to the prior year period.
• | Xalkori (Biopharma): |
Three Months Ended | Six Months Ended | ||||||||||||||||||||||||
% Change | % Change | ||||||||||||||||||||||||
(MILLIONS OF DOLLARS) | June 28, 2020 | June 30, 2019 | Total | Oper. | June 28, 2020 | June 30, 2019 | Total | Oper. | |||||||||||||||||
U.S. | $ | 37 | $ | 41 | (8 | ) | $ | 77 | $ | 75 | 2 | ||||||||||||||
International | 100 | 92 | 9 | 14 | 210 | 180 | 17 | 21 | |||||||||||||||||
Worldwide revenues | $ | 138 | $ | 133 | 4 | 7 | $ | 287 | $ | 255 | 12 | 15 | |||||||||||||
The worldwide operational growth in the second quarter and first six months of 2020 primarily resulted from growth in China, following the impact of inclusion of Xalkori in the 2019 National Reimbursement Drug List.
• | Viagra (Upjohn): |
Three Months Ended | Six Months Ended | |||||||||||||||||||||||||||
% Change | % Change | |||||||||||||||||||||||||||
(MILLIONS OF DOLLARS) | June 28, 2020 | June 30, 2019 | Total | Oper. | June 28, 2020 | June 30, 2019 | Total | Oper. | ||||||||||||||||||||
U.S. | $ | 11 | $ | 13 | (15 | ) | $ | 28 | $ | 52 | (46 | ) | ||||||||||||||||
International | 83 | 102 | (18 | ) | (15 | ) | 193 | 207 | (6 | ) | (4 | ) | ||||||||||||||||
Worldwide revenues | $ | 94 | $ | 114 | (18 | ) | (15 | ) | $ | 222 | $ | 259 | (15 | ) | (13 | ) | ||||||||||||
The worldwide operational decline in the second quarter and first six months of 2020 was primarily driven by emerging markets, primarily China, resulting from mobility restrictions due to COVID-19. The worldwide operational decline in the first six months of 2020 was also impacted by continued volume erosion due to multi-source generic competition in the U.S.
68
• | Alliance revenues (Biopharma): |
Three Months Ended | Six Months Ended | |||||||||||||||||||||||
% Change | % Change | |||||||||||||||||||||||
(MILLIONS OF DOLLARS) | June 28, 2020 | June 30, 2019 | Total | Oper. | June 28, 2020 | June 30, 2019 | Total | Oper. | ||||||||||||||||
U.S. | $ | 996 | $ | 835 | 19 | $ | 2,018 | $ | 1,610 | 25 | ||||||||||||||
International | 408 | 352 | 16 | 19 | 769 | 666 | 15 | 18 | ||||||||||||||||
Worldwide revenues | $ | 1,404 | $ | 1,187 | 18 | 19 | $ | 2,786 | $ | 2,277 | 22 | 23 | ||||||||||||
The worldwide operational growth in the second quarter and first six months of 2020 was primarily due to increases in Eliquis and Xtandi alliance revenues included in the above discussion.
See Notes to Condensed Consolidated Financial Statements––Note 14C. Segment, Geographic and Other Revenue Information: Other Revenue Information for additional information regarding the primary indications or class of the selected products discussed above.
See Notes to Condensed Consolidated Financial Statements—Note 13. Contingencies and Certain Commitments for a discussion of recent developments concerning patent and product litigation relating to certain of the products discussed above.
See the “Patents and Other Intellectual Property Rights” section in Part I, Item 1, “Business” of our 2019 Form 10-K for information regarding the expiration of various patent rights.
Product Developments—Biopharmaceutical
We continue to invest in R&D to provide potential future sources of revenues through the development of new products, as well as through additional uses for in-line and alliance products. Notwithstanding our efforts, there are no assurances as to when, or if, we will receive regulatory approval for additional indications for existing products or any of our other products in development.
We continue to strengthen our global R&D organization and pursue strategies intended to improve innovation and overall productivity in R&D to achieve a sustainable pipeline that will deliver value in the near term and over time.
For additional information about our R&D organization, see the “Research and Development” section in Part I, Item 1, “Business” of our 2019 Form 10-K.
A comprehensive update of Pfizer’s development pipeline was published as of July 28, 2020 and is available at www.pfizer.com/science/drug-product-pipeline. It includes an overview of our research and a list of compounds in development with targeted indication and phase of development, as well as mechanism of action for some candidates in Phase 1 and all candidates from Phase 2 through registration.
The following series of tables provides information about significant regulatory actions by, and filings pending with, the FDA and regulatory authorities in the EU and Japan, as well as additional indications and new drug candidates in late-stage development.
RECENT FDA APPROVALS | ||
PRODUCT | INDICATION | DATE APPROVED |
Bavencio (avelumab) | For the maintenance treatment of patients with locally advanced or metastatic urothelial carcinoma that has not progressed with first-line platinum-containing chemotherapy, which is being developed in collaboration with Merck KGaA, Germany | June 2020 |
Nyvepria (pegfilgrastim-apgf)(a) | A biosimilar to Neulasta® (pegfilgrastim) to decrease the incidence of infection, as manifested by febrile neutropenia, in patients with non-myeloid malignancies receiving myelosuppressive anti-cancer drugs associated with a clinically significant incidence of febrile neutropenia | June 2020 |
Braftovi (encorafenib)(b) | Braftovi (encorafenib) in combination with Erbitux® (cetuximab) for the treatment of BRAFV600E-mutant metastatic colorectal cancer after prior therapy | April 2020 |
Xtandi (enzalutamide) | Treatment of metastatic castration-sensitive prostate cancer, which is being developed through a collaboration with Astellas | December 2019 |
Abrilada (adalimumab-afzb)(c) | A biosimilar to Humira® (adalimumab) for the treatment of certain patients with rheumatoid arthritis, juvenile idiopathic arthritis, psoriatic arthritis, ankylosing spondylitis, adult Crohn's disease, UC and plaque psoriasis | November 2019 |
(a) | Neulasta® is a registered U.S. trademark of Amgen Inc. |
(b) | Erbitux® is a registered trademark of ImClone LLC. |
(c) | Humira® is a registered trademark of AbbVie Biotechnology Ltd. Pfizer is working to make Abrilada available to U.S. patients as soon as feasible based on the terms of its agreement with AbbVie. Current plans are to launch Abrilada in 2023. |
69
PENDING U.S. NDAs AND SUPPLEMENTAL FILINGS | ||
PRODUCT | PROPOSED INDICATION | DATE FILED* |
tanezumab | For patients with chronic pain due to moderate-to-severe osteoarthritis (OA) who have experienced inadequate pain relief with other analgesics, which is being developed in collaboration with Lilly | March 2020 |
* | The date set forth in this column is the date on which the FDA accepted our submission. |
REGULATORY APPROVALS AND FILINGS IN THE EU AND JAPAN | |||
PRODUCT | DESCRIPTION OF EVENT | DATE APPROVED | DATE FILED* |
Bosulif (bosutinib) | Application approved in Japan for the first-line treatment of chronic myelogenous leukemia (CML) | June 2020 | — |
Daurismo (glasdegib) | Application approved in the EU for Daurismo (glasdegib) in combination with low-dose cytarabine, a type of chemotherapy, for the treatment of newly diagnosed (de novo or secondary) AML in adult patients who are not candidates for standard chemotherapy | June 2020 | — |
Bavencio (avelumab) | Application filed in the EU for first-line maintenance treatment of patients with locally advanced or metastatic urothelial carcinoma, which is being developed in collaboration with Merck KGaA, Germany | — | June 2020 |
Braftovi (encorafenib)(a) | Application approved in the EU for Braftovi (encorafenib) in combination with Erbitux® (cetuximab), for the treatment of adult patients with mCRC with a BRAF mutation, who have received prior systemic therapy, which is being developed in collaboration with the Pierre Fabre Group | June 2020 | — |
Bavencio (avelumab) | Application filed in Japan for first-line maintenance treatment of patients with locally advanced or metastatic urothelial carcinoma, which is being developed in collaboration with Merck KGaA, Germany | — | May 2020 |
Ruxience (rituximab)(b) | Application approved in the EU for a biosimilar to MabThera® (rituximab) for the treatment of non-Hodgkin’s lymphoma, chronic lymphocytic leukemia, RA, granulomatosis with polyangiitis and microscopic polyangiitis, and pemphigus vulgaris | April 2020 | — |
Staquis (crisaborole) | Application approved in the EU for the treatment of mild to moderate atopic dermatitis in adults and pediatric patients from 2 years of age with ≤ 40% body surface area affected | March 2020 | — |
tanezumab | Application filed in the EU for adult patients with moderate to severe chronic pain associated with OA for whom treatment with NSAIDs and/or an opioid is ineffective, not tolerated or inappropriate | — | March 2020 |
Braftovi (encorafenib) and Mektovi (binimetinib) | Application filed in Japan for second-or-third-line treatment of BRAF-mutant mCRC in patients who have received prior systemic therapy, which is being developed in collaboration with Ono Pharmaceutical Co., Ltd. | — | March 2020 |
Vyndaqel (tafamidis free acid) | Application approved in the EU for a once-daily 61 mg oral capsule, for the treatment of wild-type or hereditary transthyretin amyloidosis in adult patients with cardiomyopathy | February 2020 | — |
Amsparity (adalimumab)(c) | Application approved in the EU for a biosimilar to Humira® (adalimumab) for the treatment of certain patients with RA, juvenile idiopathic arthritis, axial spondyloarthritis, psoriatic arthritis, psoriasis, hidradenitis suppurativa, Crohn’s disease, UC, uveitis, and pediatric plaque psoriasis | February 2020 | — |
Xeljanz (tofacitinib) | Application approved in the EU for Xeljanz (tofacitinib) 11 mg prolonged release tablets in combination with methotrexate for the treatment of moderate to severe active rheumatoid arthritis in adult patients who have responded inadequately to, or who are intolerant to one or more disease-modifying antirheumatic drugs | December 2019 | — |
Bavencio (avelumab) | Application approved in Japan for Bavencio (avelumab) in combination with Inlyta (axitinib) for the first-line treatment of advanced RCC, which is being developed in collaboration with Merck KGaA, Germany | December 2019 | — |
Bavencio (avelumab) | Application approved in the EU for Bavencio (avelumab) in combination with Inlyta (axitinib) for the first-line treatment of advanced RCC, which is being developed in collaboration with Merck KGaA, Germany | October 2019 | — |
PF-06881894(d) | Application filed in the EU for a potential biosimilar to Neulasta® (pegfilgrastim) | — | October 2019 |
Rituximab Pfizer (rituximab)(e) | Application approved in Japan for a biosimilar to Rituxan® (rituximab) for the treatment of CD20-positive, B-cell non-Hodgkin’s Lymphoma, CD20-positive, B-cell lymphoproliferative disease under immunosuppression, and Granulomatosis with polyangiitis, and microscopic polyangiitis | September 2019 | — |
Xtandi (enzalutamide) | Application filed in the EU for the treatment of metastatic castration-sensitive prostate cancer, which is being developed through a collaboration with Astellas | — | July 2019 |
* | For applications in the EU, the dates set forth in this column are the dates on which the EMA validated our submissions. |
(a) | Erbitux® is a registered trademark of ImClone LLC. |
(b) | MabThera® is a registered trademark of F. Hoffman-La Roche AG. |
(c) | Humira® is a registered trademark of AbbVie Biotechnology Ltd. Pfizer does not currently plan to commercialize Amsparity in the EU due to unfavorable market conditions. |
(d) | Neulasta® is a registered trademark of Amgen Inc. |
(e) | Rituxan® is a registered trademark of Biogen MA Inc. |
70
LATE-STAGE CLINICAL PROGRAMS FOR ADDITIONAL USES AND DOSAGE FORMS FOR IN-LINE AND IN-REGISTRATION PRODUCTS | |
PRODUCT | PROPOSED INDICATION |
Bavencio (avelumab) | A monoclonal antibody that inhibits PD-L1 for the first-line treatment of stage IIIb/IV non-small cell lung cancer, which is being developed in collaboration with Merck KGaA, Germany |
Daurismo (glasdegib)(a) | A smoothened inhibitor, in combination with cytarabine and daunorubicin, for the treatment of AML |
Ibrance (palbociclib) | Treatment of HER2+ advanced breast cancer, in collaboration with the Alliance Foundation Trials, LLC |
Ibrance (palbociclib) | Treatment of high-risk early breast cancer, in collaboration with the German Breast Group |
Lorbrena (lorlatinib) | Treatment of patients with metastatic non-small cell lung cancer whose tumors are ALK-positive as detected by an FDA-approved test |
Xeljanz (tofacitinib) | Treatment of ankylosing spondylitis |
Xtandi (enzalutamide) | Treatment of non-metastatic castration-sensitive prostate cancer, which is being developed through a collaboration with Astellas |
Talzenna (talazoparib) | An oral PARP inhibitor, in combination with Xtandi (enzalutamide), for the treatment of metastatic castration-resistant prostate cancer |
(a) | In May 2020, we accepted the recommendation of the independent Data Monitoring Committee to stop the Non-Intensive cohort of the Phase 3 clinical trial for BRIGHT AML 1019, as it is unlikely to show a statistically significant improvement in the primary endpoint of overall survival. No important new safety signals were observed in patients treated with glasdegib. A separate cohort of BRIGHT AML 1019 evaluates glasdegib in combination with intensive chemotherapy (cytarabine and daunorubicin) for the treatment of adult patients with previously untreated AML, and the cohort is ongoing and remains blinded. |
In May 2020, we and the Austrian Breast & Colorectal Cancer Study Group and the Alliance Foundation announced that following a preplanned efficacy and futility analysis, the independent Data Monitoring Committee of the collaborative Ibrance (palbociclib) Phase 3 early breast cancer PALbociclib CoLlaborative Adjuvant Study (PALLAS) determined that the trial is unlikely to show a statistically significant improvement in the primary endpoint of invasive disease-free survival. No unexpected new safety signals were observed in patients receiving Ibrance. When available, the full results from the PALLAS study will be shared with the scientific community.
NEW DRUG CANDIDATES IN LATE-STAGE DEVELOPMENT | |
CANDIDATE | PROPOSED INDICATION |
abrocitinib (PF-04965842) | A Janus kinase 1 (JAK1) inhibitor for the treatment of moderate-to-severe atopic dermatitis |
aztreonam-avibactam (PF-06947387) | A beta lactam/beta lactamase inhibitor for the treatment of patients with infections caused by Gram-negative bacteria, including those that produce metallo-beta-lactamases, for which there are limited or no treatment options |
fidanacogene elaparvovec (PF-06838435) | An investigational gene therapy for the treatment of hemophilia B |
PF-06482077 | A 20-Valent pneumococcal conjugate vaccine for the prevention of invasive pneumococcal disease and pneumonia caused by Streptococcus pneumoniae serotypes covered by the vaccine in adults 18 years of age and older |
PF-06482077 | A 20-Valent pneumococcal conjugate vaccine for the prevention of invasive pneumococcal disease and pneumonia caused by Streptococcus pneumoniae serotypes covered by the vaccine in infants |
PF-06425090 | A prophylactic vaccine for prevention of primary clostridioides difficile infection (CDI) in individuals |
PF-06886992 | Prevention of invasive meningococcal disease caused by Neisseria meningitidis serogroups A,B,C,W and Y in persons one through 25 years of age |
PF-06928316 | A respiratory syncytial virus vaccine for the prevention of RSV disease in young infants through maternal immunization and in older adults through direct immunization |
PF-07302048 (BNT162) | A messenger RNA-based vaccine for the prevention of SARS-CoV-2, the virus that causes COVID-19 disease, in partnership with BioNTech |
PF-07265803 | An oral inhibitor of p38 mitogen-activated protein kinase for the treatment of patients with symptomatic dilated cardiomyopathy due to a Lamin A/C gene mutation |
ritlecitinib (PF-06651600) | A selective dual Janus kinase 3 (JAK3) and Tyrosine kinase Expressed in hepatocellular Carcinoma (TEC) family inhibitor for the treatment of patients with moderate to severe alopecia areata |
sasanlimab (PF-06801591) | A monoclonal antibody that inhibits PD-1, in combination with Bacillus Calmette-Guerin (BCG), for the treatment of non-muscle invasive bladder cancer |
somatrogon (PF-06836922) | A long-acting hGH-CTP for the treatment of growth hormone deficiency in children, which is being developed in collaboration with OPKO |
somatrogon (PF-06836922) | A long-acting hGH-CTP for the treatment of growth hormone deficiency in adults, which is being developed in collaboration with OPKO |
tanezumab | An anti-nerve growth factor monoclonal antibody for the treatment of cancer pain, which is being developed in collaboration with Lilly |
Additional product-related programs are in various stages of discovery and development.
71
Costs and Expenses
The changes in expenses below reflect, among other things, a decline in expenses resulting from the July 31, 2019 completion of the Consumer Healthcare JV transaction with GSK (see Notes to Condensed Consolidated Financial Statements—Note 2B. Acquisition, Equity-Method Investment and Licensing Arrangements: Equity-Method Investment). In addition, the COVID-19 pandemic impacted certain operating expenses in the second quarter and first six months of 2020.
Cost of Sales
Three Months Ended | Six Months Ended | |||||||||||||||||||||
(MILLIONS OF DOLLARS) | June 28, 2020 | June 30, 2019 | % Change | June 28, 2020 | June 30, 2019 | % Change | ||||||||||||||||
Cost of sales | $ | 2,281 | $ | 2,576 | (11 | ) | $ | 4,658 | $ | 5,009 | (7 | ) | ||||||||||
As a percentage of Revenues | 19.3 | % | 19.4 | % | 19.5 | % | 19.0 | % | ||||||||||||||
Cost of sales decreased $295 million in the second quarter of 2020 and $351 million in the first six months of 2020, primarily due to:
• | the favorable impact of the July 31, 2019 completion of the Consumer Healthcare joint venture transaction with GSK; and |
• | a favorable impact of foreign exchange, |
partially offset by:
• | the unfavorable impact of incremental costs incurred in response to the COVID-19 pandemic. |
The decrease in Cost of sales in the first six months of 2020 was also partially offset by the net increase in sales volumes for various products within our product portfolio.
The slight decrease in Cost of sales as a percentage of revenues in the second quarter of 2020, compared to the same period in 2019, was primarily due to all of the factors discussed above, as well as a favorable change in product mix, primarily driven by revenue growth in the Oncology portfolio and Vyndaqel, and an increase in alliance revenues, which have no associated cost of sales, partially offset by the impact of the lower Lyrica revenues in developed markets due to U.S. multi-source generic competition that began in July 2019.
The increase in Cost of sales as a percentage of revenues in the first six months of 2020, compared to the same period in 2019, was primarily due to all of the factors discussed above, as well as the impact of the lower Lyrica revenues in developed markets due to U.S. multi-source generic competition that began in July 2019, partially offset by a favorable change in product mix, primarily driven by revenue growth in the Oncology portfolio and Vyndaqel, and an increase in alliance revenues, which have no associated cost of sales.
Selling, Informational and Administrative (SI&A) Expenses
Three Months Ended | Six Months Ended | |||||||||||||||||||||
(MILLIONS OF DOLLARS) | June 28, 2020 | June 30, 2019 | % Change | June 28, 2020 | June 30, 2019 | % Change | ||||||||||||||||
Selling, informational and administrative expenses | $ | 3,030 | $ | 3,511 | (14 | ) | $ | 5,903 | $ | 6,850 | (14 | ) | ||||||||||
As a percentage of Revenues | 25.7 | % | 26.5 | % | 24.8 | % | 26.0 | % | ||||||||||||||
SI&A expenses decreased $481 million in the second quarter of 2020, primarily due to:
• | the favorable impact of the July 31, 2019 completion of the Consumer Healthcare joint venture transaction with GSK; |
• | lower spending on sales and marketing activities due to the impact of the COVID-19 pandemic; |
• | a decrease in field force expense as well as advertising and promotion expenses, primarily related to Lipitor and Norvasc, due to the VBP program in China, which was initially implemented in certain cities in March 2019 and expanded nationwide beginning in December 2019, as well as Lyrica in the U.S. due to generic competition that began in July 2019 and anticipated generic competition for Celebrex in Japan beginning in June 2020; |
• | lower spending associated with corporate enabling functions; and |
• | the favorable impact of foreign exchange, |
partially offset by:
• | legal entity restructuring, as well as separation costs associated with our planned Upjohn transaction with Mylan. |
SI&A expenses decreased $947 million in the first six months of 2020, mostly due to:
• | the favorable impact of the July 31, 2019 completion of the Consumer Healthcare joint venture transaction with GSK; |
72
• | a reduction in field force expense as well as advertising and promotion expenses, primarily related to Lyrica in the U.S. due to generic competition that began in July 2019 and the anticipated generic competition for Celebrex in Japan that began in June 2020, as well as a decrease in Lipitor and Norvasc expenses due to the VBP program in China, which was initially implemented in certain cities in March 2019 and expanded nationwide beginning in December 2019; |
• | lower spending associated with corporate enabling functions; |
• | lower spending on sales and marketing activities due to the impact of the COVID-19 pandemic; |
• | a reduction to expense resulting from the decrease in our liability to be paid to participants of our supplemental savings plan; |
• | lower investments across the Inflammation & Immunology portfolio; and |
• | the favorable impact of foreign exchange, |
partially offset by:
• | legal entity restructuring, as well as separation costs associated with our planned Upjohn transaction with Mylan. |
Research and Development (R&D) Expenses
Three Months Ended | Six Months Ended | |||||||||||||||||||
(MILLIONS OF DOLLARS) | June 28, 2020 | June 30, 2019 | % Change | June 28, 2020 | June 30, 2019 | % Change | ||||||||||||||
Research and development expenses | $ | 2,132 | $ | 1,842 | 16 | $ | 3,856 | $ | 3,544 | 9 | ||||||||||
As a percentage of Revenues | 18.1 | % | 13.9 | % | 16.2 | % | 13.4 | % | ||||||||||||
R&D expenses increased $290 million in the second quarter 2020, primarily due to:
• | costs related to our collaboration agreement with BioNTech to co-develop a COVID-19 vaccine, including an upfront payment to BioNTech; and |
• | an upfront payment to Valneva, |
partially offset by:
• | a net reduction of spending across our Oncology, Inflammation & Immunology, Rare Disease, Internal Medicine and Vaccines portfolios, as well as delays in program costs related to COVID-19. |
R&D expenses increased $311 million in the first six months of 2020, mostly due to:
• | costs related to our collaboration agreement with BioNTech to co-develop a COVID-19 vaccine, including an upfront payment to BioNTech; |
• | an upfront payment to Valneva; and |
• | increased investments towards building new capabilities and driving automation, |
partially offset by:
• | a decrease in the value of the portfolio performance share grants reflecting the decrease in the price of Pfizer’s common stock in the first half of 2020; and |
• | a net reduction of spending across our Oncology, Inflammation & Immunology, Rare Disease, Internal Medicine and Vaccines portfolios, as well as delays in program costs related to COVID-19. |
For additional information on Cost of sales, SI&A and R&D expenses by operating segment, see the “Analysis of Operating Segment Information” section of this MD&A.
Amortization of Intangible Assets
Three Months Ended | Six Months Ended | |||||||||||||||||||||
(MILLIONS OF DOLLARS) | June 28, 2020 | June 30, 2019 | % Change | June 28, 2020 | June 30, 2019 | % Change | ||||||||||||||||
Amortization of intangible assets | $ | 905 | $ | 1,184 | (24 | ) | $ | 1,790 | $ | 2,367 | (24 | ) | ||||||||||
As a percentage of Revenues | 7.7 | % | 8.9 | % | 7.5 | % | 9.0 | % | ||||||||||||||
Amortization of intangible assets decreased $279 million in the second quarter of 2020 and $577 million in the first six months of 2020, primarily due to the non-recurrence of amortization expense as a result of fully amortized assets and the impairment of Eucrisa in the fourth quarter of 2019, partially offset by an increase in amortization expense related to intangible assets from our acquisition of Array.
73
For additional information, see Notes to Condensed Consolidated Financial Statements—Note 2A. Acquisition, Equity-Method Investment and Licensing Arrangements: Acquisition and —Note 9A. Identifiable Intangible Assets and Goodwill: Identifiable Intangible Assets.
Restructuring Charges and Other Costs Associated with Acquisitions and Cost-Reduction/Productivity Initiatives
Three Months Ended | Six Months Ended | |||||||||||||||||||||
(MILLIONS OF DOLLARS) | June 28, 2020 | June 30, 2019 | % Change | June 28, 2020 | June 30, 2019 | % Change | ||||||||||||||||
Restructuring credits—acquisition-related costs(a) | $ | (1 | ) | $ | (206 | ) | (100 | ) | $ | — | $ | (214 | ) | (100 | ) | |||||||
Restructuring charges—cost reduction initiatives(b) | 341 | 62 | * | 396 | 81 | * | ||||||||||||||||
Restructuring charges/(credits) | 340 | (144 | ) | * | 396 | (134 | ) | * | ||||||||||||||
Transaction costs(c) | 11 | — | * | 14 | — | * | ||||||||||||||||
Integration costs and other(c) | 11 | 29 | (62 | ) | 21 | 64 | (67 | ) | ||||||||||||||
Restructuring charges and certain acquisition-related costs | 362 | (115 | ) | * | 431 | (69 | ) | * | ||||||||||||||
Net periodic benefit costs | 5 | 4 | 24 | 29 | 10 | * | ||||||||||||||||
Total additional depreciation—asset restructuring | 6 | 10 | (36 | ) | 6 | 23 | (71 | ) | ||||||||||||||
Total implementation costs | 75 | 42 | 77 | 99 | 69 | 45 | ||||||||||||||||
Costs associated with acquisitions and cost-reduction/productivity initiatives(d) | $ | 449 | $ | (59 | ) | * | $ | 566 | $ | 32 | * | |||||||||||
* Indicates calculation not meaningful or results are equal to or greater than 100%. | ||||||||||||||||||||||
(a) | Includes employee termination costs, asset impairments and other exit costs associated with business combinations. Credits for the second quarter and the first six months of 2019 were mostly due to the reversal of certain accruals related to our acquisition of Wyeth upon the effective favorable settlement of an IRS audit for multiple years. See Notes to Consolidated Financial Statements––Note 5D. Tax Matters: Tax Contingencies in our 2019 Financial Report. |
(b) | Includes employee termination costs, asset impairments and other exit costs not associated with acquisitions. The charges for the second quarter and the first six months of 2020 primarily represent employee termination costs associated with our Transforming to a More Focused Company program. For the second quarter of 2019, the charges were composed of employee termination costs and exit costs, partially offset by lower asset write-downs, and for the first six months of 2019 were mostly related to employee termination costs and exit costs. |
(c) | For additional information, see Notes to Condensed Consolidated Financial Statements—Note 3. Restructuring Charges and Other Costs Associated with Acquisitions and Cost-Reduction/Productivity Initiatives. |
(d) | Comprises Restructuring charges and certain acquisition-related costs as well as costs associated with our cost-reduction/productivity initiatives included in Cost of sales, Research and development expenses, Selling, informational and administrative expenses and/or Other (income)/deductions––net as appropriate. For additional information, see Notes to Condensed Consolidated Financial Statements—Note 3. Restructuring Charges and Other Costs Associated with Acquisitions and Cost-Reduction/Productivity Initiatives. |
Transforming to a More Focused Company Program
With the formation of the GSK Consumer Healthcare joint venture and the anticipated combination of Upjohn, our global, primarily off-patent branded and generics business, with Mylan, Pfizer is transforming itself into a more focused, global leader in science-based innovative medicines. As a result, we began, in the fourth quarter of 2019, to identify and undertake efforts to ensure our cost base aligns appropriately with our Biopharmaceutical revenue base, which is expected to be 20% less (based on the midpoint of the range for 2020 New Pfizer revenue guidance, compared to 2019 Total Company reported revenue) as a result of both the completed GSK Consumer Healthcare and expected Upjohn transactions. While certain direct costs have transferred or will transfer to the GSK Consumer Healthcare joint venture and to the Upjohn entities, there are indirect costs which are not expected to transfer. In addition, we are taking steps to restructure our organizations to appropriately support and drive the purpose of the three core functions of our focused innovative medicines business: R&D, Manufacturing and Commercial.
We expect the costs associated with this multi-year program to be incurred from 2020 through 2022 and to total approximately $1.2 billion on a pre-tax basis, with substantially all of the costs to be cash expenditures. Actions may include, among others, changes in location of certain activities, expanded use and co-location of centers of excellence and shared services, and increased use of digital technologies. The associated actions and the specific costs will primarily include severance and benefit plan impacts, exit costs as well as associated implementation costs. We expect gross cost savings of approximately $900 million to be achieved primarily over the two-year period 2021-2022.
Also as part of this program, in connection with the legacy cost reduction initiatives, primarily related to manufacturing activities, we expect to incur costs of approximately $400 million, with approximately 20% of the costs to be non-cash. The costs associated with this effort are expected to be incurred from 2020 through 2022, and will primarily include implementation costs, product transfer costs, exit costs, as well as accelerated depreciation. We expect targeted net cost savings of approximately $200 million, with approximately 30% realized in the first half of 2020, and the remaining expected to be achieved in the second half of 2020 through 2022.
74
Savings are expected to be realized primarily in corporate enabling functions and in manufacturing (as described in the Notes to Condensed Consolidated Financial Statements––Note 14A. Segment, Geographic and Other Revenue Information: Segment Information).
Certain qualifying costs associated with this program were recorded in the fourth quarter of 2019 and in the first and second quarters of 2020 and are reflected as Certain Significant Items and excluded from our non-GAAP measure of Adjusted Income. See the “Non-GAAP Financial Measure (Adjusted Income)” section of this MD&A for additional information.
For additional information about this program and expected and actual total costs, see Notes to Condensed Consolidated Financial Statements—Note 3. Restructuring Charges and Other Costs Associated with Acquisitions and Cost-Reduction/Productivity Initiatives.
In addition to this major program, we continuously monitor our operations for cost reduction and/or productivity opportunities, especially in light of the losses of exclusivity and the expiration of collaborative arrangements for various products.
Other (Income)/Deductions—Net
Three Months Ended | Six Months Ended | |||||||||||||||||||
(MILLIONS OF DOLLARS) | June 28, 2020 | June 30, 2019 | % Change | June 28, 2020 | June 30, 2019 | % Change | ||||||||||||||
Other (income)/deductions––net | $ | (862 | ) | $ | 126 | * | $ | (641 | ) | $ | 218 | * | ||||||||
* Indicates calculation not meaningful or results are equal to or greater than 100%. | ||||||||||||||||||||
For information about the components of Other (income)/deductions—net, see Notes to Condensed Consolidated Financial Statements—Note 4. Other (Income)/Deductions—Net.
See also the “Analysis of Operating Segment Information” section of this MD&A.
Provision/(Benefit) for Taxes on Income
Three Months Ended | Six Months Ended | |||||||||||||||||||
(MILLIONS OF DOLLARS) | June 28, 2020 | June 30, 2019 | % Change | June 28, 2020 | June 30, 2019 | % Change | ||||||||||||||
Provision/(benefit) for taxes on income | $ | 519 | $ | (915 | ) | * | $ | 993 | $ | (481 | ) | * | ||||||||
Effective tax rate on continuing operations | 13.1 | % | (22.1 | )% | 12.7 | % | (5.7 | )% | ||||||||||||
* Indicates calculation not meaningful or results are equal to or greater than 100%. | ||||||||||||||||||||
For information about our effective tax rate and the events and circumstances contributing to the changes between periods, see Notes to Condensed Consolidated Financial Statements—Note 5. Tax Matters.
Non-GAAP Financial Measure (Adjusted Income)
General Description of Non-GAAP Financial Measure (Adjusted Income)
Adjusted income is an alternative view of performance used by management. We measure the performance of the overall Company on this basis in conjunction with other performance metrics. Because Adjusted income is an important internal measurement for Pfizer, we believe that investors’ understanding of our performance is enhanced by disclosing this performance measure. We report Adjusted income, certain components of Adjusted income, and Adjusted diluted earnings per share in order to portray the results of our major operations––the discovery, development, manufacture, marketing and sale of prescription medicines and vaccines––prior to considering certain income statement elements. We have defined Adjusted income as Net income attributable to Pfizer Inc. before the impact of purchase accounting for acquisitions, acquisition-related costs, discontinued operations and certain significant items, which are described below. Also, see the “Non-GAAP Financial Measure (Adjusted Income)––General Description of Non-GAAP Financial Measure (Adjusted Income)” section of our 2019 Financial Report for additional information. Similarly, we have defined the Adjusted income components as Cost of sales, Selling, informational and administrative expenses, Research and development expenses, Amortization of intangible assets and Other (income)/deductions––net each before the impact of purchase accounting for acquisitions, acquisition-related costs and certain significant items. We have defined Adjusted diluted earnings per share as Earnings per common share attributable to Pfizer Inc.––diluted before the impact of purchase accounting for acquisitions, acquisition-related costs, discontinued operations and certain significant items. The Adjusted income measure, the Adjusted income component measures and the Adjusted diluted earnings per share measure are not, and should not be viewed as, substitutes for U.S. GAAP net income, U.S. GAAP net income components or U.S. GAAP diluted earnings per share.
75
The following are examples of how the Adjusted income and Adjusted diluted earnings per share measures are utilized:
• | senior management receives a monthly analysis of our operating results that is prepared on an Adjusted income and Adjusted diluted earnings per share basis; |
• | our annual budgets are prepared on an Adjusted income and Adjusted diluted earnings per share basis; and |
• | senior management’s annual compensation is derived, in part, using Adjusted income and Adjusted diluted earnings per share measures. |
Effective in 2020, the bonus plans for substantially all non-sales-force employees worldwide are funded from a pool based on our performance, measured in significant part by three metrics, one of which is Adjusted diluted earnings per share, which is derived from Adjusted income and accounts for 40% of the bonus pool funding. Additionally, the payout for some Performance Share Awards is determined in part by Adjusted net income, which is derived from Adjusted income.
Adjusted income and its components and Adjusted diluted earnings per share are non-GAAP financial measures that have no standardized meaning prescribed by U.S. GAAP and, therefore, are limited in their usefulness to investors. Because of their non-standardized definitions, Adjusted income and its components (unlike U.S. GAAP net income and its components) and Adjusted diluted earnings per share (unlike U.S. GAAP diluted earnings per share) may not be comparable to the calculation of similar measures of other companies. Adjusted income and its components and Adjusted diluted earnings per share are presented solely to permit investors to more fully understand how management assesses performance.
We also recognize that, as internal measures of performance, the Adjusted income and its components and Adjusted diluted earnings per share measures have limitations, and we do not restrict our performance-management process solely to these metrics. A limitation of these measures is that they provide a view of our operations without including all events during a period, such as the effects of an acquisition or amortization of purchased intangibles, and they do not provide a comparable view of our performance relative to other companies in the biopharmaceutical industry. We also use other specifically tailored tools designed to achieve the highest levels of performance. For example, our R&D organization has productivity targets, upon which its effectiveness is measured. In addition, total shareholder return, both on an absolute basis and relative to a publicly-traded pharmaceutical index, plays a significant role in determining payouts under certain of Pfizer’s long-term incentive compensation plans.
See the accompanying reconciliations of certain GAAP reported to non-GAAP adjusted information for the second quarter and first six months of 2020 and 2019 below.
Purchase Accounting Adjustments
Adjusted income is calculated prior to considering certain significant purchase accounting impacts resulting from business combinations and net asset acquisitions. These impacts, primarily associated with Wyeth (acquired in 2009), Hospira (acquired in 2015), Anacor (acquired in 2016), Medivation (acquired in 2016) and Array (acquired in 2019), can include the incremental charge to cost of sales from the sale of acquired inventory that was written up to fair value, amortization related to the increase in fair value of the acquired finite-lived intangible assets, and to a much lesser extent, depreciation related to the increase/decrease in fair value of the acquired fixed assets (primarily manufacturing facilities), amortization related to the increase in fair value of acquired debt, and the fair value changes associated with contingent consideration. Therefore, the Adjusted income measure includes the revenues earned upon the sale of the acquired products without considering the acquisition cost of those products.
Acquisition-Related Costs
Adjusted income is calculated prior to considering transaction, integration, restructuring charges and additional depreciation costs associated with business combinations because these costs are unique to each transaction and represent costs that were incurred to restructure and integrate two businesses as a result of the acquisition decision. For additional clarity, only transaction costs, additional depreciation and restructuring and integration activities that are associated with a business combination or a net-asset acquisition are included in acquisition-related costs. We have made no adjustments for the resulting synergies.
Discontinued Operations
Adjusted income is calculated prior to considering the results of operations included in discontinued operations, as well as any related gains or losses on the disposal of such operations.
76
Certain Significant Items
Adjusted income is calculated prior to considering certain significant items. Certain significant items represent substantive and/or unusual items that are evaluated on an individual basis. Such evaluation considers both the quantitative and the qualitative aspects of their nature. Certain significant items may be highly variable and difficult to predict. Furthermore, in some cases it is reasonably possible that they could reoccur in future periods. For example, major non-acquisition-related cost-reduction programs stand on their own as they are specific to an event or goal with a defined term, but we may have subsequent programs based on reorganizations of the business, cost productivity or in response to loss of exclusivity or economic conditions. Legal charges to resolve litigation are also related to specific cases, which are facts and circumstances specific and, in some cases, may also be the result of litigation matters at acquired companies that were inestimable, not probable or unresolved at the date of acquisition. Unusual items may represent items that are not part of our ongoing business; items that, either as a result of their nature or size, we would not expect to occur as part of our normal business on a regular basis; items that would be non-recurring; or items that relate to products we no longer sell. While not all-inclusive, examples of items that could be included as certain significant items would be: (i) gains on the completion of joint venture transactions such as the gain on the completion of the GSK Consumer Healthcare joint venture transaction discussed in Notes to Condensed Consolidated Financial Statements—Note 2B. Acquisition, Equity-Method Investment and Licensing Arrangements: Equity-Method Investment, (ii) gains and losses from equity securities because of their inherent volatility, which we do not control and cannot predict with any level of certainty and because we do not believe that including these gains and losses assists investors in understanding our business or is reflective of our core operations and business; (iii) a major non-acquisition-related restructuring charge and associated implementation costs; (iv) amounts related to certain disposals of businesses, products or facilities that do not qualify as discontinued operations under U.S. GAAP; (v) certain intangible asset impairments; (vi) adjustments related to the resolution of certain tax positions; (vii) the impact of adopting certain significant, event-driven tax legislation, such as the TCJA discussed in Notes to Consolidated Financial Statements—Note 5A. Tax Matters: Taxes on Income from Continuing Operations in Pfizer’s 2019 Financial Report; or (viii) charges related to certain legal matters, such as certain of those discussed in Notes to Condensed Consolidated Financial Statements—Note 13A. Contingencies and Certain Commitments: Legal Proceedings, included in Part I, Item 1 of this Quarterly Report on Form 10-Q. Normal, ongoing defense costs of the Company or settlements of and accruals for legal matters made in the normal course of our business would not be considered certain significant items.
Reconciliations of GAAP Reported to Non-GAAP Adjusted Information––Certain Line Items
Three Months Ended June 28, 2020 | ||||||||||||||||||||||||
IN MILLIONS, EXCEPT PER COMMON SHARE DATA | GAAP Reported | Purchase Accounting Adjustments(a) | Acquisition-Related Items(a) | Discontinued Operations(a) | Certain Significant Items(a) | Non-GAAP Adjusted | ||||||||||||||||||
Revenues | $ | 11,801 | $ | — | $ | — | $ | — | $ | — | $ | 11,801 | ||||||||||||
Cost of sales | 2,281 | 5 | — | — | (49 | ) | 2,236 | |||||||||||||||||
Selling, informational and administrative expenses | 3,030 | (1 | ) | — | — | (221 | ) | 2,808 | ||||||||||||||||
Research and development expenses | 2,132 | 1 | — | — | (238 | ) | 1,895 | |||||||||||||||||
Amortization of intangible assets | 905 | (834 | ) | — | — | — | 71 | |||||||||||||||||
Restructuring charges and certain acquisition-related costs | 362 | — | (21 | ) | — | (341 | ) | — | ||||||||||||||||
(Gain) on completion of Consumer Healthcare JV transaction | — | — | — | — | — | — | ||||||||||||||||||
Other (income)/deductions––net | (862 | ) | (82 | ) | — | — | 582 | (361 | ) | |||||||||||||||
Income from continuing operations before provision/(benefit) for taxes on income | 3,953 | 910 | 21 | — | 268 | 5,152 | ||||||||||||||||||
Provision/(benefit) for taxes on income(b) | 519 | 187 | 5 | — | 30 | 741 | ||||||||||||||||||
Income from continuing operations | 3,434 | 723 | 16 | — | 238 | 4,411 | ||||||||||||||||||
Discontinued operations––net of tax | — | — | — | — | — | — | ||||||||||||||||||
Net income attributable to noncontrolling interests | 8 | — | — | — | — | 8 | ||||||||||||||||||
Net income attributable to Pfizer Inc. | 3,426 | 723 | 16 | — | 238 | 4,403 | ||||||||||||||||||
Earnings per common share attributable to Pfizer Inc.––diluted | 0.61 | 0.13 | — | — | 0.04 | 0.78 | ||||||||||||||||||
See end of tables for note (a) and (b).
77
Six Months Ended June 28, 2020 | ||||||||||||||||||||||||
IN MILLIONS, EXCEPT PER COMMON SHARE DATA | GAAP Reported | Purchase Accounting Adjustments(a) | Acquisition-Related Items(a) | Discontinued Operations(a) | Certain Significant Items(a) | Non-GAAP Adjusted | ||||||||||||||||||
Revenues | $ | 23,829 | $ | — | $ | — | $ | — | $ | — | $ | 23,829 | ||||||||||||
Cost of sales | 4,658 | 9 | — | — | (81 | ) | 4,586 | |||||||||||||||||
Selling, informational and administrative expenses | 5,903 | — | — | — | (351 | ) | 5,553 | |||||||||||||||||
Research and development expenses | 3,856 | 3 | — | — | (236 | ) | 3,622 | |||||||||||||||||
Amortization of intangible assets | 1,790 | (1,648 | ) | — | — | — | 142 | |||||||||||||||||
Restructuring charges and certain acquisition-related costs | 431 | — | (35 | ) | — | (396 | ) | — | ||||||||||||||||
(Gain) on completion of Consumer Healthcare JV transaction | (6 | ) | — | — | — | 6 | — | |||||||||||||||||
Other (income)/deductions––net | (641 | ) | (85 | ) | — | — | 179 | (547 | ) | |||||||||||||||
Income from continuing operations before provision/(benefit) for taxes on income | 7,838 | 1,722 | 34 | — | 879 | 10,474 | ||||||||||||||||||
Provision/(benefit) for taxes on income(b) | 993 | 367 | 8 | — | 170 | 1,539 | ||||||||||||||||||
Income from continuing operations | 6,845 | 1,355 | 26 | — | 709 | 8,934 | ||||||||||||||||||
Discontinued operations––net of tax | — | — | — | — | — | — | ||||||||||||||||||
Net income attributable to noncontrolling interests | 17 | — | — | — | — | 17 | ||||||||||||||||||
Net income attributable to Pfizer Inc. | 6,828 | 1,355 | 26 | — | 709 | 8,917 | ||||||||||||||||||
Earnings per common share attributable to Pfizer Inc.––diluted | 1.22 | 0.24 | — | — | 0.13 | 1.59 | ||||||||||||||||||
Three Months Ended June 30, 2019 | ||||||||||||||||||||||||
IN MILLIONS, EXCEPT PER COMMON SHARE DATA | GAAP Reported | Purchase Accounting Adjustments(a) | Acquisition-Related Items(a) | Discontinued Operations(a) | Certain Significant Items(a) | Non-GAAP Adjusted | ||||||||||||||||||
Revenues | $ | 13,264 | $ | — | $ | — | $ | — | $ | — | $ | 13,264 | ||||||||||||
Cost of sales | 2,576 | 6 | — | — | (26 | ) | 2,556 | |||||||||||||||||
Selling, informational and administrative expenses | 3,511 | 1 | (1 | ) | — | (47 | ) | 3,464 | ||||||||||||||||
Research and development expenses | 1,842 | 1 | — | — | (18 | ) | 1,825 | |||||||||||||||||
Amortization of intangible assets | 1,184 | (1,117 | ) | — | — | — | 67 | |||||||||||||||||
Restructuring charges and certain acquisition-related costs | (115 | ) | — | 177 | — | (62 | ) | — | ||||||||||||||||
(Gain) on completion of Consumer Healthcare JV transaction | — | — | — | — | — | — | ||||||||||||||||||
Other (income)/deductions––net | 126 | (70 | ) | — | — | (156 | ) | (100 | ) | |||||||||||||||
Income from continuing operations before provision/(benefit) for taxes on income | 4,141 | 1,178 | (176 | ) | — | 309 | 5,452 | |||||||||||||||||
Provision/(benefit) for taxes on income(b) | (915 | ) | 222 | 6 | — | 1,610 | 923 | |||||||||||||||||
Income from continuing operations | 5,056 | 957 | (182 | ) | — | (1,301 | ) | 4,529 | ||||||||||||||||
Discontinued operations––net of tax | — | — | — | — | — | — | ||||||||||||||||||
Net income attributable to noncontrolling interests | 10 | — | — | — | — | 10 | ||||||||||||||||||
Net income attributable to Pfizer Inc. | 5,046 | 957 | (182 | ) | — | (1,301 | ) | 4,520 | ||||||||||||||||
Earnings per common share attributable to Pfizer Inc.––diluted | 0.89 | 0.17 | (0.03 | ) | — | (0.23 | ) | 0.80 | ||||||||||||||||
78
Six Months Ended June 30, 2019 | ||||||||||||||||||||||||
IN MILLIONS, EXCEPT PER COMMON SHARE DATA | GAAP Reported | Purchase Accounting Adjustments(a) | Acquisition-Related Items(a) | Discontinued Operations(a) | Certain Significant Items(a) | Non-GAAP Adjusted | ||||||||||||||||||
Revenues | $ | 26,382 | $ | — | $ | — | $ | — | $ | — | $ | 26,382 | ||||||||||||
Cost of sales | 5,009 | 10 | — | — | (48 | ) | 4,971 | |||||||||||||||||
Selling, informational and administrative expenses | 6,850 | 1 | (2 | ) | — | (74 | ) | 6,775 | ||||||||||||||||
Research and development expenses | 3,544 | 3 | — | — | (29 | ) | 3,518 | |||||||||||||||||
Amortization of intangible assets | 2,367 | (2,237 | ) | — | — | — | 130 | |||||||||||||||||
Restructuring charges and certain acquisition-related costs | (69 | ) | — | 150 | — | (81 | ) | — | ||||||||||||||||
(Gain) on completion of Consumer Healthcare JV transaction | — | — | — | — | — | — | ||||||||||||||||||
Other (income)/deductions––net | 218 | 6 | — | — | (459 | ) | (235 | ) | ||||||||||||||||
Income from continuing operations before provision/(benefit) for taxes on income | 8,463 | 2,217 | (148 | ) | — | 691 | 11,223 | |||||||||||||||||
Provision/(benefit) for taxes on income(b) | (481 | ) | 446 | 11 | — | 1,822 | 1,797 | |||||||||||||||||
Income from continuing operations | 8,945 | 1,771 | (159 | ) | — | (1,131 | ) | 9,426 | ||||||||||||||||
Discontinued operations––net of tax | — | — | — | — | — | — | ||||||||||||||||||
Net income attributable to noncontrolling interests | 15 | — | — | — | — | 15 | ||||||||||||||||||
Net income attributable to Pfizer Inc. | 8,929 | 1,771 | (159 | ) | — | (1,131 | ) | 9,410 | ||||||||||||||||
Earnings per common share attributable to Pfizer Inc.––diluted | 1.56 | 0.31 | (0.03 | ) | — | (0.20 | ) | 1.65 | ||||||||||||||||
(a) | For details of adjustments, see “Details of Income Statement Items Included in GAAP Reported but Excluded from Non-GAAP Adjusted Income” below. |
(b) | The effective tax rate on Non-GAAP Adjusted income was 14.4% in the second quarter of 2020, compared to 16.9% in the second quarter of 2019. The effective tax rate on Non-GAAP Adjusted income was 14.7% in the first six months of 2020, compared to 16.0% in the first six months of 2019. The decreases were primarily due to a favorable change in the jurisdictional mix of earnings as a result of operating fluctuations in the normal course of business. |
79
Details of Income Statement Items Included in GAAP Reported but Excluded from Non-GAAP Adjusted Income
Three Months Ended | Six Months Ended | |||||||||||||||
(MILLIONS OF DOLLARS) | June 28, 2020 | June 30, 2019 | June 28, 2020 | June 30, 2019 | ||||||||||||
Purchase accounting adjustments | ||||||||||||||||
Amortization, depreciation and other(a) | $ | 915 | $ | 1,185 | $ | 1,731 | $ | 2,227 | ||||||||
Cost of sales | (5 | ) | (6 | ) | (9 | ) | (10 | ) | ||||||||
Total purchase accounting adjustments––pre-tax | 910 | 1,178 | 1,722 | 2,217 | ||||||||||||
Income taxes(b) | (187 | ) | (222 | ) | (367 | ) | (446 | ) | ||||||||
Total purchase accounting adjustments––net of tax | 723 | 957 | 1,355 | 1,771 | ||||||||||||
Acquisition-related costs | ||||||||||||||||
Restructuring credits(c) | (1 | ) | (206 | ) | — | (214 | ) | |||||||||
Transaction costs(c) | 11 | — | 14 | — | ||||||||||||
Integration costs and other(c) | 11 | 29 | 21 | 64 | ||||||||||||
Additional depreciation––asset restructuring(d) | — | 1 | — | 2 | ||||||||||||
Total acquisition-related costs––pre-tax | 21 | (176 | ) | 34 | (148 | ) | ||||||||||
Income taxes(e) | (5 | ) | (6 | ) | (8 | ) | (11 | ) | ||||||||
Total acquisition-related costs––net of tax | 16 | (182 | ) | 26 | (159 | ) | ||||||||||
Discontinued operations | ||||||||||||||||
Total discontinued operations––net of tax, attributable to Pfizer Inc.(f) | — | — | — | — | ||||||||||||
Certain significant items | ||||||||||||||||
Restructuring charges––cost reduction initiatives(g) | 341 | 62 | 396 | 81 | ||||||||||||
Implementation costs and additional depreciation––asset restructuring(h) | 82 | 51 | 106 | 89 | ||||||||||||
Net gains recognized during the period on equity securities(i) | (696 | ) | (25 | ) | (501 | ) | (136 | ) | ||||||||
Certain legal matters, net(i) | 17 | 15 | 26 | 9 | ||||||||||||
Certain asset impairments(i) | — | 10 | — | 149 | ||||||||||||
Business and legal entity alignment costs(j) | 174 | 141 | 289 | 264 | ||||||||||||
Net losses on early retirement of debt(i) | — | — | — | 138 | ||||||||||||
Other(k) | 350 | 56 | 563 | 97 | ||||||||||||
Total certain significant items––pre-tax | 268 | 309 | 879 | 691 | ||||||||||||
Income taxes(l) | (30 | ) | (1,610 | ) | (170 | ) | (1,822 | ) | ||||||||
Total certain significant items––net of tax | 238 | (1,301 | ) | 709 | (1,131 | ) | ||||||||||
Total purchase accounting adjustments, acquisition-related costs, discontinued operations and certain significant items––net of tax, attributable to Pfizer Inc. | $ | 977 | $ | (526 | ) | $ | 2,090 | $ | 481 | |||||||
(a) | Included primarily in Amortization of intangible assets. |
(b) | Included in Provision /(benefit) for taxes on income. Income taxes includes the tax effect of the associated pre-tax amounts, calculated by determining the jurisdictional location of the pre-tax amounts and applying that jurisdiction’s applicable tax rate. |
(c) | Included in Restructuring charges and certain acquisition-related costs. For additional information, see the “Costs and Expenses—Restructuring Charges and Other Costs Associated with Acquisitions and Cost-Reduction/Productivity Initiatives” section of this MD&A and Notes to Condensed Consolidated Financial Statements—Note 3. Restructuring Charges and Other Costs Associated with Acquisitions and Cost-Reduction/Productivity Initiatives. |
(d) | Included in Selling, informational and administrative expenses for the three and six months ended June 30, 2019. Represents the impact of changes in the estimated useful lives of assets involved in restructuring actions related to acquisitions. |
(e) | Included in Provision/(benefit) for taxes on income. Income taxes includes the tax effect of the associated pre-tax amounts, calculated by determining the jurisdictional location of the pre-tax amounts and applying that jurisdiction’s applicable tax rate. The second quarter and first six months of 2019 include the impact of the non-taxable reversal of certain accruals related to our acquisition of Wyeth upon the effective favorable settlement of an IRS audit for multiple tax years. |
(f) | Included in Discontinued operations––net of tax. |
(g) | Amounts relate to employee termination costs, asset impairments and other exit costs not associated with acquisitions, which are included in Restructuring charges and certain acquisition-related costs (see the “Costs and Expenses—Restructuring Charges and Other Costs Associated with Acquisitions and Cost-Reduction/Productivity Initiatives” section of this MD&A and Notes to Condensed Consolidated Financial Statements—Note 3. Restructuring Charges and Other Costs Associated with Acquisitions and Cost-Reduction/Productivity Initiatives). |
(h) | Amounts relate to our cost-reduction/productivity initiatives not related to acquisitions (see Notes to Condensed Consolidated Financial Statements—Note 3. Restructuring Charges and Other Costs Associated with Acquisitions and Cost-Reduction/Productivity Initiatives). For the three months ended June 28, 2020, primarily included in Cost of sales ($16 million) and Selling, informational and administrative expenses ($63 million). For the six months ended June 28, 2020, primarily included in Cost of sales ($31 million) and Selling, informational and administrative expenses ($78 million). For the three months ended June 30, 2019, included in Cost of sales ($24 million), Selling, informational and administrative expenses ($16 million) and Research and development expenses ($11 million). For the six months ended June 30, 2019, included in Cost of sales ($46 million), Selling, informational and administrative expenses ($25 million) and Research and development expenses ($18 million). |
(i) | Included in Other (income)/deductions—net (see Notes to Condensed Consolidated Financial Statements—Note 4. Other (Income)/Deductions—Net). |
(j) | For the three months ended June 28, 2020, primarily included in Cost of sales ($30 million) and Selling, informational and administrative expenses ($138 million), and for the six months ended June 28, 2020, primarily included in Cost of sales ($45 million) and Selling, informational and administrative |
80
expenses ($235 million) and primarily represents legal entity restructuring, as well as separation costs associated with our planned Upjohn transaction with Mylan, and mainly includes consulting, legal, tax and advisory services. For the three and six months ended June 30, 2019, primarily included in Other (income)/deductions––net and represented incremental costs associated with the design, planning and implementation of our new organizational structure, effective in the beginning of 2019, and primarily included consulting, legal, tax and advisory services.
(k) | For the three months ended June 28, 2020, primarily included in Selling, informational and administrative expenses ($21 million), Research and development expenses ($229 million) and Other (income)/deductions––net ($97 million). For the first six months of 2020, primarily included in Selling, informational and administrative expenses ($37 million), Research and development expenses ($230 million) and Other (income)/deductions––net ($296 million). For the three months ended June 30, 2019, primarily included in Selling, informational and administrative expenses ($28 million) and Other (income)/deductions––net ($19 million). For the first six months of 2019, primarily included in Selling, informational and administrative expenses ($41 million), Research and development expenses ($11 million) and Other (income)/deductions––net ($43 million). Among other things, the second quarter of 2020 includes charges of $85 million and the first six months of 2020 includes charges of $245 million recorded in Other (income)/deductions––net, primarily representing our pro rata share of restructuring and business combination accounting charges recorded by the GSK Consumer Healthcare joint venture. The second quarter and first six months of 2020 also include upfront payments of $130 million to Valneva SE and $72 million to BioNTech SE, which were recorded to Research and development expenses. |
(l) | Included in Provision/(benefit) for taxes on income. Income taxes includes the tax effect of the associated pre-tax amounts, calculated by determining the jurisdictional location of the pre-tax amounts and applying that jurisdiction’s applicable tax rate. The second quarter and first six months of 2019 were favorably impacted primarily by a benefit recorded of approximately $1.4 billion, representing tax and interest, resulting from the favorable settlement of an IRS audit for multiple tax years, as well as the tax benefit recorded as a result of additional guidance issued by the U.S. Department of Treasury related to the TCJA. |
Analysis of Operating Segment Information
The following tables and associated notes provide additional information about the performance of each of our two reportable operating segments—Biopharma and Upjohn, and our Consumer Healthcare operating segment through July 31, 2019. For additional information about each operating segment, see the “Overview of Our Performance, Operating Environment, Strategy and Outlook—Our Strategy—Organizing for Growth” section of this MD&A and Notes to Condensed Consolidated Financial Statements—Note 14. Segment, Geographic and Other Revenue Information.
Acquisitions and other business development activities completed in 2019 and in the first half of 2020, including the contribution of our Consumer Healthcare business to the GSK Consumer Healthcare joint venture, impacted financial results in the periods presented. For additional information, see Notes to Consolidated Financial Statements—Note 1A. Basis of Presentation and Significant Accounting Policies: Basis of Presentation in our 2019 Financial Report, and Notes to Condensed Consolidated Financial Statements—Note 2. Acquisition, Equity-Method Investment and Licensing Arrangements.
The following tables provide revenue and cost information by reportable operating segment and a reconciliation of that information to our condensed consolidated statements of income: | ||||||||||||||||||||||||
Second Quarter of 2020 | ||||||||||||||||||||||||
(MILLIONS OF DOLLARS) | Biopharma(a) | Upjohn(a) | Other(b) | Non-GAAP Adjusted(c) | Reconciling Items(d) | GAAP Reported | ||||||||||||||||||
Revenues | $ | 9,795 | $ | 2,006 | $ | — | $ | 11,801 | $ | — | $ | 11,801 | ||||||||||||
Cost of sales | 1,713 | 506 | 17 | 2,236 | 44 | 2,281 | ||||||||||||||||||
% of revenue | 17.5 | % | 25.2 | % | * | 18.9 | % | * | 19.3 | % | ||||||||||||||
Selling, informational and administrative expenses | 1,488 | 273 | 1,047 | 2,808 | 222 | 3,030 | ||||||||||||||||||
Research and development expenses | 216 | 56 | 1,623 | 1,895 | 237 | 2,132 | ||||||||||||||||||
Amortization of intangible assets | 71 | — | — | 71 | 834 | 905 | ||||||||||||||||||
Restructuring charges and certain acquisition-related costs | — | — | — | — | 362 | 362 | ||||||||||||||||||
(Gain) on completion of Consumer Healthcare JV transaction | — | — | — | — | — | — | ||||||||||||||||||
Other (income)/deductions––net | (342 | ) | 2 | (21 | ) | (361 | ) | (501 | ) | (862 | ) | |||||||||||||
Income/(loss) from continuing operations before provision/(benefit) for taxes on income | 6,650 | 1,168 | (2,666 | ) | 5,152 | (1,199 | ) | 3,953 | ||||||||||||||||
See end of tables for notes (a) through (d).
81
Six Months Ended June 28, 2020 | ||||||||||||||||||||||||
(MILLIONS OF DOLLARS) | Biopharma(a) | Upjohn(a) | Other(b) | Non-GAAP Adjusted(c) | Reconciling Items(d) | GAAP Reported | ||||||||||||||||||
Revenues | $ | 19,802 | $ | 4,027 | $ | — | $ | 23,829 | $ | — | $ | 23,829 | ||||||||||||
Cost of sales | 3,488 | 1,003 | 95 | 4,586 | 73 | 4,658 | ||||||||||||||||||
% of revenue | 17.6 | % | 24.9 | % | * | 19.2 | % | * | 19.5 | % | ||||||||||||||
Selling, informational and administrative expenses | 2,980 | 560 | 2,013 | 5,553 | 350 | 5,903 | ||||||||||||||||||
Research and development expenses | 401 | 110 | 3,110 | 3,622 | 234 | 3,856 | ||||||||||||||||||
Amortization of intangible assets | 141 | — | — | 142 | 1,648 | 1,790 | ||||||||||||||||||
Restructuring charges and certain acquisition-related costs | — | — | — | — | 431 | 431 | ||||||||||||||||||
(Gain) on completion of Consumer Healthcare JV transaction | — | — | — | — | (6 | ) | (6 | ) | ||||||||||||||||
Other (income)/deductions––net | (588 | ) | (5 | ) | 45 | (547 | ) | (94 | ) | (641 | ) | |||||||||||||
Income/(loss) from continuing operations before provision/(benefit) for taxes on income | 13,379 | 2,359 | (5,264 | ) | 10,474 | (2,635 | ) | 7,838 | ||||||||||||||||
Second Quarter of 2019 | ||||||||||||||||||||||||
(MILLIONS OF DOLLARS) | Biopharma(a) | Upjohn(a) | Other(b) | Non-GAAP Adjusted(c) | Reconciling Items(d) | GAAP Reported | ||||||||||||||||||
Revenues | $ | 9,432 | $ | 2,970 | $ | 862 | $ | 13,264 | $ | — | $ | 13,264 | ||||||||||||
Cost of sales | 1,732 | 551 | 273 | 2,556 | 20 | 2,576 | ||||||||||||||||||
% of revenue | 18.4 | % | 18.6 | % | * | 19.3 | % | * | 19.4 | % | ||||||||||||||
Selling, informational and administrative expenses | 1,685 | 385 | 1,394 | 3,464 | 48 | 3,511 | ||||||||||||||||||
Research and development expenses | 200 | 60 | 1,565 | 1,825 | 16 | 1,842 | ||||||||||||||||||
Amortization of intangible assets | 67 | — | — | 67 | 1,117 | 1,184 | ||||||||||||||||||
Restructuring charges and certain acquisition-related costs | — | — | — | — | (115 | ) | (115 | ) | ||||||||||||||||
(Gain) on completion of Consumer Healthcare JV transaction | — | — | — | — | — | — | ||||||||||||||||||
Other (income)/deductions––net | (323 | ) | 1 | 222 | (100 | ) | 226 | 126 | ||||||||||||||||
Income/(loss) from continuing operations before provision/(benefit) for taxes on income | 6,071 | 1,973 | (2,592 | ) | 5,452 | (1,311 | ) | 4,141 | ||||||||||||||||
Six Months Ended June 30, 2019 | ||||||||||||||||||||||||
(MILLIONS OF DOLLARS) | Biopharma(a) | Upjohn(a) | Other(b) | Non-GAAP Adjusted(c) | Reconciling Items(d) | GAAP Reported | ||||||||||||||||||
Revenues | $ | 18,477 | $ | 6,184 | $ | 1,721 | $ | 26,382 | $ | — | $ | 26,382 | ||||||||||||
Cost of sales | 3,374 | 1,088 | 510 | 4,971 | 38 | 5,009 | ||||||||||||||||||
% of revenue | 18.3 | % | 17.6 | % | * | 18.8 | % | * | 19.0 | % | ||||||||||||||
Selling, informational and administrative expenses | 3,201 | 722 | 2,853 | 6,775 | 75 | 6,850 | ||||||||||||||||||
Research and development expenses | 364 | 115 | 3,039 | 3,518 | 26 | 3,544 | ||||||||||||||||||
Amortization of intangible assets | 129 | — | — | 130 | 2,237 | 2,367 | ||||||||||||||||||
Restructuring charges and certain acquisition-related costs | — | — | — | — | (69 | ) | (69 | ) | ||||||||||||||||
(Gain) on completion of Consumer Healthcare JV transaction | — | — | — | — | — | — | ||||||||||||||||||
Other (income)/deductions––net | (545 | ) | 8 | 302 | (235 | ) | 453 | 218 | ||||||||||||||||
Income/(loss) from continuing operations before provision/(benefit) for taxes on income | 11,954 | 4,251 | (4,983 | ) | 11,223 | (2,760 | ) | 8,463 | ||||||||||||||||
* | Indicates calculation not meaningful or result is equal to or greater than 100%. |
(a) | Amounts represent the revenues and costs managed by each of the Biopharma and Upjohn reportable operating segments for the periods presented. The expenses generally include only those costs directly attributable to the operating segment. |
82
(b) | Other comprises the revenues and costs included in our Adjusted income components (see footnote (c) below) that are managed outside Biopharma and Upjohn and includes the following: |
Second Quarter of 2020 | ||||||||||||||||||||
Other Business Activities | ||||||||||||||||||||
(MILLIONS OF DOLLARS) | WRDM(i) | GPD(ii) | Other(iii) | Corporate and Other Unallocated(iv) | Total | |||||||||||||||
Revenues | $ | — | $ | — | $ | — | $ | — | $ | — | ||||||||||
Cost of sales | — | — | — | 17 | 17 | |||||||||||||||
Selling, informational and administrative expenses | 40 | — | 107 | 900 | 1,047 | |||||||||||||||
Research and development expenses | 646 | 727 | 6 | 245 | 1,623 | |||||||||||||||
Amortization of intangible assets | — | — | — | — | — | |||||||||||||||
Restructuring charges and certain acquisition-related costs | — | — | — | — | — | |||||||||||||||
(Gain) on completion of Consumer Healthcare JV transaction | — | — | — | — | — | |||||||||||||||
Other (income)/deductions––net | — | 5 | — | (25 | ) | (21 | ) | |||||||||||||
Income/(loss) from continuing operations before provision/(benefit) for taxes on income | (685 | ) | (732 | ) | (113 | ) | (1,136 | ) | (2,666 | ) | ||||||||||
Six Months Ended June 28, 2020 | ||||||||||||||||||||
Other Business Activities | ||||||||||||||||||||
(MILLIONS OF DOLLARS) | WRDM(i) | GPD(ii) | Other(iii) | Corporate and Other Unallocated(iv) | Total | |||||||||||||||
Revenues | $ | — | $ | — | $ | — | $ | — | $ | — | ||||||||||
Cost of sales | (1 | ) | 1 | — | 96 | 95 | ||||||||||||||
Selling, informational and administrative expenses | 68 | — | 213 | 1,732 | 2,013 | |||||||||||||||
Research and development expenses | 1,224 | 1,498 | 11 | 376 | 3,110 | |||||||||||||||
Amortization of intangible assets | — | — | — | — | — | |||||||||||||||
Restructuring charges and certain acquisition-related costs | — | — | — | — | — | |||||||||||||||
(Gain) on completion of Consumer Healthcare JV transaction | — | — | — | — | — | |||||||||||||||
Other (income)/deductions––net | 2 | 1 | 1 | 41 | 45 | |||||||||||||||
Income/(loss) from continuing operations before provision/(benefit) for taxes on income | (1,293 | ) | (1,499 | ) | (226 | ) | (2,245 | ) | (5,264 | ) | ||||||||||
Second Quarter of 2019 | ||||||||||||||||||||
Other Business Activities | ||||||||||||||||||||
(MILLIONS OF DOLLARS) | WRDM(i) | GPD(ii) | Other(iii) | Corporate and Other Unallocated(iv) | Total | |||||||||||||||
Revenues | $ | — | $ | — | $ | 862 | $ | — | $ | 862 | ||||||||||
Cost of sales | — | 1 | 276 | (4 | ) | 273 | ||||||||||||||
Selling, informational and administrative expenses | 29 | — | 407 | 958 | 1,394 | |||||||||||||||
Research and development expenses | 548 | 764 | 32 | 221 | 1,565 | |||||||||||||||
Amortization of intangible assets | — | — | — | — | — | |||||||||||||||
Restructuring charges and certain acquisition-related costs | — | — | — | — | — | |||||||||||||||
(Gain) on completion of Consumer Healthcare JV transaction | — | — | — | — | — | |||||||||||||||
Other (income)/deductions––net | (1 | ) | 1 | (1 | ) | 224 | 222 | |||||||||||||
Income/(loss) from continuing operations before provision/(benefit) for taxes on income | (576 | ) | (765 | ) | 148 | (1,399 | ) | (2,592 | ) | |||||||||||
83
Six Months Ended June 30, 2019 | ||||||||||||||||||||
Other Business Activities | ||||||||||||||||||||
(MILLIONS OF DOLLARS) | WRDM(i) | GPD(ii) | Other(iii) | Corporate and Other Unallocated(iv) | Total | |||||||||||||||
Revenues | $ | — | $ | — | $ | 1,721 | $ | — | $ | 1,721 | ||||||||||
Cost of sales | — | 1 | 550 | (42 | ) | 510 | ||||||||||||||
Selling, informational and administrative expenses | 50 | — | 795 | 2,008 | 2,853 | |||||||||||||||
Research and development expenses | 1,080 | 1,490 | 63 | 406 | 3,039 | |||||||||||||||
Amortization of intangible assets | — | — | — | — | — | |||||||||||||||
Restructuring charges and certain acquisition-related costs | — | — | — | — | — | |||||||||||||||
(Gain) on completion of Consumer Healthcare JV transaction | — | — | — | — | — | |||||||||||||||
Other (income)/deductions––net | (2 | ) | — | — | 304 | 302 | ||||||||||||||
Income/(loss) from continuing operations before provision/(benefit) for taxes on income | (1,128 | ) | (1,491 | ) | 313 | (2,676 | ) | (4,983 | ) | |||||||||||
(i) | WRDM—the R&D and Medical expenses managed by our WRDM organization, which is generally responsible for research projects for our Biopharma portfolio until proof-of-concept is achieved and then for transitioning those projects to the GPD organization for possible clinical and commercial development. R&D spending may include upfront and milestone payments for intellectual property rights. The WRDM organization also has responsibility for certain science-based and other platform-services organizations, which provide end-to-end technical expertise and other services to the various R&D projects, as well as the Worldwide Medical and Safety group, which ensures that Pfizer provides all stakeholders––including patients, healthcare providers, pharmacists, payers and health authorities––with complete and up-to-date information on the risks and benefits associated with Pfizer products so that they can make appropriate decisions on how and when to use Pfizer’s medicines. |
(ii) | GPD––the costs associated with our GPD organization, which is generally responsible for clinical trials from WRDM in the Biopharma portfolio, including late stage portfolio spend. GPD also provides technical support and other services to Pfizer R&D projects. GPD is responsible for facilitating all regulatory submissions and interactions with regulatory agencies. |
(iii) | Other—the operating results of our Consumer Healthcare business, through July 31, 2019, and costs associated with other commercial activities not managed as part of Biopharma or Upjohn, including all strategy, business development, portfolio management and valuation capabilities, which previously had been reported in various parts of the organization. |
(iv) | Corporate and Other Unallocated––the costs associated with corporate enabling functions (such as digital, global real estate operations, legal, finance, human resources, worldwide public affairs, compliance and worldwide procurement), patient advocacy activities and certain compensation and other corporate costs, such as interest income and expense, and gains and losses on investments, as well as overhead expenses associated with our manufacturing (which include manufacturing variances associated with production) and commercial operations that are not directly assessed to an operating segment, as business unit (segment) management does not manage these costs. Corporate and Other Unallocated also includes our share of earnings from the GSK Consumer Healthcare joint venture and other charges related to the GSK Consumer Healthcare joint venture, primarily representing our pro-rata share of restructuring and business combination accounting charges recorded by the GSK Consumer Healthcare joint venture. |
We recognized the following amounts in Cost of sales related to forward-exchange contracts designated as cash flow hedges of a portion of our foreign exchange-denominated forecasted intercompany inventory sales:
• | a $80 million net gain in the second quarter of 2020; |
• | a $150 million net gain in the first six months of 2020; |
• | a $59 million net gain in the second quarter of 2019; and |
• | a $103 million net gain in the first six months of 2019. |
For additional information, see Notes to Condensed Consolidated Financial Statements––Note 7E. Financial Instruments: Derivative Financial Instruments and Hedging Activities.
(c) | See the “Non-GAAP Financial Measure (Adjusted Income)” section of this MD&A for a definition of these “Adjusted Income” components. |
(d) | Includes costs associated with (i) purchase accounting adjustments; (ii) acquisition-related costs; and (iii) certain significant items, which are substantive and/or unusual, and in some cases recurring, items (such as gains on the completion of joint venture transactions, restructuring charges, legal charges or gains and losses from equity securities), that are evaluated on an individual basis by management. For additional information about these reconciling items and/or our Non-GAAP adjusted measure of performance, see the “Non-GAAP Financial Measure (Adjusted Income)” section of this MD&A. |
Second Quarter of 2020 vs. Second Quarter of 2019
Biopharma Operating Segment
Revenues
Biopharma Revenues increased $363 million, or 4%, to $9.8 billion in the second quarter of 2020 from $9.4 billion in the second quarter of 2019, reflecting an operational increase of $593 million, or 6%, partially offset by the unfavorable impact of foreign exchange of $230 million, or 2%.
84
The following provides an analysis of the increase in Biopharma worldwide Revenues:
(MILLIONS OF DOLLARS) | ||||
Biopharma Revenues, for the three months ended June 30, 2019 | $ | 9,432 | ||
Operational growth/(decline): | ||||
Continued growth from certain key brands(a) | 351 | |||
Higher revenues for the rare disease business driven by the U.S. launches of Vyndaqel in May 2019 and Vyndamax in September 2019 for ATTR-CM; and in international markets, primarily driven by the March 2019 launch of the ATTR-CM indication in Japan and the February 2020 approval of the ATTR-CM indication in the EU | 175 | |||
Higher revenues for Inlyta, primarily in the U.S., driven by increased demand resulting from the second quarter of 2019 U.S. FDA approvals for the combinations of certain immune checkpoint inhibitors plus Inlyta for the first-line treatment of patients with advanced RCC | 93 | |||
Higher revenues for Biosimilars, primarily in the U.S., driven by strong volume performance from Retacrit and new product launches | 78 | |||
Higher revenues for Xtandi primarily driven by continued strong demand in the metastatic and non-metastatic castration-resistant prostate cancer indications as well as the metastatic (mCSPC) castration-sensitive prostate cancer indication, which was approved in the U.S. in December 2019 | 64 | |||
Lower revenues for Enbrel internationally, primarily reflecting continued biosimilar competition in most developed Europe markets, as well as in Japan and Brazil, all of which is expected to continue | (66 | ) | ||
Decline in Prevnar 13/Prevenar 13 revenues primarily in the U.S., reflecting the expected unfavorable impact of disruptions to wellness visits for pediatric and adult patients due to COVID-19-related mobility restrictions or limitations, partially offset by the favorable impact of timing associated with government purchases for the pediatric indication, compared to the prior-year period. The decline in the U.S. was partially offset by growth in international markets primarily reflecting significantly increased adult uptake in Germany and certain other markets resulting from greater vaccine awareness for respiratory illnesses, including specifically pneumococcal disease, due to the COVID-19 pandemic, as well as continued strong pediatric uptake in China | (28 | ) | ||
Other operational factors, net | (74 | ) | ||
Operational growth, net | 593 | |||
Unfavorable impact of foreign exchange | (230 | ) | ||
Biopharma Revenues increase | 363 | |||
Biopharma Revenues, for the three months ended June 28, 2020 | $ | 9,795 | ||
(a) | Certain key brands represent Ibrance, Eliquis and Xeljanz. See the “Analysis of the Condensed Consolidated Statements of Income––Revenues––Selected Product Discussion” section of this MD&A for product analysis information. |
Total Biopharma revenues from emerging markets decreased $80 million, or 4%, to $1.9 billion in the second quarter of 2020 from $2.0 billion in the second quarter of 2019, reflecting operational growth of $82 million, or 4%. Foreign exchange had an unfavorable impact of 8% on total Biopharma revenues from emerging markets. The operational increase in emerging markets was primarily driven by Prevenar 13 and Eliquis, partially offset by Sulperazon.
Costs and Expenses
• | Cost of sales as a percentage of Revenues decreased 0.9 percentage points, driven by a favorable change in product mix, which includes an increase in alliance revenue which has no associated cost of sales, and a favorable impact of foreign exchange, partially offset by an increase in royalty expenses based on the mix of products sold. |
• | The decrease in Cost of sales of 1% was mainly driven by a favorable impact of foreign exchange, partially offset by an increase in royalty expense based on the mix of products sold, and an unfavorable change in product mix. |
• | The decrease in Selling, informational and administrative expenses of 12% was mostly driven by lower spending on sales and marketing activities due to the impact of the COVID-19 pandemic, a favorable impact of foreign exchange, and lower investments across the Inflammation & Immunology portfolio, partially offset by additional investment in the Oncology portfolio in developed markets. |
• | The increase in Research and development expenses of 8% was mainly related to increased medical spending, primarily for Rare Disease, Internal Medicine, and Hospital. |
• | The favorable change in Other (income)/deductions––net includes, among other things, an increase in income from collaborations, out-licensing arrangements and sales of compound/product rights, partially offset by a decrease in royalty- related income mainly due to the non-recurrence of a one-time favorable resolution of a legal dispute in the second quarter of 2019. |
85
Upjohn Operating Segment
Revenues
Upjohn Revenues decreased $964 million, or 32%, to $2.0 billion in the second quarter of 2020 from $3.0 billion in the second quarter of 2019, reflecting an operational decrease of $917 million, or 31%, and the unfavorable impact of foreign exchange of $48 million, or 2%.
The following provides an analysis of the decrease in Upjohn worldwide Revenues:
(MILLIONS OF DOLLARS) | ||||
Upjohn Revenues, for the three months ended June 30, 2019 | $ | 2,970 | ||
Operational growth/(decline): | ||||
Lower worldwide revenues for Lyrica, primarily in the U.S., reflecting the expected significantly lower volumes associated with multi-source generic competition that began in the U.S. in July 2019 | (826 | ) | ||
Decline in revenues for Revatio driven by lower U.S. Oral Suspension formulation sales and pricing pressures due to multi-source generic competition | (34 | ) | ||
Growth in revenues for Lipitor and Norvasc, reflecting significant revenue declines in the prior-year period associated with the VBP program in China, which was initially implemented in certain cities in March 2019, and expanded nationwide beginning in December 2019, resulting in significant volume and price erosion | 55 | |||
Other operational factors, net | (111 | ) | ||
Operational decline, net | (917 | ) | ||
Unfavorable impact of foreign exchange | (48 | ) | ||
Upjohn Revenues decrease | (964 | ) | ||
Upjohn Revenues, for the three months ended June 28, 2020 | $ | 2,006 | ||
Total Upjohn revenues from emerging markets increased $11 million, or 1%, to $862 million in the second quarter of 2020 from $851 million in the second quarter of 2019, reflecting operational growth of $57 million, or 7%. Foreign exchange had an unfavorable impact of 5% on total Upjohn revenues from emerging markets. The operational increase in emerging markets was primarily driven by Lipitor and Norvasc in China.
Costs and Expenses
• | Cost of sales as a percentage of Revenues increased 6.7 percentage points, driven by lower Lyrica revenues, primarily in the U.S. due to multi-source generic competition that began in July 2019, partially offset by lower royalty expense for Lyrica due to its U.S. patent expiration. |
• | The decrease in Cost of sales of 8% was mainly driven by a decrease in sales volume and lower royalty expense primarily due to the Lyrica patent expiration and multi-source generic competition that began in the U.S. in July 2019. |
• | Selling, informational and administrative expenses decreased 29% driven by a decrease in field force expense as well as advertising and promotion expenses, primarily related to Lipitor and Norvasc, due to the volume-based procurement (VBP) program in China, which was initially implemented in certain cities in March 2019 and expanded nationwide beginning in December 2019, as well as Lyrica in the U.S. due to generic competition that began in July 2019 and anticipated generic competition for Celebrex in Japan beginning in June 2020. |
• | Research and development expenses and Other (income)/deductions––net were relatively unchanged. |
First Six Months of 2020 vs. First Six Months of 2019
Biopharma Operating Segment
Revenues
Biopharma Revenues increased $1.3 billion, or 7%, to $19.8 billion in the first six months of 2020 from $18.5 billion in the first six months of 2019, reflecting an operational increase of $1.7 billion, or 9%, and an unfavorable impact of foreign exchange of $345 million, or 2%.
The following provides an analysis of the increase in Biopharma worldwide Revenues:
86
(MILLIONS OF DOLLARS) | ||||
Biopharma Revenues, for the six months ended June 30, 2019 | $ | 18,477 | ||
Operational growth/(decline): | ||||
Continued growth from certain key brands(a) | 812 | |||
Higher revenues for the rare disease business driven by the U.S. launches of Vyndaqel in May 2019 and Vyndamax in September 2019 for ATTR-CM; and in international markets, primarily driven by the March 2019 launch of the ATTR-CM indication in Japan and the February 2020 approval of the ATTR-CM indication in the EU | 353 | |||
Higher revenues for the Hospital business in the U.S., primarily driven by increased demand for certain sterile injectable products utilized in the intubation and ongoing treatment of mechanically-ventilated COVID-19 patients as well as continued growth from Panzyga following its November 2018 U.S. launch | 212 | |||
Higher revenues for Inlyta, primarily in the U.S., driven by increased demand resulting from the second quarter of 2019 U.S. FDA approvals for the combinations of certain immune checkpoint inhibitors plus Inlyta for the first-line treatment of patients with advanced RCC | 191 | |||
Higher revenues for Biosimilars, primarily in the U.S., driven by strong volume performance from Retacrit, new product launches and steady volume and share growth in the U.S. for Inflectra, across hospital channels, clinics and alternate sites of care | 190 | |||
Higher revenues for Xtandi primarily driven by continued strong demand in the metastatic and non-metastatic castration-resistant prostate cancer indications as well as the metastatic (mCSPC) castration-sensitive prostate cancer indication, which was approved in the U.S. in December 2019 | 106 | |||
Lower revenues for Enbrel internationally, primarily reflecting continued biosimilar competition in most developed Europe markets, as well as in Brazil and Japan, all of which is expected to continue | (159 | ) | ||
Decline in Prevnar 13/Prevenar 13 revenues primarily in the U.S., reflecting the expected unfavorable impact of disruptions to wellness visits for pediatric and adult patients due to COVID-19-related mobility restrictions or limitations, partially offset by the favorable impact of timing associated with government purchases for the pediatric indication, compared to the prior-year period. The decline in the U.S. was partially offset by growth in international markets primarily reflecting significantly increased adult uptake in Germany and certain other markets resulting from greater vaccine awareness for respiratory illnesses, including specifically pneumococcal disease, due to the COVID-19 pandemic, as well as continued strong pediatric uptake in China | (47 | ) | ||
Other operational factors, net | 11 | |||
Operational growth, net | 1,670 | |||
Unfavorable impact of foreign exchange | (345 | ) | ||
Biopharma Revenues increase | 1,325 | |||
Biopharma Revenues, for the six months ended June 28, 2020 | $ | 19,802 | ||
(a) | Certain key brands represent Ibrance, Eliquis and Xeljanz. See the “Analysis of the Condensed Consolidated Statements of Income––Revenues––Selected Product Discussion” section of this MD&A for product analysis information. |
Total Biopharma revenues from emerging markets increased $143 million, or 4%, to $4.1 billion in the first six months of 2020 from $3.9 billion in the first six months of 2019, reflecting operational growth of $379 million, or 10%. Foreign exchange had an unfavorable impact of 6% on total Biopharma revenues from emerging markets. The operational increase in emerging markets was primarily driven by Prevenar 13, Eliquis, certain anti-infective products, primarily Zavicefta and Zithromax, Ibrance and Xalkori, partially offset by Sulperazon.
Costs and Expenses
• | Cost of sales as a percentage of Revenues decreased 0.6 percentage points, driven by a favorable change in product mix, which includes an increase in alliance revenue which has no associated cost of sales, partially offset by an increase in royalty expenses based on the mix of products sold. |
• | The increase in Cost of sales of 3% was mainly driven by an increase in sales volumes for various products and an increase in royalty expenses based on the mix of products sold, partially offset by a favorable impact of foreign exchange. |
• | The decrease in Selling, informational and administrative expenses of 7% was mostly driven by lower spending on sales and marketing activities due to the impact of the COVID-19 pandemic, lower investments across the Inflammation & Immunology portfolio, a favorable impact of foreign exchange, and lower healthcare reform expenses, partially offset by additional investment in the Oncology portfolio in developed markets. |
• | The increase in Research and development expenses of 10% was mainly related to increased medical spending, primarily for Oncology, Internal Medicine, and Rare Disease. |
• | The favorable change in Other (income)/deductions––net includes, among other things, an increase in income from collaborations, out-licensing arrangements and sales of compound/product rights, partially offset by a decrease in royalty- related income mainly due to the non-recurrence of a one-time favorable resolution of a legal dispute in the second quarter of 2019. |
87
Upjohn Operating Segment
Revenues
Upjohn Revenues decreased $2.2 billion, or 35%, to $4.0 billion in the first six months of 2020 from $6.2 billion in the first six months of 2019, reflecting an operational decrease of $2.1 billion, or 34%, and the unfavorable impact of foreign exchange of $66 million, or 1%.
The following provides an analysis of the decrease in Upjohn worldwide Revenues:
(MILLIONS OF DOLLARS) | ||||
Upjohn Revenues, for the six months ended June 30, 2019 | $ | 6,184 | ||
Operational decline: | ||||
Lower worldwide revenues for Lyrica, primarily in the U.S., reflecting the expected significantly lower volumes associated with multi-source generic competition that began in the U.S. in July 2019 | (1,655 | ) | ||
Declines in revenues for Lipitor and Norvasc, primarily resulting from the VBP program in China, which was initially implemented in certain cities in March 2019, and expanded nationwide beginning in December 2019, resulting in significant volume and price erosion | (254 | ) | ||
Decline in revenues for Revatio driven by lower U.S. Oral Suspension formulation sales and pricing pressures due to multi-source generic competition | (58 | ) | ||
Other operational factors, net | (124 | ) | ||
Operational decline, net | (2,090 | ) | ||
Unfavorable impact of foreign exchange | (66 | ) | ||
Upjohn Revenues decrease | (2,156 | ) | ||
Upjohn Revenues, for the six months ended June 28, 2020 | $ | 4,027 | ||
Total Upjohn revenues from emerging markets decreased $307 million, or 15%, to $1.7 billion in the first six months of 2020 from $2.0 billion in the first six months of 2019, reflecting an operational decline of $247 million or, 12%, and the unfavorable impact of foreign exchange of 3% on total Upjohn revenues from emerging markets. The operational decline in emerging markets was primarily driven by Lipitor and Norvasc in China.
Costs and Expenses
• | Cost of sales as a percentage of Revenues increased 7.3 percentage points, driven by lower Lyrica revenues, primarily in the U.S. due to multi-source generic competition that began in July 2019, lower Lipitor and Norvasc revenues due to the VBP program in China, which was initially implemented in March 2019 and expanded nationwide beginning in December 2019, and an unfavorable impact of foreign exchange, partially offset by lower royalty expense for Lyrica due to its U.S. patent expiration. |
• | The decrease in Cost of sales of 8% was mainly driven by lower royalty expense and a decrease in sales volume primarily due to the Lyrica patent expiration and multi-source generic competition that began in the U.S. in July 2019. |
• | Selling, informational and administrative expenses decreased 22% driven by a reduction in field force expense as well as advertising and promotion expenses, primarily related to Lyrica in the U.S. due to generic competition that began in July 2019 and the anticipated generic competition for Celebrex in Japan that began in June 2020, as well as a decrease in Lipitor and Norvasc expenses due to the VBP program in China, which was initially implemented in certain cities in March 2019 and expanded nationwide beginning in December 2019. |
• | Research and development expenses and Other (income)/deductions––net were relatively unchanged. |
ANALYSIS OF THE CONDENSED CONSOLIDATED STATEMENTS OF CASH FLOWS
Six Months Ended | |||||||||||
(MILLIONS OF DOLLARS) | June 28, 2020 | June 30, 2019 | % Change | ||||||||
Cash provided by/(used in): | |||||||||||
Operating activities | $ | 6,688 | $ | 4,309 | 55 | ||||||
Investing activities | (13,082 | ) | 5,648 | * | |||||||
Financing activities | 6,959 | (9,318 | ) | * | |||||||
Effect of exchange-rate changes on cash and cash equivalents and restricted cash and cash equivalents | (70 | ) | (28 | ) | * | ||||||
Net increase in Cash and cash equivalents and restricted cash and cash equivalents | $ | 495 | $ | 612 | (19 | ) | |||||
* Calculation not meaningful or results are equal to or greater than 100%. | |||||||||||
88
Operating Activities
The increase in net cash provided by operating activities is driven by the net change in Other changes in assets and liabilities, net of acquisitions and divestitures, partially offset by a decrease in net income, reflecting the lower contribution from the Consumer Healthcare business as a result of the July 31, 2019 completion of the Consumer Healthcare joint venture transaction with GSK.
In the first six months of 2020, the change in the line item Other adjustments, net primarily reflects, among other items:
• | an increase in equity method dividends received, |
partially offset by:
• | an increase in net unrealized gains on equity securities; |
• | an increase in equity income; and |
• | an increase in accreted interest on debt discount. |
In the condensed consolidated statements of cash flows, the line item Other changes in assets and liabilities, net of acquisitions and divestitures is presented excluding the effects of changes in foreign currency exchange rates, as these changes do not reflect actual cash inflows or outflows, and excluding any other significant non-cash movements. Accordingly, the amounts shown will not necessarily agree with the changes in the assets and liabilities that are presented in our condensed consolidated balance sheets. In the first six months of 2020 and 2019, the line item Other changes in assets and liabilities, net of acquisitions and divestitures, primarily reflects changes, in the normal course of business, in trade accounts receivable, inventories, other current and noncurrent assets, trade accounts payable, accrued compensation, and other current and noncurrent liabilities, as well as in 2019, the adjustment necessary to reflect the non-cash nature of the favorable settlement of an IRS audit for multiple tax years (see Notes to Consolidated Financial Statements––Note 5D. Tax Matters: Tax Contingencies in our 2019 Financial Report).
Investing Activities
The change in net cash provided by/(used in) investing activities was mostly attributable to:
• | a $16.7 billion increase in net purchases of short-term investments with original maturities of three months or less, largely due to the $11.4 billion of proceeds from the Upjohn long-term debt issuances in the second quarter of 2020, which were invested in money market funds (see Notes to Condensed Consolidated Financial Statements—Note 7D. Financial Instruments: Long-Term Debt and —Note 7A. Financial Instruments: Fair Value Measurements); and |
• | a $1.4 billion decrease in proceeds from redemptions and sales of short-term investments. |
Financing Activities
The change in net cash provided by/(used in) financing activities was primarily attributable to:
• | an increase in issuances of long-term debt of $11.7 billion (see Notes to Condensed Consolidated Financial Statements—Note 7D. Financial Instruments: Long-Term Debt); |
• | a decrease in purchases of common stock of $8.9 billion; and |
• | lower repayments on long-term debt of $3.2 billion, |
partially offset by:
• | $3.1 billion net payments on short-term borrowings in the first six months of 2020, compared to $4.3 billion net proceeds raised from short-term borrowings in the first six months of 2019. |
ANALYSIS OF FINANCIAL CONDITION, LIQUIDITY AND CAPITAL RESOURCES
We rely largely on operating cash flows, short-term investments, short-term commercial paper borrowings and long-term debt to provide for our liquidity requirements. We continue our efforts to improve cash inflows through working capital efficiencies. We target specific areas of focus including accounts receivable, inventories, accounts payable, and other working capital, which allows us to optimize our operating cash flows. Due to our significant operating cash flows as well as our financial assets, access to capital markets and available lines of credit and revolving credit agreements, we believe that we have, and will maintain, the ability to meet our liquidity needs for the foreseeable future, which can include, among others:
• | the working capital requirements of our operations, including our R&D activities; |
• | investments in our business; |
• | dividend payments and potential increases in the dividend rate; |
• | share repurchases; |
• | the cash requirements associated with our cost-reduction/productivity initiatives; |
• | paying down outstanding debt; |
89
• | contributions to our pension and postretirement plans; and |
• | business-development activities. |
Our long-term debt is rated high-quality by both S&P and Moody’s. See the “Credit Ratings” section below. As market conditions change, we continue to monitor our liquidity position. We have taken and will continue to take a conservative approach to our financial investments. Both short-term and long-term debt investments consist primarily of high-quality, highly liquid, well-diversified available-for-sale debt securities.
Selected Measures of Liquidity and Capital Resources
The following table provides certain relevant measures of our liquidity and capital resources: | ||||||||
(MILLIONS OF DOLLARS, EXCEPT RATIOS AND PER COMMON SHARE DATA) | June 28, 2020 | December 31, 2019 | ||||||
Selected financial assets(a): | ||||||||
Cash and cash equivalents | $ | 1,801 | $ | 1,305 | ||||
Restricted short-term investments | 11,412 | — | ||||||
Short-term investments | 9,581 | 8,525 | ||||||
Long-term investments, excluding private equity securities at cost | 2,370 | 2,258 | ||||||
25,163 | 12,088 | |||||||
Debt: | ||||||||
Short-term borrowings, including current portion of long-term debt | 13,084 | 16,195 | ||||||
Long-term debt | 50,529 | 35,955 | ||||||
63,613 | 52,150 | |||||||
Selected net financial liabilities | $ | (38,450 | ) | $ | (40,062 | ) | ||
Working capital(b) | $ | 13,701 | $ | (4,501 | ) | |||
Ratio of current assets to current liabilities | 1.42:1 | 0.88:1 | ||||||
Total Pfizer Inc. shareholders’ equity per common share(c) | $ | 11.58 | $ | 11.41 | ||||
(a) | See Notes to Condensed Consolidated Financial Statements––Note 7. Financial Instruments for a description of certain assets held and for a description of credit risk related to our financial instruments held. |
(b) | The increase in working capital was primarily due to: |
• | an increase mainly driven by operating cash flow generation and the long-term debt issuances discussed below, partially offset by debt repayment and capital expenditures; and |
• | the timing of accruals, cash receipts and payments in the ordinary course of business. |
(c) | Represents total Pfizer Inc. shareholders’ equity divided by the actual number of common shares outstanding (which excludes treasury stock). |
In June 2020, Upjohn Inc. and Upjohn Finance B.V. (a wholly-owned subsidiary of Upjohn Inc.) completed privately placed debt offerings of $7.45 billion and €3.60 billion aggregate principal senior unsecured notes, respectively (the Upjohn Debt Transactions). See the “Agreement to Combine Upjohn with Mylan” section below for the discussion on the use of proceeds.
In May 2020, we completed a public offering of $4.0 billion aggregate principal amount of senior unsecured notes.
In March 2020, we:
• | completed a public offering of $1.25 billion aggregate principal amount of senior unsecured sustainability notes. The proceeds were initially used to repay outstanding commercial paper and subsequently will be used to help manage our environmental impact and support increased patient access to our medicines and vaccines, especially among underserved populations, and strengthen healthcare systems; and |
• | repurchased at par all $1.065 billion principal amount outstanding of senior unsecured notes that were due in 2047 before the maturity date, which did not have a material impact on our condensed consolidated financial statements. |
For additional information, see Notes to Condensed Consolidated Financial Statements––Note 7D. Financial Instruments: Long-Term Debt.
For additional information about the sources and uses of our funds, see the “Analysis of the Condensed Consolidated Statements of Cash Flows” section of this MD&A.
Agreement to Combine Upjohn with Mylan
In connection with our agreement to combine Upjohn with Mylan to form a new company, Viatris, discussed in the “Overview of Our Performance, Operating Environment, Strategy and Outlook––Our Business Development Initiatives” section of this MD&A, in June 2020, Upjohn Inc. (i) incurred $11.4 billion of debt in the Upjohn Debt Transactions, (ii) entered into a revolving credit agreement for up to $4 billion, $1.5 billion of which will be available in a single draw at or around the closing of the combination of Upjohn with Mylan for the sole purpose of funding the cash payment of $12 billion by Upjohn Inc. to Pfizer as partial consideration for Pfizer’s contribution of the Upjohn Business to Upjohn Inc. and (iii) entered into a $600 million delayed draw term loan agreement. Immediately prior to the proposed distribution to Pfizer’s stockholders of all of the
90
issued and outstanding shares of Upjohn Inc.’s common stock held by Pfizer (the Distribution), Upjohn Inc. will make a cash distribution of $12 billion to Pfizer. The proceeds of the revolving credit agreement, term loan agreement and the Upjohn Debt Transactions will be used to fund the $12 billion cash distribution from Upjohn Inc. to Pfizer prior to the Distribution. In the interim, the $11.4 billion of proceeds from the Upjohn Debt Transactions were invested by Upjohn Inc. in money market funds and classified as Restricted short-term investments in the condensed consolidated balance sheet as of June 28, 2020. Upon completion of the Upjohn Debt Transactions on June 23, 2020, the commitments under the senior unsecured $12 billion bridge facility were fully terminated. Pfizer has guaranteed the notes in the Upjohn Debt Transactions, and such guarantees will automatically and unconditionally terminate without the consent of holders of the notes upon the Distribution. Upjohn Inc. has guaranteed the notes issued by Upjohn Finance B.V., and Upjohn Inc. will remain a guarantor of such notes post Distribution. Following the separation, Upjohn Inc. and Upjohn Finance B.V., as applicable, will remain the obligor with respect to all of the aforementioned debt. See Notes to Condensed Consolidated Financial Statements––Note 7D. Financial Instruments: Long-Term Debt for additional information.
Domestic and International Selected Financial Assets
Many of our operations are conducted outside the U.S., and significant portions of our selected financial assets are held internationally. The amount of funds held in U.S. tax jurisdictions can fluctuate due to the timing of receipts and payments in the ordinary course of business and due to other reasons, such as business-development activities. As part of our ongoing liquidity assessments, we regularly monitor the mix of domestic and international cash flows (both inflows and outflows). The changes in tax law under the TCJA, which includes transitioning U.S. international taxation from a worldwide tax system to a territorial tax system, allow us to more easily access our selected financial assets globally.
Credit Ratings
Two major corporate debt-rating organizations, Moody’s and S&P, assign ratings to our short-term and long-term debt. A security rating is not a recommendation to buy, sell or hold securities and the rating is subject to revision or withdrawal at any time by the rating organization. Each rating should be evaluated independently of any other rating.
In June 2019, S&P placed Pfizer on “CreditWatch Negative” following the announcement of Pfizer’s intention to acquire Array. The CreditWatch placement was resolved with a one-notch downgrade of Pfizer’s debt rating to ‘AA-’ upon the consummation of the transaction. In July 2019, we announced that we entered into a definitive agreement to combine Upjohn with Mylan, which resulted in actions from both Moody’s and S&P. Moody’s placed Pfizer’s long-term rating under review for downgrade (limited to one-notch, or ‘A2’ upon close of the Mylan transaction) while S&P lowered Pfizer’s rating to ‘AA-’ (as a result of the Array transaction) and confirmed it will still remain on CreditWatch Negative (with the expectation the rating will be lowered one additional notch to ‘A+’ upon close of the Mylan transaction).
The following table provides the current ratings assigned by these rating agencies to our commercial paper and senior unsecured long-term debt: | ||||||||
NAME OF RATING AGENCY | Pfizer Commercial Paper | Pfizer Long-Term Debt | Outlook/Watch | Date of Last Rating Change | ||||
Rating | Rating | |||||||
Moody’s | P-1 | A1 | Under Review for Downgrade | October 2009 | ||||
S&P | A-1+ | AA- | CreditWatch Negative | July 2019 | ||||
Debt Capacity––Lines of Credit
We have available lines of credit and revolving credit agreements with a group of banks and other financial intermediaries. We typically maintain cash and cash equivalent balances and short-term investments which, together with our available revolving credit facilities, are in excess of our commercial paper and other short-term borrowings. As of June 28, 2020, we had access to a total of $15 billion in U.S. revolving credit facilities consisting of a $7 billion facility expiring in 2024 and an $8 billion facility expiring in September 2020, which may be used to support our commercial paper borrowings. In addition to the U.S. revolving credit facilities, our lenders have provided us an additional $611 million in lines of credit, of which $582 million expire within one year. Of these total lines of credit, $15.6 billion were unused as of June 28, 2020.
LIBOR
From time to time, we issue variable rate debt based on LIBOR, or undertake interest rate swaps that contain a variable element based on LIBOR. The U.K. Financial Conduct Authority announced in July 2017 that it will no longer compel banks to submit rates that are currently used to calculate LIBOR after 2021. Various governing parties, including government agencies, are working on a benchmark transition plan for LIBOR (and other interbank offered rates globally). We are monitoring their
91
progress, and we will likely amend contracts to accommodate any replacement rate where it is not already provided. We do not expect the transition to an alternative rate to have a material impact on our liquidity or financial resources.
Global Economic Conditions––General
The global economic environment has not had, nor do we anticipate it will have, a material impact on our liquidity or capital resources. Due to our significant operating cash flows, financial assets, access to capital markets and available lines of credit and revolving credit agreements, we continue to believe that we have, and will maintain, the ability to meet our liquidity needs for the foreseeable future. We monitor our liquidity position continuously in the face of evolving economic conditions. For additional information see the “Overview of Our Performance, Operating Environment, Strategy and Outlook––The Global Economic Environment” section in this MD&A.
Global Economic Conditions––Venezuela and Argentina Operations
Our Venezuela and Argentina operations function in hyperinflationary economies. The impact to Pfizer is not considered material.
Off-Balance Sheet Arrangements
In the ordinary course of business and in connection with the sale of assets and businesses and other transactions, we often indemnify our counterparties against certain liabilities that may arise in connection with a transaction or that are related to events and activities prior to or following a transaction. If the indemnified party were to make a successful claim pursuant to the terms of the indemnification, we may be required to reimburse the loss. These indemnification obligations generally are subject to various restrictions and limitations. Historically, we have not paid significant amounts under these provisions and, as of June 28, 2020, the estimated fair value of our indemnification obligations was not significant.
Certain of our co-promotion or license agreements give our licensors or partners the rights to negotiate for, or in some cases to obtain under certain financial conditions, co-promotion or other rights in specified countries with respect to certain of our products.
Share-Purchase Plans and Accelerated Share Repurchase Agreements
At June 28, 2020, our remaining share-purchase authorization was approximately $5.3 billion, with no repurchases in the first six months of 2020 and no repurchases currently planned for the remainder of 2020. See Notes to Consolidated Financial Statements––Note 12. Equity in our 2019 Financial Report for more information on our publicly announced share-purchase plans, including our accelerated share repurchase agreements.
Dividends on Common Stock
For quarterly cash dividend information, see Notes to Condensed Consolidated Financial Statements––Note 11. Equity.
Our current and projected dividends provide a return to shareholders while maintaining sufficient capital to invest in growing our businesses. Our dividends are not restricted by debt covenants. While the dividend level remains a decision of Pfizer’s Board of Directors and will continue to be evaluated in the context of future business performance, we currently believe that we can support future annual dividend increases, barring significant unforeseen events. Also, assuming Upjohn is spun off, Pfizer expects that immediately following the closing of the proposed transaction to combine Upjohn with Mylan, the combined dividend dollar amount received by Pfizer shareholders, based upon the combination of continued Pfizer ownership and approximately 0.12 shares of the new company (Viatris) expected to be granted for each Pfizer share in a spin-off, will equate to Pfizer’s dividend amount in effect immediately prior to closing.
92
NEW ACCOUNTING STANDARDS
Recently Adopted Accounting Standards
See Notes to Condensed Consolidated Financial Statements––Note 1B. Basis of Presentation and Significant Accounting Policies: Adoption of New Accounting Standards in 2020.
Recently Issued Accounting Standards, Not Adopted as of June 28, 2020 | ||||
Standard/Description | Effective Date | Effect on the Financial Statements or Other Significant Matters | ||
In December 2019, the FASB issued new guidance that simplifies the accounting for income taxes by eliminating certain exceptions to the guidance related to the approach for intraperiod tax allocation, the methodology for calculating income taxes in an interim period and the recognition of deferred tax liabilities for outside basis differences. The new guidance also simplifies aspects of the accounting for franchise taxes and enacted changes in tax laws or rates and clarifies the accounting for transactions that result in a step-up in the tax basis of goodwill. | January 1, 2021. Early adoption is permitted. | We do not expect this guidance to have a material impact on our consolidated financial statements. | ||
In March 2020, the FASB issued new guidance to address reference rate reform by providing temporary optional expedients and exceptions to the guidance for contracts, hedging relationships, and other transactions that reference LIBOR or another reference rate expected to be discontinued after 2021 because of reference rate reform. The new guidance provides the following optional expedients: 1. Simplify accounting analyses under current U.S. GAAP for contract modifications.2. Simplify the assessment of hedge effectiveness and allow hedging relationships affected by reference rate reform to continue.3. Allow a one-time election to sell or transfer debt securities classified as held to maturity that reference a rate affected by reference rate reform. | Elections can be adopted prospectively at any time in the first quarter of 2020 through December 31, 2022. | We are assessing the impact of the provisions of this new guidance on our consolidated financial statements. | ||
FORWARD-LOOKING INFORMATION AND FACTORS THAT MAY AFFECT FUTURE RESULTS
This report and other written or oral statements that we make from time to time contain forward-looking statements. Such forward-looking statements involve substantial risks and uncertainties. We have tried, wherever possible, to identify such statements by using words such as “will,” “may,” “could,” “likely,” “ongoing,” “anticipate,” “estimate,” “expect,” “project,” “intend,” “plan,” “believe,” “assume,” “target,” “forecast,” “guidance,” “goal,” “objective,” “aim,” “seek” and other words and terms of similar meaning or by using future dates in connection with any discussion of, among other things, our anticipated operating and financial performance, business plans and prospects, expectations for our product pipeline, in-line products and product candidates, including anticipated regulatory submissions, data read-outs, study starts, approvals, revenue contribution, growth, performance, timing of exclusivity and potential benefits, strategic reviews, capital allocation objectives, plans for and prospects of our acquisitions and other business-development activities, benefits anticipated from the reorganization of our commercial operations in 2019, sales efforts, expenses, interest rates, foreign exchange rates, the outcome of contingencies, such as legal proceedings, government regulation, our ability to successfully capitalize on growth opportunities or prospects, manufacturing and product supply, our efforts to respond to COVID-19, our expectations regarding the impact of COVID-19 on our business, operations and financial results and plans relating to share repurchases and dividends. In particular, these include statements relating to future actions, including, among others, the expected timing of closing of and costs associated with the pending transaction to combine Upjohn with Mylan to create a new global pharmaceutical company set forth in the “Overview of Our Performance, Operating Environment, Strategy and Outlook––Our Business Development Initiatives” section of this MD&A, the expected impact of patent expiries on our business set forth in the “Overview of Our Performance, Operating Environment, Strategy and Outlook––Our Operating Environment––Industry-Specific Challenges––Intellectual Property Rights and Collaboration/Licensing Rights” and “––Our Strategy––Organizing for Growth” sections of this MD&A, our efforts to respond to COVID-19, including, among other things, expectations regarding our investigational vaccine candidate against SARS-CoV-2 and our investigational protease inhibitor, and the anticipated impact of COVID-19 on our business, operations and financial results set forth in the “Overview of Our Performance, Operating Environment, Strategy and Outlook––The Global Economic Environment” and “––Our Financial Guidance for 2020” sections of this MD&A, the benefits expected from the reorganization of our commercial operations in 2019 and our expectations regarding growth set forth in the “Overview of Our Performance, Operating Environment, Strategy and Outlook––Our Strategy––Organizing for Growth” section of this
93
MD&A, the anticipated costs and savings from certain of our initiatives, primarily from our Transforming to a More Focused Company program, set forth in the “Overview of Our Performance, Operating Environment, Strategy and Outlook—Our Strategy—Transforming to a More Focused Company” and “Costs and Expenses––Restructuring Charges and Other Costs Associated with Acquisitions and Cost-Reduction/Productivity Initiatives” sections of this MD&A and in Notes to Condensed Consolidated Financial Statements––Note 3. Restructuring Charges and Other Costs Associated with Acquisitions and Cost-Reduction/Productivity Initiatives, the financial guidance set forth in the “Overview of Our Performance, Operating Environment, Strategy and Outlook––Our Financial Guidance for 2020” section of this MD&A, the expected impact of ACIP’s latest recommendation for Prevnar 13 for adults 65 and older on Prevnar 13’s revenues set forth in the “Analysis of the Condensed Consolidated Statements of Income––Revenues––Selected Product Discussion––Prevnar 13/Prevenar 13” section of this MD&A, our anticipated liquidity position set forth in the “Analysis of Financial Condition, Liquidity and Capital Resources” section of this MD&A, our expectations regarding dividends set forth in the “Analysis of Financial Condition, Liquidity and Capital Resources” section of this MD&A and the benefits expected from our business development transactions and the contributions that we expect to make from our general assets to the company’s pension and postretirement plans during 2020 set forth in the “Overview of Our Performance, Operating Environment, Strategy and Outlook––Our Financial Guidance for 2020” section of this MD&A and Notes to Condensed Consolidated Financial Statements––Note 10. Pension and Postretirement Benefit Plans. Among the factors that could cause actual results to differ materially from past results and future plans and projected future results are the following:
• | the outcome of R&D activities, including, without limitation, the ability to meet anticipated pre-clinical or clinical endpoints, commencement and/or completion dates for our pre-clinical or clinical trials, regulatory submission dates, regulatory approval dates and/or launch dates, as well as the possibility of unfavorable pre-clinical and clinical trial results, including the possibility of unfavorable new clinical data and further analyses of existing clinical data; |
• | the risk we may not be able to successfully address all of the comments received from regulatory authorities such as the FDA or the EMA, or obtain approval from regulators, which will depend on myriad factors, including such regulator making a determination as to whether a product’s benefits outweigh its known risks and a determination of the product’s efficacy; regulatory decisions impacting labeling, manufacturing processes, safety and/or other matters; and recommendations by technical or advisory committees, such as ACIP, that may impact the use of our vaccines; |
• | the speed with which regulatory authorizations, pricing approvals and product launches may be achieved; |
• | claims and concerns that may arise regarding the safety or efficacy of in-line products and product candidates, including claims and concerns that may arise from the outcome of post-approval clinical trials, which could result in the loss of marketing approval, changes in product labeling, and/or new or increased concerns about the side effects or efficacy of, a product that could affect its availability or commercial potential, such as the update to the U.S. and EU prescribing information for Xeljanz; |
• | the success of external business-development activities, including the ability to identify and execute on potential business development opportunities, the ability to satisfy the conditions to closing of announced transactions in the anticipated time frame or at all, the ability to realize the anticipated benefits of any such transactions, and the potential need to obtain additional equity or debt financing to pursue these opportunities, which could result in increased leverage and impact our credit ratings; |
• | competitive developments, including the impact on our competitive position of new product entrants, in-line branded products, generic products, private label products, biosimilars and product candidates that treat diseases and conditions similar to those treated by our in-line drugs and drug candidates; |
• | the implementation by the FDA and regulatory authorities in certain countries of an abbreviated legal pathway to approve biosimilar products, which could subject our biologic products to competition from biosimilar products, with attendant competitive pressures, after the expiration of any applicable exclusivity period and patent rights; |
• | risks related to our ability to develop and commercialize biosimilars, including risks associated with “at risk” launches, defined as the marketing of a product by Pfizer before the final resolution of litigation (including any appeals) brought by a third party alleging that such marketing would infringe one or more patents owned or controlled by the third party, and access challenges for our biosimilar products where our product may not receive appropriate formulary access or remains in a disadvantaged position relative to the innovator product; |
• | the ability to meet competition from generic, branded and biosimilar products after the loss or expiration of patent protection for our products or competitor products; |
• | the ability to successfully market both new and existing products domestically and internationally; |
• | difficulties or delays in manufacturing, sales or marketing, including delays caused by natural events, such as hurricanes; supply disruptions, shortages or stock-outs at our facilities; and legal or regulatory actions, such as |
94
warning letters, suspension of manufacturing, seizure of product, injunctions, debarment, recall of a product, delays or denials of product approvals, import bans or denial of import certifications;
• | the impact of public health outbreaks, epidemics or pandemics (such as the COVID-19 pandemic) on our business, operations and financial condition and results, including due to travel limitations and government-mandated work-from-home or shelter-in-place orders, manufacturing disruptions or delays, supply chain interruptions, including challenges related to reliance on third-party suppliers, disruptions to pipeline development and clinical trials, including difficulties or delays in enrollment of certain clinical trials, decreased product demand, including due to reduced numbers of in-person meetings with prescribers, patient visits with physicians, vaccinations and elective surgeries resulting in fewer new prescriptions or refills of existing prescriptions and reduced demand for products used in procedures, further reduced product demand as a result of increased unemployment, challenges presented by reallocating human capital, R&D, manufacturing and other resources to assist in responding to the pandemic without disruption to our operations, costs associated with the COVID-19 pandemic, including protocols intended to reduce the risk of transmission, increased supply chain costs and additional R&D costs incurred in our efforts to develop a potential vaccine and treatment for COVID-19, challenges related to our business development initiatives, including potential delays or disruptions related to regulatory approvals, including the anticipated combination of Upjohn with Mylan, interruptions or delays in the operations of certain regulatory authorities, which may delay the approvals of new products we are developing, potential label expansions for existing products and the launch of newly-approved products, potential increased cyber incidents such as phishing, social engineering and malware attacks, and other challenges presented by disruptions to our normal operations in response to the pandemic, as well as uncertainties regarding the duration and severity of the pandemic and its impacts and government or regulatory actions to contain the virus or control the supply of medicines, each of which may also amplify the impact of the other factors listed in this section; |
• | uncertainties related to our efforts to develop a potential treatment or vaccine for COVID-19, including uncertainties related to the risk that our development programs may not be successful, commercially viable or receive approval or Emergency Use Authorization from regulatory authorities, risks associated with preliminary data, including the possibility of unfavorable new preclinical or clinical trial data and further analyses of existing preclinical or clinical trial data that may be inconsistent with the data used for selection of the BNT162b2 vaccine candidate and dose level for the Phase 2/3 study, the risk that clinical trial data are subject to differing interpretations and assessments, including during the peer review/publication process, in the scientific community generally, and by regulatory authorities, whether and when data from the BNT162 mRNA vaccine program will be published in scientific journal publications and, if so, when and with what modifications, disruptions in the relationships between us and our collaboration partners or third-party suppliers, the risk that other companies may produce superior or competitive products, the risk that demand for any products may no longer exist, risks related to the availability of raw materials to manufacture any such products, the risk that we may not be able to recoup costs associated with our R&D and manufacturing efforts and risks associated with any changes in the way we approach or provide additional research funding for potential drug development related to COVID-19, the risk that we may not be able to create or scale up manufacturing capacity on a timely basis or have access to logistics or supply channels commensurate with global demand for any potential approved vaccine or product candidate, which would negatively impact our ability to supply the estimated numbers of doses of our vaccine candidate within the projected time periods indicated, and pricing and access challenges for such products, including in the U.S.; |
• | trade buying patterns; |
• | the impact of existing and future legislation and regulatory provisions on product exclusivity; |
• | trends toward managed care and healthcare cost containment, and our ability to obtain or maintain timely or adequate pricing or favorable formulary placement for our products; |
• | the impact of any significant spending reductions or cost controls affecting Medicare, Medicaid or other publicly funded or subsidized health programs or changes in the tax treatment of employer-sponsored health insurance that may be implemented; |
• | the impact of any U.S. healthcare reform or legislation, including any replacement, repeal, modification or invalidation of some or all of the provisions of the U.S. Patient Protection and Affordable Care Act, as amended by the Health Care and Education Reconciliation Act; |
• | U.S. federal or state legislation or regulatory action and/or policy efforts affecting, among other things, pharmaceutical product pricing, intellectual property, reimbursement or access, including under Medicaid, Medicare and other publicly funded or subsidized health programs; patient out-of-pocket costs for medicines, manufacturer prices and/or price increases that could result in new mandatory rebates and discounts or other pricing restrictions; general budget control actions; the importation of prescription drugs from outside the U.S. at prices that are regulated by governments of various foreign countries; revisions to reimbursement of biopharmaceuticals under |
95
government programs; restrictions on U.S. direct-to-consumer advertising; limitations on interactions with healthcare professionals; or the use of comparative effectiveness methodologies that could be implemented in a manner that focuses primarily on the cost differences and minimizes the therapeutic differences among pharmaceutical products and restricts access to innovative medicines; as well as pricing pressures for our products as a result of highly competitive insurance markets;
• | legislation or regulatory action in markets outside the U.S., including China, affecting pharmaceutical product pricing, intellectual property, reimbursement or access, including, in particular, continued government-mandated reductions in prices and access restrictions for certain biopharmaceutical products to control costs in those markets; |
• | the exposure of our operations outside the U.S. to possible capital and exchange controls, economic conditions, expropriation and other restrictive government actions, changes in intellectual property legal protections and remedies, as well as political unrest, unstable governments and legal systems and inter-governmental disputes; |
• | contingencies related to actual or alleged environmental contamination; |
• | any significant breakdown, infiltration or interruption of our information technology systems and infrastructure; |
• | legal defense costs, insurance expenses and settlement costs; |
• | the risk of an adverse decision or settlement and the adequacy of reserves related to legal proceedings, including patent litigation, such as claims that our patents are invalid and/or do not cover the product of the generic drug manufacturer or where one or more third parties seeks damages and/or injunctive relief to compensate for alleged infringement of its patents by our commercial or other activities, product liability and other product-related litigation, including personal injury, consumer, off-label promotion, securities, antitrust and breach of contract claims, commercial, environmental, government investigations, employment and other legal proceedings, including various means for resolving asbestos litigation, as well as tax issues; |
• | the risk that our currently pending or future patent applications may not result in issued patents, or be granted on a timely basis, or any patent-term extensions that we seek may not be granted on a timely basis, if at all; |
• | our ability to protect our patents and other intellectual property, both domestically and internationally, including against claims of invalidity that could result in loss of exclusivity, such as claims related to our Lyrica patents in Japan, and in response to any pressure, or legal or regulatory action by, various stakeholders or governments that could potentially result in us not seeking intellectual property protection for or agreeing not to enforce intellectual property related to our medicines, including potential vaccines and treatments for COVID-19; |
• | interest rate and foreign currency exchange rate fluctuations, including the impact of possible currency devaluations in countries experiencing high inflation rates; |
• | governmental laws and regulations affecting domestic and foreign operations, including, without limitation, tax obligations and changes affecting the tax treatment by the U.S. of income earned outside the U.S. that may result from pending and possible future proposals, including further clarifications and/or interpretations of or changes to the TCJA enacted in 2017; |
• | any significant issues involving our largest wholesale distributors, which account for a substantial portion of our revenues; |
• | the possible impact of the increased presence of counterfeit medicines in the pharmaceutical supply chain on our revenues and on patient confidence in the integrity of our medicines; |
• | uncertainties based on the formal change in relationship between the U.K. government and the EU, which could have implications on our research, commercial and general business operations in the U.K. and the EU, including the approval and supply of our products; |
• | any significant issues that may arise related to the outsourcing of certain operational and staff functions to third parties, including with regard to quality, timeliness and compliance with applicable legal or regulatory requirements and industry standards; |
• | any significant issues that may arise related to our joint ventures and other third-party business arrangements; |
• | further clarifications and/or changes in interpretations of existing laws and regulations, or changes in laws and regulations, in the U.S. and other countries, including changes in U.S. generally accepted accounting principles; |
• | uncertainties related to general economic, political, business, industry, regulatory and market conditions including, without limitation, uncertainties related to the impact on us, our customers, suppliers and lenders and counterparties to our foreign-exchange and interest-rate agreements of challenging global economic conditions and recent and possible future changes in global financial markets; the related risk that our allowance for doubtful accounts may not be adequate; and the risks related to volatility of our income due to changes in the market value of equity investments; |
96
• | any changes in business, political and economic conditions due to actual or threatened terrorist activity or civil unrest in the U.S. and other parts of the world, and related U.S. military action overseas; |
• | growth in costs and expenses; |
• | changes in our product, segment and geographic mix; |
• | the impact of purchase accounting adjustments, acquisition-related costs, discontinued operations and certain significant items; |
• | the impact of product recalls, withdrawals and other unusual items; |
• | the risk of an impairment charge related to our intangible assets, goodwill or equity-method investments; |
• | the impact of, and risks and uncertainties related to, acquisitions and divestitures, such as the acquisition of Array, our transaction with GSK which combined our respective consumer healthcare businesses into a new consumer healthcare joint venture and our agreement to combine Upjohn with Mylan to create a new global pharmaceutical company, Viatris, including, among other things, risks related to the satisfaction of the conditions to closing to any pending transaction (including the failure to obtain any necessary shareholder and regulatory approvals) in the anticipated timeframe or at all and the possibility that such transaction does not close; the ability to realize the anticipated benefits of those transactions, including the possibility that the expected cost savings and/or accretion from certain of those transactions will not be realized or will not be realized within the expected time frame; the risk that the businesses will not be integrated successfully; negative effects of the announcement or the consummation of the transaction on the market price of Pfizer’s common stock, Pfizer’s credit ratings and/or Pfizer’s operating results; disruption from the transactions making it more difficult to maintain business and operational relationships; risks related to our ability to grow revenues for certain acquired products; significant transaction costs; unknown liabilities; the risk of litigation and/or regulatory actions related to the transaction, other business effects, including the effects of industry, market, economic, political or regulatory conditions, future exchange and interest rates, changes in tax and other laws, regulations, rates and policies, future business combinations or disposals; competitive developments; and as it relates to the Consumer Healthcare JV with GSK, the possibility that a future separation of the joint venture as an independent company via a demerger of GSK’s equity interest to GSK’s shareholders and a listing of the joint venture on the U.K. equity market may not occur; and |
• | the impact of, and risks and uncertainties related to, restructurings and internal reorganizations, including the reorganization of our commercial operations in 2019, as well as any other corporate strategic initiatives, and cost-reduction and productivity initiatives, each of which requires upfront costs but may fail to yield anticipated benefits and may result in unexpected costs or organizational disruption. |
We cannot guarantee that any forward-looking statement will be realized. Achievement of anticipated results is subject to substantial risks, uncertainties and inaccurate assumptions. Should known or unknown risks or uncertainties materialize or should underlying assumptions prove inaccurate, actual results could vary materially from past results and those anticipated, estimated or projected. Investors should bear this in mind as they consider forward-looking statements, and are cautioned not to put undue reliance on forward-looking statements.
We undertake no obligation to publicly update forward-looking statements, whether as a result of new information, future events or otherwise, except as required by law or by the rules and regulations of the SEC. You are advised, however, to consult any further disclosures we make on related subjects.
Additional discussion regarding certain risks, uncertainties and assumptions described above, as well as other material risks to our business, is included under the heading entitled “Risk Factors” in Part I, Item 1A. of our 2019 Form 10-K and Part II, Item 1A, “Risk Factors” of this Quarterly Report on Form 10-Q. These risks could cause actual results to differ materially from past and projected future results. We note these factors for investors as permitted by the Private Securities Litigation Reform Act of 1995. We incorporate that section of the 2019 Form 10-K in this filing and investors should refer to it. You should understand that it is not possible to predict or identify all such factors. Consequently, you should not consider any such list to be a complete set of all potential risks or uncertainties.
The operating segment information provided in this report does not purport to represent the revenues, costs and income from continuing operations before provision for taxes on income that each of our operating segments would have recorded had each segment operated as a standalone company during the periods presented.
This report includes discussion of certain clinical studies relating to various in-line products and/or product candidates. These studies typically are part of a larger body of clinical data relating to such products or product candidates, and the discussion herein should be considered in the context of the larger body of data. In addition, clinical trial data are subject to differing interpretations, and, even when we view data as sufficient to support the safety and/or effectiveness of a product candidate or a new indication for an in-line product, regulatory authorities may not share our views and may require additional data or may deny approval altogether.
97
Item 3. Quantitative and Qualitative Disclosures About Market Risk
Information required by this item is incorporated by reference from the discussion in Part II, Item 7A, “Quantitative and Qualitative Disclosures About Market Risk—Financial Risk Management”, of our 2019 Form 10-K.
Item 4. Controls and Procedures
As of the end of the period covered by this report, we carried out an evaluation, under the supervision and with the participation of our principal executive officer and principal financial officer, of the effectiveness of the design and operation of our disclosure controls and procedures (as such term is defined in Rules 13a-15(e) and 15d-15(e) under the Exchange Act). Based on this evaluation, our principal executive officer and principal financial officer concluded that our disclosure controls and procedures are effective in alerting them in a timely manner to material information required to be disclosed in our periodic reports filed with the SEC.
During our most recent fiscal quarter, there has not been any change in our internal control over financial reporting (as such term is defined in Rules 13a-15(f) and 15d-15(f) under the Exchange Act) that has materially affected, or is reasonably likely to materially affect, our internal control over financial reporting.
PART II - OTHER INFORMATION
Item 1. Legal Proceedings
The information required by this Item is incorporated herein by reference to Notes to Condensed Consolidated Financial Statements––Note 13A. Contingencies and Certain Commitments: Legal Proceedings in Part I, Item 1, of this Quarterly Report on Form 10-Q.
Item 1A. Risk Factors
We refer to the “Our Operating Environment”, “The Global Economic Environment” and “Forward-Looking Information and Factors That May Affect Future Results” sections of the MD&A of this Quarterly Report on Form 10-Q and Part I, Item 1A, “Risk Factors” of our 2019 Form 10-K. We are including the following risk factor, which should be read in conjunction with the risk factors discussed in Part I, Item 1A, “Risk Factors” of our 2019 Form 10-K.
COVID-19 PANDEMIC
Our business, operations and financial condition and results have been and may continue to be impacted by the COVID-19 pandemic to varying degrees. We currently anticipate an ongoing, gradual global recovery from the first-half 2020 macroeconomic and healthcare impacts of the COVID-19 pandemic beginning in the third quarter of 2020. The pandemic continues to present a number of risks and challenges for our business, including, among others, impacts due to travel limitations and government-mandated work-from-home or shelter-in-place orders; manufacturing disruptions and delays; supply chain interruptions, including challenges related to reliance on third-party suppliers; disruptions to pipeline development and clinical trials, including difficulties or delays in enrollment of certain clinical trials; decreased product demand, including due to reduced numbers of in-person meetings with prescribers, patient visits with physicians, vaccinations and elective surgeries resulting in fewer new prescriptions or refills of existing prescriptions and reduced demand for products used in procedures; further reduced product demand as a result of increased unemployment; challenges presented by reallocating human capital, R&D, manufacturing and other resources to assist in responding to the pandemic without disruption to our operations; costs associated with the COVID-19 pandemic, including protocols intended to reduce the risk of transmission; increased supply chain costs and additional R&D costs incurred in our efforts to develop a vaccine and treatment for COVID-19; challenges related to our business development initiatives, including potential delays or disruptions related to regulatory approvals, including the anticipated combination of Upjohn with Mylan; interruptions or delays in the operations of certain regulatory authorities, which may delay the approvals of new products we are developing, potential label expansions for existing products and the launch of newly-approved products; potential increased cyber incidents such as phishing, social engineering and malware attacks; challenges related to our intellectual property, both domestically and internationally, including in response to any pressure or legal or regulatory action, by various stakeholders or governments that could potentially result in us not seeking intellectual property protection for, licensing or agreeing not to enforce our intellectual property rights related to our medicines, including potential vaccines and treatments for COVID-19; and other challenges presented by disruptions to our normal operations in response to the pandemic, as well as uncertainties regarding the duration and severity of the pandemic and its impacts and government or regulatory actions to contain the virus or control the supply of medicines.
98
We also face uncertainties related to our efforts to develop a potential treatment or vaccine for COVID-19, including uncertainties related to the risk that our development programs may not be successful, commercially viable or receive approval or Emergency Use Authorization from regulatory authorities; risks associated with preliminary data, including the possibility of unfavorable new preclinical or clinical trial data and further analyses of existing preclinical or clinical trial data that may be inconsistent with the data used for selection of the BNT162b2 vaccine candidate and dose level for the Phase 2/3 study; the risk that clinical trial data are subject to differing interpretations and assessments, including during the peer review/publication process, in the scientific community generally, and by regulatory authorities; whether and when data from the BNT162 mRNA vaccine program will be published in scientific journal publications and, if so, when and with what modifications; disruptions in the relationships between us and our collaboration partners or third-party suppliers; the risk that other companies may produce superior or competitive products; the risk that demand for any products we may develop may no longer exist; risks related to the availability of raw materials to manufacture any such products; the risk that we may not be able to recoup costs associated with our R&D and manufacturing efforts and risks associated with any changes in the way we approach or provide additional research funding for potential drug development related to COVID-19; the risk that we may not be able to create or scale up manufacturing capacity on a timely basis or have access to logistics or supply channels commensurate with global demand for any potential approved vaccine or product candidate, which would negatively impact our ability to supply the estimated numbers of doses of our vaccine candidate within the projected time periods indicated; and pricing and access challenges for such products, including in the U.S.
Further, the COVID-19 pandemic, and the volatile global economic conditions stemming from the pandemic, could precipitate or amplify the other risk factors that we identify in the “Risk Factors” section of our 2019 Form 10-K, which could materially adversely affect our business, operations and financial condition and results.
We are continuing to monitor the latest developments regarding the COVID-19 pandemic on our business, operations and financial condition and results, and have made certain assumptions regarding the pandemic for purposes of our operational planning and financial projections, including assumptions regarding the duration and severity of the pandemic and the global macroeconomic impact of the pandemic. Despite careful tracking and planning, however, we are unable to accurately predict the extent of the impact of the pandemic on our business, operations and financial condition and results due to the uncertainty of future developments. In particular, we believe the ultimate impact on our business, operations and financial condition and results will be affected by the speed and extent of the continued spread of the coronavirus globally, the duration of the pandemic, new information that may emerge concerning the severity and incidence of COVID-19, the safety, efficacy and availability of a vaccine and treatments for COVID-19, the global macroeconomic impact of the pandemic and governmental or regulatory actions to contain the virus or control supply of medicines. The pandemic may also affect our business, operations or financial condition and results in a manner that is not presently known to us or that we currently do not consider to present significant risks.
For additional information on how the COVID-19 pandemic has already impacted our business, operations and financial condition and results, see the “Overview of Our Performance, Operating Environment, Strategy and Outlook––The Global Economic Environment” section of the MD&A of this Quarterly Report on Form 10-Q.
99
Item 2. Unregistered Sales of Equity Securities and Use of Proceeds
The following table provides certain information with respect to our purchases of shares of the Company’s common stock during the second fiscal quarter of 2020:
Issuer Purchases of Equity Securities(a)
Period | Total Number of Shares Purchased(b) | Average Price Paid per Share(b) | Total Number of Shares Purchased as Part of Publicly Announced Plan | Approximate Dollar Value of Shares That May Yet Be Purchased Under the Plan(a) | ||||||||||
March 30, 2020 through April 26, 2020 | 19,649 | $ | 32.65 | — | $ | 5,292,881,709 | ||||||||
April 27, 2020 through May 24, 2020 | 41,905 | $ | 38.04 | — | $ | 5,292,881,709 | ||||||||
May 25, 2020 through June 28, 2020 | 18,583 | $ | 37.24 | — | $ | 5,292,881,709 | ||||||||
Total | 80,137 | $ | 36.53 | — | ||||||||||
(a) | For additional information, see the Notes to Consolidated Financial Statements––Note 12. Equity in our 2019 Financial Report, which is |
incorporated by reference.
(b) | These columns represent (i) 73,616 shares of common stock surrendered to the Company to satisfy tax withholding obligations in connection with the vesting of awards under our long-term incentive programs and (ii) the open market purchase by the trustee of 6,521 shares of common stock in connection with the reinvestment of dividends paid on common stock held in trust for employees who were granted performance share awards and who deferred receipt of such awards. |
Item 3. Defaults Upon Senior Securities
None.
Item 4. Mine Safety Disclosures
Not applicable.
Item 5. Other Information
None.
100
Item 6. Exhibits
- | Amendment No. 1, dated as of May 29, 2020, to the Business Combination Agreement, dated as of July 29, 2019, by and among Pfizer Inc., Upjohn Inc., Utah Acquisition Sub Inc., Mylan N.V., Mylan I B.V. and Mylan II B.V. is incorporated by reference from our Current Report on Form 8-K filed on June 1, 2020 (File No. 001-03619). (Pursuant to Item 601(b)(2) of Regulation S-K, the registrant hereby agrees to supplementally furnish to the Securities and Exchange Commission upon request any omitted schedule or exhibit to the Business Combination Agreement). | ||
- | Amendment No. 2, dated as of May 29, 2020, to the Separation and Distribution Agreement, dated as of July 29, 2019, by and between Pfizer Inc. and Upjohn Inc. is incorporated by reference from our Current Report on Form 8-K filed on June 1, 2020 (File No. 001-03619). (Pursuant to Item 601(b)(2) of Regulation S-K, the registrant hereby agrees to supplementally furnish to the Securities and Exchange Commission upon request any omitted schedule or exhibit to the Separation and Distribution Agreement). | ||
- | Fourth Supplemental Indenture, dated May 28, 2020, between Pfizer Inc. and The Bank of New York Mellon, as trustee, is incorporated by reference from our Current Report on Form 8-K filed on May 28, 2020 (File No. 001-03619). | ||
Time Sharing Agreement, dated July 9, 2020, by and between Pfizer Inc. and Albert Bourla. | |||
- | Accountants’ Acknowledgment. | ||
- | Certification by the Chief Executive Officer Pursuant to Section 302 of the Sarbanes-Oxley Act of 2002. | ||
- | Certification by the Chief Financial Officer Pursuant to Section 302 of the Sarbanes-Oxley Act of 2002. | ||
- | Certification by the Chief Executive Officer Pursuant to 18 U.S.C. Section 1350, as Adopted Pursuant to Section 906 of the Sarbanes-Oxley Act of 2002. | ||
- | Certification by the Chief Financial Officer Pursuant to 18 U.S.C. Section 1350, as Adopted Pursuant to Section 906 of the Sarbanes-Oxley Act of 2002. | ||
Exhibit 101: | |||
EX-101.INS | XBRL Instance Document - the instance document does not appear in the Interactive Data File because its XBRL tags are embedded within the Inline XBRL document. | ||
EX-101.SCH EX-101.CAL EX-101.LAB EX-101.PRE EX-101.DEF | Inline XBRL Taxonomy Extension Schema Inline XBRL Taxonomy Extension Calculation Linkbase Inline XBRL Taxonomy Extension Label Linkbase Inline XBRL Taxonomy Extension Presentation Linkbase Inline XBRL Taxonomy Extension Definition Document | ||
Exhibit 104 | Cover Page Interactive Data File––the cover page interactive data file does not appear in the Interactive Data File because its XBRL tags are embedded within the Inline XBRL document. | ||
101
SIGNATURE
Pursuant to the requirements of the Securities Exchange Act of 1934, the registrant has duly caused this report to be signed on its behalf by the undersigned thereunto duly authorized.
Pfizer Inc. | ||
(Registrant) | ||
Dated: | August 6, 2020 | /s/ Jennifer Damico |
Jennifer Damico, Senior Vice President and Controller (Principal Accounting Officer and Duly Authorized Officer) | ||
102
Similar companies
See also JOHNSON & JOHNSON - Annual report 2024 (10-K 2024-12-29) Annual report 2025 (10-Q 2025-06-29)See also ELI LILLY & Co - Annual report 2024 (10-K 2024-12-31) Annual report 2025 (10-Q 2025-06-30)
See also AbbVie Inc. - Annual report 2024 (10-K 2024-12-31) Annual report 2025 (10-Q 2025-06-30)
See also NOVO NORDISK A S
See also Merck & Co., Inc. - Annual report 2024 (10-K 2024-12-31) Annual report 2025 (10-Q 2025-06-30)