PSQ Holdings, Inc. - Quarter Report: 2023 September (Form 10-Q)
UNITED STATES
SECURITIES AND EXCHANGE COMMISSION
Washington, D.C. 20549
FORM 10-Q
(Mark One)
☒ QUARTERLY REPORT PURSUANT TO SECTION 13 OR 15(d) OF THE SECURITIES EXCHANGE ACT OF 1934
For the quarterly period ended September 30, 2023
☐ TRANSITION REPORT PURSUANT TO SECTION 13 OR 15(d) OF THE SECURITIES EXCHANGE ACT OF 1934
For the transition period from to
Commission File Number: 001-40457
PSQ Holdings, Inc.
(Exact name of registrant as specified in its charter)
| Delaware | 86-2062844 | |
| (State or other jurisdiction of | (IRS Employer | |
| incorporation or organization) | Identification No.) | |
| 250 S. Australian Avenue, Suite 1300 West Palm Beach, Florida |
33401 | |
| (Address of principal executive offices) | (Zip Code) | |
(877) 776-2402
(Registrant’s telephone number, including area code)
Not applicable
(Former name, former address and former fiscal year, if changed since last report)
Securities registered pursuant to Section 12(b) of the Act:
| Title of each class | Trading Symbol(s) | Name of each exchange on which registered | ||
| Class A common stock, par value $0.0001 per share | PSQH | New York Stock Exchange | ||
| Redeemable warrants, each whole warrant exercisable for one share of Class A common stock at an exercise price of $11.50 per share | PSQH.WS | New York Stock Exchange |
Indicate by check mark whether the registrant (1) has filed all reports required to be filed by Section 13 or 15(d) of the Securities Exchange Act of 1934 during the preceding 12 months (or for such shorter period that the registrant was required to file such reports), and (2) has been subject to such filing requirements for the past 90 days. Yes ☒ No ☐
Indicate by check mark whether the registrant has submitted electronically every Interactive Data File required to be submitted pursuant to Rule 405 of Regulation S-T (Section 232.405 of this chapter) during the preceding 12 months (or such shorter period that the registrant was required to submit such files). Yes ☒ No ☐
Indicate by check mark whether the registrant is a large accelerated filer, an accelerated filer, a non-accelerated filer, a smaller reporting company or an emerging growth company. See the definitions of “large accelerated filer,” “accelerated filer,” “smaller reporting company,” and “emerging growth company” in Rule 12b-2 of the Exchange Act:
| Large accelerated filer | ☐ | Accelerated filer | ☐ |
| Non-accelerated filer | ☒ | Smaller reporting company | ☒ |
| Emerging growth company | ☒ | ||
If an emerging growth company, indicate by check mark if the registrant has elected not to use the extended transition period for complying with any new or revised financial accounting standards provided pursuant to Section 13(a) of the Exchange Act. ☐
Indicate by check mark whether the registrant is a shell company (as defined in Rule 12b-2 of the Exchange Act). Yes ☐ No ☒
As of November 14, 2023, there were 24,395,075 shares of the registrant’s Class A common stock, par value $0.0001 per share, issued and outstanding and 3,213,678 shares of the registrant’s Class C common stock, par value $0.0001 per share, issued and outstanding.
TABLE OF CONTENTS
i
PART I – FINANCIAL INFORMATION
ITEM 1. Interim Condensed Consolidated Financial Statements
PSQ HOLDINGS, INC. (dba PublicSq.)
Condensed Consolidated Balance Sheets
| September 30, 2023 | December 31, 2022 | |||||||
| (Unaudited) | ||||||||
| Assets | ||||||||
| Current assets | ||||||||
| Cash and cash equivalents | $ | 25,255,909 | $ | 2,330,405 | ||||
| Inventory | 1,476,085 | |||||||
| Prepaid expenses and other current assets | 3,541,769 | 289,379 | ||||||
| Accounts receivable | 67,604 | |||||||
| Total current assets | 30,341,367 | 2,619,784 | ||||||
| Intangible assets, net | 2,532,063 | 1,267,673 | ||||||
| Operating lease right-of-use asset | 164,304 | 293,520 | ||||||
| Property and equipment, net | 132,246 | 26,723 | ||||||
| Deposits | 78,165 | 7,963 | ||||||
| Total assets | $ | 33,248,145 | $ | 4,215,663 | ||||
| Liabilities and stockholders’ equity | ||||||||
| Current liabilities | ||||||||
| Accounts payable | $ | 1,714,385 | $ | 424,065 | ||||
| Accrued expenses | 1,061,606 | 41,494 | ||||||
| Deferred revenue | 248,958 | 49,654 | ||||||
| Current portion of operating lease liabilities | 168,608 | 169,275 | ||||||
| Total current liabilities | 3,193,557 | 684,488 | ||||||
| Earn-out liabilities | 1,950,000 | |||||||
| Warrant liabilities | 16,599,500 | |||||||
| Operating lease liabilities, non-current | 129,762 | |||||||
| Total liabilities | 21,743,057 | 814,250 | ||||||
| Commitments and contingencies (Note 14) | ||||||||
| Stockholders’ equity | ||||||||
| Preferred stock, $0.0001 par value; 50,000,000 authorized shares; shares issued and outstanding as of September 30, 2023 and December 31, 2022 | ||||||||
| Class A Common stock, $0.0001 par value; 500,000,000 authorized shares; 24,340,075 shares and 11,806,007 shares issued and outstanding as of September 30, 2023 and December 31, 2022, respectively | 2,434 | 1,181 | ||||||
| Class C Common stock, $0.0001 par value; 40,000,000 authorized shares; 3,213,678 shares issued and outstanding as of September 30, 2023 and December 31, 2022 | 321 | 321 | ||||||
| Additional paid in capital | 68,033,896 | 12,383,475 | ||||||
| Subscription receivable | (99,612 | ) | ||||||
| Accumulated deficit | (56,531,563 | ) | (8,883,952 | ) | ||||
| Total stockholders’ equity | 11,505,088 | 3,401,413 | ||||||
| Total liabilities and stockholders’ equity | $ | 33,248,145 | $ | 4,215,663 | ||||
The accompanying notes are an integral part of these unaudited condensed consolidated financial statements.
1
PSQ HOLDINGS, INC. (dba PublicSq.)
Condensed Consolidated Statements of Operations (Unaudited)
| For the three months ended September 30, | For the nine months ended September 30, | |||||||||||||||
| 2023 | 2022 | 2023 | 2022 | |||||||||||||
| Revenues, net of returns and discounts of $232,597 and $0 for the three months ended September 30, 2023 and 2022, and $232,597 and $0 for the nine months ended September 30, 2023 and 2022, respectively | $ | 2,030,900 | $ | 124,634 | $ | 2,938,641 | $ | 197,575 | ||||||||
| Costs and expenses: | ||||||||||||||||
| Cost of sales – services (exclusive of depreciation and amortization shown separately below) | 569,502 | 210,363 | 1,189,440 | 483,756 | ||||||||||||
| Cost of goods sold (exclusive of depreciation and amortization shown separately below) | 903,672 | 903,672 | ||||||||||||||
| Transaction costs incurred in connection with the Business Combination | 3,309,597 | 7,048,177 | ||||||||||||||
| General and administrative | 4,311,199 | 993,488 | 7,448,015 | 2,175,612 | ||||||||||||
| Sales and marketing | 3,670,309 | 429,455 | 6,739,149 | 954,501 | ||||||||||||
| Research and development | 1,486,069 | 413,675 | 3,310,943 | 874,026 | ||||||||||||
| Depreciation and amortization | 759,745 | 203,489 | 2,004,319 | 477,405 | ||||||||||||
| Total costs and expenses | 15,010,093 | 2,250,470 | 28,643,715 | 4,965,300 | ||||||||||||
| Operating loss | (12,979,193 | ) | (2,125,836 | ) | (25,705,074 | ) | (4,767,725 | ) | ||||||||
| Other income (expense): | ||||||||||||||||
| Other income, net | 119,957 | 328 | 173,644 | 8,174 | ||||||||||||
| Change in fair value of convertible notes | (14,571,109 | ) | ||||||||||||||
| Change in fair value of earn-out liabilities | 450,000 | 450,000 | ||||||||||||||
| Change in fair value of warrant liabilities | (7,783,000 | ) | (7,783,000 | ) | ||||||||||||
| Interest expense, net | (46,690 | ) | (210,545 | ) | ||||||||||||
| Loss before income tax expense | (20,238,926 | ) | (2,125,508 | ) | (47,646,084 | ) | (4,759,551 | ) | ||||||||
| Income tax benefit (expense) | 262 | 4,208 | (1,527 | ) | 3,495 | |||||||||||
| Net loss | $ | (20,238,664 | ) | $ | (2,121,300 | ) | $ | (47,647,611 | ) | $ | (4,756,056 | ) | ||||
| $ | (0.77 | ) | $ | (0.18 | ) | $ | (2.38 | ) | $ | (0.44 | ) | |||||
| 26,265,627 | 11,982,103 | 20,058,726 | 10,705,779 | |||||||||||||
The accompanying notes are an integral part of these unaudited condensed consolidated financial statements.
2
PSQ HOLDINGS, INC. (dba PublicSq.)
Condensed Consolidated Statements of Changes in Stockholders’ Equity (Unaudited)
| Class A Common Stock | Class C Common Stock | Additional Paid-In | Subscription | Accumulated | Total Stockholders’ (Deficit) | |||||||||||||||||||||||||||
| Shares | Amount | Shares | Amount | Capital | Receivable | Deficit | Equity | |||||||||||||||||||||||||
| Balance at December 31, 2022 | 771,155 | $ | 771 | $ | $ | 12,384,206 | $ | (99,612 | ) | $ | (8,883,952 | ) | $ | 3,401,413 | ||||||||||||||||||
| Retroactive application of Business Combination (Note 1) | 11,034,852 | 410 | 3,213,678 | 321 | (731 | ) | ||||||||||||||||||||||||||
| Balance at December 31, 2022 | 11,806,007 | 1,181 | 3,213,678 | 321 | 12,383,475 | (99,612 | ) | (8,883,952 | ) | 3,401,413 | ||||||||||||||||||||||
| Issuance of common stock for cash | 1,447,523 | 145 | - | 2,499,979 | 2,500,124 | |||||||||||||||||||||||||||
| Receipt of subscription receivable | - | - | 100,012 | 100,012 | ||||||||||||||||||||||||||||
| Issuance of common stock for asset acquisition | 1,071,229 | 107 | - | 1,334,751 | 1,334,858 | |||||||||||||||||||||||||||
| Net loss | - | - | (6,687,640 | ) | (6,687,640 | ) | ||||||||||||||||||||||||||
| Balance at March 31, 2023 | 14,324,759 | 1,433 | 3,213,678 | 321 | 16,218,205 | 400 | (15,571,592 | ) | 648,767 | |||||||||||||||||||||||
| Repayment of subscription payable | - | - | (400 | ) | (400 | ) | ||||||||||||||||||||||||||
| Net loss | - | - | (20,721,307 | ) | (20,721,307 | ) | ||||||||||||||||||||||||||
| Balance at June 30, 2023 | 14,324,759 | 1,433 | 3,213,678 | 321 | 16,218,205 | (36,292,899 | ) | (20,072,940 | ) | |||||||||||||||||||||||
| Conversion of notes to common stock | 3,984,388 | 397 | - | 37,293,626 | 37,294,023 | |||||||||||||||||||||||||||
| Issuance of common stock upon Business Combination (Note 1) | 7,735,151 | 774 | - | 12,426,006 | 12,426,780 | |||||||||||||||||||||||||||
| Forfeiture of shares | (1,704,223 | ) | (170 | ) | - | 170 | ||||||||||||||||||||||||||
| Share based compensation | - | - | 2,095,889 | 2,095,889 | ||||||||||||||||||||||||||||
| Net loss | - | - | (20,238,664 | ) | (20,238,664 | ) | ||||||||||||||||||||||||||
| Balance at September 30, 2023 | 24,340,075 | $ | 2,434 | 3,213,678 | $ | 321 | $ | 68,033,896 | $ | $ | (56,531,563 | ) | $ | 11,505,088 | ||||||||||||||||||
| Class A Common Stock |
Class C Common Stock |
Additional Paid-In | Subscription | Accumulated | Total Stockholders’ Equity |
|||||||||||||||||||||||||||
| Shares | Amount | Shares | Amount | Capital | Receivable | Deficit | (Deficit) | |||||||||||||||||||||||||
| Balance at December 31, 2021 | 485,731 | $ | 486 | $ | $ | 2,799,994 | $ | (34,600 | ) | $ | (1,905,376 | ) | $ | 860,504 | ||||||||||||||||||
| Retroactive application of Business Combination (Note 1) | 5,761,113 | 139 | 3,213,678 | 321 | (460 | ) | ||||||||||||||||||||||||||
| Balance at December 31, 2021 | 6,246,844 | 625 | 3,213,678 | 321 | 2,799,534 | (34,600 | ) | (1,905,376 | ) | 860,504 | ||||||||||||||||||||||
| Issuance of common stock for cash | 503,380 | 50 | - | 810,195 | 810,245 | |||||||||||||||||||||||||||
| Receipt of subscription receivable | - | - | 35,000 | 35,000 | ||||||||||||||||||||||||||||
| Net loss | - | - | (1,019,811 | ) | (1,019,811 | ) | ||||||||||||||||||||||||||
| Balance at March 31, 2022 | 6,750,224 | 675 | 3,213,678 | 321 | 3,609,729 | 400 | (2,925,187 | ) | 685,938 | |||||||||||||||||||||||
| Issuance of common stock for cash | 784,627 | 79 | - | 1,455,021 | 1,455,100 | |||||||||||||||||||||||||||
| Net loss | - | - | (1,614,945 | ) | (1,614,945 | ) | ||||||||||||||||||||||||||
| Balance at June 30, 2022 | 7,534,851 | 754 | 3,213,678 | 321 | 5,064,750 | 400 | (4,540,132 | ) | 526,093 | |||||||||||||||||||||||
| Issuance of common stock for cash | 1,813,957 | 181 | - | 3,132,419 | 3,132,600 | |||||||||||||||||||||||||||
| Net loss | - | - | (2,121,300 | ) | (2,121,300 | ) | ||||||||||||||||||||||||||
| Balance at September 30, 2022 | 9,348,808 | $ | 935 | 3,213,678 | $ | 321 | $ | 8,197,169 | $ | 400 | $ | (6,661,432 | ) | $ | 1,537,393 | |||||||||||||||||
The accompanying notes are an integral part of these unaudited condensed consolidated financial statements.
3
PSQ HOLDINGS, INC. (dba PublicSq.)
Condensed Consolidated Statements of Cash Flows (Unaudited)
| For the nine months ended September 30, | ||||||||
| 2023 | 2022 | |||||||
| Cash Flows from Operating Activities | ||||||||
| Net loss | $ | (47,647,611 | ) | $ | (4,756,056 | ) | ||
| Adjustment to reconcile net loss to cash used in operating activities | ||||||||
| Amortization and depreciation | 2,004,319 | 477,405 | ||||||
| Share based compensation | 2,095,889 | |||||||
| Realized gain on short term investment | (173,644 | ) | ||||||
| Change in fair value of convertible notes | 14,571,109 | |||||||
| Change in fair value of warrant liabilities | 7,783,000 | |||||||
| Change in fair value of earn-out liabilities | (450,000 | ) | ||||||
| Noncash lease expense | 129,216 | 13,042 | ||||||
| Interest expense | 58,455 | |||||||
| Changes in operating assets and liabilities: | ||||||||
| Accounts receivable | (67,604 | ) | ||||||
| Prepaid expenses and other assets | (2,017,390 | ) | (124,066 | ) | ||||
| Deposits | (70,202 | ) | (5,463 | ) | ||||
| Accounts payable | 8,648,290 | 90,788 | ||||||
| Inventory | (1,476,085 | ) | ||||||
| Accrued expenses | 4,268,432 | 73,898 | ||||||
| Deferred revenue | 199,304 | 22,196 | ||||||
| Operating lease payments | (130,429 | ) | (8,822 | ) | ||||
| Net cash used in operating activities | (12,274,951 | ) | (4,217,078 | ) | ||||
| Cash flows from Investing Activities | ||||||||
| Software development costs | (1,840,066 | ) | (1,058,672 | ) | ||||
| Purchases of short-term investments | (10,049,870 | ) | ||||||
| Proceeds from the sale of short-term investments | 10,223,514 | |||||||
| Purchases of intangible assets | (86,600 | ) | ||||||
| Purchases of property and equipment | (113,065 | ) | (21,465 | ) | ||||
| Net cash used in investing activities | (1,866,087 | ) | (1,080,137 | ) | ||||
| Cash flows from Financing Activities | ||||||||
| Proceeds from the issuance of Convertible Notes Payable | 22,500,000 | |||||||
| Proceeds from reverse recapitalization | 18,104,194 | - | ||||||
| Transaction costs incurred in connection with Business Combination | (6,137,377 | ) | - | |||||
| Repayment of subscription payable | (400 | ) | ||||||
| Proceeds from the issuance of common stock | 2,600,125 | 5,433,365 | ||||||
| Net cash provided by financing activities | 37,066,542 | 5,433,365 | ||||||
| Net increase in cash and cash equivalents | 22,925,504 | 136,150 | ||||||
| Cash and cash equivalents, beginning of period | 2,330,405 | 399,403 | ||||||
| Cash and cash equivalents, end of the period | $ | 25,255,909 | $ | 535,553 | ||||
| Supplemental Cash Flow Information | ||||||||
| Promissory notes converted to equity | $ | 37,294,023 | $ | |||||
| Initial recognition of Earn-out liability | $ | 2,400,000 | $ | |||||
| Acquisition of warrant liability | $ | 8,816,500 | $ | |||||
| Recording of D&O tail insurance acquired by Colombier | $ | 1,235,000 | $ | |||||
| Acquisition of tax liability | $ | 957,982 | $ | |||||
| Stock for stock transfer | $ | 1,334,500 | $ | |||||
| Cash paid for interest | $ | $ | ||||||
The accompanying notes are an integral part of these unaudited condensed consolidated financial statements.
4
PSQ HOLDINGS, INC. (dba PublicSq.)
NOTES TO THE UNAUDITED CONDENSED CONSOLIDATED FINANCIAL STATEMENTS
Note 1 — Organization and Business Operations
PSQ Holdings, Inc. dba PublicSq. (“Publicsq.”, “PSQ”, “we”, “us”, “our”, and the “Company”) is a Delaware corporation headquartered in Florida. The Company operates the website and mobile application as PublicSq. The Company is a values-focused organization that provides other values-focused (patriotic, American made, etc.) small businesses with a platform to access consumers that are drawn to patriotic values. The Company generates revenue from advertising revenues.
In February 2023, the Company acquired the assets of EveryLife, Inc. (“EveryLife”) by way of a stock for stock exchange. Pursuant to that agreement, the Company acquired a brand name in exchange for 55,000 shares of the Company’s common stock. On July 13, 2023, the Company launched the brand and began generating revenue from sales of diapers and wipes from this operation.
Merger Agreement
On July 19, 2023 (the “Closing”), the Company consummated the Business Combination (as defined below), pursuant to the terms of the Merger Agreement dated February 27, 2023 with Colombier Acquisition Corp., a Delaware corporation (“Colombier”), Colombier-Liberty Acquisition, Inc., a Delaware corporation and a wholly-owned subsidiary of Colombier (“Merger Sub”), and Colombier Sponsor, LLC (the “Sponsor”), a Delaware limited liability company, in its capacity as Purchaser Representative (the “Purchaser Representative”), and PSQ Holdings, Inc., a Delaware corporation (“PSQ”) (collectively the “Combined Company”).
At Closing, pursuant to the terms of the Merger Agreement and after giving effect to the redemptions of Class A Common Stock, par value $0.0001 per share, of Colombier (the “Colombier Class A Common Stock”) by public stockholders of Colombier:
| ● | all options, convertible notes, warrants and other rights to subscribe for or purchase any capital stock of PSQ or securities convertible into or exchangeable for, or that otherwise conferred on the holder any right to acquire, any capital stock of PSQ which remained outstanding and had not been exercised or did not convert automatically into shares of PSQ Common Stock (as defined below) prior to the effective time of the Merger (the “Effective Time”) were cancelled without consideration; |
| ● | each share of PSQ Common Stock, par value $0.001 per share (“PSQ Common Stock”), including shares of PSQ Common Stock issued upon conversion of outstanding convertible notes of PSQ that automatically converted into shares of PSQ Common Stock immediately prior to the completion of the Merger, in each case other than shares of PSQ Common Stock held by the CEO, was automatically converted into the right to receive 19.476836 shares of Class A Common Stock, par value $0.0001 per share, of the Company (“Class A Common Stock”); and |
| ● | each share of PSQ Common Stock held by the CEO was automatically converted into the right to receive 19.476836 shares of Class C Common Stock, par value $0.0001 per share, of the Company (“Class C Common Stock” and, together with Class A Common Stock, “Company Common Stock”). |
5
The Merger and the other transactions described in the Merger Agreement collectively herein are described as the “Business Combination”.
In addition to the right of holders’ of PSQ Common Stock immediately prior to the Effective Time (the “PSQ Stockholders”) to receive Class A Common Stock or Class C Common Stock, as applicable, in the Merger, PSQ Stockholders and certain executive officers, employees and service providers of PSQ (the “Deemed Equity Holders” and, together with the PSQ Stockholders, the “Participating Equity Holders”) will be entitled to receive up to 3,000,000 shares of Class A Common Stock (the “Earnout Shares”) in the event certain trading price-based metrics are satisfied during the five (5)-year period commencing on the date of the Closing and ending on the fifth anniversary thereof (the “Earnout Period”), or, if earlier, upon the occurrence of a change of control transaction (as defined in the Merger Agreement) during the Earnout Period with an implied per share price that exceeds the relevant trading price-based metrics. Specifically, Earnout Shares will be earned if one or more of the three (3) triggering events described below occurs:
| ● | in the event that, and upon the date during the Earnout Period on which, the volume-weighted average trading price of Class A Common Stock quoted on the New York Stock Exchange (“NYSE”) (or such other exchange on which the shares of Class A Common Stock are then listed) for any twenty (20) trading days within any thirty (30) consecutive trading day period (the “Earnout Trading Price”) is greater than or equal to $12.50, the Participating Equity Holders will be entitled to receive an aggregate of 1,000,000 Earnout Shares; |
| ● | in the event that, and upon the date during the Earnout Period on which, the Earnout Trading Price is greater than or equal to $15.00, the Participating Equity Holders will be entitled to receive an aggregate of 1,000,000 additional Earnout Shares; and |
| ● | in the event that, and upon the date during the Earnout Period on which, the Earnout Trading Price is greater than or equal to $17.50, the Participating Equity Holders will be entitled to receive an aggregate of 1,000,000 additional Earnout Shares. |
Each share of the Company’s Class C Common Stock entitles its holder, initially the CEO, to a number of votes per share (rounded up to the nearest whole number) equal to (a) the aggregate number of outstanding shares of Class A Common Stock entitled to vote on the applicable matter as of the applicable record date plus 100, divided by (b) the aggregate number of outstanding shares of Class C Common Stock (the “Per Share Class C Voting Power”). As of the Closing Date, as a result of his ownership of 100% of the outstanding Class C Common Stock, the CEO has approximately 52.62% of the voting power of the Company, and the result of most matters to be voted upon by the Company’s stockholders will be controlled by the CEO, who can base his vote upon his best judgment and his fiduciary duties to PSQ stockholders. Each share of Class C Common Stock held by the CEO may be converted by the CEO at any time into one (1) share of Class A Common Stock.
Additionally, on the Closing Date, in connection with the consummation of the Business Combination, Colombier changed its name from Colombier Acquisition Corp. to PSQ Holdings, Inc.
PSQ has been determined to be the accounting acquirer based on evaluation of the following facts and circumstances:
| ● | PSQ’s existing stockholders will have the ability to control decisions regarding election and removal of directors and officers of the Combined Company; |
| ● | PSQ is the larger entity in terms of substantive operations and employee base; |
| ● | PSQ will comprise the ongoing operations of the Combined Company; and |
| ● | PSQ’s existing senior management will be the senior management of the Combined Company. |
Accordingly, the Business Combination was accounted for as a reverse recapitalization in accordance with accounting principles generally accepted in the United States of America (“U.S. GAAP”). Under this method of accounting, although Colombier acquired all of the outstanding equity interests of PSQ in the Business Combination, Colombier was treated as the “acquired” company and PSQ was treated as the accounting acquirer for financial statement reporting purposes. Accordingly, the Business Combination was treated as the equivalent of PSQ issuing stock for the net assets of Colombier, accompanied by a recapitalization. The net assets of Colombier were stated at historical cost, with no goodwill or other intangible assets recorded. Operations prior to the Business Combination will be those of PSQ.
6
Note 2 — Liquidity
Historically, the Company’s primary sources of liquidity have been funds from financing activities. The Company reported net losses of $47,647,611 and $4,756,056 for the nine months ended September 30, 2023 and 2022, and had negative cash flows from operations of $12,274,951 and $4,217,078 for the nine months ended September 30, 2023 and 2022, respectively. As of September 30, 2023, the Company had aggregate cash and cash equivalents of $25,255,909 and net working capital of $27,147,810. In conjunction with the consummation of the Business Combination, the Company received proceeds totaling $34,938,880 in July 2023, after giving effect to Colombier’s stockholder redemptions and before payment of transaction expenses, which will be utilized to fund operations and the Company’s growth plans. The Company believes that as a result of the Business Combination its existing cash and cash equivalents, as well as proceeds received from the Business Combination, will be sufficient to fund operations and capital needs for the next year from the date these condensed consolidated financial statements were available to be issued.
The Company’s future capital requirements will depend on many factors including the Company’s revenue growth rate, the timing and extent of spending to support further sales and marketing and research and development efforts. In order to finance these opportunities, the Company may need to raise additional financing. While there can be no assurances, the Company may need to pursue issuances of additional equity raises and debt rounds of financing. If additional financing is required from outside sources, the Company may not be able to raise it on terms acceptable to the Company or at all. If the Company is unable to raise additional capital when desired, the Company’s business, results of operations and financial condition would be materially and adversely affected.
Note 3 — Summary of Significant Accounting Policies
Basis of Presentation and Principles of Consolidation
The accompanying unaudited condensed consolidated financial statements have been prepared in accordance with accounting principles generally accepted in the United States of America (“U.S. GAAP”) and the rules and regulations of the U.S. Securities and Exchange Commission (the “SEC”) for interim financial information. Accordingly, certain information and footnote disclosures normally included in consolidated financial statements in accordance with U.S. GAAP have been omitted. In the opinion of management, all adjustments (consisting of normal recurring adjustments) considered necessary for a fair presentation have been included. Operating results for the nine months ended September 30, 2023 are not necessarily indicative of the results that may be expected for the year ending December 31, 2023.
As a result, all significant intercompany balances and transactions have been eliminated in consolidation.
The condensed consolidated balance sheet at December 31, 2022 has been derived from the audited consolidated financial statements at that date, but does not include all disclosures, including notes, required by U.S. GAAP for complete financial statements.
Use of Estimates
The preparation of condensed consolidated financial statements in conformity with U.S. GAAP requires management to make certain estimates and assumptions that affect the reported amounts and disclosures of assets and liabilities and the reported amounts of revenues and expenses during the reporting period. Estimates are adjusted to reflect actual experience when necessary. Such estimates include, but are not limited to, revenue recognition, intangible assets, estimation of contingencies, recoverability of deferred tax assets, the incremental borrowing rate applied to lease accounting, valuation of earn out liabilities and warrant liabilities, and estimation of income taxes. Actual results may differ from our estimates.
7
Earnings (Loss) Per Share
The Company computes basic earnings (loss) per share (“EPS”) by dividing income (loss) available to common stockholders by the weighted average number of common shares outstanding for the reporting period. All securities that meet the definition of a participating security, irrespective of whether the securities are convertible, nonconvertible, or potential common stock securities, shall be included in the computation of basic EPS using the two-class method. However, when the different classes of units have identical rights and privileges except voting rights, whereby they share equally in dividends and residual net assets on a per unit basis, the classes can be combined and presented as one class for EPS purposes. As such, the Company has combined the Class A and Class C Common stock for purposes of the EPS calculation.
Diluted earnings (loss) per share is calculated by dividing net earnings (loss) by the weighted average number of common shares and dilutive common stock equivalents outstanding. During the periods when they are anti-dilutive, common stock equivalents, if any, are not considered in the computation. As of September 30, 2023, the Company’s restricted stock units (“RSUs”) and Warrants were not considered in the computation as they are anti-dilutive. As of December 31, 2022, there were no anti-dilutive shares or common stock equivalents outstanding.
Revenue Recognition
[1] Marketplace Revenues
Advertising services
Advertising revenue is generated by displaying ad products and services on the Company’s platform. Customers enter into advertising subscription arrangements. The Company recognizes revenues over-time as the ads are displayed over the subscription period so the Company is providing a service and the service is being consumed by the customer simultaneously over the period of service. In general, we report advertising revenue on a gross basis, since we control the advertising inventory before it is transferred to our customers. Our control is evidenced by our sole ability to monetize the advertising inventory before it is transferred to our customers.
The Company recognizes revenue from push notifications and email blasts at a point in time when delivered. Push notifications and email blasts are considered delivered when an ad is displayed to users. When a customer enters into an advertising subscription arrangement that includes push notifications and/or email blasts, the Company allocates a portion of the total consideration to the push notification and email blast performance obligations based on the residual approach.
[2] Brand Sales
Product sales
The Company generates revenue through the sale of diapers and wipes to consumers by way of the Company’s website. The Company considers customer orders to be the contracts with the customer. There is a single performance obligation, which is the Company’s promise to transfer the Company’s product to customers based on specific payment and shipping terms in the arrangement. The entire transaction price is allocated to this single performance obligation. Product revenue is recognized when a customer obtains control of the Company’s product, which occurs at shipment. Revenue is measured as the amount of consideration the Company expects to receive in exchange for transferring products.
The Company evaluated principal versus agent considerations to determine whether it is appropriate to record third-party logistics provider fees paid as an expense. Thes fees are recorded shipping and handling expenses within cost of goods sold and are not recorded as a reduction of revenue because the Company owns and controls all the goods before they are transferred to the customer. The Company can, at any time, direct the third-party logistics provider to return the Company’s inventories to any location specified by the Company. It is the Company’s responsibility to make any returns made by customers directly to logistic providers and the Company retains the back-end inventory risk. Further, the Company is subject to credit risk (i.e., credit card chargebacks), establishes prices of its products, fulfills the goods to the customer and can limit quantities or stop selling the goods at any time.
Product Returns
Consistent with industry practice, the Company generally offers customers a limited right of return for products purchased. The Company reviews its receivables quarterly and records a reserve, if necessary. As of September 30, 2023, the Company has not deemed it necessary to record a reserve.
8
Cash and Cash Equivalents
The Company considers all highly liquid investments with a maturity of 90 days or less at the time of purchase to be cash equivalents. The carrying values of cash and cash equivalents approximate their fair values due to the short-term nature of these instruments. The Company maintains cash accounts with financial institutions. At times, balances in these accounts may exceed federally insured limits. No losses have been incurred to date on any deposits.
Warrant Liabilities
The Company evaluates all of its financial instruments, including issued share purchase warrants, to determine if such instruments are derivatives or contain features that qualify as embedded derivatives, pursuant to Financial Accounting Standards Board’s (“FASB”) Accounting Standards Codification Topic, ASC 815-40, Derivatives and Hedging (“ASC 815-40”). The classification of derivative instruments, including whether such instruments should be recorded as liabilities or as equity, is re-assessed at the end of each reporting period. The Company accounts for the Public Warrants (as defined in Note 9) and the Private Placement Warrants (collectively, with the Public Warrants, the “Warrants”) in accordance with the guidance contained in ASC 815-40 under which the Warrants do not meet the criteria for equity treatment and must be recorded as liabilities. Accordingly, the Company classifies the Warrants as liabilities at their fair value and adjusts the Warrants to fair value at each reporting period. This liability is subject to re-measurement at each balance sheet date until exercised, and any change in fair value is recognized in the consolidated statements of operations. The Warrants for periods where no observable traded price was available are valued using a binomial lattice model. For the Public Warrants, quoted market price will be used as the fair value as of each relevant date.
Business Combinations
The Company evaluates whether acquired net assets should be accounted for as a business combination or an asset acquisition by first applying a screen test to determine whether substantially all of the fair value of the gross assets acquired is concentrated in a single identifiable asset or group of similar identifiable assets. If so, the transaction is accounted for as an asset acquisition. If not, the Company applies its judgement to determine whether the acquired net assets meets the definition of a business by considering if the set includes an acquired input, process, and the ability to create outputs.
The Company accounts for business combinations using the acquisition method when it has obtained control. The Company measures goodwill as the fair value of the consideration transferred including the fair value of any non-controlling interest recognized, less the net recognized amount of the identifiable assets acquired and liabilities assumed, all measured at their fair value as of the acquisition date. Transaction costs, other than those associated with the issuance of debt or equity securities, that the Company incurs in connection with a business combination are expensed as incurred.
Any contingent consideration (“Earn-out liabilities”) is measured at fair value at the acquisition date. For contingent consideration that do not meet all the criteria for equity classification, such contingent consideration are required to be recorded at their initial fair value at the acquisition date, and on each balance sheet date thereafter. Changes in the estimated fair value of liability-classified contingent consideration are recognized on the consolidated statements of operations in the period of change.
When the initial accounting for a business combination has not been finalized by the end of the reporting period in which the transaction occurs, the Company reports provisional amounts. Provisional amounts are adjusted during the measurement period, which does not exceed one year from the acquisition date. These adjustments, or recognition of additional assets or liabilities, reflect new information obtained about facts and circumstances that existed at the acquisition date that, if known, would have affected the amounts recognized at that date.
Inventory
Inventories consist primarily of finished goods such as diapers and wipes. Inventories are stated at lower of cost or net realizable value. Cost is measured by using an adjusted standard cost method which approximates FIFO (first in, first out). The net realizable value of the Company’s inventory is estimated based on current and forecasted demand, and market conditions. The allowance for excess and obsolete inventory requires management to make assumptions and to apply judgment regarding a number of factors, including estimates applying past and projected sales performance to current inventory levels. As of September 30, 2023, no reserve for inventory has been recorded.
Intangible Assets
Intangible assets consist of purchased technology and brand name that were acquired through an acquisition and are amortized on a straight-line basis over useful lives ranging from 1 to 15 years. The Company reviews the recoverability of its intangible assets by comparing the carrying value of such assets to the related undiscounted value of the projected cash flows associated with the assets, or asset group. If the carrying value is found to be greater, the Company records an impairment loss for the excess of book value over fair value. No impairment of the Company’s intangible assets was recorded for the nine months ended September 30, 2023 and year ended December 31, 2022.
9
Capitalized Software
The Company capitalizes costs related to the development of its internal accounting software and certain projects for internal use in accordance with ASC 350 - Intangibles – Goodwill and Other. The Company capitalizes costs to develop its mobile application and website when preliminary development efforts are successfully completed, management has authorized and committed project funding, and it is probable that the project will be completed, and the software will be used as intended. Costs incurred during the preliminary planning and evaluation stage of the project and during the post implementation operational stage, including maintenance, are expensed as incurred. Costs incurred for enhancements that are expected to result in additional functionality are capitalized and expensed over the estimated useful life of the upgrades on a per project basis. Amortization is computed on an individual product basis over the estimated economic life of the product using the straight-line method. Software development costs expensed and not capitalized, which are included in research and development expense in the accompanying condensed consolidated statements of operations, were $80,244 and $34,776 for the three months ended September 30, 2023 and 2022 and $1,015,540 and $139,199 for the nine months ended September 30, 2023, and 2022, respectively. The gross capitalized software development costs included in intangible assets in the accompanying condensed consolidated balance sheets as of September 30, 2023 and December 31, 2022, were $4,016,771 and $2,177,053, respectively.
Impairment of Long-Lived Assets
The Company reviews long-lived assets, including intangible, capitalized software and lease assets, for impairment whenever events or changes in circumstances indicate that the carrying amount of an asset may not be recoverable. Recoverability of assets to be held and used is measured first by a comparison of the carrying amount of an asset to future undiscounted net cash flows expected to be generated by the asset. If such assets are impaired, an impairment loss would be recognized based on the excess of the carrying amount of the asset above the fair value of the asset.
Convertible Notes
The Company may enter into convertible notes, some of which contain, predominantly, fixed rate conversion features, whereby the outstanding principal and accrued interest may be converted by the holder, into common shares at a fixed discount to the market price of the common stock at the time of conversion. In this case, the convertible notes represent a financial instrument other than an outstanding share that embodies a conditional obligation that the issuer must or may settle by issuing a variable number of its equity shares. The Company records the convertible note liability at its fixed monetary amount by measuring and recording a premium, as applicable, on the convertible notes date with a charge to expense in accordance with ASC-480 - Distinguishing Liabilities from Equity.
Leases
The Company determines if an arrangement is a lease at inception. For leases where the Company is the lessee, right-of-use (“ROU”) assets represent the Company’s right to use the underlying asset for the term of the lease and the lease liabilities represent an obligation to make lease payments arising from the lease. The Company’s lease agreement contains rent escalation provisions, which are considered in determining the ROU assets and lease liabilities. The Company begins recognizing rent expense when the lessor makes the underlying asset available for use by the Company. Lease liabilities are recognized at the lease commencement date based on the present value of the future lease payments over the lease term. Lease renewal periods are considered on a lease-by-lease basis in determining the lease term. The interest rate the Company uses to determine the present value of future lease payments is the Company’s incremental borrowing rate because the rate implicit in the Company’s leases is not readily determinable. The incremental borrowing rate is a hypothetical rate for collateralized borrowings in economic environments where the leased asset is located based on credit rating factors. The ROU asset is determined based on the lease liability initially established and adjusted for any prepaid lease payments and any lease incentives received. The lease term to calculate the ROU asset and related lease liability includes options to extend or terminate the lease when it is reasonably certain that the Company will exercise the option. Certain leases contain variable costs, such as common area maintenance, real estate taxes or other costs. Variable lease costs are expensed as incurred on the statements of operations.
Operating leases are included in the ROU assets and lease liabilities on the condensed consolidated balance sheets. The Company has no finance leases.
Share Based Compensation
The Company recognizes an expense for share-based compensation awards based on the estimated fair value of the award on the date of grant.
As of September 30, 2023 there were 3,115,989 RSUs outstanding. At December 31, 2022, there were no board approved grants of share-based compensation awards.
Research and Development
The Company expenses research and development costs as incurred, except for certain internal-use software development costs, which may be capitalized as noted above. Research and development expenses consist primarily of software development costs, including employee compensation and external contractors, associated with the ongoing development of the Company’s technology.
10
Fair Value of Financial Instruments
Fair value is the price that would be received to sell an asset, or the amount paid to transfer a liability in an orderly transaction between market participants at the measurement date. There is a fair value hierarchy that prioritizes the inputs used to measure fair value. The hierarchy gives the highest priority to quoted prices in active markets for identical assets or liabilities (Level 1 measurement) and the lowest priority to unobservable inputs (Level 3 measurement). The Company classifies fair value balances based on the observability of those inputs. The three levels of the fair value hierarchy are as follows:
Level 1 — Inputs based on unadjusted quoted market prices in active markets for identical assets or liabilities that the Company has the ability to access at the measurement date.
Level 2 — Observable inputs other than quoted prices included in Level 1, such as quoted prices for similar assets or liabilities in active markets or quoted prices for identical or similar instruments in markets that are not active or for which all significant inputs are observable or can be corroborated by observable market data.
Level 3 — Inputs reflect management’s best estimate of what market participants would use in pricing the asset or liability at the measurement date. The inputs are both unobservable for the asset and liability in the market and significant to the overall fair value measurement.
On February 23, 2023, the Company acquired the assets of EveryLife by way of a stock for stock exchange (See Note 5 “Asset Acquisition”). The assets acquired have been recorded at their relative fair value based on a valuation obtained by the Company using the market approach.
In some circumstances, the inputs used to measure fair value might be categorized within different levels of the fair value hierarchy. In those instances, the fair value measurement is categorized in its entirety in the fair value hierarchy based on the lowest level input that is significant to the fair value measurement. The Company establishes the fair value of its assets and liabilities using the price that would be received to sell an asset or paid to transfer a liability in an orderly transaction between market participants at the measurement date and establishes a fair value hierarchy based on the inputs used to measure fair value. The recorded amounts of certain financial instruments, including accounts receivable, accounts payable, accrued expenses, debt at fixed interest rates, and other liabilities approximate fair value due to their relatively short maturities.
The Company’s policy is to record transfers between levels, if any, as of the beginning of the fiscal year. For the three and nine months ended September 30, 2023 no transfers between levels have been recognized.
Segment Reporting
Operating segments are defined as components of an entity for which separate discrete financial information is available that is evaluated regularly by the Chief Operating Decision Maker (“CODM”) in deciding how to allocate resources and in assessing performance. The Company has determined that the Company has two reportable segments comprised of Marketplace and Brands.
Recent Accounting Pronouncements
The Company has assessed the adoption impacts of recently issued accounting standards by the Financial Accounting Standards Board on the Company’s condensed consolidated financial statements as well as material updates to previous assessments, if any, to the Company’s annual audited financial statements and notes thereto included in our Form S-4 for the year ended December 31, 2022.
Note 4 — Recapitalization
As discussed in Note 1, “Organization and Business Operations”, the Business Combination was consummated on July 19, 2023, which, for accounting purposes, was treated as the equivalent of PSQ issuing stock for the net assets of Colombier, accompanied by recapitalization. Under this method of accounting, Colombier was treated as the acquired company for financial accounting and reporting purposes under GAAP.
11
Transaction Proceeds
Upon closing of the Business Combination, the Company received gross proceeds of $34.9 million from the Business Combination, offset by total transaction costs of $16.8 million. The following table reconciles the elements of the Business Combination to the condensed consolidated statements of cash flows and the condensed consolidated statement of changes in stockholders’ equity for the period ended September 30, 2023:
| Cash-trust and cash, net of redemptions | $ | 34,938,880 | ||
| Less: transaction costs and advisory fees, paid | (16,834,686 | ) | ||
| Net proceeds from the Business Combination | 18,104,194 | |||
| Less: public and private placement warrant liabilities | (8,816,500 | ) | ||
| Less: earn-out liabilities | (2,400,000 | ) | ||
| Add: amounts paid in advance | 2,570,919 | |||
| Add: Transaction costs in accounts payable and accrued expenses | 2,967,393 | |||
| Reverse recapitalization, net | $ | 12,426,006 |
The number of shares of Common Stock issued immediately following the consummation of the Business Combination were:
| Colombier Class A common stock, outstanding prior to the Business Combination | 17,250,000 | |||
| Less: Redemption of Colombier Class A common stock | (13,827,349 | ) | ||
| Class A common stock of Colombier | 3,422,651 | |||
| Colombier Class B common stock, outstanding prior to the Business Combination | 4,312,500 | |||
| Business Combination shares | 7,735,151 | |||
| PSQ Shares | 21,522,825 | |||
| Common Stock immediately after the Business Combination | 29,257,976 |
The number of PSQ shares was determined as follows:
PSQ Shares | PSQ Shares after conversion ratio | |||||||
| Class A Common Stock | 940,044 | 18,309,147 | ||||||
| Class C Common Stock | 165,000 | 3,213,678 | ||||||
| Total | 1,105,044 | 21,522,825 | ||||||
Public and private placement warrants
The Public Warrants issued in the IPO and 5,700,000 warrants issued in connection with private placement at the time of Colombier’s initial public offering (the “Private Placement Warrants”) remained outstanding and became warrants for the Company (see Note 9).
Redemption
Prior to the closing of the Business Combination, certain Colombier public shareholders exercised their right to redeem certain of their outstanding shares for cash, resulting in the redemption of 13,827,349 shares of Colombier Class A common stock for an aggregate payment of $141,151,432.
Transactions costs
For the three and nine months ended September 30, 2023, transaction costs incurred within the condensed consolidated statements of operations were as follows:
| Three months ended September 30, 2023 | Nine months ended September 30, 2023 | |||||||
| Accounting fees | $ | 247,912 | $ | 756,257 | ||||
| Legal fees | 1,818,914 | 5,049,149 | ||||||
| Travel and other expenses | 331,971 | 331,971 | ||||||
| One-time share-based payment to influencers and advisors | 910,800 | 910,800 | ||||||
| Total | $ | 3,309,597 | $ | 7,048,177 | ||||
12
Note 5 — Asset Acquisition
EveryLife Inc.
On February 23, 2023, the Company acquired the assets of EveryLife by way of a stock for stock exchange. Pursuant to that agreement, the Company acquired a brand name in exchange for 55,000 shares of the Company’s common stock. Through the stock for stock exchange agreement, the Company acquired EveryLife’s marketing related intangibles which consist of a brand name.
This acquisition was accounted for as an asset purchase. The cost of a group of assets acquired in an asset acquisition shall be allocated to the individual assets acquired or liabilities assumed based on their relative fair values and shall not give rise to goodwill.
The following table presents the acquisition date fair value of the asset acquired:
| Assets acquired: | ||||
| Balance – January 1, 2023 | $ | |||
| Issuance of common stock at fair value | 1,334,850 | |||
| Balance – March 31, 2023 | 1,334,850 | |||
| Legal costs capitalized | 42,611 | |||
| Balance – September 30, 2023 | $ | 1,377,461 | ||
Note 6 — Intangible Assets, Net
The following table summarizes intangible assets, net:
| Useful Life | September 30, 2023 | December 31, 2022 | ||||||||
| Capitalized software development costs | 1-5 years | $ | 4,016,771 | $ | 2,177,053 | |||||
| Purchased technology | 1-15 years | 72,488 | 28,500 | |||||||
| Brand name | 10 years | 1,377,461 | ||||||||
| Total intangible assets | 5,466,720 | 2,205,553 | ||||||||
| Less: Accumulated amortization | (2,934,657 | ) | (937,880 | ) | ||||||
| Total intangible assets, net | $ | 2,532,063 | $ | 1,267,673 | ||||||
Amortization expenses were $716,469 and $202,723 for the three months ended September 30, 2023 and 2022, respectively and $1,996,777 and $475,872 for the nine months ended September 30, 2023 and 2022, respectively.
As of September 30, 2023, estimated future amortization expense is expected as follows:
| Remainder of 2023 | $ | 402,004 | ||
| 2024 | 322,127 | |||
| 2025 | 322,127 | |||
| 2026 | 322,127 | |||
| 2027 | 322,127 | |||
| Thereafter | 841,551 | |||
| $ | 2,532,063 |
13
Note 7 — Leases
Since inception, the Company has entered into three leases for office suites in California, two were short-term and one lease was long-term and expires in 2024. Termination of the lease is prohibited unless there is a violation under the lease agreement. The lease has escalating payments from $15,538 per month to $16,719 per month. In determining the length of the lease term, the Company determined there was no embedded extension option. At lease commencement date, the Company estimated the lease liability and the right-of-use assets at present value using the Company’s estimated incremental borrowing rate of 10.5%
Additionally, in October 2023, the Company has entered into a new sublease in Florida, which will become the new headquarters (see Note 15).
Rent expense under the operating leases included in the results of operations, inclusive of common area maintenance charges and real estate taxes, was $108,827 and $29,589 for the three months ended September 30, 2023 and 2022, respectively and $220,895 and $72,131 for the nine months ended September 30, 2023 and 2022, respectively.
The following amounts were recorded in the Company’s condensed consolidated balance sheets relating to its operating lease and other supplemental information:
| September 30, 2023 | December 31, 2022 | |||||||
| ROU assets | $ | 164,304 | $ | 293,520 | ||||
| Lease liabilities: | ||||||||
| Current lease liabilities | $ | 168,608 | $ | 169,275 | ||||
| Non-current lease liabilities | 129,762 | |||||||
| Total lease liabilities | $ | 168,608 | $ | 299,037 | ||||
| Other supplemental information: | ||||||||
| Weighted average remaining lease term | 0.92 years | 2 years | ||||||
| Weighted average discount rate | 10.50 | % | 10.50 | % | ||||
The following table presents the lease payments relating to the Company’s operating leases:
| Fiscal Year | September 30, 2023 | December 31, 2022 | ||||||
| Remainder of 2023 | $ | 48,013 | $ | 191,183 | ||||
| 2024 | 128,035 | 133,753 | ||||||
| Total lease payments | 176,048 | 324,936 | ||||||
| Less: imputed interest | (7,440 | ) | (25,899 | ) | ||||
| Present value of operating lease liabilities | $ | 168,608 | $ | 299,037 | ||||
Note 8 — Convertible Promissory Notes
During the nine months ended September 30, 2023, the Company issued convertible promissory notes (the “Notes”) in the total amount of $22,500,000 that accrue interest at the rate of 5% per annum until converted or paid in full upon maturity being December 31, 2024.
As described in Note 1, on July 19, 2023, the Company consummated the Business Combination and became a publicly-traded company at which time the balance under each Note converted automatically into shares of PSQ Common Stock at a conversion price per share based upon an implied $100 million fully diluted pre-money valuation, excluding the Notes.
The Notes are required to be recorded at their initial fair value on the date of issuance under ASC 480-10-25-14, and each balance sheet date thereafter. Changes in the estimated fair value of the Notes are recognized as non-cash gains or losses in the condensed consolidated statements of operations.
14
The change in the fair value of the Notes measured with Level 3 inputs for the three and nine months ended September 30, 2023 is summarized as follows:
| Convertible Notes |
||||
| Fair value as of January 1, 2023 | $ | |||
| Principal balance of convertible notes issued | 2,050,000 | |||
| Change in valuation inputs or other assumptions | 1,147,905 | |||
| Fair value as of March 31, 2023 | 3,197,905 | |||
| Principal balance of convertible notes issued | 20,450,000 | |||
| Change in valuation inputs or other assumptions | 13,423,204 | |||
| Fair value as of June 30, 2023 | 37,071,109 | |||
| Conversion of convertible notes | (37,071,109 | ) | ||
| Fair value as of September 30, 2023 | $ | |||
Note 9 — Warrant Liabilities
As part of Colombier’s initial public offering (“IPO”), Colombier issued warrants to third-party investors where each whole warrant entitles the holder to purchase one share of the Company’s common stock at an exercise price of $11.50 per share (the “Public Warrants”). Simultaneously with the closing of the IPO, Colombier completed the private sale of warrants where each warrant allows the holder to purchase one share of the Company’s common stock at $11.50 per share. At September 30, 2023, there are 5,750,000 Public Warrants and 5,700,000 Private Placement warrants outstanding.
These warrants expire on the fifth anniversary of the Business Combination or earlier upon redemption or liquidation and are exercisable commencing 30 days after the Business Combination, provided that the Company has an effective registration statement under the Securities Act covering the shares of common stock issuable upon exercise of the warrants and a current prospectus relating to them is available (or the Company permits holders to exercise their warrants on a cashless basis under the circumstances specified in the warrant agreement) and registered, qualified or exempt from registration under the securities, or blue sky, laws of the state of residence of the holder.
Once the warrants become exercisable, the Company may redeem the outstanding warrants:
| ● | in whole and not in part; |
| ● | at a price of $0.01 per warrant; |
15
| ● | upon not less than 30 days’ prior written notice of redemption given after the warrants become exercisable to each warrant holder; and |
| ● | if, and only if, the reported last sale price of the Class A common stock equals or exceeds $18.00 per share (as adjusted for stock splits, stock dividends, reorganizations, recapitalizations and the like) for any 20 trading days within a 30-trading day period commencing once the warrants become exercisable and ending three business days before the Company sends the notice of redemption to the warrant holders. |
The Public Warrants and Private Placement Warrants are recognized as derivative liabilities in accordance with ASC 815. Accordingly, the Company recognized the warrant instruments as liabilities at fair value as of the Closing Date, with an offsetting entry to additional paid-in capital and adjusts the carrying value of the instruments to fair value through other income (expense) on the condensed consolidated statement of operations at each reporting period until they are exercised. As of September 30, 2023, the Public Warrants and Private Placement Warrants are presented within warrants on the condensed consolidated balance sheet.
Note 10 — Related Parties
On August 25, 2023, the Company and its former Chief Operating Officer (“COO”) entered into a separation and release of claims agreement (the “Separation Agreement”) providing for the COO’s departure from his position to pursue other business opportunities. The effective date of the COO’s departure was August 25, 2023 (the “Separation Date”). Pursuant to the Separation Agreement, the COO is entitled to receive continued payment of his 2023 annual base salary for a period of 12 months, subject to his compliance with the Separation Agreement, including a release of claims in favor of the Company, certain restrictive covenants described below and the forfeiture to the Company by the COO of 1,704,223 shares of the Company’s Class A common stock. In addition, the Separation Agreement provides that the COO will not be granted further equity of the Company, including restricted stock units or earnout compensation; however, the COO remains eligible to receive certain earnout compensation as a former shareholder of PublicSq. Inc. Subject to eligibility, the Separation Agreement provides for continued payment by the Company of the Company’s share of COBRA premiums for the COO’s health benefit coverage for a period of up to 12 months following the Separation Date. The Separation Agreement also provides for, among other things, non-disclosure and non-solicitation obligations applicable to the COO and mutual non-disparagement obligations.
In August 2023, the Company signed a one-year strategic consulting agreement with a consulting company that is controlled by a board member. The consulting company was engaged by the Company to provide strategic advice and assistance to the Company in connection with capital markets strategy, acquisition strategy, investor relations strategy, and other strategic matters for a fixed fee of $80,000 per month plus expenses. As of September 30, 2023, the Company has incurred and paid $160,000 relating to this agreement.
In June 2023, the Company signed a consulting agreement with a board member to provide advisory services to EveryLife. In exchange the board member receives $10,000 per month and 40,000 RSUs to vest at the completion of the consulting agreement. As of September 30, 2023, the Company has incurred and paid $40,000 relating to this agreement.
Note 11 — Share Based Compensation
On July 25, 2023, the Board of Directors of the Company approved the PSQ Holdings, Inc. 2023 Stock Incentive Plan as well as the 2023 Employee Stock Purchase Plan, whereby it may grant to certain employees, consultants and advisors an award, such as (a) incentive stock options, (b) non-qualified stock options, (c) restricted stock and (d) RSUs, of the Company.
2023 Stock incentive plan
Awards may be made under the Plan for up to such number of shares of Class A common stock, $0.0001 par value per share, of the Company (the “Class A Common Stock”) as is equal to the sum of:
(A) a number of shares of Class A Common Stock equal to fifteen percent (15%) of the outstanding shares of all classes of Company common stock, $0.0001 par value per share (“Company Common Stock”), determined immediately following the closing of the Merger Agreement.
(B) an annual increase to be added on the first day of each fiscal year, commencing on January 1, 2024 and continuing for each fiscal year until, and including, January 1, 2033, equal to the lesser of (i) 1% of the outstanding shares of all classes of Company Common Stock on such date and (ii) the number of shares of Class A Common Stock determined by the Board.
2023 Employee Stock Purchase plan
The purpose of this plan is to provide eligible employees opportunities to purchase shares of the Company’s Class A common stock. For this purpose, the Board approved 600,000 shares of Class A Common stock, plus an annual increase to be added on the first day of each fiscal year, commencing on January 1, 2024 and continuing for each fiscal year until, and including, January 1, 2033, equal to the least of (i) 425,000 shares of Class A Common Stock, (ii) 1% of the outstanding shares of all classes of Company common stock, $0.0001 par value per share, on such date and (iii) a number of shares of Class A Common Stock determined by the Board.
16
Restricted Stock Units
During the three months ended September 30, 2023, the Company issued RSU’s under the 2023 Stock Incentive Plan to employees, advisors, and board of directors. Each RSU entitles the recipient to one share of our common stock upon vesting. The Company measures the fair value of RSUs using the stock price on the date of grant.
Share-based compensation expense for RSUs is recorded ratably over their vesting period.
A summary of the activity with respect to, and status of, RSUs during the nine-month period ended September 30, 2023 is presented below:
| Number of RSUs | Weighted Average Grant Date Value | |||||||
| Unvested as of January 1, 2023 | ||||||||
| Granted | 3,115,989 | $ | 10.12 | |||||
| Vested | (131,568 | ) | ||||||
| Unvested as of September 30, 2023 | 2,984,421 | $ | 10.12 | |||||
As of September 30, 2023, unrecognized compensation cost related to the grant of RSUs was approximately $22.4 million. Unvested outstanding RSUs as of September 30, 2023 had a weighted average remaining vesting period of 3.0 years.
Share based compensation relating to earn-out
As more fully described in Note 1, certain executive officers, employees and service providers of PSQ will be entitled to receive up to 3,000,000 shares of Class A Common Stock (the “Earnout Shares”) in the event certain trading price-based metrics are satisfied during the five (5)-year period commencing on the date of the Closing and ending on the fifth anniversary thereof (the “Earnout Period”), or, if earlier, upon the occurrence of a change of control transaction (as defined in the Merger Agreement) during the Earnout Period with an implied per share price that exceeds the relevant trading price-based metrics.
In accordance with ASC 718, these are awards granted with a market condition. The effect of this market condition was reflected in the grant-date fair value of an award. The fair value of the earn-out shares was estimated using a Monte Carlo simulation utilizing assumptions related to the contractual term of the instruments, estimated volatility of the price of the Common Stock and current interest rates. Below are the key assumptions used in valuing the earn-out shares:
| As of 9/30/2023 | ||||
| PSQH Stock Price | $ | 9.08 | ||
| Volatility | 40 | % | ||
| Risk free rate of return | 4.6 | % | ||
| Expected term (in years) | 4.8 | |||
During the three and nine months ended September 30, 2023, the Company recorded $767,719 of share-based compensation expense, related to the earn-out shares.
During the three and nine months ended September 30, 2023, the Company recorded the following share-based compensation expense, related to RSUs and earn-out shares:
| For the three and nine months ended September 30, 2023 | ||||
| Cost of sales | $ | 2,239 | ||
| General and administrative expenses | 587,717 | |||
| Transaction incurred in connection with the Business Combination | 910,800 | |||
| Research and development | 201,810 | |||
| Sales and marketing | 393,323 | |||
| $ | 2,095,889 | |||
17
Note 12 — Fair Value Measurements
We account for certain liabilities at fair value and classify these liabilities within the fair value hierarchy (Level 1, Level 2, or Level 3).
Liabilities subject to fair value measurements are as follows:
| As of September 30, 2023 | ||||||||||||||||
| Level 1 | Level 2 | Level 3 | Total | |||||||||||||
| Liabilities | ||||||||||||||||
| Warrant liabilities – Public Warrants (1) | $ | $ | $ | 7,992,500 | $ | 7,992,500 | ||||||||||
| Warrant liabilities – Private placement warrants (1) | 8,607,000 | 8,607,000 | ||||||||||||||
| Earn-out liabilities (2) | 1,950,000 | 1,950,000 | ||||||||||||||
| Total liabilities | $ | $ | $ | 18,549,500 | $ | 18,549,500 | ||||||||||
| (1) | Public Warrants and Private Placement Warrants were estimated using a Black-Scholes option pricing model utilizing assumptions related to the contractual term of the instruments, estimated volatility of the price of the Common Stock and current interest rates. |
| (2) | The fair value of the earn-out liabilities was estimated using Monte Carlo simulation utilizing assumptions related to the contractual term of the instruments, estimated volatility of the price of the Common Stock and current interest rates. |
The following table presents the changes in fair value of the public and private placements warrants:
| For the three months ended September 30, 2023 | For the nine months ended September 30, 2023 | |||||||
| Liability at beginning of the period | $ | $ | ||||||
| Assumed in the Business Combination | 8,816,500 | 8,816,500 | ||||||
| Change in fair value | 7,783,000 | 7,783,000 | ||||||
| Balance as of September 30, 2023 | $ | 16,599,500 | $ | 16,599,500 | ||||
The following table presents the changes in fair value of the earn-out liabilities:
| For the three months ended September 30, 2023 | For the nine months ended September 30, 2023 | |||||||
| Liability at beginning of the period | $ | $ | ||||||
| Assumed in the Business Combination | 2,400,000 | 2,400,000 | ||||||
| Change in fair value | (450,000 | ) | (450,000 | ) | ||||
| Balance as of September 30, 2023 | $ | 1,950,000 | $ | 1,950,000 | ||||
18
Note 13 — Segments
The Company routinely evaluates whether its operating and reportable segments continue to reflect the way the CODM evaluates the business. The determination is based on: (1) how the Company’s CODM evaluates the performance of the business, including resource allocation decisions, and (2) whether discrete financial information for each operating segment is available. The Company considers the chief executive officer to be its CODM.
As of September 30, 2023, the Company’s operating and reportable segments include:
| ● | Marketplace: PSQ has created a marketplace platform to access consumers that are drawn to patriotic values. The Company generates revenue from advertising revenues. |
| ● | Brands: The first wholly-owned brand is EveryLife, Inc., which generates revenue from online sales of diapers and wipes |
The CODM measures and evaluates the Company’s performance based on gross revenue and Segment Earnings Before Interest, Taxes, depreciation, and amortization (“EBITDA”). Adjusted EBITDA is defined as earnings (loss) from operations less depreciation and amortization, share based compensation and transaction costs. Earnings (loss) from operations excludes interest, interest expense, (gain) loss on sale of equipment, change in fair value of financial instruments and other expenses. The Company believes that Adjusted EBITDA is an appropriate measure for evaluating the operating performance of the Company’s business segments because it is the primary measure used by the Company’s chief operating decision maker to evaluate the performance of and allocate resources to the Company’s businesses.
Segment performance, as defined by the Company, is not necessarily comparable to other similarly titled captions of other companies.
The following tables set forth the Company’s revenues, net and adjusted EBITDA for the three and nine months ended September 30, 2023 and 2022:
| For the three months ended September 30, | For the nine months ended September 30, | |||||||||||||||
| 2023 | 2022 | 2023 | 2022 | |||||||||||||
| Revenues, net: | ||||||||||||||||
| Marketplace | ||||||||||||||||
| Advertising sales | $ | 875,546 | $ | 124,634 | $ | 1,783,287 | $ | 197,575 | ||||||||
| Brands | ||||||||||||||||
| Product sales | 1,387,951 | 1,387,951 | ||||||||||||||
| Returns and discounts | (232,597 | ) | (232,597 | ) | ||||||||||||
| Total Brand revenues, net | 1,155,354 | 1,155,354 | ||||||||||||||
| Total revenues, net | $ | 2,030,900 | $ | 124,634 | $ | 2,938,641 | $ | 197,575 | ||||||||
| For the three months ended September 30, | For the nine months ended September 30, | |||||||||||||||
| 2023 | 2022 | 2023 | 2022 | |||||||||||||
| Adjusted EBITDA: | ||||||||||||||||
| Marketplace EBITDA | $ | (6,339,765 | ) | $ | (1,922,347 | ) | $ | (14,082,492 | ) | $ | (4,290,320 | ) | ||||
| Brands EBITDA | (1,384,997 | ) | (1,384,997 | ) | ||||||||||||
| Total adjusted EBITDA | (7,724,762 | ) | (1,922,347 | ) | (15,467,489 | ) | (4,290,320 | ) | ||||||||
| Transaction costs incurred in connection with the Business Combination | (3,309,597 | ) | (7,048,177 | ) | ||||||||||||
| Share-based compensation (exclusive of what is included in transaction costs above) | (1,185,089 | ) | (1,185,089 | ) | ||||||||||||
| Depreciation and amortization | (759,745 | ) | (203,489 | ) | (2,004,319 | ) | (477,405 | ) | ||||||||
| Other income, net | 119,957 | 328 | 173,644 | 8,174 | ||||||||||||
| Change in fair value of warrant liabilities | (7,783,000 | ) | (7,783,000 | ) | ||||||||||||
| Change in fair value of earn-out liabilities | 450,000 | 450,000 | ||||||||||||||
| Change in fair value of convertible notes | (14,571,109 | ) | ||||||||||||||
| Income tax benefit (expense) | 262 | 4,208 | (1,527 | ) | 3,495 | |||||||||||
| Interest expense, net | (46,690 | ) | (210,545 | ) | ||||||||||||
| Net loss | $ | (20,238,664 | ) | $ | (2,121,300 | ) | $ | (47,647,611 | ) | $ | (4,756,056 | ) | ||||
No asset information has been disclosed as the CODM does not regularly review asset information by reportable segment.
19
Note 14 — Commitments and Contingencies
Advertising Commitment
In April 2023, the Company entered into an advertising agreement with a media group for the purpose of promoting the Company and its services on a national platform. In connection with this agreement, the Company committed to pay $377,000 in eight monthly installments. As of September 30, 2023, the Company has recorded and paid $235,625 of this commitment.
In May 2023, the Company entered into a sponsorship agreement with a media group for the purpose of promoting the Company and its services on a national platform. In connection with this agreement, the Company committed to pay $485,000 in two equal installments. As of September 30, 2023, the Company has recorded and paid $242,500 of this commitment.
Other Legal Matters
From time to time in the ordinary course of business, the Company may be subject to various claims, charges, and litigation. At September 30, 2023 and December 31, 2022, the Company did not have any pending claims, charges or litigation that were expected to have a material adverse impact on its financial position, results of operations or cash flows.
Note 15 — Subsequent Events
The Company has evaluated and recognized or disclosed subsequent events, as appropriate, from the condensed consolidated balance sheet date through November 14, 2023, the date the condensed consolidated financial statements were available to be issued.
In October 2023, the Company entered into a one-year advertising agreement with a media group for the purpose of promoting the Company and its services on a national platform. In connection with this agreement, the Company committed to pay $1,000,000 in six equal installments.
As previously announced the Company relocated its headquarters from California to Florida. In October 2023, the Company entered into a lease agreement. Effective October 1, 2023, the Company will be expected to pay base rent in the amount of $16,457 per month through January 30, 2025.
20
ITEM 2. Management’s Discussion and Analysis of Financial Condition and Results of Operations
The following “Management’s Discussion and Analysis of Financial Condition and Results of Operations” should be read in conjunction with our unaudited condensed consolidated financial statements for the three and nine months ended September 30, 2023 and 2022, our audited financial statements as of the year ended December 31, 2022, and other information included elsewhere in this report. This discussion contains forward-looking statements that involve risks and uncertainties. Our actual results could differ materially from such forward-looking statements. Factors that could cause or contribute to those differences include, but are not limited to, those identified below and those discussed in the sections titled “Risk Factors” and “Cautionary Note Regarding Forward-Looking Statements” included elsewhere in this report. Additionally, our historical results are not necessarily indicative of the results that may be expected in any future period. Amounts are presented in U.S. dollars.
Unless the context otherwise requires, references in this “Management’s Discussion and Analysis of Financial Condition and Results of Operations” to “PSQ,” “we”, “us”, “our”, and the “Company” are intended to refer to (i) following the Business Combination, the business and operations of PSQ Holdings, Inc. and its consolidated subsidiaries, and (ii) prior to the Business Combination, Private PSQ (the predecessor entity in existence prior to the consummation of the Business Combination) and its consolidated subsidiaries.
Cautionary Note Regarding Forward-Looking Statements
This report, including, without limitation, statements under the heading “Management’s Discussion and Analysis of Financial Condition and Results of Operations,” includes forward-looking statements within the meaning of Section 27A of the Securities Act of 1933 and Section 21E of the Securities Exchange Act of 1934, or the Exchange Act. These forward-looking statements can be identified by the use of forward-looking terminology, including the words “believes,” “estimates,” “anticipates,” “expects,” “intends,” “plans,” “may,” “will,” “potential,” “projects,” “predicts,” “continue,” or “should,” or, in each case, their negative or other variations or comparable terminology. There can be no assurance that actual results will not materially differ from expectations. Such statements include, but are not limited to, the future financial performance of the company, our growth plans and opportunities, our financial performance, our ability to raise additional funds, and any other statements that are not statements of current or historical facts.
The forward-looking statements contained in this report are based on our current expectations and beliefs concerning future developments and their potential effects on us. Future developments affecting us may not be those that we have anticipated. These forward-looking statements involve a number of risks, uncertainties (some of which are beyond our control) and other assumptions that may cause actual results or performance to be materially different from those expressed or implied by these forward-looking statements. These risks and uncertainties include, but are not limited to, those factors described under the heading “Risk Factors” in our registration statement on Form S-1 (File No. 333-273830), which are incorporated by reference herein. Should one or more of these risks or uncertainties materialize, or should any of our assumptions prove incorrect, actual results may vary in material respects from those projected in these forward-looking statements. We undertake no obligation to update or revise any forward-looking statements, whether as a result of new information, future events or otherwise, except as may be required under applicable law. These risks and others described under “Risk Factors” may not be exhaustive.
By their nature, forward-looking statements involve risks and uncertainties because they relate to events and depend on circumstances that may or may not occur in the future. We caution you that forward-looking statements are not guarantees of future performance and that our actual results of operations, financial condition and liquidity, and developments in the industry in which we operate may differ materially from those made in or suggested by the forward-looking statements contained in this report. In addition, even if our results or operations, financial condition and liquidity, and developments in the industry in which we operate are consistent with the forward-looking statements contained in this report, those results or developments may not be indicative of results or developments in subsequent periods.
21
Overview
PSQ is a values-aligned platform where consumers with traditional American values can connect with and patronize business members whose values align with their own. PSQ is free-to-use for consumer members, who can use its platform to search for and shop from values-aligned business members both locally, online, and nationally. Since our nationwide launch in July 2022, we have become the largest values-aligned platform of pro-America businesses and consumers.
We incorporated PSQ Holdings, Inc. in February of 2021, began development of our digital platform (mobile app and website) in May 2021, and launched our initial product regionally in San Diego County, California in October 2021 on iOS, Android, and on our website. After 10 months of testing in various markets and courting member feedback, we launched the PSQ platform nationwide on July 4, 2022. As of September 30, 2023, on our platform we have more than 1,590,000 active consumer members (defined as unique consumer membership accounts for which we have received all required contact information and which have not been deactivated or deleted since our reception) and more than 70,000 business members from a wide variety of industries.
On February 23, 2023, PSQ completed a stock-for-stock transaction to purchase 100% of the outstanding shares of EveryLife, Inc. (“EveryLife”), a Delaware corporation, in exchange for 55,000 shares of common stock, par value $0.001 per share, of Private PSQ (“Private PSQ Common Stock”).
The mailing address of PSQ’s principal executive office is 250 S. Australian Avenue, Suite 1300, West Palm Beach, Florida 33401.
Recent Developments
Launch of eCommerce Marketplace
The Company has officially launched its eCommerce marketplace functionality on mobile and desktop devices. The eCommerce marketplace features a single cart shopping experience where consumers can purchase a variety of products from multiple vendors in one transaction. The Company has built its eCommerce marketplace with multiple user experience enhancements and is seeing tremendous engagement from businesses with over 400,000 products now available for purchase.
Business Combination
On February 27, 2023, PublicSq. Inc. (formerly known as PSQ Holdings, Inc.) entered into the Agreement and Plan of Merger (the “Merger Agreement”) with Colombier-Liberty Acquisition, Inc. (“Merger Sub”), Colombier Sponsor LLC (the “Sponsor”) and PSQ Holdings, Inc. (formerly known as Colombier Acquisition Corp.) (“Colombier”).
On July 19, 2023 (the “Closing Date”), we consummated the Business Combination, pursuant to the terms of the Merger Agreement.
The Business Combination (as defined in the Merger Agreement) was accounted for as a reverse recapitalization in accordance with United States Generally Accepted Accounting Principles (“GAAP”). Under this method of accounting, Colombier was treated as the “acquired” company for financial reporting purposes and PSQ was treated as the “acquirer”.
Upon the closing of the transaction, the CEO possessed approximately 52.62% of the voting power of the Combined Company (depending on the number of outstanding shares of Class A Common Stock and Class C Common Stock at such time) through the issuance to him of shares of Class C Common Stock in connection with the Business Combination. As of the date of this report, the CEO controls approximately 52.81% of our outstanding voting power due to his ownership all of our outstanding shares of Class C Common Stock.
22
Convertible Promissory Notes
During the nine months ended September 30, 2023, we issued convertible promissory notes (the “Notes”) in the total amount of $22,500,000 that accrue interest at the rate of 5% per annum until converted. As described above, on July 19, 2023, we consummated the Business Combination and became a publicly-traded company at which time the balances under each Note converted automatically into shares of PSQ Common Stock at a conversion price per share based upon an implied $100 million fully diluted pre-money valuation, excluding the Notes. The Notes are required to be recorded at their initial fair value on the date of issuance under ASC 480-10-25-14, and each balance sheet date thereafter. Changes in the estimated fair value of the Notes are recognized as non-cash gains or losses in the condensed consolidated statements of operations.
Upon the conversion and before giving effect to the Business Combination, 204,570 shares of Private PSQ Common Stock were issued in respect of the aggregate balances under all the Notes which represented approximately 18.5% of the total outstanding shares of Private PSQ Common Stock.
Components of Results of Operations
During the three months ended September 30, 2023 and 2022, our net loss was $20.2 million and $2.1 million, respectively and during the nine months ended September 30, 2023 and 2022, our net loss was $47.6 million, and $4.8 million, respectively. Our net loss increased in 2023 from 2022, largely due to the $14.6 million increase in the fair value of the convertible notes, $7.8 million increase in fair value of the warrant liabilities, as well as $7.0 million related to transaction costs incurred due to the business combination and $1.2 million of share-based compensation incurred. Our expenses will likely increase in the future as we develop and launch new offerings and platform features, expand in existing and new markets, increase our sales and marketing efforts and continue to invest in our platform, as well as a result of our becoming a public company. We have not been profitable since inception, and as of September 30, 2023 and December 31, 2022, our accumulated deficit was $56.5 million and $8.9 million, respectively. Since inception, we have financed our operations primarily through equity raises and operating activities.
Revenues, net
Our revenues have been derived from the advertising of products and services on the PSQ platform as well as from product sales.
In July 2023, the Company launched the EveryLife business and began to generate revenue through the sale of diapers and wipes to consumers by way of the EveryLife’s website. The Company considers customer orders to be the contracts with the customer. There is a single performance obligation, which is the Company’s promise to transfer the Company’s product to customers based on specific payment and shipping terms in the arrangement.
Our advertising revenues are derived from multi-month fixed price contracts for advertising subscription arrangements. Revenues from subscription contracts are recognized using the “over-time” method of revenue recognition. Accordingly, we recognize revenues over-time as the advertisements are displayed over the subscription period and the service is being consumed by the business member simultaneously over the period of service. Over-time revenue recognition is based on an input measure of progress based on costs incurred compared to estimated total costs at completion. Each advertisement has a contractual revenue value and an estimated cost. The over-time revenue is recognized monthly.
We recognize advertising revenue from push notifications and email blasts at the point of delivery. Push notifications and email blasts are considered delivered when an advertisement is displayed to users. When a customer enters into an advertising subscription arrangement that includes push notifications and/or email blasts, we allocate a portion of the total consideration to the push notification and email blast performance obligations based on the residual approach, if the standalone selling price (“SSP”) is not observable. We use the residual approach, which is a method to allocate revenue to a remaining performance obligation. We have stand-alone selling prices for all other services in the advertising package. After allocating revenue per package to those other services based on their stand-alone selling price, the email blasts and push notifications are allocated to the remaining revenue for that package. We are able to determine the SSP based on the cost charged to a customer for each service. If the level of service includes multiple performance obligations, the incremental difference attributed to the additional service represents its standalone selling price. We calculate the SSP of the push notification or email blast, and record the revenue when the advertisement is displayed to users.
23
In general, we report advertising revenue on a gross basis, since we control the advertising inventory before it is transferred to our customers. Our control is evidenced by our sole ability to monetize the advertising inventory before it is transferred to our customers.
In the future, in addition to greater levels of advertising revenue expected as a result of the growth of our marketplace, we also expect to realize increased amounts of business-to-business (“B2B”) revenue and to begin realizing e-commerce transactional revenue as we expand our business operations into those areas.
For a description of our revenue recognition policies, see Note 3, Summary of Significant Accounting Policies, in our condensed consolidated financial statements.
Cost of Sales - Services (exclusive of depreciation and amortization)
Cost of sales- services (exclusive of depreciation and amortization) consists of the direct costs incurred in building and running subscription-based software services. We recognize the cost of revenue associated with personnel costs, general administrative expenses, and fees related to servers that assist in hosting our platform.
Cost of goods sold (exclusive of depreciation and amortization)
Cost of goods sold (exclusive of depreciation and amortization) includes the purchase price of merchandise sold to customers, inbound and outbound shipping and handling costs, freight and duties, shipping and packaging supplies and warehouse fulfillment costs incurred.
Operating Expenses
Operating expenses primarily include general and administrative, research and development, sales and marketing, and depreciation and amortization. The most significant component of our operating expenses is personnel-related costs such as salaries, benefits, and bonuses. We expect our personnel-related costs as a percentage of total costs to decrease over time.
We expect to continue to invest substantial resources to support our growth. We anticipate that each of the following categories of operating expenses will increase in absolute dollar amounts and decrease as a percentage of revenue for the foreseeable future.
Transaction costs incurred in connection with the Business Combination
Transaction costs incurred in connection with the Business Combination primarily consists of professional fees, travel expenses and one-time share-based payments to non-employee advisors and influencers.
General and Administrative Expenses
General and administrative expenses consist primarily of personnel-related expenses for our finance, legal, human resources and administrative personnel, as well as the costs of information technology, professional services, insurance, travel, and other administrative expenses. We expect to invest in our corporate organization and incur additional expenses associated with transitioning to, and operating as, a public company, including increased legal, audit, tax and accounting costs, investor relations costs, higher insurance premiums and compliance costs. As a result, we expect that general and administrative expenses will increase in absolute dollars in future periods but decline as a percentage of total revenue over time. Our inability to scale our expenses could negatively impact gross margin and profitability.
Sales and Marketing Expenses
Sales and marketing expenses consist primarily of salaries, employee benefits, consultant fees, commissions, and direct marketing costs related to the promotion of PSQ’s platforms/solutions and certain costs related to the acquisition of both consumer and business members on our platform. As a result, we expect that sales expenses will increase in absolute dollars in future periods as we increase marketing activities, grow our operations, and continue to build our brand awareness. but decline as a percentage of total revenue over time. Our inability to scale our expenses could negatively impact gross margin and profitability.
24
Research and Development Expenses
Research and development expenses consist primarily of salaries, employee benefits and consultant fees related to our development activities to originate, develop, and enhance our platform. We expect research and development expenses to increase over time due to growth in our engineering and product teams, especially related to the continued development of e-commerce functionality.
Depreciation and Amortization Expense
Depreciation and amortization expense consists primarily of amortization of capitalized software development costs.
Non-Operating Income and Other Items
Other Income, Net
Other income, net primarily relates to realized and unrealized gains on our available for sale investments for the nine months ended September 30, 2023 and Employee Retention Tax Credit (“ERTC”) and the Research and Development Tax Credit (“R&D Tax Credit”) for the nine months ended September 30, 2022.
Change in fair value of convertible promissory notes
Changes in the fair value of Notes are recorded in the condensed consolidated statement of operations. The Notes represent a financial instrument other than an outstanding share that embodies a conditional obligation that the issuer must or may settle by issuing a variable number of its equity shares. We record the Note liability at its fixed monetary amount by measuring and recording a premium, as applicable, on the Notes date with a charge to expense.
Change in fair value of earn-out liabilities
Changes in the fair value of earn-out liabilities are recorded in the condensed consolidated statement of operations. The Earn-out liabilities represent a financial instrument other than an outstanding share that embodies a conditional obligation that the issuer must or may settle by issuing a variable number of its equity shares. We record the earn-out liability at its fair value at each reporting period.
Change in fair value of warrant liabilities
Changes in the fair value of warrant liabilities are recorded in the condensed consolidated statement of operations. The warrant liabilities represent a financial instrument other than an outstanding share that embodies a conditional obligation that the issuer must or may settle by issuing a variable number of its equity shares. We record the warrant liabilities at its fair value at each reporting period.
Interest Expense, net
Interest expense incurred consists of interest accrued on Notes issued. The Notes were converted to equity at the close of the Business Combination.
Income Tax Expense
We are subject to income taxes in the United States, but due to our net operating loss (“NOL”) position, we have recognized a minimal provision or benefit in recent years. Deferred income taxes reflect the net tax effects of temporary differences between the carrying amounts of assets and liabilities for financial reporting purposes and the amounts used for income tax purposes. A valuation allowance is provided when it is more likely than not that the deferred tax assets will not be realized. We have established a full valuation allowance to offset our U.S. net deferred tax assets due to the uncertainty of realizing future tax benefits from our NOL carryforwards and other deferred tax assets.
25
Key Business Metrics and Selected Financial Data
We use certain key metrics and financial measures not prepared in accordance with GAAP to evaluate and manage our business.
Adjusted EBITDA
We define adjusted EBITDA, a non-GAAP financial measure, as earnings (loss) before interest expense, income tax expense (benefit), depreciation and amortization, as adjusted to exclude change in fair value of our financial instruments, other income (expense), net, transaction expenses and share-based compensation expense. See “Non-GAAP Financial Measures” for a reconciliation of GAAP net loss to adjusted EBITDA.
Total Active Consumer Members on Platform
We perform calculations utilizing total active consumer members on our platform as a measure of the reach of our app and website over time. Total active members, as defined by us, are unique consumer membership accounts for which we have received all required contact information, and which have not been deactivated or deleted. These numbers are based on data provided directly from our database. Total active consumer members on our platform do not include unique visitors to the site nor individuals who download the app but do not create an account to login. Our definition of total active consumer members may differ from similar definitions and metrics used by other companies.
Total active consumer members on our platform were over 1,590,000 at September 30, 2023, an increase of 646% from September 30, 2022. We believe that significant growth in our total active consumer members is attributable to earned media, word of mouth referrals, our outreach program and consumer interest in our platform.
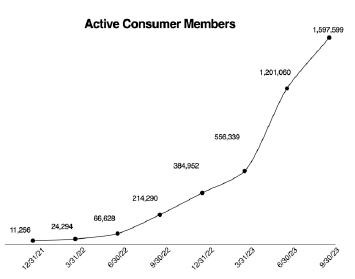
Total Business Members on Platform
We calculate the total business members on our platform as a measure of the reach of our app and website over time. Total business members represent unique business members who have been verified and added to the platform by our team. Total business members do not include business members that were not approved by our team to be on our platform. Our definition of total business members on our platform may differ from similar definitions and metrics used by other companies.
Total business members increased to 70,955 at September 30, 2023, an increase of 224% from September 30, 2022. We believe that the significant growth in the total business members on our platform is attributable to earned media, word of mouth referrals, and our Outreach Program.
26
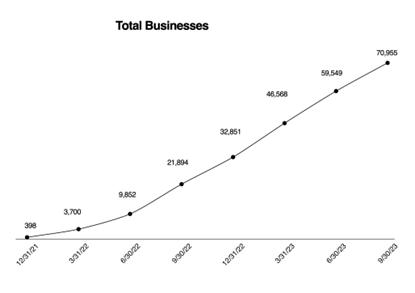
Results of Operations
The results of operations presented below should be reviewed in conjunction with the unaudited condensed consolidated financial statements for the three and nine months ended September 30, 2023 and 2022 found elsewhere in this document.
The following table sets forth our condensed consolidated statement of operations for the three and nine months ended September 30, 2023 and 2022, and the dollar and percentage change between the two periods:
| Three Months Ended September 30, 2023 | Three Months Ended September 30, 2022 | Variance, $ | Variance, % | |||||||||||||
| Revenues, net | $ | 2,030,900 | $ | 124,634 | $ | 1,906,266 | 1529 | % | ||||||||
| Costs and expenses: | ||||||||||||||||
| Cost of sales - services (exclusive of depreciation and amortization expense shown below) | 569,502 | 210,363 | 359,139 | 171 | % | |||||||||||
| Cost of goods sold (exclusive of depreciation and amortization expense shown below) | 903,672 | - | 903,672 | NM | ||||||||||||
| Transaction costs incurred in connection with the Business Combination | 3,309,597 | - | 3,309,597 | NM | ||||||||||||
| General and administrative | 4,311,199 | 993,488 | 3,317,711 | 334 | % | |||||||||||
| Sales and marketing | 3,670,309 | 429,455 | 3,240,854 | 755 | % | |||||||||||
| Research and development | 1,486,069 | 413,675 | 1,072,394 | 259 | % | |||||||||||
| Depreciation and amortization | 759,745 | 203,489 | 556,256 | 273 | % | |||||||||||
| Total operating expenses | 15,010,093 | 2,250,470 | 12,759,623 | 567 | % | |||||||||||
| Operating loss | (12,979,193 | ) | (2,125,836 | ) | (10,853,357 | ) | 511 | % | ||||||||
| Other income (expense): | ||||||||||||||||
| Other income, net | 119,957 | 328 | 119,629 | NM | ||||||||||||
| Change in fair value of earn-out liabilities | 450,000 | - | 450,000 | NM | ||||||||||||
| Change in fair value of warrant liabilities | (7,783,000 | ) | - | (7,783,000 | ) | NM | ||||||||||
| Interest expense, net | (46,690 | ) | - | (46,690 | ) | NM | ||||||||||
| Loss before income taxes | (20,238,926 | ) | (2,125,508 | ) | (18,113,418 | ) | 852 | % | ||||||||
| Income tax (expense) benefit | 262 | 4,208 | (3,946 | ) | (94 | )% | ||||||||||
| Net loss | $ | (20,238,664 | ) | $ | (2,121,300 | ) | (18,117,364 | ) | 854 | % | ||||||
27
| Nine Months Ended September 30, 2023 | Nine Months Ended September 30, 2022 | Variance, $ | Variance, % | |||||||||||||
| Revenues, net | $ | 2,938,641 | $ | 197,575 | $ | 2,741,066 | 1387 | % | ||||||||
| Costs and expenses: | ||||||||||||||||
| Cost of sales - services (exclusive of depreciation and amortization expense shown below) | 1,189,440 | 483,756 | 705,684 | 146 | % | |||||||||||
| Cost of goods sold (exclusive of depreciation and amortization expense shown below) | 903,672 | - | 903,672 | NM | ||||||||||||
| Transaction costs incurred in connection with the Business Combination | 7,048,177 | - | 7,048,177 | NM | ||||||||||||
| General and administrative | 7,448,015 | 2,175,612 | 5,272,403 | 242 | % | |||||||||||
| Sales and marketing | 6,739,149 | 954,501 | 5,784,648 | 606 | % | |||||||||||
| Research and development | 3,310,943 | 874,026 | 2,436,917 | 279 | % | |||||||||||
| Depreciation and amortization | 2,004,319 | 477,405 | 1,526,914 | 320 | % | |||||||||||
| Total operating expenses | 28,643,715 | 4,965,300 | 23,678,415 | 477 | % | |||||||||||
| Operating loss | (25,705,074 | ) | (4,767,725 | ) | (20,937,349 | ) | 439 | % | ||||||||
| Other income (expense): | ||||||||||||||||
| Other income, net | 173,644 | 8,174 | 165,470 | 2024 | % | |||||||||||
| Change in fair value of convertible promissory notes | (14,571,109 | ) | - | (14,571,109 | ) | NM | ||||||||||
| Change in fair value of earn-out liabilities | 450,000 | - | 450,000 | NM | ||||||||||||
| Change in fair value of warrant liabilities | (7,783,000 | ) | - | (7,783,000 | ) | NM | ||||||||||
| Interest expense, net | (210,545 | ) | - | (210,545 | ) | NM | ||||||||||
| Loss before income taxes | (47,646,084 | ) | (4,759,551 | ) | (42,886,533 | ) | 901 | % | ||||||||
| Income tax (expense) benefit | (1,527 | ) | 3,495 | (5,022 | ) | (144 | )% | |||||||||
| Net loss | $ | (47,647,611 | ) | $ | (4,756,056 | ) | $ | (42,891,555 | ) | 902 | % | |||||
NM* — Percentage change not meaningful.
Revenues, net
| For the three months ended September 30, | For the nine months ended September 30, | |||||||||||||||
| 2023 | 2022 | 2023 | 2022 | |||||||||||||
| Revenues, net: | ||||||||||||||||
| Marketplace | ||||||||||||||||
| Advertising sales | $ | 875,546 | $ | 124,634 | $ | 1,783,287 | $ | 197,575 | ||||||||
| Brands | ||||||||||||||||
| Product sales | 1,387,951 | - | 1,387,951 | - | ||||||||||||
| Returns and discounts | (232,597 | ) | - | (232,597 | ) | - | ||||||||||
| Total Brand revenues, net | 1,155,354 | - | 1,155,354 | - | ||||||||||||
| Total revenues, net | $ | 2,030,900 | $ | 124,634 | $ | 2,938,641 | $ | 197,575 | ||||||||
Revenues, net increased by $1.9 million for the three months ended September 30, 2023 compared to the three months ended September 30, 2022. The increase was driven by the first quarter of product sales of $1.4 million offset by returns and discounts of $0.2 million, as well as an increase in the business member base and introduction of new advertising features on our platform, which resulted in advertising revenues of $0.9 million.
Revenues, net increased by $2.7 million for the nine months ended September 30, 2023 compared to the nine months ended September 30, 2022. The increase was driven by the first quarter of product sales of $1.4 million offset by returns and discounts of $0.2 million, as well as an increase in the business member base and introduction of new advertising features on our platform, which resulted in advertising revenues of $1.8 million.
28
Cost of sales - services (exclusive of depreciation and amortization)
Cost of sales (exclusive of depreciation and amortization) increased by $0.4 million, or 171%, for the three months ended September 30, 2023 compared to the three months ended September 30, 2022. The increase was mainly due to an increase in personnel expenses of $0.4 million.
Cost of sales (exclusive of depreciation and amortization) increased by $0.7 million, or 146%, for the nine months ended September 30, 2023 compared to the nine months ended September 30, 2022. The increase was mainly due to an increase in personnel expenses of $0.7 million.
Cost of goods sold (exclusive of depreciation and amortization)
Cost of goods sold (exclusive of depreciation and amortization) increased by $0.9 million for the three months ended September 30, 2023 compared to the three months ended September 30, 2022. The increase was mainly due to the sale of products of $0.9 million.
Cost of goods sold (exclusive of depreciation and amortization) increased by $0.9 million for the nine months ended September 30, 2023 compared to the nine months ended September 30, 2022. The increase was mainly due to the sale of products of $0.9 million.
Transaction costs incurred in connection with the Business Combination
Transaction costs incurred in connection with the Business Combination for the three months ended September 30, 2023 include legal fees of $1.8 million, accounting fees of $0.2 million, travel and other expenses of $0.3 million and a one-time share-based payment expense of $0.9 million for immediately-vested RSUs issued to non-employee influencers and advisors.
Transaction costs incurred in connection with the Business Combination for the nine months ended September 30, 2023 include legal fees of $5.0 million, accounting fees of $0.8 million, travel and other expenses of $0.3 million and a one-time share-based payment expense of $0.9 million for immediately-vested RSUs issued to non-employee influencers and advisors.
General and Administrative Expense
General and administrative expense increased by $3.3 million, or 334%, for the three months ended September 30, 2023 compared to the three months ended September 30, 2022. The increase was due to a $2.1 million increase in staffing-related costs, as well as a $1.2 million increase in other administrative expenses, which include accounting, legal, and other administrative services.
General and administrative expense increased by $5.3 million, or 242%, for the nine months ended September 30, 2023 compared to the nine months ended September 30, 2022. The increase was due to a $4.6 million increase in staffing-related costs, as well as a $0.7 million increase in other administrative expenses, which include accounting, legal, and other administrative services.
Sales and Marketing Expense
Sales and marketing expense increased by $3.2 million, or 755%, for the three months ended September 30, 2023 compared to the three months ended September 30, 2022. The increase was due to a $3.2 million increase in other marketing and public relation activities.
Sales and marketing expense increased by $5.8 million, or 606%, for the nine months ended September 30, 2023 compared to the nine months ended September 30, 2022. The increase was due to a $5.8 million increase in other marketing and public relation activities.
29
Research and Development Expense
Research and development expense increased by $1.1 million or 259%, for the three months ended September 30, 2023 compared to the three months ended September 30, 2022. The increase was due to an increase in staffing-related costs in our product and engineering teams, as well as costs related to computer software, hardware, and other administrative expenses.
Research and development expense increased by $2.4 million, or 279%, for the nine months ended September 30, 2023 compared to the nine months ended September 30, 2022. The increase was due to an increase in staffing-related costs in our product and engineering teams, as well as costs related to computer software, hardware, and other administrative expenses.
Depreciation and amortization
Depreciation and amortization expense increased $0.6 million, or 273%, for three months ended September 30, 2023 compared to the three months ended September 30, 2022. The increase was primarily related to the amortization of capitalized software development costs.
Depreciation and amortization expense increased $1.5 million, or 320% for nine months ended September 30, 2023 compared to the nine months ended September 30, 2022. The increase was primarily related to the amortization of capitalized software development costs.
Other Income, net
Other income, net increased by $0.1 million and $0.2 million for the three and nine months ended September 30, 2023 compared to the three and nine months ended September 30, 2022, respectively. The increase was primarily related to the realized gain on short term investments.
Interest Expense, net
Interest expense, net increased by $47 thousand and $0.2 million for the three and nine months ended September 30, 2023 compared to the three and nine months ended September 30, 2022, respectively. The increase was due to the interest payable in relation to the Notes recorded as of September 30, 2023.
Income Tax Benefit (Expense)
Income tax benefit (expense) increased by an insignificant amount for the three and nine months ended September 30, 2023 compared to the three and nine months ended September 30, 2022.
30
Liquidity and Capital Resources
Historically, we have financed operations primarily through cash generated from equity raises and operating activities. Our primary short-term requirements for liquidity and capital are to fund general working capital and capital expenditures. Our principal long-term working capital uses include increasing our advertising and marketing exposure, expanding our internal engineering and product teams, developing and launching D2C products, and developing and rolling out e-commerce capabilities.
In connection with the expected launch of our first D2C branded products, we intend to fund initial inventory requirements with cash on hand. Longer term, our expected liquidity and capital requirements will likely consist of research and development needed to identify additional D2C opportunities. We do not currently anticipate that growth and expansion into new areas, such as D2C consumer products, will require us to make significant capital investments in our business, as we plan to employ an “asset light” business model and rely on third party manufacturers and other outsourced third party relationships as we build this part of our business.
As of September 30, 2023 and December 31, 2022, our cash and cash equivalents balance was $25.3 million, and $2.3 million, respectively. Cash and cash equivalents consist of interest-bearing deposit accounts managed by third-party financial institutions, and highly liquid investments with maturities of three months or less.
From March through June 2023, we issued $22.5 million in Notes, of which $22.5 million were received as of June 30, 2023, as part of a Permitted Financing under the Merger Agreement. The Notes are unsecured obligations and bear interest at a rate of 5% per annum, which interest will accrue and be added to the principal amount of the Notes. In July 2023, in connection with the consummation of the Business Combination, the Notes automatically converted into shares of PSQ Common Stock immediately prior to completion of the Business Combination at a conversion rate based upon an implied $100 million fully diluted pre-money valuation of Private PSQ, excluding the Notes. Upon such conversion and before giving effect to the Merger, the shares of Private PSQ Common Stock issued in respect of the aggregate balances under all Notes represented approximately 18.4% of the total outstanding shares of Private PSQ Common Stock. The Notes were issued in a private placement transaction exempt from registration under the Securities Act of 1933, as amended.
In conjunction with the consummation of the Business Combination, we received proceeds totaling $34,938,880 in July 2023, after giving effect to Colombier’s stockholder redemptions and before payment of transaction expenses, which will be utilized to fund our operations and growth plans. To the extent our Warrants are exercised for cash, we will receive up to an aggregate of approximately $131.7 million from the exercises thereof. On November 13, 2023, the closing price of the Class A Common Stock as reported by the NYSE was $6.78 per share, which price was less than the $11.50 per share exercise price of the Warrants. There can be no assurance that the trading price of our Class A Common Stock will exceed the exercise price per share of the Warrants after the date of this report and prior to their expiration. Until such time occurs, holders of our Warrants are less likely to exercise their Warrants for cash. In considering our capital requirements and sources of liquidity, we have not assumed or relied on the receipt of any proceeds from potential future exercises of the Warrants. We believe that as a result of the Business Combination our existing cash and short-term investments, as well as proceeds received from the Business Combination, will be sufficient to fund operations and capital needs for at least one year from the date the condensed consolidated financial statements were issued for the quarterly period ended September 30, 2023.
Our future capital requirements will depend on many factors, including our revenue growth rate, the timing and extent of spending by us to support further sales and marketing and research and development efforts, the degree to which we are successful in launching new business initiatives such as our contemplated e-commerce and D2C business initiatives and the cost associated with these initiatives, and the growth of our business generally. In order to finance these opportunities and associated costs, it is possible that we will need to raise additional financing if the proceeds realized by us from the Merger are insufficient to support our business needs. While we believe that the proceeds realized by us through the Merger will be sufficient to meet our currently contemplated business needs, we cannot assure you that this will be the case. If additional financing is required by us from outside sources, we may not be able to raise it on terms acceptable to us or at all. If we are unable to raise additional capital on acceptable terms when needed, our business, results of operations and financial condition would be materially and adversely affected.
31
Comparison of the Nine Months Ended September 30, 2023 and 2022
The following table shows our cash flows provided by (used in) operating activities, investing activities and financing activities for the stated periods:
| For the nine months ended September 30, | ||||||||||||
| 2023 | 2022 | Variance | ||||||||||
| Net cash used in operating activities | $ | (12,274,951 | ) | $ | (4,217,078 | ) | (8,057,873 | ) | ||||
| Net cash used in investing activities | (1,866,087 | ) | (1,080,137 | ) | (785,950 | ) | ||||||
| Net cash provided by financing activities | 37,066,542 | 5,433,365 | 31,633,177 | |||||||||
Net Cash Used in Operating Activities
Net cash used in operating activities for the nine months ended September 30, 2023 was $12.3 million compared to $4.2 million used in operating activities during the nine months ended September 30, 2022. The increase in cash used in operating activities was due to an overall increase in operating expenses, resulting in an increased net loss of $42.9 million (which includes the change in fair value of Notes of $14.6 million, and change in fair value of the warrants of $7.8 million). This was offset with an increase in non-cash expenses of $1.5 for amortization and depreciation and share based compensation of $2.1 million. Also offsetting this was an increase in cash provided by operating assets and liabilities of $9.4 million.
Net Cash Used in Investing Activities
Net cash used in investing activities for the nine months ended September 30, 2023 was $1.9 million, an increase of $0.8 million from cash used in investing activities of $1.1 million for the nine months ended September 30, 2022. The increase was primarily due additional costs incurred with the internally developed software (the gross capitalized software development costs included in intangible assets as of September 30, 2023 were $4.0 million).
Net Cash Provided by Financing Activities
Net cash provided by financing activities for nine months ended September 30, 2023 was $37.1 million compared to $5.4 million provided by financing activities for the nine months ended September 30, 2022. The increase was primarily due to $22.5 million of proceeds from the issuance of Notes, $18.1 million of proceeds from the reverse recapitalization and $2.6 million of proceeds from the issuance of Private PSQ Common Stock, offset by transaction costs of $6.1 million.
Non-GAAP Financial Measures
The non-GAAP financial measures below have not been calculated in accordance with GAAP and should be considered in addition to results prepared in accordance with GAAP and should not be considered as a substitute for, or superior to, GAAP results. In addition, Adjusted EBITDA should not be construed as indicators of our operating performance, liquidity or cash flows generated by operating, investing and financing activities, as there may be significant factors or trends that they fail to address. We caution investors that non-GAAP financial information, by its nature, departs from traditional accounting conventions. Therefore, its use can make it difficult to compare our current results with our results from other reporting periods and with the results of other companies.
Our management uses these non-GAAP financial measures, in conjunction with GAAP financial measures, as an integral part of managing our business and to, among other things: (i) monitor and evaluate the performance of our business operations and financial performance; (ii) facilitate internal comparisons of the historical operating performance of our business operations; (iii) facilitate external comparisons of the results of our overall business to the historical operating performance of other companies that may have different capital structures and debt levels; (iv) review and assess the operating performance of our management team; (v) analyze and evaluate financial and strategic planning decisions regarding future operating investments; and (vi) plan for and prepare future annual operating budgets and determine appropriate levels of operating investments.
32
Adjusted EBITDA
We define adjusted EBITDA, a non-GAAP financial measure, as net earnings (loss) before interest and other expenses, net, income tax expense, depreciation and amortization, as adjusted to exclude change in fair value of our financial instruments, other income (expense), net, transaction expenses and share-based compensation expense. We utilize adjusted EBITDA as an internal performance measure in the management of our operations because we believe the exclusion of these non-cash and non-recurring charges allow for a more relevant comparison of our results of operations to other companies in our industry. adjusted EBITDA should not be viewed as a substitute for net loss calculated in accordance with GAAP, and other companies may define adjusted EBITDA differently.
The following table provides a reconciliation of net loss to adjusted EBITDA to net loss for the periods presented:
| For the three months ended September 30, | For the nine months ended September 30, | |||||||||||||||
| 2023 | 2022 | 2023 | 2022 | |||||||||||||
| Net loss | (20,238,664 | ) | $ | (2,121,300 | ) | $ | (47,647,611 | ) | $ | (4,756,056 | ) | |||||
| Excluding: | ||||||||||||||||
| Interest expense, net | 46,690 | - | 210,545 | - | ||||||||||||
| Income tax (benefit) expense | (262 | ) | (4,208 | ) | 1,527 | (3,495 | ) | |||||||||
| Change in fair value of convertible notes | - | - | 14,571,109 | - | ||||||||||||
| Change in fair value of earn-out liabilities | (450,000 | ) | - | (450,000 | ) | - | ||||||||||
| Change in fair value of warrant liabilities | 7,783,000 | - | 7,783,000 | - | ||||||||||||
| Other income, net | (119,957 | ) | (328 | ) | (173,644 | ) | (8,174 | ) | ||||||||
| Depreciation and amortization | 759,745 | 203,489 | 2,004,319 | 477,405 | ||||||||||||
| Share-based compensation (exclusive of what is shown above in transaction costs) | 1,185,089 | - | 1,185,089 | - | ||||||||||||
| Transaction costs incurred in connection with the Business Combination | 3,309,597 | - | 7,048,177 | - | ||||||||||||
| Adjusted EBITDA | $ | (7,724,762 | ) | (1,922,347 | ) | (15,467,489 | ) | (4,290,320 | ) | |||||||
Off-Balance Sheet Arrangements
None.
Critical Accounting Policies and Significant Management Estimates
We prepare our financial statements in accordance with GAAP. The preparation of financial statements also requires we make estimates and assumptions that affect the reported amounts of assets, liabilities, revenue, costs and expenses and related disclosures. We base our estimates on historical experience and on various other assumptions that we believe to be reasonable under the circumstances. Actual results could differ significantly from the estimates made by our management. To the extent that there are differences between our estimates and actual results, our future financial statement presentation, balance sheet, results of operations and cash flows will be affected. We believe that the accounting policies discussed below are critical to understanding our historical and future performance, as these policies relate to the more significant areas involving our management’s judgments and estimates. Critical accounting policies and estimates are those that we consider the most important to the portrayal of our balance sheet and results of operations because they require our most difficult, subjective or complex judgments, often as a result of the need to make estimates about the effects of matters that are inherently uncertain.
The preparation of our financial statements in conformity with GAAP requires us to make estimates and judgments that affect the amounts reported in those financial statements and accompanying notes. Although we believe that the estimates we use are reasonable, due to the inherent uncertainty involved in making those estimates, actual results reported in future periods could differ from those estimates. Our significant accounting policies are described in Note 3 to our Interim Condensed Consolidated Financial Statements for the three- and nine-month period ended September 30, 2023 included elsewhere in this report. Our critical accounting policies are described below.
33
Revenue Recognition
[1] Marketplace Revenues
Advertising services
Advertising revenue is generated by displaying ad products and services on the Company’s platform. Customers enter into advertising subscription arrangements. The Company recognizes revenues over-time as the ads are displayed over the subscription period so the Company is providing a service and the service is being consumed by the customer simultaneously over the period of service. In general, we report advertising revenue on a gross basis, since we control the advertising inventory before it is transferred to our customers. Our control is evidenced by our sole ability to monetize the advertising inventory before it is transferred to our customers.
The Company recognizes revenue from push notifications and email blasts at a point in time when delivered. Push notifications and email blasts are considered delivered when an ad is displayed to users. When a customer enters into an advertising subscription arrangement that includes push notifications and/or email blasts, the Company allocates a portion of the total consideration to the push notification and email blast performance obligations based on the residual approach.
[2] Brand Sales
Product Sales
The Company generates revenue through the sale of diapers and wipes to consumers by way of the Company’s website. The Company considers customer orders to be the contracts with the customer. There is a single performance obligation, which is the Company’s promise to transfer the Company’s product to customers based on specific payment and shipping terms in the arrangement. The entire transaction price is allocated to this single performance obligation. Product revenue is recognized when a customer obtains control of the Company’s product, which occurs at shipment. Revenue is measured as the amount of consideration the Company expects to receive in exchange for transferring products.
The Company evaluated principal versus agent considerations to determine whether it is appropriate to record third-party logistics provider fees paid as an expense. Thes fees are recorded shipping and handling expenses within cost of goods sold and are not recorded as a reduction of revenue because the Company owns and controls all the goods before they are transferred to the customer. The Company can, at any time, direct the third-party logistics provider to return the Company’s inventories to any location specified by the Company. It is the Company’s responsibility to make any returns made by customers directly to logistic providers and the Company retains the back-end inventory risk. Further, the Company is subject to credit risk (i.e., credit card chargebacks), establishes prices of its products, fulfills the goods to the customer and can limit quantities or stop selling the goods at any time.
34
Product Returns
Consistent with industry practice, the Company generally offers customers a limited right of return for products purchased. The Company reviews its receivables quarterly and records a reserve, if necessary. As of September 30, 2023, the Company has not deemed it necessary to record a reserve.
Warrant Liabilities
The Company does not use derivative instruments to hedge exposures to cash flow, market, or foreign currency risks. The Company evaluates all of its financial instruments, including issued share purchase warrants, to determine if such instruments are derivatives or contain features that qualify as embedded derivatives, pursuant to Financial Accounting Standards Board’s (“FASB”) Accounting Standards Codification Topic, ASC 815-40, Derivatives and Hedging (“ASC 815-40”). The classification of derivative instruments, including whether such instruments should be recorded as liabilities or as equity, is re-assessed at the end of each reporting period. The Company accounts for the Public Warrants (as defined in Note 9) and the Private Placement Warrants (collectively, with the Public Warrants, the “Warrants”) in accordance with the guidance contained in ASC 815-40 under which the Warrants do not meet the criteria for equity treatment and must be recorded as liabilities. Accordingly, the Company classifies the Warrants as liabilities at their fair value and adjusts the Warrants to fair value at each reporting period. This liability is subject to re-measurement at each balance sheet date until exercised, and any change in fair value is recognized in the consolidated statements of operations. The Warrants for periods where no observable traded price was available are valued using a binomial lattice model. For periods subsequent to the detachment of the Public Warrants from the Units, the Public Warrant quoted market price will be used as the fair value as of each relevant date.
Share Based Compensation
The Company recognizes an expense for share-based compensation awards based on the estimated fair value of the award on the date of grant.
The Company accounts for share-based compensation under the provisions of ASC Topic 718. As noted above, ASC Topic 718 requires that share-based payment transactions with employees and non-employees, in certain cases, be recognized in the condensed consolidated financial statements based on their fair value. As of September 30, 2023 there were 3,115,989 units outstanding. At December 31, 2022, there were no board approved grants of share-based compensation awards.
Income Taxes
We use the asset and liability method of accounting for income taxes. Under this method, deferred tax assets and liabilities are recognized by applying the statutory tax rates in effect in the years in which the differences between the financial reporting and tax filing bases of existing assets and liabilities are expected to reverse. Valuation allowances are established when necessary to reduce deferred tax assets to the amounts expected to be realized.
We utilize a two-step approach to recognizing and measuring uncertain income tax positions (tax contingencies). The first step is to evaluate the tax position for recognition by determining if the weight of available evidence indicates it is more likely than not that the position will be sustained on audit, including resolution of related appeals or litigation processes. The second step is to measure the tax benefit as the largest amount which is more than 50% likely of being realized upon ultimate settlement. We make estimates, assumptions and judgments to determine its provision for income taxes and also for deferred tax assets and liabilities and any valuation allowances recorded against deferred tax assets. Actual future operating results and the underlying amount and type of income could differ materially from our estimates, assumptions and judgments thereby impacting its financial position and results of operations.
35
Emerging Growth Company Status
In April 2012, the JOBS Act was enacted. Section 107(b) of the JOBS Act provides that an emerging growth company can take advantage of an extended transition period for complying with new or revised accounting standards. Thus, an emerging growth company can delay the adoption of certain accounting standards until those standards would otherwise apply to private companies. We have elected to take advantage of the extended transition period to comply with new or revised accounting standards and to adopt certain of the reduced disclosure requirements available to emerging growth companies. As a result of the accounting standards election, we will not be subject to the same implementation timing for new or revised accounting standards as other public companies that are not emerging growth companies which may make comparison of our financials to those of other public companies more difficult.
Implications of being a Smaller Reporting Company
Additionally, PSQ is a “smaller reporting company” as defined in Item 10(f)(1) of Regulation S-K. Smaller reporting companies may take advantage of certain reduced disclosure obligations, including, among other things, providing only two years of audited financial statements. PSQ will remain a smaller reporting company until the last day of the fiscal year in which (i) the market value of common stock held by non-affiliates exceeds $250 million as of the end of that year’s second fiscal quarter (if PSQ’s annual revenues exceeded $100 million during such completed fiscal year), or (ii) The market value of common stock held by non-affiliates equals or exceeds $700 million as of the end of that year’s second fiscal quarter (if PSQ’s annual revenues did not exceed $100 million during such completed fiscal year). To the extent PSQ takes advantage of such reduced disclosure obligations, it may also make comparison of its financial statements with other public companies difficult or impossible.
Recent Accounting Pronouncements
See Note 3, Summary of Significant Accounting Policies, to our condensed consolidated financial statements for the three and nine months ended September 30, 2023 and 2022 as well as Private PSQ’s financial statements for the year ended December 31, 2022.
Changes in and Disagreements with Accountants on Accounting and Financial Disclosure
None.
Internal Control over Financial Reporting
During the audit of the Private PSQ financial statements for the year ended December 31, 2022, its independent registered accounting firm noted deficiencies that constitute a material weakness in our internal control over financial reporting which remains as of September 30, 2023. We have taken and intend to continue to take steps to remediate this material weakness, including enlisting the help of external advisors to provide assistance in the areas of internal controls in the short term, and evaluating the longer-term resource needs of our accounting staff. These remediation measures will continue to be time consuming and costly, and place significant demands on our financial, accounting, and operational resources.
Item 3. Quantitative and Qualitative Disclosures about Market Risk
As a smaller reporting company, we are not required to provide the information required by this Item.
Item 4. Controls and Procedures
Disclosure controls and procedures are controls and other procedures that are designed to ensure that information required to be disclosed in our reports filed or submitted under Securities Exchange Act of 1934, as amended (the “Exchange Act”), is recorded, processed, summarized and reported within the time periods specified in the SEC’s rules and forms. Disclosure controls and procedures include, without limitation, controls and procedures designed to ensure that information required to be disclosed in our reports filed or submitted under the Exchange Act is accumulated and communicated to our management, including our Chief Executive Officer and Chief Financial Officer, to allow timely decisions regarding required disclosure.
36
Evaluation of Disclosure Controls and Procedures
As required by Rules 13a-15 and 15d-15 under the Exchange Act, our Chief Executive Officer and Chief Financial Officer carried out an evaluation of the effectiveness of the design and operation of our disclosure controls and procedures as of September 30, 2023. Based on this evaluation, our Chief Executive Officer and Chief Financial Officer have concluded that our disclosure controls and procedures were not effective, due solely to the material weakness in our internal control over financial reporting. As a result, we performed additional analysis as deemed necessary to ensure that our financial statements were prepared in accordance with GAAP. Accordingly, management believes that the financial statements included in this Quarterly Report on Form 10-Q present fairly in all material respects our financial position, results of operations and cash flows for the period presented.
Management intends to implement remediation steps to improve our disclosure controls and procedures and our internal control over financial reporting. Specifically, we intend to expand and improve our review process for complex transactions. We plan to further improve this process by enhancing access to accounting literature, identification of third-party professionals with whom to consult regarding complex accounting applications, and consideration of additional staff with the requisite experience and training to supplement existing accounting professionals.
Changes in Internal Control Over Financial Reporting
There was no change in our internal control over financial reporting (as defined in Rules 13a-15(f) and 15d-15(f) under the Exchange Act) during the period from January 1, 2023 through September 30, 2023 that has materially affected, or is reasonably likely to materially affect, our internal control over financial reporting.
37
PART II - OTHER INFORMATION
Item 1. Legal Proceedings.
None.
Item 1A. Risk Factors.
As a result of closing of the Business Combination on July 19, 2023, the risk factors previously disclosed Part I, Item 1A of our Annual Report on Form 10-K for the fiscal year ended December 31, 2022 no longer apply. For risk factors relating to our business following the Business Combination, please refer to the section “Risk Factors” in the Company’s Registration Statement on Form S-1 (File No. 333-273830) initially filed with the SEC on August 9, 2023, as amended. Any of these factors could result in a significant or material adverse effect on the Company’s results of operations or financial condition. Additional risk factors not presently known to us or that we currently deem immaterial may also impair the Company’s business or results of operations. We may disclose changes to such factors or disclose additional factors from time to time in the Company’s future filings with the SEC.
Item 2. Unregistered Sale of Equity Securities, Use of Proceeds, and Issuer Purchases of Equity Securities.
(a) During the quarter ended September 30, 2023, there were no unregistered sales of our securities that were not reported in a Current Report on Form 8-K.
(b) On June 11, 2021, Colombier consummated its initial public offering (the “Initial Public Offering”) of 15,000,000 units consisting of one share of Colombier Class A Common Stock and one-third (1/3) of one public warrant (“Units”). The Units were sold at an offering price of $10.00 per unit, generating total gross proceeds of $150,000,000. B. Riley Securities, Inc. acted as sole book-running manager, of the Initial Public Offering. The securities in the Initial Public Offering were registered under the Securities Act on registration statement on Form S-1 (No. 333-254492). The SEC declared the registration statements effective on June 8, 2021.
Simultaneous with the consummation of the Initial Public Offering, the Sponsor consummated the private placement of an aggregate of 5,250,000 warrants (the “Private Placement Warrants”) at a price of $1.00 per Private Placement Warrant, generating total proceeds of $5,250,000. Each whole Private Placement Warrant is exercisable to purchase one share of common stock at an exercise price of $11.50 per share. The issuance was made pursuant to the exemption from registration contained in Section 4(a)(2) of the Securities Act.
The Private Placement Warrants are identical to the warrants underlying the Units sold in the Initial Public Offering, except that the Private Placement Warrants are not transferable, assignable, or salable until after the completion of a business combination, subject to certain limited exceptions.
On July 1, 2021, the underwriters exercised their over-allotment option in full, resulting in the sale of an additional 2,250,000 Units for gross proceeds of $22,500,000, less the underwriters’ discount of $450,000. In connection with the underwriters’ full exercise of their over-allotment option, the Company also consummated the sale of an additional 450,000 Private Placement Warrants at $1.00 per Private Placement Warrant, generating total proceeds of $450,000. A total of $22,500,000 was deposited into the Trust Account, bringing the aggregate proceeds held in the Trust Account to $172,500,000.
Of the gross proceeds received from the Initial Public Offering, the exercise of the over-allotment option and the Private Placement Warrants, an aggregate of $150,000,000 was placed in the Trust Account.
We paid a total of $3,000,000 in underwriting discounts and commissions and $460,299 for other costs and expenses related to the Initial Public Offering.
For a description of the use of the proceeds generated in our Initial Public Offering, see Part I, Item 2 of this Quarterly Report on Form 10-Q.
The consummation of the Business Combination resulted in gross proceeds of $176.1 million, reflecting use of proceeds to pay for redemptions to public stockholders.
The funds from the Business Combination were used for: (i) redemptions to public stockholders – reflected in the gross proceeds of the Business Combination; (ii) cash to balance sheet; and (iii) payment of fees and expenses. The direct and indirect fees and expenses incurred were approximately $33.7 million. As of July 19, 2023, we added $18.1 million as cash to our balance sheet.
(c) None.
Item 3. Defaults Upon Senior Securities.
None.
Item 4. Mine Safety Disclosures.
Not Applicable.
38
Item 5. Other Information.
(a) None.
(b) Following the closing of the Business Combination, we adopted our Amended and Restated Bylaws, which, among other things, set forth certain procedures by which our shareholders may recommend nominees to our board of directors, as described in more detail in the Registration Statement on Form S-4 filed by Colombier, as amended (File No. 333-271177).
(c) Not applicable.
Item 6. Exhibits.
The following exhibits are filed as part of, or incorporated by reference into, this Quarterly Report on Form 10-Q.
39
| * | Filed herewith. |
| # | Indicates a management contract or compensatory plan, contract or arrangement. |
| † | Schedules and similar attachments to this Exhibit have been omitted pursuant to Item 601(a)(5) of Registration S-K. The Company hereby agrees to furnish a copy of any omitted schedules to the SEC upon request. |
| + | Certain portions of this document that constitute confidential information have been redacted in accordance with Regulation S-K, Item 601(b)(10). |
40
SIGNATURES
Pursuant to the requirements of Securities Exchange Act of 1934, the registrant has duly caused this report to be signed on its behalf by the undersigned, thereunto duly authorized.
| PSQ Holdings, Inc. | ||
| Date: November 14, 2023 | /s/ Michael Seifert | |
| Name: | Michael Seifert | |
| Title: | President and Chief Executive Officer | |
| (Principal Executive Officer) | ||
| Date: November 14, 2023 | /s/ Bradley Searle | |
| Name: | Bradley Searle | |
| Title: | Chief Financial Officer | |
| (Principal Financial and Accounting Officer) | ||
41
Similar companies
See also Angi Inc. - Annual report 2022 (10-K 2022-12-31) Annual report 2023 (10-Q 2023-09-30)See also Vado Corp. - Annual report 2022 (10-K 2022-11-30) Annual report 2023 (10-Q 2023-09-30)
See also Clear Channel Outdoor Holdings, Inc. - Annual report 2022 (10-K 2022-12-31) Annual report 2023 (10-Q 2023-09-30)
See also Thryv Holdings, Inc. - Annual report 2022 (10-K 2022-12-31) Annual report 2023 (10-Q 2023-09-30)
See also Quotient Technology Inc. - Annual report 2022 (10-K 2022-12-31) Annual report 2023 (10-Q 2023-06-30)