Resolute Forest Products Inc. - Annual Report: 2013 (Form 10-K)
UNITED STATES SECURITIES AND EXCHANGE COMMISSION
WASHINGTON, D.C. 20549
FORM 10-K
(Mark One)
þ | ANNUAL REPORT PURSUANT TO SECTION 13 OR 15(d) OF THE SECURITIES EXCHANGE ACT OF 1934 FOR THE FISCAL YEAR ENDED DECEMBER 31, 2013 | |
¨ | TRANSITION REPORT PURSUANT TO SECTION 13 OR 15(d) OF THE SECURITIES EXCHANGE ACT OF 1934 FOR THE TRANSITION PERIOD FROM TO | |
COMMISSION FILE NUMBER: 001-33776
RESOLUTE FOREST PRODUCTS INC.
(Exact name of registrant as specified in its charter)
Delaware | 98-0526415 | |
(State or other jurisdiction of incorporation or organization) | (I.R.S. employer identification number) | |
111 Duke Street, Suite 5000; Montréal, Québec; Canada H3C 2M1 |
(Address of principal executive offices) (Zip Code) |
(514) 875-2515 |
(Registrant’s telephone number, including area code)
Securities registered pursuant to Section 12(b) of the Act:
Common Stock, par value $.001 per share | New York Stock Exchange Toronto Stock Exchange | |
(Title of class) | (Name of exchange on which registered) | |
Securities registered pursuant to Section 12(g) of the Act: None
Indicate by check mark if the registrant is a well-known seasoned issuer, as defined in Rule 405 of the Securities Act. Yes þ No ¨
Indicate by check mark if the registrant is not required to file reports pursuant to Section 13 or Section 15(d) of the Act. Yes ¨ No þ
Indicate by check mark whether the registrant (1) has filed all reports required to be filed by Section 13 or 15(d) of the Securities Exchange Act of 1934 during the preceding 12 months (or for such shorter period that the registrant was required to file such reports), and (2) has been subject to such filing requirements for the past 90 days. Yes þ No ¨
Indicate by check mark whether the registrant has submitted electronically and posted on its corporate Website, if any, every Interactive Data File required to be submitted and posted pursuant to Rule 405 of Regulation S-T (§232.405 of this chapter) during the preceding 12 months (or for such shorter period that the registrant was required to submit and post such files). Yes þ No ¨
Indicate by check mark if disclosure of delinquent filers pursuant to Item 405 of Regulation S-K (§229.405 of this chapter) is not contained herein, and will not be contained, to the best of the registrant’s knowledge, in definitive proxy or information statements incorporated by reference in Part III of this Form 10-K or any amendment to this Form 10-K. ¨
Indicate by check mark whether the registrant is a large accelerated filer, an accelerated filer, a non-accelerated filer, or a smaller reporting company. See the definitions of “large accelerated filer,” “accelerated filer” and “smaller reporting company” in Rule 12b-2 of the Exchange Act.
Large accelerated filer þ | Accelerated filer ¨ | Non-accelerated filer ¨ | Smaller reporting company ¨ |
(Do not check if a smaller reporting company) | |||
Indicate by check mark whether the registrant is a shell company (as defined in Rule 12b-2 of the Act). Yes ¨ No þ
The aggregate market value of the registrant’s common stock held by non-affiliates of the registrant as of the last business day of the registrant’s most recently completed second fiscal quarter (June 28, 2013) was approximately $864 million.
Indicate by check mark whether the registrant has filed all documents and reports required to be filed by Section 12, 13 or 15(d) of the Securities Exchange Act of 1934 subsequent to the distribution of securities under a plan confirmed by a court. Yes þ No ¨
As of January 31, 2014, there were 94,546,260 shares of Resolute Forest Products Inc. common stock outstanding.
DOCUMENTS INCORPORATED BY REFERENCE
Portions of the registrant’s definitive proxy statement to be filed within 120 days of December 31, 2013 are incorporated by reference in this Annual Report on Form 10-K in response to Part III, Items 10, 11, 12, 13 and 14.
TABLE OF CONTENTS
Item 1. | ||
Item 1A. | ||
Item 1B. | ||
Item 2. | ||
Item 3. | ||
Item 4. | ||
Item 5. | ||
Item 6. | ||
Item 7. | ||
Item 7A. | ||
Item 8. | ||
Item 9. | ||
Item 9A. | ||
Item 9B. | ||
Item 10. | ||
Item 11. | ||
Item 12. | ||
Item 13. | ||
Item 14. | ||
Item 15. | ||
CAUTIONARY STATEMENTS REGARDING FORWARD-LOOKING INFORMATION AND USE OF
THIRD-PARTY DATA
Statements in this Annual Report on Form 10-K (“Form 10-K”) that are not reported financial results or other historical information of Resolute Forest Products Inc. (with its subsidiaries and affiliates, either individually or collectively, unless otherwise indicated, referred to as “Resolute Forest Products,” “we,” “our,” “us” or the “Company”) are “forward-looking statements” within the meaning of the Private Securities Litigation Reform Act of 1995. They include, for example, statements relating to our: efforts to reach resolution concerning the funding relief measures related to the material Canadian registered pension plans; efforts to continue to reduce costs and increase revenues and profitability, including our cost reduction initiatives; business and operating outlook; assessment of market conditions; prospects, growth strategies and the industry in which we operate; and strategies for achieving our goals generally, including the strategies described in Part II, Item 7, “Management’s Discussion and Analysis of Financial Condition and Results of Operations – Our Business,” of this Form 10-K. Forward-looking statements may be identified by the use of forward-looking terminology such as the words “should,” “would,” “could,” “will,” “may,” “expect,” “believe,” “anticipate,” “attempt,” “project” and other terms with similar meaning indicating possible future events or potential impact on our business or shareholders.
The reader is cautioned not to place undue reliance on these forward-looking statements, which are not guarantees of future performance. These statements are based on management’s current assumptions, beliefs and expectations, all of which involve a number of business risks and uncertainties that could cause actual results to differ materially. The potential risks and uncertainties that could cause our actual future financial condition, results of operations and performance to differ materially from those expressed or implied in this Form 10-K include the risks described in Part I, Item 1A, “Risk Factors.”
All forward-looking statements in this Form 10-K are expressly qualified by the cautionary statements contained or referred to in this section and in our other filings with the United States Securities and Exchange Commission (the “SEC”) and the Canadian securities regulatory authorities. We disclaim any obligation to publicly update or revise any forward-looking information, whether as a result of new information, future events or otherwise, except as required by law.
Market and Industry Data
Certain information about industry or general economic conditions contained in this Form 10-K is derived from third-party sources and certain trade publications that we believe are widely accepted and accurate; however, we have not independently verified this information and cannot provide assurances of its accuracy.
PART I
ITEM 1. BUSINESS
We are a global leader in the forest products industry, with a diverse range of products, including newsprint, specialty papers, market pulp and wood products, which are marketed in close to 90 countries. We own or operate over 40 pulp and paper mills and wood products facilities in the United States, Canada and South Korea, and power generation assets in Canada.
Resolute Forest Products Inc., a Delaware corporation, was formed on January 25, 2007, from the merger of Abitibi-Consolidated Inc. (“Abitibi”) and Bowater Incorporated. The ticker symbol for our common stock is “RFP” and trades on both the New York Stock Exchange (the “NYSE”) and the Toronto Stock Exchange (the “TSX”).
1
Executive Officers
The following is information about our executive officers as of March 3, 2014:
Name | Age | Position | Officer Since |
Richard Garneau | 66 | President and Chief Executive Officer | 2011 |
Pierre Laberge | 57 | Senior Vice President, Human Resources | 2011 |
John Lafave | 49 | Senior Vice President, Pulp and Paper Sales and Marketing | 2011 |
Yves Laflamme | 57 | Senior Vice President, Wood Products, Procurement and Information Technology | 2007 |
Jo-Ann Longworth | 53 | Senior Vice President and Chief Financial Officer | 2011 |
André Piché | 55 | Senior Vice President, Pulp and Paper Operations | 2014 |
Richard Tremblay | 50 | Senior Vice President, Pulp and Paper Operations | 2014 |
Jacques P. Vachon | 54 | Senior Vice President, Corporate Affairs and Chief Legal Officer | 2007 |
Mr. Garneau joined the board of directors in June 2010. Previously, Mr. Garneau served as president and chief executive officer of Catalyst Paper Corporation from March 2007 to May 2010. Prior to his tenure at Catalyst, Mr. Garneau served as executive vice president, operations at Domtar Corporation. He also held a variety of roles at Norampac Inc. (a joint-venture of Domtar Inc. and Cascades Inc.), Copernic Inc., Future Electronics Inc., St. Laurent Paperboard Inc., Finlay Forest Industries Inc. and Donohue Inc. Mr. Garneau is a member of the Chartered Professional Accountants of Canada.
Mr. Laberge previously served as senior vice president, human resources and public affairs from June 2011 to February 2012 and as vice president, human resources for our Canadian operations from January 2011 to May 2011.
Mr. Lafave previously served as vice president sales, national accounts – paper sales, vice president sales, national accounts – newsprint, vice president sales, commercial printers of Abitibi from 2004 to 2009. He held progressive positions in sales with UPM-Kymmene and Repap Enterprises.
Mr. Laflamme previously served as senior vice president, wood products from October 2007 to January 2011, as senior vice president, woodlands and sawmills of Abitibi from 2006 to October 2007, and as vice president, sales, marketing and value-added wood products operations of Abitibi from 2004 to 2005.
Ms. Longworth previously served as special advisor to the president and chief executive officer, focusing on special mandates, from July 4, 2011 to August 31, 2011. She served as senior vice president and chief accounting officer with World Color Inc. (formerly Quebecor World Inc.) from 2008 to 2010, as chief financial officer with Skyservice Inc. from 2007 to 2008, as vice president and controller with Novelis, Inc. from 2005 to 2006, and held a number of financial and operational roles over a 16-year career with Alcan Inc.
Mr. Piché previously served as interim senior vice president, pulp and paper operations from November 1, 2013 to February 4, 2014. He served as vice president, pulp and paper operations from October 2012 to October 2013, as vice president, operational excellence from November 2007 to September 2012, and as general manager of the Baie-Comeau, Laurentide and Clermont mills between 1996 and 2008.
Mr. Tremblay previously served as interim senior vice president, pulp and paper operations from November 1, 2013 to February 4, 2014. He served as vice president, pulp and paper operations from June 2011 to October 2013. Prior to joining Resolute in June 2011, he served as general manager of several mills at Smurfit Stone Container Corporation between 2002 and 2011.
Mr. Vachon previously served as senior vice president and chief legal officer from January 2011 to February 2012, as senior vice president, corporate affairs and chief legal officer from October 2007 to January 2011, and as senior vice president, corporate affairs and secretary of Abitibi from 1997 to October 2007.
Our Products
We manage our business based on the products we manufacture. Our reportable segments correspond to our principal product lines: newsprint, specialty papers, market pulp and wood products. Certain segment and geographical financial information, including sales by segment and by geographic area, operating income (loss) by segment and long-lived assets by geographic area, can be found in Note 20, “Segment Information” to our consolidated financial statements and related notes (“Consolidated Financial Statements”) appearing in Part II, Item 8, “Financial Statements and Supplementary Data,” of this Form 10-K (“Item 8”). As of the fourth quarter of 2013, the results from our coated papers operations have been integrated with the specialty papers segment. This better reflects management's internal analysis, given the increasingly high degree of substitution with
2
supercalender grades, and the diminishing percentage coated papers represents in our product portfolio. Comparative year information, including the information presented below, has been modified to conform to this revised segment presentation.
In accordance with our values, our environmental vision statement and forestry policies and in the interests of our customers and other stakeholders, we are committed to implementing and maintaining environmental management systems at our pulp, paper, woodlands and wood procurement operations to promote the conservation and sustainable use of forests and other natural resources. We and other member companies of the Forest Products Association of Canada, as well as a number of environmental organizations, are partners in the Canadian Boreal Forest Agreement. The group works to identify solutions to conservation issues that meet the goal of balancing equally the three pillars of sustainability linked to human activities: economic, social and environmental. We are also a member of the World Wildlife Fund’s Climate Savers program, in which businesses establish ambitious targets to voluntarily reduce greenhouse gas emissions and work aggressively toward achieving them.
Newsprint
We produce newsprint at 11 facilities in North America and one facility in South Korea. With total capacity of approximately 2.9 million metric tons, or approximately 10% of total worldwide capacity, we are the largest producer of newsprint in the world by capacity. We are also the largest North American producer of newsprint, with total North American capacity of approximately 2.7 million metric tons, or approximately 38% of total North American capacity. We sell newsprint to newspaper publishers all over the world and also to commercial printers in North America for uses such as inserts and flyers. In 2013, approximately 44% of our total newsprint shipments were to markets outside of North America. Additionally, joint venture partners (partners with us in the ownership of certain mills we operate) purchased approximately 348,000 metric tons of newsprint from our consolidated entities in 2013, which represented approximately 15% of the total newsprint we sold.
Specialty papers
We produce specialty papers at eight facilities in North America. Our specialty papers segment is composed of uncoated mechanical papers, including supercalendered, superbright, high bright, bulky book and directory papers, as well as coated mechanical papers. With total capacity of approximately 1.4 million metric tons, or approximately 34% of total North American capacity, we are the largest producer of uncoated mechanical papers in North America, and the third largest in the world. Also, with 580,000 metric tons of capacity, or approximately 18% of total North American capacity, we are North America’s third largest producer of coated mechanical papers. Our specialty papers are used in books, retail inserts, direct mail, coupons, magazines, catalogs and other commercial printing applications. We sell specialty papers to major commercial printers, direct mailers, publishers, catalogers and retailers, mostly in North America.
Market pulp
We produce market pulp at seven facilities in North America, with total capacity of approximately 1.7 million metric tons, or approximately 10% of total North American capacity, making us the third largest pulp producer in North America. Approximately 80% of our virgin pulp capacity is softwood-based: northern bleached softwood kraft pulp, southern bleached softwood kraft pulp and fluff pulp. We are also a competitive producer of northern bleached hardwood kraft pulp and southern bleached hardwood kraft pulp, and a leading producer of recycled bleached kraft pulp. Wood pulp is the most commonly used material to make paper. Pulp not converted into paper is sold as market pulp, which is used to make a range of consumer products including tissue, packaging, specialty paper products, diapers and other absorbent products. Approximately 32% of our 2013 market pulp shipments were exported outside of North America, including significant exports to Europe (14%), Asia (8%) and Latin America (6%).
Wood products
We operate 16 sawmills in Canada that produce construction-grade lumber sold in North America, mostly on the east coast. Our sawmills produce dimension spruce-pine-fir lumber and are a major source of wood chips for our pulp and paper mills and wood residue we use as fuel in our power cogeneration assets and other operations. In 2013, we shipped 1.5 billion board feet of construction-grade lumber within North America. We also operate two engineered wood products facilities in Canada that produce I-joists for the construction industry and two remanufacturing wood products facilities in Canada that produce bed frame components, finger joints and furring strips.
For additional information on our corporate strategy, see “Our Business” under Item 7.
3
Pulp and paper manufacturing facilities
The following table lists the pulp and paper manufacturing facilities and the number of paper machines we owned or operated as of December 31, 2013 (excluding facilities and paper machines that have been permanently closed as of December 31, 2013) and production information by product line (which represents all of our reportable segments except wood products). The table shows actual 2013 production, which reflects the impact of any downtime taken in 2013, and the 2014 capacity.
Number of Paper Machines | 2014 | 2013 | 2013 Production By Product Line | |||||||||||||
(In 000s of metric tons) | Total Capacity | Total Production | Newsprint | Specialty Papers | Market Pulp | |||||||||||
Canada | ||||||||||||||||
Alma, Québec | 3 | 345 | 330 | — | 330 | — | ||||||||||
Amos, Québec | 1 | 197 | 194 | 194 | — | — | ||||||||||
Baie-Comeau, Québec | 3 | 463 | 434 | 434 | — | — | ||||||||||
Clermont, Québec (1) | 2 | 334 | 311 | 311 | — | — | ||||||||||
Dolbeau, Québec | 1 | 138 | 124 | — | 124 | — | ||||||||||
Fort Frances, Ontario (2) | 1 | 97 | 110 | — | 110 | — | ||||||||||
Gatineau, Québec (3) | 1 | 184 | 103 | 103 | — | — | ||||||||||
Iroquois Falls, Ontario (4) | 2 | 225 | 213 | 185 | 28 | — | ||||||||||
Kénogami, Québec | 1 | 137 | 135 | — | 135 | — | ||||||||||
Laurentide, Québec | 1 | 191 | 173 | — | 173 | — | ||||||||||
Saint-Félicien, Québec | — | 356 | 325 | — | — | 325 | ||||||||||
Thorold, Ontario | 1 | 197 | 145 | 145 | — | — | ||||||||||
Thunder Bay, Ontario | 1 | 560 | 517 | 202 | — | 315 | ||||||||||
United States | ||||||||||||||||
Augusta, Georgia | 2 | 403 | 381 | 381 | — | — | ||||||||||
Calhoun, Tennessee (5) | 3 | 609 | 476 | 42 | 289 | 145 | ||||||||||
Catawba, South Carolina | 3 | 864 | 699 | — | 487 | 212 | ||||||||||
Coosa Pines, Alabama | — | 263 | 261 | — | — | 261 | ||||||||||
Fairmont, West Virginia | — | 218 | 167 | — | — | 167 | ||||||||||
Grenada, Mississippi | 1 | 246 | 229 | 229 | — | — | ||||||||||
Menominee, Michigan | — | 178 | 155 | — | — | 155 | ||||||||||
Usk, Washington (6) | 1 | 244 | 233 | 233 | — | — | ||||||||||
South Korea | ||||||||||||||||
Mokpo, South Korea | 1 | 200 | 195 | 195 | — | — | ||||||||||
29 | 6,649 | 5,910 | 2,654 | 1,676 | 1,580 | |||||||||||
(1) | Donohue Malbaie Inc. (“DMI”), which owns one of Clermont’s paper machines, is owned 51% by us and 49% by NYT Capital Inc. We manage the facility and wholly own all of the other assets at the site. Manufacturing costs are transferred between us and DMI at agreed-upon transfer costs. DMI’s paper machine produced 212,000 metric tons of newsprint in 2013. The amounts in the above table represent the mill’s total capacity and production including DMI’s paper machine. |
(2) | On January 14, 2014, we announced an extended period of market-related outage for a paper machine in Fort Frances. This outage is expected to last through the first quarter of 2014 at minimum (representing approximately 24,000 metric tons of specialty capacity). The 2014 capacity does not include any capacity from either the indefinitely idled kraft mill nor from the other indefinitely idled specialty paper machine. |
(3) | Our Gatineau facility, which was closed in 2010, was restarted on May 14, 2013. |
(4) | On October 24, 2013, we announced the permanent closure of a paper machine in Iroquois Falls. The closure is expected to take effect within 6 months of the announcement date (representing approximately 45,000 metric tons of capacity). |
4
(5) | On March 11, 2013, we acquired the noncontrolling interest in Calhoun Newsprint Company (“CNC”), which was previously owned 51% by us and 49% by Herald Company, Inc. Following the acquisition we indefinitely idled the paper machine previously owned by CNC on March 12, 2013 (representing approximately 215,000 metric tons of newsprint capacity). In 2014, we began to use the machine on an intermittent basis. |
(6) | Ponderay Newsprint Company is located in Usk, Washington and is an unconsolidated partnership in which we have a 40% interest and, through a wholly-owned subsidiary, we are the managing partner. The balance of the partnership is held by affiliates of three newspaper publishers. The amounts in the above table represent the mill’s total capacity and production. |
Wood products facilities
The following table lists the sawmills we owned or operated as of December 31, 2013 and their respective 2014 capacity and 2013 production. We do not have access to enough timber to operate the sawmills at their total capacity. This table excludes facilities that have been permanently closed as of December 31, 2013.
2014 | 2013 | |||||||
(In million board feet) | Total Capacity | Total Production | ||||||
Comtois, Québec | 145 | 41 | ||||||
Girardville-Normandin, Québec | 218 | 197 | ||||||
La Doré, Québec | 185 | 185 | ||||||
La Tuque, Québec (1) | 175 | 99 | ||||||
Maniwaki, Québec | 160 | 88 | ||||||
Mistassini, Québec | 175 | 164 | ||||||
Obedjiwan, Québec (2) | 65 | 42 | ||||||
Pointe-aux-Outardes, Québec | 175 | 94 | ||||||
Roberval, Québec | 143 | 17 | ||||||
Saint-Félicien, Québec | 160 | 128 | ||||||
Saint-Fulgence, Québec | 167 | 7 | ||||||
Saint-Hilarion, Québec | 85 | 26 | ||||||
Saint-Ludger-de-Milot, Québec (3) | 135 | 100 | ||||||
Saint-Thomas, Québec | 75 | 68 | ||||||
Senneterre, Québec | 155 | 101 | ||||||
Thunder Bay, Ontario | 300 | 261 | ||||||
2,518 | 1,618 | |||||||
(1) | Forest Products Mauricie L.P. is located in La Tuque and is a consolidated subsidiary in which we have a 93.2% interest. The amounts in the above table represent the mill’s total capacity and production. |
(2) | Sociéte en Commandite Scierie Opitciwan is located in Obedjiwan and is an unconsolidated entity in which we have a 45% interest. The amounts in the above table represent the mill’s total capacity and production. |
(3) | Produits Forestiers Petit-Paris Inc. is located in Saint-Ludger-de-Milot and is an unconsolidated entity in which we have a 50% interest. The amounts in the above table represent the mill’s total capacity and production. |
5
The following table lists the remanufacturing and engineered wood products facilities we owned or operated as of December 31, 2013 and their respective 2014 capacity and 2013 production.
2014 | 2013 | |||||||
(In million board feet, except where otherwise stated) | Total Capacity | Total Production | ||||||
Remanufacturing Wood Products Facilities | ||||||||
Château-Richer, Québec | 66 | 66 | ||||||
La Doré, Québec | 16 | 16 | ||||||
Total Remanufacturing Wood Facilities | 82 | 82 | ||||||
Engineered Wood Products Facilities | ||||||||
Larouche and Saint-Prime, Québec (million linear feet) (1) | 145 | 99 | ||||||
(1) | Abitibi-LP Engineered Wood Inc. and Abitibi-LP Engineered Wood II Inc. are located in Larouche and Saint-Prime, respectively, and are unconsolidated entities in which we have a 50% interest in each entity. We operate the facilities and our joint venture partners sell the products. The amounts in the above table represent the mills’ total capacity and production. |
On October 12, 2006, an agreement regarding Canada’s softwood lumber exports to the U.S. became effective (the “2006 Softwood Lumber Agreement”). The 2006 Softwood Lumber Agreement provides for, among other things, softwood lumber to be subject to one of two ongoing border restrictions, depending upon the province of first manufacture with several provinces being exempt from these border restrictions. Volume quotas have been established for each company within the provinces of Ontario and Québec based on historical production, and the volume quotas are not transferable between provinces. Quota volume restrictions are lifted if U.S. composite prices rise above $355 composite per thousand board feet. On January 23, 2012, Canada and the U.S. announced a two-year extension to the 2006 Softwood Lumber Agreement, through October 2015.
Other products
We also sell green power produced from renewable sources, recovered paper, wood chips and other wood related products to customers located in Canada and the United States. Sales of these other products are considered a recovery of the cost of manufacturing our primary products.
Raw Materials
Our operations consume substantial amounts of raw materials such as wood, recovered paper, chemicals and energy in the manufacturing of our paper, pulp and wood products. We purchase raw materials and energy sources (except internal generation) primarily on the open market.
Wood
Our sources of wood include property we own or lease, property on which we possess harvesting rights, wood harvested from timber supply guarantees, and purchases from local producers, including sawmills that supply residual wood chips. As of December 31, 2013, we owned or leased approximately 0.1 million acres of timberlands. In Ontario, we had long-term harvesting rights for approximately 22.1 million acres of Crown-owned land. The harvesting rights licenses in Ontario are 20 years in length and automatically renew every five years, contingent upon our continual compliance with environmental performance and reforestation requirements. In Québec, new legislation has replaced the use of timber supply and forest management agreements with timber supply guarantees on Crown-owned land as of April 1, 2013. As a result, we no longer own long-term harvesting rights contracts in Québec but instead are allocated a certain volume of supply through timber supply guarantees. As of April 1, 2013, we were allocated 4.8 million cubic meters of supply through the timber supply guarantees. These guarantees are five years in length and are renewable, subject to certain conditions.
All of our managed forest lands are third-party certified to one or more globally recognized sustainable forest management standards, including those of the Sustainable Forestry Initiative (the “SFI”) and the Forest Stewardship Council (the “FSC”). We have implemented fiber tracking systems at all of our North American mills to ensure that our wood fiber supply comes from acceptable sources such as certified forests and legal harvesting operations. These systems are third-party certified to recognized chain of custody standards.
We depend heavily on harvesting rights and timber supply guarantees over crown land in Ontario and Québec, respectively, which are effectively renewable licenses granted by the provincial governments, subject to certain conditions. In particular, the volume of harvest permitted under these licenses is subject to limits, sometimes referred to as the “annual allowable cut,” which are reviewed regularly, typically every five years. For example, in 2006 the chief forester of the province of Québec ordered a reduction in the allowable harvest, from 2004 levels, of 24% over five years starting in 2008, with a final assessment
6
expected this year. In 2011, the chief forester announced an interim reduction of a further 10% to the allowable harvest over 2013 and 2014. About 25% of the then remaining timber supply guarantees allocated in Québec were transferred to an open auction system that began to be implemented over the course of 2013.
We strive to improve our forest management and wood fiber procurement practices and we encourage our wood and fiber suppliers to demonstrate continual improvement in forest resource management, wood and fiber procurement and third-party certification.
Recovered paper
We are one of the largest recyclers of newspapers and magazines in North America and have a number of recycling plants that use advanced mechanical and chemical processes to manufacture high quality pulp from a mixture of old newspapers, old magazines and sorted office paper, or “recovered paper.” Using recovered paper, we produce, among other things, recycled fiber newsprint and uncoated specialty papers comparable in quality to paper produced with 100% virgin fiber pulp. The Thorold and Mokpo newsprint operations, and the Menominee and Fairmont pulp operations, produce products containing 100% recycled fiber. In 2013, we used 1.1 million metric tons of recovered paper in our production processes and the recycled fiber content in the newsprint we produced averaged 18%.
In 2013, we collected or purchased 1.3 million metric tons of recovered paper. Our Paper Retriever® and ecorewards® programs collect recovered fiber through a combination of community drop-off containers and recycling programs with businesses and commercial offices. The recovered paper that we physically purchase is from suppliers generally within the region of our recycling plants, primarily under long-term agreements.
Energy
Steam and electrical power constitute the primary forms of energy used in pulp and paper production. Process steam is produced in boilers using a variety of fuel sources, as well as heat recovery units in mechanical pulp facilities. All but two of our mills produced 100% of their own steam requirements. In 2013, our Alma, Calhoun, Catawba, Coosa Pines, Dolbeau, Fort Frances, Gatineau, Kénogami, Saint-Félicien and Thunder Bay operations collectively consumed approximately 44% of their electrical requirements from internal sources, notably on-site cogeneration and hydroelectric dams. The balance of our energy needs was purchased from third parties. We have seven sites that operate cogeneration facilities and all of these sites generate “green energy” from carbon-neutral biomass. In addition, we utilize alternative fuels such as methane from landfills, used oil, tire-derived fuel and black liquor to reduce consumption of fossil fuels.
As of December 31, 2013, we had one hydroelectric facility (Hydro Saguenay in Québec), which consisted of seven dams with capacity of 170 MW and generation of 1,165 GWh. The water rights agreements required to operate these dams typically range from 10 to 25 years and are generally renewable, under certain conditions, for additional terms. In some cases, the agreements are contingent on the continued operation of the related paper mill and a minimum level of capital spending in the region.
Competition
In general, our products are globally-traded commodities and are marketed in close to 90 countries. The markets in which we compete are highly competitive and, aside from quality specifications to meet customer needs, the production of our products does not depend upon a proprietary process or formula. Pricing and the level of shipments of our products are influenced by the balance between supply and demand as affected by global economic conditions, changes in consumption and capacity, the level of customer and producer inventories and fluctuations in currency exchange rates. Any material decline in prices for our products or other adverse developments in the markets for our products could have a material adverse effect on our results of operations or financial condition. Prices for our products have been and are likely to continue to be highly volatile.
Newsprint, one of our principal products, is produced by numerous manufacturers worldwide. In 2013, the five largest North American producers represented approximately 79% of North American newsprint capacity and the five largest global producers represented approximately 33% of global newsprint capacity. Our total newsprint capacity is approximately 10% of worldwide newsprint capacity. We face competition from both large global producers and numerous smaller regional producers. Price, quality and customer relationships are important competitive determinants.
Our specialty papers, including uncoated mechanical papers and coated mechanical papers, compete on the basis of price, quality, service and breadth of product line. With approximately 34% of North American uncoated mechanical papers capacity, we are the largest producer of uncoated mechanical papers in North America and the third largest in the world. We compete with numerous uncoated mechanical paper producers, with the five largest North American producers representing 76% of the North American uncoated mechanical papers capacity and the five largest global producers representing 50% of global uncoated mechanical papers capacity in 2013. In addition, imports from overseas accounted for approximately 8% of North American demand in 2013. We also compete with a number of other coated mechanical paper producers with operations in North America. In 2013, the five largest North American producers represented approximately 85% of North American
7
capacity for coated mechanical papers. We compete with numerous worldwide suppliers of other grades of paper such as coated freesheet and supercalendered paper. Imports accounted for approximately 11% of North American demand in 2013.
We compete with a number of other major market pulp producers with operations in North America. Market pulp is a globally-traded commodity for which competition exists in all major markets. We produce six major grades of market pulp (northern and southern hardwood, northern and southern softwood, recycled bleached kraft and fluff) and compete with other producers from South America (eucalyptus hardwood and radiata pine softwood), Europe (northern hardwood and softwood) and Asia (mixed tropical hardwood). Price, quality, service and fiber sources are considered the main competitive determinants.
By the end of 2008, we had completed the certification of all of our managed forest lands to globally-recognized sustainable forest management standards, namely the SFI and the Z809 Standard of the CSA. In 2009, to better respond to market demands, we introduced the FSC standard in our certification portfolio by re-certifying two forest units in Québec from CSA to FSC and by dual-certifying one forest in Ontario to FSC (already certified to SFI). Though certification depends on a number of factors, many of which are beyond our control, we remain committed to achieving our goal of FSC certification for at least 80% of the forests we manage or on which we hold significant harvesting rights or timber supply guarantees by 2015.
As with other global commodities, the competitive position of our products is significantly affected by fluctuations in foreign currency exchange rates. See Item 7A, “Quantitative and Qualitative Disclosures About Market Risk – Foreign Currency Exchange Risk,” of this Form 10-K.
Trends in advertising, electronic data transmission and storage, and the Internet are expected to have further adverse effects on the demand for traditional print media, including our products and those of our customers. See Item 1A, “Risk Factors – Developments in alternative media are expected to continue to adversely affect the demand for our products, especially in North America, and our responses to these developments may not be successful,” of this Form 10-K.
Emergence From Creditor Protection Proceedings
AbitibiBowater Inc. (our predecessor entity) and all but one of its debtor affiliates successfully emerged from creditor protection proceedings under Chapter 11 of the United States Bankruptcy Code, as amended (“Chapter 11”) and the Companies’ Creditors Arrangement Act (Canada) (the “CCAA”), as applicable (collectively, the “Creditor Protection Proceedings”) on December 9, 2010 (the “Emergence Date”). The wholly-owned subsidiary operating the Mokpo, South Korea operations and almost all of the less than wholly-owned subsidiaries operated outside of the Creditor Protection Proceedings. We refer to AbitibiBowater Inc. and certain of its U.S. and Canadian subsidiaries as the “Debtors”. We refer to the Chapter 11 Debtors’ Second Amended Joint Plan of Reorganization under Chapter 11 of the Bankruptcy Code and the CCAA Debtors’ CCAA Plan of Reorganization and Compromise, in each case as amended and including all exhibits and supplements thereto, together as the “Plans of Reorganization”, each as a “Plan of Reorganization” and individually as the “Chapter 11 Reorganization Plan” and the “CCAA Reorganization Plan”, respectively. The Plans of Reorganization became effective on the Emergence Date. Pursuant to the Plans of Reorganization, we distributed on the Emergence date the shares of our common stock for the benefit of unsecured creditors in the Creditor Protection Proceedings and we established a reserve of shares for the benefit of holders of disputed claims. By the end of 2013, all disputed claims had been definitively resolved, and the distribution of shares from the disputed claim share reserve in respect thereof had been completed. The Debtors’ Chapter 11 cases are closed; we expect imminently the court-appointed monitor for the CCAA proceedings to apply to the court for its discharge in respect of those CCAA cases, bringing them to a close as well.
Employees
As of December 31, 2013, we employed approximately 8,400 people, of whom approximately 6,200 were represented by bargaining units, primarily the Unifor Union and the Confederation of National Trade Unions (the “CNTU”) in Canada and predominantly by the United Steelworkers International in the U.S. The collective agreements covering approximately 2,000 employees in Canada are scheduled to expire in 2014, affecting eight of our pulp and paper operations and approximately 35% of our pulp and paper production. We also have collective agreements covering 750 employees in 13 woodlands and sawmills operations in Canada that have either expired or are scheduled to expire in 2014.
While we intend to negotiate to renew collective agreements, there can be no assurance that we will be able to renew agreements on satisfactory terms, or that we will maintain continuously satisfactory agreements with all of our unionized employees. Given our focus on controlling costs, we expect that labor costs and flexibility in managing our operations will be important topics for discussion in the renewal negotiations. If we are unable to renew the agreements, it could result in strikes, work stoppages or disturbances by affected employees, which could cause us to experience a disruption of operations and affect our business, financial condition or results of operations.
On February 17, 2014, we announced a five year renewal of the master collective agreement covering four unionized U.S. pulp and paper mills. The agreement covers about 1,500 employees, represented by the United Steelworkers, the International
8
Brotherhood of Electrical Workers and the United Association of Journeymen and Apprentices of the Plumbing, Pipefitting and Sprinkler Fitting Industry of the U.S. and Canada (the “UA”). The four mills, together with our other U.S. pulp and paper operations, none of which has an expiring collective agreement, represent almost half of our pulp and paper production capacity.
Trademarks
We have registrations or pending applications for the trademarks “RESOLUTE” and “resolute Forest Products & Design” in the countries of our principal markets, as well as “RESOLUTE FOREST PRODUCTS” and “R Design” in Canada and the United States, and “RÉSOLU” and “Produits forestiers résolu & Design” in Canada. We consider our interest in the marks and logos to be important and necessary to the conduct of our business.
Environmental Matters
We are subject to a variety of federal, state, provincial and local environmental laws and regulations in the jurisdictions in which we operate. We believe our operations are in material compliance with current applicable environmental laws and regulations. While it is impossible to predict future environmental regulations that may be established, we believe that we will not be at a competitive disadvantage with regard to meeting future Canadian, United States or South Korean standards. For additional information, see Note 16, “Commitments and Contingencies – Environmental matters,” to our Consolidated Financial Statements.
Internet Availability of Information
We make our Form 10-K, our Quarterly Reports on Form 10-Q and our Current Reports on Form 8-K, and any amendments to these reports, available free of charge on our website (www.resolutefp.com) as soon as reasonably practicable after we file or furnish such materials to the SEC. The SEC also maintains a website (www.sec.gov) that contains our reports and other information filed with the SEC. In addition, any materials we file with the SEC may be read and copied at the SEC’s Public Reference Room at 100 F Street, NE, Washington, D.C., 20549. Information on the operations of the Public Reference Room may be obtained by calling the SEC at 1-800-SEC-0330. Our reports are also available on the System for Electronic Document Analysis and Retrieval (“SEDAR”) website (www.sedar.com).
ITEM 1A. RISK FACTORS
In addition to the other information set forth in this Form 10-K, you should carefully consider the following factors, which could materially affect our business, financial condition or future results. In particular, the risks described below could cause actual events to differ materially from those contemplated in the forward-looking statements in this Form 10-K. The risks described below are not the only risks we face. Additional risks and uncertainties not currently known to us or that we currently deem to be immaterial may also materially affect our business, financial condition or future results.
Developments in alternative media are expected to continue to adversely affect the demand for our products, especially in North America, and our responses to these developments may not be successful.
Trends in advertising, electronic data transmission and storage, and the Internet are expected to have further adverse effects on the demand for traditional print media, including our products and those of our customers. Neither the timing nor the extent of those trends can be predicted with certainty. Our newspaper, magazine, book and catalog publishing customers could increase their use of, and indeed compete with, other forms of media and advertising and electronic data transmission and storage, such as television, electronic readers and websites. This could then reduce their consumption of newsprint, commercial printing papers or other products we manufacture. The demand for some of our products has weakened significantly over the last several years; for example, according to industry statistics, North American newsprint demand fell by 25% in 2009, 6% in 2010, 7% in 2011, 1% in 2012 and 9% in 2013. This trend, which similarly affects our specialty papers, could continue as a result of developments in alternative media, lower North American newspaper circulation, weaker advertising, grade substitution and conservation measures taken by publishers and retailers. If the trend of consolidation among our customers continues, there could be fewer customers in the market for our products, and our negotiating position with these customers could be weakened.
We have responded to the changing market dynamics by optimizing assets and streamlining our production. If demand for our products continues to decline, or if the pace of decline accelerates, it may be necessary to curtail production even further, or permanently shut down more machines and facilities. In addition to the potential loss of production, curtailments and shutdowns could result in asset impairments and cash closure costs for the affected facilities, including restructuring charges and exit or disposal costs, which could negatively impact our cash flows and materially affect our results of operations and financial condition.
9
We could experience disruptions in operations or increased labor costs due to labor disputes.
As of December 31, 2013, we employed approximately 8,400 people, of whom approximately 6,200 were represented by bargaining units, primarily the Unifor Union and the Confederation of National Trade Unions, or the CNTU, in Canada and the United Steelworkers International in the U.S. The collective agreements covering approximately 2,000 employees in Canada are scheduled to expire in 2014, affecting eight of our pulp and paper operations and approximately 35% of our pulp and paper production. We also have collective agreements covering 750 employees in 13 woodlands and sawmills operations in Canada that have either expired or are scheduled to expire in 2014.
While we intend to negotiate to renew collective agreements, there can be no assurance that we will be able to renew agreements on satisfactory terms, or that we will maintain continuously satisfactory agreements with all of our unionized employees. Given our focus on controlling costs, we expect that labor costs and flexibility in managing our operations will be important topics for discussion in the renewal negotiations. If we are unable to renew the agreements, it could result in strikes, work stoppages or disturbances by affected employees, which could cause us to experience a disruption of operations and affect our business, financial condition or results of operations.
Currency fluctuations can adversely affect our competitive position, selling prices and manufacturing costs.
We compete with producers from around the world, particularly North America, Europe and South America, in most of our product lines with the exception of wood products, where we compete with other North American producers. We sell our products mainly in transactions denominated in U.S. dollars, but we also sell in certain local currencies, including the euro, the pound sterling and the Canadian dollar. In addition to the impact of product supply and demand, changes in the relative strength or weakness of these currencies, particularly the U.S. dollar, could also affect international trade flows in these products. A stronger U.S. dollar might attract imports, thereby increasing product supply and possibly creating downward pressure on prices. On the other hand, a weaker U.S. dollar might encourage U.S. exports but also increase manufacturing costs in Canadian dollars, or other foreign currencies.
Variations in exchange rates could also significantly affect our competitive position. In 2012, for example, the strength of the U.S. dollar against certain European currencies negatively affected the competitive position of North American newsprint producers selling in certain U.S. dollar-denominated international newsprint markets, like Asia and India. Some of our European competitors were able to price business more aggressively in those markets as a result of the relative weakness of their local currency, which negatively affected our ability to compete, forcing us to take steps to limit our exposure to these markets. Conversely, with the strengthening euro in 2013, particularly against the U.S. dollar, exports from North America rose, while they fell from Western Europe.
We are particularly sensitive to changes in the value of the Canadian dollar versus the U.S. dollar. The actual impact of these changes depends primarily on the proportion of our production and sales that occur in Canada, the proportion of our financial assets and liabilities denominated in Canadian dollars, and the magnitude, direction and duration of changes in the exchange rate. We expect exchange rate fluctuations to continue to impact costs and revenues, but we cannot predict the magnitude or direction of this effect for any period, and there can be no assurance of any future effects. In the last two years, the Canadian dollar fluctuated between a low of US$0.93 in December of 2013 and a high of US$1.03 in September of 2012. Based on operating projections for 2014, if the Canadian dollar strengthens by one cent against the U.S. dollar, we expect that it will decrease our annual operating income by approximately $15 million, and vice versa.
Furthermore, certain other assets and liabilities, including a substantial portion of our net pension and other postretirement benefit, or OPEB, obligations and our deferred income tax assets, are denominated in Canadian dollars. As a result, our earnings can be subject to the potentially significant effect of foreign currency translation gains or losses in respect of these Canadian dollar net monetary assets. In this case, a strengthening of the Canadian dollar against the U.S. dollar in any given period would generally cause a foreign currency translation gain, and a weakening of the Canadian dollar would generally lead to a foreign currency translation loss.
We face intense competition in the forest products industry and the failure to compete effectively could have a material adverse effect on our business, financial condition and results of operations.
We compete with numerous forest products companies, some of which have greater financial resources than we do. The trend toward consolidation in the forest products industry has led to the formation of sizeable global producers, with greater flexibility in pricing and financial resources for marketing, investment and expansion than we do. Because the markets for our products are all highly competitive, actions by competitors can affect our ability to compete and the volatility of prices at which products are sold.
The forest products industry is capital intensive, and requires significant investment to remain competitive. Some of our competitors may be lower-cost producers in some of the businesses in which we operate. In particular, the sizeable investments
10
in new, low-cost hardwood grade pulp capacity in South America, whose costs are expected to be very competitive, and the actions those mills take to bring their product to market, could adversely affect our competitive position in similar grades. This in turn could affect our sales, operating income and cash flows, and push us to consider significant capital investments to remain competitive. Failure to compete effectively could have a material adverse effect on our business, financial condition or results of operations.
Based on market interest, we offer a number of our products, particularly market pulp and wood products, with specific designations to one or more globally-recognized sustainable forest management and chain of custody standards. Our ability to conform to new or existing guidelines for certification depends on a number of factors, many of which are beyond our control, such as: changes to the interpretation or the application of the standards; the adequacy of government-implemented conservation measures; and the existence of territorial disputes between First Nations and governments. If we are unable to offer certified products, or to meet commitments to supply certified product, it could affect the marketability of our products and our ability to compete with certain producers.
The forest products industry is highly cyclical; fluctuations in the prices of, and the demand for, our products could result in small or negative profit margins, lower sales volumes and curtailment or closure of operations.
The forest products industry is highly cyclical. The overall levels of demand for the products we manufacture and consequently, our sales and profitability, reflect fluctuations in levels of end-user demand, which depend at least in part on general economic conditions in North America and the world. In addition to end-user demand, we've experienced cyclical changes in prices, sales volume and margins for our products as a result of changing market trends and the effect of capacity fluctuations on supply and demand as well as the relative competitiveness of producers. Because our commodity products have few distinguishing qualities from producer to producer, competition is based mainly on price, which is determined by supply relative to demand, which is in turn affected by the factors described above.
We could be required to make contributions to our Canadian pension plans at levels that could be significantly higher than expected, which could have an adverse impact on our financial condition.
In connection with our emergence from the Creditor Protection Proceedings in 2010, the provinces of Québec and Ontario adopted regulations specific to us, which we refer to as the “funding relief regulations,” to establish parameters concerning the funding of the aggregate solvency deficits in our material Canadian registered pension plans, which we refer to as the “affected plans,” until 2020. These plans represented approximately 75% of our unfunded pension obligations as of December 31, 2013. Because the aggregate solvency ratio in the affected plans was below the minimum solvency level prescribed in the regulations on each of December 31, 2011, and December 31, 2012, the regulations required that we propose corrective measures designed to close the solvency deficit - Cdn$500 million as of December 31, 2011 ($471 million, based on the exchange rate in effect on December 31, 2013), and an additional Cdn$130 million as of December 31, 2012 ($122 million, based on the exchange rate in effect on December 31, 2013) - within five years of the applicable measurement date.
In 2013, we reached an agreement in principle with Company stakeholders in Québec and in Ontario to replace the corrective measures mechanism under the funding relief regulations in favor of set incremental contributions beyond the basic funding under the existing framework. We expect that in the coming months, Québec and Ontario will adopt regulations to implement this revised framework. We cannot currently estimate the additional contributions, if any, that we could be required to make in respect of the corrective measures if the provinces fail to implement the expected regulations and take steps to enforce the current funding relief regulations despite the agreement in principle and the anticipatory additional contributions we made in respect thereof in 2013. In light of the rising interest rate environment, strong asset returns and 2013 funding, when we file the actuarial report in respect of the affected plans in the second quarter of this year, we expect that the solvency deficit as of December 31, 2013, will have decreased significantly from the level at December 31, 2012. Nevertheless, the additional contributions we could be required to make in these circumstances could be material, which would negatively impact our cash flows and materially affect our results of operations or financial condition.
It is also possible that provincial pension regulators could attempt to compel additional funding of certain of our Canadian registered pension plans in respect of plan members associated with sites we formerly operated in their respective provinces. In 2012, we filed a motion for directives with the Québec Superior Court in Canada, the court with jurisdiction in the creditor protection proceedings, seeking an order to prevent pension regulators in each of Québec, New Brunswick and Newfoundland and Labrador from declaring partial wind-ups of pension plans relating to employees of former operations in New Brunswick and Newfoundland and Labrador, or a declaration that any claim for accelerated reimbursements of deficits arising from a partial wind-up is a barred claim under the creditor protection proceedings. A partial wind-up would likely shorten the period in which any deficit within those plans, which could reach up to Cdn$150 million ($141 million, based on the exchange rate in effect on December 31, 2013), would have to be funded if we do not obtain the relief sought. At this time, we cannot estimate the additional contributions, if any, that may be required in future years, but they could be material.
11
We could be required to record additional valuation allowances against our recorded deferred income tax assets.
We recorded significant tax attributes (deferred income tax assets) relating to our Canadian operations in our consolidated balance sheet as of December 31, 2013, which attributes would be available to offset future taxable income. If, in the future, we determine that we are unable to recognize the benefit of these tax attributes as a result of sustained cumulative losses in our Canadian operations, we could be required to record additional valuation allowances for the portion of the deferred income tax assets that are not recoverable. Such valuation allowances, if taken, would be recorded as a charge to income tax expense and would negatively impact our results of operations.
The terms of our ABL credit facility and the indenture governing our senior notes could restrict our current and future operations, particularly our ability to respond to changes and to take certain actions.
The indenture governing our 5.875% senior notes due 2023 and the credit agreement governing our senior secured asset-based revolving credit facility, or the “ABL,” contain a number of restrictive covenants that impose operating and financial restrictions on us and could limit our ability to engage in activities that might be in our long-term best interests, including, among other things, restrictions on our ability to: incur, assume or guarantee significant additional indebtedness; issue redeemable stock and preferred stock; pay dividends or make distributions or redeem or repurchase capital stock; prepay, redeem or repurchase certain debt; make loans and investments; incur liens; restrict dividends, loans or asset transfers from our subsidiaries; sell or otherwise dispose of assets, including capital stock of subsidiaries; consolidate or merge with or into, or sell substantially all of our assets to, another person; enter into transactions with affiliates; and enter into new lines of business.
A breach of the covenants under the indenture governing our notes or under the ABL could result in an event of default, which could allow holders and lenders, as the case may be, to accelerate their debt and could result in the acceleration of any other debt to which a cross-acceleration or cross-default provision applies. An event of default under the ABL would also allow the lenders to terminate all commitments to extend further credit thereunder. If we were unable to repay amounts due and payable under the ABL, the lenders would have the right to proceed against the collateral securing the indebtedness. In any of these events, we and our subsidiaries might not have sufficient assets to repay the indebtedness. As a result, we could be: limited in how we conduct our business; unable to raise additional debt or equity financing to operate during general economic or business downturns; or unable to compete effectively or to take advantage of new business opportunities.
Our operations require substantial capital and we may be unable to maintain adequate capital resources to provide for all of our capital requirements.
Our businesses are capital intensive and require regular capital expenditures in order to maintain our equipment, increase our operating efficiency and comply with environmental laws. If our available cash resources and cash generated from operations are not sufficient to fund our operating needs and capital expenditures, we would either need to borrow or reduce or delay capital expenditures. If we cannot maintain or upgrade our equipment as we require, we may become unable to manufacture products that compete effectively. An inability to make required capital expenditures in a timely fashion could have a material adverse effect on our growth, business, financial condition or results of operations.
We may not be successful in implementing our strategies to increase earnings power.
Our corporate strategy includes, on the one hand, a profitable retreat from certain paper grades, and on the other, using our strong financial position to act on opportunities to diversify and grow. This could require significant capital investments with uncertain return outcomes, as we seek to improve our performance and margins by: leveraging our low-cost position; maintaining a stringent focus on costs; getting the most out of our access to virgin fiber; maximizing the utilization of our most cost-effective mills and streamlining production to adapt to changing market dynamics; and capitalizing on our economical access to international markets to compensate for the secular decline in North American newsprint demand. We also believe in taking an opportunistic approach to strategic initiatives, with a particular focus on reducing our cost position, improving our product diversification, providing synergies or allowing us to expand into future growth markets. There are risks associated with the implementation of these strategies, which are complicated and involve a substantial number of mills, machines, capital and personnel. To the extent we are unsuccessful in achieving these strategies, our results of operations may be adversely affected.
Our manufacturing businesses may have difficulty obtaining wood fiber at favorable prices, or at all.
Wood fiber is the principal raw material we use in our business. We use both virgin fiber - wood chips and logs - and recycled fiber - old newspapers, old magazines and sorted office paper - as fiber sources for our pulp and paper mills. The primary source for wood fiber is timber. Environmental litigation and regulatory developments have caused, and may cause in the future, significant reductions in the amount of timber available for commercial harvest in Canada and the United States.
We depend heavily on harvesting rights and timber supply guarantees over crown land in Ontario and Québec, respectively, which are effectively renewable licenses granted by the provincial governments, subject to certain conditions. In particular, the
12
volume of harvest permitted under these licenses is subject to limits, sometimes referred to as the “annual allowable cut,” which are reviewed regularly, typically every five years. For example, in 2006 the chief forester of the province of Québec ordered a reduction in the allowable harvest, from 2004 levels, of 24% over five years starting in 2008, with a final assessment expected this year. In 2011, the chief forester announced an interim reduction of a further 10% to the allowable harvest over 2013 and 2014. About 25% of the then remaining timber supply guarantees allocated in Québec were transferred to an open auction system that began to be implemented over the course of 2013. Accordingly, we cannot at this time estimate the full impact of these reductions to our guaranteed harvest levels, but it has subjected a significant portion of the fiber we need to operate our business to market forces, which could reduce availability and/or increase the costs to supply fiber.
In addition to regulatory constraints, our supply of timber could be affected by future domestic or foreign regulation, litigation advanced by Aboriginal groups or other interested parties, and actions taken by environmental organizations to influence any of the foregoing. These activities could focus on any one or more of: the use of timberlands; forest management practices; sustainable forest management certification standards; the protection of endangered species; the promotion of forest biodiversity and the response to and prevention of catastrophic wildfires. Our access to timber may also be affected by factors such as fire and fire prevention, insect infestation, disease, ice storms, wind storms, drought, flooding and other natural and man-made causes, thereby potentially reducing supply and increasing prices. As is typical in the industry, we do not maintain insurance for any loss to our access to standing timber from natural disasters or other causes.
Though timber is our primary source of fiber, we buy a significant portion of fiber on the open market as well. Wood fiber is a commodity; prices historically have been cyclical, and subject to market influences, which could be concentrated in any particular region due to market shifts.
A sustained increase in the cost of purchased energy and other raw materials would lead to higher manufacturing costs, thereby reducing our margins.
Our operations consume substantial amounts of energy, such as electricity, natural gas, fuel oil and wood residue, a substantial proportion of which we buy on the open market. The main raw materials we require in our manufacturing process are chemicals, wood fiber and recovered paper. The prices for raw materials and energy are volatile and may change rapidly, directly affecting our results of operations. The availability of raw materials and energy may also be disrupted by many factors outside our control, adversely affecting our operations. Energy prices, particularly for electricity, natural gas and fuel oil, have been volatile in recent years, and further fluctuations will impact our manufacturing costs and contribute to earnings volatility. The pricing of recycled fiber is also subject to market influences and has experienced significant fluctuations in recent years.
For our commodity products, the relationship between industry supply and demand, rather than changes in the cost of raw materials, will determine our ability to increase prices. Consequently, we may be unable to pass along increases in our operating costs to our customers. Any sustained increase in energy, chemical or raw material prices without any corresponding increase in product pricing would reduce our operating margins and potentially require us to limit or cease operations of one or more of our machines.
There also can be no certainty that we will be able to maintain our water rights, which are necessary for our hydroelectric power generating facilities, or to renew them at conditions comparable to those currently in effect.
Our business is subject to global economic conditions; soft conditions could cause a number of the risks we face to increase in likelihood, magnitude and duration.
Our operations and performance depend significantly on worldwide economic conditions. During the global financial crisis and the slow recovery that has followed, customers across all of our businesses delayed and reduced expenditures in response to deteriorating macroeconomic and industry conditions and uncertainty, which has had a significant negative impact on the demand for our products and therefore, the cash flows of our businesses. If global economic conditions were to soften again, we would expect higher unemployment and lower gross domestic product growth rates to further affect demand for newsprint, specialty papers and pulp. We believe that in the last downturn, many end consumers reduced newspaper and magazine subscriptions as a direct result of their financial circumstances, contributing to lower demand for our products by our customers. Advertising demand in magazines and newspapers, including classified advertisements, and demand from automotive dealerships and real estate agencies was also impacted by higher unemployment, lower automobile sales and the tepid real estate environment. Lower demand for print advertisements leads to fewer pages in newspapers, magazines and other advertisement circulars and periodicals, decreasing the demand for our products. Furthermore, consumer and advertising-driven demand for our paper products could not recover from a downturn, even with an economic recovery, as purchasing habits could permanently change. Demand for our market pulp products is generally associated with production rates with paper producers, as well as consumption trends for products such as tissue, towelling and absorbent products.
The economic downturn had a profoundly negative impact on the U.S. housing industry, which is a significant driver for demand of our lumber and other wood-based products, and could be expected to have a similar effect if global conditions were
13
to soften again. According to the U.S. Census Bureau, U.S. housing starts declined from approximately 2.1 million in 2005 to a low of approximately 0.6 million in 2009, reflecting a 71% decline. During these types of conditions, with a low level of primary demand for our lumber and other wood-based products, we would expect our wood products business to operate at a low level until there is a meaningful recovery in new residential construction demand. Furthermore, with less lumber demand, sawmills generate less wood chips that we use in our pulp and paper mills, which leads the pulp and paper mills to increase their supply from the open market, where prices can fluctuate with market conditions. We would also have less wood residue to use internally, which would increase our fossil fuel consumption and, as a result, our costs.
Changes in laws and regulations could adversely affect our results of operations.
We are subject to a variety of foreign, federal, state, provincial and local laws and regulations dealing with trade, employees, transportation, taxes, timber and water rights, pension funding and the environment. Changes in these laws or regulations or their interpretations or enforcement have required in the past, and could require in the future, substantial expenditures by us and adversely affect our results of operations. For example, changes in environmental laws and regulations have in the past, and could in the future, require us to spend substantial amounts to comply with rules and regulations relating to air emissions, wastewater discharge, waste management, landfill sites, including investigation and remediation costs and greenhouse gas regulations. Environmental laws and their enforcement are becoming increasingly stringent. Consequently, our compliance and remediation costs could increase materially.
Changes in the political or economic conditions in Canada, the United States or other countries in which our products are manufactured or sold could adversely affect our results of operations.
We manufacture products in Canada, the United States and South Korea, and we sell products throughout the world. The economic and political climate of each region has a significant impact on our costs and the prices of, and demand for, our products. Changes in regional economies or political instability, including acts of war or terrorist activities, can affect the cost of manufacturing and distributing our products, pricing and sales volume, directly affecting our results of operations. These changes could also affect the availability or cost of insurance.
We may be required to record additional environmental liabilities.
We are subject to a wide range of general and industry-specific laws and regulations relating to pollution and the protection of the environment, including those governing air emissions, wastewater discharges, timber harvesting, the storage, management and disposal of regulated substances and waste, the investigation and clean-up of contaminated sites, landfill and lagoon operation and closure, forestry operations, endangered species habitat and health and safety. Noncompliance with these regulations can result in significant civil or criminal fines or penalties, damage to our reputation, claims by private parties or may require us to spend substantial amounts of money on pollution control equipment or additional wastewater treatment facilities. As an owner and operator of real estate and manufacturing and processing facilities, we may also be liable under environmental laws for cleanup and other costs and damages, including investigation costs, tort liability and damages to natural resources, resulting from past or present spills, releases or threats of releases of regulated substances and waste on or from our current or former properties. We may incur liability under these laws without regard to whether we knew of, were responsible for, or owned the property at the time of, any spill, release or threats of releases of any regulated substances or waste on or from any current or former property, or at properties where we arranged for the disposal of regulated materials. Claims may also arise out of currently unknown environmental conditions or aggressive enforcement efforts by government regulators, public interest groups or private parties. As a result of the above, we may be required to record additional environmental liabilities.
We are subject to physical and financial risks associated with climate change.
Our operations and the operations of our suppliers are subject to climate variations, which impact the productivity of forests, the distribution and abundance of species and the spread of disease or insect epidemics, which may adversely or positively affect timber production. Over the past several years, changing weather patterns and climatic conditions due to natural and man-made causes have added to the unpredictability and frequency of natural disasters such as hurricanes, earthquakes, hailstorms, wildfires, snow and ice storms, which could also affect our woodlands or cause variations in the cost for raw materials, such as fiber. Changes in precipitation resulting in droughts could adversely affect timber or our hydroelectric production, by increasing our energy costs.
To the extent climate change impacts raw material availability or our hydroelectric production, it may also impact our costs and revenues. Furthermore, should financial markets view climate change as a financial risk, our ability to access capital markets or to receive acceptable terms and conditions could be affected.
14
We may be required to record additional long-lived asset impairment or accelerated depreciation charges.
Losses related to the impairment of long-lived assets to be held and used are recognized when circumstances indicate the carrying value of an asset group may not be recoverable, such as continuing losses or demand declines in certain businesses. When indicators that the carrying value of an asset group may not be recoverable are triggered, we evaluate the carrying value of the asset group in relation to its expected undiscounted future cash flows. If the carrying value of an asset group is greater than the expected undiscounted future cash flows to be generated by the asset group, an impairment charge is recognized based on the excess of the asset group’s carrying value over its fair value. If it is determined that the carrying value of an asset group is recoverable, we review and adjust, as necessary, the estimated useful lives of the assets in the group. If there were to be a triggering event, it is possible that we could record non-cash long-lived asset impairment or accelerated depreciation charges in future periods, which would be recorded as operating expenses and would directly and negatively impact our reported results of operations.
The occurrence of natural or man-made disasters could disrupt our supply chain and the delivery of our products and adversely affect our financial condition or results of operations.
The success of our businesses is largely contingent on the availability of direct access to raw materials and our ability to ship products on a timely basis. As a result, any event that disrupts or limits transportation or delivery services could materially and adversely affect our business. In addition, our operating results depend on the continued operation of our various production facilities and the ability to complete construction and maintenance projects on schedule. Material operating interruptions at our facilities, including interruptions caused by the events described below, could materially reduce the productivity and profitability of a particular manufacturing facility, or our business as a whole, during and after the period of such operational difficulties.
Although we take precautions to enhance the safety of our operations and minimize the risk of disruptions, our operations are subject to hazards inherent in our business and the transportation of raw materials, products and wastes. These potential hazards include: explosions; fires; severe weather and natural disasters; mechanical failures; unscheduled downtimes; supplier disruptions; labor shortages or other labor difficulties; transportation interruptions; remediation complications; discharges or releases of toxic or hazardous substances or gases; other environmental risks; and terrorist acts.
Some of these hazards can cause personal injury and loss of life, severe damage to or destruction of property and equipment and environmental damage and can result in suspension of operations, the shutdown of affected facilities, reputational damage or the imposition of civil or criminal penalties. Furthermore, we will also continue to be subject to present and future claims with respect to workplace exposure, exposure of contractors on our premises, as well as other persons located nearby, workers’ compensation and other matters.
We maintain property, business interruption, product, general liability, casualty and other types of insurance, including pollution and legal liability, that we believe are in accordance with customary industry practices, but we are not fully insured against all potential hazards inherent in our business, including losses resulting from natural disasters, war risks or terrorist acts. Changes in insurance market conditions have caused, and may in the future cause, premiums and deductibles for certain insurance policies to increase substantially and in some instances, for certain insurance to become unavailable or available only for reduced amounts of coverage. If we were to incur a significant liability for which we were not fully insured, we might not be able to finance the amount of the uninsured liability on terms acceptable to us or at all, and might be obligated to divert a significant portion of our cash flow from normal business operations.
There are significant holders of our common stock.
There are several significant holders of our common stock who own a substantial percentage of the outstanding shares of our common stock. These holders could increase their percentage ownership of our common stock and may be in a position to influence the outcome of actions requiring shareholder approval, including, among other things, the election of board members. This concentration of ownership could also facilitate or hinder a negotiated change of control and consequently, impact the value of our common stock. Furthermore, the possibility that one or more of these holders may sell all or a large portion of our common stock in a short period of time may adversely affect the trading price of our common stock.
We are subject to cyber-security risks related to breaches of security pertaining to sensitive company, customer, employee and vendor information as well as breaches in the technology that manages operations and other business processes.
We use information technologies to securely manage operations and various business functions. We rely on various technologies to process, store and report on our business and interact with customers, vendors and employees. The secure processing, maintenance and transmission of this information is critical to our operations and business strategy. Despite our security design and controls, and those of our third party providers, our information technology and infrastructure may be vulnerable to cyber attacks by hackers or breaches due to employee error, malfeasance or other disruptions. Any such breach
15
could result in operational disruptions or the misappropriation of sensitive data that could subject us to civil and criminal penalties, litigation or have a negative impact on our reputation. There can be no assurance that such disruptions or misappropriations and the resulting repercussions will not negatively impact our cash flows and materially affect our results of operations or financial condition.
Our international sales and operations are subject to applicable laws relating to trade, export controls and foreign corrupt practices, the violation of which could adversely affect our operations.
As a result of our international sales and operations, we are subject to trade and economic sanctions and other restrictions imposed by the United States, Canada and other governments or organizations. We are also subject to the U.S. Foreign Corrupt Practices Act, the Canadian Corruption of Foreign Public Officials Act, the United Kingdom Bribery Act 2010 and other anti-bribery laws that generally bar bribes or unreasonable gifts to foreign governments or officials. Changes in trade sanctions laws could restrict our business practices, including cessation of business activities in sanctioned countries or with sanctioned entities, and may result in modifications to compliance programs. Violations of these laws or regulations could result in sanctions including fines, loss of authorizations needed to conduct our international business and other penalties, which could adversely impact our business, operating results and financial condition.
We could pursue acquisitions, divestitures and other strategic transactions, the success of which could impact our results of operations, cash flows and financial condition.
In the past, we have pursued acquisitions to complement or expand our business, divestures and other strategic transactions. Such future transactions are part of our general strategic objectives and may occur. If we identify an acquisition candidate, we may not be able to successfully negotiate or finance the acquisition or integrate the acquired businesses with our existing business and services. Future acquisitions could result in potentially dilutive issuances of equity securities and the incurrence of debt and contingent liabilities, amortization expenses and substantial goodwill. The negotiation of any transaction, its completion, and subsequent integration of any business acquired may be complex and time consuming, involve significant costs and may result in a distraction of management’s attention from on-going business operations. We may be affected materially and adversely if we are unable to successfully integrate businesses that we acquire. Similarly, we may divest portions of our business, which may also have material and adverse effects.
ITEM 1B. UNRESOLVED STAFF COMMENTS
None.
16
ITEM 2. PROPERTIES
Information regarding our owned properties is included in Item 1, “Business.”
In addition to the properties that we own, we also lease under long-term leases office premises, office and transportation equipment, have water rights on certain government-owned waters and have harvesting rights with respect to certain timberlands. For additional information, see Note 19, “Operating Leases and Purchase Obligations,” to our Consolidated Financial Statements.
ITEM 3. LEGAL PROCEEDINGS
We are involved in various legal proceedings relating to contracts, commercial disputes, taxes, environmental issues, employment and workers’ compensation claims, Aboriginal claims and other matters. We periodically review the status of these proceedings with both inside and outside counsel. Although the final outcome of any of these matters is subject to many variables and cannot be predicted with any degree of certainty, we establish reserves for a matter (including legal costs expected to be incurred) when we believe an adverse outcome is probable and the amount can be reasonably estimated. We believe that the ultimate disposition of these matters will not have a material adverse effect on our financial condition, but it could have a material adverse effect on our results of operations in any given quarter or year.
Effective July 31, 2012, we completed the second step transaction pursuant to which we acquired the remaining 25.4% of the outstanding Fibrek Inc. (“Fibrek”) shares, following the approval of Fibrek’s shareholders on July 23, 2012, and the issuance of a final order of the Québec Superior Court in Canada (the “Canadian Court”) approving the arrangement on July 27, 2012. Certain former shareholders of Fibrek exercised (or purported to exercise) rights of dissent in respect of the transaction, asking for a judicial determination of the fair value of their claim under the Canada Business Corporations Act. No consideration has to date been paid to the former Fibrek shareholders who exercised (or purported to exercise) rights of dissent. Any such consideration will only be paid out upon settlement or judicial determination of the fair value of their claims and will be paid entirely in cash. Accordingly, we cannot presently determine the amount that ultimately will be paid to former holders of Fibrek shares in connection with the proceedings, but we have reserved approximately Cdn$14 million ($13 million, based on the exchange rate in effect on December 31, 2013) for the eventual payment of those claims.
On June 12, 2012, we filed a motion for directives with the Canadian Court seeking an order to prevent pension regulators in each of Québec, New Brunswick and Newfoundland and Labrador from declaring partial wind-ups of pension plans relating to employees of former operations in New Brunswick and Newfoundland and Labrador, or a declaration that any claim for accelerated reimbursements of deficits arising from a partial wind-up is a barred claim under the Creditor Protection Proceedings. These plans are subject to the funding relief regulations described in Note 14, “Pension and Other Postretirement Benefit Plans – Canadian pension funding,” to our Consolidated Financial Statements and we contend, among other things, that any such declaration, if issued, would be inconsistent with the Canadian Court’s sanction order confirming the Plan of Reorganization and the terms of our emergence from the Creditor Protection Proceedings. A partial wind-up would likely shorten the period in which any deficit within those plans, which could reach up to Cdn$150 million ($141 million, based on the exchange rate in effect on December 31, 2013), would have to be funded if we do not obtain the relief sought. No hearing date has been set to date.
ITEM 4. MINE SAFETY DISCLOSURES
Not applicable.
17
PART II
ITEM 5. | MARKET FOR REGISTRANT’S COMMON EQUITY, RELATED STOCKHOLDER MATTERS AND ISSUER PURCHASES OF EQUITY SECURITIES |
Our common stock trades on both the NYSE and the TSX. The ticker symbol for our common stock was changed from “ABH” to “RFP” on the NYSE on May 24, 2012 and on the TSX on May 28, 2012.
The high and low prices of our common stock on the NYSE for 2012 and 2013, by quarter, are set forth below.
High | Low | |||||||
2012 | ||||||||
First quarter | $ | 16.22 | $ | 14.20 | ||||
Second quarter | $ | 14.40 | $ | 10.15 | ||||
Third quarter | $ | 14.95 | $ | 9.02 | ||||
Fourth quarter | $ | 13.93 | $ | 10.40 | ||||
2013 | ||||||||
First quarter | $ | 17.54 | $ | 13.26 | ||||
Second quarter | $ | 16.62 | $ | 12.58 | ||||
Third quarter | $ | 15.80 | $ | 12.42 | ||||
Fourth quarter | $ | 17.08 | $ | 12.36 | ||||
As of January 31, 2014, there were approximately 3,730 holders of record of our common stock.
Any future determination to pay dividends will be at the discretion of the Board of Directors and will be dependent on then-existing conditions, including our financial condition, results of operations, capital requirements, contractual restrictions, business prospects and other factors that the Board of Directors considers relevant. The indenture governing our senior notes due in 2023 (“the 2023 Notes”) and the credit agreement governing our ABL credit facility contain restrictions on our ability to pay dividends and repurchase shares.
On May 22, 2012, our Board of Directors approved a share repurchase program of up to 10% of our common stock, for an aggregate purchase price of up to $100 million. Through December 31, 2012, we repurchased 5.6 million shares at a cost of $67 million. We did not repurchase shares in 2013.
See Part III, Item 12 of this Form 10-K, “Security Ownership of Certain Beneficial Owners and Management and Related Stockholder Matters,” for information regarding our equity compensation plan.
18
The following graph compares the cumulative total return attained by shareholders on our common stock versus the cumulative total returns of the S&P 500 index and a peer group of five companies since December 10, 2010, the date our common stock began trading following our emergence from the Creditor Protection Proceedings. The individual companies comprising the peer group are: Domtar Corporation, International Paper Company, UPM – Kymmene Corporation, Verso Paper Corp. and Weyerhaeuser Company. The graph tracks the performance of a $100 investment in our common stock on December 10, 2010, in the S&P 500 index on November 30, 2010 and in the peer group on November 30, 2010 (with the reinvestment of all dividends) to December 31, 2013. The stock price performance included in the graph is not indicative of future stock price performance.

19
ITEM 6. SELECTED FINANCIAL DATA
The following table presents summary historical consolidated financial information for each of the last five years and should be read in conjunction with Items 7 and 8. The selected financial information for the years ended December 31, 2013, 2012 and 2011 and as of December 31, 2013 and 2012 under the captions “Statement of Operations Data,” “Segment Sales Information,” “Statement of Cash Flows Data” and “Financial Position” shown below has been derived from our audited Consolidated Financial Statements. Comparative year segment sales information has been revised to conform to the changes made to our reportable segments.
In accordance with Financial Accounting Standards Board (“FASB”) Accounting Standards Codification (“ASC”) 852, “Reorganizations”, fresh start accounting was required upon our emergence from the Creditor Protection Proceedings, which we applied effective December 31, 2010. The implementation of the Plans of Reorganization and the application of fresh start accounting materially changed the carrying amounts and classifications reported in our consolidated financial statements and resulted in the Company becoming a new entity for financial reporting purposes. Accordingly, our consolidated financial statements as of December 31, 2010 and for periods subsequent to December 31, 2010 are not comparable to our consolidated financial statements for periods prior to December 31, 2010. References to “Successor” or “Successor Company” refer to the Company on or after December 31, 2010, after giving effect to the implementation of the Plans of Reorganization and the application of fresh start accounting. References to “Predecessor” or “Predecessor Company” refer to the Company prior to December 31, 2010. Additionally, references to periods on or after December 31, 2010 refer to the Successor and references to periods prior to December 31, 2010 refer to the Predecessor.
In accordance with the guidance of FASB ASC 250, “Accounting Changes and Error Corrections,” certain prior year amounts have been adjusted due to our change in accounting policy for planned major maintenance costs, as discussed in Note 1, “Organization and Basis of Presentation - Change in accounting policy for planned major maintenance costs,” to the Consolidated Financial Statements.
20
Successor | Predecessor | ||||||||||||||||||||||||
(In millions, except per share amounts or otherwise indicated) | 2013 | 2012 | 2011 | 2010 | 2009 | ||||||||||||||||||||
Statement of Operations Data | |||||||||||||||||||||||||
Sales | $ | 4,461 | $ | 4,503 | $ | 4,756 | $ | 4,746 | $ | 4,366 | |||||||||||||||
Operating (loss) income (1) | (2 | ) | (28 | ) | 207 | (164 | ) | (374 | ) | ||||||||||||||||
Reorganization items, net (2) | — | — | — | 1,895 | (639 | ) | |||||||||||||||||||
Net (loss) income including noncontrolling interests | (639 | ) | (33 | ) | 45 | 2,762 | (1,559 | ) | |||||||||||||||||
Net (loss) income attributable to Resolute Forest Products Inc. | (639 | ) | 1 | 47 | 2,601 | (1,552 | ) | ||||||||||||||||||
Basic net (loss) income per share attributable to Resolute Forest Products Inc. common shareholders | (6.75 | ) | 0.01 | 0.48 | 45.07 | (26.90 | ) | ||||||||||||||||||
Diluted net (loss) income per share attributable to Resolute Forest Products Inc. common shareholders | (6.75 | ) | 0.01 | 0.48 | 27.49 | (26.90 | ) | ||||||||||||||||||
Dividends declared per common share | — | — | — | — | — | ||||||||||||||||||||
Segment Sales Information | |||||||||||||||||||||||||
Newsprint | $ | 1,473 | $ | 1,627 | $ | 1,816 | $ | 1,804 | $ | 1,802 | |||||||||||||||
Specialty papers | 1,366 | 1,562 | 1,813 | 1,803 | 1,747 | ||||||||||||||||||||
Market pulp | 1,053 | 814 | 659 | 715 | 518 | ||||||||||||||||||||
Wood products | 569 | 500 | 468 | 424 | 290 | ||||||||||||||||||||
Other | — | — | — | — | 9 | ||||||||||||||||||||
$ | 4,461 | $ | 4,503 | $ | 4,756 | $ | 4,746 | $ | 4,366 | ||||||||||||||||
Statement of Cash Flows Data | |||||||||||||||||||||||||
Net cash provided by operating activities | $ | 206 | $ | 266 | $ | 198 | $ | 39 | $ | 46 | |||||||||||||||
Cash invested in fixed assets | 161 | 169 | 97 | 81 | 101 | ||||||||||||||||||||
Successor | Predecessor | ||||||||||||||||||||||||
2013 | 2012 | 2011 | 2010 | 2009 | |||||||||||||||||||||
Financial Position | |||||||||||||||||||||||||
Fixed assets (3) | $ | 2,289 | $ | 2,440 | $ | 2,502 | $ | 2,641 | $ | 3,897 | |||||||||||||||
Total assets | 5,385 | 6,333 | 6,304 | 7,135 | 7,125 | ||||||||||||||||||||
Long-term debt, including current portion (4) (5) | 599 | 534 | 621 | 905 | 613 | ||||||||||||||||||||
Total debt (4) (5) | 599 | 534 | 621 | 905 | 1,499 | ||||||||||||||||||||
Additional Information | |||||||||||||||||||||||||
Employees (number) | 8,400 | 9,300 | 10,400 | 10,500 | 12,100 | ||||||||||||||||||||
(1) | Operating loss for 2009 included $276 million of alternative fuel mixture tax credits. |
(2) | Represents certain expenses, provisions for losses and other charges and credits directly associated with or resulting from the reorganization and restructuring of the business that were realized or incurred in the Creditor Protection Proceedings, including the impact of the implementation of the Plans of Reorganization and the application of fresh start accounting. |
(3) | As part of the application of fresh start accounting, fixed assets were adjusted to their fair values as of December 31, 2010. |
(4) | As of the Emergence Date and pursuant to the Plans of Reorganization, all amounts outstanding under our debtor in possession financing arrangements and the Debtors’ pre-petition secured debt obligations were paid in full in cash and certain holders of allowed claims arising from the Debtors’ pre-petition unsecured debt obligations received their pro rata share of the Successor Company’s common stock. Additionally, upon the consummation of the Plans of Reorganization, we assumed the obligations in respect of the $850 million principal amount of our senior secured notes due in 2018 (the “2018 Notes”), issued by an escrow subsidiary of ours. In 2012 and 2011, we redeemed $85 million and $264 million, respectively, of principal amount of the 2018 Notes. In 2013, we issued $600 million aggregate principal of 2023 Notes and used the proceeds to redeem the remaining $501 million of principal amount of the 2018 Notes. For additional information, see Note 13, “Long-Term Debt,” to our Consolidated Financial Statements. |
21
(5) | Due to the commencement of the Creditor Protection Proceedings, our consolidated balance sheet as of December 31, 2009 included unsecured pre-petition debt obligations of $4,852 million included in liabilities subject to compromise, secured pre-petition debt obligations of $980 million included in current liabilities and secured pre-petition debt obligations of $34 million included in long-term debt, net of current portion. |
22
ITEM 7. MANAGEMENT’S DISCUSSION AND ANALYSIS OF FINANCIAL CONDITION AND RESULTS OF OPERATIONS
The following management’s discussion and analysis is intended to help the reader understand Resolute Forest Products, our results of operations, cash flows and financial condition. The discussion is provided as a supplement to, and should be read in conjunction with, our consolidated financial statements and the accompanying notes contained in Item 8 - Financial Statements and Supplementary Data.
OVERVIEW
Resolute Forest Products is a global leader in the forest products industry, with a diverse range of products, including newsprint, specialty papers, market pulp and wood products, which are marketed in close to 90 countries. We own or operate over 40 pulp and paper mills and wood products facilities in the U.S., Canada and South Korea, and power generation assets in Canada. By capacity, we are the largest producer of newsprint in the world, the largest producer of uncoated mechanical papers in North America and the biggest Canadian volume producer of wood products east of the Rockies. We are also a significant North American producer of coated mechanical papers and market pulp.
We report our activities in four business segments: newsprint, specialty papers, market pulp and wood products.
We are guided by our vision and values, focusing on safety, profitability, accountability, sustainability and teamwork. These are the elements that we believe best define us:
• | Competitive cost structure - as a result of aggressive cost reductions and mill rationalizations, today we compete as a leading, lower-cost North American producer. Maintaining this competitive advantage is our key focus. By challenging ourselves to optimize assets - maximizing the utilization of our most cost-effective mills and streamlining production to adapt to changing market dynamics - we seek to remain an industry cost leader and to maximize shareholder value and earnings power. |
• | Synergistic and diversified asset base - our harvesting rights and extensive network of Canadian sawmills not only makes us a significant lumber producer in eastern North America, but also give us the fiber management advantage of integration from the harvested log through the finished pulp or paper product at more than half of our facilities. In the U.S., we source primarily from the lower-cost southeastern fiber basket. The diversified and complimentary nature of our asset base also provides earnings from multiple products. |
• | Financial strength - we make disciplined capital management a priority; we believe in maintaining a flexible and conservative capital structure. |
Our business
Products
Our 2.9 million metric tons of capacity in newsprint represents approximately 10% of worldwide capacity and 38% of North American capacity. We sell newsprint to newspaper publishers all over the world and also to commercial printers in North America for uses such as inserts and flyers. In 2013, international deliveries represented 44% of total newsprint shipments.
We have 2.0 million metric tons of capacity in specialty papers, which include uncoated mechanical and coated mechanical grades. Approximately one third of our production of uncoated mechanical papers is high-gloss (or supercalender) paper, mainly used for magazines, coupons, retail inserts and newspaper supplements. We produce another third of high-bright papers for general commercial printing, educational textbooks, digital printing and tradebooks. The last third includes papers for directories, paperback books and other commercial applications. In total, our 1.4 million metric tons of uncoated mechanical papers capacity makes us the largest producer in North America, and the third largest in the world. We sell uncoated mechanical papers almost exclusively in North America. With 580,000 metric tons of capacity, we are North America’s third largest producer of coated mechanical papers, grades used for magazines, catalogs and advertising inserts. Demand for these products is largely tied to consumer spending and advertising. We sell to major commercial printers, publishers, catalogers and retailers in North America.
We operate seven pulp mills, five in the U.S. and two in Canada, with total capacity of 1.7 million metric tons, making us the third largest pulp producer in North America. Approximately 80% of our virgin pulp capacity is softwood-based, including: northern bleached softwood kraft pulp (or “NBSK”), southern bleached softwood kraft pulp (or “SBSK”) and fluff pulp. We are also a competitive producer of northern bleached hardwood kraft pulp (or “NBHK”) and southern bleached hardwood kraft pulp (or “SBHK”), and a leading producer of recycled bleached kraft pulp (or “RBK”). Our market pulp - the pulp we produce but do not consume internally - is used to make a range of consumer products, like tissue, packaging, specialty paper products, diapers
23
and other absorbent products. Approximately 32% of our 2013 market pulp shipments were exported outside of North America, including significant exports to Europe (14%), Asia (8%) and Latin America (6%).
In 2013, we shipped 1.5 billion board feet of construction-grade lumber within North America, mostly on the east coast. Our sawmills produce dimension spruce-pine-fir (or “SPF”) lumber and provide wood chips to our pulp and paper mills in Canada and wood residue we use as fuel in our power cogeneration assets and other operations. We also produce i-joists for the construction industry and bed frame components, finger joints and furring strips.
Years Ended December 31, | ||||||||||||
2013 | 2012 | 2011 | ||||||||||
Sales | ||||||||||||
Newsprint | 33 | % | 36 | % | 38 | % | ||||||
Specialty papers | 31 | % | 35 | % | 38 | % | ||||||
Market pulp | 23 | % | 18 | % | 14 | % | ||||||
Wood products | 13 | % | 11 | % | 10 | % | ||||||
Total (%) | 100 | % | 100 | % | 100 | % | ||||||
Total sales ($ millions) | $ | 4,461 | $ | 4,503 | $ | 4,756 | ||||||
Strategy
Our corporate strategy includes, on the one hand, a gradual retreat from certain paper grades, and on the other, using our strong financial position to act on opportunities to diversify and grow. That strategy is based on three core themes: operational excellence, disciplined use of capital and strategic initiatives.
Operational excellence
We aim to improve our performance and margins by:
• | leveraging our lower-cost position; |
• | maintaining a stringent focus on reducing costs and optimizing our diversified asset base; |
• | maximizing the benefits of our access to virgin fiber and managing our exposure to volatile recycled fiber; |
• | pursuing our strategy of managing production and inventory levels and focusing production on our most profitable facilities and machines; and |
• | capitalizing on our economical access to international markets to compensate for the secular decline in North American newsprint demand. |
Disciplined use of capital
We make capital management a priority. Building on our focus to reduce manufacturing costs, we will continue our efforts to decrease overhead and spend our capital in a disciplined, strategic and focused manner, concentrated on our most successful sites.
Maintaining our strong financial position and financial flexibility is one of our primary financial goals. In 2011 and 2012, we redeemed $349 million of principal amount of our then-outstanding 10.25% senior secured notes due 2018 and a $90 million promissory note issued in connection with an acquisition in 2011. In 2012, we also repaid and canceled Fibrek’s term loan and credit facility, for a total of $112 million. In 2013, we refinanced the remaining balance of our senior secured notes with 5.875% senior unsecured notes due 2023. In addition to adding five years to maturity, the refinancing reduced our annual cash interest burden by $16 million and improves our financial flexibility.
Strategic initiatives
We believe in taking an opportunistic approach to strategic initiatives, pursuing only those that reduce our cost position, improve our product diversification, provide synergies or allow us to expand into future growth markets. We anticipate continued consolidation in the paper and forest products industry, as we and our competitors continue to explore ways to increase efficiencies and grow into more favorable markets.
By acquiring Fibrek in 2012, we grew our market pulp segment, increasing our presence in a market that we believe will grow over the long term. In addition to growing our pulp capacity by over 70%, we’re in the process of building or refurbishing two
24
sawmills in Northern Ontario, Canada. By the time they begin production in early 2015, along with other capacity initiatives we’re working on, we expect our annualized sawmill capacity to be around 1.9 billion board feet, a 30% increase above 2013.
Sustainable performance and development
Our sustainability strategy is based on a balanced approach to environmental, social and economic performance, designed to enhance our competitive position. It is supported by public commitments in a number of key performance areas, focusing primarily on:
• | improving resource efficiency, which helps control fiber and power costs, two significant input costs in our industry; |
• | adapting to our customers’ procurement policies and striving to anticipate trends in demand for environmentally-conscious forest products, which will enhance the long-term competitiveness of our product offering; |
• | positioning Resolute as a competitive employer in order to attract, engage and retain the best and brightest minds, promoting employee engagement, innovation and longevity; and |
• | building solid community relations to support long-term regional prosperity and our own financial and operational success. |
Our key sustainability commitments include:
• | Achieving an Occupational Safety and Health Administration (or “OSHA”) incident rate of 0.99 or below in 2014, which is slightly below the 1.02 we achieved in 2013. Though we strive to have zero injuries, our 2013 safety performance is generally considered to be world-class. |
• | We’re closing in, ahead of schedule, on the goal we set as a member of the World Wildlife Fund (“WWF”) Climate Savers program to reduce our scope 1 and 2 greenhouse gas (or “GHG”) emissions by 65% by 2015, compared to 2000 levels. |
• | Maintaining 100% certification of Resolute-owned or managed woodlands to sustainable forest management (SFM) certification standards. For over five years now, 100% of managed forests have been certified to either FSC®, SFI® and or CSA. |
• | Through 2015, implementing new human resource practices to support workforce renewal and retention, engage employees in the Company’s sustainability-focused vision and values, and ensure current and future staffing requirements. |
• | Reducing the number of mill environmental incidents in 2014 by 10% compared to 2013. |
Power generation
We produce electricity at seven cogeneration facilities and seven hydroelectric dams. The output is consumed internally, sold at contracted fixed prices and/or sold on the spot market. This allows us to reduce our costs by generating energy internally at a lower cost compared to open market purchases, and by producing revenue from external sales of some of the power.
This table provides a breakdown of the output capacity (based on installed capacity and operating expectations in 2014) available for internal consumption at our existing production facilities:
Energy | |||||||
INTERNAL CONSUMPTION | Type | Capacity (MW) | Consumption (MWh/year) | ||||
Calhoun, TN | Cogeneration | 64 | 373,000 | ||||
Catawba, SC | Cogeneration | 55 | 430,000 | ||||
Coosa Pines, AL | Cogeneration | 30 | 105,000 | ||||
Hydro Saguenay, QC (7 dams) | Hydroelectric | 170 | 1,050,000 | ||||
Thunder Bay, ON | Cogeneration | 51 | 220,000 | ||||
25
This table shows the facilities where we currently produce electricity to sell externally as green power produced from renewable sources at favorable rates, almost all of which we buy back for use in our operations.
Energy | |||||||
EXTERNAL SALES | Type | Capacity (MW) | Annualized sales (MWh/year) | ||||
Dolbeau-Mistassini, QC | Cogeneration | 28 | 192,000 | ||||
Gatineau, QC | Cogeneration | 15 | 110,000 | ||||
Saint-Félicien, QC | Cogeneration | 43 | 300,000 | ||||
Thunder Bay, ON | Cogeneration | 65 | 390,000 | ||||
Business Conditions
2013 Highlights
We made significant progress as an organization in 2013, strengthening our financial position, enhancing the efficiency of our operations and improving our performance on safety and sustainability.
We strengthened our financial position in three key ways:
• | We reached an agreement-in-principle with Company stakeholders in Québec and in Ontario to replace the corrective measures mechanism under the existing funding relief regulations in favor of stable, predictable and balanced pension funding for our Canadian plans, which represented about 75% of our unfunded pension obligations as of December 31, 2013. |
• | The rising interest rate environment, strong asset returns, 2013 funding, the favorable currency impact and amendments to OPEB plans all contributed to the elimination of $672 million of net pension and OPEB liabilities from our balance sheet compared to 2012. |
• | We refinanced, on a very timely basis, all of our outstanding secured debt with $600 million of unsecured notes, at 5.875% interest, reducing our cash interest burden by $16 million annually, adding 5 more years to maturity and improving our financial flexibility. |
Concerning operational excellence initiatives:
• | Since 2012, we optimized newsprint capacity by idling two machines and restarting the Gatineau mill, for a net reduction of about 285,000 metric tons on an annualized basis. In our specialty papers segment, we idled three machines and restarted the Dolbeau mill, for a net reduction of about 220,000 metric tons on an annualized basis. |
• | We restructured manning at two more sites in 2013, eliminating 170 positions, without reducing operating capacity. |
• | We’ve grown our pulp capacity by over 70% with our 2012 acquisition of Fibrek, and by the time our new sawmills in Northern Ontario begin production in early 2015, along with other capacity initiatives we’re working on, we expect our annualized sawmill operating capacity to be around 1.9 billion board feet, a 30% increase above 2013. |
• | In 2013, we finished bringing online all four of our cogeneration assets from which we sell electricity externally - Dolbeau (specialty papers), Gatineau (newsprint), Saint-Félicien (market pulp), and Thunder Bay (newsprint and market pulp). Together, they reduced our costs by approximately $45 million, not including other operational efficiencies realized with the operation of the cogeneration assets, such as labor efficiencies. |
• | We’ve restructured and significantly improved the performance of the three pulp mills we acquired with Fibrek in 2012. After a challenging start because of the extensive catch-up maintenance and environmental work required at the Saint-Félicien mill, we’ve made the three mills more competitive than before we acquired them. |
On safety and environment:
• | We achieved an OSHA incident rate of 1.02 in 2013. Though we strive to have zero injuries, our 2013 safety performance is generally considered to be world-class. |
• | We’re closing in, ahead of schedule, on the goal we set as a member of the WWF Climate Savers program to reduce our GHG emissions by 65% by 2015, compared to 2000 levels. |
26
• | We fell short of our internal commitment to reduce environmental incidents by 10% in 2013 compared to 2012, but we’ve developed an action plan to address gaps and improve performance. For 2014, we set a goal of reducing the number of mill environmental incidents by 10% compared to 2013. |
RESULTS OF OPERATIONS
Consolidated Earnings
Selected Annual Financial Information
Years Ended December 31, | ||||||||||||
(in millions, except per share amounts) | 2013 | 2012 | 2011 | |||||||||
Sales (1) | $ | 4,461 | $ | 4,503 | $ | 4,756 | ||||||
Operating income (loss) per segment | ||||||||||||
Newsprint | 40 | 97 | 89 | |||||||||
Specialty papers | 35 | 85 | 122 | |||||||||
Market pulp (1) | 42 | (43 | ) | 91 | ||||||||
Wood products | 41 | 26 | (25 | ) | ||||||||
Corporate / other | (160 | ) | (193 | ) | (70 | ) | ||||||
Total | (2 | ) | (28 | ) | 207 | |||||||
Net (loss) income (1) | (639 | ) | 1 | 47 | ||||||||
Net (loss) income per common share | ||||||||||||
Basic | $ | (6.75 | ) | $ | 0.01 | $ | 0.48 | |||||
Diluted | (6.75 | ) | 0.01 | 0.48 | ||||||||
Cash and cash equivalents | $ | 322 | $ | 263 | $ | 369 | ||||||
Total assets | 5,385 | 6,333 | 6,304 | |||||||||
Adjusted EBITDA (2) | $ | 377 | $ | 393 | $ | 490 | ||||||
Adjusted EBITDA margin (2) | 8.5 | % | 8.7 | % | 10.3 | % | ||||||
ROE, adjusted for special items (3) | 2.8 | % | 2.6 | % | 4.8 | % | ||||||
(1) | We’ve included Fibrek’s results of operations in our consolidated financial statements, in the market pulp segment, as of May 2, 2012, the date we acquired a controlling interest. Fibrek’s sales, operating income and net income in our results for 2013 were $456 million, $40 million and $40 million, respectively. Its sales, operating loss and net loss in our 2012 results were $268 million, $9 million and $9 million, respectively. |
(2) | Earnings before interest expense, income taxes and depreciation, or “EBITDA”, adjusted EBITDA and adjusted EBITDA margin are not financial measures recognized under generally accepted accounting principles, or “GAAP”. EBITDA is calculated as net income (loss) including noncontrolling interests from the consolidated statements of operations, adjusted for interest expense, income taxes and depreciation and amortization. Adjusted EBITDA means EBITDA, excluding special items such as foreign exchange translation gains and losses, severance costs, closure costs, impairment and other related charges, inventory write-downs related to closures, start up costs of idled mills, gains and losses on dispositions of assets, net loss on extinguishment of debt, transaction costs and other charges or credits that are excluded from our segments’ performance from GAAP operating income (loss). Adjusted EBITDA margin is adjusted EBITDA expressed as a percentage of sales. We believe that using measures such as EBITDA, adjusted EBITDA and adjusted EBITDA margin is useful because they are consistent with the indicators management uses internally to measure the Company’s performance and it allows the reader to more easily compare our ongoing operations and financial performance from period to period. |
(3) | Return on equity, or “ROE”, is a non-GAAP financial measure, calculated by dividing net income (loss), excluding the special items identified below, by adjusted shareholders’ equity. ROE is a measure of profitability that shows how much profit the Company generated as a percentage of shareholder money invested. |
27
Years ended December 31, | ||||||||||||
(in millions) | 2013 | 2012 | 2011 | |||||||||
Net (loss) income including noncontrolling interests | $ | (639 | ) | $ | (33 | ) | $ | 45 | ||||
Interest expense | 51 | 66 | 95 | |||||||||
Income tax provision (benefit) | 524 | (39 | ) | 19 | ||||||||
Depreciation and amortization | 243 | 233 | 220 | |||||||||
EBITDA | $ | 179 | $ | 227 | $ | 379 | ||||||
Foreign exchange translation loss (gain) | 24 | (17 | ) | 21 | ||||||||
Severance costs | — | 5 | 12 | |||||||||
Closure costs, impairment and other related charges | 89 | 185 | 46 | |||||||||
Inventory write-downs related to closures | 11 | 12 | 3 | |||||||||
Start up costs of idled mills | 32 | 13 | — | |||||||||
Net gain on disposition of assets | (2 | ) | (35 | ) | (3 | ) | ||||||
Net loss on extinguishment of debt | 59 | — | — | |||||||||
Transaction costs | 6 | 8 | 5 | |||||||||
Other (income) expense, net | (21 | ) | (5 | ) | 27 | |||||||
Adjusted EBITDA | $ | 377 | $ | 393 | $ | 490 | ||||||
December 31, 2013 | ||||||||||||
(in millions, except ROE) | Net (loss) income | Shareholders’ equity | ROE (%) | |||||||||
GAAP as reported | $ | (639 | ) | $ | 2,827 | (22.6 | )% | |||||
Adjustments for special items: | ||||||||||||
Foreign exchange translation loss | $ | 26 | $ | 26 | ||||||||
Severance costs | — | — | ||||||||||
Closure costs, impairment and other related charges | 59 | 59 | ||||||||||
Inventory write-downs related to closures | 7 | 7 | ||||||||||
Start up costs of idled mill | 23 | 23 | ||||||||||
Net gain on disposition of assets | (2 | ) | (2 | ) | ||||||||
Net loss on extinguishment of debt | 38 | 38 | ||||||||||
Transaction costs | 5 | 5 | ||||||||||
Other income, net | (14 | ) | (14 | ) | ||||||||
U.S. deferred income tax asset valuation allowance | 604 | 604 | ||||||||||
Cumulative past-year adjustments for special items | — | 210 | ||||||||||
GAAP as adjusted for special items | $ | 107 | $ | 3,783 | 2.8 | % | ||||||
28
December 31, 2012 | ||||||||||||
(in millions, except ROE) | Net income | Shareholders’ equity | ROE (%) | |||||||||
GAAP as reported | $ | 1 | $ | 3,102 | — | % | ||||||
Adjustments for special items: | ||||||||||||
Foreign exchange translation gain | $ | (23 | ) | $ | (23 | ) | ||||||
Severance costs | 4 | 4 | ||||||||||
Closure costs, impairment and other related charges | 116 | 116 | ||||||||||
Inventory write-downs related to closures | 7 | 7 | ||||||||||
Start up costs of idled mills | 10 | 10 | ||||||||||
Net gain on disposition of assets | (22 | ) | (22 | ) | ||||||||
Transaction costs | 8 | 8 | ||||||||||
Other income, net | (2 | ) | (2 | ) | ||||||||
Reorganization-related and other tax adjustments | (13 | ) | (13 | ) | ||||||||
Cumulative past-year adjustments for special items | — | 125 | ||||||||||
GAAP as adjusted for special items | $ | 86 | $ | 3,312 | 2.6 | % | ||||||
December 31, 2011 | ||||||||||||
(in millions, except ROE) | Net income | Shareholders’ equity | ROE (%) | |||||||||
GAAP as reported | $ | 47 | $ | 3,423 | 1.4 | % | ||||||
Adjustments for special items: | ||||||||||||
Foreign exchange translation loss | $ | 23 | $ | 23 | ||||||||
Severance costs | 8 | 8 | ||||||||||
Closure costs, impairment and other related charges | 32 | 32 | ||||||||||
Inventory write-downs related to closures | 2 | 2 | ||||||||||
Net gain on disposition of assets | (2 | ) | (2 | ) | ||||||||
Transaction costs | 4 | 4 | ||||||||||
Other expense, net | 20 | 20 | ||||||||||
Reorganization-related and other tax adjustments | 38 | 38 | ||||||||||
GAAP as adjusted for special items | $ | 172 | $ | 3,548 | 4.8 | % | ||||||
29
2013 vs. 2012
Operating loss variance analysis
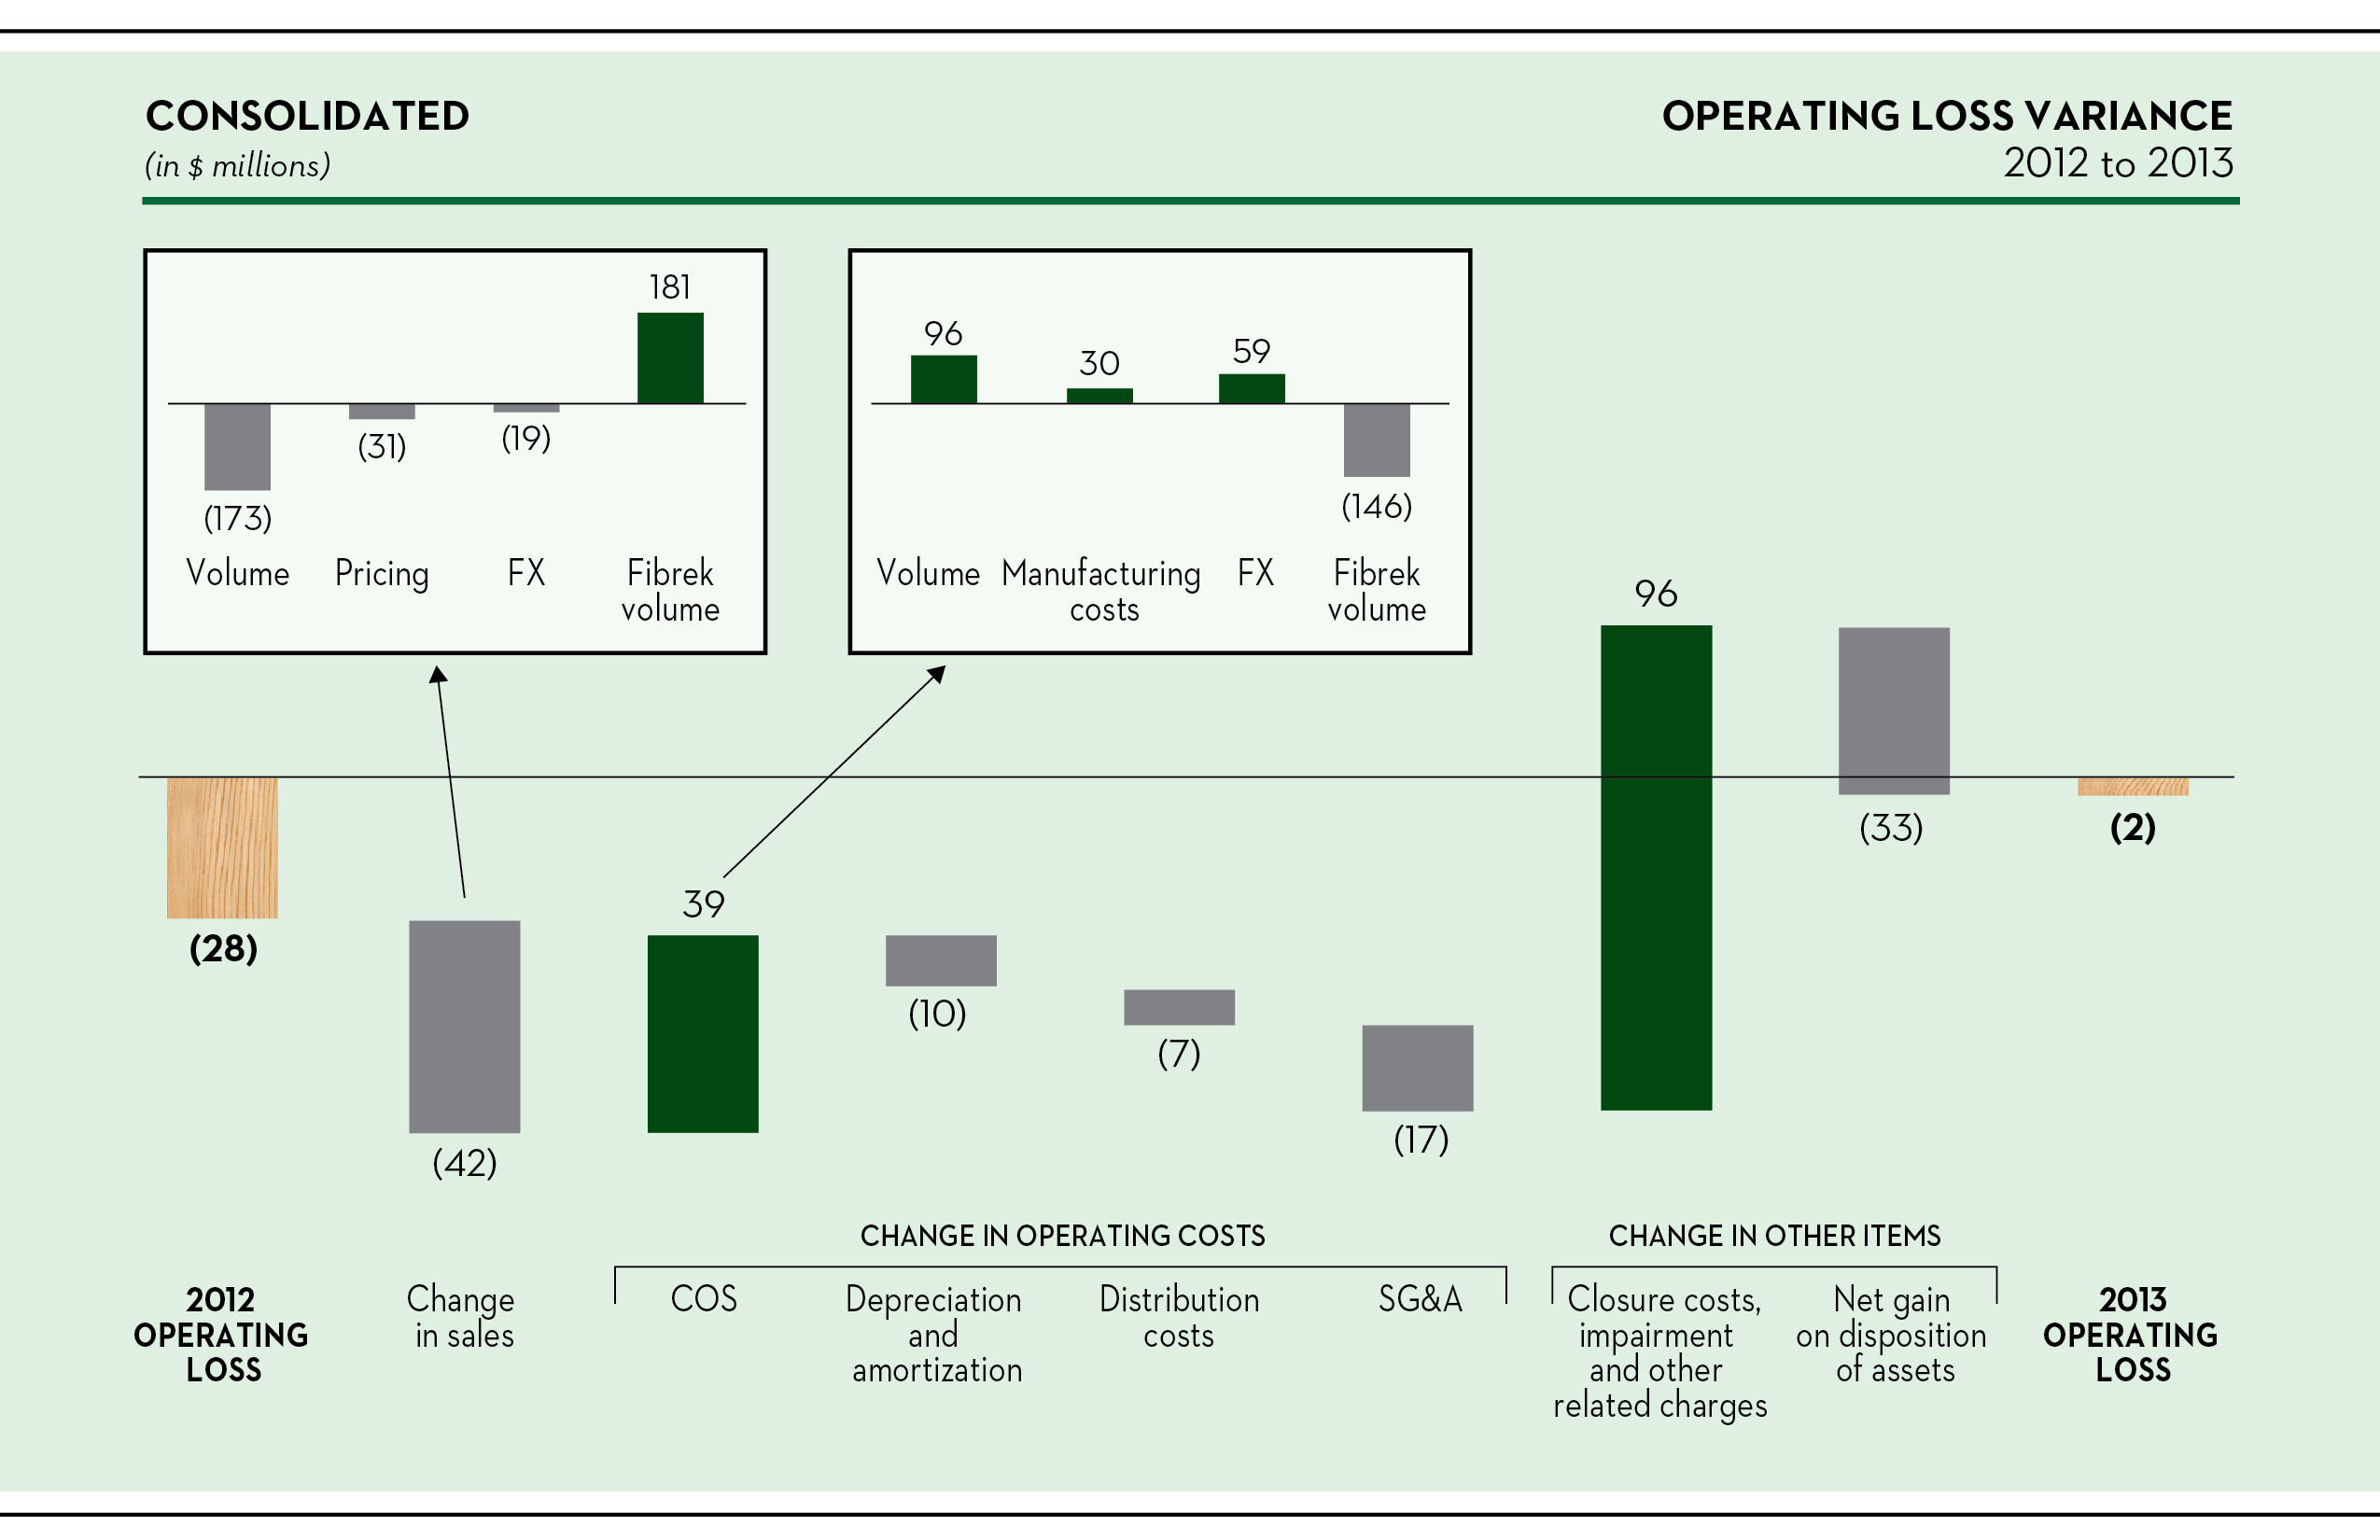
Sales
Our sales were $4,461 million in 2013, $42 million lower, or 1%, than in 2012. Excluding Fibrek, volume had a $173 million impact, which reflects our efforts to optimize the asset base, maximizing the utilization of our most cost-effective mills and streamlining production to adapt to changing market dynamics. Accordingly, at the end of 2013 we operated four fewer machines overall compared to the start of 2012, not including the three pulp mills we acquired with Fibrek.
Overall pricing fell by $31 million in 2013. The pricing drop in newsprint ($84 million) and specialty papers ($24 million) more than offset higher pricing in wood products ($59 million) and market pulp ($18 million). Currency fluctuations unfavorably affected sales by $19 million.
The former Fibrek mills generated an additional $181 million of sales volume compared to the year-ago period, reflecting their consolidation within our financial statements from only May 2, 2012, onward, and extensive downtime in the third quarter of 2012 to improve the Saint-Félicien pulp mill’s operational and environmental performance.
Compared to 2012, we took approximately 242,000 metric tons less downtime in the newsprint, specialty and market pulp segments, not including downtime at machines later closed or idled and whose production capacity was not replaced.
Cost of sales, excluding depreciation, amortization and distribution costs
Cost of sales, excluding depreciation, amortization and distribution costs, or “COS,” improved by $39 million in 2013, reflecting the favorable effect of the weaker Canadian dollar and lower overall manufacturing costs, partially offset by the unfavorable effects of higher volume, the net result of additional volume from the three former Fibrek pulp mills over the lower non-Fibrek volume.
Manufacturing costs improved as a result of:
• | asset optimization and mill restructuring initiatives ($42 million); |
• | additional external power sales from new cogeneration facilities ($36 million); and |
30
• | lower power costs ($7 million); |
offset in part by:
• | higher maintenance costs ($19 million); |
• | higher fuel energy costs because of natural gas pricing ($16 million); and |
• | increased overall fiber costs ($6 million). |
The net increase in fiber costs reflects higher log costs in the wood products segment and higher wood costs in the U.S. southeast pulp and paper mills due to wet weather, offset in part by more efficient fiber usage, as well as lower chip and recovered paper costs.
Other items that were not production-related but still affected the manufacturing costs variance included:
• | costs associated with mill restarts net of lower costs for non-operating sites ($8 million); |
• | the timing of the receipt of insurance proceeds ($4 million); and |
• | an increase in the net pension and other postretirement benefit expense ($7 million), due primarily to the amortization of actuarial losses starting in 2013; |
which more than offset a non-cash obsolescence provision for slow-moving spare parts taken in 2012 ($10 million).
Depreciation and amortization
Depreciation and amortization increased by $10 million due to the acquisition of the three Fibrek pulp mills.
Selling, general and administrative expenses
Selling, general and administrative expenses, or “SG&A,” were $17 million higher in 2013 largely because of credits we recorded in 2012, including a refund of certain group benefit premiums paid in prior years ($11 million).
Closure costs, impairment and other related charges
See the corresponding variance analysis under “- Segment Earnings - Corporate and Other” below.
Net gain on disposition of assets
Compared to $2 million in 2013, we recognized a net gain on disposition of assets of $35 million in 2012, mainly as a result of the sale of timberlands in Nova Scotia in the first quarter.
Net (loss) income variance analysis
Net loss was $639 million in 2013, or $6.75 per share, compared to net income of $1 million, or $0.01 per share, in 2012.
Interest expense
Interest expense was $51 million in 2013, down by $15 million, reflecting:
• | the lower principal amount of 10.25% senior secured notes due 2018 following the $85 million redemption in October of 2012; and |
• | the refinancing, in the second quarter of 2013, of the senior secured notes with 5.875% senior unsecured notes due 2023. |
Other (expense) income, net
The $62 million we recorded as other expense, net, was the product of:
• | a net loss on extinguishment of debt ($59 million), which reflects the tender offer premium paid to holders of the 2018 notes ($84 million), net of the write-down of the associated unamortized premium ($25 million); and |
• | a foreign currency loss from the translation of Canadian dollar net monetary assets ($24 million); |
31
offset by:
• | the forgiveness of a note payable in connection with our acquisition of a former joint venture partner’s interest in CNC ($12 million); and |
• | a distribution from the liquidation of a former U.K. subsidiary ($12 million). |
By comparison, we recorded other income, net, of $22 million in 2012, including a $17 million foreign exchange gain from the translation of Canadian dollar net monetary assets and other income items of $16 million, partially offset by $11 million of post-emergence costs.
Income taxes
We recorded a $524 million income tax provision in 2013, on a loss before income taxes of $115 million, compared to an expected income tax benefit of $40 million based on the U.S. federal statutory income tax rate of 35%. The difference largely reflects a net valuation allowance increase of $572 million, most of which relates to a $604 million charge recorded to establish a full valuation allowance against our net U.S. deferred income tax assets, partially offset by a tax benefit on the reversal of a $36 million valuation allowance on available U.S. capital losses that we now expect to use in the future because of our acquisition of the noncontrolling interest in CNC.
We recorded a $39 million income tax benefit in 2012, on a loss before income taxes of $72 million, compared to an expected income tax benefit of $25 million based on the U.S. federal statutory income tax rate of 35%. This difference reflects the favorable impacts related to reorganization-related tax adjustments, foreign exchange related items, research and development tax incentives, as well as adjustments to unrecognized tax benefits, offset by a net increase in valuation allowances. This net increase in valuation allowances was primarily due to the costs associated with the idling of our Mersey operations net of the benefits of an internal reorganization of our U.S. Fibrek subsidiaries.
Some of our Canadian subsidiaries, including our principal Canadian operating subsidiary, use the U.S. dollar as functional currency but determine taxable income in Canadian dollars. This can cause frequent and substantial variations to our effective tax rate when compared to the weighted-average of both domestic and foreign statutory tax rates. This is because we compute the foreign exchange component of the income tax provision of our Canadian subsidiaries on a different basis than in our consolidated financial statements. Due to the unpredictability of foreign exchange rates, we are unable to estimate the impact of future changes in exchange rates on our effective tax rate.
Noncontrolling interests
In 2012, we recorded a loss of $34 million attributable to noncontrolling interests, representing our former joint venture partner’s share of the impairment, severance costs and other charges related to the indefinite idling of the Mersey newsprint mill, partially offset by the partner’s share of the gain from the sale of timberlands in Nova Scotia.
Q4 of 2013 vs. Q4 of 2012
Operating income (loss) variance analysis
Operating income improved to $8 million in the fourth quarter, compared to an operating loss of $58 million in the year-ago period. Sales rose by $22 million because of higher shipment volumes of newsprint ($9 million), market pulp ($21 million) and wood products ($12 million), offset in part by lower shipments of specialty papers ($6 million). Overall pricing was down $5 million, as higher selling prices for market pulp ($17 million) and wood products ($5 million) were more than offset by the lower pricing for newsprint ($20 million) and specialty papers ($7 million).
Compared to the fourth quarter of 2012, the Company took approximately 36,000 metric tons less downtime in the newsprint, specialty and market pulp segments, not including downtime at machines later closed or idled and whose production capacity was not replaced.
COS improved by $9 million because of lower manufacturing costs ($3 million) and the favorable effect of the weaker Canadian dollar ($28 million), offset by costs associated with the additional volume ($22 million). The drop in manufacturing costs reflects:
• | our asset optimization and mill restructuring initiatives and external power sales from cogeneration facilities ($13 million); |
• | more efficient fiber usage, lower usage of coating chemicals, as well as lower chip and recovered paper costs ($12 million); |
32
• | a non-cash obsolescence provision for slow-moving spare parts taken in 2012 ($10 million); and |
• | a favorable power adjustment ($4 million); |
offset in part by:
• | higher maintenance costs ($14 million); |
• | higher log costs in the province of Québec ($9 million), including: higher stumpage fees, most of which was lumber market-price related, and other costs associated with the comprehensive modification of the forest tenure system in the province; and |
• | higher wood costs in the U.S. southeast due to wet weather ($7 million). |
Closure costs, impairment and other related charges were $33 million in the fourth quarter of 2013, reflecting costs and charges related to the extended market-related outage at the remaining paper machine in Fort Frances and the impairment of the U.S. recycling assets. By comparison, we recorded $87 million in the same period in 2012 for costs, impairment and charges related to the idling of the Mersey newsprint mill, the idling of a pulp and a paper machine at our Fort Frances mill and the idling of a paper machine at our Laurentide mill.
Net loss variance analysis
Net loss in the fourth quarter of 2013 was $3 million, compared to a net loss of $45 million in the year ago period, a narrowing of $42 million. The change to operating income is described above. Interest expense was $12 million, or $3 million lower, as a result of the refinancing of our senior secured notes in the second quarter. The change in the Canadian dollar compared to the end of the third quarter led to a $15 million foreign exchange loss on the translation of Canadian dollar net monetary assets, compared to a loss of $4 million in the fourth quarter of 2012.
We recorded a $22 million income tax benefit on a loss before taxes of $24 million in the fourth quarter of 2013, compared to a $29 million benefit on a loss before taxes of $73 million in the same period of 2012. The fourth quarter 2013 income tax benefit reflected a favorable adjustment to valuation allowances of $10 million, as well as a decrease in certain state-related deferred income tax liabilities. The fourth quarter 2012 income tax benefit reflected a favorable net adjustment for valuation allowances of $9 million, mainly as a result of an internal reorganization of our U.S. Fibrek subsidiaries.
2012 vs. 2011
Operating (loss) income variance analysis
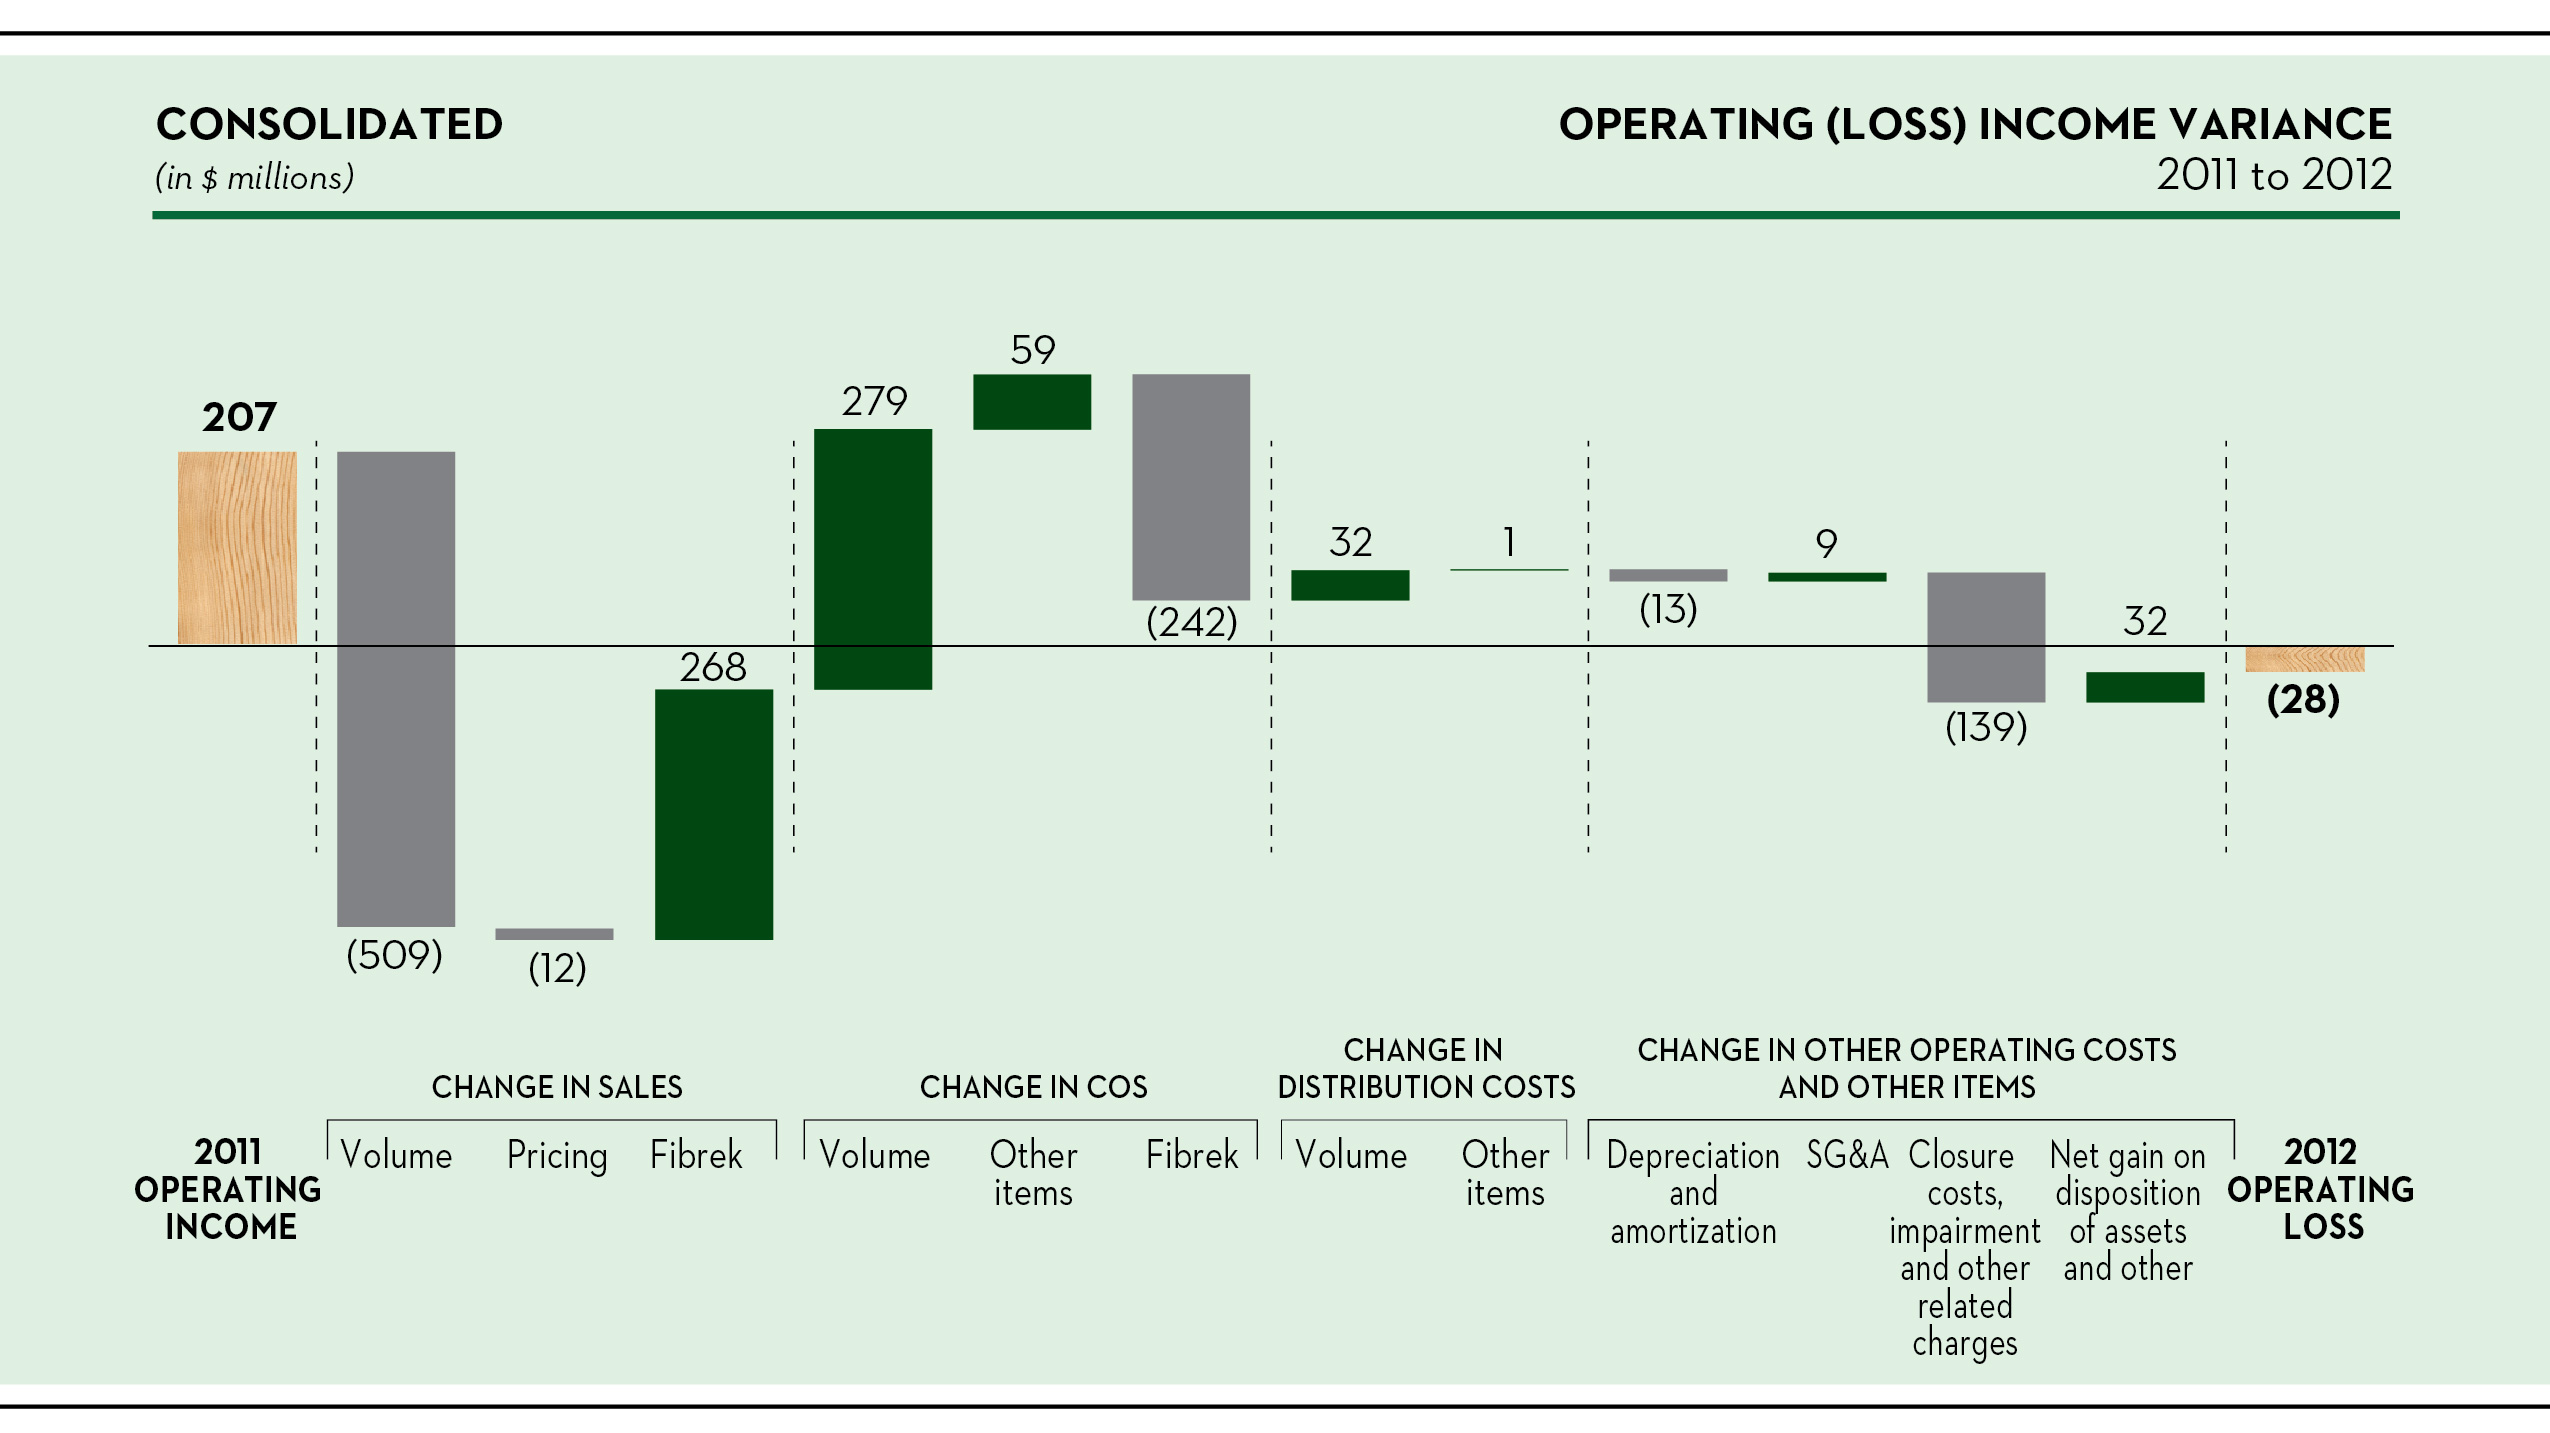
33
Sales
Sales decreased by $253 million in 2012, or 5.3%, to $4,503 million, led by a $509 million decline in volume across all grades and a net $12 million reduction in pricing, as more fully described in the segment variance analysis below. The decline was partly offset with the inclusion of Fibrek sales ($268 million). In light of challenging market conditions, the non-Fibrek volume decline reflects additional market downtime and our ongoing efforts to focus production in our most cost-effective mills, and drive better efficiency by restructuring and reducing labor costs. This fits into our strategy of managing production and inventory levels, selling only profitable tons, and maintaining world-class operational standards.
Cost of sales, excluding depreciation, amortization and distribution costs
COS improved by $96 million in 2012 compared to 2011, or $59 million net of Fibrek and the volume effects. COS was favorably influenced by the slightly weaker Canadian dollar compared to the U.S. dollar ($24 million) and a net reduction in manufacturing costs ($37 million), including:
• | lower costs for energy ($44 million) as a result of favorable pricing and our energy saving initiatives; |
• | lower labor and pension costs ($34 million); |
• | favorable recovered paper pricing ($21 million); |
• | the idling of the Mersey facility in June ($18 million); |
• | other operational cost improvements ($17 million); and |
• | favorable inventory adjustment as a result of increasing market prices for lumber products ($6 million). |
These favorable effects to COS were offset by costs associated with the start-up of closed mills and our capacity reduction initiatives ($25 million); higher log costs ($23 million), including stumpage fees; and increased coating and chemicals costs ($17 million). Compared to 2011, segment COS was also unfavorably affected by the loss of power sales income as a result of our sale of ACH Limited Partnership, or “ACH”, in 2011 ($19 million), by non-cash inventory obsolescence charges for slow-moving spare parts ($15 million) over the course of the year, offset by the benefit of a 2010 NIER program rebate recorded in 2011 ($8 million).
We joined the Northern Industrial Electricity Rate Program, or “NIER program”, during the second quarter of 2011, retroactive to the program’s April 1, 2010, start date. Under the program, we earned rebates on electricity purchased and consumed by our northern Ontario pulp and paper mills, subject to certain conditions. These rebates, which effectively reduce our energy costs, are available until the program expires in April of 2016. Of the rebates we recorded in 2011, $8 million related to 2010.
Depreciation and amortization
Depreciation and amortization increased by $13 million in 2012, mainly as a result of the acquisition of Fibrek’s assets.
Selling, general and administrative expenses
SG&A was $9 million lower in 2012 compared to 2011, as we collected a refund of certain group benefit premiums paid in prior years ($11 million) and recorded lower severance and transition costs ($8 million). These favorable changes to SG&A were partially offset by higher special project costs ($6 million), including Fibrek, and the SG&A associated with the addition of Fibrek.
Closure costs, impairment and other related charges
We recorded closure costs, impairment and other related charges of $185 million in 2012, $139 million higher than in 2011, as a result of our asset optimization initiatives during the year, including the idling and sale of operations in Mersey, Nova Scotia, the idling of a kraft pulp mill and paper machine in Fort Frances and the closure of a paper machine in Laurentide. Our major initiatives in 2011 included machine closures in Coosa Pines, Baie-Comeau and Kénogami as well as restructurings in our Mokpo and Mersey facilities.
Net gain on disposition of assets
We recognized a net gain on disposition of assets of $35 million in 2012, compared to $3 million in 2011, mainly as a result of the sale of timberlands in Nova Scotia in the first quarter.
34
Net income variance analysis
Net income in 2012 was $1 million, or $0.01 per share, a decrease of $46 million, or $0.47 per share, compared to net income in 2011 of $47 million, or $0.48 per diluted common share.
Interest expense
Interest expense decreased by $29 million, to $66 million, in 2012 from $95 million in 2011. The decrease related to the elimination of ACH’s debt in connection with the sale of our interest ($7 million) and the lower principal amount of senior secured notes as a result of redemptions, including $179 million in June 2011, an additional $85 million in November of that year and $85 million in October of 2012.
Other income (expense), net
Other income, net, was $22 million in 2012, compared to an expense of $48 million in 2011. The change of $70 million includes a foreign exchange gain (compared to a 2011 loss) on the translation of Canadian dollar net monetary assets to U.S. dollars ($38 million) and lower post-emergence costs ($36 million), which represented legal and other professional fees for the resolution and settlement of disputed creditor claims and other post-emergence activities.
Income taxes
We recorded a $39 million income tax benefit in 2012, on a loss before income taxes of $72 million, $14 million more than the expected $25 million benefit calculated using the federal statutory income tax rate of 35%. Our effective tax rate for the year was therefore 54%. This stems from the favorable effects of reorganization-related and other tax adjustments of $13 million, foreign exchange of $10 million, research and development tax incentives of $8 million and adjustments for unrecognized tax benefits of $5 million, offset by a net increase in valuation allowances of $24 million. This net increase in valuation allowances was primarily due to the costs associated with the idling of our Mersey operations before the assets were sold and an internal reorganization of our U.S. Fibrek subsidiaries. In 2011, our income tax provision was $19 million, on income before income taxes of $64 million, resulting in an effective tax rate of 30%. The provision included a favorable adjustment to reserves for unrecognized tax benefits of $63 million on the completion of certain tax authority examinations, mostly offset by the unfavorable effects of prior year reorganization-related tax adjustments of $38 million, foreign exchange of $9 million, and an increase in valuation allowances of $15 million on certain deferred income tax benefits we no longer expected to realize.
Segment Earnings
We manage our business based on the products we manufacture. Our reportable segments correspond to our principal product lines: newsprint, specialty papers, market pulp and wood products. As of the fourth quarter, the results from our coated papers operations have been integrated with the specialty papers segment. This better reflects management’s internal analysis, given the increasingly high degree of substitution with supercalender grades, and the diminishing percentage coated papers represents in our product portfolio. Comparative information has been modified to conform to this revised segment presentation.
We do not allocate any of the income or loss items following “operating (loss) income” in our consolidated statements of operations to our segments because those items are reviewed separately by management. Similarly, we do not allocate to the segments closure costs, impairment and other related charges, severance costs, inventory write-downs related to closures, startup costs of idled mills, net gain on disposition of assets, transaction costs, as well as other discretionary charges or credits. We also exclude certain corporate items from the segments, and present those separately as “corporate and other,” consistent with how management analyzes the results.
We allocate SG&A to the segments, with the exception of severance costs and certain other discretionary charges and credits, which are presented under corporate and other. Depreciation and amortization is also allocated to our segments.
35
NEWSPRINT
Highlights
Years Ended December 31, | ||||||||||||
(in millions, except where otherwise stated) | 2013 | 2012 | 2011 | |||||||||
Sales | $ | 1,473 | $ | 1,627 | $ | 1,816 | ||||||
Operating income (1) | 40 | 97 | 89 | |||||||||
EBITDA (2) | 113 | 169 | 162 | |||||||||
(in thousands of metric tons) | ||||||||||||
Shipments | 2,392 | 2,491 | 2,753 | |||||||||
Downtime | 141 | 260 | 102 | |||||||||
Inventory at end of period | 99 | 90 | 78 | |||||||||
(1) | Net income including noncontrolling interests is equal to operating income in this segment. |
(2) | EBITDA, a non-GAAP financial measure, is reconciled below. For more information on the calculation and reason we include this measure, see note 1 under “Results of Operations – Consolidated Earnings – Selected Annual Financial Information” above. |
Years Ended December 31, | ||||||||||||
(in millions) | 2013 | 2012 | 2011 | |||||||||
Net income including noncontrolling interests | $ | 40 | $ | 97 | $ | 89 | ||||||
Depreciation and amortization | 73 | 72 | 73 | |||||||||
EBITDA | 113 | 169 | 162 | |||||||||
Industry trends

Source: Pulp & Paper Products Council (or “PPPC”)
Total North American demand for newsprint fell by 10% in 2013, with a 10% reduction in demand from newspaper publishers and 6% from other users. Globally, demand was down by 5%; Western Europe was down by 6% and Latin America by 7%, but demand was up 7% in India. An 11% increase in exports helped North American producers ship only 4% less overall than last year, with a 31% increase in shipments to Asia and 2% to Latin America. Accordingly, the shipment-to-capacity ratio in North America remained at 92% for the year, compared to the global average of 90%.
36
Operational Performance

2013 vs. 2012
Operating income variance analysis

Sales
Newsprint sales were $1,473 million, down by $154 million, or 9%, as a result of a 6% drop in average transaction price, or $37 per metric ton, and a 4% reduction in shipments, or 99,000 metric tons. The drop in shipments reflects our initiatives to optimize mill assets in response to changing market dynamics. As a result, we’ve reduced our annualized capacity by 285,000 metric tons, representing:
• | the closure, in the second quarter of 2012, of the Mersey, Nova Scotia, newsprint mill; and |
• | the idling of the Calhoun newsprint machine, net of the corresponding restart of the Gatineau newsprint mill in the second quarter of 2013. |
Among other advantages, the Gatineau mill benefits from a more competitive cost position, in part due to its ability to make external power sales from its cogeneration facility.
37
We took 79,000 metric tons less downtime in 2013, not including 2012 downtime at the Mersey mill (40,000 metric tons), which represents a net capacity reduction. Our export volume represented 44% of total shipments, compared to 41% in 2012.
Cost of sales, excluding depreciation, amortization and distribution costs
Segment COS improved by $94 million in 2013. In addition to the effect of lower volume and the weaker Canadian dollar, there was a $36 million improvement in manufacturing costs, which was favorably affected by:
• | asset optimization initiatives and lower labor costs because of restructuring initiatives ($31 million); and |
• | external sales of power from our new cogeneration facilities, and lower chip and recovered paper pricing ($29 million). |
Manufacturing costs were unfavorably affected by:
• | higher maintenance costs ($8 million); |
• | higher fuel energy costs, mostly because of natural gas pricing ($7 million); and |
• | the receipt of insurance proceeds in 2012 for the 2011 roof collapse at our Clermont mill ($7 million). |
Distribution costs
Excluding the effect of volume, distribution costs rose by $9 million, mostly as a result of an increase in our export business from North American mills and the closure of the Calhoun newsprint machine.
Selling, general and administrative expenses
Segment SG&A fell by $5 million as a result of higher allocation to the market pulp segment following the acquisition of Fibrek.
2012 vs. 2011
Operating income variance analysis

38
Sales
In 2012, newsprint sales decreased $189 million, or 10%, to $1,627 million, primarily as a result of a 262,000 metric ton decrease in shipments and a $6 per metric ton reduction in average transaction price.
Shipments were down as a result of our efforts to control finished goods inventory and to manage our exposure to newsprint export markets pressured by the strong U.S. dollar. We took 158,000 metric tons more downtime in 2012 than in 2011, and we indefinitely idled, and subsequently sold, our export-focused Mersey newsprint mill, reducing our annual capacity by approximately 250,000 metric tons.
Cost of sales, excluding depreciation, amortization and distribution costs
Segment COS improved by $173 million in 2012, or $79 million, net of the impact of lower volume and the $11 million positive effect of the weaker Canadian dollar, including:
• | lower costs of power and fuel on lower natural gas pricing and energy saving initiatives ($22 million); |
• | favorable recovered paper pricing ($20 million); |
• | the idling of the Mersey facility in June ($18 million); |
• | lower labor costs as a result of various restructuring initiatives ($16 million); |
• | other operational cost improvements ($13 million); and |
• | favorable fiber costs, including kraft usage and lower pricing for wood chips ($7 million). |
Compared to 2011, segment COS was also favorably affected with the receipt of insurance proceeds ($7 million) for the 2011 roof collapse at our Clermont mill, but it was unfavorably affected by the loss of power sales income as a result of our sale of ACH in 2011 ($19 million), a non-cash obsolescence provision for slow-moving spare parts ($6 million) and the benefit of a 2010 NIER rebate recorded in 2011 ($5 million).
SPECIALTY PAPERS
Highlights
Years Ended December 31, | ||||||||||||
(in millions, except where otherwise stated) | 2013 | 2012 | 2011 | |||||||||
Sales | $ | 1,366 | $ | 1,562 | $ | 1,813 | ||||||
Operating income (1) | 35 | 85 | 122 | |||||||||
EBITDA (2) | 112 | 168 | 206 | |||||||||
(in thousands of short tons) | ||||||||||||
Shipments | 1,837 | 2,054 | 2,410 | |||||||||
Downtime | 188 | 192 | 96 | |||||||||
Inventory at end of period | 96 | 82 | 94 | |||||||||
(1) | Net income including noncontrolling interests is equal to operating income in this segment. |
(2) | EBITDA, a non-GAAP financial measure, is reconciled below. For more information on the calculation and reason we include this measure, see note 1 under “Results of Operations – Consolidated Earnings – Selected Annual Financial Information” above. |
Years Ended December 31, | ||||||||||||
(in millions) | 2013 | 2012 | 2011 | |||||||||
Net income including noncontrolling interests | $ | 35 | $ | 85 | $ | 122 | ||||||
Depreciation and amortization | 77 | 83 | 84 | |||||||||
EBITDA | 112 | 168 | 206 | |||||||||
39
Industry trends

Source: PPPC
North American demand for uncoated mechanical papers rose by 3% in 2013, with a 14% increase in demand for high-gloss (supercalender) grades, as certain customers substituted down from coated mechanical grades. Demand was down by 3% for standard grades. The industry shipment-to-capacity ratio was 92% for 2013, unchanged from 2012.

Source: PPPC
Demand for coated mechanical grades was down 7% in the year. After being considerably higher through three quarters, imports fell significantly in the fourth quarter, finishing the year down 11% overall. The industry shipment-to-capacity ratio dropped 4% in 2013, to 89%.
Operational Performance

40
2013 vs. 2012
Operating income variance analysis
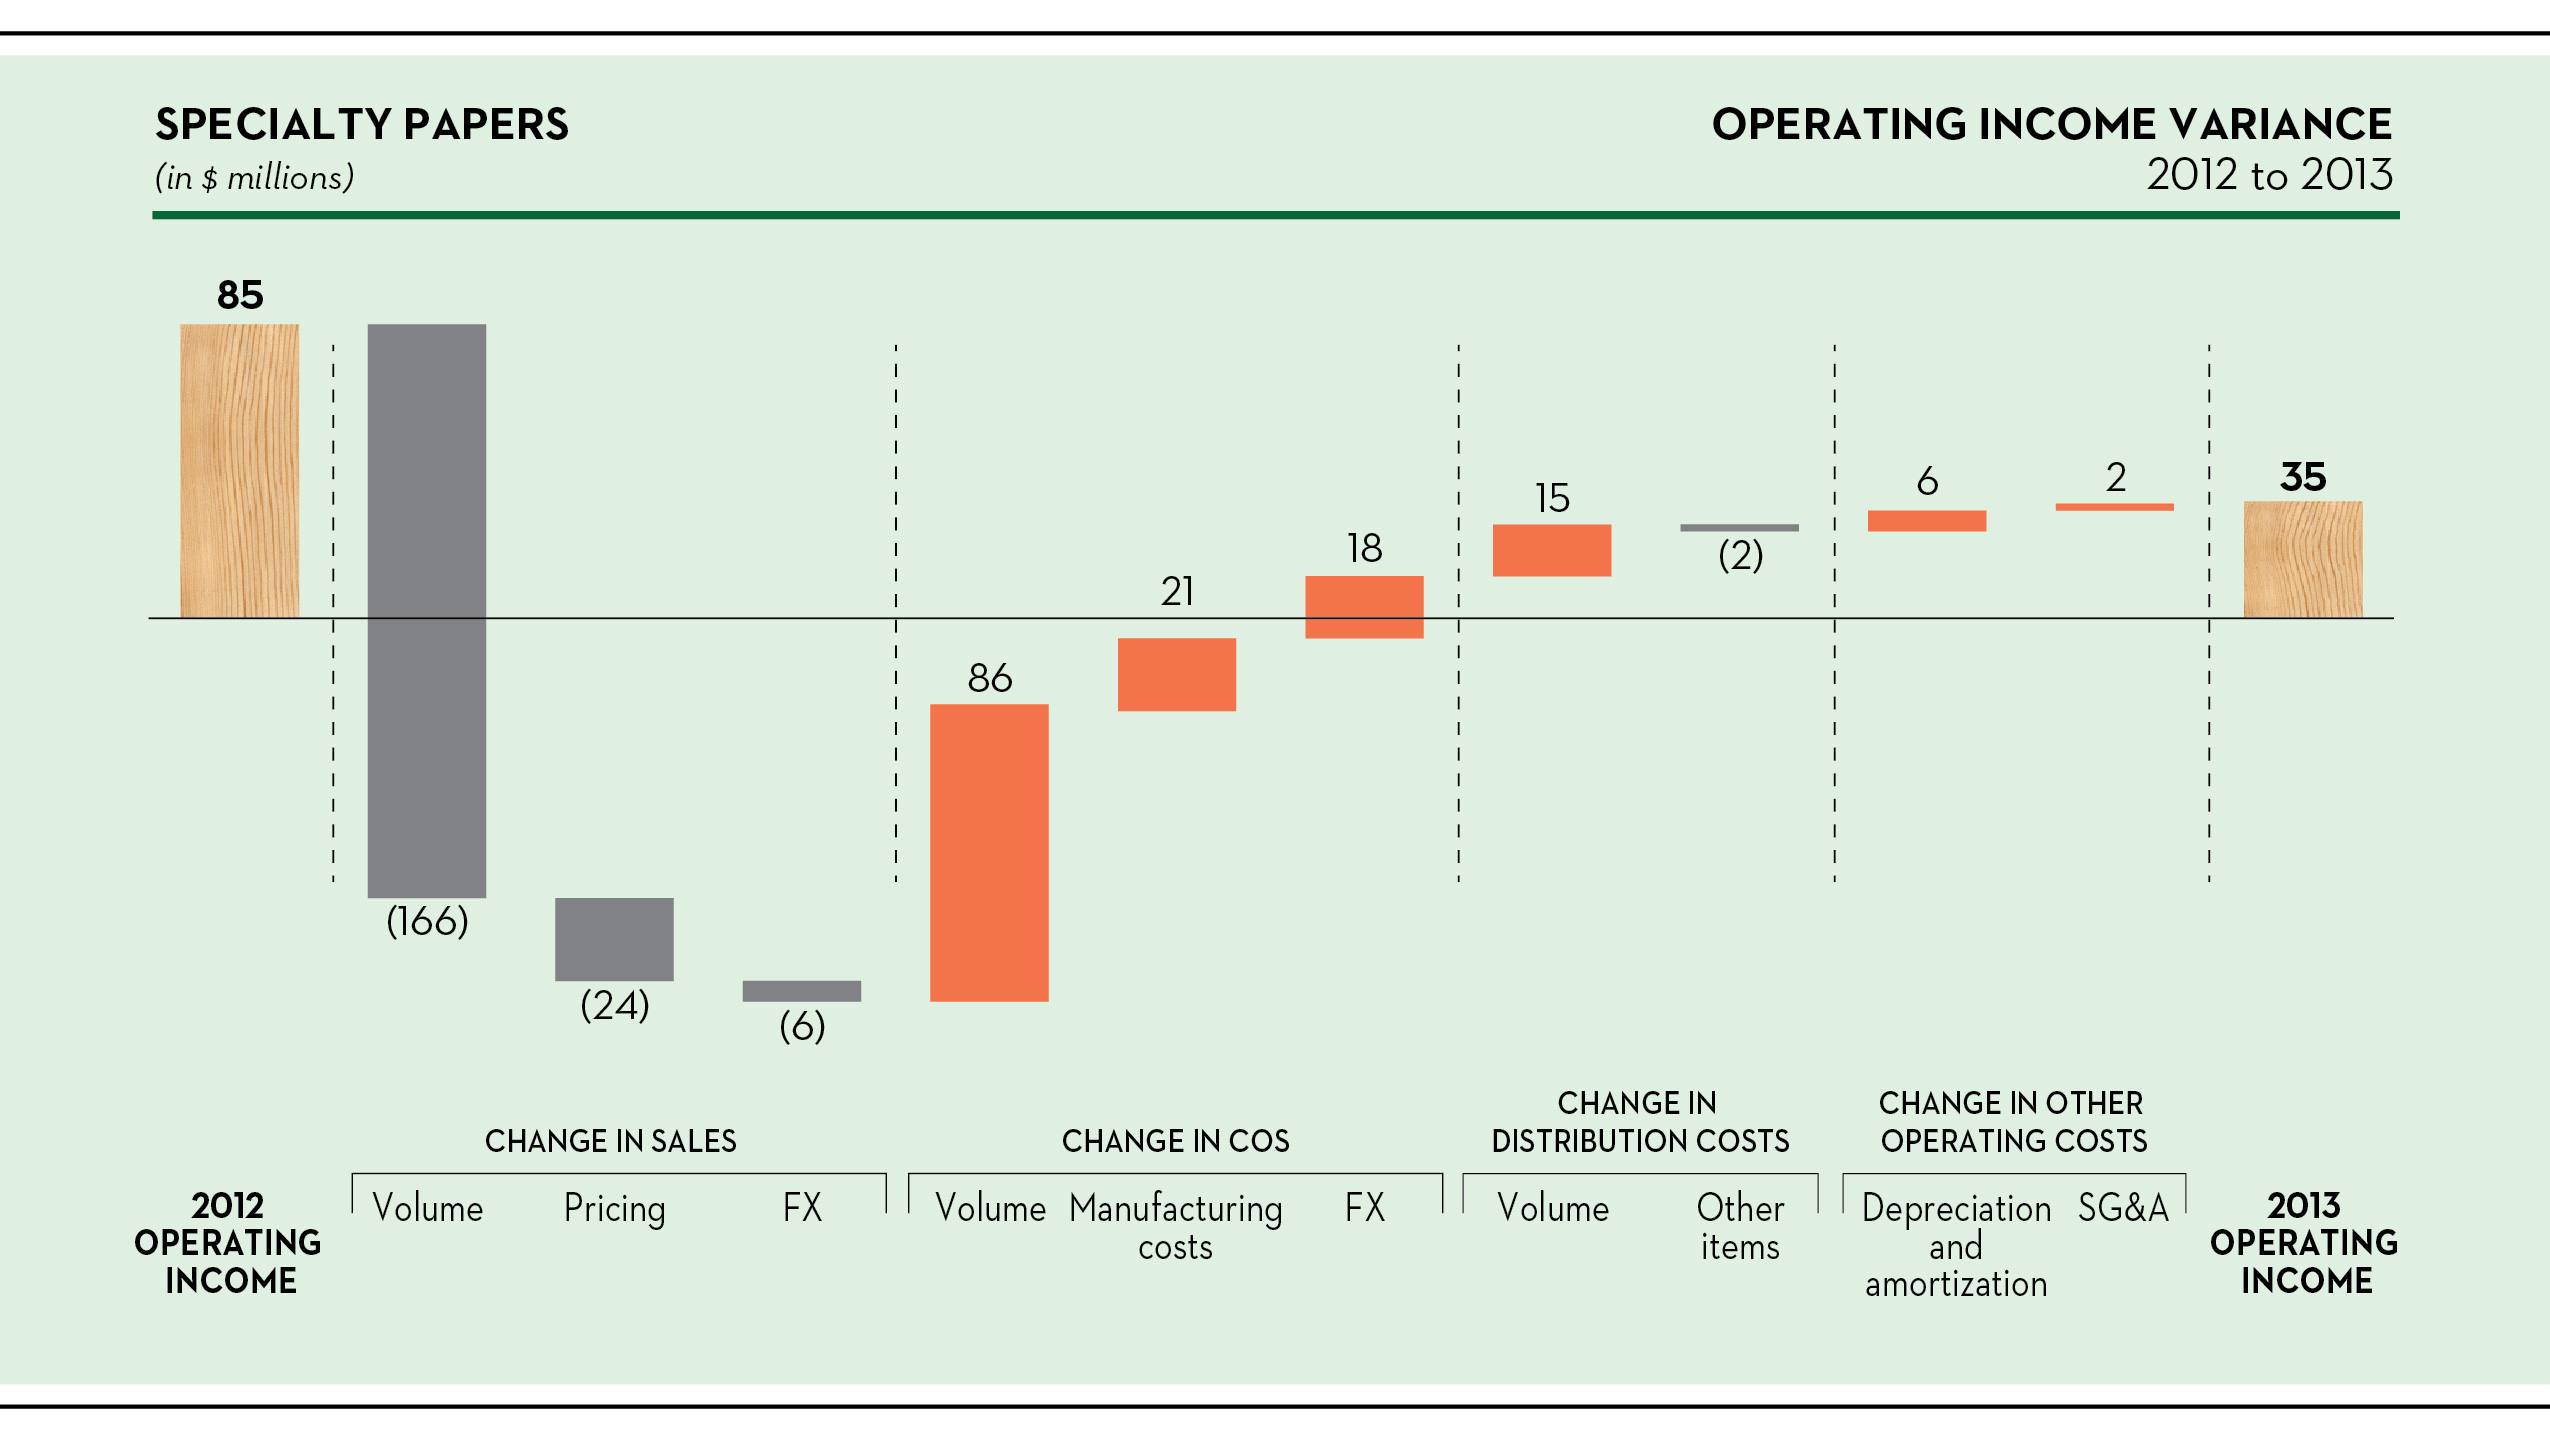
Sales
Specialty papers sales were $1,366 million in 2013, a $196 million decrease, or 13%, reflecting the unfavorable effect of a 197,000 metric ton (217,000 short tons) decrease in shipments and a 2% drop in average transaction price, or $16 per short ton. The drop in shipments reflects our efforts to optimize the asset base, maximizing the utilization of our most cost-effective mills and streamlining production to adapt to changing market dynamics. As a result, we’ve reduced our annualized capacity by 220,000 metric tons (243,000 short tons), representing:
• | the indeterminate idling of a coated paper machine at our Catawba mill (June 2012); |
• | the indefinite idling of a high-bright and book paper machine at our Fort Frances mill (November 2012); and |
• | the permanent closure of a high-gloss paper machine at our Laurentide mill, and the corresponding restart of the Dolbeau high-gloss paper machine (October 2012). |
Not including 125,000 metric tons (138,000 short tons) of 2012 downtime at Catawba and Fort Frances, which represents net capacity reductions, we took 16,000 metric tons (18,000 short tons) less downtime in 2013.
Cost of sales, excluding depreciation, amortization and distribution costs
Segment COS improved by $125 million in 2013. Other than the effect of volume and the favorable effect of the weaker Canadian dollar, manufacturing costs improved by $21 million as a result of:
• | external sales of power from our new cogeneration facilities and lower labor costs as a result of restructuring initiatives ($15 million); |
• | more efficient fiber usage and lower chip and recovered paper pricing ($15 million); |
• | lower electricity costs, mostly due to lower consumption in the U.S. southeast ($9 million); |
• | lower usage of coating chemicals ($6 million); and |
• | the receipt in 2013 of a business interruption insurance claim relating to a 2012 fire at our Dolbeau facility ($3 million); |
41
partially offset by:
• | higher unscheduled maintenance and repair costs ($16 million); |
• | higher wood costs in the U.S. southeast, including as a result of wet weather and usage ($6 million); and |
• | higher fuel energy costs, mostly because of higher natural gas prices ($5 million). |
Depreciation and amortization
Depreciation and amortization decreased by $6 million, reflecting lower depreciation as a result of the reduced carrying value of idled assets.
2012 vs. 2011
Operating income variance analysis
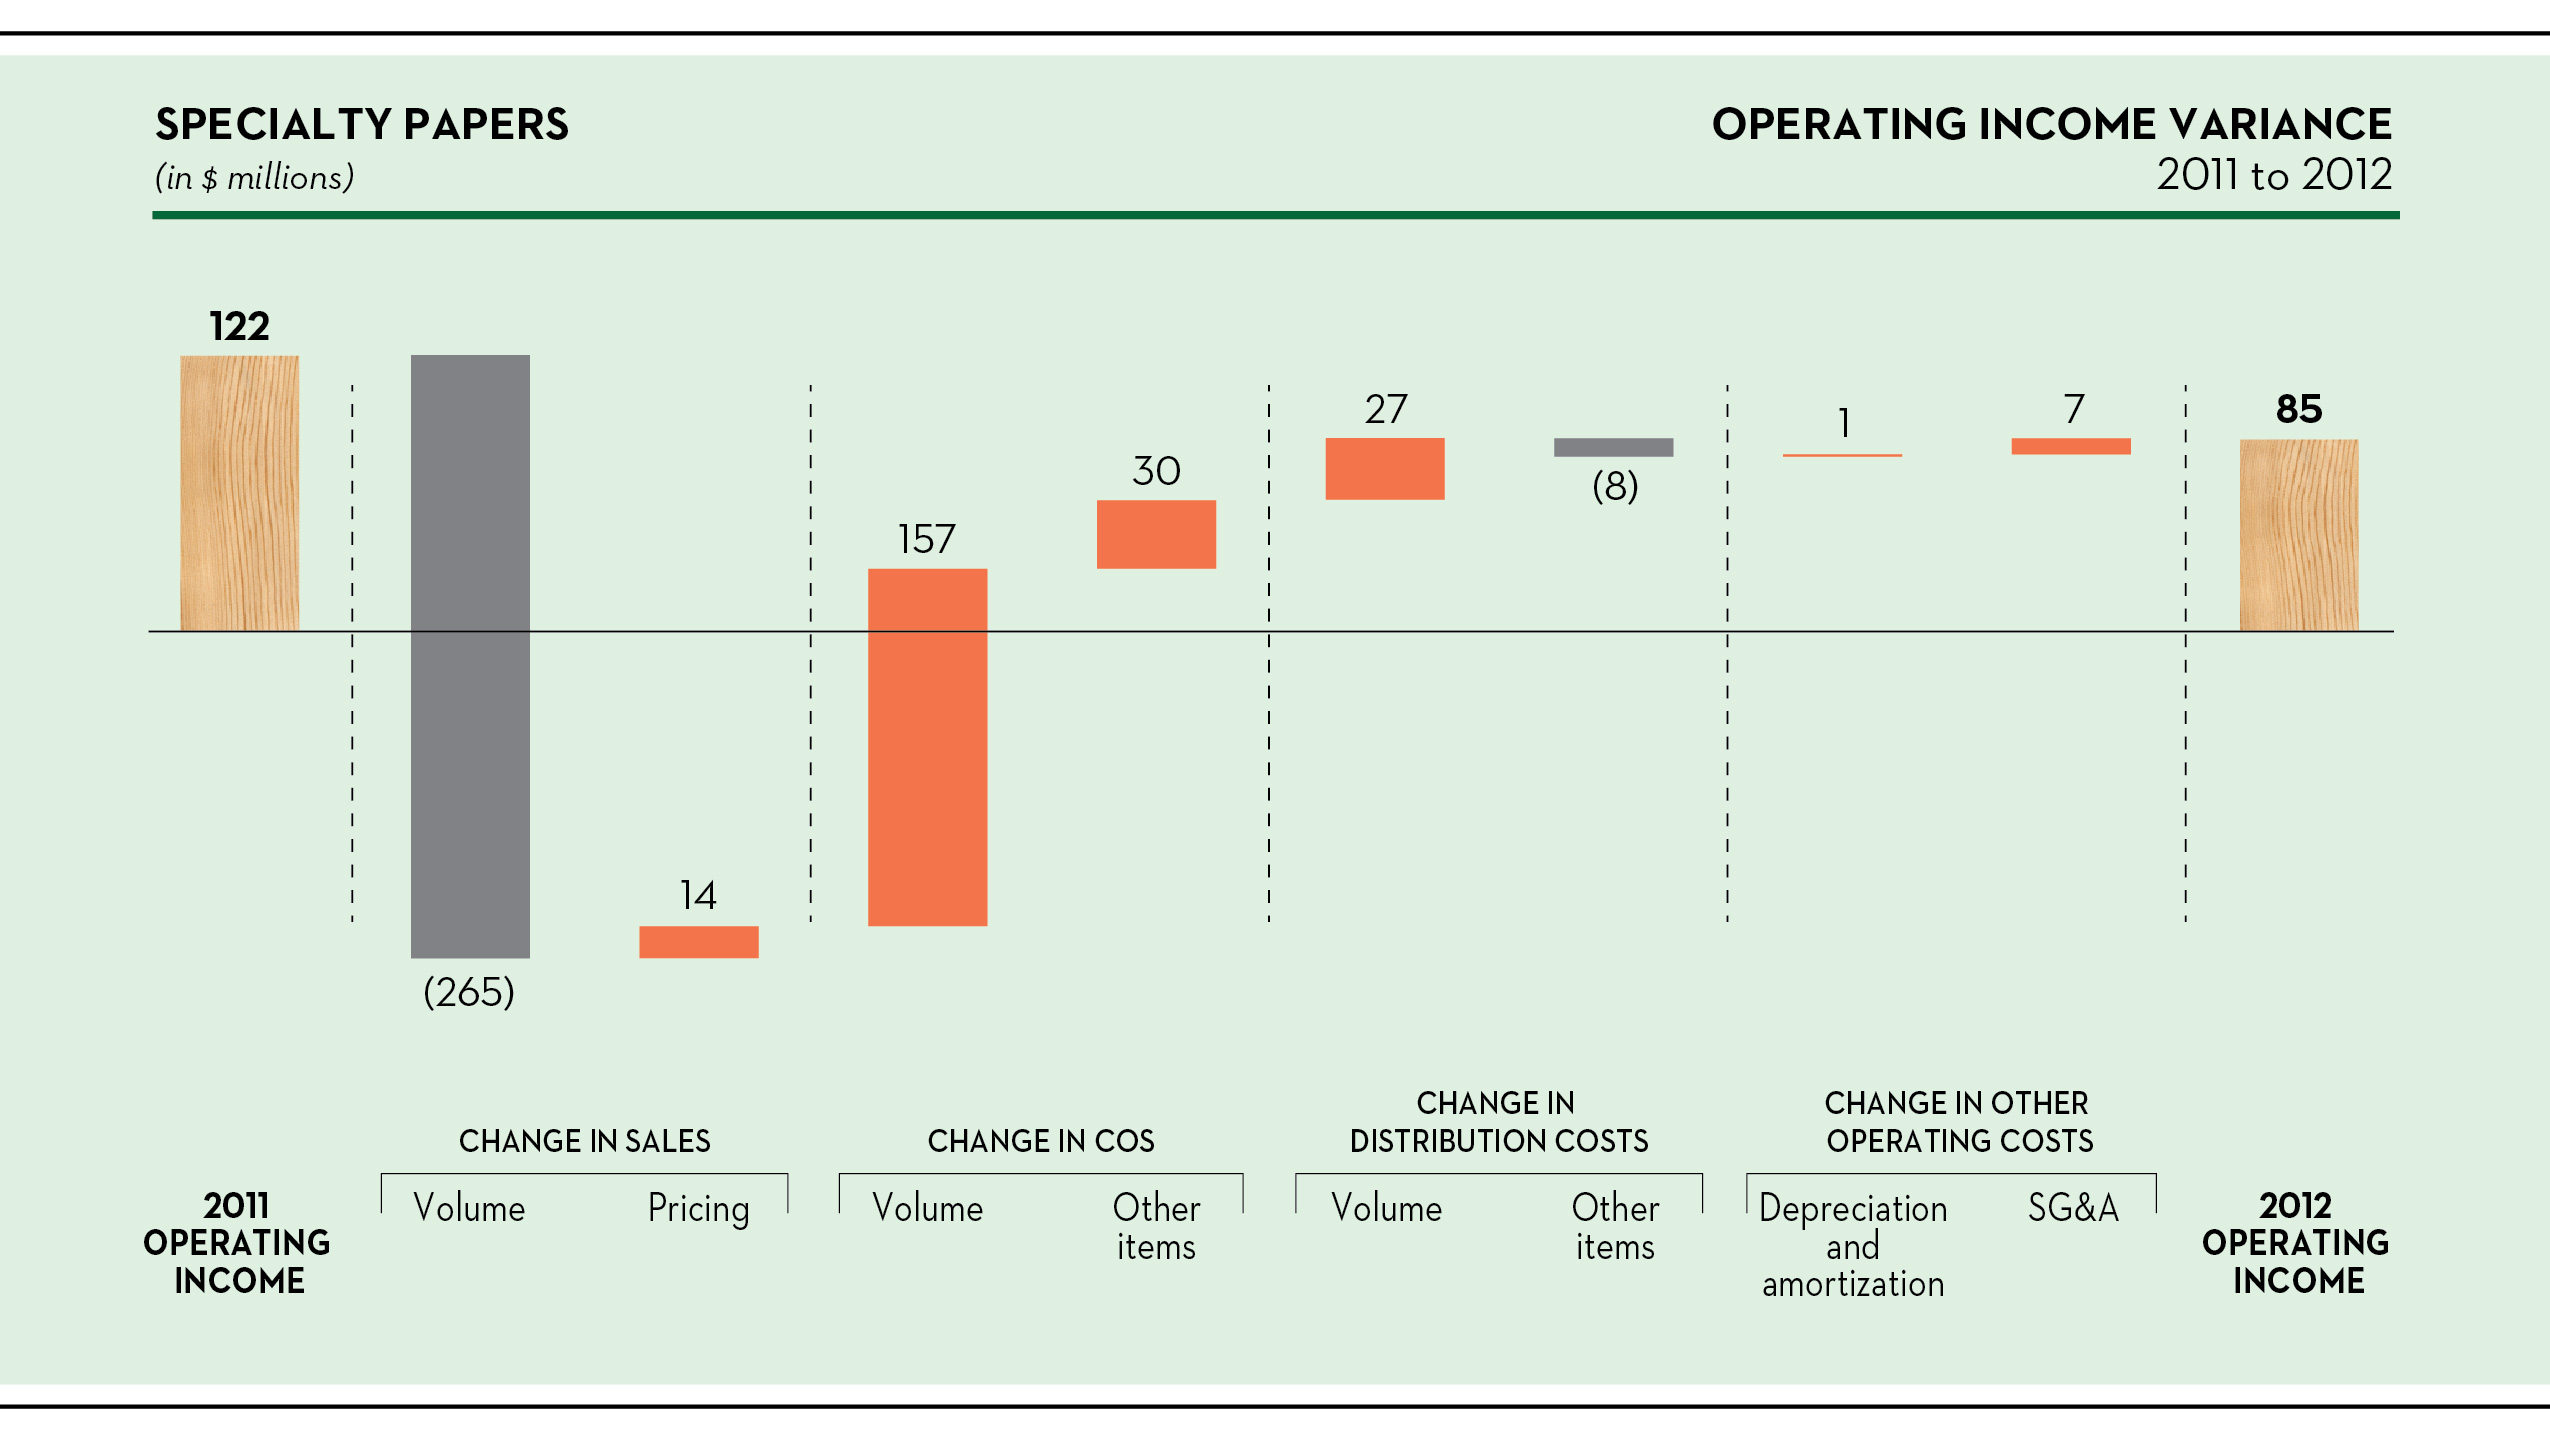
Sales
Specialty paper sales decreased $251 million, or 14%, to $1,562 million in 2012, reflecting the unfavorable effect of a 323,000 metric ton (356,000 short ton) decrease in shipments ($265 million) and the favorable impact of a $8 per short ton increase in average transaction price ($14 million).
We optimized our asset base in the segment as part of our ongoing efforts to manage production and inventory levels and to focus production in our most cost-effective mills. While we took only 87,000 additional metric tons (96,000 short tons) of downtime in 2012 compared to 2011, we adjusted our network with the following capacity initiatives:
• | closure of one paper machine at Kénogami (December 2011); |
• | indeterminate idling of one paper machine at Catawba (June 2012); |
• | restart of Dolbeau (October 2012); |
• | closure of one paper machine at Laurentide (November 2012); and |
• | idling of one paper machine at Fort Frances (November 2012). |
These adjustments resulted in a net decrease of approximately 222,000 metric tons (246,000 short tons) of operating capacity on an annualized basis.
42
Cost of sales, excluding depreciation, amortization and distribution costs
Segment COS decreased $187 million in 2012. Other than the impact of volume and the weaker Canadian dollar, COS was favorably influenced by the positive effects of:
• | lower costs for power and steam ($17 million); |
• | lower labor and benefits costs ($10 million) as a result of various restructuring initiatives; |
• | a decline in kraft usage ($4 million); and |
• | lower fiber costs ($3 million) |
partially offset by:
• | higher unscheduled maintenance and repair costs ($18 million); |
• | higher wood costs in the U.S. southeast due to the wet weather ($8 million); |
• | higher costs for coating and other chemicals ($6 million); |
• | a non-cash obsolescence provision for slow-moving spare parts ($5 million); |
• | and additional costs associated with the ramp-up of operations at the Dolbeau facility ($4 million). |
Distribution costs
Segment distribution costs decreased $19 million in 2012 as a result of the lower volume, offset by increased unit costs ($8 million) as a result of delays in Dolbeau’s start-up, which led to more costly modes of transportation to meet delivery deadlines.
Selling, general and administrative expenses
We allocated less SG&A to the segment in 2012 due to the reductions in operating capacity as well as the higher allocation to the market pulp segment as a result of the Fibrek acquisition.
MARKET PULP
Highlights
Years Ended December 31, | ||||||||||||
(in millions, except where otherwise stated) | 2013 | 2012 | 2011 | |||||||||
Sales | $ | 1,053 | $ | 814 | $ | 659 | ||||||
Operating income (loss) (1) | 42 | (43 | ) | 91 | ||||||||
EBITDA (2) | 94 | 1 | 121 | |||||||||
(in thousands of metric tons) | ||||||||||||
Shipments | 1,583 | 1,254 | 902 | |||||||||
Downtime | 51 | 300 | 97 | |||||||||
Inventory at end of period | 81 | 121 | 79 | |||||||||
(1) | Net income (loss) including noncontrolling interests is equal to operating income (loss) in this segment. |
(2) | EBITDA, a non-GAAP financial measure, is reconciled below. For more information on the calculation and reason we include this measure, see note 1 under “Results of Operations – Consolidated Earnings – Selected Annual Financial Information” above. |
Years Ended December 31, | ||||||||||||
(in millions) | 2013 | 2012 | 2011 | |||||||||
Net income (loss) including noncontrolling interests | $ | 42 | $ | (43 | ) | $ | 91 | |||||
Depreciation and amortization | 52 | 44 | 30 | |||||||||
EBITDA | 94 | 1 | 121 | |||||||||
43
Industry trends

Source: PPPC
The chemical pulp market grew by over 1.5 million tons in 2013, up 3%. Regionally, North American demand was up 5%, China, 9%, while Western Europe was down 1%. Softwood mills operated at a strong 94% ratio in 2013.
Operational Performance

44
2013 vs. 2012
Operating income (loss) variance analysis

Sales
Sales in the market pulp segment were $1,053 million in 2013, an increase of $239 million, or 29%. The average transaction price was 2% higher in 2013, or $16 per metric ton. Shipments rose by 329,000 metric tons, or 26%. 263,000 metric tons of the increase relates to the three former Fibrek pulp mills, reflecting the additional four months of results given the timing of the acquisition, as well as more operating time at the Saint-Félicien mill in light of the extensive downtime taken in 2012 to improve its operational and environmental performance. Shipments from non-Fibrek mills rose by 8% as a result of stronger market conditions.
Not including downtime associated with the Fort Frances pulp mill, which represents a net capacity reduction, we took 147,000 metric tons less downtime in 2013 in light of the stronger market conditions and the extensive 2012 downtime at Saint-Félicien.
We idled the Fort Frances kraft pulp mill in November of 2012, reducing the production available for external sales by 63,000 metric tons on an annualized basis. The mill’s operational configuration was such that we did not believe it could be operated profitably following the loss of its key customer.
Cost of sales, excluding depreciation, amortization and distribution costs
Segment COS increased by $128 million in 2013, mainly as a result of our Fibrek acquisition.
Other than the effect of the weaker Canadian dollar, manufacturing costs improved by $24 million, mostly because of:
• | lower chip and recovered paper costs ($22 million); |
• | external power sales from the additional cogeneration capacity at the Saint-Félicien and Thunder Bay mills, and lower maintenance costs compared to the extensive catch-up maintenance at the Saint-Félicien mill in 2012 ($18 million); |
partially offset by:
• | higher wood costs in the U.S. southeast due to the wet weather ($8 million); and |
• | higher fuel energy costs, mostly because of higher natural gas prices ($8 million). |
45
Depreciation and amortization
Depreciation and amortization rose by $8 million, primarily as a result of the addition of the three Fibrek mills.
Selling, general and administrative expenses
Segment SG&A allocation rose by $5 million as a result of higher allocation to the segment following the acquisition of Fibrek.
2012 vs. 2011
Operating (loss) income variance analysis

Sales
Sales in the market pulp segment increased $155 million, or 24%, to $814 million in 2012. Shipments rose 352,000 metric tons, including the additional volume ($268 million) with our acquisition of Fibrek, which we began to consolidate in our results as of May. Excluding Fibrek, we experienced a $100 per metric ton decrease in average transaction price ($86 million) and a reduction in shipments compared to 2011 ($27 million). Overall, we took over 205,000 metric tons more downtime in the year, as we increased market downtime in response to softer market conditions compared to 2011, and as a result of downtime associated with the extensive maintenance outage and environmental work at Fibrek’s Saint-Félicien mill.We also idled our Fort Frances kraft pulp mill in November.
Cost of sales, excluding depreciation, amortization and distribution costs
Segment COS increased $249 million in 2012, mainly as a result of our acquisition of Fibrek ($242 million), partly offset by the favorable impact of lower volume. Unfavorable items included higher costs for chemicals ($11 million), maintenance and labor ($10 million), and, for Fibrek, $16 million of maintenance costs relating to the five-week outage at Saint-Félicien.
Depreciation and amortization
Primarily as a result of adding the three Fibrek mills to our asset base, segment depreciation and amortization increased by $14 million compared to 2011.
Selling, general and administrative expenses
SG&A increased $4 million as a result of higher allocation to the segment following the acquisition of Fibrek.
46
WOOD PRODUCTS
Highlights
Years Ended December 31, | ||||||||||||
(in millions, except where otherwise stated) | 2013 | 2012 | 2011 | |||||||||
Sales | $ | 569 | $ | 500 | $ | 468 | ||||||
Operating income (loss) (1) | 41 | 26 | (25 | ) | ||||||||
EBITDA (2) | 77 | 60 | 8 | |||||||||
(in millions of board feet) | ||||||||||||
Shipments | 1,480 | 1,442 | 1,586 | |||||||||
Downtime | 482 | 559 | 517 | |||||||||
Inventory at end of period | 123 | 101 | 124 | |||||||||
(1) | Net income (loss) including noncontrolling interests is equal to operating income (loss) in this segment. |
(2) | EBITDA, a non-GAAP financial measure, is reconciled below. For more information on the calculation and reason we include this measure, see note 1 under “Results of Operations – Consolidated Earnings – Selected Annual Financial Information” above. |
Years Ended December 31, | ||||||||||||
(in millions) | 2013 | 2012 | 2011 | |||||||||
Net income (loss) including noncontrolling interests | $ | 41 | $ | 26 | $ | (25 | ) | |||||
Depreciation and amortization | 36 | 34 | 33 | |||||||||
EBITDA | 77 | 60 | 8 | |||||||||
Industry trends

Source : U.S. Census Bureau
Actual U.S. housing starts in 2013 were 923,000, 18% higher than in 2012.
47
Operational Performance

2013 vs. 2012
Operating income variance analysis

Sales
Wood products sales were $569 million in 2013, a $69 million increase, or 14%, as a result of an 11% increase in average transaction price, or $37 per thousand board feet, and a 3% rise in shipments, or 38 million thousand board feet of lumber, both reflecting stronger market conditions.
Cost of sales, excluding depreciation, amortization and distribution costs
Segment COS rose by $45 million, or 12%. The effect of greater shipment volume offset the benefit of the weaker Canadian dollar, while manufacturing costs rose by $44 million because of:
• | higher log costs in the province of Québec ($25 million), including: higher stumpage fees, most of which was lumber market-price related, and other costs associated with the comprehensive modification of the forest tenure system in the province; and |
48
• | lower internal wood chip selling prices ($12 million). |
2012 vs. 2011
Operating income (loss) variance analysis

Sales
Wood products sales increased $32 million, or 7%, to $500 million in 2012. The principal favorable variance was an increase in average transaction price of $53 per thousand board feet, partially offset by a 144 million board feet reduction in shipments. The drop in shipments stems from lower production, including the closure of the Oakhill sawmill in Nova Scotia and downtime at certain Québec sawmills.
Cost of sales, excluding depreciation, amortization and distribution costs
Segment COS decreased $8 million in 2012, including the favorable impact of lower volume. Manufacturing costs were favorably influenced by lower maintenance costs ($8 million) due in part to the closure of the Oakhill sawmill, and a favorable inventory adjustment as a result of increasing market prices for lumber products ($6 million). They were unfavorably affected by: lower prices on chip sales ($8 million); higher stumpage costs ($17 million), which are directly related to lumber prices; and unfavorable fiber usage ($4 million) due to size and species mix.
Distribution costs
Segment distribution costs decreased $13 million in 2012 as a result of lower volumes ($7 million) and lower freight costs ($6 million).
49
CORPORATE AND OTHER
Highlights
Years Ended December 31, | ||||||||||||
(in millions) | 2013 | 2012 | 2011 | |||||||||
Cost of sales, excluding depreciation, amortization and distribution costs | $ | (44 | ) | $ | (37 | ) | $ | (14 | ) | |||
Depreciation and amortization | (5 | ) | — | — | ||||||||
Selling, general and administrative expenses | (24 | ) | (6 | ) | (13 | ) | ||||||
Closure costs, impairment and other related charges | (89 | ) | (185 | ) | (46 | ) | ||||||
Net gain on disposition of assets | 2 | 35 | 3 | |||||||||
Operating loss | $ | (160 | ) | $ | (193 | ) | $ | (70 | ) | |||
The table below shows the reconciliation of net loss including noncontrolling interests to EBITDA and adjusted EBITDA, which are non-GAAP financial measures. For more information on the calculation and reason we include these measures, see note 1 under “Results of Operations – Consolidated Earnings – Selected Annual Financial Information” above.
Years Ended December 31, | ||||||||||||
(in millions) | 2013 | 2012 | 2011 | |||||||||
Net loss including noncontrolling interests | $ | (797 | ) | $ | (198 | ) | $ | (232 | ) | |||
Interest expense | 51 | 66 | 95 | |||||||||
Income tax provision (benefit) | 524 | (39 | ) | 19 | ||||||||
Depreciation and amortization | 5 | — | — | |||||||||
EBITDA | $ | (217 | ) | $ | (171 | ) | $ | (118 | ) | |||
Foreign exchange translation loss (gain) | 24 | (17 | ) | 21 | ||||||||
Severance costs | — | 5 | 12 | |||||||||
Closure costs, impairment and other related charges | 89 | 185 | 46 | |||||||||
Inventory write-downs related to closures | 11 | 12 | 3 | |||||||||
Start up costs of idled mills | 32 | 13 | — | |||||||||
Net gain on disposition of assets | (2 | ) | (35 | ) | (3 | ) | ||||||
Net loss on extinguishment of debt | 59 | — | — | |||||||||
Transaction costs | 6 | 8 | 5 | |||||||||
Other (income) expense, net | (21 | ) | (5 | ) | 27 | |||||||
Adjusted EBITDA | (19 | ) | (5 | ) | (7 | ) | ||||||
2013 vs. 2012
Cost of sales, excluding depreciation, amortization and distribution costs
COS rose by $7 million, to $44 million, in 2013, which includes start-up costs at our Gatineau mill ($32 million) and inventory write-downs associated with idlings at Calhoun and Fort Frances ($11 million). In the same period of 2012, we incurred start-up costs at Dolbeau and Gatineau ($13 million), closed mill costs at those mills before they were later restarted ($12 million) and inventory write-downs in connection with the idlings at our Mersey, Fort Frances and Laurentide mills ($12 million).
Depreciation and amortization
Depreciation and amortization increased by $5 million, mainly because of the amortization of costs associated with the implementation of integrated business management software.
Selling, general and administrative expenses
SG&A was $18 million higher in 2013 largely because of credits we recorded in 2012, including a refund of certain group benefit premiums paid in prior years ($11 million).
50
Closure costs, impairment and other related charges
We recorded closure costs, impairment and other related charges of $89 million, compared to $185 million in the year-ago period. The current period included:
• | accelerated depreciation, severance and other costs associated with the idling of a newsprint machine at our Calhoun mill ($50 million); |
• | severance, pension curtailment loss and other closure costs associated with the extended market-related outage at the remaining Fort Frances paper machine ($13 million); |
• | long-lived asset impairment charges related to our U.S. recycling assets ($11 million); and |
• | accelerated depreciation, severance and other costs associated with other asset optimization and restructuring initiatives ($15 million). |
In the same period of 2012, we recorded:
• | long-lived asset impairment charges, severance costs, ongoing maintenance costs, and a pension plan curtailment and settlement loss as a result of idling the Mersey newsprint mill ($95 million); |
• | severance costs, pension plan curtailment and settlement loss as well as the write-down of assets associated with the idling of a paper and a pulp machine in Fort Frances and other costs ($45 million); |
• | accelerated depreciation and severance costs associated with the idling of a machine at our Laurentide mill ($22 million); |
• | severance costs and a pension curtailment loss associated with restructuring initiatives at our Baie-Comeau and Catawba mills ($8 million); and |
• | a settlement loss for lump sum payments to vested terminated participants in certain U.S. pension plans ($7 million). |
Net gain on disposition of assets
We recognized a net gain on disposition of assets of $2 million in 2013, compared to $35 million in 2012, mainly as a result of the sale of timberlands in Nova Scotia in the first quarter of 2012.
2012 vs. 2011
Cost of sales, excluding depreciation, amortization and distribution costs
COS rose by $23 million, to $37 million, in 2012. In 2012, we incurred start-up costs for our Dolbeau and Gatineau mills ($13 million), write-downs of inventory as a result of the capacity reduction initiatives at Mersey, Fort Frances and Laurentide ($12 million) and other costs related to closed mills ($12 million). By comparison, in 2011, we incurred costs related to closed mills ($9 million), write-downs of inventory ($3 million) with the elimination of paperboard production at our Coosa Pines paper mill and costs related to the permanent closure of a paper machine at our Kénogami paper mill.
Selling, general and administrative expenses
Corporate SG&A was $7 million lower in 2012 than in 2011, mainly as a result of a refund of certain group benefit premiums paid in prior years ($11 million), partly offset by additional transaction costs.
Closure costs, impairment and other related charges
We recorded closure costs, impairment and other related charges of $185 million in 2012, $139 million higher than in 2011, as a result of our asset optimization initiatives during the year, including the idling and sale of operations in Mersey, the idling of a kraft pulp mill and paper machine in Fort Frances, and the closure of a paper machine in Laurentide. Our major initiatives in 2011 included machine closures in Coosa Pines, Baie-Comeau and Kénogami, as well as restructurings in our Mokpo and Mersey facilities.
Net gain on disposition of assets
We recognized a net gain on disposition of assets of $35 million in 2012, compared to $3 million in 2011, mainly as a result of the sale of timberlands in Nova Scotia in the first quarter of 2012.
51
LIQUIDITY AND CAPITAL RESOURCES
Capital Resources
We rely on cash and cash equivalents, net cash provided by operations and the ABL credit facility to fund our operations, make pension contributions and to finance our working capital and capital expenditures.
As of December 31, 2013, we had cash and cash equivalents of $322 million and availability of $561 million under the ABL credit facility. As of December 31, 2013, our ABL credit facility was undrawn, but for ordinary course letters of credit. In our view, the Company has sufficient financial resources available to finance its business plan, meet its working capital requirements and maintain an appropriate level of capital spending.
Refinancing of Senior Secured Notes
On May 8, 2013, we completed the private offering of $600 million aggregate principal amount of 5.875% senior notes due 2023, or the “2023 notes.” The 2023 notes are unsecured and are guaranteed by substantially all of our U.S. subsidiaries. Interest on the 2023 notes is payable semi-annually on May 15 and November 15 of each year, beginning November 15, 2013.
We used the proceeds from the sale of the 2023 notes to purchase, on May 8, 2013, $496 million aggregate principal amount of our 10.25% senior secured notes due 2018, or the “2018 notes,” representing 99% of the outstanding amount, in connection with the tender offer and consent solicitation that expired on May 21, 2013. Aggregate consideration for the purchase was $584 million, including accrued and unpaid interest of $4 million. In connection with the refinancing, we entered into a supplemental indenture to eliminate substantially all of the restrictive covenants and certain events of default under the indenture and to release the collateral securing the obligations under the 2018 notes. We redeemed all of the remaining $5 million of outstanding principal amount of 2018 notes on October 8, 2013, at a redemption price of 103% of the principal amount, plus accrued and unpaid interest.
ABL Credit Facility
The ABL credit facility, which expires on October 28, 2016, is an asset-based, revolving credit facility with an aggregate lender commitment of up to $665 million. As amended, it includes a $60 million swingline sub-facility and a $200 million letter of credit sub-facility. It also provides for an uncommitted incremental loan facility of up to $200 million, subject to certain terms and conditions. Revolving loans and letters of credit under the facility are subject to borrowing base availability, which is calculated monthly on the basis of eligible accounts receivable and inventory, minus certain reserves. The facility was undrawn as of December 31, 2013, except for $39 million of ordinary course letters of credit; availability was $561 million.
Generally, our obligations under the facility are guaranteed by certain material subsidiaries and they are secured by first priority liens on accounts receivable, inventory and related assets.
Our borrowings under the ABL credit facility bear interest at a rate equal to a specified base rate, the Canadian prime rate or the Eurodollar rate, in each case plus an applicable margin. We pay a commitment fee from 0.375% to 0.50% per year, subject to monthly pricing adjustments, and a fee on outstanding letters of credit at a rate equal to the applicable margin in respect of Eurodollar borrowings, plus a facing fee, as agreed to in writing from time to time, and certain administrative fees.
Loans and unused commitments under the facility are voluntarily repayable, in whole or in part, at any time without premium or penalty. As recently amended, the facility does not include financial covenants, except for a minimum consolidated fixed charge coverage ratio if excess availability falls below the greater of: (i) $50 million and (ii) 10% of the lesser of (A) the total commitments and (B) the borrowing base then in effect. The requirement, as then in effect, was not triggered at any time in 2013 as excess availability was above these levels.
The ABL credit facility contains customary covenants for asset-based credit agreements of this type, and imposes certain restrictions, subject to a number of exceptions and qualifications, including limits on our ability to:
• | incur and repay indebtedness; |
• | incur liens; |
• | make certain restricted payments; |
• | make certain investments; |
• | merge, consolidate and dispose of assets; |
• | enter into transactions with affiliates; |
• | amend, modify or terminate the Canadian pension and benefit plans; and |
52
• | modify material indebtedness. |
The ABL credit facility also contains customary requirements to deliver financial statements, other reports and notices, as well as events of default, subject to grace periods and notice requirements.
The credit facility was amended as of February 25, 2014, to, among other things:
• | release the second priority liens on the collateral of the covered borrowers and guarantors previously pledged to secure the 2018 notes, with an ability to re-implement that second lien should we issue new secured debt with a second lien on the ABL collateral; |
• | reduce the excess availability thresholds that trigger a minimum consolidated fixed charge coverage ratio; |
• | increase the uncommitted incremental loan facility; |
• | improve our borrowing capacity by providing more flexibility under the debt incurrence covenant, including significant expansion to baskets for unsecured and secured debt, subject to certain conditions; and |
• | increase certain advance rates for purposes of calculating the borrowing base. |
The 2023 Notes
The 2023 notes are unsecured and are guaranteed by substantially all of our U.S. subsidiaries, all of which also guaranteed our 2018 notes. The 2023 notes were sold at an offering price of 99.062% of the principal amount. Interest on the notes is payable semi-annually on May 15 and November 15 of each year, beginning November 15, 2013.
The 2023 notes were issued pursuant to an indenture dated May 8, 2013, by and among the Company, the guarantors and Wells Fargo Bank, National Association, as trustee. The terms of the 2023 notes indenture impose certain restrictions, subject to a number of exceptions and qualifications, including limits on our ability to:
• | incur, assume or guarantee additional indebtedness; |
• | issue redeemable stock and preferred stock; |
• | pay dividends or make distributions or redeem or repurchase capital stock; |
• | prepay, redeem or repurchase certain debt; |
• | make loans and investments; |
• | incur liens; |
• | issue dividends, make loans or transfer assets from our subsidiaries; |
• | sell or otherwise dispose of assets, including capital stock of subsidiaries; |
• | consolidate or merge with or into, or sell substantially all of our assets to, another person; |
• | enter into transactions with affiliates; and |
• | enter into new lines of business. |
The 2023 notes will be redeemable, in whole or in part, at any time on or after May 15, 2017, at the redemption prices specified in the 2023 notes indenture, plus accrued and unpaid interest. Before that date, we may redeem some or all of the notes at a redemption price of 100% of the principal amount, plus accrued and unpaid interest and a “make-whole” premium. We may redeem up to 35% of the notes before May 15, 2016, using proceeds from certain equity offerings at a price of 105.875% of the principal amount. We could be required to make an offer to purchase the notes upon the sale of certain assets or upon a change of control.
In connection with the offering of the 2023 notes, we and the guarantors entered into a registration rights agreement, dated as of May 8, 2013, with the initial purchasers. Under the terms of the registration rights agreement, we agreed to use our commercially reasonable efforts to file with the SEC and cause to become effective a registration statement relating to an offer (which we refer to as the “exchange offer”) to: (i) exchange the 2023 notes for registered notes (which we refer to as the “exchange notes”), with substantially the same terms as the 2023 notes; and (ii) exchange the guarantees related to the 2023 notes for registered guarantees relating to the exchange notes, with substantially the same terms as the original guarantees. We have agreed to use our commercially reasonable efforts to cause the exchange offer to be completed within 400 days after the issuance of the 2023 notes. We have also agreed to file (and seek effectiveness of) a shelf registration statement, in certain circumstances, that would allow certain holders to offer some or all of the 2023 notes to the public.
53
If the exchange offer is not so completed, or if the shelf registration statement is not effective in the required circumstances, the annual interest rate on the 2023 notes will increase by 0.25% per annum for the first 90-day period following the event triggering the increase. The interest rate on the 2023 notes will increase by 0.25% per annum at the beginning of each subsequent 90-day period, up to a maximum of 1.0% additional interest per annum, until the exchange offer is completed or the shelf registration statement is filed, as applicable.
Flow of Funds
Summary of cash flows
A summary of cash flows for the years ended December 31, 2013, 2012 and 2011 was as follows:
Years Ended December 31, | ||||||||||||
(in millions) | 2013 | 2012 | 2011 | |||||||||
Net cash provided by operating activities | $ | 206 | $ | 266 | $ | 198 | ||||||
Net cash (used in) provided by investing activities | (151 | ) | (75 | ) | 245 | |||||||
Net cash provided by (used in) financing activities | 4 | (297 | ) | (393 | ) | |||||||
Net increase (decrease) in cash and cash equivalents | $ | 59 | $ | (106 | ) | $ | 50 | |||||
2013 vs. 2012
Cash provided by operating activities
We generated $60 million less cash from operating activities in 2013 compared to 2012. The change was unfavorably affected by:
• | higher pension contributions and OPEB payments in 2013 ($32 million); |
• | lower operating income, excluding the largely non-cash items such as closure costs, impairment and other related charges as well as depreciation and amortization, and the net gain on dispositions of assets ($27 million); and |
• | $13 million less cash generated from working capital. |
This was only partially offset by:
• | $14 million less in interest payments; and |
• | a 2013 distribution from the liquidation of a former U.K. subsidiary ($12 million). |
Cash used in investing activities
We used $151 million in investing activities in 2013, $76 million higher than in 2012. Other than the $8 million decrease in cash invested in fixed assets, the difference is almost entirely due to net favorable items in 2012, including:
• | a decrease in restricted cash due to the release of a tax indemnity given in connection with the sale of our interest in Manicouagan Power Company in 2009 ($76 million); and |
• | the proceeds from disposition of timberlands in Nova Scotia ($24 million); |
partially offset by:
• | the cash portion of the consideration paid for the acquisition of Fibrek ($24 million, net of cash acquired). |
Cash provided by (used in) financing activities
Financing activities provided $4 million in 2013, compared to a use of $297 in 2012, for a $301 million difference.
In 2013, we received proceeds of $594 million in connection with the issuance of the 2023 notes, which we used to repurchase $501 million of the outstanding 2018 notes and to pay $84 million as a tender offer premium. We also paid financing and credit facility fees of $9 million. We also received an $8 million payment from our former joint venture partner in CNC in connection with our acquisition of their interest.
In 2012, we paid $27 million in cash as part of the consideration to acquire shares of the noncontrolling interest in Fibrek, we repaid its debt ($112 million), we repurchased 5.6 million of our own shares under our share repurchase program ($67 million) and we redeemed $85 million of our 2018 notes.
54
2012 vs. 2011
Cash provided by operating activities
We generated $68 million more cash from operating activities in 2012 compared to 2011, despite a $235 million reduction in operating income, as described in more detail above. The improvement was primarily due to: lower pension contributions net of expense ($80 million) as a result of a $17 million reduction in contributions to U.S. plans; and, in 2011, the $20 million voluntary additional and $25 million accelerated contributions for the first half of 2012; partly offset by a $14 million increase in the cash component of closure costs, impairment and other charges.
Cash (used in) provided by investing activities
We used $75 million for investing activities in 2012, compared to $245 million provided by investing activities in 2011. The $320 million difference reflects lower proceeds from: the disposition of assets ($265 million), as a result of the sale of Mersey assets in 2012, compared to the 2011 disposition of our investment in ACH; an increase in investments in fixed assets ($72 million) and cash used, in 2012, in the acquisition of Fibrek ($24 million). These changes were partially offset by a decrease of restricted cash in 2012, compared to a small increase in 2011, due to the partial release of a tax indemnity in connection with the sale of our interest in MPCo, the effects of which led to a $78 million change.
Cash used in financing activities
Cash used in financing activities was $96 million lower than in 2011, to $297 million, mainly as a result lower debt payments ($156 million). In 2011, we redeemed $264 million of senior secured notes and a $90 million promissory note, partly with the proceeds of ACH. In 2012, we redeemed $85 million of senior secured notes and we repaid Fibrek’s debt ($112 million). The year over year variance was unfavorably affected by purchases of our shares of common stock ($67 million) and higher payments for the acquisition of noncontrolling interests ($12 million) with the acquisition of Fibrek in 2012, compared to the acquisition of the noncontrolling interest in Augusta Newsprint Company in 2011. 2012 also reflects the favorable effects of lower dividends and distribution to noncontrolling interests ($16 million).
2014 expectations
In 2014, we anticipate that we may use cash on hand to:
• | Make capital expenditures for compliance and maintenance of business activities of between $135 million and $160 million, plus between $75 million and $125 million for value-creating projects. |
• | We may consider other strategic opportunities, with a particular focus on those that reduce our cost position, improve our product diversification, provide synergies or allow us to expand into future growth markets. |
• | Subject to market conditions, repurchase up to the remaining $33 million authorized for share repurchases under our existing $100 million repurchase program. |
Credit Rating Risk
Although the ABL credit facility does not include any provision that would require material changes in payment schedules or terminations as a result of a credit rating downgrade, we believe our access to capital markets at a reasonable cost is determined in large part by credit quality. A credit rating downgrade could impact our ability to access capital markets.
December 31, | |||
2013 | 2012 | 2011 | |
Standard & Poor’s | |||
Senior secured notes rating | - | BB | BB- |
Long-term corporate credit rating | BB- | BB- | BB- |
Outlook | Stable | Stable | Stable |
Moody’s Investors Service | |||
Senior secured debt | Ba3 | Ba3 | B1 |
Corporate family rating | Ba3 | Ba3 | B1 |
Probability of default | Ba3 | Ba3 | B1 |
Outlook | Positive | Stable | Stable |
55
Subject to other factors affecting the credit markets as a whole, we believe our current ratings should provide a significant degree of flexibility in obtaining funds on competitive terms. These security ratings reflect the views of the rating agencies only. An explanation of the significance of these ratings can be obtained from each rating agency. The ratings are not a recommendation to buy, sell or hold securities. Any rating can be revised upward or downward or withdrawn at any time by a rating agency.
Employee Benefit Plans
Canadian pension funding
Funding relief measures
As a pre-condition to our emergence from the creditor protection proceedings in 2010, we entered into agreements with the provinces of Québec and Ontario to establish parameters concerning the funding of the aggregate solvency deficits in our material Canadian registered pension plans, which we refer to as the “affected plans,” until 2020. These plans represented approximately 75% of our unfunded pension obligations as of December 31, 2013. In exchange for certain undertakings, the provinces confirmed, before our emergence, their intention to adopt regulations specific to us, which we refer to as the “funding relief regulations,” to implement those parameters in respect of the affected plans.
As adopted in mid-2011, the funding relief regulations provide that corrective measures would be required if the aggregate solvency ratio in the affected plans fell below a prescribed level under the targets specified by the regulations as of December 31 in any year through 2014. Thereafter, supplemental contributions would be required if the aggregate solvency ratio in the affected plans fell below a prescribed level under the targets specified by the regulations as of December 31 in any year on or after 2015 for the remainder of the period covered by the regulations.
Solvency deficit
The aggregate solvency ratio calculation is based on a number of factors and assumptions, including the accrued benefits to be provided by the plans, interest rate levels, membership data and demographic experience. The assumptions used in the calculation are materially different from the assumptions used to arrive at the net pension and OPEB obligations for purposes of our consolidated financial statements. Under Canadian actuarial rules for solvency determinations, the liabilities are calculated on the assumption that the plans are terminated at the measurement date (each December 31 for the affected plans), and the liabilities are discounted primarily using a specified annuity purchase rate, which is that day’s spot interest rate on government securities in Canada plus a prescribed margin. By contrast, for purposes of our consolidated financial statements, the discount rate is determined with a model that develops a hypothetical high-quality bond portfolio, where the bonds are theoretically purchased to settle the expected benefit payments of the plans.
December 31, | ||||||||||||||||
Affected Plans | 2013 | 2012 | 2011 | 2010 | ||||||||||||
Discount rate for accounting purposes | 4.9 | % | 4.3 | % | 4.9 | % | 5.5 | % | ||||||||
Balance sheet funded status | 84.0 | % | 77.0 | % | 82.0 | % | 86.0 | % | ||||||||
Annuity purchase rate for solvency purposes | 3.9 | % | (1) | 3.0 | % | 3.3 | % | 4.5 | % | |||||||
Solvency ratio | 78.4 | % | (1) | 67.3 | % | 69.4 | % | 77.5 | % | |||||||
(1) | Preliminary, subject to final actuarial report. |
As of December 31, 2013, a 1% increase in the applicable annuity purchase rate described above would decrease the solvency deficit by approximately Cdn$520 million ($490 million, based on the exchange rate in effect on December 31, 2013), and vice versa.
Corrective measures
The aggregate solvency ratio in the affected plans was below the minimum solvency level prescribed in the regulations on each of December 31, 2011, and December 31, 2012. Accordingly, the regulations required that we propose corrective measures designed to attain the target solvency ratio prescribed in the regulations within five years. The difference between the solvency status as of December 31, 2011, and the target specified under the funding relief regulations represented the portion of the solvency deficit that was subject to corrective measures; it amounted to approximately Cdn$500 million as of December 31, 2011 ($471 million, based on the exchange rate in effect on December 31, 2013).
In light of falling yields on government securities in Canada, and a 0.2% reduction in the prescribed margin to determine the annuity purchase rate under Canadian actuarial rules, the solvency deficit widened by an additional Cdn$130 million as of
56
December 31, 2012 ($122 million, based on the exchange rate in effect on December 31, 2013), which then triggered the need for additional corrective measures in respect of that amount. Because of the rising interest rate environment, strong asset returns and 2013 funding, when we file the actuarial report in respect of the affected plans in the second quarter of this year, we expect that the solvency deficit as of December 31, 2013, will have decreased significantly from the level at December 31, 2012.
Nevertheless, in 2013, we reached an agreement in principle with Company stakeholders in Québec and in Ontario to replace the corrective measures mechanism under the funding relief regulations in favor of set incremental contributions beyond the basic funding under the existing framework. The agreement in principle provides that, among other things, our basic contribution to the affected plans will increase to Cdn$80 million for each year from 2013 through 2020, and the additional contribution based on free cash flow will be eliminated. Furthermore, our principal Canadian operating subsidiary undertook, upon emergence, to make an additional solvency deficit reduction contribution to its pension plans of Cdn$75, payable over four years, for each metric ton of capacity reduced in Québec or Ontario, in the event of downtime of more than six consecutive months or nine cumulative months over a period of 18 months, subject to certain conditions. Under the agreement in principle with Québec and Ontario, this would not apply to any capacity reduction before April of 2013.
We expect that in the coming months, Québec and Ontario will adopt regulations to implement this revised framework; accordingly, we accelerated Cdn$30 million of contributions to the affected plans in the fourth quarter, representing the incremental funding under the new regulations had they been adopted in 2013.
Should the provinces fail to implement the expected regulations and decide to enforce to current funding relief regulations despite the agreement in principle and the Cdn$30 million of accelerated contributions in 2013, we cannot estimate, at this time, the additional contributions, if any, that may be made or required in future years in respect of the corrective measures, but they could be material, which would negatively impact our cash flows and materially affect our results of operations and financial condition.
Partial wind-ups
On June 12, 2012, we filed a motion for directives with the Québec Superior Court in Canada, the court with jurisdiction in the creditor protection proceedings, seeking an order to prevent pension regulators in each of Québec, New Brunswick and Newfoundland and Labrador from declaring partial wind-ups of pension plans relating to employees of former operations in New Brunswick and Newfoundland and Labrador, or a declaration that any claim for accelerated reimbursements of deficits arising from a partial wind-up is a barred claim under the creditor protection proceedings. A partial wind-up would likely shorten the period in which any deficit within those plans, which could reach up to Cdn$150 million ($141 million, based on the exchange rate in effect on December 31, 2013), would have to be funded if we do not obtain the relief sought. No hearing date has been set. At this time, we cannot estimate the additional contributions, if any, that may be required in future years, but they could be material.
Pension and OPEB plans
In 2013, gross contributions to our defined benefit pension and defined contribution pension (including SERP) were $133 million and $22 million, respectively. Of this aggregate 2013 funding of $155 million, we expensed $47 million. We also made $22 million of contributions to OPEB plans, $16 million of which was expensed.
For 2014, we estimate that our contributions to defined benefit pension and defined contribution pension plans (including SERP) will be approximately $140 million and $20 million, respectively, and we would expect to expense approximately $25 million in the aggregate. We also expect to make approximately $20 million of contributions to OPEB plans, of which $10 million would be expensed.
We fund our pension and OPEB plans as required by applicable laws and regulations, taking into account the agreements entered into with the provinces of Québec and Ontario discussed above. We may, from time to time, make additional payments.
Share Repurchase Program
On May 22, 2012, the board approved a share repurchase program of up to 10% of our common stock, for an aggregate purchase price of up to $100 million. Through December 31, 2012, we repurchased 5.6 million shares at a cost of $67 million. We did not repurchase shares in 2013.
57
Contractual Obligations
As of December 31, 2013, the Company’s contractual obligations, including payments due by period, were as follows:
(in millions) | Total | 2014 | 2015-2016 | 2017-2018 | Thereafter | |||||||||||||||
Long-term debt (1) | $ | 940 | $ | 37 | $ | 72 | $ | 72 | $ | 759 | ||||||||||
Non-cancelable operating lease obligations (2) | 23 | 4 | 6 | 4 | 9 | |||||||||||||||
Purchase obligations | 263 | 77 | 86 | 51 | 49 | |||||||||||||||
$ | 1,226 | $ | 118 | $ | 164 | $ | 127 | $ | 817 | |||||||||||
(1) | Long-term debt commitments represent primarily interest payments on the 2023 notes over the periods indicated and payment of the remaining principal balance at maturity, assuming no further redemptions. |
(2) | We lease certain office premises, office equipment and transportation equipment under operating leases. |
CHANGE IN ACCOUNTING POLICY
In 2013, we changed our accounting policy for repair and maintenance costs associated with planned major maintenance activities. Previously, all repair and maintenance costs, including those associated with planned major maintenance, were expensed as incurred. We elected to change our accounting policy for planned major maintenance costs to the deferral method, whereby the costs of each planned major maintenance activity are amortized on a straight-line basis over the estimated period until the next planned major maintenance activity. All other routine repair and maintenance costs continue to be expensed as incurred. We believe that the deferral method is preferable as the economic benefit associated with planned major maintenance activities are more appropriately recognized over the period of future benefit, which is not limited to the period the expense is incurred. In addition, the deferral method enhances the comparability of our financial results with our peer companies. In accordance with the guidance in FASB ASC 250, “Accounting Changes and Error Corrections,” we have applied the change in accounting policy retroactively by adjusting our comparative consolidated financial statements for the effect of this change.
RECENT ACCOUNTING GUIDANCE
None of the new accounting guidance is expected to materially affect our results of operations or financial condition.
CRITICAL ACCOUNTING ESTIMATES
The preparation of financial statements in conformity with U.S. generally accepted accounting principles requires us to make accounting estimates based on assumptions, judgments and projections of future results of operations and cash flows. These estimates and assumptions affect the reported amounts of revenues and expenses during the periods presented and the reported amounts of assets and liabilities and the disclosure of contingent assets and liabilities as of the date of the financial statements.
We base our estimates, assumptions and judgments on a number of factors, including historical experience, recent events, existing conditions, internal budgets and forecasts, projections obtained from industry research firms and other data that we believe are reasonable under the circumstances. We believe that our accounting estimates are appropriate and that the resulting financial statement amounts are reasonable. Due to the inherent uncertainties in making estimates, actual results could differ materially from these estimates, requiring adjustments to financial statement amounts in future periods.
A summary of our significant accounting policies is disclosed in note 2, “summary of significant accounting policies,” to our consolidated financial statements. Based upon a review of our significant accounting policies, we believe the following accounting policies require us to make accounting estimates that can significantly affect the results reported in our consolidated financial statements. We have reported the development, selection and disclosures of our critical accounting estimates to the audit committee of our board of directors, and the audit committee has reviewed the disclosures relating to these estimates.
Pension and OPEB obligations
Description of accounts impacted by the accounting estimate
We record assets and liabilities associated with our pension and OPEB obligations, net of pension plan assets that may be considered material to our financial position. We also record net periodic benefit costs associated with these net obligations as our employees render service. As of December 31, 2013, we have pension and OPEB obligations aggregating $6,314 million and accumulated pension plan assets at fair value of $5,013 million. Our 2013 net periodic pension and OPEB costs were $41 million.
58
Judgments and uncertainties involved in the accounting estimate
The following inputs are used to determine our net obligations and our net periodic benefit costs each year and the determination of these inputs requires judgment:
• | discount rate – used to determine the net present value of our pension and OPEB obligations and to determine the interest cost component of our net periodic pension and OPEB costs; |
• | return on assets – used to estimate the growth in the value of invested assets that are available to satisfy pension benefit obligations and to determine the expected return on plan assets component of our net periodic pension benefit costs; |
• | mortality rate – used to estimate the impact of mortality on pension and OPEB obligations; |
• | rate of compensation increase – used to calculate the impact future pay increases will have on pension benefit obligations; and |
• | health care cost trend rate – used to calculate the impact of future health care costs on OPEB obligations. |
The discount rate for our domestic and foreign plans was determined with a model that develops a hypothetical high-quality bond portfolio, where the bonds are theoretically purchased to settle the expected benefit payments of the plans. The discount rate reflects the single rate that produces the same discounted values as the value of the theoretical high-quality bond portfolio. In determining the expected return on assets, we considered the historical returns and the future expectations for returns for each asset class, as well as the target asset allocation of the pension portfolio. For the mortality rate of our domestic plans, we used actuarially-determined mortality tables that were consistent with our historical mortality experience and future expectations for mortality of the employees who participate in our domestic pension and OPEB plans. The mortality rate for our Canadian plans was established using the recently issued actuarially-determined mortality table reflecting a longer life expectancy, combined with the result of our historical mortality experience study that were consistent with our future expectations for mortality of the employees who participate in our foreign pension and OPEB plans. In determining the rate of compensation increase, we reviewed historical salary increases and promotions, while considering current industry conditions, the terms of collective bargaining agreements with our employees and the outlook for our industry. For the health care cost trend rate, we considered historical trends for these costs, as well as recently enacted healthcare legislation.
Effect if actual results differ from assumptions
Variations in assumptions could have a significant effect on the net periodic benefit costs and net unfunded pension and OPEB obligations reported in our consolidated financial statements. For example, a 25 basis point change in any one of these assumptions would have increased (decreased) our net periodic benefit costs for our pension and OPEB plans and our net pension and OPEB obligations as follows:
2013 Net Periodic Benefit Cost | Net Pension and OPEB Obligations as of December 31, 2013 | ||||||||||||||||
(In millions) | 25 Basis Point Increase | 25 Basis Point Decrease | 25 Basis Point Increase | 25 Basis Point Decrease | |||||||||||||
Assumption: | |||||||||||||||||
Discount rate | $ | (6 | ) | $ | 8 | $ | (160 | ) | $ | 170 | |||||||
Return on assets | (12 | ) | 12 | — | — | ||||||||||||
Rate of compensation increase | 1 | (1 | ) | 8 | (8 | ) | |||||||||||
Health care cost trend rate | 1 | (1 | ) | 7 | (6 | ) | |||||||||||
As of December 31, 2013, the most significant change in our assumptions was an increase to 4.9% from 4.3% as of December 31, 2012, in the discount rate for our pension benefit obligations, resulting in a reduction of our pension benefit obligation of approximately $400 million.
The net periodic benefit costs of our pension plans is based on the expected return on plan assets and not the actual return on plan assets, and the net periodic benefit cost of our pension and OPEB plans is based on the expected change in pension and OPEB obligations arising from the time value of money and not the actual change in pension and OPEB obligations. Differences between these expected and actual results were recorded in “accumulated other comprehensive loss” in our consolidated balance sheets as an actuarial gain or loss. Net gains arising in 2013, before tax, and deferred in “accumulated other comprehensive loss” were $441 million and reduced our accumulated net actuarial loss. This loss will be amortized into
59
our consolidated statements of operations in future years and will increase our 2014 net periodic benefit costs by approximately $1 million.
Deferred income tax assets
Description of accounts impacted by the accounting estimates
We have significant net deferred income tax assets of $1,240 million recorded in our Consolidated Balance Sheet as of December 31, 2013, representing net deferred income tax liabilities of $6 million in the United States and net deferred income tax assets of $1,246 million in Canada, respectively, and are comprised primarily of:
United States:
• | Deferred income tax assets of $1,306 million, comprised of $690 million for Federal and state operating loss carryforwards expiring between 2021 and 2033, $440 million for capital losses expiring in 2014 and $176 million for other temporary differences, mostly related to pension and OPEB plans. |
• | Deferred income tax liabilities of $284 million, mostly related to accelerated depreciation on fixed assets. |
• | A valuation allowance of $1,028 million against the net deferred income tax assets which are not more likely than not to be realized in the future. |
Canada:
• | Deferred income tax assets of $1,359 million, comprised of $223 million related to a pool of scientific research and experimental development costs with no expiry, $133 million for Federal and provincial operating loss carryforwards expiring between 2014 and 2033, $113 million for tax credit carryforwards expiring between 2014 and 2033, $4 million for capital loss carryforwards with no expiry, as well as $886 million for other temporary differences, mostly related to fixed asset undepreciated capital costs with no expiry and pension and OPEB plans. |
• | Deferred income tax liabilities of $47 million for various temporary differences. |
• | A valuation allowance of $66 million related to items of a capital nature and the net deferred income tax assets associated with Fibrek Holding Inc., a Canadian wholly-owned subsidiary. |
Other:
• | Deferred income tax assets of $27 million, mostly comprised of other foreign subsidiaries operating loss carryforwards expiring between 2019 and 2023. |
• | A valuation allowance of $27 million against the net deferred income tax assets of other foreign subsidiaries which are not more likely than not to be realized in the future. |
Judgments and uncertainties involved in the accounting estimates
At each reporting period, we assess whether it is more likely than not that the deferred income tax assets will be realized, based on the review of all available positive and negative evidence, including future reversals of existing taxable temporary differences, estimates of future taxable income, past operating results and prudent and feasible tax planning strategies. The carrying value of our deferred income tax assets reflects our expected ability to generate sufficient future taxable income in certain tax jurisdictions to utilize these deferred income tax benefits.
Following the assessment of the realizability of our U.S. operations deferred income tax assets, we concluded that existing negative evidence outweighed positive evidence and that a full valuation allowance against our net deferred income tax assets was required. A cumulative loss position is considered significant negative evidence in assessing the realizability of deferred income tax assets that is difficult to overcome. As a result of our mill rationalization efforts, executed to improve our cost structure and asset base going forward, as well as changing dynamics in the pulp and paper industry, our U.S. operations were in a three year cumulative loss position for the year ended December 31, 2013. Considering that the weight given to positive and negative evidence must be commensurate with the extent to which that evidence may be objectively verified, the recent cumulative loss of our U.S. operations limits our ability to consider other subjective positive evidence, such as projections of future earnings. As a result, we recorded an increase to the income tax provision of $604 million in order to establish a full valuation allowance against our net U.S. deferred income tax assets. The non-cash charge to establish a valuation allowance does not have any impact on our consolidated operating income or cash flow. It also does not reduce our underlying tax attributes, nor hinders our ability to use them in the future. If, in the future, sufficient objective positive evidence becomes available such that, based on the weight of available evidence, it is determined to be more likely than not that some or all of the deferred income tax assets associated with our U.S. operations can be realized, the valuation allowance will be reduced as appropriate, with the related adjustment being recognized as a decrease to the income tax provision.
60
The weight of positive evidence, which included a review of historical cumulative earnings and our expected future performance, resulted in the conclusion by management that valuation allowances were not required for most of our deferred income tax assets in Canada, as they were determined to be more likely than not to be realized. We maintained a valuation allowance against certain items of a capital nature and on the net deferred income tax assets associated with Fibrek Holding Inc., a Canadian wholly-owned subsidiary. Although 2013 saw an improved performance for Fibrek Holding Inc., this Canadian subsidiary remained in a cumulative three year loss position for the year ended December 31, 2013. We will continue to monitor all available evidence related to this subsidiary, including past and expected future performance in order to assess the need for a valuation allowance. If in a future period Fibrek Holding Inc. moves into a three year cumulative earnings position and we are confident this represents sustained profitability, the valuation allowance will be reduced as appropriate, with the related adjustment being recognized as a decrease to the income tax provision.
The Company calculates its income tax provision for the period based on estimates and assumptions that could differ from the actual results reflected in income tax returns filed in the subsequent years. Adjustments based on actual filed income tax returns are recorded when identified.
Tax benefits related to uncertain tax positions are recorded when it is more likely than not, based on the technical merits, that the position will be sustained upon examination by the relevant tax authority. The amount of tax benefit recognized may differ from the amount taken or expected to be taken on a tax return. These differences represent unrecognized tax benefits and are reviewed at each reporting period based on facts, circumstances and other available evidence. We have unrecognized tax benefits of $81 million as of December 31, 2013. As income tax legislation and regulations are complex and subject to interpretation, our tax positions could be challenged by taxing authorities.
Effect if actual results differ from assumptions
Our expected future performance represents important positive evidence in determining the recoverability of our deferred income tax assets. If actual financial results are not consistent with the assumptions and judgments used, we may be required to reduce the value of our net deferred income tax assets by recording additional valuation allowances, resulting in an additional income tax expense that could be material.
We do not expect a significant change to the amount of unrecognized tax benefits over the next twelve months. However, any adjustments arising from examinations by tax authorities may alter the timing or amount of taxable income or deductions, or the allocation of income among tax jurisdictions and could differ from the amount accrued.
Long-lived assets
Description of accounts impacted by the accounting estimate
We have long-lived assets recorded in our Consolidated Balance Sheet of $2,355 million as of December 31, 2013. These long-lived assets include fixed assets, net and amortizable intangible assets, net. In 2013, we recorded depreciation and amortization of $243 million and impairment and accelerated depreciation charges aggregating $61 million associated with these long-lived assets. The depreciation and amortization and impairment charges are based on accounting estimates.
The unit of accounting for impairment testing for long-lived assets is its asset group (see note 2, “summary of significant accounting policies – impairment of long-lived assets,” to our consolidated financial statements). The unit of accounting for the depreciation and amortization of long-lived assets is at a lower level, either as a group of closely-related assets or at an individual asset level. The cost of a long-lived asset is amortized over its estimated remaining useful life, which is subject to change based on events and circumstances or management’s intention for the use of the asset.
Losses related to the impairment of long-lived assets to be held and used are recognized when circumstances indicate the carrying value of an asset group may not be recoverable, such as continuing losses in certain businesses. When indicators that the carrying value of an asset group may not be recoverable are triggered, we evaluate the carrying value of the asset group in relation to its expected undiscounted future cash flows. If the carrying value of an asset group is greater than the expected undiscounted future cash flows to be generated by the asset group, an impairment charge is recognized based on the excess of the asset group’s carrying value over its fair value. If it is determined that the carrying value of an asset group is recoverable, we review and adjust, as necessary, the estimated useful lives of the assets in the group.
When an asset group meets the criteria for classification as an asset held for sale, an impairment charge is recognized, if necessary, based on the excess of the asset group’s carrying value over the expected net proceeds from the sale (the estimated fair value minus the estimated costs to sell the asset group).
Our long-lived asset impairment and accelerated depreciation charges are disclosed in note 5, “closure costs, impairment and other related charges,” to our consolidated financial statements.
61
Judgments and uncertainties involved in the accounting estimate
The calculation of depreciation and amortization of long-lived assets requires us to apply judgment in selecting the remaining useful lives of the assets. The remaining useful life of an asset must address both physical and economic considerations. The remaining economic life of a long-lived asset is frequently shorter than its physical life. The pulp and paper industry in recent years has been characterized by considerable uncertainty in business conditions. Estimates of future economic conditions for our long-lived assets and therefore, their remaining useful economic life, require considerable judgment.
Asset impairment for long-lived assets to be held and used is tested at the lowest asset group level having largely independent cash flows. Determining the asset groups for long-lived assets to be held and used requires management’s judgment.
Asset impairment loss calculations require us to apply judgment in estimating asset group fair values and future cash flows, including periods of operation, projections of product pricing, first quality production levels, product costs, market supply and demand, foreign exchange rates, inflation, projected capital spending and, specifically for fixed assets acquired, assigned useful lives, functional obsolescence, asset condition and discount rates. When performing impairment tests, we estimate the fair values of the assets using management’s best assumptions, which we believe would be consistent with the assumptions that a hypothetical marketplace participant would use. Estimates and assumptions used in these tests are evaluated and updated as appropriate. One key assumption, especially for our long-lived assets in Canada, is the foreign exchange rate. Foreign exchange rates were determined based on our budgeted exchange rates for 2014. The assessment of whether an asset group should be classified as held for sale requires us to apply judgment in estimating the probable timing of the sale, and in testing for impairment loss, judgment is required in estimating the net proceeds from the sale.
Effect if actual results differ from assumptions
If our estimate of the remaining useful life changes, such a change is accounted for prospectively in our determination of depreciation and amortization. Actual depreciation and amortization charges for an individual asset may therefore be significantly accelerated if the outlook for its remaining useful life is shortened considerably.
A number of judgments were made in the determination of our asset groups. If a different conclusion had been reached for any one of those assumptions, it could have resulted in the identification of asset groups different from those we actually identified. This may have resulted in a different conclusion when comparing the expected undiscounted future cash flows or the fair value to the carrying value of the asset group.
Actual asset impairment losses could vary considerably from estimated impairment losses if actual results are not consistent with the assumptions and judgments used in estimating future cash flows and asset fair values.
Assets with proportionately greater risk of acceleration in depreciation and amortization or additional impairment those facilities that are presently idled. Information on certain of our idled assets can be found in note 5, “closure costs, impairment and other related charges,” to our consolidated financial statements.
62
ITEM 7A. QUANTITATIVE AND QUALITATIVE DISCLOSURES ABOUT MARKET RISK
We are exposed to risks associated with fluctuations in foreign currency exchange rates, commodity prices, prices for the products we manufacture and credit risk on accounts receivable from our customers.
Foreign Currency Exchange Risk
We compete with producers from around the world, particularly North America, Europe and South America, in most of our product lines with the exception of wood products, where we compete with other North American producers. We sell our products mainly in transactions denominated in U.S. dollars, but we also sell in certain local currencies, including the euro, the pound sterling and the Canadian dollar. In addition to the impact of product supply and demand, changes in the relative strength or weakness of these currencies, particularly the U.S. dollar, could also affect international trade flows in these products. A stronger U.S. dollar might attract imports, thereby increasing product supply and possibly creating downward pressure on prices. On the other hand, a weaker U.S. dollar might encourage U.S. exports but also increase manufacturing costs in Canadian dollars, or other foreign currencies.
Variations in exchange rates could also significantly affect our competitive position. In 2012, for example, the strength of the U.S. dollar against certain European currencies negatively affected the competitive position of North American newsprint producers selling in certain U.S. dollar-denominated international newsprint markets, like Asia and India. Some of our European competitors were able to price business more aggressively in those markets as a result of the relative weakness of their local currency, which negatively affected our ability to compete, forcing us to take steps to limit our exposure to these markets. Conversely, with the strengthening euro in 2013, particularly against the U.S. dollar, exports from North America rose, while they fell from Western Europe.
We are particularly sensitive to changes in the value of the Canadian dollar versus the U.S. dollar. The actual impact of these changes depends primarily on the proportion of our production and sales that occur in Canada, the proportion of our financial assets and liabilities denominated in Canadian dollars, and the magnitude, direction and duration of changes in the exchange rate. We expect exchange rate fluctuations to continue to impact costs and revenues, but we cannot predict the magnitude or direction of this effect for any period, and there can be no assurance of any future effects. In the last two years, the Canadian dollar fluctuated between a low of US$0.93 in December of 2013 and a high of US$1.03 in September of 2012. Based on operating projections for 2014, if the Canadian dollar strengthens by one cent against the U.S. dollar, we expect that it will decrease our annual operating income by approximately $15 million, and vice versa.
Furthermore, certain other assets and liabilities, including a substantial portion of our net pension and OPEB obligations and our deferred income tax assets, are denominated in Canadian dollars. As a result, our earnings can be subject to the potentially significant effect of foreign currency translation gains or losses in respect of these Canadian dollar net monetary assets. In this case, a strengthening of the Canadian dollar against the U.S. dollar in any given period would generally cause a foreign currency translation gain, and a weakening of the Canadian dollar would generally lead to a foreign currency translation loss.
Product Price Risk
Historically, economic and market shifts, fluctuations in capacity, and changes in foreign currency exchange rates have created cyclical changes in prices, sales volume and margins for our products. Most of our paper, market pulp and wood products are commodities that are widely available from other producers; because these products have few distinguishing qualities from producer to producer, competition is based primarily on price, which is determined by supply relative to demand. The overall levels of demand for the products we manufacture, consequently our sales and profitability, reflect fluctuations in end-user demand, which depend in part on general economic conditions in North America and worldwide.
In the table below, we show the impact of a $25 change to the average transaction price per unit of our products, based on our operating configuration as of December 31, 2013. This presentation measures only the impact of pricing and items directly related to price, and assumes that every other factor is held constant.
63
PRODUCT | Unit | Projected change in annualized EBTIDA ($ millions) | |
$25 increase in price per unit | $25 decrease in price per unit | ||
Newsprint | $ / metric ton | 62 | 62 |
Specialty papers | $ / short ton | 47 | 47 |
Market pulp | $ / metric ton | 40 | 40 |
Wood products | $ / thousand board feet | 24 | 24 |
Commodity Price Risk
We purchase significant amounts of energy, chemicals, wood fiber and recovered paper to supply our manufacturing facilities. These raw materials are market-priced commodities and as such, are subject to fluctuations in market prices. Increases in the prices of these commodities will tend to reduce our reported earnings and decreases will tend to increase our reported earnings. From time to time, we may enter into contracts aimed at securing a stable source of supply for commodities such as timber, wood fiber, energy, chemicals and recovered paper. These contracts typically require us to pay the market price at the time of purchase. Thus, under these contracts, we generally remain subject to market fluctuations in commodity prices.
Credit Risk
We are exposed to credit risk on the accounts receivable from our customers. In order to manage our credit risk, we have adopted policies, which include the analysis of the financial position of our customers and the regular review of their credit limits. We also subscribe to credit insurance and, in some cases, require bank letters of credit. Our customers are mainly in the business of newspaper publishing, advertising, printing, paper converting, consumer products as well as lumber wholesaling and retailing.
64
ITEM 8. FINANCIAL STATEMENTS AND SUPPLEMENTARY DATA
Index to Financial Statements
Page | |
Consolidated Statements of Operations for the Years Ended December 31, 2013, 2012 and 2011 | |
Consolidated Statements of Comprehensive Loss for the Years Ended December 31, 2013, 2012 and 2011 | |
Consolidated Balance Sheets as of December 31, 2013 and 2012 | |
Consolidated Statements of Changes in Equity for the Years Ended December 31, 2013, 2012 and 2011 | |
Consolidated Statements of Cash Flows for the Years Ended December 31, 2013 and 2012 | |
65
RESOLUTE FOREST PRODUCTS INC.
CONSOLIDATED STATEMENTS OF OPERATIONS
(In millions, except per share amounts)
Years Ended December 31, | ||||||||||||
2013 | 2012 | 2011 | ||||||||||
Sales | $ | 4,461 | $ | 4,503 | $ | 4,756 | ||||||
Costs and expenses: | ||||||||||||
Cost of sales, excluding depreciation, amortization and distribution costs | 3,446 | 3,485 | 3,581 | |||||||||
Depreciation and amortization | 243 | 233 | 220 | |||||||||
Distribution costs | 521 | 514 | 547 | |||||||||
Selling, general and administrative expenses | 166 | 149 | 158 | |||||||||
Closure costs, impairment and other related charges | 89 | 185 | 46 | |||||||||
Net gain on disposition of assets | (2 | ) | (35 | ) | (3 | ) | ||||||
Operating (loss) income | (2 | ) | (28 | ) | 207 | |||||||
Interest expense | (51 | ) | (66 | ) | (95 | ) | ||||||
Other (expense) income, net | (62 | ) | 22 | (48 | ) | |||||||
(Loss) income before income taxes | (115 | ) | (72 | ) | 64 | |||||||
Income tax (provision) benefit | (524 | ) | 39 | (19 | ) | |||||||
Net (loss) income including noncontrolling interests | (639 | ) | (33 | ) | 45 | |||||||
Net loss attributable to noncontrolling interests | — | 34 | 2 | |||||||||
Net (loss) income attributable to Resolute Forest Products Inc. | $ | (639 | ) | $ | 1 | $ | 47 | |||||
Net (loss) income per share attributable to Resolute Forest Products Inc. common shareholders: | ||||||||||||
Basic | $ | (6.75 | ) | $ | 0.01 | $ | 0.48 | |||||
Diluted | $ | (6.75 | ) | $ | 0.01 | $ | 0.48 | |||||
Weighted-average number of Resolute Forest Products Inc. common shares outstanding: | ||||||||||||
Basic | 94.7 | 97.4 | 97.1 | |||||||||
Diluted | 94.7 | 97.5 | 97.1 | |||||||||
See accompanying notes to consolidated financial statements.
66
RESOLUTE FOREST PRODUCTS INC.
CONSOLIDATED STATEMENTS OF COMPREHENSIVE LOSS
(In millions)
Years Ended December 31, | ||||||||||||
2013 | 2012 | 2011 | ||||||||||
Net (loss) income including noncontrolling interests | $ | (639 | ) | $ | (33 | ) | $ | 45 | ||||
Other comprehensive (loss) income: | ||||||||||||
Change in unamortized prior service credits, net of tax of $0, $7 and $0 in 2013, 2012 and 2011, respectively. | (3 | ) | 23 | (2 | ) | |||||||
Change in unamortized actuarial losses, net of tax of $121, $135 and $127 in 2013, 2012 and 2011, respectively. | 350 | (351 | ) | (317 | ) | |||||||
Foreign currency translation | (4 | ) | 1 | 10 | ||||||||
Other comprehensive income (loss), net of tax | 343 | (327 | ) | (309 | ) | |||||||
Comprehensive loss including noncontrolling interests | (296 | ) | (360 | ) | (264 | ) | ||||||
Less: Comprehensive loss (income) attributable to noncontrolling interests: | ||||||||||||
Net loss | — | 34 | 2 | |||||||||
Change in unamortized actuarial losses, net of tax of $0 in both 2012 and 2011 | — | 6 | 8 | |||||||||
Foreign currency translation | — | 2 | (2 | ) | ||||||||
Comprehensive loss attributable to noncontrolling interests | — | 42 | 8 | |||||||||
Comprehensive loss attributable to Resolute Forest Products Inc. | $ | (296 | ) | $ | (318 | ) | $ | (256 | ) | |||
See accompanying notes to consolidated financial statements.
67
RESOLUTE FOREST PRODUCTS INC.
CONSOLIDATED BALANCE SHEETS
(In millions, except per share amount)
December 31, 2013 | December 31, 2012 | |||||||
Assets | ||||||||
Current assets: | ||||||||
Cash and cash equivalents | $ | 322 | $ | 263 | ||||
Accounts receivable, net: | ||||||||
Trade | 536 | 576 | ||||||
Other | 98 | 121 | ||||||
Inventories, net | 529 | 558 | ||||||
Deferred income tax assets | 32 | 56 | ||||||
Other current assets | 45 | 56 | ||||||
Total current assets | 1,562 | 1,630 | ||||||
Fixed assets, net | 2,289 | 2,440 | ||||||
Amortizable intangible assets, net | 66 | 69 | ||||||
Deferred income tax assets | 1,266 | 2,000 | ||||||
Other assets | 202 | 194 | ||||||
Total assets | $ | 5,385 | $ | 6,333 | ||||
Liabilities and equity | ||||||||
Current liabilities: | ||||||||
Accounts payable and accrued liabilities | $ | 533 | $ | 581 | ||||
Current portion of long-term debt | 2 | 2 | ||||||
Deferred income tax liabilities | 32 | — | ||||||
Total current liabilities | 567 | 583 | ||||||
Long-term debt, net of current portion | 597 | 532 | ||||||
Pension and other postretirement benefit obligations | 1,294 | 1,946 | ||||||
Deferred income tax liabilities | 26 | 75 | ||||||
Other long-term liabilities | 62 | 72 | ||||||
Total liabilities | 2,546 | 3,208 | ||||||
Commitments and contingencies | ||||||||
Equity: | ||||||||
Resolute Forest Products Inc. shareholders’ equity: | ||||||||
Common stock, $0.001 par value. 117.0 shares issued and 94.5 shares outstanding as of December 31, 2013; 117.0 shares issued and 94.8 shares outstanding as of December 31, 2012 | — | — | ||||||
Additional paid-in capital | 3,751 | 3,730 | ||||||
(Deficit) retained earnings | (592 | ) | 47 | |||||
Accumulated other comprehensive loss | (271 | ) | (614 | ) | ||||
Treasury stock at cost, 22.5 shares and 22.2 shares as of December 31, 2013 and December 31, 2012, respectively | (61 | ) | (61 | ) | ||||
Total Resolute Forest Products Inc. shareholders’ equity | 2,827 | 3,102 | ||||||
Noncontrolling interests | 12 | 23 | ||||||
Total equity | 2,839 | 3,125 | ||||||
Total liabilities and equity | $ | 5,385 | $ | 6,333 | ||||
See accompanying notes to consolidated financial statements.
68
RESOLUTE FOREST PRODUCTS INC.
CONSOLIDATED STATEMENTS OF CHANGES IN EQUITY
(In millions)
Resolute Forest Products Inc. Shareholders’ Equity | ||||||||||||||||||||||||||||
Common Stock | Additional Paid-in Capital | Retained Earnings (Deficit) | Accumulated Other Comprehensive Loss | Treasury Stock | Non- controlling Interests | Total Equity | ||||||||||||||||||||||
Balance as of December 31, 2010 | $ | — | $ | 3,709 | $ | — | $ | — | $ | — | $ | 278 | $ | 3,987 | ||||||||||||||
Share-based compensation costs for equity-classified awards | — | 3 | — | — | — | — | 3 | |||||||||||||||||||||
Net income (loss) | — | — | 47 | — | — | (2 | ) | 45 | ||||||||||||||||||||
Dividends and distribution paid to noncontrolling interests | — | — | — | — | — | (21 | ) | (21 | ) | |||||||||||||||||||
Acquisition of noncontrolling interest | — | (15 | ) | — | — | — | (105 | ) | (120 | ) | ||||||||||||||||||
Disposition of investment in ACH Limited Partnership (Note 6) | — | — | — | (8 | ) | — | (99 | ) | (107 | ) | ||||||||||||||||||
Contribution of capital to noncontrolling interest | — | (10 | ) | — | — | — | 15 | 5 | ||||||||||||||||||||
Other comprehensive loss, net of tax | — | — | — | (303 | ) | — | (6 | ) | (309 | ) | ||||||||||||||||||
Balance as of December 31, 2011 | — | 3,687 | 47 | (311 | ) | — | 60 | 3,483 | ||||||||||||||||||||
Share-based compensation costs for equity-classified awards | — | 5 | — | — | — | — | 5 | |||||||||||||||||||||
Net income (loss) | — | — | 1 | — | — | (34 | ) | (33 | ) | |||||||||||||||||||
Acquisition of Fibrek Inc. (2.8 newly-issued shares and 0.5 shares of treasury stock) (Note 3) | — | 38 | (1 | ) | — | 6 | — | 43 | ||||||||||||||||||||
Disposition of investment in Bowater Mersey Paper Company Limited (our “Mersey operations”) (Note 6) | — | — | — | 16 | — | 9 | 25 | |||||||||||||||||||||
Purchases of treasury stock (5.6 shares) (Note 17) | — | — | — | — | (67 | ) | — | (67 | ) | |||||||||||||||||||
Distribution of common stock from the share reserve to Augusta Newsprint Company and Fibrek Inc., wholly-owned subsidiaries (0.1 shares in treasury) (Note 17) | — | — | — | — | — | — | — | |||||||||||||||||||||
Restricted stock units and deferred stock units vested (0.1 shares), net of shares forfeited for employee withholding taxes | — | — | — | — | — | — | — | |||||||||||||||||||||
Dividends paid to noncontrolling interest | — | — | — | — | — | (5 | ) | (5 | ) | |||||||||||||||||||
Contribution of capital to non-controlling interest | — | — | — | — | — | 1 | 1 | |||||||||||||||||||||
Other comprehensive loss, net of tax | — | — | — | (319 | ) | — | (8 | ) | (327 | ) | ||||||||||||||||||
Balance as of December 31, 2012 | — | 3,730 | 47 | (614 | ) | (61 | ) | 23 | 3,125 | |||||||||||||||||||
Share-based compensation costs for equity-classified awards | — | 7 | — | — | — | — | 7 | |||||||||||||||||||||
Net loss | — | — | (639 | ) | — | — | — | (639 | ) | |||||||||||||||||||
Contribution of capital from noncontrolling interest (net of tax of $3) | — | — | — | — | — | 5 | 5 | |||||||||||||||||||||
Acquisition of noncontrolling interest (Note 7) | — | 14 | — | — | — | (14 | ) | — | ||||||||||||||||||||
Distribution of common stock from the shares reserve to the Company (0.3 shares in treasury) (Note 17) | — | — | — | — | — | — | — | |||||||||||||||||||||
Dividend paid to noncontrolling interest | — | — | — | — | — | (2 | ) | (2 | ) | |||||||||||||||||||
Other comprehensive income, net of tax | — | — | — | 343 | — | — | 343 | |||||||||||||||||||||
Balance as of December 31, 2013 | $ | — | $ | 3,751 | $ | (592 | ) | $ | (271 | ) | $ | (61 | ) | $ | 12 | $ | 2,839 | |||||||||||
See accompanying notes to consolidated financial statements.
69
RESOLUTE FOREST PRODUCTS INC.
CONSOLIDATED STATEMENTS OF CASH FLOWS
(In millions)
Years Ended December 31, | ||||||||||||
2013 | 2012 | 2011 | ||||||||||
Cash flows from operating activities: | ||||||||||||
Net (loss) income including noncontrolling interests | $ | (639 | ) | $ | (33 | ) | $ | 45 | ||||
Adjustments to reconcile net (loss) income including noncontrolling interests to net cash provided by operating activities: | ||||||||||||
Share-based compensation | 7 | 5 | 3 | |||||||||
Depreciation and amortization | 243 | 233 | 220 | |||||||||
Closure costs, impairment and other related charges | 80 | 166 | 41 | |||||||||
Inventory write-downs related to closures | 11 | 12 | 3 | |||||||||
Deferred income taxes | 523 | (36 | ) | 15 | ||||||||
Net pension contributions and other postretirement benefit payments | (117 | ) | (95 | ) | (175 | ) | ||||||
Net gain on disposition of assets | (2 | ) | (35 | ) | (3 | ) | ||||||
Loss (gain) on translation of foreign currency denominated deferred income taxes | 93 | (37 | ) | 25 | ||||||||
(Gain) loss on translation of foreign currency denominated pension and other postretirement benefit obligations | (88 | ) | 30 | (15 | ) | |||||||
Gain on forgiveness of note payable | (12 | ) | — | — | ||||||||
Net loss on extinguishment of debt | 59 | — | — | |||||||||
Net planned major maintenance payments (Note 1) | (1 | ) | (7 | ) | (9 | ) | ||||||
Premium related to debt redemptions | — | (5 | ) | (16 | ) | |||||||
Dividends received from equity method investees in excess of income | 6 | 2 | 9 | |||||||||
Leasehold improvement incentive received from lessor | — | 5 | — | |||||||||
Changes in working capital: | ||||||||||||
Accounts receivable | 62 | 91 | 87 | |||||||||
Inventories | 16 | (21 | ) | (39 | ) | |||||||
Other current assets | 10 | 5 | 31 | |||||||||
Accounts payable and accrued liabilities | (37 | ) | (11 | ) | (28 | ) | ||||||
Other, net | (8 | ) | (3 | ) | 4 | |||||||
Net cash provided by operating activities | 206 | 266 | 198 | |||||||||
Cash flows from investing activities: | ||||||||||||
Cash invested in fixed assets | (161 | ) | (169 | ) | (97 | ) | ||||||
Disposition of investment in ACH Limited Partnership | — | — | 296 | |||||||||
Disposition of our interest in our Mersey operations, net of cash | — | 14 | — | |||||||||
Disposition of other assets | 4 | 36 | 19 | |||||||||
Acquisition of Fibrek Inc., net of cash acquired | — | (24 | ) | — | ||||||||
Proceeds from holdback related to disposition of investment in Manicouagan Power Company (“MPCo”) | — | — | 29 | |||||||||
Proceeds from insurance settlements | 4 | — | 8 | |||||||||
Decrease (increase) in restricted cash | 8 | 76 | (2 | ) | ||||||||
Increase in deposit requirements for letters of credit, net | (2 | ) | (12 | ) | (8 | ) | ||||||
Other investing activities, net | (4 | ) | 4 | — | ||||||||
Net cash (used in) provided by investing activities | (151 | ) | (75 | ) | 245 | |||||||
Cash flows from financing activities: | ||||||||||||
Issuance of long-term debt | 594 | — | — | |||||||||
Premium paid on extinguishment of debt | (84 | ) | — | — | ||||||||
Payments of debt | (503 | ) | (198 | ) | (354 | ) | ||||||
Payments of financing and credit facility fees | (9 | ) | — | (3 | ) | |||||||
Purchases of treasury stock | — | (67 | ) | — | ||||||||
Dividends and distribution to noncontrolling interests | (2 | ) | (5 | ) | (21 | ) | ||||||
Acquisition of noncontrolling interest | — | (27 | ) | (15 | ) | |||||||
Contribution of capital from noncontrolling interest | 8 | — | — | |||||||||
Net cash provided by (used in) financing activities | 4 | (297 | ) | (393 | ) | |||||||
Net increase (decrease) in cash and cash equivalents | 59 | (106 | ) | 50 | ||||||||
Cash and cash equivalents: | ||||||||||||
Beginning of year | 263 | 369 | 319 | |||||||||
End of year | $ | 322 | $ | 263 | $ | 369 | ||||||
Supplemental disclosures of cash flow information: | ||||||||||||
Cash paid (received) during the year for: | ||||||||||||
Interest, including capitalized interest of $2, $2 and $1 in 2013, 2012 and 2011, respectively | $ | 54 | $ | 68 | $ | 105 | ||||||
Income taxes, net | $ | 2 | $ | — | $ | (6 | ) | |||||
See accompanying notes to consolidated financial statements.
70
Note 1. Organization and Basis of Presentation
Nature of operations
Resolute Forest Products Inc. (with its subsidiaries and affiliates, either individually or collectively, unless otherwise indicated, referred to as “Resolute Forest Products,” “we,” “our,” “us” or the “Company”) is incorporated in Delaware. We are a global leader in the forest products industry, with a diverse range of products, including newsprint, specialty papers, market pulp and wood products, which are marketed in close to 90 countries. We own or operate over 40 pulp and paper mills and wood products facilities in the United States, Canada and South Korea, and power generation assets in Canada.
AbitibiBowater Inc. (our predecessor entity) and all but one of its debtor affiliates successfully emerged from creditor protection proceedings under Chapter 11 of the United States Bankruptcy Code, as amended (“Chapter 11”) and the Companies’ Creditors Arrangement Act (Canada) (the “CCAA”), as applicable (collectively, the “Creditor Protection Proceedings”) on December 9, 2010 (the “Emergence Date”). The wholly-owned subsidiary operating the Mokpo, South Korea operations and almost all of the less than wholly-owned subsidiaries operated outside of the Creditor Protection Proceedings. We refer to AbitibiBowater Inc. and certain of its U.S. and Canadian subsidiaries as the “Debtors”. We refer to the Chapter 11 Debtors’ Second Amended Joint Plan of Reorganization under Chapter 11 of the Bankruptcy Code and the CCAA Debtors’ CCAA Plan of Reorganization and Compromise, in each case as amended and including all exhibits and supplements thereto, together as the “Plans of Reorganization”, each as a “Plan of Reorganization” and individually as the “Chapter 11 Reorganization Plan” and the “CCAA Reorganization Plan”, respectively. Pursuant to the Plans of Reorganization, we distributed on the Emergence date the shares of our common stock for the benefit of unsecured creditors in the Creditor Protection Proceedings and we established a reserve of shares for the benefit of holders of disputed claims. By the end of 2013, all disputed claims had been definitively resolved, and the distribution of shares from the disputed claim share reserve in respect thereof had been completed. The Debtors’ Chapter 11 cases are closed; we expect imminently the court-appointed monitor for the CCAA proceedings to apply to the court for its discharge in respect of those CCAA cases, bringing them to a close as well.
Financial statements
We have prepared our consolidated financial statements in accordance with United States generally accepted accounting principles (“U.S. GAAP”). All amounts are expressed in U.S. dollars, unless otherwise indicated. Certain prior period amounts in our Consolidated Balance Sheets, Consolidated Statements of Cash Flows and Notes to Consolidated Financial Statements have been reclassified to conform to the 2013 presentation.
Consolidation
Our consolidated financial statements include the accounts of Resolute Forest Products Inc. and its controlled subsidiaries. All significant transactions and balances between these companies have been eliminated. All consolidated subsidiaries are wholly-owned as of December 31, 2013 with the exception of the following:
Consolidated Subsidiary | Resolute Forest Products Ownership | Partner | Partner Ownership |
Forest Products Mauricie L.P. | 93.2% | Cooperative Forestière du Haut Saint-Maurice | 6.8% |
Donohue Malbaie Inc. | 51% | NYT Capital Inc. | 49% |
Equity method investments
We account for our investments in affiliated companies where we have significant influence, but not control over their operations, using the equity method of accounting.
Change in accounting policy for planned major maintenance costs
In 2013, we changed our accounting policy for repair and maintenance costs associated with planned major maintenance activities. Previously, all repair and maintenance costs, including those associated with planned major maintenance, were expensed as incurred. We elected to change our accounting policy for planned major maintenance costs to the deferral method, whereby the costs of each planned major maintenance activity are amortized on a straight-line basis over the estimated period until the next planned major maintenance activity. All other routine repair and maintenance costs continue to be expensed as incurred. We believe that the deferral method is preferable as the economic benefit associated with planned major maintenance activities are more appropriately recognized over the period of future benefit, which is not limited to the period the expense is
71
incurred. In addition, the deferral method enhances the comparability of our financial results with our peer companies. In accordance with the guidance in Financial Accounting Standards Board (“FASB”) Accounting Standards Codification (“ASC”) 250, “Accounting Changes and Error Corrections,” we have applied the change in accounting policy retroactively by adjusting our comparative consolidated financial statements for the effect of this change. As a result of the change, retained earnings as of December 31, 2011 increased by $6 million, while having no impact on our retained earnings as of December 31, 2010.
The effect of the change in accounting policy on our Consolidated Statements of Operations for the year ended December 31, 2013 was as follows:
(In millions, except per share amounts) | Before Accounting Policy Change | Adjustment | As Reported | |||||||||
Cost of sales, excluding depreciation, amortization and distribution costs | $ | 3,447 | $ | (1 | ) | $ | 3,446 | |||||
Loss before income taxes | (116 | ) | 1 | (115 | ) | |||||||
Income tax provision | (525 | ) | 1 | (524 | ) | |||||||
Net loss including noncontrolling interests | (641 | ) | 2 | (639 | ) | |||||||
Net loss attributable to Resolute Forest Products Inc. | (641 | ) | 2 | (639 | ) | |||||||
Basic net loss per share attributable to Resolute Forest Products Inc. | (6.77 | ) | 0.02 | (6.75 | ) | |||||||
Diluted net loss per share attributable to Resolute Forest Products Inc. | (6.77 | ) | 0.02 | (6.75 | ) | |||||||
Comprehensive loss attributable to Resolute Forest Products Inc. | (298 | ) | 2 | (296 | ) | |||||||
The effect of the change in accounting policy on our Consolidated Statements of Operations for the year ended December 31, 2012 was as follows:
(In millions, except per share amounts) | As Previously Reported | Adjustment | As Reported | |||||||||
Cost of sales, excluding depreciation, amortization and distribution costs | $ | 3,492 | $ | (7 | ) | $ | 3,485 | |||||
Closure costs, impairment and other related charges | 180 | 5 | 185 | |||||||||
Loss before income taxes | (74 | ) | 2 | (72 | ) | |||||||
Income tax benefit | 38 | 1 | 39 | |||||||||
Net loss including noncontrolling interests | (36 | ) | 3 | (33 | ) | |||||||
Net (loss) income attributable to Resolute Forest Products Inc. | (2 | ) | 3 | 1 | ||||||||
Basic net (loss) income per share attributable to Resolute Forest Products Inc. | (0.02 | ) | 0.03 | 0.01 | ||||||||
Diluted net (loss) income per share attributable to Resolute Forest Products Inc. | (0.02 | ) | 0.03 | 0.01 | ||||||||
Comprehensive loss attributable to Resolute Forest Products Inc. | (321 | ) | 3 | (318 | ) | |||||||
The effect of the change in accounting policy on our Consolidated Statements of Operations for the year ended December 31, 2011 was as follows:
(In millions, except per share amounts) | As Previously Reported | Adjustment | As Reported | |||||||||
Cost of sales, excluding depreciation, amortization and distribution costs | $ | 3,590 | $ | (9 | ) | $ | 3,581 | |||||
Income before income taxes | 55 | 9 | 64 | |||||||||
Income tax provision | (16 | ) | (3 | ) | (19 | ) | ||||||
Net income including noncontrolling interests | 39 | 6 | 45 | |||||||||
Net income attributable to Resolute Forest Products Inc. | 41 | 6 | 47 | |||||||||
Basic net income per share attributable to Resolute Forest Products Inc. | 0.42 | 0.06 | 0.48 | |||||||||
Diluted net income per share attributable to Resolute Forest Products Inc. | 0.42 | 0.06 | 0.48 | |||||||||
Comprehensive loss attributable to Resolute Forest Products Inc. | (262 | ) | 6 | (256 | ) | |||||||
72
The effect of the change in accounting policy on our Consolidated Balance Sheets as of December 31, 2013 and December 31, 2012 was as follows:
2013 | 2012 | |||||||||||||||||||||||
(In millions) | Before Accounting Policy Change | Adjustment | As Reported | As Previously Reported | Effect of Change | As Adjusted | ||||||||||||||||||
Other current assets | $ | 33 | $ | 12 | $ | 45 | $ | 45 | $ | 11 | $ | 56 | ||||||||||||
Deferred income tax assets (non-current) | 1,267 | (1 | ) | 1,266 | 2,002 | (2 | ) | 2,000 | ||||||||||||||||
(Deficit) retained earnings | (603 | ) | 11 | (592 | ) | 38 | 9 | 47 | ||||||||||||||||
There was no impact on net cash provided by operating activities for all periods as a result of the change in accounting policy.
Note 2. Summary of Significant Accounting Policies
Use of estimates
In preparing our consolidated financial statements in accordance with U.S. GAAP, management is required to make accounting estimates based on assumptions, judgments and projections of future results of operations and cash flows. These estimates and assumptions affect the reported amounts of revenues and expenses during the periods presented and the reported amounts of assets and liabilities and the disclosure of contingent assets and liabilities as of the date of the financial statements. The most critical estimates relate to the assumptions underlying the benefit obligations of our pension and other postretirement benefit (“OPEB”) plans, the recoverability of deferred income tax assets and the carrying values of our long-lived assets. Estimates, assumptions and judgments are based on a number of factors, including historical experience, recent events, existing conditions, internal budgets and forecasts, projections obtained from industry research firms and other data that management believes are reasonable under the circumstances. Actual results could differ materially from those estimates under different assumptions or conditions.
Cash and cash equivalents
Cash and cash equivalents generally consist of direct obligations of the U.S. and Canadian governments and their agencies, demand deposits and other short-term, highly liquid securities with a maturity of three months or less from the date of purchase.
Accounts receivable
Accounts receivable are recorded at cost, net of an allowance for doubtful accounts that is based on expected collectibility, and such carrying value approximates fair value.
Inventories
Inventories are stated at the lower of cost or market value using the average cost method. Cost includes labor, materials and production overhead, which is based on the normal capacity of our production facilities. Unallocated overhead, including production overhead associated with abnormal production levels, is recognized in “Cost of sales, excluding depreciation, amortization and distribution costs” in our Consolidated Statements of Operations when incurred.
Fixed assets
Fixed assets acquired are stated at acquisition cost less accumulated depreciation and impairment. The cost of the fixed assets is reduced by any investment tax credits or government capital grants received. Depreciation is provided on a straight-line basis over the estimated useful lives of the assets. We capitalize interest on borrowings during the construction period of major capital projects as part of the related asset and amortize the capitalized interest into earnings over the related asset’s remaining useful life. As discussed in Note 1, “Organization and Basis of Presentation – Change in accounting policy for planned major maintenance costs,” we elected to change our accounting policy for planned major maintenance costs to the deferral method, whereby the costs of each planned major maintenance activity are capitalized to “Other current assets” in our Consolidated Balance Sheets and amortized to “Cost of sales, excluding depreciation, amortization and distribution costs” in our Consolidated Statements of Operations on a straight-line basis over the estimated period until the next planned major maintenance activity. All other routine repair and maintenance costs are expensed as incurred.
73
Environmental costs
We expense environmental costs related to existing conditions resulting from past or current operations and from which no current or future benefit is discernible. These costs are included in “Cost of sales, excluding depreciation, amortization and distribution costs” or “Other (expense) income, net” in our Consolidated Statements of Operations. Expenditures that extend the life of the related property are capitalized. We determine our liability on a site-by-site basis and record a liability at the time it is probable and can be reasonably estimated. Such accruals are adjusted as further information develops or circumstances change. Costs of future expenditures for environmental remediation obligations are discounted to their present value when the amount and timing of expected cash payments are reliably determinable.
Amortizable intangible assets
Amortizable intangible assets are stated at cost less accumulated amortization. Amortization is provided on a straight-line basis over the estimated useful lives of the assets.
Impairment of long-lived assets
The unit of accounting for impairment testing for long-lived assets is its group, which includes fixed assets, amortizable intangible assets and liabilities directly related to those assets (herein defined as “asset group”). For asset groups that are held and used, that group represents the lowest level for which identifiable cash flows are largely independent of the cash flows of other asset groups. For asset groups that are to be disposed of by sale or otherwise, that group represents assets to be disposed of together as a group in a single transaction and liabilities directly associated with those assets that will be transferred in the transaction.
Long-lived assets are reviewed for impairment when events or changes in circumstances indicate that the carrying value of an asset group may no longer be recoverable. The recoverability of an asset group that is held and used is tested by comparing the carrying value of the asset group to the sum of the estimated undiscounted future cash flows expected to be generated by that asset group. In estimating the undiscounted future cash flows, we use projections of cash flows directly associated with, and which are expected to arise as a direct result of, the use and eventual disposition of the asset group. If there are multiple plausible scenarios for the use and eventual disposition of an asset group, we assess the likelihood of each scenario occurring in order to determine a probability-weighted estimate of the undiscounted future cash flows. The principal assumptions include periods of operation, projections of product pricing, production levels and sales volumes, product costs, market supply and demand, foreign exchange rates, inflation and projected capital spending. Changes in any of these assumptions could have a material effect on the estimated undiscounted future cash flows expected to be generated by the asset group. If it is determined that an asset group is not recoverable, an impairment loss is recognized in the amount that the asset group’s carrying value exceeds its fair value. The fair value of a long-lived asset group is determined in accordance with our accounting policy for fair value measurements, as discussed below. If it is determined that the carrying value of an asset group is recoverable, we review and adjust, as necessary, the estimated useful lives of the assets in the group.
When an asset group meets the criteria for classification as an asset held for sale, an impairment charge is recognized, if necessary, based on the excess of the asset group’s carrying value over the expected net proceeds from the sale (the estimated fair value minus the estimated costs to sell).
Asset groups to be disposed of other than by sale are classified as held and used until the asset group is disposed or use of the asset group has ceased.
Income taxes
We use the asset and liability approach in accounting for income taxes. Under this approach, deferred income tax assets and liabilities are recognized for the expected future tax consequences attributable to differences between the financial statement carrying amounts of existing assets and liabilities and their respective tax bases. This approach also requires the recording of deferred tax assets related to operating loss and tax credit carryforwards. Deferred income tax assets and liabilities are measured using enacted tax rates applicable when temporary differences and carryforwards are expected to be recovered or settled. We have not provided for U.S. income taxes on the undistributed earnings, if any, of our foreign subsidiaries, as we have specific plans for the reinvestment of such earnings.
Valuation allowances are recognized to reduce deferred income tax assets to the amount that is more likely than not to be realized. In assessing the likelihood of realization, we consider all available positive and negative evidence, including future reversals of existing taxable temporary differences, estimates of future taxable income, past operating results, and prudent and feasible tax planning strategies.
74
Tax benefits related to uncertain tax positions are recorded when it is more likely than not, based on technical merits, that the position will be sustained upon examination by the relevant taxing authorities. The amount of tax benefit recognized may differ from the amount taken or expected to be taken on a tax return. These differences represent unrecognized tax benefits and are reviewed at each reporting period based on facts, circumstances and available evidence. We recognize interest and penalties accrued related to unrecognized tax benefits as a component of the income tax expense.
Pension and OPEB obligations
For our defined benefit plans, we recognize an asset or a liability for pension and OPEB obligations net of the fair value of plan assets. An asset is recognized for a plan’s over-funded status and a liability is recognized for a plan’s under-funded status. Changes in the funding status that have not been recognized in our net periodic benefit costs are reflected as an adjustment to our “Accumulated other comprehensive loss” in our Consolidated Balance Sheets. Net periodic benefit costs are recognized as employees render the services necessary to earn the pension and OPEB. Amounts we contribute to our defined contribution plans are expensed as incurred.
Fair value measurements
Fair value is defined as the price that would be received to sell an asset or paid to transfer a liability (an exit price) in an orderly transaction between market participants at the measurement date, and is based on any principal market for the specific asset or liability. We consider the risk of non-performance of the obligor, which in some cases reflects our own credit risk, in determining fair value. In accordance with FASB ASC 820, “Fair Value Measurements and Disclosures,” we categorize assets and liabilities measured at fair value into one of three different levels depending on the observability of the inputs employed in the measurement. This fair value hierarchy is as follows:
Level 1 - | Valuations based on quoted prices in active markets for identical assets and liabilities. |
Level 2 - | Valuations based on observable inputs, other than Level 1 prices, such as quoted interest or currency exchange rates. |
Level 3 - | Valuations based on significant unobservable inputs that are supported by little or no market activity, such as discounted cash flow methodologies based on internal cash flow forecasts. |
The asset’s or liability’s fair value measurement level within the fair value hierarchy is based on the lowest level of any input that is significant to the fair value measurement. Valuation techniques used in the determination of fair value of our assets and liabilities, when required, maximize the use of observable inputs and minimize the use of unobservable inputs.
Share-based compensation
We amortize the fair value of our stock incentive awards over the requisite service period using the straight-line attribution approach. The requisite service period is reduced for those employees who are retirement eligible at the date of the grant or who will become retirement eligible during the vesting period and who will be entitled to continue vesting in their entire award upon retirement. The fair value of stock options is determined using a Black-Scholes option pricing formula, and the fair value of restricted stock units (“RSUs”) and deferred stock units (“DSUs”) is determined based on the market price of a share of our common stock on the grant date. We estimate forfeitures of stock incentive awards based on historical experience and recognize compensation cost only for those awards expected to vest. Estimated forfeitures are updated to reflect new information or actual experience, as it becomes available.
Any excess tax benefits related to share-based compensation gets recorded in the additional paid-in capital (“APIC”) pool and is available to absorb future tax related deficiencies. If the amount of future tax deficiencies is greater than the available APIC pool, we would record the excess as income tax expense in our Consolidated Statements of Operations. For each of the years ended December 31, 2013, 2012 and 2011 the balance of the APIC pool was zero.
Any cash flows resulting from the tax benefit that arise from the exercise of stock options and the vesting of RSUs and DSUs that exceed the compensation cost recognized (excess tax benefits) are classified as financing cash flows.
Revenue recognition
Pulp, paper and wood products are delivered to our customers in the United States and Canada directly from our mills by either truck or rail. Pulp and paper products delivered to our international customers by ship are sold with international shipping terms. Revenue is recorded when risk of loss and title of the product passes to the customer. For sales with the terms free on board (“FOB”) shipping point, revenue is recorded when the product leaves the mill, whereas for sales transactions FOB
75
destination, revenue is recorded when the product is delivered to the customer’s delivery site, when the title and risk of loss are transferred. Sales are reported net of allowances and rebates, and the following criteria must be met before they are recognized: persuasive evidence of an arrangement exists, delivery has occurred and we have no remaining obligations, prices are fixed or determinable and collectibility is reasonably assured. Sales of our other products (green power produced from renewable sources, recovered paper, wood chips and other wood related products) are recognized when the products are delivered and are included in “Cost of sales, excluding depreciation, amortization and distribution costs” in our Consolidated Statements of Operations.
Net (loss) income per share
We calculate basic net (loss) income per share attributable to Resolute Forest Products Inc. common shareholders by dividing our net (loss) income by the weighted-average number of outstanding common shares. We calculate diluted net income per share attributable to Resolute Forest Products Inc. common shareholders by dividing our net income by the weighted-average number of outstanding common shares, as adjusted for the incremental shares attributable to the dilutive effects of potentially dilutive securities (such as stock options, RSUs and DSUs). The incremental shares are calculated using the treasury stock method (stock options, RSUs and DSUs). To calculate diluted net loss per share attributable to Resolute Forest Products Inc. common shareholders, no adjustments to our basic weighted-average number of outstanding common shares are made, since the impact of potentially dilutive securities (such as stock options, RSUs and DSUs) would be antidilutive.
Translation
The functional currency of the majority of our operations is the U.S. dollar. However, some of these operations maintain their books and records in their local currency in accordance with certain statutory requirements. Non-monetary assets and liabilities of these operations and the related income and expense items such as depreciation and amortization are remeasured into U.S. dollars using historical exchange rates. Remaining assets and liabilities are remeasured into U.S. dollars using the exchange rates as of the balance sheet date. Remaining income and expense items are remeasured into U.S. dollars using an average exchange rate for the period. Gains and losses from foreign currency transactions and from remeasurement of the balance sheet are reported as “Other (expense) income, net” in our Consolidated Statements of Operations.
The functional currency of all other operations is their local currency. Assets and liabilities of these operations are translated into U.S. dollars at the exchange rates in effect as of the balance sheet dates. Income and expense items are translated at average daily or monthly exchange rates for the period. The resulting translation gains or losses are recognized as a component of equity in “Accumulated other comprehensive loss.”
Distribution costs
Distribution costs represent costs associated with handling finished goods and shipping products to customers. Such costs are included in “Distribution costs” in our Consolidated Statements of Operations.
76
Note 3. Acquisition of Fibrek Inc.
On May 2, 2012, in connection with an offer to purchase all of the issued and outstanding shares of Fibrek Inc. (“Fibrek”), a producer and marketer of virgin and recycled kraft pulp operating three mills, we acquired a controlling interest in Fibrek and began consolidating its results of operations, financial position and cash flows in our consolidated financial statements.
Our acquisition of Fibrek was achieved in stages. In connection with the offer, between April 11, 2012 and April 25, 2012, we acquired approximately 48.8% of the then outstanding Fibrek shares. On May 2, 2012 (the “acquisition date”), we acquired additional shares of Fibrek, after which we owned a controlling interest in Fibrek (approximately 50.1% of the then outstanding Fibrek shares) and Fibrek became a consolidated subsidiary. After May 2, 2012, we acquired additional shares of Fibrek and, as of May 17, 2012, the offer expiry date, we owned approximately 74.6% of the then outstanding Fibrek shares. On July 31, 2012, we completed the second step transaction for the remaining 25.4% of the outstanding Fibrek shares.
As aggregate consideration for all of the Fibrek shares we purchased, we distributed approximately 3.3 million shares of our common stock and Cdn$63 million ($63 million, based on the exchange rates in effect on each of the dates we acquired the shares of Fibrek) in cash. See Note 16, “Commitments and Contingencies,” for additional information.
The following summarizes the fair value as of the acquisition date of all of the consideration transferred through May 2, 2012 to acquire our controlling interest in Fibrek:
(In millions) | |||
Cash | $ | 36 | |
Common stock issued (1.9 million shares) | 24 | ||
$ | 60 | ||
The acquisition-date fair value of our common stock issued as part of the consideration transferred for Fibrek was determined based on the closing market price of our common stock on the acquisition date.
The total purchase price was allocated to the identifiable assets acquired and liabilities assumed based on our estimates of their fair values on the acquisition date.
77
The following summarizes our allocation of the purchase price to the fair value of assets acquired and liabilities assumed:
(In millions) | |||
Cash and cash equivalents | $ | 12 | |
Accounts receivable | 60 | ||
Inventories | 63 | ||
Other current assets | 2 | ||
Current assets acquired | 137 | ||
Fixed assets | 161 | ||
Amortizable intangible assets | 52 | ||
Other assets | 1 | ||
Total assets acquired | $ | 351 | |
Accounts payable and accrued liabilities | $ | 70 | |
Short-term bank debt | 36 | ||
Current portion of long-term debt | 2 | ||
Current liabilities assumed | 108 | ||
Long-term debt, net of current portion | 83 | ||
Pension and other postretirement benefit obligations | 39 | ||
Other long-term liabilities | 1 | ||
Total liabilities assumed | $ | 231 | |
Net assets acquired | 120 | ||
Fair value of consideration transferred, including our previously-held interest of $58 million | 60 | ||
Fair value of noncontrolling interest | 60 | ||
$ | 120 | ||
The fair value of the consideration transferred plus the fair value of the noncontrolling interest approximated the fair value of the net assets acquired. Therefore, no goodwill or gain was recognized at the acquisition date. The acquisition-date fair value of the noncontrolling interest in Fibrek was determined based on the market price we paid for Fibrek’s common stock on the acquisition date.
Upon acquisition, we identified amortizable intangible assets related to energy contracts, which had a weighted-average amortization period of approximately 23 years. The fair value of the amortizable intangible assets was determined based on the discounted cash flow method.
Subsequent to acquisition date, we acquired the remaining noncontrolling interest in Fibrek, which we accounted for as equity transactions whereby we adjusted the carrying amount of the noncontrolling interest in Fibrek to reflect the change in our ownership interest in Fibrek. As consideration for this additional equity interest in Fibrek, we distributed approximately 1.4 million shares of our common stock and Cdn$27 million ($27 million, based on the exchange rates in effect on each of the dates we acquired the shares of Fibrek) in cash. Transaction costs of approximately $1 million associated with the acquisition of the noncontrolling interest in Fibrek were recorded in “Additional paid-in capital” in our Consolidated Balance Sheet as of December 31, 2012.
Fibrek’s results of operations have been included in our consolidated financial statements beginning on the acquisition date and are included in the market pulp segment. The amount of Fibrek’s sales and net income included in our Consolidated Statements of Operations were $456 million and $40 million, respectively for the year ended December 31, 2013. The amount of Fibrek's sales and net loss included in our Consolidated Statements of Operations were $268 million and $9 million, respectively, for the year ended December 31, 2012.
78
The following unaudited pro forma information for the years ended December 31, 2012 and 2011 represents our results of operations as if the acquisition of Fibrek had occurred on January 1, 2011. This pro forma information does not purport to be indicative of the results that would have occurred for the periods presented or that may be expected in the future.
(Unaudited, in millions except per share data) | 2012 | 2011 | ||||||
Sales | $ | 4,669 | $ | 5,300 | ||||
Net (loss) income attributable to Resolute Forest Products Inc. | (2 | ) | 53 | |||||
Basic net (loss) income per share attributable to Resolute Forest Products Inc. | (0.02 | ) | 0.53 | |||||
Diluted net (loss) income per share attributable to Resolute Forest Products Inc. | (0.02 | ) | 0.53 | |||||
The unaudited pro forma net (loss) income attributable to Resolute Forest Products Inc. for the years ended December 31, 2012 and 2011 excludes $19 million and $7 million, respectively, of both our and Fibrek’s transaction costs associated with the acquisition.
Note 4. Amortizable Intangible Assets, Net
Amortizable intangible assets, net as of December 31, 2013 and 2012 were comprised of the following:
2013 | 2012 | ||||||||||||||||||||||||
(Dollars in millions) | Estimated Life (Years) | Gross Carrying Value | Accumulated Amortization | Net | Gross Carrying Value | Accumulated Amortization | Net | ||||||||||||||||||
Water rights | 10 – 40 | $ | 19 | $ | 2 | $ | 17 | $ | 19 | $ | 1 | $ | 18 | ||||||||||||
Energy contracts | 15 – 25 | 52 | 3 | 49 | 52 | 1 | 51 | ||||||||||||||||||
$ | 71 | $ | 5 | $ | 66 | $ | 71 | $ | 2 | $ | 69 | ||||||||||||||
In order to operate our hydroelectric generating facility, we draw water from various rivers in Québec. The use of such government-owned waters is governed by water power leases/agreements with the province of Québec, which set out the terms, conditions and fees (as applicable). Terms of these agreements typically range from 10 to 25 years and are generally renewable, under certain conditions. In some cases, the agreements are contingent on the continued operation of the related paper mill and a minimum level of capital spending in the region.
In connection with our acquisition of Fibrek, we identified amortizable intangible assets related to energy contracts. See Note 3, “Acquisition of Fibrek Inc.,” for additional information.
Amortization expense related to amortizable intangible assets for the year ended December 31, 2013 was approximately $3 million and was $1 million for the years ended December 31, 2012 and 2011, respectively. Amortization expense related to amortizable intangible assets is estimated to be approximately $3 million per year for each of the next five years (excluding any accelerated amortization charges that may be required, as discussed above).
79
Note 5. Closure Costs, Impairment and Other Related Charges
Closure costs, impairment and other related charges for the year ended December 31, 2013, were comprised of the following:
(In millions) | Impairment of Assets (1) | Accelerated Depreciation | Pension Plan Curtailment Losses | Severance and Other Costs | Total | |||||||||||||||
Indefinite idlings and extended market-related outage: | ||||||||||||||||||||
Paper machine in Calhoun, Tennessee (2) | $ | — | $ | 44 | $ | — | $ | 6 | $ | 50 | ||||||||||
Kraft mill and paper machines in Fort Frances, Ontario | — | — | 2 | 15 | 17 | |||||||||||||||
Permanent closure: | ||||||||||||||||||||
Paper machine in Iroquois Falls, Ontario (3) | — | 2 | — | 1 | 3 | |||||||||||||||
Restructuring initiative: | ||||||||||||||||||||
Baie-Comeau, Québec paper mill | — | — | 1 | 1 | 2 | |||||||||||||||
Other | 11 | 4 | — | 2 | 17 | |||||||||||||||
$ | 11 | 50 | $ | 3 | $ | 25 | $ | 89 | ||||||||||||
(1) | Due to declining market conditions, we recorded long-lived assets impairment charges related to our recycling assets to reduce the carrying value of the assets to their estimated fair value, which was determined based on estimated market prices for similar assets. |
(2) | Following our acquisition of the noncontrolling interest in Calhoun Newsprint Company (“CNC”), we indefinitely idled a paper machine at the Calhoun mill on March 12, 2013, resulting in accelerated depreciation charges to reduce the carrying value of the assets to reflect their revised estimated remaining useful lives. In 2014, we began to use the machine on an intermittent basis. For additional information regarding our acquisition of the noncontrolling interest in CNC, see Note 7, “Other (Expense) Income, Net.” |
(3) | In October 24, 2013, we announced the permanent closure of a paper machine in Iroquois Falls. The closure is expected to take effect within 6 months of the announcement date. |
80
Closure costs, impairment and other related charges for the year ended December 31, 2012, were comprised of the following:
(In millions) | Impairment of Assets | Accelerated Depreciation | Pension and OPEB Plan Curtailment and Settlement Losses | Severance and Other Costs | Total | |||||||||||||||
Indefinite idlings: | ||||||||||||||||||||
Mersey operations, Nova Scotia (1) | $ | 72 | $ | — | $ | 8 | $ | 15 | $ | 95 | ||||||||||
Kraft mill and paper machine in Fort Frances (2) | 36 | 2 | 1 | 6 | 45 | |||||||||||||||
Paper machine in Catawba, South Carolina (2) | 1 | — | — | — | 1 | |||||||||||||||
Permanent closure: | ||||||||||||||||||||
Paper machine in Laurentide, Québec | — | 18 | — | 4 | 22 | |||||||||||||||
Restructuring initiatives: | ||||||||||||||||||||
Catawba paper mill | — | — | — | 4 | 4 | |||||||||||||||
Baie-Comeau, paper mill | — | — | 3 | 1 | 4 | |||||||||||||||
Lump-sum payments to vested terminated employees (Note 14) | — | — | 7 | — | 7 | |||||||||||||||
Other (2) | 2 | 1 | 2 | 2 | 7 | |||||||||||||||
$ | 111 | $ | 21 | $ | 21 | $ | 32 | $ | 185 | |||||||||||
(1) | We recorded long-lived asset impairment charges (including a $7 million write-down of an asset retirement obligation for environmental liabilities) related to the indefinite idling and subsequent sale of our interest in our Mersey operations, to reduce the carrying value of our net assets to fair value less costs to sell. |
(2) | We recorded long-lived assets impairment charges to reduce the carrying value of the assets to their estimated fair value, which was determined based on the assets’ estimated salvage values. |
Closure costs, impairment and other related charges for the year ended December 31, 2011, were comprised of the following:
(In millions) | Impairment of Assets (1) | Accelerated Depreciation | Pension and OPEB Plan Curtailment Losses | Severance and Other Costs | Total | |||||||||||||||
Permanent closures: | ||||||||||||||||||||
Paperboard production in Coosa Pines, Alabama | $ | 7 | $ | 1 | $ | 3 | $ | 3 | $ | 14 | ||||||||||
Paper machine in Kénogami, Québec | — | 3 | 2 | 5 | 10 | |||||||||||||||
Paper machine in Baie-Comeau | — | 2 | — | — | 2 | |||||||||||||||
Restructuring initiatives: | ||||||||||||||||||||
Mokpo, South Korea paper mill | 6 | — | — | 3 | 9 | |||||||||||||||
Mersey operations | — | — | 3 | 3 | 6 | |||||||||||||||
Calhoun | 3 | — | — | — | 3 | |||||||||||||||
Other | — | 2 | — | — | 2 | |||||||||||||||
$ | 16 | $ | 8 | $ | 8 | $ | 14 | $ | 46 | |||||||||||
(1) | We recorded long-lived assets impairment charges to reduce the carrying value of the assets to their estimated fair value, which was determined based on the assets’ estimated sale or salvage values. |
81
Note 6. Net Gain on Disposition of Assets
During 2013, we sold a parcel of land in Fort Frances and various other assets for total consideration of $2 million, resulting in a net gain on disposition of assets of approximately $2 million.
During 2012, we sold two parcels of land in Gatineau, Québec, our Petit Saguenay, Québec sawmill, our recycling division’s assets located in Phoenix, Arizona, a portion of our Mersey timberlands and subsequently our interest in our Mersey operations and various other assets for total consideration of $55 million, resulting in a net gain on disposition of assets of $35 million.
During 2011, we sold our investment in ACH Limited Partnership (“ACH”), our Alabama River, Alabama paper mill, our Kenora, Ontario paper mill and various other assets for cash proceeds of $315 million, resulting in a net gain on disposition of assets of $3 million.
Note 7. Other (Expense) Income, Net
Other (expense) income, net for the years ended December 31, 2013, 2012 and 2011 was comprised of the following:
(In millions) | 2013 | 2012 | 2011 | |||||||||
Foreign exchange (loss) gain | $ | (24 | ) | $ | 17 | $ | (21 | ) | ||||
Net (loss) gain on extinguishment of debt (Note 13) | (59 | ) | 2 | 6 | ||||||||
Post-emergence costs (1) | (1 | ) | (11 | ) | (47 | ) | ||||||
Gain on forgiveness of note payable (2) | 12 | — | — | |||||||||
Gain on liquidation settlement (3) | 12 | — | — | |||||||||
Income from equity method investments | 3 | 5 | 2 | |||||||||
Interest income | 1 | 5 | 3 | |||||||||
Miscellaneous (expense) income | (6 | ) | 4 | 9 | ||||||||
$ | (62 | ) | $ | 22 | $ | (48 | ) | |||||
(1) | Primarily represents legal and other professional fees for the resolution and settlement of disputed creditor claims, as well as costs for other post-emergence activities associated with the Creditor Protection Proceedings. |
(2) | On March 11, 2013, we acquired the noncontrolling interest in CNC, which was previously owned 51% by us and included in our consolidated financial statements on a fully consolidated basis. As a result, CNC became a wholly-owned subsidiary of ours. In connection with this transaction, we recognized a gain on the forgiveness of a $12 million note issued by CNC. The acquisition of the noncontrolling interest in CNC was accounted for as an equity transaction. |
(3) | On February 2, 2010, Bridgewater Paper Company Limited (“BPCL”), a subsidiary of ours, filed for administration in the United Kingdom pursuant to the United Kingdom Insolvency Act 1986, as amended. As a result, we became a creditor of BPCL and lost control over their operations. In connection with our claims, we received a liquidation settlement of $12 million during 2013. |
82
Note 8. Accumulated Other Comprehensive Loss
The change in our accumulated other comprehensive loss by component (net of tax) for the year ended December 31, 2013 was as follows:
(In millions) | Unamortized Prior Service Credits (1)(3) | Unamortized Actuarial Losses (1)(2)(4)(5) | Foreign Currency Translation | Total | ||||||||||||
Balance as of December 31, 2012 | $ | 21 | $ | (640 | ) | $ | 5 | $ | (614 | ) | ||||||
Other comprehensive income (loss) before reclassifications | 1 | 328 | (4 | ) | 325 | |||||||||||
Amounts reclassified from accumulated other comprehensive loss (6) | (4 | ) | 22 | — | 18 | |||||||||||
Net current period other comprehensive (loss) income | (3 | ) | 350 | (4 | ) | 343 | ||||||||||
Balance as of December 31, 2013 | $ | 18 | $ | (290 | ) | $ | 1 | $ | (271 | ) | ||||||
(1) | In 2013, following the introduction of the health insurance exchange system, we approved an amendment to our U.S. OPEB plan, whereby salaried post-65 retirees will be provided Medicare coverage via a Medicare Exchange program, effective January 1, 2014. As a result of this plan amendment, “Pension and other postretirement benefit obligations” and “Accumulated other comprehensive loss” in our Consolidated Balance Sheet as of December 31, 2013, were decreased by $57 million and $35 million (net of tax of $22 million), respectively, and consisted of $13 million (net of tax of $8 million ) of unamortized prior service credits and $22 million (net of tax of $14 million) of unamortized actuarial losses. |
(2) | In 2013, we announced a workforce reduction at our Baie-Comeau paper mill, which will result in the elimination of approximately 90 positions. As a result, “Pension and other postretirement benefit obligations” and “Accumulated other comprehensive loss” in our Consolidated Balance Sheet as of December 31, 2013 were decreased by $8 million and $6 million (net of tax of $2 million), respectively. |
(3) | Following the restart of our previously closed Gatineau paper mill, 119 employees were reinstated to our pension plans in 2013. As a result, “Pension and other postretirement benefit obligations” and “Accumulated other comprehensive loss” in our Consolidated Balance Sheet as of December 31, 2013 were increased by $18 million and $13 million (net of tax of $5 million), respectively. |
(4) | We recorded certain adjustments associated with our previously reported pension and OPEB obligations in 2013. As a result, “Pension and other postretirement benefit obligations” and “Accumulated other comprehensive loss” in our Consolidated Balance Sheet as of December 31, 2013 were decreased by $27 million and $17 million (net of tax of $10 million), respectively. |
(5) | On January 14, 2014, we announced an extended period of market-related outage at a paper mill in Fort Frances, which, if the mill remains idled, would result in the elimination of approximately 150 positions. As a result, “Pension and other postretirement benefit obligations” and “Accumulated other comprehensive loss” in our Consolidated Balance Sheet as of December 31, 2013 was decreased by $27 million and $20 million (net of tax of $7 million), respectively. |
(6) | See the table below for details about these reclassifications. |
83
The reclassifications out of accumulated other comprehensive loss for the year ended December 31, 2013 were comprised of the following:
(In millions) | Amounts Reclassified From Accumulated Other Comprehensive Loss | Affected Line in the Consolidated Statements of Operations | |||
Unamortized Prior Service Credits | |||||
Amortization and curtailments of prior service credits | $ | (3 | ) | Cost of sales, excluding depreciation, amortization and distribution costs (1) | |
(3 | ) | Closure costs, impairment and other related charges (1) | |||
2 | Income tax (provision) benefit | ||||
$ | (4 | ) | Net of tax | ||
Unamortized Actuarial Losses | |||||
Amortization and curtailments of actuarial losses | $ | 23 | Cost of sales, excluding depreciation, amortization and distribution costs (1) | ||
7 | Closure costs, impairment and other related charges (1) | ||||
(8 | ) | Income tax (provision) benefit | |||
$ | 22 | Net of tax | |||
Total Reclassifications | $ | 18 | Net of tax | ||
(1) | These items are included in the computation of net periodic benefit cost related to our pension and OPEB plans summarized in Note 14, “Pension and Other Postretirement Benefit Plans.” |
Note 9. Net (Loss) Income Per Share
The weighted-average number of common shares outstanding used to calculate basic and diluted net (loss) income per share attributable to Resolute Forest Products Inc. common shareholders for the years ended December 31, 2013, 2012 and 2011 was as follows:
(In millions) | 2013 | 2012 | 2011 | |||
Basic weighted-average number of common shares outstanding | 94.7 | 97.4 | 97.1 | |||
Diluted weighted-average number of common shares outstanding | 94.7 | 97.5 | 97.1 | |||
No adjustments to net (loss) income attributable to Resolute Forest Products Inc. common shareholders were necessary to calculate basic and diluted net (loss) income per share for all periods presented.
The weighted-average number of option shares and equity-classified RSUs and DSUs outstanding for the years ended December 31, 2013, 2012 and 2011 was as follows:
(In millions) | 2013 (1) | 2012 (2) | 2011 (2) | |||
Option shares | 2.0 | 1.5 | 0.9 | |||
RSUs and DSUs | 1.0 | 0.8 | 0.4 | |||
(1) | These option shares and RSUs and DSUs were excluded from the calculation of diluted net loss per share as the impact would have been antidilutive. |
(2) | The dilutive impact of these option shares and RSUs and DSUs on the weighted-average number of common shares outstanding used to calculate diluted net income per share was nominal. |
84
Note 10. Inventories, Net
Inventories, net as of December 31, 2013 and 2012 were comprised of the following:
(In millions) | 2013 | 2012 | ||||||
Raw materials and work in process | $ | 153 | $ | 181 | ||||
Finished goods | 195 | 201 | ||||||
Mill stores and other supplies | 181 | 176 | ||||||
$ | 529 | $ | 558 | |||||
In 2013, we recorded charges for write-downs of mill stores and other supplies of $11 million primarily related to the indefinite idling of a paper machine in Calhoun and an extended period of market-related outage for a paper machine in Fort Frances. In 2012, we recorded charges of $12 million for write-downs of mill stores and other supplies as a result of the indefinite idling of our Mersey newsprint mill, the permanent closure of a paper machine at our Laurentide paper mill and the indefinite idling of the kraft mill and a paper machine at our Fort Frances pulp and paper mill. These charges were included in “Cost of sales, excluding depreciation, amortization and distribution costs” in our Consolidated Statements of Operations.
Note 11. Fixed Assets, Net
Fixed assets, net as of December 31, 2013 and 2012 were comprised of the following:
(Dollars in millions) | Range of Estimated Useful Lives in Years | 2013 | 2012 | ||||||
Land and land improvements | 1 – 10 | $ | 89 | $ | 88 | ||||
Buildings | 7 – 40 | 291 | 289 | ||||||
Machinery and equipment | 3 – 40 | 2,239 | 2,090 | ||||||
Hydroelectric power plants | 10 – 40 | 286 | 283 | ||||||
Timberlands and timberlands improvements | 4 – 20 | 83 | 70 | ||||||
Construction in progress | 61 | 91 | |||||||
3,049 | 2,911 | ||||||||
Less: Accumulated depreciation | (760 | ) | (471 | ) | |||||
$ | 2,289 | $ | 2,440 | ||||||
Note 12. Accounts Payable and Accrued Liabilities
Accounts payable and accrued liabilities as of December 31, 2013 and 2012 were comprised of the following:
(In millions) | 2013 | 2012 | ||||||
Trade accounts payable | $ | 361 | $ | 368 | ||||
Payroll, bonuses and severance payable | 97 | 109 | ||||||
Accrued interest | 5 | 12 | ||||||
Pension and OPEB obligations | 24 | 30 | ||||||
Income and other taxes payable | 6 | 8 | ||||||
Claims payable | — | 4 | ||||||
Other | 40 | 50 | ||||||
$ | 533 | $ | 581 | |||||
85
Note 13. Long-Term Debt
Overview
Long-term debt, including current portion, as of December 31, 2013 and 2012, was comprised of the following:
(In millions) | 2013 | 2012 | ||||||
5.875% senior notes due 2023: | ||||||||
Principal amount | $ | 600 | $ | — | ||||
Unamortized discount | (5 | ) | — | |||||
Total senior notes due 2023 | 595 | — | ||||||
10.25% senior secured notes due 2018: | ||||||||
Principal amount | — | 501 | ||||||
Unamortized premium | — | 27 | ||||||
Total senior secured notes due 2018 | — | 528 | ||||||
Other debt: | ||||||||
PSIF – Investissement Québec loan | 1 | 3 | ||||||
Capital lease obligation | 3 | 3 | ||||||
Total other debt | 4 | 6 | ||||||
Total debt | 599 | 534 | ||||||
Less: Current portion of long-term debt | (2 | ) | (2 | ) | ||||
Long-term debt, net of current portion | $ | 597 | $ | 532 | ||||
Senior notes
2023 Notes
On May 8, 2013, we issued $600 million aggregate principal amount of 5.875% senior notes due 2023 (the “2023 Notes”) pursuant to an indenture as of that date (the “indenture”). Upon their issuance, the 2023 Notes were recorded at their fair value of $594 million, which reflected a discount of $6 million that is being amortized to interest expense using the interest method over the term of the notes, resulting in an effective interest rate of 6.0%. Interest on the notes is payable semi-annually on May 15 and November 15 of each year, beginning November 15, 2013, until their maturity date of May 15, 2023.
The notes are guaranteed by all of our existing and subsequently acquired or organized direct or indirect wholly-owned U.S. subsidiaries (the “guarantors”) that guarantee the ABL Credit Facility (as defined and discussed below). The notes are unsecured and effectively junior to indebtedness under the ABL Credit Facility to the extent of the value of the collateral that secures the ABL Credit Facility and to future secured indebtedness. In addition, the notes are structurally subordinated to all existing and future liabilities of our subsidiaries that do not guarantee the notes.
The terms of the indenture impose certain restrictions, subject to a number of exceptions and qualifications, including limits on our ability to: incur, assume or guarantee additional indebtedness; issue redeemable stock and preferred stock; pay dividends or make distributions or redeem or repurchase capital stock; prepay, redeem or repurchase certain debt; make loans and investments; incur liens; issue dividends, make loans or transfer assets from our subsidiaries; sell or otherwise dispose of assets, including capital stock of subsidiaries; consolidate or merge with or into, or sell substantially all of our assets to, another person; enter into transactions with affiliates; and enter into new lines of business.
At any time prior to May 15, 2017, we may redeem some or all of the notes at a redemption price of 100% of the principal amount, plus accrued and unpaid interest and a “make-whole” premium. We may redeem up to 35% of the notes before May 15, 2016 using proceeds from certain equity offerings at a price of 105.875% of the principal amount. In the event of a change of control, each holder will have the right to require us to repurchase all or any part of that holder’s notes at a purchase price in cash equal to 101% of the aggregate principal amount of the notes plus any accrued and unpaid interest. If we sell certain of our assets and do not use the proceeds to pay down certain indebtedness, purchase additional assets or make capital expenditures, each as specified in the indenture, we must offer to purchase the notes at a redemption price of 100% of the principal amount thereof plus accrued and unpaid interest with the net cash proceeds from the asset sale.
86
On or after May 15, 2017, the 2023 Notes will be redeemable, in whole or in part, at redemption prices equal to a percentage of the principal amount plus accrued and unpaid interest, as follows:
Year (beginning May 15) | Redemption Price |
2017 | 104.406% |
2018 | 102.938% |
2019 | 101.469% |
2020 and thereafter | 100.000% |
In connection with the offering of the 2023 Notes, we and the guarantors entered into a registration rights agreement, dated as of May 8, 2013, with the initial purchasers of the 2023 Notes. Under the terms of the registration rights agreement, we agreed to use our commercially reasonable efforts to file with the SEC and cause to become effective a registration statement relating to an offer (which we refer to as the “exchange offer”) to: (i) exchange the 2023 Notes for registered notes (which we refer to as the “exchange notes”), with substantially the same terms as the 2023 Notes; and (ii) exchange the guarantees related to the 2023 Notes for registered guarantees relating to the exchange notes, with substantially the same terms as the original guarantees. We have agreed to use our commercially reasonable efforts to cause the exchange offer to be completed within 400 days after the issuance of the 2023 Notes. In addition, we have agreed to file (and seek effectiveness of) a shelf registration statement, in certain circumstances, that would allow certain holders to offer some or all of the 2023 Notes to the public.
If the exchange offer is not so completed, or if the shelf registration statement is not effective in the required circumstances, the annual interest rate on the 2023 Notes will increase by 0.25% per annum for the first 90-day period following the event triggering the increase. The interest rate on the 2023 Notes will increase by 0.25% per annum at the beginning of each subsequent 90-day period, up to a maximum of 1.0% additional interest per annum, until the exchange offer is completed or the shelf registration statement is filed, as applicable.
The fair value of the 2023 Notes was $554 million as of December 31, 2013 and was determined by reference to over-the-counter prices (Level 2).
In connection with the issuance of the notes, we incurred fees of approximately $9 million, which were recorded as deferred financing costs in “Other assets” in our Consolidated Balance Sheet as of December 31, 2013, and are being amortized to interest expense using the interest method over the term of the notes.
2018 Notes
In connection with our emergence from the Creditor Protection Proceedings in 2010, we issued $850 million in aggregate principal amount of 10.25% senior secured notes, with a maturity date of October 15, 2018 (the “2018 Notes”). On June 13, 2011, in accordance with the terms of the 2018 Notes indenture, we applied the first $100 million of net proceeds from our May 27, 2011 sale of our investment in ACH Limited Partnership to redeem $94 million of principal amount of the 2018 Notes at a redemption price of 105% of the principal amount, plus accrued and unpaid interest. Additionally, on each of June 29, 2011, November 4, 2011 and October 10, 2012, we redeemed $85 million of principal amount of the 2018 Notes at a redemption price of 103% of the principal amount, plus accrued and unpaid interest.
On May 8, 2013, we used the proceeds of the sale of the 2023 Notes to purchase $496 million aggregate principal amount of the 2018 Notes, or 99% of the outstanding amount, in connection with the tender offer and consent solicitation that expired on May 21, 2013. Aggregate consideration for the purchase was $584 million, including accrued and unpaid interest of $4 million, and in connection therewith, we entered into a supplemental indenture to implement certain changes to the 2018 Notes indenture and to release the collateral securing the 2018 Notes. We then redeemed the remaining $5 million of principal amount of the 2018 Notes on October 8, 2013, at a redemption price of 103% of the principal amount, plus accrued and unpaid interest.
As a result of these redemptions, we recorded a loss on extinguishment of debt of $59 million (net of $25 million write-down of unamortized premium) for the year ended December 31, 2013 as well as net gains on extinguishment of debt of $2 million and $6 million during the years ended December 31, 2012 and 2011, respectively, which were included in “Other (expense) income, net” in our Consolidated Statements of Operations.
ABL Credit Facility
In 2010, we and three of our wholly-owned subsidiaries, Resolute FP US Inc., and Abibow Recycling LLC (collectively, the “U.S. Borrowers”) and Resolute FP Canada Inc. (the “Canadian Borrower” and, together with the U.S. Borrowers, the “Borrowers”), entered into a senior secured asset-based revolving credit facility (the “ABL Credit Facility”) with a syndicate of
87
lenders. The proceeds of the ABL Credit Facility can be used by us for, among other things, working capital, capital expenditures, permitted acquisitions and other general corporate purposes.
On April 29, 2013, we entered into an Incremental Commitment Agreement with respect to the credit agreement that governs the ABL Credit Facility, increasing the aggregate amount of the ABL Credit Facility from $600 million to $665 million. The ABL Credit Facility, as so increased, matures on October 28, 2016 and provides for an asset-based, revolving credit facility with an aggregate lender commitment of up to $665 million at any time outstanding, subject to borrowing base availability, including a $60 million swingline sub-facility and a $200 million letter of credit sub-facility. The ABL Credit Facility includes a $465 million tranche available to the Borrowers and a $200 million tranche available solely to the U.S. Borrowers, in each case subject to the borrowing base availability of those Borrowers. The ABL Credit Facility also provides for an uncommitted incremental loan facility of up to $135 million, subject to certain terms and conditions set forth in the ABL Credit Facility.
Revolving loan (and letter of credit) availability under the ABL Credit Facility is subject to borrowing base availability, which at any time is equal to, for the Borrowers, the sum of: (i) 85% of eligible accounts receivable plus (ii) the lesser of 65% of eligible inventory or 85% of the net orderly liquidation value of eligible inventory, minus certain reserves.
The obligations of the U.S. Borrowers under the ABL Credit Facility are guaranteed by each of the other U.S. Borrowers and certain of our material U.S. subsidiaries (the “U.S. Guarantors”), and secured by first priority liens on and security interests in substantially all of the assets of the U.S. Borrowers and the U.S. Guarantors and by first priority liens on the capital stock of the subsidiaries (limited to 65% of the capital stock in first tier foreign subsidiaries) now owned or acquired in the future by Resolute Forest Products Inc. and the U.S. Guarantors. The obligations of the Canadian Borrower under the ABL Credit Facility are guaranteed by each of the other Borrowers, the U.S. Guarantors and certain of our material Canadian subsidiaries (the “Canadian Guarantors” and, together with the U.S. Guarantors, the “Guarantors”), and are secured by first priority liens on and security interests in accounts receivable, inventory and related assets of the Canadian Borrower and the Canadian Guarantors and by first priority liens on and security interests in substantially all of the assets of the U.S. Borrowers and the U.S. Guarantors.
Borrowings under the ABL Credit Facility bear interest at a rate equal to, at the Borrower’s option, the base rate, the Canadian prime rate or the Eurodollar rate, in each case plus an applicable margin. The base rate under the ABL Credit Facility equals the greater of: (i) a specified base rate, (ii) the Federal Funds rate plus 0.5%, (iii) a specified rate for certificates of deposit having a term of three months plus 0.5% or (iv) the Eurodollar rate for a one month interest period plus 1.0%. The interest rate margin applicable to borrowings under the ABL Credit Facility, as amended, is 1.75% – 2.25% per annum with respect to Eurodollar rate and bankers’ acceptance rate borrowings and 0.75% – 1.25% per annum with respect to base rate and Canadian prime rate borrowings, in each case depending on historic excess availability under the ABL Credit Facility. The applicable margin is subject, in each case, to monthly pricing adjustments based on the average monthly historic excess availability under the ABL Credit Facility.
In addition to paying interest on the outstanding borrowings under the ABL Credit Facility, the Borrowers are required to pay a fee in respect of unutilized commitments. The unutilized commitment fee payable by the Borrowers under the ABL Credit Facility, as amended, is 0.375% – 0.50% per annum, subject to monthly pricing adjustments based on the unutilized commitment of the ABL Credit Facility. The Borrowers must also pay a fee on outstanding letters of credit under the ABL Credit Facility at a rate equal to the applicable margin in respect of Eurodollar borrowings, plus a facing fee as agreed to in writing from time to time, and certain administrative fees.
The Borrowers are able to voluntarily repay outstanding loans and reduce unused commitments, in each case, in whole or in part, at any time without premium or penalty. The Borrowers are required to repay outstanding loans anytime the outstanding loans exceed the maximum availability then in effect. The Borrowers are also required to use net proceeds from certain significant asset sales to repay outstanding loans, but may re-borrow following such prepayments if the conditions to borrowings are met.
The ABL Credit Facility contains customary covenants for asset-based credit agreements of this type, including, among other things: (i) requirements to deliver financial statements, other reports and notices; (ii) restrictions on the existence or incurrence and repayment of indebtedness; (iii) restrictions on the existence or incurrence of liens; (iv) restrictions on making certain restricted payments; (v) restrictions on making certain investments; (vi) restrictions on certain mergers, consolidations and asset dispositions; (vii) restrictions on transactions with affiliates; (viii) restrictions on amendments or modifications to the Canadian pension and benefit plans and (ix) restrictions on modifications to material indebtedness. Additionally, a minimum consolidated fixed charge coverage ratio of 1.0:1.0 is required if at any time excess availability falls below the greater of: (i) $60 million and (ii) 12.5% of the lesser of (A) the total commitments and (B) the borrowing base then in effect. Subject to customary grace periods and notice requirements, the ABL Credit Facility also contains customary events of default.
88
On February 25, 2014, the ABL Credit Facility was amended. For additional information see Note 23, “Subsequent Events.”
As of December 31, 2013, the Borrowers had no borrowings and $39 million of letters of credit outstanding under the ABL Credit Facility. As of December 31, 2013, we had $561 million of availability under the ABL Credit Facility, which was comprised of $345 million for the U.S. Borrowers and $216 million for the Canadian Borrower.
The carrying value of assets pledged as collateral for our total debt obligations was approximately $3.1 billion as of December 31, 2013.
Other debt
We assumed Fibrek’s outstanding indebtedness on the acquisition date. As of December 31, 2012, Fibrek’s term loan and credit facility, totaling $112 million of principal, were repaid in full, plus accrued and unpaid interest, and the related agreements were cancelled and terminated.
PSIF – Investissement Québec
On February 23, 2007, Investissement Québec granted Fibrek a Cdn$6 million interest-free loan through the Soutien à l’industrie forestière program (“PSIF”), payable in monthly installments over a maximum of 4 years, starting December 31, 2010. As of December 31, 2013, the fair value of the loan approximated its carrying value of $1 million. The fair value was determined by discounting the cash flows using a current interest rate (4.4%) for financial instruments with similar characteristics and maturities (Level 3).
Capital lease obligation
We have a capital lease obligation for a warehouse, which can be renewed for 20 years at our option. Minimal payments are determined by an escalatory price clause.
Note 14. Pension and Other Postretirement Benefit Plans
We have multiple contributory and non-contributory defined benefit pension plans covering a significant portion of our U.S. and Canadian employees. We also sponsor a number of OPEB plans (e.g., defined benefit health care and life insurance plans) for retirees at certain locations. Benefits are based on years of service and, depending on the plan, average compensation earned by employees either during their last years of employment or over their careers. Our plan assets and cash contributions to the plans have been sufficient to provide pension benefits to participants and meet the funding requirements of the Employee Retirement Income Security Act of 1974 in the United States as well as applicable legislation in Canada. In particular, the cash contributions required for our material registered Canadian pension plans are specified in the funding relief regulations with regards to the solvency deficits in the affected plans, as further discussed below under “Canadian pension funding.”
In addition to the previously described plans, we have a number of defined contribution plans covering substantially all of our U.S. employees and a significant portion of our Canadian employees. Under the U.S. defined contribution plans, employees are allowed to contribute to these plans and we make matching contributions. In addition, under the U.S. defined contribution plans, most non-union employees also receive an automatic company contribution, regardless of the employee’s contribution. The amount of the automatic company contribution is a percentage of the employee’s pay, determined based on age and years of service. The Canadian registered defined contribution plans provide for mandatory contributions by employees and by us, as well as opportunities for employees to make additional optional contributions and receive, in some cases, matching contributions on those optional amounts. Our expense for the defined contribution plans totaled $22 million in 2013, $21 million in 2012 and $22 million in 2011.
Certain of the above plans are covered under collective bargaining agreements.
The following tables include both our foreign (Canada and South Korea) and domestic (U.S.) plans. The assumptions used to measure the obligations of each of our foreign and domestic plans are not significantly different from each other, with the exception of the health care trend rates, which are presented below, and the mortality rates revised in 2013 for our Canadian plans to reflect the increase in life expectancy based on the findings of the Canadian Institute of Actuaries.
89
The changes in our pension and OPEB obligations and plan assets for the years ended December 31, 2013 and 2012 and the funded status and reconciliation of amounts recognized in our Consolidated Balance Sheets as of December 31, 2013 and 2012 were as follows:
Pension Plans | OPEB Plans | ||||||||||||||||
(In millions) | 2013 | 2012 | 2013 | 2012 | |||||||||||||
Change in benefit obligations: | |||||||||||||||||
Benefit obligations as of beginning of year | $ | 6,724 | $ | 6,411 | $ | 424 | $ | 404 | |||||||||
Service cost | 33 | 36 | 3 | 3 | |||||||||||||
Interest cost | 274 | 312 | 16 | 20 | |||||||||||||
Actuarial (gain) loss | (208 | ) | 488 | (79 | ) | 13 | |||||||||||
Participant contributions | 18 | 15 | 5 | 5 | |||||||||||||
Plan amendments | 18 | (30 | ) | (21 | ) | — | |||||||||||
Curtailments and settlements | 1 | (51 | ) | — | — | ||||||||||||
Acquisition | — | 133 | — | 3 | |||||||||||||
Divestiture | — | (239 | ) | — | (4 | ) | |||||||||||
Benefits paid | (489 | ) | (506 | ) | (27 | ) | (25 | ) | |||||||||
Effect of foreign currency exchange rate changes | (367 | ) | 155 | (11 | ) | 5 | |||||||||||
Benefit obligations as of end of year | 6,004 | 6,724 | 310 | 424 | |||||||||||||
Change in plan assets: | |||||||||||||||||
Fair value of plan assets as of beginning of year | 5,175 | 5,259 | — | — | |||||||||||||
Actual return on plan assets | 472 | 348 | — | — | |||||||||||||
Employer contributions | 133 | 103 | 22 | 20 | |||||||||||||
Participant contributions | 18 | 15 | 5 | 5 | |||||||||||||
Settlements | (6 | ) | (62 | ) | — | — | |||||||||||
Acquisition | — | 97 | — | — | |||||||||||||
Divestiture | — | (209 | ) | — | — | ||||||||||||
Benefits paid | (489 | ) | (506 | ) | (27 | ) | (25 | ) | |||||||||
Effect of foreign currency exchange rate changes | (290 | ) | 130 | — | — | ||||||||||||
Fair value of plan assets as of end of year | 5,013 | 5,175 | — | — | |||||||||||||
Funded status as of end of year | $ | (991 | ) | $ | (1,549 | ) | $ | (310 | ) | $ | (424 | ) | |||||
Amounts recognized in our Consolidated Balance Sheets consisted of: | |||||||||||||||||
Other assets | $ | 17 | $ | 3 | $ | — | $ | — | |||||||||
Accounts payable and accrued liabilities | (3 | ) | (4 | ) | (21 | ) | (26 | ) | |||||||||
Pension and OPEB obligations | (1,005 | ) | (1,548 | ) | (289 | ) | (398 | ) | |||||||||
Net obligations recognized | $ | (991 | ) | $ | (1,549 | ) | $ | (310 | ) | $ | (424 | ) | |||||
The total benefit obligations and the total fair value of plan assets for pension plans with benefit obligations in excess of plan assets were $5,079 million and $4,071 million, respectively, as of December 31, 2013, and were $6,630 million and $5,078 million, respectively, as of December 31, 2012. The total accumulated benefit obligations and the total fair value of plan assets for pension plans with accumulated benefit obligations in excess of plan assets were $5,014 million and $4,071 million, respectively, as of December 31, 2013, and were $6,546 million and $5,078 million, respectively, as of December 31, 2012. The total accumulated benefit obligations for all pension plans were $5,931 million and $6,639 million as of December 31, 2013 and 2012, respectively.
In 2013, following the introduction of the health insurance exchange system, we approved an amendment to our U.S. OPEB plan, whereby salaried post-65 retirees will be provided Medicare coverage via a Medicare Exchange program, effective
90
January 1, 2014. This plan amendment resulted in a prior service credit of $21 million and an actuarial gain of $36 million. Also, following the restart of our previously closed Gatineau paper mill, 119 employees were reinstated to our pension plans in 2013, which resulted in a prior service cost of $18 million. For additional information on these plan amendments, see Note 8, “Accumulated Other Comprehensive Loss.”
In 2012, following the renewal of the 2009 collective agreements in our Canadian pulp and paper mills, we cancelled 2011 and 2013 ad hoc indexations as part of the emergence from the Creditor Protection Proceedings. This plan amendment resulted in a prior service credit of $30 million.
These changes were recorded in “Pension and other postretirement benefit obligations” in our Consolidated Balance Sheets. The prior service (credits) cost and the actuarial gain are amortized to “Cost of sales, excluding depreciation, amortization and distribution costs” in our consolidated statements of operations, over the expected average remaining service lifetime of the respective plans.
The components of net periodic benefit cost relating to our pension and OPEB plans for the years ended December 31, 2013, 2012 and 2011 were as follows:
A detail of amounts included in “Accumulated other comprehensive loss” in our Consolidated Balance Sheets can be found in Note 8, “Accumulated Other Comprehensive Loss.” We estimate that $4 million of prior service credits, net of actuarial losses, will be amortized from accumulated other comprehensive loss into our Consolidated Statements of Operations in 2014.
Pension Plans | OPEB Plans | ||||||||||||||||||||||||
(In millions) | 2013 | 2012 | 2011 | 2013 | 2012 | 2011 | |||||||||||||||||||
Service cost | $ | 33 | $ | 36 | $ | 35 | $ | 3 | $ | 3 | $ | 3 | |||||||||||||
Interest cost | 274 | 312 | 335 | 16 | 20 | 22 | |||||||||||||||||||
Expected return on plan assets | (308 | ) | (340 | ) | (351 | ) | — | — | — | ||||||||||||||||
Amortization of prior service (credits) costs | (2 | ) | — | 2 | (1 | ) | — | — | |||||||||||||||||
Amortization of actuarial losses (gains) | 25 | — | — | (2 | ) | — | — | ||||||||||||||||||
Net periodic benefit cost before special events | 22 | 8 | 21 | 16 | 23 | 25 | |||||||||||||||||||
Curtailments and settlements | 3 | 21 | 5 | — | — | 3 | |||||||||||||||||||
$ | 25 | $ | 29 | $ | 26 | $ | 16 | $ | 23 | $ | 28 | ||||||||||||||
The following is a summary of the special events that impacted our net periodic benefit costs as a curtailment or settlement for the years ended December 31, 2013, 2012 and 2011:
Pension Plans | OPEB Plans | ||||||||||||||||||||||||
(In millions) | 2013 | 2012 | 2011 | 2013 | 2012 | 2011 | |||||||||||||||||||
Settlements resulting from lump-sum payouts or plan liquidations and wind-ups | $ | — | $ | 10 | $ | 3 | $ | — | $ | — | $ | — | |||||||||||||
Curtailments and settlements resulting from the closure of mills or paper machines and other mill restructurings | 3 | 11 | 2 | — | — | 3 | |||||||||||||||||||
$ | 3 | $ | 21 | $ | 5 | $ | — | $ | — | $ | 3 | ||||||||||||||
On January 14, 2014, we announced an extended period of market-related outage at a paper mill in Fort Frances, which, if the mill remains idled, would result in the elimination of approximately 150 positions. In 2013, we announced a workforce reduction at our Baie-Comeau paper mill, which will result in the elimination of approximately 90 positions. The cost of these curtailments were included in “Closure costs, impairment, and other related charges” in our Consolidated Statements of Operations for the year ended December 31, 2013.
In 2012, we recorded charges for curtailments and settlements primarily related to the indefinite idling of part of our Mersey operations (eliminating 176 positions), a workforce reduction at our Baie-Comeau paper mill (eliminating 90 positions) and the lump-sum payments for the vested terminated employees in certain of our U.S. pension plans. The cost of these curtailments and settlements was included in “Closure costs, impairment and other related charges” in our Consolidated Statements of Operations for the year ended December 31, 2012.
91
In 2011, we ceased paperboard production at our Coosa Pines paper mill (eliminating 137 positions), reduced the workforce at our Mersey operations (eliminating 97 positions), permanently closed a paper machine at our Kénogami paper mill (eliminating 130 positions) and liquidated, either partially or fully, two of our pension plans. The cost of these curtailments was included in “Closure costs, impairment and other related charges” in our Consolidated Statements of Operations for the year ended December 31, 2011.
Assumptions used to determine benefit obligations and net periodic benefit cost
The weighted-average assumptions used to determine the benefit obligations at the measurement dates and the net periodic benefit cost for the years ended December 31, 2013, 2012 and 2011 were as follows:
Pension Plans | OPEB Plans | ||||||||||||||||
2013 | 2012 | 2011 | 2013 | 2012 | 2011 | ||||||||||||
Benefit obligations: | |||||||||||||||||
Discount rate | 4.9 | % | 4.3 | % | 4.9 | % | 5.0 | % | 4.2 | % | 4.9 | % | |||||
Rate of compensation increase | 2.5 | % | 2.5 | % | 1.2 | % | — | — | — | ||||||||
Net periodic benefit cost: | |||||||||||||||||
Discount rate | 4.3 | % | 4.9 | % | 5.5 | % | 4.2 | % | 4.9 | % | 5.6 | % | |||||
Expected return on assets | 6.3 | % | 6.5 | % | 6.6 | % | — | — | — | ||||||||
Rate of compensation increase | 2.5 | % | 1.2 | % | 0.9 | % | — | — | — | ||||||||
The discount rate for our domestic and foreign plans was determined with a model that develops a hypothetical high-quality bond portfolio, where the bonds are theoretically purchased to settle the expected benefit payments of the plans. The discount rate reflects the single rate that produces the same discounted values as the value of the theoretical bond portfolio. In determining the expected return on assets, we considered the historical returns and the future expectations for returns for each asset class, as well as the target asset allocation of the pension portfolio. In determining the rate of compensation increase, we reviewed historical salary increases and promotions, while considering current industry conditions, the terms of collective bargaining agreements with our employees and the outlook for our industry. For the mortality rate of our domestic plans, we used recently-issued actuarially-determined mortality tables that were consistent with our historical mortality experience and future expectations for mortality of the employees who participate in our domestic pension and OPEB plans. The mortality rate for our foreign plans was established using the recently-issued actuarially-determined mortality table reflecting a longer life expectancy, combined with the result of our historical mortality experience study that were consistent with our future expectations for mortality of the employees who participate in our foreign pension and OPEB plans.
The assumed health care cost trend rates used to determine the benefit obligations for our domestic and foreign OPEB plans as of December 31, 2013 and 2012 were as follows:
2013 | 2012 | ||||||||||||
Domestic Plans | Foreign Plans | Domestic Plans | Foreign Plans | ||||||||||
Health care cost trend rate assumed for next year | 7.5 | % | 4.4 | % | 7.0 | % | 4.4 | % | |||||
Rate to which the cost trend rate is assumed to decline (ultimate trend rate) | 4.5 | % | 3.8 | % | 4.5 | % | 2.9 | % | |||||
Year that the rate reaches the ultimate trend rate | 2028 | 2033 | 2028 | 2031 | |||||||||
For the health care cost trend rates, we considered historical trends for these costs, actual experience of the plans, recently enacted health care legislation as well as future expectations.
Variations in this health care cost trend rate can have a significant effect on the amounts reported. A 1% change in this assumption would have had the following impact on our 2013 OPEB obligation and costs for our domestic and foreign plans:
1% Increase | 1% Decrease | ||||||||||||||||||||||||||||
(Dollars in millions) | Domestic Plans | Foreign Plans | Domestic Plans | Foreign Plans | |||||||||||||||||||||||||
Benefit obligation | $ | 23 | 13 | % | $ | 6 | 4 | % | $ | (18 | ) | (11 | )% | $ | (5 | ) | (4 | )% | |||||||||||
Service and interest costs | $ | 2 | 23 | % | $ | — | 6 | % | $ | (2 | ) | (18 | )% | $ | — | (5 | )% | ||||||||||||
92
Fair value of plan assets
The fair value of plan assets held by our pension plans as of December 31, 2013 was as follows:
(In millions) | Total | Level 1 | Level 2 | Level 3 | ||||||||||||
Equity securities: | ||||||||||||||||
U.S. companies | $ | 751 | $ | 751 | $ | — | $ | — | ||||||||
Non-U.S. companies | 912 | 636 | 276 | — | ||||||||||||
Debt securities: | ||||||||||||||||
Corporate and government securities | 2,611 | 240 | 2,371 | — | ||||||||||||
Asset-backed securities | 161 | — | 161 | — | ||||||||||||
Bank loans/foreign annuities | 40 | — | — | 40 | ||||||||||||
Real estate | 48 | — | — | 48 | ||||||||||||
Cash and cash equivalents | 444 | 444 | — | — | ||||||||||||
Accrued interest and dividends | 46 | — | 46 | — | ||||||||||||
$ | 5,013 | $ | 2,071 | $ | 2,854 | $ | 88 | |||||||||
The fair value of plan assets held by our pension plans as of December 31, 2012 was as follows:
(In millions) | Total | Level 1 | Level 2 | Level 3 | ||||||||||||
Equity securities: | ||||||||||||||||
U.S. companies | $ | 642 | $ | 632 | $ | 10 | $ | — | ||||||||
Non-U.S. companies | 847 | 571 | 276 | — | ||||||||||||
Debt securities: | ||||||||||||||||
Corporate and government securities | 3,019 | 242 | 2,777 | — | ||||||||||||
Asset-backed securities | 139 | — | 139 | — | ||||||||||||
Bank loans/foreign annuities | 41 | — | — | 41 | ||||||||||||
Real estate | 51 | — | 5 | 46 | ||||||||||||
Cash and cash equivalents | 398 | 398 | — | — | ||||||||||||
Accrued interest and dividends | 38 | — | 38 | — | ||||||||||||
$ | 5,175 | $ | 1,843 | $ | 3,245 | $ | 87 | |||||||||
Equity securities include large-cap and mid-cap publicly-traded companies mainly located in the United States, Canada and other developed countries, as well as commingled equity funds invested in the same types of securities. The fair value of the equity securities is determined based on quoted market prices (Level 1) or the net asset values per share that are derived from the accumulated fair values of the equity securities within the commingled funds (Level 2).
Debt securities include corporate bonds of U.S. and Canadian companies from diversified industries, bonds and Treasuries issued by the U.S. government and the Canadian federal and provincial governments, asset-backed securities and commingled fixed income funds invested in these same types of securities. The fair value of the debt securities is determined based on quoted market prices (Level 1), market-corroborated inputs such as matrix prices, yield curves and indices (Level 2), the net asset values per share that are derived from the accumulated fair values of the debt securities within the commingled funds (Level 2) or specialized pricing sources that utilize consensus-based contributed prices and spreads (Level 3). Bank loan investments are primarily located in the U.S. The fair value of bank loans is determined based on the mid-point of the bid and ask price points (Level 3).
Real estate investments are located in Canada. The fair value of the real estate is determined based on an appraisal completed by a national real estate firm. Those appraisers use several valuation concepts, including the cost approach, market approach and income approach (Level 3).
The fair value of accrued interest and dividends is determined based on market-corroborated inputs such as declared dividends and stated interest rates (Level 2).
93
The changes in Level 3 pension plan assets for the years ended December 31, 2013 and 2012 were as follows:
(In millions) | Bank Loans/Foreign Annuities | Real Estate | Total | |||||||||
Balance as of December 31, 2011 | $ | 44 | $ | 39 | $ | 83 | ||||||
Unrealized gains relating to assets held as of December 31, 2012 | — | 7 | 7 | |||||||||
Realized gains | 1 | — | 1 | |||||||||
Purchases | 54 | — | 54 | |||||||||
Sales | (57 | ) | — | (57 | ) | |||||||
Effect of foreign currency exchange rate changes | (1 | ) | — | (1 | ) | |||||||
Balance as of December 31, 2012 | 41 | 46 | 87 | |||||||||
Unrealized gains relating to assets held as of December 31, 2013 | 2 | 5 | 7 | |||||||||
Purchases | 40 | — | 40 | |||||||||
Sales | (41 | ) | — | (41 | ) | |||||||
Effect of foreign currency exchange rate changes | (2 | ) | (3 | ) | (5 | ) | ||||||
Balance as of December 31, 2013 | $ | 40 | $ | 48 | $ | 88 | ||||||
Long-term strategy and objective
Our investment strategy and objective is to maximize the long-term rate of return on our plan assets within an acceptable level of risk in order to meet our current and future obligations to pay benefits to qualifying employees and their beneficiaries while minimizing and stabilizing pension benefit costs and contributions. One way we accomplish this objective is to diversify our plan investments. Diversification of assets is achieved through strategic allocations to various asset classes, as well as various investment styles within these asset classes, and by retaining multiple, experienced third-party investment management firms with complementary investment styles and philosophies to implement these allocations. Risk is further managed by reviewing our investment policies at least annually and monitoring our fund managers at least quarterly for compliance with mandates and performance measures. A series of permitted and prohibited investments are listed in our respective investment policies, which are provided to our fund managers. The use of derivative financial instruments for speculative purposes and investments in the equity or debt securities of Resolute Forest Products and its affiliates are prohibited.
We have established a target asset allocation and an allowable range from such target asset allocation for our plans based upon analysis of risk/return tradeoffs and correlations of asset mixes given long-term historical returns, prospective capital market returns, forecasted benefit payments and the forecasted timing of those payments. The targeted asset allocation of the plan assets is designed to hedge the change in the pension liabilities resulting from fluctuations in the discount rate by investing in debt and other securities, while also generating excess returns required to reduce the unfunded pension deficit by investing in equity securities with higher potential returns. The targeted asset allocation of the plan assets is 50% equity securities, with an allowable range of 30% to 60%, and 50% debt and other securities, with an allowable range of 40% to 70%, including up to 5% in short-term instruments required for near-term liquidity needs. Approximately 60% of the equity securities are targeted to be invested in the U.S. and Canada, with the balance in other developed and emerging countries. Substantially all of the debt securities are targeted to be invested in the U.S. and Canada. The asset allocation for each plan is reviewed periodically and rebalanced toward the targeted asset mix when the fair value of the investments within an asset class falls outside the predetermined range.
94
Expected benefit payments and future contributions
The following benefit payments are expected to be paid from the plans’ net assets. The OPEB plans’ benefit payments have been reduced by expected Medicare subsidy receipts associated with the Medicare Prescription Drug, Improvement and Modernization Act of 2003.
(In millions) | Pension Plans | OPEB Plans | Expected Subsidy Receipts | |||||||||
2014 | $ | 407 | $ | 21 | $ | 1 | ||||||
2015 | 408 | 21 | 1 | |||||||||
2016 | 409 | 21 | 1 | |||||||||
2017 | 410 | 21 | 1 | |||||||||
2018 | 409 | 20 | 1 | |||||||||
2019- 2023 | 2,002 | 103 | 10 | |||||||||
We estimate our 2014 contributions (excluding contributions to our defined contribution plans) to be approximately $140 million to our pension plans and approximately $20 million to our OPEB plans.
Patient Protection and Affordable Care Act
In March 2010, the Patient Protection and Affordable Care Act (the “PPACA”) was enacted, potentially impacting our cost to provide healthcare benefits to eligible active and retired employees. The PPACA has both short-term and long-term implications on benefit plan standards. Implementation of this legislation began in 2010 and is expected to continue in phases from 2011 through 2018.
We have analyzed this legislation to determine: (i) the impact of the required plan standard changes on our employee healthcare plans, (ii) the effect of the excise tax on high cost healthcare plans and (iii) the resulting costs. The impact, for those changes that were currently estimable, was not material to our results of operations. In 2013, PPACA also introduced the health insurance exchange system to facilitate the purchase of state health insurance. Individuals may purchase insurance from a set of government standardized plans offering federal subsidies. In light of this new arrangement, we re-evaluated the current postretirement medical offerings and ultimately decided to shift post-Medicare coverage to the exchanges starting in 2014 for the U.S. salaried employees. For additional information, see Note 8, “Accumulated Other Comprehensive Loss.” In addition, following the five year renewal of the master collective agreement covering four unionized U.S. pulp and paper mills, effective as of February 14, 2014, we will amend our U.S. OPEB plan, whereby unionized post-65 active employees will be provided Medicare coverage via a Medicare Exchange program, effective January 1, 2015. For additional information, see Note 23, “Subsequent Events.”
Moving Ahead for Progress in the 21st Century Act
In July 2012, the Moving Ahead for Progress in the 21st Century Act (“MAP-21”) was signed into law, offering optional short-term funding relief for domestic pension plan sponsors. The discount-rate stabilization provision in MAP-21 limits the discount rates applicable in determining funding requirements to rates within a specified corridor of a 25-year average. The corridor was 15% and 10% in 2013 and 2012 respectively, and will widen to 20% in 2014, 25% in 2015 and 30% for the years after 2015. This enactment provides relief in the form of reduced minimum required contributions. We benefited from this funding relief and as a result, our required contributions for our domestic plans in 2013 and 2012 were reduced by $23 million and $9 million, respectively.
Canadian pension funding
Funding relief measures
As a pre-condition to our emergence from the Creditor Protection Proceedings, we entered into agreements with the provinces of Québec and Ontario to establish parameters concerning the funding of the aggregate solvency deficits in our material Canadian registered pension plans, which we refer to as the “affected plans,” until 2020. These plans represented approximately 75% of our unfunded pension obligations as of December 31, 2013. In exchange for certain undertakings, the provinces confirmed their intention to adopt regulations specific to us, which we refer to as the “funding relief regulations,” to implement those parameters in respect of the affected plans.
95
The funding relief regulations provide, among other things, that our aggregate annual contribution in respect of the solvency deficits in the affected plans for each year from 2011 through 2020 are limited to the following: (i) a Cdn$50 million basic contribution; (ii) beginning in 2013, if the plans’ aggregate solvency ratio falls below a specified target for a year, an additional contribution equal to 15% of free cash flow (calculated as per the funding relief regulations) up to Cdn$15 million per year and (iii) beginning in 2016, if the amount payable for benefits in a year exceeds a specified threshold and the plans’ aggregate solvency ratio is more than 2% below the target for that year, a supplementary contribution equal to such excess (such supplementary contribution being capped at Cdn$25 million on the first occurrence only of such an excess). Should a plan move into a surplus during the 2011 – 2020 period, it will cease to be subject to this funding relief. After 2020, the funding rules in place at the time will apply to any remaining deficit.
As adopted in mid-2011, the funding relief regulations also provide that corrective measures would be required if the aggregate solvency ratio in the affected plans fell below a prescribed level under the targets specified by the regulations as of December 31 in any year through 2014. Such measures may include additional funding over five years to attain the target solvency ratio prescribed in the regulations.
In addition, our principal Canadian operating subsidiary has undertaken in those agreements, among other things, for up to five years following the Emergence Date, to:
• | not pay a dividend at any time when the weighted average solvency ratio of its affected plans is less than 80%; |
• | abide by the compensation plan detailed in the Plans of Reorganization with respect to salaries, bonuses and severance; |
• | direct at least 60% of the maintenance and value-creation investments earmarked for our Canadian pulp and paper operations to projects in Québec and at least 30% to projects in Ontario; |
• | invest a minimum of Cdn$50 million over a two to three year construction period for a new condensing turbine at our Thunder Bay, Ontario facility, subject to certain conditions; |
• | invest at least Cdn$75 million in strategic projects in Québec over a five-year period; |
• | maintain our head office and the current related functions in Québec; |
• | make an additional solvency deficit reduction contribution to its pension plans of Cdn$75, payable over four years, for each metric ton of capacity reduced in Québec or Ontario, in the event of downtime of more than six consecutive months or nine cumulative months over a period of 18 months; |
• | create a diversification fund by contributing Cdn$2 million per year for five years for the benefit of the municipalities and workers in our Québec operating regions; |
• | pay an aggregate of Cdn$5 million over five years to be used for such environmental remediation purposes instructed by the province of Ontario; and |
• | maintain and renew certain financial assurances with the province of Ontario in respect of certain properties in the province. |
Solvency deficit
The aggregate solvency ratio calculation is based on a number of factors and assumptions, including the accrued benefits to be provided by the plans, interest rate levels, membership data and demographic experience. The assumptions used in the solvency calculation are materially different from the assumptions used to arrive at the pension and OPEB obligations for purposes of our consolidated financial statements.
Under Canadian actuarial rules for solvency determinations, the liabilities are calculated on the assumption that the plans are terminated at the measurement date (each December 31 for the affected plans), and the liabilities are discounted primarily using a specified annuity purchase rate, which is that day’s spot interest rate on government securities in Canada plus a prescribed margin. By contrast, for purposes of our consolidated financial statements, the discount rate is determined with a model that develops a hypothetical high-quality bond portfolio, where the bonds are theoretically purchased to settle the expected benefit payments of the plans.
As of December 31, 2013, a 1% change in discount rates would result in an approximate Cdn$520 million ($490 million, based on the exchange rate in effect on December 31, 2013) change in the solvency deficit.
96
Corrective measures
As of December 31, 2011 and 2012, the aggregate solvency ratio in the affected plans was below the minimum solvency level prescribed in the regulations. Accordingly, the regulations required that we propose corrective measures designed to attain the target solvency ratio prescribed in the regulations within five years. The difference between the solvency status as of December 31, 2011, and the target specified under the funding relief regulations represented the portion of the solvency deficit that was subject to corrective measures; it amounted to approximately Cdn$500 million as of December 31, 2011 ($471 million, based on the exchange rate in effect on December 31, 2013). The solvency deficit widened by approximately Cdn$130 million as of December 31, 2012 ($122 million, based on the exchange rate in effect on December 31, 2013), which then triggered the need for additional corrective measures in respect of that amount.
Because of the rising interest rate environment, strong asset returns and 2013 funding, when we file the actuarial report in respect of the affected plans in the second quarter of this year, we expect that the solvency deficit as of December 31, 2013, will have decreased significantly from the level at December 31, 2012.
In 2013, we reached an agreement in principle with Company stakeholders in Québec and in Ontario to replace the corrective measures mechanism under the funding relief regulations in favor of set incremental contributions beyond the basic funding under the existing framework. We expect that in the coming months, Québec and Ontario will adopt regulations to implement this revised framework.
The revised framework of the funding relief provides, among other things, that our basic contribution is increased from Cdn$50 million to Cdn$80 million for each year from 2013 through 2020, and the additional contribution that began in 2013, based on the free cash flow, is eliminated. Moreover, the additional solvency deficit reduction contribution of Cdn$75 per metric ton would not apply to any capacity reduction before April 2013.
Accordingly, we accelerated Cdn$30 million of contributions to the affected plans in 2013, representing the incremental funding under the regulations had they been adopted in 2013.
97
Note 15. Income Taxes
(Loss) income before income taxes by taxing jurisdiction for the years ended December 31, 2013, 2012 and 2011 was as follows:
(In millions) | 2013 | 2012 | 2011 | |||||||||
United States | $ | (168 | ) | $ | (34 | ) | $ | 29 | ||||
Foreign | 53 | (38 | ) | 35 | ||||||||
$ | (115 | ) | $ | (72 | ) | $ | 64 | |||||
The income tax (provision) benefit for the years ended December 31, 2013, 2012 and 2011 was comprised of the following:
(In millions) | 2013 | 2012 | 2011 | |||||||||
U.S. Federal and State: | ||||||||||||
Current | $ | — | $ | (2 | ) | $ | — | |||||
Deferred | (504 | ) | 17 | (23 | ) | |||||||
(504 | ) | 15 | (23 | ) | ||||||||
Foreign: | ||||||||||||
Current | (1 | ) | 5 | (4 | ) | |||||||
Deferred | (19 | ) | 19 | 8 | ||||||||
(20 | ) | 24 | 4 | |||||||||
Total: | ||||||||||||
Current | (1 | ) | 3 | (4 | ) | |||||||
Deferred | (523 | ) | 36 | (15 | ) | |||||||
$ | (524 | ) | $ | 39 | $ | (19 | ) | |||||
98
The income tax (provision) benefit attributable to (loss) income before income taxes differs from the amounts computed by applying the United States federal statutory income tax rate of 35% for the years ended December 31, 2013, 2012 and 2011 as a result of the following:
(In millions) | 2013 | 2012 | 2011 | |||||||||
(Loss) income before income taxes | $ | (115 | ) | $ | (72 | ) | $ | 64 | ||||
Income tax (provision) benefit: | ||||||||||||
Expected income tax benefit (provision) | 40 | 25 | (22 | ) | ||||||||
Changes resulting from: | ||||||||||||
Valuation allowance (1) | (572 | ) | (24 | ) | (15 | ) | ||||||
Reorganization-related and other tax adjustments (2) | — | 13 | (38 | ) | ||||||||
Adjustment for unrecognized tax benefits (3) | 2 | 5 | 63 | |||||||||
Foreign exchange | (4 | ) | 10 | (9 | ) | |||||||
Research and development tax incentives | 2 | 8 | — | |||||||||
State income taxes, net of federal income tax benefit | 3 | 1 | (1 | ) | ||||||||
Foreign tax rate differences | 4 | 1 | 2 | |||||||||
Other, net | 1 | — | 1 | |||||||||
$ | (524 | ) | $ | 39 | $ | (19 | ) | |||||
(1) | During 2013, we recorded a net increase in the valuation allowance of $572 million, mostly due to a charge of $604 million to establish a full valuation allowance against our net U.S. deferred income tax assets, partly offset by the reversal of $36 million of valuation allowance related to available U.S. capital losses, which are now expected to be utilized in the future as a result of the acquisition of the noncontrolling interest in CNC. See “Deferred income taxes” section below for a further discussion of the valuation allowance. |
During 2012, the increase in the valuation allowance primarily related to costs associated with the indefinite idling of our Mersey operations prior to the sale, where we did not recognize tax benefits, as well as an increase in the valuation allowance for certain benefits in Canada and the U.S. that were expected to expire unused. Partially offsetting these increases was a release of valuation allowance related to the U.S. Fibrek operations, following an internal reorganization where the U.S. Fibrek group joined our U.S. consolidated group.
During 2011, the increase in the valuation allowance related to certain U.S. State ordinary loss carryforwards, as well as tax benefits for our Mersey operations and our Mokpo paper mill where we did not recognize deferred income tax assets.
(2) | During 2012 and 2011, we recorded reorganization-related and other tax adjustments, which represented adjustments to our previously-reported tax balance sheet accounts. We did not adjust any prior period reported amounts, as we did not believe that these adjustments were material to our previously-issued financial statements. |
(3) | During 2013, 2012 and 2011, we recorded benefits for previously unrecognized tax benefits related to uncertain tax positions pursuant to FASB ASC 740, “Income Taxes,” as effectively settled upon completion of certain tax authority examinations. |
Deferred income taxes
At each reporting period, we assess whether it is more likely than not that the deferred income tax assets will be realized, based on the review of all available positive and negative evidence, including future reversals of existing taxable temporary differences, estimates of future taxable income, past operating results and prudent and feasible tax planning strategies. The carrying value of our deferred income tax assets reflects our expected ability to generate sufficient future taxable income in certain tax jurisdictions to utilize these deferred income tax benefits.
Following the assessment of the realizability of our U.S. operations deferred income tax assets, we concluded that existing negative evidence outweighed positive evidence and that a full valuation allowance against our net deferred income tax assets was required. A cumulative loss position is considered significant negative evidence in assessing the realizability of deferred income tax assets that is difficult to overcome. As a result of our mill rationalization efforts, executed to improve our cost structure and asset base going forward, as well as changing dynamics in the pulp and paper industry, our U.S. operations were in a three year cumulative loss position for the year ended December 31, 2013. Considering that the weight given to positive
99
and negative evidence must be commensurate with the extent to which that evidence may be objectively verified, the recent cumulative loss of our U.S. operations limits our ability to consider other subjective positive evidence, such as projections of future earnings. As a result, we recorded an increase to the income tax provision of $604 million in order to establish a full valuation allowance against our net U.S. deferred income tax assets. The non-cash charge to establish a valuation allowance does not have any impact on our consolidated operating income or cash flow. It also does not reduce our underlying tax attributes, nor hinders our ability to use them in the future
The weight of positive evidence, which included a review of historical cumulative earnings and our expected future performance, resulted in the conclusion by management that valuation allowances were not required for most of our deferred income tax assets in Canada, as they were determined to be more likely than not to be realized. We maintained a valuation allowance against certain items of a capital nature and on the net deferred income tax assets associated with Fibrek Holding Inc., a Canadian wholly-owned subsidiary.
Deferred income taxes as of December 31, 2013 and 2012 were comprised of the following:
(In millions) | 2013 | 2012 | ||||||
Fixed assets | $ | (236 | ) | $ | (262 | ) | ||
Deferred gains | (41 | ) | (40 | ) | ||||
Other liabilities | (54 | ) | (120 | ) | ||||
Deferred income tax liabilities | (331 | ) | (422 | ) | ||||
Fixed assets | 575 | 593 | ||||||
Pension and OPEB plans | 389 | 587 | ||||||
Ordinary loss carryforwards | 843 | 816 | ||||||
Capital loss carryforwards | 444 | 444 | ||||||
Research and development expense pool | 223 | 254 | ||||||
Tax credit carryforwards | 119 | 159 | ||||||
Other assets | 99 | 173 | ||||||
Deferred income tax assets | 2,692 | 3,026 | ||||||
Valuation allowance | (1,121 | ) | (623 | ) | ||||
Net deferred income tax assets | $ | 1,240 | $ | 1,981 | ||||
Amounts recognized in our Consolidated Balance Sheets consisted of: | ||||||||
Deferred income tax assets – current | $ | 32 | $ | 56 | ||||
Deferred income tax assets – noncurrent | 1,266 | 2,000 | ||||||
Deferred income tax liabilities - current | (32 | ) | — | |||||
Deferred income tax liabilities – noncurrent | (26 | ) | (75 | ) | ||||
Net deferred income tax assets | $ | 1,240 | $ | 1,981 | ||||
100
The balance of tax attributes and their dates of expiration as of December 31, 2013 were as follows:
(In millions) | Related Deferred Income Tax Asset | Year of Expiration | ||||
Ordinary loss carryforwards: | ||||||
U.S. Federal ordinary loss carryforwards of $1,779 | $ | 623 | (1 | ) | 2021 – 2033 | |
U.S. State ordinary loss carryforwards of $1,718 | 67 | (1 | ) | 2014 – 2033 | ||
Canadian Federal and provincial (excluding Québec) ordinary loss carryforwards of $436 | 72 | 2014 – 2033 | ||||
Québec ordinary loss carryforwards of $639 | 61 | 2014 – 2033 | ||||
Other ordinary loss carryforwards | 20 | 2019 – 2023 | ||||
$ | 843 | |||||
Capital loss carryforwards: | ||||||
U.S. capital loss carryforwards of $1,258 | $ | 440 | (1 | ) | 2014 | |
Canadian capital loss carryforwards of $12 | 4 | Indefinite | ||||
$ | 444 | |||||
Research and development expense pool: | ||||||
Canadian Federal and provincial (excluding Québec) research and development expense pool of $788 | $ | 142 | Indefinite | |||
Québec research and development expense pool of $969 | 81 | Indefinite | ||||
$ | 223 | |||||
Tax credit carryforwards: | ||||||
Canadian research and development tax credit carryforwards | $ | 112 | 2016 – 2033 | |||
Other Canadian tax credit carryforwards | 1 | 2014 | ||||
U.S State tax credit carryforwards | 6 | (1 | ) | 2014 – 2028 | ||
$ | 119 | |||||
(1) | As at December 31, 2013, a full valuation allowance was recorded on our U.S operations net deferred income tax assets. |
Our U.S federal net operating loss carryforwards are subject to the U.S. Internal Revenue Code of 1986, as amended § 382 (“IRC § 382”) limitation, resulting from a previous ownership change. We do not expect that IRC § 382 would limit the utilization of our available U.S federal net operating loss carryforwards prior to their expiration.
We consider our foreign earnings to be permanently invested. Accordingly, we do not currently provide for the additional United States and foreign income taxes that would become payable upon remission of undistributed earnings of foreign subsidiaries. The cumulative undistributed earnings of such subsidiaries as of December 31, 2013 are not material. It is not practicable to estimate the income tax liability that might be incurred if such earnings were remitted to the U.S.
101
Unrecognized tax benefits
The following table summarizes the activity related to our gross unrecognized tax benefits for the years ended December 31, 2013 and 2012:
(In millions) | 2013 | 2012 | ||||||
Beginning of year | $ | 84 | $ | 109 | ||||
(Decrease) increase in unrecognized tax benefits resulting from: | ||||||||
Positions taken in a prior period | (1 | ) | (16 | ) | ||||
Positions taken in the current period | 4 | 44 | ||||||
Settlements with taxing authorities | — | (55 | ) | |||||
Change in Canadian foreign exchange rate | (6 | ) | 2 | |||||
End of year | $ | 81 | $ | 84 | ||||
We recognize interest and penalties accrued on unrecognized tax benefits as components of the income tax provision. The total amount of unrecognized tax benefits that, if recognized, would affect the effective tax rate is $78 million. During 2013, changes to unrecognized tax benefits reflected additional uncertain tax positions taken, as well as the impact of changes in foreign exchanges rates. In 2012, we adjusted certain reserves for unrecognized tax benefits following the completion of examinations and settlements reached with various taxing authorities, as well as additional uncertain tax positions taken.
In the normal course of business, we are subject to audits from the federal, state, provincial and other tax authorities regarding various tax liabilities. U.S. federal tax returns for 2010 and future years, as well as Canadian tax returns for 2008 and future years remain subject to examination by tax authorities.
We do not expect a significant change to the amount of unrecognized tax benefits over the next twelve months. However, any adjustments arising from examinations by taxing authorities may alter the timing or amount of taxable income or deductions, or the allocation of income among tax jurisdictions, and could differ from the amount accrued. We believe that taxes accrued in our Consolidated Balance Sheets fairly represent the amount of income taxes to be settled or realized in the future.
Note 16. Commitments and Contingencies
Legal items
We are involved in various legal proceedings relating to contracts, commercial disputes, taxes, environmental issues, employment and workers’ compensation claims, Aboriginal claims and other matters. We periodically review the status of these proceedings with both inside and outside counsel. Although the final outcome of any of these matters is subject to many variables and cannot be predicted with any degree of certainty, we establish reserves for a matter (including legal costs expected to be incurred) when we believe an adverse outcome is probable and the amount can be reasonably estimated. We believe that the ultimate disposition of these matters will not have a material adverse effect on our financial condition, but it could have a material adverse effect on our results of operations in any given quarter or year.
Effective July 31, 2012, we completed the second step transaction pursuant to which we acquired the remaining 25.4% of the outstanding Fibrek shares, following the approval of Fibrek’s shareholders on July 23, 2012, and the issuance of a final order of the Québec Superior Court in Canada (the “Canadian Court”) approving the arrangement on July 27, 2012. Certain former shareholders of Fibrek exercised (or purported to exercise) rights of dissent in respect of the transaction, asking for a judicial determination of the fair value of their claim under the Canada Business Corporations Act. No consideration has to date been paid to the former Fibrek shareholders who exercised (or purported to exercise) rights of dissent. Any such consideration will only be paid out upon settlement or judicial determination of the fair value of their claims and will be paid entirely in cash. Accordingly, we cannot presently determine the amount that ultimately will be paid to former holders of Fibrek shares in connection with the proceedings, but we have reserved approximately Cdn$14 million ($13 million, based on the exchange rate in effect on December 31, 2013) for the eventual payment of those claims.
On June 12, 2012, we filed a motion for directives with the Canadian Court seeking an order to prevent pension regulators in each of Québec, New Brunswick and Newfoundland and Labrador from declaring partial wind-ups of pension plans relating to employees of former operations in New Brunswick and Newfoundland and Labrador, or a declaration that any claim for accelerated reimbursements of deficits arising from a partial wind-up is a barred claim under the Creditor Protection Proceedings. These plans are subject to the funding relief regulations described in Note 14, “Pension and Other Postretirement Benefit Plans - Canadian pension funding,” and we contend, among other things, that any such declaration, if issued, would be
102
inconsistent with the Canadian Court’s sanction order confirming the Plan of Reorganization and the terms of our emergence from the Creditor Protection Proceedings. A partial wind-up would likely shorten the period in which any deficit within those plans, which could reach up to Cdn$150 million ($141 million based on the exchange rate in effect on December 31, 2013), would have to be funded if we do not obtain the relief sought. No hearing date has been set to date.
Environmental matters
We are subject to a variety of federal, state, provincial and local environmental laws and regulations in the jurisdictions in which we operate. We believe our operations are in material compliance with current applicable environmental laws and regulations. Environmental regulations promulgated in the future could require substantial additional expenditures for compliance and could have a material impact on us, in particular, and the industry in general. We may be a “potentially responsible party” with respect to four hazardous waste sites that are being addressed pursuant to the Comprehensive Environmental Response, Compensation and Liability Act of 1980 (“Superfund”) or the Resource Conservation and Recovery Act (“RCRA”) corrective action authority. We believe we will not be liable for any significant amounts at any of these sites.
We have recorded $9 million and $4 million for environmental liabilities as of December 31, 2013 and 2012, respectively, which represents management’s estimate based on an assessment of relevant factors and assumptions of the ultimate settlement amounts for environmental liabilities. The amount of these liabilities could be affected by changes in facts or assumptions not currently known to management. These liabilities are included in “Accounts payable and accrued liabilities” or “Other long-term liabilities” in our Consolidated Balance Sheets.
Other representations, warranties and indemnifications
We make representations and warranties and offer indemnities to counterparties in connection with commercial transactions like asset sales and other commercial agreements. Indemnification obligations generally are standard contractual terms, are entered into in the normal course of business and are related to contingencies that are not expected to occur at the time of the agreement. We are not able to develop an estimate of the maximum payout under these indemnification obligations, but we believe that it is unlikely that we will be required to make material payments under those arrangements and no material liabilities related thereto have been recognized in our consolidated financial statements.
Note 17. Share Capital
Overview
We are authorized under our certificate of incorporation, as amended and restated, to issue up to 200 million shares of capital stock, consisting of: (i) 190 million shares of common stock, par value $0.001 per share and (ii) 10 million shares of preferred stock, par value $0.001 per share.
Preferred stock
As of December 31, 2013 and 2012, no preferred shares were issued and outstanding.
Common stock
On the Emergence Date and pursuant to the Plans of Reorganization, we issued an aggregate of 97,134,954 shares of common stock for the benefit of unsecured creditors of the Debtors in the Creditor Protection Proceedings and also reserved 9,020,960 shares for issuance under the predecessor to the Resolute Forest Products Equity Incentive Plan (as amended, the “Incentive Plan”).
As of December 31, 2011, 77,415,389 shares of common stock had been distributed to the holders of unsecured claims as of the applicable distribution record date under the Plans of Reorganization on account of allowed unsecured creditor claims. During the years ended December 31, 2013 and 2012, an additional 3,693,601 and 15,702,418 shares, respectively, of common stock had been distributed to the holders of unsecured claims from the share reserve established on the Emergence Date for disputed claims, leaving no remaining unresolved claim.
Because the aggregate of allowed claims against certain Chapter 11 debtors was resolved for less than was originally reserved when the disputed claim share reserve was established, and because certain of the CCAA debtors had no creditor, the remaining 276,662 shares and 46,884 shares, respectively, unallocated under the respective plan of reorganization were transferred to us in 2013 and accounted as treasury stock.
103
Consistent with the confirmation order in respect of our U.S. Debtors’ Chapter 11 Reorganization Plan and applicable law, we relied on section 1145(a)(1) of Chapter 11 to exempt the issuance of these shares of common stock and their distribution to unsecured creditors from the registration requirements of the Securities Act of 1933 (as amended, the “Securities Act”).
Treasury stock
On May 22, 2012, our board of directors approved a share repurchase program of up to 10% of our common stock, for an aggregate purchase price of up to $100 million. During the year ended December 31, 2012, we repurchased 5,610,152 shares at a cost of $67 million. We did not repurchase shares in 2013.
On July 31, 2012, we distributed 503,054 shares from treasury as part of the consideration in the second step transaction to acquire the remaining non-controlling interest in Fibrek. For additional information, see Note 3, “Acquisition of Fibrek Inc.”
In 2013, we also transferred 323,546 shares of common stock from the disputed share reserve, as described above.
Dividends
We did not declare or pay any dividends on our common stock during the years ended December 31, 2013, 2012 and 2011.
Note 18. Share-Based Compensation
Overview
The Incentive Plan, which became effective on the Emergence Date and is administered by the human resources and compensation/nominating and governance committee of the board of directors, provides for the grant of equity-based awards, including stock options, stock appreciation rights, restricted stock, RSUs, DSUs (collectively, “stock incentive awards”) and cash incentive awards to certain of our officers, directors, employees, consultants and advisors. As discussed in Note 17, “Share Capital,” we have been authorized to issue stock incentive awards for up to 9 million shares under the Incentive Plan.
In 2011, the board of directors adopted the Resolute Forest Products Outside Director Deferred Compensation Plan (the “Deferred Compensation Plan”), which allows non-employee directors to surrender 50% or 100% of their cash fees in exchange for DSUs or RSUs, as applicable based on the director’s country of residency. The number of awards issued pursuant to the Deferred Compensation Plan is based on 110% of the fees earned, resulting in a 10% premium incentive.
As of December 31, 2013 and 2012, all of our outstanding stock incentive awards pursuant to the Incentive Plan were accounted for as equity-classified, service-based awards and all of our outstanding stock incentive awards pursuant to the Deferred Compensation Plan were accounted for as liability awards. As of December 31, 2013, approximately 5.7 million shares were available for issuance under the Incentive Plan.
For the years ended December 31, 2013, 2012 and 2011, share-based compensation expense was $8 million (no tax benefit), $5 million ($1 million of tax benefit) and $3 million ($1 million of tax benefit), respectively.
Retirement eligibility period
Employees who retire (upon meeting certain age and service criteria) at least 6 months after the grant date and prior to the end of the four-year vesting period will be allowed to continue vesting in their awards after retirement in accordance with the normal vesting schedule. The requisite service periods for the stock incentive awards are reduced on an individual basis, as necessary, to reflect the grantee’s individual retirement eligibility date (“the retirement eligibility period”).
104
Stock options
In 2013 and 2012, we made grants of 692,759 and 785,885 stock options, respectively, to our non-employee directors and to certain employees using the following weighted-average assumptions:
2013 | 2012 | |||||||
Exercise price | $ | 15.66 | $ | 11.41 | ||||
Fair value | $ | 7.65 | $ | 5.59 | ||||
Expected dividend yield | — | — | ||||||
Expected volatility | 50.0 | % | 50.6 | % | ||||
Risk-free interest rate | 1.8 | % | 1.6 | % | ||||
Expected life in years | 6.25 | 6.25 | ||||||
The stock options become exercisable ratably over a period of 4 years, or the retirement eligibility period, whichever is shorter, and, unless terminated earlier in accordance with their terms, expire 10 years from the date of grant. New shares of our common stock are issued upon the exercise of a stock option. In certain cases, we withhold shares in respect of option costs and applicable taxes.
We calculated the grant-date fair value of the stock options using the Black-Scholes option pricing model. The payment of dividends is subject to certain restrictions under the 2023 Notes indenture and the credit agreement that governs the ABL Credit Facility; therefore, we assumed an expected dividend yield of zero. Due to the short trading history of the Company’s common stock, we estimated the expected volatility based on the historical volatility of a peer group within our industry measured over a term approximating the expected life of the options. We estimated the risk-free interest rate based on a zero-coupon U.S. Treasury instrument with a remaining term approximating the expected life of the options. Historical exercise data attributable to stock incentive awards granted after the Company’s common stock began publicly trading is limited; therefore, we used the simplified method permitted by Staff Accounting Bulletin Topic 14 to estimate the expected life of the options. Under this approach, the expected life is presumed to be the midpoint between the vesting date and the end of the contractual term.
The activity of stock options for the year ended December 31, 2013 was as follows:
Number of Shares | Weighted- Average Exercise Price | Weighted- Average Contractual Life (years) | Aggregate Intrinsic Value | ||||||||||
Outstanding as of December 31, 2012 | 1,530,618 | $ | 15.46 | 9.2 | $ | — | |||||||
Granted | 692,759 | 15.66 | |||||||||||
Exercised | (13,301 | ) | 11.41 | ||||||||||
Forfeited | (180,773 | ) | 15.40 | ||||||||||
Outstanding as of December 31, 2013 | 2,029,303 | $ | 15.56 | 8.7 | $ | — | |||||||
Exercisable as of December 31, 2013 | 585,928 | $ | 17.74 | 7.8 | $ | — | |||||||
As of December 31, 2013, there was approximately $7 million of unrecognized compensation cost related to these stock options, which is expected to be recognized over a remaining requisite service period of 3.2 years.
Restricted stock units and deferred stock units
In 2013 and 2012, we made grants of RSUs and DSUs to our non-employee directors and to certain employees pursuant to the Incentive Plan. Each RSU and DSU provides the holder the right to receive one share of our common stock upon vesting. The awards vest ratably over a period of one year for directors and four years for employees, or over the retirement eligibility period, whichever is shorter. Awards to employees are settled with shares of stock upon vesting, while awards to directors are settled with shares of stock ratably over a period of three years or upon separation from the Board of Directors, as applicable based on the director’s country of residency. In certain cases, we withhold shares in respect of applicable taxes.
105
The activity of RSUs and DSUs for the year ended December 31, 2013 was as follows:
Number of Units | Weighted- Average Fair Value at Grant Date | |||||
Outstanding as of December 31, 2012 | 777,548 | $ | 13.50 | |||
Granted (1) | 504,329 | 16.15 | ||||
Vested and settled (2) | (226,305 | ) | 12.63 | |||
Forfeited | (95,121 | ) | 13.18 | |||
Outstanding as of December 31, 2013 (3) | 960,451 | $ | 15.13 | |||
(1) | Includes 32,804 DSUs to non-employee directors pursuant to the Deferred Compensation Plan. |
(2) | Includes 8,149 and 3,613 awards that were vested in 2012 and 2011, respectively, but were not settled until 2013. |
(3) | Includes 38,424 awards that were vested in 2013 but have not been settled and therefore remain outstanding as of December 31, 2013. |
As of December 31, 2013, there was approximately $9 million of unrecognized compensation cost related to these RSUs and DSUs, which is expected to be recognized over a remaining requisite service period of 3.2 years. New shares of our common stock are issued upon the settlement of an RSU or DSU issued pursuant to the Incentive Plan.
The weighted-average grant-date fair value of all RSUs and DSUs granted in 2012 was $11.66.
Note 19. Operating Leases and Purchase Obligations
We lease office premises, office equipment and transportation equipment under operating leases for which total expense was $12 million in 2013, $13 million in 2012 and $13 million in 2011. In the normal course of business, we have also entered into various supply agreements, guarantees, purchase commitments and harvesting rights agreements (for land that we manage for which we make payments to various Canadian provinces based on the amount of timber harvested).
As of December 31, 2013, the future minimum rental payments under operating leases and commitments for purchase obligations were as follows:
(In millions) | Purchase Obligations | Operating Leases | ||||||
2014 | $ | 77 | $ | 4 | ||||
2015 | 44 | 3 | ||||||
2016 | 42 | 3 | ||||||
2017 | 35 | 2 | ||||||
2018 | 16 | 2 | ||||||
Thereafter | 49 | 9 | ||||||
$ | 263 | $ | 23 | |||||
106
Note 20. Segment Information
We manage our business based on the products we manufacture. Our reportable segments correspond to our principal product lines: newsprint, specialty papers, market pulp and wood products. As of the fourth quarter of 2013, the results from our coated papers operations have been integrated with the specialty papers segment. This better reflects management's internal analysis, given the increasingly high degree of substitution with supercalender grades, and the diminishing percentage coated papers represents in our product portfolio. Comparative year information, including the table presented below, has been modified to conform to this revised segment presentation.
None of the income or loss items following “Operating (loss) income” in our Consolidated Statements of Operations are allocated to our segments, since those items are reviewed separately by management. For the same reason, closure costs, impairment and other related charges, severance costs, inventory write-downs related to closures, start up costs of idled mills, net gain on disposition of assets, transaction costs, as well as other discretionary charges or credits are not allocated to our segments. We allocate depreciation and amortization expense to our segments, although the related fixed assets and amortizable intangible assets are not allocated to segment assets. Additionally, all selling, general and administrative expenses, excluding severance costs and certain discretionary charges and credits, are allocated to our segments.
In each of 2013, 2012 and 2011, no assets were identifiable by segment and reviewed by management. All assets were therefore included in Corporate and other.
Information about certain segment data for the years ended December 31, 2013, 2012 and 2011 was as follows:
(In millions) | Newsprint | Specialty Papers | Market Pulp (1) | Wood Products | Corporate and Other | Consolidated Total | ||||||||||||||||||
Sales | ||||||||||||||||||||||||
2013 | $ | 1,473 | $ | 1,366 | $ | 1,053 | $ | 569 | $ | — | $ | 4,461 | ||||||||||||
2012 | 1,627 | 1,562 | 814 | 500 | — | 4,503 | ||||||||||||||||||
2011 | 1,816 | 1,813 | 659 | 468 | — | 4,756 | ||||||||||||||||||
Depreciation and amortization | ||||||||||||||||||||||||
2013 | $ | 73 | $ | 77 | $ | 52 | $ | 36 | $ | 5 | $ | 243 | ||||||||||||
2012 | 72 | 83 | 44 | 34 | — | 233 | ||||||||||||||||||
2011 | 73 | 84 | 30 | 33 | — | 220 | ||||||||||||||||||
Operating income (loss) (2) | ||||||||||||||||||||||||
2013 | $ | 40 | $ | 35 | $ | 42 | $ | 41 | $ | (160 | ) | $ | (2 | ) | ||||||||||
2012 | 97 | 85 | (43 | ) | 26 | (193 | ) | (28 | ) | |||||||||||||||
2011 | 89 | 122 | 91 | (25 | ) | (70 | ) | 207 | ||||||||||||||||
Capital expenditures | ||||||||||||||||||||||||
2013 | $ | 57 | $ | 17 | $ | 40 | $ | 31 | $ | 16 | $ | 161 | ||||||||||||
2012 | 58 | 22 | 40 | 22 | 27 | 169 | ||||||||||||||||||
2011 | 34 | 19 | 12 | 20 | 12 | 97 | ||||||||||||||||||
(1) | For the years ended December 31, 2013, 2012 and 2011, market pulp sales excluded inter-segment sales of $17 million, $36 million and $33 million, respectively. |
107
(2)Corporate and other operating loss for the years ended December 31, 2013, 2012 and 2011 included the following significant items:
(In millions) | 2013 | 2012 | 2011 | |||||||||
Net gain on disposition of assets | $ | 2 | $ | 35 | $ | 3 | ||||||
Closure costs, impairment and other related charges | (89 | ) | (185 | ) | (46 | ) | ||||||
Inventory write-downs related to closures | (11 | ) | (12 | ) | (3 | ) | ||||||
Severance costs | — | (5 | ) | (12 | ) | |||||||
Transaction costs | (6 | ) | (8 | ) | (5 | ) | ||||||
Start up costs of idled mills | (32 | ) | (13 | ) | — | |||||||
$ | (136 | ) | $ | (188 | ) | $ | (63 | ) | ||||
Sales are attributed to countries based on the location of the customer. No single customer, related or otherwise, accounted for 10% or more of our 2013, 2012 or 2011 consolidated sales. No country in the “Other countries” group in the table below exceeded 2% of consolidated sales. Sales by country for the years ended December 31, 2013, 2012 and 2011 were as follows:
(In millions) | 2013 | 2012 | 2011 | |||||||||
United States | $ | 2,834 | $ | 2,766 | $ | 2,859 | ||||||
Foreign countries: | ||||||||||||
Canada | 546 | 636 | 636 | |||||||||
Mexico | 168 | 140 | 151 | |||||||||
Brazil | 122 | 154 | 166 | |||||||||
Italy | 85 | 105 | 106 | |||||||||
India | 74 | 36 | 60 | |||||||||
Korea | 65 | 84 | 88 | |||||||||
Other countries | 567 | 582 | 690 | |||||||||
1,627 | 1,737 | 1,897 | ||||||||||
$ | 4,461 | $ | 4,503 | $ | 4,756 | |||||||
Long-lived assets, which exclude intangible assets and deferred income tax assets, by country, as of December 31, 2013 and 2012, were as follows:
(In millions) | 2013 | 2012 | ||||||
United States | $ | 967 | $ | 1,071 | ||||
Foreign countries: | ||||||||
Canada | 1,498 | 1,538 | ||||||
Korea | 26 | 25 | ||||||
1,524 | 1,563 | |||||||
$ | 2,491 | $ | 2,634 | |||||
108
Note 21. Condensed Consolidating Financial Information
The following information is presented in accordance with Rule 3-10 of Regulation S-X and the public information requirements of Rule 144 promulgated pursuant to the Securities Act in connection with Resolute Forest Products Inc.’s 2023 Notes that are fully and unconditionally guaranteed, on a joint and several basis, by all of our 100% owned material U.S. subsidiaries (the “Guarantor Subsidiaries”). The 2023 Notes are not guaranteed by our foreign subsidiaries and our less than 100% owned U.S. subsidiaries (the “Non-guarantor Subsidiaries”).
The following condensed consolidating financial information sets forth the Statements of Operations and Comprehensive Loss for the years ended December 31, 2013, 2012 and 2011, the Balance Sheets as of December 31, 2013 and 2012 and the Statements of Cash Flows for the years ended December 31, 2013, 2012 and 2011 for Resolute Forest Products Inc. (the “Parent”), the Guarantor Subsidiaries on a combined basis and the Non-guarantor Subsidiaries on a combined basis. The condensed consolidating financial information reflects the investments of the Parent in the Guarantor Subsidiaries and Non-guarantor Subsidiaries, as well as the investments of the Guarantor Subsidiaries in the Non-guarantor Subsidiaries, using the equity method of accounting. The principal consolidating adjustments are elimination entries to eliminate the investments in subsidiaries and intercompany balances and transactions.
CONDENSED CONSOLIDATING STATEMENT OF OPERATIONS AND COMPREHENSIVE (LOSS) INCOME | ||||||||||||||||||||
For the Year Ended December 31, 2013 | ||||||||||||||||||||
(In millions) | Parent | Guarantor Subsidiaries | Non-guarantor Subsidiaries | Consolidating Adjustments | Consolidated | |||||||||||||||
Sales | $ | — | $ | 3,674 | $ | 2,956 | $ | (2,169 | ) | $ | 4,461 | |||||||||
Costs and expenses: | ||||||||||||||||||||
Cost of sales, excluding depreciation, amortization and distribution costs | — | 3,356 | 2,247 | (2,157 | ) | 3,446 | ||||||||||||||
Depreciation and amortization | — | 100 | 143 | — | 243 | |||||||||||||||
Distribution costs | — | 172 | 357 | (8 | ) | 521 | ||||||||||||||
Selling, general and administrative expenses | 18 | 47 | 101 | — | 166 | |||||||||||||||
Closure costs, impairment and other related charges | — | 61 | 28 | — | 89 | |||||||||||||||
Net gain on disposition of assets | — | — | (2 | ) | — | (2 | ) | |||||||||||||
Operating (loss) income | (18 | ) | (62 | ) | 82 | (4 | ) | (2 | ) | |||||||||||
Interest expense | (89 | ) | (4 | ) | (8 | ) | 50 | (51 | ) | |||||||||||
Other (expense) income, net | (60 | ) | 66 | (18 | ) | (50 | ) | (62 | ) | |||||||||||
Parent’s equity in loss of subsidiaries | (472 | ) | — | — | 472 | — | ||||||||||||||
(Loss) income before income taxes | (639 | ) | — | 56 | 468 | (115 | ) | |||||||||||||
Income tax provision | — | (564 | ) | (21 | ) | 61 | (524 | ) | ||||||||||||
Net (loss) income including noncontrolling interests | (639 | ) | (564 | ) | 35 | 529 | (639 | ) | ||||||||||||
Net income attributable to noncontrolling interests | — | — | — | — | — | |||||||||||||||
Net (loss) income attributable to Resolute Forest Products Inc. | $ | (639 | ) | $ | (564 | ) | $ | 35 | $ | 529 | $ | (639 | ) | |||||||
Comprehensive (loss) income attributable to Resolute Forest Products Inc. | $ | (296 | ) | $ | (346 | ) | $ | 217 | $ | 129 | $ | (296 | ) | |||||||
109
CONDENSED CONSOLIDATING STATEMENT OF OPERATIONS AND COMPREHENSIVE (LOSS) INCOME | ||||||||||||||||||||
For the Year Ended December 31, 2012 | ||||||||||||||||||||
(In millions) | Parent | Guarantor Subsidiaries | Non-guarantor Subsidiaries | Consolidating Adjustments | Consolidated | |||||||||||||||
Sales | $ | — | $ | 3,139 | $ | 2,894 | $ | (1,530 | ) | $ | 4,503 | |||||||||
Costs and expenses: | ||||||||||||||||||||
Cost of sales, excluding depreciation, amortization and distribution costs | — | 2,774 | 2,228 | (1,517 | ) | 3,485 | ||||||||||||||
Depreciation and amortization | — | 93 | 140 | — | 233 | |||||||||||||||
Distribution costs | — | 162 | 361 | (9 | ) | 514 | ||||||||||||||
Selling, general and administrative expenses | 18 | 56 | 75 | — | 149 | |||||||||||||||
Closure costs, impairment and other related charges | — | 12 | 173 | — | 185 | |||||||||||||||
Net gain on disposition of assets | — | — | (35 | ) | — | (35 | ) | |||||||||||||
Operating (loss) income | (18 | ) | 42 | (48 | ) | (4 | ) | (28 | ) | |||||||||||
Interest expense | (214 | ) | (13 | ) | (8 | ) | 169 | (66 | ) | |||||||||||
Other income, net | 2 | 171 | 18 | (169 | ) | 22 | ||||||||||||||
Parent’s equity in income of subsidiaries | 147 | — | — | (147 | ) | — | ||||||||||||||
(Loss) income before income taxes | (83 | ) | 200 | (38 | ) | (151 | ) | (72 | ) | |||||||||||
Income tax benefit (provision) | 84 | (69 | ) | 23 | 1 | 39 | ||||||||||||||
Net income (loss) including noncontrolling interests | 1 | 131 | (15 | ) | (150 | ) | (33 | ) | ||||||||||||
Net loss attributable to noncontrolling interests | — | — | 34 | — | 34 | |||||||||||||||
Net income attributable to Resolute Forest Products Inc. | $ | 1 | $ | 131 | $ | 19 | $ | (150 | ) | $ | 1 | |||||||||
Comprehensive (loss) income attributable to Resolute Forest Products Inc. | $ | (318 | ) | $ | 69 | $ | (238 | ) | $ | 169 | $ | (318 | ) | |||||||
110
CONDENSED CONSOLIDATING STATEMENT OF OPERATIONS AND COMPREHENSIVE (LOSS) INCOME | ||||||||||||||||||||
For the Year Ended December 31, 2011 | ||||||||||||||||||||
(In millions) | Parent | Guarantor Subsidiaries | Non-guarantor Subsidiaries | Consolidating Adjustments | Consolidated | |||||||||||||||
Sales | $ | — | $ | 3,141 | $ | 3,154 | $ | (1,539 | ) | $ | 4,756 | |||||||||
Costs and expenses: | ||||||||||||||||||||
Cost of sales, excluding depreciation, amortization and distribution costs | — | 2,680 | 2,440 | (1,539 | ) | 3,581 | ||||||||||||||
Depreciation and amortization | — | 90 | 130 | — | 220 | |||||||||||||||
Distribution costs | — | 157 | 390 | — | 547 | |||||||||||||||
Selling, general and administrative expenses | 27 | 58 | 73 | — | 158 | |||||||||||||||
Closure costs, impairment and other related charges | — | 18 | 28 | — | 46 | |||||||||||||||
Net gain on disposition of assets | — | (2 | ) | (1 | ) | — | (3 | ) | ||||||||||||
Operating (loss) income | (27 | ) | 140 | 94 | — | 207 | ||||||||||||||
Interest expense | (216 | ) | (7 | ) | (18 | ) | 146 | (95 | ) | |||||||||||
Other income (expense), net | 6 | 134 | (42 | ) | (146 | ) | (48 | ) | ||||||||||||
Parent’s equity in income of subsidiaries | 199 | — | — | (199 | ) | — | ||||||||||||||
(Loss) income before income taxes | (38 | ) | 267 | 34 | (199 | ) | 64 | |||||||||||||
Income tax benefit (provision) | 85 | (109 | ) | 5 | — | (19 | ) | |||||||||||||
Net income including noncontrolling interests | 47 | 158 | 39 | (199 | ) | 45 | ||||||||||||||
Net loss attributable to noncontrolling interests | — | — | 2 | — | 2 | |||||||||||||||
Net income attributable to Resolute Forest Products Inc. | $ | 47 | $ | 158 | $ | 41 | $ | (199 | ) | $ | 47 | |||||||||
Comprehensive (loss) income attributable to Resolute Forest Products Inc. | $ | (256 | ) | $ | 85 | $ | (188 | ) | $ | 103 | $ | (256 | ) | |||||||
111
CONDENSED CONSOLIDATING BALANCE SHEET | ||||||||||||||||||||
As of December 31, 2013 | ||||||||||||||||||||
(In millions) | Parent | Guarantor Subsidiaries | Non-guarantor Subsidiaries | Consolidating Adjustments | Consolidated | |||||||||||||||
Assets | ||||||||||||||||||||
Current assets: | ||||||||||||||||||||
Cash and cash equivalents | $ | — | $ | 165 | $ | 157 | $ | — | $ | 322 | ||||||||||
Accounts receivable, net | — | 433 | 201 | — | 634 | |||||||||||||||
Accounts receivable from affiliates | — | 335 | 135 | (470 | ) | — | ||||||||||||||
Inventories, net | — | 211 | 326 | (8 | ) | 529 | ||||||||||||||
Deferred income tax assets | — | — | 32 | — | 32 | |||||||||||||||
Interest receivable from parent | — | 14 | — | (14 | ) | — | ||||||||||||||
Note receivable from affiliate | — | 350 | — | (350 | ) | — | ||||||||||||||
Note receivable from subsidiary | 13 | — | — | (13 | ) | — | ||||||||||||||
Other current assets | — | 18 | 27 | — | 45 | |||||||||||||||
Total current assets | 13 | 1,526 | 878 | (855 | ) | 1,562 | ||||||||||||||
Fixed assets, net | — | 847 | 1,442 | — | 2,289 | |||||||||||||||
Amortizable intangible assets, net | — | — | 66 | — | 66 | |||||||||||||||
Deferred income tax assets | — | 28 | 1,236 | 2 | 1,266 | |||||||||||||||
Notes receivable from parent | — | 627 | — | (627 | ) | — | ||||||||||||||
Notes receivable from affiliates | — | 170 | — | (170 | ) | — | ||||||||||||||
Investments in and advances to consolidated subsidiaries | 4,734 | 2,085 | — | (6,819 | ) | — | ||||||||||||||
Other assets | 8 | 112 | 82 | — | 202 | |||||||||||||||
Total assets | $ | 4,755 | $ | 5,395 | $ | 3,704 | $ | (8,469 | ) | $ | 5,385 | |||||||||
Liabilities and equity | ||||||||||||||||||||
Current liabilities: | ||||||||||||||||||||
Accounts payable and accrued liabilities | $ | 5 | $ | 190 | $ | 338 | $ | — | $ | 533 | ||||||||||
Current portion of long-term debt | — | 1 | 1 | — | 2 | |||||||||||||||
Accounts payable to affiliates | 352 | 118 | — | (470 | ) | — | ||||||||||||||
Deferred income tax liabilities | — | 32 | — | — | 32 | |||||||||||||||
Interest payable to subsidiaries | 14 | — | — | (14 | ) | — | ||||||||||||||
Note payable to affiliate | — | — | 350 | (350 | ) | — | ||||||||||||||
Note payable to parent | — | — | 13 | (13 | ) | — | ||||||||||||||
Total current liabilities | 371 | 341 | 702 | (847 | ) | 567 | ||||||||||||||
Long-term debt, net of current portion | 595 | 2 | — | — | 597 | |||||||||||||||
Long-term debt due to subsidiaries | 627 | — | — | (627 | ) | — | ||||||||||||||
Long-term debt due to affiliate | — | — | 170 | (170 | ) | — | ||||||||||||||
Pension and other postretirement benefit obligations | — | 340 | 954 | — | 1,294 | |||||||||||||||
Deferred income tax liabilities | — | 1 | 25 | — | 26 | |||||||||||||||
Other long-term liabilities | — | 26 | 36 | — | 62 | |||||||||||||||
Total liabilities | 1,593 | 710 | 1,887 | (1,644 | ) | 2,546 | ||||||||||||||
Total equity | 3,162 | 4,685 | 1,817 | (6,825 | ) | 2,839 | ||||||||||||||
Total liabilities and equity | $ | 4,755 | $ | 5,395 | $ | 3,704 | $ | (8,469 | ) | $ | 5,385 | |||||||||
112
CONDENSED CONSOLIDATING BALANCE SHEET | ||||||||||||||||||||
As of December 31, 2012 | ||||||||||||||||||||
(In millions) | Parent | Guarantor Subsidiaries | Non-guarantor Subsidiaries | Consolidating Adjustments | Consolidated | |||||||||||||||
Assets | ||||||||||||||||||||
Current assets: | ||||||||||||||||||||
Cash and cash equivalents | $ | 5 | $ | 171 | $ | 87 | $ | — | $ | 263 | ||||||||||
Accounts receivable, net | — | 383 | 366 | (52 | ) | 697 | ||||||||||||||
Accounts receivable from affiliates | — | 262 | 211 | (473 | ) | — | ||||||||||||||
Inventories, net | — | 225 | 337 | (4 | ) | 558 | ||||||||||||||
Deferred income tax assets | — | 11 | 45 | — | 56 | |||||||||||||||
Notes and interest receivable from parent | — | 593 | — | (593 | ) | — | ||||||||||||||
Notes receivable from affiliates | — | 9 | 138 | (147 | ) | — | ||||||||||||||
Note receivable from a subsidiary | 41 | — | — | (41 | ) | — | ||||||||||||||
Other current assets | — | 18 | 38 | — | 56 | |||||||||||||||
Total current assets | 46 | 1,672 | 1,222 | (1,310 | ) | 1,630 | ||||||||||||||
Fixed assets, net | — | 908 | 1,532 | — | 2,440 | |||||||||||||||
Amortizable intangible assets, net | — | — | 69 | — | 69 | |||||||||||||||
Deferred income tax assets | — | 594 | 1,405 | 1 | 2,000 | |||||||||||||||
Note receivable from affiliate | — | 531 | — | (531 | ) | — | ||||||||||||||
Investments in and advances to consolidated subsidiaries | 4,859 | 2,089 | — | (6,948 | ) | — | ||||||||||||||
Other assets | — | 98 | 96 | — | 194 | |||||||||||||||
Total assets | $ | 4,905 | $ | 5,892 | $ | 4,324 | $ | (8,788 | ) | $ | 6,333 | |||||||||
Liabilities and equity | ||||||||||||||||||||
Current liabilities: | ||||||||||||||||||||
Accounts payable and accrued liabilities | $ | 11 | $ | 198 | $ | 424 | $ | (52 | ) | $ | 581 | |||||||||
Current portion of long-term debt | — | — | 2 | — | 2 | |||||||||||||||
Accounts payable to affiliates | 336 | 135 | 2 | (473 | ) | — | ||||||||||||||
Notes and interest payable to subsidiaries | 593 | — | — | (593 | ) | — | ||||||||||||||
Notes payable to affiliates | — | 138 | 9 | (147 | ) | — | ||||||||||||||
Note payable to parent | — | — | 41 | (41 | ) | — | ||||||||||||||
Total current liabilities | 940 | 471 | 478 | (1,306 | ) | 583 | ||||||||||||||
Long-term debt, net of current portion | 528 | 3 | 1 | — | 532 | |||||||||||||||
Long-term debt due to affiliate | — | — | 531 | (531 | ) | — | ||||||||||||||
Pension and other postretirement benefit obligations | — | 559 | 1,387 | — | 1,946 | |||||||||||||||
Deferred income tax liabilities | — | — | 75 | — | 75 | |||||||||||||||
Other long-term liabilities | — | 36 | 36 | — | 72 | |||||||||||||||
Total liabilities | 1,468 | 1,069 | 2,508 | (1,837 | ) | 3,208 | ||||||||||||||
Total equity | 3,437 | 4,823 | 1,816 | (6,951 | ) | 3,125 | ||||||||||||||
Total liabilities and equity | $ | 4,905 | $ | 5,892 | $ | 4,324 | $ | (8,788 | ) | $ | 6,333 | |||||||||
113
CONDENSED CONSOLIDATING STATEMENT OF CASH FLOWS | ||||||||||||||||||||
For the Year Ended December 31, 2013 | ||||||||||||||||||||
(In millions) | Parent | Guarantor Subsidiaries | Non-guarantor Subsidiaries | Consolidating Adjustments | Consolidated | |||||||||||||||
Net cash (used in) provided by operating activities | $ | (5 | ) | $ | 41 | $ | 170 | $ | — | $ | 206 | |||||||||
Cash flows from investing activities: | ||||||||||||||||||||
Cash invested in fixed assets | — | (55 | ) | (106 | ) | — | (161 | ) | ||||||||||||
Disposition of assets | — | — | 4 | — | 4 | |||||||||||||||
Proceeds from insurance settlements | — | — | 4 | — | 4 | |||||||||||||||
Decrease in restricted cash | — | — | 8 | — | 8 | |||||||||||||||
Increase in deposit requirements for letters of credit, net | — | — | (2 | ) | — | (2 | ) | |||||||||||||
Other investing activities, net | — | — | (4 | ) | — | (4 | ) | |||||||||||||
Net cash used in investing activities | — | (55 | ) | (96 | ) | — | (151 | ) | ||||||||||||
Cash flows from financing activities: | ||||||||||||||||||||
Issuance of long-term debt | 594 | — | — | — | 594 | |||||||||||||||
Premium paid on extinguishment of debt | (84 | ) | — | — | — | (84 | ) | |||||||||||||
Dividend to noncontrolling interest | — | — | (2 | ) | (2 | ) | ||||||||||||||
Payments of debt | (501 | ) | — | (2 | ) | — | (503 | ) | ||||||||||||
Payments of financing and credit facility fees | (9 | ) | — | — | — | (9 | ) | |||||||||||||
Contribution of capital from noncontrolling interest | — | 8 | — | — | 8 | |||||||||||||||
Net cash provided by (used in) financing activities | — | 8 | (4 | ) | — | 4 | ||||||||||||||
Net (decrease) increase in cash and cash equivalents | (5 | ) | (6 | ) | 70 | — | 59 | |||||||||||||
Cash and cash equivalents: | ||||||||||||||||||||
Beginning of year | 5 | 171 | 87 | — | 263 | |||||||||||||||
End of year | $ | — | $ | 165 | $ | 157 | $ | — | $ | 322 | ||||||||||
114
CONDENSED CONSOLIDATING STATEMENT OF CASH FLOWS | ||||||||||||||||||||
For the Year Ended December 31, 2012 | ||||||||||||||||||||
(In millions) | Parent | Guarantor Subsidiaries | Non-guarantor Subsidiaries | Consolidating Adjustments | Consolidated | |||||||||||||||
Net cash provided by operating activities | $ | — | $ | 249 | $ | 17 | $ | — | $ | 266 | ||||||||||
Cash flows from investing activities: | ||||||||||||||||||||
Cash invested in fixed assets | — | (42 | ) | (127 | ) | — | (169 | ) | ||||||||||||
Disposition of our interest in our Mersey operations, net of cash | — | — | 14 | — | 14 | |||||||||||||||
Disposition of other assets | — | 1 | 35 | — | 36 | |||||||||||||||
Acquisition of Fibrek, net of cash acquired | — | — | (24 | ) | — | (24 | ) | |||||||||||||
Decrease in restricted cash | — | — | 76 | — | 76 | |||||||||||||||
Increase in deposit requirements for letters of credit, net | — | — | (12 | ) | — | (12 | ) | |||||||||||||
Advances from (to) affiliates | 72 | (56 | ) | (16 | ) | — | — | |||||||||||||
Other investing activities, net | — | — | 4 | — | 4 | |||||||||||||||
Net cash provided by (used in) investing activities | 72 | (97 | ) | (50 | ) | — | (75 | ) | ||||||||||||
Cash flows from financing activities: | ||||||||||||||||||||
Purchases of treasury stock | (67 | ) | — | — | — | (67 | ) | |||||||||||||
Dividends and distribution to noncontrolling interests | — | — | (5 | ) | — | (5 | ) | |||||||||||||
Acquisition of noncontrolling interest | — | — | (27 | ) | — | (27 | ) | |||||||||||||
Payments of debt | — | (109 | ) | (89 | ) | — | (198 | ) | ||||||||||||
Net cash used in financing activities | (67 | ) | (109 | ) | (121 | ) | — | (297 | ) | |||||||||||
Net increase (decrease) in cash and cash equivalents | 5 | 43 | (154 | ) | — | (106 | ) | |||||||||||||
Cash and cash equivalents: | ||||||||||||||||||||
Beginning of year | — | 128 | 241 | — | 369 | |||||||||||||||
End of year | $ | 5 | $ | 171 | $ | 87 | $ | — | $ | 263 | ||||||||||
115
CONDENSED CONSOLIDATING STATEMENT OF CASH FLOWS | ||||||||||||||||||||
For the Year Ended December 31, 2011 | ||||||||||||||||||||
(In millions) | Parent | Guarantor Subsidiaries | Non-guarantor Subsidiaries | Consolidating Adjustments | Consolidated | |||||||||||||||
Net cash provided by operating activities | $ | — | $ | 188 | $ | 10 | $ | — | $ | 198 | ||||||||||
Cash flows from investing activities: | ||||||||||||||||||||
Cash invested in fixed assets | — | (30 | ) | (67 | ) | — | (97 | ) | ||||||||||||
Disposition of investment in ACH | — | — | 296 | — | 296 | |||||||||||||||
Disposition of other assets | — | 11 | 8 | — | 19 | |||||||||||||||
Proceeds from holdback related to disposition of investment in MPCo | — | — | 29 | — | 29 | |||||||||||||||
Proceeds from insurance settlements | — | — | 8 | — | 8 | |||||||||||||||
Increase in restricted cash | — | — | (2 | ) | — | (2 | ) | |||||||||||||
Increase in deposit requirements for letters of credit, net | — | — | (8 | ) | — | (8 | ) | |||||||||||||
Advances from (to) affiliates | — | 150 | (150 | ) | — | — | ||||||||||||||
Net cash provided by investing activities | — | 131 | 114 | — | 245 | |||||||||||||||
Cash flows from financing activities: | ||||||||||||||||||||
Dividends and distribution to noncontrolling interests | — | — | (21 | ) | — | (21 | ) | |||||||||||||
Acquisition of noncontrolling interest | — | — | (15 | ) | — | (15 | ) | |||||||||||||
Payments of debt | — | (354 | ) | — | — | (354 | ) | |||||||||||||
Payment of credit facility fees | — | (1 | ) | (2 | ) | — | (3 | ) | ||||||||||||
Net cash used in financing activities | — | (355 | ) | (38 | ) | — | (393 | ) | ||||||||||||
Net (decrease) increase in cash and cash equivalents | — | (36 | ) | 86 | — | 50 | ||||||||||||||
Cash and cash equivalents: | ||||||||||||||||||||
Beginning of year | — | 164 | 155 | — | 319 | |||||||||||||||
End of year | $ | — | $ | 128 | $ | 241 | $ | — | $ | 369 | ||||||||||
116
Note 22. Quarterly Information (Unaudited)
Year ended December 31, 2013 | First Quarter | Second Quarter | Third Quarter | Fourth Quarter | Year | |||||||||||||||
(In millions, except per share amounts) | ||||||||||||||||||||
Sales | $ | 1,074 | $ | 1,107 | $ | 1,130 | $ | 1,150 | $ | 4,461 | ||||||||||
Operating (loss) income (1) | (49 | ) | 3 | 36 | 8 | (2 | ) | |||||||||||||
Net loss attributable to Resolute Forest Products Inc. | (5 | ) | (43 | ) | (588 | ) | (3 | ) | (639 | ) | ||||||||||
Basic net loss per share attributable to Resolute Forest Products Inc. common shareholders | (0.05 | ) | (0.45 | ) | (6.22 | ) | (0.03 | ) | (6.75 | ) | ||||||||||
Diluted net loss per share attributable to Resolute Forest Products Inc. common shareholders | (0.05 | ) | (0.45 | ) | (6.22 | ) | (0.03 | ) | (6.75 | ) | ||||||||||
Year ended December 31, 2012 | First Quarter | Second Quarter | Third Quarter | Fourth Quarter | Year | |||||||||||||||
(In millions, except per share amounts) | ||||||||||||||||||||
Sales | $ | 1,054 | $ | 1,168 | $ | 1,153 | $ | 1,128 | $ | 4,503 | ||||||||||
Operating income (loss) (2) | 31 | (32 | ) | 31 | (58 | ) | (28 | ) | ||||||||||||
Net income (loss) attributable to Resolute Forest Products Inc. | 26 | (17 | ) | 37 | (45 | ) | 1 | |||||||||||||
Basic net income (loss) per share attributable to Resolute Forest Products Inc. common shareholders | 0.27 | (0.17 | ) | 0.38 | (0.47 | ) | 0.01 | |||||||||||||
Diluted net income (loss) per share attributable to Resolute Forest Products Inc. common shareholders | 0.27 | (0.17 | ) | 0.38 | (0.47 | ) | 0.01 | |||||||||||||
(1)Operating loss for the year ended December 31, 2013 included the following significant items:
(In millions) | First Quarter | Second Quarter | Third Quarter | Fourth Quarter | Year | |||||||||||||||
Net gain on disposition of assets | $ | — | $ | 2 | $ | — | $ | — | $ | 2 | ||||||||||
Closure costs, impairment and other related charges | (40 | ) | (12 | ) | (4 | ) | (33 | ) | (89 | ) | ||||||||||
Inventory write-downs related to closures | (4 | ) | (1 | ) | — | (6 | ) | (11 | ) | |||||||||||
Transaction costs | (3 | ) | (2 | ) | — | (1 | ) | (6 | ) | |||||||||||
Start up costs of idled mill | (15 | ) | (13 | ) | (3 | ) | (1 | ) | (32 | ) | ||||||||||
$ | (62 | ) | $ | (26 | ) | $ | (7 | ) | $ | (41 | ) | $ | (136 | ) | ||||||
(2)Operating income (loss) for the year ended December 31, 2012 included the following significant items:
(In millions) | First Quarter | Second Quarter | Third Quarter | Fourth Quarter | Year | |||||||||||||||
Net gain on disposition of assets | $ | 23 | $ | 1 | $ | 4 | $ | 7 | $ | 35 | ||||||||||
Closure costs, impairment and other related charges | (5 | ) | (88 | ) | (5 | ) | (87 | ) | (185 | ) | ||||||||||
Inventory write-downs related to closures | — | (7 | ) | — | (5 | ) | (12 | ) | ||||||||||||
Severance costs | (2 | ) | (1 | ) | — | (2 | ) | (5 | ) | |||||||||||
Transaction costs | (4 | ) | (3 | ) | — | (1 | ) | (8 | ) | |||||||||||
Start up costs of idled mills | — | — | (5 | ) | (8 | ) | (13 | ) | ||||||||||||
$ | 12 | $ | (98 | ) | $ | (6 | ) | $ | (96 | ) | $ | (188 | ) | |||||||
117
Note 23. Subsequent Events
The following significant events occurred subsequent to December 31, 2013:
• | The province of Québec informed us on December 30, 2011 that it intended not to renew the water rights associated with our Jim-Gray hydroelectric dam and to require us to transfer the property to the province for no consideration. The province had granted us several extensions, through March 1, 2014, to transfer the property. As part of a master agreement reached with the province on February 28, 2014, among other things, it renewed the water rights associated with the Jim-Gray dam for a period of 10 years as of January 1, 2012, which are further renewable under certain conditions. Accordingly, we will retain the property of the dam until the expiry of the associated water rights. |
• | On January 14, 2014, we announced an extended period of market-related outage at a paper mill in Fort Frances. For additional information, see Note 5, “Closure Costs, Impairment and Other Related Charges,” and Note 8, “Accumulated Other Comprehensive Loss.” |
• | Following the five year renewal of the master collective agreement covering 4 unionized U.S. pulp and paper mills, effective as of February 14, 2014, we will amend our U.S. OPEB plan, whereby unionized post-65 active employees will be provided Medicare coverage via a Medicare Exchange program, effective January 1, 2015. As a result of this plan amendment, “Pension and other postretirement benefit obligations” and “Accumulated other comprehensive loss” in our consolidated balance sheet will both be decreased in 2014 by approximately $40 million. |
• | The ABL Credit Facility was amended as of February 25, 2014, to, among other things: |
• | release the liens securing the ABL Credit Facility on that portion of the assets of the U.S. Borrowers and the U.S. Guarantors which had secured the 2018 Notes on a first priority basis, primarily consisting of real property, equipment, intellectual property and the equity of our subsidiaries, with the ability to re-implement those liens with a second lien priority should we issue new secured debt which is to be secured by a second lien on our accounts receivable and inventory and other assets which continue to secure the ABL Credit Facility; |
• | reduce the excess availability thresholds that trigger a minimum consolidated fixed charge coverage ratio to the greater of: (i) $50 million and (ii) 10% of the lesser of (A) the total commitments and (B) the borrowing base then in effect; |
• | increase the uncommitted incremental loan facility to $200 million; |
• | increase our borrowing capacity by expanding our ability to create liens if the debt incurrence test is met and by increasing minimum baskets for unsecured and secured debt to $500 million each, subject to certain conditions; and |
• | increase the borrowing base by including 90% of eligible international accounts receivable and 100% of cash deposits, limited to $100 million and subject to certain conditions. |
118
REPORT OF INDEPENDENT REGISTERED PUBLIC ACCOUNTING FIRM
To the Board of Directors and the Shareholders of Resolute Forest Products Inc.
In our opinion, the accompanying consolidated balance sheets and the related consolidated statements of operations, comprehensive loss, changes in deficit and cash flows present fairly, in all material respects, the financial position of Resolute Forest Products Inc. and its subsidiaries at December 31, 2013 and December 31, 2012, and the results of their operations and their cash flows for each of the three years in the period ended December 31, 2013 in conformity with accounting principles generally accepted in the United States of America. In addition, in our opinion, the accompanying financial statements schedule listed in the index appearing under item 15(a)(2) which includes the parent company only condensed balance sheets at December 31, 2013 and December 31, 2012 and the related condensed statements of operations, (deficit) retained earnings and comprehensive loss and cash flows for each of the three years in the period ended December 31, 2013 present fairly, in all material respects, the information set forth therein when read in conjunction with the related consolidated financial statements. Also in our opinion, the Company maintained, in all material respects, effective internal control over financial reporting as of December 31, 2013, based on criteria established in Internal Control - Integrated Framework (1992) issued by the Committee of Sponsoring Organizations of the Treadway Commission (COSO). The Company's management is responsible for these financial statements and financial statement schedule, for maintaining effective internal control over financial reporting and for its assessment of the effectiveness of internal control over financial reporting, included in the accompanying Management's Report on Financial Statements and Assessment of Internal Control over Financial Reporting. Our responsibility is to express opinions on these financial statements, on the financial statement schedule, and on the Company's internal control over financial reporting based on our integrated audits .We conducted our audits in accordance with the standards of the Public Company Accounting Oversight Board (United States). Those standards require that we plan and perform the audits to obtain reasonable assurance about whether the financial statements are free of material misstatement and whether effective internal control over financial reporting was maintained in all material respects. Our audits of the financial statements included examining, on a test basis, evidence supporting the amounts and disclosures in the financial statements, assessing the accounting principles used and significant estimates made by management, and evaluating the overall financial statement presentation. Our audit of internal control over financial reporting included obtaining an understanding of internal control over financial reporting, assessing the risk that a material weakness exists, and testing and evaluating the design and operating effectiveness of internal control based on the assessed risk. Our audits also included performing such other procedures as we considered necessary in the circumstances. We believe that our audits provide a reasonable basis for our opinions.
As discussed in Note 1 to the consolidated financial statements, the Company changed the manner in which it accounts for planned major maintenance costs.
A company’s internal control over financial reporting is a process designed to provide reasonable assurance regarding the reliability of financial reporting and the preparation of financial statements for external purposes in accordance with generally accepted accounting principles. A company’s internal control over financial reporting includes those policies and procedures that (i) pertain to the maintenance of records that, in reasonable detail, accurately and fairly reflect the transactions and dispositions of the assets of the company; (ii) provide reasonable assurance that transactions are recorded as necessary to permit preparation of financial statements in accordance with generally accepted accounting principles, and that receipts and expenditures of the company are being made only in accordance with authorizations of management and directors of the company; and (iii) provide reasonable assurance regarding prevention or timely detection of unauthorized acquisition, use, or disposition of the company’s assets that could have a material effect on the financial statements.
Because of its inherent limitations, internal control over financial reporting may not prevent or detect misstatements. Also, projections of any evaluation of effectiveness to future periods are subject to the risk that controls may become inadequate because of changes in conditions, or that the degree of compliance with the policies or procedures may deteriorate.
/s/ PricewaterhouseCoopers LLP (1) |
Montreal, Canada |
March 3, 2014 |
(1) CPA auditor, CA, public accountancy permit No.A113048 |
119
MANAGEMENT’S REPORT ON FINANCIAL STATEMENTS AND ASSESSMENT OF INTERNAL CONTROL OVER FINANCIAL REPORTING
Financial Statements
Management of Resolute Forest Products Inc. is responsible for the preparation of the financial information included in this Form 10-K. The accompanying consolidated financial statements have been prepared in accordance with U.S. generally accepted accounting principles and include amounts that are based on the best estimates and judgments of management.
Assessment of Internal Control over Financial Reporting
Management is responsible for establishing and maintaining adequate internal control over financial reporting as defined in Rules 13a-15(f) and 15d-15(f) under the Securities Exchange Act of 1934. Resolute Forest Products Inc.’s internal control over financial reporting is a process designed to provide reasonable assurance regarding the reliability of financial reporting and the preparation of financial statements for external purposes in accordance with U.S. generally accepted accounting principles. Internal control over financial reporting includes those policies and procedures that:
— | pertain to the maintenance of records that, in reasonable detail, accurately and fairly reflect the transactions and dispositions of the assets of Resolute Forest Products Inc.; |
— | provide reasonable assurance that transactions are recorded as necessary to permit preparation of financial statements in accordance with U.S. generally accepted accounting principles; |
— | provide reasonable assurance that receipts and expenditures of Resolute Forest Products Inc. are being made only in accordance with the authorizations of management and directors of Resolute Forest Products Inc.; and |
— | provide reasonable assurance regarding prevention or timely detection of unauthorized acquisition, use or disposition of assets that could have a material effect on the consolidated financial statements. |
Because of its inherent limitations, internal control over financial reporting may not prevent or detect misstatements. Projections of any evaluation of effectiveness to future periods are subject to the risk that controls may become inadequate because of changes in conditions, or that the degree of compliance with the policies or procedures may deteriorate.
Management assessed the effectiveness of Resolute Forest Products Inc.’s internal control over financial reporting as of December 31, 2013. Management based this assessment on the criteria for effective internal control over financial reporting described in Internal Control – Integrated Framework (1992) issued by the Committee of Sponsoring Organizations of the Treadway Commission. Management’s assessment included an evaluation of the design of Resolute Forest Products Inc.’s internal control over financial reporting and testing of the operational effectiveness of its internal control over financial reporting. Management reviewed the results of its assessment with the Audit Committee of our Board of Directors.
Based on this assessment, management determined that, as of December 31, 2013, Resolute Forest Products Inc.’s internal control over financial reporting was effective.
The effectiveness of Resolute Forest Products Inc.’s internal control over financial reporting as of December 31, 2013 has been audited by PricewaterhouseCoopers LLP, an independent registered public accounting firm, as stated in their report above.
120
ITEM 9. CHANGES IN AND DISAGREEMENTS WITH ACCOUNTANTS ON ACCOUNTING AND FINANCIAL DISCLOSURE
None.
ITEM 9A. CONTROLS AND PROCEDURES
Evaluation of Disclosure Controls and Procedures
Disclosure controls and procedures as defined in Exchange Act Rules 13a-15(e) and 15d-15(e) are our controls and other procedures that are designed to ensure that information required to be disclosed by us in the reports that we file or submit under the Exchange Act is recorded, processed, summarized and reported within the time periods specified in the Securities and Exchange Commission’s rules and forms. Disclosure controls and procedures include, without limitation, controls and procedures designed to ensure that information required to be disclosed by us in the reports that we file or submit under the Exchange Act is accumulated and communicated to our management, including our President and Chief Executive Officer and Senior Vice President and Chief Financial Officer, as appropriate to allow timely decisions regarding required disclosure.
We have evaluated the effectiveness of the design and operation of our disclosure controls and procedures, as defined in Rules 13a-15(e) and 15d-15(e) of the Securities Exchange Act of 1934, as of December 31, 2013. Based on that evaluation, the President and Chief Executive Officer and the Senior Vice President and Chief Financial Officer concluded that our disclosure controls and procedures were effective as of such date in recording, processing, summarizing and timely reporting information required to be disclosed in our reports to the Securities and Exchange Commission.
Management’s Report on Internal Control over Financial Reporting
Management has issued its report on internal control over financial reporting, which included management’s assessment that the Company’s internal control over financial reporting was effective as of December 31, 2013. Management’s report on internal control over financial reporting can be found on page 120 of this Form 10-K. Our independent registered public accounting firm, PricewaterhouseCoopers LLP, has issued an attestation report on the effectiveness of internal control over financial reporting as of December 31, 2013. This report can be found on page 119 of this Form 10-K.
Changes in Internal Control over Financial Reporting
In connection with the evaluation of internal control over financial reporting, there were no changes during the quarter ended December 31, 2013 that have materially affected, or are reasonably likely to materially affect, our internal control over financial reporting.
ITEM 9B. OTHER INFORMATION
None.
121
PART III
ITEM 10. DIRECTORS, EXECUTIVE OFFICERS AND CORPORATE GOVERNANCE
The information required by this Item is incorporated by reference to our definitive proxy statement for our 2014 annual meeting of shareholders to be held on May 23, 2014 (the “2014 proxy statement”), which will be filed within 120 days of the end of our fiscal year ended December 31, 2013.
We have adopted a code of ethics that applies to our principal executive officer, principal financial officer and principal accounting officer. This code of ethics (which is entitled “Code of Business Conduct”) and our corporate governance policies are posted on our website at www.resolutefp.com. We intend to satisfy disclosure requirements regarding amendments to or waivers from our code of ethics by posting such information on this website. The charters of the Audit Committee and the Human Resources and Compensation/Nominating and Governance Committee of our Board of Directors are available on our website as well. This information is also available in print free of charge to any person who requests it.
ITEM 11. EXECUTIVE COMPENSATION
The information required by this Item is incorporated by reference to our 2014 proxy statement.
ITEM 12. SECURITY OWNERSHIP OF CERTAIN BENEFICIAL OWNERS AND MANAGEMENT AND RELATED STOCKHOLDER MATTERS
The information required by this Item that is not included below under “Equity Compensation Plan Information” is incorporated by reference to our 2014 proxy statement.
Equity Compensation Plan Information
The following table provides information as of December 31, 2013 regarding securities to be issued upon exercise of outstanding stock options or pursuant to outstanding restricted stock units, deferred stock units and performance-based awards, and securities remaining available for issuance under our equity compensation plan. The Resolute Forest Products Equity Incentive Plan is the only compensation plan with shares authorized.
Plan category | (a) Number of securities to be issued upon exercise of outstanding options, warrants and rights | (b) Weighted-average exercise price of outstanding options, warrants and rights | (c) Number of securities remaining available for future issuance under equity compensation plans (excluding securities reflected in column (a)) | |||||||
Equity compensation plans approved by security holders | — | $ | — | — | ||||||
Equity compensation plans not approved by security holders (1) | 2,989,754 | 15.56 | 5,706,952 | |||||||
Total | 2,989,754 | $ | 15.56 | 5,706,952 | ||||||
(1) | The Resolute Forest Products Equity Incentive Plan was approved by the Courts pursuant to the Plans of Reorganization. The weighted-average exercise price in column (b) represents the weighted-average exercise price of 2,029,303 stock options outstanding as of December 31, 2013. There is no exercise price for the 960,451 restricted stock units and deferred stock units outstanding as of December 31, 2013. |
ITEM 13. CERTAIN RELATIONSHIPS AND RELATED TRANSACTIONS, AND DIRECTOR INDEPENDENCE
The information required by this Item is incorporated by reference to our 2014 proxy statement.
ITEM 14. PRINCIPAL ACCOUNTING FEES AND SERVICES
The information required by this Item is incorporated by reference to our 2014 proxy statement.
122
PART IV
ITEM 15. EXHIBITS, FINANCIAL STATEMENT SCHEDULES
(a) The following are filed as a part of this Form 10-K:
(1) The following are included at the indicated page of this Form 10-K:
Page | ||
Consolidated Statements of Operations for the Years Ended December 31, 2013, 2012 and 2011 | ||
Consolidated Statements of Comprehensive Loss for the Years Ended December 31, 2013, 2012 and 2011 | ||
Consolidated Balance Sheets as of December 31, 2013 and 2012 | ||
Consolidated Statements of Changes in Equity for the Years Ended December 31, 2013, 2012 and 2011 | ||
Consolidated Statements of Cash Flows for the Years Ended December 31, 2013 and 2012 | ||
(2) The following financial statement schedule for the years ended December 31, 2013, 2012 and 2011 is submitted:
All other financial statement schedules are omitted because they are not applicable, not material or because the required information is included in the financial statements or notes.
(3) Exhibits (numbered in accordance with Item 601 of Regulation S-K):
Exhibit No. | Description |
2.1* | Share Purchase Agreement, dated December 10, 2012, among The Province of Nova Scotia, Bowater Canadian Limited, The Daily Herald Company and Resolute Forest Products Inc. (incorporated by reference from Exhibit 2.1 to Resolute Forest Products Inc.’s Current Report on Form 8-K filed December 14, 2012, SEC File No. 001-33776). |
3.1* | Amended and Restated Certificate of Incorporation of Resolute Forest Product Inc. (incorporated by reference from Exhibit 3.1 to Resolute Forest Product Inc.’s Annual Report on Form 10-K for the year ended December 31, 2012 filed March 1, 2013, SEC File No. 001-33776). |
3.2* | Third Amended and Restated By-laws of AbitibiBowater Inc. (incorporated by reference from Exhibit 3(ii) to AbitibiBowater Inc.’s Form 8-A filed on December 9, 2010). |
4.1* | Amended and Restated Indenture, dated as of May 12, 2011, among AbitibiBowater Inc., each of the guarantors from time to time party hereto, as guarantors, and Wells Fargo Bank, National Association, as trustee and as collateral agent (incorporated by reference from Exhibit 4.1 to AbitibiBowater Inc.’s Quarterly Report on Form 10-Q for the quarter ended March 31, 2011 filed May 16, 2011, SEC File No. 001-33776). |
4.2* | Form of 10.25% Senior Note due 2018 (included in Exhibit 4.1 to AbitibiBowater Inc.’s Quarterly Report on Form 10-Q for the quarter ended March 31, 2011 filed May 16, 2011, SEC File No. 001-33776). |
4.3* | Second Supplemental Indenture, dated as of March 9, 2012, among AbitibiBowater Inc., the guarantors party thereto and Wells Fargo Bank, National Association, as trustee (incorporated by reference from Exhibit 4.1 to AbitibiBowater Inc.’s Quarterly Report on Form 10-Q for the quarter ended March 31, 2012 filed May 10, 2012, SEC File No. 001-33776). |
4.4* | Third Supplemental Indenture, dated as of December 31, 2012, among Resolute Forest Products Inc., the guarantors party thereto and Wells Fargo Bank, National Association, as trustee. (incorporated by reference from Exhibit 4.1 to Resolute Forest Products Inc.’s Quarterly Report on Form 10-Q for the quarter ended March 31, 2013 filed May 10, 2013, SEC File No. 001-33776). |
123
Exhibit No. | Description |
4.5* | Fourth Supplemental Indenture, dated as of March 12, 2013, among Resolute Forest Products Inc., the guarantors party thereto and Wells Fargo Bank, National Association, as trustee. (incorporated by reference from Exhibit 4.2 to Resolute Forest Products Inc.’s Quarterly Report on Form 10-Q for the quarter ended March 31, 2013 filed May 10, 2013, SEC File No. 001-33776). |
4.6* | Fifth Supplemental Indenture, dated as of May 7, 2013, among Resolute Forest Products Inc., the guarantors party thereto and Wells Fargo Bank, National Association, as trustee. (incorporated by reference from Exhibit 4.3 to Resolute Forest Products Inc.’s Quarterly Report on Form 10-Q for the quarter ended March 31, 2013 filed May 10, 2013, SEC File No. 001-33776). |
4.7* | Indenture, dated as of May 8, 2013, among Resolute Forest Products Inc., the guarantors party thereto and Wells Fargo Bank, National Association, as trustee. (incorporated by reference from Exhibit 4.4 to Resolute Forest Products Inc.’s Quarterly Report on Form 10-Q for the quarter ended March 31, 2013 filed May 10, 2013, SEC File No. 001-33776). |
4.8* | Registration Rights Agreement, dated as of May 8, 2013, among Resolute Forest Products Inc., the guarantors party thereto and Merrill Lynch, Pierce, Fenner & Smith Incorporated, as representative. (incorporated by reference from Exhibit 4.5 to Resolute Forest Products Inc.’s Quarterly Report on Form 10-Q for the quarter ended March 31, 2013 filed May 10, 2013, SEC File No. 001-33776). |
10.1* | ABL Credit Agreement, dated as of December 9, 2010, among AbitibiBowater Inc., Bowater Incorporated, Abitibi-Consolidated Corp., Abitibi-Consolidated Inc., Barclays Bank PLC, JPMorgan Chase Bank, N.A., and Citibank, N.A., as administrative agent and collateral agent (incorporated by reference from Exhibit 10.1 to AbitibiBowater Inc.’s Current Report on Form 8-K filed December 15, 2010, SEC File No. 001-33776). |
10.2* | Securities Purchase Agreement, dated February 11, 2011, among AbiBow Canada Inc., Caisse de depot et placement du Quebec and CDP Investissements Inc., as vendors, and Infra H2O GP Partners Inc., Infra H2O LP Partners Inc. and BluEarth Renewables Inc., as the purchaser (incorporated by reference from Exhibit 2.1 to AbitibiBowater Inc.’s Current Report on Form 8-K filed February 17, 2011, SEC File No. 001-33776). |
†10.3* | AbitibiBowater 2010 Canadian DB Supplemental Executive Retirement Plan, effective as of December 9, 2010 (incorporated by reference from Exhibit 10.4 to AbitibiBowater Inc.’s Annual Report on Form 10-K for the year ended December 31, 2010 filed April 5, 2011, SEC File No. 001-33776). |
†10.4* | AbitibiBowater Inc. 2010 Equity Incentive Plan Form of Restricted Stock Unit Agreement (incorporated by reference from Exhibit 10.2 to AbitibiBowater Inc.’s Registration Statement on Form S-8 filed January 7, 2011, SEC Registration No. 333-171602). |
†10.5* | AbitibiBowater Inc. 2010 Equity Incentive Plan Form of Director Nonqualified Stock Option Agreement (incorporated by reference from Exhibit 10.3 to AbitibiBowater Inc.’s Registration Statement on Form S-8 filed January 7, 2011, SEC Registration No. 333-171602). |
†10.6* | AbitibiBowater Inc. 2010 Equity Incentive Plan Form of Employee Nonqualified Stock Option Agreement (incorporated by reference from Exhibit 10.4 to AbitibiBowater Inc.’s Registration Statement on Form S-8 filed January 7, 2011, SEC Registration No. 333-171602). |
†10.7* | AbitibiBowater Inc. 2010 Equity Incentive Plan Form of Employee Restricted Stock Unit Agreement (incorporated by reference from Exhibit 10.13 to AbitibiBowater Inc.’s Annual Report on Form 10-K for the year ended December 31, 2011 filed February 29, 2012, SEC File No. 001-33776). |
†10.8* | AbitibiBowater Inc. 2010 Equity Incentive Plan Form of Employee Nonqualified Stock Option Agreement (incorporated by reference from Exhibit 10.14 to AbitibiBowater Inc.’s Annual Report on Form 10-K for the year ended December 31, 2011 filed February 29, 2012, SEC File No. 001-33776). |
†10.9* | AbitibiBowater Executive Restricted Stock Unit Plan, effective as of April 1, 2011 (incorporated by reference from Exhibit 10.13 to AbitibiBowater Inc.’s Annual Report on Form 10-K for the year ended December 31, 2010 filed April 5, 2011, SEC File No. 001-33776). |
†10.10* | Employment Agreement between Yves Laflamme and AbitibiBowater Inc., dated February 14, 2011 (incorporated by reference from Exhibit 10.2 to AbitibiBowater Inc.’s Current Report on Form 8-K filed February 18, 2011, SEC File No. 001-33776). |
†10.11* | Offer Letter between Jo-Ann Longworth and AbitibiBowater Inc., dated July 25, 2011 (incorporated by reference from Exhibit 10.2 to AbitibiBowater Inc.’s Quarterly Report on Form 10-Q for the quarter ended September 30, 2011 filed November 14, 2011, SEC File No. 001-33776). |
124
Exhibit No. | Description |
†10.12* | Offer Letter between Pierre Laberge and AbitibiBowater Inc., dated June 9, 2011 (incorporated by reference from Exhibit 10.35 to AbitibiBowater Inc.’s Annual Report on Form 10-K for the year ended December 31, 2011 filed February 29, 2012, SEC File No. 001-33776). |
†10.13* | Director compensation program chart (incorporated by reference from Exhibit 10.36 to AbitibiBowater Inc.’s Annual Report on Form 10-K for the year ended December 31, 2011 filed February 29, 2012, SEC File No. 001-33776). |
†10.14* | Retirement Compensation Trust Agreement (with Letter of Credit) between AbiBow Canada Inc. and AbitibiBowater Inc. and CIBC Mellon Trust Company, dated and effective as of November 1, 2011 (incorporated by reference from Exhibit 10.39 to AbitibiBowater Inc.’s Annual Report on Form 10-K for the year ended December 31, 2011 filed February 29, 2012, SEC File No. 001-33776). |
†10.15* | Agreement Concerning the Pulp and Paper Operations of AbiBow Canada in Ontario, dated November 10, 2010, between Bowater Canadian Forest Products Inc. and Abitibi-Consolidated Company of Canada and The Province of Ontario (incorporated by reference from Exhibit 10.32 to AbitibiBowater Inc.’s Annual Report on Form 10-K for the year ended December 31, 2010 filed April 5, 2011, SEC File No. 001-33776). |
†10.16* | Agreement Concerning the Pulp and Paper Operations of AbiBow Canada in Quebec, dated September 13, 2010, between Bowater Canadian Forest Products Inc. and Abitibi-Consolidated Company of Canada and The Government of Quebec (incorporated by reference from Exhibit 10.33 to AbitibiBowater Inc.’s Annual Report on Form 10-K for the year ended December 31, 2010 filed April 5, 2011, SEC File No. 001-33776). |
10.17* | Amendment No. 1, dated as of April 28, 2011, to the ABL Credit Agreement, dated as of December 9, 2010, among AbitibiBowater Inc., the subsidiaries of AbitibiBowater party thereto, the lenders party thereto from time to time and Citibank, N.A., as administrative agent and collateral agent (incorporated by reference from Exhibit 10.1 to AbitibiBowater Inc.’s Quarterly Report on Form 10-Q for the quarter ended March 31, 2011 filed May 16, 2011, SEC File No. 001-33776). |
10.18* | Amendment No. 2, dated October 28, 2011, to ABL Credit Agreement, dated as of December 9, 2010, among AbitibiBowater Inc., AbiBow US Inc. (f/k/a Bowater Incorporated) and AbiBow Recycling LLC (f/k/a Abitibi-Consolidated Corp.) and AbiBow Canada Inc. (f/k/a Abitibi-Consolidated Inc.), and Citibank, N.A., as administrative agent and collateral agent (incorporated by reference from Exhibit 10.1 to AbitibiBowater Inc.’s Current Report on Form 8-K filed October 31, 2011, SEC File No. 001-33776). |
10.19* | Lock-up Agreement between AbitibiBowater Inc. and Fairfax Financial Holdings Limited, dated as of November 28, 2011 (incorporated by reference from Exhibit 10.1 to AbitibiBowater Inc.’s Current Report on Form 8-K filed November 29, 2011, SEC File No. 001-33776). |
10.20* | Lock-up Agreement between AbitibiBowater Inc. and Oakmont Capital Inc., dated as of November 28, 2011 (incorporated by reference from Exhibit 10.2 to AbitibiBowater Inc.’s Current Report on Form 8-K filed November 29, 2011, SEC File No. 001-33776). |
10.21* | Lock-up Agreement between AbitibiBowater Inc. and Dalal Street, LLC, dated as of November 28, 2011 (incorporated by reference from Exhibit 10.3 to AbitibiBowater Inc.’s Current Report on Form 8-K filed November 29, 2011, SEC File No. 001-33776). |
†10.22* | Executive Employment Agreement between AbitibiBowater Inc. and Richard Garneau, dated January 1, 2011 (incorporated by reference from Exhibit 10.26 to AbitibiBowater Inc.’s Annual Report on Form 10-K for the year ended December 31, 2010 filed April 5, 2011, SEC File No. 001-33776). |
†10.23* | Change in Control Agreement between AbitibiBowater Inc. and Richard Garneau, dated January 1, 2011 (incorporated by reference from Exhibit 10.27 to AbitibiBowater Inc.’s Annual Report on Form 10-K for the year ended December 31, 2010 filed April 5, 2011, SEC File No. 001-33776). |
†10.24** | Executive Employment Agreement between AbitibiBowater Inc. and Richard Garneau, dated February 26, 2014. |
†10.25** | Change in Control Agreement between AbitibiBowater Inc. and Richard Garneau, dated February 26, 2014. |
†10.26* | Employment Agreement between Alain Boivin and AbitibiBowater Inc., dated February 22, 2011 (incorporated by reference from Exhibit 10.28 to AbitibiBowater Inc.’s Annual Report on Form 10-K for the year ended December 31, 2010 filed April 5, 2011, SEC File No. 001-33776). |
†10.27* | Offer Letter between John Lafave and AbitibiBowater Inc., dated February 14, 2011 (incorporated by reference from Exhibit 10.29 to AbitibiBowater Inc.’s Annual Report on Form 10-K for the year ended December 31, 2010 filed April 5, 2011, SEC File No. 001-33776). |
125
Exhibit No. | Description |
†10.28* | Offer Letter between Jacques Vachon and AbitibiBowater Inc., dated March 19, 2012 (incorporated by reference from Exhibit 10.2 to AbitibiBowater Inc.’s Quarterly Report on Form 10-Q for the quarter ended March 31, 2012 filed May 10, 2012, SEC File No. 001-33776). |
†10.29* | Resolute Forest Products DC Make-up Program, effective January 1, 2012 (incorporated by reference from Exhibit 10.3 to AbitibiBowater Inc.’s Quarterly Report on Form 10-Q for the quarter ended March 31, 2012 filed May 10, 2012, SEC File No. 001-33776). |
10.30* | Waiver and Amendment No. 3, dated as of March 21, 2012, under and to the ABL Credit Agreement, dated as of December 9, 2010, among AbitibiBowater Inc., the subsidiaries of AbitibiBowater party thereto, the lenders party thereto from time to time and Citibank, N.A., as administrative agent and collateral agent (incorporated by reference from Exhibit 10.4 to AbitibiBowater Inc.’s Quarterly Report on Form 10-Q for the quarter ended March 31, 2012 filed May 10, 2012, SEC File No. 001-33776). |
†10.31* | Resolute Forest Products Inc. Severance Policy – Chief Executive Officer and Direct Reports, effective as of August 1, 2012 (incorporated by reference from Exhibit 10.1 to Resolute Forest Products Inc.’s Quarterly Report on Form 10-Q for the quarter ended June 30, 2012 filed August 9, 2012, SEC File No. 001-33776). |
†10.32* | Resolute Forest Products Equity Incentive Plan (previously named the AbitibiBowater Inc. 2010 Equity Incentive Plan), effective as of December 9, 2010 (incorporated by reference from Exhibit 10.2 to Resolute Forest Products Inc.’s Quarterly Report on Form 10-Q for the quarter ended September 30, 2012 filed November 9, 2012, SEC File No. 001-33776). |
†10.33* | Resolute Forest Products Outside Director Deferred Compensation Plan (previously named the AbitibiBowater Inc. Outside Director Deferred Compensation Plan), effective as of April 1, 2011 (incorporated by reference from Exhibit 10.3 to Resolute Forest Products Inc.’s Quarterly Report on Form 10-Q for the quarter ended September 30, 2012 filed November 9, 2012, SEC File No. 001-33776). |
†10.34* | Summary of 2013 Resolute Forest Products Inc. Short-Term Incentive Plan (incorporated by reference from Exhibit 10.1 to Resolute Forest Products Inc.’s Current Report on Form 8-K filed February 28, 2013, SEC File No. 001-33776). |
†10.35* | Form of Indemnification Agreement for Directors and Officers of Resolute Forest Products Inc. (incorporated by reference from Exhibit 10.41 to Resolute Forest Products Inc.’s Annual Report on Form 10-K for the year ended December 31, 2012 filed March 1, 2013, SEC File No. 001-33776). |
†10.36* | AbiBow Canada Inc. and AbitibiBowater Inc. Security Protocol with respect to the AbitibiBowater 2010 Canadian DB Supplemental Executive Retirement Plan and the AbiBow Canada SERP, amended and restated effective April 1, 2012. (incorporated by reference from Exhibit 10.41 to Resolute Forest Products Inc.’s Annual Report on Form 10-K for the year ended December 31, 2012 filed March 1, 2013, SEC File No. 001-33776). |
†10.37* | 2013 Resolute Forest Products Inc. Short-Term Incentive Plan. (incorporated by reference from Exhibit 10.1 to Resolute Forest Products Inc.’s Quarterly Report on Form 10-Q for the quarter ended March 31, 2013 filed May 10, 2013, SEC File No. 001-33776). |
†10.38* | Resolute Forest Products Equity Incentive Plan Form of Director Deferred Stock Unit Agreement. (incorporated by reference from Exhibit 10.2 to Resolute Forest Products Inc.’s Quarterly Report on Form 10-Q for the quarter ended March 31, 2013 filed May 10, 2013, SEC File No. 001-33776). |
†10.39* | Resolute Forest Products Equity Incentive Plan Form of Director Restricted Stock Unit Agreement. (incorporated by reference from Exhibit 10.3 to Resolute Forest Products Inc.’s Quarterly Report on Form 10-Q for the quarter ended March 31, 2013 filed May 10, 2013, SEC File No. 001-33776). |
†10.40** | Resolute Forest Products Equity Incentive Plan Form of Restricted Stock Unit Agreement. |
†10.41** | Resolute Forest Products Equity Incentive Plan Form of Employee Nonqualified Stock Option Agreement. |
†10.42** | Offer Letter between André Piché and Resolute Forest Products Inc., dated February 4, 2014. |
†10.43** | Offer Letter between Richard Tremblay and Resolute Forest Products Inc., dated February 4, 2014. |
10.44** | Amendment No. 6, dated as of February 25, 2014, to ABL Credit Agreement, dated as of December 9, 2010, among Resolute Forest Products Inc. (f/k/a AbitibiBowater Inc.) the Subsidiaries of Resolute Forest Products Inc. parties thereto, the Lenders party thereto and Citibank, N.A., as administrative agent and collateral agent. |
12.1** | Computation of Ratio of Earnings to Fixed Charges. |
126
Exhibit No. | Description |
18.1* | Letter From Independent Registered Accounting Firm Regarding Change in Accounting Policy. (incorporated by reference from Exhibit 18.1 to Resolute Forest Products Inc.’s Quarterly Report on Form 10-Q for the quarter ended June 30, 2013 filed August 9, 2013, SEC File No. 001-33776). |
21.1** | Subsidiaries of the registrant. |
23.1** | Consent of PricewaterhouseCoopers LLP. |
24.1** | Power of attorney for certain Directors of the registrant. |
31.1** | Certification of President and Chief Executive Officer Pursuant to Section 302 of the Sarbanes-Oxley Act of 2002. |
31.2** | Certification of Senior Vice President and Chief Financial Officer Pursuant to Section 302 of the Sarbanes-Oxley Act of 2002. |
32.1** | Certification of President and Chief Executive Officer Pursuant to Section 906 of the Sarbanes-Oxley Act of 2002. |
32.2** | Certification of Senior Vice President and Chief Financial Officer Pursuant to Section 906 of the Sarbanes-Oxley Act of 2002. |
101.INS*** | XBRL Instance Document. |
101.SCH*** | XBRL Taxonomy Extension Schema Document. |
101.CAL*** | XBRL Taxonomy Extension Calculation Linkbase Document. |
101.LAB*** | XBRL Taxonomy Extension Label Linkbase Document. |
101.PRE*** | XBRL Taxonomy Extension Presentation Linkbase Document. |
101.DEF*** | XBRL Taxonomy Extension Definition Linkbase Document. |
* | Previously filed and incorporated herein by reference. |
† | This is a management contract or compensatory plan or arrangement. |
** | Filed with this Form 10-K. |
*** | Interactive data files furnished with this Form 10-K, which represent the following materials from this Form 10-K formatted in XBRL (eXtensible Business Reporting Language): (i) the Consolidated Statements of Operations, (ii) the Consolidated Statements of Comprehensive Loss, (iii) the Consolidated Balance Sheets, (iv) the Consolidated Statement of Changes in Equity, (v) the Consolidated Statements of Cash Flows, (vi) the Notes to Consolidated Financial Statements and (vii) Schedule I – Resolute Forest Products Inc. Condensed Financial Statements and Notes. Pursuant to applicable securities laws and regulations, the Company is deemed to have complied with the reporting obligation relating to the submission of interactive data files in such exhibits and is not subject to liability under any anti-fraud provisions or other liability provisions of the federal securities laws as long as the Company has made a good faith attempt to comply with the submission requirements and promptly amends the interactive data files after becoming aware that the interactive data files fail to comply with the submission requirements. In addition, users of this data are advised that, pursuant to Rule 406T of Regulation S-T, these interactive data files are deemed not filed or part of a registration statement or prospectus for purposes of Sections 11 or 12 of the Securities Act of 1933 or Section 18 of the Securities Exchange Act of 1934 and otherwise are not subject to liability under these sections. |
(b) | The above-referenced exhibits are being filed with this Form 10-K. |
(c) | None. |
127
SIGNATURES
Pursuant to the requirements of Section 13 or 15(d) of the Securities Exchange Act of 1934, the Registrant has duly caused this report to be signed on its behalf by the undersigned, thereunto duly authorized.
RESOLUTE FOREST PRODUCTS INC. | ||
Date: March 3, 2014 | By: | /s/ Richard Garneau |
Richard Garneau | ||
President and Chief Executive Officer | ||
Pursuant to the requirements of the Securities Exchange Act of 1934, this report has been signed below by the following persons on behalf of the Registrant and in the capacities and on the dates indicated.
Signature | Title | Date | ||
/s/ Richard Garneau | President and Chief Executive Officer | March 3, 2014 | ||
Richard Garneau | (Principal Executive Officer) | |||
/s/ Bradley P. Martin* | Chairman, Director | March 3, 2014 | ||
Bradley P. Martin | ||||
/s/ Jo-Ann Longworth | Senior Vice President and Chief Financial Officer | March 3, 2014 | ||
Jo-Ann Longworth | (Principal Financial Officer) | |||
/s/ Silvana Travaglini | Vice President and Chief Accounting Officer | March 3, 2014 | ||
Silvana Travaglini | (Principal Accounting Officer) | |||
/s/ Michel P. Desbiens* | Director | March 3, 2014 | ||
Michel P. Desbiens | ||||
/s/ Jennifer C. Dolan* | Director | March 3, 2014 | ||
Jennifer C. Dolan | ||||
/s/ Richard D. Falconer* | Director | March 3, 2014 | ||
Richard D. Falconer | ||||
/s/ Jeffrey A. Hearn* | Director | March 3, 2014 | ||
Jeffrey A. Hearn | ||||
/s/ Alain Rhéaume* | Director | March 3, 2014 | ||
Alain Rhéaume | ||||
/s/ Michael S. Rousseau* | Director | March 3, 2014 | ||
Michael S. Rousseau | ||||
/s/ David H. Wilkins* | Director | March 3, 2014 | ||
David H. Wilkins | ||||
* Jo-Ann Longworth, by signing her name hereto, does sign this document on behalf of the persons indicated above pursuant to powers of attorney duly executed by such persons that are filed herewith as Exhibit 24.1.
By: | /s/ Jo-Ann Longworth | |
Jo-Ann Longworth, Attorney-in-Fact | ||
128
Schedule I – RESOLUTE FOREST PRODUCTS INC. CONDENSED FINANCIAL STATEMENTS AND NOTES
Resolute Forest Products Inc.
(Parent Company Only)
Condensed Statements of Operations, (Deficit) Retained Earnings and Comprehensive Loss
(In millions)
Years Ended December 31, | ||||||||||||
2013 | 2012 | 2011 | ||||||||||
Expenses: | ||||||||||||
Selling, general and administrative expenses | $ | 18 | $ | 18 | $ | 27 | ||||||
Operating loss | (18 | ) | (18 | ) | (27 | ) | ||||||
Interest expense | (89 | ) | (214 | ) | (216 | ) | ||||||
Other (expense) income, net | (60 | ) | 2 | 6 | ||||||||
Equity in income of subsidiaries | (472 | ) | 147 | 199 | ||||||||
Loss before income taxes | (639 | ) | (83 | ) | (38 | ) | ||||||
Income tax benefit | — | 84 | 85 | |||||||||
Net (loss) income | (639 | ) | 1 | 47 | ||||||||
Retained earnings as of beginning of year | 47 | 47 | — | |||||||||
Acquisition of Fibrek | — | (1 | ) | — | ||||||||
(Deficit) retained earnings as of end of year | $ | (592 | ) | $ | 47 | $ | 47 | |||||
Comprehensive loss | $ | (296 | ) | $ | (318 | ) | $ | (256 | ) | |||
See accompanying notes to condensed financial statements.
F-1
Schedule I – RESOLUTE FOREST PRODUCTS INC. CONDENSED FINANCIAL STATEMENTS AND NOTES
Resolute Forest Products Inc.
(Parent Company Only)
Condensed Balance Sheets
(In millions)
December 31, 2013 | December 31, 2012 | |||||||
Assets | ||||||||
Current assets: | ||||||||
Cash and cash equivalents | $ | — | $ | 5 | ||||
Note receivable from a subsidiary | 13 | 41 | ||||||
Total current assets | 13 | 46 | ||||||
Investment in and advances to subsidiaries | 4,734 | 4,859 | ||||||
Other assets | 8 | — | ||||||
Total assets | $ | 4,755 | $ | 4,905 | ||||
Liabilities and equity | ||||||||
Current liabilities: | ||||||||
Accounts payable and accrued liabilities | $ | 5 | $ | 11 | ||||
Accounts payable to subsidiaries | 352 | 336 | ||||||
Notes and interest payable to subsidiaries | 14 | 593 | ||||||
Total current liabilities | 371 | 940 | ||||||
Long-term debt | 595 | 528 | ||||||
Long-term debt due to subsidiaries | 627 | — | ||||||
Total liabilities | 1,593 | 1,468 | ||||||
Equity: | ||||||||
Common stock | — | — | ||||||
Additional paid-in capital | 4,086 | 4,065 | ||||||
(Deficit) retained earnings | (592 | ) | 47 | |||||
Accumulated other comprehensive loss | (271 | ) | (614 | ) | ||||
Treasury stock | (61 | ) | (61 | ) | ||||
Total Resolute Forest Products Inc. equity | 3,162 | 3,437 | ||||||
Total liabilities and equity | $ | 4,755 | $ | 4,905 | ||||
See accompanying notes to condensed financial statements.
F-2
Schedule I – RESOLUTE FOREST PRODUCTS INC. CONDENSED FINANCIAL STATEMENTS AND NOTES
Resolute Forest Products Inc.
(Parent Company Only)
Condensed Statements of Cash Flows
(In millions)
Years Ended December 31, | ||||||||||||
2013 | 2012 | 2011 | ||||||||||
Net cash used in operating activities | $ | (5 | ) | $ | — | $ | — | |||||
Cash flows from investing activities: | ||||||||||||
Advances from affiliates | — | 72 | — | |||||||||
Net cash provided by investing activities | — | 72 | — | |||||||||
Cash flows from financing activities: | ||||||||||||
Issuance of long-term debt | 594 | — | — | |||||||||
Premium paid on extinguishment of debt | (84 | ) | — | — | ||||||||
Purchases of treasury stock | — | (67 | ) | — | ||||||||
Payments of debt | (501 | ) | — | — | ||||||||
Payments of financing and credit facility fees | (9 | ) | — | — | ||||||||
Net cash used in financing activities | — | (67 | ) | — | ||||||||
Net (decrease) increase in cash and cash equivalents | (5 | ) | 5 | — | ||||||||
Cash and cash equivalents: | ||||||||||||
Beginning of year | 5 | — | — | |||||||||
End of year | $ | — | $ | 5 | $ | — | ||||||
See accompanying notes to condensed financial statements.
F-3
Schedule I – RESOLUTE FOREST PRODUCTS INC. CONDENSED FINANCIAL STATEMENTS AND NOTES
Resolute Forest Products Inc.
(Parent Company Only)
Notes to Condensed Financial Statements
Note A. Organization and Basis of Presentation
The accompanying condensed financial statements, including the notes thereto, should be read in conjunction with the consolidated financial statements of Resolute Forest Products Inc. included in Item 8 of this Form 10-K (“Consolidated Financial Statements”). When the term “Resolute Forest Products Inc.” (also referred to as “Resolute Forest Products,” “we,” “us” or “our”) is used, we mean Resolute Forest Products Inc., the parent company only. Resolute Forest Products Inc. is incorporated in Delaware and is a holding company whose only significant asset is an investment in the common stock of our subsidiaries.
All amounts are expressed in U.S. dollars, unless otherwise indicated. Defined terms in this Schedule I have the meanings ascribed to them in the Consolidated Financial Statements. In accordance with the guidance of FASB ASC 250, certain prior year amounts in our condensed financial statements have been adjusted due to our change in accounting policy for planned major maintenance costs, as discussed in Note 1, “Organization and Basis of Presentation - Change in accounting policy for planned major maintenance costs,” to the Consolidated Financial Statements.
The effect of the change in accounting policy on our Condensed Consolidated Statements of Operations for the year ended December 31, 2013 was as follows:
(In millions) | Before Accounting Policy Change | Adjustment | As Reported | |||||||||
Equity in income of subsidiaries | $ | (474 | ) | $ | 2 | $ | (472 | ) | ||||
Loss before income taxes | (641 | ) | 2 | (639 | ) | |||||||
Net loss | (641 | ) | 2 | (639 | ) | |||||||
Comprehensive loss | (298 | ) | 2 | (296 | ) | |||||||
The effect of the change in accounting policy on our Condensed Consolidated Statements of Operations for the year ended December 31, 2012 was as follows:
(In millions) | As Previously Reported | Adjustment | As Reported | |||||||||
Equity in income of subsidiaries | $ | 144 | $ | 3 | $ | 147 | ||||||
Loss before income taxes | (86 | ) | 3 | (83 | ) | |||||||
Net (loss) income | (2 | ) | 3 | 1 | ||||||||
Comprehensive loss | (321 | ) | 3 | (318 | ) | |||||||
The effect of the change in accounting policy on our Condensed Consolidated Statements of Operations for the year ended December 31, 2011 was as follows:
(In millions) | As Previously Reported | Adjustment | As Reported | |||||||||
Equity in income of subsidiaries | $ | 193 | $ | 6 | $ | 199 | ||||||
Loss before income taxes | (44 | ) | 6 | (38 | ) | |||||||
Net income | 41 | 6 | 47 | |||||||||
Comprehensive loss | (262 | ) | 6 | (256 | ) | |||||||
F-4
Resolute Forest Products Inc.
(Parent Company Only)
Notes to Condensed Financial Statements
The effect of the change in accounting policy on our Condensed Consolidated Balance Sheets as of December 31, 2013 and December 31, 2012 was as follows:
December 31, 2013 | December 31, 2012 | |||||||||||||||||||||||
(In millions) | Before Accounting Policy Change | Adjustment | As Reported | As Previously Reported | Effect of Change | As Adjusted | ||||||||||||||||||
Investment in and advances to subsidiaries | $ | 4,723 | $ | 11 | $ | 4,734 | $ | 4,850 | $ | 9 | $ | 4,859 | ||||||||||||
(Deficit) retained earnings | (603 | ) | 11 | (592 | ) | 38 | 9 | 47 | ||||||||||||||||
As a result of the change, retained earnings as of December 31, 2011 increased by $6 million, while having no impact on our retained earnings as of December 31, 2010.
Note B. Financing Arrangements
Senior notes
2023 Notes
On May 8, 2013, we issued $600 million aggregate principal amount of 2023 Notes pursuant to an indenture as of that date. Upon their issuance, the 2023 Notes were recorded at their fair value, which resulted in a discount, which is being amortized to interest expense using the interest method over the term of the notes. As of December 31, 2013, the carrying value of the 2023 Notes was $595 million, which included the unamortized discount of $5 million. Interest on the notes was paid by Resolute FP US Inc. on our behalf (see Note C, “Transactions with Related Parties”). For a discussion of the 2023 Notes, see Note 13, “Long-Term Debt – 2023 Notes,” to the Consolidated Financial Statements.
2018 Notes
Our 2018 Notes had a maturity date of October 15, 2018. For a discussion of the 2018 Notes, see Note 13, “Long-Term Debt – 2018 Notes,” to the Consolidated Financial Statements.
On June 13, 2011, the first $100 million of net proceeds from the sale of our investment in ACH was used to redeem $94 million of principal amount of the 2018 Notes at a redemption price of 105% of the principal amount, plus accrued and unpaid interest. Additionally, on each of June 29, 2011, November 4, 2011 and October 10, 2012, $85 million of principal amount of the 2018 Notes was redeemed at a redemption price of 103% of the principal amount, plus accrued and unpaid interest. As a result of these redemptions, in 2012 and 2011, we recorded net gains on extinguishment of debt of $2 million and $6 million, respectively, which were included in “Other (expense) income, net” in our Condensed Statements of Operations, (Deficit) Retained Earnings and Comprehensive Loss (“Statements of Operations”). These redemptions and all interest on the notes were paid by Resolute FP US Inc. on our behalf (see Note C, “Transactions with Related Parties”).
On May 8, 2013, we used the proceeds of the sale of the 2023 Notes to purchase $496 million aggregate principal amount of the 2018 Notes in connection with the tender offer and consent solicitation that expired on May 21, 2013. Aggregate consideration for the purchase was $584 million, including accrued and unpaid interest of $4 million. We then redeemed the remaining $5 million of principal amount of the 2018 Notes on October 8, 2013, at a redemption price of 103% of the principal amount, plus accrued and unpaid interest. As a result, we recorded a loss on extinguishment of debt of $59 million (net of $25 million write-down of unamortized premium) for the year ended December 31, 2013, which was included in “Other (expense) income, net” in our Statements of Operations.
The 2018 Notes were recorded at their fair value, which resulted in a premium, which was being amortized to interest expense using the interest method over the term of the notes. As of December 31, 2012, the carrying value of the 2018 Notes was $528 million, which included the unamortized premium of $27 million.
ABL Credit Facility
In 2010, we and the Borrowers entered into the ABL Credit Facility with a syndicate of lenders. The proceeds of the ABL Credit Facility can be used by us for, among other things, working capital, capital expenditures, permitted acquisitions and other general corporate purposes.
F-5
Resolute Forest Products Inc.
(Parent Company Only)
Notes to Condensed Financial Statements
On April 29, 2013, we entered into an Incremental Commitment Agreement (the “agreement”) with respect to the credit agreement that governs the ABL Credit Facility, increasing the aggregate amount of the ABL Credit Facility from $600 million to $665 million. The ABL Credit Facility, as so increased, matures on October 28, 2016 and provides for an asset-based, revolving credit facility with an aggregate lender commitment of up to $665 million at any time outstanding, subject to borrowing base availability, including a $60 million swingline sub-facility and a $200 million letter of credit sub-facility. The ABL Credit Facility includes a $465 million tranche available to the Borrowers and a $200 million tranche available solely to the U.S. Borrowers, in each case subject to the borrowing base availability of those Borrowers. The ABL Credit Facility also provides for an uncommitted incremental loan facility of up to $135 million, subject to certain terms and conditions set forth in the ABL Credit Facility. For a discussion of our ABL Credit Facility, see Note 13, “Long-Term Debt – ABL Credit Facility,” to the Consolidated Financial Statements.
On February 25, 2014, the ABL Credit Facility was amended. For additional information see Note 23, “Subsequent Events,” to the Consolidated Financial Statements.
Financial covenants
The 2023 Notes and the ABL Credit Facility impose restrictions on the ability of certain subsidiaries to transfer funds or other assets to us in the form of dividends or advances. These restrictions could affect our operations or our ability to pay dividends in the future.
Note C. Transactions with Related Parties
Note Receivable
On December 9, 2010, Resolute FP Canada Inc. entered into a promissory note payable to us in the amount of $250 million, bearing interest at the Applicable Federal Rate set forth by the Internal Revenue Service for obligations of this type, due on demand by us. Interest recorded on the note was less than $1 million in each of 2013, 2012 and 2011, and is included in “Other (expense) income, net” in our Statements of Operations. As of December 31, 2013 and 2012, the outstanding balance of the note and accrued interest on the note totaled $13 million and $41 million, respectively, and approximated fair value and was included in “Note receivable from a subsidiary” in our Condensed Balance Sheets.
Notes Payable
Long-term debt due to subsidiaries, including current portion and interest payable to subsidiaries, as of December 31, 2013 and 2012, was comprised of the following:
(In millions) | 2013 | 2012 | ||||||
Total debt due to subsidiaries including accrued interest: | ||||||||
RFP US note | $ | 364 | $ | 332 | ||||
Donohue note | 277 | 261 | ||||||
Total debt due to subsidiaries including accrued interest | 641 | 593 | ||||||
Less: Current portion of long-term debt due to subsidiaries including accrued interest | ||||||||
RFP US note | (11 | ) | (332 | ) | ||||
Donohue note | (3 | ) | (261 | ) | ||||
Total | (14 | ) | (593 | ) | ||||
Long-term debt due to subsidiaries, net of current portion and accrued interest | $ | 627 | $ | — | ||||
Interest expense on notes payable to subsidiaries for the years ended December 31, 2013, 2012 and 2011 was comprised of the following:
(In millions) | 2013 | 2012 | 2011 | |||||||||
RFP US note | $ | 32 | $ | 127 | $ | 115 | ||||||
Donohue note | 16 | 32 | 29 | |||||||||
$ | 48 | $ | 159 | $ | 144 | |||||||
F-6
Resolute Forest Products Inc.
(Parent Company Only)
Notes to Condensed Financial Statements
In 2008, we contributed to Resolute FP US Inc. a promissory note due June 30, 2013, executed by us in favor of Resolute FP US Inc. in exchange for the ownership interest it held in one of its subsidiaries (“RFP US note”). On December 20, 2012, we completed a series of internal transactions with our subsidiaries, Resolute FP US Inc. and Resolute FP Canada Inc. These transactions involved cash transfers related to capital reductions, the issuance of intercompany notes, and the partial repayment of existing intercompany obligations. As a result of these transactions, we reduced both our obligation to Resolute FP US Inc. and our paid-in capital in Resolute FP Canada Inc. by $805 million. On June 30, 2013, we entered into an agreement to amend and restate our RFP US note. As amended, the amount of the promissory note was $353 million (decreased from $650 million) with an interest rate of 6.5% (decreased from 12.5%) due June 30, 2018. As of December 31, 2013 and 2012, the fair value of the RFP US note approximated its carrying value.
In 2008, AbitibiBowater US Holding LLC (“Holding”), a subsidiary of ours, entered into a promissory note payable to Donohue due March 31, 2013 (the “Donohue note”). On the Emergence Date, we assumed, by merger with Holding, its obligations with respect to this promissory note. On March 28, 2013, we entered into an agreement to amend and restate our Donohue note. As amended, the amount of the promissory note was $270 million (increased from $139 million) with an interest rate of 3.57% (decreased from 13.75%) due March 31, 2015. As of December 31, 2013 and 2012, the fair value of the Donohue note approximated its carrying value.
Equity
As a result of the contribution of capital from the noncontrolling interest and the subsequent acquisition of the noncontrolling interest of CNC, “Additional paid-in capital” increased by $14 million in 2013. For additional information, see Note 7, “Other (Expense) Income, Net” to the Consolidated Financial Statements.
In connection with our acquisition of Fibrek, Resolute FP Canada Inc., paid us $43 million in 2012 in exchange for the 3.3 million shares of our common stock that were distributed to Fibrek’s shareholders as partial consideration for the Fibrek shares purchased by Resolute FP Canada Inc.
On May 22, 2012, our Board of Directors approved a share repurchase program of up to 10% of our common stock, for an aggregate purchase price of up to $100 million. In 2012, we repurchased 5,610,152 shares at a cost of $67 million. The repurchases of shares were funded by our subsidiaries ($51 million from Resolute FP US Inc. and $16 million from Resolute FP Canada Inc.). We did not repurchase shares in 2013.
Other
Some of our subsidiaries provide certain corporate administrative services on our behalf and certain of our subsidiaries, including legal, finance, tax, risk management, IT, executive management, payroll and employee benefits. As such, these subsidiaries have charged us a portion of their general and administrative expenses, based on specific identification or on an appropriate allocation key (e.g., sales, purchases, headcount, etc.) determined by the type of expense or department. In 2013, 2012 and 2011, these subsidiaries charged us $17 million, $17 million and $23 million, respectively, for certain corporate administrative expenses, which were recorded in “Selling, general and administrative expenses” in our Statements of Operations.
As discussed in Note B, “Financing Arrangements,” in 2012 and 2011, Resolute FP US Inc. paid on our behalf $85 million and $264 million, respectively, of principal amount of the 2018 Notes plus the redemption premiums (approximately $3 million and $10 million, respectively). Resolute FP US Inc. also paid all interest on the 2018 Notes in 2013, 2012 and 2011 (approximately $29 million, $60 million and $85 million, respectively). Additionally, Resolute FP US Inc. paid on our behalf the interest on our 2023 Notes totaling $18 million.
In 2013, a valuation allowance was recorded on the net deferred income tax assets of the U.S. consolidated group. Accordingly, we recorded a valuation allowance on the current year deferred income tax assets generated. For more information see Note 15, “Income Taxes” to the Consolidated Financial Statements. In 2012 and 2011, we recorded a tax benefit of $84 million and $85 million, respectively, which could be used to offset the future current income tax liability of our U.S. subsidiaries with which we file a consolidated U.S. income tax return; accordingly, we have recorded these amounts through intercompany.
We guarantee debt and other obligations of our subsidiaries with certain third parties. These guarantees are primarily to companies that provide energy required to operate certain facilities within our subsidiaries. Such obligations include the guarantee of payments owing by subsidiaries when due under various agreements to their respective counterparties. These guarantees would require payment from us only in the event of default on payment by the subsidiary. As of December 31, 2013
F-7
Resolute Forest Products Inc.
(Parent Company Only)
Notes to Condensed Financial Statements
and 2012, the maximum potential amount of future payments that we could be required to make under these guarantees was $35 million and $31 million, respectively. The guarantees have terms ranging from 10 to 90 days.
As part of the agreements that Resolute FP Canada Inc. entered into with the provinces of Québec and Ontario for funding relief with respect to aggregate solvency deficits in its material Canadian registered pension plans, Resolute FP Canada Inc. agreed to a number of undertakings, one of which is a restriction on the payment of dividends to us. For additional information, see Note 14, “Pension and Other Postretirement Benefit Plans – Canadian pension funding,” to the Consolidated Financial Statements.
F-8
EXHIBIT INDEX
Exhibit No. | Description |
2.1* | Share Purchase Agreement, dated December 10, 2012, among The Province of Nova Scotia, Bowater Canadian Limited, The Daily Herald Company and Resolute Forest Products Inc. (incorporated by reference from Exhibit 2.1 to Resolute Forest Products Inc.’s Current Report on Form 8-K filed December 14, 2012, SEC File No. 001-33776). |
3.1* | Amended and Restated Certificate of Incorporation of Resolute Forest Product Inc. (incorporated by reference from Exhibit 3.1 to Resolute Forest Product Inc.’s Annual Report on Form 10-K for the year ended December 31, 2012 filed March 1, 2013, SEC File No. 001-33776). |
3.2* | Third Amended and Restated By-laws of AbitibiBowater Inc. (incorporated by reference from Exhibit 3(ii) to AbitibiBowater Inc.’s Form 8-A filed on December 9, 2010). |
4.1* | Amended and Restated Indenture, dated as of May 12, 2011, among AbitibiBowater Inc., each of the guarantors from time to time party hereto, as guarantors, and Wells Fargo Bank, National Association, as trustee and as collateral agent (incorporated by reference from Exhibit 4.1 to AbitibiBowater Inc.’s Quarterly Report on Form 10-Q for the quarter ended March 31, 2011 filed May 16, 2011, SEC File No. 001-33776). |
4.2* | Form of 10.25% Senior Note due 2018 (included in Exhibit 4.1 to AbitibiBowater Inc.’s Quarterly Report on Form 10-Q for the quarter ended March 31, 2011 filed May 16, 2011, SEC File No. 001-33776). |
4.3* | Second Supplemental Indenture, dated as of March 9, 2012, among AbitibiBowater Inc., the guarantors party thereto and Wells Fargo Bank, National Association, as trustee (incorporated by reference from Exhibit 4.1 to AbitibiBowater Inc.’s Quarterly Report on Form 10-Q for the quarter ended March 31, 2012 filed May 10, 2012, SEC File No. 001-33776). |
4.4* | Third Supplemental Indenture, dated as of December 31, 2012, among Resolute Forest Products Inc., the guarantors party thereto and Wells Fargo Bank, National Association, as trustee. (incorporated by reference from Exhibit 4.1 to Resolute Forest Products Inc.’s Quarterly Report on Form 10-Q for the quarter ended March 31, 2013 filed May 10, 2013, SEC File No. 001-33776). |
4.5* | Fourth Supplemental Indenture, dated as of March 12, 2013, among Resolute Forest Products Inc., the guarantors party thereto and Wells Fargo Bank, National Association, as trustee. (incorporated by reference from Exhibit 4.2 to Resolute Forest Products Inc.’s Quarterly Report on Form 10-Q for the quarter ended March 31, 2013 filed May 10, 2013, SEC File No. 001-33776). |
4.6* | Fifth Supplemental Indenture, dated as of May 7, 2013, among Resolute Forest Products Inc., the guarantors party thereto and Wells Fargo Bank, National Association, as trustee. (incorporated by reference from Exhibit 4.3 to Resolute Forest Products Inc.’s Quarterly Report on Form 10-Q for the quarter ended March 31, 2013 filed May 10, 2013, SEC File No. 001-33776). |
4.7* | Indenture, dated as of May 8, 2013, among Resolute Forest Products Inc., the guarantors party thereto and Wells Fargo Bank, National Association, as trustee. (incorporated by reference from Exhibit 4.4 to Resolute Forest Products Inc.’s Quarterly Report on Form 10-Q for the quarter ended March 31, 2013 filed May 10, 2013, SEC File No. 001-33776). |
4.8* | Registration Rights Agreement, dated as of May 8, 2013, among Resolute Forest Products Inc., the guarantors party thereto and Merrill Lynch, Pierce, Fenner & Smith Incorporated, as representative. (incorporated by reference from Exhibit 4.5 to Resolute Forest Products Inc.’s Quarterly Report on Form 10-Q for the quarter ended March 31, 2013 filed May 10, 2013, SEC File No. 001-33776). |
10.1* | ABL Credit Agreement, dated as of December 9, 2010, among AbitibiBowater Inc., Bowater Incorporated, Abitibi-Consolidated Corp., Abitibi-Consolidated Inc., Barclays Bank PLC, JPMorgan Chase Bank, N.A., and Citibank, N.A., as administrative agent and collateral agent (incorporated by reference from Exhibit 10.1 to AbitibiBowater Inc.’s Current Report on Form 8-K filed December 15, 2010, SEC File No. 001-33776). |
10.2* | Securities Purchase Agreement, dated February 11, 2011, among AbiBow Canada Inc., Caisse de depot et placement du Quebec and CDP Investissements Inc., as vendors, and Infra H2O GP Partners Inc., Infra H2O LP Partners Inc. and BluEarth Renewables Inc., as the purchaser (incorporated by reference from Exhibit 2.1 to AbitibiBowater Inc.’s Current Report on Form 8-K filed February 17, 2011, SEC File No. 001-33776). |
†10.3* | AbitibiBowater 2010 Canadian DB Supplemental Executive Retirement Plan, effective as of December 9, 2010 (incorporated by reference from Exhibit 10.4 to AbitibiBowater Inc.’s Annual Report on Form 10-K for the year ended December 31, 2010 filed April 5, 2011, SEC File No. 001-33776). |
Exhibit No. | Description |
†10.4* | AbitibiBowater Inc. 2010 Equity Incentive Plan Form of Restricted Stock Unit Agreement (incorporated by reference from Exhibit 10.2 to AbitibiBowater Inc.’s Registration Statement on Form S-8 filed January 7, 2011, SEC Registration No. 333-171602). |
†10.5* | AbitibiBowater Inc. 2010 Equity Incentive Plan Form of Director Nonqualified Stock Option Agreement (incorporated by reference from Exhibit 10.3 to AbitibiBowater Inc.’s Registration Statement on Form S-8 filed January 7, 2011, SEC Registration No. 333-171602). |
†10.6* | AbitibiBowater Inc. 2010 Equity Incentive Plan Form of Employee Nonqualified Stock Option Agreement (incorporated by reference from Exhibit 10.4 to AbitibiBowater Inc.’s Registration Statement on Form S-8 filed January 7, 2011, SEC Registration No. 333-171602). |
†10.7* | AbitibiBowater Inc. 2010 Equity Incentive Plan Form of Employee Restricted Stock Unit Agreement (incorporated by reference from Exhibit 10.13 to AbitibiBowater Inc.’s Annual Report on Form 10-K for the year ended December 31, 2011 filed February 29, 2012, SEC File No. 001-33776). |
†10.8* | AbitibiBowater Inc. 2010 Equity Incentive Plan Form of Employee Nonqualified Stock Option Agreement (incorporated by reference from Exhibit 10.14 to AbitibiBowater Inc.’s Annual Report on Form 10-K for the year ended December 31, 2011 filed February 29, 2012, SEC File No. 001-33776). |
†10.9* | AbitibiBowater Executive Restricted Stock Unit Plan, effective as of April 1, 2011 (incorporated by reference from Exhibit 10.13 to AbitibiBowater Inc.’s Annual Report on Form 10-K for the year ended December 31, 2010 filed April 5, 2011, SEC File No. 001-33776). |
†10.10* | Employment Agreement between Yves Laflamme and AbitibiBowater Inc., dated February 14, 2011 (incorporated by reference from Exhibit 10.2 to AbitibiBowater Inc.’s Current Report on Form 8-K filed February 18, 2011, SEC File No. 001-33776). |
†10.11* | Offer Letter between Jo-Ann Longworth and AbitibiBowater Inc., dated July 25, 2011 (incorporated by reference from Exhibit 10.2 to AbitibiBowater Inc.’s Quarterly Report on Form 10-Q for the quarter ended September 30, 2011 filed November 14, 2011, SEC File No. 001-33776). |
†10.12* | Offer Letter between Pierre Laberge and AbitibiBowater Inc., dated June 9, 2011 (incorporated by reference from Exhibit 10.35 to AbitibiBowater Inc.’s Annual Report on Form 10-K for the year ended December 31, 2011 filed February 29, 2012, SEC File No. 001-33776). |
†10.13* | Director compensation program chart (incorporated by reference from Exhibit 10.36 to AbitibiBowater Inc.’s Annual Report on Form 10-K for the year ended December 31, 2011 filed February 29, 2012, SEC File No. 001-33776). |
†10.14* | Retirement Compensation Trust Agreement (with Letter of Credit) between AbiBow Canada Inc. and AbitibiBowater Inc. and CIBC Mellon Trust Company, dated and effective as of November 1, 2011 (incorporated by reference from Exhibit 10.39 to AbitibiBowater Inc.’s Annual Report on Form 10-K for the year ended December 31, 2011 filed February 29, 2012, SEC File No. 001-33776). |
†10.15* | Agreement Concerning the Pulp and Paper Operations of AbiBow Canada in Ontario, dated November 10, 2010, between Bowater Canadian Forest Products Inc. and Abitibi-Consolidated Company of Canada and The Province of Ontario (incorporated by reference from Exhibit 10.32 to AbitibiBowater Inc.’s Annual Report on Form 10-K for the year ended December 31, 2010 filed April 5, 2011, SEC File No. 001-33776). |
†10.16* | Agreement Concerning the Pulp and Paper Operations of AbiBow Canada in Quebec, dated September 13, 2010, between Bowater Canadian Forest Products Inc. and Abitibi-Consolidated Company of Canada and The Government of Quebec (incorporated by reference from Exhibit 10.33 to AbitibiBowater Inc.’s Annual Report on Form 10-K for the year ended December 31, 2010 filed April 5, 2011, SEC File No. 001-33776). |
10.17* | Amendment No. 1, dated as of April 28, 2011, to the ABL Credit Agreement, dated as of December 9, 2010, among AbitibiBowater Inc., the subsidiaries of AbitibiBowater party thereto, the lenders party thereto from time to time and Citibank, N.A., as administrative agent and collateral agent (incorporated by reference from Exhibit 10.1 to AbitibiBowater Inc.’s Quarterly Report on Form 10-Q for the quarter ended March 31, 2011 filed May 16, 2011, SEC File No. 001-33776). |
10.18* | Amendment No. 2, dated October 28, 2011, to ABL Credit Agreement, dated as of December 9, 2010, among AbitibiBowater Inc., AbiBow US Inc. (f/k/a Bowater Incorporated) and AbiBow Recycling LLC (f/k/a Abitibi-Consolidated Corp.) and AbiBow Canada Inc. (f/k/a Abitibi-Consolidated Inc.), and Citibank, N.A., as administrative agent and collateral agent (incorporated by reference from Exhibit 10.1 to AbitibiBowater Inc.’s Current Report on Form 8-K filed October 31, 2011, SEC File No. 001-33776). |
10.19* | Lock-up Agreement between AbitibiBowater Inc. and Fairfax Financial Holdings Limited, dated as of November 28, 2011 (incorporated by reference from Exhibit 10.1 to AbitibiBowater Inc.’s Current Report on Form 8-K filed November 29, 2011, SEC File No. 001-33776). |
Exhibit No. | Description |
10.20* | Lock-up Agreement between AbitibiBowater Inc. and Oakmont Capital Inc., dated as of November 28, 2011 (incorporated by reference from Exhibit 10.2 to AbitibiBowater Inc.’s Current Report on Form 8-K filed November 29, 2011, SEC File No. 001-33776). |
10.21* | Lock-up Agreement between AbitibiBowater Inc. and Dalal Street, LLC, dated as of November 28, 2011 (incorporated by reference from Exhibit 10.3 to AbitibiBowater Inc.’s Current Report on Form 8-K filed November 29, 2011, SEC File No. 001-33776). |
†10.22* | Executive Employment Agreement between AbitibiBowater Inc. and Richard Garneau, dated January 1, 2011 (incorporated by reference from Exhibit 10.26 to AbitibiBowater Inc.’s Annual Report on Form 10-K for the year ended December 31, 2010 filed April 5, 2011, SEC File No. 001-33776). |
†10.23* | Change in Control Agreement between AbitibiBowater Inc. and Richard Garneau, dated January 1, 2011 (incorporated by reference from Exhibit 10.27 to AbitibiBowater Inc.’s Annual Report on Form 10-K for the year ended December 31, 2010 filed April 5, 2011, SEC File No. 001-33776). |
†10.24** | Executive Employment Agreement between AbitibiBowater Inc. and Richard Garneau, dated February 26, 2014. |
†10.25** | Change in Control Agreement between AbitibiBowater Inc. and Richard Garneau, dated February 26, 2014. |
†10.26* | Employment Agreement between Alain Boivin and AbitibiBowater Inc., dated February 22, 2011 (incorporated by reference from Exhibit 10.28 to AbitibiBowater Inc.’s Annual Report on Form 10-K for the year ended December 31, 2010 filed April 5, 2011, SEC File No. 001-33776). |
†10.27* | Offer Letter between John Lafave and AbitibiBowater Inc., dated February 14, 2011 (incorporated by reference from Exhibit 10.29 to AbitibiBowater Inc.’s Annual Report on Form 10-K for the year ended December 31, 2010 filed April 5, 2011, SEC File No. 001-33776). |
†10.28* | Offer Letter between Jacques Vachon and AbitibiBowater Inc., dated March 19, 2012 (incorporated by reference from Exhibit 10.2 to AbitibiBowater Inc.’s Quarterly Report on Form 10-Q for the quarter ended March 31, 2012 filed May 10, 2012, SEC File No. 001-33776). |
†10.29* | Resolute Forest Products DC Make-up Program, effective January 1, 2012 (incorporated by reference from Exhibit 10.3 to AbitibiBowater Inc.’s Quarterly Report on Form 10-Q for the quarter ended March 31, 2012 filed May 10, 2012, SEC File No. 001-33776). |
10.30* | Waiver and Amendment No. 3, dated as of March 21, 2012, under and to the ABL Credit Agreement, dated as of December 9, 2010, among AbitibiBowater Inc., the subsidiaries of AbitibiBowater party thereto, the lenders party thereto from time to time and Citibank, N.A., as administrative agent and collateral agent (incorporated by reference from Exhibit 10.4 to AbitibiBowater Inc.’s Quarterly Report on Form 10-Q for the quarter ended March 31, 2012 filed May 10, 2012, SEC File No. 001-33776). |
†10.31* | Resolute Forest Products Inc. Severance Policy – Chief Executive Officer and Direct Reports, effective as of August 1, 2012 (incorporated by reference from Exhibit 10.1 to Resolute Forest Products Inc.’s Quarterly Report on Form 10-Q for the quarter ended June 30, 2012 filed August 9, 2012, SEC File No. 001-33776). |
†10.32* | Resolute Forest Products Equity Incentive Plan (previously named the AbitibiBowater Inc. 2010 Equity Incentive Plan), effective as of December 9, 2010 (incorporated by reference from Exhibit 10.2 to Resolute Forest Products Inc.’s Quarterly Report on Form 10-Q for the quarter ended September 30, 2012 filed November 9, 2012, SEC File No. 001-33776). |
†10.33* | Resolute Forest Products Outside Director Deferred Compensation Plan (previously named the AbitibiBowater Inc. Outside Director Deferred Compensation Plan), effective as of April 1, 2011 (incorporated by reference from Exhibit 10.3 to Resolute Forest Products Inc.’s Quarterly Report on Form 10-Q for the quarter ended September 30, 2012 filed November 9, 2012, SEC File No. 001-33776). |
†10.34* | Summary of 2013 Resolute Forest Products Inc. Short-Term Incentive Plan (incorporated by reference from Exhibit 10.1 to Resolute Forest Products Inc.’s Current Report on Form 8-K filed February 28, 2013, SEC File No. 001-33776). |
†10.35* | Form of Indemnification Agreement for Directors and Officers of Resolute Forest Products Inc. (incorporated by reference from Exhibit 10.41 to Resolute Forest Products Inc.’s Annual Report on Form 10-K for the year ended December 31, 2012 filed March 1, 2013, SEC File No. 001-33776). |
†10.36* | AbiBow Canada Inc. and AbitibiBowater Inc. Security Protocol with respect to the AbitibiBowater 2010 Canadian DB Supplemental Executive Retirement Plan and the AbiBow Canada SERP, amended and restated effective April 1, 2012. (incorporated by reference from Exhibit 10.41 to Resolute Forest Products Inc.’s Annual Report on Form 10-K for the year ended December 31, 2012 filed March 1, 2013, SEC File No. 001-33776). |
Exhibit No. | Description |
†10.37* | 2013 Resolute Forest Products Inc. Short-Term Incentive Plan. (incorporated by reference from Exhibit 10.1 to Resolute Forest Products Inc.’s Quarterly Report on Form 10-Q for the quarter ended March 31, 2013 filed May 10, 2013, SEC File No. 001-33776). |
†10.38* | Resolute Forest Products Equity Incentive Plan Form of Director Deferred Stock Unit Agreement. (incorporated by reference from Exhibit 10.2 to Resolute Forest Products Inc.’s Quarterly Report on Form 10-Q for the quarter ended March 31, 2013 filed May 10, 2013, SEC File No. 001-33776). |
†10.39* | Resolute Forest Products Equity Incentive Plan Form of Director Restricted Stock Unit Agreement. (incorporated by reference from Exhibit 10.3 to Resolute Forest Products Inc.’s Quarterly Report on Form 10-Q for the quarter ended March 31, 2013 filed May 10, 2013, SEC File No. 001-33776). |
†10.40** | Resolute Forest Products Equity Incentive Plan Form of Restricted Stock Unit Agreement. |
†10.41** | Resolute Forest Products Equity Incentive Plan Form of Employee Nonqualified Stock Option Agreement. |
†10.42** | Offer Letter between André Piché and Resolute Forest Products Inc., dated February 4, 2014. |
†10.43** | Offer Letter between Richard Tremblay and Resolute Forest Products Inc., dated February 4, 2014. |
10.44** | Amendment No. 6, dated as of February 25, 2014, to ABL Credit Agreement, dated as of December 9, 2010, among Resolute Forest Products Inc. (f/k/a AbitibiBowater Inc.) the Subsidiaries of Resolute Forest Products Inc. parties thereto, the Lenders party thereto and Citibank, N.A., as administrative agent and collateral agent. |
12.1** | Computation of Ratio of Earnings to Fixed Charges. |
18.1* | Letter From Independent Registered Accounting Firm Regarding Change in Accounting Policy. (incorporated by reference from Exhibit 18.1 to Resolute Forest Products Inc.’s Quarterly Report on Form 10-Q for the quarter ended June 30, 2013 filed August 9, 2013, SEC File No. 001-33776). |
21.1** | Subsidiaries of the registrant. |
23.1** | Consent of PricewaterhouseCoopers LLP. |
24.1** | Power of attorney for certain Directors of the registrant. |
31.1** | Certification of President and Chief Executive Officer Pursuant to Section 302 of the Sarbanes-Oxley Act of 2002. |
31.2** | Certification of Senior Vice President and Chief Financial Officer Pursuant to Section 302 of the Sarbanes-Oxley Act of 2002. |
32.1** | Certification of President and Chief Executive Officer Pursuant to Section 906 of the Sarbanes-Oxley Act of 2002. |
32.2** | Certification of Senior Vice President and Chief Financial Officer Pursuant to Section 906 of the Sarbanes-Oxley Act of 2002. |
101.INS*** | XBRL Instance Document. |
101.SCH*** | XBRL Taxonomy Extension Schema Document. |
101.CAL*** | XBRL Taxonomy Extension Calculation Linkbase Document. |
101.LAB*** | XBRL Taxonomy Extension Label Linkbase Document. |
101.PRE*** | XBRL Taxonomy Extension Presentation Linkbase Document. |
101.DEF*** | XBRL Taxonomy Extension Definition Linkbase Document. |
* | Previously filed and incorporated herein by reference. |
† | This is a management contract or compensatory plan or arrangement. |
** | Filed with this Form 10-K. |
*** | Interactive data files furnished with this Form 10-K, which represent the following materials from this Form 10-K formatted in XBRL (eXtensible Business Reporting Language): (i) the Consolidated Statements of Operations, (ii) the Consolidated Statements of Comprehensive Loss, (iii) the Consolidated Balance Sheets, (iv) the Consolidated Statement of Changes in Equity, (v) the Consolidated Statements of Cash Flows, (vi) the Notes to Consolidated Financial Statements and (vii) Schedule I – Resolute Forest Products Inc. Condensed Financial Statements and Notes. Pursuant to applicable securities laws and regulations, the Company is deemed to have complied with the reporting obligation relating to the submission of interactive data files in such exhibits and is not subject to liability under any anti-fraud provisions or other liability provisions of the federal securities laws as long as the Company has made a good faith attempt to comply with the submission requirements and promptly amends the interactive data files after becoming aware that the interactive data files fail to comply with the submission requirements. In addition, users of this data are advised that, pursuant to Rule 406T of Regulation S-T, these interactive data files are deemed not filed or part of a registration statement or prospectus for purposes of Sections 11 or 12 of the Securities Act of 1933 or Section 18 of the Securities Exchange Act of 1934 and otherwise are not subject to liability under these sections. |
(b) | The above-referenced exhibits are being filed with this Form 10-K. |
(c) | None. |
Similar companies
See also INTERNATIONAL PAPER CO /NEW/ - Annual report 2022 (10-K 2022-12-31) Annual report 2023 (10-Q 2023-09-30)See also Suzano S.A.
See also Sylvamo Corp - Annual report 2022 (10-K 2022-12-31) Annual report 2023 (10-Q 2023-09-30)
See also Magnera Corp - Annual report 2022 (10-K 2022-12-31) Annual report 2023 (10-Q 2023-09-30)
See also Mativ Holdings, Inc. - Annual report 2022 (10-K 2022-12-31) Annual report 2023 (10-Q 2023-09-30)