Sovos Brands, Inc. - Annual Report: 2021 (Form 10-K)
note
UNITED STATES
SECURITIES AND EXCHANGE COMMISSION
Washington, D.C. 20549
FORM 10-K
(Mark One) | |
☒ | ANNUAL REPORT PURSUANT TO SECTION 13 OR 15(d) OF THE SECURITIES EXCHANGE ACT OF 1934 |
For the fiscal year ended December 25, 2021 | |
OR | |
☐ | TRANSITION REPORT PURSUANT TO SECTION 13 OR 15(d) OF THE SECURITIES EXCHANGE ACT OF 1934 |
For the transition period from ________ to ________
Commission File Number: 001-40837
Sovos Brands, Inc.
(Exact name of registrant as specified in its charter)

Delaware | 81-5119352 | |
(State or other jurisdiction of incorporation or organization) | (I.R.S. Employer Identification No.) |
168 Centennial Parkway, Suite 200
Louisville, CO 80027
(Address of principal executive offices) (zip code)
(720) 316-1225
(Registrant’s telephone number, including area code)
Securities registered pursuant to Section 12(b) of the Act:
Title of each class | Trading symbol | Name of each exchange on which registered | ||
Common Stock, $0.001 par value per share | SOVO | The Nasdaq Stock Market LLC (Nasdaq Global Select Market) |
Securities registered pursuant to section 12(g) of the Act: None
Indicate by check mark if the registrant is a well-known seasoned issuer, as defined in Rule 405 of the Securities Act. Yes ☐ No ☒
Indicate by check mark if the registrant is not required to file reports pursuant to Section 13 or Section 15(d) of the Act. Yes ☐ No ☒
Indicate by check mark whether the registrant (1) has filed all reports required to be filed by Section 13 or 15(d) of the Securities Exchange Act of 1934 during the preceding 12 months (or for such shorter period that the registrant was required to file such reports), and (2) has been subject to such filing requirements for the past 90 days. Yes ☒ No ☐
Indicate by check mark whether the registrant has submitted electronically every Interactive Date File required to be submitted pursuant to Rule 405 of Regulation S-T (§232.405 of this chapter) during the preceding 12 months (or for such shorter period that the registrant was required to submit such files). Yes ☒ No ☐
Indicate by check mark whether the registrant is a large accelerated filer, an accelerated filer, a non-accelerated filer, a smaller reporting company, or an emerging growth company. See the definitions of “large accelerated filer,” “accelerated filer,” “smaller reporting company” and “emerging growth company” in Rule 12b-2 of the Exchange Act.
Large accelerated filer | ☐ | Accelerated filer | ☐ |
Non-accelerated filer | ☒ | Smaller reporting company | ☐ |
Emerging growth company | ☒ |
If an emerging growth company, indicate by check mark if the registrant has elected not to use the extended transition period for complying with any new or revised financial accounting standards provided pursuant to Section 13(a) of the Exchange Act.☐
Indicate by check mark whether the registrant has filed a report on and attestation to its management’s assessment of the effectiveness of its internal control over financial reporting under Section 404(b) of the Sarbanes-Oxley Act (15 U.S.C. 7262(b)) by the registered public accounting firm that prepared or issued its audit report. ☐
Indicate by check mark whether the registrant is a shell company (as defined in Rule 12b-2 of the Exchange Act). Yes ☐ No ☒
The common stock of the registrant has been traded on the Nasdaq Global Select Market under the symbol “SOVO” since September 23, 2021, which is the business day following the pricing of its initial public offering. Accordingly, there was no public market for the registrant’s common equity as of June 26, 2021, the last business day of the registrant’s most recently completed second fiscal quarter.
As of March 15, 2022, there were 100,892,547 shares of common stock, $0.001 par value per share outstanding.
DOCUMENTS INCORPORATED BY REFERENCE
Certain portions of the registrant’s definitive proxy statement, in connection with its 2022 annual meeting of stockholders, to be filed within 120 days after the end of fiscal year ended December 25, 2021, are incorporated by reference into Part III of this Annual Report on Form 10‑K.
SOVOS BRANDS, INC.
FORM 10-K
FOR THE FISCAL YEAR ENDED DECEMBER 25, 2021
INDEX
3
CAUTIONARY NOTE REGARDING FORWARD-LOOKING STATEMENTS
This Annual Report on Form 10-K (“Form 10-K”) contains forward-looking statements. Forward-looking statements can be identified by words, such as “anticipates,” “intends,” “plans,” “seeks,” “believes,” “estimates,” “expects” and similar references to future periods, or by the inclusion of forecasts or projections. Examples of forward-looking statements include, but are not limited to, statements we make regarding the outlook for our future business and financial performance, such as those contained in Part II. Item 7. “Management’s Discussion and Analysis of Financial Condition and Results of Operations.”
Forward-looking statements are based on our current expectations and assumptions regarding our business, the economy and other future conditions. Because forward-looking statements relate to the future, by their nature, they are subject to inherent uncertainties, risks and changes in circumstances that are difficult to predict. As a result, our actual results may differ materially from those contemplated by the forward-looking statements. Important factors that could cause actual results to differ materially from those in the forward-looking statements include regional, national or global political, economic, business, competitive, market and regulatory conditions and the following:
| ● | inflation, including our vulnerability to decreases in the supply of and increases in the price of raw materials and labor, manufacturing, distribution and other costs, and our inability to offset increasing costs through cost savings initiatives or pricing; |
| ● | supply disruptions; |
| ● | competition in the packaged food industry and our product categories; |
| ● | the COVID-19 pandemic and associated effects; |
| ● | our inability to accurately forecast pricing elasticities and the resulting impact on volume growth and/or distribution gains; |
| ● | our inability to maintain our workforce; |
| ● | our inability to identify, consummate or integrate new acquisitions or realize the projected benefits of acquisitions; |
| ● | our inability to effectively manage our growth; |
| ● | our inability to successfully introduce new products or failure of recently launched products to meet expectations or remain on-shelf; |
| ● | our inability to expand household penetration and successfully market our products; |
| ● | erosion of the reputation of one or more of our brands; |
| ● | issues with the major retailers, wholesalers, distributors and mass merchants on which we rely, including if they give higher priority to other brands or products, perform poorly or declare bankruptcy; |
| ● | our vulnerability to the impact of severe weather conditions, natural disasters and other natural events on our manufacturing facilities, co-packers or raw material supplies ; |
| ● | failure by us or third-party co-packers or suppliers of raw materials to comply with food safety, environmental or other laws or regulations, or new laws or regulations; |
| ● | our dependence on third-party distributors and third-party co-packers, including one co-packer for the substantial majority of our Rao’s Homemade sauce products; |
| ● | failure to protect, or litigation involving, our tradenames or trademarks and other rights; |
| ● | our level of indebtedness under our First Lien Credit Agreement (as defined herein), which as of December 25, 2021 was $480.8 million, and our duty to comply with covenants under our First Lien Credit Agreement; and |
| ● | the interests of Advent International Corporation (“Advent”) may differ from those of public stockholders. |
See Part I. Item IA. “Risk Factors” for a further description of these and other factors. For the reasons described above, we caution you against relying on any forward-looking statements, which should also be read in conjunction with the other cautionary statements that are included elsewhere in this Form 10-K. Any forward-looking statement made by us in this Form 10-K speaks only as of the date on which we make it. Factors or events that could cause our actual results to differ may emerge from time to time, and it is not possible for us to predict all of them. We undertake no obligation to publicly update or revise any forward-looking statement, whether as a result of new information, future developments or otherwise, except as may be required by law.
4
Unless the context otherwise requires, “we,” “us,” “our,” the “Company” and “Sovos Brands” refer to Sovos Brands, Inc. and its subsidiaries. The Company’s fiscal year ends on the last Saturday in December of each year and as a result, a 53rd week is added approximately every sixth year. Our fiscal years ended December 25, 2021 (“fiscal 2021”), December 26, 2020 (“fiscal 2020”) and December 28, 2019 (“fiscal 2019”) each have 52 weeks. Our fiscal year ending December 31, 2022 (“fiscal 2022”) will have 53 weeks. Our fiscal quarters are comprised of 13 weeks each, ending on the 13th Saturday of each quarter, except for the 53-week fiscal years for which the fourth quarter will be comprised of 14 weeks, ending on the 14th Saturday of such fourth quarter.
Unless we indicate otherwise or the context otherwise requires, all references in this Form 10-K to our Rao’s brand include our Rao’s Homemade, Rao’s Homestyle and Rao’s Made for Home brands, and all references to our Rao’s products include our Rao’s Homemade pasta sauces (including tomato-based sauces, Alfredo sauces and Pesto sauces), pizza sauces and dry pastas; Rao’s Homestyle meat-based pasta sauces; and Rao’s Made for Home frozen entrées and soups.
PART I.
Item 1. Business
Overview
Sovos Brands is a consumer-packaged food company that acquires and builds disruptive growth brands that bring today’s consumers great tasting food that fits the way they live.
In 2017, our Founder, President and Chief Executive Officer, Todd R. Lachman, together with our Chairman, William R. Johnson, identified an opportunity within the broader food landscape to acquire and build a portfolio of disruptive growth brands whose high-quality products support premium positioning. With the backing of the globally established private equity firm, Advent, Sovos Brands was formed and has become a leading and differentiated premium player within the packaged food industry.
Since our inception, we have been focused on building an organization with the capabilities to acquire, integrate and grow brands as we continue to scale. Our leadership team has extensive experience managing portfolios of global brands at some of the most respected consumer packaged goods (“CPG”) companies. To unlock our full potential, we combined a distinctive mix of industry veterans, entrepreneurs and food lovers and built an inclusinve culture where everyone has a voice. We believe our highly distinctive culture has attracted leading talent from across the CPG landscape to join our team and has meaningfully contributed to our success.
In September 2021, we completed our initial public offering (the “IPO”) and became actively traded on the Nasdaq Global Select Market (“NASDAQ”) listed under the trade symbol of “SOVO.”
Our brands, Rao’s, Michael Angelo’s, noosa and Birch Benders, are built with authenticity at their core, providing consumers food experiences that are genuine, delicious and unforgettable, making each of our brands “one-of-a-kind.” Our products are premium and made with simple, high-quality ingredients.
Our business model is grounded in acquiring “one-of-a-kind” brands and leveraging a common infrastructure and shared playbook to drive growth. Our brands share multiple attributes, including: being delicious, possessing a leading consumer affinity, acting as potential category disruptors in large categories and utilizing brand strength to extend into new categories. Our brands generally over-index with young and family-oriented consumers who have higher disposable incomes. Our consumers are passionate about taste and quality and value clean ingredients according to Company-sponsored third-party studies and have higher basket sizes at retail compared to the category averages. We believe we are
5
a strategic and valuable partner to retailers as our brands generally drive incremental sales in our categories according to IRI, the leading provider of industry data and consumer insights, offer better unit economics than key competitors and attract a highly coveted consumer base who are willing to spend more per trip than category averages. Our brands share a common playbook for growth, which is focused on increasing household penetration by:
| 1. | Increasing distribution; |
| 2. | Expanding brand awareness; |
| 3. | Improving sales and marketing execution; and |
| 4. | Innovating into new categories. |
Our platform was designed to provide a foundation for future growth and to capture material synergies as we scale and add new brands. Over time, we expect to continue acquiring additional “one-of-a-kind” brands that have our targeted attributes and significant growth potential, and to combine our industry expertise with fresh thinking to bring these brands into more homes.
Our portfolio is diversified across brands and categories, with exposure to all meal occasions, especially breakfast and dinner where we believe consumers have the highest propensity to purchase food for their homes.
Our principal executive offices are located at 168 Centennial Parkway, Suite 200, Louisville, Colorado, 80027. Our telephone number is (720) 316-1225. We maintain a web site at www.sovosbrands.com.
Our Brands and Products
Our portfolio currently consists of four brands: Rao’s, Michael Angelo’s, noosa and Birch Benders. Our brands offer premium, on-trend and high-quality products in a variety of product categories and appeal to consumers for consumption in a broad range of situations, including breakfast, lunch, snacks and dinner. We completed the acquisitions of Bottom Line Food Processors, Inc. d/b/a Michael Angelo’s Gourmet Foods and Rao’s Specialty Foods (“Rao’s” or “RSF”) in January 2017 and July 2017, respectively, and our single sales and supply chain organization supported the rapid functional integration of the Michael Angelo’s and Rao’s brands. We completed the acquisition of 100% of the outstanding capital stock of Noosa Holdings, Inc. (the “Noosa Acquisition”) in November 2018, and in October 2020, we completed the acquisition of the Birch Benders business (the “Birch Benders Acquisition”). Rao’s brand net sales has grown over 480% since 2017. For discussion of brand net sales see “—Non-GAAP Financial Measures” within Part II. Item 7. “Management’s Discussion and Analysis of Financial Condition and Results of Operations.” With noosa, we leveraged synergies to gain greater scale, and noosa net sales increased by 6.5% since 2020. Our robust platform is capable of purchasing and rapidly integrating brands across temperature states, providing a broad aperture to identify potential brand targets.
Rao’s
The iconic Rao’s brand was established as a consumer-packaged food brand in 1991 with a storied New York City heritage. The Rao’s brand offers a selection of Rao’s Homemade pasta sauces (including tomato-based sauces, Alfredo sauces and Pesto sauces), pizza sauces and dry pastas; Rao’s Homestyle meat-based pasta sauces; and Rao’s Made for Home frozen entrées and soups. Rao’s sauces are simmered slowly and made in small batches with only high-quality ingredients, like pure olive oil and hand-picked, naturally ripened tomatoes from southern Italy. Our sauces have no tomato blends, no paste, no water, no fillers and no added sugar. Rao’s was the fastest-growing center store brand of scale from 2018 through 2020. The household penetration of Rao’s sauce products has increased from 1.3% in the 52 weeks ended January 3, 2016 to 10.9% in the 52 weeks ended December 26, 2021, and Rao’s sauce products captured 13.2% of the pasta and pizza sauce dollar market share, making Rao’s the #3 pasta and pizza sauce brand by dollar market share in the
6
52 weeks ended December 26, 2021. In the 4 weeks ended December 26, 2021, Rao’s sauce captured 15.4% of the pasta and pizza sauce brand by dollar market share, making Rao’s the #2 pasta and pizza sauce brand by dollar market share.
Michael Angelo’s
Michael Angelo’s was founded in 1983 with original Italian recipes that had been passed down for generations. Michael Angelo’s frozen products include a variety of signature dishes, such as eggplant parmesan, lasagna made with fresh Ricotta cheese, shrimp scampi and other pastas, for a homemade taste. We believe that our Michael Angelo’s brand is a leading producer of premium frozen entrées inspired by Italian traditions. The household penetration of Michael Angelo’s frozen dinners was 5.3% in the 52 weeks ended December 26, 2021, and Michael Angelo’s captured 1.6% of the frozen entrée dollar market share, making Michael Angelo’s the #14 brand by dollar market share, in the 52 weeks ended December 26, 2021.
noosa
An Australian expatriate co-founded Noosa Yoghurt in 2008 with a fourth-generation Colorado dairy farmer. In 2010, Noosa Yoghurt began selling yogurt at Colorado farmers markets and local Whole Foods stores. Our noosa brand offers a suite of delicious yogurt products, including spoonable yogurts and drinkable smoothies. noosa products are creamy and delicious and made with high-quality ingredients, such as whole milk from cows never treated with the growth hormone rBGH, real fruit and wildflower honey. noosa products are outperforming the spoonable and drinkable yogurt category in terms of dollar growth in the 52 weeks ended December 26, 2021. The household penetration of noosa yogurts was 7.9% in the 52 weeks ended December 26, 2021, and noosa captured 2.7% of the yogurt dollar market share, making noosa the #11 yogurt manufacturer by dollar market share in the 52 weeks ended December 26, 2021. In fiscal 2022, noosa launched into the ice cream category with noosa frozen yogurt gelato.
Birch Benders
Birch Benders was founded in 2011 with the idea of making pancakes that are restaurant quality and easier than from scratch. Birch Benders’ product offerings of “clean ingredient” breakfast foods and snacks includes pancake and waffle mixes, baking mixes and frosting, cups, syrups and frozen waffles that cater to a variety of lifestyles, including organic, plant-based, protein, “paleo” and “keto” diets. Birch Benders entered two new categories nationally in 2021. According to data from SPINS, Birch Benders is the largest pancake and waffle mix brand in the Natural and Specialty channel based on dollar sales in the 52 weeks ended December 26, 2021. The household penetration of Birch Benders pancake and waffle mixes and frozen waffles was 2.6% and 1.1%, respectively, in the 52 weeks ended December 26, 2021, and Birch Benders captured 4.6% of the pancake and waffle mix dollar market share, making Birch Benders the #8 pancake and waffle mix brand by dollar market share, in the 52 weeks ended December 26, 2021. The Birch Benders Acquisition was completed in October 2020.
Our Customers
We sell our products to customers primarily in the United States and principally to retail outlets and wholesale distributors, including traditional supermarkets, mass merchants, warehouse clubs, wholesalers, specialty food distributors, military commissaries and non-food outlets, such as drug store chains, dollar stores and e-commerce retailers. In fiscal 2021, approximately 1% of our gross sales were to international customers. We believe that the strength of our brands and our premium, on-trend and high-quality product portfolio make us a strategic partner for our customers and that we have opportunities for international growth. We utilize our direct sales force and brokers as well as third-party distributors, some of whom also purchase our products directly for their own accounts for resale, for the sale and distribution of our products.
7
In fiscal 2021, our largest customers, Costco Wholesale Corporation (“Costco”), Walmart Inc. (“Walmart”) and United Natural Foods, Inc. (“UNFI”), accounted for approximately 18%, 13% and 11%, respectively, of our gross sales, and our top four largest customers together accounted for approximately 49% of our gross sales.
Marketing, Advertising and Consumer Research
We utilize a variety of marketing channels to drive household penetration and brand awareness through paid, earned and owned marketing channels. We focus our marketing efforts on building an authentic connection with our consumers. We primarily use digital marketing and dedicate the majority of our marketing expenditures to paid advertising on digital marketing channels through videos, e-commerce advertisements, paid search, paid social advertisements and branded content. We also engage with consumers through social media “influencers,” public relations outreach to editors, and incentives such as coupons or other advertising placed on or near our products in stores.
Digital Advertising
Our digital marketing efforts include video advertisements that play as viewers stream content like television shows on online video channels and applications, content and paid social advertisements for social media networks, paid advertisements and paid preferable placement of our products on e-commerce sites, paid advertisements for our brands and products in search results, online and mobile coupons and promotions and paid advertisements on third-party and retailer mobile sites, third-party and retailer websites and in-store near our products or at check-outs to drive purchases of our products. In addition, we maintain an active email program, which we leverage to deliver information on new product launches and promotions for our Rao’s, noosa and Birch Benders brands, and we maintain registered domains at www.sovosbrands.com, www.raos.com, www.noosayoghurt.com, www.birchbenders.com and www.michaelangelos.com, which serve to communicate news about our brands directly to consumers who access our websites and social media sites and to address questions, comments or concerns about our products. From January 1, 2021 to December 31, 2021, the websites for our Rao’s, noosa and Birch Benders brands collectively had an average of approximately 260,000 visitors per month according to Google Analytics.
Social Media, Influencers, Earned Media and Branded Content
We have an active presence on social media platforms, including Facebook, Instagram and Twitter, to connect with our consumers for each of our brands. For example, we showcase our products and feature recipes on our brands’ Instagram accounts. We also partner with a number of social media “influencers” who generate further awareness of our brands through sponsored content, such as custom posts and “micro-sweeps” or giveaway offerings, on various social media platforms. We focus on selecting social media “influencers” who are real-life, approachable fans with whom our consumers can relate as well as chefs and experts on food or dietary lifestyles. In fiscal 2021, we estimate that our influencers and social channels delivered 11 million impressions for our brands. In addition, we utilize public relations outreach to editors and journalists, partner with companies to create branded content featuring our brand names or products and collaborate from time to time with celebrities or chefs to promote and endorse our products. Our paid marketing efforts are supplemented by earned media when editors, journalists, celebrities and consumers feature our brands and products in their articles, recipes, and posts as well as by word-of-mouth recommendations of our products. In fiscal 2021, we estimate that earned media efforts generated approximately 8 billion impressions for our brands.
Raw Materials, Ingredients and Packaging
We purchase raw materials, including agricultural products, whole milk, tomatoes, cheese, animal proteins, and other ingredients, such as fruit preparations, from growers, commodity processors, ingredient suppliers and other food companies located primarily in the United States. We also purchase packaging materials, including tubs, caps and lids, trays, labels, corrugated cardboard, cartons and other packaging, from packaging manufacturers located primarily in the United States. The principal raw materials we purchase for our products include whole milk, fruit preparations, tubs and
8
lids, cheese, tomatoes, animal proteins and folding cartons. The co-packers we use for production of our Rao’s, Michael Angelo’s, noosa and the significant majority of our Birch Benders products independently schedule and purchase the raw materials, ingredients and packaging they use in manufacturing our products, although we may provide some packaging (such as labels) for our Rao’s co-packers. Under certain arrangements with co-packers for our other Birch Benders products, we purchase and supply the raw materials, ingredients and packaging to our co-packers. In the future, these Birch Benders’ co-packers may independently schedule and purchase the raw materials, ingredients and packaging that they use in manufacturing our products. We purchase the majority of our packaging materials under contracts that include escalator and de-escalator formulas for the purchase of the raw materials used in our packaging, which include resin, paperboard and aluminum.
The profitability of our business relies in substantial part on the prices we and our co-packers pay for these and other raw materials, ingredients and packaging materials, which can fluctuate due to a number of factors, including changes in weather, crop size, cattle cycles, crop disease and crop pests, commodity market fluctuations, such as those caused by supply and demand, costs of carrying stock and inventory and government subsidies, natural disasters and crude oil prices. In addition, certain materials required for the manufacture of our products, such as glass and aluminum, have been or may be impacted by tariffs. The availability and cost of certain raw materials, including resin, aluminum, glass, animal protein, agricultural products and other commodities, have been adversely impacted by the COVID-19 pandemic because of increased demand and supply constraints due to reduced production shifts and labor shortages, among other factors, and have also been adversely impacted by current global geopolitical tensions, including relating to Ukraine.
Fluctuations in commodity prices can lead to retail price volatility and intensive price competition, as well as influence consumer and trade buying patterns. We attempt to manage some of the risks of increased costs of raw materials, ingredients, packaging and other costs related to the production of our products by entering into supply contracts that offer price and supply certainty and implementing cost-saving programs.
Production and Manufacturing
Manufacturing
We operate two manufacturing facilities for our products. We produce our Rao’s Made for Home and Michael Angelo’s frozen products in Austin, Texas and we produce all noosa spoonable yogurts in Bellvue, Colorado. See Item 2. “Properties.”
Co-Packing Arrangements
In addition to our own manufacturing facilities, we source a significant portion of our products under “co-packing” arrangements, a common industry practice in which manufacturing is outsourced to other companies. Co-packing arrangements generally offer flexibility and improved speed to market by leveraging equipment and technology already in place. Our co-packer La Regina di San Marzano USA, Inc. (together with its subsidiaries and affiliates, “La Regina”) currently produces the substantial majority of our Rao’s Homemade tomato-based sauce products in Italy and is establishing a manufacturing facility in Alma, Georgia that will use imported Italian tomatoes for the production of our tomato-based sauces. We have entered into an agreement that provides La Regina the exclusive rights to be the third-party supplier of certain of our tomato-based sauce products when manufacturing begins in the United States. We have the right to purchase the La Regina U.S. facility under certain circumstances. Our U.S. agreement with La Regina has a base term ending December 31, 2031, with five-year extensions (unless three years’ notice of non-renewal is provided), and limits La Regina’s ability to produce products for other brands. Our Italy agreement with La Regina has a base term ending December 31, 2027, with a seven-year extension (unless three years’ notice of non-renewal is provided), and limits La Regina’s ability to produce products for other brands. We also use co-packers located in the United States and Italy to supplement our supply of Rao’s Homemade tomato-based sauce products and for the production of our Rao’s Homestyle tomato-based sauces with meat as well as our Rao’s Homemade Alfredo sauces and Pesto sauces. We use co-packers
9
located in the United States, Italy and Canada for our Rao’s Made for Home soups. For our Rao’s Homemade dry pastas, we use a co-packer in Italy. All of our Birch Benders products are produced by co-packers located in the United States and Belgium. The remainder of our noosa products, including fruit smoothies, are each produced by a different co-packer located in the United States. We may leverage a co-packer located in the United States from time to time to supplement our in-house production of select Michael Angelo’s products.
All of the companies with which we have co-packing arrangements produce products for other companies as well as for us, except for La Regina, which produces sauce products exclusively for us and their own branded products. Most of our co-packers may periodically pass production cost adjustments as well as ingredients and packaging adjustments based on market pricing on to us. Our contract with La Regina is set as a fixed pricing model, subject to adjustment for foreign exchange fluctuations, although we may from time-to-time make adjustments in that arrangement. We believe that there are alternative sources of co-packing production available for the majority of our products, although we may experience disturbances in our operations and delays in delivery or production or higher costs if we are required to change our co-packing arrangements unexpectedly. We monitor capacity and performance of our co-packers and seek to qualify alternate suppliers as needed.
Distribution and Logistics
We distribute our products to our customers’ distribution centers directly from our production facilities, our co-packers’ production facilities or from warehouses operated by third-party logistics (“3PL”) providers. Certain of our customers are also distributors. With respect to the noosa spoonable yogurts that we produce at our Bellvue, Colorado production facility, we distributed 64% by weight directly to our customers in fiscal 2021. With respect to the Rao’s Made for Home and Michael Angelo’s frozen products that we produce at our Austin, Texas production facility, we distributed 21% by weight directly to our customers in fiscal 2021. In fiscal 2019, we increased our frozen warehousing capacity at our Austin, Texas facility to reduce our reliance on third-party warehouses as part of a productivity savings initiative. The remainder of the products we produce in Bellvue, Colorado and Austin, Texas, as well as our noosa drinkable smoothies, certain Rao’s and Michael Angelo’s products and our Birch Benders products, are distributed through 3PL warehouses. In addition, some of our customers, including some that are distributors, pick up certain of our products from our 3PL providers’ warehouses or from our co-packers’ production facilities. Customers, including those that are distributors, picked up approximately 96% of our Rao’s shelf-stable products in fiscal 2021. To the extent we do not deliver products directly to customers or customers do not pick up our products, our products are delivered from 3PL warehouses to our customers via common carrier.
Due in part to the different demands of distribution for frozen, refrigerated and shelf-stable products, each of our brands currently utilizes a different 3PL network. As part of our ongoing integration of the Birch Benders business, we plan to utilize existing 3PL relationships for distribution of shelf-stable Birch Benders products in the future. We partner with two 3PL providers with locations in Fontana, California and Edison, New Jersey for distribution of our Rao’s products, one 3PL provider located in Fort Morgan, Colorado for distribution of our noosa products, three 3PL providers with locations in Romeoville, Illinois, Woodridge, Illinois and Hobart, Indiana for distribution of our Birch Benders products and one 3PL provider located in Dallas, Texas for distribution of our Rao’s Made for Home and Michael Angelo’s products. We have warehouse agreements with our 3PL providers that we believe provide us with adequate flexibility and capacity to accommodate incremental product volume.
We also sell and distribute shelf-stable Rao’s and Birch Benders products directly to consumers through our websites and Amazon.
Research and Development
Innovation, including new product development, is a key component of our growth strategy. We have a demonstrated track record of extending our product offerings into other categories. A team of food and culinary scientists, food engineers
10
and microbiologists work to develop products to meet identified opportunities. In addition to developing new products, our research and development team regularly reformulates existing products based on advances in ingredients, equipment, materials and technology as well as to facilitate cost reduction initiatives, improve our products and support ownership of recipes. In addition to our Company-sponsored research and development activities, in order to quickly and economically introduce our new products to market or supplement our internal expertise, we may partner with contract manufacturers that make our products according to our formulas or other specifications. We also supplement our internal expertise from time to time with innovation consultants and our ingredient and material suppliers. Our research and development team also provides technical services, providing input on production line design, initial production runs on new equipment and start-up runs for new products at our facilities and some of our co-packers. We plan to complete the improvements to our research and development facility in Austin, Texas in the second quarter of 2022, investing a total of approximately $1.1 million of capital, and we expect that we will continue to build our research and development capabilities in order to support our current brands, any future acquired brands and entrance into new categories.
Intellectual Property
We believe that brand awareness is a significant component in a consumer’s decision to purchase one product over another in the highly competitive consumer products industry. We believe the protection and enforcement of our trademarks, copyrights, domain names, trade dress, unpatented proprietary expertise, recipes and formulations and other proprietary rights are important to our success. To establish and protect our proprietary rights, we rely on a combination of trademark law, copyright law, trade dress, domain names, confidentiality procedures, employee disclosure and invention assignment agreements and other intellectual property laws and contractual rights.
We own or have the rights to use a number of trademarks, brand names and other proprietary rights that are important to our business and consumer awareness of our brands. We own registered trademarks for our principal product brand names in the United States, including “Rao’s,” “Rao’s Homemade,” “Rao’s Homemade Since 1896,” “noosa,” “noosa finest yoghurt,” “Birch Benders,” “Micro-Pancakery” and “Michael Angelo’s,” and various logos used in association with these terms. We have also applied for or obtained trademark registrations for many of our principal product brand names internationally, including in Canada, the European Union, the United Kingdom and select countries in Asia. We own domain names which correspond to our primary brand names, including www.raos.com, www.noosayoghurt.com, www.birchbenders.com and www.michaelangelos.com. In addition, we rely on copyrights and proprietary expertise, recipes and formulations, as well as continuing innovation, to develop and maintain our competitive position.
Our subsidiary, RSF, is party to a worldwide co-existence agreement (the “Co-Existence Agreement”) with an unaffiliated third party, Rao’s Bar & Grill, Inc. (“RBG”), that governs each party’s rights to use and register trademarks consisting of or compromising Rao’s and associated logos (collectively, the “Rao’s Marks”). Pursuant to the Co-Existence Agreement, RSF owns the right to use and register the Rao’s Marks in connection with foods, food products, beverages, sauces and related goods and services (including, without limitation, cookbooks and online and retail store services), while RBG owns the right to use and register the Rao’s Marks in connection with restaurant and bar services, including the Rao’s restaurant in New York City which is not affiliated with us. RSF and RBG have agreed to reimburse one another for reasonable cooperation and assistance in connection with actions relating to any unauthorized or improper use of a Rao’s Mark. Further, each of RSF and RBG’s obligations under the Co-Existence Agreement last until the other party abandons all rights in each of its Rao’s Marks, and the Co-Existence Agreement may not otherwise be terminated by RSF or RBG.
In March 2018, Noosa Yoghurt acquired from Queensland Yoghurt International Pty Ltd. (“Queensland”) the intellectual property rights for the “Added Fat Vat Set” yoghurt formula and process, together with all improvements (the “IP”), which Queensland had previously licensed to Noosa Yoghurt on an exclusive basis in the United States, Mexico, Canada and the Caribbean Islands. As a result of this purchase, Noosa Yoghurt has worldwide ownership of the IP for “Added Fat Vat Set” yoghurt (i.e., yoghurt product that has a milk fat content of 4.5% or more manufactured using a vat set fermentation process), subject to (i) certain pre-existing rights with respect to such IP granted to (a) a Queensland affiliate for exclusive use in Australia and (b) Hauraki Dairy Limited for exclusive use in Japan, New Zealand, Singapore
11
and certain Pacific Islands and (ii) a nonexclusive, worldwide, perpetual, irrevocable and fully-paid license to Queensland to use the IP to manufacture and sell products other than “Added Fat Vat Set” yoghurt (e.g., frozen yoghurt, low-fat yoghurt or other dairy products).
Food Safety and Quality Assurance
Food safety and product quality are essential to the successful distribution of our products. Food safety and product quality begin in the design phase of new products and continue as we establish the supply chain and commercialization of the products. We employ FDA Compliant Food Safety Plans or USDA Compliant Hazard Analysis and Critical Control Points (“HACCP”) for our products at each of our manufacturing facilities. To monitor product quality at our facilities, we maintain quality control programs to test products during various processing stages. We use quality control laboratories in both of our manufacturing facilities to test certain raw ingredients for qualities, such as the presence of antibiotics in milk, and test finished products for microbiological, nutrient and analytical composition, such as pH value and viscosity. We also conduct on-site assessments of our co-packers to address topics, such as food safety plans, allergen control, ingredients, packaging and product specifications and sanitation.
In addition, both of our facilities have achieved a Safe Quality Food, or SQF, certification under the Global Food Safety Initiative (“GFSI”). GFSI standards are integrated food safety and quality management protocols designed specifically for the food sector and offer a comprehensive methodology to manage food safety and quality. Certification provides an independent and external validation that a product, process or service complies with applicable regulations and standards. Although inspection delays associated with the COVID-19 pandemic may impact our, and our co-packers’ GFSI certifications, we believe that we, and all of our co-packers, remain in compliance with GFSI requirements.
Competition
The packaged food industry is highly competitive. We compete with large multi-brand consumer packaged food companies, smaller product-focused companies, emerging companies and dairy products- and dairy alternative-focused companies. Numerous brands and products, including private label products and insurgent brands, compete for shelf space and sales, with competition based primarily on product quality and taste, convenience, price, trade promotion, brand recognition and loyalty, customer service, effective consumer advertising and promotional activities and the ability to identify and satisfy emerging consumer preferences.
Competing large, multi-brand consumer packaged food companies include B&G Foods, Inc., Barilla Holding S.p.A., Campbell Soup Company, Conagra Brands, Inc., Continental Mills, Inc., General Mills, Inc., The Hain Celestial Group, Inc., the J.M. Smucker Company, the Kellogg Company, The Kraft Heinz Company, Mizkan Holdings, Nestle S.A. and PepsiCo, Inc. These competitors are large, multinational corporations with substantial financial, marketing, research and development and other resources. Smaller product-focused companies that we compete with include Amy’s Kitchen, Bob’s Red Mill Natural Foods, Inc., G.L. Mezzetta, Inc., Kodiak Cakes, LLC, Newman’s Own, Inc. and Van’s International Foods. Smaller and more product-focused competitors may be more innovative and able to bring new products to market faster and more quickly exploit and serve niche markets or new or burgeoning consumer preferences, and smaller insurgent brands may develop a customer base and consumer loyalty quickly. In addition, we compete against companies focused on dairy and dairy-alternative products, such as Chobani, LLC, Danone S.A., Fage International S.A. and The Lactalis Group.
Given limited retailer shelf space, competitors actively support their respective brands with marketing, advertising and promotional spending. In addition, most retailers offer private label products that also compete for retail shelf space and consumer purchases. We believe that consumers are increasingly willing to pay a premium for quality, great-tasting products and that we are well-positioned to compete with a wide range of packaged food brands and other companies.
12
Seasonality
We have experienced, and expect to continue to experience, fluctuations in our quarterly results of operations due to the seasonal nature of our business. Consumer purchasing patterns are impacted by seasonal factors, including weather and holidays. Seasonality could cause our results of operations for an interim financial period to fluctuate and not be indicative of our full year results. Seasonality also impacts relative net sales and profitability of each quarter of the year, both on a quarter-to-quarter and year-over-year basis.
Environmental, Social and Governance
We are focused on growing our business sustainably by delivering long-term value for our customers, suppliers, stockholders, employees and the communities where we live and work. We are committed to incorporating environmental, social and related governance (“ESG”) principles into our business strategies and organizational culture. As a newly public company, we are in the process of building our ESG framework.
Human Capital, Employees and Labor Relations
As of December 25, 2021, we had 608 full-time employees, with 211 salaried employees and 397 hourly employees. None of our employees are represented by a labor union or covered under a collective bargaining agreement, and we have never experienced a labor-related work stoppage.
Our Culture, Vision, Mission and Values
At Sovos we are dedicated to bringing today’s consumers simple, great-tasting food that fits the way they live.
We have established six guiding principles to be the pillars at the core of how we work, including Lead with Courage and Tenacity, Focus on Quality, Obsess with the Front Line, Communicate with Candor and Respect, Be Nimble, and Enjoy the Ride.
These guiding principles were identified specifically to separate us from the pack, inspire excellence and remind us to have some fun along the way. We value our employees and believe that employee loyalty and engagement are key elements of our operating performance.
We monitor our progress toward achieving our human capital resources objectives by regularly measuring human capital metrics, such as turn-over and retention of our employees.
Training and Development
We are focused on building a training and development program that will enable employees to further develop their success and careers at Sovos.
Commitment to Diversity, Equity and Inclusion
As of December 25, 2021, approximately 42% of our employees were women and approximately 50% of our employees were racially diverse.
Further, as of December 25, 2021, approximately 37% of the members of our board of directors (the “Board”) were women, and approximately 25% were racially diverse.
To improve diversity, equity and inclusion, we are committed to interviewing diverse candidates for open corporate leadership positions and require every employee to attend training on preventing discrimination and harassment.
13
Total Rewards
Our human capital resources objectives include identifying, recruiting, retaining, incentivizing and integrating our existing and new employees. The principal purpose of our cash incentive plan is to attract, retain and reward personnel across our company through the granting of cash-based compensation awards, which are intended to increase stockholder value and the success of our company by motivating such individuals to perform to the best of their abilities and achieve our objectives. Our equity-based incentive plan has a similar purpose, and equity awards have historically been given to executives, senior management and directors.
Benefits
Our employee benefits vary by region and generally include:
Employee Safety and Wellbeing
Employee safety at our two manufacturing facilities is a top priority. We develop and administer policies designed to ensure the safety of our manufacturing personnel and compliance with Occupational Safety and Health Administration (“OSHA”) standards. This includes regular safety training and assessments, annual safety audits and regularly informing our executives and Board of OSHA-reportable incidents.
Employee safety has been a priority throughout the COVID-19 pandemic. We have strict protocols in place designed to minimize risk to all employees. Our actions are intended to be consistent with the latest information from the Centers for Disease Control and Prevention (“CDC”), OSHA, United States Department of Agriculture (“USDA”), the Food and Drug Administration (“FDA”) and local health departments. COVID-19 safety measures at our manufacturing facilities have included fever-scans; requiring all employees to wear masks; training employees on good hygiene practices designed to minimize infection and/or spread of virus; implementing social distancing strategies; barriers to further separate employees from one another; deep cleaning and disinfection; requiring all sick employees to stay home from work; some on-site COVID-19 testing and COVID-19 educational programs.
In general, employees who are non-essential to our manufacturing operations have been working from home during the COVID-19 pandemic.
Segments
Our operations are organized into two operating segments, (1) Dinner and Sauces and (2) Breakfast and Snacks. Our Dinner and Sauces operating segment includes Rao’s and Michael Angelo’s and our Breakfast and Snacks operating segment includes noosa and Birch Benders. Due to similar economic characteristics between the two operating segments, Dinner and Sauces and Breakfast and Snacks are aggregated into one single reporting segment. The operating segments are also similar in the following areas: (a) the nature of the products, (b) the nature of the production processes, (c) the methods used to distribute products to customers, (d) the type of customer for the products and (e) the nature of the regulatory environment.
Regulation and Compliance
14
The manufacture and sale of consumer food products is highly regulated. Our operations are subject to extensive regulation by the FDA, the USDA, the United States Environmental Protection Agency and various other federal, state, local and foreign authorities where our products are sold. We are also subject to laws regulating labor and employment; advertising and privacy; health and safety regulations; and laws affecting operations outside of the United States, including anti-bribery laws, such as the FCPA.
Food-Related Regulations
As a manufacturer and distributor of food products, we are subject to a number of food-related regulations, including the Federal Food, Drug and Cosmetic Act and regulations promulgated thereunder by the FDA, as well as the Federal Meat Inspection Act, Poultry Products Inspection Act and regulations promulgated thereunder by the USDA for meat and poultry products. This comprehensive regulatory framework governs the manufacture (including composition and ingredients), labeling, packaging and safety of food in the United States. Both the FDA and the USDA regulate manufacturing practices for foods through food safety regulations, specify the standards of identity for certain foods, including many of the products we sell, and prescribe the format and content of certain information required to appear on food product labels. Our manufacturing facility in Austin, Texas is subject to regular inspection by the USDA, and our products containing meat and poultry are subject to USDA regulation. The USDA has jurisdiction over our Rao’s Homemade, Rao’s Made for Home, Rao’s Homestyle and Michael Angelo’s sauces, soups and frozen entrées containing at least 3% raw or 2% cooked meat or poultry, and our and our U.S. co-packers’ facilities producing these products are subject to inspection by the USDA, with an inspector regularly present in our establishment when it is producing meat or poultry products. The FDA has jurisdiction over all of our other products with less than 3% raw or 2% cooked meat or poultry content and conducts inspections on a more intermittent basis.
We are also subject to the FDA Food Safety Modernization Act, which, among other things, amended the Federal Food, Drug, and Cosmetic Act to require FDA-regulated food facilities to develop and implement a written food safety plan including a hazard analysis and preventive controls program to minimize or prevent food safety hazards. The FDA also enforces the Public Health Service Act and regulations issued thereunder, which authorizes regulatory activity necessary to prevent the introduction, transmission or spread of communicable diseases. In addition, the USDA requires that establishments under its jurisdiction develop and implement HACCP plans, which require establishments to conduct a hazard analysis and implement critical control points to reduce or eliminate reasonably foreseeable food safety hazards, and Sanitation Standard Operating Procedures, which detail procedures to ensure sanitary conditions in the establishment. We are subject to numerous other federal, state and local regulations involving such matters as the licensing and registration of our manufacturing facilities, enforcement by government health agencies of standards for our products, inspection of our facilities and regulation of our trade practices in connection with the sale of food products.
We believe our facilities and manufacturing practices are in material compliance with all material government regulations applicable to our business.
Labeling Regulations
We are subject to various labeling requirements with respect to our products at the federal, state and local levels. At the federal level, the FDA has authority to review product labels, labeling and, increasingly, website and social media content, the FTC has the primary authority to regulate advertising materials, including online and television advertisements, to determine if advertising materials are misleading, while the USDA requires producers of USDA-regulated products to obtain premarket approval of labels. In addition, we are subject to various state and local consumer protection laws, including laws that allow for private class action litigation challenges to the labeling, marketing and advertising of foods. Labeling for our products must also comply with the Bioengineered Food Disclosure Standard. We are also subject to the disclosure requirements of California’s Proposition 65, which requires businesses to provide warnings prior to any exposures to a chemical listed by California as a carcinogen or as having reproductive or developmental effects, including food products.
15
We believe we are in material compliance with all material labeling laws and regulations applicable to our business.
Milk Regulations
The FDA publishes the Grade A Pasteurized Milk Ordinance (the “PMO”), which includes administrative and technical requirements for production, transportation, processing, handling, sampling, examination, labeling and sale of all Grade “A” milk. Some of our products containing milk, including our yogurt products, are subject to compliance with the PMO, in addition to the above-described general regulatory requirements for manufacturing foods. Our products are also subject to manufacturing and labeling requirements for dairy products under state laws, including California state law, which do not always mirror federal requirements.
In addition, the federal government establishes minimum prices that we must pay to producers in federally regulated areas for raw milk. Raw milk delivered to our facilities is tested to determine the percentage of butterfat and other milk components, and we pay our suppliers for the raw milk based on the results of these tests. The federal government’s minimum prices for Class II milk vary depending on the processor’s geographic location or sales area and the type of product manufactured. Federal minimum prices change monthly. Class II raw skim milk prices (which are the minimum prices we are required to pay for raw milk that is processed into Class II products, such as yogurt) for each month are announced by the federal government during the immediately preceding month. Some states have established their own rules for determining minimum prices for raw milk. In addition to the federal or state minimum prices, we also may pay producer premiums, procurement costs and other related charges that vary by location and supplier.
We believe that we are in material compliance with all material milk regulations applicable to our business.
Employee Safety Regulations
We are subject to certain occupational health and safety laws, regulations and directives, including regulations issued pursuant to the U.S. Occupational Safety and Health Act, which require us to comply with certain manufacturing safety standards to protect our employees from accidents and injuries. Our operations are subject to various federal, state and local standards and requirements with respect to the COVID-19 pandemic, which may change rapidly and with little notice.
We believe that we are in material compliance with all material employee safety regulations applicable to our business.
Environmental Regulations
We are subject to various local, state and federal environmental laws, regulations and directives that regulate, among other things, environmental protection and the use, generation, storage, handling, release and disposal of hazardous substances, including the Clean Air Act, the Clean Water Act, the Resource Conservation and Recovery Act, the Federal Insecticide, Fungicide and Rodenticide Act and the Comprehensive Environmental Response Compensation and Liability Act of 1980, as amended, and analogous state laws. As a food manufacturer, our primary environmental compliance obligations relate to wastewater and solid waste generated by our manufacturing operations and ammonia and Freon used in our refrigerant systems, all of which are subject to special handling requirements. If we fail to comply with such laws, regulations and directives or fail to obtain and comply with any requisite permits, we could face substantial fines and penalties, possible revocation of our permits or the imposition of limitations or prohibitions on our operations.
We believe that we are in material compliance with the material environmental laws, regulations and directives applicable to our business; however, there can be no assurance that we are in full compliance with all environmental laws, regulations and directives or that we will be able to comply with any future requirements or changes in such laws, regulations and directives without significant costs. We do not expect the cost of our continued compliance to have a material impact on our capital expenditures, earnings, cash flows or competitive position in the foreseeable future;
16
however, new environmental laws or regulations may be enacted or environmental laws may change or become more stringent over time. If that happens, we do not know whether such changes would require us to make significant, but currently unexpected expenditures.
Company Website and Available Information
Our primary corporate website can be found at www.sovosbrands.com. We make available free of charge at the Investors portion of this website (under the "Investors—SEC Filings" caption) all of our reports (including amendments) filed or furnished pursuant to Section 13(a) or 15(d) of the Securities Exchange Act of 1934, as amended (the “Exchange Act”), including our annual report on Form 10-K, our quarterly reports on Form 10-Q and our current reports on Form 8-K. These reports are made available on the website as soon as reasonably practicable after their filing with, or furnishing to, the Securities and Exchange Commission (the “SEC”).
All websites appearing in this Annual Report on Form 10-K are inactive textual references only, and the information in, or accessible through, such websites is not incorporated into this Annual Report on Form 10-K, or into any of our other filings with the SEC.
Information about Our Executive Officers.
The names, ages (as of March 15, 2022), current positions and background information of our executive officers are included below.
Name | Age | Position | ||
Todd R. Lachman | 58 | Founder, President and Chief Executive Officer; Director | ||
Christopher W. Hall | 61 | Chief Financial Officer | ||
Kirk A. Jensen | 47 | Chief Operating Officer | ||
Wendy K. Behr | 53 | Chief Research and Development Officer | ||
Risa Cretella | 42 | Executive Vice President and Group General Manager | ||
Katie J. Gvazdinskas | 43 | Chief Human Resources Officer | ||
Isobel A. Jones | 54 | Chief Legal Officer and General Counsel; Secretary | ||
Lisa Y. O'Driscoll | 48 | Chief Administrative Officer | ||
Priscilla Tuan | 50 | Chief Marketing Officer |
Todd R. Lachman has served as our President and Chief Executive Officer since January 2017 and has served as a director since January 2017. Prior to joining Sovos, Mr. Lachman served as operating partner of Altamont Capital Partners, a private equity firm, from May 2015 to March 2016 and a senior advisor to Advent from March 2016 to January 2017. For over 30 years, Mr. Lachman has delivered growth and value creation for some of the largest CPG companies in the United States. Prior to May 2015, Mr. Lachman served as global president of Mars Petcare, served as president of Mars Chocolate North America and Latin America and held various positions at Del Monte Foods Company, the H.J. Heinz Company and The Procter & Gamble Company. Mr. Lachman currently serves on the board of a private company. He earned his B.A. in economics and art history from Colby College and his M.B.A. from the Northwestern University Kellogg School of Management.
Christopher W. Hall has served as our Chief Financial Officer since November 2019. Prior to joining Sovos, Mr. Hall served as chief financial officer of Woodbolt Distribution LLC (Nutrabolt), a nutritional life science company, from March 2017 to November 2019 and chief financial officer of Sabra Dipping Company, LLC, a producer of refrigerated dips and spreads, from April 2015 to March 2017. Prior to April 2015, Mr. Hall held various positions for PepsiCo, Inc. and its operating divisions and subsidiaries, including Quaker Foods North America, Frito-Lay Canada and Frito-Lay, Inc. He earned his B.A. in marketing from Indiana University and his M.B.A. from the University of Texas.
17
Kirk A. Jensen has served as our Chief Operating Officer since January 2022. Mr. Jensen also served as our Chief Supply Chain Officer from May 2019 to January 2022. Prior to joining Sovos, Mr. Jensen served as chief supply chain officer and vice president of manufacturing of Snyder’s-Lance, Inc. from April 2017 to April 2018 and from March 2016 to April 2017, respectively. Mr. Jensen also held various management positions for Diamond Foods, Inc., a snack food and culinary nut company, from December 2010 to March 2016. Prior to December 2010, Mr. Jensen held various positions for Darigold, Inc. and Frito-Lay, Inc. He earned his B.S. in electrical engineering from Oregon State University.
Wendy K. Behr has served as our Chief R&D Officer since October 2020. Prior to joining Sovos, from September 2019 to October 2020, Ms. Behr served as product and supply innovation consultant of Concept to Commercialization Integrated Solutions, a growth and innovation business consultancy. Ms. Behr served as vice president, coffee R&D and packaging innovation of Keurig Dr. Pepper Inc., a beverage company, from February 2018 to October 2019 and senior vice president, R&D and corporate sustainability of WhiteWave Foods Company, a consumer packaged food and beverage company, from January 2013 to December 2017. Prior to January 2013, Ms. Behr held various positions for Diageo plc, Kraft Foods, Inc. and Givaudan Roure. She earned her B.S.in chemical engineering from the University of Illinois and her master of nutrition science of policy and certificate in graduate studies in sustainable agriculture and food systems from Tufts University.
Risa Cretella manages our Dinners and Sauces operating segment and has served as our Executive Vice President and Group General Manager since April 2020. From September 2018 until March 2020, Ms. Cretella served as our Senior Vice President, Group Manager. Ms. Cretella joined us as General Manager, Rao’s Homemade in April 2018. Prior to joining Sovos, Ms. Cretella served as senior vice president of marketing and frozen leadership brands and held various other management positions for Pinnacle Foods, Inc., a manufacturer, marketer and distributor of high-quality branded food products, from January 2013 to March 2018. Prior to January 2013, Ms. Cretella held various positions for the J.M. Smucker Company. She earned her B.A. in marketing from the University of Notre Dame and her M.B.A. from Kent State University.
Katie J. Gvazdinskas has served as our Chief Human Resources Officer since July 2021. Ms. Gvazdinskas also served as our Vice President, People and Organization from February 2019 to July 2021. Prior to joining Sovos, Ms. Gvazdinskas served as vice president of global talent management and total rewards for Crocs, Inc., a casual footwear retailer, from July 2014 to June 2017. Prior to July 2014, Ms. Gvazdinskas held various management positions for Crocs, Inc. She earned her B.A. in liberal arts and sciences at Northern Arizona University.
Isobel A. Jones has served as our Chief Legal Officer and General Counsel since February 2020 and has served as our Secretary since June 2020. Prior to joining Sovos, Ms. Jones served as general counsel of Sun Basket, Inc., an e-commerce food company, from June 2017 to July 2019. Ms. Jones was a contract attorney for the law firm of BraunHagey & Borden LLP from September 2016 to June 2017. She served as executive vice president and general counsel for Diamond Foods, Inc. from October 2014 to February 2016. Prior to October 2014, Ms. Jones served as general counsel and secretary of Annie’s, Inc. and vice president, general counsel and secretary of Peet’s Coffee and Tea, Inc. She earned her A.B. in East Asian studies and economics from Harvard University and her J.D. from Harvard Law School.
Lisa Y. O’Driscoll has served as our Chief Administrative Officer since July 2021. Ms. O’Driscoll also served as our Chief People Officer from May 2019 to July 2021 and our Senior Vice President, People, Organization and Business Integration from February 2017 to May 2019. Prior to joining Sovos, Ms. O’Driscoll served as principal, M&A/human capital of Ernst & Young, a network of firms that provide assurance, tax, transaction and advisory services, from May 2016 to January 2017 and a director of Willis Tower Watson PLC, a global advisory, broking and solutions company, from May 2012 to May 2016. Prior to May 2012, Ms. O’Driscoll held various management positions for Diamond Foods, Inc. and Willis Tower Watson PLC. She earned her B.S.W. from Campbell University.
Priscilla Tuan has served as our Chief Marketing Officer since January 2022. Ms. Tuan also served as our Senior Vice President Marketing from April 2017 to December 2021 and General Manager from December 2017 to September
18
2018. Prior to joining Sovos, Ms. Tuan served as a senior director at The Clorox Company from December 2014 to March 2017 and held various other leadership positions at The Clorox Company across commercial, marketing, innovation and sales since June 2007. Ms. Tuan also served as the Executive Sponsor for the Clorox Asian American Employee Resource Group and as a trustee of The Clorox Foundation from March 2015 to March 2017. Ms. Tuan earned her B.A. in English & American literature and political science from Brown University and an M.B.A. from Stanford University Graduate School of Business.
Item 1A. Risk Factors
An investment in our common stock involves a high degree of risk. Before investing in our common stock, you should carefully consider each of the following risk factors, as well as all other information contained in this Form 10-K, including “Management’s Discussion and Analysis of Financial Condition and Results of Operations.” The occurrence of any of the following risks could materially and adversely affect our business, financial condition, results of operations, in which case the trading price of our common stock could decline and you could lose all or part of your investment.
Summary of Risk Factors
Our business is subject to a number of risks and uncertainties including those described at length below. These risks include, among others, the following which we consider to be our most material risks:
| ● | Inflation, including our vulnerability to decreases in the supply of and increases in the price of raw materials and labor, manufacturing, distribution and other costs, and our inability to offset increasing costs through cost savings initiatives or pricing; |
| ● | supply disruptions; |
| ● | competition in the packaged food industry and our product categories; |
| ● | the COVID-19 pandemic and associated effects; |
| ● | our inability to accurately forecast pricing elasticities and the resulting impact on volume growth and/or distribution gains; |
| ● | our inability to maintain our workforce; |
| ● | our inability to identify, consummate or integrate new acquisitions or realize the projected benefits of acquisitions; |
| ● | our inability to effectively manage our growth; |
| ● | our inability to successfully introduce new products or failure of recently launched products to meet expectations or remain on-shelf; |
| ● | our inability to expand household penetration and successfully market our products; |
| ● | erosion of the reputation of one or more of our brands; |
| ● | issues with the major retailers, wholesalers, distributors and mass merchants on which we rely, including if they give higher priority to other brands or products, perform poorly or declare bankruptcy; |
| ● | our vulnerability to the impact of severe weather conditions, natural disasters and other natural events on our manufacturing facilities, co-packers or raw material supplies; |
| ● | failure by us or third-party co-packers or suppliers of raw materials to comply with food safety, environmental or other laws or regulations, or new laws or regulations; |
| ● | our dependence on third-party distributors and third-party co-packers, including one co-packer for the substantial majority of our Rao’s Homemade sauce products; |
| ● | failure to protect, or litigation involving, our tradenames or trademarks and other rights; |
| ● | our level of indebtedness under our First Lien Credit Agreement, which as of December 25, 2021 was $480.8 million, and our duty to comply with covenants under our First Lien Credit Agreement (as defined herein); and |
| ● | the interests of Advent may differ from those of public stockholders. |
19
Risks Related to Our Business and Our Industry
We are vulnerable to decreases in the supply of and increases in the price of ingredients and other materials and labor, manufacturing, distribution and other costs, and we may not be able to offset increasing costs through cost savings initiatives or pricing.
We purchase raw materials, including agricultural products, whole milk, almond and other flours, tomatoes, cheese, chicken and meat, and other ingredients, such as fruit preparations, from growers, commodity processors, ingredient suppliers and other food companies located primarily in the United States. We also purchase packaging materials, including tubs, caps and lids, trays, labels, corrugated cardboard, cartons and other packaging, from packaging manufacturers located primarily in the United States. Our co-manufacturers also purchase ingredients and packaging materials and can pass along cost increases to us subject, in some instances, to certain contractual limitations. Ingredients and packaging materials are subject to increases in price attributable to a number of factors, including disruptions in supply, global geopolitical tensions, other political unrest, tariffs, sanctions, trade disputes, drought and excessive rain, fire, temperature extremes and other adverse weather events, water scarcity, scarcity of suitable agricultural land, crop size, cattle cycles, herd and flock disease, crop disease and crop pests. Certain ingredients used in some of our products are organic or non-GMO, and organic and non-GMO raw materials may be subject to additional pressures from increased demand or greater supply vulnerability. We are particularly vulnerable to agricultural disasters or pestilence resulting in price increases associated with the tomato crops in Italy and the United States, the eggplant crop in the United States and Mexico, the production of milk in the United States, honey production in the United States and Canada and fruit crop supply because of our and our co-packers’ large purchases of these materials. Crop disease or other crop failures and crop pests, such as insects, plant diseases and fungi, as well as herd and flock diseases, such as mad cow disease, swine influenza and avian influenza, and issues impacting pollinators and bee colonies, could impact the cost and availability of the agricultural products, animal proteins and eggs used in our products. Factors associated with the COVID-19 pandemic have resulted in increased demand for and disrupted supply of some ingredients and packaging materials. Factors associated with global geopolitical tensions, including relating to Ukraine, have also disrupted supplies and increased costs. We expect factors associated with COVID-19 and global geopolitical tensions to continue to impact our business and may become more acute, particularly with respect to oil and its related impact on transportation and logistics costs as well as resin costs. Fluctuations in commodity prices can lead to retail price volatility and increased price competition and can influence consumer and trade buying patterns.
In addition, the costs of labor, logistics, manufacturing, energy, fuel and packaging materials and other costs related to the production and distribution of our products can from time to time increase significantly and unexpectedly. We attempt to manage some of these risks by entering into supply contracts and advance commodities purchase agreements from time to time and implementing cost saving measures. Our suppliers may also close (whether permanently or temporarily), causing us to seek suitable suppliers elsewhere. Factors associated with the COVID-19 pandemic have resulted in increased demand for transportation and the availability and cost of transportation for our products have been and could continue to be impacted. Moreover, we are exposed to higher costs in certain areas, such as front-line employee compensation as well as incremental costs associated with newly added health screenings, temperature checks and enhanced cleaning and sanitation protocols to protect our employees, due to the COVID-19 pandemic. Third parties, such as co-packers, suppliers, distributors, retailers and transportation companies, are subject to similar cost pressures and may seek to pass these increased costs on to us. Competition for co-packers, including increased demand for co-packed products, could also increase the costs of manufacturing and packing our products.
Further, if we increase prices to offset higher costs, we could experience lower demand for our products and sales volumes. We recently increased prices for Rao’s sauces and recently announced that we will increase prices for other products in our portfolio, which could adversely impact demand and sales. We may implement additional price increases in the future. To the extent we are unable to offset present and future cost increases related to the production and
20
distribution of our products, it could have a material adverse effect on our business, financial condition and results of operations.
The packaged food industry is highly competitive. Our product categories face a high level of competition, which could have a material adverse effect on our business, financial condition and results of operations.
The packaged food industry is highly competitive. Numerous brands and products, including private label products and insurgent brands, compete for shelf space and sales, with competition based primarily on product quality and taste, convenience, price, trade promotion, brand recognition and loyalty, customer service, effective consumer advertising and promotional activities and the ability to identify and satisfy emerging consumer preferences.
We compete with a significant number of companies of varying sizes, including large multi-brand consumer packaged food companies, smaller product-focused companies, emerging companies and dairy products- and dairy alternative-focused companies. Some of our markets are dominated by multinational corporations with greater resources and more substantial operations than us. Many of these large multi-brand competitors have substantial financial, marketing, research and development and other resources and we may not be able to successfully compete for sales to distributors or retailers that purchase from larger competitors. Competing large multi-brand consumer packaged food companies, including B&G Foods, Inc., Barilla Holding S.p.A., Campbell Soup Company, Conagra Brands, Inc., Continental Mills, Inc., General Mills, Inc., The Hain Celestial Group, Inc., the J.M. Smucker Company, the Kellogg Company, The Kraft Heinz Company, Mizkan Holdings, Nestle S.A. and PepsiCo, Inc. may be able to use their resources and scale to respond to competitive pressures and changes in consumer preferences by introducing new products or reformulating their existing products, reducing prices or increasing promotional activities. We also compete with smaller and more product-focused companies, including Amy’s Kitchen, Bob’s Red Mill Natural Foods, Inc., G.L. Mezzetta, Inc., Kodiak Cakes, LLC, Newman’s Own, Inc. and Van’s International Foods, which may be more innovative and able to bring new products to market faster and more quickly exploit and serve niche markets or new or burgeoning consumer preferences. Smaller insurgent brands we compete with may develop a customer base and consumer loyalty quickly. In addition, we compete against companies focused on dairy and dairy-alternative products, such as Chobani, LLC, Danone S.A., Fage International S.A. and The Lactalis Group.
Competitive pressures may restrict our ability to increase prices and maintain such price increases in response to commodity and other cost increases and inflation. Failure to effectively assess, timely change and properly set pricing, promotions or incentives may negatively impact our ability to achieve the objectives of such price increases.
In addition, reduced barriers to entry, easier access to funding and factors associated with the COVID-19 pandemic, such as increased cash flows caused by spikes in consumer demand and efforts by retailers to reduce the numbers of stock-keeping units (“SKUs”) on their shelves, could cause competition to intensify. Our Rao’s Made for Home and Michael Angelo’s frozen products may compete with each other, and most retailers also offer private label products that also compete for retail shelf space and consumer purchases. As a result of competition, retailers may take actions that negatively affect us. Consequently, we may need to increase our marketing, advertising and promotional spending to protect our existing market share. The inability to increase our market share, the loss of market share to our competitors and increased costs associated with increasing our market share or protecting our existing market share could have a material adverse effect on our business, financial condition and results of operations.
The COVID-19 pandemic and associated responses could have a material adverse effect on our business, financial condition and results of operations.
The COVID-19 pandemic has significantly impacted economic activity and markets throughout the world. In response, governmental authorities have implemented numerous measures in an attempt to contain the virus, such as travel bans and restrictions, quarantines, shelter-in-place orders and business shutdowns. Additionally, protests against such measures have disrupted supply chains. Although our business has benefitted from some of these governmental measures,
21
the impact and associated responses of the COVID-19 pandemic could have a material adverse effect on our business, financial condition and results of operations in a number of ways, including but not limited to:
| ● | shutdown of one or more of our manufacturing, warehousing or distribution facilities, or disruption in our supply chain, including but not limited to as a result of illness, government restrictions or other workforce or supply disruptions; |
| ● | the failure of third parties on which we rely, including but not limited to third parties that supply our co-packed products, raw materials, packaging materials and other necessary operating materials, to meet their obligations to us, or significant disruptions in their ability to do so; |
| ● | increased costs and limited supply as well as a strain on our supply chain, which could result from continued increased customer and consumer demand for our products; |
| ● | labor shortages and increased turnover rates among our employees and third parties on which we rely; |
| ● | a disruption to the production of our products in Italy and delays in shipment of our products from Italy, including those caused by reduced shipping container availability or congestion at the ports where we or our co-packer do business; |
| ● | a disruption to our distribution capabilities or to our distribution channels or increased transportation and distribution costs, including those of our suppliers, co-packers, logistics service providers or third-party distributors; |
| ● | reductions in the availability of one or more of our products as we prioritize the production of other products due to increased demand; |
| ● | a disruption to the operability or availability of our equipment, including equipment necessary to expand our or our co-packers’ and suppliers’ production capacity or implement cost-savings initiatives; |
| ● | changes to and delays in our product innovation efforts; |
| ● | new or escalated government or regulatory responses in markets where we manufacture, sell or distribute our products, or in the markets of third parties on which we rely, which could prevent or disrupt our business operations; |
| ● | a significant portion of our workforce, including our management team, could become unable to work as a result of illness, or the attention of our management team could be diverted if key employees become ill from COVID-19 and unable to work; |
| ● | higher costs in certain areas, such as front-line employee compensation, as well as incremental costs associated with newly added health screenings, temperature checks and enhanced cleaning and sanitation protocols to protect our employees, which could continue or could increase in these or other areas; |
| ● | the temporary inability of consumers to purchase our products due to illness, quarantine or other travel restrictions or financial hardship, decrease in demand due to the easing of governmental authority restrictions and business closings or decrease in pantry-loading activity; |
| ● | a change in demand for or availability of our products as a result of retailers, distributors or carriers modifying their inventory, fulfillment or shipping practices; |
| ● | an inability to effectively modify our trade promotion and advertising activities to reflect changing consumer shopping habits due to, among other things, reduced in-store visits and travel restrictions; |
| ● | a shift in consumer spending as a result of an economic downturn could result in consumers purchasing more generic, private label or lower-price products or foregoing certain purchases altogether; |
| ● | an increased reliance on our information technology systems due to many employees working remotely, which could cause us to be increasingly susceptible to cyberattacks and other cyber incidents; and |
| ● | continued business disruptions and uncertainties related to the COVID-19 pandemic for a sustained period of time, which could result in additional delays or modifications to our strategic plans and other initiatives and hinder our ability to achieve anticipated cost savings and efficiency initiatives on the original timelines. |
These and other impacts of the COVID-19 pandemic could also have the effect of heightening many of the other risk factors included in this section. The ultimate impact of the COVID-19 pandemic depends on the severity and duration of the pandemic and actions taken by governmental authorities and other third parties in response, each of which is uncertain, rapidly changing and difficult to predict. Any of these disruptions could have a material adverse effect on our business, financial condition and results of operations. Additionally, a decrease in at-home eating after the COVID-19 pandemic or
22
reduction of related restrictions could negatively impact the categories in which we compete and demand for our products, which could have a material adverse effect on our business, financial condition and results of operations.
We may have difficulties identifying, consummating or integrating new acquisitions or realizing the projected benefits of acquisitions.
A core part of our strategy is to grow through acquisitions. We successfully completed the Birch Benders Acquisition and the Noosa Acquisition in October 2020 and November 2018, respectively, and we expect to pursue additional acquisitions. However, we may be unable to identify and consummate additional acquisitions, and we may incur significant transaction costs for acquisitions that we do not complete. Brands are often sold through an auction process, and although we may invest significant resources and devote considerable amounts of time to the auction process, we may not be the winning bidder.
In addition, we may not successfully integrate and manage brands that we acquire or achieve anticipated cost savings and targeted synergies from acquisitions in the timeframe we anticipate or at all. Acquisitions involve numerous risks, including difficulties in assimilating and realizing targeted synergies in the sales, distribution, purchasing, manufacturing and warehousing capabilities of the acquired companies, personnel turnover and the diversion of management’s attention from other business concerns. We may not realize the expected benefits from the Birch Benders Acquisition which will depend, in part, on our ability to attain the projected growth opportunities and cost synergies as a result of the acquisition. Our projections for the Birch Benders Acquisition were based on assumptions which may not be reliable or accurate and may be impacted by uncertainties, including those related to the COVID-19 pandemic. Projected growth opportunities could require a greater-than-anticipated amount of trade and promotional spending. There can be no assurance that we will successfully or efficiently integrate any brands that we may acquire in the future, and the failure to do so could have a material adverse effect on our business, financial condition and results of operations. Future acquisitions by us could also result in our issuing additional equity securities, which could be dilutive to our then existing stockholders, as well as incurring substantial additional indebtedness, exposure to contingent liabilities or incurring the impairment of goodwill and other intangible assets, all of which could have a material adverse effect on our business, financial condition and results of operations.
Financial market conditions may impede our access to, or increase the cost of, financing for acquisitions.
The COVID-19 pandemic and global geopolitical tensions, including relating to Ukraine, have increased volatility and pricing in the capital markets, and any future financial market disruptions or tightening of the credit markets or interest rate increases may make it more difficult for us to obtain financing on terms we find acceptable for acquisitions or other purposes or increase the cost of obtaining financing. Interest rates are highly sensitive to many factors, including governmental monetary policies, economic and political conditions and other factors beyond our control. For example, the Federal Reserve has indicated that it intends to increase interest rates. In addition, our future borrowing costs may be affected by short- and long-term debt ratings assigned by independent rating agencies that are based, in significant part, on our performance as measured by credit metrics, such as interest coverage and leverage ratios. A decrease in these ratings could increase our cost of borrowing or make it more difficult for us to obtain financing when needed or on terms we find acceptable. Limited access to or increased cost associated with financing acquisitions may limit our ability to acquire additional brands, which could have a material adverse effect on our business, financial condition and results of operations.
We may not be able to effectively manage our growth, which could have a material adverse effect on our business, financial condition and results of operations.
We have a limited operating history as a combined company due to our recent completions of the Birch Benders Acquisition and the Noosa Acquisition in October 2020 and November 2018, respectively. Our rapid growth has placed, and may continue to place, significant demands on our organizational, administrative and operational infrastructure, including manufacturing operations, supply chain, quality control, regulatory support, customer service, sales force management and general and financial administration. As we continue to grow and acquire brands, we will need to continue
23
building our operational, financial and management controls as well as our reporting systems and procedures. Managing our planned growth effectively may require us to:
| ● | enhance our facilities and purchase additional equipment at our facilities; |
| ● | upgrade or enhance our information technology systems; and |
| ● | successfully hire, train and motivate additional employees. |
If we are unable to manage our growth effectively, we may be unable to execute our business plan, which could have a material adverse effect on our business, financial condition and results of operations.
Our future growth and continued success depend upon consumer preferences for our products, which could change. If we fail to anticipate and respond to changes in consumer preferences, demand for our products could decline.
Our business is primarily focused on sales of premium, on-trend and high-quality products, and a future decrease in consumer demand for such products could have a material adverse effect on our business, financial condition and results of operations. Consumer demand could change based on a number of possible factors, including dietary and nutritional values, such as the popularity of “keto” and “paleo” diets, and lifestyle habits, such as a potential shift away from eating at home; concerns regarding the health effects of ingredients; product packaging preferences; and factors associated with an economic downturn or the COVID-19 pandemic, such as increased unemployment, decreases in disposable income and declines in consumer confidence. While we continue to diversify our product offerings, developing new products entails risks. A failure to offer products that consumers want to buy, accurately predict which shifts in consumer preferences will be long-lasting or introduce new and improved products to satisfy those preferences could have a material adverse effect on our business, financial condition and results of operations. In addition, given the variety of backgrounds and identities of consumers in our consumer base, we must offer a sufficient array of products to satisfy the broad spectrum of consumer preferences. As such, we must be successful in developing innovative products across a multitude of product categories. A failure to anticipate and respond to changes in consumer preferences or a significant shift in consumer demand away from our products could reduce the sales of our brands or our market share, any of which could have a material adverse effect on our business, financial condition and results of operations.
If we are unable to successfully introduce new products or if recently launched products do not meet expectations or are de-listed or discontinued, it could have a material adverse effect on our business, financial condition and results of operations.
Our success is dependent on anticipating changes in consumer preferences and successful new product development and product launches in both our existing and adjacent market categories in response to such changes. Trends within the packaged food industry change often, and failure to identify and react to changes in these trends, could lead to, among other things, reduced loyalty, reduced demand and price reductions for our brands and products. In addition, our misperception of the acceptance of our brands, or brands that we may acquire in the future, could limit our ability to innovate in adjacent market categories. While we devote significant efforts to the development of new products and to the research, development and technology process functions of our business, we may underestimate the costs of new products or we may not be successful in developing new products cost-effectively or at all. We could incur significant costs, including for slotting, for products that are commercially successful as well as for products that may initially gain customer or consumer acceptance but are ultimately unsuccessful. The success of our innovation and product improvement efforts is affected by our ability to anticipate changes in consumers’ preferences; the level of funding that can be made available; the technical capability of our research and development staff in developing, formulating and testing product prototypes; our compliance with governmental regulations; and the success of our management in introducing the resulting new products or improvements in a timely manner.
Even if we are successful in introducing new or recently launched products, sales generated by new products could cause a decline in sales of our existing products, or new products could have lower margins than our existing products. Our future results and our ability to maintain or improve our competitive position will depend on our capacity to gauge the direction of our key markets and our ability to successfully identify, develop, manufacture, market and sell new or
24
improved products in these changing markets, and a failure to do so effectively could have a material adverse effect on our business, financial condition and results of operations.
Our sales and profit growth are dependent on our ability to expand existing market penetration and enter into new markets. If we are unable to increase distribution of our products, it could adversely affect our ability to grow our business.
Successful growth depends on our ability to secure increased distribution of our products by adding new customers, increasing the number of stores that sell our products, increasing the number of our products our customers offer for sale and enhancing our product portfolio with innovative and profitable products. This growth would also include expanding our retail shelf placement and priority as well as increasing access to alternative retail channels, such as e-commerce retailers, to sell our products. If our customers reduce the frequency of their shelf resets, whether as a result of increased labor costs, labor shortages or other factors, or decrease the shelf space devoted to the categories in which we compete, our ability to expand distribution of our products could be adversely impacted. The COVID-19 pandemic impacted our product innovation and growth efforts in fiscal 2020 and fiscal 2021 as a result of our customers modifying their shelf reset timings, reducing in store-displays and promotional activities and shifting their ordering patterns. Additionally, the COVID-19 pandemic caused our customers to focus on ensuring that key products remain in stock. To the extent customers continue to focus on ensuring shelf space for key products, future shelf-space opportunities for new products may be impacted. Supply disruptions may also impact our ability to expand our distribution. Our inability to successfully increase distribution of our products could have a material adverse effect on our business, financial condition and results of operations.
Our sales and profit growth are dependent on our ability to expand household penetration and the success of our marketing programs. If we are unable to increase household penetration of our products, it could adversely affect our ability to grow our business.
Successful growth depends on our ability to increase our household penetration by reaching new consumers and on our ability to increase purchases by existing consumers of our products, and we seek to maintain and improve our brand image through marketing investments, including advertising and consumer promotions. However, retailers and our competitors may continue to aggressively market their branded and private label products, which could reduce demand for our products. To compete effectively, increase our household penetration, increase purchases by our existing consumers and maintain and improve our brand image, we may need to increase or reallocate spending on marketing and promotional activities, such as rebates, temporary price reductions, off-invoice discounts, retailer advertisements, product coupons and other trade activities. These expenditures are subject to risks, including risks related to consumer acceptance of our efforts, the rapidly changing media environment, costs of advertising through social and digital media outlets and consumers’ use of the social and digital media outlets where we market our brands. We rely primarily on social media and online dissemination of our advertising campaigns, and the success of our brands, and our growth, may suffer if our marketing plans or product initiatives do not have the desired impact on a brand’s image or its ability to attract consumers or drive frequency of purchase. Our inability to successfully increase household penetration of our products or increase purchases by our existing consumers could have a material adverse effect on our business, financial condition and results of operations.
Economic downturns could limit consumer and customer demand for our products.
The willingness of consumers to purchase our products depends in part on changes in local, national and global economic conditions. Deteriorating economic and political conditions in our major markets, such as increased unemployment, decreases in disposable income, declines in consumer confidence and inflationary pressures, whether as a result of the COVID-19 pandemic, geopolitical tensions or other factors, could cause a decrease in demand for our overall product set, particularly higher priced products.
In an economic downturn, consumers may purchase more generic, private label and other products that are lower in price than our products and may forego certain purchases altogether. Consumers may reduce the number of premium
25
products that they purchase where there are mid-tier alternatives, given that premium products generally have higher retail prices than their mid-tier counterparts. Due to changes in consumer demand, we could experience a reduction in sales, a reduction in sales of higher margin products or a shift in our product mix to lower margin offerings. Our customers may also become more conservative in response to these conditions and seek to reduce their inventories or change their shelf sets to prioritize lower-price products. In addition, as a result of economic conditions or competition, we may be unable to raise our prices sufficiently to protect margins. The impacts of an economic downturn and the COVID-19 pandemic may be greater than we expect, and demand for our products may not meet our expectations in the future following the end of an economic downturn or the COVID-19 pandemic. Current global geopolitical tensions, including related to Ukraine, may exacerbate any economic downturn. Prolonged unfavorable economic conditions may have an adverse effect on any of these factors and could have a material adverse effect on our business, financial condition and results of operations.
Our business is highly concentrated in the United States, with little global diversification.
Our operations and our customers are mainly in the United States and, therefore, we are particularly susceptible to consumer trends, market fluctuations, including commodity price fluctuations, inflation or supply shortages of key raw materials, adverse regulations, the economic climate and other adverse events in the United States. The concentration of our businesses in the United States could present challenges and increases the likelihood that an adverse event in the United States would have a material adverse effect on our business, financial condition and results of operations.
Erosion of the reputation of one or more of our brands could have a material adverse effect on our business, financial condition and results of operations.
Maintaining and continually enhancing the value of our brands is critical to the success of our business, and consumer perceptions have a significant impact on the value of our brands. Our reputation could be adversely impacted by any of the following, or by negative publicity (whether or not valid) relating thereto: the failure to maintain high standards for the quality of our products; concerns about food safety, product recalls or other issues, such as product contamination, mislabeling or tampering; the failure to meet ethical, social and environmental expectations or standards for all of our operations, activities, employees or co-packers; the failure to achieve any stated goals with respect to the nutritional or ingredient profile of our products; the loss of third-party certifications for certain of our products as, for example, “gluten-free,” “non-GMO” or “organic;” our research and development efforts; or our environmental impact, including use of agricultural materials, packaging, energy use and waste management. A failure to comply with laws and regulations, maintain an effective system of internal controls or provide accurate and timely financial information could also hurt our reputation.
In particular, a significant product recall or any assertion that our products caused injury, illness or death could result in negative publicity, damage to our reputation with existing and potential customers or our brand image and loss of consumer confidence in the safety and/or quality of our products, ingredients or packaging. In addition, if another company recalls or experiences negative publicity related to a product in a category in which we compete, consumers might reduce their overall consumption of products in that category or customers may cancel orders for such products as a result of such events. A widespread product recall could result in significant losses due to the costs of a recall, the destruction of product inventory and lost sales due to the unavailability of product for a period of time, and we could suffer losses from a significant adverse product liability judgment.
Further, the widespread use of social and digital media by consumers has increased the speed and extent that information or misinformation and opinions can be shared, and negative posts or comments about us or our brands, employees, co-packers, products or packaging on social or digital media could seriously damage the value of our brands. Consumers have been increasingly focused on food safety and health and wellness with respect to the food products they buy. If we fail to adequately respond to any consumer concerns, we could suffer lost sales and damage our brand image or our reputation. Publicity concerning the health implications of food products generally, or changes in public perception of certain ingredients, packaging or food products, such as “keto” products, could negatively influence consumer perception and acceptance of our products and marketing programs. Damage to our reputation or loss of consumer confidence in the safety or quality our products for any of these or other reasons could result in decreased demand for our products, harm
26
our ability to maintain premium pricing over private label products and have a material adverse effect on our business, financial condition and results of operations, as well as require additional resources to rebuild our reputation.
A substantial amount of our net sales and EBITDA comes from our Dinners and Sauces operating segment, and a slow-down or decrease in sales of Rao’s sauce products could have a material adverse effect on our business, financial condition and results of operations.
A substantial amount of our net sales is derived from our Dinners and Sauces operating segment. Sales of products in our Dinners and Sauces operating segment, which includes our Rao’s sauce products, represented approximately 69% of our net sales in fiscal 2021. We believe that sales of products in our Dinners and Sauces operating segment will continue to constitute a substantial amount of our net sales for the foreseeable future. If we gain or maintain our market share in the market for products in our Dinners and Sauces operating segment, such as our Rao’s sauce products, competitors, including companies with greater resources and more substantial operations than us, could respond by increasing competition in this market. Our business, financial condition and results of operations would be harmed by a decline in the market for products in our Dinners and Sauces operating segment, increased competition in the market for those products, disruptions in our ability to procure those products (whether due to manufacturer inability, supply chain failures or otherwise) or our failure or inability to provide sufficient investment to support and market, promote and display those products as needed to maintain or grow their competitive position or to achieve more widespread market acceptance.
Due to seasonality or changes in our promotional activities, our revenue and operating results may vary from quarter to quarter.
We have experienced, and expect to continue to experience, fluctuations in our quarterly results of operations due to the seasonal nature of our business. Consumer purchasing patterns are impacted by seasonal factors, including weather and holidays. Seasonality could cause our results of operations for an interim financial period to fluctuate and not be indicative of our full year results. Seasonality also impacts relative net sales and profitability of each quarter of the year, both on a quarter-to-quarter and year-over-year basis. If we fail to effectively manage our inventories or fluctuations in business as a result of promotional activities or other factors, seasonality could have a material adverse effect on our business, financial condition and results of operations.
We rely on the performance of major retailers, wholesalers, distributors and mass merchants for the success of our business, and if they give higher priority to other brands or products, perform poorly or declare bankruptcy, it could have a material adverse effect on our business, financial condition and results of operations.
We sell our products principally to retail outlets and wholesale distributors, including traditional supermarkets, mass merchants, warehouse clubs, wholesalers, specialty food distributors, military commissaries and non-food outlets, such as drug store chains, dollar stores and e-commerce retailers. The poor performance of our major wholesalers, retailers or chains or our inability to collect accounts receivable from our customers could have a material adverse effect on our business, financial condition and results of operations.
In addition, our customers offer branded and private label products that compete directly with our products for retail shelf space and consumer purchases. Accordingly, there is a risk that our customers may give higher priority to their own products or to the products of our competitors. In the future, our customers may not continue to purchase our products or provide our products with adequate levels of promotional support or shelf space or may replace our branded products with private label products. For example, in 2020, one club retailer chose to discontinue carrying our Michael Angelo’s lasagna, electing to only carry the leading national brand and its private label brand. Such risks may be particularly acute in historically declining market categories, such as yogurt. Emerging alternative retail channels, such as online-only grocery delivery services, also continue to evolve and impact the packaged food industry. The performance of major retailers,
27
wholesalers, specialty distributors and mass merchants and their prioritization of our brands could have a material adverse effect on our business, financial condition and results of operations.
We may be unable to grow or maintain our profitability in the face of a consolidating retail environment, and the loss of any of our largest customers could have a material adverse effect on our business, financial condition and results of operations.
In fiscal 2021, our largest customers, Costco, Walmart and UNFI, accounted for approximately 18%, 13% and 11%, respectively, of our gross sales, and our top four largest customers together accounted for approximately 49% of our gross sales. We expect that a significant portion of our revenues will continue to be derived from a limited number of customers. Our customers are generally not contractually obligated to purchase from us and make purchase decisions based on a combination of price, promotional support, product quality, consumer demand, customer service performance, their desired inventory levels and other factors. As the retail grocery trade continues to consolidate and our customers grow larger and become more sophisticated, our customers may demand lower pricing, increased promotional programs, increased deductions and allowances and consistent terms or a single ordering system. There can be no assurance that our largest customers will continue to purchase our products in the same mix or quantities, or on the same terms, as in the past. Disruption of sales to any of these customers, or to any of our other large customers, for an extended period of time could have a material adverse effect on our business, financial condition and results of operations.
Further, our customers are seeking to improve their profitability through improving efficiency, reducing their inventories, changing their shelf sets, reducing the number of brands they carry and increasing their emphasis on products that hold either the number one or number two market position and increasing their reliance on private label products, their own brand name products and generic and other economy brands. A focus by our customers on ensuring shelf space for the most popular products to avoid out-of-stocks accelerated due to the COVID-19 pandemic and may continue to accelerate. If we fail to use our sales and marketing expertise to maintain and grow retail shelf space or priority for our products, or if we lower our prices or increase promotional support of our products and are unable to increase the volume of our products sold, it could have a material adverse effect on our business, financial condition and results of operations.
In addition, alternative retail channels, such as e-commerce retailers (including key retailers with integrated traditional and digital operations and online-only grocery delivery services), subscription services, discount and dollar stores, direct-to-consumer brands, limited assortment specialty retailers, drug stores and club stores, have become more prevalent. Substantial growth in e-commerce has encouraged the entry of new competitors and business models, intensifying competition by simplifying distribution and lowering barriers to entry. This trend away from traditional retail grocery, and towards such channels, is expected to continue. We have seen a shift in consumption towards the e-commerce channel during the COVID-19 pandemic and may see a more substantial shift in the future. Typically, products we sell via the e-commerce channel present unique challenges in order fulfillment. Securing trial of our products by new consumers may be challenging in e-commerce settings if consumers focus on re-ordering products that they customarily consume. The expanding presence of e-commerce retailers has impacted, and may continue to impact, consumer preferences and market dynamics, which in turn may negatively affect our sales or profits. In addition, these alternative retail channels may create consumer price deflation, affecting our customer relationships and presenting additional challenges to increasing prices in response to commodity or other cost increases or inflation. Also, if these alternative retail channels, such as e-commerce retailers, take significant share away from traditional retailers, this could have a material adverse effect on our business, financial condition and results of operations. If we are not successful in expanding sales in alternative retail channels, it could have a material adverse effect on our business, financial condition and results of operations.
Any future financial market disruptions or tightening of the credit markets could expose us to additional credit risks from customers and supply risks from suppliers and co-packers.
Any future financial market disruptions or tightening of the credit markets could result in some of our customers experiencing a significant decline in profits and/or reduced liquidity, and a significant adverse change in the financial and/or credit position of a customer could require us to assume greater credit risk relating to that customer and limit our
28
ability to collect receivables. Such disruptions could require us to take measures to conserve cash until the markets stabilize or until alternative credit arrangements or other funding for our business needs can be arranged.
Current global geopolitical tensions, including related to Ukraine, may increase exchange rate volatility. A significant adverse change in the financial and/or credit position of one of our suppliers or co-packers or a significant change in the Euro to U.S. dollar exchange rate could result in an interruption to the supply of our products and increased costs. This could have a material adverse effect on our business, financial condition and results of operations.
Severe weather conditions, natural disasters and other natural events can affect our manufacturing facilities, co-packers, raw material supplies or logistics and could have a material adverse effect on our business, financial condition and results of operations.
Severe weather conditions, natural disasters and other natural events, such as floods, droughts, fires, hurricanes, earthquakes, extreme temperature events, volcanic eruptions, pestilence or health pandemics, such as the COVID-19 pandemic, may affect the supply of the raw materials that we (or our co-packers) use for our products, our manufacturing facilities, our operations or the operations of third-party co-packers, transportation companies or retailers or access to ports used to import our products. For example, our yogurt plant in Colorado, which is the sole manufacturing location of our noosa spoonable yogurts, is located in a region which is affected by fires, and production at our Texas facility was temporarily interrupted in February 2021 due to severe weather conditions. La Regina, the third-party co-packer that produces the substantial majority of our Rao’s Homemade sauce products, is located near Mount Vesuvius, an active volcano. Additionally, earthquakes in California, where many of our key personnel reside, could result in office closures or impact the communications infrastructure, impacting the ability of key personnel to operate our business. Competing manufacturers and co-packers may be affected differently by weather conditions, natural disasters or other natural events, depending on the location of their supplies and facilities. If our supplies of ingredients, packaging materials or finished goods are delayed or reduced, or if our or our co-packers’ manufacturing capabilities are disrupted, we may not be able to find adequate supplemental supply sources or alternative manufacturers on favorable terms or at all, which could have a material adverse effect on our business, financial condition and results of operations.
Climate change, water scarcity or legal, regulatory or market measures to address climate change or water scarcity could have a material adverse effect on our business, financial condition and results of operations.
There is growing concern that carbon dioxide and other greenhouse gases in the atmosphere may have an adverse impact on global temperatures, weather patterns and the frequency and severity of extreme weather and natural disasters. In the event that such climate change has a negative effect on agricultural productivity, we may be subject to decreased availability or less favorable pricing for certain commodities that are necessary for our products, such as dairy products, animal proteins, tomatoes, fruit, honey and eggplant. For example, we rely on the successful harvest of tomatoes in both the United States and Italy and purchase large quantities of eggplant, and tomato or eggplant crop sizes and quality could be adversely impacted by climate change, which in turn could harm our supply of raw materials, increase our cost of transporting and storing raw materials or disrupt the production of our products. In addition, our operations and the operations of our co-packers are dependent on the availability of water. As a result of climate change, we or our co-packers may be subject to decreased availability or less favorable pricing for water, which could impact our or their manufacturing or other operations.
The increasing concern over climate change also may result in more regional, federal, foreign and/or global legal and regulatory requirements to reduce or mitigate the effects of greenhouse gases. In the event that such regulations are enacted and are more aggressive than the sustainability measures that we or our co-packers are already pursuing, we or our co-packers may experience significant increases in our manufacturing and distribution costs. In particular, increasing regulation of fuel emissions could substantially increase the supply chain and distribution costs associated with our
29
products. As a result, climate change or increased concern over climate change could have a material adverse effect on our business, financial condition and results of operations.
Failure by us or third-party co-packers or suppliers of raw materials to comply with food safety, environmental or other laws or regulations, or new laws or regulations, could have a material adverse effect on our business, financial condition and results of operations.
Our operations, and the operations of certain of our co-packers and other supplies, are subject to extensive regulation by the FDA, the USDA, the Federal Trade Commission (“FTC”) and various other federal, state, local and foreign authorities where our products are produced or sold. We and our co-packers are also subject to U.S. laws affecting operations outside of the United States, including anti-bribery laws, such as the Foreign Corrupt Practices Act (“FCPA”), and state laws, such as the California Safe Drinking Water and Toxic Enforcement Act of 1986 (better known as “Proposition 65”). Failure by us or any of our co-packers or other suppliers to comply with applicable laws and regulations, or allegations of compliance failure, may disrupt operations, expose us to potential fines and cause us to incur costs to ensure compliance.
Any changes in the laws and regulations to which we or our co-packers and other suppliers are subject, or any changes in how existing or future laws or regulations will be enforced, administered or interpreted, could increase the cost of developing, manufacturing and distributing our products or otherwise increase the cost of conducting our business, adversely impact how we are able to market our products, require us to change or reformulate products or expose us to additional risk of liabilities and claims. For example, if FDA or other regulations restrict us from labeling and marketing certain product attributes, such as “net carb” count or “keto,” we may be unable to effectively reach our target consumer for certain of our Birch Benders products or promote what we believe to be the key differentiating attributes for those products. Failure by us or our co-packers and other suppliers to comply with applicable laws and regulations, including future laws and regulations, could subject us to lawsuits, administrative penalties and civil remedies, including fines, injunctions, recalls or seizures, as well as potential criminal sanctions, any of which have a material adverse effect on our business, financial condition and results of operations.
Governmental and administrative bodies within the United States are considering a variety of tax, trade and other regulatory reforms, including tariffs on certain materials used in the manufacture of our products and tariffs on certain finished products. We regularly move data across state borders to conduct our operations and, consequently, are subject to a variety of laws and regulations in the United States regarding privacy, data protection and data security, including those related to the collection, storage, handling, use, disclosure, transfer and security of personal data. There is significant uncertainty with respect to compliance with such privacy and data protection laws and regulations because they are continuously evolving and developing and may be interpreted and applied differently from state to state and may create inconsistent or conflicting requirements.
We and our co-packers and other suppliers are subject to various federal, state, local and foreign environmental laws and regulations. Our primary environmental compliance obligations relate to wastewater and solid waste generated by our manufacturing operations and ammonia and Freon used in our refrigerant systems, all of which are subject to special handling requirements. In addition, as a current or former operator of real property, we may be liable for the cost to remove or remediate contamination resulting from the presence or release of hazardous substances from or on such property, whether or not we knew of or caused such contamination, and such liability may be joint and several. We also may be liable for costs of remediating contamination at off-site disposal or treatment facilities to which we arranged for the disposal or treatment of hazardous substances, without regard to whether we complied with applicable laws in doing so. Our failure to comply with environmental laws and regulations could subject us to lawsuits, administrative penalties and civil remedies. Due to regulatory complexities, uncertainties inherent in litigation and the risk of unidentified contaminants on our or any of our co-packers’ or other suppliers’ current and former properties, the potential exists for remediation, liability, indemnification and compliance costs to differ from our estimates. We cannot guarantee that our costs in relation
30
to these matters, or compliance with environmental laws in general, will not exceed our established liabilities or otherwise have a material adverse effect on our business, financial condition and results of operations.
Future litigation may lead us to incur significant costs or harm our or our brands’ reputations.
The sale of food products for human consumption involves the risk of injury to consumers. Such injuries may result from mislabeling, tampering or product contamination or spoilage, including the presence of foreign objects, undeclared allergens, substances, chemicals, other agents or residues introduced during the growing, processing, manufacturing, storage, handling or transportation phases of production. We may become party to various lawsuits and claims arising in the normal course of business, which may include lawsuits or claims relating to product labeling, product recalls and product liability as well as the marketing of our products, intellectual property, contracts, employment matters, environmental matters or other aspects of our business. For example, we have received demand letters related to product labeling and Proposition 65. Even when not merited, the defense of these lawsuits may divert our management’s attention, and we may incur significant expenses in defending these lawsuits. In addition, we may be required to pay damage awards or settlements or become subject to injunctions or other equitable remedies, and such claims or liabilities may not be covered by our insurance or by any rights of indemnity or contribution that we have against others. Although we maintain insurance, including product liability insurance and product contamination insurance, in amounts we believe to be adequate, we cannot assure you that we will not incur claims or liabilities for which we are not insured or that exceed the amount of our insurance coverage. The outcome of litigation is often difficult to predict, and the outcome of future litigation could have a material adverse effect on our business, financial condition and results of operations.
Our cost savings and efficiency initiatives may not be successful, which could have a material adverse effect on our business, financial condition and results of operations.
We are pursuing several cost-saving and efficiency initiatives, such as a trade efficiency project, category bids, supplier and co-packer negotiations, product reformulations, SKU rationalizations, increased automation and other efforts to simplify production and reduce costs. We are also working to leverage our scale as we grow our business, with products in three temperature states at retailers (refrigerated, frozen and shelf-stable), and continue to reduce the amount of products that are sold to customers through distributors and increase our direct engagement with customers through our “go-direct” initiative.
However, certain of our initiatives may lead to increased costs in other aspects of our business, such as increased research and development, conversion, outsourcing or distribution costs, or cause other disruptions to our business. We must accurately predict costs, be efficient in executing any plans to achieve cost savings and operate efficiently in the highly-competitive packaged food industry. To capitalize on our efforts, we must carefully evaluate investments in our business and execute in those areas with the most potential return on investment. If we are unable to realize the anticipated benefits from any cost-saving or efficiency initiatives or if such initiatives disrupt our business, it could have a material adverse effect on our business, financial condition and results of operations.
If we are unable to retain our key management personnel, it could have a material adverse effect on our business, financial condition and results of operations.
Our success depends to a significant degree upon the continued contributions of senior management, certain of whom would be difficult to replace. In particular, our Founder, President and Chief Executive Officer, Todd R. Lachman, is critical to our vision, strategic direction, culture, products and growth. We do not maintain key-man insurance for Mr. Lachman or any other member of our senior management team. We compete with other companies both within and outside of our industry for talented personnel, and we may lose key personnel or fail to attract, train and retain other talented personnel. Any such loss or failure could adversely affect our product sales, financial condition and operating results. The
31
departure of members of our key employees or senior management could have a material adverse effect on our business, financial condition and results of operations.
Fluctuations in our tax obligations and effective tax rate and realization of our deferred tax assets may result in volatility of our results of operations.
We are subject to income taxes in various U.S. jurisdictions. We record tax expense based on our estimates of future payments, which may in the future include reserves for uncertain tax positions in multiple tax jurisdictions, and valuation allowances related to certain net deferred tax assets. At any one time, many tax years may be subject to audit by various taxing jurisdictions. The results of these audits and negotiations with taxing authorities may affect the ultimate settlement of these issues. We expect that throughout the year there could be ongoing variability in our quarterly tax rates as events occur and exposures are evaluated.
In addition, our effective tax rate in a given financial reporting period may be materially impacted by a variety of factors including, but not limited to, changes in the mix and level of earnings, varying tax rates in the different jurisdictions in which we operate, fluctuations in nondeductible items or by changes to existing accounting rules or regulations. Further, tax legislation may be enacted in the future, including current proposals in Congress to increase corporate taxes. New or revised tax legislation could negatively impact our current or future tax structure and effective tax rates.
A change in the assumptions used to value our goodwill or our intangible assets, or the impairment of our goodwill or our intangible assets, could have a material adverse effect on our business, financial condition and results of operations.
Our total assets include substantial goodwill and intangible assets, such as tradenames and trademarks. Goodwill and indefinite-lived intangible assets are tested for impairment annually and when indicators of impairment exist. The annual goodwill and indefinite-lived intangible impairment test involves a qualitative evaluation and a quantitative test. The qualitative assessment evaluates factors including macro-economic conditions, industry- and company-specific factors and historical company performance in assessing fair value. If it is determined that it is more likely than not that the fair value of the reporting unit or indefinite-lived asset is less than the carrying value, a quantitative test is then performed. Otherwise, no further testing is required. When using a quantitative approach to assess goodwill for impairment, we compare the fair value of the reporting unit to the carrying amount, including goodwill. For indefinite-lived intangible assets, impairment is assessed by comparing the fair value of the asset with its carrying value. In addition, we evaluate definite-lived intangible assets for impairment whenever events or changes in circumstances indicate that the carrying amount of the assets may not be recoverable. If the estimated fair value of the reporting unit or indefinite-lived asset is less than its carrying amount, impairment is indicated, requiring recognition of an impairment charge for the differential. Determining the fair value of a reporting unit or indefinite-lived asset is judgmental in nature and involves the use of significant estimates and assumptions. Factors, such as future adverse changes in market conditions or poor operating results of these underlying assets, could result in losses or an inability to recover the carrying value of the asset that may not be reflected in the asset’s current carrying value, thereby requiring impairment charges in the future. We completed our annual impairment test for fiscal 2021 and 2020 with no adjustments to the carrying values of goodwill and intangible assets. However, we recorded an impairment loss to Michael Angelo’s goodwill of approximately $14.4 million and an impairment loss to the Michael Angelo’s trade name, a definite-lived intangible asset, of approximately $2.8 million for our fiscal year ended December 28, 2019. If operating results for any of our other brands, including brands that we have recently acquired or may acquire in the future, deteriorate or fail to meet our projections or expectations, we may be required to record additional non-cash impairment charges to certain intangible assets. In addition, any significant decline in our market capitalization, even if due to macroeconomic factors that could be affected by the COVID-19 pandemic or otherwise, could put pressure on the carrying value of our goodwill. A determination that all or a portion of our goodwill or intangible assets are impaired, although such determination would result in a non-cash charge to operations, could have a material adverse effect on our business, financial condition and results of operations.
If we do not maintain effective internal controls over financial reporting, we may not be able to accurately and timely report our financial results, which could have a material adverse effect on our business, financial condition and results
32
of operations, and investors may lose confidence in the accuracy and completeness of our financial reports and the price of our common stock may decline.
Our management is responsible for establishing and maintaining adequate internal control over financial reporting and for evaluating and reporting on the effectiveness of our system of internal control. Our internal control over financial reporting is a process designed to provide reasonable assurance regarding the reliability of financial reporting and the preparation of financial statements for external reporting purposes in accordance with generally accepted accounting principles (“GAAP”). As a public company, we are required to comply with the Sarbanes-Oxley Act of 2002, as amended (the “Sarbanes-Oxley Act”) and other rules that govern public companies. In particular, we are required to certify our compliance with Sections 302, 404 and 906 of the Sarbanes-Oxley Act, which requires us to furnish annually a report by management on the effectiveness of our internal control over financial reporting. In addition, our independent registered public accounting firm is required to report on the effectiveness of our internal control over financial reporting in the future to the extent that we are no longer an emerging growth company.
If we are unable to successfully remediate any future material weaknesses or other deficiencies in our internal control over financial reporting, the accuracy and timing of our financial reporting may be adversely affected; our liquidity, our access to capital markets, the perceptions of our creditworthiness and our ability to complete acquisitions may be adversely affected; we may be unable to maintain compliance with applicable securities laws, the NASDAQ listing requirements and the covenants under our debt agreement regarding the timely filing of periodic reports; we may be subject to regulatory investigations and penalties; investors may lose confidence in our financial reporting; we may suffer defaults, accelerations or cross-accelerations under our debt agreement to the extent we are unable to obtain waivers from the required creditors or counterparties or are unable to cure any breaches; and our stock price may decline.
We have related party transactions which present possible conflicts of interest.
We have engaged in related party transactions with our directors or related entities. For example, the Bellvue, Colorado facility where we manufacture all of our noosa spoonable yogurts is owned indirectly by Robert L. Graves, our Vice President, Strategic Initiatives and a member of our Board, and leased pursuant to a facilities lease agreement and a ground lease agreement that each expire on December 31, 2027 and contain options for extension for a total of 15 additional two-year extensions. In addition, the close proximity of our employees to the employees of Mr. Graves’ manufacturing facility and the interrelatedness of our operations with the operations of Mr. Graves’ manufacturing facility could expose us to risks or influence our business decisions. In all related party transactions, there is a risk that a related party’s influence may be such that the transaction terms could be viewed as favorable to that related party, even if we strive to ensure that the terms of the transaction are arms-length. The appearance of conflicts of interest created by related party transactions could impair the confidence of our investors.
Failure by us, or the third-party partners on which we rely, to maintain good employee relations could have a material adverse effect on our business, financial condition and results of operations.
We have approximately 608 employees. Although none of our employees are currently covered under collective bargaining agreements, our employees may elect to be represented by labor unions in the future. If a significant number of our employees were to become unionized and collective bargaining agreement terms were significantly different from our current compensation arrangements, it could have a material adverse effect on our business, financial condition and results of operations. In addition, a labor dispute involving some or all our employees could harm our reputation, disrupt our operations and reduce our revenues, and resolution of disputes could increase our costs. Further, we rely on third parties whose employees may be, or may elect to be, represented by labor unions, and such disruptions in their operations could in turn have a material adverse effect on our business, financial condition and results of operations. Although we have not experienced any material labor shortage to date, we have recently observed an overall tightening and increasingly competitive labor market. A sustained labor shortage or increased turnover rates among our employee base or the employee base of the third parties on which we rely, caused by COVID-19 or as a result of general macroeconomic factors, could lead to increased costs, such as increased overtime to meet demand and increased wage rates to attract and retain employees, and could negatively affect our business, financial condition and results of operations. Failure to maintain good
33
relations with our employees, or the failure of third parties on which we rely to maintain good relations with their employees, could have a material adverse effect on our business, financial condition and results of operations.
Risks Related to Distribution and Manufacturing
We are dependent on third-party distributors.
Third-party distributors purchase our products directly for their own account for resale, and we rely on sales made by or through these third-party distributors to customers. For instance, one of our largest customers, UNFI is also a distributor of our products. The loss of, or business disruption at, one or more of these distributors could have a material adverse effect on our business, financial condition and results of operations. Although we are striving to decrease our reliance on distributors for sales to certain customers as part of our “go-direct” cost-savings initiative, we may not be successful in this initiative, and this initiative may disrupt our relationships with our distributors who we rely on for the portion of our business that is conducted through distributors. If we are required to obtain additional or alternative distribution agreements or arrangements in the future, we cannot be certain that we will be able to do so on satisfactory terms or in a timely manner. Our inability to enter into satisfactory distribution agreements could inhibit our ability to implement our business plan or impact our ability to maintain or successfully expand the distribution of our products, which could have a material adverse effect on our business, financial condition and results of operations.
We rely on third-party co-packers for a significant portion of our manufacturing needs, including one co-packer for the substantial majority of our Rao’s Homemade sauce products. If our co-packers do not accept or fulfill purchase orders from us or we are unable to enter into additional or future co-packing agreements, it could have a material adverse effect on our business, financial condition and results of operations.
We rely upon co-packers for a significant portion of our manufacturing needs. Our success depends, in part, on maintaining a strong sourcing and manufacturing platform. We believe that there are a limited number of high-quality, fiscally stable co-packers in the industry with the equipment and operational capabilities required to make our products, and many of our co-packing agreements do not include purchase or supply minimums. If we were required to obtain additional or alternative co-packing agreements or arrangements in the future, or if co-packers experience capacity issues or disruptions (whether as a result of the COVID-19 pandemic or otherwise), production of our products may be delayed or postponed and/or the availability of some of our products may be reduced or delayed. To meet certain service level minimums for our customers and avoid financial penalties that could result from a failure to meet such minimums under our agreements with customers, we may incur additional expenses, including paying a premium for faster, more expensive transportation methods or agreeing to production premiums with our co-packers.
In addition, we rely on La Regina, a third-party co-packer, for the substantial majority of our Rao’s Homemade sauce products. La Regina currently produces our Rao’s Homemade sauce products in Italy. Any disruption to La Regina’s production or delivery of our Rao’s Homemade sauce products, whether due to the political environment in Italy, global geopolitical tensions (including related to Ukraine), COVID-19 pandemic related government restrictions, agricultural disasters or pestilence in Italy, issues with production, events affecting ports in Italy or the United States or otherwise, could have a material adverse effect on our business, financial condition and results of operations. To facilitate La Regina’s establishment of a U.S. production location in Alma, Georgia, we have agreed to provide La Regina with exclusivity for the third-party production of certain of our products once this facility is qualified to begin production. However, because the Alma, Georgia production location will use tomatoes from Italy for the production of our Rao’s Homemade and Rao’s Homestyle sauce products, production in Georgia may still be impacted by events affecting La Regina in Italy. We have, from time to time, paid La Regina for our products more quickly than required under our contract and we may make similar or other concessions in the future. La Regina is also our landlord for a distribution center that we plan to open in Alma, Georgia. La Regina does not currently have manufacturing operations in the United States and may encounter unexpected challenges in opening and operating a production location in Alma, Georgia. Business disruptions related to the COVID-19 pandemic, such as availability of necessary equipment, travel restrictions or employee recruiting challenges, could impact the commencement of manufacturing in Alma, Georgia and the opening of our planned distribution center. Some of these business disruptions have already impacted the expected commencement of manufacturing in Alma, Georgia. In
34
the event of a breach by La Regina, we have a right to purchase the facility in Alma, Georgia at cost, including the underlying real property, fixtures and equipment; however, we may encounter difficulties or delays with the exercise of the right to purchase or with assuming the operations at the Alma, Georgia facility. If our relationship with La Regina deteriorates, or if La Regina experiences financial, operational or other issues, we would be required to make alternative arrangements to produce Rao’s Homemade sauce products, such as assuming manufacturing operations on our own, developing our own internal manufacturing capabilities or finding one or more alternative co-packing arrangements, which may be costly or time-consuming to complete. If such an event were to occur, and we were unable to find alternative arrangements in a timely manner or on satisfactory terms, it could have a material adverse effect on our business, financial condition and results of operations.
A significant portion of our products are sourced from a single manufacturing site, which means disruption in, or capacity constraints affecting, our or our co-packers’ operations for any number of reasons could have a material adverse effect on our business, financial condition and results of operations.
Our products are manufactured at several different manufacturing facilities, including our two manufacturing facilities and manufacturing facilities operated by our co-packers, but in most cases, individual products are produced only at a single location. We produce all noosa spoonable yogurts at our Bellvue, Colorado manufacturing facility and all Rao’s Made for Home and Michael Angelo’s frozen products at our Austin, Texas manufacturing facility. We may leverage a co-packer from time to time to supplement our in-house production of select Michael Angelo’s products. The substantial majority of our Rao’s Homemade sauce products are produced at a single La Regina facility in Italy, the majority of our Rao’s Made for Home soup products are produced at a single location in Canada, the majority of our Birch Benders frozen waffles are produced at a single location in Belgium and our noosa smoothies are co-packed at a single facility in Flemington, New Jersey. If any of these manufacturing locations experiences a disruption for any reason, including but not limited to work stoppages, governmental actions, disease outbreaks or pandemics, acts of war, terrorism, power failure or weather-related condition or natural disaster, including fire, earthquake, extreme temperatures, volcanic eruption or flooding, or issues associated with efforts to increase manufacturing capacity or improve manufacturing efficiency, this could result in a significant reduction or elimination of the availability of some of our products. If we were not able to obtain alternate production capability in a timely manner or on satisfactory terms, this disruption could have a material adverse effect on our business, financial condition and results of operations.
We rely on third-party warehouse and transportation providers in the distribution of our products.
Our success depends, in part, on dependable and cost-effective storage and transportation systems and a strong distribution network. We utilize third-party warehouse and transportation providers for these services, and the costs of these services could increase due to factors outside of our control. For example, factors associated with the COVID-19 pandemic and other factors have resulted in increased demand for transportation and increased transportation costs. Further, during fiscal 2021, international shipping to the United States was disrupted and delayed due to congestion in international ports. Third-party warehouse and transportation providers are also subject to numerous cost pressures, including costs associated with fuel, labor and inflation, and may seek to pass these increased costs on to us. Global geopolitical tensions, including relating to Ukraine, have impacted oil prices and consequently our and our third-party providers’ transportation and logistics costs. We expect these cost increases, which may become more acute, to continue to impact our business.
In addition, a disruption in storage or transportation services could be caused by a number of factors, including labor issues; port and shipping capacity; failure to meet customer standards; acts of war; terrorism; fire, earthquakes, extreme temperatures, volcanic eruption, flooding or other natural disasters; or bankruptcy or other financial issues affecting the third-party providers of such services, and could result in an inability to supply materials to our or our co-packers’ facilities or finished products to our distribution centers or customers. Alternatives may not be available on short notice or could
35
result in higher transportation costs. Any disruption in the distribution chain of our products or an increase in the cost of these services could have a material adverse effect on our business, financial condition and results of operations.
Risks Related to Information Technology and Intellectual Property
We are increasingly dependent on information technology; disruptions, failures or security breaches of our information technology infrastructure or failure to comply with privacy laws could have a material adverse effect on our business, financial condition and results of operations.
Information technology is critically important to our business operations. We rely on information technology networks and systems, including the internet, to process, transmit and store electronic and financial information, manage a variety of business processes and activities (including our manufacturing, financial, logistics, sales, marketing and administrative functions), communicate internally and externally with customers, suppliers, carriers and others and comply with regulatory, legal and tax requirements. We also use mobile devices, social networking and other online activities to connect with our employees, suppliers, customers and consumers, and we have become more reliant on mobile devices, remote communication and other technologies during the COVID-19 pandemic. These information technology systems, many of which are managed by third parties or used in connection with shared service centers, may be susceptible to damage, disruptions or shutdowns due to factors outside of our control, including failures during the process of upgrading or replacing software, databases or components thereof, maintenance or security issues or errors, issues with migration of applications to the “cloud,” power outages, hardware or software failures, cyberattacks and other cyber incidents, telecommunication failures, denial of service, user errors, natural disasters, terrorist attacks or other catastrophic events.
Cyberattacks and other cyber incidents are occurring more frequently in the United States, constantly evolving in nature, becoming more sophisticated and being made by various groups and individuals with a wide range of expertise and motives. Cyberattacks may increase as a result of Russian tensions with the West. The decentralized nature of our operations and our increased reliance on our information technology systems due to many employees working remotely during, and potentially following, the COVID-19 pandemic could increase our vulnerability to cyberattacks and other cyber incidents. We may incur significant costs in protecting against or remediating cyberattacks or other cyber incidents.
In addition, if our suppliers or customers experience a breach or system failure, their businesses could be disrupted or otherwise negatively affected, which could in turn result in a disruption in our supply chain or reduced customer orders. If our information technology networks and systems suffer severe damage, disruption or shutdown, and our disaster recovery and business continuity plans, or those of our third-party providers, suppliers or customers, do not effectively respond to or resolve the issues in a timely manner, it could have a material adverse effect on our business, financial condition and results of operations.
Further, if we are unable to prevent physical and electronic break-ins, cyberattacks and other information security breaches, we may suffer financial and reputational damage, be subject to litigation or incur remediation costs or penalties as a result of unauthorized disclosure of confidential information belonging to us or to our partners, customers, suppliers, employees or consumers. The mishandling or inappropriate disclosure of non-public sensitive or protected information could lead to the loss of intellectual property, negatively impact planned corporate transactions or damage our reputation and brand image. Misuse, leakage or falsification of legally protected information could also result in a violation of data privacy laws and regulations and have a material adverse effect on our business, financial condition and results of operations.
Our intellectual property rights are valuable. Failure to protect, or litigation involving, our tradenames or trademarks and other rights could have a material adverse effect on our business, financial condition and results of operations.
Our intellectual property rights, including our trademarks, are a significant and valuable aspect of our business. We attempt to protect our intellectual property rights by pursuing remedies available to us under intellectual property laws, entering into third-party nondisclosure and assignment agreements and policing third-party misuses of our intellectual property. If we fail to adequately protect the intellectual property rights that we have now or may acquire in the future, or
36
if there is any change in law or otherwise that serves to reduce or remove the current legal protections of our intellectual property rights, it could have a material adverse effect on our business, financial condition and results of operations. Further, although we own rights to “Rao’s” trademarks for our packaged food products, a third party owns rights to “Rao’s” trademarks for restaurant services and bar services. We have a co-existence agreement with this third party.
There is also a risk that other parties may have or claim to have intellectual property rights covering some of our brands, products or technology. If any third parties bring a claim of intellectual property infringement against us, we may be subject to costly and time-consuming litigation which could divert the attention of management and our employees. If we are unsuccessful in defending against such claims, we may be subject to, among other things, significant damages and injunctions against development and sale of certain products, we may be unable to utilize certain of our brand or product names or we may be required to enter into costly licensing agreements, any of which could have a material adverse effect on our business, financial condition and results of operations.
A third party owns the “Rao’s” trademarks for use in connection with restaurant and bar services. Disputes regarding our co-existence agreement with this third party or negative publicity relating to the Rao’s restaurants could have a material adverse effect on our business, financial condition and results of operations.
We are party to a worldwide co-existence agreement relating to our and an unrelated third-party’s respective rights to use and register trademarks containing the term “Rao’s.” As between the parties, we own the right to use and register “Rao’s” trademarks for packaged food products, while the third party owns the right to use and register “Rao’s” trademarks for restaurant services and bar services. We believe that the “Rao’s” trademarks have significant value and are instrumental in our ability to market and sustain demand for our Rao’s product offerings. Any disputes concerning this co-existence agreement may cause us to incur significant litigation costs. In addition, any negative publicity, social media or other information relating to the restaurants bearing the “Rao’s” trademark, or their owners or employees, could harm consumer perceptions of our Rao’s sauces and other products. Any such disputes or negative information could have a material adverse effect on our business, financial condition and results of operations.
Risks Related to Our Indebtedness
Any default under our debt agreement could have significant consequences.
In June 2021, Sovos Brands Intermediate Inc., a wholly-owned subsidiary of the Company (the “Borrower”), entered into a first lien credit agreement (as amended, the “First Lien Credit Agreement”) among the Borrower, Sovos Brands Holdings, Inc., a wholly-owned subsidiary of the Company, Credit Suisse, as administrative agent and collateral agent (the “Administrative Agent”), and the lenders and issuing banks from time to time party thereto (the “First Lien Lenders”). The First Lien Credit Agreement contains covenants imposing certain restrictions on our business. These restrictions may affect our ability to operate our business and may limit our ability to take advantage of potential business opportunities as they arise. Our First Lien Credit Agreement contains restrictive covenants including, with specified exceptions, limitations on our ability to incur debt and liens; make certain investments, acquisitions and loans; pay dividends or make other distributions; make payments on subordinated debt; enter into burdensome agreements or affiliate transactions; consolidate, merge or dissolve; acquire or dispose of assets not in the ordinary course; materially alter our business; and modify our fiscal year-end. The First Lien Credit Agreement also contains a springing financial covenant that, if outstanding revolving loans (excluding any undrawn letters of credit) minus unrestricted cash exceed 35% of the aggregate revolving credit commitments, requires us to maintain, on a consolidated basis, a maximum ratio of consolidated first lien net debt to consolidated EBITDA (with certain adjustments as set forth in the First Lien Credit Agreement) of 6.95:1.00, tested as of the last day of any fiscal quarter on which such 35% threshold is exceeded. Events beyond our control, including changes in general economic and business conditions, may affect our ability to satisfy the financial covenant. We cannot assure you that we will satisfy the financial covenant in the future, or that our lenders will waive any failure to satisfy the financial covenant.
Our ability to comply with these covenants under the First Lien Credit Agreement may be affected by events beyond our control, including prevailing economic, financial and industry conditions. The breach of any of these covenants could
37
result in an event of default, which would permit the administrative agent or the specified threshold of lenders under the facility to declare all outstanding debt to be due and payable, together with accrued and unpaid interest. Further, the First Lien Credit Agreement contains cross-default provisions with respect to indebtedness in excess of a specified threshold amount, which may result in an event of default or acceleration of borrowings under the First Lien Credit Agreement if such provisions are triggered. Our obligations under the First Lien Credit Agreement are secured by a first priority lien on substantially all of our assets, subject to agreed upon exceptions. Any default by us under the First Lien Credit Agreement could have a material adverse effect on our business, financial condition and results of operations.
We may be adversely impacted by the discontinuation of the London Interbank Offered Rate (“LIBOR”).
Our First Lien Credit Agreement uses LIBOR as a reference rate. The financial authority that regulates LIBOR has announced that it intends to stop compelling banks to submit rates for the calculation of LIBOR after 2023. The U.S. Federal Reserve, in conjunction with the Alternative Reference Rates Committee, a steering committee comprised of large U.S. financial institutions, has identified the Secured Overnight Financing Rate (“SOFR”) as its preferred alternative rate. SOFR is calculated by short-term repurchase agreements, backed by Treasury securities. The transition from LIBOR may cause us to incur increased costs and additional risk. In connection with the LIBOR discontinuation, some or all of the loans under our First Lien Credit Agreement may use alternate base rate as a reference rate. When LIBOR is discontinued, interest rates will generally be based on an alternative variable rate as determined between the Administrative Agent (as defined herein) and the Borrower (as defined herein). The alternative variable rate could be higher and more volatile than LIBOR prior to its discontinuance. At this time, it is impossible to predict the effect of any such alternatives on our liquidity, our interest expense or the value of the loans under our First Lien Credit Agreement.
Our level of indebtedness could have a material adverse effect on our business, financial condition and results of operations.
The total principal amount of debt outstanding under our First Lien Credit Agreement, excluding unamortized debt issuance costs, as of December 25, 2021 was $480.8 million. Our indebtedness could have significant effects on our business, such as:
| ● | limiting our ability to borrow additional amounts to fund acquisitions, debt service requirements, execution of our growth strategy, capital expenditures and other purposes; |
| ● | limiting our ability to make investments, including acquisitions, loans and advances, and to sell, transfer or otherwise dispose of assets; |
| ● | requiring us to dedicate a substantial portion of our cash flow from operations to pay principal and interest on our borrowings, which would reduce availability of our cash flow to fund working capital, acquisitions, execution of our growth strategy, capital expenditures and other general corporate purposes; |
| ● | making us more vulnerable to adverse changes in general economic, industry and competitive conditions, in government regulation and in our business by limiting our ability to plan for and react to changing conditions; |
| ● | placing us at a competitive disadvantage compared with our competitors that have less debt; and |
| ● | exposing us to risks inherent in interest rate fluctuations because our borrowings are at variable rates of interest, which could result in higher interest expense in the event of increases in interest rates. |
In addition, we may not be able to generate sufficient cash flow from our operations to repay our indebtedness when it becomes due and to meet our other cash needs. If we are not able to pay our borrowings as they become due, we will be required to pursue one or more alternative strategies, such as selling assets, refinancing or restructuring our indebtedness or selling additional debt or equity securities. We may not be able to refinance our debt or sell additional debt or equity securities or our assets on favorable terms, if at all, and if we must sell our assets, it could have a material adverse effect on our business, financial condition and results of operation.
38
The failure to comply with the covenants under our First Lien Credit Agreement or volatility in the credit and capital markets could have a material adverse effect on our business, financial condition and results of operation.
Our ability to manage our debt is dependent on our level of positive cash flow from the sale of our products. An economic downturn may negatively impact our cash flows. Credit and capital markets can be volatile, which could make it more difficult for us to refinance our existing debt or to obtain additional debt or equity financings in the future. Such constraints could increase our costs of borrowing and could restrict our access to other potential sources of future liquidity. Future volatility or disruption in the credit and capital markets could require us to take measures to conserve cash until the markets stabilize or until alternative credit arrangements or other funding for our business needs can be arranged. Our failure to comply with the covenants under our First Lien Credit Agreement or to have sufficient liquidity to make interest and other payments required by our debt could result in a default of such debt and acceleration of our borrowings, which could have a material adverse effect on our business, financial condition and results of operations.
Other Risks Related to Ownership of Our Common Stock
Future offerings of debt or equity securities by us may have a material adverse effect on the market price of our common stock.
In the future, we may attempt to obtain financing or to further increase our capital resources by issuing additional shares of our common stock or by offering debt or other equity securities, including senior or subordinated notes, debt securities convertible into equity or shares of preferred stock.
Any future debt financing could involve restrictive covenants relating to our capital-raising activities and other financial and operational matters, which might make it more difficult for us to obtain additional capital and to pursue business opportunities, including potential acquisitions. Moreover, if we issue debt securities, the debt holders would have rights to make claims on our assets senior to the rights of our holders of our common stock. The issuance of additional shares of our common stock or other equity securities or securities convertible into equity may dilute the economic and voting rights of our existing stockholders or reduce the market price of our common stock or both. Debt securities convertible into equity could be subject to adjustments in the conversion ratio pursuant to which certain events may increase the number of equity securities issuable upon conversion. Preferred shares, if issued, could have a preference with respect to liquidating distributions or a preference with respect to dividend payments that could limit our ability to pay dividends to the holders of our common stock. Our decision to issue securities in any future offering will depend on market conditions and other factors beyond our control, which may have a material adverse effect on the amount, timing, or nature of our future offerings. Thus, holders of our common stock bear the risk that our future offerings may reduce the market price of our common stock and dilute their stockholdings in us.
If the ownership of our common stock continues to be highly concentrated, it may prevent you and other minority stockholders from influencing significant corporate decisions and may result in conflicts of interest.
As of December 25, 2021, Advent indirectly beneficially owns approximately 63% of our outstanding common stock. As a result, Advent indirectly beneficially owns shares sufficient for majority votes over all matters requiring stockholder votes, including the election of directors; mergers, consolidations and acquisitions; the sale of all or substantially all of our assets and other decisions affecting our capital structure; amendments to our certificate of incorporation or our bylaws; and our winding up and dissolution.
This concentration of ownership may delay, deter or prevent acts that would be favored by our other stockholders. The interests of Advent may not always coincide with our interests or the interests of our other stockholders. This concentration of ownership may also have the effect of delaying, preventing or deterring a change in control of us. Also, Advent may seek to cause us to take courses of action that, in its judgment, could enhance its investment in us, but which might involve risks to our other stockholders or adversely affect us or our other stockholders. As a result, the market price of our common stock could decline or stockholders might not receive a premium over the then-current market price of our common stock upon a change in control. In addition, this concentration of share ownership may adversely affect the trading
39
price of our common stock because investors may perceive disadvantages in owning shares in a company with significant stockholders.
As a controlled company, we are not subject to all of the corporate governance rules of NASDAQ.
We are currently considered a “controlled company” under the rules of NASDAQ. Controlled companies are exempt from the NASDAQ corporate governance rules requiring that listed companies have (i) a majority of their board of directors consist of “independent” directors under the listing standards of NASDAQ, (ii) a nominating/ corporate governance committee composed entirely of independent directors and a written nominating/ corporate governance committee charter meeting the NASDAQ requirements and (iii) a compensation committee composed entirely of independent directors and a written compensation committee charter meeting the requirements of NASDAQ. Although we are eligible to use some or all these exemptions, our Board is comprised of a majority of independent directors, our nominating and corporate governance committee and compensation committee consist entirely of independent directors and such committees will conduct annual performance evaluations. However, if we are to use some or all of these exemptions in the future, you may not have the same protections afforded to stockholders of companies that are subject to all of the corporate governance requirements of NASDAQ.
We do not anticipate paying any dividends on our common stock in the foreseeable future.
We do not have an established dividend policy, and we currently do not intend to pay any dividends on our common stock, and our First Lien Credit Agreement limits our ability to pay dividends on our common stock. We may also enter into other credit agreements or other borrowing arrangements in the future that restrict or limit our ability to pay dividends on our common stock. As a result, you may not receive any return on an investment in our common stock unless you sell our common stock for a price greater than that which you paid for it.
Our quarterly results of operations may fluctuate significantly and could fall below the expectations of securities analysts and investors due to seasonality and other factors, some of which are beyond our control, resulting in a decline in our stock price.
Our quarterly results of operations may fluctuate due to seasonal or other factors, including the timing of pricing actions, cost savings initiatives and inflation. Accordingly, results for any one quarter are not necessarily indicative of results to be expected for any other quarter or for any year. In addition, if we increase our marketing or promotional activity in certain periods, the seasonality of our business may be amplified. In the future, results of operations may fall below the expectations of securities analysts and investors. In that event, the price of our common stock could be adversely impacted.
If securities or industry analysts do not publish research or publish inaccurate or unfavorable research about our business, our stock price and trading volume could decline.
The trading market for our common stock will be influenced by the research and reports that industry or securities analysts publish about us or our business. If one or more of these analysts ceases coverage of our company or fails to publish reports on us regularly, we could lose visibility in the financial markets, which in turn could cause our stock price or trading volume to decline. Moreover, if our results of operations do not meet the expectations of the investor community, or one or more of the analysts who cover our company downgrade our stock, our stock price could decline.
The market price and trading volume of our common stock may be volatile, which could result in rapid and substantial losses for our stockholders, and you may lose all or part of your investment.
Shares of our common stock have experienced and may continue to experience significant volatility on NASDAQ. An active, liquid and orderly market for our common stock may not be sustained, which could depress the trading price of our common stock or cause it to be highly volatile or subject to wide fluctuations. The market price of our common stock may fluctuate or may decline significantly in the future and you could lose all or part of your investment. Some of the
40
factors that could negatively affect our share price or result in fluctuations in the price or trading volume of our common stock include:
| ● | variations in our quarterly or annual results of operations; |
| ● | changes in our earnings estimates (if provided) or differences between our actual results of operations and those expected by investors and analysts; |
| ● | the contents of published research reports about us or our industry or the failure of securities analysts to cover our common stock; |
| ● | additions or departures of key management personnel; |
| ● | any increased indebtedness we may incur in the future; |
| ● | announcements by us or others and developments affecting us; |
| ● | actions by institutional stockholders; |
| ● | litigation and governmental investigations; |
| ● | legislative or regulatory changes; |
| ● | judicial pronouncements interpreting laws and regulations; |
| ● | changes in government programs; |
| ● | changes in market valuations of similar companies; |
| ● | speculation or reports by the press or investment community with respect to us or our industry in general; |
| ● | announcements by us or our competitors of significant contracts, acquisitions, dispositions, strategic relationships, joint ventures or capital commitments; and |
| ● | general market, political and economic conditions, including local conditions in the markets in which we operate, as well as global geopolitical tensions. |
These broad market and industry factors may decrease the market price of our common stock, regardless of our actual financial performance. The stock market in general has from time to time experienced extreme price and volume fluctuations, including recently. In addition, in the past, following periods of volatility in the overall market and decreases in the market price of a company’s securities, securities class action litigation has often been instituted against these companies. This litigation, if instituted against us, could result in substantial costs and a diversion of our management’s attention and resources, which could have a material adverse effect on our business, financial condition and results of operations.
The market price of our common stock could be negatively affected by sales of substantial amounts of our common stock in the public markets.
As of December 25, 2021, we have 100,892,547 shares of common stock outstanding. Of our issued and outstanding shares, all 26,834,100 shares of common stock sold in our initial public offering are freely transferable, except for any shares purchased by our “affiliates,” as that term is defined in Rule 144 under the Securities Act of 1933, as amended (the “Securities Act”), and any shares purchased by our directors, officers or vice presidents in our reserved share program in connection with our IPO. As of December 25, 2021, approximately 63% of our outstanding common stock is indirectly beneficially owned by Advent, and can be resold into the public markets in the future in accordance with the requirements of the Securities Act.
We and our officers, directors and holders of substantially all of our outstanding capital stock and other securities have agreed, subject to specified exceptions, not to directly or indirectly:
| ● | offer, pledge, sell, contract to sell, sell any option or contract to purchase, purchase any option or contract to sell, grant any option, right or warrant to purchase, lend, or otherwise transfer or dispose of any shares of our common stock or any securities convertible into or exercisable or exchangeable for any shares of our common stock; |
| ● | enter into any swap or other agreement or transaction that transfers, in whole or in part, any of the economic consequences of ownership of any shares of common stock or any such other securities; or |
| ● | publicly disclose an intention to do any of the foregoing |
41
for a period of 180 days after September 22, 2021 without the prior written consent of the representatives of the underwriters in our IPO.
This restriction terminates after the close of trading of the common stock on and including the 180th day after September 22, 2021, which is March 21, 2022. The representatives of the underwriters may, in their sole discretion and at any time or from time to time before the termination of the 180-day period, release all or any portion of the securities subject to lock-up agreements.
The market price of our common stock may decline significantly when the restrictions on resale by our existing stockholders lapse. Sales of substantial amounts of our common stock in the public, or the possibility that such sales may occur, may cause the market price of our common stock to decrease. A decline in the price of our common stock might impede our ability to raise capital through the issuance of additional common stock or other equity securities.
The future issuance of additional common stock in connection with any equity plans, acquisitions or otherwise will dilute all other stockholdings.
As of December 25, 2021, we have an aggregate of 389,359,876 shares of common stock authorized but unissued and not reserved for issuance under our equity incentive plan. We may issue all these shares of common stock without any action or approval by our stockholders, subject to certain exceptions. The issuance of any common stock in connection with any equity incentive plan or otherwise would dilute the percentage ownership held by current investors.
Risks Related to Our Company and Organizational Structure
The interests of Advent may conflict with our interests or the interests of the holders of our common stock in the future.
Advent engages in a range of investing activities, including investments in consumer products companies and other consumer-related companies in particular. In the ordinary course of its business activities, Advent may engage in activities where its interests conflict with our interests or those of our stockholders. Our amended and restated certificate of incorporation contains provisions renouncing any interest or expectancy held by our directors affiliated with Advent in certain corporate opportunities. Accordingly, the interests of Advent may supersede ours, causing them or their affiliates to compete against us or to pursue opportunities instead of us, for which we have no recourse. Such actions on the part of Advent and inaction on our part could have a material adverse effect on our business, financial condition and results of operations. In addition, Advent may have an interest in pursuing acquisitions, divestitures and other transactions that, in its judgment, could enhance its investment in us, even though such transactions might involve risks to you, such as debt-financed acquisitions.
With certain exceptions, Advent and its affiliates, including certain of our directors who are affiliated with Advent, will not have any obligation to present business opportunities to us and may compete with us.
Our amended and restated certificate of incorporation provides that Advent and its affiliates, including certain of our directors who are affiliated with Advent, do not have any obligation to offer us an opportunity to participate in business opportunities presented to them even if the opportunity is one that we might reasonably have pursued (and therefore may be free to compete with us in the same business or similar businesses) and that, to the extent permitted by law, such directors, Advent and its affiliates, will not be liable to us or our stockholders for breach of any duty by reason of any such activities.
As a result, Advent and its affiliates, including certain of our directors who are affiliated with Advent, will not be prohibited from investing in competing businesses or doing business with our customers. Therefore, we may be in competition with Advent or certain of our directors or their respective affiliates, and we may not have knowledge of, or be able to pursue, transactions that could potentially be beneficial to us. Accordingly, we may lose certain corporate opportunities or suffer competitive harm, which could have a material adverse effect on our business, financial condition and results of operations.
42
We are a holding company with no operations and rely on our operating subsidiaries to provide us with funds necessary to meet our financial obligations and to pay dividends, if any.
We are a holding company with no material direct operations. Our principal assets are the equity interests we hold in our operating subsidiaries which own our operating assets. As a result, we are dependent on loans, dividends and other payments from our operating subsidiaries to generate the funds necessary to meet our financial obligations and to pay dividends, if any, on our common stock. Our subsidiaries are legally distinct from us and may be prohibited or restricted from paying dividends, including by the restrictions contained in our First Lien Credit Agreement, or otherwise making funds available to us under certain conditions. Although we do not expect to pay dividends on our common stock for the foreseeable future, if we are unable to obtain funds from our subsidiaries, we may be unable to pay dividends.
As a public company, we have incurred and will continue to incur significant costs to comply with the laws and regulations affecting public companies, which could harm our business and results of operations.
As a public company, we are subject to the reporting requirements of the Exchange Act, the Sarbanes-Oxley Act, and the listing requirements of NASDAQ, and other applicable securities rules and regulations. These rules and regulations have increased and will continue to increase our legal, accounting and financial compliance costs and have made and will continue to make some activities more time-consuming and costly, particularly after we cease to be an emerging growth company as defined in Section 2(a) of the Securities Act, as modified by the JOBS Act (as defined herein). For example, these rules and regulations could make it more difficult and more costly for us to obtain director and officer liability insurance, and we may be required to accept reduced policy limits and coverage or to incur substantial costs to maintain the same or similar coverage. These rules and regulations could also make it more difficult for us to attract and retain qualified persons to serve on our Board or our board committees or as executive officers. Our management and other personnel will devote a substantial amount of time to these compliance initiatives. As a result, management’s attention may be diverted from other business concerns, which could harm our business, financial condition and results of operations. We have hired for our current status and may incur additional costs in the future to comply with these requirements, which will increase our costs and expenses.
Our management team and other personnel devote a substantial amount of time to new compliance initiatives, and we may not successfully or efficiently manage our efforts to comply with the requirements of being a public company. To comply with the requirements of being a public company, including the Sarbanes-Oxley Act, we have undertaken and will continue to undertake various actions, such as implementing new internal controls and procedures and hiring accounting or internal audit staff or outsourcing certain functions to third parties, which could have a material adverse effect on our business, financial condition and results of operations.
Our current resources may not be sufficient to fulfill our public company obligations.
We are subject to various regulatory requirements, including those of the SEC and NASDAQ. These requirements include record keeping, financial reporting and corporate governance rules and regulations. Historically, our management team has not had the resources typically found in a public company. Our internal infrastructure may not be adequate to support our increased reporting obligations and we may be unable to hire, train or retain necessary staff and may be reliant on engaging outside consultants or professionals to overcome our lack of experience or employees. If our internal infrastructure is inadequate, we are unable to engage outside consultants at a reasonable rate or attract talented employees to perform these functions or are otherwise unable to fulfill our public company obligations, it could have a material adverse effect on our business, financial condition and results of operations.
43
For as long as we are an emerging growth company, we are not required to comply with certain reporting requirements, including those relating to accounting standards and disclosure about our executive compensation, that apply to other public companies.
We are an emerging growth company, as defined in Section 2(a) of the Securities Act, as modified by the JOBS Act. As such, we are eligible to take advantage of certain exemptions from various reporting requirements that are applicable to other public companies that are not emerging growth companies, including, but not limited to, not being required to comply with the auditor attestation requirements of Section 404(b) of the Sarbanes-Oxley Act, reduced disclosure obligations regarding executive compensation in our periodic reports and proxy statements, and exemptions from the requirements of holding a non-binding advisory vote on executive compensation and of stockholder approval of any golden parachute payments not previously approved. We may take advantage of some of these exemptions. If we do, we do not know if some investors will find our common stock less attractive as a result. The result may be a less-active trading market for our common stock and our stock price may be more volatile.
In addition, Section 107 of the JOBS Act provides that an emerging growth company can take advantage of the extended transition period provided in Section 7(a)(2)(B) of the Securities Act for complying with new or revised accounting standards. In other words, an emerging growth company can delay the adoption of certain accounting standards until those standards would otherwise apply to private companies.
We could remain an emerging growth company for up to five years or until the earliest of (a) the last day of the first fiscal year in which our annual gross revenues exceed $1.07 billion, (b) the date that we become a large accelerated filer as defined in Rule 12b-2 under the Exchange Act, which would occur if the market value of our common stock that is held by non-affiliates exceeds $700 million as of the last business day of our most recently completed second fiscal quarter, or (c) the date on which we have issued more than $1 billion in non-convertible debt securities in the preceding three-year period.
Delaware law and our organizational documents, as well as our existing and future debt agreements, may impede or discourage a takeover, which could deprive our investors of the opportunity to receive a premium for their shares.
We are a Delaware corporation, and the anti-takeover provisions of Delaware law impose various impediments to the ability of a third party to acquire control of us, even if a change of control would be beneficial to our existing stockholders. In addition, provisions of our amended and restated certificate of incorporation and amended and restated bylaws may make it more difficult for, or prevent a third party from, acquiring control of us without the approval of our Board. Among other things, these provisions:
| ● | provide for a classified Board with staggered three-year terms until the first annual meeting of stockholders following the earlier of (i) the fifth anniversary of our IPO and (ii) a fiscal year end at which Advent and its affiliates hold less than 50% of the voting power of our common stock necessary to elect our directors (the “Sunset”) (with the directors whose terms expire at such annual meeting and any subsequent annual meeting being elected to hold office for a one-year term expiring at the next annual meeting of stockholders and until such director’s successor shall have been elected and qualified), which classified Board will prevent a third party who acquires control of a majority of our outstanding voting stock from obtaining control of our Board until the second annual stockholders meeting following the date the acquiror obtains the controlling interest; |
| ● | do not permit cumulative voting in the election of directors, which would otherwise allow less than a majority of stockholders to elect director candidates; |
| ● | delegate the sole power of a majority of the Board to fix the number of directors; |
| ● | provide the power of our Board to fill any vacancy on our Board, whether such vacancy occurs as a result of an increase in the number of directors or otherwise; |
| ● | authorize the issuance of preferred stock without any need for action by stockholders; |
| ● | do not permit stockholders to call special meetings of stockholders; and |
| ● | establish advance notice requirements for nominations for election to our Board or for proposing matters that can be acted on by stockholders at stockholder meetings. |
44
In addition, our First Lien Credit Agreement imposes, and we anticipate that documents governing our future indebtedness may impose, limitations on our ability to enter into change of control transactions. The occurrence of a change of control transaction could constitute an event of default thereunder permitting acceleration of the indebtedness, thereby impeding our ability to enter into certain transactions.
The foregoing factors, as well as the significant common stock ownership by Advent, could impede a merger, takeover or other business combination, or discourage a potential investor from making a tender offer for our common stock, which, under certain circumstances, could reduce the market value of our common stock.
Claims for indemnification by our directors and officers may reduce our available funds to satisfy successful third-party claims against us and may reduce the amount of money available to us.
Our amended and restated certificate of incorporation and bylaws provide that we will indemnify our directors and officers, in each case, to the fullest extent permitted by Delaware law. Pursuant to our amended and restated certificate of incorporation, our directors will not be liable to us or any stockholders for monetary damages for any breach of fiduciary duty, except (i) for acts that breach his or her duty of loyalty to us or our stockholders, (ii) for acts or omissions not in good faith or which involve intentional misconduct or a knowing violation of the law, (iii) pursuant to Section 174 of the Delaware General Corporate Law (the “DGCL”), which provides for liability of directors for unlawful payments of dividends of unlawful stock purchase or redemptions, or (iv) for any transaction from which the director derived an improper personal benefit. The bylaws also require us, if so requested, to advance expenses that such director or officer incurred in defending or investigating a threatened or pending action, suit or proceeding, provided that such person will return any such advance if it is ultimately determined that such person is not entitled to indemnification by us. Any claims for indemnification by our directors and officers may reduce our available funds to satisfy successful third-party claims against us and may reduce the amount of money available to us.
Our amended and restated certificate of incorporation designates the Court of Chancery of the State of Delaware and the federal district courts of the United States of America as the sole and exclusive forums for certain types of actions and proceedings that may be initiated by our stockholders, which could limit our stockholders’ ability to obtain a favorable judicial forum for disputes with us or our directors, officers or other employees.
Our amended and restated certificate of incorporation provides that, subject to certain exceptions, unless we consent in writing in advance to the selection of an alternative forum, the Court of Chancery of the State of Delaware shall be the sole and exclusive forum for any (i) derivative action or proceeding brought on our behalf, (ii) action asserting a claim of breach of a fiduciary duty or other wrongdoing by any current or former director, officer, employee, agent or stockholder to us or our stockholders, (iii) action asserting a claim arising pursuant to any provision of the DGCL, our amended and restated certificate of incorporation or our amended and restated bylaws or as to which the DGCL confers jurisdiction on the Court of Chancery of the State of Delaware or (iv) action asserting a claim governed by the internal affairs doctrine of the law of the State of Delaware. For the avoidance of doubt, our amended and restated certificate of incorporation also provides that the foregoing exclusive forum provision will not apply to actions brought to enforce any liability or duty created by the Securities Act or the Exchange Act, or any other claim or cause of action for which the federal courts have exclusive jurisdiction.
Our amended and restated certificate of incorporation also provides that, unless we consent in writing to an alternative forum, the federal district courts of the United States of America shall be the sole and exclusive forum for the resolution of any action asserting a claim arising under the Securities Act or the rules and regulations promulgated thereunder. Pursuant to the Exchange Act, claims arising thereunder must be brought in federal district courts of the United States of America.
This choice of forum provision may limit a stockholder’s ability to bring a claim in a judicial forum that it finds favorable for disputes with us or our directors, officers or other employees, which may discourage such lawsuits against us and our directors, officers and other employees. While the Delaware courts have determined that such choice of forum
45
provisions are facially valid, a stockholder may nevertheless seek to bring an action in a venue other than those designated in the exclusive forum provisions. In such instance, we would expect to assert the validity and enforceability of our exclusive forum provisions, which may require significant additional costs associated with resolving such action in other jurisdictions, and there can be no assurance that the provisions will be enforced by a court in those other jurisdictions. If a court were to find either exclusive forum provision in amended and restated bylaws to be inapplicable or unenforceable in an action, we may incur further significant additional costs associated with resolving the dispute in other jurisdictions, all of which could seriously harm our business.
Our ability to issue preferred stock may deter takeover attempts.
Our Board is empowered to issue, without stockholder approval, preferred stock with dividends, liquidation, conversion, voting or other rights, which could decrease the amount of earnings and assets available for distribution to holders of our common stock and adversely affect the relative voting power or other rights of the holders of our common stock. In the event of issuance, the preferred stock could be used as a method of discouraging, delaying or preventing a change in control. Our amended and restated certificate of incorporation authorizes the issuance of up to 10,000,000 shares of “blank check” preferred stock with such designations, rights and preferences as may be determined from time to time by our Board. Although we have no present intention to issue any shares of our preferred stock, we may do so in the future under appropriate circumstances.
Item 1B. Unresolved Staff Comments
None.
Item 2. Properties
Our corporate headquarters are located in Louisville, Colorado. In addition, we have office locations in Berkeley, California, Montclair, New Jersey and Denver, Colorado. Our manufacturing locations are in Austin, Texas and Bellvue, Colorado. We believe that our manufacturing facilities have sufficient capacity to accommodate our planned growth. All of our offices and facilities are leased.
Item 3. Legal Proceedings
From time to time, we may become involved in actions, claims, suits and other legal proceedings arising in the ordinary course of our business, including lawsuits or claims relating to product labelling, product recalls and product liability as well as the marketing of our products, intellectual property, contracts, employment matters, environmental matters or other aspects of our business. We are not currently a party to any actions the outcome of which would, individually or in the aggregate, have a material adverse effect on our business, financial condition and results of operations if determined adversely to us.
Item 4. Mine Safety Disclosures
Not Applicable.
46
PART II.
Item 5. Market for Registrant’s Common Equity, Related Stockholder Matters and Issuer Purchases of Equity Securities
Market Information and Holders
On September 23, 2021, our common stock began trading on the Nasdaq Global Select Market under the symbol of “SOVO.”
There were approximately 63 stockholders of record of our common stock as of March 7, 2022.
Dividends
We do not have an established dividend policy, and we currently do not intend to pay dividends on our common stock in the foreseeable future. However, in the future, subject to the factors described below and our future liquidity and capitalization, we may change this policy and choose to pay dividends. In June 2021, we used the proceeds of the Initial First Lien Term Loans and the Initial Second Lien Loans (as defined herein) to repay the full amounts outstanding under our Senior Credit Facilities (as defined herein) and finance a dividend of $400.0 million to the sole stockholder of Sovos Brands Intermediate, Inc. (“Sovos Intermediate”), which was ultimately distributed to the limited partners of Sovos Brands Limited Partnership (the “Limited Partnership”).
Our ability to pay dividends is currently restricted by the terms of our First Lien Credit Agreement (as defined herein) and may be further restricted by any future indebtedness we incur.
We are a holding company that does not conduct any business operations of our own. As a result, our ability to pay dividends on our common stock is dependent upon cash dividends and distributions and other transfers from our subsidiaries.
In addition, under Delaware law, our Board may declare dividends only to the extent of our surplus (which is defined as total assets at fair market value minus total liabilities, minus statutory capital) or, if there is no surplus, out of our net profits for the then current and/or immediately preceding fiscal year.
Any future determination to pay dividends will be at the discretion of our Board and will take into account:
| • | restrictions in our debt instruments, including our First Lien Credit Agreement; |
| • | general economic business conditions; |
| • | our earnings, financial condition, and results of operations; |
| • | our capital requirements; |
| • | our prospects; |
| • | legal restrictions; and |
| • | such other factors as our Board may deem relevant. |
Use of Proceeds
On September 27, 2021, we closed our IPO of our common stock in which we sold 23,334,000 shares of common stock, $0.001 par value per share. Subsequent to the IPO, the underwriters exercised their option to purchase an additional 3,500,100 shares of common stock, and our sale of such additional shares closed on October 5, 2021. The shares sold in
47
the IPO and shares issued pursuant to the underwriters’ option to purchase additional shares were registered under the Securities Act pursuant to our Registration Statement on Form S-1 (File No. 333-259110) which was declared effective by the SEC on September 22, 2021. Our shares of common stock were sold at an offering price to the public of $12.00 per share, and we received net proceeds from the IPO of approximately $263.2 million, net of $16.8 million in underwriting discounts and commissions. The sale of additional shares to the underwriters pursuant to the underwriters’ option to purchase additional shares resulted in net proceeds of approximately $39.5 million, net of $2.5 million in underwriting discounts and commissions. We estimate that we incurred offering expenses of approximately $8.0 million. We used the net proceeds of the IPO and the sale of additional shares to the underwriters (net of underwriting discounts and commissions and offering expenses) to pay the full outstanding principal balance on the Initial Second Lien Loans of $200.0 million plus accrued interest of approximately $2.9 million, and to prepay $99.2 million of the outstanding principal balance under the Initial First Lien Term Loans, plus total accrued interest of approximately $0.9 million.
J.P. Morgan Securities LLC and Goldman Sachs & Co. LLC acted as joint lead book-running managers for the offering and as representatives of the underwriters. BofA Securities, Inc., Credit Suisse Securities (USA) LLC, Barclays Capital Inc., UBS Securities LLC, Cowen and Company, LLC, Piper Sandler & Co., Stifel, Nicolaus & Company, Incorporated and William Blair, L.L.C. also acted as book-running managers and Telsey Advisory Group LLC, Drexel Hamilton, LLC and Loop Capital Markets LLC acted as co-managers for the offering. No payments were made by us to directors, officers, or persons owning 10% or more of our common stock or to their associates, or to our affiliates, other than payments in the ordinary course of business to officers for salaries and to certain of our directors and the chairs of our committees for their service on our Board and committees of the Board.
Recent Sales of Unregistered Securities
None.
Issuer Purchases of Equity Securities
Not Applicable.
48
Performance Graph
The following stock performance graph compares the outstanding stock from issuance of SOVO, September 22, 2021, through December 25, 2021 (the last day of our fiscal year), in the cumulative total value of $100 hypothetically invested in each of (i) Sovos Brands, Inc. common stock; (ii) the Russell 2000 Index; and (iii) the S&P Composite 1500 Packaged Foods & Meats Index.
The stock price performance below is not necessarily indicative of future stock price performance.
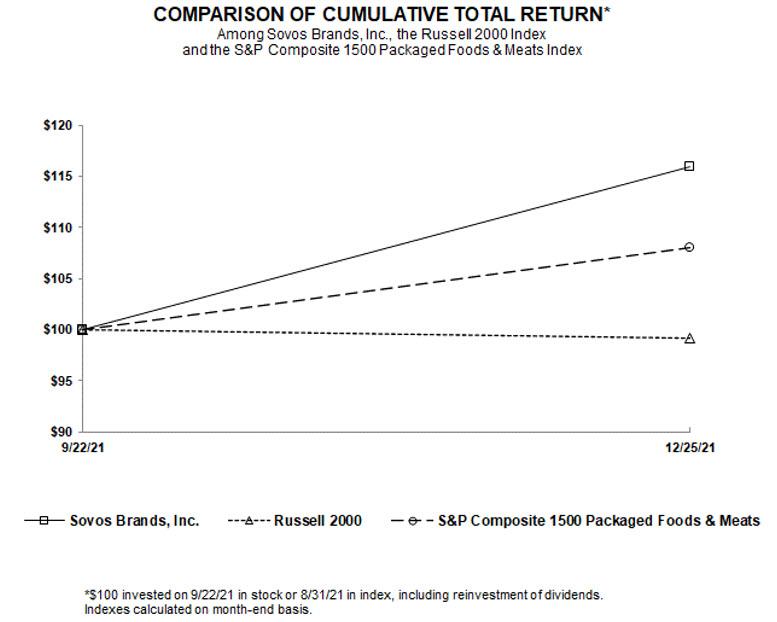
Performance Graph Data
| September 22, 2021 | | December 25, 2021 | ||
| | | | | |
Sovos Brands, Inc. | $ | 100.00 | | $ | 115.92 |
Russell 2000 | | 100.00 | | | 99.13 |
S&P Composite 1500 Packaged Foods & Meats | | 100.00 | | | 108.08 |
49
Item 6. Reserved
Not applicable.
Item 7. Management’s Discussion and Analysis of Financial Condition and Results of Operations
CAUTIONARY NOTE REGARDING FORWARD-LOOKING STATEMENTS
The following discussion and analysis of our financial condition and results of operations should be read in conjunction with our Consolidated Financial Statements and related notes included in Item 8 of this Form 10-K. In addition to historical information, the following discussion contains forward-looking statements, including, but not limited to, statements we make regarding the outlook for our future business and financial performance
Because forward-looking statements relate to the future, by their nature, they are subject to inherent uncertainties, risks and changes in circumstances that are difficult to predict. As a result, our actual results may differ materially from those contemplated by the forward-looking statements. Factors that could cause such differences include those identified below and those described in “Cautionary Note Regarding Forward-Looking Statements” and in Item 1A, “Risk Factors” of this Form 10-K. The Company assumes no obligation to update any of these forward-looking statements.
Overview
We are the fastest growing food company of scale in the United States over the past two years, focused on acquiring and building disruptive growth brands that bring today’s consumers great tasting food that fits the way they live. Our brands, Rao’s, Michael Angelo’s, noosa and Birch Benders are built with authenticity at their core, providing consumers food experiences that are genuine, delicious and unforgettable, making each of our brands “one-of-a-kind.” Our products are premium and made with simple, high-quality ingredients. Our people are at the center of all that we do. We strive to empower our teams to lead with courage and tenacity, with the goal of providing them with the confidence and agility to connect with our consumers and retail partners to drive unparalleled growth. We believe our focus on “one-of-a-kind” brands, products that people love, and passion for our people makes Sovos Brands a “one-of-a-kind” company and enables us to deliver on our objective of creating a growing and sustainable food enterprise yielding financial growth ahead of industry peers.
Since our inception, we have been focused on building an organization with the capabilities to acquire, integrate, and grow brands as we continue to scale. Our business model is grounded in acquiring “one-of-a-kind” brands, and leveraging a common infrastructure and shared playbook to drive growth. We have a track record of successful deals and have completed the following four acquisitions:
| ● | in January 2017, we completed the acquisition of Bottom Line Food Processors, Inc. d/b/a Michael Angelo’s Gourmet Foods; |
| ● | in July 2017, we completed the acquisition of Rao’s Specialty Foods, Inc.; |
| ● | in November 2018, we completed the Noosa Acquisition; and |
| ● | in October 2020, we completed the Birch Benders Acquisition. |
On September 22, 2021, we completed the IPO of 23,334,000 shares of our common stock, $0.001 par value per share, which excluded the underwriters’ option to purchase an additional 3,500,100 shares of common stock, at an offering price to the public of $12.00 per share. The IPO closed on September 27, 2021 and resulted in net proceeds of approximately $263.2 million, after deducting underwriting discounts and commissions. Subsequent to the IPO, the underwriters exercised their options to purchase an additional 3,500,100 shares of common stock. We closed the sale of such additional
50
shares on October 5, 2021, resulting in net proceeds of approximately $39.5 million, after deducting underwriting discounts and commissions.
Emerging Growth Status
As a company with less than $1.07 billion in gross revenue during our last fiscal year, we qualify as an “emerging growth company” as defined in the Jumpstart Our Business Startups Act of 2012 (the “JOBS Act”). An emerging growth company may take advantage of specified reduced reporting and other regulatory requirements for up to five years that are otherwise applicable generally to public companies. These provisions include, among other matters:
| • | exemption from the auditor attestation requirement on the effectiveness of our system of internal control over financial reporting pursuant to the Sarbanes-Oxley Act; |
| • | exemption from the adoption of new or revised financial accounting standards until they would apply to private companies; |
| • | exemption from compliance with any new requirements adopted by the Public Company Accounting Oversight Board requiring mandatory audit firm rotation or a supplement to the auditor’s report in which the auditor would be required to provide additional information about the audit and the financial statements of the issuer; |
| • | an exemption from the requirement to seek non-binding advisory votes on executive compensation and golden parachute arrangements; and |
| • | reduced disclosure about executive compensation arrangements. |
We will remain an emerging growth company until the last day of the fiscal year following the fifth anniversary of the date of the first sale of our common stock pursuant to an effective registration statement, which was September 22, 2021, unless, prior to that time, we have more than $1.07 billion in annual gross revenue, have a market value for our common stock held by non-affiliates of more than $700 million as of the last day of our second fiscal quarter of the fiscal year and a determination is made that we are deemed to be a “large accelerated filer,” as defined in Rule 12b-2 promulgated under the Exchange Act, or issue more than $1.0 billion of non-convertible debt securities over a three-year period, whether or not issued in a registered offering.
In addition, Section 107 of the JOBS Act also provides that an emerging growth company can take advantage of the extended transition period provided in Section 7(a)(2)(B) of the Securities Act for complying with new or revised accounting standards. An emerging growth company can, therefore, delay the adoption of certain accounting standards until those standards would otherwise apply to private companies.
Impact of COVID-19; Inflationary Environment
We continue to actively monitor the impact of COVID-19 on all aspects of our business. We have closely monitored and implemented the emerging shifts in government and health agency protocols and safety guidelines related to the COVID-19 pandemic throughout the past two years. We have experienced incremental operating costs at our manufacturing and warehouse facilities to promote safe operations and maintain our ability to supply our products, including frontline worker pay, employee protective equipment and higher utilization of temporary labor. As a result of non-essential travel restrictions during the pandemic, we have experienced reduced employee travel and meeting costs, which partially mitigated our higher operating costs.
We cannot predict the degree to, or the period over, which we will be affected by the COVID-19 pandemic and resulting governmental and other measures or changes thereto, including easing of restrictions. The global impact of the COVID-19 pandemic continues to evolve, and we continue to closely monitor the impact of the COVID-19 pandemic on our
51
business and remain focused on prioritizing the health of our employees while seeking to maintain the continuity of our product supply throughout the supply chain. We have benefited from changes in consumer shopping and consumption patterns during the COVID-19 pandemic, including dramatic increases of in-home consumption and trial of our products, resulting in increased household penetration of our brands in fiscal 2020. As a result of the strong demand for our products as well as supply chain disruptions, we are currently facing challenges to meet our expected service levels in fiscal 2022.
In fiscal 2021, we experienced increased cost of sales, as a percentage of net sales, contributed by higher costs for logistics, materials, labor and energy. We anticipated continued inflationary pressure and accordingly, we announced price increases with the goal of offsetting increased cost of sales. Since the price increase announcements made in late fiscal 2021, we have experienced increased inflationary pressure and volatility, and accordingly recently announced additional price increases. In addition, to assist in partially mitigating inflation, we are targeting reduced trade spending, seeking to remove our least efficient promotions and drive net price increases. We expect the year-over-year inflation impact to be higher in the first half of fiscal 2022.
Going forward, we expect higher inflation costs to persist as a headwind in the near term given the tight global supply chain. As a result, we will closely monitor our pricing and may announce additional price increases in fiscal 2022. Consistent with the consumer-packaged food industry, we are seeing cost increases in several raw materials including, but not limited to, milk, animal proteins, fruit, resin, and cardboard. Transportation challenges continue to be acute, particularly due to logistical issues at major ports, intermodal and trucking delays and capacity constraints for ocean freight cargo. These challenges have resulted in long lead times and higher logistics costs. Labor-related disruptions, including labor shortages and absenteeism, have been challenges within our operations and among our 3PL providers and other business partners.
We expect to develop additional initiatives to partially mitigate inflationary pressure on top of the various productivity initiatives already in progress. Some of our ongoing supply chain initiatives today include: the further automation of our own production facilities, optimization of our co-manufacturing network, packaging value engineering, and competitive procurement actions. Collectively, we expect the increases in costs to be partially mitigated in fiscal 2022 by the pricing actions, as well as productivity initiatives.
Key Performance Indicators
We regularly review a number of metrics to evaluate our business, measure our progress and make strategic decisions. EBITDA, Adjusted EBITDA, EBITDA margin, Adjusted EBITDA margin, brand net sales, adjusted net income, diluted earnings per share from adjusted net income, adjusted operating expenses, adjusted income tax (expense) benefit and adjusted effective tax rate (the “non-GAAP financial measures”), which are non-GAAP financial measures, are currently utilized by management and may be used by our competitors to assess performance. We believe these measures assist our investors in gaining a meaningful understanding of our performance. Because not all companies use identical calculations, our presentation of these measures may not be comparable to other similarly titled measures of other companies. See “Non-GAAP Financial Measures” for definitions and a reconciliation of net income to EBITDA and Adjusted EBITDA, net sales to brand net sales, net income to adjusted net income and diluted earnings per share from adjusted net income.
Results of Operations
The discussion that follows includes a comparison of our results of operations and liquidity and capital resources for fiscal years 2021 and 2020. For a comparison of our results of operations and financial condition for fiscal years 2020 and 2019, see “Management’s Discussion and Analysis of Financial Condition and Results of Operations” in our Prospectus filed with the SEC on September 24, 2021 (the “Prospectus”). We have also included certain non-GAAP financial measures for fiscal 2019 that were not included in our Prospectus.
52
Comparison of Results for the Fiscal Years Ended December 25, 2021 and December 26, 2020
The following table presents, for the periods indicated, selected information from our Consolidated Statements of Operations, including information presented as a percentage of net sales:
Fiscal Year Ended | Fiscal Year Ended | Increase / (Decrease) |
| |||||||||||||||
% |
| |||||||||||||||||
(In thousands) | December 25, 2021 | % of Sales | December 26, 2020 | % of Sales | $ Change | Change |
| |||||||||||
| ||||||||||||||||||
Net sales |
| $ | 719,186 |
| 100.0 | % | $ | 560,067 |
| 100.0 | % | $ | 159,119 |
| 28.4 | % | ||
Cost of sales |
| 498,394 |
| 69.3 | % |
| 373,314 |
| 66.7 | % |
| 125,080 |
| 33.5 | % | |||
Gross profit |
| 220,792 |
| 30.7 | % |
| 186,753 |
| 33.3 | % |
| 34,039 |
| 18.2 | % | |||
Operating expenses: |
|
|
|
|
|
|
|
| ||||||||||
Selling, general and administrative |
| 135,060 |
| 18.8 | % |
| 124,612 |
| 22.2 | % |
| 10,448 |
| 8.4 | % | |||
Depreciation and amortization |
| 28,871 |
| 4.0 | % |
| 24,744 |
| 4.4 | % |
| 4,127 |
| 16.7 | % | |||
Loss on extinguishment of debt |
| 15,382 |
| 2.1 | % |
| — |
| — | % |
| 15,382 |
| NM | % | |||
Forgiveness of capital advance | 5,000 | 0.7 | % | — | — | % | 5,000 | NM | % | |||||||||
Total operating expenses |
| 184,313 |
| 25.6 | % |
| 149,356 |
| 26.7 | % |
| 34,957 |
| 23.4 | % | |||
Operating income |
| 36,479 |
| 5.1 | % |
| 37,397 |
| 6.7 | % |
| (918) |
| (2.5) | % | |||
Interest expense |
| 30,885 |
| 4.3 | % |
| 19,895 |
| 3.6 | % |
| 10,990 |
| 55.2 | % | |||
Income before income taxes |
| 5,594 |
| 0.8 | % |
| 17,502 |
| 3.1 | % |
| (11,908) |
| (68.0) | % | |||
Income tax expense |
| (3,675) |
| (0.5) | % |
| (6,677) |
| (1.2) | % |
| 3,002 |
| (45.0) | % | |||
Net income | $ | 1,919 |
| 0.3 | % | $ | 10,825 |
| 1.9 | % | $ | (8,906) |
| (82.3) | % | |||
Other financial data: (1) |
|
|
|
|
|
|
|
| ||||||||||
EBITDA | $ | 74,291 |
| 10.3 | % | $ | 71,194 |
| 12.7 | % | $ | 3,097 |
| 4.4 | % | |||
Adjusted EBITDA | $ | 115,145 |
| 16.0 | % | $ | 91,132 |
| 16.3 | % | $ | 24,013 |
| 26.3 | % | |||
EBITDA margin | 10.3 | % | — |
| 12.7 | % | — |
| — |
| (18.7) | % | ||||||
Adjusted EBITDA margin | 16.0 | % | — |
| 16.3 | % | — |
| — |
| (1.8) | % | ||||||
Brand net sales | $ | 719,186 |
| — | $ | 608,754 |
| — | $ | 110,432 |
| 18.1 | % | |||||
Adjusted net income | $ | 54,277 |
| — | $ | 44,105 |
| — | $ | 10,172 |
| 23.1 | % | |||||
Adjusted operating expenses | $ | 143,757 | — | $ | 130,341 | — | $ | 13,416 | 10.3 | % | ||||||||
Adjusted income tax (expense) benefit | $ | (19,411) | — | $ | (16,563) | — | $ | (2,848) | 17.2 | % | ||||||||
Adjusted effective tax rate | 26.3 | % | — | 27.3 | % | — | — | (3.7) | % | |||||||||
| (1) | Other financial data includes non-GAAP financial metrics. See “Non-GAAP Financial Measures” for definitions and a reconciliation of our net income to EBITDA and Adjusted EBITDA, net sales to brand net sales, net income to adjusted net income, total operating expenses to adjusted operating expenses, reported income tax (expense) benefit to adjusted income tax (expense) benefit and reported effective tax rate to adjusted effective tax rate. |
Net Sales
Net sales consist primarily of product sales to our customers less cost of trade promotions such as consumer incentives, coupon redemptions, other marketing activities and allowances for unsalable product.
Net sales of $719.2 million represented an increase of $159.1 million, or 28.4%, for fiscal 2021 compared to fiscal 2020. The increase in net sales was primarily due to a $106.3 million, or 34%, increase in Rao’s net sales, the majority of which was driven by higher sauce and frozen shipments to key customers. Household penetration of our sauce business grew to 10.9% in fiscal 2021, up over 260 basis points compared to fiscal 2020. As we exited the fourth quarter of 2021, Rao’s became the #2 pasta & pizza sauce brand in dollar consumption. Higher shipments for noosa, namely in spoonable
53
yogurt, drove an incremental $10.0 million of net sales. The Birch Benders brand, which was acquired in October 2020 and was therefore not included for a full year in the results for fiscal 2020, accounted for $47.3 million of the increase.
Cost of Sales
Cost of sales represents costs directly related to the manufacturing and distribution of products. Such costs include raw materials, labor and overhead required to produce the products, co-manufacturing, packaging, warehousing, shipping and handling, third-party distribution, and depreciation of equipment and leasehold improvements. We manufacture our products in our Austin, Texas and Bellvue, Colorado manufacturing locations. We also use third-party contract manufacturers in the United States, Canada and the European Union. We procure selected elements of raw materials and packaging and receive finished goods. We incur tolling charges related to our contract manufacturing arrangements.
Cost of sales of $498.4 million represented an increase of $125.1 million, or 33.5%, for fiscal 2021 compared to fiscal 2020. The increase was primarily attributable to higher net sales discussed above. In addition, incremental costs from inflationary pressures and global logistical constraints contributed to higher cost of sales. Consistent with others in our industry, we have faced challenges with supply chain and inflationary headwinds, several of which have intensified in recent months. With Omicron having brought on the latest wave of supply chain disruption, near-term cost and operating pressures related to raw materials, particularly dairy and animal proteins, logistics and labor have intensified. As a result, we have experienced higher ocean freight and port-related costs as well as higher input and materials costs. The Birch Benders brand, which was acquired in October 2020, and was therefore not included for a full year in the results for fiscal 2020, also contributed $35.9 million to the increase.
Cost of sales as a percentage of net sales increased from 66.7% for the fiscal year ended December 26, 2020 to 69.3% for the fiscal year ended December 25, 2021. The increase in cost of sales as a percentage of net sales was due to cost pressures from incremental costs to meet customer service levels and related inflation as described above, as well as higher promotional spending.
Gross Profit
Gross profit of $220.8 million represented an increase of $34.0 million, or 18.2%, for the fiscal year ended December 25, 2021, compared to the fiscal year ended December 26, 2020. Gross profit as a percentage of net sales, or gross margin, decreased from 33.3% for fiscal 2020 to 30.7% for fiscal 2021, and was a result of the items discussed above.
Operating Expenses
Operating expenses of $184.3 million represented an increase of $35.0 million, or 23.4%, for the fiscal year ended December 25, 2021 compared to the fiscal year ended December 26, 2020 due to the following:
| ● | Selling, General and Administrative expenses: Selling, general and administrative expenses include sales and marketing costs and general and administrative expenses. Selling and marketing costs primarily include consumer facing marketing costs and customer and consumer facing selling expenses, principally comprised of advertising and marketing costs and broker commissions, as well as research and development expenses. General and administrative expenses are comprised of expenses associated with our corporate and administrative functions that support our business, including expenses for employee salaries and benefits, travel and entertainment, professional services, insurance and other corporate expenses, including auditor and tax fees, third-party consultancy fees, office leases and equity-based compensation expense. |
Selling, general and administrative expenses of $135.1 million represented an increase of $10.4 million, or 8.4%, for the fiscal year ended December 25, 2021 compared to the fiscal year ended December 26, 2020. The increase was primarily driven by the inclusion of Birch Benders in results for the full fiscal year ended December 25, 2021, after it was acquired in October of 2020, accounting for $6.7 million of the increase.
54
The remainder of the increase was driven by higher volume-related selling expenses and higher general and administrative expenses related to being a public company.
| ● | Depreciation and Amortization expenses: Depreciation and amortization expense consists of the depreciation of non-production property and equipment, including leasehold improvements, equipment, capitalized leases and the amortization of customer relationships and finite-lived trademarks. |
Depreciation and amortization expenses of $28.9 million represented an increase of $4.1 million, or 16.7%, for the fiscal year ended December 25, 2021, compared to the fiscal year ended December 26, 2020. The increase was primarily due to amortization of the intangible assets recognized as part of the Birch Benders Acquisition.
| ● | Loss on Extinguishment of Debt: Loss on extinguishment of debt of $15.4 million for the fiscal year ended December 25, 2021 resulted from the extinguishment of the loans associated with our Senior Credit Facilities in June 2021 as well as the payoff of the Initial Second Lien Facility (as defined herein) and partial prepayments of the Initial First Lien Term Loan Facility (as defined herein) with proceeds from the IPO and the underwriters’ exercise of their option to purchase additional shares. There was no loss on extinguishment of debt for the fiscal year ended December 26, 2020. |
Loss on extinguishment of debt of $15.4 million includes $9.4 million of recorded losses in connection with the repayment of the full amounts outstanding under our Senior Credit Facilities in June 2021. Upon the full prepayment of the Initial Second Lien Facility on September 27, 2021, we recognized a loss on the loan extinguishment resulting in a write-off of $4.3 million of the related unamortized issuance costs and discounts. In connection with the partial prepayments of the Initial First Lien Term Loan Facility on September 29, 2021 and October 8, 2021, we recognized a proportional loss of $1.4 million on the partial extinguishment of the related unamortized issuance costs and discounts.
| ● | Forgiveness of capital advance: Forgiveness of capital advance of $5.0 million for the fiscal year ended December 25, 2021, resulted from the forgiveness of the remaining $5.0 million balance of the original 2016 capital advance of $10.0 million with one of our suppliers, scheduled to be repaid by December 31, 2023, and is now considered forgiven and repaid in full. There was no forgiveness of capital advance for the fiscal year ended December 26, 2020. |
55
Equity-Based Compensation Expense
We grant equity-based compensation awards to certain employees, officers and non-employee directors as long-term incentive compensation. We recognize the related expense for these awards ratably over the applicable vesting period. Such expense is recognized as a selling, general and administrative expense. In connection with the IPO, we modified our existing equity-based compensation awards which resulted in a non-cash expense of approximately $0.7 million in our 2021 third quarter, resulted in a non-cash expense of $5.4 million in our 2021 fourth quarter and will result in a non-cash expense of $6.9 million through the first quarter of 2024. In November 2021, we further modified a portion of our existing equity-based compensation awards which resulted in a non-cash expense of approximately $0.6 million in our 2021 fourth quarter. We expect that this modification will result in an incremental non-cash expense of approximately $4.3 million in fiscal 2022 and approximately $1.1 million in the fiscal year ending December 30, 2023. In addition, we expect to record equity-based compensation expense of approximately $14.8 million through our 2024 third quarter resulting from the issuance of grants under the 2021 Plan (as defined herein) in connection with the IPO. In January 2022, we granted annual equity-based compensation awards to certain employees and officers and expect to recognize approximately $7.9 million through the fiscal year ending December 28, 2024 for the service-vesting awards and approximately $6.0 million through the fiscal year ending December 27, 2025 for the performance-vesting awards. We will also incur equity-based compensation expense in the future related to additional equity grants.
Interest Expense
Interest expense primarily consists of interest and fees on our Credit Facilities, our Senior Credit Facilities, and amortization of deferred financing costs. We have incurred, and may incur additional, indebtedness to fund acquisitions, and we may choose to prepay on our First Lien Credit Agreement to reduce indebtedness.
In fiscal 2020, we incurred additional indebtedness to fund the Birch Benders Acquisition, and in fiscal 2021, we refinanced our debt and incurred additional indebtedness to repay the outstanding 2018 Term Loan and Incremental Term Loan of $373.2 million and finance a $400.0 million shareholder dividend in June 2021.
On September 27, 2021, using the net proceeds of the IPO we paid the full outstanding principal balance on the Initial Second Lien Facility of $200.0 million plus accrued interest of approximately $2.9 million. Additionally, on September 29, 2021, and October 8, 2021, we prepaid $59.7 million and $39.5 million, respectively, of the outstanding principal balance under the Initial First Lien Term Loan Facility, plus total accrued interest of approximately $0.9 million. These repayments will result in a decrease in future annual interest expense.
Interest expense of $30.9 million represented an increase of $11.0 million, or 55.2%, for the fiscal year ended December 25, 2021, compared to the fiscal year ended December 26, 2020. The increase in interest expense resulted primarily from a higher balance of borrowings during fiscal 2021 compared to fiscal 2020. The higher balance of borrowings outstanding was primarily driven by the borrowings related to the October 2020 Birch Benders Acquisition and our June 2021 shareholder dividend, partially offset by the payoff of the Initial Second Lien Facility in September 2021 and the partial prepayments of the Initial First Lien Term Loan Facility in September and October 2021.
Income Tax Expense
Income tax expense consists of federal and various state taxes. Income tax expense of $3.7 million for the fiscal year ended December 25, 2021, represented a decrease of $3.0 million compared to income tax expense of $6.7 million for the fiscal year ended December 26, 2020. The decrease in our income tax expense for the fiscal year ended December 25, 2021 is primarily attributable to the decrease in earnings before income taxes, the tax deductible costs associated with the IPO that did not require capitalization for federal income tax purposes, the annual remeasurement of the deferred tax balances as a result of the change in the state tax rates, partially offset by an increase in non-deductible expenses for tax purposes related to stock compensation expense driven by the modification of performance equity awards, and a limitation on the deductibility of executive compensation related to becoming a public company. These components resulted in a
56
decrease to income tax expense for the fiscal year ended December 25,2021 compared to the fiscal year ended December 26, 2020.
Net Income
Net income for the fiscal year ended December 25, 2021 was $1.9 million compared to net income of $10.8 million for the fiscal year ended December 26, 2020. The decrease in net income was attributable to the items described above.
EBITDA
EBITDA of $74.3 million for the fiscal year ended December 25, 2021 represented an increase of $3.1 million compared to the fiscal year ended December 26, 2020. The increase was driven by improvement in gross profit, excluding depreciation, due to increases in both volume-related and acquisition-related net sales as discussed in the “—Net Sales,” “—Gross Profit,” and “—Operating Expenses” sections above. See “—Non-GAAP Financial Measures” for a discussion of EBITDA and a reconciliation of our net income to EBITDA.
Adjusted EBITDA
Adjusted EBITDA of $115.1 million for the fiscal year ended December 25, 2021 represented an increase of $24.0 million compared to the fiscal year ended December 26, 2020, as discussed in the “—Net Sales,” “—Gross Profit,” and “—Operating Expenses” sections above. See “—Non-GAAP Financial Measures” for a discussion of Adjusted EBITDA and a reconciliation of our net income to Adjusted EBITDA.
Adjusted Net Income
Adjusted net income for the fiscal year ended December 25, 2021 was $54.3 million compared to $44.1 million for the fiscal year ended December 26, 2020. The increase of $10.2 million was attributable to the items described above. See “—Non-GAAP Financial Measures” for a discussion of adjusted net income and a reconciliation of our net income to adjusted net income.
Adjusted Operating Expenses
Adjusted operating expenses for the fiscal year ended December 25, 2021 was $143.8 million compared to $130.3 million for the fiscal year ended December 26, 2020. See “—Non-GAAP Financial Measures” for a discussion of adjusted operating expenses and a reconciliation of our total operating expenses to adjusted operating expenses.
Adjusted Income Tax (Expense) Benefit
Adjusted income tax (expense) benefit for the fiscal year ended December 25, 2021 was $19.4 million compared to $16.6 million for the fiscal year ended December 26, 2020, See “—Non-GAAP Financial Measures” for a discussion of adjusted income tax (expense) benefit and a reconciliation of our reported income tax (expense) benefit to adjusted income tax (expense) benefit.
Adjusted Effective Tax Rate
The adjusted effective tax rate for the fiscal year ended December 25, 2021 was 26.3% compared to 27.3% for the fiscal year ended December 26, 2020. See “—Non-GAAP Financial Measures” for a discussion of adjusted effective tax rate and a reconciliation of reported effective tax rates to adjusted effective tax rate.
57
Non-GAAP Financial Measures
We report our financial results in accordance with GAAP. To supplement this information, we also use EBITDA, Adjusted EBITDA, EBITDA margin, Adjusted EBITDA margin, brand net sales, adjusted net income, diluted earnings per share from adjusted net income, adjusted operating expenses, adjusted income tax (expense) benefit and adjusted effective tax rate, non-GAAP financial measures, in this Form 10-K. We define EBITDA as net income before net interest expense, income tax expense, depreciation and amortization. We define Adjusted EBITDA as EBITDA adjusted for impairment of goodwill and intangible assets, transaction and integration costs, IPO readiness costs, non-cash equity-based compensation, supply chain optimization and non-recurring costs. EBITDA margin is determined by calculating the percentage EBITDA is of net sales. Adjusted EBITDA margin is determined by calculating the percentage Adjusted EBITDA is of net sales. Brand net sales consists of net sales from the Rao’s, Michael Angelo’s, noosa and Birch Benders brands for the identified period regardless of our ownership of the brand at that time. Adjusted net income, adjusted operating expenses, adjusted income tax (expense) benefit and adjusted effective tax rate consists of net income, total operating expenses, reported income tax (expense) benefit and reported effective tax rate before impairment of goodwill and intangible assets, transaction and integration costs, IPO readiness, non-cash equity-based compensation, supply chain optimization, non-recurring costs, acquisition amortization and tax-related adjustments that we do not consider in our evaluation of our ongoing operating performance from period to period as discussed further below. Diluted earnings per share from adjusted net income is determined by dividing adjusted net income by the weighted average diluted shares outstanding. Non-GAAP financial measures are included in this Form 10-K because they are key metrics used by management to assess our operating performance. Management believes that non-GAAP financial measures are helpful in highlighting performance trends because non-GAAP financial measures exclude the results of decisions that are outside the control of operating management. Our presentation of non-GAAP financial measures should not be construed to imply that our future results will be unaffected by these items. By providing these non-GAAP financial measures, management believes we are enhancing investors’ understanding of our business and our results of operations, as well as assisting investors in evaluating how well we are executing our strategic initiatives.
EBITDA, Adjusted EBITDA, EBITDA margin, Adjusted EBITDA margin, brand net sales, adjusted net income, diluted earnings per share from adjusted net income, adjusted operating expenses, adjusted income tax (expense) benefit and adjusted effective tax rate are not defined under GAAP. Our use of the terms EBITDA, Adjusted EBITDA, EBITDA margin, Adjusted EBITDA margin, brand net sales, adjusted net income and diluted earnings per share from adjusted net income, adjusted operating expenses, adjusted income tax (expense) benefit and adjusted effective tax rate may not be comparable to similarly titled measures of other companies in our industry and are not measures of performance calculated in accordance with GAAP. Our presentation of non-GAAP financial measures are intended as supplemental measures of our performance that are not required by, or presented in accordance with, GAAP. Non-GAAP financial measures should not be considered as alternatives to operating income, net income, earnings per share, net sales or any other performance measures derived in accordance with GAAP, or as measures of operating cash flows or liquidity.
Non-GAAP financial measures have important limitations as analytical tools, and you should not consider them in isolation or as substitutes for analysis of our results as reported under GAAP. Some of these limitations are:
| ● | EBITDA, Adjusted EBITDA, EBITDA margin and Adjusted EBITDA margin do not reflect any charges for the assets being depreciated and amortized that may need to be replaced in the future; |
| ● | EBITDA, Adjusted EBITDA, EBITDA margin and Adjusted EBITDA margin do not reflect the significant interest expense or the cash requirements necessary to service interest or, if any, principal payments on our debt; |
| ● | EBITDA, Adjusted EBITDA, EBITDA margin and Adjusted EBITDA margin do not reflect our income tax expense or the cash requirements to pay our income taxes; |
58
| ● | Adjusted EBITDA, Adjusted EBITDA margin, adjusted net income, diluted earnings per share from adjusted net income, adjusted operating expenses, adjusted income tax (expense) benefit and adjusted effective tax rate do not reflect the impact of impairments of goodwill or intangible assets; |
| ● | Adjusted EBITDA, Adjusted EBITDA margin, adjusted net income, diluted earnings per share from adjusted net income, adjusted operating expenses, adjusted income tax (expense) benefit and adjusted effective tax rate do not reflect the impact of transaction costs and certain integration costs associated with the Birch Benders Acquisition and the Noosa Acquisition as well as costs associated with incomplete potential acquisitions and substantial one-time costs in fiscal 2020 and fiscal 2021 related to a large, uncompleted transaction; |
| ● | Adjusted EBITDA, Adjusted EBITDA margin, adjusted net income, diluted earnings per share from adjusted net income, adjusted operating expenses, adjusted income tax (expense) benefit and adjusted effective tax rate do not reflect costs associated with preparing for our IPO, including public company readiness; |
| ● | Adjusted EBITDA, Adjusted EBITDA margin, adjusted net income, diluted earnings per share from adjusted net income, adjusted operating expenses, adjusted income tax (expense) benefit and adjusted effective tax rate do not reflect the impact of write-downs of fixed assets, product write-offs related to manufacturing optimization, certain operation rationalization initiatives and strategic initiatives; |
| ● | Adjusted EBITDA, Adjusted EBITDA margin, adjusted net income, diluted earnings per share from adjusted net income, adjusted operating expenses, adjusted income tax (expense) benefit and adjusted effective tax rate do not reflect the impact of share-based compensation upon our results of operations; and |
| ● | Adjusted EBITDA, Adjusted EBITDA margin, adjusted net income, diluted earnings per share from adjusted net income, adjusted operating expenses, adjusted income tax (expense) benefit and adjusted effective tax rate do not include certain expenses that are non-recurring, infrequent and unusual in nature, including extinguishment of debt, forgiveness of capital advance, costs associated with the dividend, enterprise resource planning (“ERP”) implementation costs related to integrating acquisitions, severance costs and certain legal settlements related to the exit of facilities. |
In the future we may incur expenses similar to those eliminated in this presentation of non-GAAP financial measures.
59
The following table provides a reconciliation of EBITDA and Adjusted EBITDA to net income, their most directly comparable GAAP measure, for each of the periods presented:
Fiscal Year Ended | | ||||||
(In thousands) |
| December 25, 2021 |
| December 26, 2020 |
| ||
Net income | $ | 1,919 | $ | 10,825 | |||
Interest |
| 30,885 |
| 19,895 | |||
Income tax expense |
| (3,675) |
| (6,677) | |||
Depreciation and amortization |
| 37,812 |
| 33,797 | |||
EBITDA |
| 74,291 |
| 71,194 | |||
Transaction and integration costs(1) |
| 4,227 |
| 12,396 | |||
Initial public offering readiness(2) |
| 5,559 |
| 2,701 | |||
Non-cash equity-based compensation(3) |
| 9,823 |
| 1,915 | |||
Supply chain optimization(4) |
| — |
| 1,914 | |||
Non-recurring costs(5) |
| 21,245 |
| 1,012 | |||
Adjusted EBITDA | $ | 115,145 | $ | 91,132 | |||
EBITDA margin | | 10.3 | % | | 12.7 | % | |
Adjusted EBITDA margin | | 16.0 | % | | 16.3 | % | |
| (1) | Consists of transaction costs and certain integration costs associated with the Birch Benders Acquisition and the Noosa Acquisition as well as costs associated with incomplete potential acquisitions and substantial one-time costs related to a large, uncompleted transaction. For the fiscal years ended December 25, 2021 and December 26, 2020, $298 and $337, respectively, are included in cost of sales and $3,929 and $12,059, respectively, are included in total operating expenses. |
| (2) | Consists of costs associated with preparing for an IPO, including public company readiness, primarily comprised of professional fees. For all periods presented, these costs are included in total operating expenses. |
| (3) | Consists of non-cash equity-based compensation expense associated with the grant of equity-based compensation provided to officers, directors and employees. For all periods presented, these costs are included in total operating expenses. |
| (4) | Consists of expenses for professional fees related to supply-chain manufacturing optimization and costs associated with SKU rationalization and certain other strategic initiatives. For the fiscal year ended December 25, 2021, there were no costs. For the fiscal year ended December 26, 2020, $586 is included in cost of sales and $1,328 is included in total operating expenses. |
| (5) | Consists of costs related to loss on extinguishment of debt, forgiveness of capital advance, legal and consulting costs associated with the dividend, ERP conversion costs related to integrating acquisitions and employee separation costs. For all periods presented, these costs are included in total operating expenses. |
EBITDA margin and Adjusted EBITDA margin are calculated by dividing EBITDA and Adjusted EBITDA, respectively, by net sales for the applicable period.
Brand net sales includes actual or estimated net sales for all of our brands for the periods presented regardless of our ownership during such period. The relative performance of Birch Benders prior to our acquisition may not be indicative of the results for Birch Benders in any future periods. Brand net sales includes net sales of the Birch Benders brand prior to the Birch Benders Acquisition and were derived from estimates prepared by, and are the responsibility of, management. Neither our independent auditors, nor any other independent accountants, have audited, compiled, examined or performed any procedures with respect to such information, nor have they expressed any opinion or any other form of assurance on
60
such information or its achievability, and assume no responsibility for, and disclaim any association with, the such information. We are providing this information to provide investors with information regarding the relative net sales growth of all of our brands during the periods presented.
The following table provides a reconciliation of brand net sales to net sales, its most directly comparable GAAP measure, for each of the periods presented:
Fiscal Year Ended | |||||||
(In thousands) |
|
| December 25, 2021 |
| December 26, 2020 | ||
Net sales | $ | 719,186 | $ | 560,067 | |||
Birch Benders net sales prior to acquisition |
| — |
| 48,687 | |||
Brand net sales | $ | 719,186 | $ | 608,754 | |||
The following table provides a reconciliation of adjusted net income to net income, its most directly comparable GAAP measure, and the resulting adjusted diluted earnings per share calculated from adjusted net income, for each of the periods presented:
Fiscal Year Ended | |||||||
(In thousands) | December 25, 2021 |
| December 26, 2020 | ||||
Net income |
| $ | 1,919 |
| $ | 10,825 | |
Transaction and integration costs(1) | 4,227 | 12,396 | |||||
Initial public offering readiness(2) | 5,559 | 2,701 | |||||
Non-cash equity-based compensation(3) | 9,823 | 1,915 | |||||
Supply chain optimization(4) | — | 1,914 | |||||
Non-recurring costs(5) | 21,245 | 1,012 | |||||
Acquisition amortization(6) | 27,240 | 23,228 | |||||
Tax effect of adjustments(7) | (14,858) | (10,391) | |||||
One-time tax expense items(8) | (878) | 505 | |||||
Adjusted net income | $ | 54,277 | $ | 44,105 | |||
Earnings per share: | |||||||
Diluted | $ | 0.02 | $ | 0.14 | |||
Adjusted diluted | $ | 0.67 | $ | 0.58 | |||
Weighted average shares outstanding: | |||||||
Diluted | 80,616,326 | 75,921,065 | |||||
Adjusted diluted | 80,616,326 | 75,921,065 | |||||
| (1) | Consists of transaction costs and certain integration costs associated with the Birch Benders Acquisition as well as costs associated with incomplete potential acquisitions and substantial one-time costs related to a large, uncompleted transaction. For the fiscal years ended December 25, 2021 and December 26, 2020, $298 and $337, respectively, are included in cost of sales and $3,929 and $12,059, respectively, are included in total operating expenses. |
| (2) | Consists of costs associated with preparing for an IPO, including public company readiness, primarily comprised of professional fees. For all periods presented, these costs are included in total operating expenses. |
| (3) | Consists of non-cash equity-based compensation expense associated with the grant of equity-based compensation provided to officers, directors and employees. For all periods presented, these costs are included in total operating expenses. |
61
| (4) | Consists of expenses for professional fees related to supply-chain manufacturing optimization and costs associated with SKU rationalization and certain other strategic initiatives. For the fiscal year ended December 25, 2021, there are no costs. For the fiscal year ended December 26, 2020, $586 is included in cost of sales and $1,328 is included in total operating expenses. |
| (5) | Consists of costs related to loss on extinguishment of debt, forgiveness of capital advance, legal and consulting costs associated with the dividend, ERP conversion costs related to integrating acquisitions and employee separation costs. For all periods presented, these costs are included in total operating expenses. |
| (6) | Amortization costs associated with acquired trade names and customer lists. |
| (7) | Tax effect was calculated using the Company's adjusted annual effective tax rate. |
| (8) | Represents the removal for remeasurement of deferred taxes related to intangibles for changes in deferred rate, the removal of the tax effect of non-deductible transaction costs and prior year adjustments of non-deductible items. |
The following table provides a reconciliation of adjusted operating expenses to total operating expenses, its most directly comparable GAAP measure, for each of the periods presented:
Fiscal Year Ended | |||||||||
(In thousands) | December 25, 2021 | December 26, 2020 | December 28, 2019 | ||||||
Selling, general and administrative | $ | $ 135,060 | $ | 124,612 | $ | 94,480 | |||
Depreciation and amortization | 28,871 | 24,744 | 23,771 | ||||||
Impairment of goodwill and intangible assets | — | — | 17,163 | ||||||
Loss on extinguishment of debt | 15,382 | — | — | ||||||
Forgiveness of capital advance | 5,000 | — | — | ||||||
Total operating expenses | 184,313 | 149,356 | 135,414 | ||||||
Impairment of goodwill and intangible assets(1) | — | — | (17,163) | ||||||
Transaction and integration costs(2) | (3,929) | (12,059) | (5,425) | ||||||
Initial public offering readiness(3) | (5,559) | (2,701) | (280) | ||||||
Non-cash equity-based compensation(4) | (9,823) | (1,915) | (2,134) | ||||||
Supply chain optimization(5) | — | (1,328) | — | ||||||
Non-recurring costs(6) | (21,245) | (1,012) | (4,626) | ||||||
Total adjusted operating expenses | $ | 143,757 | $ | 130,341 | $ | 105,786 | |||
| (1) | Consists of expenses for impairment of goodwill and intangible assets. |
| (2) | Consists of transaction costs and certain integration costs associated with the Birch Benders Acquisition as well as costs associated with incomplete potential acquisitions and substantial one-time costs related to a large, uncompleted transaction. |
| (3) | Consists of costs associated with preparing for an IPO, including public company readiness, primarily comprised of professional fees. |
| (4) | Consists of non-cash equity-based compensation expense associated with the grant of equity-based compensation provided to officers, directors and employees. |
| (5) | Consists of expenses for professional fees related to supply-chain manufacturing optimization and costs associated with SKU rationalization and certain other strategic initiatives. |
62
| (6) | Consists of costs related to loss on extinguishment of debt, forgiveness of capital advance, legal and consulting costs associated with the dividend, ERP conversion costs related to integrating acquisitions and employee separation costs. |
We adjust the GAAP financial measures for reported income tax (expense) benefit and reported effective tax rate to exclude the effect of impairment of goodwill and intangible assets, transaction and integration costs, IPO readiness, non-cash equity-based compensation, supply chain optimization, acquisition amortization and other non-recurring costs impacting comparability. We excluded the items which we believe may obscure trends in our pre-tax income and the related tax effect of those items on our adjusted effective tax rate, and other impacts to tax expense. This non-GAAP financial measure is intended to provide a meaningful comparison of the Company’s effective tax rate, excluding the pre-tax income and tax effect of the items noted above, for the periods presented. Management uses this non-GAAP financial measure to monitor the effectiveness of adjustments on our tax rate.
The following table provides reconciliations of reported income tax (expense) benefit to adjusted income tax (expense) benefit and reported effective tax rate to adjusted effective tax rate for fiscal 2021, fiscal 2020 and fiscal 2019:
Fiscal Year Ended | |||||||||||
(In thousands) |
| December 25, 2021 |
| December 26, 2020 | December 28, 2019 | ||||||
Reported income tax (expense) benefit |
| $ | (3,675) | $ | (6,677) | | $ | 18,626 | |||
Impairment of goodwill and intangible assets |
| — | — | | (695) | ||||||
Transaction and integration costs |
| (1,032) | (5,808) | | (936) | ||||||
Initial public offering readiness |
| (1,716) | (663) | | (68) | ||||||
Non-cash equity-based compensation |
| (229) | — | | — | ||||||
Supply chain optimization |
| — | (480) | | (595) | ||||||
Non-recurring costs |
| (5,186) | (249) | | (1,120) | ||||||
Acquisition amortization |
| (7,573) | (2,686) | | (13,232) | ||||||
Adjusted income tax (expense) benefit(1) |
| $ | (19,411) | $ | (16,563) | | $ | 1,980 | |||
|
| | | | |||||||
|
| | | | |||||||
Reported effective tax rate |
| 65.8 | % | 38.2 | % | 40.7 | % | ||||
Impairment of goodwill and intangible assets |
| — | — | (2.6) | |||||||
Transaction and integration costs |
| (2.6) | (6.4) | (3.6) | |||||||
Initial public offering readiness |
| (4.3) | (0.7) | (0.3) | |||||||
Non-cash equity-based compensation |
| (0.6) | — | — | |||||||
Supply chain optimization |
| — | (0.5) | (2.3) | |||||||
Non-recurring costs |
| (13.0) | (0.3) | (4.3) | |||||||
Acquisition amortization |
| (19.0) | (3.0) | (50.5) | |||||||
Adjusted effective tax rate(1) |
| 26.3 | % | 27.3 | % | (22.9) | % | ||||
(1) The adjustments to reported income tax (expense) benefit and reported effective tax rate represent the tax effect of the reconciling items included in the adjusted net income table above. See “Non-GAAP Financial Measures” for definitions of our reported income tax (expense) benefit to adjusted income tax (expense) benefit and reported effective tax rate to adjusted effective tax rate.
Liquidity and Capital Resources
Our primary sources of liquidity include cash flow from operations, cash and cash equivalents and credit capacity under our Credit Facilities and proceeds from equity offerings. As of December 25, 2021, we had cash and equivalents of $66.2 million and availability under our First Lien Credit Agreement of $125.0 million.
63
We expect to use cash primarily for working capital, capital expenditures, lease obligations, principal and interest payments on our debt and to support potential acquisitions. We estimate that our capital expenditures will be approximately $16 million to $20 million in fiscal 2022, which we plan to fund with cash generated from our operating activities.
We have purchase commitments of approximately $4.8 million and $7.0 million to third-party and related-party manufacturers and suppliers, respectively, over the next 12 months, primarily for materials and supplies used in the manufacture of our products. In addition, as of December 25, 2021, the Company had a commitment to purchase equipment at a co-packing manufacturing facility of $4.8 million to be paid by February 2022.
The capital lease liability for our Bellvue, Colorado facility at December 25, 2021 was $6.8 million, recorded net of imputed interest of $14.7 million. The current portion of the capital lease liability of $19.9 thousand and the long-term portion of $6.8 million is recorded within long-term debt, net of debt issuance costs in the Consolidated Balance Sheets. The imputed interest rate is 7.9%.
As of September 27, 2021, we received $263.2 million from the closing of the IPO, and on October 5, 2021, we received an additional $39.5 million from the exercise of the underwriters’ option to purchase additional shares. These proceeds were used to pay off the $200.0 million Initial Second Lien Loans and prepay $99.2 million of the Initial First Lien Term Loans. As a result of the prepayment on the Initial First Lien Term Loans, all future principal payments have been eliminated for the remaining term of the loan. Due to the reduction of $299.2 million in debt, we estimate interest expense will be decreased by approximately $22 million over the next 12 months based on the current interest rate. Our total indebtedness was $487.9 million as of December 25, 2021.
We believe that our cash flow from operations, availability under our Revolving Facility (as defined herein) and available cash and cash equivalents will be sufficient to meet our liquidity needs for at least the next 12 months. We anticipate that to the extent that we require additional liquidity, it will be funded through the incurrence of additional indebtedness, the issuance of equity, or a combination thereof. We cannot assure you that we will be able to obtain this additional liquidity on reasonable terms, or at all. Additionally, our liquidity and our ability to meet our obligations and fund our capital requirements are also dependent on our future financial performance, which is subject to general economic, financial and other factors that are beyond our control. Accordingly, we cannot assure you that our business will generate sufficient cash flow from operations or that future borrowings will be available from additional indebtedness or otherwise to meet our liquidity needs. We may incur additional debt or sell additional equity to finance future acquisitions, which would result in additional expenses or dilution.
Credit Facilities and Unused Borrowing Capacity
On June 8, 2021, Sovos Intermediate (the “Borrower”) entered into (i) the First Lien Credit Agreement, pursuant to which the First Lien Lenders agreed to provide senior secured credit facilities, consisting of (a) an initial first lien term loan facility in an original principal amount of $580.0 million (the “Initial First Lien Term Loan Facility” and the loans thereunder, the “Initial First Lien Term Loans”) and (b) a revolving facility in an original principal amount of $125.0 million (the “Revolving Facility” and the loans thereunder, the “Initial Revolving Loans”), including a letter of credit facility with a $45.0 million sublimit, and (ii) a Second Lien Credit Agreement, (the “Second Lien Credit Agreement”) among Sovos Intermediate, Sovos Brands Holdings, Inc., Owl Rock Capital Corporation, as administrative agent and collateral agent, and the lenders from time to time party thereto (“Second Lien Lenders”), pursuant to which the Second Lien Lenders agreed to provide a second lien secured credit facility, consisting of an initial term loan facility in an original principal amount of $200.0 million (the “Initial Second Lien Facility” and the loans thereunder, the “Initial Second Lien Loans,” and together with the Initial First Lien Term Loans and the Initial Revolving Loans, collectively, the “Credit Facilities”). Our Senior Credit Facilities consisted of (i) an initial term loan facility in an original principal amount equal to $280.0 million, (ii) a revolving credit facility in an original principal amount equal to $45.0 million, including a letter of credit facility with a $15.0 million sublimit, and (iii) an incremental term loan commitment in an original principal amount equal to $100.0 million (collectively, the “Senior Credit Facilities”).
64
In June 2021, we used the proceeds of the Initial First Lien Term Loans and the Initial Second Lien Loans to repay the full amounts outstanding under our Senior Credit Facilities and finance a dividend of $400.0 million to the sole stockholder of Sovos Intermediate, which was ultimately distributed to the limited partners of the Limited Partnership.
In September 2021, using net proceeds of the IPO, we paid the full outstanding principal balance on the Initial Second Lien Loans of $200.0 million. Additionally, in September 2021 and October 2021, we prepaid $59.7 million and $39.5 million, respectively, of the outstanding principal balance under the Initial First Lien Term Loans
The interest rate for the Initial First Lien Term Loans and the Initial Revolving Loans is (at the Borrower's option) either (a) LIBO Rate (as defined in the First Lien Credit Agreement) plus the applicable LIBO Rate spread or (b) Alternate Base Rate (as defined in the First Lien Credit Agreement) plus the applicable Alternate Base Rate spread. The Initial First Lien Term Loans mature on June 8, 2028 and the Initial Revolving Loans mature on June 8, 2026.
The interest rate for the Initial Second Lien Loans was (at the Borrower’s option) either (a) the LIBO Rate (as defined in the Second Lien Credit Agreement) plus 8.00% per annum or (b) the Alternate Base Rate (as defined in the Second Lien Credit Agreement) plus 7.00% per annum. The Initial Second Lien Loans were originally scheduled to mature on June 8, 2029. As described above, in September 2021, the Initial Second Lien Loans were paid in full.
As of December 25, 2021, we have available credit of $125.0 million under the Revolving Facility. No revolving loans were outstanding as of December 25, 2021 or December 26, 2020. As of December 25, 2021, the effective interest rate for the Initial First Lien Term Loans and Revolving Facility was 4.50%. As of December 26, 2020, the effective interest rate for the Incremental Term Loan and the 2018 Term Loan (each as defined in Note 10. Long-Term Debt to the consolidated financial statements in this Form 10-K) was 5.70%.
The First Lien Credit Agreement contains various financial, affirmative and negative covenants that we must adhere to. Under the First Lien Credit Agreement, the Borrower is required to comply with a springing financial covenant, which requires the Borrower to maintain a first lien net leverage ratio of consolidated first lien net debt to consolidated EBITDA (with certain adjustments as set forth in the First Lien Credit Agreement) of no greater than 6.95:1.00. Such financial covenant is tested only if outstanding revolving loans (excluding any undrawn letters of credit) minus unrestricted cash exceeds 35% of the aggregate revolving credit commitments. The financial covenant is subject to customary “equity cure” rights. In addition, under the First Lien Credit Agreement, an annual excess cashflow calculation is required, to determine if any excess is required to be paid on the Initial First Lien Term Loan Facility. As of December 25, 2021, the Company had no outstanding revolving loans, so did not meet the requirement to test the financial covenant under the First Lien Credit Agreement. As of December 26, 2020, the Company was compliant with its financial covenants under the Amended Credit Agreement, and no cash was required to be paid on the Incremental Term Loan and 2018 Term Loan.
Long-term debt as of December 25, 2021 consisted of the following:
December 25, 2021 | |||||||||
Unamortized debt | Total debt, | ||||||||
(In thousands) | Principal | issuance costs | net | ||||||
Initial First Lien Term Loan Facility |
| $ | 480,800 |
| $ | (6,377) |
| $ | 474,423 |
Finance lease liabilities | 7,095 | — |
| 7,095 | |||||
Total debt | $ | 487,895 | $ | (6,377) | 481,518 | ||||
Less: current portion of finance lease liabilities | | | | | | | |
| 98 |
Total long-term debt |
|
| $ | 481,420 | |||||
65
Long-term debt as of December 26, 2020 consisted of the following:
December 26, 2020 | |||||||||
|
| Unamortized debt |
| Total debt, | |||||
(In thousands) | Principal | issuance costs | net | ||||||
Senior debt | $ | 374,146 | $ | (10,282) | $ | 363,864 | |||
Revolver |
| — |
| — |
| — | |||
Total debt | $ | 374,146 | $ | (10,282) |
| 363,864 | |||
Less: current portion of long-term debt |
|
|
|
| 3,818 | ||||
Long-term debt |
|
|
|
| $ | 360,046 | |||
Statement of Cash Flows
The following table presents a summary of our cash flows provided by (used in) operating, investing and financing activities for the periods presented:
Fiscal Year Ended | ||||||
(In thousands) | December 25, 2021 |
| December 26, 2020 | |||
Cash provided by (used in): |
|
|
|
| ||
Operating activities | $ | 46,943 | $ | 62,914 | ||
Investing activities |
| (14,182) |
| (150,139) | ||
Financing activities |
| (3,633) |
| 93,570 | ||
Change in cash and cash equivalents | $ | 29,128 | $ | 6,345 | ||
Cash Provided by Operating Activities
Cash provided by operating activities was $46.9 million for the 52 weeks ended December 25, 2021, a decrease of $16.0 million from $62.9 million for the 52 weeks ended December 26, 2020. The decrease was primarily due to a $8.9 million decrease in net income, $39.3 million use of cash in operating assets and liabilities, partially offset by a $32.2 million increase of non-cash operating activities in the 52 weeks ended December 25, 2021 compared to the same period in 2020.
The $39.3 million increase in cash used in operating assets and liabilities was primarily due to $29.0 million cash used due to a decrease in accrued expenses as a result of payments of incentive compensation, accrued interest and professional fees, and $8.8 million cash used due to an increase in prepaid expenses and other current assets primarily due to capitalized IPO cost payments and increased director and officer liability insurance premium payments. The $32.2 million increase in non-cash charges was primarily related to a $15.4 million loss on extinguishment of debt from the repayment of the Senior Credit Facilities, repayment of the Initial Second Lien Facility and prepayment of the Initial First Lien Term Loan Facility, a $7.9 million increase in equity-based compensation from pre-IPO equity plan modifications and new IPO grants, a $5.0 million loss on credit write-off related to forgiveness of the capital advance with one of our suppliers, a $4.0 million increase in amortization of intangibles related to the Birch Benders Acquisition, and a $2.3 million increase in non-cash operating lease expense as a result of our current year adoption of ASC 842, partially offset by a $2.5 million decrease in deferred income taxes.
Cash Used in Investing Activities
Cash used in investing activities was $14.2 million for the fiscal year ended December 25, 2021, a decrease of $136.0 million compared to cash used in investing activities of $150.1 million for the fiscal year ended December 26, 2020. The
66
decrease in cash used in investing activities was related to no acquisitions in fiscal 2021 compared to $146.4 million of cash used in connection with the Birch Benders Acquisition in fiscal 2020, partially offset by increased capital expenditures of $10.4 million due to the addition of a production line and a freezer upgrade at our Austin, Texas manufacturing facility and new production equipment at a co-packing manufacturing facility.
Cash Used in Financing Activities
Cash used in financing activities was $3.6 million for the fiscal year ended December 25, 2021, a difference of $97.2 million compared to cash provided by financing activities of $93.6 million for the fiscal year ended December 26, 2020. For the fiscal year ended December 25, 2021, $3.6 million of cash was used in financing activities primarily driven by a $400.0 million dividend payment, $374.1 million repayment of the Senior Credit Facilities, $200.0 million repayment of the Initial Second Lien Facility, and $99.2 million prepayment of the Initial First Lien Term Loan Facility, partially offset by $766.1 million net debt proceeds from the Credit Facilities and $302.7 million in net proceeds from our IPO and the underwriters’ purchase of additional shares. For the fiscal year ended December 26, 2020, $93.6 million of cash was provided by financing activities from the $96.7 million net debt proceeds from the Senior Credit Facilities, offset by $3.1 million of debt payments.
Off-Balance Sheet Arrangements
As of December 25, 2021, we had no off-balance sheet arrangements that have or are reasonably likely to have a current or future material effect on our financial condition, changes in financial condition, income or expenses, results of operations, liquidity, capital expenditures or capital resources.
Critical Accounting Policies
Our discussion and analysis of our financial condition and results of operations is based upon our consolidated financial statements and related notes included elsewhere in this report, which have been prepared in accordance with GAAP. The preparation of these financial statements and related notes requires us to make estimates and judgments regarding matters that are uncertain and susceptible to change and that affect the reported amounts of assets, liabilities, revenue and expenses. Critical accounting policies are defined as those policies that are reflective of significant judgments, estimates and uncertainties, which could potentially result in materially different results under different assumptions and conditions. Certain of our accounting policies require the application of significant judgment by management in selecting the appropriate assumptions for calculating financial estimates. By their nature, these judgments are subject to an inherent degree of uncertainty. These judgments are based on our historical experience, current conditions, terms of existing contracts, our evaluation of trends in the industry, information provided by our customers, information available from other outside sources and various other assumptions that we believe to be reasonable under the circumstances, as appropriate. We regularly evaluate our estimates, judgments and assumptions for reasonableness and adequacy. Our actual results may differ from these estimates. To the extent that there are differences between our estimates and actual results, our future financial statement presentation, financial condition, results of operations and cash flows may be affected. Judgments and uncertainties affecting the application of those policies may result in materially different amounts being reported under different conditions or using different assumptions. The accounting policies that we believe to be the most critical to an understanding of our financial condition and results of operations and that require significant, difficult, subjective or complex judgments are discussed in Note 2. Summary of Significant Accounting Policies, to the consolidated financial statements in this Form 10-K.
Revenue Recognition
We sell a variety of Italian sauces, dry pastas, soups, yogurts, frozen entrées, pancake and waffle mixes, other baking mixes and frozen waffles to retailers through a variety of channels across the United States.
We recognize revenue when performance obligations are satisfied by transferring control of the goods to our customers. Control is transferred at a point in time, upon delivery of the goods to the customer. The customer is invoiced
67
with payment terms which are commensurate with the customer’s credit profile. Shipping and/or handling costs that occur before the customer obtains control of the good are deemed to be fulfillment activities (i.e., an expense) rather than a promised service and are recorded in cost of sales.
We assess the goods promised in our customers’ purchase orders and identify a performance obligation for each promise to transfer a good (or bundle of goods) that is distinct. To identify the performance obligations, we consider all the goods promised, whether explicitly stated or implied based on customary business practices.
Revenue is measured as the amount of consideration expected to be entitled to in exchange for fulfilled product orders, including estimates of variable consideration. The most common forms of variable consideration include trade promotions, such as consumer incentives, coupon redemptions and other marketing activities, allowances for unsaleable product, and any additional amounts where a distinct good or service cannot be identified or the value cannot be reasonably estimated. Trade promotions are recorded as a reduction to net sales with a corresponding reduction to accounts receivable at the time of revenue recognition for the underlying sale. The recognition of trade promotions requires management to make estimates regarding the volume of incentives that will be redeemed and their total cost.
We do not adjust the promised amount of consideration for the effects of significant financing components as we expect, at contract inception, that the period between the transfer of a promised good to a customer and when the customer pays for that good will be one year or less.
Business Combinations
The Company uses the acquisition method of accounting in accordance with Financial Accounting Standards Board (FASB) Accounting Standards Codification (ASC) 805, Business Combinations. Each acquired company’s operating results are included in the Company’s consolidated financial statements starting on the date of acquisition. The purchase price is equivalent to the fair value of consideration transferred. Tangible and identifiable intangible assets acquired and liabilities assumed as of the date of acquisition are recorded at the acquisition date fair value. Goodwill is recognized for the excess of purchase price over the net fair value of assets acquired and liabilities assumed. Amounts allocated to assets and liabilities are based upon estimated fair values. Such values require management to make significant estimates and assumptions, especially with respect to the identifiable intangible assets. Management makes estimates of fair value based upon assumptions believed to be reasonable and that of a market participant. These estimates are based on historical experience and information obtained from the management of the acquired companies, which are inherently uncertain. The separately identifiable intangible assets generally include customer relationships and tradenames.
For any given acquisition, we may identify certain pre-acquisition contingencies. We estimate the fair value of such contingencies, which are included as part of the assets acquired or liabilities assumed, as appropriate. Differences from these estimates are recorded in the consolidated statement of operations in the period in which they are identified.
Goodwill and Other Intangible Assets
Our total assets include substantial goodwill intangible assets, such as tradenames and trademarks. Goodwill and indefinite-lived intangible assets are tested for impairment at least annually and whenever events or circumstances occur indicating that goodwill or indefinite-lived intangible assets might be impaired. We perform the annual impairment tests on the first day of the Company’s fourth quarter. Goodwill is tested for impairment at the reporting unit level. A reporting unit is an operating segment or a component of an operating segment.
Goodwill and indefinite-lived intangible assets are tested for impairment by performing a qualitative evaluation and a quantitative test. The qualitative assessment evaluates factors including macro-economic conditions, industry- and company-specific factors and historical company performance in assessing fair value. If it is determined that it is more likely than not that the fair value of the reporting unit or indefinite- lived asset is less than the carrying value, a quantitative test is then performed. Otherwise, no further testing is required.
68
When using a quantitative approach to assess goodwill for impairment, the Company compares the fair value of the reporting unit to the carrying amount, including goodwill. If the estimated fair value of the reporting unit is less than its carrying amount, impairment is indicated, requiring recognition of an impairment charge for the differential. The Company uses a blended analysis of a discounted cash flow model and a market valuation approach to determine the fair values of its reporting units. Determining the fair value of a reporting unit is judgmental in nature and involves the use of significant estimates and assumptions. Future adverse changes in market conditions or poor operating results of these underlying assets could result in losses or an inability to recover the carrying value of the asset that may not be reflected in the asset’s current carrying value, thereby possibly requiring impairment charges in the future.
For indefinite-lived intangible assets, impairment is assessed by comparing the fair value of the asset with its carrying value, and a loss is recognized for the difference if the fair value is less than the carrying value. When estimating the fair value, the Company uses certain assumptions, such as forecasted growth rates and cost of capital. These assumptions are consistent with internal projections and operating plans. Unanticipated market or macroeconomic events and circumstances may occur, which could affect the accuracy or validity of the estimates and assumptions. For example, future changes in the judgments, assumptions and estimates that are used in our tradename impairment testing could result in significantly different estimates of the fair values. In addition, changes to, or a failure to achieve business plans or deterioration of macroeconomic conditions could result in reduced cash flows or higher discount rates, leading to a lower valuation that would trigger an impairment of the tradename.
Recently Issued Accounting Pronouncements
See Note 2. Summary of Significant Accounting Policies, to the consolidated financial statements for a discussion of recently issued accounting pronouncements.
Item 7A. Quantitative and Qualitative Disclosures about Market Risk
We are exposed to the following market risks:
Commodity and Packaging Prices and Inflation
In the fiscal year ended December 25, 2021, we experienced increased cost of sales, as a percentage of net sales, including higher freight and shipping costs and raw material costs. We continue to expect higher inflation and distribution costs given the tight global supply chain and current geopolitical tensions. Consistent with the industry, we are seeing cost increases in several raw materials such as milk, animal proteins, fruit, resin, and cardboard. Transportation challenges continue to be acute, particularly due to logistical issues at major ports as well as intermodal and trucking delays, which have resulted in long lead times and higher logistics costs.
Interest Rate Risk
We are exposed to interest rate risk through fluctuations in interest rates on our debt obligations. Interest rate changes do not affect the market value of such debt, but could impact the amount of our interest payments, and accordingly, our future earnings and cash flows, assuming other factors are held constant. As of December 25, 2021, we had $480.8 million of variable rate debt outstanding under our Credit Facilities. See Item 7, “Management’s Discussion and Analysis of Financial Condition and Results of Operations—Liquidity and Capital Resources — Credit Facilities and Unused Borrowing Capacity” above. Based upon our principal amount of long-term debt outstanding at December 25, 2021, a hypothetical 1% increase or decrease over a LIBOR base of 0.75% would impact our annual interest expense in the next year by approximately $4.9 million.
69
Item 8. Financial Statements and Supplementary Data
INDEX TO FINANCIAL STATEMENTS
Page | |
Audited Consolidated Financial Statements | |
Report of Independent Registered Public Accounting Firm (PCAOB ID No. 34) | 71 |
Consolidated Balance Sheets as of December 25, 2021 and December 26, 2020 | 72 |
73 | |
74 | |
75 | |
77 |
70
REPORT OF INDEPENDENT REGISTERED PUBLIC ACCOUNTING FIRM
To the stockholders and the Board of Directors of Sovos Brands, Inc.
Opinion on the Financial Statements
We have audited the accompanying consolidated balance sheets of Sovos Brands, Inc. and subsidiaries (the "Company"), as of December 25, 2021 and December 26, 2020, the related consolidated statements of operations, stockholders' equity and cash flows, for each of the three years in the period ended December 25, 2021, and the related notes and schedules (collectively referred to as the "financial statements"). In our opinion, the financial statements present fairly, in all material respects, the financial position of the Company as of December 25, 2021 and December 26, 2020, and the results of its operations and its cash flows for each of the three years in the period ended December 25, 2021, in conformity with accounting principles generally accepted in the United States of America.
Basis for Opinion
These financial statements are the responsibility of the Company's management. Our responsibility is to express an opinion on the Company's financial statements based on our audits. We are a public accounting firm registered with the Public Company Accounting Oversight Board (United States) (PCAOB) and are required to be independent with respect to the Company in accordance with the U.S. federal securities laws and the applicable rules and regulations of the Securities and Exchange Commission and the PCAOB.
We conducted our audits in accordance with the standards of the PCAOB. Those standards require that we plan and perform the audit to obtain reasonable assurance about whether the financial statements are free of material misstatement, whether due to error or fraud. The Company is not required to have, nor were we engaged to perform, an audit of its internal control over financial reporting. As part of our audits, we are required to obtain an understanding of internal control over financial reporting but not for the purpose of expressing an opinion on the effectiveness of the Company’s internal control over financial reporting. Accordingly, we express no such opinion.
Our audits included performing procedures to assess the risks of material misstatement of the financial statements, whether due to error or fraud, and performing procedures that respond to those risks. Such procedures included examining, on a test basis, evidence regarding the amounts and disclosures in the financial statements. Our audits also included evaluating the accounting principles used and significant estimates made by management, as well as evaluating the overall presentation of the financial statements. We believe that our audits provide a reasonable basis for our opinion.
/s/ Deloitte & Touche LLP
Denver, Colorado
March 15, 2022
We have served as the Company's auditor since 2017.
71
Sovos Brands, Inc.
Consolidated Balance Sheets
(Dollars in thousands, except par value and share data)
| December 25, 2021 |
| December 26, 2020 | |||
ASSETS |
|
|
|
| ||
CURRENT ASSETS: |
|
|
|
| ||
Cash and cash equivalents | $ | 66,154 | $ | 37,026 | ||
Accounts receivable, net |
| 70,729 |
| 60,996 | ||
Inventories |
| 51,615 |
| 47,069 | ||
Prepaid expenses and other current assets |
| 6,685 |
| 4,388 | ||
Total current assets |
| 195,183 |
| 149,479 | ||
Property and equipment, net |
| 62,671 |
| 59,481 | ||
Operating lease right-of-use assets | 15,672 | — | ||||
Goodwill |
| 437,451 |
| 437,290 | ||
Intangible assets, net |
| 464,655 |
| 491,895 | ||
Other long-term assets |
| 2,299 |
| 6,681 | ||
TOTAL ASSETS | $ | 1,177,931 | $ | 1,144,826 | ||
LIABILITIES AND STOCKHOLDERS’ EQUITY |
|
|
|
| ||
CURRENT LIABILITIES: |
|
|
|
| ||
Accounts payable | $ | 37,254 | $ | 31,170 | ||
Accrued expenses |
| 51,757 |
| 65,101 | ||
Current portion of long-term debt |
| 98 |
| 3,818 | ||
Current portion of long-term lease liabilities | 3,216 | — | ||||
Total current liabilities |
| 92,325 |
| 100,089 | ||
Long-term debt, net of debt issuance costs |
| 481,420 |
| 360,046 | ||
Deferred income taxes |
| 76,976 |
| 74,733 | ||
Long-term operating lease liabilities | 17,302 | — | ||||
Other long-term liabilities |
| 421 |
| 13,257 | ||
TOTAL LIABILITIES |
| 668,444 |
| 548,125 | ||
COMMITMENTS AND CONTINGENCIES (Note 12) |
|
|
|
| ||
STOCKHOLDERS’ EQUITY: |
|
|
|
| ||
Preferred stock, $0.001 par value per share, 10,000,000 shares authorized, no shares issued and outstanding | ||||||
Common stock, $0.001 par value per share, 500,000,000 shares authorized, 100,892,547 and 74,058,447 shares and as of December 25, 2021 and December 26, 2020, respectively |
| 101 |
| 74 | ||
Stockholder's note receivable |
| — |
| (6,000) | ||
Additional paid-in-capital |
| 559,226 |
| 654,386 | ||
Accumulated deficit |
| (49,840) |
| (51,759) | ||
TOTAL STOCKHOLDERS’ EQUITY |
| 509,487 |
| 596,701 | ||
TOTAL LIABILITIES AND STOCKHOLDERS’ EQUITY | $ | 1,177,931 | $ | 1,144,826 | ||
The accompanying notes are an integral part of these consolidated financial statements.
72
Sovos Brands, Inc.
Consolidated Statements of Operations
(Dollars in thousands, except share and per share data)
Fiscal Year Ended | |||||||||
| December 25, 2021 |
| December 26, 2020 | December 28, 2019 | |||||
$ | 719,186 | $ | 560,067 | $ | 388,004 | ||||
| 498,394 |
| 373,314 | 275,386 | |||||
Gross profit |
| 220,792 |
| 186,753 |
| 112,618 | |||
Operating expenses: | |||||||||
Selling, general and administrative |
| 135,060 |
| 124,612 | 94,480 | ||||
Depreciation and amortization |
| 28,871 |
| 24,744 | 23,771 | ||||
Loss on extinguishment of debt | 15,382 | — | — | ||||||
Forgiveness of capital advance | 5,000 | — | — | ||||||
Impairment of goodwill and intangible assets |
| — |
| — | 17,163 | ||||
Total operating expenses | 184,313 | 149,356 | 135,414 | ||||||
Operating income (loss) |
| 36,479 |
| 37,397 |
| (22,796) | |||
Interest expense |
| 30,885 |
| 19,895 | 22,975 | ||||
Income (loss) before income taxes |
| 5,594 |
| 17,502 |
| (45,771) | |||
Income tax (expense) benefit |
| (3,675) |
| (6,677) | 18,626 | ||||
Net income (loss) | $ | 1,919 | $ | 10,825 | $ | (27,145) | |||
Earnings (loss) per share: |
|
|
|
| |||||
Basic | $ | 0.02 | $ | 0.15 | $ | (0.37) | |||
Diluted | $ | 0.02 | $ | 0.14 | $ | (0.37) | |||
Weighted average shares outstanding: |
|
| |||||||
Basic |
| 80,616,326 |
| 74,058,569 | 73,912,746 | ||||
Diluted |
| 80,616,326 |
| 75,921,065 | 73,912,746 | ||||
The accompanying notes are an integral part of these consolidated financial statements.
73
Sovos Brands, Inc.
Consolidated Statements of Changes in Stockholders’ Equity
(Dollars in thousands, except share data)
|
|
| Stockholders’ |
| Additional |
| Retained Earnings |
| Total | ||||||||
Common Stock | Notes | Paid-in | (Accumulated | Stockholders’ | |||||||||||||
Shares | Amount | Receivable | Capital | Deficit) | Equity | ||||||||||||
Balance as of December 29, 2018 |
| 72,858,366 | $ | 73 | $ | — | $ | 639,014 | $ | (35,439) | $ | 603,648 | |||||
Cash contributions from Ultimate Parent |
| 618,865 |
| — |
| — |
| 5,891 |
| — |
| 5,891 | |||||
Issuance of notes to stockholders |
| 630,258 |
| 1 |
| (6,000) |
| 5,999 |
| — |
| — | |||||
Equity-based compensation expense |
| — |
| — |
| — |
| 2,119 |
| — |
| 2,119 | |||||
Cash contributions to Ultimate Parent |
| (48,742) |
| — |
| — |
| (516) |
| — |
| (516) | |||||
Net loss |
| — |
| — |
| — |
| — |
| (27,145) |
| (27,145) | |||||
Balance as of December 28, 2019 | 74,058,747 | $ | 74 | $ | (6,000) | $ | 652,507 | $ | (62,584) | $ | 583,997 | ||||||
Equity-based compensation expense | — | — | — | 1,914 | — | 1,914 | |||||||||||
Cash contributions to Ultimate Parent | (300) | — | — | (35) | — | (35) | |||||||||||
Net income | — | — | — | — | 10,825 | 10,825 | |||||||||||
Balance at December 26, 2020 |
| 74,058,447 | $ | 74 | $ | (6,000) | $ | 654,386 | $ | (51,759) | $ | 596,701 | |||||
Proceeds from stockholder's note receivable |
| — | — | 6,000 | — | — | 6,000 | ||||||||||
Dividend distribution ($5.40 per share) | — | — | — | (400,000) | — | (400,000) | |||||||||||
Proceeds from issuance of public stock | 26,834,100 | 27 | — | 321,982 | — | 322,009 | |||||||||||
Underwriter discount on issuance of public stock | — | — | — | (19,320) | — | (19,320) | |||||||||||
Capitalized IPO costs netted with IPO proceeds | — | — | — | (7,645) | — | (7,645) | |||||||||||
Equity-based compensation expense |
| — |
| — |
| — |
| 9,823 |
| — |
| 9,823 | |||||
Net income | — | — | — | — | 1,919 | 1,919 | |||||||||||
Balance at December 25, 2021 |
| 100,892,547 | $ | 101 | $ | — | $ | 559,226 | $ | (49,840) | $ | 509,487 | |||||
The accompanying notes are an integral part of these consolidated financial statements.
74
Sovos Brands, Inc.
Consolidated Statements of Cash Flows
(in thousands)
Fiscal Year Ended | |||||||||
| December 25, 2021 |
| December 26, 2020 |
| December 28, 2019 | ||||
Operating activities |
|
|
|
| |||||
Net income (loss) | $ | 1,919 | $ | 10,825 | $ | (27,145) | |||
Adjustments to reconcile net income (loss) to net cash provided by operating activities: |
|
|
| ||||||
Depreciation and amortization |
| 37,812 |
| 33,797 | 33,055 | ||||
Equity-based compensation expense |
| 9,823 |
| 1,914 | 2,119 | ||||
Deferred income taxes |
| 2,243 |
| 4,749 | (16,497) | ||||
Amortization of debt issuance costs |
| 1,883 |
| 1,775 | 1,670 | ||||
Non-cash operating lease expense |
| 2,278 |
| — | — | ||||
Loss on disposal of property and equipment |
| 307 |
| 757 | 123 | ||||
Loss on impairment of goodwill and intangible assets | — | — | 17,163 | ||||||
Loss on extinguishment of debt | 15,382 | — | — | ||||||
Forgiveness of capital advance | 5,000 | — | — | ||||||
Other |
| 697 |
| 201 | (225) | ||||
Changes in operating assets and liabilities: |
|
|
| ||||||
Accounts receivable, net |
| (9,387) |
| (11,297) | (5,539) | ||||
Inventories |
| (5,449) |
| (6,912) | (6,180) | ||||
Prepaid expenses and other current assets |
| (9,567) |
| (796) | 4,267 | ||||
Other long-term assets |
| (35) |
| (106) | 57 | ||||
Accounts payable |
| 6,242 |
| 5,478 | 8,121 | ||||
Accrued expenses |
| (8,395) |
| 20,647 | (1,943) | ||||
Other long-term liabilities |
| (979) |
| 1,882 | 2,515 | ||||
Operating lease liabilities | (2,831) | — | — | ||||||
Net cash provided by operating activities |
| 46,943 |
| 62,914 |
| 11,561 | |||
Investing activities |
|
|
|
| |||||
Acquisition of businesses, net of cash acquired |
| — |
| (146,406) | — | ||||
Purchases of property and equipment |
| (14,182) |
| (3,733) | (12,682) | ||||
Net cash used in investing activities |
| (14,182) |
| (150,139) |
| (12,682) | |||
Financing activities |
|
|
|
| |||||
Contributions from Ultimate Parent |
| — |
| — | 5,891 | ||||
Contributions to Ultimate Parent |
| — |
| (35) | (516) | ||||
Payments of debt issuance costs |
| (3,046) |
| (2,263) | — | ||||
Proceeds from long-term debt |
| 769,136 |
| 99,015 | — | ||||
Repayments of long-term debt |
| (673,346) |
| (3,054) | (2,800) | ||||
Repayments of capital lease obligations |
| (66) |
| (93) | (174) | ||||
Proceeds from revolving facility | — |
| 42,500 | — | |||||
Repayments of revolving facility |
| — |
| (42,500) | — | ||||
Net proceeds from issuance of common stock | 302,689 | — | — | ||||||
Proceeds from stockholder's note receivable |
| 6,000 |
| — | — | ||||
Contingent earnout consideration paid | (5,000) | — | — | ||||||
Dividend paid | (400,000) | — | — | ||||||
Net cash provided by (used in) financing activities |
| (3,633) |
| 93,570 |
| 2,401 | |||
Cash and cash equivalents | |||||||||
Net increase in cash and cash equivalents |
| 29,128 |
| 6,345 | 1,280 | ||||
Cash and cash equivalents at beginning of period |
| 37,026 |
| 30,681 | 29,401 | ||||
Cash and cash equivalents at end of period | $ | 66,154 | $ | 37,026 | $ | 30,681 | |||
75
Fiscal Year Ended | |||||||||
December 25, 2021 | December 26, 2020 | December 28, 2019 | |||||||
Supplemental disclosures of cash flow information |
|
|
|
| |||||
Cash paid for interest | $ | 28,535 |
| $ | 15,493 | $ | 24,045 | ||
Cash paid for taxes |
| 2,522 |
| 1,203 | 1,502 | ||||
Proceeds from income tax refunds |
| (44) |
| (1,798) | (122) | ||||
Non-cash investing and financing transactions |
|
|
| ||||||
Lease liabilities arising from operating lease right-of-use assets recognized at ASU No. 2016-02 transition | $ | 21,711 | $ | — | $ | — | |||
Lease liabilities arising from operating lease right-of-use assets recognized after ASU No. 2016-02 transition | 1,638 | — | — | ||||||
Capitalized IPO costs netted with IPO proceeds | 7,645 | — | — | ||||||
Acquisition of property and equipment not yet paid |
| 39 |
| 153 | 145 | ||||
Contingent earn out consideration related to Birch Benders acquisition (see Note 3) | — | 5,000 | — | ||||||
Acquisition of property and equipment through tenant improvement allowance |
| — |
| 822 | — | ||||
Acquisition of property and equipment through capital leases |
| — |
| 224 | 306 | ||||
Stockholder note receivable issued in exchange for class A units | — | — | 6,000 | ||||||
The accompanying notes are an integral part of these consolidated financial statements.
76
Notes to Consolidated Financial Statements
1. Company Overview
Sovos Brands, Inc. and its subsidiaries (the “Company,” “we,” “our”) is a consumer-packaged food company that creates value for its stockholders through acquisition and executive management of brands in the food industry. On September 22, 2021, Sovos Brands, Inc. priced its initial public offering (the “IPO”) of 23,334,000 shares of its common stock, $0.001 par value per share, which excluded the underwriters’ option to purchase up to an additional 3,500,100 shares of common stock, at an offering price of $12.00 per share. In conjunction with the IPO, the Company became actively traded on the Nasdaq Global Select Market (“NASDAQ”) listed under the trade symbol of “SOVO.” Upon the closing of the IPO on September 27, 2021, the Company issued 23,334,000 shares of its common stock and received approximately $263.2 million, net of underwriting discounts and commissions. Subsequent to the IPO, the underwriters exercised their options to purchase an additional 3,500,100 shares of common stock. The Company closed its sale of such additional shares on October 5, 2021, resulting in net proceeds of approximately $39.5 million, net of underwriting discounts and commissions. See Note 14. Stockholders’ Equity for more information.
Prior to the IPO, Sovos Brands Limited Partnership (the “Ultimate Parent” or the “Limited Partnership”) owned 100% of Sovos Brands, Inc., which owns 100% of Sovos Brands Holdings, Inc., which owns 100% of Sovos Brands Intermediate, Inc. (“Sovos Intermediate”). Sovos Brands Intermediate, Inc. has four wholly-owned operating subsidiaries: Rao’s Specialty Foods, Inc. (“Rao’s”); Bottom Line Food Processors, Inc. doing business as Michael Angelo’s Gourmet Foods, Inc. (“Michael Angelo’s”); Noosa Yoghurt, LLC (“Noosa”); and Birch Benders, LLC (“Birch Benders”). Through its wholly-owned operating subsidiaries, the Company produces and distributes food products in various locations throughout the United States. The Company was founded on January 17, 2017 and has its executive headquarters in Louisville, Colorado.
Description of Business
Sovos Brands, Inc. is a consumer-packaged food company that is focused on acquiring and building disruptive growth brands that bring today’s consumers great tasting food that fits the way they live. The Company’s principal products include a variety of pasta sauces, dry pasta, soups, frozen entrees, yogurts, pancake and waffle mixes, other baking mixes, and frozen waffles, which are primarily sold in the United States. The Company sells products marketed under the brand names Rao’s, Michael Angelo’s, noosa, and Birch Benders which are built with authenticity at their core, providing consumers food experiences that are genuine, delicious, and unforgettable, making each of our brands “one-of-a-kind.” Our products are premium and made with simple, high-quality ingredients. We strive to empower our teams to lead with courage and tenacity, with the goal of providing them with the confidence and agility to connect with our consumers and retail partners to drive unparalleled growth. We believe our focus on “one-of-a-kind” brands, products that people love, and passion for our people makes Sovos Brands a “one-of-a-kind” company and enables us to deliver on our objective of creating a growing and sustainable food enterprise yielding financial growth ahead of industry peers.
The consolidated financial statements include the accounts of Sovos Brands, Inc. and its wholly owned subsidiaries. All intercompany accounts and transactions have been eliminated. Unless the context otherwise requires, “we,” “us,” “our,” “Sovos Brands” and the “Company” refer to Sovos Brands, Inc. and its subsidiaries.
2. Summary of Significant Accounting Policies
Basis of Presentation—The consolidated financial statements have been prepared in conformity with accounting principles generally accepted in the United States of America (“GAAP”) and include the accounts of the Company and its subsidiaries. All intercompany balances and transactions have been eliminated. The consolidated financial statements are presented in U.S. dollars.
77
The Company’s fiscal year ends on the last Saturday closest to December 31 and as a result, a 53rd week is added approximately every sixth year. The fiscal years ended December 25, 2021 (“2021”), December 26, 2020 (“2020”) and December 28, 2019 (“2019”) each had 52 weeks.
Reclassification—Certain prior year amounts have been reclassified for consistency with the current year presentation related to purchases made under purchase commitments from third-party and related party suppliers.
Use of Estimates—The preparation of financial statements and related disclosures in conformity with GAAP requires the Company’s management to make estimates, judgments, and assumptions that affect the reported amounts of assets, liabilities, revenues and expenses, and related disclosure of contingent assets and liabilities at the date of the financial statements and for the year then ended. On an on-going basis, management evaluates the estimates used. Some of the more significant estimates and assumptions made by management involve allowances for doubtful accounts, revenue recognition as it relates to variable consideration; acquisition accounting fair value allocations; the recoverability of goodwill, other intangible assets, property and equipment and deferred tax assets; inventory valuation; equity-based compensation; and the determination of the useful life of customer relationship and finite-lived trademark intangible assets. Management bases its estimates on historical experience, current conditions and various other assumptions that it believes to be reasonable under the circumstances. These estimates form the basis for making judgments about the carrying values of assets and liabilities and are not readily apparent from other sources. Actual results may differ from these estimates.
Cash and Cash Equivalents—Cash and cash equivalents include cash on hand and cash invested in highly liquid investments purchased with an original maturity of three months or less which are classified as cash equivalents. Cash and cash equivalents are carried at cost, which approximates fair value.
Accounts Receivable, Net and Credit Losses —Accounts receivable are recorded at invoiced amounts, net of reserves and allowances. The Company estimates its allowance for doubtful accounts and the related expected credit loss based on a variety of factors including the length of time receivables are past due, economic trends and conditions affecting our customer base, and historical collection experience. Specific credit losses are recorded for individual receivables when we become aware of a customer’s inability to meet its financial obligations. Accounts receivable balances are written off in the period in which the receivable is deemed uncollectible.
The allowance for doubtful accounts was approximately $0.7 million and $0.8 million as of December 25, 2021 and December 26, 2020, respectively. Charges related to credit loss on accounts receivables were approximately $0.2 million, $0.2 million and $0.5 million for the fiscal years ended December 25, 2021, December 26, 2020 and December 28, 2019, respectively.
In addition, in December 2021, the Company entered into an agreement with one of its suppliers, in which the remaining $5.0 million of the original $10.0 million 2016 capital advance balance, scheduled to be repaid by December 31, 2023, was forgiven and treated as if it were repaid in full. Upon execution of the December 2021 agreement, the Company recorded a credit loss of $5.0 million within operating expenses in the Consolidated Statement of Operations and the balance previously reported within other long-term assets in the Consolidated Balance Sheets was eliminated.
Deferred Offering Costs—The Company defers as other assets the direct incremental costs of raising capital until such time as the offering is completed. At the time of the completion of the offering, the costs are charged against the capital raised. Should the offering be terminated, deferred offering costs are charged to operations during the period in which the offering is terminated.
Upon the closing of the IPO in September 2021, the Company had incurred $7.6 million of capitalized deferred offering costs consisting of legal, accounting, consulting, listing and filing fees, which were netted against the IPO proceeds. There were no capitalized deferred offering costs as of December 25, 2021 and approximately $0.3 million as of December 26, 2020, which were related to legal, accounting and consulting fees.
78
Inventories—Inventories are measured at the lower of cost or net realizable value. The Company uses a standard cost and average cost approach to account for inventories which approximates actual costs on the first-in, first-out (“FIFO”) method. The cost of finished products inventories includes raw materials, direct labor, certain freight and warehousing costs, indirect production, and overhead costs. The Company reviews inventory quantities on hand and records a provision for excess and obsolete inventory based primarily on the age of the inventory or discontinued items.
Property and Equipment—Property and equipment are stated at historical cost, or acquisition date fair value for property and equipment acquired in business acquisitions and are depreciated using the straight-line method over their estimated useful lives. The useful lives of property and equipment are as follows:
Furniture and Fixtures | 1-7 years |
Leasehold Improvements | Lesser of useful life or remaining lease term |
Machinery and Equipment | 7-12 years |
Computer Equipment | 3-5 years |
Software | 3 years |
Capital Leases | Based on lease terms |
Repairs and maintenance costs are expensed as incurred. Major improvements that extend the life or increase the capacity of property owned are capitalized. Major improvements to leased buildings are capitalized as leasehold improvements.
Impairment of Long-Lived Assets—The Company periodically evaluates long-lived assets, property and equipment for impairment whenever events or changes in circumstances indicate that the carrying amount of the assets may not be recoverable. The Company determines if the assets are recoverable by comparing the sum of the undiscounted future cash flows to the carrying value. Events or changes in circumstances that could result in an impairment review include, but are not limited to, significant underperformance relative to historical or projected future operating results, significant changes in the manner of use of the acquired assets or the strategy for the Company’s overall business, and significant negative industry or economic trends. Impairment is recognized when the carrying amount of an asset exceeds its fair value. There were no impairments of long-lived assets in 2021, 2020 or 2019.
Business Combinations—The Company uses the acquisition method of accounting in accordance with FASB ASC 805, Business Combinations. Each acquired company’s operating results are included in the Company’s consolidated financial statements starting on the date of acquisition. The purchase price is equivalent to the fair value of consideration transferred. Tangible and identifiable intangible assets acquired and liabilities assumed as of the date of acquisition are recorded at the acquisition date fair value. Goodwill is recognized for the excess of purchase price over the net fair value of assets acquired and liabilities assumed. Amounts allocated to assets and liabilities are based upon estimated fair values. Such values require management to make significant estimates and assumptions, especially with respect to the identifiable intangible assets. Management makes estimates of fair value based upon assumptions believed to be reasonable and that of a market participant. These estimates are based on historical experience and information obtained from the management of the acquired companies, which are inherently uncertain. The separately identifiable intangible assets generally include customer relationships and tradenames.
For any given acquisition, we may identify certain pre-acquisition contingencies. We estimate the fair value of such contingencies, which are included as part of the assets acquired or liabilities assumed, as appropriate. Differences from these estimates are recorded in the consolidated statement of operations in the period in which they are identified.
Goodwill—Goodwill is tested at least annually for impairment, or when circumstances indicate that the carrying amount of the asset may not be recoverable. The Company has elected to perform the annual impairment test on the first
79
day of the Company’s fourth quarter. Goodwill is tested for impairment at the reporting unit level. A reporting unit is an operating segment or a component of an operating segment. Goodwill is tested for impairment by either performing a qualitative evaluation or a quantitative test. The qualitative assessment evaluates factors including macro-economic conditions, industry and company-specific factors, and historical company performance in assessing fair value. If it is determined that it is more likely than not that the fair value of the reporting unit is less than the carrying value, a quantitative test is then performed. Otherwise, no further testing is required. When using a quantitative approach, the Company compares the fair value of the reporting unit to the carrying amount, including goodwill. If the estimated fair value of the reporting unit is less than its carrying amount, impairment is indicated, requiring recognition of an impairment charge for the differential. Determining the fair value of a reporting unit is judgmental in nature and involves the use of significant estimates and assumptions. Future adverse changes in market conditions or poor operating results of these underlying assets could result in losses or an inability to recover the carrying value of the asset that may not be reflected in the asset’s current carrying value, thereby possibly requiring impairment charges in the future. There were no impairments of goodwill in 2021 or 2020. In 2019, the Company recorded an impairment loss to goodwill of $14.4 million. See Note 7. Goodwill for additional information.
Intangible Assets—Intangible assets with definite useful lives are stated at cost less accumulated amortization and are amortized over their estimated useful lives using the straight-line method as follows:
Customer Relationships | 10-20 years |
Tradename | 20-25 years |
Intangible assets with definite useful lives are reviewed for impairment whenever events or changes in circumstances indicate that the carrying amounts may not be recoverable. If impairment indicators are present, the Company performs a recoverability test, and if it is determined the carrying amount of the asset is not recoverable and its carrying amount exceeds its fair value, then an impairment loss is recognized. There were no impairments of definite lived intangible assets in 2021 or 2020. In 2019, the Company recorded a $2.8 million loss on impairment of a definite lived intangible asset. See Note 8. Intangible Assets, Net for additional information.
The Rao’s tradename was determined to have an indefinite life. Indefinite-lived intangible assets are tested for impairment annually and more frequently if events or changes in financial performance between annual tests indicate that it is more likely than not that the asset is impaired. The Company has elected to perform the annual impairment test on the first day of the Company’s fourth quarter.
Indefinite-lived intangible assets are tested for impairment by either performing a qualitative evaluation or a quantitative test. The qualitative assessment evaluates factors including macro-economic conditions, industry and company-specific factors, and historical company performance in assessing fair value. If it is determined that it is more likely than not that the fair value of the asset is less than the carrying value, a quantitative test is performed. Otherwise, no further testing is required. If it is determined that it is more likely than not that the fair value of the asset is less than the carrying value, impairment is evaluated by comparing the fair value of the asset with its carrying value, and a loss is recognized for the difference if the fair value exceeds the carrying value. When estimating the fair value, the Company uses certain assumptions, such as forecasted growth rates and cost of capital. These assumptions are consistent with our internal projections and operating plans. Unanticipated market or macroeconomic events and circumstances may occur, which could affect the accuracy or validity of the estimates and assumptions. For example, future changes in the judgments, assumptions and estimates that are used in our tradename impairment testing could result in significantly different estimates of the fair values. In addition, changes to, or a failure to achieve business plans or deterioration of macroeconomic conditions could result in reduced cash flows or higher discount rates, leading to a lower valuation that would trigger an impairment of the tradename. There were no impairments of indefinite lived intangible assets in 2021, 2020 or 2019. See Note 8. Intangible Assets, Net for additional information.
80
Leasing Arrangements—Effective December 27, 2020, the Company adopted Accounting Standards Update 2016-02 (ASU 2016-02) which created a new topic, ASC 842 “Leases.” Subsequent to the issuance of ASU 2016-02, ASC 842 has been amended by various updates that amended and clarified the implementation of the standard.
In accordance with ASC 842, the Company, at the inception of the contract, determines whether a contract is or contains a lease. The Company records right-of-use assets and lease obligations for its finance and operating leases with a term greater than 12 months, which are initially recognized based on the discounted future minimum lease payments over the term of the lease. The Company has elected the short-term practical expedient for short-term leases with an initial term of 12 months or less. As a result, the Company does not apply balance sheet recognition for these short-term leases and records aggregated lease expense.
The Company uses the implicit rate in the lease, if available, for calculating the present value of the lease payments. If the implicit rate is not readily determinable, the Company will use the applicable incremental borrowing rate in calculating the present value of the sum of the lease payments. The incremental borrowing rate represents an estimate of the interest rate the Company would incur at lease commencement to borrow an amount equal to the lease payments on a collateralized basis over the term of a lease. The Company evaluates renewal options at lease inception and on an ongoing basis and includes renewal options that it is reasonably certain to exercise in its expected lease terms when classifying leases and measuring lease liabilities. Some leases also include early termination options, which can be exercised under specific conditions. Additionally, certain leases contain incentives, such as construction allowances from landlords. These incentives reduce the right-of-use asset related to the lease.
The Company recognizes expense for operating leases on a straight-line basis over the lease term. The Company recognizes interest expense and depreciation expense for finance leases. Depreciation expense for assets held under finance leases are computed using the straight-line method over the lease term or useful life for leases that contain a transfer of title or reasonably certain purchase option. The Company elected to combine lease and non-lease components for all asset classes.
The Company’s lease agreements may contain variable lease payments for increases in rental payment as a result of indexation and variable storage and shipping utilization, common area maintenance, property tax, and utility charges, which are excluded from the measurement of its right-of-use assets and lease liabilities and are recognized as variable payments in the period in which the obligation for those payments is incurred. The Company’s real estate leases include base rent escalation clauses. The majority of these are based on the change in a local consumer price or similar inflation index. Payments that may vary based on an index or rate are included in the measurement of our right-of-use assets and lease liabilities at the rate as of the commencement date with any subsequent changes to those payments being recognized as variable payments in the period in which they occur. The Company does not have significant residual value guarantees or restrictive covenants in the lease portfolio. See Note 11. Leases for additional information on leases.
Debt Issuance Costs—Costs incurred in raising debt are recorded as a direct deduction from the carrying amount of the associated debt liability and amortized over the life of the related debt instrument using the effective interest rate method. Debt issuance costs associated with the revolver are recorded as a deferred asset and are included in other assets within the Consolidated Balance Sheets.
During 2021, the Company wrote off debt issuance costs of approximately $15.4 million in conjunction with the repayment of the outstanding 2018 Term Loan, Incremental Term Loan, and Initial Second Lien Facility, and partial prepayment of the Initial First Lien Term Loan Facility. During 2020, there were no debt issuance costs written off. See Note 10. Long-Term Debt for additional information on debt issuance costs and defined terms used herein.
Comprehensive Income—Entities that report items of other comprehensive income have the option to present the components of net income and comprehensive income in either one continuous financial statement, or two consecutive financial statements. As the Company has no components of comprehensive income other than net income (loss), no statement of comprehensive income has been presented.
81
Dividends—The Company does not have an established dividend policy. The Company’s board of directors (the “Board”) has sole authority to determine if and when dividends will be declared and on what terms. Dividend payments, if any, depend on the Company’s earnings, capital requirements, financial condition, excess availability under the Company’s lines of credit, market and economic conditions, and other factors considered relevant. The Company will record all dividends as a reduction to additional paid-in capital ("APIC"). Once APIC is reduced to zero, dividends will be recorded against retained earnings or accumulated deficit. See Note 14. Stockholders’ Equity for additional information on dividends paid.
Revenue Recognition—The Company manufactures, markets and distributes a variety of Italian sauces, dry pastas, soups, yogurt, frozen entrees, pancake and waffle mixes, other baking mixes and frozen waffles to retailers through direct sales forces, broker and distributor arrangements across the United States.
The Company accounts for revenue in accordance with ASC 606, Revenue from Contracts with Customers (“ASC 606”). The Company recognizes revenue when performance obligations are satisfied by transferring control of the goods to its customers. Control is transferred at a point in time, upon delivery of the goods to the customer. The customer is invoiced with payment terms which are commensurate with the customer’s credit profile. Shipping and/or handling costs that occur before the customer obtains control of the good are deemed to be fulfillment activities (i.e. an expense) rather than a promised service and are recorded in cost of sales in the statements of operations.
The Company assesses the goods promised in its customers’ purchase orders and identifies a performance obligation for each promise to transfer a good (or bundle of goods) that is distinct. To identify the performance obligations, the Company considers all the goods promised, whether explicitly stated or implied based on customary business practices.
Sales to customers generally do not include more than one performance obligation. When a contract does contain more than one performance obligation, the contract’s transaction price is allocated to each performance obligation based on its relative standalone selling price. The standalone selling price for each distinct good is generally determined by list price. Revenue is reported net of applicable discounts and allowances. Trade promotions are recorded as a reduction to net sales with a corresponding reduction to accounts receivable at the time of revenue recognition for the underlying sale. The recognition of trade promotions requires management to make estimates regarding the volume of incentive that will be redeemed and their total cost.
Customers may deduct from future payments for defective or non-conforming products. As a result, a related refund liability is estimated and recorded as a reduction in sales. This return estimate is reviewed and updated each period and is based on historical sales and return experience.
The Company has identified certain incremental costs to obtain a contract, primarily sales and broker commissions. The Company continues to expense these costs as incurred because the amortization period for the costs would be one year or less. The Company does not incur significant fulfillment costs requiring capitalization.
The Company has elected the following practical expedients in accordance with ASC 606.
| ● | Significant financing component – The Company has elected to not adjust the promised amount of consideration for the effects of significant financing components as the Company expects, at contract inception, that the period between the transfer of a promised good to a customer and when the customer pays for that good will be one year or less. See Note 4. Revenue Recognition for additional information. |
| ● | Measurement of transaction price – The Company has elected to exclude from the measurement of transaction price all taxes assessed by a governmental authority that are both imposed on and concurrent with a specific revenue-producing transaction and collected by the Company from a customer for sales taxes. |
82
| ● | Shipping and handling costs – The Company includes shipping and handling costs associated with outbound freight within cost of sales. These costs are accounted for as fulfillment costs as they are incurred. |
Advertising and Marketing—Advertising costs include the development, production and communication of advertising through television, digital, print and radio. Development and production costs are capitalized and then expensed in the period in which the advertising first takes place. All other costs of advertising are expensed as incurred. Advertising and marketing expenses for the fiscal years ended December 25, 2021, December 26, 2020 and December 28, 2019 were approximately $38.9 million, $38.9 million and $28.8 million, respectively, and are included in selling, general, and administrative in the Consolidated Statements of Operations.
Equity-Based Compensation—Prior to the Company’s IPO, employees and certain nonemployees of the Company received equity-based compensation in the form of incentive units of the Company’s Ultimate Parent (the “Incentive Units” or “IUs”) as consideration for services to the Company. The fair value of the Incentive Units are recognized as an equity contribution from the Limited Partnership.
The Company determined the fair value of the Incentive Units as of the grant date and recognizes the compensation expense on a straight-line basis over the requisite service period, which is generally the vesting period of the Incentive Units.
Certain Incentive Units have market and performance vesting conditions depending upon a change-in-control and achievement of certain metrics. The related compensation expense is recognized when the probability of the event is likely and performance criteria are met.
In connection with the IPO, the Ultimate Parent distributed its shares of Sovos Brands, Inc. common stock to its limited partners, including holders of IUs, in accordance with the applicable terms of its partnership agreement. Holders of IUs received shares of common stock and restricted common stock of Sovos Brands, Inc. in respect of their IUs.
In connection with the IPO, a change in vesting of the original performance-based IUs, and accordingly the related distributed restricted stock, was considered to be a modification to the grants and required the shares to be revalued using a Monte Carlo simulation model. Equity-based compensation expense is recognized for these awards on a straight-line basis over the service period, regardless of the eventual number of shares that are earned based upon the performance condition. Subsequent to the IPO, the Company and the Limited Partnership modified a portion of the existing equity-based compensation awards among the Company, Limited Partnership and the holders of such restricted stock. As a result of this modification, a portion of the shares that would have vested based upon a 4.0 MOIC (including any related linear interpolation, the “Original Vesting Criteria”) instead vest on the last day of fiscal 2022 or on the last day of fiscal 2023, or upon achievement of the Original Vesting Criteria, if earlier. The fair value of the modified performance-based restricted stock awards was calculated using a Monte Carlo simulation option pricing model. See Note 15. Equity-Based Compensation for additional information.
Subsequent to the IPO, employees and certain nonemployees of the Company have received, and may in the future receive, equity-based compensation in the form of restricted stock units with service-based vesting conditions, using the fair market value of the Company’s common stock to measure fair value and in the form of restricted stock units with performance-based vesting conditions using a Monte Carlo simulation model to determine the grant-date fair value. Equity-based compensation expense is recognized on a straight-line basis over the requisite service period of the award based on their grant-date fair value.
The Company recognizes forfeitures as they occur.
Income Taxes—The Company accounts for income taxes using the asset and liability method. Under this method, income tax expense is recognized for the amount of income tax payable or refundable in the current year. The Company recognizes deferred tax asset and liabilities for the future tax consequences attributable to the differences between the financial statement carrying amounts of existing assets and liabilities and their respective tax bases. Deferred tax assets
83
are recognized subject to management’s analysis that realization is more likely than not. Deferred tax assets and liabilities are measured using enacted tax rates expected to apply to taxable income in the years in which those temporary differences are expected to be recovered or settled. The effect on deferred tax assets and liabilities of a change in tax rates is recognized in income in the period that includes the enactment date.
Certain judgments, estimates, and assumptions could affect the carrying value of deferred tax assets and valuation allowances, if any, and deferred tax liabilities in the Company’s consolidated financial statements. We recognize deferred tax assets to the extent that we believe that these assets are more likely than not to be realized. In making such a determination, we consider all available positive and negative evidence, including future reversals of existing taxable temporary differences, projected future taxable income, tax-planning strategies, and results of recent operations. If we determine that we would be able to realize our deferred tax assets in the future in excess of their net recorded amount, we would make an adjustment to the deferred tax asset valuation allowance, which would reduce the provision for income taxes.
The Company accounts for uncertain tax positions in accordance with the provisions of ASC 740, Income Taxes. The Company’s assumptions, judgments and estimates relative to the current provision for income taxes take into account current tax laws, its interpretation of current tax laws and possible outcomes of current and future audits conducted by foreign and domestic tax authorities. The Company has established reserves for income taxes to address potential exposures involving tax positions that could be challenged by tax authorities. Benefits from tax positions are measured at the largest amount of benefit that is more likely than not to be realized upon settlement. To the extent that the final tax outcome of these matters is different than the amounts recorded, such differences affect income tax expense in the period in which such determination is made. Interest and penalties, if any, related to accrued liabilities for potential tax assessments are included in income tax expense.
Concentrations of Credit Risk—Financial instruments that potentially subject the Company to a concentration of credit risk consist principally of cash and trade accounts receivable. The Company maintains cash balances at financial institutions within the United States which are insured by the Federal Deposit Insurance Corporation (“FDIC”) up to limits of approximately $250 thousand. The Company has not experienced any losses with regards to its bank accounts and believes it is not exposed to any risk of loss on its cash bank accounts.
Credit risk for the Company was concentrated in three customers who each comprised more than 10% of the Company’s total sales for the fiscal years ended December 26, 2021 and December 25, 2020. For the fiscal year ended December 28, 2019, credit risk for the Company was concentrated in two customers who each comprised more than 10% of the Company’s total sales.
Fiscal Year Ended | ||||||
December 25, 2021 | December 26, 2020 | December 28, 2019 | ||||
Customer 1 | 18% | 16% | 12% | |||
Customer 2 | 13% | 13% | 15% | |||
Customer 3 | 11% | N/A | N/A | |||
Customer 4 | N/A | 11% | N/A | |||
___________
N/A – Not applicable as the customer was not significant during these fiscal years.
At December 25, 2021 and December 26, 2020, the following percentages of the Company’s accounts receivable, net were related to these significant customers for the periods in which the customers were significant:
Fiscal Year Ended | ||||
December 25, 2021 | December 26, 2020 | |||
Customer 1 | 14% | 12% | ||
Customer 2 | 15% | 12% | ||
84
Customer 3 | N/A | N/A | ||
Customer 4 | N/A | 13% |
____________
N/A – Not applicable as the customer was not significant during these fiscal years.
No other customers individually had greater than 10% of total gross sales during these periods. The Company believes that there is no significant or unusual credit exposure at this time.
Concentrations of Vendor Risk—The Company purchases its inventories for certain product categories from a small number of vendors. One of the Company’s vendors individually represented 53% and 47% of the Company’s inventory purchases for the fiscal years ended December 25, 2021 and December 26, 2020, respectively. No other vendor individually has greater than 10% of total inventory purchases.
New Accounting Pronouncements and Policies
Recently Adopted Accounting Pronouncements
In February 2016, the FASB issued ASU No. 2016-02, Leases (Topic 842). The FASB has subsequently issued supplemental and/or clarifying ASUs inclusive of ASU 2020-05, which updated the effective date for certain non-public companies to annual reporting periods beginning after December 15, 2021. Early adoption is permitted. These updates require an organization to recognize right-of-use assets and lease liabilities on the balance sheet and also disclose certain qualitative and quantitative information about leasing arrangements that allow the users of the financial statements to better understand the amount, timing, and uncertainty of cash flows arising from leases.
The Company early adopted ASU 2016-02 and all associated amendments on the first day of fiscal year 2021 (December 27, 2020) which includes, as allowed under ASU 2018-11, the ability to recognize a cumulative-effect adjustment through opening accumulated deficit as of the date of adoption. The Company elected the package of practical expedients permitted under the transition guidance, which allows the Company to carryforward its historical assessments of: (1) whether contracts are, or contain, leases, (2) lease classification and (3) initial direct costs. The Company did not elect the hindsight practical expedient. The Company elected a policy of not recording leases on its Consolidated Balance Sheets when the leases have a term of 12 months or less and the Company is not reasonably certain to elect an option to renew the leased asset. Due to the adoption of this guidance, the Company recognized operating right-of-use assets and operating lease liabilities of $16.3 million and $21.7 million, respectively, on the Consolidated Balance Sheets as of the date of adoption. The difference between the right-of-use assets and lease liabilities is primarily due to the accrual for lease payments as a result of straight-line lease expense and unamortized tenant incentive liability balances. There was no impact to opening accumulated deficit as a result of the adoption of the guidance. The adoption of this new guidance did not have a material impact on the Company’s results of operations, cash flows, and liquidity, and did not have a material impact on the Company’s covenant compliance under its existing credit agreement.
In June 2016, the FASB issued ASU No. 2016-13, Financial Instruments – Credit Losses (Topic 326) – Measurement of Credit Losses on Financial Instruments. This standard is intended to improve financial reporting by requiring earlier recognition of credit losses on financing receivables and other financial assets in scope, such as trade receivables. The amendment is effective for fiscal years beginning after December 15, 2020. The Company adopted this standard effective December 27, 2020 and the adoption of the standard did not have a material impact on its consolidated financial statements.
In December 2019, the FASB issued ASU No. 2019-12, Simplifying the Accounting for Income Taxes, which amends existing guidance to simplify the accounting for income taxes by removing certain exceptions for investments, intraperiod allocations and interim calculations, and adding guidance to reduce complexity in the accounting standard under the FASB’s simplification initiative. The new guidance also clarifies the accounting for transactions that result in a step-up in the tax basis of goodwill. ASU 2019-12 is effective for public entities for fiscal years beginning after December 15, 2020, including interim periods within those fiscal years. For all other entities, ASU 2019-12 is effective for fiscal years beginning after December 15, 2021, including interim periods within fiscal years beginning after December 15, 2022.
85
Early adoption is permitted. Upon adoption, the amendments in ASU 2019-12 should be applied on a prospective basis to all periods presented. The Company early adopted this standard effective December 27, 2020 and the adoption of the standard did not have a material impact on its consolidated financial statements.
In October 2020, the FASB issued ASU No. 2020-10, Codification Improvements, which provides updates for technical corrections, clarifications to guidance, simplifications to wording or structure of guidance, and other minor improvements across various areas of accounting within GAAP. This ASU is effective for all entities for fiscal years beginning after December 15, 2020. The amendments of this ASU should be applied retrospectively. The Company adopted this standard effective December 27, 2020 and the adoption of the standard did not have a material impact on its consolidated financial statements or result in any retrospective changes.
Recently Issued Accounting Pronouncements Not Yet Adopted
In March 2020, the Financial Accounting Standards Board (the “FASB”) issued Accounting Standards Update (“ASU”) No. 2020-04, Reference Rate Reform (Topic 848): Facilitation of the Effects of Reference Rate Reform on Financial Reporting. The amendments of ASU No. 2020-04 are effective for companies as of March 12, 2020 through December 31, 2022. An entity may elect to apply the amendments for contract modifications by Topic or Industry Subtopic as of any date from the beginning of an interim period that includes or is subsequent to March 12, 2020, or prospectively from a date within an interim period that includes or is subsequent to March 12, 2020, up to the date that the financial statements are available to be issued. The amendments in this update apply only to contracts, hedging relationships and other transactions that reference LIBOR or another reference rate expected to be discontinued because of reference rate reform and provide optional expedients and exceptions for applying GAAP to contracts, hedging relationships and other transactions affected by reference rate reform if certain criteria are met. In January 2021, the FASB issued ASU No. 2021-1, Reference Rate Reform (Topic 848), which added clarification of the scope of Topic 848 for certain derivative instruments. The Company will continue to monitor the effects of rate reform, if any, on its contracts and the effects of adoption of these ASUs through December 31, 2022. The Company does not anticipate the amendments in these ASUs to be material to its consolidated financial statements upon adoption.
3. Business Acquisitions
On October 23, 2020, the Company completed the purchase of 100% ownership interest in Birch Benders, a brand of pancake and waffle mixes, other baking mixes and frozen waffles, whose products cater to a variety of lifestyles, including organic, plant-based, protein, paleo and keto alternatives. The acquisition diversified the Company’s consumer base and strengthened its presence in the breakfast and snacking categories. Consideration transferred for the transaction totaled $151.4 million, of which $146.4 million was paid with cash at closing, and $5.0 million contingent consideration was paid in May 2021 based on the achievement of specified operating results following completion of the acquisition. The assets acquired and liabilities assumed were recorded at their estimated fair values. Cash consideration for the acquisition was provided through borrowings under the Company’s credit facilities and cash and cash equivalents on-hand.
The consideration transferred for the transaction is summarized as follows:
(In thousands) | | | |
Cash consideration |
| $ | 146,406 |
Contingent consideration |
| 5,000 | |
Consideration transferred | $ | 151,406 |
The following table sets forth the final allocation of the Birch Benders acquisition consideration transferred to the estimated fair value of the assets acquired and liabilities assumed at the date of acquisition.
86
The final October 23, 2020 fair values are as follows:
(In thousands) | |||
Accounts receivable, net | $ | 6,184 | |
Inventories |
| 13,697 | |
Other current assets |
| 129 | |
Property and equipment |
| 94 | |
Intangible assets |
| 96,300 | |
Other long-term assets |
| 11 | |
Accounts payable |
| (4,543) | |
Accrued expense and other liabilities |
| (2,518) | |
Total assets acquired and liabilities assumed |
| 109,354 | |
Goodwill |
| 42,052 | |
Total consideration transferred | $ | 151,406 |
The final determination of the fair value of the assets acquired and liabilities assumed was completed during the quarter ended September 25, 2021. Since the initial preliminary estimates reported in the fourth quarter of 2020, the Company has updated certain amounts reflected in the preliminary purchase price allocation, as summarized in the fair values of assets acquired and liabilities assumed as set forth above. Specifically, accounts receivable acquired increased $253 thousand, inventories acquired decreased $167 thousand, other current assets acquired decreased $11 thousand, accounts payable assumed decreased $131 thousand and accrued expenses and other liabilities assumed increased $367 thousand. As a result of these adjustments, goodwill has increased $161 thousand.
Measurement period adjustments are recognized in the reporting period in which the adjustments are determined and calculated as if the accounting had been completed at the acquisition date. The final fair value determination of the assets acquired and liabilities assumed was completed prior to one year from the transaction completion, consistent with ASC 805, Business Combinations.
As a result of the acquisition of the Birch Benders business (the “Birch Benders Acquisition”), the Company recorded goodwill of $42.1 million. The goodwill recognized includes the fair value of the assembled workforce, which is not recognized as an intangible asset separable from goodwill, and expected synergies gained from the acquisition to generate revenue growth and future market development. The Company determined that the goodwill resulting from the Birch Benders Acquisition is deductible for tax purposes.
Intangible assets include the tradename and customer relationships of Birch Benders. Tradename represents the estimated fair value of the acquired entity’s name and logo with which the products are associated. The Company estimated the fair value of the tradename using the Multi-Period Excess Earnings Method. Significant assumptions include forecasted brand revenue adjusted to exclude inventory sales, company EBITDA margins, tax depreciation, tax rate, contributory asset charges, and discount rate.
Customer relationships represent the estimated fair value of the underlying relationships with the acquired entity’s business customers. The Company valued customer relationships using the avoided cost / lost profits method, a form of the income and cost approaches. Significant assumptions include forecast of revenues, cost of sales and operating expenses, and discount rate.
The final values assigned to tradename and customer relationships are $90.6 million and $5.7 million, respectively, and are amortized using the straight-line method over the estimated lives of the assets. The weighted average amortization period for the and customer relationships is 20 years. See Note 8. Intangible Assets, Net for the estimated total intangible amortization expense during the next five years.
87
4. Revenue Recognition
Revenue disaggregated by brand is as follows:
Fiscal Year Ended | |||||||||
(In thousands) |
| December 25, 2021 |
| December 26, 2020 | December 28, 2019 | ||||
Rao’s | $ | 419,966 | $ | 313,618 | $ | 158,553 | |||
Noosa |
| 163,476 |
| 153,492 | 151,471 | ||||
Michael Angelo’s |
| 79,414 |
| 83,896 | 77,980 | ||||
Birch Benders |
| 56,330 |
| 9,061 | — | ||||
Total net sales | $ | 719,186 | $ | 560,067 | $ | 388,004 | |||
5. Inventories
Inventories consisted of the following:
(In thousands) |
| December 25, 2021 |
| December 26, 2020 | ||
Finished goods | $ | 38,715 | $ | 27,734 | ||
Raw materials and packaging supplies |
| 12,900 |
| 19,335 | ||
Total inventories | $ | 51,615 | $ | 47,069 | ||
6. Property and Equipment, Net
Property and equipment, net, consisted of the following, as of the dates indicated (in thousands):
| December 25, 2021 |
| December 26, 2020 | |||
Machinery & equipment | $ | 45,329 | $ | 42,519 | ||
Leasehold improvements |
| 39,296 |
| 39,283 | ||
Construction in progress |
| 12,074 |
| 3,258 | ||
Furniture & fixtures |
| 2,119 |
| 2,547 | ||
Other |
| 1,649 |
| 1,006 | ||
Gross property and equipment |
| 100,467 |
| 88,613 | ||
Less: Accumulated depreciation and amortization |
| 37,796 |
| 29,132 | ||
Property and equipment, net | $ | 62,671 | $ | 59,481 | ||
Depreciation and amortization expense were approximately $10.6 million, $10.6 million and $10.5 million for the fiscal years ended December 25, 2021, December 26, 2020 and December 28, 2019, respectively, of which $8.9 million, $9.1 million and $9.3 million was recorded to costs of goods sold for the fiscal years ended December 25, 2021, December 26, 2020 and December 28, 2019, respectively.
88
7. Goodwill
Changes in the carrying value of goodwill during the fiscal years ended December 25, 2021 and December 26, 2020 were as follows:
(In thousands) | Goodwill | ||
Balance at December 28, 2019 |
| $ | 395,399 |
Birch Benders acquisition (Note 3) |
| 41,891 | |
Balance as of December 26, 2020 | 437,290 | ||
Purchase accounting adjustments (Note 3) |
| 161 | |
Balance as of December 25, 2021 | $ | 437,451 | |
The change in goodwill during the fiscal year ended December 25, 2021 was the result of measurement period adjustments made to the acquisition method of accounting for the Birch Benders Acquisition as described in Note 3. Business Acquisitions.
For goodwill impairment testing for the fiscal year ended December 25, 2021, the Company determined it had three reporting units: Rao's / Michael Angelo’s (combined), Noosa and Birch Benders.
In the fourth quarter of 2021, the Company performed a qualitative analysis of the goodwill for Rao's / Michael Angelo's, Noosa and Birch Benders, which determined that no events or changes in financial performance indicated impairment of Rao’s / Michael Angelo’s and Noosa, and as a result it was determined that it was more likely than not each reporting unit had fair values in excess of their carrying values. Accordingly, no further goodwill impairment assessment was deemed necessary for these two reporting units. For the Birch Benders reporting unit, the Company identified the underperformance of the reporting unit as an indicator that impairment indicators existed which required a quantitative assessment to be made. The Company compared the estimated fair value of the Birch Benders reporting unit to the carrying amount. The fair value was established using generally accepted valuation methodologies, including the discounted cash flow method of the income approach and the guideline public company method and the guideline transaction method of the market approach. It was determined that the fair value of the Birch Benders reporting unit is in excess of its carrying value, and as a result no goodwill impairment loss was recorded.
For goodwill impairment testing for the fiscal year ended December 26, 2020, the Company determined it had four reporting units: Rao's, Michael Angelo’s, Noosa and Birch Benders.
In 2020, the Company performed a qualitative analysis of the goodwill for Rao's, Michael Angelo's and Noosa, which determined that no events or changes in financial performance indicated impairment of these three reporting units, and as a result it was determined that it was more likely than not each reporting unit had fair values in excess of their carrying values. Accordingly, no further impairment assessment was deemed necessary. Due to the timing of the acquisition of Birch Benders, annual impairment testing was not required for the fiscal year ended December 26, 2020 on Birch Benders.
There were no impairment charges related to goodwill during the fiscal years ended December 25, 2021 or December 26, 2020.
In 2019, the Company performed a qualitative analysis of the goodwill for Rao's, Michael Angelo's and Noosa, which determined that no events or changes in financial performance indicated impairment of Rao's and Noosa, and as a result it was determined that it was more likely than not each reporting unit had fair values in excess of their carrying values. Accordingly, no further impairment assessment was deemed necessary for these reporting units. For the Michael Angelo’s reporting unit, the Company identified the underperformance of the reporting unit as an indicator that impairment indicators existed that required a quantitative assessment to be performed. As a result, an impairment assessment was conducted on goodwill for the Michael Angelo’s reporting unit by performing a two-step test. In the first step, the Company compared the estimated fair value of the Michael Angelo’s reporting unit to the carrying value of its assets and liabilities, including goodwill. The fair value was established using generally accepted valuation methodologies, including discounted
89
cash flow analysis and comparable public company analysis, both methods weighted equally. It was determined that the carrying amount of the Michael Angelo’s reporting unit exceeded its fair value, so the second step was required to measure the goodwill impairment loss which included valuing all the assets of the reporting unit as if the reporting unit had been acquired in a business combination and comparing the implied fair value of the reporting unit’s goodwill to the carrying amount of goodwill. The second step determined that the carrying value of the goodwill exceeded the Company’s estimate of the implied fair value of goodwill, so the Company recorded an impairment charge in an amount equal to the excess of the carrying value of goodwill over its implied fair value. The Company recorded an impairment loss to goodwill in the amount of $14.4 million for the fiscal year ended December 28, 2019.
8. Intangible Assets, Net
Intangible asset, net, consisted of the following:
December 25, 2021 | |||||||||
Gross carrying | Accumulated | Net carrying | |||||||
(In thousands) | amount | amortization | amount | ||||||
Intangible assets - definite lives |
|
|
|
|
| ||||
Customer relationships | $ | 213,000 | $ | 71,330 | $ | 141,670 | |||
Tradename |
| 192,347 |
| 22,362 |
| 169,985 | |||
405,347 | 93,692 | 311,655 | |||||||
Intangible assets - indefinite lives |
|
|
|
|
| ||||
Tradename | 153,000 | — | 153,000 | ||||||
Total intangible assets | $ | 558,347 | $ | 93,692 | $ | 464,655 | |||
December 26, 2020 | |||||||||
Gross carrying | Accumulated | Net carrying | |||||||
(In thousands) |
| amount |
| amortization |
| amount | |||
Intangible assets - definite lives |
|
|
| ||||||
Customer relationships | $ | 213,000 | $ | 53,461 | $ | 159,539 | |||
Tradename |
| 192,347 |
| 12,991 |
| 179,356 | |||
405,347 | 66,452 | 338,895 | |||||||
Intangible assets - indefinite lives | |||||||||
Tradename |
| 153,000 | — | 153,000 | |||||
Total intangible assets | $ | 558,347 | $ | 66,452 | $ | 491,895 | |||
As a result of the Birch Benders Acquisition, the Company recorded definite lived tradename and customer relationships of $90.6 million and $5.7 million, respectively, as of the acquisition date of October 23, 2020. See Note 3: Business Acquisitions.
Amortization expense was approximately $27.2 million, $23.2 million and $22.5 million for the fiscal years ended December 25, 2021, December 26, 2020 and December 28, 2019, respectively, of which all was included in selling general and administrative expense in the Consolidated Statements of Operations.
In the fourth quarter of 2021 and 2020 the Company performed an analysis of definite lived intangible assets, which determined there were no events or changes in circumstances that indicated the carrying amounts of the customer relationships or tradename may not be recoverable, and as a result no further impairment assessment was deemed necessary, and no impairment was recorded.
In the fourth quarter of 2019, the Company identified the underperformance of the Michael Angelo’s reporting unit as an indicator that further analysis was needed to test the recoverability of the definite lived intangible assets. A
90
recoverability test was performed using a discounted cash flow model, which indicated that the carrying value exceeded the fair value resulting in an impairment of the Michael Angelo’s trade name of $2.8 million as of December 28, 2019.
In the fourth quarter of 2021, 2020 and 2019, the Company performed a qualitative impairment analysis of the indefinite lived intangible assets and determined that no events or changes in financial performance indicated impairment of the tradename, and as a result it was determined that it was more likely than not the indefinite lived intangible assets had fair values in excess of their carrying values. Accordingly, no further impairment assessment was deemed necessary.
Estimated total intangible amortization expense during the next five fiscal years and thereafter is as follows:
(In thousands) |
| Amortization | |
2022 | $ | 27,240 | |
2023 |
| 27,240 | |
2024 |
| 27,240 | |
2025 |
| 27,240 | |
2026 |
| 27,240 | |
2027 and thereafter |
| 175,455 | |
Total | $ | 311,655 | |
9. Accrued Expenses
Accrued expenses consisted of the following:
(In thousands) |
| December 25, 2021 |
| December 26, 2020 | ||
Accrued trade | $ | 23,122 | $ | 23,010 | ||
Accrued general expense |
| 15,327 |
| 18,275 | ||
Accrued compensation and benefits |
| 10,478 |
| 20,179 | ||
Accrued marketing |
| 2,830 |
| 3,637 | ||
Total accrued expenses | $ | 51,757 | $ | 65,101 | ||
10. Long-Term Debt
Long-term debt consisted of the following:
December 25, 2021 | |||||||||
Unamortized debt | Total debt, | ||||||||
(In thousands) | Principal | issuance costs | net | ||||||
Initial First Lien Term Loan Facility |
| $ | 480,800 |
| $ | (6,377) |
| $ | 474,423 |
Finance lease liabilities | 7,095 | — |
| 7,095 | |||||
Total debt | $ | 487,895 | $ | (6,377) | 481,518 | ||||
Less: current portion of finance lease liabilities | | | | | | | |
| 98 |
Total long-term debt |
|
| $ | 481,420 | |||||
91
December 26, 2020 | |||||||||
|
| Unamortized debt |
| Total debt, | |||||
(In thousands) | Principal | issuance costs | net | ||||||
Senior debt | $ | 374,146 | $ | (10,282) | $ | 363,864 | |||
Revolver |
| — |
| — |
| — | |||
Total debt | $ | 374,146 | $ | (10,282) |
| 363,864 | |||
Less: current portion of long-term debt |
|
|
|
| 3,818 | ||||
Long-term debt |
|
|
|
| $ | 360,046 | |||
Senior Debt
In November 2018, in conjunction with the acquisition of Noosa, Sovos Intermediate (“Borrower”) entered into a Credit Facility Agreement with Credit Suisse, Citizens Bank N.A. (“Citizens”), Deutsche Bank, and Aresbank, S.A. (“Credit Agreement”) with a term loan of $280 million (“2018 Term Loan”) and a revolving line of credit of $45 million (“Revolving Line of Credit”). In accordance with the Credit Agreement, the Company repaid the outstanding 2017 term loan of $158.4 million with Citizens as well as the amount outstanding under the revolving line of credit of $7.0 million.
In October 2020, the Company entered into an amendment to its Credit Agreement (“Amended Credit Agreement”). The Amended Credit Agreement provided, among other things, for an additional $100.0 million term loan (the “Incremental Term Loan”) which was part of the same class and had the same terms as the 2018 Term Loan. The Company analyzed the amendment and determined the Incremental Term Loan was not considered a debt modification because the existing 2018 Term Loan was not paid off. The Company paid debt issuance costs related to the Incremental Term Loan of $3.2 million, which were all capitalized.
In June 2021, Sovos Intermediate entered into a First Lien Credit Agreement (“First Lien Credit Agreement”) among Sovos Intermediate, Sovos Brands Holdings, Inc., Credit Suisse AG, Cayman Islands Branch (“Credit Suisse”), as administrative agent and collateral agent, and the lenders and issuing banks from time to time party thereto (“First Lien Lenders”), consisting of an initial term loan facility of $580.0 million (“Initial First Lien Term Loan Facility”), and a revolving credit facility of $125.0 million (“Revolving Facility”), including a letter of credit facility with a $45.0 million sublimit. Also in June 2021, Sovos Intermediate entered into a Second Lien Credit Agreement (“Second Lien Credit Agreement”) among Sovos Intermediate, Sovos Brands Holdings, Inc., Owl Rock Capital Corporation, as administrative agent and collateral agent, and the lenders from time to time party thereto (“Second Lien Lenders”), consisting of an initial term loan facility of $200.0 million (“Initial Second Lien Facility”). In accordance with the First Lien Credit Agreement and Second Lien Credit Agreement, the Company repaid the outstanding 2018 Term Loan and Incremental Term Loan of $373.2 million to Credit Suisse and made a restricted payment for the purpose of paying a dividend in the amount of $400.0 million to the direct or indirect equity holders of the Ultimate Parent. See Note 13. Stockholders’ Equity for further information on the dividend payment.
As the debt transaction on the Initial First Lien Term Loan Facility and Initial Second Lien Facility was accounted for as an extinguishment of the old debt, the Company wrote off $9.4 million of the existing 2018 Term Loan and Incremental Term Loan debt issuance costs to expense. The Initial First Lien Term Loan Facility and Initial Second Lien Facility were issued with discounts of $1.5 million and $4.0 million respectively, and the Company paid debt issuance costs of $6.8 million and $0.5 million respectively. The discounts and debt issuance costs paid on the Initial First Lien Term Loan Facility and Initial Second Lien Facility were capitalized. The debt transaction on the Revolving Facility was accounted for as a debt modification. The Company continued to amortize $0.2 million of the existing Revolving Line of Credit debt issuance costs over the new life of the debt, wrote off $0.3 million of the existing Revolving Line of Credit debt issuance costs to expense, and paid $1.1 million in debt issuance costs for the new Revolving Facility, which was capitalized.
In September 2021, using net proceeds of the IPO, the Company paid the full outstanding principal balance on the Initial Second Lien Facility of $200.0 million plus accrued interest of approximately $2.9 million. Upon the full prepayment of the Initial Second Lien Facility, the Company recognized a loss on the loan extinguishment resulting in a
92
write-off of $4.3 million of the related unamortized issuance costs and discounts. Additionally, in September 2021 and October 2021, the Company prepaid $59.7 million and $39.5 million, respectively, of the outstanding principal balance under the Initial First Lien Term Loan Facility, plus total accrued interest of approximately $0.9 million. Upon the partial prepayment of the Initial First Lien Term Loan Facility, the Company recognized a $1.4 million proportional loss on the partial extinguishment of the related unamortized issuance costs and discounts.
The remaining principal balance on the Initial First Lien Term Loan Facility, after the $59.7 million and $39.5 million prepayments, is $480.8 million. The Company has directed Credit Suisse to apply the prepayments against future scheduled principal installments, which eliminates all future principal payments for the remaining term of the loan.
The amortization of debt issuance costs and discount of $1.9 million, $1.8 million and $1.7 million for the fiscal years ended December 25, 2021, December 26, 2020 and December 28, 2019, respectively, is included within interest expense in the Consolidated Statements of Operations.
The interest rate for the Initial First Lien Term Loan Facility and Revolving Facility is London Inter-Bank Offered Rate (“LIBO Rate”) plus an applicable rate contingent on the Company’s calculated first lien leverage ratio, ranging from 400 to 425 basis points, and is subject to a 50 basis points reduction, at each level, after the consummation of an initial public offering (as used in this paragraph, an "IPO"). In no event shall the LIBO Rate be less than 0.75% per annum for the Initial First Lien Term Loan Facility or less than 0.00% per annum for the Revolving Line of Credit. The Initial First Lien Term Loan Facility matures on June 8, 2028 and the Revolving Facility matures on June 8, 2026. The Initial First Lien Term Loan Facility is collateralized by substantially all of the assets of the Company.
The interest rate for the Initial Second Lien Facility was LIBO Rate plus 8.00% per annum and was subject to a 25 basis points reduction after the consummation of an IPO. In no event could the LIBO Rate be less than 0.75% per annum. The Initial Second Lien Facility was originally scheduled to mature on June 8, 2029 and was collateralized by substantially all of the assets of the Company. As described above, in September 2021, the Initial Second Lien Facility was paid in full.
As of September 27, 2021, the closing date of the IPO, the interest rate on the Initial First Lien Term Loan Facility and Revolving Facility decreased 50 basis points, from an effective rate of 5.00% to 4.50%.
As of December 25, 2021, the Company had available credit of $125 million under the Revolving Facility, and as of December 26, 2020, the Company had available credit of $45 million under the Revolving Line of Credit. There was zero outstanding on either of the Company’s Revolving Credit Facilities as of December 25, 2021 and December 26, 2020. As of December 25, 2021, the effective interest rate for the Initial First Lien Term Loan Facility and Revolving Facility was 4.50%. As of December 26, 2020, the effective interest rate for the Incremental Term Loan and the 2018 Term Loan was 5.70%.
As of December 25, 2021, the future minimum principal payments for the next five years and thereafter are as follows (in thousands):
Fiscal Year Ending |
|
| |
2022 | $ | — | |
2023 |
| — | |
2024 |
| — | |
2025 |
| — | |
2026 |
| — | |
Thereafter | 480,800 | ||
Total | $ | 480,800 |
93
Loan Covenants
In connection with the First Lien Credit Agreement, the Company has various financial, affirmative, and negative covenants that it must adhere to as specified within the loan agreements. The First Lien Credit Agreement contains a springing financial covenant, which requires the Borrower to maintain a first lien net leverage ratio of consolidated first lien net debt to consolidated EBITDA (with certain adjustments as set forth in the First Lien Credit Agreement) no greater than 6.95:1.00. Such financial covenant is tested only if outstanding revolving loans (excluding any undrawn letters of credit) minus unrestricted cash exceed 35% of the aggregate revolving credit commitments. The financial covenant is subject to customary “equity cure” rights. In addition, under the First Lien Credit Agreement, an annual excess cashflow calculation is required, to determine if any excess is required to be paid on the Initial First Lien Term Loan Facility. As of December 25, 2021, the Company had no outstanding revolving loans, so did not meet the requirement to test the financial covenant under the First Lien Credit Agreement.
Finance Lease Liabilities
The Company classifies a lease as a finance lease if the lease term is for a major part, or at least 75%, of the remaining economic life of the underlying asset, or if a lease triggers the present value test or the alternative use test. Prior to the adoption of ASU 2016-02, finance lease liabilities were classified within accrued expenses and other long-term liabilities.
See Note 11. Leases and Note 18. Related Party Transactions for additional discussion of the finance lease liabilities.
11. Leases
On December 27, 2020, the Company adopted ASU No. 2016-02, Leases, using the modified retrospective approach under ASU No. 2018-11, which permits application of the new guidance at the beginning of the period of adoption, with comparative periods continuing to be reported under ASC Topic 840, Leases.
The Company leases real estate in the form of distribution centers, manufacturing facilities, equipment, and office space. Generally, the term for real estate leases ranges from 2 to 10 years at inception of the contract. Generally, the term for equipment leases is 5 years at inception of the contract. Most manufacturing facilities and office space leases include one or more options to renew, with renewal terms that generally can extend the lease term from 2 to 30 years. The exercise of lease renewal options is at the Company’s discretion.
Operating and finance lease costs are included within Cost of sales and Selling, general, and administrative expenses in the Consolidated Statements of Operations. Sublease income was not material for the periods presented.
94
The components of lease expense were as follows:
Fiscal Year Ended | |||||
(In thousands) | Statement of Operations Caption | December 25, 2021 | |||
Operating lease cost: |
|
|
| ||
Lease cost |
| Cost of sales and Selling, general, and administrative | $ | 3,266 | |
Variable lease cost (1) |
| Cost of sales and Selling, general, and administrative |
| 1,384 | |
Total operating lease cost |
|
| 4,650 | ||
Short term lease cost |
| Cost of sales and Selling, general, and administrative |
| 222 | |
Finance lease cost: |
|
|
| ||
Amortization of right-of-use assets |
| Cost of sales and Selling, general, and administrative |
| 261 | |
Interest on lease liabilities |
| Interest expense |
| 532 | |
Total finance lease cost |
|
| 793 | ||
Total lease cost | $ | 5,665 | |||
| (1) | Variable lease cost primarily consists of common area maintenance, utilities, taxes, and insurance. |
The gross amount of assets and liabilities related to both operating and finance leases were as follows:
(In thousands) | Balance Sheet Caption | December 25, 2021 | ||||
Assets |
|
|
|
|
| |
Operating lease right-of-use assets |
| Operating lease right-of-use assets | $ | 15,672 | ||
Finance lease right-of-use assets |
|
| 6,299 | |||
Total lease assets |
| $ | 21,971 | |||
Liabilities |
|
|
|
| ||
Current: | ||||||
Operating lease liabilities | Operating lease liabilities | $ | 3,216 | |||
Finance lease liabilities | 98 | |||||
Long-term: | ||||||
Operating lease liabilities |
| Long-term operating lease liabilities |
| 17,302 | ||
Finance lease liabilities |
|
| 6,997 | |||
Total lease liabilities |
| $ | 27,613 | |||
The weighted-average remaining lease term and weighted-average discount rate for operating and finance leases at December 25, 2021 were as follows:
| Operating Leases |
| Finance Leases |
| |
Weighted-average remaining lease term (in years) |
| 7.1 |
| 34.8 | |
Weighted-average discount rate |
| 4.9 | % | 7.8 | % |
95
Future maturities of lease liabilities as of December 25, 2021 were as follows:
(In thousands) |
| Operating Leases |
| Finance Leases | ||
Fiscal year ending: |
|
|
|
| ||
2022 | $ | 4,108 | $ | 607 | ||
2023 |
| 4,040 |
| 609 | ||
2024 |
| 3,472 |
| 557 | ||
2025 |
| 2,961 |
| 549 | ||
2026 |
| 2,995 |
| 520 | ||
Thereafter |
| 6,920 |
| 18,970 | ||
Total lease payments |
| 24,496 |
| 21,812 | ||
Less: Interest |
| (3,978) |
| (14,717) | ||
Present value of lease liabilities | $ | 20,518 | $ | 7,095 | ||
As of December 25, 2021, the Company did not have any significant additional operating or finance leases that have not yet commenced.
Supplemental cash flow and other information related to leases were as follows:
| Fiscal Year Ended | ||
(In thousands) | December 25, 2021 | ||
Cash paid for amounts included in the measurement of lease liabilities |
|
| |
Operating cash flows from operating leases | $ | 3,893 | |
Operating cash flows from finance leases |
| 532 | |
Financing cash flows from finance leases | 66 | ||
Right-of-use assets obtained in exchange for new lease liabilities | | | |
Finance leases | | | — |
Operating leases | | | 1,638 |
Comparative Information as Reported Under Previous Accounting Standards
The following comparative information is reported based upon previous accounting standards in effect for the periods presented.
Future minimum payments under lease arrangements with a remaining term in excess of one year as of December 26, 2020 were as follows:
| Capital |
| Operating |
| Related Party |
| Related Party | |||||
(In thousands) | Leases | Leases | Capital Lease | Operating Lease | ||||||||
Fiscal Year Ending: | ||||||||||||
2021 | $ | 105 | $ | 3,783 | $ | 495 | $ | 27 | ||||
2022 |
| 105 |
| 3,808 |
| 500 |
| 27 | ||||
2023 |
| 105 |
| 3,813 |
| 505 |
| 28 | ||||
2024 |
| 48 |
| 3,244 |
| 510 |
| 28 | ||||
2025 |
| 34 |
| 2,733 |
| 515 |
| 28 | ||||
Thereafter |
| — |
| 7,650 |
| 19,489 |
| 1,065 | ||||
Total | $ | 397 | $ | 25,031 | $ | 22,014 | $ | 1,203 | ||||
96
For the fiscal years ended December 26, 2020 and December 28, 2019, rent expense for operating leases was $3.4 million and $2.7 million, respectively.
12. Commitments and Contingencies
Litigation
From time to time, we are subject to various legal actions arising in the ordinary course of our business. We cannot predict with reasonable assurance the outcome of these legal actions brought against us as they are subject to uncertainties. Accordingly, any settlement or resolution in these legal actions may occur and affect our net income (loss) in such period as the settlement or resolution. We do not believe the outcome of any existing legal actions would have a material adverse effect on our consolidated financial statements taken as a whole.
Purchase Commitments
The Company has current third-party purchase obligations for raw materials, packaging, and co-manufacturing. These commitments have been entered into based on future projected needs. For the fiscal years ended December 25, 2021 and December 26, 2020, the Company made third-party purchases in the amount of $2.4 million and $11.7 million, respectively, under purchase commitments. As of December 25, 2021, the Company had outstanding minimum purchase commitments with three suppliers. The estimated annual minimum purchase commitments with the suppliers were as follows (in thousands):
Fiscal Year Ending |
| ||
2022 | $ | 4,819 | |
2023 |
| 4,323 | |
2024 |
| 3,500 | |
2025 |
| 1,875 | |
2026 |
| — | |
Thereafter |
| — | |
Total | $ | 14,517 | |
In addition, as of December 25, 2021, the Company had a commitment to purchase equipment at a co-packing manufacturing facility of $4.8 million to be paid by February 2022.
See Note 18. Related Party Transactions for information about our commitments to related parties.
13. Fair Value of Financial Instruments
ASC 820, Fair Value Measurements and Disclosures (“ASC 820”), defines fair value as the price that would be received for an asset, or paid to transfer a liability, in an orderly transaction between market participants on the measurement date, and establishes a three-level fair value hierarchy that prioritizes the inputs used to measure fair value as follows:
Level 1: quoted prices (unadjusted) in active markets for identical assets or liabilities;
Level 2: inputs other than quoted prices included within Level 1 that are observable for the asset or liability, either directly (i.e., as prices) or indirectly (i.e., derived from prices); and
97
Level 3: inputs for the asset or liability that are based on unobservable inputs in which there is little or no market data.
Cash and cash equivalents, accounts receivable, prepaid expenses, accounts payable and accrued expenses are reflected in the Consolidated Balance Sheets at carrying value, which approximates fair value due to the short-term nature of these instruments.
The Company’s borrowing instruments are recorded at their carrying values in the Consolidated Balance Sheets, which may differ from their respective fair values. The carrying values and estimated fair values of the Company’s Initial First Lien Term Loan Facility and Revolving Facility approximate their carrying values as of December 31, 2021 and the Company’s senior debt and revolver approximate their carrying values as of December 26, 2020, based on interest rates currently available to the Company for similar borrowings.
Assets and liabilities that are measured at fair value on a nonrecurring basis relate primarily to goodwill, intangibles, and property and equipment, which are remeasured when the derived fair value is below the carrying value on the Company’s Consolidated Balance Sheets. For these assets, the Company does not periodically adjust carrying value to fair value except in the event of impairment. When the impairment has occurred, the Company measures the required charges and adjusts the carrying value as discussed in Note 2. Summary of Significant Accounting Policies. For discussion about the impairment testing of assets and liabilities not measured at fair value on a recurring basis see Note 7. Goodwill, and Note 8. Intangible Assets, Net for additional details.
There were no transfers of financial instruments between the three levels of fair value hierarchy during the fiscal years ended December 25, 2021 and December 26, 2020.
14. Stockholders’ Equity
Dividend distribution
On June 8, 2021, the Company paid a one-time cash dividend to the Ultimate Parent. The total amount of the dividend was $400 million and was recorded against APIC.
Stock split
On September 8, 2021, the Company filed a certificate of amendment to its Certificate of Incorporation (“Certificate of Amendment”) with the Secretary of State of the State of Delaware. Prior to the effective date of the Certificate of Amendment, the Company was authorized to issue 750,000 shares of common stock at $0.01 par value. As a result of the filing of the Certificate of Amendment, the Company became authorized to issue 500,000,000 shares of common stock at $0.001 par value. Pursuant to the Certificate of Amendment, on September 8, 2021 the Company effected a stock split of its common stock, at a rate of 120.8-for-1 (the “Stock Split”), accompanied by a corresponding increase in the Company's issued and outstanding shares of common stock. No fractional shares of common stock were issued upon the Stock Split. Any holder of common stock with aggregated shares totaling to fractional shares were rounded up to the nearest whole share. The accompanying consolidated financial statements and related disclosure for periods prior to the Stock Split have been retroactively restated to reflect the filing of the Certificate of Amendment, including the Stock Split.
As a result of the Stock Split, the Company had a total of 74,058,447 shares issued and as of September 8, 2021. In connection with the IPO, on September 22, 2021, the Ultimate Parent distributed its shares of Sovos Brands, Inc. common stock to its limited partners, including holders of IUs, in accordance with the applicable terms of its partnership agreement.
98
Preferred Stock
On September 23, 2021, the Company filed an amended and restated certificate of incorporation (“Amended and Restated Charter”) with the Secretary of State of the State of Delaware, which was effective on September 23, 2021. As a result of the filing of the Amended and Restated Charter, the Company was authorized to issue 510,000,000 shares, divided into two classes as follows: (i) 500,000,000 shares are designated shares of common stock, par value $0.001 per share, and (ii) 10,000,000 shares are designated shares of preferred stock, par value $0.001 per share.
Organizational Transactions and IPO
On September 27, 2021, the Company closed its IPO of 23,334,000 shares of common stock, $0.001 par value per share, at an offering price of $12.00 per share, and received net proceeds from the IPO of approximately $263.2 million, net of $16.8 million in underwriting discounts and commissions.
Subsequent to the IPO, the underwriters exercised their option to purchase an additional 3,500,100 shares of common stock. The Company closed its sale of such additional shares on October 5, 2021, resulting in net proceeds of approximately $39.5 million, net of $2.5 million in underwriting discounts and commissions.
As a result of the IPO and the exercise of the underwriters’ option to purchase additional shares, the new investors in the Company own 26,834,100 shares of the common stock, or approximately 26.6% of the total 100,892,547 shares of common stock outstanding as of March 15, 2022.
15. Equity-Based Compensation
Pre-IPO Equity
2017 Equity Incentive Plan
In 2017, the Ultimate Parent established the Sovos Brands Limited Partnership 2017 Equity Incentive Plan (“2017 Plan”), in which certain employees and nonemployees of the Company received equity-based compensation in the form of Incentive Units (“IUs”) of the Ultimate Parent, as consideration for services to the Company. The IUs, were deemed to be equity instruments subject to expense recognition under FASB ASC 718, Compensation — Stock Compensation. The estimate of fair value of the IUs granted was determined as of the grant date.
The fair value of the IUs granted in 2019 and 2020 was estimated using a two-step process. First, the enterprise value of Sovos Brands Holdings, Inc. was established using two generally accepted valuation methodologies: discounted cash flow analysis and guideline comparable public company analysis. Second, the enterprise value was allocated among the securities that comprise the capital structure of Sovos Brands Holdings, Inc. using the Black-Scholes option-pricing model. The use of the Black-Scholes option-pricing model requires the Company to make estimates and assumptions, such as expected volatility, expected term and expected risk-free interest rate.
Significant assumptions used to estimate the fair value of the Incentive Units were as follows, which were the same between service based and performance-based shares:
| 2020 |
| 2019 | |
Expected term |
| 1.5 to 3.5 yrs | 1.5 to 3.5 yrs | |
Risk-free rate of return | 1.61% | 1.61% | ||
Applied volatility | 20% | 20% |
The expected term represents management's estimate of time to an exit event. The risk-free rate of return is based upon the US Treasury yield through time to liquidity. Applied volatility is based on the volatility of a sample of publicly traded companies in markets similar to Sovos Brands Holdings, Inc.
99
The fair value of the IUs granted in 2021 was estimated using the Probability Weighted Expected Return Method (“PWERM”), which is a forward-looking approach that was considered to be appropriate when expected future liquidity events, such as an IPO, are reasonably certain. The PWERM analysis considered three potential liquidation time horizons, ranging from current value to three years and assigned a 33.3% probability to each scenario. The valuation of the total company enterprise and equity values was calculated for each of the three scenarios, and then applied a weighted average calculation.
The IUs’ activity for the fiscal year ended December 25, 2021 was as follows:
Service Based | Performance Based | |||||||||
|
| Weighted Average |
|
| Weighted Average | |||||
Incentive | Grant Date | Incentive | Grant Date | |||||||
Units | Fair Value | Units | Fair Value | |||||||
Outstanding at December 26, 2020 | 34,659 | $ | 245 | 46,000 | $ | 15 | ||||
Granted |
| 1,231 | 842 | 1,722 | 8 | |||||
Forfeited | (332) | 407 | (908) | 13 | ||||||
Distribution of common stock with respect to IUs (1) |
| (35,558) | 264 | (46,814) | 14 | |||||
Outstanding at December 25, 2021 |
| — | $ | — |
| — | $ | — | ||
Vested at December 25, 2021 |
| — | $ | — |
| — | $ | — | ||
| (1) | In connection with the IPO, the Ultimate Parent distributed its shares of Sovos Brands, Inc. common stock to its limited partners, including holders of IUs, in accordance with the applicable terms of its partnership agreement. |
Distribution of Sovos Common Stock with respect to IUs
Holders of IUs received shares of common stock and restricted common stock of Sovos Brands, Inc. in respect of their IUs. The common stock was distributed with respect to vested IUs and the restricted common stock was distributed with respect to nonvested IUs, with the vesting of such restricted common stock tracking the same vesting terms as the related nonvested IUs at the time of distribution.
The distribution of Sovos common stock with respect to IUs was calculated based on a multi-step valuation which included a comparison of the fair value of the Company based on the pricing at the Company’s IPO to the fair value of the outstanding partnership units of the Ultimate Parent, including the IUs granted under the 2017 Plan. The conversion was based on:
| ● | a ratio that takes into account the number of IUs held, |
| ● | the application distribution threshold applicable to the IUs, and |
| ● | the value of distributions that the holder would have been entitled to receive had the Ultimate Parent liquidated on the date of such replacement in accordance with the terms of the distribution “waterfall” set forth in the Partnership Agreement. |
100
Restricted Common Stock
The following table summarizes our restricted common stock activity during the fiscal year ended December 25, 2021:
Service Based | Performance Based | |||||||||
|
| Weighted Average |
|
| Weighted Average | |||||
Restricted | Grant Date | Restricted | Grant Date | |||||||
Common Stock | Fair Value | Common Stock | Fair Value | |||||||
Nonvested at December 26, 2020 | — | $ | — | — | $ | — | ||||
Distribution of restricted common stock (1)(2) | 94,646 | 12.00 | 3,319,291 | 3.91 | ||||||
Granted |
| — | — | — | — | |||||
Vested | (18,558) | 12.00 | (683,442) | 7.86 | ||||||
Forfeited back to Ultimate Parent(3) | (3,847) | 12.00 | (45,001) | 2.89 | ||||||
Nonvested at December 25, 2021 |
| 72,241 | $ | 12.00 |
| 2,590,848 | $ | 5.25 | ||
Vested at December 25, 2021 |
| 727,464 | $ | 12.00 |
| 683,442 | $ | 7.86 | ||
| (1) | The service-based restricted common stock excludes 708,906 shares that vested prior to distribution. None of the performance-based restricted common stock vested prior to distribution. |
| (2) | The weighted average grant date fair value for the performance-based restricted common stock at distribution was based on the x multiple of invested capital (“MOIC”) modification described below. A subsequent modification in November 2021 to the x MOIC restricted common stock resulted in an increase in the weighted average grant date fair value for those shares to $15.15 per share. |
| (3) | Shares of restricted common stock that do not vest are not cancelled but instead remain outstanding and are forfeited back to the Ultimate Parent. During the year ended December 25, 2021, 3,847 shares of restricted common stock subject to time-based service conditions and 45,001 shares of restricted common stock subject to performance-based conditions were forfeited back to the Ultimate Parent. |
In connection with the IPO, a change in the vesting of the existing performance-based IUs and accordingly the related distributed restricted stock resulted in a modification to the grants and required the shares to be revalued as of the IPO date, resulting in a modified grant date fair value of approximately $13.0 million. The fair value of the performance-based restricted stock awards was calculated using a Monte Carlo simulation option pricing model which requires the Company to make estimates and assumptions, such as expected volatility, expected term and expected risk-free interest rate. Specifically, the model revalued the performance units based on the revised vesting condition of the x MOIC restricted common stock achieving the x MOIC based on a 30-day volume weighted average price with remainder of the restricted common stock vesting upon the earlier of the Ultimate Parent owning 25% or less of the company or 30 months post-IPO. On November 3, 2021, the performance condition of the x MOIC restricted common stock was met and, accordingly, 683,442 shares of restricted stock with a performance-based vesting condition vested.
On November 4, 2021, the Company and the Limited Partnership modified a portion of the existing equity-based compensation awards dated September 22, 2021 among the Company, Limited Partnership and the holders of such restricted stock. As a result of this modification, a portion of the shares that would have vested based upon a MOIC (including any related linear interpolation, the “Original Vesting Criteria”) instead vest on the last day of fiscal 2022 or on the last day of fiscal 2023, or upon achievement of the Original Vesting Criteria, if earlier. The fair value of the modified performance-based restricted stock awards was calculated using a Monte Carlo simulation option pricing model which requires the Company to make estimates and assumptions, such as expected volatility, expected term and expected risk-free interest rate, resulting in a modified grant date fair value of approximately $6.1 million.
As of December 25, 2021, 72,241 shares of restricted common stock resulting from the distribution of common stock with respect to nonvested time-based IUs vest upon fulfilling time-based service conditions and are scheduled to vest through 2024. As of December 25, 2021, the remaining 2,590,848 shares of restricted common stock resulting from the distribution with respect to nonvested performance-based IUs will vest only if certain performance conditions, including exceeding various MOIC levels, are achieved.
101
During the fiscal year ended December 25, 2021, the Company recorded equity-based compensation expense of approximately $2.7 million related to the restricted common stock with time-based service vesting conditions. During the fiscal years ended December 26, 2020 and December 28, 2019, the Company recorded equity-based compensation expense of approximately $1.9 million and $2.1 million, respectively, related to the IUs with time-based service vesting conditions.
The Company recognized approximately $7.1 million of equity-based compensation expense during the fiscal year ended December 25, 2021 related to the performance-based restricted common stock and will recognize the remaining expense for these awards ratably over the applicable 30-month period. Prior to the distribution of common stock with respect to the performance-based IUs, the performance conditions for the performance-based IUs were not deemed probable of occurrence, and therefore, no compensation cost was recorded for such IUs during the fiscal years ended December 26, 2020 and December 28, 2019.
The equity-based compensation expense prior to the IPO was considered to be a transaction with the Ultimate Parent and was classified as a component within additional paid-in capital in the Company’s consolidated statements of changes in stockholder’s equity.
Post-IPO Equity
2021 Equity Incentive Plan
Effective September 21, 2021, the Company approved the 2021 Equity Incentive Plan (the “2021 Plan”) which reserves 9,739,244 shares of common stock. The 2021 Plan provides for the granting of stock options, stock appreciation rights, restricted stock awards, restricted stock units or equity-based awards to eligible employees, consultants and directors.
Restricted Stock Units
The Company has issued restricted stock units under the 2021 Plan. The following table summarizes our restricted stock unit activity during the fiscal year ended December 25, 2021:
|
| Weighted Average | |||
Restricted Stock | Grant Date | ||||
Units | Fair Value | ||||
Outstanding at December 26, 2020 | | — | | $ | — |
Granted | | 967,158 | 12.00 | ||
Vested | | — | — | ||
Forfeited | | (39,936) | 12.00 | ||
Outstanding at December 25, 2021 | | 927,222 | $ | 12.00 | |
Vested at December 25, 2021 | | — | $ | — | |
In connection with the IPO, and under the 2021 Plan, the Company granted 967,158 time-based restricted stock units (“RSUs”) to certain employees and independent directors. The RSUs include (i) 759,362 RSUs issued to certain employees with each award vesting 100% on the third anniversary of the grant date, subject in general to the applicable employee’s continued service through the vesting date, (ii) 191,130 RSUs issued to certain employees and independent directors with each award vesting in three equal annual installments, subject in general to the employee’s or director’s continued service through the vesting date, and (iii) 16,666 RSUs issued to certain of our independent directors that vest on the earlier of the first anniversary of the grant date and immediately prior to our first annual meeting of stockholders following the IPO, in each case subject in general to the applicable director’s continued service through the vesting date.
102
Performance-based Restricted Stock Units
The Company has issued performance-based restricted stock units under the 2021 Plan. The following table summarizes our performance-based stock unit activity during the fiscal year ended December 25, 2021:
| Performance-based |
| Weighted Average | ||
Restricted Stock | Grant Date | ||||
Units | Fair Value | ||||
Outstanding at December 26, 2020 | | — | | $ | — |
Granted | | 687,690 | 7.09 | ||
Vested | | — | — | ||
Forfeited | | (5,728) | 7.09 | ||
Outstanding at December 25, 2021 | | 681,962 | $ | 7.09 | |
Vested at December 25, 2021 | | — | $ | — | |
The performance-based restricted stock units (“PSUs) were granted to certain employees with each award vesting subject in general to the achievement of the performance condition and subject in general to the employee’s continued service through the vesting date.
The fair value of the PSUs was estimated using a Monte Carlo simulation option pricing model, which requires the Company to make estimates and assumptions, such as expected volatility, expected term and expected risk-free interest rate.
The Company expects to record equity-based compensation expense of approximately $14.8 million through the third quarter of 2024 resulting from the issuance of the RSUs and PSUs during the fiscal year ended December 25, 2021.
As of December 25, 2021, there was an aggregate of 8,130,060 shares of common stock available for future equity awards under the 2021 Plan.
16. Employee Benefits
The Company has one Company sponsored defined contribution plan. Company contributions to this defined contribution plan are based on employee contributions and compensation. The Company’s contributions to this plan for the fiscal years ended December 25, 2021, December 26, 2020 and December 28, 2019 were $1.8 million, $1.4 million and $1.0 million, respectively.
103
17. Income Taxes
Income tax expense (benefit) for the fiscal years ended December 25, 2021, December 26, 2020 and December 28, 2019 consists of the following current and deferred amounts (in thousands):
| 2021 |
| 2020 |
| 2019 | ||||
Current: |
|
|
|
| | | |||
Federal | $ | 641 | $ | — | $ | — | |||
State |
| 791 |
| 1,928 |
| (2,129) | |||
Total current tax expense (benefit) |
| 1,432 |
| 1,928 |
| (2,129) | |||
Deferred: |
|
|
|
|
|
| |||
Federal |
| 3,414 |
| 805 |
| (4,478) | |||
State |
| (1,171) |
| 3,944 |
| (12,019) | |||
Total deferred tax expense (benefit) |
| 2,243 |
| 4,749 |
| (16,497) | |||
Income tax expense (benefit) | $ | 3,675 | $ | 6,677 | $ | (18,626) | |||
Total income tax expense in 2021, 2020 and 2019 varies from the amounts computed by applying the federal statutory income tax rate of 21% to income (loss) before income taxes primarily due to the following items (dollars in thousands):
2021 | 2020 |
| 2019 | | ||||||||||||
United States statutory income tax expense (benefit) |
| $ | 1,175 |
| 21.0 | % | $ | 3,676 |
| 21.0 | % | $ | (9,613) |
| 21.0 | % |
State tax expense (benefit), net of federal tax |
| 910 |
| 16.3 |
| 781 |
| 4.5 | | (874) | | 1.9 | ||||
Transaction costs |
| (312) |
| (5.6) |
| (2,763) |
| (15.8) | | 328 | | (0.7) | ||||
Equity-based compensation |
| 1,772 |
| 31.7 |
| 406 |
| 2.3 | | 448 | | (1.0) | ||||
Goodwill impairment |
| — |
| — |
| — |
| — | | 3,026 | | (6.6) | ||||
Nondeductible executive compensation | 625 | 11.2 | — | — | | — | | — | ||||||||
Other permanent items |
| 180 |
| 3.2 |
| 113 |
| 0.6 | | 114 | | (0.2) | ||||
Remeasurement of deferred tax balances |
| (993) |
| (17.7) |
| 3,388 |
| 19.4 | | (8,232) | | 18.0 | ||||
Unrecognized tax benefits |
| (121) |
| (2.2) |
| 609 |
| 3.5 | | — | | — | ||||
Return to provision |
| 236 |
| 4.2 |
| 81 |
| 0.5 | | (1,324) | | 2.9 | ||||
Income tax payable adjustment |
| — |
| — |
| — |
| — | | (764) | | 1.7 | ||||
Deferred income tax adjustments |
| 200 |
| 3.6 |
| 450 |
| 2.6 | | (1,805) | | 3.9 | ||||
Other, net |
| 3 |
| 0.1 |
| (64) |
| (0.4) | | 70 | | (0.2) | ||||
Income tax expense (benefit) | $ | 3,675 |
| 65.8 | % | $ | 6,677 |
| 38.2 | % | $ | (18,626) | | 40.7 | % | |
Deferred tax assets and liabilities reflect the tax effect of temporary differences between the carrying value of assets and liabilities for financial reporting purposes and the tax basis of these assets and liabilities as measured by income tax law. The tax effects of temporary differences that give rise to significant portions of the deferred tax assets and deferred tax liabilities at December 25, 2021 and December 26, 2020 are presented below (in thousands):
104
| 2021 |
| 2020 | |||
Deferred Income Tax Assets: |
|
|
|
| ||
Inventory | $ | 1,506 | $ | 694 | ||
Accrued compensation |
| 1,832 |
| 4,390 | ||
Bad debt allowance |
| 164 |
| 152 | ||
Deferred rent |
| — |
| 1,322 | ||
Net operating loss |
| 3,065 |
| 9,912 | ||
163(j) interest limitation |
| 3,493 |
| 47 | ||
Research and Development credit |
| — |
| 116 | ||
Equity-based compensation |
| 229 |
| — | ||
Lease liability |
| 6,585 |
| — | ||
Other |
| 231 |
| 115 | ||
Total deferred income tax assets |
| 17,105 |
| 16,748 | ||
Deferred Income Tax Liabilities: |
|
|
|
| ||
Property and equipment |
| (6,536) |
| (6,927) | ||
Intangible assets |
| (81,860) |
| (84,479) | ||
Prepaid expenses |
| (131) |
| (75) | ||
Right-of-use asset | (5,406) | — | ||||
Other |
| (148) |
| — | ||
Total deferred income tax liabilities |
| (94,081) |
| (91,481) | ||
Net deferred income tax liabilities | $ | (76,976) | $ | (74,733) | ||
A valuation allowance is recorded when it is more likely than not that some portion of the deferred tax assets will not be realized. As of each reporting date, the Company's management considers all evidence, both positive and negative, that could impact management's view with regards to future realization of deferred tax assets. As of December 25, 2021, no valuation for deferred tax assets was recorded as management believes it is more likely than not that all the deferred tax assets will be realized.
At December 25, 2021, the Company has a net operating loss (“NOL”) carryforward for federal tax purposes of approximately $10.7 million and $20.9 million for state tax purposes.
The following table summarizes the NOL carryforwards by jurisdiction (in thousands):
| Expiration Period |
| December 25, 2021 | ||
Federal |
| None | $ | 10,717 | |
State |
| 2023‑2041 |
| 9,553 | |
State |
| None |
| 11,363 | |
Section 382 of the Internal Revenue Code (the Code) limits the use of net operating losses, Section 163j interest expense carryforward and tax credit carryforward in certain situations where changes occur in the stock ownership of a company. If the company should have an ownership change of more than 50% of the value of the Company's capital stock, utilization of these carryforwards could be restricted. In connection with the IPO on September 27, 2021, the Company's remaining net operating losses and Section 163(j) interest expense carryforwards are subject to the limits of Section 382 as of December 25, 2021. The company does not believe that its utilization of carryforwards will be restricted by these limitations.
Unrecognized tax benefits represent the aggregate tax effect of differences between the tax return positions and the amounts otherwise recognized in the Company’s consolidated financial statements and are reflected in accrued expenses and other long-term liabilities in the Company’s Consolidated Balance Sheets. The Company accounts for uncertain tax positions by recognizing the financial statement effects of a tax provision only when based upon the technical merits, it is “more-likely-than-not” that the tax position will be sustained upon examination.
105
The following table summarizes the Company's unrecognized tax benefits (in thousands):
| 2021 | ||
Balance, beginning of year | $ | 483 | |
Gross increases related to prior period tax position |
| 94 | |
Gross increases related to current period tax position |
| 32 | |
Gross decreases related to prior period tax position |
| (254) | |
Balance, end of year | $ | 355 | |
Included in the balance of unrecognized tax benefits at December 25, 2021, are potential benefits of $0.4 million that if recognized would affect the effective tax rate on income from continuing operations.
The Company recognizes interest and penalties with respect to unrecognized tax benefits as a component of income tax expense. The amount of accrued interest and penalties related to unrecognized tax benefits for the fiscal years ended December 25, 2021 and December 26, 2020 was $0.1 million and $0.1 million, respectively.
The Company believes that it is reasonably possible that approximately $67 thousand of its unrecognized tax benefits may be recognized by the end of 2022, as a result of settlement with the taxing authorities. As such, this balance is reflected in accrued expenses in the Company’s Consolidated Balance Sheet as of December 25, 2021.
The Company is generally subject to potential federal and state examinations for the tax years on and after December 31, 2013 for federal purposes and December 31, 2014 for state purposes.
18. Related Party Transactions
The Company has two related party leases for a manufacturing facility and land. The facility and land are leased from Morning Fresh Dairy (“Morning Fresh”), a related party entity owned and controlled by an employee, board member of the Company and major equity holder of the Ultimate Parent. The facility lease and land lease are classified as a finance lease and operating lease, respectively, based on the original lease term and reasonably certain renewal options. As of December 25, 2021, the facility has a lease liability balance of $6.8 million which is primarily recognized as long-term debt in our Consolidated Balance Sheets. As of December 25, 2021, the land lease has a liability balance of $0.5 million which is primarily recognized as long-term operating lease liabilities in our Consolidated Balance Sheets. The facility and land lease contained payments of approximately $0.5 million, $0.5 million and $0.5 million for the fiscal years ended December 25, 2021, December 26, 2020 and December 28, 2019, respectively. In addition, $0.2 million, $0.2 million and $0.1 million was paid for the fiscal years ended December 25, 2021, December 26, 2020 and December 28, 2019, respectively, for a proportionate share of utilities, taxes and insurance.
Morning Fresh regularly purchases finished goods inventory from the Company for sale to its customers. Additionally, Morning Fresh regularly supplies milk used in the Company’s manufacturing process.
Sales to and purchases from Morning Fresh were as follows:
| Fiscal Year Ended | ||||||||
(In thousands) | December 25, 2021 | December 26, 2020 | December 28, 2019 | ||||||
Sales | $ | 471 | $ | 439 | $ | 280 | |||
Purchases | $ | 5,443 | $ | 4,945 | $ | 5,104 | |||
106
Amounts outstanding in respect to Morning Fresh transactions were as follows:
(In thousands) |
| December 25, 2021 |
| December 26, 2020 | ||
Receivables | $ | 26 | $ | 66 | ||
Payables | $ | 354 | $ | 503 | ||
The Company has a milk supply agreement with Morning Fresh for a base term ending December 31, 2027, with the option available for extension for a total of fifteen additional 2-year periods to December 31, 2057. Four years’ advance written notice is required to terminate the agreement. Milk will be priced on a month-to-month basis by USDA Central Federal Order No. 32 for Class II milk, plus surcharges and premiums, provided that the final price of the milk shall be 23.24 cents per hundred weight less than the published Dairy Farmers of America bill for that month. The Company will accept up to 3,650,000 gallons as determined by Morning Fresh in 2020, and for each year of the term thereafter.
As of December 25, 2021, the Company has future commitments to purchase approximately $39.4 million of milk from Morning Fresh, approximated at current market price. In addition, the Company has agreed to pay an additional $33 thousand monthly through December 31, 2027 to cover the landowner’s incremental costs relating to capital improvements necessary to support increased milk production required by the Company over the term of this agreement. If the agreement is terminated before December 1, 2027, the Company will be required to pay an early termination penalty, which declines from $3.0 million at the inception of the agreement to $0 over the ten-year term, based on an amortization table outlined in the agreement.
As of December 25, 2021, the estimated annual minimum purchase commitments with Morning Fresh were as follows (in thousands):
Fiscal Year Ending |
| ||
2022 | $ | 6,970 | |
2023 | 6,970 | ||
2024 | 6,970 | ||
2025 | 6,970 | ||
2026 | 6,970 | ||
Thereafter | 6,968 | ||
Total | $ | 41,818 | |
In January 2019, the Company entered into an agreement with a stockholder, to sell and issue 5,217 Class A units in exchange for a $6 million stockholder note receivable, which was recorded within stockholders’ equity. In accordance with the agreement, interest on the note accrued and compounded quarterly at a rate equal to the long-term applicable federal rate per annum on date of issuance on the unpaid principal amount of the note. The federal rate used on the date of issuance was the January 2019 long-term applicable federal rates for purposes of IRC 1274(d), which was 3.12%. On February 26, 2021, the stockholder note receivable plus accrued and unpaid interest was paid in full in the amount of $6.4 million.
Advent International Corporation (“Advent”) is a private equity firm which has invested funds in our common stock. Although no individual fund owns a controlling interest in us, together the funds represent our current majority owners.
Advent and its affiliates have ownership interests in a broad range of companies. We have entered and may in the future enter into commercial transactions in the ordinary course of our business with some of these companies, including the sale of goods and services and the purchase of goods and services.
During the fiscal years ended December 25, 2021, December 26, 2020 and December 28, 2019, Advent held an interest in Fort Dearborn Company (“Fort Dearborn”), a supplier of packaging labels. Purchases of labels from Fort Dearborn were
107
$1.8 million, $1.7 million and $0.7 million for the fiscal years ended December 25, 2021, December 26, 2020 and December 28, 2019, respectively.
For the year ended December 28, 2019 the Company received $5.9 million of contributions from the parent, related to an additional investment in Noosa of $2.8 million, the finalization of the Noosa working capital settlement of $1.8 million, and a preemptive rights offering which generated $1.3 million of additional capital.
For the fiscal years December 26, 2020 and December 28, 2019, the Company paid to the Ultimate Parent $35 thousand and $0.5 million, respectively, for the repurchase of Class A units and Incentive Units. There were no repurchases of Class A units or Incentive Units in 2021.
The Company pays legal expenses on behalf of the Limited Partnership, and carries a balance within other long-term assets that reflects the amount due from the Limited Partnership. As of December 25, 2021, the receivable balance was $0.4 million. There was no balance due from the Limited Partnership as of December 26, 2020.
The Company pays board compensation to three board members of $100 thousand to $125 thousand annually who are also limited partners of the Limited Partnership.
19. Earnings Per Share
Basic and diluted earnings (loss) per share (“EPS’) were as follows:
Fiscal Year Ended | |||||||||
(In thousands, except share and per share amounts) |
| December 25, 2021 |
| December 26, 2020 | December 28, 2019 | ||||
Net income (loss) | $ | 1,919 | $ | 10,825 | $ | (27,145) | |||
Basic |
|
|
|
| |||||
Weighted average basic common shares outstanding | 80,616,326 | 74,058,569 | 73,912,746 | ||||||
Basic earnings (loss) per share | $ | 0.02 | $ | 0.15 | $ | (0.37) | |||
Diluted |
|
|
|
| |||||
Weighted average diluted common shares outstanding | 80,616,326 | 75,921,065 | 73,912,746 | ||||||
Diluted earnings (loss) per share | $ | 0.02 | $ | 0.14 | $ | (0.37) | |||
A total of 927,222 RSUs issued under the 2021 Plan outstanding as of December 25, 2021 were excluded from the calculation of diluted EPS for the fiscal year ended December 25, 2021 because the effect was anti-dilutive.
There were no anti-dilutive shares for the diluted EPS calculation for the fiscal year ended December 26, 2020.
For the fiscal year ended December 28, 2019, all outstanding equity Incentive Units issued under our equity-based compensation plan were excluded from the calculation of diluted EPS because the effect was anti-dilutive.
108
Item 9. Changes in and Disagreements with Accountants on Accounting and Financial Disclosure
Not applicable.
Item 9A. Controls and Procedures
We maintain disclosure controls and procedures, as such term is defined in Rules 13a-15(e) and 15d-15(e) under the Securities Exchange Act of 1934, as amended (the “Exchange Act”), that are designed to provide reasonable assurance that information required to be disclosed by us in the reports that we file or submit under the Exchange Act is recorded, processed, summarized and reported within the time periods specified in the SEC rules and forms, and that such information is accumulated and communicated to our management, including our Chief Executive Officer and Chief Financial Officer, as appropriate, to allow timely decisions regarding required financial disclosures.
Management, including the participation of our Chief Executive Officer and our Chief Financial Officer, conducted an evaluation (pursuant to Rule 13a-15(b) under the Exchange Act) of the effectiveness of our disclosure controls and procedures as of the end of the period covered by this Form 10-K. Based on this evaluation, our Chief Executive Officer and Chief Financial Officer concluded that, as of December 25, 2021, the Company’s disclosure controls and procedures were effective.
Management's Annual Report on Internal Control over Financial Reporting
This annual report does not include a report of management's assessment regarding internal control over financial reporting or an attestation report of our registered public accounting firm due to a transition period established by rules of the SEC for newly public companies. Additionally, our independent registered public accounting firm will not be required to opine on the effectiveness of our internal control over financial reporting until we are no longer an “emerging growth company” as defined in the JOBS Act.
Changes in Internal Control over Financial Reporting
Based on management’s evaluation, there were no changes in our internal control over financial reporting during the quarter ended December 25, 2021 that have materially affected, or are reasonably likely to materially affect, our internal control over financial reporting.
Inherent Limitations on Effectiveness of Controls
Because of its inherent limitations, internal control over financial reporting may not prevent or detect misstatements. All internal control systems, no matter how well designed, have inherent limitations. Therefore, even those systems determined to be effective can provide only reasonable assurance with respect to financial statement preparation and presentation. While our disclosure controls and procedures are designed to provide reasonable assurance of their effectiveness, because of the inherent limitations in all control systems, no evaluation of controls can provide absolute assurance that all control issues and instances of fraud, if any, within the Company have been detected. Additionally, projections of any evaluation of effectiveness to future periods are subject to the risk that controls may become inadequate because of changes in conditions, or that the degree of compliance with the policies or procedures may deteriorate.
Item 9B. Other Information
Not applicable.
Item 9C. Disclosure Regarding Foreign Jurisdictions that Prevent Inspections
Not applicable.
109
PART III.
Item 10. Directors, Executive Officers and Corporate Governance
Incorporated herein by reference to our definitive proxy statement for our 2022 Annual Meeting of Stockholders to be filed no later than 120 days after the end of the fiscal year ended December 25, 2021.
Item 11. Executive Compensation
Incorporated herein by reference to our definitive proxy statement for our 2022 Annual Meeting of Stockholders to be filed no later than 120 days after the end of the fiscal year ended December 25, 2021.
Item 12. Security Ownership of Certain Beneficial Owners and Management and Related Stockholder Matters
Incorporated herein by reference to our definitive proxy statement for our 2022 Annual Meeting of Stockholders to be filed no later than 120 days after the end of the fiscal year ended December 25, 2021.
Item 13. Certain Relationships and Related Transactions, and Director Independence
Incorporated herein by reference to our definitive proxy statement for our 2022 Annual Meeting of Stockholders to be filed no later than 120 days after the end of the fiscal year ended December 25, 2021.
Item 14. Principal Accounting Fees and Services
Information about aggregate fees billed to us by our principal accountant, Deloitte & Touche LLP (PCAOB ID No. 34) will be included in our definitive proxy statement for our 2022 Annual Meeting of Stockholders to be filed no later than 120 days after the end of the fiscal year ended December 25, 2021, and is incorporated herein by reference.
PART IV.
Item 15. Exhibits, Financial Statement Schedules
The audited consolidated financial statements of Sovos Brands, Inc. and its subsidiaries, as required to be filed, are included under Item 8 of this Annual Report on Form 10-K. Other schedules have been omitted as they are not applicable or the required information is set forth in the consolidated financial statements or notes thereto.
Exhibit | ||
No. |
| Document |
3.1 | ||
3.2 | ||
4.1 | ||
4.2 |
110
*4.3 | Description of Securities. | |
10.1 | ||
10.2 | ||
†10.3 | ||
†10.4 | ||
†10.5 | ||
*†10.6 | ||
†10.7 | ||
†10.8 | ||
†10.9 | ||
†10.10 | ||
†10.11 | ||
†10.12 | ||
†10.13 | ||
†10.14 | ||
†10.15 |
111
†10.16 | ||
†10.17 | ||
†10.18 | ||
†10.19 | ||
†10.20 | ||
†10.21 | ||
†10.22 | ||
†10.23 | ||
†10.24 | ||
†10.25 | ||
†10.26 | ||
†10.27 | ||
†10.28 | ||
†10.29 |
112
†10.30 | ||
†10.31 | ||
*†10.32 | Form of Sovos Brands, Inc. 2021 Equity Incentive Plan Restricted Stock Unit Award Agreement. | |
†10.33 | ||
†10.34 | ||
†10.35 | ||
*†10.36 | Letter Agreement dated March 14, 2022 between Sovos Brands Intermediate, Inc. and Kirk Jensen. | |
21.1 | ||
*23.1 | ||
*31.1 | ||
*31.2 | ||
*32.1 | ||
101.INS | XBRL Instance Document | |
101.SCH | XBRL Taxonomy Extension Schema Document | |
101.CAL | XBRL Taxonomy Extension Calculation Linkbase Document | |
101.DEF | XBRL Taxonomy Extension Definition Linkbase Document | |
101.LAB | XBRL Taxonomy Extension Label Linkbase Document | |
101.PRE | XBRL Taxonomy Extension Presentation Linkbase Document | |
104 | Cover Page Interactive Data File (embedded within the Inline XBRL document and contained in Exhibit 101). * Filed herewith.
† Management contract or compensatory plan or arrangement. |
113
SIGNATURES
Pursuant to the requirements of Section 13 or 15(d) of the Securities Exchange Act of 1934, the registrant has duly caused this report to be signed on its behalf by the undersigned thereunto duly authorized.
Sovos Brands, Inc. | ||
By: | /s/ Todd R. Lachman | |
Date: March 15, 2022 | Name: | Todd R. Lachman |
Title: | President and Chief Executive Officer | |
115
Pursuant to the requirements of the Securities Exchange Act of 1934, this report has been signed below by the following persons on behalf of the registrant and in the capacities and on the dates indicated.
Signature | Title | Date | |
/s/ Todd R. Lachman Todd R. Lachman | President, Chief Executive Officer and Director (Principal Executive Officer) | March 15, 2022 | |
/s/ Christopher W. Hall Christopher W. Hall | Chief Financial Officer (Principal Financial Officer) | March 15, 2022 | |
/s/ William R. Johnson William R. Johnson | Chairman of the Board of Directors | March 15, 2022 | |
/s/ Jefferson M. Case Jefferson M. Case | Director | March 15, 2022 | |
/s/ Robert L. Graves Robert L. Graves | Director | March 15, 2022 | |
/s/ Neha U. Mathur Neha U. Mathur | Director | March 15, 2022 | |
/s/ David W. Roberts David W. Roberts | Director | March 15, 2022 | |
/s/ Valarie L. Sheppard Valarie L. Sheppard | Director | March 15, 2022 | |
/s/ Vijayanthimala Singh Vijayanthimala Singh | Director | March 15, 2022 |
116
Similar companies
See also Mondelez International, Inc. - Annual report 2022 (10-K 2022-12-31) Annual report 2023 (10-Q 2023-09-30)See also GROUPE DANONE
See also CONAGRA BRANDS INC. - Annual report 2024 (10-K 2024-05-26) Annual report 2025 (10-Q 2025-02-23)
See also CAMPBELL'S Co - Annual report 2023 (10-K 2023-07-30) Annual report 2023 (10-Q 2023-04-30)
See also FLOWERS FOODS INC - Annual report 2023 (10-K 2023-12-30) Annual report 2023 (10-Q 2023-10-07)