|
|
|
|
|
|
|
|
|
|
|
|
|
|
|
|
|
|
|
|
|
|
|
|
|
|
|
|
|
|
|
|
|
|
|
|
|
|
|
|
|
|
|
|
|
|
|
|
|
|
|
|
|
|
|
|
|
|
|
|
|
|
| | |
|
)
|
|
|
|
|
|
|
|
|
|
|
|
|
|
|
|
|
Verizon % - % notes due 2025 - 2028 | € | | | | $ | | |
|
(1) The total cash consideration includes the tender offer consideration, plus any accrued and unpaid interest to the date of purchase. In addition, for securities denominated in a currency other than the U.S. dollar, cash consideration is shown on a U.S. dollar equivalent basis and includes the amount payable per the derivatives entered into in connection with the transaction. See Note 7 for additional information on cross currency swap transactions related to the transaction.
Repayments and Repurchases
| | | | | | | | | | | |
| (dollars in millions) | Principal Repaid/ Repurchased | | Amount Paid(1) |
|
Verizon % notes due 2024 | € | | | | $ | | |
Verizon % notes due 2024 | $ | | | | | |
| Verizon floating rate notes due 2024 | | | | | |
|
| Open market repurchases of various Verizon notes | | | | | |
| Total | | | $ | | |
|
|
|
|
|
|
|
|
|
|
|
|
|
(1) Represents amount paid to repay or repurchase, including any accrued interest. In addition, for securities denominated in a currency other than the U.S. dollar, amount paid is shown on a U.S. dollar equivalent basis and includes the amount payable per the derivatives entered into in connection with the transaction. See Note 7 for additional information on cross currency swap transactions related to the transaction.
Issuances
| | | | | | | | | | | |
| (dollars in millions) | Principal Amount Issued | | Net Proceeds(1) |
|
|
|
|
|
|
|
|
|
|
|
|
|
|
|
|
Verizon % notes due 2032 | € | | | | $ | | |
Verizon % notes due 2036 | € | | | | | |
Verizon % notes due 2054(2) | $ | | | | | |
| Total | | | $ | | |
(1) Net proceeds were net of underwriting discounts and other issuance costs. In addition, for securities denominated in a currency other than the U.S. dollar, net proceeds are shown on a U.S. dollar equivalent basis. See Note 7 for additional information on cross currency swap transactions related to the issuances.
(2) An amount equal to the net proceeds from these notes is expected to be used to fund, in whole or in part, certain renewable energy projects, including new and existing investments made by us during the period from May 1, 2023 through the maturity date of the notes.
Commercial Paper Program
During the three months ended March 31, 2024, we issued $ billion in commercial paper and we repaid $ billion of commercial paper. As of March 31, 2024, we had $ billion of commercial paper outstanding. These transactions are reflected within Cash flows from financing activities in our condensed consolidated statements of cash flows on a net basis.
Asset-Backed Debt
As of March 31, 2024, the carrying value of our asset-backed debt was $ billion. Our asset-backed debt includes Asset-Backed Notes (ABS Notes) issued to third-party investors (Investors) and loans (ABS Financing Facilities) received from banks and their conduit facilities (collectively, the Banks). Our consolidated asset-backed debt bankruptcy remote legal entities (each, an ABS Entity, or collectively, the ABS Entities) issue the debt or are otherwise party to the transaction documentation in connection with our asset-backed debt transactions. Under the terms of our asset-backed debt, Cellco Partnership (Cellco), a wholly-owned subsidiary of the Company, and certain other Company affiliates (collectively, the Originators) transfer device payment plan agreement receivables and certain other receivables (collectively referred to as certain receivables) or a participation interest in certain other receivables to one of the ABS Entities, which in turn transfers such receivables and participation interest to another ABS Entity that issues the debt. Verizon entities retain the equity interests and residual interests, as applicable, in the ABS Entities, which represent the rights to all funds not needed to make required payments on the asset-backed debt and other related payments and expenses.
Our asset-backed debt is secured by the transferred receivables and participation interest, and future collections on such receivables and underlying receivables related to such participation interest. These receivables and participation interest transferred to the ABS Entities and related assets, consisting primarily of restricted cash, will only be available for payment of asset-backed debt and expenses related thereto, payments to the Originators in respect of additional transfers of certain receivables and participation interest, and other obligations arising from our asset-backed debt transactions, and will not be available to pay other obligations or claims of Verizon’s creditors until the associated asset-backed debt and other obligations are
| | $ | | |
| A-1b Senior class notes | Compounded SOFR + (1) | | | | |
| B Junior class notes | | | | | |
| C Junior class notes | | | | | |
| | | | |
| Series 2024-2 | | | | |
| A Senior class notes | | | | | |
| B Junior class notes | | | | | |
| C Junior class notes | | | | | |
| Total | | | | $ | | |
|
|
|
|
|
|
| (1) Compounded Secured Overnight Financing Rate (SOFR) is calculated using SOFR as published by the Federal Reserve Bank of New York in accordance with the terms of such notes. Compounded SOFR for the interest payment made in March 2024 was %.
Under the terms of each series of ABS Notes outstanding as of March 31, 2024, there is a revolving period of up to , , or , as applicable, during which we may transfer additional receivables to the ABS Entity. During the three months ended March 31, 2024, we made aggregate principal repayments of $ million in connection with an anticipated redemption of ABS Notes and notes that have entered the amortization period, including payments in connection with any note redemptions.
In April 2024, we issued $ million aggregate principal amount of senior and junior ABS Notes, with a blended interest rate of approximately %, through an ABS Entity.
ABS Financing Facilities
Under the loan agreements outstanding in connection with the ABS Financing Facility originally entered into in 2021 and most recently renewed in 2023 (2021 ABS Financing Facility), we prepaid an aggregate of $ million in January 2024 and borrowed an additional $ million in March 2024. The aggregate outstanding balance under the 2021 ABS Financing Facility was $ billion as of March 31, 2024. In April 2024, we prepaid an aggregate of $ million under a loan agreement outstanding in connection with the 2021 ABS Financing Facility.
Under the loan agreement outstanding in connection with the ABS Financing Facility originally entered into in 2022 and most recently renewed in 2023 (2022 ABS Financing Facility), the aggregate outstanding balance was $ billion as of March 31, 2024.
Variable Interest Entities (VIEs)
The ABS Entities meet the definition of a VIE for which we have determined that we are the primary beneficiary as we have both the power to direct the activities of the entity that most significantly impact the entity’s performance and the obligation to absorb losses or the right to receive benefits of the entity. Therefore, the assets, liabilities and activities of the ABS Entities are
| | $ | | |
| Prepaid expenses and other | | | | | |
| Other assets | | | | | |
| | | |
| Liabilities | | | |
| Accounts payable and accrued liabilities | | | | | |
| Debt maturing within one year | | | | | |
| Long-term debt | | | | | |
The Accounts receivable, net amounts above does not include underlying receivables for which a participation interest has been transferred to the ABS Entities. See Note 6 for additional information on certain receivables and participation interest used to secure asset-backed debt.
| | $ | | | | $ | | | Various export credit facilities(2) | 2024 - 2031 | | | | | | | | | |
| Total | | | $ | | | | $ | | | | $ | | |
|
|
|
|
|
The data presented in the table above was last updated on March 31, 2024.
Allowance for Credit Losses
The credit quality indicators are used in determining the estimated amount and the timing of expected credit losses for the device payment plan agreement and wireless service receivables portfolios.
For device payment plan agreement receivables, we record bad debt expense based on a default and loss calculation using our proprietary loss model. The expected loss rate is determined based on customer credit scores and other qualitative factors as noted above. The loss rate is assigned individually on a customer by customer basis and the custom credit scores are then aggregated by vintage and used in our proprietary loss model to calculate the weighted-average loss rate used for determining the allowance balance.
We monitor the collectability of our wireless service receivables as one overall pool. Wireline service receivables are disaggregated and pooled by the following types of customers and related contracts: consumer, small and medium business, enterprise, public sector and wholesale. For wireless service receivables and wireline consumer and small and medium business receivables, the allowance is calculated based on a 12 month rolling average write-off balance multiplied by the average life-cycle of an account from billing to write-off. The risk of loss is assessed over the contractual life of the receivables and is adjusted based on the historical loss amounts for current and future conditions based on management’s qualitative considerations. For enterprise, public sector and wholesale wireline receivables, the allowance for credit losses is based on historical write-off experience and individual customer credit risk, if applicable.
| | $ | | | |
|
|
|
|
|
|
|
|
| | $ | | | | $ | | | | $ | | |
|
|
| Cross currency swaps | | | | | | | | | | | |
|
| Interest rate caps | | | | | | | | | | | |
|
|
| Other assets: | | | | | | | |
|
| Fixed income securities | | | | | | | | | | | |
|
| Cross currency swaps | | | | | | | | | | | |
|
| Interest rate caps | | | | | | | | | | | |
|
|
|
| Total | $ | | | | $ | | | | $ | | | | $ | | |
| | | | | | | |
| Liabilities: | | | | | | | |
| Other current liabilities: | | | | | | | |
| Interest rate swaps | $ | | | | $ | | | | $ | | | | $ | | |
| Cross currency swaps | | | | | | | | | | | |
| Foreign exchange forwards | | | | | | | | | | | |
| Interest rate caps | | | | | | | | | | | |
|
|
|
|
| Other liabilities: | | | | | | | |
| Interest rate swaps | | | | | | | | | | | |
| Cross currency swaps | | | | | | | | | | | |
|
| Interest rate caps | | | | | | | | | | | |
|
|
|
|
| Total | $ | | | | $ | | | | $ | | | | $ | | |
(1)Quoted prices in active markets for identical assets or liabilities.
(2)Observable inputs other than quoted prices in active markets for identical assets and liabilities.
(3)Unobservable pricing inputs in the market.
| | $ | | | | $ | | | | $ | | | |
|
| Cross currency swaps | | | | | | | | | | | |
| Foreign exchange forwards | | | | | | | | | | | |
| Interest rate caps | | | | | | | | | | | |
|
|
| Other assets: | | | | | | | |
|
| Fixed income securities | | | | | | | | | | | |
|
| Cross currency swaps | | | | | | | | | | | |
| Interest rate caps | | | | | | | | | | | |
|
|
|
| Total | $ | | | | $ | | | | $ | | | | $ | | |
| | | | | | | |
| Liabilities: | | | | | | | |
| Other current liabilities: | | | | | | | |
Interest rate swaps | $ | | | | $ | | | | $ | | | | $ | | |
|
Cross currency swaps | | | | | | | | | | | |
Foreign exchange forwards | | | | | | | | | | | |
Interest rate caps | | | | | | | | | | | |
|
|
|
| Contingent consideration | | | | | | | | | | | |
| Other liabilities: | | | | | | | |
Interest rate swaps | | | | | | | | | | | |
Cross currency swaps | | | | | | | | | | | |
|
Interest rate caps | | | | | | | | | | | |
|
|
|
|
| Total | $ | | | | $ | | | | $ | | | | $ | | |
(1)Quoted prices in active markets for identical assets or liabilities.
(2)Observable inputs other than quoted prices in active markets for identical assets and liabilities.
(3)Unobservable pricing inputs in the market.
Certain of our equity investments do not have readily determinable fair values and are excluded from the tables above. Such investments are measured at cost, less any impairment, plus or minus changes resulting from observable price changes in orderly transactions for an identical or similar investment of the same issuer and are included in Investments in unconsolidated businesses in our condensed consolidated balance sheets. As of both March 31, 2024 and December 31, 2023, the carrying amount of our investments without readily determinable fair values was $ million. During the three months ended March 31, 2024, there were insignificant adjustments due to observable price changes and there were insignificant amounts of impairment charges. As of March 31, 2024, cumulative adjustments due to observable price changes and impairment charges were $ million and $ million, respectively.
Verizon had a liability for contingent consideration related to its acquisition of TracFone, completed in November 2021. The fair value was calculated using a probability-weighted discounted cash flow model and represented a Level 3 measurement. Level 3 instruments include valuation based on unobservable inputs reflecting our own assumptions, consistent with reasonably available assumptions made by other market participants. Subsequent to the Acquisition Date, at each reporting date, the contingent consideration liability was remeasured to fair value. Contingent consideration payments were completed in January of 2024. During the three months ended March 31, 2024 and March 31, 2023, we made payments of $ million and $ million, respectively, related to the contingent consideration. See Note 3 for additional information.
Fixed income securities consist primarily of investments in municipal bonds. The valuation of the fixed income securities is based on the quoted prices for similar assets in active markets or identical assets in inactive markets or models that apply inputs from observable market data. The valuation determines that these securities are classified as Level 2.
Derivative contracts are valued using models based on readily observable market parameters for all substantial terms of our derivative contracts and thus are classified within Level 2. We use mid-market pricing for fair value measurements of our derivative instruments. Our derivative instruments are recorded on a gross basis.
We recognize transfers between levels of the fair value hierarchy as of the end of the reporting period.
Fair Value of Short-term and Long-term Debt
The fair value of our debt is determined using various methods, including quoted prices for identical debt instruments, which is a Level 1 measurement, as well as quoted prices for similar debt instruments with comparable terms and maturities, which is a Level 2 measurement.
| | $ | | | | $ | | | | $ | | | | $ | | | | At December 31, 2023 | | | | | | | | | | | | | | |
| |
Derivative Instruments
We enter into derivative transactions primarily to manage our exposure to fluctuations in foreign currency exchange rates and interest rates. We employ risk management strategies, which may include the use of a variety of derivatives including interest rate swaps, cross currency swaps, forward starting interest rate swaps, treasury rate locks, interest rate caps, swaptions and foreign exchange forwards. We do not hold derivatives for trading purposes.
| | $ | | |
| Cross currency swaps | | | | | |
|
|
|
| Foreign exchange forwards | | | | | |
|
|
| | $ | | |
| Notional value settled | | | | | |
|
|
| Pre-tax gain (loss) recognized in Interest expense | | | | () | |
| Cross Currency Swaps: | | | |
| Notional value entered into | | | | | |
| Notional value settled | | | | | |
|
Pre-tax gain (loss) on cross currency swaps recognized in Interest expense | () | | | | |
Pre-tax gain (loss) on hedged debt recognized in Interest expense | | | | () | |
Excluded components recognized in Other comprehensive income (loss) | | | | () | |
| Initial value of the excluded component amortized into Interest expense | | | | | |
|
|
|
|
|
|
|
|
|
| | | | | | | | | | | |
| Three Months Ended |
| March 31, |
| (dollars in millions) | 2024 | | 2023 |
|
|
|
|
| Other, net Cash Flows from Financing Activities: | | | |
| Cash paid for settlement of cross currency swaps, net | $ | () | | | $ | () | |
| | $ | | |
| Cumulative amount of fair value hedging adjustment included in the carrying amount of the hedged liabilities | () | | | () | |
| Cumulative amount of fair value hedging adjustment remaining for which hedge accounting has been discontinued | | | | | |
billion as of March 31, 2022 will continue to be amortized into Interest expense over the remaining life of the hedging instruments. During the three months ended March 31, 2024 and March 31, 2023, the amortization of the initial value of the excluded component completely offset the amortization related to the amount remaining in Other comprehensive income (loss) related to cash flow hedges. See Note 9 for additional information. We estimate that $ million will be amortized into Interest expense within the next 12 months.
Net Investment Hedges
We have designated certain foreign currency debt instruments as net investment hedges to mitigate foreign exchange exposure related to non-U.S. dollar net investments in certain foreign subsidiaries against changes in foreign exchange rates. The notional amount of Euro-denominated debt designated as a net investment hedge was € million as of both March 31, 2024 and December 31, 2023.
Undesignated Derivatives
We also have the following derivative contracts which we use as economic hedges but for which we have elected not to apply hedge accounting.
| | $ | | | | Notional value settled | | | | | |
| Pre-tax gain (loss) recognized in Other income, net | () | | | | |
|
|
|
|
|
|
|
Foreign Exchange Forwards
We enter into British Pound Sterling and Euro foreign exchange forwards to mitigate our foreign exchange rate risk related to non-functional currency denominated monetary assets and liabilities of international subsidiaries.
t hold any collateral. At March 31, 2024, we posted $ billion of collateral related to derivative contracts under collateral exchange agreements, which was recorded as Prepaid expenses and other in our condensed consolidated balance sheet. At December 31, 2023, we did t hold any collateral. At December 31, 2023, we posted $ billion of collateral related to derivative contracts under collateral exchange arrangements, which was recorded as Prepaid expenses and other in our condensed consolidated balance sheet. While we may be exposed to credit losses due to the nonperformance of our counterparties, we consider the risk remote and do not expect that any such nonperformance would result in a significant effect on our results of operations or financial condition due to our diversified pool of counterparties.
| | $ | | | | $ | | | | $ | | |
| Service cost - Selling, general and administrative expense | | | | | | | | | | | |
| Service cost | $ | | | | $ | | | | $ | | | | $ | | |
| | | | | | | |
| Amortization of prior service cost (credit) | $ | | | | $ | | | | $ | () | | | $ | () | |
| Expected return on plan assets | () | | | () | | | () | | | () | |
| Interest cost | | | | | | | | | | | |
| Remeasurement gain, net | () | | | | | | | | | | |
|
| Other components | $ | () | | | $ | () | | | $ | | | | $ | | |
| | | | | | | |
| Total | $ | () | | | $ | | | | $ | | | | $ | | |
The service cost component of net periodic benefit cost (income) is recorded in Cost of services and Selling, general and administrative expense in the condensed consolidated statements of income while the other components, including mark-to-market adjustments, if any, are recorded in Other income, net.
During the three months ended March 31, 2024, we updated the expected return on plan assets assumption for our pension plans from % at December 31, 2023 to % based upon the expected market returns from the March 31, 2024 asset allocation.
Pension Annuitization
On February 29, 2024, we entered into separate commitment agreements, one by and between the Company, State Street Global Advisors Trust Company (“State Street”), as independent fiduciary of the Verizon Management Pension Plan and Verizon Pension Plan for Associates (the “Pension Plans”), and The Prudential Insurance Company of America (“Prudential”), and one by and between the Company, State Street and RGA Reinsurance Company (“RGA”), under which the Pension Plans purchased
billion of benefit liabilities of the Pension Plans.
The purchase of the group annuity contracts closed on March 6, 2024. The group annuity contracts primarily cover a population that includes retirees who commenced benefit payments from the Pension Plans prior to January 1, 2023 (“Transferred Participants”). Prudential and RGA each irrevocably guarantee and assume the sole obligation to make future payments to the Transferred Participants as provided under their respective group annuity contracts, with direct payments beginning July 1, 2024. The aggregate amount of each Transferred Participant’s payment under the group annuity contracts will be equal to the amount of each individual’s payment under the Pension Plans.
The purchase of the group annuity contracts was funded directly by transferring $ billion of assets of the Pension Plans. The Company made additional contributions to the Pension Plans prior to the closing date of the transaction, as discussed below. With these contributions, the funded ratio of each of the Pension Plans does not change as a result of this transaction. During the three months ended March 31, 2024, we recorded a net pre-tax settlement gain as a result of this transaction, as discussed below.
Pension plan assets and liabilities are primarily presented within Employee benefit obligations in our condensed consolidated balance sheets.
Severance Payments
During the three months ended March 31, 2024, we paid severance benefits of $ million. At March 31, 2024, we had a remaining severance liability of $ million, a portion of which includes future contractual payments to separated employees.
Employer Contributions
During the three months ended March 31, 2024, we made discretionary contributions to the Pension Plans in the aggregate amount of $ million. During the three months ended March 31, 2023, we made contributions to our qualified pension plans. During the three months ended March 31, 2024 and March 31, 2023, we made insignificant contributions to our nonqualified pension plans. No mandatory qualified pension plans contributions are expected or required through December 31, 2024. No significant changes are expected with respect to the nonqualified pension and other postretirement benefit plans contributions in 2024.
Remeasurement gain, net
During the three months ended March 31, 2024, we recorded a net pre-tax remeasurement gain of $ million in our pension plans due to a net pre-tax settlement gain of $ million resulting from the pension annuitization transaction discussed above, partially offset by a net pre-tax remeasurement loss of $ million triggered by settlements.
The net pre-tax remeasurement loss recorded for the three months ended March 31, 2024, was primarily driven by a $ million charge resulting from the difference between our estimated and actual return on assets, partially offset by a credit of $ million due to changes in our discount rate assumption used to determine the current year liabilities of our pension plans.
| | $ | | | | | | | $ | | | | |
| Balance at end of period | | | | | | | | | | | | |
| | | | | | | | |
| Additional Paid In Capital | | | | | | | | |
| Balance at beginning of period | | | | | | | | | | |
|
| Other | | | () | | | | | | | |
| Balance at end of period | | | | | | | | | | |
| | | | | | | | |
| Retained Earnings | | | | | | | | |
| Balance at beginning of period | | | | | | | | | | |
|
|
| Net income attributable to Verizon | | | | | | | | | | |
Dividends declared ($, $ per share) | | | () | | | | | () | | |
| Other | | | () | | | | | | | |
| Balance at end of period | | | | | | | | | | |
| | | | | | | | |
| Accumulated Other Comprehensive Loss | | | | | | | | |
| Balance at beginning of period attributable to Verizon | | | () | | | | | () | | |
|
|
| Foreign currency translation adjustments | | | () | | | | | | | |
| Unrealized gain on cash flow hedges | | | | | | | | | | |
| Unrealized gain (loss) on fair value hedges | | | | | | | | () | | |
| Unrealized gain (loss) on marketable securities | | | () | | | | | | | |
| Defined benefit pension and postretirement plans | | | () | | | | | () | | |
| Other comprehensive income (loss) | | | | | | | | () | | |
| Balance at end of period attributable to Verizon | | | () | | | | | () | | |
| | | | | | | | |
| Treasury Stock | | | | | | | | |
| Balance at beginning of period | () | | | () | | | () | | | () | | |
|
| Employee plans | | | | | | | | | | | | |
| Shareholder plans | | | | | | | | | | | | |
|
| Balance at end of period | () | | | () | | | () | | | () | | |
| | | | | | | | |
| Deferred Compensation-ESOPs and Other | | | | | | | | |
| Balance at beginning of period | | | | | | | | | | |
| Restricted stock equity grant | | | | | | | | () | | |
| Amortization | | | () | | | | | () | | |
| Balance at end of period | | | | | | | | | | |
| | | | | | | | |
| Noncontrolling Interests | | | | | | | | |
| Balance at beginning of period | | | | | | | | | | |
|
|
|
|
|
| Total comprehensive income | | | | | | | | | | |
| Distributions and other | | | () | | | | | () | | |
| Balance at end of period | | | | | | | | | | |
| Total Equity | | | $ | | | | | | $ | | | |
| | | | $ | () | | | $ | | | | $ | () | |
| | | | | |
| | | | | |
)| | | | $ | () | | | $ | | | | $ | () | |
The amounts presented above in Net other comprehensive income (loss) are net of taxes. The amounts reclassified to net income related to unrealized gain (loss) on cash flow hedges and unrealized gain (loss) on fair value hedges in the table above are included in Other income, net and Interest expense in our condensed consolidated statements of income. See Note 7 for additional information. The amounts reclassified to net income related to unrealized loss on marketable securities and defined benefit pension and postretirement plans in the table above are included in Other income, net in our condensed consolidated statements of income. See Note 8 for additional information.
reportable segments that we operate and manage as strategic business units - Consumer and Business. We measure and evaluate our reportable segments based on segment operating income, consistent with the chief operating decision maker’s assessment of segment performance.
states in the Mid-Atlantic and Northeastern U.S., as well as Washington D.C., over our 100% fiber-optic network through our Verizon Fios product portfolio and over a traditional copper-based network to customers who are not served by Fios. | | |
Verizon
Business Group | | Our Business segment provides wireless and wireline communications services and products, including FWA broadband, data, video and conferencing services, corporate networking solutions, security and managed network services, local and long distance voice services and network access to deliver various IoT services and products. We provide these products and services to businesses, government customers and wireless and wireline carriers across the U.S. and a subset of these products and services to customers around the world. |
Our Consumer segment's wireless and wireline products and services are available to our retail customers, as well as resellers that purchase wireless network access from us on a wholesale basis. Our Business segment's wireless and wireline products and services are organized by the primary customer groups targeted by these offerings: Enterprise and Public Sector, Business Markets and Other, and Wholesale.
Corporate and other primarily includes device insurance programs, investments in unconsolidated businesses and development stage businesses that support our strategic initiatives, as well as unallocated corporate expenses, certain pension and other employee benefit related costs and interest and financing expenses. Corporate and other also includes the historical results of divested businesses and other adjustments and gains and losses that are not allocated or used in assessing segment performance due to their nature. Although such transactions are excluded from the business segment results, they are included in reported consolidated earnings. Gains and losses from these transactions that are not individually significant are included in segment results and therefore included in the chief operating decision maker’s assessment of segment performance.
reportable segments: | | | | | | | | | | | |
|
|
| (dollars in millions) | 2024 | | 2023 |
| External Operating Revenues | | | |
| Consumer | | | |
Service | $ | | | | $ | | |
Wireless equipment | | | | | |
Other(1) | | | | | |
Total Consumer | | | | | |
| Business | | | |
| Enterprise and Public Sector | | | | | |
Business Markets and Other | | | | | |
| Wholesale | | | | | |
| Total Business | | | | | |
| Total reportable segments | $ | | | | $ | | |
| | | |
| Intersegment Revenues | | | |
| Consumer | $ | | | | $ | | |
| Business | | | | | |
| Total reportable segments | $ | | | | $ | | |
| | | |
| Total Operating Revenues | | | |
| Consumer | $ | | | | $ | | |
Business(2) | | | | | |
| Total reportable segments | $ | | | | $ | | |
| | | |
| Operating Income | | | |
| Consumer | $ | | | | $ | | |
| Business | | | | | |
| Total reportable segments | $ | | | | $ | | |
(1) Other revenue includes fees that partially recover the direct and indirect costs of complying with regulatory and industry obligations and programs, revenues associated with certain products included in our device protection offerings, leasing and interest recognized when equipment is sold to the customer by an authorized agent under a device payment plan agreement.
(2) Service and other revenues and Wireless equipment revenues included in our Business segment were approximately $ billion and $ million, respectively, for the three months ended March 31, 2024, and were approximately $ billion and $ million, respectively, for the three months ended March 31, 2023.
The following table provides Fios revenue for our reportable segments:
| | | | | | | | | | | |
|
|
| (dollars in millions) | 2024 | | 2023 |
| Consumer | $ | | | | $ | | |
| Business | | | | | |
| Total Fios revenue | $ | | | | $ | | |
The following table provides Wireless service revenue for our reportable segments and includes intersegment activity:
| | | | | | | | | | | |
|
|
| (dollars in millions) | 2024 | | 2023 |
| Consumer | $ | | | | $ | | |
| Business | | | | | |
| Total Wireless service revenue | $ | | | | $ | | |
| | $ | | | Corporate and other | | | | | |
Eliminations | () | | | () | |
|
| Total consolidated operating revenues | $ | | | | $ | | |
| | $ | | |
| Corporate and other | () | | | () | |
|
|
| Other components of net periodic benefit charges (Note 8) | () | | | () | |
|
|
|
|
|
|
Legacy legal matter | () | | | | |
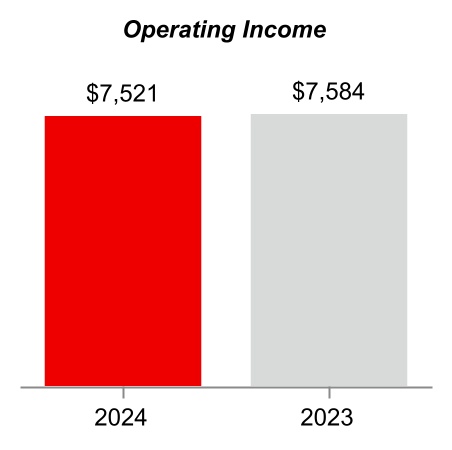
| Total consolidated operating income | | | | | |
| Equity in earnings (losses) of unconsolidated businesses | () | | | | |
| Other income, net | | | | | |
| Interest expense | () | | | () | |
| Income Before Provision For Income Taxes | $ | | | | $ | | |
No single customer accounted for more than 10% of our total operating revenues during the three months ended March 31, 2024 or 2023.
The chief operating decision maker does not review disaggregated assets on a segment basis; therefore, such information is not presented. Depreciation and amortization included in the measure of segment profitability is primarily allocated based on proportional usage, and is included within Total reportable segments operating income.
million and $ million, respectively, remained as confirmed obligations outstanding related to suppliers participating in the supplier finance program.
federal district court actions alleging that Verizon is infringing various patents. Most of these cases are brought by non-practicing entities and effectively seek only monetary damages; a small number are brought by companies that have sold products and could seek injunctive relief as well. These cases have progressed to various stages and a small number may go to trial in the coming 12 months if they are not otherwise resolved.
renewable energy purchase agreements (REPAs) with third parties. Each of the REPAs is based on the expected operation of a renewable energy-generating facility and has a fixed price term of to years from the commencement of the facility's entry into commercial operation. of the facilities have entered into commercial operation, and the remainder are under development. The REPAs generally are expected to be financially settled based on the prevailing market price as energy is generated by the facilities.
| | |
| Item 2. Management’s Discussion and Analysis of Financial Condition and Results of Operations |
Verizon Communications Inc. (the Company) is a holding company that, acting through its subsidiaries (together with the Company, collectively, Verizon), is one of the world’s leading providers of communications, technology, information and entertainment products and services to consumers, businesses and government entities. With a presence around the world, we offer data, video and voice services and solutions on our networks and platforms that are designed to meet customers’ demand for mobility, reliable network connectivity and security.
To compete effectively in today’s dynamic marketplace, we are focused on the capabilities of our high-performing networks to drive growth based on delivering what customers want and need in the digital world. We are consistently deploying new network architecture and technologies to secure our leadership in both fourth-generation (4G) and fifth-generation (5G) wireless networks. Our network quality is the hallmark of our brand and the foundation for the connectivity, platforms and solutions upon which we build our competitive advantage. In 2024, we are focused on enhancing and driving the monetization of our networks, platforms and solutions, retaining and growing our high-quality customer base and further improving our financial and operating performance.
Our strategy requires significant capital investments primarily to acquire wireless spectrum, put the spectrum into service, provide additional capacity for growth in our networks, invest in the fiber that supports our businesses, evolve and maintain our networks and develop and maintain significant advanced information technology systems and data system capabilities. We believe that our C-Band spectrum, together with our industry leading millimeter wave spectrum holdings and our 4G Long-Term Evolution (LTE) network and fiber infrastructure, will drive innovative products and services and fuel our growth.
Highlights of Our Financial Results for the Three Months Ended March 31, 2024 and 2023
(dollars in millions)
Business Overview
We have two reportable segments that we operate and manage as strategic business units - Verizon Consumer Group (Consumer) and Verizon Business Group (Business).
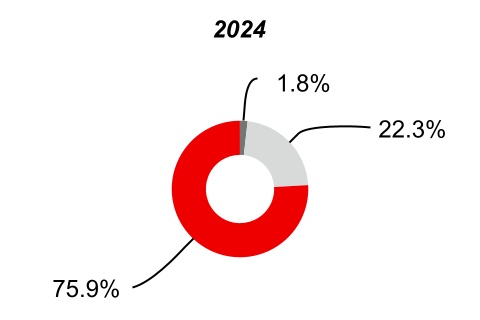
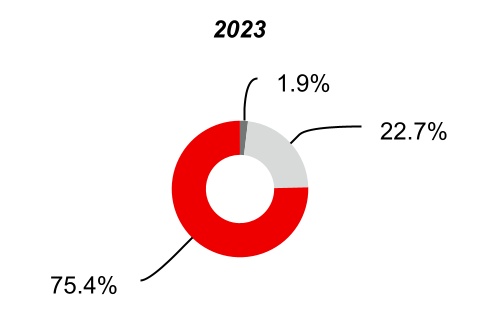
Revenue by Segment for the Three Months Ended March 31, 2024 and 2023
———
Note: Excludes eliminations.
Verizon Consumer Group
Our Consumer segment provides consumer-focused wireless and wireline communications services and products. Our wireless services are provided across one of the most extensive wireless networks in the United States (U.S.) under the Verizon family of brands and through wholesale and other arrangements. We also provide fixed wireless access (FWA) broadband through our 5G or 4G LTE networks as an alternative to traditional landline internet access. Our wireline services are provided in nine states in the Mid-Atlantic and Northeastern U.S., as well as Washington D.C., over our 100% fiber-optic network through our Verizon Fios product portfolio and over a traditional copper-based network to customers who are not served by Fios. Our Consumer segment's wireless and wireline products and services are available to our retail customers, as well as resellers that purchase wireless network access from us on a wholesale basis.
Customers can obtain our wireless services on a postpaid or prepaid basis. Our postpaid service is generally billed one month in advance for a monthly access charge in return for access to and usage of network services. Our prepaid service is offered only to Consumer customers and enables individuals to obtain wireless services without credit verification by paying for all services in advance. The Consumer segment also offers several categories of wireless equipment to customers, including a variety of smartphones and other handsets, wireless-enabled internet devices, such as tablets, and other wireless-enabled connected devices, such as smart watches.
In addition to the wireless services and equipment discussed above, the Consumer segment sells residential fixed connectivity solutions, including internet, video and voice services, and wireless network access to resellers on a wholesale basis. The Consumer segment's operating revenues for the three months ended March 31, 2024 totaled $25.1 billion, representing an increase of 0.8% compared to the similar period in 2023. See "Segment Results of Operations" for additional information regarding our Consumer segment’s operating performance and selected operating statistics.
Verizon Business Group
Our Business segment provides wireless and wireline communications services and products, including FWA broadband, data, video and conferencing services, corporate networking solutions, security and managed network services, local and long distance voice services and network access to deliver various Internet of Things (IoT) services and products, including solutions that support mobile resource management. We provide these products and services to businesses, government customers and wireless and wireline carriers across the U.S. and a subset of these products and services to customers around the world. The Business segment's operating revenues for the three months ended March 31, 2024 totaled $7.4 billion, representing a decrease of 1.6% compared to the similar period in 2023. See "Segment Results of Operations" for additional information regarding our Business segment’s operating performance and selected operating statistics.
Corporate and Other
Corporate and other primarily includes device insurance programs, investments in unconsolidated businesses and development stage businesses that support our strategic initiatives, as well as unallocated corporate expenses, certain pension and other employee benefit related costs and interest and financing expenses. Corporate and other also includes the historical results of
divested businesses and other adjustments and gains and losses that are not allocated or used in assessing segment performance due to their nature. Although such transactions are excluded from the business segment results, they are included in reported consolidated earnings. Gains and losses from these transactions that are not individually significant are included in segment results and therefore are included in the chief operating decision maker’s assessment of segment performance. See "Consolidated Results of Operations" for additional information regarding Corporate and other results.
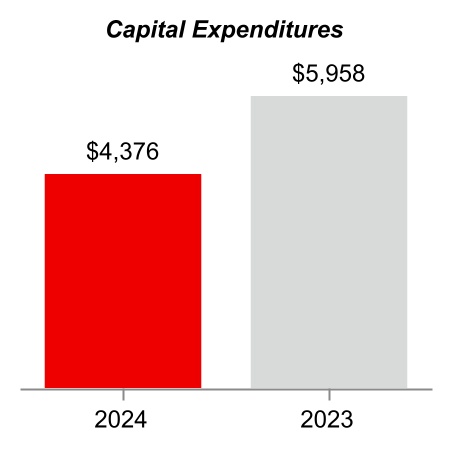
Capital Expenditures and Investments
We continue to invest in our wireless networks, high-speed fiber and other advanced technologies to position ourselves at the center of growth trends for the future. During the three months ended March 31, 2024, these investments included $4.4 billion for capital expenditures. See "Cash Flows Used in Investing Activities" for additional information. Capital expenditures for 2024 are expected to be in the range of $17.0 billion to $17.5 billion.
Global Network and Technology
Over the past several years, we have been leading the development of 5G wireless technology industry standards and the ecosystems for fixed and mobile 5G wireless services. 5G technology enables higher throughput and lower latency than 4G LTE technology and allows our networks to handle more traffic as the number of internet-connected devices grows.
We are focusing our capital investment on building our next generation 5G network, while also adding capacity and density to our 4G LTE network. We are densifying our networks by utilizing macro and small cell technology, in-building solutions and distributed antenna systems. Network densification enables us to add capacity to address increasing mobile video consumption and the growing demand for IoT products and services on our 5G and 4G LTE networks. We obtained full access to our C-Band spectrum in August 2023, and will continue deploying this spectrum across the continental U.S.
We continue to build fiber-based networks supporting data, video and advanced business services - areas where demand for reliable high-speed connections is growing. In addition, we leverage our 5G and 4G LTE networks for our FWA broadband service.
| | |
| Consolidated Results of Operations |
In this section, we discuss our overall results of operations and highlight special items, some of which are not included in our segment results. In "Segment Results of Operations" we review the performance of our two reportable segments in more detail.
Consolidated Operating Revenues
| | | | | | | | | | | | | | | | | | | | | | | |
| | Three Months Ended | | | | |
| | March 31, | | Increase/ |
| (dollars in millions) | 2024 | | 2023 | | (Decrease) |
| Consumer | $ | 25,057 | | | $ | 24,857 | | | $ | 200 | | | 0.8 | % |
| Business | 7,376 | | | 7,494 | | | (118) | | | (1.6) | |
| Corporate and other | 611 | | | 617 | | | (6) | | | (1.0) | |
| Eliminations | (63) | | | (56) | | | (7) | | | 12.5 | |
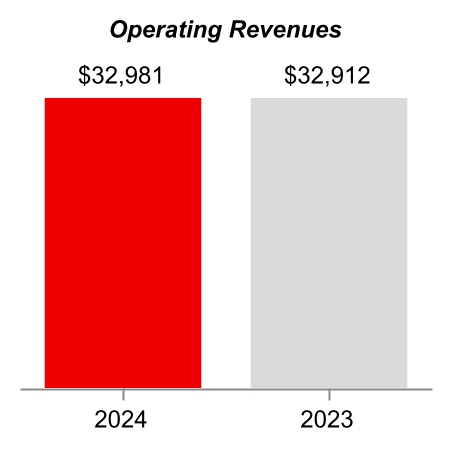
| Consolidated Operating Revenues | $ | 32,981 | | | $ | 32,912 | | | $ | 69 | | | 0.2 | |
Consolidated operating revenues increased during the three months ended March 31, 2024 compared to the similar period in 2023 primarily due to revenue increases in our Consumer segment, partially offset by revenue decreases in our Business segment.
Revenues for our segments are discussed separately below under the heading "Segment Results of Operations."
Consolidated Operating Expenses
| | | | | | | | | | | | | | | | | | | | | | | |
| | Three Months Ended | | | | |
| | March 31, | | Increase/ |
| (dollars in millions) | 2024 | | 2023 | | (Decrease) |
| Cost of services | $ | 6,967 | | | $ | 7,078 | | | $ | (111) | | | (1.6) | % |
| Cost of wireless equipment | 5,905 | | | 6,426 | | | (521) | | | (8.1) | |
| Selling, general and administrative expense | 8,143 | | | 7,506 | | | 637 | | | 8.5 | |
| Depreciation and amortization expense | 4,445 | | | 4,318 | | | 127 | | | 2.9 | |
| Consolidated Operating Expenses | $ | 25,460 | | | $ | 25,328 | | | $ | 132 | | | 0.5 | |
Operating expenses for our segments are discussed separately below under the heading "Segment Results of Operations."
Cost of Services
Cost of services includes the following costs directly attributable to a service: salaries and wages, benefits, materials and supplies, content costs, contracted services, network access and transport costs, customer provisioning costs, computer systems support and costs to support our outsourcing contracts and technical facilities. Aggregate customer service costs, which include billing and service provisioning, are allocated between Cost of services and Selling, general and administrative expense.
Cost of services decreased during the three months ended March 31, 2024 compared to the similar period in 2023 primarily as result of:
•a decrease of $130 million in access costs primarily as a result of decreases in prepaid subscribers, circuit disconnections and pricing changes;
•a decrease of $102 million in personnel costs primarily related to the impact of workforce changes;
•an increase of $49 million in direct costs driven by vendor and service provider promotions and discounts received in 2023 that did not reoccur in 2024; and
•an increase of $48 million in rent and lease expense primarily driven by new leases and lease modifications related to the continued deployment of the C-Band spectrum.
Cost of Wireless Equipment
Cost of wireless equipment decreased during the three months ended March 31, 2024 compared to the similar period in 2023 primarily as a result of:
•a decrease of $852 million driven by a lower volume of wireless devices sold primarily related to a decrease of 19% in upgrades; and
•an increase of $331 million due to a shift to higher priced equipment in the mix of wireless devices sold.
Selling, General and Administrative Expense
Selling, general and administrative expense includes salaries and wages and benefits not directly attributable to a service or product, the provision for credit losses, taxes other than income taxes, advertising and sales commission costs, call center and information technology costs, regulatory fees, professional service fees and rent and utilities for administrative space. Also included is a portion of the aggregate customer care costs as discussed above in "Cost of Services."
Selling, general and administrative expense increased during the three months ended March 31, 2024 compared to the similar period in 2023 primarily due to:
•an increase of $312 million in personnel costs primarily related to an increase in costs associated with the transition to third-party contracted resources along with the impacts of a prior year compensation plan assumption change that did not reoccur and increased sales commission expense;
•an increase of $136 million related to higher costs for device insurance programs due to an increase in claims; and
•an increase of $106 million related to a legacy legal matter.
See "Special Items" for additional information on the legacy legal matter.
Depreciation and Amortization Expense
Depreciation and amortization expense increased during the three months ended March 31, 2024 compared to the similar period in 2023 primarily due to the change in the mix of net depreciable and amortizable assets, including the amortization period of certain acquisition-related intangible assets, and the continued deployment of C-Band network assets.
Other Consolidated Results
Other Income, Net
Additional information relating to Other income, net is as follows:
| | | | | | | | | | | | | | | | | | | | | | | |
| Three Months Ended | | | | |
| | March 31, | | Increase/ |
| (dollars in millions) | 2024 | | 2023 | | (Decrease) |
| Interest income | $ | 78 | | | $ | 75 | | | $ | 3 | | | 4.0 | % |
| Other components of net periodic benefit income | — | | | 13 | | | (13) | | | nm |
| Net debt extinguishment gains | 110 | | | 70 | | | 40 | | | 57.1 | |
| Other, net | 10 | | | (44) | | | 54 | | | nm |
Other Income, Net | $ | 198 | | | $ | 114 | | | $ | 84 | | | 73.7 | |
nm - not meaningful
Other income, net, reflects certain items not directly related to our core operations, including interest income, debt extinguishment costs, components of net periodic pension and postretirement benefit cost and income and certain foreign exchange gains and losses.
Other income, net increased during the three months ended March 31, 2024 compared to the similar period in 2023 primarily due to:
•an increase of $54 million primarily related to the remeasurement of our foreign currency denominated assets and liabilities resulting in a foreign currency adjustment gain in 2024 compared with a loss in 2023; and
•net debt extinguishment gains of $110 million related to tender offers and open market repurchases of various Company notes in 2024, compared with gains of $70 million related to open market repurchases of various Company notes in 2023.
Interest Expense
| | | | | | | | | | | | | | | | | | | | | | | |
| Three Months Ended | | | | |
| | March 31, | | Increase/ |
| (dollars in millions) | 2024 | | 2023 | | (Decrease) |
| Total interest costs on debt balances | $ | 1,909 | | | $ | 1,748 | | | $ | 161 | | | 9.2 | % |
| Less capitalized interest costs | 274 | | | 541 | | | (267) | | | (49.4) | |
Interest Expense | $ | 1,635 | | | $ | 1,207 | | | $ | 428 | | | 35.5 | |
| | | | | | | |
Average debt outstanding(1)(3) | $ | 152,754 | | | $ | 151,493 | | | | | |
Effective interest rate(2)(3) | 5.0 | % | | 4.6 | % | | | | |
(1)The average debt outstanding is a financial measure and is calculated by applying a simple average of prior months end balances of total short-term and long-term debt, net of discounts, premiums and unamortized debt issuance costs.
(2)The effective interest rate is the rate of actual interest incurred on debt. It is calculated by dividing the total interest costs on debt balances by the average debt outstanding.
(3)We believe that this measure is useful to management, investors and other users of our financial information in evaluating our debt financing cost and trends in our debt leverage management.
Total interest expense increased during the three months ended March 31, 2024 compared to the similar period in 2023 primarily as a result of a decrease in capitalized interest costs due to additional C-Band spectrum licenses being placed into service, an increase in interest costs due to a higher average interest rate and higher average debt balances.
Provision for Income Taxes
| | | | | | | | | | | | | | | | | | | | | | | |
| Three Months Ended | | |
| | March 31, | | |
| (dollars in millions) | 2024 | | 2023 | | Decrease |
| Provision for income taxes | $ | 1,353 | | | $ | 1,482 | | | $ | (129) | | | (8.7) | % |
| Effective income tax rate | 22.3 | % | | 22.8 | % | | | | |
The effective income tax rate is calculated by dividing the provision for income taxes by income before the provision for income taxes. During the three months ended March 31, 2024, both the provision for income taxes and the effective income tax rate decreased compared to the similar period in 2023 due to lower income before taxes in the current period.
Unrecognized Tax Benefits
Unrecognized tax benefits were $2.7 billion at both March 31, 2024 and December 31, 2023. Interest and penalties related to unrecognized tax benefits were $650 million (after-tax) and $630 million (after-tax) at March 31, 2024 and December 31, 2023, respectively.
Verizon and/or its subsidiaries file income tax returns in the U.S. federal jurisdiction, and various state, local and foreign jurisdictions. As a large taxpayer, we are under audit by the Internal Revenue Service and multiple state and foreign jurisdictions for various open tax years. It is reasonably possible that the amount of the liability for unrecognized tax benefits could change by a significant amount in the next twelve months. An estimate of the range of the possible change cannot be made until these tax matters are further developed or resolved.
Consolidated Net Income, Consolidated EBITDA and Consolidated Adjusted EBITDA
Consolidated earnings before interest, taxes, depreciation and amortization expense (Consolidated EBITDA) and Consolidated Adjusted EBITDA, which are presented below, are non-GAAP financial measures that we believe are useful to management, investors and other users of our financial information in evaluating operating profitability on a more variable cost basis as they exclude the depreciation and amortization expense related primarily to capital expenditures and acquisitions that occurred in prior years, as well as in evaluating operating performance in relation to Verizon’s competitors. Consolidated EBITDA is calculated by adding back interest, taxes, depreciation and amortization expense to net income.
Consolidated Adjusted EBITDA is calculated by excluding from Consolidated EBITDA the effect of the following non-operational items: equity in earnings and losses of unconsolidated businesses and other income and expense, net, as well as the effect of certain special items. We believe that this measure is useful to management, investors and other users of our financial information in evaluating the effectiveness of our operations and underlying business trends. We believe that Consolidated Adjusted EBITDA is widely used by investors to compare a company’s operating performance to its competitors by minimizing impacts caused by differences in capital structure, taxes, and depreciation and amortization policies. Further, the exclusion of non-operational items and special items enables comparability to prior period performance and trend analysis. See "Special Items" for additional information.
It is management’s intent to provide non-GAAP financial information to enhance the understanding of Verizon’s GAAP financial information, and it should be considered by the reader in addition to, but not instead of, the financial statements prepared in accordance with GAAP. Each non-GAAP financial measure is presented along with the corresponding GAAP measure so as not to imply that more emphasis should be placed on the non-GAAP measure. We believe that providing these non-GAAP measures in addition to the GAAP measures allows management, investors and other users of our financial information to more fully and accurately assess both consolidated and segment performance. The non-GAAP financial information presented may be determined or calculated differently by other companies and may not be directly comparable to that of other companies.
| | | | | | | | | | | |
|
|
| (dollars in millions) | 2024 | | 2023 |
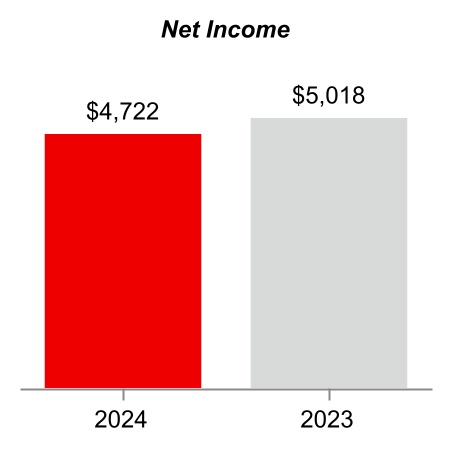
| Consolidated Net Income | $ | 4,722 | | | $ | 5,018 | |
| Add: | | | |
| Provision for income taxes | 1,353 | | | 1,482 | |
Interest expense | 1,635 | | | 1,207 | |
Depreciation and amortization expense(1) | 4,445 | | | 4,318 | |
| Consolidated EBITDA | $ | 12,155 | | | $ | 12,025 | |
| | | |
| Add (Less): | | | |
| Other income, net | $ | (198) | | | $ | (114) | |
| Equity in (earnings) losses of unconsolidated businesses | 9 | | | (9) | |
|
|
|
|
|
|
|
|
|
|
Legacy legal matter | 106 | | | — | |
| Consolidated Adjusted EBITDA | $ | 12,072 | | | $ | 11,902 | |
|
|
|
|
| 3,160 | | (277) | | | (8.8) |
| | | | | | | |
| | | | | | | |
| 8,202 | | 1,095 | | | 13.4 |
| | | | | | | |
| | | | | | | |
| | | | | | | |
| | | | | | | |
|
|
|
| | | | | | | |
| | | | | | | |
|
|
| % | | 0.84 | % | | | | |
|
| 135.75 | | $ | 130.06 | | $ | 5.69 | | | 4.4 |
| | | | | | | |
| 2.79 | | 0.07 | | | 2.5 |
| | | | | | | |
| | | | | | | | (1)As of end of period
Where applicable, the operating results reflect certain adjustments, including those related to the 3G network shutdowns, migration activity among different types of devices and plans, customer profile changes, and adjustments in connection with mergers, acquisitions and divestitures.
nm - not meaningful
Consumer’s total operating revenues increased during the three months ended March 31, 2024 compared to the similar period in 2023 as a result of increases in Service and Other revenues, partially offset by a decrease in Wireless equipment revenue.
Service Revenue
Service revenue increased during the three months ended March 31, 2024 compared to the similar period in 2023 primarily driven by an increase in Wireless service revenue.
Wireless service revenue increased during the three months ended March 31, 2024 compared to the similar period in 2023 primarily as a result of:
•an increase of $409 million in access revenues related to our postpaid plans primarily due to pricing actions; an increase in our FWA subscriber base; and an increase in subscriptions through MyPlan offerings. These increases were partially offset by the amortization of wireless equipment sales promotions;
•an increase of $149 million related to growth in non-retail service revenue;
•an increase of $64 million in TravelPass revenue through increased customer international travel; and
•a decrease of $106 million in prepaid revenue primarily due to a decrease in the prepaid subscriber base.
Wireless Equipment Revenue
Wireless equipment revenue decreased during the three months ended March 31, 2024 compared to the similar period in 2023 primarily as a result of:
•a decrease of $722 million driven by a lower volume of wireless devices sold primarily related to a decrease of 21% in upgrades; and
•an increase of $365 million related to a shift to higher priced equipment in the mix of wireless devices sold.
Other Revenue
Other revenue includes fees that partially recover the direct and indirect costs of complying with regulatory and industry obligations and programs, revenues associated with certain products included in our device protection offerings, leasing and interest recognized when equipment is sold to the customer by an authorized agent under a device payment plan agreement.
Other revenue remained relatively flat for the three months ended March 31, 2024 compared to the similar period in 2023.
Operating Expenses
| | | | | | | | | | | | | | | | | | | | | | | |
| Three Months Ended | | |
| | March 31, | | Increase/ |
| (dollars in millions) | 2024 | | 2023 | | (Decrease) |
| Cost of services | $ | 4,537 | | | $ | 4,432 | | | $ | 105 | | | 2.4 | % |
| Cost of wireless equipment | 4,750 | | | 5,191 | | | (441) | | | (8.5) | |
| Selling, general and administrative expense | 5,089 | | | 4,921 | | | 168 | | | 3.4 | |
| Depreciation and amortization expense | 3,309 | | | 3,214 | | | 95 | | | 3.0 | |
| Total Operating Expenses | $ | 17,685 | | | $ | 17,758 | | | $ | (73) | | | (0.4) | |
Cost of Services
Cost of services increased during the three months ended March 31, 2024 compared to the similar period in 2023 primarily as a result of:
•an increase of $59 million in rent and lease expense primarily driven by new leases and lease modifications related to the continued deployment of the C-Band spectrum;
•an increase of $42 million in personnel costs mainly driven by certain other post-employment benefit credits in 2023 that did not reoccur in 2024;
•an increase of $40 million in direct costs driven by vendor and service provider promotions and discounts received in 2023 that did not reoccur in 2024;
•an increase of $29 million in digital content costs primarily associated with an increase in subscriptions through MyPlan offerings, partially offset by a decrease in traditional linear content costs due to a decline in Fios video subscribers; and
•a decrease of $84 million in access costs primarily as a result of decreases in prepaid subscribers, circuit disconnections and pricing changes.
Cost of Wireless Equipment
Cost of wireless equipment decreased during the three months ended March 31, 2024 compared to the similar period in 2023 primarily as a result of:
•a decrease of $719 million driven by a lower volume of wireless devices sold primarily related to a decrease of 21% in upgrades; and
•an increase of $278 million related to a shift to higher priced equipment in the mix of wireless devices sold.
Selling, General and Administrative Expense
Selling, general and administrative expense increased during the three months ended March 31, 2024 compared to the similar period in 2023 primarily due to:
•an increase of $80 million in personnel costs mainly driven by the impacts of a prior year compensation plan assumption change that did not reoccur and increased sales commission expense; and
•an increase of $50 million in regulatory fees mainly driven by an increase in rates.
Depreciation and Amortization Expense
Depreciation and amortization expense increased during the three months ended March 31, 2024 compared to the similar period in 2023 driven by the change in the mix of total Verizon depreciable and amortizable assets and Consumer's usage of those assets.
Segment Operating Income and EBITDA
| | | | | | | | | | | | | | | | | | | | | | | |
| Three Months Ended | | |
| | March 31, | | |
| (dollars in millions) | 2024 | | 2023 | | Increase |
| Segment Operating Income | $ | 7,372 | | | $ | 7,099 | | | $ | 273 | | | 3.8 | % |
Add Depreciation and amortization expense | 3,309 | | | 3,214 | | | 95 | | | 3.0 | |
| Segment EBITDA | $ | 10,681 | | | $ | 10,313 | | | $ | 368 | | | 3.6 | |
| | | | | | | |
| Segment operating income margin | 29.4 | % | | 28.6 | % | | | | |
| Segment EBITDA margin | 42.6 | % | | 41.5 | % | | | | |
| 3,587 | | $ | 3,787 | | $ | (200) | | | (5.3) | % |
| | | | | | | |
|
|
|
|
| 65 | | (6) | | | (9.2) | |
| | | | | | | |
| | | | | | | |
| 1,192 | | 624 | | | 52.3 | |
| | | | | | | |
| | | | | | | |
| | | | | | | |
| | | | | | | |
|
| 136 | | (46) | | | (33.8) | |
| | | | | | | |
| | | | | | | |
|
|
| 1.16 | % | | | | |
| | | | | | | |
| | | | | | | |
| | | | | | | |
| | | | | | | |
| | | | | | | |
| | | | | | | |
| | | | | | | | (1) Service and other revenues included in our Business segment were approximately $6.5 billion and $6.6 billion for the three months ended March 31, 2024 and 2023, respectively. Wireless equipment revenues included in our Business segment were $871 million and $882 million for the three months ended March 31, 2024 and 2023, respectively.
(2) As of end of period
Where applicable, the operating results reflect certain adjustments, including those related to the 3G network shutdowns, migration activity among different types of devices and plans, customer profile changes, and adjustments in connection with mergers, acquisitions and divestitures.
Business’s total operating revenues decreased during the three months ended March 31, 2024 compared to the similar period in 2023 as a result of decreases in Enterprise and Public Sector and Wholesale revenues, partially offset by an increase in Business Markets and Other revenue.
Enterprise and Public Sector
Enterprise and Public Sector offers wireless products and services as well as wireline connectivity and managed solutions to our large business and government customers. Large businesses are identified based on their size and volume of business with Verizon. Public sector offers these services with features and pricing designed to address the needs of U.S. federal, state and local governments and educational institutions.
Enterprise and Public Sector revenues decreased during the three months ended March 31, 2024 compared to the similar period in 2023 primarily due to:
•a decrease of $150 million in wireline revenue primarily driven by decreases in networking, traditional data and voice communication services due to secular market pressure, coupled with lower customer premise equipment sales volumes; and
•a decrease of $20 million in Wireless equipment revenue driven by a decrease in the number of wireless devices sold primarily due to fewer upgrades, partially offset by a shift to higher priced equipment in the mix of devices sold.
Business Markets and Other
Business Markets and Other offers wireless services and equipment, conferencing services, tailored voice and networking products, Fios services, advanced voice solutions and security services to our business customers that ordinarily do not meet the requirements to be categorized as Enterprise and Public Sector, as described above. Business Markets and Other also includes solutions that support mobile resource management.
Business Markets and Other revenue increased during the three months ended March 31, 2024 compared to the similar period in 2023 primarily due to an increase of $114 million in Wireless service revenue driven mainly by an increase in our FWA subscriber base and our pricing actions.
Fios revenues remained flat for the three months ended March 31, 2024 compared to the similar period in 2023.
Wholesale
Wholesale offers wireline communications services including data, voice, local dial tone and broadband services primarily to local, long distance, and wireless carriers that use our facilities to provide services to their customers.
Wholesale revenue remained relatively flat for the three months ended March 31, 2024 compared to the similar period in 2023.
Operating Expenses
| | | | | | | | | | | | | | | | | | | | | | | |
| Three Months Ended | | |
| | March 31, | | Increase/ |
| (dollars in millions) | 2024 | | 2023 | | (Decrease) |
| Cost of services | $ | 2,432 | | | $ | 2,582 | | | $ | (150) | | | (5.8) | % |
| Cost of wireless equipment | 1,155 | | | 1,234 | | | (79) | | | (6.4) | |
| Selling, general and administrative expense | 2,262 | | | 2,033 | | | 229 | | | 11.3 | |
| Depreciation and amortization expense | 1,128 | | | 1,094 | | | 34 | | | 3.1 | |
| Total Operating Expenses | $ | 6,977 | | | $ | 6,943 | | | $ | 34 | | | 0.5 | |
Cost of Services
Cost of services decreased during the three months ended March 31, 2024 compared to the similar period in 2023 primarily due to:
•a decrease of $77 million in personnel costs related to the impact of workforce changes, partially offset by certain other post-employment benefit credits in 2023 that did not reoccur in 2024;
•a decrease of $46 million in access costs related to changes in usage, partially offset by changes in circuit access prices; and
•a decrease of $29 million in customer premise equipment costs due to lower volumes sold.
Cost of Wireless Equipment
Cost of wireless equipment decreased during the three months ended March 31, 2024 compared to the similar period in 2023 primarily as a result of:
•a decrease of $132 million driven by a lower volume of wireless devices sold; and
•an increase of $53 million related to a shift to higher priced equipment in the mix of wireless devices sold.
Selling, General and Administrative Expense
Selling, general and administrative expense increased during the three months ended March 31, 2024 compared to the similar period in 2023 primarily due to an increase of $209 million in personnel costs primarily related to an increase in costs associated with the transition to third-party contracted resources along with the impacts of a prior year compensation plan assumption change that did not reoccur and increased sales commission expense.
Depreciation and Amortization Expense
Depreciation and amortization expense increased during the three months ended March 31, 2024 compared to the similar period in 2023 driven by the change in the mix of total Verizon depreciable and amortizable assets and Business's usage of those assets.
Segment Operating Income and EBITDA
| | | | | | | | | | | | | | | | | | | | | | | |
| | Three Months Ended | | |
| March 31, | | Increase/ |
| (dollars in millions) | 2024 | | 2023 | | (Decrease) |
| Segment Operating Income | $ | 399 | | | $ | 551 | | | $ | (152) | | | (27.6) | % |
| Add Depreciation and amortization expense | 1,128 | | | 1,094 | | | 34 | | | 3.1 | |
| Segment EBITDA | $ | 1,527 | | | $ | 1,645 | | | $ | (118) | | | (7.2) | |
| | | | | | | |
| Segment operating income margin | 5.4 | % | | 7.4 | % | | | | |
| Segment EBITDA margin | 20.7 | % | | 22.0 | % | | | | |
The changes in the table above during the three months ended March 31, 2024 compared to the similar period in 2023 were primarily a result of the factors described in connection with Business operating revenues and operating expenses.
Special items included in Income Before Provision For Income Taxes were as follows:
| | | | | | | | | | | |
|
|
| (dollars in millions) | 2024 | | 2023 |
|
|
|
|
|
|
|
|
|
|
|
|
|
|
|
Amortization of acquisition-related intangible assets(1) | | | |
| Depreciation and amortization expense | $ | 221 | | | $ | 208 | |
|
|
|
|
|
|
|
|
|
|
|
|
|
|
|
|
|
|
|
|
|
|
Legacy legal matter | | | |
Selling, general and administrative expense | 106 | | | — | |
| Total | $ | 327 | | | $ | 208 | |
(1) Amounts are included in segment results of operations.
Consolidated Adjusted EBITDA, a non-GAAP measure discussed in the section titled "Consolidated Net Income, Consolidated EBITDA and Consolidated Adjusted EBITDA" as part of Consolidated Results of Operations, excludes all of the amounts included above.
The income and expenses related to special items included in our condensed consolidated results of operations were as follows:
| | | | | | | | | | | |
|
|
| (dollars in millions) | 2024 | | 2023 |
| Within Total Operating Expenses | $ | 327 | | | $ | 208 | |
|
|
|
| Total | $ | 327 | | | $ | 208 | |
|
| |
|
| |
|
| |
|
| |
|
|
|
|
|
|
|
|
|
Pursuant to Regulation S-K, Item 601(b)(4)(iii)(A), certain instruments which define the rights of holders of long-term debt of Verizon Communications Inc. and its consolidated subsidiaries are not filed herewith, and the Company hereby agrees to furnish a copy of any such instrument to the SEC upon request.
Pursuant to the requirements of the Securities Exchange Act of 1934, the registrant has duly caused this report to be signed on its behalf by the undersigned thereunto duly authorized.
| | | | | | | | | | | | | | |
| | VERIZON COMMUNICATIONS INC. |
| | |
| Date: April 25, 2024 | | By | /s/ | Mary-Lee Stillwell |
| | | | Mary-Lee Stillwell |
| | | | Senior Vice President and Controller |
| | | | (Principal Accounting Officer) |

Similar companies
See also AT&T INC. -
Annual report 2024 (10-K 2024-12-31)
Annual report 2023 (10-Q 2023-09-30)
See also AMERICA MOVIL SAB DE CV/
See also BCE INC
See also PERUSAHAAN PERSEROAN PERSERO PT TELEKOMUNIKASI INDONESIA TBK
See also ORANGE