EVANS BANCORP INC - Annual Report: 2017 (Form 10-K)
UNITED STATES
SECURITIES AND EXCHANGE COMMISSION
Washington, D.C. 20549
FORM 10-K
[X]ANNUAL REPORT PURSUANT TO SECTION 13 OR 15(d) OF THE SECURITIES EXCHANGE ACT OF 1934
For the fiscal year ended: December 31, 2017
[ ]TRANSITION REPORT PURSUANT TO SECTION 13 OR 15(d) OF THE SECURITIES EXCHANGE ACT OF 1934
For the transition period from __________ to __________
Commission file number: 001-35021
EVANS BANCORP, INC.
(Exact name of registrant as specified in its charter)
|
New York |
|
16-1332767 |
|
(State or other jurisdiction of incorporation or organization) |
|
(I.R.S. Employer Identification No.) |
|
One Grimsby Drive, Hamburg, New York |
|
14075 |
|
(Address of principal executive offices) |
|
(Zip Code) |
|
(716) 926-2000 |
|
Registrant’s telephone number (including area code) |
Securities registered pursuant to Section 12(b) of the Act:
|
Title of Each Class |
|
Name of Each Exchange on Which Registered |
|
Common Stock, Par Value $.50 per share |
|
NYSE American LLC |
Securities registered pursuant to Section 12(g) of the Act:
|
None |
|
(Title of Class) |
Indicate by check mark if the registrant is a well-known seasoned issuer, as defined in Rule 405 of the Securities Act.
|
Yes |
|
|
No |
X |
Indicate by check mark if the registrant is not required to file reports pursuant to Section 13 or Section 15(d) of the Act.
|
Yes |
|
|
No |
X |
Indicate by check mark whether the registrant: (1) has filed all reports required to be filed by Section 13 or 15(d) of the Securities Exchange Act of 1934 during the preceding 12 months (or for such shorter period that the registrant was required to file such reports), and (2) has been subject to such filing requirements for the past 90 days.
|
Yes |
X |
|
No |
|
Indicate by checkmark whether the registrant has submitted electronically and posted on its corporate Web site, if any, every Interactive Data File required to be submitted and posted pursuant to Rule 405 of Regulation S-T during the preceding 12 months (or for such shorter period that the registrant was required to submit and post such files).
|
Yes |
X |
|
No |
|
|
Indicate by check mark if disclosure of delinquent filers pursuant to Item 405 of Regulation S-K is not contained herein, and will not be contained, to the best of registrant’s knowledge, in definitive proxy or information statements incorporated by reference in Part III of this Form 10-K or any amendment to this Form 10-K. [X ]
Indicate by check mark whether the registrant is a large accelerated filer, an accelerated filer, a non-accelerated filer, a smaller reporting company, or an emerging growth company. See the definitions of “large accelerated filer,” "accelerated filer," “smaller reporting company,” and “emerging growth company” in Rule 12b-2 of the Exchange Act. (Check one):
|
Large accelerated filer |
|
|
Accelerated filer |
X |
|
|
Non-accelerated filer |
|
|
Smaller reporting company |
|
|
|
(do not check if a smaller reporting company) |
Emerging growth company |
|
|
||
Indicate by check mark whether the registrant is a shell company (as defined in Rule 12b-2 of the Act).
|
Yes |
|
|
No |
X |
If an emerging growth company, indicate by check mark if the registrant has elected not to use the extended transition period for complying with any new or revised financial accounting standards provided pursuant to Section 13(a) of the Exchange Act□
On June 30, 2017, the aggregate market value of the registrant’s common stock held by non-affiliates was approximately $183 million, based upon the closing sale price of a share of the registrant’s common stock on NYSE American, LLC.
As of February 26, 2018, 4,787,550 shares of the registrant’s common stock were outstanding.
Page 1 of 119
Exhibit Index on Page 116
1
DOCUMENTS INCORPORATED BY REFERENCE
Portions of the registrant's Proxy Statement relating to the registrant's 2018 Annual Meeting of Shareholders, to be held on April 26, 2018, which will be subsequently filed with the Securities and Exchange Commission within 120 days after the end of the fiscal year to which this Report relates, are incorporated by reference into Part III of this Annual Report on Form 10-K where indicated.
2
INDEX
|
|
||
|
|
||
|
Item 1. |
5 | |
|
Item 1A. |
14 | |
|
Item 1B. |
19 | |
|
Item 2. |
20 | |
|
Item 3. |
20 | |
|
Item 4. |
20 | |
|
|
||
|
|
||
|
|
||
|
Item 5. |
||
|
|
21 | |
|
Item 6. |
24 | |
|
Item 7. |
||
|
|
25 | |
|
Item 7A. |
53 | |
|
Item 8. |
54 | |
|
Item 9. |
||
|
|
113 | |
|
Item 9A. |
113 | |
|
Item 9B. |
113 | |
|
|
||
|
|
||
|
|
||
|
Item 10. |
114 | |
|
Item 11. |
114 | |
|
Item 12. |
SECURITY OWNERSHIP OF CERTAIN BENEFICIAL OWNERS AND MANAGEMENT |
|
|
|
114 | |
|
Item 13. |
||
|
|
114 | |
|
Item 14. |
114 | |
|
|
||
|
|
||
|
|
||
|
Item 15. |
115 | |
|
Item 16. |
115 | |
|
|
118 | |
|
|
3
FORWARD LOOKING STATEMENTS
This Annual Report on Form 10-K may contain certain forward-looking statements within the meaning of Section 27A of the Securities Act of 1933, as amended (the “Securities Act”), and Section 21E of the Securities Exchange Act of 1934, as amended (the “Exchange Act”), that involve substantial risks and uncertainties. When used in this report, or in the documents incorporated by reference herein, the words “will,” “anticipate,” “believe,” “estimate,” “expect,” “intend,” “may,” “plan,” “seek,” “look to,” “goal,” “target” and similar expressions identify such forward-looking statements. These forward-looking statements include statements regarding the business plans, prospects, growth and operating strategies of Evans Bancorp, Inc. (the “Company"), statements regarding the asset quality of the Company’s loan and investment portfolios, and estimates of the Company’s risks and future costs and benefits.
These forward-looking statements are based largely on the expectations of the Company’s management and are subject to a number of risks and uncertainties, including but not limited to: general economic conditions, either nationally or in the Company’s market areas, that are worse than expected; increased competition among depository or other financial institutions; inflation and changes in the interest rate environment that reduce the Company’s margins or reduce the fair value of financial instruments; changes in laws or government regulations affecting financial institutions, including changes in regulatory fees and capital requirements; the Company’s ability to enter new markets successfully and capitalize on growth opportunities; the Company’s ability to successfully integrate acquired entities; loan losses in excess of the Company’s allowance for loan losses; complications related to the Bank’s core systems conversion; changes in accounting pronouncements and practices, as adopted by financial institution regulatory agencies, the Financial Accounting Standards Board (“FASB”) and the Public Company Accounting Oversight Board; the impact of such changes in accounting pronouncements and practices being greater than anticipated; the ability to realize the benefit of deferred tax assets; changes in the financial performance and/or condition of the Company’s borrowers; changes in consumer spending, borrowing and saving habits; changes in the Company’s organization, compensation and benefit plans; and other factors discussed elsewhere in this Annual Report on Form 10-K including the risk factors described in Item 1A, as well as in the Company’s periodic reports filed with the Securities and Exchange Commission. Many of these factors are beyond the Company’s control and are difficult to predict.
Because of these and other uncertainties, the Company’s actual results, performance or achievements could differ materially from those contemplated, expressed or implied by the forward-looking statements contained herein. Forward-looking statements speak only as of the date they are made. The Company undertakes no obligation to publicly update or revise forward-looking information, whether as a result of new, updated information, future events or otherwise, except to the extent required by law.
4
EVANS BANCORP, INC.
Evans Bancorp, Inc. (the “Company”) is a New York business corporation which is registered as a financial holding company under the Bank Holding Company Act of 1956, as amended (the “BHCA”). The principal office of the Company is located at One Grimsby Drive, Hamburg, NY 14075 and its telephone number is (716) 926-2000. This facility is occupied by the Office of the President and Chief Executive Officer of the Company, as well as the Administrative and Loan Divisions of Evans Bank. The Company was incorporated on October 28, 1988, but the continuity of its banking business is traced to the organization of the Evans National Bank of Angola on January 20, 1920. Except as the context otherwise requires, the Company and its direct and indirect subsidiaries are collectively referred to in this report as the “Company.” The Company’s common stock is traded on the NYSE American, LLC under the symbol “EVBN.”
At December 31, 2017, the Company had consolidated total assets of $1.3 billion, deposits of $1.1 billion and stockholders’ equity of $118 million.
The Company’s primary business is the operation of its subsidiaries. It does not engage in any other substantial business activities. The Company has two direct wholly-owned subsidiaries: (1) Evans Bank, N.A. (the “Bank”), which provides a full range of banking services to consumer and commercial customers in Western New York; and (2) Evans National Financial Services, LLC (“ENFS”), which owns 100% of the membership interests in The Evans Agency, LLC (“TEA”), which sells various premium-based insurance policies on a commission basis. At December 31, 2017, the Bank represented 99% and ENFS represented 1% of the consolidated assets of the Company. Further discussion of our segments is included in Note 18 to the Company’s Consolidated Financial Statements included under Item 8 of this Annual Report on Form 10-K.
Evans Bank
The Bank is a nationally chartered bank that has its headquarters at One Grimsby Drive, Hamburg, NY, and a total of 14 full-service banking offices in Erie County, Niagara County, and Chautauqua County, NY.
At December 31, 2017, the Bank had total assets of $1.3 billion, investment securities of $149 million, net loans of $1.1 billion, deposits of $1.1 billion and stockholders’ equity of $108 million, compared with total assets of $1.1 billion, investment securities of $97 million, net loans of $929 million, deposits of $940 million and stockholders’ equity of $90 million at December 31, 2016. The Bank offers deposit products, which include checking and negotiable order of withdrawal (“NOW”) accounts, savings accounts, and certificates of deposit, as its principal source of funding. The Bank’s deposits are insured up to the maximum permitted by the Deposit Insurance Fund of the Federal Deposit Insurance Corporation (“FDIC”). The Bank offers a variety of loan products to its customers, including commercial and consumer loans and commercial and residential mortgage loans.
As is the case with banking institutions generally, the Bank’s operations are significantly influenced by general economic conditions and by related monetary and fiscal policies of banking regulatory agencies, including the Federal Reserve Board (“FRB”) and FDIC. The Bank is also subject to the supervision, regulation and examination of the Office of the Comptroller of the Currency of the United States of America (the “OCC”).
The Evans Agency, LLC
TEA, a property and casualty insurance agency, is a wholly-owned subsidiary of ENFS. TEA is headquartered in Hamburg, NY, with offices located throughout Western New York. TEA is a full-service insurance agency offering personal, commercial and financial services products. For the year ended December 31, 2017, TEA had total revenue of $8 million.
TEA’s primary market area is Erie, Chautauqua, Cattaraugus and Niagara counties. Most lines of personal insurance are provided, including automobile, homeowners, boat, recreational vehicle, landlord, and umbrella coverage. Commercial insurance products are also provided, consisting of property, liability, automobile, inland marine, workers compensation, bonds, crop and umbrella insurance. TEA also provides the following financial services products: employee benefits, life and disability insurance, Medicare supplements, long term care, annuities, mutual funds, retirement programs and New York State Disability.
5
Other Subsidiaries
In addition to the Bank and TEA, the Company has the following direct and indirect wholly-owned subsidiaries:
Evans National Holding Corp. (“ENHC”). ENHC, a wholly-owned subsidiary of the Bank, operates as a real estate investment trust that holds commercial real estate loans and residential mortgages, providing additional flexibility and planning opportunities for the business of the Bank.
Evans National Financial Services, LLC (“ENFS”). ENFS is a wholly-owned subsidiary of the Company. ENFS's primary business is to own the business and assets of the Company’s non-banking financial services subsidiaries.
Frontier Claims Services, Inc. (“FCS”). FCS is a wholly-owned subsidiary of TEA and provides claims adjusting services to various insurance companies.
The Company also has two special purpose entities: Evans Capital Trust I, a statutory trust formed in September 2004 under the Delaware Statutory Trust Act, solely for the purpose of issuing and selling certain securities representing undivided beneficial interests in the assets of the trust, investing the proceeds thereof in certain debentures of the Company and engaging in those activities necessary, advisable or incidental thereto; and ENB Employers Insurance Trust, a Delaware trust company formed in February 2003 for the sole purpose of holding life insurance policies under the Bank’s bank-owned life insurance (“BOLI”) program.
The Company operates in two operating segments – banking activities and insurance agency activities. See Note 18 to the Company’s Consolidated Financial Statements included under Item 8 of this Annual Report on Form 10-K for more information on the Company’s operating segments.
MARKET AREA
The Company’s primary market area is Erie County, Niagara County, northern Chautauqua County and northwestern Cattaraugus County, NY. This primary market area is the area where the Bank principally receives deposits and makes loans and TEA sells insurance.
MARKET RISK
For information about, and a discussion of, the Company's "Market Risk," see Part II, Item 7 "Management's Discussion and Analysis of Financial Condition and Results of Operations - Market Risk" of this Annual Report on Form 10-K.
COMPETITION
All phases of the Company’s business are highly competitive. The Company competes actively with local, regional and national financial institutions, as well as with bank branches and insurance agency offices in the Company’s primary market area of Erie County, Niagara County, northern Chautauqua County, and northwestern Cattaraugus County, NY. These Western New York counties have a high density of financial institutions, many of which are significantly larger and have greater financial resources than the Company. The Company faces competition for loans and deposits from other commercial banks, savings banks, internet banks, savings and loan associations, mortgage banking companies, credit unions, and other financial services companies. The Company faces additional competition from non-depository competitors such as the mutual fund industry, securities and brokerage firms, and insurance companies and brokerages. In the personal insurance area, the majority of TEA’s competition comes from direct writers, as well as some small local agencies located in the same towns and villages in which TEA has offices. In the commercial business segment, the majority of the competition comes from larger agencies located in and around Buffalo, NY. By offering the large number of carriers which it has available to its customers, TEA has attempted to remain competitive in all aspects of its business.
As an approximate indication of the Company’s competitive position, the Bank had the sixth most deposits in the Buffalo, NY metropolitan statistical area according to the FDIC’s annual deposit market share report as of June 30, 2017 with 2% of the total market’s deposits of $41 billion. By comparison, the market leaders, M&T Bank and Key Bank, had 80% of the county’s deposits combined. The Company attempts to be generally competitive with all financial institutions in its service area with respect to interest rates paid on time and savings deposits, service charges on deposit accounts, and interest rates charged on loans.
6
SUPERVISION AND REGULATION
Bank holding companies and banks are extensively regulated under both federal and state laws and regulations that are intended to protect depositors and customers. Additionally, because the Company is a public company with shares traded on the NYSE American, LLC, it is subject to regulation by the Securities and Exchange Commission, as well as the listing standards required by NYSE American. To the extent that the following summary describes statutory and regulatory provisions, it is qualified in its entirety by reference to the particular statutory and regulatory provisions. Any change in the applicable law or regulation, or a change in the way such laws or regulations are interpreted by regulatory agencies or courts, may have a material adverse effect on the Company's business, financial condition and results of operations.
Bank Holding Company Regulation (BHCA)
As a financial holding company registered under the BHCA, the Company and its non-banking subsidiaries are subject to regulation and supervision under the BHCA by the FRB. The FRB requires periodic reports from the Company, and is authorized by the BHCA to make regular examinations of the Company and its subsidiaries.
The Company is required to obtain the prior approval of the FRB before merging with or acquiring all or substantially all of the assets of, or direct or indirect ownership or control of more than 5% of the voting shares of, a bank or bank holding company. The FRB will not approve any acquisition, merger or consolidation that would have a substantial anti-competitive result, unless the anti-competitive effects of the proposed transaction are outweighed by a greater public interest in meeting the needs and convenience of the public.
Subject to various exceptions, the BHCA and the Change in Bank Control Act of 1978, together with related regulations, require FRB approval before any person or company acquires “control” of a bank holding company. Control is conclusively presumed to exist if an individual or company acquires 25% or more of any class of voting securities of the bank holding company. Rebuttable control is presumed to exist if a person or company acquires 10% or more, but less than 25%, of any class of the bank holding company’s voting securities.
The FRB also considers managerial, capital and other financial factors in acting on acquisition or merger applications. A bank holding company may not engage in, or acquire direct or indirect control of more than 5% of the voting shares of any company engaged in any non-banking activity, unless such activity has been determined by the FRB to be closely related to banking or managing banks. The FRB has identified by regulation various non-banking activities in which a bank holding company may engage with notice to, or prior approval by, the FRB.
The FRB has enforcement powers over financial holding companies and their subsidiaries, among other things, to enjoin activities that represent unsafe or unsound practices or constitute violations of law, rule, regulation, administrative orders, or written agreements with a federal bank regulator. These powers may be exercised through the issuance of cease and desist orders, civil monetary penalties or other actions.
Under Regulation Y, a bank holding company must serve as a source of financial and managerial strength for its subsidiary banks and must not conduct its operations in an unsafe or unsound manner. Additionally, Regulation Y requires a bank holding company to give the FRB prior notice of any redemption or repurchase of its own equity securities, if the consideration to be paid, together with the consideration paid for any repurchases in the preceding year, is equal to 10% or more of the company’s consolidated net worth. The FRB may oppose the transaction if it believes that the transaction would constitute an unsafe or unsound practice or would violate any law or regulation. There is an exception for bank holding companies that are well-managed, well capitalized, and not subject to any unresolved supervisory issues. To date, the Company has qualified for this exception. As another example, a bank holding company may not impair its subsidiary bank’s soundness by causing it to make funds available to non-banking subsidiaries or their customers if the FRB believed it would not be prudent to do so.
Bank holding companies and their subsidiary banks are also subject to the provisions of the Community Reinvestment Act (“CRA”). Under the terms of the CRA, the FRB (or other appropriate bank regulatory agency, in the case of the Bank, the OCC) is required, in connection with its examination of a bank, to assess such bank’s record in meeting the credit needs of the communities served by that bank, including low and moderate-income neighborhoods. Furthermore, such assessment is taken into account in evaluating any application made by a bank holding company or a bank for, among other things, approval of a branch or other deposit facility, office relocation, a merger or an acquisition of bank shares.
7
Supervision and Regulation of Bank Subsidiaries
The Bank is a nationally chartered banking corporation subject to supervision, examination and regulation by the FRB, the FDIC and the OCC. These regulators have the power to enjoin “unsafe or unsound practices,” require affirmative action to correct any conditions resulting from any violation or practice, issue an administrative order that can be judicially enforced, direct an increase in capital, restrict the growth of a bank, assess civil monetary penalties, and remove a bank’s officers and directors.
The operations of the Bank are subject to numerous statutes and regulations. Such statutes and regulations relate to required reserves against deposits, investments, loans, mergers and consolidations, issuance of securities, payment of dividends, establishment of branches, and other aspects of the Bank’s operations. Various consumer laws and regulations also affect the operations of the Bank, including state usury laws, laws relating to fiduciaries, consumer credit and equal credit, fair credit reporting, and privacy of non-public financial information.
The Bank is subject to Sections 23A and 23B of the Federal Reserve Act and Regulation W thereunder, which govern certain transactions, such as loans, extensions of credit, investments and purchases of assets between member banks and their affiliates, including their parent holding companies. These restrictions limit the transfer from its subsidiaries, including the Bank, of funds to the Company in the form of loans, extensions of credit, investments or purchases of assets (collectively, “Transfers”), and they require that the Bank’s transactions with the Company be on terms no less favorable to the Bank than comparable transactions between the Bank and unrelated third parties. Transfers by the Bank to any affiliate (including the Company) are limited in amount to 10% of the Bank’s capital and surplus, and transfers to all affiliates are limited in the aggregate to 20% of the Bank’s capital and surplus. Furthermore, such loans and extensions of credit are also subject to various collateral requirements. These regulations and restrictions may limit the Company’s ability to obtain funds from the Bank for its cash needs, including funds for acquisitions, and the payment of dividends, interest and operating expenses.
The Bank is prohibited from engaging in certain tying arrangements in connection with any extension of credit, lease or sale of property or furnishing of services. For example, the Bank may not generally require a customer to obtain other services from the Bank or the Company, and may not require the customer to promise not to obtain other services from a competitor as a condition to an extension of credit. The Bank is also subject to certain restrictions imposed by the Federal Reserve Act on extensions of credit to executive officers, directors, principal stockholders or any related interest of such persons. Extensions of credit: (i) must be made on substantially the same terms (including interest rates and collateral) as those prevailing at the time for, and following credit underwriting procedures that are not less stringent than those applicable to, comparable transactions with persons not covered above and who are not employees, and (ii) must not involve more than the normal risk of repayment or present other unfavorable features. The Bank is also subject to certain lending limits and restrictions on overdrafts to such persons. A violation of these restrictions may result in the assessment of substantial civil monetary penalties on the Bank or any officer, director, employee, agent or other person participating in the conduct of the affairs of the Bank or the imposition of a cease and desist order.
As insurer, the FDIC imposes deposit insurance premiums and is authorized to conduct examinations of and to require reporting by, insured institutions. It may also prohibit an insured institution from engaging in any activity the FDIC determines by regulation or order to pose a serious threat to the FDIC. The FDIC also has the authority to initiate enforcement actions against insured institutions. The FDIC may terminate the deposit insurance of any insured depository institution, including the Bank, if it determines after a hearing that the institution has engaged or is engaging in unsafe or unsound practices, is in an unsafe or unsound condition to continue operations, or has violated any applicable law, regulation, order or any condition imposed by an agreement with the FDIC.
The FDIC has adopted a risk-based premium system that provides for quarterly assessments based on an insured institution’s ranking in one of four risk categories based on their examination ratings and capital ratios. In addition, all FDIC-insured institutions are required to pay assessments to the FDIC to fund interest payments on bonds issued by the Financing Corporation (“FICO”), a mixed-ownership Federal government corporation established to recapitalize the Federal Savings and Loan Insurance Corporation. The current annualized assessment rate is 0.56 basis points, or approximately 0.14 basis points per quarter. These assessments will continue until the Financing Corporation bonds mature in 2019. Pursuant to the Dodd-Frank Act, the deposit insurance assessment base was redefined in 2011 to reflect consolidated total assets less average tangible equity. The result is that larger financial institutions, which have more assets leveraged with non-deposit wholesale funds, generally have paid a greater percentage of the aggregate insurance assessment and smaller banks, including the Bank, have paid less.
Regulations promulgated by the FDIC pursuant to the Federal Deposit Insurance Corporation Improvement Act of 1991 place limitations on the ability of certain insured depository institutions to accept, renew or rollover deposits by offering rates of interest which are significantly higher than the prevailing rates of interest on deposits offered by other depository institutions having the same type of charter in such depository institutions’ normal market area. Under these regulations, well-capitalized institutions may accept, renew or rollover such deposits without restriction, while adequately capitalized institutions may accept, renew or rollover such deposits with a waiver from the FDIC (subject to certain restrictions on payment of rates). Undercapitalized institutions may not accept, renew or rollover such deposits.
8
Under the Financial Institutions Reform, Recovery and Enforcement Act of 1989, a depository institution insured by the FDIC can be held liable for any loss incurred by, or reasonably expected to be incurred by, the FDIC in connection with: (i) the default of a commonly controlled FDIC-insured depository institution, or (ii) any assistance provided by the FDIC to a commonly controlled FDIC-insured institution in danger of default. “Default” is defined generally as the appointment of a conservator or receiver, and “in danger of default” is defined generally as the existence of certain conditions indicating that, in the opinion of the appropriate banking agency, a “default” is likely to occur in the absence of regulatory assistance.
In addition to the foregoing, federal regulators have adopted regulations and examination procedures promoting the safety and soundness of institutions by specifically addressing, among other things: (i) internal controls, information systems and internal audit systems; (ii) loan documentation; (iii) credit underwriting; (iv) interest rate exposure; (v) asset growth; (vi) ratio of classified assets to capital; (vii) minimum earnings; and (viii) compensation and benefits standards for management officials. FRB regulations, for example, generally require a bank holding company to give the FRB prior notice of any redemption or repurchase of the bank holding company’s equity securities, if the consideration to be paid, together with the consideration paid for any repurchases or redemptions in the preceding year, is equal to 10% or more of the company's consolidated net worth. The Federal Reserve Board has broad authority to prohibit activities of bank holding companies and their non-banking subsidiaries which represent unsafe and unsound banking practices or which constitute violations of laws or regulations, and can assess civil money penalties for certain activities conducted on a knowing and reckless basis, if those activities caused a substantial loss to a depository institution.
Dividends paid by the Bank have been the Company's primary source of operating funds and are expected to be for the foreseeable future. Capital adequacy requirements serve to limit the amount of dividends that may be paid by the Bank. Under OCC regulations, the Bank may not pay a dividend, without prior OCC approval, if the total amount of all dividends declared during the calendar year, including the proposed dividend, exceed the sum of its retained net income to date during the calendar year and its retained net income over the preceding two years. As of December 31, 2017, approximately $13 million was available for the payment of dividends without prior OCC approval. The Bank’s ability to pay dividends is also subject to the Bank being in compliance with regulatory capital requirements. At December 31, 2017, the Bank was in compliance with these requirements.
Because the Company is a legal entity separate and distinct from the Bank, the Company's right to participate in the distribution of assets of the Bank in the event of the Bank's liquidation or reorganization would be subject to the prior claims of the Bank's creditors. In the event of a liquidation or other resolution of an insured depository institution, the claims of depositors and other general or subordinated creditors are entitled to a priority of payment over the claims of unsecured, non-deposit creditors, including a parent bank holding company (such as the Company) or any shareholder or creditor thereof.
The FRB, the OCC and other federal banking agencies have broad enforcement powers, including the power to terminate deposit insurance, to impose substantial fines and other civil and criminal penalties, and to appoint a conservator or receiver for the assets of a regulated entity. Failure to comply with applicable laws, regulations and supervisory agreements could subject the Company or its subsidiaries, as well as officers, directors and other institution-affiliated parties of these organizations, to administrative sanctions and potential civil monetary penalties.
Capital Adequacy
The Company and its subsidiary bank are required to comply with applicable capital adequacy standards established by the federal banking agencies. In July 2013, the Federal Reserve Board, the OCC, and the FDIC approved final rules (the “Capital Rules”) establishing a new comprehensive capital framework for U.S. banking organizations. These rules went into effect as to the Company and its subsidiary bank on January 1, 2015, subject to phase-in periods for certain components and other provisions.
Basel III and the Capital Rules. The Capital Rules generally implement the Basel Committee’s December 2010 final capital framework referred to as “Basel III” for strengthening international capital standards. The Capital Rules substantially revise the risk-based capital requirements applicable to bank holding companies and their depository institution subsidiaries, including Evans Bancorp, Inc., and Evans Bank N.A., as compared to the U.S. general risk-based capital rules that were applicable to the Company through December 31, 2014. The Capital Rules revise the definitions and the components of regulatory capital, as well as address other issues affecting the numerator in banking institutions’ regulatory capital ratios. The Capital Rules also address asset risk weights and other matters affecting the denominator in banking institutions’ regulatory capital ratios.
Among other matters, the Capital Rules: (i) introduce a new capital measure called “Common Equity Tier 1” (“CET1”) and related regulatory capital ratio of CET1 to risk-weighted assets; (ii) specify that Tier 1 capital consists of CET1 and “Additional Tier 1 capital” instruments meeting certain revised requirements; (iii) mandate that most deductions/adjustments to regulatory capital measures be made to CET1 and not to the other components of capital; and (iv) expand the scope of the deductions from and adjustments to capital as compared to the previous regulations.
9
Pursuant to the Capital Rules, the minimum capital ratios as of January 1, 2015 (subject to the phase-in of additional requirements as described below) were as follows:
|
|
|
|
4.5% CET1 to risk-weighted assets; |
|
|
|
|
6.0% Tier 1 capital (that is, CET1 plus Additional Tier 1 capital) to risk-weighted assets; |
|
|
|
|
8.0% Total capital (that is, Tier 1 capital plus Tier 2 capital) to risk-weighted assets; and |
|
|
|
|
4.0% Tier 1 capital to average consolidated assets as reported on the consolidated financial statements (known as the “leverage ratio”). |
The Capital Rules also introduce a new “capital conservation buffer,” composed entirely of CET1, on top of the minimum risk-weighted asset ratios described above, and is designed to absorb losses during periods of economic stress. Banking institutions with a ratio of CET1 to risk-weighted assets above the minimum but below the capital conservation buffer will face constraints on dividends, equity and other capital instrument repurchases and compensation based on the amount of the shortfall. The implementation of the capital conservation buffer began on January 1, 2016 at 0.625% and is scheduled to increase by 0.625% on each subsequent January 1 through January 1, 2019. Thus, when fully phased-in on January 1, 2019, the capital standards applicable to the Company will include an additional capital conservation buffer of 2.5% of CET1, effectively resulting in minimum ratios inclusive of the capital conservation buffer of (i) CET1 to risk-weighted assets of at least 7%, (ii) Tier 1 capital to risk-weighted assets of at least 8.5%; (iii) Total capital to risk-weighted assets of at least 10.5% and (iv) a minimum leverage ratio of 4%, calculated as the ratio of Tier 1 capital to average assets.
The Capital Rules provide for a number of deductions from and adjustments to CET1. These include, for example, the requirement that mortgage servicing rights, deferred tax assets arising from temporary differences that could not be realized through net operating loss carrybacks and significant investments in non-consolidated financial entities be deducted from CET1 to the extent that any one such category exceeds 10% of CET1 or all such items, in the aggregate, exceed 15% of CET1.
In addition, the Capital Rules include certain exemptions to address concerns about the regulatory burden on community banks. For example, banking organizations with less than $15 billion in consolidated assets as of December 31, 2009 are permitted to include in Tier 1 capital trust preferred securities and cumulative perpetual preferred stock issued and included in Tier 1 capital prior to May 19, 2010 on a permanent basis, without any phase out (subject to a limit of 25% of Tier 1 capital). Also, community banks were able to elect on a one time basis in their March 31, 2015 quarterly filings to opt-out of the onerous requirement to include most accumulated other comprehensive income (“AOCI”) components in the calculation of common equity Tier 1 capital and, in effect, retain the AOCI treatment under the current capital rules. Under the Capital Rules, the Company made a one-time, permanent election to continue to exclude AOCI from capital.
The Federal Deposit Insurance Act (the “FDIA”) establishes a system of regulatory remedies to resolve the problems of undercapitalized institutions, referred to as the prompt corrective action. The federal banking regulators have established five capital categories (“well-capitalized,” “adequately capitalized,” “undercapitalized,” “significantly undercapitalized” and “critically undercapitalized”) and must take certain mandatory supervisory actions, and are authorized to take other discretionary actions, with respect to institutions which are undercapitalized, significantly undercapitalized or critically undercapitalized. The severity of these mandatory and discretionary supervisory actions depends upon the capital category in which the institution is placed. Generally, subject to a narrow exception, the FDIA requires the banking regulator to appoint a receiver or conservator for an institution that is critically undercapitalized. The FDIC has specified by regulation the relevant capital levels for each category, which are printed below. The Federal Reserve Board and the OCC have specified the same or similar levels for each category.
|
|
|
|
|
“Well-Capitalized” |
|
“Adequately Capitalized” |
|
CET1 ratio of 6.5% Leverage Ratio of 5%, Tier 1 Capital ratio of 8%, Total Capital ratio of 10%, and Not subject to a written agreement, order, capital directive or regulatory remedy directive requiring a specific capital level. |
|
CET1 ratio of 4.5% Leverage Ratio of 4%, Tier 1 Capital ratio of 6%, and Total Capital ratio of 8%. |
|
|
||
|
“Undercapitalized” |
|
“Significantly Undercapitalized” |
|
CET1 Ratio of less than 4.5% Leverage Ratio less than 4%, Tier 1 Capital ratio less than 6%, or Total Capital ratio less than 8%. |
|
CET1 Ratio of less than 3% Leverage Ratio less than 3%, Tier 1 Capital ratio less than 4%, or Total Capital ratio less than 6%. |
|
|
||
|
“Critically undercapitalized” |
|
|
10
|
Tangible equity to total assets less than 2%. |
|
|
For purposes of these regulations, the term “tangible equity” includes core capital elements counted as Tier 1 Capital for purposes of the risk-based capital standards plus the amount of outstanding cumulative perpetual preferred stock (including related surplus), minus all intangible assets with certain exceptions.
An institution that is classified as well-capitalized based on its capital levels may be classified as adequately capitalized, and an institution that is adequately capitalized or undercapitalized based upon its capital levels may be treated as though it were undercapitalized or significantly undercapitalized, respectively, if the appropriate federal banking agency, after notice and opportunity for hearing, determines that an unsafe or unsound condition or an unsafe or unsound practice warrants such treatment.
An institution that is categorized as undercapitalized, significantly undercapitalized or critically undercapitalized is required to submit an acceptable capital restoration plan to its appropriate federal banking regulator. Under the FDIA, in order for the capital restoration plan to be accepted by the appropriate federal banking agency, a BHC must guarantee that a subsidiary depository institution will comply with its capital restoration plan, subject to certain limitations. The BHC must also provide appropriate assurances of performance. The obligation of a controlling BHC under the FDIA to fund a capital restoration plan is limited to the lesser of 5.0% of an undercapitalized subsidiary’s assets or the amount required to meet regulatory capital requirements. An undercapitalized institution is also generally prohibited from increasing its average total assets, making acquisitions, establishing any branches or engaging in any new line of business, except in accordance with an accepted capital restoration plan or with the approval of the FDIC. Institutions that are significantly undercapitalized or undercapitalized and either fail to submit an acceptable capital restoration plan or fail to implement an approved capital restoration plan may be subject to a number of requirements and restrictions, including orders to sell sufficient voting stock to become adequately capitalized, requirements to reduce total assets and cessation of receipt of deposits from correspondent banks. Critically undercapitalized depository institutions failing to submit or implement an acceptable capital restoration plan are subject to appointment of a receiver or conservator.
The Company’s regulatory capital ratios under risk-based capital rules in effect through December 31, 2017 are presented in Note 20 of Notes to Financial Statements filed herewith in Part II, Item 8, “Financial Statements and Supplementary Data”.
Dodd-Frank Wall Street Reform and Consumer Protection Act
The Dodd-Frank Wall Street Reform and Consumer Protection Act (“Dodd-Frank Act”), enacted in 2010, is widely regarded as the most sweeping change to financial regulation since the Great Depression. The law was intended to promote robust supervision and regulation of financial firms; establish comprehensive supervision of financial markets; protect consumers and investors from financial abuse; provide the government with the tools to manage a financial crisis; and raise international regulatory standards and improve international cooperation. Some of the most significant aspects of The Dodd-Frank Act include:
|
I. |
The creation of a new oversight regulator, the Financial Stability Oversight Council. The council of regulators monitors the financial system for systemic risk and will determine which entities pose significant systemic risk and should be subject to greater federal regulation and oversight. |
|
II. |
The Collins Amendment, which requires the federal banking agencies to establish minimum leverage capital and risk-based capital requirements for insured depository institutions, depository institution holding companies and non-bank financial companies supervised by the FRB (also known as systemically significant financial institutions). The Collins Amendment provides that certain hybrid financial instruments, such as trust preferred securities, issued on or after May 19, 2010, will be excluded from Tier 1 capital. For certain large depository institution holding companies (greater than $15 billion in assets at December 31, 2009), hybrid financial instruments issued before May 19, 2010 were phased out of Tier 1 capital over a three-year period beginning January 1, 2013. The Company was well below this threshold at December 31, 2009. At December 31, 2017, the Company had $11.3 million in trust preferred securities included in Tier 1 capital. |
|
III. |
The Durbin Amendment, which provided that interchange fees that a card issuer or payment network receives or charges for debit transactions will now be regulated by the FRB and must be “reasonable and proportional” to the cost incurred by the card issuer in authorizing, clearing and settling the transaction. The pricing provisions of the Durbin Amendment apply to card issuing financial institutions with more than $10 billion in assets. The Durbin Amendment also prohibits all issuers and networks from restricting the number of networks over which electronic debit transactions may be processed to less than two unaffiliated networks, and prohibits issuers and networks from inhibiting a merchant’s ability to direct the routing of the electronic debit transaction over any network that the issuer has enabled to process them. Although the Bank is exempt from the pricing provisions of the Durbin Amendment, it has been indirectly impacted as it competes with other institutions who are directly impacted by the Durbin Amendment. |
11
|
IV. |
A number of deposit insurance reforms, which have generally benefited the Bank. First, the Dodd-Frank Act redefined the deposit insurance assessment base to reflect consolidated total assets less average tangible equity. The result is that larger financial institutions, which have more assets leveraged with non-deposit wholesale funds, have paid a greater percentage of the aggregate insurance assessment, while smaller banks (such as the Bank) have paid less than they would have under the prior rules. The Dodd-Frank Act also increased the minimum reserve ratio of the Deposit Insurance Fund from 1.15% to 1.35%, but exempted institutions with assets less than $10 billion from funding the cost of the increase. The title also permanently increased deposit insurance coverage to $250,000 per account (subject to certain limitations). |
|
V. |
A permanent exemption from the provisions of Section 404(b) of the Sarbanes-Oxley Act (“SOX”), which requires that public companies receive an opinion from their external auditors as to the effectiveness of their internal control over financial reporting, for companies with a public market capitalization under $75 million. As an accelerated filer, the Company does not qualify for this exemption. |
|
VI. |
Establishment of the Consumer Financial Protection Bureau (the “CFPB”), an independent agency with the authority to prohibit practices that it finds to be unfair, deceptive, or abusive, in addition to requiring certain disclosures. |
|
VII. |
The imposition of new regulations on mortgage loan originators, including the imposition of new disclosure requirements and appraisal reforms, such as: the creation of a mortgage originator duty of care; the establishment of certain underwriting requirements designed to ensure that at the time of origination the consumer has a reasonable ability to repay the loan; the creation of document requirements intended to eliminate “no document” and “low document” loans; the prohibition of steering incentives for mortgage originators; a prohibition on yield spread premiums and prepayment penalties in some cases; and a provision that allows borrowers to assert as a foreclosure defense a contention that the lender violated the anti-steering restrictions or the reasonable repayment requirements. |
|
VIII. |
In December 2013, five federal agencies (including the FRB and the OCC) adopted a final regulation implementing the “Volcker Rule” provision of the Dodd-Frank Act. The Volcker Rule generally prohibits insured banks and their affiliates from proprietary trading or from acquiring or retaining any equity, partnership or other ownership interest in, sponsoring or having certain other relationships with a hedge fund or a private equity fund, subject to certain exceptions. The Volcker Rule has not had an impact on the operations of the Company or the Bank, as they do not engage in the activities prohibited by the Volcker Rule. |
Regulation of Insurance Agency Subsidiary
TEA is regulated by the New York State Department of Financial Services. As of the date of this report, TEA meets and maintains all licensing and continuing education requirements required by the State of New York.
Monetary Policy and Economic Control
The commercial banking business is affected not only by general economic conditions, but also by the monetary policies of the FRB. Changes in the discount rate on member bank borrowing, availability of borrowing at the “discount window,” open market operations, the imposition of changes in reserve requirements against member banks’ deposits and assets of foreign branches and the imposition of and changes in reserve requirements against certain borrowings by banks and their affiliates are some of the instruments of monetary policy available to the FRB. These monetary policies are used in varying combinations to influence overall growth and distributions of bank loans, investments and deposits, and this use may affect interest rates charged on loans or paid on deposits. The monetary policies of the FRB have had a significant effect on the operating results of commercial banks and are expected to continue to do so in the future. The monetary policies of these agencies are influenced by various factors, including inflation, unemployment, and short-term and long-term changes in the international trade balance and in the fiscal policies of the United States Government. Future monetary policies and the effect of such policies on the future business and earnings of the Company cannot be predicted.
Consumer Laws and Regulations
In addition to the laws and regulations discussed herein, the Bank is also subject to certain consumer laws and regulations that are designed to protect consumers in transactions with banks. These laws and regulations include, but are not limited to, the USA PATRIOT Act of 2001, the Bank Secrecy Act, the Truth in Lending Act, the Truth in Savings Act, the Electronic Funds Transfer Act, the Expedited Funds Availability Act, the Equal Credit Opportunity Act, the Fair Housing Act, the Home Mortgage Disclosure Act, the Real Estate Settlement Procedures Act, Federal Financial Privacy Laws, Interagency Guidelines Establishing Information Security Standards, the Right to Financial Privacy Act, and the Fair and Accurate Credit Transactions Reporting Act. These laws and regulations regulate the manner in which financial institutions must deal with customers when taking deposits or making loans to such customers.
12
Tax Cuts and Jobs Act
The Tax Cuts and Jobs Act (“TCJA”), which represents one of the most significant overhauls to the United States federal tax code since 1986, was signed into law on December 22, 2017. The TCJA impacts the Company in various ways which are outlined in Note 13 to the Consolidated Financial Statements.
The most significant impact of the TCJA is on the Company’s marginal federal tax rate in 2018 and beyond, which will decrease from 35% to 21%. The change in the corporate tax rate resulted in a $2.0 million expense associated with a remeasurement of the Company’s deferred tax asset as of December 31, 2017. Approximately $0.6 million of the $2.0 million expense is associated with deferred tax assets related to net unrealized losses on available-for-sale investment securities and the unamortized actuarial losses on the Company’s defined benefit pension and supplemental executive retirement plans (“SERPs”) which were originally recorded through other comprehensive income (“OCI”) and not net income. The Company reclassified the $0.6 million charge related to deferred tax expense for items originally recorded through OCI from OCI to retained earnings per Accounting Standards Update 2018-02, “Reclassification of Certain Tax Effects from Accumulated Other Comprehensive Income,” released in February 2018 and early adopted by the Company for the period ended December 31, 2017.
Other aspects of the TCJA impacting the Company include:
|
· |
The Company is active in the historic rehabilitation tax credit (“HRTC”) market. Before TCJA, HRTC’s were allowed for 20% of qualified rehabilitation expenses (“QRE”) in the year the property is placed in service. For properties owned before December 31, 2017 in which construction is started by June 22, 2018 and completed by December 22, 2019, the previous rules still apply. The Company has two remaining projects that fit these criteria. For all other projects, the HRTC for 20% of QRE will now be taken over a 5 year period rather than all in the first year. This delay in cash flows to investors is expected to negatively impact the pricing on HRTC’s. It is possible that when investors like the Company lower their price on potential HRTC opportunities, developers may not have sufficient funding to complete rehabilitation projects in the future and the HRTC market could become severely diminished or eliminated altogether. The Company earned $0.7 million in net income on HRTC investments in 2017. The Company has historic tax credit investments valued at $1.2 million as of December 31, 2017. |
|
· |
The TCJA limits the deductibility of executive compensation. The TCJA expands the definition of “covered employees” for purposes of Section 162(m) of the Internal Revenue Code to include the CFO, CEO, and the three most highly compensated officers for the tax year and designates covered employees as covered employees forever. Previously, if a covered employee retired, the individual would no longer be considered covered in retirement and therefore post-retirement payments to that individual would not be limited by Section 162(m). This change impacts the SERP for one of the Company’s executive officers, who has agreed to receive his benefit in a lump sum payment. The Company anticipates that this lump sum payment will exceed $1 million and the excess of the payment over $1 million will therefore be non-deductible. As of December 31, 2017, the executive’s projected benefit obligation was $1.4 million. As a result, the Company recorded a $114 thousand valuation allowance at December 31, 2017 as an estimate of the non-deductible portion of the future benefit payment. |
|
· |
The TCJA allows for 100% expensing of the cost of qualified property acquired and placed in service after September 27, 2017 and before January 1, 2023. This benefit is scheduled to phase out in full by 2027. Management expects that this will allow the Company to deduct capital expenses in full in the year of acquisition rather than over a period of time (3-7 years). This is expected to delay tax payments for the Company but is unlikely to have a material effect on results from operations. |
|
· |
The TCJA repeals the 50% deduction for entertainment, amusement, or recreation activities and disallows employer deductions for meals provided for the convenience of the employer. The impact of this change is not expected to be material to the Company. |
There are many other provisions in the TCJA that affect corporations generally but are not expected to impact the Company, including limits on the deductibility of FDIC insurance premium for banks with more than $10 billion in assets, various provisions related to companies with international operations, and limitations on the deductibility of interest expense. Income tax expense and deferred tax assets were recorded for the year ended December 31, 2017 and as of December 31, 2017, respectively, based on the Company’s initial analysis of the TCJA. Given the complexity of the TCJA, anticipated guidance from the U.S. Treasury regarding implementation of the TCJA, and the potential for guidance from the Securities and Exchange Commission or the Financial Accounting Standards Board related to the TCJA, it is possible there will be adjustments to the Company’s results of operations during 2018 to reflect any such guidance provided.
EMPLOYEES
As of December 31, 2017, the Bank had 218 employees, TEA had 49 employees, and FCS had 4 employees. The Company had no direct employees. Management believes that the Company’s subsidiaries have good relationships with their employees.
13
AVAILABLE INFORMATION
The Company's Annual Report on Form 10-K, Quarterly Reports on Form 10-Q, Current Reports on Form 8-K and amendments to those reports filed or furnished by the Company pursuant to Section 13(a) or 15(d) of the Exchange Act are available without charge on the Company's website, www.evansbancorp.com - SEC filings section, as soon as reasonably practicable after they are electronically filed with or furnished to the SEC. The Company is providing the address to its Internet site solely for the information of investors. The Company does not intend its Internet address to be an active link or to otherwise incorporate the contents of the website into this Annual Report on Form 10-K or into any other report filed with or furnished to the SEC.
The following factors identified by the Company's management represent significant potential risks that the Company faces in its operations.
The Company’s Business May Be Adversely Affected by Conditions in the Financial Markets and Economic Conditions Generally
The Company’s financial performance generally, and in particular the ability of borrowers to pay interest on and repay principal of outstanding loans and the value of collateral securing those loans, is highly dependent upon the business environment in the markets where the Company operates, in Western New York and in the United States as a whole. A favorable business environment is generally characterized by, among other factors, economic growth, efficient capital markets, low inflation, high business and investor confidence, and strong business earnings. Unfavorable or uncertain economic and market conditions can be caused by: declines in economic growth, declines in housing and real estate valuations, business activity or investor or business confidence; limitations on the availability or increases in the cost of credit and capital; increases in inflation or interest rates; natural disasters; or a combination of these or other factors.
Economic conditions in the United States remained positive in 2017, which included national and local unemployment rates of 4.1% and 5.6%, respectively, as of December 31, 2017. Although conditions in Western New York and the United States are currently good, a slowdown of the economy could occur in the future. The last recession ended in 2009 and has been followed by 102 months of economic expansion. In the post-World War II era, the average period of economic expansion has been 57 months. This could indicate that we are in a longer than normal period of economic expansion and that there is increased risk of recession. Even though the Company is a community institution servicing a local market, in a global economy, any deteriorating conditions in other parts of the world could affect the United States economically. Such conditions could materially adversely affect the credit quality of the Company’s loans, and therefore, the Company’s results of operations and financial condition.
Commercial Real Estate and Commercial Business Loans Expose the Company to Increased Credit Risks
At December 31, 2017, the Company's portfolio of commercial real estate loans totaled $627 million, or 59% of total loans outstanding, and the Company's portfolio of commercial and industrial (“C&I”) loans totaled $232 million, or 22% of total loans outstanding. The Company plans to continue to emphasize the origination of commercial loans as they generally earn a higher rate of interest than other loan products offered by the Bank. However, commercial loans generally expose a lender to greater risk of non-payment and loss than one-to four-family residential mortgage loans because repayment of commercial real estate and C&I loans often depends on the successful operations and the income stream of the borrowers. Commercial mortgages are collateralized by real property while C&I loans are typically secured by business assets such as equipment and accounts receivable. Commercial loans typically involve larger loan balances to single borrowers or groups of related borrowers compared to one-to four-family residential mortgage loans. Also, many of the Company's commercial borrowers have more than one commercial real estate or C&I loan outstanding with the Company. Consequently, an adverse development with respect to one loan or one credit relationship can expose the Company to a significantly greater risk of loss compared to an adverse development with respect to a one-to four-family residential mortgage loan. Commercial real estate loans in non-accrual status at December 31, 2017 were $8.9 million, compared with $6.1 million at December 31, 2016. C&I loans in non-accrual status at December 31, 2017 were $1.7 million, compared with $3.1 million at December 31, 2016. Increases in the delinquency levels of commercial real estate and C&I loans could result in an increase in non-performing loans and the provision for loan losses, which could have a material adverse effect on the Company’s results of operations and financial condition.
14
Continuing Concentration of Loans in the Company's Primary Market Area May Increase the Company's Risk
Unlike larger banks that are more geographically diversified, the Company provides banking and financial services to customers located primarily in western New York State (“WNY”). Therefore, the Company's success depends primarily on the general economic conditions in WNY. The Company's business lending and marketing strategies focus on loans to small and medium-sized businesses in this geographic region. Moreover, the Company's assets are heavily concentrated in mortgages on properties located in WNY. Accordingly, the Company's business and operations are vulnerable to downturns in the economy of WNY. The concentration of the Company's loans in this geographic region subjects the Company to the risk that a downturn in the economy or recession in this region could result in a decrease in loan originations and increases in delinquencies and foreclosures, which would more greatly affect the Company than if the Company's lending were more geographically diversified. In addition, the Company may suffer losses if there is a decline in the value of properties underlying the Company's mortgage loans which would have a material adverse impact on the Company's operations.
In the Event the Company's Allowance for Loan Losses is Not Sufficient to Cover Actual Loan Losses, the Company's Earnings Could Decrease
The Company maintains an allowance for loan losses in order to capture the probable losses inherent in its loan portfolio. There is a risk that the Company may experience significant loan losses which could exceed the allowance for loan losses. In determining the amount of the Company's recorded allowance, the Company makes various assumptions and judgments about the collectability of its loan portfolio, including the creditworthiness of its borrowers, the effect of changes in the local economy on the value of the real estate and other assets serving as collateral for the repayment of loans, the effects on the Company's loan portfolio of current economic indicators and their probable impact on borrowers, and the Company's loan quality reviews. The emphasis on the origination of commercial real estate and C&I loans is a significant factor in evaluating the allowance for loan losses. As the Company continues to increase the amount of these loans in the portfolio, additional or increased provisions for loan losses may be necessary and would adversely affect the results of operations. In addition, bank regulators periodically review the Company's loan portfolio and credit underwriting procedures, as well as its allowance for loan losses, and may require the Company to increase its provision for loan losses or recognize further loan charge-offs. At December 31, 2017, the Company had a gross loan portfolio of $1.1 billion and the allowance for loan losses was $14.0 million, which represented 1.32% of the total amount of gross loans. If the Company's assumptions and judgments prove to be incorrect or bank regulators require the Company to increase its provision for loan losses or recognize further loan charge-offs, the Company may have to increase its allowance for loan losses or loan charge-offs which could have an adverse effect on the Company's operating results and financial condition. Additionally, there can be no assurances that the Company's allowance for loan losses will be adequate to protect the Company against loan losses that it may incur.
Changes in Interest Rates Could Adversely Affect the Company's Business, Results of Operations and Financial Condition
The Company's results of operations and financial condition are significantly affected by changes in interest rates. The Company's results of operations depend substantially on its net interest income, which is the difference between the interest income earned on its interest-earning assets and the interest expense paid on its interest-bearing liabilities. Because the Company's interest-bearing liabilities generally re-price or mature more quickly than its interest-earning assets, an increase in interest rates could result in a decrease in its net interest income.
Changes in interest rates also affect the value of the Company's interest-earning assets, and in particular, the Company's securities portfolio. Generally, the value of securities fluctuates inversely with changes in interest rates. At December 31, 2017, the Company's securities available for sale totaled $144 million. Net unrealized losses on securities available for sale amounted to $1.0 million, net of tax. Decreases in the fair value of securities available for sale could have an adverse effect on stockholders' equity or earnings.
The Company also is subject to reinvestment risk associated with changes in interest rates. Changes in interest rates may affect the average life of loans and mortgage-related securities. Decreases in interest rates can result in increased prepayments of loans and mortgage-related securities, as borrowers refinance to reduce borrowing costs. Under these circumstances, the Company is subject to reinvestment risk to the extent that it is unable to reinvest the cash received from such prepayments at rates that are comparable to the rates on existing loans and securities. Additionally, increases in interest rates may decrease loan demand and make it more difficult for borrowers to repay adjustable rate loans.
As of December 31, 2017, the FRB had raised the targeted federal funds rate a total of 1.00% since December 2016. These actions benefited the Company’s net interest margin in 2017 due to the re-pricing of the variable rate loan portfolio. However, rising interest rates have begun to put pressure on funding costs. The cost of the Company’s interest-bearing liabilities increased in the second half of 2017 as the Company’s reliance on time deposits and other borrowings increased and low-cost savings deposit growth lagged. There is risk that funding costs could continue to increase and that margin compression could have a material adverse effect on the Company’s results of operations and financial condition.
15
The Company May Be Adversely Affected by the Soundness of Other Financial Institutions
Financial services institutions are interrelated as a result of counterparty relationships. The Company has exposure to many different industries and counterparties, and routinely executes transactions with counterparties in the financial services industry. As a result, defaults by, or even rumors or questions about, one or more financial services institutions, or the financial services industry generally, could lead to losses or defaults by us or by other institutions and impact our business. Many of these transactions expose us to credit risk in the event of default of our counterparty or customer. In addition, our credit risk may be further increased when the collateral held by us cannot be relied upon or is liquidated at prices not sufficient to recover the full amount of the financial instrument exposure due to us. Any such losses could materially and adversely affect our results of operations.
The most important counterparty for the Company, in terms of liquidity, is the Federal Home Loan Bank of New York (“FHLBNY”). The Company uses FHLBNY as its primary source of borrowed overnight funds and also has several long-term advances with FHLBNY. At December 31, 2017, the Company had a total of $88 million in borrowed funds with FHLBNY. The Company has placed sufficient collateral in the form of commercial and residential real estate loans at FHLBNY. As a member of the Federal Home Loan Bank System, the Bank is required to hold stock in FHLBNY. The Bank held FHLBNY stock with a fair value of $4.9 million as of December 31, 2017.
There are 12 branches of the FHLB, including New York. If a branch were at risk of breaching risk-based capital requirements, it could suspend dividends, cut dividend payments, and/or not buy back excess FHLB stock that members hold. FHLBNY has stated that they expect to be able to continue to pay dividends, redeem excess capital stock, and provide competitively priced advances in the future. Nonetheless, the 12 FHLB branches are jointly liable for the consolidated obligations of the FHLB system. To the extent that one FHLB branch cannot meet its obligations to pay its share of the system’s debt; other FHLB branches can be called upon to make the payment.
Systemic weakness in the FHLB could result in higher costs of FHLB borrowings, reduced value of FHLB stock, and increased demand for alternative sources of liquidity that are more expensive, such as brokered time deposits, the discount window at the Federal Reserve, or lines of credit with correspondent banks First Tennessee Bank and M&T Bank.
A Decline in the Value of the Company’s Deferred Tax Assets Could Adversely Affect the Company’s Operating Results and Regulatory Capital Ratios.
The Company’s tax strategies depend on the ability to generate taxable income in future periods. The Company’s tax strategies will be less effective in the event the Company fails to generate anticipated amounts of taxable income. The value of the Company’s deferred tax assets is subject to an evaluation of whether it is more likely than not that they will be realized for financial statement purposes. In making this determination, management considers all positive and negative evidence available, including the Company’s historical levels of taxable income, the opportunity for net operating loss carrybacks, and projections for future taxable income over the statutory tax loss carryover period. If the Company were to conclude that a significant portion of deferred tax assets were not more likely than not to be realized, the required valuation allowance could adversely affect the Company’s financial position, results of operations and regulatory capital ratios. In addition, the value of the Company’s deferred tax assets could be adversely affected by a change in statutory tax rates.
The TCJA Includes Significant Changes in Tax Legislation Which Could Result in Significant Changes to the Company’s Future Tax Positions, Consumer Behavior, the Economy and Competition.
The TCJA, which was enacted in December 2017, contains many provisions which differ from previous tax law. These changes include, but are not limited to, the reduction in the federal corporate income tax rate from 35% to 21%. The Company recorded income tax expense and deferred tax assets for the year ended December 31, 2017 and as of December 31, 2017, respectively, based on the Company’s initial analysis of the TCJA. This resulted in an expense related to the remeasurement of the Company’s deferred tax assets and reduced the value of those assets by $2.1 million due to the reduction of the federal corporate income tax rate from 35% to 21%. Given the complexity of the TCJA, anticipated guidance from the U.S. Treasury regarding implementation of the act, and the potential for guidance from the Securities and Exchange Commission or the Financial Accounting Standards Board related to the TCJA, it is possible there will be adjustments to our results of operations during 2018 to reflect any such guidance provided. These adjustments may adversely affect our financial condition and results of operations.
Furthermore, given the significant change in the US tax law, there could be any number of consequences to the US economy and therefore the Company. While corporations will benefit from the reduction in the federal income tax rate, the implications could result in more aggressive loan and deposit pricing or increased advertising by direct competitors of the Company or wage inflation that would increase the Company’s salaries and benefits costs. Further, changes in the federal tax code for individuals could drive changes in consumer behavior that could impact the Company. For example, new caps on the deductibility of mortgage interest could adversely affect the residential real estate market including a reduction in home prices (including homes serving as collateral for the Bank’s current residential mortgage loans) and a preference for renting rather than owning a home. Any such occurrences could have a material adverse effect on the Company’s business, financial condition, and results of operations.
16
HRTC rules also changed under the TCJA, with new credits now being taken over five years rather than all in the year in which the project is placed in service. This delay in cash flows to investors is expected to negatively impact the pricing on HRTC’s. It is possible that when investors like the Company lower their price on potential HRTC opportunities, developers may not have sufficient funding to complete rehabilitation projects in the future and the HRTC market could become severely diminished or eliminated altogether. The Company earned $0.7 million in net income on HRTC investments in 2017. The Company has HRTC investments valued at $1.2 million as of December 31, 2017.
Strong Competition Within the Company's Market Area May Limit the Company’s Growth and Profitability
Competition in the banking and financial services industry is intense. The Company competes with commercial banks, savings institutions, mortgage brokerage firms, credit unions, finance companies, mutual funds, insurance companies, and brokerage and investment banking firms operating locally within the Company's market area and elsewhere. Many of these competitors (whether regional or national institutions) have substantially greater resources and lending limits than the Company does, and may offer certain services that the Company does not or cannot provide. The Company's profitability depends upon its continued ability to successfully compete in this market area.
Expansion of the Company’s Branch Network May Adversely Affect its Financial Results
The Company cannot assure that the opening of new branches will be accretive to earnings or that it will be accretive to earnings within a reasonable period of time. Numerous factors contribute to the performance of a new branch, such as suitable location, qualified personnel, and an effective marketing strategy. Additionally, it takes time for a new branch to gather sufficient loans and deposits to generate income sufficient to cover its operating expenses. Difficulties the Company experiences in opening new branches may have a material adverse effect on the Company’s financial condition and results of operations.
The Company Operates in a Highly Regulated Environment and May Be Adversely Affected By Changes in Laws and Regulations
The Company and its subsidiaries are subject to regulation, supervision and examination by the OCC, FRB, and by the FDIC, as insurer of its deposits. Such regulation and supervision govern the activities in which a bank and its holding company may engage and are intended primarily for the protection of the deposit insurance funds and depositors. Regulatory requirements affect the Company's lending practices, capital structure, investment practices, dividend policy and growth. These regulatory authorities have extensive discretion in connection with their supervisory and enforcement activities, including the imposition of restrictions on the operation of a bank, the imposition of deposit insurance premiums and other assessments, the classification of assets by a bank and the adequacy of a bank's allowance for loan losses. Any change in such regulation and oversight, particularly through the new rules and regulations expected to be established by the Dodd-Frank Act and Basel III, could have a material adverse impact on the Bank, the Company and its business, financial condition and results of operations.
Lack of System Integrity or Credit Quality Related to Funds Settlement Could Result in a Financial Loss
The Bank settles funds on behalf of financial institutions, other businesses and consumers and receives funds from clients, card issuers, payment networks and consumers on a daily basis for a variety of transaction types. Transactions facilitated by the Bank include debit card, credit card and electronic bill payment transactions, supporting consumers, financial institutions and other businesses. These payment activities rely upon the technology infrastructure that facilitates the verification of activity with counterparties and the facilitation of the payment. If the continuity of operations or integrity of processing were compromised this could result in a financial loss to the Bank, and therefore the Company, due to a failure in payment facilitation. In addition, the Bank may issue credit to consumers, financial institutions or other businesses as part of the funds settlement. A default on this credit by a counterparty could result in a financial loss to the Bank, and therefore to the Company.
Financial Services Companies Depend on the Accuracy and Completeness of Information about Customers and Counterparties
In deciding whether to extend credit or enter into other transactions, the Company may rely on information furnished by or on behalf of customers and counterparties, including financial statements, credit reports, and other financial information. The Company may also rely on representations of those customers, counterparties, or other third parties, such as independent auditors, as to the accuracy and completeness of that information. Reliance on inaccurate or misleading financial statements, credit reports, or other financial information could cause the Company to enter into unfavorable transactions, which could have a material adverse effect on the Company’s financial condition and results of operations.
17
Loss of Key Employees May Disrupt Relationships with Certain Customers
The Company’s business is primarily relationship-driven in that many of the key employees of the Bank and TEA have extensive customer relationships. Loss of a key employee with such customer relationships may lead to the loss of business if the customers were to follow that employee to a competitor. While management believes that the Company’s relationships with its key business producers are good, the Company cannot guarantee that all of its key personnel will remain with the organization. Loss of such key personnel, particularly if they enter into an employment relationship with one of the Company’s competitors, could result in the loss of some of the Company’s customers. Such losses could have a material adverse effect on the Company’s business, financial condition and results of operations.
Future FDIC Insurance Premium Increases May Adversely Affect the Company’s Earnings
The Company is generally unable to control the amount of premiums that it is required to pay for FDIC insurance. If there are additional bank or financial institution failures or other similar occurrences, the FDIC may again increase the premiums assessed upon insured institutions. Such increases and any future increases or required prepayments of FDIC insurance premiums may adversely impact the Company’s results of operations.
The Company is a Financial Holding Company and Depends on Its Subsidiaries for Dividends, Distributions and Other Payments
The Company is a legal entity separate and distinct from its banking and other subsidiaries. The Company’s principal source of cash flow, including cash flow to pay dividends to the Company’s stockholders and principal and interest on its outstanding debt, is dividends from the Bank. There are statutory and regulatory limitations on the payment of dividends by the Bank, as well as the payment of dividends by the Company to its stockholders. Regulations of the OCC affect the ability of the Bank to pay dividends and other distributions and to make loans to the Company. If the Bank is unable to make dividend payments and sufficient capital is not otherwise available, the Company may not be able to make dividend payments to its common stockholders or principal and interest payments on its outstanding debt.
Because the Nature of the Financial Services Business Involves a High Volume of Transactions, the Company Faces Significant Operational Risks
The Company relies on the ability of its employees and systems to process a high number of transactions. Operational risk is the risk of loss resulting from the Company’s operations, including but not limited to, the risk of fraud by employees or persons outside of the Company, the execution of unauthorized transactions by employees, errors relating to transaction processing and technology, breaches of the internal control system and compliance requirements, and business continuation and disaster recovery. This risk of loss also includes the potential legal actions that could arise as a result of an operational deficiency or as a result of noncompliance with applicable regulatory standards, adverse business decisions or their implementation, and customer attrition due to potential negative publicity. In the event of a breakdown in the internal control system, improper operation of systems or improper employee actions, the Company could suffer financial loss, face regulatory action and suffer damage to its reputation, any of which could have a material adverse effect on the Company’s financial condition or results of operation.
The Company’s Information Systems May Experience an Interruption or Breach in Security
The Company relies heavily on communications and information systems to conduct its business. Any failure, interruption, or breach in security or operational integrity of these systems could result in failures or disruptions in the Company’s customer relationship management, general ledger, deposit, loan, and other systems. There can be no assurance that failures, interruptions, or security breaches of the Company’s information systems will not occur or, if they do occur, that they will be adequately addressed. If personal, nonpublic, confidential, or proprietary information of customers in the Company’s possession were to be mishandled or misused, we could suffer significant regulatory consequences, reputational damage, and financial loss. Such mishandling or misuse could include, for example, if such information were erroneously provided to parties who are not permitted to have the information, either by fault of the Company’s systems, employees or counterparties, or where such information is intercepted or otherwise inappropriately taken by third parties. The occurrence of any failures, interruptions, or security breaches of the Company’s information systems could damage the Company’s reputation, result in a loss of customer business, subject the Company to additional regulatory scrutiny, or expose the Company to civil litigation and possible financial liability, any of which could have a material adverse effect on the Company’s financial condition and results of operations.
18
The Potential for Business Interruption Exists Throughout the Company’s Organization
Integral to the Company’s performance is the continued efficacy of our technical systems, operational infrastructure, relationships with third parties and the vast array of associates and key executives in the Company’s day-to-day and ongoing operations. Failure by any or all of these resources subjects the Company to risks that may vary in size, scale and scope. This includes, but is not limited to, operational or technical failures, pandemics, ineffectiveness or exposure due to interruption in third party support as expected, as well as the loss of key individuals or failure on the part of key individuals to perform properly. The occurrence of any such event could have a material adverse effect on the Company’s business, which, in turn, could have a material adverse effect on its financial condition and results of operations.
Environmental Factors May Create Liability
In the course of its business, the Bank has acquired and may acquire in the future, property securing loans that are in default. There is a risk that the Bank could be required to investigate and clean-up hazardous or toxic substances or chemical releases at such properties after acquisition by the Bank in a foreclosure action, and that the Bank may be held liable to a governmental entity or third parties for property damage, personal injury and investigation and clean-up costs incurred by such parties in connection with such contamination. The Bank may in the future be required to perform an investigation or clean-up activities in connection with environmental claims. Ay such occurrence could have a material adverse effect on our business, financial condition, and results of operations.
Anti-Takeover Laws and Certain Agreements and Charter Provisions May Adversely Affect Share Value
Certain provisions of the Company’s certificate of incorporation and state and federal banking laws, including regulatory approval requirements, could make it more difficult for a third party to acquire control of the Company without approval of the Company’s board of directors. Under federal law, subject to certain exemptions, a person, entity or group must notify the FRB before acquiring control of a bank holding company. Acquisition of 10% or more of any class of voting stock of a bank holding company, including shares of the Company’s common stock, creates a rebuttable presumption that the acquiror “controls” the bank holding company. Also, a bank holding company must obtain the prior approval of the FRB before, among other things, acquiring direct or indirect ownership or control of more than 5% of the voting shares of any bank, including the Bank. There also are provisions in the Company’s certificate of incorporation that may be used to delay or block a takeover attempt. Taken as a whole, these statutory provisions and provisions in the Company’s certificate of incorporation could result in the Company being less attractive to a potential acquiror and thus could adversely affect the market price of the Company’s common stock.
Damage to the Company’s Reputation Could Adversely Impact our Business
The Company’s business reputation is important to its success. The ability to attract and retain customers, investors, employees and advisors may depend upon external perceptions of the Company. Damage to the Company’s reputation could cause significant harm to its business and prospects and may arise from numerous sources, including litigation or regulatory actions, failing to deliver minimum standards of service and quality, compliance failures, unethical behavior and the misconduct of employees, advisors and counterparties. Negative perceptions or publicity regarding these matters could damage the Company’s reputation among existing and potential customers, investors, employees and advisors. Adverse developments with respect to the financial services industry may also, by association, negatively impact the Company’s reputation or result in greater regulatory or legislative scrutiny or litigation against the Company. Preserving and enhancing the Company’s reputation also depends on maintaining systems and procedures that address known risks and regulatory requirements, as well as its ability to identify and mitigate additional risks that arise due to changes in businesses and the marketplaces in which the Company operates, the regulatory environment and client expectations. If any of these developments has a material effect on the Company’s reputation, its business could suffer.
Item 1B.UNRESOLVED STAFF COMMENTS
None.
19
At December 31, 2017, the Bank conducted its business from its administrative office and 14 branch offices. The Bank’s administrative office is located at One Grimsby Drive in Hamburg, NY. The administrative office facility is 26,000 square feet and is owned by the Bank. This facility is occupied by the Office of the President and Chief Executive Officer of the Company, as well as the Administrative and Loan Divisions of the Bank. The Bank also owns a building on Sunset Drive in Hamburg, NY that houses its Operations Center.
The Bank has 14 branch locations. The Bank owns the building and land for five locations. Of the remaining branch locations, eight are leased by the Bank and one is leased by TEA.
TEA operates from a 10,000 square foot office located at 6834 Erie Road, Derby, NY, which is owned by the Bank. TEA has 7 retail locations. TEA leases one of the locations. The Bank owns three of the locations, the Bank leases two of the locations, and TEA owns the remaining building.
The nature of the Company’s business generates a certain amount of litigation involving matters arising in the ordinary course of business.
In the opinion of management, there are no proceedings pending to which the Company is a party or to which its property is subject, which, if determined adversely, would have a material effect on the Company’s financial statements.
Item 4.MINE SAFETY DISCLOSURES
Not applicable.
20
Item 5.MARKET FOR REGISTRANT’S COMMON EQUITY, RELATED
STOCKHOLDER MATTERS AND ISSUER PURCHASES OF EQUITY SECURITIES
Market Information. The Company’s common stock is listed on the NYSE American under the symbol EVBN.
The following table shows, for the periods indicated, the high and low sales prices per share of the Company’s common stock for fiscal 2017 and 2016 as reported on the NYSE American.
|
|
||||||||||||
|
|
2017 |
2016 |
||||||||||
|
QUARTER |
High |
Low |
High |
Low |
||||||||
|
FIRST |
$ |
40.95 |
$ |
32.00 |
$ |
26.10 |
$ |
23.55 | ||||
|
SECOND |
$ |
42.58 |
$ |
35.10 |
$ |
25.48 |
$ |
22.87 | ||||
|
THIRD |
$ |
47.08 |
$ |
37.80 |
$ |
27.87 |
$ |
24.41 | ||||
|
FOURTH |
$ |
45.60 |
$ |
40.01 |
$ |
37.67 |
$ |
25.90 | ||||
Holders. The approximate number of holders of record of the Company’s common stock as of February 26, 2018 was 1,195.
Cash Dividends. The Company paid the following cash dividends on shares of the Company’s common stock during 2017 and 2016:
|
· |
A cash dividend of $0.40 per share on October 3, 2017 to shareholders of record on September 12, 2017. |
|
· |
A cash dividend of $0.40 per share on April 4, 2017 to shareholders of record on March 14, 2017. |
|
· |
A cash dividend of $0.38 per share on October 4, 2016 to shareholders of record on September 13, 2016. |
|
· |
A cash dividend of $0.38 per share on April 5, 2016 to shareholders of record on March 15, 2016. |
The amount and type (cash or stock), if any, of future dividends will be determined by the Company’s Board of Directors and will depend upon the Company’s earnings, financial conditions and other factors considered by the Board of Directors to be relevant. The Bank pays a dividend to the Company to provide funds for: debt service on the junior subordinated debentures, a portion of the proceeds of which were contributed to the Bank as capital; dividends the Company pays; treasury stock repurchases; and other Company expenses. As discussed above under “Item 1A. Risk Factors,” the Company is dependent upon cash flow from its subsidiaries in order to fund its dividend payments. There are various legal limitations with respect to the Bank’s ability to supply funds to the Company. In particular, under Federal banking law, the approval of the FRB and OCC may be required in certain circumstances, prior to the payment of dividends by the Company or the Bank. As of December 31, 2017, approximately $13 million was available for the payment of dividends without prior OCC approval. See Note 20 to the Company’s Consolidated Financial Statements included in Part II, Item 8 of this Annual Report on Form 10-K for additional information concerning contractual and regulatory restrictions on the payment of dividends.
21
PERFORMANCE GRAPH
The following Performance Graph compares the Company's cumulative total stockholder return on its common stock for a five-year period (December 31, 2012 to December 31, 2017) with the cumulative total return of the NYSE American Composite Index and NASDAQ Bank Index. The comparison for each of the periods assumes that $100 was invested on December 31, 2012 in each of the Company's common stock and the stocks included in the NYSE American Composite Index and NASDAQ Bank Index and that all dividends were reinvested without commissions. This table does not forecast future performance of the Company's stock.
Compare 5-Year Cumulative Total Return Among
Evans Bancorp, Inc.,
NYSE American Composite Index and NASDAQ Bank Index
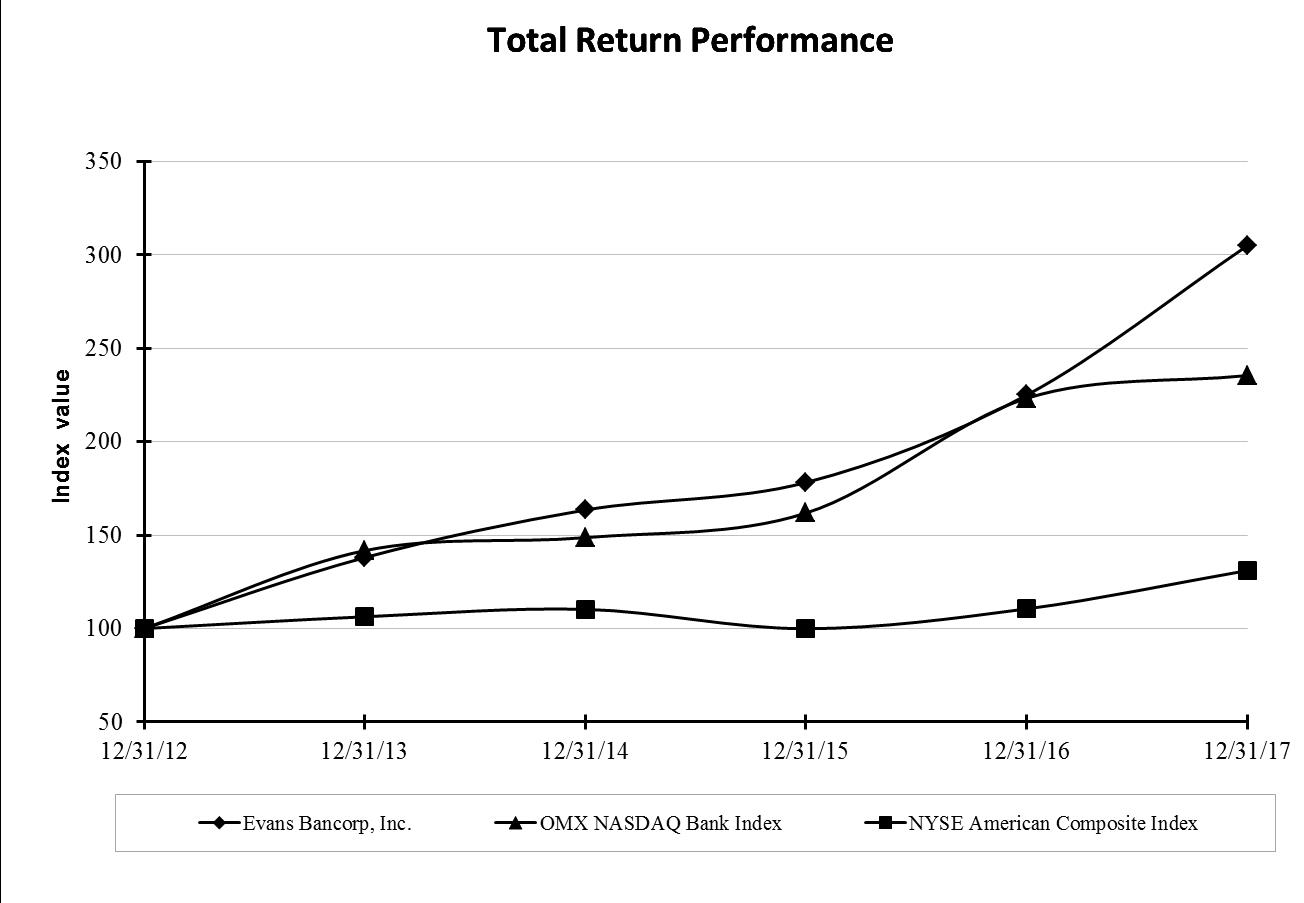
|
|
||||||
|
|
||||||
|
Index |
12/31/12 |
12/31/13 |
12/31/14 |
12/31/15 |
12/31/16 |
12/31/17 |
|
Evans Bancorp, Inc. |
100.00 | 138.01 | 163.49 | 178.22 | 225.02 | 304.99 |
|
NASDAQ Bank |
100.00 | 141.72 | 148.69 | 161.84 | 223.29 | 235.48 |
|
NYSE American - Composite Index |
100.00 | 106.29 | 110.29 | 99.91 | 110.54 | 131.05 |
In accordance with and to the extent permitted by applicable law or regulation, the information set forth above under the heading "Performance Graph" shall not be deemed to be "soliciting material" or to be "filed" with the SEC under the Securities Act or the Exchange Act, or subject to the liabilities of Section 18 of the Exchange Act, except to the extent that we specifically request that such information be treated as soliciting material or specifically incorporate it by reference into such a filing.
22
Purchases of Equity Securities by the Issuer and Affiliated Purchasers.
Issuer Purchases of Equity Securities
|
|
||||||||||
|
Period |
Total Number of Shares Purchased (1) |
Average Price Paid per Share |
Total Number of Shares Purchased as Part of Publicly Announced Plans or Programs (2) |
Maximum Number of Shares that may yet be Purchased Under the Plans or Programs |
||||||
|
October 2017: |
||||||||||
|
October 1, 2017 - October 31, 2017 |
- |
$ |
- |
- |
100,000 | |||||
|
November 2017: |
||||||||||
|
November 1, 2017 - November 30, 2017 |
- |
$ |
- |
- |
100,000 | |||||
|
December 2017: |
||||||||||
|
December 1, 2017 - December 30, 2017 |
- |
$ |
- |
- |
100,000 | |||||
|
|
||||||||||
|
Total: |
- |
$ |
- |
- |
100,000 | |||||
|
(1) |
On October 17, 2017, the Board of Directors authorized the Company to repurchase up to 100,000 shares of the Company’s common stock (the “2017 Repurchases Program”). The 2017 Repurchase Program expires 24 months after its adoption and may be suspended or discontinued by the Board of Directors at any time. The maximum number of shares that may be purchased under the 2017 Repurchase Program as of December 31, 2017 was 100,000. The 2017 Repurchase Program replaces the repurchase program previously approved by the Board of Directors on March 25, 2013, which the Board of Directors elected to terminate in connection with the approval of the 2017 Repurchase Program. |
23
Item 6.SELECTED FINANCIAL DATA
|
|
||||||||||||||||||||
|
|
||||||||||||||||||||
|
|
||||||||||||||||||||
|
|
As of and for the year ended December 31, |
|||||||||||||||||||
|
|
2017 |
2016 |
2015 |
2014 |
2013 |
|||||||||||||||
|
|
(in thousands, except for per share data) |
|||||||||||||||||||
|
Balance Sheet Data |
||||||||||||||||||||
|
Assets |
$ |
1,295,633 |
$ |
1,100,709 |
$ |
939,107 |
$ |
846,809 |
$ |
833,498 | ||||||||||
|
Interest-earning assets |
1,214,806 | 1,030,113 | 873,450 | 785,302 | 767,629 | |||||||||||||||
|
Investment securities |
149,152 | 97,205 | 98,758 | 97,132 | 102,049 | |||||||||||||||
|
Loans and leases, net |
1,051,296 | 928,596 | 761,101 | 683,131 | 635,493 | |||||||||||||||
|
Deposits |
1,051,229 | 939,974 | 802,982 | 707,635 | 706,612 | |||||||||||||||
|
Borrowings |
108,869 | 49,689 | 32,151 | 38,808 | 33,681 | |||||||||||||||
|
Stockholders' equity |
118,342 | 96,748 | 91,256 | 85,788 | 80,712 | |||||||||||||||
|
|
||||||||||||||||||||
|
Income Statement Data |
||||||||||||||||||||
|
Net interest income |
$ |
42,017 |
$ |
35,248 |
$ |
31,804 |
$ |
31,099 |
$ |
28,347 | ||||||||||
|
Non-interest income |
13,003 | 11,252 | 13,720 | 10,273 | 12,161 | |||||||||||||||
|
Non-interest expense |
38,594 | 35,096 | 32,698 | 31,252 | 29,380 | |||||||||||||||
|
Net income |
10,479 | 8,272 | 7,843 | 8,187 | 7,857 | |||||||||||||||
|
|
||||||||||||||||||||
|
Per Share Data |
||||||||||||||||||||
|
Earnings per share - basic |
$ |
2.21 |
$ |
1.93 |
$ |
1.85 |
$ |
1.96 |
$ |
1.88 | ||||||||||
|
Earnings per share - diluted |
2.16 | 1.90 | 1.82 | 1.92 | 1.85 | |||||||||||||||
|
Cash dividends |
0.80 | 0.76 | 0.72 | 0.65 | 0.26 | |||||||||||||||
|
Book value |
24.74 | 22.50 | 21.44 | 20.41 | 19.21 | |||||||||||||||
|
|
||||||||||||||||||||
|
Performance Ratios |
||||||||||||||||||||
|
Return on average assets |
0.89 |
% |
0.80 |
% |
0.87 |
% |
0.98 |
% |
0.96 |
% |
||||||||||
|
Return on average equity |
9.11 |
% |
8.74 |
% |
8.82 |
% |
9.84 |
% |
10.06 |
% |
||||||||||
|
Net interest margin |
3.80 |
% |
3.67 |
% |
3.80 |
% |
4.01 |
% |
3.74 |
% |
||||||||||
|
Efficiency ratio * |
68.50 |
% |
74.03 |
% |
71.83 |
% |
70.83 |
% |
71.98 |
% |
||||||||||
|
Dividend payout ratio |
36.20 |
% |
39.38 |
% |
38.92 |
% |
33.16 |
% |
13.83 |
% |
||||||||||
|
|
||||||||||||||||||||
|
Capital Ratios |
||||||||||||||||||||
|
Tier 1 capital to average assets |
10.06 |
% |
9.49 |
% |
10.45 |
% |
10.84 |
% |
10.36 |
% |
||||||||||
|
Equity to assets |
9.13 |
% |
8.79 |
% |
9.72 |
% |
10.13 |
% |
9.68 |
% |
||||||||||
|
|
||||||||||||||||||||
|
Asset Quality Ratios |
||||||||||||||||||||
|
Total non-performing assets to |
||||||||||||||||||||
|
total assets |
1.06 |
% |
1.09 |
% |
1.71 |
% |
1.25 |
% |
1.65 |
% |
||||||||||
|
Total non-performing loans and |
||||||||||||||||||||
|
leases to total loans and leases |
1.29 |
% |
1.28 |
% |
2.07 |
% |
1.52 |
% |
2.12 |
% |
||||||||||
|
Net charge-offs (recoveries) to |
||||||||||||||||||||
|
average loans and leases |
0.07 |
% |
0.02 |
% |
0.12 |
% |
0.03 |
% |
(0.04) |
% |
||||||||||
|
Allowance for loan and lease losses |
||||||||||||||||||||
|
to total loans and leases |
1.32 |
% |
1.48 |
% |
1.66 |
% |
1.80 |
% |
1.78 |
% |
||||||||||
* The calculation of the efficiency ratio excludes amortization of intangibles and gains and losses on tax credit investments.
See Item 7, “Management’s Discussion and Analysis of Financial Condition and Results of Operations,” and Item 8, “Consolidated Financial Statements and Supplementary Data,” of this Report on Form 10-K for further information and analysis of changes in the Company's financial condition and results of operations.
24
Item 7.MANAGEMENT’S DISCUSSION AND ANALYSIS OF FINANCIAL CONDITION AND RESULTS OF OPERATIONS
OVERVIEW
This discussion is intended to compare the performance of the Company for the years ended December 31, 2017, 2016 and 2015. The review of the information presented should be read in conjunction with Part I, Item 1: “Business” and Part II, Item 6: “Selected Financial Data” and Item 8: “Financial Statements and Supplementary Data” of this Annual Report on Form 10-K.
The Company is a financial holding company registered under the BHCA. The Company currently conducts its business through its two direct wholly-owned subsidiaries: the Bank, and the Bank’s subsidiaries, ENL and ENHC; and ENFS and its subsidiary, TEA. The Company does not engage in any other substantial business. Unless the context otherwise requires, the term “Company” refers collectively to Evans Bancorp, Inc. and its subsidiaries.
Summary
Net income in 2017 was $10.5 million, a 27% increase from 2016 net income of $8.3 million, and 34% higher than 2015 net income of $7.8 million. The results include the impact of the TCJA, which was signed into law in December 2017, and the Company’s investment in HRTC investments. The TCJA lowered the federal corporate income tax rate from 35% to 21% starting in 2018. As a result, the Company’s deferred tax deductions have less value. When the deferred tax asset was remeasured, the impact was additional tax expense for 2017 of $2.1 million.
To provide investors with greater visibility of the Company’s operating results, in addition to the results measured in accordance with U.S. generally accepted accounting principles (“GAAP”), the Company is presenting its results in the following table excluding the impact of the TCJA and the Company’s HRTC investment activity. Management views the TCJA as a non-recurring item while the GAAP presentation of the historic tax credit impact is complicated for users to follow. This non-GAAP information is being disclosed because management believes that presenting these non-GAAP financial measures provides investors with information useful in understanding the Company’s financial performance, its performance trends, and financial position. While the Company’s management uses these non-GAAP measures in its analysis of the Company’s performance, this information should not be viewed as a substitute for financial results determined in accordance with GAAP or considered to be more important than financial results determined in accordance with GAAP, nor is it necessarily comparable with non-GAAP measures which may be presented by other companies. See the reconciliation of non-GAAP to GAAP measures in the following table:
25
|
|
|||||||
|
GAAP to Non-GAAP Reconciliation |
|||||||
|
|
|||||||
|
GAAP |
|||||||
|
($ in thousands, except per share data) |
2017 |
2016 |
2015 |
||||
|
|
|||||||
|
Net Interest Income After Provision |
$ |
41,279 | 34,039 | 30,588 | |||
|
Non-Interest Income |
13,003 | 11,252 | 13,720 | ||||
|
Non-Interest Expenses |
38,594 | 35,096 | 32,698 | ||||
|
Income Before Taxes |
15,688 | 10,195 | 11,610 | ||||
|
Income Taxes |
5,209 | 1,923 | 3,767 | ||||
|
Net Income |
$ |
10,479 | 8,272 | 7,843 | |||
|
|
|||||||
|
Effective Tax Rate |
33.2% | 18.9% | 32.4% | ||||
|
|
|||||||
|
Non-GAAP |
|||||||
|
|
2017 |
2016 |
2015 |
||||
|
|
|||||||
|
Net Interest Income After Provision |
$ |
41,279 | 34,039 | 30,588 | |||
|
Non-Interest Income (excluding HRTC impact) |
14,157 | 12,157 | 13,720 | ||||
|
Non-Interest Expenses |
38,594 | 35,096 | 32,698 | ||||
|
Income Before Taxes (excluding HRTC impact) |
16,842 | 11,100 | 11,610 | ||||
|
|
|||||||
|
HRTC impact presented in non-interest income |
(1,154) | (905) |
- |
||||
|
Other Non-interest Income |
14,157 | 12,157 | 13,720 | ||||
|
Total Non-Interest Income |
13,003 | 11,252 | 13,720 | ||||
|
|
|||||||
|
HRTC impact presented in Income Taxes |
(1,869) | (1,413) |
- |
||||
|
Deferred Tax Asset remeasurement due to TCJA |
2,074 |
- |
- |
||||
|
Income Taxes (excluding HRTC and TCJA impact) |
5,004 | 3,336 | 3,767 | ||||
|
Total Income Taxes |
5,209 | 1,923 | 3,767 | ||||
|
|
|||||||
|
Net Income |
$ |
10,479 | 8,272 | 7,843 | |||
|
|
|||||||
|
Non-GAAP Effective Tax Rate (excluding HRTC and TCJA impact) |
29.7% | 30.1% | 32.4% | ||||
|
|
|||||||
|
Net Income |
10,479 | 8,272 | 7,843 | ||||
|
TCJA Impact |
2,074 |
- |
- |
||||
|
Net Income excluding TCJA Impact |
12,553 | 8,272 | 7,843 | ||||
|
|
|||||||
|
Weighted average number of diluted shares |
4,860,828 | 4,358,517 | 4,307,368 | ||||
|
|
|||||||
|
Per diluted common share: |
|||||||
|
Net income |
$ |
2.16 | 1.90 | 1.82 | |||
|
TCJA impact |
0.43 |
- |
- |
||||
|
Net Income excluding TCJA Impact |
2.59 | 1.90 | 1.82 | ||||
The primary driver of the increase in the Company’s net income during 2017 was the higher net interest income resulting from the Company’s significant loan growth since 2015 and the net interest margin expansion in 2017. Net interest income was $42.0 million in 2017, a 19% increase from 2016 and 32% higher than 2015. Average loans grew from $705 million in 2015 to $962 million in 2017 while net interest margin increased to 3.80% in 2017 from 3.67% in the previous year.
The increase in net interest income in 2017 when compared with 2016 and 2015 was partially offset by increases in non-interest expenses due to an investment in talent in the form of salaries and benefits expenses for new and existing employees, that management believes is critical to the Company’s growth strategy. Salaries and benefits expense, the largest component of non-interest expenses, increased 10% and 9% in 2017 and 2016, respectively when compared with the preceding years. The Company has also made a significant investment in technology, including new core banking and online banking systems, resulting in increases in technology expenses of $0.9 million in 2017 when compared with 2015.
26
The largest component of the Company’s non-interest income, insurance service revenue, rebounded to $7.9 million in 2017 after a decrease to $6.5 million in 2016 from $7.2 million in 2015, with various business lines including employee benefits and commercial property and casualty insurance commissions experiencing strong revenue growth.
Provision for loan losses declined to $0.7 million in 2017 after two consecutive years at $1.2 million after the Company had significant improvement in criticized loan levels and a restructuring and paydown of its largest nonperforming loan.
Strategy
The Company’s goal is to continue to increase market share and achieve scale while improving profitability and returning value to shareholders. The Company’s biggest strength and earnings driver is commercial and small business lending. The Company expects to continue to focus on building on this competitive advantage by adding personnel in this area. Management has also bolstered its biggest driver of non-interest income, The Evans Agency, through both agency and talent acquisition as well as building out its employee benefits and financial services businesses. In addition, management intends to continue to develop strategies to deepen existing customer relationships with tailored product sets that reward the Company’s most loyal customers.
The Company’s strategies are designed to direct tactical investment decisions supporting its financial objectives. While the Company intends to focus its efforts on the pursuit of these strategies, there can be no assurance that the Company will successfully implement these strategies or that the strategies will produce the desired results. The Company’s most significant revenue source continues to be net interest income, defined as total interest income less interest expense. Net interest income accounted for 76% of total revenue in 2017. To produce net interest income and consistent earnings growth over the long-term, the Company must generate loan and deposit growth at acceptable margins within its market area. To generate and grow loans and deposits, the Company must focus on a number of areas including, but not limited to, sales practices, customer and employee satisfaction and retention, competition, evolving customer behavior, technology, product innovation, interest rates, credit performance of its customers and vendor relationships.
The Company also considers non-interest income important to its continued financial success. Fee income generation is partly related to the Company’s loan and deposit operations, such as deposit service charges, as well as to its financial products, such as commercial and personal insurance sold through TEA. Improved performance in non-interest income can help increase capital ratios because most of the non-interest income is generated without recording assets on the balance sheet. The Company has and will continue to face challenges in increasing its non-interest income as the regulatory environment changes.
The Company has focused its efforts on targeted groups in its community such as (1) smaller businesses with smaller credit needs but rich in deposits and other service needs; (2) middle market commercial businesses; (3) commercial real estate lending; and (4) retail customers. In 2017, the Company expanded its targeted groups to include municipal customers. The overarching goal is to cross-sell between our insurance, financial services and banking lines of business to deepen our relationships with all of our customers. The Company believes that these efforts resulted in strong growth in the commercial loan portfolio, core deposits, and insurance agency revenue during fiscal 2017.
The Company strives to provide a personal touch to customer service and is committed to maintaining a local, community-based philosophy. The Bank has emphasized hiring local branch and lending personnel with strong ties to the specific local communities it serves.
The Bank serves its market through 14 banking offices in Western New York. The Company’s principal source of funding is through deposits, which it reinvests in the community in the form of loans and investments. Deposits are insured up to the maximum permitted by the Deposit Insurance Fund of the FDIC. The Bank is regulated by the OCC.
APPLICATION OF CRITICAL ACCOUNTING ESTIMATES
The Company’s Consolidated Financial Statements are prepared in accordance with U.S. generally accepted accounting principles (“GAAP”) and follow general practices within the industries in which it operates. Application of these principles requires management to make estimates, assumptions and judgments that affect the amounts reported in the Company’s Consolidated Financial Statements and Notes. These estimates, assumptions and judgments are based on information available as of the date of the Consolidated Financial Statements. Accordingly, as this information changes, the Consolidated Financial Statements could reflect different estimates, assumptions and judgments. Certain policies inherently have a greater reliance on the use of estimates, assumptions and judgments, and as such, have a greater possibility of producing results that could be materially different than originally reported.
The most significant accounting policies followed by the Company are presented in Note 1 to the Consolidated Financial Statements included in Item 8 of this Annual Report on Form 10-K. These policies, along with the disclosures presented in the other Notes to the Company's Consolidated Financial Statements contained in this Annual Report on Form 10-K and in this financial review, provide information on how significant assets and liabilities are valued in the Company’s Consolidated Financial Statements and how those values are determined.
27
Estimates, assumptions and judgments are necessary when assets and liabilities are required to be recorded at fair value, when a decline in the value of an asset not carried on the financial statements at fair value warrants an impairment write-down or valuation reserve to be established, or when an asset or liability needs to be recorded contingent upon a future event. Carrying assets and liabilities at fair value inherently results in more financial statement volatility. The fair values and the information used to record valuation adjustments for certain assets and liabilities are based either on quoted market prices or are provided by other third-party sources, when available. When third-party information is not available, valuation adjustments are estimated in good faith by management primarily through the use of internal cash flow modeling techniques.
Based on the valuation techniques used and the sensitivity of financial statement amounts to the methods, assumptions and estimates underlying those amounts, management has identified the determination of the allowance for loan losses and valuation of goodwill to be the accounting areas that require the most subjective or complex judgments, and as such, could be most subject to revision as new information becomes available.
Allowance for Loan Losses
The allowance for loan losses represents management’s estimate of probable losses in the Bank’s loan portfolio. Determining the amount of the allowance for loan losses is considered a critical accounting estimate because it requires significant judgment on the part of management and the use of estimates related to the amount and timing of expected future cash flows on impaired loans, estimated losses on pools of homogeneous loans based on historical loss experience and consideration of current economic trends and conditions, all of which may be susceptible to significant change. The loan portfolio also represents the largest asset type on the Company’s consolidated balance sheets.
Management methodology and policy in determining the allowance for loan losses can be found in Note 1 to the Consolidated Financial Statements included in Item 8 of this Annual Report on Form 10-K. The activity in the allowance for loan losses is depicted in supporting tables in Note 3 to the Consolidated Financial Statements included in Item 8 of this Annual Report on Form 10-K
Goodwill and Intangible Assets
The amount of goodwill reflected in the Company’s Consolidated Financial Statements is required to be tested by management for impairment on at least an annual basis. The test for impairment of goodwill in an identified reporting unit is considered a critical accounting estimate because it requires judgment on the part of management and the use of estimates related to the growth assumptions and market multiples used in the valuation model. As of December 31, 2017, TEA had $8.1 million in goodwill. The banking reporting unit does not have any goodwill. All of the goodwill at TEA stems from the acquisition of various insurances agencies, not the purchase of diverse companies in which goodwill was subjectively allocated to different reporting units. Therefore, total market capitalization reconciliation was not performed because not all of the reporting units had goodwill.
Management valued TEA, the reporting unit with goodwill, using cash flow modeling and earnings multiple techniques. When using the cash flow models, management considered historical information, the operating budget for 2018, economic and insurance market cycles, and strategic goals in projecting net income and cash flows for the next five years. The fair value calculated substantially exceeded the book value of TEA. The value based on a multiple to earnings before interest, taxes, depreciation, and amortization (“EBITDA”) was higher than the value calculated using cash flow modeling, a result of conservative growth assumptions used by the Company in the cash flow model as well as an implied control premium in the multiple. The multiple used was based on industry data and consistent with the previous year’s assumption.
Fair values determined in the impairment tests were substantially higher than the carrying value for TEA. Management used growth rates that are achievable over the long run through both soft and hard insurance cycles. After a decline in TEA’s revenue in 2016 that was largely attributable to its insurance claims business and profit sharing revenue, revenue in 2017 rebounded to $7.5 million in 2017, a 22% growth rate. TEA’s largest revenue source, its commercial insurance commissions, experienced strong growth in 2017 while profit sharing revenue and insurance claims rebounded to more normal historical levels. TEA significantly increased the size of its employee benefits sales and administrative team which resulted in more than doubling employee benefits revenue. Personal lines revenue growth was also solid after two small agency acquisitions in the past year.
For further discussion of the Company’s accounting for goodwill and other intangible assets, see Note 1 to the Consolidated Financial Statements included in Item 8 of this Annual Report on Form 10-K.
28
RESULTS OF OPERATIONS FOR THE YEARS ENDED DECEMBER 31, 2017 AND DECEMBER 31, 2016
Net Income
Net income of $10.5 million in 2017 consisted of $9.6 million related to the Company’s banking activities and $0.9 million related to the Company’s insurance agency activities. The total net income of $10.5 million was a 27% increase from $8.3 million in 2016. Earnings per diluted share for 2017 of $2.16 were 14% higher than the earnings per diluted share of $1.90 for 2016. Excluding the impact of the $2.1 million deferred tax asset expense related to the remeasurement due to the TCJA, 2017 net income was $12.6 million, or $2.59 per diluted share, which is 36% higher than 2016. See the “Summary” section included above in this Management’s Discussion and Analysis of Results of Operations and Financial Condition for a reconciliation of the effective tax rates excluding the impact of the TCJA, which is a non-GAAP financial measure, to the most directly comparable GAAP measure.
Net Interest Income
Net interest income, the difference between interest income and fee income on earning assets, such as loans and securities, and interest expense on deposits and borrowings, provides the primary basis for the Company’s results of operations.
Net interest income is dependent on the amounts and yields earned on interest earning assets as compared to the amounts of and rates paid on interest bearing liabilities.
29
AVERAGE BALANCE SHEET INFORMATION
The following table presents the significant categories of the assets and liabilities of the Company, interest income and interest expense, and the corresponding yields earned and rates paid in 2017, 2016, and 2015. The assets and liabilities are presented as daily averages. The average loan balances include both performing and non-performing loans. Interest income on loans does not include interest on loans for which the Bank has ceased to accrue interest. Available-for-sale securities are stated at fair value. Interest and yield are not presented on a tax-equivalent basis.
|
|
|||||||||||||||||||||||||||
|
|
2017 |
2016 |
2015 |
||||||||||||||||||||||||
|
|
Average |
Interest |
Average |
Interest |
Average |
Interest |
|||||||||||||||||||||
|
|
Outstanding |
Earned/ |
Yield/ |
Outstanding |
Earned/ |
Yield/ |
Outstanding |
Earned/ |
Yield/ |
||||||||||||||||||
|
|
Balance |
Paid |
Rate |
Balance |
Paid |
Rate |
Balance |
Paid |
Rate |
||||||||||||||||||
|
|
(in thousands) |
(in thousands) |
(in thousands) |
||||||||||||||||||||||||
|
ASSETS |
|||||||||||||||||||||||||||
|
Interest-earning assets: |
|||||||||||||||||||||||||||
|
Loans, net |
$ |
961,876 |
$ |
44,379 | 4.61 |
% |
$ |
841,443 |
$ |
37,330 | 4.44 |
% |
$ |
705,404 |
$ |
32,638 | 4.63 |
% |
|||||||||
|
Taxable securities |
100,836 | 2,466 | 2.45 |
% |
71,000 | 1,652 | 2.33 |
% |
68,156 | 1,935 | 2.84 |
% |
|||||||||||||||
|
Tax-exempt securities |
35,128 | 837 | 2.38 |
% |
38,014 | 926 | 2.44 |
% |
37,076 | 991 | 2.67 |
% |
|||||||||||||||
|
Interest bearing deposits at banks |
6,699 | 66 | 0.99 |
% |
9,333 | 47 | 0.50 |
% |
26,170 | 64 | 0.24 |
% |
|||||||||||||||
|
|
- |
||||||||||||||||||||||||||
|
Total interest-earning assets |
1,104,539 |
$ |
47,748 | 4.32 |
% |
959,790 |
$ |
39,955 | 4.16 |
% |
836,806 |
$ |
35,628 | 4.26 |
% |
||||||||||||
|
|
|||||||||||||||||||||||||||
|
Non interest-earning assets: |
|||||||||||||||||||||||||||
|
Cash and due from banks |
13,545 | 13,157 | 12,591 | ||||||||||||||||||||||||
|
Premises and equipment, net |
10,957 | 11,350 | 10,448 | ||||||||||||||||||||||||
|
Other assets |
49,055 | 43,671 | 42,211 | ||||||||||||||||||||||||
|
|
|||||||||||||||||||||||||||
|
Total Assets |
$ |
1,178,096 |
$ |
1,027,968 |
$ |
902,056 | |||||||||||||||||||||
|
|
|||||||||||||||||||||||||||
|
LIABILITIES & STOCKHOLDERS' EQUITY |
|||||||||||||||||||||||||||
|
Interest-bearing liabilities: |
|||||||||||||||||||||||||||
|
NOW |
$ |
93,881 |
$ |
206 | 0.22 |
% |
$ |
87,215 |
$ |
262 | 0.30 |
% |
$ |
78,801 |
$ |
322 | 0.41 |
% |
|||||||||
|
Regular savings |
536,862 | 2,593 | 0.48 |
% |
478,252 | 2,318 | 0.48 |
% |
418,020 | 1,591 | 0.38 |
% |
|||||||||||||||
|
Time deposits |
160,440 | 2,088 | 1.30 |
% |
117,682 | 1,460 | 1.24 |
% |
102,711 | 1,426 | 1.39 |
% |
|||||||||||||||
|
Other borrowed funds |
26,491 | 397 | 1.50 |
% |
26,011 | 270 | 1.04 |
% |
9,655 | 136 | 1.41 |
% |
|||||||||||||||
|
Junior subordinated debentures |
11,327 | 426 | 3.76 |
% |
11,330 | 372 | 3.28 |
% |
11,330 | 327 | 2.89 |
% |
|||||||||||||||
|
Securities sold U/A to repurchase |
10,703 | 21 | 0.20 |
% |
12,884 | 25 | 0.19 |
% |
11,495 | 22 | 0.19 |
% |
|||||||||||||||
|
|
|||||||||||||||||||||||||||
|
Total interest-bearing liabilities |
839,704 |
$ |
5,731 | 0.68 |
% |
733,374 |
$ |
4,707 | 0.64 |
% |
632,012 |
$ |
3,824 | 0.61 |
% |
||||||||||||
|
|
|||||||||||||||||||||||||||
|
Noninterest-bearing liabilities: |
|||||||||||||||||||||||||||
|
Demand deposits |
208,898 | 185,029 | 166,611 | ||||||||||||||||||||||||
|
Other |
14,512 | 14,942 | 14,529 | ||||||||||||||||||||||||
|
Total liabilities |
$ |
1,063,114 |
$ |
933,345 |
$ |
813,152 | |||||||||||||||||||||
|
|
|||||||||||||||||||||||||||
|
Stockholders' equity |
114,982 | 94,623 | 88,904 | ||||||||||||||||||||||||
|
|
|||||||||||||||||||||||||||
|
Total Liabilities and Equity |
$ |
1,178,096 |
$ |
1,027,968 |
$ |
902,056 | |||||||||||||||||||||
|
|
|||||||||||||||||||||||||||
|
Net interest earnings |
$ |
42,017 |
$ |
35,248 |
$ |
31,804 | |||||||||||||||||||||
|
Net interest margin |
3.80 |
% |
3.67 |
% |
3.80 |
% |
|||||||||||||||||||||
|
Interest rate spread |
3.64 |
% |
3.52 |
% |
3.65 |
% |
|||||||||||||||||||||
30
The following table segregates changes in interest earned and paid for the past two years into amounts attributable to changes in volume and changes in rates by major categories of assets and liabilities. The change in interest income and expense due to both volume and rate has been allocated in the table to volume and rate changes in proportion to the relationship of the absolute dollar amounts of the change in each.
|
|
||||||||||||||||||
|
|
||||||||||||||||||
|
|
2017 Compared to 2016 |
2016 Compared to 2015 |
||||||||||||||||
|
|
Increase (Decrease) Due to |
Increase (Decrease) Due to |
||||||||||||||||
|
|
(in thousands) |
|||||||||||||||||
|
|
Volume |
Rate |
Total |
Volume |
Rate |
Total |
||||||||||||
|
|
||||||||||||||||||
|
Interest earned on: |
||||||||||||||||||
|
Loans |
$ |
5,510 |
$ |
1,539 |
$ |
7,049 |
$ |
6,081 |
$ |
(1,389) |
$ |
4,692 | ||||||
|
Taxable securities |
726 | 88 | 814 | 78 | (361) | (283) | ||||||||||||
|
Tax-exempt securities |
(69) | (20) | (89) | 25 | (90) | (65) | ||||||||||||
|
Interest-bearing deposits at banks |
(16) | 35 | 19 | (58) | 41 | (17) | ||||||||||||
|
Total interest-earning assets |
$ |
6,151 |
$ |
1,642 |
$ |
7,793 |
$ |
6,126 |
$ |
(1,799) |
$ |
4,327 | ||||||
|
|
||||||||||||||||||
|
Interest paid on: |
||||||||||||||||||
|
NOW accounts |
$ |
19 |
$ |
(75) |
$ |
(56) |
$ |
32 |
$ |
(92) |
$ |
(60) | ||||||
|
Savings deposits |
283 | (8) | 275 | 251 | 476 | 727 | ||||||||||||
|
Time deposits |
553 | 75 | 628 | 195 | (161) | 34 | ||||||||||||
|
Other borrowed funds |
(23) | 200 | 177 | 241 | (59) | 182 | ||||||||||||
|
Total interest-bearing liabilities |
$ |
832 |
$ |
192 |
$ |
1,024 |
$ |
719 |
$ |
164 |
$ |
883 | ||||||
Net interest income increased by $6.8 million, or 19%, to $42.0 million in 2017 from $35.2 million in 2016. As indicated in the preceding table, this increase primarily resulted from increased loan volume and higher loan yields, partially offset by increased time and savings deposits balances and higher time deposit and borrowings rates. Overall, the increased volume of interest-earning assets and interest-bearing liabilities positively impacted net interest income by $5.3 million, while the rates earned and paid on those respective assets and liabilities had a positive impact of $1.5 million.
The Company has invested in adding to its commercial loan portfolio significantly in the past several years by adding several commercial loan officers while existing loan officers have increased production. The total commercial loan portfolio average balance, including commercial real estate and C&I loans, increased $101 million, or 15%, from a $679 million average balance in 2016 to a $780 million average balance in 2017. Consumer loans, including residential mortgages and home equity lines of credit, increased 11% from a $175 million average balance in 2016 to a $195 million average balance in 2017.
On the funding side, the Company’s primary growth vehicles shifted from retail savings deposits to municipal savings deposits and retail time deposits. Growth in commercial demand deposit products continues to be strong and reflects the Company’s increasing C&I loan production which often includes demand deposits from the borrower. Average demand deposits grew $24 million, or 13%, to $209 million in 2017. The $24 million in growth included $16 million in commercial deposits, $5 million in retail deposits, and $3 million in municipal deposits. Total average deposits increased $132 million, or 15%, year over year to $1.0 billion in 2017. With the FRB raising the target overnight rate for federal funds 100 basis points since December 2016, short-term interest rates rose sharply during 2017. Given the significant size of its savings deposit portfolio, the Company maintained pricing discipline on savings deposits to prevent re-pricing the portfolio and increasing funding costs. As a result, consumers shifted to time deposits to earn a higher yield even if it fixed their rate for a period of time. This dynamic resulted in higher time deposit growth and lower savings deposit growth in 2017 compared with 2016. Average retail savings deposits grew $26 million, or 7%, in 2017, compared with $64 million, or 22%, in 2016. By comparison, average time deposits increased $43 million, or 36%, in 2017, compared with $15 million, or 15%, in 2016. Management compensated for the slowdown in retail savings deposit growth with a renewed focus on its government banking program by hiring additional personnel to enhance the Bank’s ability to provide services in this area. This investment resulted in $29 million, or 80%, growth in average municipal savings deposits to $66 million in 2017, compared with $3 million, or 10%, growth in the previous year.
31
Net interest spread, or the difference between yield on interest-earning assets and rate on interest-bearing liabilities, increased from 3.52% in 2016 to 3.64% in 2017. The yield on interest-earning assets increased 16 basis points from 4.16% in 2016 to 4.32% in 2017, while the cost of interest-bearing liabilities increased 4 basis points to 0.68% over the same time periods. The increase in interest-earning asset yields is a result of the re-pricing of the Bank’s variable rate loan portfolio after the 100 basis point increase in the target federal funds rate since December 2016. Most of the Bank’s variable rate loan portfolio is tied to the Bank’s prime rate, which increases correspondingly with increases in the targeted overnight federal funds rate. The increase in the cost of interest-bearing liabilities reflects the shift in the deposit portfolio mix to time deposits which pay a higher rate on average than savings deposits. The rates paid on the Bank’s other borrowed funds also increased in 2017, reflecting the general market increase in short-term rates as the Bank’s borrowings are concentrated in overnight funds which re-price daily.
The Company’s net interest margin increased from 3.67% in 2016 to 3.80% in 2017, reflecting the higher net interest spread. Several factors could put pressure on the Company’s net interest margin in the future, including further flattening of the yield curve and increased pricing competition for loans and deposits.
The Bank regularly monitors its exposure to interest rate risk. Management believes that the proper management of interest-sensitive funds will help protect the Bank’s earnings against changes in interest rates. The Bank’s Asset/Liability Management Committee (“ALCO”) meets monthly for the purpose of evaluating the Bank’s short-term and long-term liquidity position and the potential impact on capital and earnings of changes in interest rates. The Bank has adopted an asset/liability policy that specifies minimum limits for liquidity and capital ratios. This policy includes setting ranges for the negative impact acceptable on net interest income and on the fair value of equity as a result of a shift in interest rates. The asset/liability policy also includes guidelines for investment activities and funds management. At its monthly meetings, ALCO reviews the Bank’s status and formulates its strategies based on current economic conditions, interest rate forecasts, loan demand, deposit volatility and the Bank’s earnings objectives.
Provision for Loan Losses
The Company’s provision for loan losses declined to $0.7 million in 2017 from $1.2 million in 2016. The lower provision reflects an improvement in reserves for impaired loans and the level of criticized loans, partially offset by provision for loan growth. The allowance for loan loss allocation for impaired loans decreased from $2.0 million at the end of 2016 to $1.1 million at December 31, 2017. The lower reserve for impaired loans reflects a decrease in reserve on the Company’s largest impaired loan after the loan was paid down as part of a restructuring in the third quarter of 2017. As noted in Note 1 to the Consolidated Financial Statements included in Item 8 of this Annual Report on Form 10-K, the Company records a specific reserve on impaired loans and a higher reserve percentage on criticized loan balances, or those loans risk-rated 5 or higher, which are collectively evaluated for impairment. At December 31, 2017, criticized loans (i.e. loans risk-rated 5 or higher) that were collectively evaluated for impairment were $18.3 million, compared with $28.1 million at December 31, 2016. Overall, total loans collectively evaluated for impairment increased $122 million to $1.0 billion at the end of 2017 from $927 million as of December 31, 2016 resulting in provision for loan growth. There was not a material impact on the provision due to any changes in qualitative factors related to economic factors as the economy remained on a steady growth path with relatively low unemployment throughout 2017.
A description of how the allowance for loan losses is determined along with tabular data depicting the key factors in calculating the allowance is set forth in Notes 1 and 3 of the Notes to Consolidated Financial Statements included in Part II, Item 8 of this Annual Report on Form 10-K.
32
Non-accrual, Past Due and Restructured Loans
The following table summarizes the Bank’s non-accrual and accruing loans 90 days or more past due as of the dates listed below. See Note 3 of the Notes to Consolidated Financial Statements included in Part II, Item 8 of this Annual Report on Form 10-K for further information about the Company's non-accrual, past due and restructured loans.
|
|
|||||||||||||||||||||||||||||
|
|
|||||||||||||||||||||||||||||
|
|
|||||||||||||||||||||||||||||
|
|
At December 31, |
||||||||||||||||||||||||||||
|
|
2017 |
2016 |
2015 |
2014 |
2013 |
||||||||||||||||||||||||
|
|
(in thousands) |
||||||||||||||||||||||||||||
|
Non-accruing loans and leases: |
|||||||||||||||||||||||||||||
|
Mortgage loans on real estate: |
|||||||||||||||||||||||||||||
|
Residential mortgages |
$ |
1,226 |
$ |
862 |
$ |
1,400 |
$ |
1,296 |
$ |
1,376 | |||||||||||||||||||
|
Commercial and multi-family |
8,938 | 1,874 | 3,574 | 3,162 | 8,873 | ||||||||||||||||||||||||
|
Construction-residential |
- |
- |
- |
- |
- |
||||||||||||||||||||||||
|
Construction-commercial |
- |
4,178 | 4,187 |
- |
- |
||||||||||||||||||||||||
|
Home equities |
1,119 | 1,261 | 1,058 | 415 | 447 | ||||||||||||||||||||||||
|
Total mortgage loans on |
|||||||||||||||||||||||||||||
|
real estate |
11,283 | 8,175 | 10,219 | 4,873 | 10,696 | ||||||||||||||||||||||||
|
|
|||||||||||||||||||||||||||||
|
Direct financing leases |
- |
- |
- |
- |
47 | ||||||||||||||||||||||||
|
Commercial and industrial loans |
1,749 | 3,106 | 5,312 | 5,500 | 2,970 | ||||||||||||||||||||||||
|
Consumer and other loans |
9 | 17 | 14 | 17 | 20 | ||||||||||||||||||||||||
|
|
|||||||||||||||||||||||||||||
|
Total non-accruing loans |
|||||||||||||||||||||||||||||
|
and leases |
$ |
13,041 |
$ |
11,298 |
$ |
15,545 |
$ |
10,390 |
$ |
13,733 | |||||||||||||||||||
|
|
|||||||||||||||||||||||||||||
|
Accruing loans 90+ days past due |
674 | 722 | 497 | 201 |
- |
||||||||||||||||||||||||
|
Total non-performing loans |
|||||||||||||||||||||||||||||
|
and leases |
$ |
13,715 |
$ |
12,020 |
$ |
16,042 |
$ |
10,591 |
$ |
13,733 | |||||||||||||||||||
|
|
|||||||||||||||||||||||||||||
|
Total non-performing loans and |
|||||||||||||||||||||||||||||
|
leases to total assets |
1.06 |
% |
1.09 |
% |
1.71 |
% |
1.25 |
% |
1.65 |
% |
|||||||||||||||||||
|
Total non-performing loans and |
|||||||||||||||||||||||||||||
|
leases to total loans and leases |
1.29 |
% |
1.28 |
% |
2.07 |
% |
1.52 |
% |
2.12 |
% |
|||||||||||||||||||
Non-performing loans increased $1.7 million from $12.0 million at December 31, 2016 to $13.7 million at December 31, 2017. The increase in 2017 was primarily driven by one large commercial loan relationship of $3.4 million moving to nonaccrual status, partially offset by a pay down of $1.9 million in a loan that had been the Company’s largest non-performing loan as of December 31, 2016.
Non-accruing loans increased $1.7 million from $11.3 million at December 31, 2016 to $13.0 million at December 31, 2017. Accruing loans categorized as 90 days past due was flat at $0.7 million at each of December 31, 2017 and 2016. The increase in non-accruing loans was concentrated in commercial real estate, partially offset by a decrease in non-accruing commercial construction loans and non-accruing C&I loans. The commercial construction loan in nonaccruing status as of the end of 2016 was part of the restructuring of the Company’s previously largest nonperforming loan relationship. The construction loan was paid down and after restructuring converted to a permanent loan and classified as commercial real estate. The restructuring was considered to be a troubled debt restructuring based on the terms of the new loan. The total impact from the paydown and restructuring of that particular commercial relationship was a net decrease in nonaccruing loans of $1.9 million with a decrease in commercial construction loan balances of $4.2 million and an increase in commercial real estate loan balances of $2.3 million. There were two other relationships that drove the $7.0 million increase in nonaccruing commercial and multi-family real estate loans, including a $3.4 million medical office loan and a $1.0 million matured multi-family loan. The decline in nonaccruing C&I loans was due to the upgrade of a $1.3 million commercial loan relationship with a manufacturing firm to performing status after 6 consecutive months of payments with no delinquency and improved financial results for the borrower.
33
The Company had $7.3 million in loans that were restructured and deemed to be a troubled debt restructuring (“TDR”) at December 31, 2017 with $4.4 million of those balances in non-accrual status, compared with $5.1 million and $1.2 million, respectively, at December 31, 2016. The increase in TDR loans reflects the restructuring of the non-accruing construction loan discussed above. Any TDR that is placed on non-accrual is not returned to accruing status until the borrower makes timely payments as contracted for at least six months and future collection under the revised terms is probable. All of the restructurings were completed in an effort to maximize the Company’s ability to collect on loans where borrowers were experiencing financial difficulty. Modifications made to loans in a troubled debt restructuring did not have a material impact on the Company’s net income for the years ended December 31, 2017 and 2016. The reserve for a TDR is based upon the present value of the future expected cash flows discounted at the loan’s original effective rate or upon the fair value of the collateral less costs to sell, if the loan is deemed collateral dependent. This reserve methodology is used because all TDR loans are considered impaired.
The following table presents the Company’s TDR loans as of December 31, 2017 and 2016:
|
|
||||||||||||
|
|
||||||||||||
|
|
December 31, 2017 |
|||||||||||
|
|
(in thousands) |
|||||||||||
|
|
Total |
Nonaccruing |
Accruing |
Related Allowance |
||||||||
|
Commercial and industrial |
$ |
734 |
$ |
220 |
$ |
514 |
$ |
8 | ||||
|
|
||||||||||||
|
Residential real estate: |
||||||||||||
|
Residential |
1,656 | 271 | 1,385 |
- |
||||||||
|
Construction |
- |
- |
- |
- |
||||||||
|
|
||||||||||||
|
Commercial real estate: |
||||||||||||
|
Commercial and multi-family |
3,854 | 3,767 | 87 | 236 | ||||||||
|
Construction |
187 |
- |
187 |
- |
||||||||
|
|
||||||||||||
|
Home equities |
794 | 128 | 666 |
- |
||||||||
|
Consumer and other loans |
25 |
- |
25 | 24 | ||||||||
|
|
||||||||||||
|
Total TDR loans |
$ |
7,250 |
$ |
4,386 |
$ |
2,864 |
$ |
268 | ||||
|
|
||||||||||||
|
|
December 31, 2016 |
|||||||||||
|
|
(in thousands) |
|||||||||||
|
|
Total |
Nonaccruing |
Accruing |
Related Allowance |
||||||||
|
Commercial and industrial |
$ |
574 |
$ |
532 |
$ |
42 |
$ |
147 | ||||
|
Residential real estate: |
||||||||||||
|
Residential |
1,949 | 227 | 1,722 |
- |
||||||||
|
Construction |
- |
- |
- |
- |
||||||||
|
Commercial real estate: |
||||||||||||
|
Commercial and multi-family |
1,617 | 313 | 1,304 |
- |
||||||||
|
Construction |
257 |
- |
257 |
- |
||||||||
|
Home equities |
667 | 175 | 492 | 1 | ||||||||
|
Consumer and other |
26 |
- |
26 | 26 | ||||||||
|
Total TDR loans |
$ |
5,090 |
$ |
1,247 |
$ |
3,843 |
$ |
174 | ||||
34
Allowance for Loan and Lease Losses
The following table summarizes the Bank’s allowance for loan and lease losses and changes in the allowance for loan losses by categories:
|
|
||||||||||||||||||||
|
|
||||||||||||||||||||
|
|
ANALYSIS OF THE ALLOWANCE FOR LOAN AND LEASE LOSSES |
|||||||||||||||||||
|
|
2017 |
2016 |
2015 |
2014 |
2013 |
|||||||||||||||
|
|
(in thousands) |
|||||||||||||||||||
|
BALANCE AT THE BEGINNING |
||||||||||||||||||||
|
OF THE YEAR |
$ |
13,916 |
$ |
12,883 |
$ |
12,533 |
$ |
11,503 |
$ |
9,732 | ||||||||||
|
CHARGE-OFFS: |
||||||||||||||||||||
|
Residential mortgages |
- |
- |
(66) |
- |
(39) | |||||||||||||||
|
Commercial and multi-family |
(127) |
- |
(139) | (57) | (460) | |||||||||||||||
|
Home equities |
(1) |
- |
- |
(2) | (128) | |||||||||||||||
|
Direct financing leases |
- |
- |
- |
- |
- |
|||||||||||||||
|
Commercial and industrial loans |
(791) | (360) | (799) | (957) | (20) | |||||||||||||||
|
Consumer installment and other loans |
(66) | (47) | (43) | (46) | (64) | |||||||||||||||
|
TOTAL CHARGE-OFFS |
(985) | (407) | (1,047) | (1,062) | (711) | |||||||||||||||
|
|
||||||||||||||||||||
|
RECOVERIES: |
||||||||||||||||||||
|
Residential mortgages |
- |
2 | 2 | 18 | 2 | |||||||||||||||
|
Commercial and multi-family |
- |
59 | 44 | 58 | 444 | |||||||||||||||
|
Home equities |
3 | 3 |
- |
- |
1 | |||||||||||||||
|
Direct financing leases |
- |
- |
- |
173 | 242 | |||||||||||||||
|
Commercial and industrial loans |
323 | 151 | 126 | 574 | 240 | |||||||||||||||
|
Consumer installment and other loans |
24 | 16 | 9 | 40 | 13 | |||||||||||||||
|
TOTAL RECOVERIES |
350 | 231 | 181 | 863 | 942 | |||||||||||||||
|
|
||||||||||||||||||||
|
NET (CHARGE-OFFS) RECOVERIES |
(635) | (176) | (866) | (199) | 231 | |||||||||||||||
|
PROVISION FOR LOAN |
||||||||||||||||||||
|
AND LEASE LOSSES |
738 | 1,209 | 1,216 | 1,229 | 1,540 | |||||||||||||||
|
BALANCE AT THE END OF YEAR |
$ |
14,019 |
$ |
13,916 |
$ |
12,883 |
$ |
12,533 |
$ |
11,503 | ||||||||||
|
|
||||||||||||||||||||
|
RATIO OF NET CHARGE-OFFS |
||||||||||||||||||||
|
(RECOVERIES) TO AVERAGE |
||||||||||||||||||||
|
NET LOANS AND LEASES |
||||||||||||||||||||
|
OUTSTANDING |
0.07 |
% |
0.02 |
% |
0.12 |
% |
0.03 |
% |
(0.04) |
% |
||||||||||
|
|
||||||||||||||||||||
|
RATIO OF ALLOWANCE FOR |
||||||||||||||||||||
|
LOAN AND LEASE LOSSES TO |
||||||||||||||||||||
|
TOTAL LOANS AND LEASES |
1.32 |
% |
1.48 |
% |
1.66 |
% |
1.80 |
% |
1.78 |
% |
||||||||||
35
Net charge-offs increased from $0.2 million in 2016 to $0.6 million in 2017. The ratio of net charge-offs to average net loans outstanding correspondingly increased from 0.02% in 2016 to 0.07% in 2017. The largest charge-off in 2017 occurred in the fourth quarter for $0.8 million in the C&I loan portfolio when it was determined that the non-accruing loan was no longer collectible and the collateral supporting the loan had appraised values lower than the outstanding loan balance.
An allocation of the allowance for loan losses by portfolio type over the past five years follows:
|
|
||||||||||||||||||||||||||||||
|
|
||||||||||||||||||||||||||||||
|
|
Balance at 12/31/2017 attributable to: |
Percent of loans in each category to total loans: |
Balance at 12/31/2016 attributable to: |
Percent of loans in each category to total loans: |
Balance at 12/31/2015 attributable to: |
Percent of loans in each category to total loans: |
Balance at 12/31/2014 attributable to: |
Percent of loans in each category to total loans: |
Balance at 12/31/2013 attributable to: |
Percent of loans in each category to total loans: |
||||||||||||||||||||
|
|
(in thousands) |
|||||||||||||||||||||||||||||
|
Residential |
||||||||||||||||||||||||||||||
|
mortgages* |
$ |
950 | 12 |
% |
$ |
769 | 13 |
% |
$ |
909 | 14 |
% |
$ |
941 | 14 |
% |
$ |
1,038 | 15 |
% |
||||||||||
|
Commercial |
||||||||||||||||||||||||||||||
|
mortgages* |
7,409 | 59 |
% |
7,890 | 59 |
% |
7,135 | 59 |
% |
5,650 | 58 |
% |
4,912 | 59 |
% |
|||||||||||||||
|
|
||||||||||||||||||||||||||||||
|
Home equities |
347 | 7 |
% |
348 | 7 |
% |
371 | 8 |
% |
819 | 9 |
% |
878 | 9 |
% |
|||||||||||||||
|
Commercial |
||||||||||||||||||||||||||||||
|
loans |
5,204 | 22 |
% |
4,813 | 21 |
% |
4,383 | 19 |
% |
4,896 | 19 |
% |
4,489 | 17 |
% |
|||||||||||||||
|
Consumer |
||||||||||||||||||||||||||||||
|
loans** |
109 |
- |
% |
96 |
- |
% |
85 |
- |
% |
78 |
- |
% |
37 |
- |
% |
|||||||||||||||
|
|
||||||||||||||||||||||||||||||
|
Unallocated |
- |
- |
% |
- |
- |
% |
- |
- |
% |
149 |
- |
% |
149 |
- |
% |
|||||||||||||||
|
|
$ |
14,019 | 100 |
% |
$ |
13,916 | 100 |
% |
$ |
12,883 | 100 |
% |
$ |
12,533 | 100 |
% |
$ |
11,503 | 100 |
% |
||||||||||
* includes construction loans
** includes other loans
The proportion of the allowance allocated to commercial mortgages comprised 53% of the allowance for loan losses, and correspondingly, the commercial mortgage portfolio made up the largest proportion, or 59%, of the total loan portfolio as of December 31, 2017, as compared with 57% of the allowance and 59% of the total loan portfolio at December 31, 2016. The decrease in the percentage of the allowance attributed to commercial mortgages reflected the decrease in specific reserves on an impaired commercial construction loan relationship.
C&I loans comprise 37% of the allowance for loan losses despite being only 22% of the loan portfolio. C&I loans have the highest historical loss experience compared to the other portfolio segments and this is reflected in the allowance allocated to the different portfolio segments. Therefore, C&I loans have the highest allowance allocation as a percentage of the portfolio segment when compared with the other portfolio segments.
Overall, the ratio of the allowance for loan losses to total loans decreased from 1.48% at December 31, 2016 to 1.32% on December 31, 2017. The decrease is a reflection of a sustained level of low charge-offs and improved credit quality metrics such as a decline in criticized loans and reduced reserves on impaired loans. The non-performing loans ratio was steady at 1.29% at the end of 2017, compared with 1.28% at the conclusion of the previous year.
The Company maintains a robust loan review process to ensure that specific credits are appropriately graded and reserved. Management believes that the allowance for loan losses is reflective of a fair assessment of the current environment and credit quality trends.
Non-Interest Income
Total non-interest income increased by $1.8 million from $11.2 million in 2016 to $13.0 million in 2017. The primary factor driving the increase was revenue growth in insurance services fees of 21%, or $1.4 million to $7.9 million. TEA’s revenue remains the largest component of non-interest income at 61% of total non-interest income. TEA is a source of diversification in the earnings of the Company and helps generate income not directly impacted by difficult credit or interest rate environments. The largest contributor to the increase in insurance income was contingent profit sharing revenue. Profit sharing revenue varies depending on the loss experience of TEA’s customers relative to overall premiums paid to insurance carriers. Profit sharing revenue in 2017 was higher than average long term profit sharing revenue trends while profit sharing revenue in 2016 was lower than average, resulting in a $0.4 million increase in profit sharing revenue in 2017. Employee benefit revenue more than doubled from 2016 to 2017 as TEA increased sales staff and management
36
to boost production. Commercial lines revenue had strong growth in 2017 as new business production exceeded the previous year’s results. Personal lines revenue increased after TEA purchased the assets of two small insurance agencies, one in the fourth quarter of 2016 and another in the first quarter of 2017.
In addition to insurance revenue, other non-interest income sources that increased in 2017 included bank-owned life insurance (“BOLI”) income and interchange fees. BOLI income increased $0.3 million to $0.9 million in 2017 due to a gain on an insurance claim made in the fourth quarter of 2017. There were no claims made in 2016. Interchange fee income increased $0.2 million to $1.5 million in 2017 due to higher debit card activity during the year.
The Company is actively engaged in the community by financing historic rehabilitation projects in Buffalo and enhances its yield by investing in related tax credits. When a project is completed, the Company recognizes tax benefits with a related reduction in the investment. The impact to non-interest income from historic tax credit investments was a $1.2 million loss in 2017, compared with a $0.9 million loss in 2016. In 2017, a $4.0 million write-off on the investments was recorded in non-interest income and was partially offset by $2.8 million in refundable New York State tax credits, resulting in the $1.2 million net loss related to tax credit investments in non-interest income in 2017. There was also a corresponding $1.9 million tax benefit realized in income tax expense in 2017, resulting in a net benefit to net income of $0.7 million related to the tax credit investments. The write-offs were contemplated when management priced the initial investment in the tax credit projects. The net impact to non-interest income for historic tax credit investments in 2016 was a net loss of $0.9 million with a corresponding $1.4 million benefit in income tax expense. A table depicting the impact of the historic tax credit transactions is in Note 13 to the Consolidated Financial Statements.
Non-Interest Expense
Total non-interest expense increased $3.5 million, or 10%, from $35.1 million in 2016 to $38.6 million in 2017. The largest increases in non-interest expense in 2017 when compared with 2016 were salaries and employee benefits, which increased $2.2 million, or 10%, and technology and communication expenses, which increased $0.6 million, or 27%.
The increase in salaries and employee benefits stems from merit increases, the addition of new employees as a part of the Company’s planned growth strategy, and increased incentive compensation. Technology and communications expenses increased due to costs associated with the Bank’s new online banking system, which was implemented in the beginning of the second quarter of 2017, the full year impact of the new core banking system implemented in the second quarter of 2016, and increased debit card expenses related to higher activity. Occupancy expenses increased $0.3 million due to capital improvements made on Company properties and the full year impact of the Bank’s new branch in Lockport, NY, which opened in May 2016. Other expenses increased $0.2 million due to a $0.3 million contribution to the Evans Bank Foundation Fund in the fourth quarter of 2017. There were no contributions made in 2016.
The efficiency ratio expresses the relationship of operating expenses to revenues. The Company's efficiency ratio, or non-interest operating expenses (exclusive of non-cash intangible amortization) divided by the sum of net interest income and non-interest income (exclusive of gains and losses from investment securities and tax credit investments), improved to 68.5% in 2017 from 74.0% in 2016. The decrease occurred as growth in net interest income (19%) and non-interest income (16%) exceeded non-interest expense growth of 10%. While the Company’s growth strategy has resulted in continued rising non-interest expenses, the investments in people and infrastructure made in previous years were able to be leveraged for improved efficiency in 2017.
Taxes
Income tax expense for the year was $5.2 million, representing an effective tax rate of 33.2% compared with an effective tax rate of 18.9% in 2016. The difference was driven by a $2.1 million charge to the Company’s deferred tax asset due to the TCJA signed in December 2017 and by the impact of historic tax credit investment transactions in 2017 and 2016. The TCJA lowered the federal corporate tax rate from 35% to 21% starting in 2018. As a result, the Company’s deferred tax deductions have less value and necessitated a write-down of the asset. Excluding the impact of the historic tax credit transactions with respect to 2017 and 2016 and the remeasurement of the deferred tax asset with respect to 2017, the 2017 effective tax rate (non-GAAP) was 29.7% compared with 30.1% in 2016. The reconciliation of the effective tax rates excluding the impact of the TCJA and historic tax credit investments, which are non-GAAP financial measures, to the most directly comparable GAAP measure is provided in the table in the “Summary” section of Management’s Discussion and Analysis of Results of Operations and Financial Condition.
Income tax expense and deferred tax assets were recorded for the year ended December 31, 2017 and as of December 31, 2017, respectively, based on the Company’s initial analysis of the TCJA. Given the complexity of the TCJA, anticipated guidance from the U.S. Treasury regarding implementation of the act, and the potential for guidance from the Securities and Exchange Commission or the Financial Accounting Standards Board related to the TCJA, it is possible there will be adjustments to the Company’s results of operations during 2018 to reflect any such guidance provided.
37
RESULTS OF OPERATIONS FOR YEARS ENDED DECEMBER 31, 2016 AND DECEMBER 31, 2015
Net Income
Net income of $8.3 million in 2016 consisted of $7.5 million related to the Company’s banking activities and $0.8 million related to the Company’s insurance agency activities. The total net income of $8.3 million was a 5% increase from $7.8 million in 2015. Earnings per diluted share for 2016 of $1.90 were 4% higher than the earnings per diluted share of $1.82 for 2015.
Net Interest Income
Net interest income increased by $3.4 million, or 11%, to $35.2 million in 2016 from $31.8 million in 2015. This increase primarily resulted from increased loan volume, partially offset by lower yields earned on loans and investment securities. Overall, the increased volume of interest-earning assets and interest-bearing liabilities positively impacted net interest income by $5.4 million, while the rates earned and paid on those respective assets and liabilities had a negative impact of $2.0 million.
The total commercial loan portfolio balance, including commercial real estate and C&I loans, increased $123 million, or 22%, from a $556 million average balance in 2015 to a $679 million average balance in 2016. Consumer loans increased 8% from a $162 million average balance in 2015 to a $175 million average balance in 2016.
On the funding side, the Company was successful in attracting new deposit customers, with most of that success coming from growth in retail savings deposits and commercial demand deposit products. The Company marketed attractive retail savings and time deposit products to fund the strong commercial loan growth. The Company’s increasing C&I loan production resulted in a corresponding increase in commercial demand deposits. Total average deposits increased $102 million, or 13%, year over year to $868 million in 2016. The largest component of that growth was in average savings deposits of $60 million. Average demand deposits increased $18 million, including $15 million in commercial demand deposits, from 2015 to 2016. Average time deposits grew $15 million from 2015 to 2016.
The FRB decision to raise its targeted overnight rate by 0.25% in December 2015 had a positive impact on the Company’s 2016 results while the increase in late 2016 had minimal impact on the Company’s 2016 results. Previous to 2015, the FRB executed on a monetary policy designed to keep interest rates at all-time lows with the target overnight rate between 0.00% and 0.25% since the end of 2008 until the FRB raised its target rate to between 0.25% and 0.50% in December 2015. The FRB raised the target rate again in December 2016 to between 0.50% and 0.75%. The FRB had also executed on other quantitative easing strategies, including the purchase of mortgage-backed securities, in an attempt to depress longer-term market interest rates. Although the FRB eventually stopped its asset purchases, its accommodation policy kept rates historically low during the same period. This interest rate environment resulted in lower interest yields earned on assets as well as lower rates paid on liabilities. Assets re-priced into lower yields as older loans and securities matured, and new loans were originated and securities purchased at lower yields than those they were replacing.
Net interest spread, or the difference between yield on interest-earning assets and rate on interest-bearing liabilities, decreased from 3.65% in 2015 to 3.52% in 2016. The yield on interest-earning assets decreased 10 basis points from 4.26% in 2015 to 4.16% in 2016, while the cost of interest-bearing liabilities increased 3 basis points to 0.64% over the same time periods. The decline in interest-earning asset yields is a result of the continued asset re-pricing described above. The increase in the cost of interest-bearing liabilities reflects the continued shift in the savings deposit portfolio to higher rate products. The Company had very low cost core savings deposits that were more mature in their life cycle and did not grow in 2016. Simultaneously, the Company offered attractive rates on certain savings products in an effort to fund the Company’s strong loan growth.
The Company’s net interest margin decreased from 3.80% in 2015 to 3.67% in 2016, reflecting the changes to the net interest spread.
Provision for Loan Losses
The Company’s provision for loan losses was $1.2 million in both 2016 and 2015. The provision was flat year over year as increases in reserves for impaired loans, the level of criticized loans, and loan growth were offset by the impact of the sustained low level of historical losses in the portfolio. The allowance for loan loss allocation for impaired loans increased from $1.7 million at the end of 2015 to $2.0 million at December 31, 2016. The higher reserve for impaired loans reflected an increase in reserve on the Company’s largest impaired loan after a new appraisal was obtained in 2016 that demonstrated a decrease in the value of the collateral securing the loan. As noted in Note 1 to the Consolidated Financial Statements included in Item 8 of this Annual Report on Form 10-K, the Company reserves a specific allocation on impaired loans and a higher percentage on criticized loans, or those loans risk-rated 5 or higher. At December 31, 2016, criticized loans (i.e. loans risk-rated 5 or higher) that were collectively evaluated for impairment were $28.1 million, compared with $26.7 million at December 31, 2015. Overall, total loans collectively evaluated for impairment increased $173 million to $927 million at the end of 2016 from $754 million as of December 31, 2015. Offsetting the increase in the provision for loan losses related to these factors was a reduction in the Company’s allowance related to its historical loss experience. The Company had sustained
38
historical loss experience at extremely low levels for a period of time sufficient that management determined that it was appropriate to lower the allowance allocation determined by historical losses in accordance with the Bank’s allowance for loan losses policy.
Non-performing loans decreased $4.0 million from $16.0 million at December 31, 2015 to $12.0 million at December 31, 2016. The decrease in 2016 was primarily driven by one large commercial loan relationship of $3.6 million being upgraded to performing status.
Non-Interest Income
Total non-interest income decreased by $2.5 million from 2015 to 2016. The primary factors driving the decrease were the $0.9 million net loss related to tax credit investments in 2016 and a $0.7 million gain on insurance proceeds recorded in 2015 related to a fire sustained at a branch location. In 2016, a $3.0 million write-off on the tax credit investments was recorded in non-interest income and was partially offset by $2.1 million in refundable New York State tax credits, resulting in the $0.9 million net loss related to tax credit investments in non-interest income in 2016. There was also a corresponding $1.4 million tax benefit realized in income tax expense in 2016, resulting in a net benefit to net income of $0.5 million related to the tax credit investments. There were no comparable transactions in 2015.
Insurance service and fee revenue decreased $0.7 million from 2015 to $6.5 million in 2016. The decrease in insurance service and fee revenue was largely due to lower financial services revenue and a decline in insurance claims services revenue at FCS. The number of insurance claims serviced in 2016 was down from 2015 after the prior year benefited from a high volume of weather-induced claims activity. Financial services revenue declined in the face of stiff competition and shifting consumer preferences to more passive investment alternatives and other lower-cost investment choices.
Non-Interest Expense
Total non-interest expense increased $2.4 million, or 7%, from $32.7 million in 2015 to $35.1 million in 2016. The largest increases in non-interest expense in 2016 when compared with 2015 were salaries and employee benefits, which increased $1.7 million, or 9%, and technology and communication expenses, which increased $0.3 million, or 24%.
The increase in salaries and employee benefits stemmed from merit increases, the addition of new employees as a part of the Company’s planned growth strategy, increased incentive compensation, and fringe benefits costs including health care costs and retirement funding expenses. Technology and communications expenses increased due to the increased costs of the Bank’s new core banking system implemented in the beginning of the second quarter of 2016. Advertising costs increased $0.2 million due to a marketing campaign targeted toward obtaining new customers impacted by bank merger activity in Western New York. Higher FDIC insurance costs of $0.1 million reflected the Company’s balance sheet growth in 2016.
The Company's efficiency ratio was 74.0% in 2016 and 71.8% in 2015. The increase occurred as non-interest expense growth resulting from the Company’s growth strategy outpaced revenue growth, which was negatively impacted by the decrease in insurance service and fee revenue and net interest margin compression.
Taxes
The provision for income taxes in 2016 was $1.9 million on pre-tax income of $10.2 million for an effective tax rate of 18.9%, compared with an effective tax rate of 32.5% in 2015. The 2016 fiscal year benefited from historic tax credits generated from investing in community projects that rehabilitate historic properties. Excluding the impact of the historic tax credit and write-off of the tax credit investments recognized in non-interest income for the period ended December 31, 2016, the provision for income taxes would have been $3.3 million on pre-tax income of $11.1 million yielding an effective rate of 30.1%.
FINANCIAL CONDITION
The Company had total assets of $1.3 billion at December 31, 2017, an increase of $195 million, or 18%, from $1.1 billion at December 31, 2016. Net loans of $1.1 billion at the recent year end were $123 million, or 13%, higher than $929 million at December 31, 2016. Total investment securities increased $52 million from $97 million at December 31, 2016 to $149 million at December 31, 2017, and deposits increased by $111 million, or 12%, to $1.1 billion as of the end of 2017. Stockholders’ equity was $118 million at the conclusion of 2017, a $21 million, or 22% increase from $97 million at the previous year end.
Securities Activities
The primary objectives of the Bank’s securities portfolio are to provide liquidity and maximize income while preserving safety of principal. Secondary objectives include: providing collateral to secure local municipal deposits, the investment of funds during periods of decreased loan demand, interest rate sensitivity considerations, supporting local communities through the purchase of tax-exempt
39
securities and tax planning considerations. The Bank’s Board of Directors is responsible for establishing overall policy and reviewing performance of the Bank’s investments.
Under the Bank’s policy, acceptable portfolio investments include: United States Government obligations, obligations of federal agencies or U.S. Government-sponsored enterprises, mortgage-backed securities, municipal obligations (general obligations, revenue obligations, school districts and non-rated issues from the Bank’s general market area), banker’s acceptances, certificates of deposit, Industrial Development Authority Bonds, Public Housing Authority Bonds, corporate bonds (each corporation limited to the Bank’s legal lending limit), collateralized mortgage obligations, Small Business Investment Companies (SBIC), Federal Reserve stock and Federal Home Loan Bank stock.
In regard to municipal securities, the Company’s general investment policy is that in-state securities must be rated at least Moody’s Baa (or equivalent) at the time of purchase. The Company reviews the ratings report and municipality financial statements and prepares a pre-purchase analysis report before the purchase of any municipal securities. Out-of-state issues must be rated by Moody’s at least Aa (or equivalent) at the time of purchase. The Company did not own any out-of-state municipal bonds at December 31, 2017 or December 31, 2016. Bonds rated below A are reviewed periodically to ensure their continued credit worthiness. While purchase of non-rated municipal securities is permitted, such purchases are limited to bonds issued by municipalities in the Company’s general market area. Those municipalities are typically customers of the Bank whose financial situation is familiar to management. The financial statements of the issuers of non-rated securities are reviewed by the Bank and a credit file of the issuers is kept on each non-rated municipal security with relevant financial information.
The Company has not experienced any credit troubles in its municipal bond portfolio and does not believe any credit troubles are imminent. Aside from the non-rated municipal securities to local municipalities discussed above that are considered held-to-maturity, all of the Company’s available-for-sale municipal bonds are investment-grade government obligation (“G.O.”) bonds. G.O. bonds are generally considered safer than revenue bonds because they are backed by the full faith and credit of the government while revenue bonds rely on the revenue produced by a particular project. All of the Company’s municipal bonds are to municipalities in New York State. To the Company’s knowledge, there has never been a default on a NY G.O. bond in the history of the state. The Company believes that its risk of loss on default of a G.O. municipal bond for the Company is relatively low. However, historical performance does not guarantee future performance.
All fixed and adjustable rate mortgage pools backing the Company’s mortgage-backed securities contain a certain amount of risk related to the uncertainty of prepayments of the underlying mortgages. Interest rate changes have a direct impact on prepayment rates. The Company uses a third-party developed model to monitor the average life and yield volatility of mortgage pools under various interest rate assumptions.
Pursuant to FASB Accounting Standards Codification (“ASC”) 320, “Investments – Debt and Equity Securities”, which establishes accounting treatment for investments in securities, all securities in the Bank’s investment portfolio are either designated as “held to maturity” or “available for sale.”
Fair values for available for sale securities are determined using independent pricing services and market-participating brokers. The Company utilizes a third-party for these pricing services. The third-party utilizes evaluated pricing models that vary by asset class and incorporate available trade, bid and other market information for structured securities, cash flow and, when available, loan performance data. Because many fixed income securities do not trade on a daily basis, the third-party service provider’s evaluated pricing applications apply information as applicable through processes, such as benchmarking of like securities, sector groupings, and matrix pricing, to prepare evaluations. In addition, our third-party pricing service provider uses model processes, such as the Option Adjusted Spread model, to assess interest rate impact and develop prepayment scenarios. The models and the process take into account market convention. For each asset class, a team of evaluators gathers information from market sources and integrates relevant credit information, perceived market movements and sector news into the evaluated pricing applications and models. The third party, at times, may determine that it does not have sufficient verifiable information to value a particular security. In these cases the Company will utilize valuations from another pricing service.
Management believes that it has a sufficient understanding of the third party service’s valuation models, assumptions and inputs used in determining the fair value of securities to enable management to maintain an appropriate system of internal control. On a quarterly basis the Company reviews changes, as submitted by our third-party pricing service provider, in the market value of its securities portfolio. Individual changes in valuations are reviewed for consistency with general interest rate movements and any known credit concerns for specific securities. Additionally, on an annual basis the Company has its entire securities portfolio priced by a second pricing service to determine consistency with another market evaluator. If, on the Company’s review or in comparing with another servicer, a material difference between pricing evaluations were to exist, the Company may submit an inquiry to our third party pricing service provider regarding the data used to value a particular security. If the Company determines it has market information that would support a different valuation than our third-party pricing service provider’s evaluation it can submit a challenge for a change to that security’s valuation. There were no material differences in valuations noted in 2017 or 2016.
40
The Company designates all securities at the time of purchase as either “held to maturity” or “available for sale.” Securities designated as held to maturity are stated on the Company’s Consolidated Balance Sheets included under Item 8 of this Annual Report on Form 10-K at amortized cost. Those designated as available for sale are reported at fair market value. At December 31, 2017, $5.3 million in securities were designated as held to maturity. These bonds are municipal investments that the Bank has made in its local market area.
The available for sale portfolio totaled $144 million or approximately 96% of the Company’s securities portfolio at December 31, 2017. Net unrealized gains and losses on available for sale securities resulted in a net unrealized loss of $1.4 million at December 31, 2017, as compared with a net unrealized loss of $0.6 million at December 31, 2016. The increase in the net unrealized loss position in 2017 was due to the rise in market interest rates during the year. Unrealized gains and losses on available-for-sale securities are reported, net of taxes, as a separate component of stockholders’ equity. For the year ended December 31, 2017, the impact on stockholders’ equity was a net unrealized loss, net of taxes, of approximately $0.7 million.
Certain securities available for sale were in an unrealized loss position at December 31, 2017. Management assessed those securities available for sale in an unrealized loss position at December 31, 2017 and determined the decline in fair value below amortized cost to be temporary. In making this determination, management considered the period of time the securities were in a loss position, the percentage decline in comparison to the securities amortized cost, the financial condition of the issuer (primarily government or government-sponsored enterprises) and the Company’s ability and intent to hold these securities until their fair value recovers to their amortized cost. Management believes the decline in fair value is primarily related to market interest rate fluctuations and not to the credit deterioration of the individual issuer.
Securities and interest-bearing deposits at banks made up 13% of the Company’s total average interest-earning assets in 2017 compared with 12% in 2016. The Company’s securities portfolio outstanding balances increased from $97 million at December 31, 2016 to $149 million at December 31, 2017 and the Company’s interest-bearing deposits at banks also increased from $1 million to $8 million over the same time period. The interest-bearing deposits are liquid interest-bearing cash accounts at correspondent banks. After the Company raised $14 million in equity in the first quarter of 2017, management increased the size of the investment portfolio to leverage and generate immediate returns on the capital. At December 31, 2017, the Company’s concentration in U.S. government-sponsored agency bonds was 19% of the total securities balance versus 13% at December 31, 2016. Government-sponsored mortgage-backed securities comprised 58% of the portfolio at December 31, 2017, compared with 49% of the portfolio at December 31, 2016, and tax-advantaged municipal bonds made up 23% of the portfolio at December 31, 2017 versus 38% of the portfolio at December 31, 2016. With a new President of the United States taking office early in 2017, management chose to minimize its purchases of municipal bonds due to the possibility of a decrease in the corporate tax rate, which would effectively reduce the return on those investments given the value those bonds have as tax-advantaged investments. The largest increase was in mortgage-backed securities as the continual return of principal on these investments offers management more capability to manage interest rate risk.
As a member of both the Federal Reserve System and the FHLB, the Bank is required to hold stock in those entities. The Bank held $4.9 million and $2.2 million in FHLB stock as of December 31, 2017 and 2016, respectively, and $1.9 million and $1.5 million in FRB stock at December 31, 2017 and 2016, respectively.
Income from securities held in the Bank’s investment portfolio represented 7% of total interest income of the Company in 2017 compared with 7% in 2016 and 8% in 2015. Taxable securities yields improved to 2.45% in 2017 from 2.33% in 2016, but were lower than 2.84% in 2015. Investment purchase activity was relatively low in 2016 as higher yielding bonds were called or matured, resulting in a decrease in yields. Returns improved in 2017 as market interest rates rose and investment purchase activity increased. Conversely, tax-exempt yields continued to decrease to 2.38% in 2017 from 2.44% in 2016 and 2.67% in 2015. With minimal municipal bond purchases in 2017 and higher yielding investments being called or matured, overall tax-exempt portfolio yields continued to decline.
Available for sale securities with a total fair value of $138 million at December 31, 2017 were pledged as collateral to secure public deposits and for other purposes required or permitted by law.
41
The following table summarizes the Bank’s securities with those designated as available for sale valued at fair value and securities designated as held to maturity at amortized cost as of December 31, 2017, 2016, and 2015:
|
|
|||||||||
|
|
|||||||||
|
|
At December 31, |
||||||||
|
|
2017 |
2016 |
2015 |
||||||
|
|
(in thousands) |
||||||||
|
Available for Sale: |
|||||||||
|
Debt securities |
|||||||||
|
U.S. government agencies |
$ |
28,053 |
$ |
12,872 |
$ |
21,846 | |||
|
States and local subdivisions |
29,373 | 35,142 | 37,683 | ||||||
|
Total debt securities |
$ |
57,426 |
$ |
48,014 |
$ |
59,529 | |||
|
|
|||||||||
|
Mortgage-backed securities |
|||||||||
|
FNMA |
$ |
31,554 |
$ |
14,560 |
$ |
10,449 | |||
|
FHLMC |
14,540 | 3,525 | 4,634 | ||||||
|
GNMA |
2,102 | 2,533 | 3,236 | ||||||
|
SBA |
10,215 |
- |
- |
||||||
|
CMO's |
27,981 | 26,590 | 19,293 | ||||||
|
Total mortgage-backed securities |
$ |
86,392 |
$ |
47,208 |
$ |
37,612 | |||
|
|
|||||||||
|
Total available for sale securities |
$ |
143,818 |
$ |
95,222 |
$ |
97,141 | |||
|
|
|||||||||
|
Held to Maturity: |
|||||||||
|
Debt securities |
|||||||||
|
States and local subdivisions |
$ |
5,334 |
$ |
1,983 |
$ |
1,617 | |||
|
|
|||||||||
|
Total held to maturity securities |
$ |
5,334 |
$ |
1,983 |
$ |
1,617 | |||
42
The following table sets forth the contractual maturities and weighted average interest yields of the Bank’s securities portfolio (yields on tax-exempt obligations are not presented on a tax-equivalent basis) as of December 31, 2017. Expected maturities will differ from contracted maturities since issuers may have the right to call or prepay obligations without penalties.
|
|
||||||||||||||||||||||||
|
|
||||||||||||||||||||||||
|
|
Maturing |
|||||||||||||||||||||||
|
|
Within |
After One But |
After Five But |
After |
||||||||||||||||||||
|
|
One Year |
Within Five Years |
Within Ten Years |
Ten Years |
||||||||||||||||||||
|
|
Amount |
Yield |
Amount |
Yield |
Amount |
Yield |
Amount |
Yield |
||||||||||||||||
|
|
($ in thousands) |
|||||||||||||||||||||||
|
Available for Sale: |
||||||||||||||||||||||||
|
Debt Securities |
||||||||||||||||||||||||
|
U.S. Government agencies |
$ |
2,005 | 2.00 |
% |
$ |
6,976 | 1.75 |
% |
$ |
19,072 | 2.60 |
% |
$ |
- |
- |
% |
||||||||
|
States and political |
||||||||||||||||||||||||
|
subdivisions |
3,985 | 2.19 |
% |
17,092 | 2.12 |
% |
6,313 | 2.99 |
% |
1,983 | 4.28 |
% |
||||||||||||
|
Total debt securities |
$ |
5,990 | 2.13 |
% |
$ |
24,068 | 2.01 |
% |
$ |
25,385 | 2.70 |
% |
$ |
1,983 | 4.28 |
% |
||||||||
|
|
||||||||||||||||||||||||
|
Mortgage-backed securities |
||||||||||||||||||||||||
|
FNMA |
$ |
18 | 7.08 |
% |
$ |
- |
- |
% |
$ |
15,464 | 2.56 |
% |
$ |
16,072 | 3.05 |
% |
||||||||
|
FHLMC |
11 | 4.90 |
% |
21 | 5.88 |
% |
2,471 | 2.42 |
% |
12,037 | 2.78 |
% |
||||||||||||
|
GNMA |
- |
- |
% |
- |
- |
% |
659 | 3.74 |
% |
1,443 | 3.17 |
% |
||||||||||||
|
SBA |
- |
- |
% |
- |
- |
% |
- |
- |
% |
10,215 | 2.66 |
% |
||||||||||||
|
CMO |
4 | 4.58 |
% |
- |
- |
% |
427 | 2.74 |
% |
27,550 | 2.27 |
% |
||||||||||||
|
Total mortgage-backed |
||||||||||||||||||||||||
|
securities |
$ |
33 | 6.05 |
% |
$ |
21 | 5.88 |
% |
$ |
19,021 | 2.58 |
% |
$ |
67,317 | 2.60 |
% |
||||||||
|
|
||||||||||||||||||||||||
|
Total available for sale |
$ |
6,023 | 2.15 |
% |
$ |
24,089 | 2.01 |
% |
$ |
44,406 | 2.65 |
% |
$ |
69,300 | 2.67 |
% |
||||||||
|
|
||||||||||||||||||||||||
|
Held to Maturity: |
||||||||||||||||||||||||
|
Debt Securities |
||||||||||||||||||||||||
|
States and political |
||||||||||||||||||||||||
|
subdivisions |
$ |
4,077 | 1.58 |
% |
$ |
690 | 2.15 |
% |
$ |
473 | 3.60 |
% |
$ |
94 | 2.80 |
% |
||||||||
|
Total held to maturity |
$ |
4,077 | 1.58 |
% |
$ |
690 | 2.15 |
% |
$ |
473 | 3.60 |
% |
$ |
94 | 2.80 |
% |
||||||||
|
|
||||||||||||||||||||||||
|
Total securities |
$ |
10,100 | 1.92 |
% |
$ |
24,779 | 2.01 |
% |
$ |
44,879 | 2.66 |
% |
$ |
69,394 | 2.67 |
% |
||||||||
LENDING ACTIVITIES
The Bank has a loan policy which is approved by its Board of Directors on an annual basis. The loan policy governs the conditions under which loans may be made, addresses the lending authority of Bank officers, documentation requirements, appraisal policy, charge-off policies and desired portfolio mix. The Bank’s lending limit to any one borrower is subject to regulation by the OCC. The Bank continually monitors its loan portfolio to review compliance with new and existing regulations.
The Bank offers a variety of loan products to its customers, including residential and commercial real estate mortgage loans, commercial loans, and installment loans. The Bank primarily extends loans to customers located within the Western New York area. Interest income on loans represented approximately 93% of the total interest income of the Company in 2017 and 2016 and 92% of total interest income in 2015. The Bank’s loan portfolio, net of the allowances for loan losses, totaled $1.1 billion and $929 million at December 31, 2017 and December 31, 2016, respectively. The net loan portfolio represented 87% and 88% of the Company’s average interest-earning assets during 2017 and 2016, respectively.
43
The following table summarizes the major classifications of the Bank’s loans as of the dates indicated:
|
|
|||||||||||||||
|
|
|||||||||||||||
|
|
December 31, |
||||||||||||||
|
|
2017 |
2016 |
2015 |
2014 |
2013 |
||||||||||
|
|
(in thousands) |
||||||||||||||
|
Mortgage loans on real estate: |
|||||||||||||||
|
Residential Mortgages |
$ |
131,208 |
$ |
118,542 |
$ |
103,941 |
$ |
98,374 |
$ |
94,027 | |||||
|
Commercial and multi-family |
519,902 | 462,385 | 399,819 | 363,252 | 361,247 | ||||||||||
|
Construction-Residential |
2,134 | 2,540 | 1,546 | 721 | 1,509 | ||||||||||
|
Construction-Commercial |
107,274 | 93,240 | 60,892 | 40,986 | 23,902 | ||||||||||
|
Home equities |
69,745 | 66,234 | 61,042 | 59,948 | 57,228 | ||||||||||
|
Total real estate loans |
830,263 | 742,941 | 627,240 | 563,281 | 537,913 | ||||||||||
|
|
|||||||||||||||
|
Commercial and industrial loans |
232,211 | 197,371 | 144,330 | 129,456 | 106,952 | ||||||||||
|
Consumer and other loans |
1,654 | 1,417 | 1,735 | 2,168 | 1,261 | ||||||||||
|
Net deferred loan origination costs |
1,187 | 783 | 679 | 759 | 870 | ||||||||||
|
Total gross loans and leases |
1,065,315 | 942,512 | 773,984 | 695,664 | 646,996 | ||||||||||
|
|
|||||||||||||||
|
Allowance for loan and |
|||||||||||||||
|
lease losses |
(14,019) | (13,916) | (12,883) | (12,533) | (11,503) | ||||||||||
|
|
|||||||||||||||
|
Loans and leases, net |
$ |
1,051,296 |
$ |
928,596 |
$ |
761,101 |
$ |
683,131 |
$ |
635,493 | |||||
Real Estate Loans
Approximately 78% of the Bank’s total loan portfolio at December 31, 2017 consisted of real estate loans or loans collateralized by mortgages on real estate, including residential mortgages, commercial mortgages and other types of real estate loans. The Bank’s real estate loan portfolio was $830 million at December 31, 2017, compared with $743 million at December 31, 2016. The real estate loan portfolio increased by 12% in 2017 over 2016 compared with an increase of 18% in 2016 over 2015.
The Bank offers fixed rate residential mortgage loans with terms of 10 to 30 years with, typically, up to an 80% loan-to-value (“LTV”) ratio. Any loans with a greater than 80% LTV have private mortgage insurance. Fixed rate residential mortgage loans outstanding totaled $128 million at December 31, 2017, which was 12% of total loans outstanding, compared with $116 million and 12%, respectively, at December 31, 2016. This balance did not include any construction residential mortgage loans, which are discussed below. The increase in residential mortgages occurred due to loan originations of $40 million in 2017, partially offset by payments within the portfolio during the year. Residential mortgage originations in 2016 were $42 million. The local real estate market was strong in 2017 with median sales prices continuing to rise at a healthy rate. While the number of closed sales in the local market was down in 2017 when compared to the previous year, it was still higher when compared to years preceding 2016.
The Bank has a contractual arrangement with FNMA, pursuant to which the Bank sells certain mortgage loans to FNMA and the Bank retains the servicing rights to those loans. The Bank determines with each origination of residential real estate loans which desired maturities, within the context of overall maturities in the loan portfolio, provide the appropriate mix to optimize the Bank’s ability to absorb the corresponding interest rate risk within the Company’s tolerance ranges. In 2017, the Bank sold $11 million in mortgages to FNMA under this arrangement, compared with $10 million in mortgages sold in 2016.
At December 31, 2017, the Bank had retained the servicing rights on $78 million in mortgages sold to FNMA, compared with a $76 million servicing portfolio to FNMA at December 31, 2016. The Company recorded a net servicing asset for such loans of $0.6 million and $0.5 million at December 31, 2017 and 2016, respectively. The value of the mortgage servicing rights increased due to the increase in the size of the servicing portfolio, offset by a slight decline in pricing.
The Bank offers adjustable rate residential mortgage loans with terms of up to 30 years. Rates on these mortgage loans remain fixed for a predetermined time and are adjusted annually thereafter. The Bank’s outstanding adjustable rate residential mortgage loans were $3 million or less than 1% of total loans outstanding at each of December 31, 2017 and 2016. With rates on fixed rate mortgage products at still near historic lows, there has been little demand for variable-rate products which has resulted in minimal growth in variable rate mortgage loan balances.
Overall, residential real estate loans increased 10%, from $119 million at December 31, 2016 to $131 million at December 31, 2017.
44
The Bank also offers commercial mortgage loans with up to an 80% LTV ratio for up to 20 years on a variable and fixed rate basis. Many of these mortgage loans either mature or are subject to a rate call after three to five years. To the extent required, loans exceeding an 80% LTV are reported on an exception report to the Board of Directors. The Bank’s outstanding commercial mortgage loans were $520 million at December 31, 2017, which was 49% of total loans outstanding, and 13% higher than the $462 million balance at December 31, 2016. The Company’s Western New York footprint continued to experience strong demand for commercial real estate in 2017. The balance at December 31, 2017 included $188 million in fixed rate and $332 million in variable rate commercial mortgage loans, which include interest rate calls.
The Bank also offers other types of loans collateralized by real estate, such as home equity loans. The Bank offers home equity loans at variable and fixed interest rates with terms of up to 15 years and up to an 85% combined LTV ratio. At December 31, 2017, the real estate loan portfolio included $70 million of home equity loans, which represented 7% of total loans outstanding, compared with $66 million and 7% at December 31, 2016, respectively. The total home equity portfolio included $65 million in variable rate loans and $5 million in fixed rate loans.
The Bank also offers both residential and commercial real estate construction loans at up to an 80% LTV ratio at fixed interest or adjustable interest rates and multiple maturities. At December 31, 2017, adjustable rate construction loans outstanding totaled $107 million, or 10% of total loans outstanding, and fixed rate real estate construction loans outstanding totaled $2 million, or less than 1% of total loan outstanding. At December 31, 2016, adjustable rate construction loans outstanding totaled $93 million, or 10% of total loans outstanding, and fixed rate real estate construction loans outstanding totaled $3 million, or less than 1% of total loans outstanding. Western New York has experienced a strong commercial construction market recently and the Company’s commercial real estate lending expertise has allowed the Company to take advantage of this strong market and grow this portfolio significantly over the past three years.
Commercial and Industrial Loans
The Bank offers C&I loans on a secured and unsecured basis, including lines of credit and term loans at fixed and variable interest rates and multiple maturities. The Bank’s C&I loan portfolio totaled $232 million at December 31, 2017, compared with $197 million at December 31, 2016, an 18% increase. The growth is attributable to an increased number of C&I relationship managers and good results achieved through the Bank’s community-focused and relationship-based lending approach in the local market. C&I loans represented 22% and 21% of the Bank’s total loans at the end of 2017 and 2016, respectively.
Collateral for C&I loans, where applicable, may consist of inventory, receivables, equipment and other business assets. At December 31, 2017, 59% of the Bank’s C&I loans were at variable rates which are tied to the prime rate or LIBOR.
Consumer Loans
The Bank’s consumer installment and other loan portfolio totaled $2 million and $1 million at December 31, 2017 and 2016, respectively, representing less than 1% of the Bank’s total loans outstanding at those same respective dates. Traditional installment loans are offered at fixed interest rates with various maturities of up to 60 months, on a secured and unsecured basis. This segment of the portfolio is done on an accommodation basis for customers. The Company does not actively try to grow the portfolio in a significant way. Other loans consisted primarily of cash reserves, overdrafts, and loan clearing accounts.
45
Loan Maturities and Sensitivities of Loans to Changes in Interest Rates
The following table shows the maturities of commercial and industrial loans and commercial real estate construction loans outstanding as of December 31, 2017 and the classification of those loans due after one year according to sensitivity to changes in interest rates.
|
|
||||||||||||
|
|
||||||||||||
|
|
||||||||||||
|
|
Within |
After One But |
After Five |
|||||||||
|
|
One Year |
Within Five Years |
Years |
Total |
||||||||
|
|
(in thousands) |
|||||||||||
|
Commercial and industrial |
$ |
83,268 |
$ |
96,145 |
$ |
52,798 |
$ |
232,211 | ||||
|
Commercial real estate construction |
66,547 | 15,712 | 25,015 | 107,274 | ||||||||
|
|
$ |
149,815 |
$ |
111,857 |
$ |
77,813 |
$ |
339,485 | ||||
|
|
||||||||||||
|
Loans maturing after one year with: |
||||||||||||
|
Fixed Rates |
$ |
60,974 |
$ |
38,450 | ||||||||
|
Variable Rates |
50,883 | 39,363 | ||||||||||
|
|
$ |
111,857 |
$ |
77,813 | ||||||||
SOURCES OF FUNDS
General
Customer deposits represent the primary source of the Bank’s funds for lending and other investment purposes. In addition to deposits, other sources of funds include loan repayments, loan sales on the secondary market, interest and dividend income from investments, matured investments, and borrowings from the Federal Home Loan Bank (“FHLB”) and from correspondent banks First Tennessee Bank and M&T Bank.
Deposits
The Bank offers a variety of deposit products, including checking, savings, NOW accounts, certificates of deposit and jumbo certificates of deposit. Bank deposits are insured up to the limits provided by the FDIC. The following table details the Bank’s deposits as of the dates indicated:
|
|
|||||||||
|
|
December 31, |
||||||||
|
|
2017 |
2016 |
2015 |
||||||
|
|
(in thousands) |
||||||||
|
|
|||||||||
|
Demand deposits |
$ |
219,664 |
$ |
201,741 |
$ |
183,098 | |||
|
NOW accounts |
109,378 | 88,632 | 83,674 | ||||||
|
Regular savings |
535,730 | 508,652 | 439,993 | ||||||
|
Time deposits, $100,000 and over |
103,703 | 70,216 | 40,066 | ||||||
|
Other time deposits |
82,754 | 70,733 | 56,151 | ||||||
|
Total |
$ |
1,051,229 |
$ |
939,974 |
$ |
802,982 | |||
46
The following schedule sets forth the maturities of the Bank’s time deposits as of December 31, 2017:
|
|
|||||||||||||||
|
|
Time Deposit Maturity Schedule |
||||||||||||||
|
|
0-3 Mos. |
3-6 Mos. |
6-12 Mos. |
Over 12 Mos. |
Total |
||||||||||
|
|
(in thousands) |
||||||||||||||
|
|
|||||||||||||||
|
Time deposits - $100,000 and over |
$ |
9,302 |
$ |
21,496 |
$ |
41,401 |
$ |
31,504 |
$ |
103,703 | |||||
|
Other time deposits |
5,488 | 12,208 | 30,414 | 34,644 | 82,754 | ||||||||||
|
Total time deposits |
$ |
14,790 |
$ |
33,704 |
$ |
71,815 |
$ |
66,148 |
$ |
186,457 | |||||
Total deposits increased $111 million or 12% in 2017 from the end of 2016. As noted in the “Net Interest Income” section of Management’s Discussion and Analysis, rising interest rates in 2017 led to a shift in the Company’s deposit mix. With the Company’s maintaining pricing discipline on its $388 million retail savings portfolio, the largest part of its total deposit portfolio, the Company’s main driver of deposit growth over the previous two years lagged in 2017. Retail savings deposits declined from $395 million at the end of 2016. Alternatively, the Company invested in its government banking program in an effort to enhance another opportunity to acquire core deposits. The Company also remained competitive in its retail time deposit products to offer retail customers an account that pays a higher interest rate.
The Company grew core transactional checking accounts, including non-interest bearing demand deposits and NOW accounts, by 13% to $329 million at December 31, 2017. The $18 million in growth in non-interest bearing demand deposits during 2017 was largely due to growth in commercial demand deposits of $9 million as the Company was able to attract new core customers and some current commercial customers maintained higher cash balances. Municipal demand deposits grew $5 million and retail demand deposits grew $4 million in 2017. The $21 million in growth in NOW accounts was primarily attributable to an increase in municipal NOW accounts of $16 million.
As of December 31, 2017, savings deposits increased $27 million, or 5%, over the previous year end. The growth in savings deposits was attributable to the Company’s investment in its government banking program as municipal deposits grew $48 million in 2017. Retail savings deposited declined $7 million in 2017 while commercial savings deposits fell $14 million.
Time deposits increased $46 million or 33% to $186 million as of December 31, 2017. As savings rates were held steady in a rising rate environment, retail depositors moved to time deposit products. The Company offered competitive rates for time deposits as a way to raise funds for loan growth and fix interest rates for a portion of its deposit portfolio.
The following table shows daily average deposits and average rates paid on significant deposit categories by the Bank:
|
|
||||||||||||||||||
|
|
||||||||||||||||||
|
|
2017 |
2016 |
2015 |
|||||||||||||||
|
|
Average Balance |
Weighted Average Rate |
Average Balance |
Weighted Average Rate |
Average Balance |
Weighted Average Rate |
||||||||||||
|
|
(in thousands) |
|||||||||||||||||
|
|
||||||||||||||||||
|
Demand deposits |
$ |
208,898 |
- |
% |
$ |
185,029 |
- |
% |
$ |
166,611 |
- |
% |
||||||
|
NOW accounts |
93,881 | 0.22 |
% |
87,215 | 0.30 |
% |
78,801 | 0.41 |
% |
|||||||||
|
Regular savings |
536,862 | 0.48 |
% |
478,252 | 0.48 |
% |
418,020 | 0.38 |
% |
|||||||||
|
Time deposits |
160,440 | 1.30 |
% |
117,682 | 1.24 |
% |
102,711 | 1.39 |
% |
|||||||||
|
Total |
$ |
1,000,081 | 0.49 |
% |
$ |
868,178 | 0.46 |
% |
$ |
766,143 | 0.44 |
% |
||||||
Federal Funds Purchased and Other Borrowed Funds. Another source of the Bank’s funds for lending and investing activities is borrowings from the FHLB. The Bank had $78 million outstanding on its overnight line of credit with the FHLB as of December 31, 2017, compared with $18 million at the previous year end. The Bank’s utilization of its overnight line of credit with the FHLB increased in 2017 to fund loan growth and investment security purchases. The Bank also had an FHLB advance of $10 million outstanding with a rate of 1.73% maturing in 2020 at each of December 31, 2017 and 2016.
47
Securities Sold Under Agreements to Repurchase
The Bank enters into agreements with certain customers to sell securities owned by the Bank to those customers and repurchase the identical security within one day. No physical movement of the securities is involved. The customer is informed that the securities are held in safekeeping by the Bank on behalf of the customer. Securities sold under agreements to repurchase totaled $9 million at December 31, 2017 compared with $10 million at December 31, 2016. Balances can vary day to day based on customer needs.
Pension
The Bank maintains a qualified defined benefit pension plan (the “Pension Plan”), which covered substantially all employees of the Bank at the time the Pension Plan was frozen on January 31, 2008. All benefits eligible participants accrued in the Pension Plan to the freeze date have been retained. Employees have not accrued additional benefits in the Pension Plan from that date. Employees will be eligible to receive these benefits at normal retirement age. Additionally, the Company has entered into individual retirement agreements with certain of its executive officers providing for unfunded supplemental pension benefits under the Company’s Supplemental Executive Retirement Plan and Senior Executive Supplemental Executive Retirement Plan (collectively, the “SERP plans”). Information about the Company’s Pension Plan and SERP plans, including contributions, pension expense and actuarial assumptions, including return on plan assets and the discount rate utilized to determine future pension obligations, can be found in Note 11 to the Consolidated Financial Statements included in Item 8 of this Annual Report on Form 10-K.
Management decided to fully fund the Pension Plan in 2017 with a $1 million contribution. As a result, the primary objective of the investment philosophy for the management of the Pension Plan assets shifted from long term capital appreciation to capital preservation. Management believes that bcause the Pension Plan is frozen, managing the assets of the Pension Plan with a lower risk investment strategy is the optimal course of action. Furthermore, by making the large contribution in 2017, the Company maximized the tax benefit of the deduction considering lower rate under TCJA.
Management tested the sensitivity of the pension expense to changes in three key assumptions: return on plan assets, the discount rate, and salary rate increases. A 0.25% decrease in the rate of return on plan assets would have resulted in a decrease in pension expense of 32% or $11 thousand. A 0.25% decrease in the discount rate would have resulted in a decrease in pension expense of 8% or $3 thousand. Since the Pension Plan has been frozen, pension expense is not sensitive to compensation scale increases or decreases. The SERP has no plan assets; therefore there is no rate of return on plan assets. A 0.25% decrease in the discount rate would have resulted in an increase in SERP expense of 3% or $11 thousand. A 0.25% increase in the rate of annual salary increases would have resulted in an increase in SERP expense of 1% or $4 thousand.
Liquidity
The Company utilizes cash flows from its investment portfolio and federal funds sold balances to manage the liquidity requirements it experiences due to loan demand and deposit fluctuations. The Bank also has many borrowing options. As a member of the FHLB, the Bank is able to borrow funds at competitive rates. Given the current collateral available, advances of up to $164 million can be drawn on the FHLB via the Bank’s Overnight Line of Credit Agreement. An amount equal to 25% of the Bank’s total assets could be borrowed through the advance programs under certain qualifying circumstances. The Bank also has the ability to purchase up to $18 million in federal funds from its correspondent banks. By placing sufficient collateral in safekeeping at the Federal Reserve Bank, the Bank could also borrow at the FRB’s discount window. The Company’s liquidity needs also can be met by more aggressively pursuing time deposits, or accessing the brokered time deposit market, including the Certificate of Deposit Account Registry Service (“CDARS”) network. Additionally, the Company has access to capital markets as a funding source.
The cash flows from the Company’s investment portfolio are laddered, so that securities mature at regular intervals, to provide funds from principal and interest payments at various times as liquidity needs may arise. Contractual maturities are also laddered, with consideration as to the volatility of market prices, so that securities are available for sale from time-to-time without the need to incur significant losses. At December 31, 2017, approximately 7% of the Company’s debt securities had maturity dates of one year or less, and approximately 23% had maturity dates of five years or less. In addition, the Company receives regular cash flows on its mortgage-backed securities.
Management, on an ongoing basis, closely monitors the Company’s liquidity position for compliance with internal policies, and believes that available sources of liquidity are adequate to meet funding needs in the normal course of business. As part of that monitoring process, management calculates the 90-day liquidity each month by analyzing the cash needs of the Bank. Included in the calculation are liquid assets and potential liabilities. Management stresses the potential liabilities calculation to ensure a strong liquidity position. Included in the calculation are assumptions of some significant deposit run-off as well as funds needed for loan closing and investment purchases. At December 31, 2017, in the stress test, the Bank had net short-term liquidity available of $237 million as compared with $248 million at December 31, 2016. Available assets of $157 million divided by public and purchased funds of $319 million, resulted in a long-term liquidity ratio of 49% at December 31, 2017, compared with 58% at December 31, 2016. This decrease was driven
48
primarily by an increase in outstanding short-term borrowings as a result of strong loan growth throughout the year that outpaced deposit growth.
Management does not anticipate engaging in any activities, either currently or over the long-term, for which adequate funding would not be available and which would therefore result in significant pressure on liquidity. However, an economic recession could negatively impact the Company’s liquidity. The Bank relies heavily on FHLBNY as a source of funds, particularly with its overnight line of credit. In past economic recessions, some FHLB branches have suspended dividends, cut dividend payments, and not bought back excess FHLB stock that members hold in an effort to conserve capital. FHLBNY has stated that they expect to be able to continue to pay dividends, redeem excess capital stock, and provide competitively priced advances in the future. Historically, the most severe problems in FHLB have been at some of the other FHLB branches. Nonetheless, the 12 FHLB branches are jointly liable for the consolidated obligations of the FHLB system. To the extent that one FHLB branch cannot meet its obligations to pay its share of the system’s debt, other FHLB branches can be called upon to make the payment.
Systemic weakness in the FHLB could result in higher costs of FHLB borrowings and increased demand for alternative sources of liquidity that are more expensive, such as brokered time deposits, the discount window at the Federal Reserve, or lines of credit with correspondent banks First Tennessee Bank and M&T Bank.
Contractual Obligations
The Company is party to contractual financial obligations, including repayment of borrowings, operating lease payments and commitments to extend credit. The table below presents certain future financial obligations.
|
|
|||||||||||||||
|
|
|||||||||||||||
|
|
Payments due within time period at December 31, 2017 |
||||||||||||||
|
|
(in thousands) |
||||||||||||||
|
|
Total |
Less Than 1 Year |
1 - 3 Years |
3 - 5 Years |
More Than 5 Years |
||||||||||
|
Contractual Obligations: |
|||||||||||||||
|
Securities sold under agreement |
|||||||||||||||
|
to repurchase |
$ |
9,289 |
$ |
9,289 |
$ |
- |
$ |
- |
$ |
- |
|||||
|
Operating lease obligations |
5,488 | 662 | 1,245 | 1,085 | 2,496 | ||||||||||
|
Other borrowed funds |
88,250 | 78,250 | 10,000 |
- |
- |
||||||||||
|
Junior subordinated debentures |
11,330 |
- |
- |
- |
11,330 | ||||||||||
|
Total |
$ |
114,357 |
$ |
88,201 |
$ |
11,245 |
$ |
1,085 |
$ |
13,826 | |||||
|
|
|||||||||||||||
|
Interest expense on fixed rate debt |
$ |
396 |
$ |
173 |
$ |
223 |
$ |
- |
$ |
- |
|||||
At December 31, 2017, the Company had commitments to extend credit of $248 million compared with $218 million at December 31, 2016. For additional information regarding future financial commitments, this disclosure should be read in conjunction with Note 16 to the Company’s Consolidated Financial Statements included in Item 8 of this Annual Report on Form 10-K.
Capital
Total Company stockholders’ equity was $118 million at December 31, 2017, an increase from $97 million at December 31, 2016. Equity as a percentage of assets was 9.1% at December 31, 2017, compared with 8.8% at December 31, 2016. Book value per share of common stock increased to $24.74 at December 31, 2017 from $22.50 at December 31, 2016. The reason for the increase in stockholders’ equity and book value per share was primarily related to a common stock issuance that netted $14 million in proceeds in January 2017 and $10 million in net income, offset in part by $4 million in dividends paid to common stockholders in 2017. In January 2017, the Company completed a registered common stock offering that netted the Company $14 million in additional capital after expenses. The Company issued 440,000 shares at $35.00 per share (including shares issued upon partial exercise of the underwriters’ allotment option in connection with the offering). The offering was accretive to book value per share.
The dividend payment of $0.80 per share in 2017 was $0.04, or 5% higher per share than dividends paid in 2016. The Company typically pays a semi-annual dividend in April and October of each year. Management and the Board of Directors of the Company believe that the dividend level is prudent to maintain available capital to support the continued growth of the Company, as well as to manage the Company’s and the Bank’s capital ratios, while providing a dividend yield (dividend per share divided by stock price) competitive with peers in the industry at an annualized rate of 1.9% at December 31, 2017.
49
Included in stockholders’ equity was accumulated other comprehensive income/(loss) which includes the net after-tax impact of unrealized gains or losses on investment securities classified as available for sale. Net unrealized losses after tax were $1.0 million, or $0.22 per share of common stock, at December 31, 2017, compared with net unrealized losses on available-for-sale investment securities after tax of $0.4 million, or $0.08 per share of common stock, at December 31, 2016. Such unrealized gains and losses are generally due to changes in interest rates and represent the difference, net of applicable income tax effect, between the estimated fair value and amortized cost of investment securities classified as available-for-sale. The Company had no other-than-temporary impairment charges in its investment portfolio in 2017 or 2016.
The Company and the Bank have consistently maintained regulatory capital ratios above well capitalized standards. For further detail on capital and capital ratios, see Note 20 to the Company’s Consolidated Financial Statements included under Item 8 of this Annual Report on Form 10-K.
Market Risk
Market risk is the risk of loss from adverse changes in market prices and/or interest rates of the Bank’s financial instruments. The primary market risk the Company is exposed to is interest rate risk. The core banking activities of lending and deposit-taking expose the Bank to interest rate risk, which occurs when assets and liabilities re-price at different times and by different amounts as interest rates change. As a result, net interest income earned by the Bank is subject to the effects of changing interest rates. The Bank measures interest rate risk by calculating the variability of net interest income in the future periods under various interest rate scenarios using projected balances for interest-earning assets and interest-bearing liabilities. Management’s philosophy toward interest rate risk management is to limit the variability of net interest income. The balances of financial instruments used in the projections are based on expected growth from forecasted business opportunities, anticipated prepayments of loans and investment securities and expected maturities of investment securities, loans and deposits. Management supplements the modeling technique described above with the analysis of market values of the Bank’s financial instruments and changes to such market values given changes in interest rates.
ALCO, which includes members of the Bank’s senior management, monitors the Bank’s interest rate sensitivity with the aid of a model that considers the impact of ongoing lending and deposit gathering activities, as well as the interrelationships between the magnitude and timing of the re-pricing of financial instruments, including the effect of changing interest rates on expected prepayments and maturities. When deemed prudent, the Bank’s management has taken actions and intends to do so in the future, to mitigate the Bank's exposure to interest rate risk through the use of on or off-balance sheet financial instruments. Possible actions include, but are not limited to, changes in the pricing of loan and deposit products, modifying the composition of interest-earning assets and interest-bearing liabilities, and the purchase of other financial instruments used for interest rate risk management purposes. In 2017 and 2016, the Bank did not use off-balance sheet financial instruments to manage interest rate risk.
SENSITIVITY OF NET INTEREST INCOME TO CHANGES IN INTEREST RATES
|
|
||||||
|
|
Calculated increase |
|||||
|
|
in projected annual net interest income |
|||||
|
|
(in thousands) |
|||||
|
|
||||||
|
|
December 31, 2017 |
December 31, 2016 |
||||
|
Changes in interest rates |
||||||
|
|
||||||
|
+200 basis points |
$ |
1,907 |
$ |
1,838 | ||
|
+100 basis points |
2,927 | 2,590 | ||||
|
|
||||||
|
-100 basis points |
(3,268) |
NM |
||||
|
-200 basis points |
NM |
NM |
||||
Many assumptions are utilized by the Bank to calculate the impact that changes in interest rates may have on net interest income. The more significant assumptions relate to the rate of prepayments of mortgage-related assets, loan and deposit volumes and pricing, and deposit maturities. The Bank also assumes immediate changes in rates, including 100 and 200 basis point rate changes. In the event that a 100 or 200 basis point rate change cannot be achieved, the applicable rate changes are limited to lesser amounts, such that interest rates cannot be less than zero. These assumptions are inherently uncertain and, as a result, the Bank cannot precisely predict the impact of changes in interest rates on net interest income. Actual results may differ significantly due to the timing, magnitude, and frequency of interest rate changes in market conditions and interest rate differentials (spreads) between maturity/re-pricing categories, as well as any actions, such as those previously described, which management may take to counter such changes. At each of December 31, 2017 and December 31, 2016, the Bank's projected net interest income benefitted more from a 100 basis point increase in market rates
50
compared with a 200 basis point increase in rates. This relationship was due in part to expected increases in deposit rates needed to retain deposit customers if rates moved up 200 basis points but were not required if rates only moved 100 basis points higher. In light of the uncertainties and assumptions associated with the process, the amounts presented in the table, and changes in such amounts, are not considered significant to the Bank’s projected net interest income.
Financial instruments with off-balance sheet risk at December 31, 2017 included $226 million in undisbursed lines of credit at an average interest rate of 4.43%; $4 million in fixed rate loan origination commitments at 4.15%; and $3 million in adjustable rate letters of credit, which if drawn upon, would typically earn an interest rate equal to the prime lending rate plus 2%. Unused overdraft protection lines totaled $16 million, which if drawn upon, would also typically earn an interest rate equal to the prime lending rate plus 2%.
The following table represents expected maturities of interest-bearing assets and liabilities and their corresponding average interest rates.
|
|
||||||||||||||||||||||||||||||||
|
|
||||||||||||||||||||||||||||||||
|
|
||||||||||||||||||||||||||||||||
|
Expected maturity year ended December 31, |
||||||||||||||||||||||||||||||||
|
|
2018 |
2019 |
2020 |
2021 |
2022 |
Thereafter |
Total |
Fair Value |
||||||||||||||||||||||||
|
|
(in thousands) |
|||||||||||||||||||||||||||||||
|
Interest-bearing Assets |
||||||||||||||||||||||||||||||||
|
Gross loan and lease |
||||||||||||||||||||||||||||||||
|
receivables |
$ |
177,149 |
$ |
57,750 |
$ |
46,643 |
$ |
66,898 |
$ |
80,262 |
$ |
636,613 |
$ |
1,065,315 |
$ |
1,047,967 | ||||||||||||||||
|
Average interest |
4.81 |
% |
5.14 |
% |
5.01 |
% |
4.41 |
% |
4.79 |
% |
4.48 |
% |
4.61 |
% |
4.61 |
% |
||||||||||||||||
|
|
||||||||||||||||||||||||||||||||
|
Investment securities |
$ |
10,100 |
$ |
5,807 |
$ |
11,505 |
$ |
4,363 |
$ |
3,104 |
$ |
114,273 |
$ |
149,152 |
$ |
149,079 | ||||||||||||||||
|
Average interest |
1.92 |
% |
2.23 |
% |
1.88 |
% |
1.98 |
% |
2.19 |
% |
2.67 |
% |
2.51 |
% |
2.51 |
% |
||||||||||||||||
|
|
||||||||||||||||||||||||||||||||
|
Interest-bearing Liabilities |
||||||||||||||||||||||||||||||||
|
Interest-bearing |
||||||||||||||||||||||||||||||||
|
deposits |
$ |
765,417 |
$ |
31,877 |
$ |
18,160 |
$ |
10,390 |
$ |
5,721 |
$ |
- |
$ |
831,565 |
$ |
832,890 | ||||||||||||||||
|
Average interest |
0.61 |
% |
1.54 |
% |
1.64 |
% |
1.48 |
% |
1.46 |
% |
- |
% |
0.69 |
% |
0.69 |
% |
||||||||||||||||
|
|
||||||||||||||||||||||||||||||||
|
Other borrowed funds |
$ |
78,250 |
$ |
- |
$ |
10,000 |
$ |
- |
$ |
- |
$ |
- |
$ |
88,250 |
$ |
88,132 | ||||||||||||||||
|
Average interest |
1.53 |
% |
- |
% |
1.73 |
% |
- |
% |
- |
% |
- |
% |
1.55 |
% |
1.55 |
% |
||||||||||||||||
|
|
||||||||||||||||||||||||||||||||
|
Securities sold under |
||||||||||||||||||||||||||||||||
|
agreements to repurchase |
$ |
9,289 |
$ |
- |
$ |
- |
$ |
- |
$ |
- |
$ |
- |
$ |
9,289 |
$ |
9,290 | ||||||||||||||||
|
Average interest |
0.19 |
% |
- |
% |
- |
% |
- |
% |
- |
% |
- |
% |
0.19 |
% |
0.19 |
% |
||||||||||||||||
|
|
||||||||||||||||||||||||||||||||
|
Junior subordinated |
||||||||||||||||||||||||||||||||
|
debt |
$ |
- |
$ |
- |
$ |
- |
$ |
- |
$ |
- |
$ |
11,330 |
$ |
11,330 |
$ |
11,330 | ||||||||||||||||
|
Average interest |
- |
% |
- |
% |
- |
% |
- |
% |
- |
% |
4.10 |
% |
4.10 |
% |
4.10 |
% |
||||||||||||||||
When rates rise or fall, the market value of the Company’s rate-sensitive assets and liabilities, increases or decreases. As a part of the Company’s asset/liability policy, the Company has set limitations on the acceptable level of the negative impact of such rate fluctuations on the market value of the Company’s balance sheet. The Bank’s securities portfolio is priced monthly and adjustments are made on the balance sheet to reflect the market value of the available for sale portfolio per ASC Topic 320 “Investments – Debt and Equity Securities.” At December 31, 2017, the impact to equity, net of tax, as a result of marking available for sale securities to market was an unrealized loss of $1.0 million. On a monthly basis, the available for sale portfolio is shocked for immediate rate increases of 200 basis points. At December 31, 2017, the Company determined it would take an immediate increase in rates in excess of 200 basis points to eliminate the current capital cushion in excess of regulatory requirements. The Company’s and the Bank’s capital ratios are also reviewed by management on a quarterly basis.
Capital Expenditures
Significant planned expenditures for 2018 include the purchase of technology to improve workflow automation and operational efficiency. The Company believes it has a sufficient capital base to support these known and potential capital expenditures, currently expected to total approximately $1.4 million, with current assets.
51
Impact of Inflation and Changing Prices
There will continually be economic events, such as changes in the economic policies of the FRB, which will have an impact on the profitability of the Company. Inflation may result in impaired asset growth, reduced earnings and substandard capital ratios. The net interest margin can be adversely impacted by the volatility of interest rates throughout the year. Since these factors are unknown, management attempts to structure the balance sheet and re-pricing frequency of assets and liabilities to avoid a significant concentration that could result in a negative impact on earnings.
Segment Information
In accordance with the provisions of ASC 280, “Segment Reporting,” the Company’s operating segments have been determined based upon its internal profitability reporting. The Company’s operating segments consist of banking activities and insurance agency activities.
The banking activities segment includes all of the activities of the Bank in its function as a full-service commercial bank. Net income from banking activities was $9.6 million in 2017 compared with $7.4 million in 2016. The increase in net income from banking activities was driven primarily by net interest income, which increased 19% from $35.4 million in 2016 to $42.1 million in 2017. The increase in net interest income resulted from strong loan and core deposit growth. Total assets of the banking activities segment increased $194 million or 18% during 2017 to $1.3 billion at December 31, 2017.
The insurance activities segment includes activities of TEA, a property and casualty insurance agency with locations in the Western New York area. Net income from insurance activities was $0.9 million in 2017, an increase from $0.8 million in 2016. The increase in net income in the insurance activities segment primarily resulted from a $1.4 million increase in revenue. The higher revenue reflected an increase in several business lines, including commercial lines, personal lines, employee benefits, and profit sharing. The increase in revenue was largely offset by an increase in expenses of $1.2 million as TEA made significant investments in the sales talent that drove the top line revenue growth. TEA’s total assets were $10.5 million at December 31, 2017, compared with $9.4 million at December 31, 2016.
Fourth Quarter 2017 Results
Net income was $1.0 million, or $0.20 per diluted share, in the fourth quarter of 2017 compared with
$3.7 million, or $0.76 per diluted share, in the trailing third quarter of 2017 and $2.3 million, or $0.53 per diluted share, in last year’s fourth quarter. The decrease in net income was primarily attributable to the deferred tax asset remeasurement impact of $2.1 million due to the lower federal corporate tax rate in the TCJA. Return on average equity was 3.32% for the fourth quarter of 2017 compared with 12.71% in the trailing third quarter and 9.70% in the prior-year period.
Net interest income increased $0.1 million, or 1%, from the trailing third quarter of 2017 and $1.8 million, or 19%, from the prior-year fourth quarter to $11.2 million in the fourth quarter of 2017, reflecting strong loan and demand deposit growth. The Company’s commercial loan portfolio grew at a significant rate as average commercial loan balances, including both commercial real estate and commercial and industrial (“C&I”) loans, were $822 million in the fourth quarter of 2017, up 4%, or 17% on an annualized basis, from $789 million in the trailing third quarter and 10% from $745 million in the 2016 fourth quarter.
Net interest margin of 3.79% in the fourth quarter of 2017 declined 12 basis points from the 2017 third quarter, but improved 13 basis points from the prior year’s fourth quarter. The trailing third quarter’s net interest income benefited $0.4 million, or 14 basis points, from the full payoff of two loans that were formerly in nonaccrual status. At the time of the payoff, $0.4 million in interest payments previously received were recognized as income. The uptick in net interest margin year-over-year was due to an improvement in loan yields, which continued to benefit from the re-pricing of variable rate loans tied to the Company’s prime rate. The prime rate was 4.50% as of the end of 2017 compared with 4.25% at September 30, 2017 and 3.75% at the conclusion of 2016. The change in prime rate reflects the increase in the federal funds rate targeted by the FRB. This improvement in loan yields was somewhat offset by an increase in the cost of interest-bearing liabilities. The average rate paid on deposits and other borrowings was 0.73% in the fourth quarter of 2017 compared with 0.69% in the third quarter of 2017 and 0.64% in the fourth quarter of 2016. With rising short-term interest rates and the Company seeking to exercise pricing discipline, savings deposit growth slowed significantly in the second half of 2017. As a result, during the fourth quarter of 2017 the Company funded most of its loan growth with time deposits and other wholesale borrowings which have a higher average cost than savings deposits. When compared with last year’s fourth quarter, the average time deposit rate of 1.34% was 9 basis points higher and the average other borrowings rate of 1.71% was 45 basis points higher.
The increase in loan loss provision in the fourth quarter of 2017 to $0.6 million from $0.2 million in the third quarter of 2017 and $0.4 million in the fourth quarter of the prior year was mostly due to the quarter’s significant loan growth and a single charge-off of a C&I loan in the quarter of $0.8 million. The loan was considered impaired and in nonaccrual status with a $0.4 million reserve at September 30, 2017. Outside the large charge-off, other credit quality metrics were favorable, including an $8 million decrease in criticized loans from $38 million at each of December 31, 2016 and September 30, 2017 to $30 million at the end of 2017.
52
Non-interest income was $3.0 million in the fourth quarter of 2017, compared with $3.4 million in the third quarter of 2017 and $2.6 million in the prior-year period. In the final quarter of 2017, the positive impact to net income related to historic tax credit investments was $0.5 million as a $1.2 million refundable New York State tax credit was recorded in non-interest income and a corresponding $1.0 million tax benefit was realized in income tax expense, offset by a $1.7 million write-off on the investment recorded in non-interest income. Insurance revenue decreased $0.5 million from the trailing third quarter to $1.6 million in the fourth quarter of 2017 due to the seasonal decrease in commercial lines insurance commissions. The increase of $0.3 million from the previous year’s fourth quarter resulted from improved performance across various business lines, including commercial lines insurance, personal lines insurance, and employee benefit plans sales. The Company recognized a $0.3 million gain on a BOLI claim in the fourth quarter of 2017. There were no policy claims in the third quarter of 2017 or fourth quarter of 2016.
Total non-interest expense was $10.4 million in the fourth quarter of 2017, an increase of 6%, or $0.6 million, from $9.8 million in the third quarter of 2017 and was $1.3 million, or 14%, higher than expenses in the prior-year fourth quarter. Salaries and benefits costs of $6.3 million were flat when compared with the third quarter of 2017, but 8% higher than last year’s fourth quarter, reflecting strategic personnel hires in 2017 to support the Company’s continued growth.
The increase in other expenses in the fourth quarter reflects a $0.3 million contribution to the Evans Bank Foundation Fund (“the Foundation”). The Foundation contributes to community organizations reflecting the Company’s values and impacting the Western New York region in a positive and meaningful way.
The efficiency ratio for the fourth quarter of 2017 was 70.4% and improved from the 74.2% ratio in the fourth quarter of 2016, but was higher than the 66.2% ratio in the third quarter of 2017. The increase over the third quarter reflects the impact of seasonal insurance agency revenue and the contribution to the Foundation while the improvement from last year’s fourth quarter reflects the strong net interest income growth.
Income tax expense for the fourth quarter of 2017 was $2.2 million, representing an effective tax rate of 69.0% compared with an effective tax rate of 16.6% in the third quarter of 2017 and 7.8% in the fourth quarter of 2016. The increase was driven by the $2.1 million expense related to the remeasurement of the Company’s deferred tax asset due to the enactment of the TCJA in December 2017 and by the impact of historic tax credit investment transactions in each of the periods.
Item 7A.QUANTITATIVE AND QUALITATIVE DISCLOSURES ABOUT MARKET RISK
The information called for by this Item is incorporated by reference to the discussion of "Liquidity" and "Market Risk”, including the discussion under the caption "Sensitivity of Net Interest Income to Changes in Interest Rates" included in Part II, Item 7. Management’s Discussion and Analysis of Financial Condition and Results of Operations of this Annual Report on Form 10-K.
53
Item 8.FINANCIAL STATEMENTS AND SUPPLEMENTARY DATA
Financial Statements and Supplementary Data consist of the financial statements as indexed and presented below and the Unaudited Quarterly Financial Data presented in Note 22 to our Consolidated Financial Statements.
54
Management's Annual Report on Internal Control Over Financial Reporting
Management is responsible for establishing and maintaining adequate internal control over financial reporting for Evans Bancorp, Inc. and subsidiaries (the “Company”). Management has assessed the effectiveness of the Company’s internal control over financial reporting as of December 31, 2017 based on criteria established in Internal Control-Integrated Framework (2013) issued by the Committee of Sponsoring Organizations of the Treadway Commission (COSO). Based on that assessment, management concluded that the Company maintained effective internal control over financial reporting as of December 31, 2017.
The Company's consolidated financial statements for the fiscal year ended December 31, 2017 were audited by KPMG LLP, an independent registered public accounting firm. KPMG LLP also audited the effectiveness of the Company's internal control over financial reporting as of December 31, 2017, as stated in their report, which appears in the "Report of Independent Registered Public Accounting Firm" immediately following this annual report of management.
EVANS BANCORP, INC. AND SUBSIDIARIES
/s/ David J. Nasca
David J. Nasca
President and Chief Executive Officer
/s/ John B. Connerton
John B. Connerton
Treasurer
55
Report of Independent Registered Public Accounting Firm
To the Stockholders and Board of Directors
Evans Bancorp, Inc.:
Opinion on the Consolidated Financial Statements
We have audited the accompanying consolidated balance sheets of Evans Bancorp, Inc. and subsidiaries (the “Company”) as of December 31, 2017 and 2016, the related consolidated statements of income, comprehensive income, changes in stockholders’ equity, and cash flows for each of the years in the three‑year period ended December 31, 2017, and the related notes (collectively, the “consolidated financial statements”). In our opinion, the consolidated financial statements present fairly, in all material respects, the financial position of the Company as of December 31, 2017 and 2016, and the results of its operations and its cash flows for each of the years in the three‑year period ended December 31, 2017, in conformity with U.S. generally accepted accounting principles.
We also have audited, in accordance with the standards of the Public Company Accounting Oversight Board (United States) (“PCAOB”), the Company’s internal control over financial reporting as of December 31, 2017, based on criteria established in Internal Control – Integrated Framework (2013) issued by the Committee of Sponsoring Organizations of the Treadway Commission, and our report dated March 1, 2018 expressed an unqualified opinion on the effectiveness of the Company’s internal control over financial reporting
Basis for Opinion
These consolidated financial statements are the responsibility of the Company’s management. Our responsibility is to express an opinion on these consolidated financial statements based on our audits. We are a public accounting firm registered with the PCAOB and are required to be independent with respect to the Company in accordance with the U.S. federal securities laws and the applicable rules and regulations of the Securities and Exchange Commission and the PCAOB.
We conducted our audits in accordance with the standards of the PCAOB. Those standards require that we plan and perform the audit to obtain reasonable assurance about whether the consolidated financial statements are free of material misstatement, whether due to error or fraud. Our audits included performing procedures to assess the risks of material misstatement of the consolidated financial statements, whether due to error or fraud, and performing procedures that respond to those risks. Such procedures included examining, on a test basis, evidence regarding the amounts and disclosures in the consolidated financial statements. Our audits also included evaluating the accounting principles used and significant estimates made by management, as well as evaluating the overall presentation of the consolidated financial statements. We believe that our audits provide a reasonable basis for our opinion.

We have served as the Company’s auditor since 2003.
Buffalo, New York
March 1, 2018
56
Report of Independent Registered Public Accounting Firm
To the Stockholders and Board of Directors
Evans Bancorp, Inc.:
Opinion on Internal Control Over Financial Reporting
We have audited Evans Bancorp, Inc. and subsidiaries’ (the “Company”) internal control over financial reporting as of December 31, 2017, based on criteria established in Internal Control – Integrated Framework (2013) issued by the Committee of Sponsoring Organizations of the Treadway Commission. In our opinion, the Company maintained, in all material respects, effective internal control over financial reporting as of December 31, 2017, based on criteria established in Internal Control – Integrated Framework (2013) issued by the Committee of Sponsoring Organizations of the Treadway Commission.
We also have audited, in accordance with the standards of the Public Company Accounting Oversight Board (United States) (“PCAOB”), the consolidated balance sheets of the Company as of December 31, 2017 and 2016, the related consolidated statements of income, comprehensive income, changes in stockholders’ equity, and cash flows for each of the years in the three-year period ended December 31, 2017, and the related notes (collectively, the “consolidated financial statements”), and our report dated March 1, 2018 expressed an unqualified opinion on those consolidated financial statements.
Basis for Opinion
The Company’s management is responsible for maintaining effective internal control over financial reporting and for its assessment of the effectiveness of internal control over financial reporting, included in the accompanying Management’s Annual Report on Internal Control over Financial Reporting. Our responsibility is to express an opinion on the Company’s internal control over financial reporting based on our audit. We are a public accounting firm registered with the PCAOB and are required to be independent with respect to the Company in accordance with the U.S. federal securities laws and the applicable rules and regulations of the Securities and Exchange Commission and the PCAOB.
We conducted our audit in accordance with the standards of the PCAOB. Those standards require that we plan and perform the audit to obtain reasonable assurance about whether effective internal control over financial reporting was maintained in all material respects. Our audit of internal control over financial reporting included obtaining an understanding of internal control over financial reporting, assessing the risk that a material weakness exists, and testing and evaluating the design and operating effectiveness of internal control based on the assessed risk. Our audit also included performing such other procedures as we considered necessary in the circumstances. We believe that our audit provides a reasonable basis for our opinion.
Definition and Limitations of Internal Control Over Financial Reporting
A company’s internal control over financial reporting is a process designed to provide reasonable assurance regarding the reliability of financial reporting and the preparation of financial statements for external purposes in accordance with generally accepted accounting principles. A company’s internal control over financial reporting includes those policies and procedures that (1) pertain to the maintenance of records that, in reasonable detail, accurately and fairly reflect the transactions and dispositions of the assets of the company; (2) provide reasonable assurance that transactions are recorded as necessary to permit preparation of financial statements in accordance with generally accepted accounting principles, and that receipts and expenditures of the company are being made only in accordance with authorizations of management and directors of the company; and (3) provide reasonable assurance regarding prevention or timely detection of unauthorized acquisition, use, or disposition of the company’s assets that could have a material effect on the financial statements.
Because of its inherent limitations, internal control over financial reporting may not prevent or detect misstatements. Also, projections of any evaluation of effectiveness to future periods are subject to the risk that controls may become inadequate because of changes in conditions, or that the degree of compliance with the policies or procedures may deteriorate.
Buffalo, New York
March 1, 2018
|
|
57
|
CONSOLIDATED BALANCE SHEETS |
||||||
|
December 31, 2017 AND DECEMBER 31, 2016 |
||||||
|
(in thousands, except share and per share amounts) |
||||||
|
|
December 31, |
December 31, |
||||
|
|
2017 |
2016 |
||||
|
ASSETS |
||||||
|
Cash and due from banks |
$ |
13,751 |
$ |
12,503 | ||
|
Interest-bearing deposits at banks |
7,579 | 581 | ||||
|
Securities: |
||||||
|
Available for sale, at fair value (amortized cost: $145,232 at December 31, 2017; |
143,818 | 95,222 | ||||
|
$95,810 at December 31, 2016) |
||||||
|
Held to maturity, at amortized cost (fair value: $5,261 at December 31, 2017; |
5,334 | 1,983 | ||||
|
$1,959 at December 31, 2016) |
||||||
|
Federal Home Loan Bank common stock, at cost |
4,863 | 2,185 | ||||
|
Federal Reserve Bank common stock, at cost |
1,916 | 1,546 | ||||
|
Loans, net of allowance for loan losses of $14,019 at December 31, 2017 |
||||||
|
and $13,916 at December 31, 2016 |
1,051,296 | 928,596 | ||||
|
Properties and equipment, net of accumulated depreciation of $18,255 at December 31, 2017 |
||||||
|
and $17,012 at December 31, 2016 |
10,564 | 11,310 | ||||
|
Goodwill and intangible assets |
8,553 | 8,406 | ||||
|
Bank-owned life insurance |
27,729 | 21,534 | ||||
|
Other assets |
20,230 | 16,843 | ||||
|
|
||||||
|
TOTAL ASSETS |
$ |
1,295,633 |
$ |
1,100,709 | ||
|
|
||||||
|
LIABILITIES AND STOCKHOLDERS' EQUITY |
||||||
|
LIABILITIES |
||||||
|
Deposits: |
||||||
|
Demand |
$ |
219,664 |
$ |
201,741 | ||
|
NOW |
109,378 | 88,632 | ||||
|
Savings |
535,730 | 508,652 | ||||
|
Time |
186,457 | 140,949 | ||||
|
Total deposits |
1,051,229 | 939,974 | ||||
|
|
||||||
|
Securities sold under agreement to repurchase |
9,289 | 10,159 | ||||
|
Other borrowings |
88,250 | 28,200 | ||||
|
Other liabilities |
17,193 | 14,298 | ||||
|
Junior subordinated debentures |
11,330 | 11,330 | ||||
|
Total liabilities |
1,177,291 | 1,003,961 | ||||
|
|
||||||
|
CONTINGENT LIABILITIES AND COMMITMENTS |
||||||
|
|
||||||
|
STOCKHOLDERS' EQUITY: |
||||||
|
Common stock, $.50 par value, 10,000,000 shares authorized; 4,783,562 |
||||||
|
and 4,302,504 shares issued at December 31, 2017 and December 31, 2016, |
||||||
|
respectively, and 4,782,505 and 4,300,634 outstanding at December 31, 2017 |
||||||
|
and December 31, 2016, respectively |
2,394 | 2,153 | ||||
|
Capital surplus |
59,444 | 44,389 | ||||
|
Treasury stock, at cost, 1,057 and 1,870 shares at December 31, 2017 and |
||||||
|
December 31, 2016, respectively |
- |
- |
||||
|
Retained earnings |
59,921 | 52,630 | ||||
|
Accumulated other comprehensive loss, net of tax |
(3,417) | (2,424) | ||||
|
Total stockholders' equity |
118,342 | 96,748 | ||||
|
|
||||||
|
TOTAL LIABILITIES AND STOCKHOLDERS' EQUITY |
$ |
1,295,633 |
$ |
1,100,709 | ||
|
|
||||||
|
See Notes to Consolidated Financial Statements |
||||||
58
|
CONSOLIDATED STATEMENTS OF INCOME |
|||||||||
|
YEARS ENDED DECEMBER 31, 2017, 2016, AND 2015 |
|||||||||
|
(in thousands, except share and per share amounts) |
|||||||||
|
|
|||||||||
|
|
2017 |
2016 |
2015 |
||||||
|
INTEREST INCOME |
|||||||||
|
Loans |
$ |
44,379 |
$ |
37,330 |
$ |
32,638 | |||
|
Interest bearing deposits at banks |
66 | 47 | 64 | ||||||
|
Securities: |
|||||||||
|
Taxable |
2,466 | 1,652 | 1,935 | ||||||
|
Non-taxable |
837 | 926 | 991 | ||||||
|
Total interest income |
47,748 | 39,955 | 35,628 | ||||||
|
INTEREST EXPENSE |
|||||||||
|
Deposits |
4,887 | 4,040 | 3,339 | ||||||
|
Other borrowings |
418 | 295 | 158 | ||||||
|
Junior subordinated debentures |
426 | 372 | 327 | ||||||
|
Total interest expense |
5,731 | 4,707 | 3,824 | ||||||
|
NET INTEREST INCOME |
42,017 | 35,248 | 31,804 | ||||||
|
PROVISION FOR LOAN LOSSES |
738 | 1,209 | 1,216 | ||||||
|
NET INTEREST INCOME AFTER |
|||||||||
|
PROVISION FOR LOAN LOSSES |
41,279 | 34,039 | 30,588 | ||||||
|
NON-INTEREST INCOME |
|||||||||
|
Deposit service charges |
1,747 | 1,750 | 1,736 | ||||||
|
Insurance service and fees |
7,898 | 6,519 | 7,194 | ||||||
|
Gain on loans sold |
156 | 93 | 133 | ||||||
|
Bank-owned life insurance |
864 | 556 | 563 | ||||||
|
Loss on tax credit investments |
(3,997) | (3,022) |
- |
||||||
|
Refundable state historic tax credit |
2,843 | 2,117 |
- |
||||||
|
Gain on insurance settlement |
- |
- |
734 | ||||||
|
Interchange fee income |
1,494 | 1,322 | 1,270 | ||||||
|
Other |
1,998 | 1,917 | 2,090 | ||||||
|
Total non-interest income |
13,003 | 11,252 | 13,720 | ||||||
|
NON-INTEREST EXPENSE |
|||||||||
|
Salaries and employee benefits |
24,408 | 22,221 | 20,478 | ||||||
|
Occupancy |
3,199 | 2,915 | 2,789 | ||||||
|
Advertising and public relations |
1,095 | 1,022 | 857 | ||||||
|
Professional services |
2,260 | 2,216 | 2,354 | ||||||
|
Technology and communications |
2,881 | 2,274 | 2,005 | ||||||
|
Amortization of intangibles |
113 |
- |
- |
||||||
|
FDIC insurance |
740 | 752 | 607 | ||||||
|
Other |
3,898 | 3,696 | 3,608 | ||||||
|
Total non-interest expense |
38,594 | 35,096 | 32,698 | ||||||
|
INCOME BEFORE INCOME TAXES |
15,688 | 10,195 | 11,610 | ||||||
|
|
|||||||||
|
INCOME TAX PROVISION |
5,209 | 1,923 | 3,767 | ||||||
|
|
|||||||||
|
NET INCOME |
$ |
10,479 |
$ |
8,272 |
$ |
7,843 | |||
|
|
|||||||||
|
Net income per common share-basic |
$ |
2.21 |
$ |
1.93 |
$ |
1.85 | |||
|
Net income per common share-diluted |
$ |
2.16 |
$ |
1.90 |
$ |
1.82 | |||
|
Cash dividends per common share |
$ |
0.80 |
$ |
0.76 |
$ |
0.72 | |||
|
Weighted average number of common shares outstanding |
4,738,394 | 4,281,885 | 4,235,048 | ||||||
|
Weighted average number of diluted shares outstanding |
4,860,828 | 4,358,517 | 4,307,368 | ||||||
|
|
|||||||||
|
See Notes to Consolidated Financial Statements |
|||||||||
59
|
|
|||||||||||||||||
|
STATEMENTS OF CONSOLIDATED COMPREHENSIVE INCOME |
|||||||||||||||||
|
YEARS ENDED DECEMBER 31, 2017, 2016, AND 2015 |
|||||||||||||||||
|
(in thousands) |
|||||||||||||||||
|
|
2017 |
2016 |
2015 |
||||||||||||||
|
|
|||||||||||||||||
|
NET INCOME |
$ |
10,479 |
$ |
8,272 |
$ |
7,843 | |||||||||||
|
|
|||||||||||||||||
|
OTHER COMPREHENSIVE LOSS, NET OF TAX: |
|||||||||||||||||
|
Unrealized loss on available-for-sale securities |
(507) | (840) | (436) | ||||||||||||||
|
|
|||||||||||||||||
|
Defined benefit pension plans: |
|||||||||||||||||
|
Amortization of prior service cost |
27 | 19 | 19 | ||||||||||||||
|
Amortization of actuarial loss |
137 | 139 | 125 | ||||||||||||||
|
Actuarial (losses) gains |
(19) | 68 | (10) | ||||||||||||||
|
Total |
145 | 226 | 134 | ||||||||||||||
|
|
|||||||||||||||||
|
OTHER COMPREHENSIVE LOSS, NET OF TAX |
(362) | (614) | (302) | ||||||||||||||
|
|
|||||||||||||||||
|
COMPREHENSIVE INCOME |
$ |
10,117 |
$ |
7,658 |
$ |
7,541 | |||||||||||
|
|
|||||||||||||||||
|
See Notes to Consolidated Financial Statements |
|||||||||||||||||
60
|
|
||||||||||||||||||
|
EVANS BANCORP, INC. AND SUBSIDIARIES |
||||||||||||||||||
|
CONSOLIDATED STATEMENTS OF CHANGES IN STOCKHOLDERS’ EQUITY |
||||||||||||||||||
|
YEARS ENDED DECEMBER 31, 2017, 2016, AND 2015 |
||||||||||||||||||
|
(in thousands, except share and per share amounts) |
||||||||||||||||||
|
|
||||||||||||||||||
|
|
Accumulated |
|||||||||||||||||
|
|
Other |
|||||||||||||||||
|
|
Common |
Capital |
Retained |
Comprehensive |
Treasury |
|||||||||||||
|
|
Stock |
Surplus |
Earnings |
Income (Loss) |
Stock |
Total |
||||||||||||
|
Balance, December 31, 2014 |
$ |
2,123 |
$ |
43,102 |
$ |
42,822 |
$ |
(1,508) |
$ |
(751) |
$ |
85,788 | ||||||
|
Net Income |
7,843 | 7,843 | ||||||||||||||||
|
Other comprehensive loss |
(302) | (302) | ||||||||||||||||
|
Cash dividends ($0.72 per common share) |
(3,049) | (3,049) | ||||||||||||||||
|
Stock options and restricted stock expense |
495 | 495 | ||||||||||||||||
|
Excess tax benefit from stock-based compensation |
32 | 32 | ||||||||||||||||
|
Issued 10,574 shares in Employee Stock |
||||||||||||||||||
|
Purchase Plan |
5 | 211 | 216 | |||||||||||||||
|
Issued 7,832 shares in stock option exercise |
4 | (4) |
- |
|||||||||||||||
|
Repurchased 8,676 shares in treasury stock |
(210) | (210) | ||||||||||||||||
|
Reissued 20,942 restricted shares |
(503) | 503 |
- |
|||||||||||||||
|
Reissued 11,197 shares under Dividend Reinvestment Plan |
31 | 246 | 277 | |||||||||||||||
|
Reissued 15,235 shares in stock option exercises |
(46) | 212 | 166 | |||||||||||||||
|
Balance, December 31, 2015 |
$ |
2,132 |
$ |
43,318 |
$ |
47,616 |
$ |
(1,810) |
$ |
- |
$ |
91,256 | ||||||
|
Net Income |
8,272 | 8,272 | ||||||||||||||||
|
Other comprehensive loss |
(614) | (614) | ||||||||||||||||
|
Cash dividends ($0.76 per common share) |
(3,258) | (3,258) | ||||||||||||||||
|
Stock compensation expense |
553 | 553 | ||||||||||||||||
|
Excess tax benefit from stock-based compensation |
43 | 43 | ||||||||||||||||
|
Repurchased 3,280 shares in treasury stock |
(80) | (80) | ||||||||||||||||
|
Issued 19,093 restricted shares |
10 | (10) |
- |
|||||||||||||||
|
Issued 7,162 shares under Dividend Reinvestment Plan |
4 | 179 | 183 | |||||||||||||||
|
Issued 10,596 shares in Employee Stock Purchase Plan |
5 | 221 | 226 | |||||||||||||||
|
Issued 5,450 shares in stock option exercises |
2 | 88 | 90 | |||||||||||||||
|
Reissued 2,902 shares under Dividend Reinvestment Plan |
8 | 69 | 77 | |||||||||||||||
|
Reissued 267 shares in stock option exercises |
(6) | 6 |
- |
|||||||||||||||
|
Reissued 3,215 restricted shares, net of 1,950 forfeitures |
(5) | 5 |
- |
|||||||||||||||
|
Balance, December 31, 2016 |
$ |
2,153 |
$ |
44,389 |
$ |
52,630 |
$ |
(2,424) |
$ |
- |
$ |
96,748 | ||||||
|
Net Income |
10,479 | 10,479 | ||||||||||||||||
|
Other comprehensive loss |
(362) | (362) | ||||||||||||||||
|
Reclassification of certain tax effects from AOCI related to the Tax Cuts and Jobs Act of 2017 |
631 | (631) |
- |
|||||||||||||||
|
Cash dividends ($0.80 per common share) |
(3,819) | (3,819) | ||||||||||||||||
|
Stock compensation expense |
623 | 623 | ||||||||||||||||
|
Reissued 741 restricted shares |
- |
|||||||||||||||||
|
Issued 440,000 shares in stock offering |
220 | 13,922 | 14,142 | |||||||||||||||
|
Issued 13,112 restricted shares, net of forfeitures |
9 | (9) |
- |
|||||||||||||||
|
Issued 6,155 shares under Dividend Reinvestment Plan |
3 | 249 | 252 | |||||||||||||||
|
Issued 7,610 shares in Employee Stock Purchase Plan |
4 | 261 | 265 | |||||||||||||||
|
Issued 10,001 shares in stock option exercises |
5 | 140 | 145 | |||||||||||||||
|
Repurchased 9,218 shares in treasury stock |
(342) | (342) | ||||||||||||||||
|
Reissued 13,470 shares in stock option exercises |
(131) | 342 | 211 | |||||||||||||||
|
Balance, December 31, 2017 |
$ |
2,394 |
$ |
59,444 |
$ |
59,921 |
$ |
(3,417) |
$ |
- |
$ |
118,342 | ||||||
|
|
||||||||||||||||||
|
See Notes to Consolidated Financial Statements |
||||||||||||||||||
61
|
|
|||||||||
|
|
|||||||||
|
EVANS BANCORP, INC. AND SUBSIDIARIES |
|||||||||
|
CONSOLIDATED STATEMENTS OF CASH FLOWS |
|||||||||
|
YEARS ENDED DECEMBER 31, 2017, 2016, AND 2015 |
|||||||||
|
(in thousands) |
|||||||||
|
|
2017 |
2016 |
2015 |
||||||
|
|
|||||||||
|
OPERATING ACTIVITIES: |
|||||||||
|
Interest received |
$ |
47,028 |
$ |
39,570 |
$ |
35,044 | |||
|
Fees received |
13,419 | 11,839 | 12,719 | ||||||
|
Interest paid |
(5,631) | (4,627) | (3,896) | ||||||
|
Cash paid to employees and vendors |
(37,778) | (33,876) | (32,658) | ||||||
|
Cash contributed to pension plan |
(1,000) | (140) | (165) | ||||||
|
Income taxes paid |
(3,029) | (1,534) | (2,950) | ||||||
|
Proceeds from sale of loans held for resale |
11,487 | 9,775 | 14,453 | ||||||
|
Originations of loans held for resale |
(11,016) | (9,467) | (14,449) | ||||||
|
|
|||||||||
|
Net cash provided by operating activities |
13,480 | 11,540 | 8,098 | ||||||
|
|
|||||||||
|
INVESTING ACTIVITIES: |
|||||||||
|
Available for sales securities: |
|||||||||
|
Purchases |
(65,889) | (25,953) | (28,961) | ||||||
|
Proceeds from maturities, calls, and payments |
13,014 | 25,230 | 26,760 | ||||||
|
Held to maturity securities: |
|||||||||
|
Purchases |
(4,345) | (866) | (637) | ||||||
|
Proceeds from maturities, calls, and payments |
995 | 500 | 619 | ||||||
|
Proceeds from property insurance |
- |
- |
1,183 | ||||||
|
Cash paid for bank owned life insurance |
(6,000) |
- |
- |
||||||
|
Additions to properties and equipment |
(483) | (1,452) | (1,888) | ||||||
|
Purchase of tax credit investment |
(3,102) | (2,078) | (1,100) | ||||||
|
Acquisitions |
(275) | (325) |
- |
||||||
|
Net increase in loans |
(120,438) | (167,901) | (78,441) | ||||||
|
|
|||||||||
|
Net cash used in investing activities |
(186,523) | (172,845) | (82,465) | ||||||
|
|
|||||||||
|
FINANCING ACTIVITIES: |
|||||||||
|
Proceeds from (repayments of) short-term borrowings, net |
59,180 | 17,538 | (16,657) | ||||||
|
Proceeds from long-term borrowings |
- |
- |
10,000 | ||||||
|
Net increase in deposits |
111,255 | 136,992 | 95,347 | ||||||
|
Dividends paid |
(3,819) | (3,258) | (3,049) | ||||||
|
Repurchase of treasury stock |
(342) | (80) | (210) | ||||||
|
Issuance of common stock |
14,804 | 499 | 216 | ||||||
|
Reissuance of treasury stock |
211 | 77 | 443 | ||||||
|
|
|||||||||
|
Net cash provided by financing activities |
181,289 | 151,768 | 86,090 | ||||||
|
|
|||||||||
|
Net increase (decrease) in cash and equivalents |
8,246 | (9,537) | 11,723 | ||||||
|
|
|||||||||
|
CASH AND CASH EQUIVALENTS: |
|||||||||
|
Beginning of year |
13,084 | 22,621 | 10,898 | ||||||
|
|
|||||||||
|
End of year |
$ |
21,330 |
$ |
13,084 |
$ |
22,621 | |||
62
|
|
|||||||||
|
|
|||||||||
|
CONSOLIDATED STATEMENTS OF CASH FLOWS |
|||||||||
|
YEARS ENDED DECEMBER 31, 2017, 2016, AND 2015 |
|||||||||
|
(in thousands) |
|||||||||
|
|
2017 |
2016 |
2015 |
||||||
|
|
|||||||||
|
RECONCILIATION OF NET INCOME TO NET CASH |
|||||||||
|
PROVIDED BY OPERATING ACTIVITIES: |
|||||||||
|
|
|||||||||
|
Net income |
$ |
10,479 |
$ |
8,272 |
$ |
7,843 | |||
|
|
|||||||||
|
Adjustments to reconcile net income to net cash |
|||||||||
|
provided by operating activities: |
|||||||||
|
Depreciation and amortization |
1,762 | 1,554 | 1,513 | ||||||
|
Deferred tax expense (benefit) |
3,150 | (71) | 980 | ||||||
|
Provision for loan losses |
738 | 1,209 | 1,216 | ||||||
|
Net loss on tax credit investment |
1,154 | 905 |
- |
||||||
|
Gain on loans sold |
(156) | (93) | (133) | ||||||
|
Gain on proceeds from insurance |
- |
- |
(734) | ||||||
|
Stock compensation expense |
623 | 553 | 495 | ||||||
|
Proceeds from sale of loans held for resale |
11,487 | 9,775 | 14,453 | ||||||
|
Originations of loans held for resale |
(11,016) | (9,467) | (14,449) | ||||||
|
Changes in assets and liabilities affecting cash flow: |
|||||||||
|
Other assets |
(2,975) | (2,156) | (2,563) | ||||||
|
Other liabilities |
(1,766) | 1,059 | (523) | ||||||
|
|
|||||||||
|
NET CASH PROVIDED BY OPERATING ACTIVITIES |
$ |
13,480 |
$ |
11,540 |
$ |
8,098 | |||
|
|
|||||||||
|
|
63
|
EVANS BANCORP, INC. AND SUBSIDIARIES NOTES TO CONSOLIDATED FINANCIAL STATEMENTS YEARS ENDED DECEMBER 31, 2017, 2016 AND 2015 |
|
1. |
ORGANIZATION AND SUMMARY OF SIGNIFICANT ACCOUNTING POLICIES |
Organization and General
Evans Bancorp, Inc. (the “Company”) was organized as a New York business corporation and incorporated under the laws of the State of New York on October 28, 1988 for the purpose of becoming a bank holding company. Through August 2004, the Company was registered with the Federal Reserve Board (“FRB”) as a bank holding company under the Bank Holding Company Act of 1956, as amended. In August 2004, the Company filed for, and was approved as, a Financial Holding Company under the Bank Holding Company Act. The Company currently conducts its business through its two subsidiaries: Evans Bank, N.A. (the “Bank”), a nationally chartered bank, and its subsidiary, Evans National Holding Corp. (“ENHC”); and Evans National Financial Services, LLC (“ENFS”) and its subsidiary, The Evans Agency LLC (“TEA”). Unless the context otherwise requires, the term “Company” refers collectively to Evans Bancorp, Inc. and its subsidiaries. The Company conducts its business through its subsidiaries. It does not engage in any other substantial business.
Regulatory Requirements
The Company is subject to the rules, regulations, and reporting requirements of various regulatory bodies, including the FRB, the Federal Deposit Insurance Corporation (“FDIC”), the Office of the Comptroller of the Currency (“OCC”), the New York State Department of Financial Services (“the NYSDFS”), and the SEC.
Principles of Consolidation
The consolidated financial statements include the accounts of the Company, the Bank, ENFS and their subsidiaries. All material inter-company accounts and transactions are eliminated in consolidation.
Accounting Estimates
Management has made a number of estimates and assumptions relating to the reporting of assets and liabilities and disclosure of contingent assets and liabilities in order to prepare these consolidated financial statements in conformity with U.S. generally accepted accounting principles. The estimates and assumptions that management deems to be critical involve our accounting policies relating to the determination of our allowance for loan losses and the valuation of goodwill. These estimates and assumptions are based on management’s best estimates and judgment and management evaluates them on an ongoing basis using historical experience and other factors, including the current economic environment, which management believes to be reasonable under the circumstances. We adjust our estimates and assumptions when facts and circumstances dictate. As future events cannot be determined with precision, actual results could differ significantly from our estimates. Changes in those estimates resulting from continuing changes in the economic environment will be reflected in the consolidated financial statements in periods as they occur.
Cash and Cash Equivalents
For purposes of reporting cash flows, cash and cash equivalents include cash and due from banks and interest-bearing deposits at banks.
Securities
Securities which the Bank has the positive intent and ability to hold to maturity are classified as held to maturity and are stated at cost, adjusted for discounts and premiums that are recognized in interest income over the period to the earlier of the call date or maturity using the level yield method. These securities represent debt issuances of local municipalities in the Bank’s market area for which market prices are not readily available. Management periodically evaluates the financial condition of the municipalities for any indication that the Bank does not expect to recover the entire amortized cost basis of their bonds.
Securities classified as available for sale are stated at fair value with unrealized gains and losses excluded from earnings and reported, net of deferred income taxes, in accumulated other comprehensive income or loss, a component of stockholders’ equity. Gains and losses on sales of securities are computed using the specific identification method.
Declines in the fair value of investment securities (with certain exceptions for debt securities noted below) that are deemed to be other-than-temporary are charged to earnings as a realized loss and a new cost basis for the securities is established. Declines in the fair value of debt securities below amortized cost are deemed to be other-than-temporary in circumstances where: (1) the Bank has the intent to sell a security; (2) it is more likely than not that the Bank will be required to sell the security before recovery of its amortized cost basis; or (3) the Bank does not expect to recover the entire amortized cost basis of the security. If the Bank intends to sell a security or if it is
64
more likely than not that the Bank will be required to sell the security before recovery, an other-than-temporary impairment write-down is recognized in earnings equal to the difference between the security’s amortized cost basis and its fair value. If the Bank does not intend to sell the security or it is not more likely than not that it will be required to sell the security before recovery, the other-than-temporary impairment write-down is separated into an amount representing credit loss, which is recognized in earnings, and an amount related to all other factors, which is recognized in other comprehensive income. There were no charges associated with other-than-temporary impairment declines in fair value of securities in 2017, 2016, or 2015.
The Bank does not engage in securities trading activities.
Loans
Loans that management has the intent and ability to hold for the foreseeable future, or until maturity or pay-off, generally are reported at their outstanding unpaid principal balances adjusted for unamortized deferred fees or costs. Interest income is accrued on the unpaid principal balance and is recognized using the interest method. Loan origination fees, net of certain direct origination costs, are deferred and recognized as an adjustment of the related loan yield using the effective yield method of accounting for amortizing loans and straight line over an estimated life for lines of credit.
Loans become past due when the payment date has been missed. If payment has not been received within 30 days, then the loan is delinquent. Delinquent loans are placed into three categories; 30-59 days past due, 60-89 days past due, or 90+ days past due. Loans 90 or more days past due are considered non-performing.
The accrual of interest on loans is discontinued at the time the loan is 90 days delinquent, unless the credit is well secured and in process of collection. If the credit is not well secured and in the process of collection, the loan is placed on non-accrual status and is subject to charge-off if collection of principal or interest is considered doubtful. A loan can also be placed on nonaccrual before it is 90 days delinquent if management determines that it is probable that the Bank will be unable to collect principal or interest due according to the contractual terms of the loan.
All interest due but not collected for loans that are placed on non-accrual status or charged off is reversed against interest income. The interest on these loans is accounted for on the cost-recovery method, until it again qualifies for an accrual basis. Any cash receipts on non-accrual loans reduce the carrying value of the loans. Loans are returned to accrual status when all principal and interest amounts contractually due are brought current, the adverse circumstances which resulted in the delinquent payment status are resolved, and payments are made in a timely manner for a period of time sufficient to reasonably assure their future dependability.
The Bank considers a loan impaired when, based on current information and events, it is probable that it will be unable to collect principal or interest due according to the contractual terms of the loan. These loans are individually assessed for any impairment. Loan impairment is measured based on the present value of expected cash flows discounted at the loan’s effective interest rate or, as a practical expedient, at the loan’s observable market price or the fair value of the collateral, less costs to sell, if the loan is collateral dependent. Appraised and reported values may be discounted based on management’s historical knowledge, changes in market conditions from the time of valuation, estimated costs to sell, and/or management’s expertise and knowledge of the client and the client’s business. The Company has an appraisal policy in which appraisals are obtained upon a loan being downgraded on the Company’s internal loan rating scale to a 5 (special mention) or a 6 (substandard) depending on the amount of the loan, the type of loan and the type of collateral. All impaired nonaccrual loans are either graded a 6 or 7 on the internal loan rating scale. Subsequent to the downgrade, if the loan remains outstanding and impaired for at least one year more, management may require another follow-up appraisal. Between receipts of updated appraisals, if necessary, management may perform an internal valuation based on any known changing conditions in the marketplace such as sales of similar properties, a change in the condition of the collateral, or feedback from local appraisers.
The Bank monitors the credit risk in its loan portfolio by reviewing certain credit quality indicators (“CQI”). The primary CQI for its commercial mortgage and commercial and industrial (“C&I”) portfolios is the individual loan’s credit risk rating. The following list provides a description of the credit risk ratings that are used internally by the Bank when assessing the adequacy of its allowance for loan losses:
|
· |
1-3-Pass: Risk Rated 1-3 loans are loans with a slight risk of loss. The loan is secured by collateral of sufficient value to cover the loan by an acceptable margin. The financial statements of the company demonstrate sufficient net worth and repayment ability. The company has established an acceptable credit history with the bank and typically has a proven track record of performance. Management is experienced, and has an at least average ability to manage the company. The industry has an average or less than average susceptibility to wide fluctuations in business cycles. |
|
· |
4-Watch: Although generally acceptable, a higher degree of risk is evident in these watch credits. Obligor assessment factors may have elements which reflect marginally acceptable conditions warranting more careful review and analysis and monitoring. |
The obligor’s balance sheet reflects generally acceptable asset quality with some elements weak or marginally acceptable. Liquidity may be somewhat strained, but is at an acceptable level to support operations. Obligor may be fully leveraged with
65
ratios higher than industry averages. High leverage is negatively impacting the company, leaving it vulnerable to adverse change. Inconsistent or declining capability to service existing debt requirements evidenced by debt service coverage temporarily below or near acceptable level. The margin of collateral may be adequate, but declining or fluctuating in value. Company management may be unproven, but capable. Rapid expansion or acquisition may increase leverage or reduce cash flow.
Negative industry conditions or weaker management could also be characteristic. Proper consideration should be given to companies in a high growth phase or in development business segments that may not have achieved sustainable earnings.
Obligors demonstrate sufficient financial flexibility to react to and positively address the root cause of the adverse financial trends without significant deviations from their current business strategy. The rating is also used for borrowers that have made significant progress in resolving their financial weaknesses.
|
· |
5-O.A.E.M. (Other Assets Especially Mentioned): Special Mention (“SM”) – A special mention asset has potential weaknesses that warrant management’s close attention. If left uncorrected, these potential weaknesses may result in deterioration of the repayment prospects for the asset or in the institution’s credit position at some future date. |
SM assets have potential weaknesses that may, if not checked or corrected, weaken the asset or inadequately protect the institution’s position at some future date. These assets pose elevated risk, but their weakness does not yet justify a substandard classification. Borrowers may be experiencing adverse operating trends (declining revenues or margins) or an ill proportioned balance sheet (e.g. increasing inventory without an increase in sales, high leverage, tight liquidity).
Adverse economic or market conditions, such as interest rate increases or the entry of a new competitor, may also support a special mention rating.
Nonfinancial reasons for rating a credit exposure special mention include management problems, pending litigation, an ineffective loan agreement or other material structural weakness, and any other significant deviation from prudent lending practices.
The SM rating is designed to identify a specific level of risk and concern about asset quality. Although an SM asset has a higher probability of default than a pass asset, its default is not imminent.
|
· |
6-Substandard: A substandard asset is inadequately protected by the current sound worth and paying capacity of the obligor or of the collateral pledged, if any. Assets so classified must have a well-defined weakness, or weaknesses, that jeopardize the liquidation of the debt. They are characterized by the distinct possibility that the Bank will sustain some loss if the deficiencies are not corrected. |
Substandard assets have a high probability of payment default, or they have other well-defined weaknesses. They require more intensive supervision by Bank management.
Substandard assets are generally characterized by current or expected unprofitable operations, inadequate debt service coverage, inadequate liquidity, or marginal capitalization. Repayment may depend on collateral or other credit risk subsidies. For some substandard assets, the likelihood of full collection of interest and principal may be in doubt; such assets should be placed on non-accrual. Although substandard assets in the aggregate will have distinct potential for loss, an individual asset’s loss potential does not have to be distinct for the asset to be rated substandard. These loans are periodically reviewed and tested for impairment.
|
· |
7-Doubtful: An asset classified doubtful has all the weaknesses inherent in one classified substandard with the added characteristic that the weaknesses make collection or liquidation in full, on the basis of currently existing facts, conditions, and values, highly questionable and improbable. |
A doubtful asset has a high probability of total or substantial loss, but because of specific pending events that may strengthen the asset, its classification of loss is deferred.
Doubtful borrowers are usually in default, lack adequate liquidity or capital, and lack the resources necessary to remain an operating entity. Pending events can include mergers, acquisitions, liquidations, capital injections, the perfection of liens on additional collateral, the valuation of collateral, and refinancing.
Generally, pending events should be resolved within a relatively short period and the ratings will be adjusted based on the new information. Because of high probability of loss, non-accrual accounting treatment is required for doubtful assets.
66
|
· |
8-Loss: Assets classified loss are considered uncollectable and of such little value that their continuance as bankable assets is not warranted. This classification does not mean that the assets have absolutely no recovery or salvage value, but rather that it is not practical or desirable to defer writing off this basically worthless asset even though partial recovery may be affected in the future. |
With loss assets, the underlying borrowers are often in bankruptcy, have formally suspended debt repayments, or have otherwise ceased normal business operations. Once an asset is classified loss, there is little prospect of collecting either its principal or interest. When access to collateral, rather than the value of the collateral, is a problem, a less severe classification may be appropriate. Losses are to be recorded in the period an obligation becomes uncollectible.
The Company’s consumer loans, including residential mortgages and home equities, are not individually risk rated or reviewed in the Company’s loan review process. Consumers are not required to provide the Company with updated financial information as is a commercial customer. Consumer loans also carry smaller balances. Given the lack of updated information since the initial underwriting of the loan and small size of individual loans, the Company does not have credit risk ratings for consumer loans and instead uses delinquency status as the credit quality indicator for consumer loans. However, once a consumer loan is identified as impaired, it is individually evaluated for impairment.
Allowance for Loan Losses
The provision for loan losses represents the amount charged against the Bank’s earnings to maintain an allowance for loan losses inherent in the portfolio based on management’s evaluation of the loan portfolio at the balance sheet date. Factors considered by the Bank’s management in establishing the allowance include: the collectability of individual loans, current loan concentrations, charge-off history, loss emergence period, delinquent loan percentages, the fair value of the collateral, input from regulatory agencies, and general economic conditions.
On a quarterly basis, management of the Bank meets to review and determine the adequacy of the allowance for loan losses. In making this determination, the Bank’s management analyzes the ultimate collectability of the loans in its portfolio by incorporating feedback provided by the Bank’s internal loan staff, an independent internal loan review function and information provided by examinations performed by regulatory agencies.
The analysis of the allowance for loan losses is composed of two components: specific credit allocation and general portfolio allocation. The specific credit allocation includes a detailed review of each impaired loan and allocation is made based on this analysis. Factors may include the appraisal value of the collateral, the age of the appraisal, the type of collateral, the performance of the loan to date, the performance of the borrower’s business based on financial statements, and legal judgments involving the borrower. The general portfolio allocation consists of an assigned reserve percentage based on the historical loss experience, the loss emergence period, and other qualitative factors of the loan category.
The general portfolio allocation is segmented into homogeneous pools of loans with similar characteristics. Separate pools of loans include loans pooled by loan grade and by portfolio segment. An average historical loss rate over the past six years multiplied by the loss emergence period factor is applied against these loans.
For both the criticized and non-criticized loan pools in the general portfolio allocation, additional qualitative factors are applied. The qualitative factors applied to the general portfolio allocation reflect management’s evaluation of various conditions. The conditions evaluated include the following: levels and trends in delinquencies, non-accruals, and criticized loans; trends in volume and terms of loans; effects of any changes in lending policies and credit quality underwriting standards; experience, ability, and depth of management; national and economic trends and conditions; changes in the quality of the loan review system; concentrations of credit risk; changes in collateral value; and large loan risk. The total possible qualitative allocation is determined by comparing peer bank historical charge-off rates to the Bank’s historical charge-off rate. The actual qualitative allocation is determined by qualitative factor by loan type based on metrics that management believes are appropriate indicators of whether the Bank is in a low, moderate, or high risk range relative to historical experience for each qualitative factor.
Foreclosed Real Estate
Foreclosed real estate is initially recorded at the lower of carrying or fair value (net of costs of disposal) at the date of foreclosure. Costs relating to development and improvement of property are capitalized, whereas costs relating to the holding of property are expensed. Assessments are periodically performed by management, and an allowance for losses is established through a charge to operations if the carrying value of a property exceeds fair value. The Company held no foreclosed real estate at December 31, 2017 or December 31, 2016.
67
Insurance Commissions and Fees
Commission revenue is recognized as of the effective date of the insurance policy. The Company also receives contingent commissions from insurance companies which are based on the overall profitability of their relationship based primarily on the loss experience of the insurance placed by the Company. Contingent commissions from insurance companies are recognized when determinable.
Goodwill and Other Intangible Assets
The Company accounts for goodwill and other intangible assets in accordance with ASC Topic 350, "Intangibles – Goodwill and Other." The Company records the excess of the cost of acquired entities over the fair value of identifiable tangible and intangible assets acquired, less liabilities assumed, as goodwill. The Company amortizes acquired intangible assets with definite useful economic lives over their useful economic lives utilizing the straight-line method. On a periodic basis, management assesses whether events or changes in circumstances indicate that the carrying amounts of the intangible assets may be impaired. The Company does not amortize goodwill and any acquired intangible asset with an indefinite useful economic life, but reviews them for impairment at a reporting unit level on an annual basis, or when events or changes in circumstances indicate that the carrying amounts may be impaired. A reporting unit is defined as any distinct, separately identifiable component of one of our operating segments for which complete, discrete financial information is available and reviewed regularly by the segment’s management. The only reporting unit with goodwill as of December 31, 2017 was the insurance agency activities reporting unit.
The fair value of the insurance agency activities reporting unit is measured annually as of December 31st utilizing the average of a discounted cash flow model and a market value based on a multiple to earnings before interest, taxes, depreciation, and amortization (“EBITDA”) for similar companies. The calculated value of the insurance agency reporting unit was in excess of the carrying amount at December 31, 2017. The Company has performed the required goodwill impairment tests and has determined that goodwill was not impaired as of December 31, 2017.
Bank-Owned Life Insurance
The Bank has purchased insurance on the lives of Company directors and certain members of the Bank's and TEA's management. The policies accumulate asset values to meet future liabilities, including the payment of employee benefits, such as retirement benefits. Increases in the cash surrender value are recorded as other income in the Company’s Consolidated Statements of Income.
Properties and Equipment
Properties and equipment are stated at cost less accumulated depreciation. Depreciation is computed using the straight-line method over the estimated useful lives of the assets, which range from 3 to 39 years. Impairment losses on properties and equipment are realized if the carrying amount is not recoverable from its undiscounted cash flows and exceeds its fair value in accordance with ASC Topic 360, “Property, Plant, and Equipment.”
Income Taxes
Deferred tax assets and liabilities are recognized for the future tax effects attributable to differences between the financial statement value of existing assets and liabilities and their respective tax bases and carryforwards. Deferred tax assets and liabilities are reflected at currently enacted income tax rates applicable to the periods in which the deferred tax assets or liabilities are expected to be realized or settled. As changes in tax laws or rates are enacted, deferred tax assets and liabilities are adjusted through income tax expense.
The Bank has invested in partnerships that incur expenses related to the rehabilitation of a certified historic structure located in New York State. At the time the historic structure is placed in service, the Bank is eligible for a federal and New York State tax credit. At the same time, the Bank evaluates its investment, which is valued at the present value of the expected cash flows from its partnership interest. If the investment is determined to be impaired, the Bank will record that impairment loss on its income statement in non-interest income. The federal tax credit impact is included in the Company’s estimated effective tax rate calculation and recorded in income tax expense. For New York State, any new credit earned from rehabilitated historic properties placed in service on or after January 1, 2015 not used in the current tax year will be treated as a refund or overpayment of tax to be credited to the next year’s tax. Since the realization of the tax credit does not depend on the Bank’s generation of future taxable income or the Bank’s ongoing tax status or tax position, the refund is not considered an element of income tax accounting (ASC 740). In such cases, the Bank would not record the credit as a reduction of income tax expense; rather, the Bank includes the refundable New York State tax credit in non-interest income with a corresponding receivable recorded in other assets.
The Tax Cuts and Jobs Act (“TCJA”), which represents one of the most significant overhauls to the United States federal tax code since 1986, was signed into law on December 22, 2017. The TCJA reduces the Company’s marginal federal income tax rate from 35% to 21%, but also reduces the benefit of historic tax credit investments. The impact of the TCJA on the Company is detailed in Note 13 to the Consolidated Financial Statements. In addition to the decrease in the marginal federal income tax rate, there are many
68
other provisions in the TCJA that affect corporations generally but are not expected to impact the Company including limits on the deductibility of FDIC insurance premium for banks with more than $10 billion in assets, various provisions related to companies with international operations, and limitations on the deductibility of interest expense.
Earnings Per Share
Earnings per common share is determined by dividing net income by the weighted average number of shares outstanding during the period. Diluted earnings per common share is based on increasing the weighted-average number of shares of common stock by the number of shares of common stock that would be issued assuming the exercise of stock options. Such adjustments to weighted-average number of shares of common stock outstanding are made only when such adjustments are expected to dilute earnings per common share. There were 122,434, 76,632, and 72,320 potentially dilutive shares of common stock included in calculating diluted earnings per share for the years ended December 31, 2017, 2016, and 2015, respectively. Potential common shares that would have the effect of increasing diluted earnings per share are considered to be anti-dilutive. In accordance with ASC Topic 260, "Earnings Per Share," these shares were not included in calculating diluted earnings per share. There were no anti-dilutive shares at each of December 31, 2017 and 2016. As of December 31, 2015, there were 36 thousand shares that were not included in calculating diluted earnings per share because their effect was anti-dilutive.
Treasury Stock
Repurchases of shares of Evans Bancorp, Inc. stock are recorded at cost as a reduction of shareholders’ equity. Reissuances of shares of treasury stock are recorded at market value.
Comprehensive Income
Comprehensive income includes both net income and other comprehensive income, including the change in unrealized gains and losses on securities available for sale, and the change in the liability related to pension costs, net of tax.
Employee Benefits
The Bank maintains a non-contributory, qualified, defined benefit pension plan (the “Pension Plan”) that covered substantially all employees before it was frozen on January 31, 2008. All benefits eligible participants had accrued in the Pension Plan until the freeze date have been retained. Employees have not accrued additional benefits in the Pension Plan from that date. The actuarially determined pension benefit in the form of a life annuity is based on the employee’s combined years of service, age and compensation. The Bank’s policy is to fund the minimum amount required by government regulations. Employees are eligible to receive these benefits at normal retirement age.
The Bank maintains a defined contribution 401(k) plan and accrues contributions due under this plan as earned by employees. In addition, the Bank maintains a non-qualified Supplemental Executive Retirement Plan for certain members of senior management, a non-qualified Deferred Compensation Plan for directors and certain members of management, and a non-qualified Executive Incentive Retirement Plan for certain members of management, as described more fully in Note 11 to these Consolidated Financial Statements, “Employee Benefits and Deferred Compensation Plans.”
Stock-based Compensation
Stock-based compensation expense is recognized over the vesting period of the stock-based grant based on the estimated grant date value of the stock-based compensation that is expected to vest. Information on the determination of the estimated value of stock-based awards used to calculate stock-based compensation expense is included in Note 12 to these Consolidated Financial Statements, “Stock-Based Compensation.”
ASU 2016-09, Improvements to Employee Share-Based Payment Accounting, was adopted effective January 1, 2017. This ASU is part of the FASB’s Simplification Initiative. The areas for simplification in this Update involve several aspects of the accounting for share-based payment transactions, including the income tax consequences, classification of awards as either equity or liabilities, and classification on the statement of cash flows. Some of the areas of simplification apply only to nonpublic entities. One part of this ASU that impacted the Company was the elimination of the concept of a tax windfall pool. Previously, an entity determined for each award whether the difference between the deduction for tax purposes and the compensation cost recognized for financial reporting purposes resulted in either an excess benefit or a tax deficiency. Excess tax benefits were recognized in additional paid-in-capital; tax deficiencies were recognized either as an offset to accumulated excess tax benefits, if any, or in the income statement. Excess tax benefits were not recognized until the deduction reduced taxes payable. Under the new standard, all excess tax benefits and tax deficiencies are recognized as income tax expense or benefit in the income statement in the period in which they are incurred. The impact on the Company was a tax benefit of $0.2 million for the year ended December 31, 2017.
69
In addition, the Company made the accounting policy election effective January 1, 2017 to account for forfeitures of stock awards when they occur rather than estimating the number of awards that are expected to vest. When stock awards are granted, the Company assumes that the service condition will be achieved when determining the initial amount of compensation cost recognized. This election has not had a material impact on the Company’s financial statements.
Loss Contingencies
Loss contingencies, including claims and legal actions arising in the ordinary course of business, are recorded as liabilities when the likelihood of loss is probable and an amount or range of loss can be reasonably estimated.
Financial Instruments with Off-Balance Sheet Risk
In the ordinary course of business, the Bank has entered into off-balance sheet financial arrangements consisting of commitments to extend credit and standby letters of credit. The Bank provides guarantees in the form of standby letters of credit, which represent an irrevocable obligation to make payments to a third party if the borrower defaults on its obligation under a borrowing or other contractual arrangement with the third party. The Bank could potentially be required to make payments to the extent of the amount guaranteed by the standby letters of credit based on the terms of the agreement. The maximum potential amount of future payments under standby letters of credit was $3.1 million and $3.7 million as of December 31, 2017 and 2016, respectively. There were no liabilities recorded on the Consolidated Balance Sheets related to standby letters of credit as of December 31, 2017 and 2016, respectively, reflecting management’s assessment of the value of the guarantee given the lack of historical activity and the likelihood of current customers to draw on the letters of credit. The Bank has not incurred any losses on its commitments during the past three years and has not recorded a reserve for its commitments.
Advertising costs
Advertising costs are expensed as incurred.
RECENT ACCOUNTING PRONOUNCEMENTS AND DEVELOPMENTS
Below are accounting policies recently issued or proposed but not yet required to be adopted as of December 31, 2017. To the extent management believes the adoption of new accounting standards materially affects the Company’s financial condition, results of operations, or liquidity, the impacts are discussed below.
Accounting Standards Update (“ASU”) 2014-09, Revenue from Contracts with Customers. The objective of this ASU is to require entities to recognize the amount of revenue to which it expects to be entitled for the transfer of promised goods or services to customers. This ASU modifies the guidance used to recognize revenue from contracts with customers for transfers of goods or services and transfers of nonfinancial assets, unless those contracts are within the scope of other guidance. The ASU also requires new qualitative and quantitative disclosures, including disaggregation of revenues and descriptions of performance obligations. The Company adopted the guidance on January 1, 2018 using the modified retrospective method with a cumulative-effect adjustment to opening retained earnings. Because the guidance does not apply to revenue associated with financial instruments, including loans and securities that are accounted for under other U.S. GAAP, the new revenue recognition standard did not have a material impact on the Company’s consolidated financial statements. The Company’s implementation efforts included the identification of revenue within the scope of the guidance, as well as the evaluation of revenue contracts. The Company did identify one revenue source, variable profit-sharing revenue for TEA, which will be accounted for differently in 2018 and beyond. Profit-sharing revenue is variable consideration that TEA earns based on the loss ratio of its customers at insurance companies. TEA typically receives the cash consideration the following year, mostly in the first quarter, for the profit-sharing revenue earned in the previous year. Prior to January 1, 2018, the Company recognized profit-sharing revenue when the cash was received. After January 1, 2018, the Company will estimate this variable consideration based on past performance and loss experience known during the year and make subsequent adjustments to revenue when the uncertainty associated with the variable revenue is resolved. The Company recorded a cumulative-effect adjustment to retained earnings of $0.4 million as of January 1, 2018 related to TEA’s variable profit-sharing revenue.
ASU 2016-01, Recognition and Measurement of Financial Assets and Financial Liabilities. The main objective of this ASU is to enhance the reporting model for financial instruments to provide users of financial statements with more decision-useful information. The amendments in this ASU are effective for annual reporting periods beginning after December 15, 2017, including interim periods within those fiscal years. The ASU will not impact results of operations or the financial position of the Company, but will impact its fair value disclosures in the notes to the financial statements.
ASU 2016-02, Leases. The objective of this ASU is to increase transparency and comparability among organizations by recognizing lease assets and lease liabilities on the balance sheet and disclosing key information about leasing arrangements to meet that objective. Under this new guidance, a lessee should recognize in the statement of financial position a liability to make lease payments and a right-of-use asset representing its right to use the underlying asset for the lease term. The recognition, measurement, and
70
presentation of expenses and cash flows arising from a lease by a lessee have not significantly changed from previous GAAP. Information about the Company’s operating lease obligations is disclosed in Note 16 to the Company’s Consolidated Financial Statements included in Item 8 of this Annual Report on Form 10-K. The amendments in this ASU are effective for fiscal years beginning after December 15, 2018, including interim periods within those fiscal years. The Company is currently evaluating the impact of the standard on its financial reporting.
ASU 2016-13, Financial Instruments – Credit Losses: Measurement of Credit Losses on Financial Instruments. Current GAAP requires an “incurred loss” methodology for recognizing credit losses that delays recognition until it is probable a loss has been incurred. Both financial institutions and users of their financial statements expressed concern that current GAAP restricts the ability to record credit losses that are expected, but do not yet meet the “probable” threshold. The main objective of this ASU (commonly known as the Current Expected Credit Loss Impairment Model, or CECL, in the industry) is to provide financial statement users with more decision-useful information about the expected credit losses on financial instruments and other commitments to extend credit held by a reporting entity at each reporting date. To achieve this objective, the amendments in CECL replace the incurred loss impairment methodology in current GAAP with a methodology that reflects expected credit losses and requires consideration of a broader range of reasonable and supportable information to inform credit loss estimates. The amendments in CECL are effective for the Company for fiscal years beginning after December 15, 2019, including interim periods within those fiscal years. The FASB expects that an entity will be able to leverage its current systems and methods for recording the allowance for credit losses. However, many financial institutions, particularly community banks similar in size to the Company and industry groups like the American Bankers Association, have expressed concern about the impact of CECL. The life of loan loss concept presents complexities that can decrease capital, and add both volatility to the allowance for loan losses (“ALLL”) estimates and additional costs. CECL may increase the ALLL, though many factors will determine the impact for each bank. Changes in expectations of future economic conditions play a large role in CECL and can significantly affect the credit loss estimate. A challenge for the Company could be the operational impact. Costly new systems and processes to track loan performance may need to be purchased or developed. Significant procedural challenges may be faced both in implementation and on an ongoing basis. The total impact of CECL to the Company’s financial statements is unknown but may be material. Implementation of CECL will be a significant project for the Company through the projected implementation date of January 1, 2020.
ASU 2017-04, Simplifying the Test for Goodwill Impairment. The objective of this ASU is to simplify how an entity is required to test goodwill impairment by eliminating Step 2 from the goodwill impairment test. Step 2 measures a goodwill impairment loss by comparing the implied fair value of a reporting unit’s goodwill with the carrying amount of that goodwill. Under the amendments in this ASU, an entity will perform its annual goodwill impairment test by comparing the fair value of a reporting unit with its carrying amount. An entity would recognize an impairment charge for the amount by which the carrying amount exceeds the reporting unit’s fair value. The amendments in this ASU are effective for annual reporting periods beginning after December 15, 2019, including interim periods within those fiscal years. The Company does not expect the standard to have a material impact on the Company’s financial reporting.
ASU 2017-08, Premium Amortization on Purchased Callable Debt Securities. The objective of this ASU is to amend the amortization period for certain purchased callable debt securities held at a premium. The FASB is shortening the amortization period for the premium to the earliest call date. Under current GAAP, entities generally amortize the premium as an adjustment of yield over the contractual life of the investment. Current GAAP excludes certain callable debt securities from consideration of early repayment of principal even if the holder is certain that the call will be exercised. As a result, upon the exercise of a call on a callable debt security held at a premium, the unamortized premium is recorded as a loss in earnings. The amendments do no not require an accounting change for securities held at a discount; the discount continues to be amortized to maturity. The amendments in this ASU are effective for fiscal years, and interim periods within those fiscal years, beginning after December 15, 2018. The Company does hold callable debt securities that were purchased at a premium and is currently evaluating the impact of the standard on its financial reporting.
ASU 2018-02, Reclassification of Certain Tax Effects from Accumulated Other Comprehensive Income. This ASU allows a reclassification from accumulated other comprehensive income to retained earnings for stranded tax effects resulting from the TCJA. Consequently, the ASU eliminates the stranded tax effects resulting from the TCJA. This ASU was issued in response to concern expressed by stakeholders about the guidance in current GAAP that requires deferred tax liabilities and assets to be adjusted for the effect of a change in tax laws or rates with the effect included in income from continuing operations in the reporting period that includes the enactment date. That guidance is applicable even in situations in which the related income tax effects of items in accumulated other comprehensive income were originally recorded in other comprehensive income (rather than in income from continuing operations). The ASU is effective for fiscal years beginning after December 15, 2018 and interim periods within those fiscal years. Early adoption is permitted for reporting periods for which financial statements have not yet been issued or been made available for issuance. Given that the ASU was issued before the issuance of the Company’s Consolidated Financial Statements in this Form 10-K, the Company early adopted the ASU and recorded a reclassification from accumulated other comprehensive income to retained earnings as of December 31, 2017 of $0.6 million.
71
2.SECURITIES
The amortized cost of securities and their approximate fair value at December 31 were as follows:
|
|
||||||||||||
|
|
2017 |
|||||||||||
|
|
(in thousands) |
|||||||||||
|
|
||||||||||||
|
|
Amortized |
Unrealized |
Fair |
|||||||||
|
|
Cost |
Gains |
Losses |
Value |
||||||||
|
|
||||||||||||
|
Available for Sale: |
||||||||||||
|
Debt securities: |
||||||||||||
|
U.S. government agencies |
$ |
28,407 |
$ |
22 |
$ |
(376) |
$ |
28,053 | ||||
|
States and political subdivisions |
29,169 | 246 | (42) | 29,373 | ||||||||
|
Total debt securities |
$ |
57,576 |
$ |
268 |
$ |
(418) |
$ |
57,426 | ||||
|
|
||||||||||||
|
Mortgage-backed securities: |
||||||||||||
|
FNMA |
$ |
31,835 |
$ |
69 |
$ |
(350) |
$ |
31,554 | ||||
|
FHLMC |
14,708 | 22 | (190) | 14,540 | ||||||||
|
GNMA |
2,105 | 18 | (21) | 2,102 | ||||||||
|
SBA |
10,309 | 9 | (103) | 10,215 | ||||||||
|
CMO |
28,699 | 26 | (744) | 27,981 | ||||||||
|
Total mortgage-backed securities |
$ |
87,656 |
$ |
144 |
$ |
(1,408) |
$ |
86,392 | ||||
|
|
||||||||||||
|
Total securities designated as available for sale |
$ |
145,232 |
$ |
412 |
$ |
(1,826) |
$ |
143,818 | ||||
|
|
||||||||||||
|
Held to Maturity: |
||||||||||||
|
Debt securities |
||||||||||||
|
States and political subdivisions |
$ |
5,334 |
$ |
1 |
$ |
(74) |
$ |
5,261 | ||||
|
|
||||||||||||
|
Total securities designated as held to maturity |
$ |
5,334 |
$ |
1 |
$ |
(74) |
$ |
5,261 | ||||
|
|
||||||||||||
|
|
2016 |
|||||||||||
|
|
(in thousands) |
|||||||||||
|
|
||||||||||||
|
|
Amortized |
Unrealized |
Fair |
|||||||||
|
|
Cost |
Gains |
Losses |
Value |
||||||||
|
|
||||||||||||
|
Available for Sale: |
||||||||||||
|
Debt securities: |
||||||||||||
|
U.S. government agencies |
$ |
12,958 |
$ |
67 |
$ |
(153) |
$ |
12,872 | ||||
|
States and political subdivisions |
34,952 | 356 | (166) | 35,142 | ||||||||
|
Total debt securities |
$ |
47,910 |
$ |
423 |
$ |
(319) |
$ |
48,014 | ||||
|
|
||||||||||||
|
Mortgage-backed securities: |
||||||||||||
|
FNMA |
$ |
14,694 |
$ |
96 |
$ |
(230) |
$ |
14,560 | ||||
|
FHLMC |
3,544 | 32 | (51) | 3,525 | ||||||||
|
GNMA |
2,535 | 19 | (21) | 2,533 | ||||||||
|
CMO |
27,127 | 67 | (604) | 26,590 | ||||||||
|
Total mortgage-backed securities |
$ |
47,900 |
$ |
214 |
$ |
(906) |
$ |
47,208 | ||||
|
|
||||||||||||
|
Total securities designated as available for sale |
$ |
95,810 |
$ |
637 |
$ |
(1,225) |
$ |
95,222 | ||||
|
|
||||||||||||
|
Held to Maturity: |
||||||||||||
|
Debt securities |
||||||||||||
|
States and political subdivisions |
$ |
1,983 |
$ |
5 |
$ |
(29) |
$ |
1,959 | ||||
|
|
||||||||||||
|
Total securities designated as held to maturity |
$ |
1,983 |
$ |
5 |
$ |
(29) |
$ |
1,959 | ||||
Available for sale securities with a total fair value of $138 million and $87 million were pledged as collateral to secure public deposits and for other purposes required or permitted by law at December 31, 2017 and 2016, respectively.
The scheduled maturity of debt and mortgage-backed securities at December 31, 2017 and 2016 is summarized below. All maturity amounts are contractual maturities. Actual maturities may differ from contractual maturities because certain issuers have the right to call or prepay obligations with or without call premiums.
|
|
||||||||||||
|
|
72
|
|
2017 |
2016 |
||||||||||
|
|
Amortized |
Estimated |
Amortized |
Estimated |
||||||||
|
|
cost |
fair value |
cost |
fair value |
||||||||
|
|
(in thousands) |
(in thousands) |
||||||||||
|
|
||||||||||||
|
Debt securities available for sale: |
||||||||||||
|
|
||||||||||||
|
Due in one year or less |
$ |
5,974 |
$ |
5,990 |
$ |
2,869 |
$ |
2,876 | ||||
|
Due after one year through five years |
24,063 | 24,068 | 30,171 | 30,214 | ||||||||
|
Due after five years through ten years |
25,584 | 25,385 | 12,166 | 12,133 | ||||||||
|
Due after ten years |
1,955 | 1,983 | 2,704 | 2,791 | ||||||||
|
|
57,576 | 57,426 | 47,910 | 48,014 | ||||||||
|
|
||||||||||||
|
Mortgage-backed securities |
||||||||||||
|
available for sale |
87,656 | 86,392 | 47,900 | 47,208 | ||||||||
|
|
||||||||||||
|
Total available for sale securities |
$ |
145,232 |
$ |
143,818 |
$ |
95,810 |
$ |
95,222 | ||||
|
|
||||||||||||
|
Debt securities held to maturity: |
||||||||||||
|
|
||||||||||||
|
Due in one year or less |
$ |
4,077 |
$ |
4,053 |
$ |
780 |
$ |
778 | ||||
|
Due after one year through five years |
690 | 661 | 289 | 283 | ||||||||
|
Due after five years through ten years |
473 | 464 | 814 | 805 | ||||||||
|
Due after ten years |
94 | 83 | 100 | 93 | ||||||||
|
|
5,334 | 5,261 | 1,983 | 1,959 | ||||||||
|
|
||||||||||||
|
Total held to maturity securities |
$ |
5,334 |
$ |
5,261 |
$ |
1,983 |
$ |
1,959 | ||||
Contractual maturities of the Company’s mortgage-backed securities generally exceed ten years; however, the effective lives may be significantly shorter due to prepayments of the underlying loans and due to the nature of these securities.
There were no realized gains and losses from gross sales of securities in 2017, 2016 or 2015.
Information regarding unrealized losses within the Company’s available for sale securities at December 31, 2017 and 2016 is summarized below. The securities are primarily U.S. government-guaranteed agency securities or municipal securities. All unrealized losses are considered temporary and related to market interest rate fluctuations.
73
|
|
||||||||||||||||||
|
|
2017 |
|||||||||||||||||
|
|
||||||||||||||||||
|
|
Less than 12 months |
12 months or longer |
Total |
|||||||||||||||
|
|
Fair |
Unrealized |
Fair |
Unrealized |
Fair |
Unrealized |
||||||||||||
|
|
Value |
Losses |
Value |
Losses |
Value |
Losses |
||||||||||||
|
|
(in thousands) |
|||||||||||||||||
|
Available for Sale: |
||||||||||||||||||
|
Debt securities: |
||||||||||||||||||
|
U.S. government agencies |
$ |
15,151 |
$ |
(239) |
$ |
6,863 |
$ |
(137) |
$ |
22,014 |
$ |
(376) | ||||||
|
States and political subdivisions |
7,288 | (28) | 894 | (14) | 8,182 | (42) | ||||||||||||
|
Total debt securities |
$ |
22,439 |
$ |
(267) |
$ |
7,757 |
$ |
(151) |
$ |
30,196 |
$ |
(418) | ||||||
|
|
||||||||||||||||||
|
Mortgage-backed securities: |
||||||||||||||||||
|
FNMA |
$ |
20,087 |
$ |
(207) |
$ |
6,517 |
$ |
(143) |
$ |
26,604 |
$ |
(350) | ||||||
|
FHLMC |
12,984 | (147) | 960 | (43) | 13,944 | (190) | ||||||||||||
|
GNMA |
- |
- |
1,212 | (21) | 1,212 | (21) | ||||||||||||
|
SBA |
4,516 | (43) | 1,769 | (60) | 6,285 | (103) | ||||||||||||
|
CMO |
11,023 | (216) | 14,753 | (528) | 25,776 | (744) | ||||||||||||
|
Total mortgage-backed securities |
$ |
48,610 |
$ |
(613) |
$ |
25,211 |
$ |
(795) |
$ |
73,821 |
$ |
(1,408) | ||||||
|
|
||||||||||||||||||
|
Held to Maturity: |
||||||||||||||||||
|
Debt securities: |
||||||||||||||||||
|
States and political subdivisions |
$ |
4,548 |
$ |
(37) |
$ |
626 |
$ |
(37) |
$ |
5,174 |
$ |
(74) | ||||||
|
|
||||||||||||||||||
|
Total temporarily impaired |
||||||||||||||||||
|
securities |
$ |
75,597 |
$ |
(917) |
$ |
33,594 |
$ |
(983) |
$ |
109,191 |
$ |
(1,900) | ||||||
|
|
||||||||||||||||||
|
|
||||||||||||||||||
|
|
2016 |
|||||||||||||||||
|
|
||||||||||||||||||
|
|
Less than 12 months |
12 months or longer |
Total |
|||||||||||||||
|
|
Fair |
Unrealized |
Fair |
Unrealized |
Fair |
Unrealized |
||||||||||||
|
|
Value |
Losses |
Value |
Losses |
Value |
Losses |
||||||||||||
|
|
(in thousands) |
|||||||||||||||||
|
Available for Sale: |
||||||||||||||||||
|
Debt securities: |
||||||||||||||||||
|
U.S. government agencies |
$ |
6,847 |
$ |
(153) |
$ |
- |
$ |
- |
$ |
6,847 |
$ |
(153) | ||||||
|
States and political subdivisions |
16,895 | (146) | 731 | (20) | 17,626 | (166) | ||||||||||||
|
Total debt securities |
$ |
23,742 |
$ |
(299) |
$ |
731 |
$ |
(20) |
$ |
24,473 |
$ |
(319) | ||||||
|
|
||||||||||||||||||
|
Mortgage-backed securities: |
||||||||||||||||||
|
FNMA |
$ |
9,577 |
$ |
(230) |
$ |
- |
$ |
- |
$ |
9,577 |
$ |
(230) | ||||||
|
FHLMC |
1,728 | (8) | 988 | (43) | 2,716 | (51) | ||||||||||||
|
GNMA |
1,046 | (17) | 309 | (4) | 1,355 | (21) | ||||||||||||
|
CMO |
19,745 | (569) | 1,166 | (35) | 20,911 | (604) | ||||||||||||
|
Total mortgage-backed securities |
$ |
32,096 |
$ |
(824) |
$ |
2,463 |
$ |
(82) |
$ |
34,559 |
$ |
(906) | ||||||
|
|
||||||||||||||||||
|
Held to Maturity: |
||||||||||||||||||
|
Debt securities: |
||||||||||||||||||
|
States and political subdivisions |
$ |
863 |
$ |
(3) |
$ |
706 |
$ |
(26) |
$ |
1,569 |
$ |
(29) | ||||||
|
|
||||||||||||||||||
|
Total temporarily impaired |
||||||||||||||||||
|
securities |
$ |
56,701 |
$ |
(1,126) |
$ |
3,900 |
$ |
(128) |
$ |
60,601 |
$ |
(1,254) | ||||||
74
Management has assessed the securities available for sale in an unrealized loss position at December 31, 2017 and 2016 and determined the decline in fair value below amortized cost to be temporary. In making this determination, management considered the period of time the securities were in a loss position, the percentage decline in comparison to the securities’ amortized cost, and the financial condition of the issuer (primarily government or government-sponsored enterprises). In addition, management does not intend to sell these securities and it is not more likely than not that the Company will be required to sell these securities before recovery of their amortized cost. Management believes the decline in fair value is primarily related to market interest rate fluctuations and not to the credit deterioration of the individual issuers. The Company holds no securities backed by sub-prime or Alt-A residential mortgages or commercial mortgages and also does not hold any trust-preferred securities.
The Company did not record any other-than-temporary impairment charges in 2017, 2016, or 2015. The credit worthiness of the Company’s portfolio is largely reliant on the ability of U.S. government agencies such as the Federal Home Loan Bank (“FHLB”), Federal National Mortgage Association (“FNMA”), and the Federal Home Loan Mortgage Corporation (“FHLMC”), and municipalities throughout New York State to meet their obligations. In addition, dysfunctional markets could materially alter the liquidity, interest rate, and pricing risk of the portfolio. The stable past performance is not a guarantee for similar performance going forward.
3.LOANS AND THE ALLOWANCE FOR LOAN LOSSES
Major categories of loans at December 31, 2017 and 2016 are summarized as follows:
|
|
December 31, 2017 |
December 31, 2016 |
||||
|
Mortgage loans on real estate: |
(in thousands) |
|||||
|
Residential mortgages |
$ |
131,208 |
$ |
118,542 | ||
|
Commercial and multi-family |
519,902 | 462,385 | ||||
|
Construction-Residential |
2,134 | 2,540 | ||||
|
Construction-Commercial |
107,274 | 93,240 | ||||
|
Home equities |
69,745 | 66,234 | ||||
|
Total real estate loans |
830,263 | 742,941 | ||||
|
|
||||||
|
Commercial and industrial loans |
232,211 | 197,371 | ||||
|
Consumer and other loans |
1,654 | 1,417 | ||||
|
Net deferred loan origination costs |
1,187 | 783 | ||||
|
Total gross loans |
1,065,315 | 942,512 | ||||
|
|
||||||
|
Allowance for loan losses |
(14,019) | (13,916) | ||||
|
|
||||||
|
Loans, net |
$ |
1,051,296 |
$ |
928,596 | ||
Residential Mortgages: The Company originates adjustable-rate and fixed-rate, one-to-four-family residential real estate loans for the construction, purchase, or refinancing of a mortgage. These loans are collateralized by owner-occupied properties located in the Company’s market area and are amortized over a period of 10 to 30 years. Loans on one-to-four-family residential real estate are mostly originated in amounts of no more than 80% of the property’s appraised value or have private mortgage insurance. Mortgage title insurance and hazard insurance are normally required. Construction loans have a unique risk, because they are secured by an incomplete dwelling.
The Bank, in its normal course of business, sells certain residential mortgages which it originates to FNMA. The Company maintains servicing rights on the loans that it sells to FNMA and earns a fee thereon. The Bank determines with each origination of residential real estate loans which desired maturities, within the context of overall maturities in the loan portfolio, provide the appropriate mix to optimize the Bank’s ability to absorb the corresponding interest rate risk within the Company’s tolerance ranges. This practice allows the Company to manage interest rate risk, liquidity risk, and credit risk. At December 31, 2017 and 2016, the Company had approximately $78 million and $76 million, respectively, in unpaid principal balances of loans that it services for FNMA. For the years ended December 31, 2017 and 2016, the Company sold $11 million and $10 million, respectively, in loans to FNMA and realized gains on those sales of $156 thousand and $93 thousand, respectively. Gains or losses recognized upon the sale of loans are determined on a specific identification basis. The Company had a related asset of approximately $0.6 and $0.5 million for the servicing portfolio rights as of December 31, 2017 and 2016, respectively. No loans were held for sale at December 31, 2017 compared with $0.3 million in loans held for sale at December 31, 2016. Loans held for sale are typically in the portfolio for less than a month. As a result, the carrying value approximates fair value. The Company has never been contacted by FNMA to repurchase any loans due to improper documentation or fraud.
Due to the lack of foreclosure activity and absence of any ongoing litigation at December 31, 2017 and 2016, the Company had no accrual for loss contingencies or potential costs associated with foreclosure-related activities at those dates.
75
Commercial and Multi-Family Mortgages and Commercial Construction Loans: Commercial real estate loans are made to finance the purchases of real estate with completed structures or in the midst of being constructed. These commercial real estate loans are secured by first liens on the real estate, which may include apartments, hotels, retail stores or plazas, healthcare facilities, and other non-owner-occupied facilities. These loans are generally less risky than commercial and industrial loans, since they are secured by real estate and buildings. The Company offers commercial mortgage loans with up to an 80% LTV ratio for up to 20 years on a variable and fixed rate basis. Many of these mortgage loans either mature or are subject to a rate call after three to five years. The Company’s underwriting analysis includes credit verification, independent appraisals, a review of the borrower's financial condition, and the underlying cash flows. Construction loans have a unique risk, because they are secured by an incomplete dwelling.
As of December 31, 2017, there were $228 million in residential and commercial mortgage loans pledged to FHLBNY to serve as collateral for borrowings.
Home Equities: The Company originates home equity lines of credit and second mortgage loans (loans secured by a second lien position on one-to-four-family residential real estate). These loans carry a higher risk than first mortgage residential loans because they are in a second position with respect to collateral. Risk is reduced through underwriting criteria, which include credit verification, appraisals, a review of the borrower's financial condition, and personal cash flows. A security interest, with title insurance when necessary, is taken in the underlying real estate.
Commercial and Industrial Loans: These loans generally include term loans and lines of credit. Such loans are made available to businesses for working capital (including inventory and receivables), business expansion (including acquisition of real estate, expansion, and improvements) and equipment purchases. As a general practice, a collateral lien is placed on equipment or other assets owned by the borrower. These loans generally carry a higher risk than commercial real estate loans based on the nature of the underlying collateral, which can be business assets such as equipment and accounts receivable. To reduce the risk, management also attempts to secure real estate as collateral and obtain personal guarantees of the borrowers. To further reduce risk and enhance liquidity, these loans generally carry variable rates of interest, re-pricing in three- to five-year periods, and have a maturity of five years or less. Lines of credit generally carry floating rates of interest (e.g. prime plus a margin).
Consumer Loans: The Company funds a variety of consumer loans, including direct automobile loans, recreational vehicle loans, boat loans, home improvement loans, and personal loans (collateralized and uncollateralized). Most of these loans carry a fixed rate of interest with principal repayment terms typically ranging up to five years, based upon the nature of the collateral and the size of the loan. The majority of consumer loans are underwritten on a secured basis using the underlying collateral being financed. A minimal amount of loans are unsecured, which carry a higher risk of loss. These loans included overdrawn deposit accounts classified as loans of less than $0.1 million at December 31, 2017 and 2016.
The Company maintains an allowance for loan losses in order to capture the probable losses inherent in its loan portfolio. There is a risk that the Company may experience significant loan losses in 2018 and beyond which could exceed the allowance for loan losses. If the Company's assumptions and judgments prove to be incorrect or bank regulators require the Company to increase its provision for loan losses or recognize further loan charge-offs, the Company may have to increase its allowance for loan losses or loan charge-offs which could have a material adverse effect on the Company's operating results and financial condition. There can be no assurance that the Company's allowance for loan losses will be adequate to protect the Company against loan losses that it may incur.
Changes in the allowance for loan losses for the years ended December 31, 2017, 2016 and 2015 follow:
|
|
|||||||||
|
|
|||||||||
|
|
|||||||||
|
|
2017 |
2016 |
2015 |
||||||
|
|
(in thousands) |
||||||||
|
Balance, beginning of year |
$ |
13,916 |
$ |
12,883 |
$ |
12,533 | |||
|
Provisions for loan losses |
738 | 1,209 | 1,216 | ||||||
|
Recoveries |
350 | 231 | 181 | ||||||
|
Charge-offs |
(985) | (407) | (1,047) | ||||||
|
Balance, end of year |
$ |
14,019 |
$ |
13,916 |
$ |
12,883 | |||
76
The following tables summarize the allowance for loan losses, as of December 31, 2017 and 2016, respectively, by portfolio segment. The segments presented are at the level management uses to assess and monitor the risk and performance of the portfolio.
|
|
||||||||||||||||||
|
|
||||||||||||||||||
|
2017 |
||||||||||||||||||
|
|
||||||||||||||||||
|
(in thousands) |
Commercial and Industrial |
Commercial Real Estate Mortgages* |
Consumer and Other |
Residential Mortgages* |
Home Equities |
Total |
||||||||||||
|
Allowance for loan |
||||||||||||||||||
|
losses: |
||||||||||||||||||
|
Beginning balance |
$ |
4,813 |
$ |
7,890 |
$ |
96 |
$ |
769 |
$ |
348 |
$ |
13,916 | ||||||
|
Charge-offs |
(791) | (127) | (66) |
- |
(1) | (985) | ||||||||||||
|
Recoveries |
323 |
- |
24 |
- |
3 | 350 | ||||||||||||
|
Provision (Credit) |
859 | (354) | 55 | 181 | (3) | 738 | ||||||||||||
|
Ending balance |
$ |
5,204 |
$ |
7,409 |
$ |
109 |
$ |
950 |
$ |
347 |
$ |
14,019 | ||||||
|
|
||||||||||||||||||
|
Allowance for loan |
||||||||||||||||||
|
losses: |
||||||||||||||||||
|
Ending balance: |
||||||||||||||||||
|
Individually evaluated |
||||||||||||||||||
|
for impairment |
$ |
372 |
$ |
643 |
$ |
34 |
$ |
28 |
$ |
- |
$ |
1,077 | ||||||
|
Collectively evaluated |
||||||||||||||||||
|
for impairment |
4,832 | 6,766 | 75 | 922 | 347 | 12,942 | ||||||||||||
|
Total |
$ |
5,204 |
$ |
7,409 |
$ |
109 |
$ |
950 |
$ |
347 |
$ |
14,019 | ||||||
|
|
||||||||||||||||||
|
Loans: |
||||||||||||||||||
|
Ending balance: |
||||||||||||||||||
|
Individually evaluated |
||||||||||||||||||
|
for impairment |
$ |
2,263 |
$ |
9,212 |
$ |
34 |
$ |
2,611 |
$ |
1,785 |
$ |
15,905 | ||||||
|
Collectively evaluated |
||||||||||||||||||
|
for impairment |
229,948 | 617,964 | 1,620 | 130,731 | 67,960 | 1,048,223 | ||||||||||||
|
Total |
$ |
232,211 |
$ |
627,176 |
$ |
1,654 |
$ |
133,342 |
$ |
69,745 |
$ |
1,064,128 | ||||||
Note: Loan balances do not include $1.2 million in net deferred loan origination costs as of December 31, 2017.
* includes construction loans
77
|
|
||||||||||||||||||
|
|
||||||||||||||||||
|
2016 |
||||||||||||||||||
|
|
||||||||||||||||||
|
(in thousands) |
Commercial and Industrial |
Commercial Real Estate Mortgages* |
Consumer and Other |
Residential Mortgages* |
Home Equities |
Total |
||||||||||||
|
Allowance for loan |
||||||||||||||||||
|
losses: |
||||||||||||||||||
|
Beginning balance |
$ |
4,383 |
$ |
7,135 |
$ |
85 |
$ |
909 |
$ |
371 |
$ |
12,883 | ||||||
|
Charge-offs |
(360) |
- |
(47) |
- |
- |
(407) | ||||||||||||
|
Recoveries |
151 | 59 | 16 | 2 | 3 | 231 | ||||||||||||
|
Provision (Credit) |
639 | 696 | 42 | (142) | (26) | 1,209 | ||||||||||||
|
Ending balance |
$ |
4,813 |
$ |
7,890 |
$ |
96 |
$ |
769 |
$ |
348 |
$ |
13,916 | ||||||
|
|
||||||||||||||||||
|
Allowance for loan |
||||||||||||||||||
|
losses: |
||||||||||||||||||
|
Ending balance: |
||||||||||||||||||
|
Individually evaluated |
||||||||||||||||||
|
for impairment |
$ |
492 |
$ |
1,471 |
$ |
43 |
$ |
1 |
$ |
20 |
$ |
2,027 | ||||||
|
Collectively evaluated |
||||||||||||||||||
|
for impairment |
4,321 | 6,419 | 53 | 768 | 328 | 11,889 | ||||||||||||
|
Total |
$ |
4,813 |
$ |
7,890 |
$ |
96 |
$ |
769 |
$ |
348 |
$ |
13,916 | ||||||
|
|
||||||||||||||||||
|
Loans: |
||||||||||||||||||
|
Ending balance: |
||||||||||||||||||
|
Individually evaluated |
||||||||||||||||||
|
for impairment |
$ |
3,148 |
$ |
7,613 |
$ |
43 |
$ |
2,584 |
$ |
1,753 |
$ |
15,141 | ||||||
|
Collectively evaluated |
||||||||||||||||||
|
for impairment |
194,223 | 548,012 | 1,374 | 118,498 | 64,481 | 926,588 | ||||||||||||
|
Total |
$ |
197,371 |
$ |
555,625 |
$ |
1,417 |
$ |
121,082 |
$ |
66,234 |
$ |
941,729 | ||||||
Note: Loan balances do not include $783 thousand in net deferred loan origination costs as of December 31, 2016.
* includes construction loans
78
A description of the Company’s accounting policies and the methodology used to estimate the allowance for loan losses, including a description of the factors considered in determining the allowance for loan losses, such as historical losses and existing economic conditions, is included in Note 1 to the Financial Statements.
The following table provides data, at the class level, of credit quality indicators of certain loans, as of December 31, 2017 and 2016, respectively:
|
|
||||||||||||
|
2017 |
||||||||||||
|
(in thousands) |
||||||||||||
|
Corporate Credit Exposure – By Credit Rating |
Commercial Real Estate Construction |
Commercial and Multi-Family Mortgages |
Total Commercial Real Estate |
Commercial and Industrial |
||||||||
|
1-3 |
$ |
83,203 |
$ |
418,819 |
$ |
502,022 |
$ |
158,181 | ||||
|
4 |
24,071 | 87,746 | 111,817 | 57,827 | ||||||||
|
5 |
- |
4,106 | 4,106 | 13,247 | ||||||||
|
6 |
- |
9,231 | 9,231 | 2,134 | ||||||||
|
7/8 |
- |
- |
- |
822 | ||||||||
|
Total |
$ |
107,274 |
$ |
519,902 |
$ |
627,176 |
$ |
232,211 | ||||
|
|
||||||||||||
|
2016 |
||||||||||||
|
(in thousands) |
||||||||||||
|
Corporate Credit Exposure – By Credit Rating |
Commercial Real Estate Construction |
Commercial and Multi-Family Mortgages |
Total Commercial Real Estate |
Commercial and Industrial |
||||||||
|
1-3 |
$ |
82,520 |
$ |
372,235 |
$ |
454,755 |
$ |
121,414 | ||||
|
4 |
6,541 | 73,655 | 80,196 | 59,117 | ||||||||
|
5 |
- |
12,506 | 12,506 | 12,623 | ||||||||
|
6 |
4,179 | 3,989 | 8,168 | 3,404 | ||||||||
|
7 |
- |
- |
- |
813 | ||||||||
|
Total |
$ |
93,240 |
$ |
462,385 |
$ |
555,625 |
$ |
197,371 | ||||
The Company’s risk ratings are monitored by the individual relationship managers and changed as deemed appropriate after receiving updated financial information from the borrowers or deterioration or improvement in the performance of a loan is evident in the customer’s payment history. Each commercial relationship is individually assigned a risk rating. The Company also maintains a loan review process that monitors the management of the Company’s commercial loan portfolio by the relationship managers. The Company’s loan review function reviews at least 40% of the commercial loan portfolio annually.
The Company’s consumer loans, including residential mortgages and home equity loans and lines of credit, are not individually risk rated or reviewed as part of the Company’s loan review process. Unlike commercial customers, consumer loan customers are not required to provide the Company with updated financial information. Consumer loans also carry smaller dollar balances. Given the lack of updated information since the initial underwriting of the loan and the small size of individual loans, the Company uses delinquency status as the primary credit quality indicator for consumer loans. Once a consumer loan reaches 60 days past due, management orders an independent appraisal of the underlying collateral and produces a credit report on the borrower. After discounting for potential selling costs and other factors specific to the property or borrower, the book value of the loan is then compared to the collateral value as determined by the appraisal. In situations where the Company holds a junior lien, management accounts for the amount of the senior liens held by other lenders, and the collateral value is more heavily discounted to account for the increased risk. If the loan is ultimately determined to be impaired, it is placed in non-accrual status. Unless the loan is well secured and in the process of collection, all consumer loans that are more than 90 days past due are placed in non-accrual status.
79
A summary of current, past due, and nonaccrual loans as of December 31, 2017 and 2016 follows:
|
|
|||||||||||||||||
|
2017 |
|||||||||||||||||
|
(in thousands) |
|||||||||||||||||
|
|
|||||||||||||||||
|
|
Current |
Non-accruing |
Total |
||||||||||||||
|
|
Balance |
30-59 days |
60-89 days |
90+ days |
Loans |
Balance |
|||||||||||
|
|
|||||||||||||||||
|
Commercial and industrial |
$ |
225,915 |
$ |
4,019 |
$ |
163 |
$ |
365 |
$ |
1,749 |
$ |
232,211 | |||||
|
Residential real estate: |
|||||||||||||||||
|
Residential |
129,251 | 731 |
- |
- |
1,226 | 131,208 | |||||||||||
|
Construction |
2,134 |
- |
- |
- |
- |
2,134 | |||||||||||
|
Commercial real estate: |
|||||||||||||||||
|
Commercial |
508,044 | 2,611 |
- |
309 | 8,938 | 519,902 | |||||||||||
|
Construction |
102,109 | 3,239 | 1,926 |
- |
- |
107,274 | |||||||||||
|
Home equities |
68,415 | 171 | 40 |
- |
1,119 | 69,745 | |||||||||||
|
Consumer and other |
1,628 | 11 | 6 |
- |
9 | 1,654 | |||||||||||
|
Total Loans |
$ |
1,037,496 |
$ |
10,782 |
$ |
2,135 |
$ |
674 |
$ |
13,041 |
$ |
1,064,128 | |||||
|
|
|||||||||||||||||
|
2016 |
|||||||||||||||||
|
(in thousands) |
|||||||||||||||||
|
|
|||||||||||||||||
|
|
Current |
Non-accruing |
Total |
||||||||||||||
|
|
Balance |
30-59 days |
60-89 days |
90+ days |
Loans |
Balance |
|||||||||||
|
|
|||||||||||||||||
|
Commercial and industrial |
$ |
184,872 |
$ |
6,567 |
$ |
2,826 |
$ |
- |
$ |
3,106 |
$ |
197,371 | |||||
|
Residential real estate: |
|||||||||||||||||
|
Residential |
116,876 | 751 | 53 |
- |
862 | 118,542 | |||||||||||
|
Construction |
2,540 |
- |
- |
- |
- |
2,540 | |||||||||||
|
Commercial real estate: |
|||||||||||||||||
|
Commercial |
452,187 | 6,319 | 1,522 | 483 | 1,874 | 462,385 | |||||||||||
|
Construction |
88,566 | 257 |
- |
239 | 4,178 | 93,240 | |||||||||||
|
Home equities |
64,868 | 105 |
- |
- |
1,261 | 66,234 | |||||||||||
|
Consumer and other |
1,387 | 3 | 10 |
- |
17 | 1,417 | |||||||||||
|
Total Loans |
$ |
911,296 |
$ |
14,002 |
$ |
4,411 |
$ |
722 |
$ |
11,298 |
$ |
941,729 | |||||
The following table provides data, at the class level, of impaired loans:
|
|
|||||||||||||||||||||||||||||||||||
|
|
|||||||||||||||||||||||||||||||||||
|
|
At December 31, 2017 |
||||||||||||||||||||||||||||||||||
|
|
Recorded Investment |
Unpaid Principal Balance |
Related Allowance |
Average Recorded Investment |
Interest Income Foregone |
Interest Income Recognized |
|||||||||||||||||||||||||||||
|
With no related allowance recorded: |
(in thousands) |
||||||||||||||||||||||||||||||||||
|
Commercial and industrial |
$ |
1,023 |
$ |
1,917 |
$ |
- |
$ |
1,704 |
$ |
92 |
$ |
28 | |||||||||||||||||||||||
|
Residential real estate: |
|||||||||||||||||||||||||||||||||||
|
Residential |
2,415 | 2,594 |
- |
2,456 | 46 | 83 | |||||||||||||||||||||||||||||
|
Construction |
- |
- |
- |
- |
- |
- |
|||||||||||||||||||||||||||||
|
Commercial real estate: |
|||||||||||||||||||||||||||||||||||
|
Commercial |
2,336 | 2,469 |
- |
2,449 | 134 | 32 | |||||||||||||||||||||||||||||
|
Construction |
187 | 187 |
- |
218 |
- |
13 | |||||||||||||||||||||||||||||
|
Home equities |
1,785 | 1,892 |
- |
1,828 | 62 | 33 | |||||||||||||||||||||||||||||
|
Consumer and other |
- |
- |
- |
- |
- |
- |
|||||||||||||||||||||||||||||
|
Total impaired loans |
$ |
7,746 |
$ |
9,059 |
$ |
- |
$ |
8,655 |
$ |
334 |
$ |
189 | |||||||||||||||||||||||
|
|
|||||||||||||||||||||||||||||||||||
|
|
|||||||||||||||||||||||||||||||||||
80
|
|
|||||||||||||||||||||||||||||||||||
|
|
|||||||||||||||||||||||||||||||||||
|
|
At December 31, 2017 |
||||||||||||||||||||||||||||||||||
|
|
Recorded Investment |
Unpaid Principal Balance |
Related Allowance |
Average Recorded Investment |
Interest Income Foregone |
Interest Income Recognized |
|||||||||||||||||||||||||||||
|
With a related allowance recorded: |
(in thousands) |
||||||||||||||||||||||||||||||||||
|
Commercial and industrial |
$ |
1,240 |
$ |
1,431 |
$ |
372 |
$ |
1,279 |
$ |
79 |
$ |
12 | |||||||||||||||||||||||
|
Residential real estate: |
|||||||||||||||||||||||||||||||||||
|
Residential |
196 | 196 | 28 | 196 | 6 | 3 | |||||||||||||||||||||||||||||
|
Construction |
- |
- |
- |
- |
- |
- |
|||||||||||||||||||||||||||||
|
Commercial real estate: |
|||||||||||||||||||||||||||||||||||
|
Commercial |
6,689 | 6,819 | 643 | 6,755 | 156 | 129 | |||||||||||||||||||||||||||||
|
Construction |
- |
- |
- |
- |
- |
- |
|||||||||||||||||||||||||||||
|
Home equities |
- |
- |
- |
- |
- |
- |
|||||||||||||||||||||||||||||
|
Consumer and other |
34 | 59 | 34 | 37 | 3 | 2 | |||||||||||||||||||||||||||||
|
Total impaired loans |
$ |
8,159 |
$ |
8,505 |
$ |
1,077 |
$ |
8,267 |
$ |
244 |
$ |
146 | |||||||||||||||||||||||
|
|
|||||||||||||||||||||||||||||||||||
|
|
|||||||||||||||||||||||||||||||||||
|
|
|||||||||||||||||||||||||||||||||||
|
|
|||||||||||||||||||||||||||||||||||
|
|
At December 31, 2017 |
||||||||||||||||||||||||||||||||||
|
|
Recorded Investment |
Unpaid Principal Balance |
Related Allowance |
Average Recorded Investment |
Interest Income Foregone |
Interest Income Recognized |
|||||||||||||||||||||||||||||
|
Total: |
(in thousands) |
||||||||||||||||||||||||||||||||||
|
Commercial and industrial |
$ |
2,263 |
$ |
3,348 |
$ |
372 |
$ |
2,983 |
$ |
171 |
$ |
40 | |||||||||||||||||||||||
|
Residential real estate: |
|||||||||||||||||||||||||||||||||||
|
Residential |
2,611 | 2,790 | 28 | 2,652 | 52 | 86 | |||||||||||||||||||||||||||||
|
Construction |
- |
- |
- |
- |
- |
- |
|||||||||||||||||||||||||||||
|
Commercial real estate: |
|||||||||||||||||||||||||||||||||||
|
Commercial |
9,025 | 9,288 | 643 | 9,204 | 290 | 161 | |||||||||||||||||||||||||||||
|
Construction |
187 | 187 |
- |
218 |
- |
13 | |||||||||||||||||||||||||||||
|
Home equities |
1,785 | 1,892 |
- |
1,828 | 62 | 33 | |||||||||||||||||||||||||||||
|
Consumer and other |
34 | 59 | 34 | 37 | 3 | 2 | |||||||||||||||||||||||||||||
|
Total impaired loans |
$ |
15,905 |
$ |
17,564 |
$ |
1,077 |
$ |
16,922 |
$ |
578 |
$ |
335 | |||||||||||||||||||||||
|
|
|||||||||||||||||||||||||||||||||||
|
|
|||||||||||||||||||||||||||||||||||
|
|
|||||||||||||||||||||||||||||||||||
|
|
|||||||||||||||||||||||||||||||||||
|
|
At December 31, 2016 |
||||||||||||||||||||||||||||||||||
|
|
Recorded Investment |
Unpaid Principal Balance |
Related Allowance |
Average Recorded Investment |
Interest Income Foregone |
Interest Income Recognized |
|||||||||||||||||||||||||||||
|
With no related allowance recorded: |
(in thousands) |
||||||||||||||||||||||||||||||||||
|
Commercial and industrial |
$ |
1,304 |
$ |
1,604 |
$ |
- |
$ |
1,455 |
$ |
125 |
$ |
51 | |||||||||||||||||||||||
|
Residential real estate: |
|||||||||||||||||||||||||||||||||||
|
Residential |
2,513 | 2,720 |
- |
2,542 | 39 | 78 | |||||||||||||||||||||||||||||
|
Construction |
- |
- |
- |
- |
- |
- |
|||||||||||||||||||||||||||||
|
Commercial real estate: |
|||||||||||||||||||||||||||||||||||
|
Commercial |
2,123 | 2,168 |
- |
2,181 | 33 | 89 | |||||||||||||||||||||||||||||
|
Construction |
257 | 257 |
- |
404 | 2 | 28 | |||||||||||||||||||||||||||||
|
Home equities |
1,559 | 1,621 |
- |
1,606 | 51 | 30 | |||||||||||||||||||||||||||||
|
Consumer and other |
- |
- |
- |
- |
- |
- |
|||||||||||||||||||||||||||||
|
Total impaired loans |
$ |
7,756 |
$ |
8,370 |
$ |
- |
$ |
8,188 |
$ |
250 |
$ |
276 | |||||||||||||||||||||||
81
|
|
|||||||||||||||||||||||||||||||||||
|
|
At December 31, 2016 |
||||||||||||||||||||||||||||||||||
|
|
Recorded Investment |
Unpaid Principal Balance |
Related Allowance |
Average Recorded Investment |
Interest Income Foregone |
Interest Income Recognized |
|||||||||||||||||||||||||||||
|
With a related allowance recorded: |
(in thousands) |
||||||||||||||||||||||||||||||||||
|
Commercial and industrial |
$ |
1,844 |
$ |
1,913 |
$ |
492 |
$ |
1,898 |
$ |
62 |
$ |
53 | |||||||||||||||||||||||
|
Residential real estate: |
|||||||||||||||||||||||||||||||||||
|
Residential |
71 | 72 | 1 | 72 | 2 | 1 | |||||||||||||||||||||||||||||
|
Construction |
- |
- |
- |
- |
- |
- |
|||||||||||||||||||||||||||||
|
Commercial real estate: |
|||||||||||||||||||||||||||||||||||
|
Commercial |
1,054 | 1,083 | 296 | 1,062 | 50 |
- |
|||||||||||||||||||||||||||||
|
Construction |
4,179 | 4,201 | 1,175 | 4,180 | 194 |
- |
|||||||||||||||||||||||||||||
|
Home equities |
194 | 206 | 20 | 195 | 9 | 1 | |||||||||||||||||||||||||||||
|
Consumer and other |
43 | 68 | 43 | 45 | 3 | 3 | |||||||||||||||||||||||||||||
|
Total impaired loans |
$ |
7,385 |
$ |
7,543 |
$ |
2,027 |
$ |
7,452 |
$ |
320 |
$ |
58 | |||||||||||||||||||||||
|
|
|||||||||||||||||||||||||||||||||||
|
|
|||||||||||||||||||||||||||||||||||
|
|
|||||||||||||||||||||||||||||||||||
|
|
At December 31, 2016 |
||||||||||||||||||||||||||||||||||
|
|
Recorded Investment |
Unpaid Principal Balance |
Related Allowance |
Average Recorded Investment |
Interest Income Foregone |
Interest Income Recognized |
|||||||||||||||||||||||||||||
|
Total: |
(in thousands) |
||||||||||||||||||||||||||||||||||
|
Commercial and industrial |
$ |
3,148 |
$ |
3,517 |
$ |
492 |
$ |
3,353 |
$ |
187 |
$ |
104 | |||||||||||||||||||||||
|
Residential real estate: |
|||||||||||||||||||||||||||||||||||
|
Residential |
2,584 | 2,792 | 1 | 2,614 | 41 | 79 | |||||||||||||||||||||||||||||
|
Construction |
- |
- |
- |
- |
- |
- |
|||||||||||||||||||||||||||||
|
Commercial real estate: |
|||||||||||||||||||||||||||||||||||
|
Commercial |
3,177 | 3,251 | 296 | 3,243 | 83 | 89 | |||||||||||||||||||||||||||||
|
Construction |
4,436 | 4,458 | 1,175 | 4,584 | 196 | 28 | |||||||||||||||||||||||||||||
|
Home equities |
1,753 | 1,827 | 20 | 1,801 | 60 | 31 | |||||||||||||||||||||||||||||
|
Consumer and other |
43 | 68 | 43 | 45 | 3 | 3 | |||||||||||||||||||||||||||||
|
Total impaired loans |
$ |
15,141 |
$ |
15,913 |
$ |
2,027 |
$ |
15,640 |
$ |
570 |
$ |
334 | |||||||||||||||||||||||
|
|
|||||||||||||||||||||||||||||||||||
There were $7.7 million in impaired loans with no related allowance at December 31, 2017 and $7.8 million in impaired loans with no related allowance at December 31, 2016. As management identifies impaired loans that are collateral dependent, new appraisals are ordered to determine the fair value of the collateral. It should also be noted that when estimating the fair value of collateral for the purpose of performing an impairment test, management further reduces the appraised value of the collateral to account for estimated selling or carrying costs, age of the appraisal, if applicable, or any other perceived market or borrower-specific risks to the value of the collateral.
The interest income in the preceding table was interest income recognized on accruing TDRs and interest paid prior to loans being identified as non-accrual. The interest income foregone in the preceding table represents interest income that the Company did not recognize on those loans while they were on non-accrual.
The Bank had no loan commitments to borrowers in non-accrual status at December 31, 2017 and 2016.
82
Troubled debt restructurings (“TDRs”)
The Company had $7.3 million in loans that were restructured and deemed to be TDRs at December 31, 2017 with $4.4 million of those balances in non-accrual status. Any new TDR that is placed on non-accrual is not returned to accruing status until the borrower makes timely payments as contracted for at least six months and future collection under the revised terms is probable. All of the restructurings were allowed in an effort to maximize the Company’s ability to collect on loans where borrowers were experiencing financial difficulty. The reserve for a TDR is based upon the present value of the future expected cash flows discounted at the loan’s original effective rate or upon the fair value of the collateral less costs to sell, if the loan is deemed collateral dependent. This reserve methodology is used because all TDR loans are considered impaired.
The following table presents the Company’s TDR loans as of December 31, 2017, and 2016, respectively:
|
|
||||||||||||
|
|
December 31, 2017 |
|||||||||||
|
|
(in thousands) |
|||||||||||
|
|
Total |
Nonaccruing |
Accruing |
Related Allowance |
||||||||
|
Commercial and industrial |
$ |
734 |
$ |
220 |
$ |
514 |
$ |
8 | ||||
|
Residential real estate: |
||||||||||||
|
Residential |
1,656 | 271 | 1,385 |
- |
||||||||
|
Construction |
- |
- |
- |
- |
||||||||
|
Commercial real estate: |
||||||||||||
|
Commercial and multi-family |
3,854 | 3,767 | 87 | 236 | ||||||||
|
Construction |
187 |
- |
187 |
- |
||||||||
|
Home equities |
794 | 128 | 666 |
- |
||||||||
|
Consumer and other |
25 |
- |
25 | 24 | ||||||||
|
Total TDR loans |
$ |
7,250 |
$ |
4,386 |
$ |
2,864 |
$ |
268 | ||||
|
|
||||||||||||
|
|
December 31, 2016 |
|||||||||||
|
|
(in thousands) |
|||||||||||
|
|
Total |
Nonaccruing |
Accruing |
Related Allowance |
||||||||
|
Commercial and industrial |
$ |
574 |
$ |
532 |
$ |
42 |
$ |
147 | ||||
|
Residential real estate: |
||||||||||||
|
Residential |
1,949 | 227 | 1,722 |
- |
||||||||
|
Construction |
- |
- |
- |
- |
||||||||
|
Commercial real estate: |
||||||||||||
|
Commercial and multi-family |
1,617 | 313 | 1,304 |
- |
||||||||
|
Construction |
257 |
- |
257 |
- |
||||||||
|
Home equities |
667 | 175 | 492 | 1 | ||||||||
|
Consumer and other |
26 |
- |
26 | 26 | ||||||||
|
Total TDR loans |
$ |
5,090 |
$ |
1,247 |
$ |
3,843 |
$ |
174 | ||||
The Company’s TDRs have various agreements that involve deferral of principal payments, or interest-only payments, for a period (usually 12 months or less) to allow the customer time to improve cash flow or sell the property. Other common types of concessions leading to the designation of a TDR are lines of credit that are termed-out and extensions of maturities at rates that are less than prevailing market rates given the risk profile of the borrower.
83
The following tables show the data for TDR activity by type of concession granted to the borrower during 2017 and 2016:
|
|
||||||||||||||||
|
|
Year ended December 31, 2017 |
Year ended December 31, 2016 |
||||||||||||||
|
|
(Recorded Investment in thousands) |
(Recorded Investment in thousands) |
||||||||||||||
|
Troubled Debt Restructurings by Type of Concession |
Number of Contracts |
Pre-Modification Outstanding Recorded Investment |
Post-Modification Outstanding Recorded Investment |
Number of Contracts |
Pre-Modification Outstanding Recorded Investment |
Post-Modification Outstanding Recorded Investment |
||||||||||
|
|
||||||||||||||||
|
Commercial and Industrial: |
||||||||||||||||
|
Deferral of principal |
1 |
$ |
874 |
$ |
874 |
- |
$ |
- |
$ |
- |
||||||
|
Extension of maturity |
- |
- |
- |
2 | 121 | 121 | ||||||||||
|
Term-out line of credit |
1 | 180 | 180 | 1 | 20 | 20 | ||||||||||
|
Residential Real Estate & Construction: |
||||||||||||||||
|
Extension of maturity |
2 | 254 | 272 | 1 | 95 | 95 | ||||||||||
|
Extension of maturity and |
||||||||||||||||
|
interest rate reduction |
- |
- |
- |
1 | 109 | 109 | ||||||||||
|
Commercial Real Estate & Construction: |
||||||||||||||||
|
Extension of maturity |
3 | 5,073 | 5,073 |
- |
- |
- |
||||||||||
|
Combination of concessions |
1 | 4,179 | 3,397 |
- |
- |
- |
||||||||||
|
Home Equities |
- |
- |
- |
- |
- |
- |
||||||||||
|
Deferral of principal |
1 | 175 | 175 |
- |
- |
- |
||||||||||
|
Extension of maturity and |
||||||||||||||||
|
interest rate reduction |
1 | 20 | 20 |
- |
- |
- |
||||||||||
|
Consumer and other loans |
- |
- |
- |
- |
- |
- |
||||||||||
Modifications made to loans in a troubled debt restructuring did not have a material impact on the Company’s net income for the years ended December 31, 2017 and 2016. All of the C&I and commercial real estate TDRs were already considered impaired and sufficiently reserved for prior to being identified as a TDR.
At December 31, 2017, there were no commitments to lend additional funds to debtors owing loans whose terms have been modified in TDRs.
The general practice of the Bank is to work with borrowers so that they are able to repay their loan in full. If a borrower continues to be delinquent or cannot meet the terms of a TDR and the loan is determined to be uncollectible, the loan will be charged-off to its collateral value. A loan is considered in default when the loan is 90 days past due. The following table presents loans which were classified as TDRs during the preceding twelve months and which subsequently defaulted during the twelve month periods ended December 31, 2017 and 2016, respectively:
|
|
||||||||||
|
|
Year ended December 31, 2017 |
Year ended December 31, 2016 |
||||||||
|
|
(Recorded Investment in thousands) |
(Recorded Investment in thousands) |
||||||||
|
|
||||||||||
|
Troubled Debt Restructurings |
Number of |
Recorded |
Number of |
Recorded |
||||||
|
That Subsequently Defaulted |
Contracts |
Investment |
Contracts |
Investment |
||||||
|
Commercial and industrial |
1 |
$ |
107 |
- |
$ |
- |
||||
|
Residential real estate |
1 |
151 |
- |
- |
||||||
|
Commercial real estate |
- |
- |
- |
- |
||||||
|
Home equities |
- |
- |
- |
- |
||||||
|
Consumer and other loans |
- |
- |
- |
- |
||||||
|
|
||||||||||
84
4.PROPERTIES AND EQUIPMENT
Properties and equipment at December 31 were as follows:
|
|
2017 |
2016 |
||||
|
|
(in thousands) |
|||||
|
Land |
$ |
268 |
$ |
268 | ||
|
Buildings and improvements |
13,047 | 13,032 | ||||
|
Furniture, fixtures, and equipment |
15,504 | 15,022 | ||||
|
|
28,819 | 28,322 | ||||
|
Less accumulated depreciation |
(18,255) | (17,012) | ||||
|
Properties and equipment, net |
$ |
10,564 |
$ |
11,310 | ||
Depreciation expense totaled $1.2 million in 2017, $1.2 million in 2016, and $1.0 million in 2015.
5.OTHER ASSETS
Other assets at December 31 were as follows:
|
|
||||||
|
|
||||||
|
|
2017 |
2016 |
||||
|
|
(in thousands) |
|||||
|
Net deferred tax asset |
$ |
4,450 |
$ |
7,310 | ||
|
Accrued interest receivable |
4,091 | 3,243 | ||||
|
State historic tax credit receivable |
4,960 | 2,117 | ||||
|
Prepaid expenses |
1,022 | 980 | ||||
|
Mortgage servicing rights |
586 | 527 | ||||
|
Historic tax credit investments |
1,182 | 454 | ||||
|
Accounts receivable |
2,688 | 884 | ||||
|
Other |
1,251 | 1,328 | ||||
|
Total other assets |
$ |
20,230 |
$ |
16,843 | ||
|
|
||||||
6.GOODWILL AND INTANGIBLE ASSETS
The Company had $8.1 million in goodwill at each of December 31, 2017 and 2016. The entire amount of goodwill is within the insurance agency activities segment. The Company measures the fair value of the insurance agency reporting unit annually, as of December 31, utilizing market value EBITDA multiples based on industry data and cash flow modeling. When modeling future cash flows, management considered historical information, the operating budget, and strategic goals in projecting net income and cash flows for the next five years. No impairment was recognized as a result of the goodwill impairment test as of December 31, 2017 and 2016, respectively. Further discussion of the Company’s goodwill impairment testing is included in Note 1.
85
TEA purchased the assets of A.M. Smith Group, Inc., a local insurance agency in Lockport, NY, on December 31, 2016 and Mietus Agency in Derby, N.Y on January 1, 2017. Intangible assets related to those acquisitions are reflected in the table below:
|
|
|||||||||||||
|
2017 |
Gross Carrying Amount |
Accumulated Amortization |
Net |
Weighted Avg Amortization Period |
|||||||||
|
|
(in thousands) |
||||||||||||
|
|
|||||||||||||
|
Insurance expirations |
$ |
565 |
$ |
(113) |
$ |
452 |
4 years |
||||||
|
|
|||||||||||||
|
|
|||||||||||||
|
2016 |
Gross Carrying Amount |
Accumulated Amortization |
Net |
Weighted Avg Amortization Period |
|||||||||
|
|
(in thousands) |
||||||||||||
|
|
|||||||||||||
|
Insurance expirations |
$ |
305 |
$ |
- |
$ |
305 |
5 years |
||||||
|
|
|||||||||||||
Amortization expense related to intangibles for the years ended December 31, 2017, 2016, and 2015 was $113 thousand, $0, and $0, respectively. Estimated amortization expense for each of the four succeeding fiscal years is as follows:
|
|
|||
|
|
|||
|
Year Ending December 31 |
Amount |
||
|
|
(in thousands) |
||
| 2018 |
$ |
113 | |
| 2019 | 113 | ||
| 2020 | 113 | ||
| 2021 | 113 | ||
|
|
$ |
452 | |
86
7.DEPOSITS
Time deposits, with minimum denominations of $100 thousand each, totaled $103.7 million and $70.2 million at December 31, 2017 and 2016, respectively. There were overdrawn deposit accounts classified as loans of less than $0.1 million at both December 31, 2017 and 2016.
At December 31, 2017, the scheduled maturities of all time deposits were as follows:
|
|
|||
|
|
|||
|
|
(in thousands) |
||
| 2018 |
$ |
120,308 | |
| 2019 | 31,877 | ||
| 2020 | 18,160 | ||
| 2021 | 10,390 | ||
| 2022 | 5,722 | ||
|
|
$ |
186,457 | |
In prior years, some of the Company’s time deposits were obtained through brokered transactions. Brokered time deposits totaled $1.2 million at each of December 31, 2017 and 2016.
8.BORROWED FUNDS AND JUNIOR SUBORDINATED DEBENTURES
Other borrowings at December 31, 2017 consist of a $10 million advance from the FHLB with a fixed interest rate of 1.73% that matures in 2020 and a FHLB Overnight Line of Credit advance of $78 million.
The Bank has the ability to borrow additional funds from the FHLB based on the securities or real estate loans that can be used as collateral and to purchase additional federal funds through one of the Bank’s correspondent banks. Given the current collateral available, additional advances of up to $164 million can be drawn on the FHLB via the Bank’s Overnight Line of Credit Agreement. The Bank also has the ability to purchase up to $18 million in federal funds from its correspondent banks.
As a member of the Federal Home Loan Bank System, the Bank is required to hold stock in FHLBNY. The Bank held FHLBNY stock with a carrying value of $5 million and $2 million as of December 31, 2017 and December 31, 2016, respectively.
87
The amounts and interest rates of other borrowed funds were as follows:
|
|
||||||||||||
|
|
FHLB Overnight Line of Credit |
FHLB Advances |
Total Other Borrowings |
|||||||||
|
|
(in thousands) |
|||||||||||
|
At December 31, 2017 |
||||||||||||
|
Amount outstanding |
$ |
78,250 |
$ |
10,000 |
$ |
88,250 | ||||||
|
Weighted-average interest rate |
1.53 |
% |
1.73 |
% |
1.55 |
% |
||||||
|
|
||||||||||||
|
For the year ended December 31, 2017 |
||||||||||||
|
Highest amount at a month end |
$ |
78,250 |
$ |
10,000 | ||||||||
|
Daily average amount outstanding |
$ |
16,491 |
$ |
10,000 |
$ |
26,491 | ||||||
|
Weighted-average interest rate |
1.36 |
% |
1.73 |
% |
1.50 |
% |
||||||
|
|
||||||||||||
|
At December 31, 2016 |
||||||||||||
|
Amount outstanding |
$ |
18,200 |
$ |
10,000 |
$ |
28,200 | ||||||
|
Weighted-average interest rate |
0.74 |
% |
1.73 |
% |
1.09 |
% |
||||||
|
|
||||||||||||
|
For the year ended December 31, 2016 |
||||||||||||
|
Highest amount at a month end |
$ |
49,100 |
$ |
10,000 | ||||||||
|
Daily average amount outstanding |
$ |
16,011 |
$ |
10,000 |
$ |
26,011 | ||||||
|
Weighted-average interest rate |
0.61 |
% |
1.73 |
% |
1.05 |
% |
||||||
|
|
||||||||||||
|
At December 31, 2015 |
||||||||||||
|
Amount outstanding |
$ |
- |
$ |
10,000 |
$ |
10,000 | ||||||
|
Weighted-average interest rate |
- |
% |
1.73 |
% |
1.73 |
% |
||||||
|
|
||||||||||||
|
For the year ended December 31, 2015 |
||||||||||||
|
Highest amount at a month end |
$ |
17,700 |
$ |
10,000 | ||||||||
|
Daily average amount outstanding |
$ |
2,504 |
$ |
7,151 |
$ |
9,655 | ||||||
|
Weighted-average interest rate |
0.33 |
% |
1.79 |
% |
1.41 |
% |
||||||
On October 1, 2004, Evans Capital Trust I, a statutory business trust wholly-owned by the Company (the “Trust”), issued $11.0 million in aggregate principal amount of floating rate preferred capital securities due November 23, 2034 (the “Capital Securities”) classified on the Company’s consolidated balance sheets as Junior Subordinated Debentures. The distribution rate on the Capital Securities of the Trust adjusts quarterly based on changes in the three-month London Interbank Offered Rate (“LIBOR”) and was 4.10% at December 31, 2017.
The Capital Securities have a distribution rate of three-month LIBOR plus 2.65%, and the distribution dates are February 23, May 23, August 23, and November 23.
The common securities of the Trust (the “Common Securities”) are wholly-owned by the Company and are the only class of the Trust’s securities possessing general voting powers. The Capital Securities represent preferred undivided interests in the assets of the Trust. Under the Federal Reserve Board’s current risk-based capital guidelines, the Capital Securities are includable in the Company’s Tier 1 (Core) capital.
The proceeds from the issuances of the Capital Securities and Common Securities were used by the Trust to purchase $11.3 million in aggregate liquidation amount of floating rate junior subordinated deferrable interest debentures (“Junior Subordinated Debentures”) of the Company, due October 1, 2037, which are comprised of $11.0 million of Capital Securities and $330 thousand of Common Securities. The $330 thousand of Common Securities represent the initial capital contribution of the Company to the Trust, which, in accordance with the provisions of ASC Topic 810 "Consolidation," have not been consolidated and are included in “Other Assets” on the consolidated balance sheet.
88
The Junior Subordinated Debentures represent the sole assets of the Trust, and payments under the Junior Subordinated Debentures are the sole source of cash flow for the Trust. The interest rate payable on the Junior Subordinated Debentures was 4.10% at December 31, 2017.
Holders of the Capital Securities receive preferential cumulative cash distributions on each distribution date at the stated distribution rate, unless the Company exercises its right to extend the payment of interest on the Junior Subordinated Debentures for up to twenty quarterly periods, in which case payment of distributions on the respective Capital Securities will be deferred for comparable periods. During an extended interest period, in accordance with terms as defined in the indenture relating to the Capital Securities, the Company may not pay dividends or distributions on, or repurchase, redeem, or acquire any shares of its capital stock. The agreements governing the Capital Securities, in the aggregate, provide a full, irrevocable, and unconditional guarantee by the Company of the payment of distributions on, the redemption of, and any liquidation distribution with respect to the Capital Securities. The obligations under such guarantee and the Capital Securities are subordinate and junior in right of payment to all senior indebtedness of the Company.
The Capital Securities will remain outstanding until the Junior Subordinated Debentures are repaid at maturity, are redeemed prior to maturity, or are distributed in liquidation to the Trust. The Capital Securities are mandatorily redeemable in whole, but not in part, upon repayment at the stated maturity dates of the Junior Subordinated Debentures or the earlier redemption of the Junior Subordinated Debentures in whole upon the occurrence of one or more events (“Events”) set forth in the indentures relating to the Capital Securities, and in whole or in part at any time contemporaneously with the optional redemption of the related Junior Subordinated Debentures in whole or in part. The Junior Subordinated Debentures are redeemable prior to their stated maturity dates at the Company’s option: (i) on or after the stated optional redemption dates, in whole at any time, or in part from time to time; or (ii) in whole, but not in part, at any time within 90 days following the occurrence and during the continuation of one or more of the Events, in each case subject to possible regulatory approval. The redemption price of the Capital Securities and the related Junior Subordinated Debentures upon early redemption would be at the liquidation amount plus accumulated but unpaid distributions.
9.SECURITIES SOLD UNDER AGREEMENTS TO REPURCHASE
The Bank enters into agreements with customers to sell securities owned by the Bank to the customers and repurchase the identical security, within one business day. No physical movement of the securities is involved. The customers are informed the securities are held in safekeeping by the Bank on behalf of the customers. The Bank had $9.3 million and $10.2 million in securities sold under agreement to repurchase at December 31, 2017 and 2016, respectively.
89
10.COMPREHENSIVE INCOME (LOSS)
The following tables display the components of other comprehensive income (loss), net of tax:
|
|
Balance at December 31, 2016 |
Net Change |
Balance at December 31, 2017 |
||||||
|
|
(in thousands) |
||||||||
|
Net unrealized loss on investment securities |
$ |
(365) |
$ |
(684) |
$ |
(1,049) | |||
|
Net defined benefit pension plan adjustments |
(2,059) | (309) | (2,368) | ||||||
|
Total |
$ |
(2,424) |
$ |
(993) |
$ |
(3,417) | |||
|
|
Balance at December 31, 2015 |
Net Change |
Balance at December 31, 2016 |
||||||
|
|
(in thousands) |
||||||||
|
Net unrealized gain (loss) on investment securities |
$ |
475 |
$ |
(840) |
$ |
(365) | |||
|
Net defined benefit pension plan adjustments |
(2,285) | 226 | (2,059) | ||||||
|
Total |
$ |
(1,810) |
$ |
(614) |
$ |
(2,424) | |||
|
|
Balance at December 31, 2014 |
Net Change |
Balance at December 31, 2015 |
||||||
|
|
(in thousands) |
||||||||
|
Net unrealized gain (loss) on investment securities |
$ |
911 |
$ |
(436) |
$ |
475 | |||
|
Net defined benefit pension plan adjustments |
(2,419) | 134 | (2,285) | ||||||
|
Total |
$ |
(1,508) |
$ |
(302) |
$ |
(1,810) | |||
|
|
December 31, 2017 |
||||||||||||||
|
|
Before-Tax Amount |
Income Tax (Provision) Benefit |
Net-of-Tax Amount |
Tax effect reclass due to TCJA |
Total Net Change |
||||||||||
|
Unrealized loss on investment securities: |
|||||||||||||||
|
Unrealized (loss) gain on investment securities |
$ |
(826) |
$ |
319 |
$ |
(507) |
$ |
(177) |
$ |
(684) | |||||
|
|
|||||||||||||||
|
Defined benefit pension plans adjustments: |
|||||||||||||||
|
Net actuarial (loss) gain |
$ |
(30) |
$ |
11 |
$ |
(19) | |||||||||
|
Reclassifications from accumulated other |
|||||||||||||||
|
comprehensive income for gains (losses) |
|||||||||||||||
|
Amortization of prior service cost (a) |
31 | (4) | 27 | ||||||||||||
|
Amortization of actuarial loss (a) |
173 | (36) | 137 | ||||||||||||
|
Net change |
174 | (29) | 145 | (454) | (309) | ||||||||||
|
|
|||||||||||||||
|
Other Comprehensive Income (Loss) |
$ |
(652) |
$ |
290 |
$ |
(362) |
$ |
(631) |
$ |
(993) | |||||
|
(a) |
Included in net periodic pension cost as described in Note 11 – “Employee Benefits and Deferred Compensation Plans” |
90
|
|
December 31, 2016 |
||||||||
|
|
Before-Tax Amount |
Income Tax (Provision) Benefit |
Net-of-Tax Amount |
||||||
|
Unrealized loss on investment securities: |
|||||||||
|
Unrealized (loss) gain on investment securities |
$ |
(1,355) |
$ |
515 |
$ |
(840) | |||
|
|
|||||||||
|
Defined benefit pension plans adjustments: |
|||||||||
|
Net actuarial gain (loss) |
$ |
110 |
$ |
(42) |
$ |
68 | |||
|
Reclassifications from accumulated other |
|||||||||
|
comprehensive income for gains (losses) |
|||||||||
|
Amortization of prior service cost (a) |
31 | (12) | 19 | ||||||
|
Amortization of actuarial loss (a) |
221 | (82) | 139 | ||||||
|
Net change |
362 | (136) | 226 | ||||||
|
|
|||||||||
|
Other Comprehensive Income (Loss) |
$ |
(993) |
$ |
379 |
$ |
(614) | |||
|
(a) |
Included in net periodic pension cost as described in Note 11 – “Employee Benefits and Deferred Compensation Plans” |
|
|
December 31, 2015 |
||||||||
|
|
Before-Tax Amount |
Income Tax (Provision) Benefit |
Net-of-Tax Amount |
||||||
|
Unrealized loss on investment securities: |
|||||||||
|
Unrealized (loss) gain on investment securities |
$ |
(719) |
$ |
283 |
$ |
(436) | |||
|
|
|||||||||
|
Defined benefit pension plans adjustments: |
|||||||||
|
Net actuarial gain (loss) |
$ |
5 |
$ |
(15) |
$ |
(10) | |||
|
Reclassifications from accumulated other |
|||||||||
|
comprehensive income for gains (losses) |
|||||||||
|
Amortization of prior service cost (a) |
31 | (12) | 19 | ||||||
|
Amortization of actuarial loss (a) |
201 | (76) | 125 | ||||||
|
Net change |
237 | (103) | 134 | ||||||
|
|
|||||||||
|
Other Comprehensive Income (Loss) |
$ |
(482) |
$ |
180 |
$ |
(302) | |||
|
(a) |
Included in net periodic pension cost as described in Note 11 – “Employee Benefits and Deferred Compensation Plans” |
11.EMPLOYEE BENEFITS AND DEFERRED COMPENSATION PLANS
Employees’ Pension Plan
The Bank has a defined benefit pension plan that covered substantially all employees of the Company and its subsidiaries (the “Pension Plan”). The Pension Plan provides benefits that are based on the employees’ compensation and years of service. The Bank uses an actuarial method of amortizing prior service cost and unrecognized net gains or losses which result from actual experience and assumptions being different than those that are projected. The amortization method the Bank uses recognizes the prior service cost and net gains or losses over the average remaining service period of active employees which exceeds the required amortization. The Pension Plan was frozen effective January 31, 2008. Under the freeze, eligible employees will receive the benefits already earned through January 31, 2008 at retirement, but will not be able to accrue any additional benefits. As a result, service cost will no longer be incurred.
91
Selected Financial Information for the Pension Plan is as follows:
|
|
||||||
|
|
||||||
|
|
12/31/2017 |
12/31/2016 |
||||
|
Change in benefit obligation: |
(in thousands) |
|||||
|
Benefit obligation at the beginning of the year |
$ |
5,524 |
$ |
5,384 | ||
|
Service cost |
- |
- |
||||
|
Interest cost |
216 | 221 | ||||
|
Assumption change |
245 | 97 | ||||
|
Actuarial (gain) loss |
62 | 11 | ||||
|
Benefits paid |
(205) | (189) | ||||
|
Benefit obligation at the end of the year |
5,842 | 5,524 | ||||
|
|
||||||
|
Change in plan assets: |
||||||
|
Fair value of plan assets at the beginning of year |
4,266 | 4,067 | ||||
|
Actual return on plan assets |
726 | 248 | ||||
|
Employer contributions |
1,000 | 140 | ||||
|
Benefits paid |
(205) | (189) | ||||
|
Fair value of plan assets at the end of year |
5,787 | 4,266 | ||||
|
|
||||||
|
Funded status |
$ |
(55) |
$ |
(1,258) | ||
|
|
||||||
|
Amount recognized in the Consolidated Balance Sheets consist of: |
||||||
|
Accrued benefit liabilities |
$ |
(55) |
$ |
(1,258) | ||
|
|
||||||
|
Amount recognized in the Accumulated Other Comprehensive Loss consists of: |
||||||
|
Net actuarial loss |
$ |
2,192 |
$ |
2,429 | ||
|
Prior service cost |
- |
- |
||||
|
Net amount recognized in equity - pre-tax |
$ |
2,192 |
$ |
2,429 | ||
|
|
||||||
|
Net amount recognized on Consolidated Balance Sheets in Other Liabilities |
$ |
2,137 |
$ |
1,171 | ||
|
|
||||||
|
Accumulated benefit obligation at year end |
$ |
5,842 |
$ |
5,524 | ||
Assumptions used by the Bank in the determination of Pension Plan information consisted of the following:
|
|
||||||||||||
|
|
||||||||||||
|
|
2017 |
2016 |
2015 |
|||||||||
|
Discount rate for projected benefit obligation |
3.55 |
% |
3.95 |
% |
4.17 |
% |
||||||
|
Discount rate for net periodic pension cost |
3.95 |
% |
4.17 |
% |
3.83 |
% |
||||||
|
Rate of increase in compensation levels |
- |
% |
- |
% |
- |
% |
||||||
|
Expected long-term rate of return of plan assets |
6.50 |
% |
6.50 |
% |
7.50 |
% |
||||||
92
The components of net periodic benefit cost consisted of the following:
|
|
|||||||||
|
|
|||||||||
|
|
2017 |
2016 |
2015 |
||||||
|
|
(in thousands) |
||||||||
|
Service cost |
$ |
- |
$ |
- |
$ |
- |
|||
|
Interest cost |
216 | 221 | 205 | ||||||
|
Expected return on plan assets |
(275) | (263) | (308) | ||||||
|
Net amortization and deferral |
92 | 85 | 71 | ||||||
|
Net periodic benefit cost |
$ |
33 |
$ |
43 |
$ |
(32) | |||
The estimated amounts to be amortized from accumulated other comprehensive loss into net periodic cost in 2018 for amortization of actuarial loss will be $80 thousand.
The Company contributed $1 million to the Pension Plan in 2017 and expects that it will not contribute to the Pension Plan in 2018.
The expected long-term rate of return on Pension Plan assets assumption was determined based on historical returns earned by equity and fixed income securities, adjusted to reflect future return expectations based on plan targeted asset allocation. Equity and fixed income securities were assumed to earn returns in the ranges of 5% to 10% and 5% to 6%, respectively. When these overall return expectations are applied to the Pension Plan’s targeted allocation, the expected rate of return was determined to be 6.50%, which is within the range of expected return. The Company’s management will continue to evaluate its actuarial assumptions, including the expected rate of return, at least annually, and will adjust as necessary.
The weighted average asset allocation of the Pension Plan at December 31, 2017 and 2016, the Pension Plan measurement date, was as follows:
|
|
||||||
|
Asset Category: |
2017 |
2016 |
||||
|
Equity mutual funds |
25.93 |
% |
67.97 |
% |
||
|
Fixed income mutual funds |
72.17 |
% |
30.20 |
% |
||
|
Cash/Short-term investments |
1.90 |
% |
1.83 |
% |
||
|
|
100.00 |
% |
100.00 |
% |
||
The portfolio is invested in accordance with sound investment practices that emphasize long-term investment fundamentals. Consistent with this approach, the investment strategy is to diversify the portfolio in order to reduce risk and to maintain sufficient liquidity to meet the obligations of the Plan. The Plan’s long-term asset allocation under normal market conditions shifted during 2017 from 65% equity investments and 35% in fixed income assets and other short term cash equivalents to 25% and 75%, respectively. The investment objective of the allocation in equity investments emphasizes long term capital appreciation. These equity investments are diversified across market capitalization, industries, style and geographical location. The investment objective of the fixed income allocation is to generally provide a diversified source of income with an awareness of capital preservation. Management decided to fully fund the Plan in 2017 with a $1 million contribution. As a result, the primary objective of the investment philosophy shifted from long term capital appreciation to capital preservation.
93
The major categories of assets in the Bank’s Pension Plan as of year-end are presented in the following table. Assets are segregated according to their investment objective by the level of the valuation inputs within the fair value hierarchy established by ASC Topic 820 utilized to measure fair value (see Note 19 – Fair Value of Financial Instruments).
|
|
||||||
|
|
||||||
|
|
2017 |
2016 |
||||
|
|
(in thousands) |
|||||
|
Level 1: |
||||||
|
Mutual funds: |
||||||
|
Short-term investments: |
||||||
|
Money market |
$ |
110 |
$ |
78 | ||
|
Fixed Income: |
4,176 | 1,288 | ||||
|
Equities: |
||||||
|
Small cap |
243 | 307 | ||||
|
Large cap |
520 | 1,008 | ||||
|
Real estate |
- |
101 | ||||
|
International large cap |
497 | 923 | ||||
|
International small cap |
123 | 201 | ||||
|
Emerging markets |
118 | 254 | ||||
|
Commodity |
- |
106 | ||||
|
|
$ |
5,787 |
$ |
4,266 | ||
The mutual funds are actively traded with market quotes available on at least a daily basis. Therefore, they are Level 1 assets.
The discount rate utilized by the Company for determining future pension obligations is based on a review of long-term bonds that receive one of the two highest ratings given by a recognized rating agency. The discount rate determined on this basis decreased from 3.95% at December 31, 2016 to 3.55% at December 31, 2017 for the Company's Pension Plan.
Expected benefit payments under the Pension Plan over the next ten years at December 31, 2017 are as follows:
|
|
|||
|
|
|||
|
|
(in thousands) |
||
| 2018 |
$ |
216 | |
| 2019 | 214 | ||
| 2020 | 212 | ||
| 2021 | 227 | ||
| 2022 | 261 | ||
|
Year 2023 - 2027 |
1,629 | ||
Supplemental Executive Retirement Plans
The Bank also maintains a non-qualified supplemental executive retirement plan (the “SERP”) covering certain members of the Company’s senior management. The SERP was amended during 2003 to provide a benefit based on a percentage of final average earnings, as opposed to the fixed benefit that was provided for in the superseded plan.
On April 8, 2010, the Compensation Committee of the Board of Directors of the Company approved the adoption of the Evans Bank, N.A. Supplemental Executive Retirement Plan for Senior Executives (“the Senior Executive SERP”). The “old” SERP plan will keep its participants at the time of the creation of the Senior Executive SERP, but any future executives identified by the Board of Directors as eligible for SERP benefits will participate in the Senior Executive SERP. A participant is generally entitled to receive a benefit under the Senior Executive SERP upon a termination of employment, other than for “cause”, after the participant has completed 10 full calendar years of service with the Bank. No benefit is payable under the Senior Executive SERP if the participant’s employment is terminated for “cause” or if the participant voluntarily terminates before completing 10 full calendar years of service with the Bank. In addition, the payment of benefits under the Senior Executive SERP is conditioned upon certain agreements of the participant related to confidentiality, cooperation, non-competition, and non-solicitation. A participant will be entitled to a retirement benefit under the Senior Executive SERP if his or her employment with the Bank terminates other than for “cause”. The “accrued benefit” is based on a percentage of the participant’s final average earnings, which is determined based upon the participant’s total annual compensation over
94
the highest consecutive five calendar years of the participant’s employment with the Bank, accrued over the participant’s “required benefit service”. The percentages and years of service requirements are set forth in each participant’s Participation Agreement, and range from 25% to 35% and from 15 to 20 years.
The obligations related to the two SERP plans are indirectly funded by various life insurance contracts naming the Bank as beneficiary. The Bank has also indirectly funded the SERPs, as well as other benefits provided to other employees, through bank-owned life insurance. The Bank uses an actuarial method of amortizing unrecognized net gains or losses which result from actual experience and assumptions being different than those that are projected. The amortization method the Bank is using recognizes the net gains or losses over the average remaining service period of active employees, which exceeds the required amortization.
Selected financial information for the two SERP plans is as follows:
|
|
||||||
|
|
||||||
|
|
12/31/2017 |
12/31/2016 |
||||
|
Change in benefit obligation: |
(in thousands) |
|||||
|
Benefit obligation at the beginning of the year |
$ |
4,255 |
$ |
4,349 | ||
|
Service cost |
168 | 188 | ||||
|
Interest cost |
137 | 144 | ||||
|
Actuarial (gain) loss |
175 | (234) | ||||
|
Benefits paid |
(193) | (192) | ||||
|
Benefit obligation at the end of the year |
4,542 | 4,255 | ||||
|
|
||||||
|
Change in plan assets: |
||||||
|
Fair value of plan assets at the beginning of year |
- |
- |
||||
|
Actual return on plan assets |
- |
- |
||||
|
Employer contributions |
193 | 192 | ||||
|
Benefits paid |
(193) | (192) | ||||
|
Fair value of plan assets at the end of year |
- |
- |
||||
|
|
||||||
|
Funded status |
$ |
(4,542) |
$ |
(4,255) | ||
|
|
||||||
|
Amount recognized in the Consolidated Balance Sheets consist of: |
||||||
|
Accrued benefit liabilities |
$ |
(4,542) |
$ |
(4,255) | ||
|
|
||||||
|
Amount recognized in the Accumulated Other Comprehensive Loss consists of: |
||||||
|
Net actuarial loss |
$ |
841 |
$ |
747 | ||
|
Prior service cost |
156 | 187 | ||||
|
Net amount recognized in equity - pre-tax |
$ |
997 |
$ |
934 | ||
|
|
||||||
|
Net amount recognized on Consolidated Balance Sheets in Other Liabilities |
$ |
(3,545) |
$ |
(3,321) | ||
|
|
||||||
|
Accumulated benefit obligation at year end |
$ |
4,007 |
$ |
3,902 | ||
Assumptions used by the Bank in both years in the determination of SERP information consisted of the following:
|
|
|||||||||
|
|
2017 |
2016 |
2015 |
||||||
|
Discount rate for projected benefit obligation |
3.09 |
% |
3.30 |
% |
3.38 |
% |
|||
|
Discount rate for net periodic pension cost |
3.30 |
% |
3.38 |
% |
3.30 |
% |
|||
|
Salary scale |
3.00 |
% |
3.00 |
% |
3.50 |
% |
|||
95
The discount rate utilized by the Company for determining future pension obligations is based on a review of long-term bonds that receive one of the two highest ratings given by a recognized rating agency. The discount rate determined on this basis decreased from 3.30% at December 31, 2016 to 3.09% at December 31, 2017 (i.e. the measurement date) for the SERP.
The components of net periodic benefit cost consisted of the following:
|
|
|||||||||
|
|
2017 |
2016 |
2015 |
||||||
|
|
(in thousands) |
||||||||
|
Service cost |
$ |
168 |
$ |
188 |
$ |
194 | |||
|
Interest cost |
137 | 144 | 146 | ||||||
|
Net amortization and deferral |
112 | 167 | 161 | ||||||
|
Net periodic benefit cost |
$ |
417 |
$ |
499 |
$ |
501 | |||
The estimated amounts to be amortized from accumulated other comprehensive loss into net periodic benefit cost in 2018 for prior service costs and actuarial loss will be $31 thousand and $86 thousand, respectively.
Expected benefit payments under the SERP over the next ten years at December 31, 2017 are as follows:
|
|
|||
|
|
|||
|
|
(in thousands) |
||
| 2018 |
$ |
193 | |
| 2019 | 193 | ||
| 2020 | 193 | ||
| 2021 | 277 | ||
| 2022 | 2,841 | ||
|
Year 2023 - 2027 |
1,185 | ||
Other Compensation Plans
The Company has a non-qualified deferred compensation plan whereby directors and certain officers may defer a portion of their base pre-tax compensation. Additionally, the Company has a non-qualified executive incentive retirement plan, whereby the Company defers on behalf of certain officers a portion of their base compensation until retirement or termination of service, subject to certain vesting arrangements. Aggregate expense under these plans was approximately $107 thousand in 2017, $110 thousand in 2016, and $105 thousand in 2015. The benefit obligation, included in other liabilities in the Company’s consolidated balance sheets, was $2.0 million at December 31, 2017 and $2.2 million at each of December 31, 2016 and 2015.
These benefit plans are indirectly funded by bank-owned life insurance contracts with a total aggregate cash surrender value of approximately $27.7 million and $21.5 million at December 31, 2017 and 2016, respectively. Increases in cash surrender value are included in other non-interest income on the Company’s Consolidated Statements of Income. Endorsement split-dollar life insurance benefits have also been provided to directors and certain officers of the Bank and its subsidiaries during employment.
The Bank also has a defined contribution retirement and thrift 401(k) Plan (the “401(k) Plan”) for its employees who meet certain length of service and age requirements. The provisions of the 401(k) Plan allow eligible employees to contribute a portion of their annual salary, up to the IRS statutory limit. The 401(k) plan includes a Qualified Automatic Contribution Arrangement (“QACA”). This arrangement features automatic deferred contributions with annual escalation, a QACA matching contribution, and an additional matching contribution. Employees vest in employer contributions over six years. The Company’s expense under the 401(k) Plan was approximately $818 thousand, $727 thousand, and $751 thousand for the years ended December 31, 2017, 2016, and 2015, respectively.
12.STOCK-BASED COMPENSATION
At December 31, 2017, the Company had two stock-based compensation plans, which are described below. The Company accounts for the fair value of its grants under these plans in accordance with ASC Topic 718, “Compensation – Stock Compensation”. The compensation cost charged against income for those plans was $456 thousand, $380 thousand, and $318 thousand for 2017, 2016, and 2015, respectively, and is included in “Salaries and Employee Benefits” in the Company’s Consolidated Statements of Income. All stock option and restricted stock expense is recorded on a straight-line basis over the expected vesting term. In addition, expenses for director stock-based compensation were recognized to reflect $120 thousand, $98 thousand, and $106 thousand in 2017, 2016, and 2015, respectively, as part of “Other” expense in the Company’s Consolidated Statements of Income.
96
2009 Long-Term Equity Incentive Plan
Under the Company’s 2009 Long-Term Equity Incentive Plan (the “2009 Plan”) and, prior to the adoption of the 2009 Plan by shareholders in April 2009, under the Company’s 1999 Employee Stock Option and Long-Term Incentive Plan (the “1999 Plan” and together with the 2009 Plan, the “Equity Plans”), the Company has granted options or restricted stock to officers, directors and key employees of the Company and its subsidiaries. Under the Equity Plans, the Company was authorized to issue up to 629,796 shares of common stock. Under the Equity Plans, the exercise price of each option is not to be less than 100% of the market price of the Company’s stock on the date of grant and an option’s maximum term is ten years. If available, the Company normally issues shares out of its treasury for any options exercised or restricted shares issued. The options have vesting schedules from 12 months through 4 years. At December 31, 2017, there were a total of 107,824 shares available for grant under the 2009 Plan. The Company may no longer make grants under the 1999 Plan.
The fair value of each option grant is estimated on the date of grant using the Black-Scholes option-pricing model with the following weighted-average assumptions:
|
|
2017 |
2016 |
2015 |
|||||||||
|
Dividend Yield |
2.03 |
% |
2.88 |
% |
2.93 |
% |
||||||
|
Expected Life (years) |
6.95 | 6.77 | 6.36 | |||||||||
|
Expected Volatility |
17.34 |
% |
17.25 |
% |
19.62 |
% |
||||||
|
Risk-free Interest Rate |
2.24 |
% |
1.78 |
% |
1.90 |
% |
||||||
|
Weighted Average Fair Value |
$ |
6.41 |
$ |
3.05 |
$ |
3.49 | ||||||
The Company used historical volatility calculated using daily closing prices for its common stock over periods that match the expected term of the option granted to estimate the expected volatility. The risk-free interest rate assumption was based upon U.S. Treasury yields appropriate for the expected term of the Company's stock options based upon the date of grant. The expected dividend yield was based upon the Company's recent history of paying dividends. The expected life was based upon the options’ expected vesting schedule and historical exercise patterns.
Stock options activity for 2017 was as follows:
|
|
||||||||||||||||
|
|
Options |
Weighted Average Exercise Price |
Weighted Average Remaining Contractual Term (years) |
Aggregate Intrinsic Value |
||||||||||||
|
Balance, December 31, 2016 |
251,702 |
$ |
18.66 | |||||||||||||
|
Granted |
24,990 | 39.50 | ||||||||||||||
|
Exercised |
(26,199) | 17.66 | ||||||||||||||
|
Expired |
- |
- |
||||||||||||||
|
Forfeited |
(9,273) | 29.06 | ||||||||||||||
|
Balance, December 31, 2017 |
241,220 |
$ |
20.53 | 5.18 |
$ |
5,156 | ||||||||||
|
|
||||||||||||||||
|
Exercisable, December 31, 2017 |
169,119 |
$ |
16.79 | 3.89 |
$ |
4,247 | ||||||||||
Future compensation cost expected to be expensed over the weighted average remaining contractual term for remaining outstanding options is $220 thousand. The unrecognized compensation cost is scheduled to be recognized as follows:
|
|
|||
|
|
|||
|
|
(in thousands) |
||
| 2018 |
$ |
97 | |
| 2019 | 73 | ||
| 2020 | 42 | ||
| 2021 | 8 | ||
97
Restricted stock award activity for 2017 was as follows:
|
|
||||||
|
|
Shares |
Weighted Average Grant Date Fair Value |
||||
|
Balance, December 31, 2016 |
39,168 |
$ |
23.68 | |||
|
Granted |
18,033 | 39.74 | ||||
|
Vested |
(17,018) | 23.00 | ||||
|
Forfeited |
(3,929) | 29.68 | ||||
|
Balance, December 31, 2017 |
36,254 |
$ |
31.34 | |||
As of December 31, 2017, there was $756 thousand in unrecognized compensation cost related to restricted share-based compensation arrangements granted under the Equity Plans. The unrecognized compensation cost is scheduled to be recognized as follows:
|
|
|||
|
|
(in thousands) |
||
| 2018 |
$ |
366 | |
| 2019 | 240 | ||
| 2020 | 127 | ||
| 2021 | 23 | ||
During fiscal years 2017, 2016, and 2015, the following activity occurred under the Company’s plans:
|
|
|||||||||
|
|
|||||||||
|
|
2017 |
2016 |
2015 |
||||||
|
|
(in thousands) |
||||||||
|
Total intrinsic value of stock options exercised |
$ |
567 |
$ |
92 |
$ |
409 | |||
|
Total fair value of restricted stock awards vested |
$ |
645 |
$ |
349 |
$ |
287 | |||
Employee Stock Purchase Plan
The Company also maintains the Evans Bancorp, Inc. Employee Stock Purchase Plan (the “Purchase Plan”). As of December 31, 2017, there were 114,944 shares of common stock available to issue to full-time employees of the Company and its subsidiaries, nearly all of whom are eligible to participate. Under the terms of the Purchase Plan, employees can choose each year to have up to 15% of their annual base earnings withheld to purchase the Company’s common stock. Prior to 2017, the Company granted options on January 1 and July 1 of each year during the term of the Purchase Plan. The purchase price of the stock was 85% of the lower of its price on the grant date (January 1 and July 1) or the exercise date (June 30 and December 31). Starting in 2017, employees can purchase stock only on June 30 and December 31 each year during the term of the Purchase Plan for 85% of the price on the purchase date. The Company no longer grants employees the option to purchase the stock at the lower of the price at the beginning or end or the purchase periods. Under the Purchase Plan, the Company issued 7,610, 10,596, and 10,574 shares to employees in 2017, 2016, and 2015, respectively. In 2017, the compensation cost is calculated by the value of the 15% discount only. In 2015 and 2016, compensation cost was recognized for the fair value of the employees’ purchase rights, which was estimated using the Black-Scholes model with assumptions depicted in the following table.
|
|
2016 |
2015 |
||||||||||
|
Dividend Yield |
2.93 |
% |
3.01 |
% |
||||||||
|
Expected Life (years) |
0.50 | 0.50 | ||||||||||
|
Expected Volatility |
22.97 |
% |
16.47 |
% |
||||||||
|
Risk-free Interest Rate |
0.43 |
% |
0.19 |
% |
||||||||
|
Weighted Average Fair Value |
$ |
7.71 |
$ |
6.92 | ||||||||
The compensation cost that was charged against income for the Purchase Plan was $47 thousand, $75 thousand, and $71 thousand for 2017, 2016, and 2015, respectively.
98
13.INCOME TAXES
The components of the provision for income taxes were as follows:
|
|
|||||||||
|
|
|||||||||
|
|
2017 |
2016 |
2015 |
||||||
|
|
(in thousands) |
||||||||
|
Current federal tax expense |
$ |
2,041 |
$ |
1,990 |
$ |
2,784 | |||
|
Current state tax expense |
18 | 4 | 3 | ||||||
|
Total current tax expense |
2,059 | 1,994 | 2,787 | ||||||
|
|
|||||||||
|
Deferred federal tax expense (benefit) |
$ |
2,441 |
$ |
(405) |
$ |
435 | |||
|
Deferred state tax expense |
709 | 334 | 545 | ||||||
|
Total deferred tax expense (benefit) |
3,150 | (71) | 980 | ||||||
|
|
|||||||||
|
Total income tax provision |
$ |
5,209 |
$ |
1,923 |
$ |
3,767 | |||
The Company’s provision for income taxes differs from the amounts computed by applying the federal income tax statutory rates to income before income taxes. A reconciliation of the differences is as follows:
|
|
||||||||||||||||||
|
|
||||||||||||||||||
|
|
2017 |
2016 |
2015 |
|||||||||||||||
|
|
Amount |
Percent |
Amount |
Percent |
Amount |
Percent |
||||||||||||
|
|
(in thousands) |
|||||||||||||||||
|
Tax provision at statutory rate |
$ |
5,334 | 34 |
% |
$ |
3,466 | 34 |
% |
$ |
3,947 | 34 |
% |
||||||
|
Change in taxes resulting from: |
||||||||||||||||||
|
Tax-exempt income |
(589) | (4) | (522) | (5) | (617) | (5) | ||||||||||||
|
Historic tax credit |
(1,869) | (12) | (1,413) | (14) |
- |
- |
||||||||||||
|
State taxes, net of federal benefit |
455 | 2 | 236 | 2 | 362 | 3 | ||||||||||||
|
Deferred tax asset remeasurement |
2,074 | 13 |
- |
- |
- |
- |
||||||||||||
|
Other items, net |
(196) |
- |
156 | 2 | 75 |
- |
||||||||||||
|
Income tax provision |
$ |
5,209 | 33 |
% |
$ |
1,923 | 19 |
% |
$ |
3,767 | 32 |
% |
||||||
In 2017, the Company recognized the impact of its investments in partnerships that incurred expenses related to the rehabilitation of certified historic structures located in New York State after the historic structures were placed in service. At the time a historic structure is placed in service, the Bank is eligible for a federal and New York State tax credit. As noted in Note 1, for New York State, any new credit earned from rehabilitated historic properties placed in service on or after January 1, 2015 not used in the current tax year will be treated as a refund or overpayment of tax to be credited to the next year’s tax. Since the realization of the tax credit does not depend on the Bank’s generation of future taxable income or the Bank’s ongoing tax status or tax position, the refund is not considered an element of income tax accounting (ASC 740). In such cases, the Bank would not record the credit as a reduction of income tax expense; rather, the Bank includes the refundable New York State tax credit in non-interest income with a corresponding receivable recorded in other assets.
99
The following table presents the impact to the results of operations from the Bank’s historic tax credit activity for the years ended December 31, 2017 and 2016. There was no impact to the 2015 results of operations from historic rehabilitation tax credits.
|
|
||||||
|
|
2017 |
2016 |
||||
|
|
(in thousands) |
|||||
|
|
||||||
|
Loss on tax credit investment |
$ |
(3,997) |
$ |
(3,022) | ||
|
Refundable state historic tax credit |
2,843 | 2,117 | ||||
|
Income tax benefit |
1,869 | 1,413 | ||||
|
Total HTC income |
$ |
715 |
$ |
508 | ||
|
|
||||||
At December 31, 2017 and 2016 the components of the net deferred tax asset were as follows:
|
|
||||||
|
|
2017 |
2016 |
||||
|
|
(in thousands) |
|||||
|
Deferred tax assets: |
||||||
|
Pension and SERP plans |
$ |
1,184 |
$ |
2,094 | ||
|
Allowance for loan and lease losses |
3,566 | 5,222 | ||||
|
Non accrued interest |
58 | 34 | ||||
|
Deferred compensation |
594 | 950 | ||||
|
Litigation accrual |
1 | 61 | ||||
|
Loss on investment in tax credit |
454 | 636 | ||||
|
Stock options granted |
137 | 169 | ||||
|
Historic tax credit carryforward |
518 | 786 | ||||
|
Leases |
109 | 157 | ||||
|
Net unrealized losses on securities |
364 | 224 | ||||
|
Gross deferred tax assets |
$ |
6,985 |
$ |
10,333 | ||
|
|
||||||
|
Deferred tax liabilities: |
||||||
|
Depreciation and amortization |
$ |
1,428 |
$ |
2,071 | ||
|
Prepaid expenses |
479 | 476 | ||||
|
Deferred dividend income |
192 |
- |
||||
|
Mortgage servicing asset |
151 | 200 | ||||
|
Gross deferred tax liabilities |
$ |
2,250 |
$ |
2,747 | ||
|
|
||||||
|
Valuation allowance |
(285) | (276) | ||||
|
Net deferred tax asset |
$ |
4,450 |
$ |
7,310 | ||
The net deferred tax asset at December 31, 2017 and 2016 is included in “other assets” in the Company’s consolidated balance sheets.
In assessing the ability of the Company to realize the benefit of the deferred tax assets, management considers whether it is more likely than not that some portion or all of the deferred tax assets will not be realized. The ultimate realization of deferred tax assets is dependent upon the generation of future taxable income during the periods in which those temporary differences become deductible. Management considers the scheduled reversal of deferred tax liabilities, availability of operating loss carrybacks, projected future taxable income, and tax planning strategies in making this assessment. Based upon the level of historical taxable income, the opportunity for net operating loss carrybacks, and projections for future taxable income over the periods which deferred tax assets are deductible, management believes it is more likely than not the Company will generate sufficient taxable income to realize the benefits of these deductible differences at December 31, 2017, except for a valuation allowance of $171 thousand on the net deferred tax asset for the investment in a historic tax credits of $454 thousand and an allowance of $114 thousand on the net deferred tax asset for pension and
100
SERP plans of $1.2 million. In assessing the need for a valuation allowance for the deferred tax assets for the investments in historic tax credits and for the SERP, the Company considered all positive and negative evidence in assessing whether the weight of available evidence supports the recognition of some or all of the deferred tax assets.
In regard to historic tax credit investments, because of the tax nature of the loss to be recognized when the investment is ultimately sold (which for tax purposes will give rise to a capital loss), the Company does not have any known capital gains in the future to be able to utilize the capital losses from these investments. Therefore, the Company’s assessment of the deferred tax asset warrants the need for a valuation allowance to be recognized on the deferred tax asset that it determined is more-likely-than-not to not be realized. The amount of remaining capital loss includes the projected capital basis after taking the tax credit, expected losses, and cash distributions.
In regard to the deferred tax asset related to the SERP, given the lump sum distribution election made by one of the Company’s executives, the Company expects it will pay that executive a SERP benefit of more than $1 million in a single fiscal year. Per Section 162(m) of the Internal Revenue Code, the amount exceeding $1 million is not deductible for income tax purposes. The Company therefore determined it is more-likely-than-not that the projected benefit obligation for the executive’s SERP benefit exceeding $1 million will not be deductible.
The state historic tax credit carryforward has an indefinite life with no expiration date in which to utilize the credit.
The Company did not have any unrecognized tax benefits for the years ended December 31, 2017, 2016, and 2015.
There were no accrued penalties and interest at December 31, 2017 and 2016.
The Company is subject to routine audits of its tax returns by the Internal Revenue Service (“IRS”) and various state taxing authorities. During 2017, the Company concluded a NYS audit covering the years 2011-2014. The most recent IRS audit was completed in 2010 and covered the years 2006-2008. These audits concluded with no material adverse findings. The tax years 2015-2016 for NYS and 2014-2016 for the IRS remain subject to examination.
The most significant impact of the TCJA is on the Company’s marginal federal tax rate in 2018 and beyond, which will decrease from 35% to 21%. The change in the corporate tax rate resulted in a $2.0 million expense related to the remeasurement of the Company’s deferred tax asset as of December 31, 2017. The impact from the TCJA may differ from this estimate, due to, among other things, further refinement of the Company’s calculations, changes in interpretations and assumptions the Company has made, guidance that may be issued and actions the Company may take as a result of tax reform. Approximately $0.6 million of the $2.0 million expense is associated with deferred taxes related to unrealized gains on available-for-sale investment securities and the unamortized actuarial losses on the Pension Plan and the SERPs which were originally created through other comprehensive income. The Company reclassified the $0.6 million charge related to deferred tax expense for items originally recorded through OCI from OCI to retained earnings per ASU 2018-02, “Reclassification of Certain Tax Effects from Accumulated Other Comprehensive Income,” released in February 2018 and early adopted by the Company for the period ended December 31, 2017.
Other significant aspects of the TCJA that have a direct impact on the Company include:
|
· |
The Company is active in the historic rehabilitation tax credit (“HRTC”) market. Before TCJA, HRTC’s were allowed for 20% of qualified rehabilitation expenses (“QRE”) in the year the property is placed in service. For properties owned before December 31, 2017 in which construction is started by June 22, 2018 and completed by December 22, 2019, the old rules still apply. The Company has two remaining projects that fit these criteria. For all other projects, the HRTC for 20% of QRE will now be taken over a 5 year period rather than all in the first year. This delay in cash flows to investors will negatively impact the pricing on HRTC’s. The Company earned $0.7 million in net income on HRTC investments in 2017. The Company had historic tax credit investments valued at $1.2 million as of December 31, 2017. |
|
· |
The TCJA limits the deductibility of executive compensation. The TCJA expands the definition of “covered employees” for purposes of Section 162(m) of the Internal Revenue Code to include the CFO, CEO, and the three most highly compensated officers for the tax year and designates covered employees as covered employees forever. Previously, if a covered employee retired, the individual would no longer be considered covered in retirement and therefore post-retirement payments to that individual would not be limited by Section 162(m). This change impacts the SERP for one of the Company’s executive officers, who has agreed to receive his benefit in a lump sum payment. The Company anticipates that this lump sum payment will exceed $1 million and the excess of the payment over $1 million will therefore be non-deductible. As of December 31, 2017, the executive’s projected benefit obligation was $1.4 million. As a result, the Company recorded a $114 thousand valuation allowance as an estimate of the non-deductible portion of the future benefit payment. |
101
14.OTHER LIABILITIES
Other liabilities at December 31 were as follows:
|
|
||||||
|
|
||||||
|
|
||||||
|
|
2017 |
2016 |
||||
|
|
(in thousands) |
|||||
|
Retirement compensation liabilities |
$ |
6,997 |
$ |
8,012 | ||
|
Accounts payable |
3,484 | 3,432 | ||||
|
Historic tax credit investment |
3,942 | 2,320 | ||||
|
Interest payable |
334 | 233 | ||||
|
Loan participation payable |
2,143 | 1 | ||||
|
Other |
293 | 300 | ||||
|
Total other liabilities |
$ |
17,193 |
$ |
14,298 | ||
In regard to the loan participation payable for $2.1 million in the table above, on December 29, 2017, the last business day of fiscal 2017, the Bank received a pay-off of a loan that was partially participated out to another financial institution. The Bank received the funds for the full loan amount, including the participating bank’s portion, but did not remit funds to the participating bank until the first business day of 2018. Therefore, the funds received on December 29, 2017 for the participating bank’s portion of the paid off loan was recorded as a liability as of December 31, 2017.
15.RELATED PARTY TRANSACTIONS
The Bank has entered into loan transactions with certain directors, executive officers, significant shareholders and their affiliates (related parties) in the ordinary course of its business. The aggregate outstanding principal balance of loans to such related parties on December 31, 2017 and 2016 was $3.3 million and $3.1 million, respectively. During 2017, there were $3.3 million of advances and new loans to such related parties, and repayments amounted to $3.1 million. Terms of these loans have prevailing market pricing that would be offered to similarly-situated non-affiliated third parties. Deposits from related parties were $2.4 million and $2.2 million as of December 31, 2017 and 2016, respectively.
16.CONTINGENT LIABILITIES AND COMMITMENTS
The Company’s consolidated financial statements do not reflect various commitments and contingent liabilities which arise in the normal course of business and which involve elements of credit risk, interest rate risk, and liquidity risk. These commitments and contingent liabilities are commitments to extend credit and standby letters of credit. A summary of the Bank’s commitments and contingent liabilities at December 31, 2017 and 2016 is as follows:
|
|
||||||
|
|
||||||
|
|
December 31, |
December 31, |
||||
|
|
2017 |
2016 |
||||
|
|
(in thousands) |
|||||
|
|
||||||
|
Commitments to extend credit |
$ |
247,540 |
$ |
217,581 | ||
|
Standby letters of credit |
3,115 | 3,736 | ||||
|
Total |
$ |
250,655 |
$ |
221,317 | ||
Commitments to extend credit and standby letters of credit all include exposure to some credit loss in the event of non-performance of the customer. The Bank’s credit policies and procedures for credit commitments and financial guarantees are the same as those for extensions of credit that are recorded on the Consolidated Balance Sheets. Because these instruments have fixed maturity dates, and because they may expire without being drawn upon, they do not necessarily represent cash requirements to the Bank. The Bank has not incurred any losses on its commitments during the past three years and has not recorded a reserve for its commitments.
The Company has entered into contracts with third parties, some of which include indemnification clauses. Examples of such contracts include contracts with third-party service providers, brokers and dealers, correspondent banks, and purchasers of residential mortgages.
102
Additionally, the Company has bylaws, policies, and agreements under which it agrees to indemnify its officers and directors from liability for certain events or occurrences while the directors or officers are, or were, serving at the Company’s request in such capacities. The Company indemnifies its officers and directors to the fullest extent allowed by law. The maximum potential amount of future payments that the Company could be required to make under these indemnification provisions is unlimited, but would be affected by all relevant defenses to such claims, as well as directors’ and officers’ liability insurance maintained by the Company. Due to the nature of these indemnification provisions, it is not possible to quantify the aggregate exposure to the Company resulting from them.
Certain lending commitments for construction residential mortgage loans are considered derivative instruments under the guidelines of GAAP. The changes in the fair value of these commitments, due to interest rate risk, are not recorded on the consolidated balance sheets as the fair value of these derivatives is not considered to be material.
The Company leases certain offices, land and equipment under long-term operating leases. The aggregate minimum annual rental commitments under these leases total approximately $662 thousand in 2018; $650 thousand in 2019; $595 thousand in 2020; $538 thousand in 2021; $547 thousand in 2022, and $2.5 million thereafter. The rental expense under operating leases contained in the Company’s Consolidated Statements of Income included $651 thousand, $626 thousand, and $645 thousand, in 2017, 2016, and 2015, respectively.
17.CONCENTRATIONS OF CREDIT
All of the Bank’s loans, commitments, and standby letters of credit have been granted to customers in the Bank’s primary market area, which is Western New York. Investments in state and municipal securities also involve governmental entities within the Bank’s primary market area. The concentrations of credit by type of loan are set forth in Note 3 to these Consolidated Financial Statements, "Loans and the Allowance for Loan Losses." The distribution of commitments to extend credit approximates the distribution of loans outstanding. Standby letters of credit were granted primarily to commercial borrowers. The Bank, as a matter of policy, does not extend credit to any single borrower or group in excess of 15% of capital.
18.SEGMENT INFORMATION
The Company is comprised of two primary business segments: banking activities and insurance agency activities. The operating segments are separately managed and their performance is evaluated based on net income. The banking business segment includes both commercial and consumer banking services, including a wide array of lending and depository services as well as offering non-deposit investment products, such as annuities and mutual funds. The insurance agency segment includes the activities of selling various premium-based insurance policies on a commission basis, including business and personal insurance, employee benefits, surety bonds, risk management, life, disability and long-term care coverage, as well as providing claims adjusting services to various insurance companies. All sources of segment specific revenues and expenses contributed to management’s definition of net income. Revenues from transactions between the two segments are not significant. The accounting policies of the segments are the same as those described in Note 1 of these “Notes to Consolidated Financial Statements.”
The following tables set forth information regarding these segments for the years ended December 31, 2017, 2016, and 2015.
|
|
2017 |
||||||||
|
|
Banking |
Insurance Agency |
|||||||
|
|
Activities |
Activities |
Total |
||||||
|
|
(in thousands) |
||||||||
|
|
|||||||||
|
Net interest income (expense) |
$ |
42,119 |
$ |
(102) |
$ |
42,017 | |||
|
Provision for loan losses |
738 |
- |
738 | ||||||
|
Net interest income (expense) after |
|||||||||
|
provision for loan losses |
41,381 | (102) | 41,279 | ||||||
|
Non-interest income |
5,105 |
- |
5,105 | ||||||
|
Insurance service and fees |
416 | 7,482 | 7,898 | ||||||
|
Amortization expense |
- |
113 | 113 | ||||||
|
Non-interest expense |
32,610 | 5,871 | 38,481 | ||||||
|
Income before income taxes |
14,292 | 1,396 | 15,688 | ||||||
|
Income tax provision |
4,674 | 535 | 5,209 | ||||||
|
Net income |
$ |
9,618 |
$ |
861 |
$ |
10,479 | |||
103
|
|
2016 |
||||||||
|
|
Banking |
Insurance Agency |
|||||||
|
|
Activities |
Activities |
Total |
||||||
|
|
(in thousands) |
||||||||
|
|
|||||||||
|
Net interest income (expense) |
$ |
35,371 |
$ |
(123) |
$ |
35,248 | |||
|
Provision for loan losses |
1,209 |
- |
1,209 | ||||||
|
Net interest income (expense) after |
|||||||||
|
provision for loan losses |
34,162 | (123) | 34,039 | ||||||
|
Non-interest income |
4,733 |
- |
4,733 | ||||||
|
Insurance service and fees |
400 | 6,119 | 6,519 | ||||||
|
Non-interest expense |
30,438 | 4,658 | 35,096 | ||||||
|
Income before income taxes |
8,857 | 1,338 | 10,195 | ||||||
|
Income tax provision |
1,408 | 515 | 1,923 | ||||||
|
Net income |
$ |
7,449 |
$ |
823 |
$ |
8,272 | |||
|
|
2015 |
||||||||
|
|
Banking |
Insurance Agency |
|||||||
|
|
Activities |
Activities |
Total |
||||||
|
|
(in thousands) |
||||||||
|
|
|||||||||
|
Net interest income (expense) |
$ |
31,921 |
$ |
(117) |
$ |
31,804 | |||
|
Provision for loan losses |
1,216 |
- |
1,216 | ||||||
|
Net interest income (expense) after |
|||||||||
|
provision for loan losses |
30,705 | (117) | 30,588 | ||||||
|
Non-interest income |
6,526 |
- |
6,526 | ||||||
|
Insurance service and fees |
672 | 6,522 | 7,194 | ||||||
|
Non-interest expense |
28,103 | 4,595 | 32,698 | ||||||
|
Income before income taxes |
9,800 | 1,810 | 11,610 | ||||||
|
Income tax provision (benefit) |
3,071 | 696 | 3,767 | ||||||
|
Net income |
$ |
6,729 |
$ |
1,114 |
$ |
7,843 | |||
|
|
||||||
|
|
||||||
|
|
December 31, |
December 31, |
||||
|
|
2017 |
2016 |
||||
|
|
(in thousands) |
|||||
|
Identifiable Assets, Net |
||||||
|
Banking activities |
$ |
1,285,173 |
$ |
1,091,291 | ||
|
Insurance agency activities |
10,460 | 9,418 | ||||
|
Consolidated Total Assets |
$ |
1,295,633 |
$ |
1,100,709 | ||
19.FAIR VALUE OF FINANCIAL INSTRUMENTS
Fair value is defined in ASC Topic 820 “Fair Value Measurements and Disclosures” as the price that would be received to sell an asset or paid to transfer a liability in an orderly transaction between market participants at the measurement date.
There are three levels of inputs to fair value measurements:
|
· |
Level 1 inputs are quoted prices for identical instruments in active markets; |
|
· |
Level 2 inputs are inputs other than quoted prices included within Level 1 that are observable for the asset or liability, either directly or indirectly; and |
|
· |
Level 3 inputs are unobservable inputs. |
Observable market data should be used when available.
104
FINANCIAL INSTRUMENTS MEASURED AT FAIR VALUE ON A RECURRING BASIS
The following table presents for each of the fair-value hierarchy levels as defined in this footnote, those financial instruments which are measured at fair value on a recurring basis at December 31, 2017 and 2016:
|
(in thousands) |
Level 1 |
Level 2 |
Level 3 |
Fair Value |
||||||||
|
|
||||||||||||
|
December 31, 2017 |
||||||||||||
|
Securities available-for-sale: |
||||||||||||
|
U.S. government agencies |
$ |
- |
$ |
28,053 |
$ |
- |
$ |
28,053 | ||||
|
States and political subdivisions |
- |
29,373 |
- |
29,373 | ||||||||
|
Mortgage-backed securities |
- |
86,392 |
- |
86,392 | ||||||||
|
Mortgage servicing rights |
- |
- |
586 | 586 | ||||||||
|
|
||||||||||||
|
December 31, 2016 |
||||||||||||
|
Securities available-for-sale: |
||||||||||||
|
U.S. government agencies |
$ |
- |
$ |
12,872 |
$ |
- |
$ |
12,872 | ||||
|
States and political subdivisions |
- |
35,142 |
- |
35,142 | ||||||||
|
Mortgage-backed securities |
- |
47,208 |
- |
47,208 | ||||||||
|
Mortgage servicing rights |
- |
- |
527 | 527 |
Securities available for sale
Fair values for available for sale securities are determined using independent pricing services and market-participating brokers. The Company utilizes a third-party for these pricing services. The third-party utilizes evaluated pricing models that vary by asset class and incorporate available trade, bid and other market information for structured securities, cash flow and, when available, loan performance data. Because many fixed income securities do not trade on a daily basis, the third-party service provider’s evaluated pricing applications apply information as applicable through processes, such as benchmarking of like securities, sector groupings, and matrix pricing, to prepare evaluations. In addition, our third-party pricing service provider uses model processes, such as the Option Adjusted Spread model, to assess interest rate impact and develop prepayment scenarios. The models and the process take into account market convention. For each asset class, a team of evaluators gathers information from market sources and integrates relevant credit information, perceived market movements and sector news into the evaluated pricing applications and models. The third-party, at times, may determine that it does not have sufficient verifiable information to value a particular security. In these cases the Company will utilize valuations from another pricing service.
Management believes that it has a sufficient understanding of the third-party service’s valuation models, assumptions and inputs used in determining the fair value of securities to enable management to maintain an appropriate system of internal control. On a quarterly basis the Company reviews changes, as submitted by our third-party pricing service provider, in the market value of its securities portfolio. Individual changes in valuations are reviewed for consistency with general interest rate movements and any known credit concerns for specific securities. Additionally, on an annual basis the Company has its entire securities portfolio priced by a second pricing service to determine consistency with another market evaluator. If, on the Company’s review or in comparing with another servicer, a material difference between pricing evaluations were to exist, the Company may submit an inquiry to our third-party pricing service provider regarding the data used to value a particular security. If the Company determines it has market information that would support a different valuation than our third-party service provider’s evaluation it can submit a challenge for a change to that security’s valuation. There were no material differences in valuations noted in 2017 or 2016.
Securities available for sale are classified as Level 2 in the fair value hierarchy as the valuation provided by the third-party provider uses observable market data.
Mortgage servicing rights
Mortgage servicing rights (“MSRs”) do not trade in an active, open market with readily observable prices. Accordingly, the Company obtains the fair value of the MSRs using a third-party pricing provider. The provider determines the fair value by discounting projected net servicing cash flows of the remaining servicing portfolio. The valuation model used by the provider considers market loan prepayment predictions and other economic factors. The fair value of MSRs is mostly affected by changes in mortgage interest rates since rate changes cause the loan prepayment acceleration factors to increase or decrease. All assumptions are market driven. Management has a sufficient understanding of the third-party service’s valuation models, assumptions and inputs used in determining the fair value of MSRs to enable management to maintain an appropriate system of internal control. Mortgage servicing rights are classified within Level 3 of the fair value hierarchy as the valuation is model driven and primarily based on unobservable inputs.
105
The following table summarizes the changes in fair value for items measured at fair value (Level 3) on a recurring basis using significant unobservable inputs during the years ended December 31:
|
(in thousands) |
2017 |
2016 |
2015 |
||||||
|
Mortgage servicing rights - January 1 |
$ |
527 |
$ |
557 |
$ |
518 | |||
|
Losses included in earnings |
(48) | (123) | (93) | ||||||
|
Additions from loan sales |
107 | 93 | 132 | ||||||
|
Mortgage servicing rights - December 31 |
$ |
586 |
$ |
527 |
$ |
557 | |||
Quantitative information about the significant unobservable inputs used in the fair value measurement of MSRs at the respective dates is as follows:
|
|
December 31, 2017 |
December 31, 2016 |
||||
|
Servicing fees |
0.25 |
% |
0.25 |
% |
||
|
Discount rate |
9.50 |
% |
9.52 |
% |
||
|
Prepayment rate (CPR) |
10.56 |
% |
8.12 |
% |
||
FINANCIAL INSTRUMENTS MEASURED AT FAIR VALUE ON A NONRECURRING BASIS
The Company is required, on a nonrecurring basis, to adjust the carrying value of certain assets or provide valuation allowances related to certain assets using fair value measurements. The following table presents for each of the fair-value hierarchy levels as defined in this footnote, those financial instruments which are measured at fair value on a nonrecurring basis at December 31, 2017 and 2016:
|
|
||||||||||||
|
(in thousands) |
Level 1 |
Level 2 |
Level 3 |
Fair Value |
||||||||
|
|
||||||||||||
|
December 31, 2017 |
||||||||||||
|
Collateral dependent impaired loans |
$ |
- |
$ |
- |
$ |
14,464 |
$ |
14,464 | ||||
|
|
||||||||||||
|
December 31, 2016 |
||||||||||||
|
Collateral dependent impaired loans |
$ |
- |
$ |
- |
$ |
13,114 |
$ |
13,114 |
Impaired loans
The Company evaluates and values impaired loans at the time the loan is identified as impaired, and the fair values of such loans are estimated using Level 3 inputs in the fair value hierarchy. Each loan’s collateral value has a unique appraisal and management’s discount of the value is based on factors unique to each impaired loan. The significant unobservable input in determining the fair value is management’s subjective discount on appraisals of the collateral securing the loan, which ranges from 10%-50%. Fair value is estimated based on the value of the collateral securing these loans. Collateral may consist of real estate and/or business assets including equipment, inventory and/or accounts receivable and the value of these assets is determined based on appraisals by qualified licensed appraisers hired by the Company. Appraised and reported values may be discounted based on management’s historical knowledge, changes in market conditions from the time of valuation, estimated costs to sell, and/or management’s expertise and knowledge of the client and the client’s business.
The Company has an appraisal policy in which appraisals are obtained upon a commercial loan being downgraded on the Company internal loan rating scale to a 5 (special mention) or a 6 (substandard) depending on the amount of the loan, the type of loan, and the type of collateral. All impaired commercial loans are either graded a 6 or 7 on the internal loan rating scale, unless the commercial loan is impaired due to a troubled debt restructure and is now performing. For consumer loans, the Company obtains appraisals when a loan becomes 60 days past due or is determined to be impaired, whichever occurs first. Subsequent to the downgrade or reaching 60 days past due, if the loan remains outstanding and impaired for at least one year more, management may require another follow-up appraisal. Between receipts of updated appraisals, if necessary, management may perform an internal valuation based on any known changing conditions in the marketplace such as sales of similar properties, a change in the condition of the collateral, or feedback from local appraisers. Collateral dependent impaired loans had a gross value of $15.5 million, with a valuation allowance of $1.1 million, at December 31, 2017, compared to a gross value for collateral dependent impaired loans of $15.1 million, with a valuation allowance of $2.0 million, at December 31, 2016.
106
At December 31, 2017 and 2016, the estimated fair values of the Company’s financial instruments, including those that are not measured and reported at fair value on a recurring basis or nonrecurring basis, were as follows:
|
|
December 31, 2017 |
December 31, 2016 |
||||||||||
|
|
Carrying |
Fair |
Carrying |
Fair |
||||||||
|
|
Amount |
Value |
Amount |
Value |
||||||||
|
|
(in thousands) |
(in thousands) |
||||||||||
|
Financial assets: |
||||||||||||
|
Level 1: |
||||||||||||
|
Cash and cash equivalents |
$ |
21,330 |
$ |
21,330 |
$ |
13,084 |
$ |
13,084 | ||||
|
Level 2: |
||||||||||||
|
Available for sale securities |
143,818 | 143,818 | 95,222 | 95,222 | ||||||||
|
FHLB and FRB stock |
6,779 | 6,779 | 3,731 | 3,731 | ||||||||
|
Level 3: |
||||||||||||
|
Held to maturity securities |
5,334 | 5,261 | 1,983 | 1,959 | ||||||||
|
Loans, net |
1,051,296 | 1,047,967 | 928,596 | 945,998 | ||||||||
|
Mortgage servicing rights |
586 | 586 | 527 | 527 | ||||||||
|
|
||||||||||||
|
Financial liabilities: |
||||||||||||
|
Level 1: |
||||||||||||
|
Demand deposits |
$ |
219,664 |
$ |
219,664 |
$ |
201,741 |
$ |
201,741 | ||||
|
NOW deposits |
109,378 | 109,378 | 88,632 | 88,632 | ||||||||
|
Savings deposits |
535,730 | 535,730 | 508,652 | 508,652 | ||||||||
|
Level 2: |
||||||||||||
|
Securities sold under agreement to |
||||||||||||
|
repurchase |
9,289 | 9,289 | 10,159 | 10,159 | ||||||||
|
Other borrowed funds |
88,250 | 88,132 | 28,200 | 28,152 | ||||||||
|
Junior subordinated debentures |
11,330 | 11,330 | 11,330 | 11,330 | ||||||||
|
Level 3: |
||||||||||||
|
Time deposits |
186,457 | 187,782 | 140,949 | 141,758 | ||||||||
The following methods and assumptions were used to estimate the fair value of each class of financial instruments for which it is practicable to estimate that value.
Cash and Cash Equivalents
For these short-term instruments, the carrying amount is a reasonable estimate of fair value. “Cash and Cash Equivalents” includes cash and due from banks and interest-bearing deposits at other banks.
Securities Held to Maturity
The Company holds certain municipal bonds as held-to-maturity. These bonds are generally small in dollar amount and are issued only by certain local municipalities within the Company’s market area. The original terms are negotiated directly and on an individual basis consistent with our loan and credit guidelines. These bonds are not traded on the open market and management intends to hold the bonds to maturity. The fair value of held-to-maturity securities is estimated by discounting the future cash flows using the current rates at which similar agreements would be made with municipalities with similar credit ratings and for the same remaining maturities.
FHLB and FRB stock
The carrying value of FHLB and FRB stock, which are non-marketable equity investments, approximates fair value.
Loans Receivable
The fair value of fixed rate loans is estimated by discounting the future cash flows using the current rates at which similar loans would be made to borrowers with similar credit ratings and for the same remaining maturities, net of the appropriate portion of the allowance for loan losses. For variable rate loans, the carrying amount is a reasonable estimate of fair value. This fair value calculation is not necessarily indicative of the exit price, as defined in ASC Topic 820.
107
Deposits
The fair value of demand deposits, NOW accounts, muni-vest accounts and regular savings accounts is the amount payable on demand at the reporting date. The fair value of time deposits is estimated using the rates currently offered for deposits of similar remaining maturities.
Borrowed Funds and Securities Sold Under Agreement to Repurchase
The fair value of securities sold under agreement to repurchase approximates its carrying value. The fair value of other borrowed funds was estimated using a discounted cash flow analysis based on the Company’s current incremental borrowing rates for similar types of borrowing arrangements.
Junior Subordinated Debentures
There is no active market for the Company’s debentures and there have been no issuances of similar instruments in recent years. The Company looked at a market bond index to estimate a discount margin to value the debentures. The discount margin was very similar to the spread to LIBOR established at the issuance of the debentures. As a result, the Company determined that the fair value of the adjustable-rate debentures approximates their face amount.
Pension Plan Assets
Refer to Note 11 to these Consolidated Financial Statements, “Employee Benefits and Deferred Compensation Plans” for the fair value analysis of the Pension Plan assets.
108
20.REGULATORY MATTERS
Quantitative measures established by regulation to ensure capital adequacy require the Company to maintain minimum amounts and ratios (set forth in the table that follows) of Common Equity Tier I, Total Capital, and Tier I Capital (as defined in FRB regulations) to risk-weighted assets (as defined in FRB regulations), and of Tier I capital (as defined in FRB regulations) to average assets (as defined in FRB regulations). Management believes that as of December 31, 2017 and 2016, the Company and the Bank met all capital adequacy requirements to which they are subject.
The most recent notification from their regulators categorized the Company and the Bank as well capitalized under the regulatory framework for prompt corrective action. To be categorized as well capitalized, the Company and the Bank must maintain minimum Common Equity Tier I, total risk-based, Tier I risk-based, and Tier I leverage ratios as set forth in the table. There are no conditions or events since that notification that management believes have changed the Company’s or Bank’s category rating.
The Company’s and the Bank’s actual capital amounts and ratios were as follows:
|
|
||||||||||||||||||||||||
|
|
||||||||||||||||||||||||
|
|
December 31, 2017 |
|||||||||||||||||||||||
|
|
(in thousands) |
|||||||||||||||||||||||
|
|
Company |
Bank |
Minimum for Capital Adequacy Purposes |
Minimum to be Well Capitalized Under Prompt Corrective Action Provisions |
||||||||||||||||||||
|
|
Amount |
Ratio |
Amount |
Ratio |
Amount |
Ratio |
Amount |
Ratio |
||||||||||||||||
|
|
||||||||||||||||||||||||
|
Common Equity Tier I |
||||||||||||||||||||||||
|
(to Risk Weighted Assets) |
$ |
125,283 | 11.72 |
% |
$ |
122,421 | 11.48 |
% |
$ |
48,102 | 4.5 |
% |
$ |
69,481 | 6.5 |
% |
||||||||
|
|
||||||||||||||||||||||||
|
Total Capital |
||||||||||||||||||||||||
|
(to Risk Weighted Assets) |
$ |
138,654 | 12.97 |
% |
$ |
135,764 | 12.73 |
% |
$ |
85,515 | 8.0 |
% |
$ |
106,894 | 10.0 |
% |
||||||||
|
|
||||||||||||||||||||||||
|
Tier I Capital |
||||||||||||||||||||||||
|
(to Risk Weighted Assets) |
$ |
125,283 | 11.72 |
% |
$ |
122,421 | 11.48 |
% |
$ |
64,136 | 6.0 |
% |
$ |
85,515 | 8.0 |
% |
||||||||
|
|
||||||||||||||||||||||||
|
Tier I Capital |
||||||||||||||||||||||||
|
(to Average Assets) |
$ |
125,283 | 10.11 |
% |
$ |
122,421 | 9.90 |
% |
$ |
49,586 | 4.0 |
% |
$ |
61,983 | 5.0 |
% |
||||||||
The Company is subject to the dividend restrictions imposed by the FRB and the OCC. Dividends are paid as declared by the Board of Directors. The Company may pay dividends only if it is solvent and would not be rendered insolvent by the dividend payment and only from unrestricted and unreserved earned surplus and under some circumstances capital surplus. The Bank’s dividend restrictions apply indirectly to the Company since cash available for dividend distribution will initially come from dividends paid to the Company by the Bank.
Dividends may be paid by the Bank only if it would not impair the Bank’s capital structure, if the Bank’s surplus is at least equal to its common capital and if the dividends declared in any year do not exceed the total of net profits in that year combined with undivided profits of the preceding two years less any required transfers to surplus, and if no losses have been sustained equal to or exceeding its undivided profits.
In addition, federal regulators have the ability to restrict dividend payments. If the Bank or the Company approaches well-capitalized or minimum capital adequacy levels, regulators could restrict or forbid dividend payments.
109
21.PARENT COMPANY ONLY FINANCIAL INFORMATION
Parent company (Evans Bancorp, Inc.) only condensed financial information is as follows:
CONDENSED BALANCE SHEETS
|
|
December 31, |
||||
|
|
2017 |
2016 |
|||
|
|
(in thousands) |
||||
|
ASSETS |
|||||
|
Cash |
$ |
436 |
$ |
240 | |
|
Other assets |
974 | 961 | |||
|
Investment in subsidiaries |
129,153 | 108,069 | |||
|
Total assets |
$ |
130,563 |
$ |
109,270 | |
|
|
|||||
|
LIABILITIES AND STOCKHOLDERS’ EQUITY |
|||||
|
LIABILITIES: |
|||||
|
Junior subordinated debentures |
$ |
11,330 |
$ |
11,330 | |
|
Other liabilities |
891 | 1,192 | |||
|
Total liabilities |
12,221 | 12,522 | |||
|
|
|||||
|
STOCKHOLDERS’ EQUITY |
|||||
|
Total Stockholders’ Equity |
$ |
118,342 |
$ |
96,748 | |
|
Total liabilities and stockholders’ equity |
$ |
130,563 |
$ |
109,270 | |
110
CONDENSED STATEMENTS OF INCOME
|
|
December 31, |
|||||||
|
|
2017 |
2016 |
2015 |
|||||
|
|
(in thousands) |
|||||||
|
Dividends from subsidiaries |
$ |
2,100 |
$ |
5,300 |
$ |
2,000 | ||
|
Expenses |
(771) | (1,477) | (1,387) | |||||
|
|
||||||||
|
Income before equity in undistributed |
||||||||
|
earnings of subsidiaries |
1,329 | 3,823 | 613 | |||||
|
|
||||||||
|
Equity in undistributed earnings of subsidiaries |
9,150 | 4,449 | 7,230 | |||||
|
|
||||||||
|
Net income |
10,479 | 8,272 | 7,843 | |||||
|
|
||||||||
|
Other comprehensive income |
- |
- |
- |
|||||
|
|
||||||||
|
Comprehensive income |
$ |
10,479 |
$ |
8,272 |
$ |
7,843 | ||
CONDENSED STATEMENTS OF CASH FLOWS
|
|
Year Ended |
|||||||
|
|
2017 |
2016 |
2015 |
|||||
|
|
(in thousands) |
|||||||
|
Operating Activities: |
||||||||
|
Net income |
$ |
10,479 |
$ |
8,272 |
$ |
7,843 | ||
|
Adjustments to reconcile net income to |
||||||||
|
net cash provided by operating activities: |
||||||||
|
Undistributed earnings of subsidiaries |
(9,150) | (4,449) | (7,230) | |||||
|
Changes in assets and liabilities affecting cash flow: |
||||||||
|
Other assets |
(13) | 371 | (267) | |||||
|
Other liabilities |
(183) | (1,972) | 191 | |||||
|
Net cash provided by operating activities |
1,133 | 2,222 | 537 | |||||
|
|
||||||||
|
Investing Activities: |
||||||||
|
Investment in subsidiaries |
(11,791) | (250) |
- |
|||||
|
Net cash used in investing activities |
(11,791) | (250) |
- |
|||||
|
|
||||||||
|
Financing Activities: |
||||||||
|
Proceeds from issuance of common stock |
15,015 | 316 |
- |
|||||
|
Cash dividends paid |
(3,819) | (2,998) | (2,765) | |||||
|
Purchase of Treasury stock |
(342) | (80) |
- |
|||||
|
Net cash used in financing activities |
10,854 | (2,762) | (2,765) | |||||
|
|
||||||||
|
Net increase (decrease) in cash |
196 | (790) | (2,228) | |||||
|
|
||||||||
|
Cash beginning of year |
240 | 1,030 | 3,258 | |||||
|
|
||||||||
|
Cash ending of year |
$ |
436 |
$ |
240 |
$ |
1,030 | ||
111
22.SELECTED QUARTERLY FINANCIAL DATA - UNAUDITED
|
|
||||||||||||
|
|
||||||||||||
|
|
||||||||||||
|
|
4th Quarter |
3rd Quarter |
2nd Quarter |
1st Quarter |
||||||||
|
|
(in thousands, except for per share data) |
|||||||||||
|
2017 |
||||||||||||
|
Interest Income |
$ |
12,794 |
$ |
12,574 |
$ |
11,462 |
$ |
10,918 | ||||
|
Interest Expense |
1,634 | 1,479 | 1,344 | 1,274 | ||||||||
|
Net Interest Income |
11,160 | 11,095 | 10,118 | 9,644 | ||||||||
|
Net Income |
992 | 3,723 | 2,618 | 3,146 | ||||||||
|
Earnings per share basic |
0.21 | 0.78 | 0.55 | 0.68 | ||||||||
|
Earnings per share diluted |
0.20 | 0.76 | 0.54 | 0.66 | ||||||||
|
|
||||||||||||
|
2016 |
||||||||||||
|
Interest Income |
$ |
10,664 |
$ |
10,241 |
$ |
9,694 |
$ |
9,356 | ||||
|
Interest Expense |
1,261 | 1,172 | 1,178 | 1,096 | ||||||||
|
Net Interest Income |
9,403 | 9,069 | 8,516 | 8,260 | ||||||||
|
Net Income |
2,339 | 2,216 | 2,003 | 1,714 | ||||||||
|
Earnings per share basic |
0.54 | 0.52 | 0.47 | 0.40 | ||||||||
|
Earnings per share diluted |
0.53 | 0.51 | 0.46 | 0.40 | ||||||||
112
Item 9.CHANGES IN AND DISAGREEMENTS WITH ACCOUNTANTS ON
ACCOUNTING AND FINANCIAL DISCLOSURES
Not applicable.
Item 9A.CONTROLS AND PROCEDURES
|
(a) |
Disclosure Controls and Procedures. The Company’s management, with the participation of the Company’s principal executive officer and principal financial officer, evaluated the effectiveness of the design and operation of the Company’s disclosure controls and procedures (as defined in Rules 13a-15(e) and 15d-15(e) under the Exchange Act) as of December 31, 2017 (the end of the period covered by this Annual Report on Form 10-K). Based on that evaluation, the Company’s principal executive and principal financial officers concluded that, as of December 31, 2017, the Company’s disclosure controls and procedures were effective. |
|
(b) |
Management's Annual Report on Internal Control Over Financial Reporting. Management's Annual Report on Internal Control Over Financial Reporting appears at "Item 8. Financial Statements and Supplementary Data" of this Annual Report on Form 10-K, and is incorporated herein by reference in response to this Item 9A. |
|
(c) |
Attestation Report of the Independent Registered Public Accounting Firm. The effectiveness of the Company's internal control over financial reporting as of December 31, 2017 has been audited by KPMG LLP, an independent registered public accounting firm, as stated in their report, which appears in the "Report of Independent Registered Public Accounting Firm" in "Item 8. Financial Statements and Supplementary Data" of this Annual Report on Form 10-K, and is incorporated herein by reference in response to this Item 9A. |
|
(d) |
Changes in Internal Control Over Financial Reporting. No changes in the Company's internal control over financial reporting were identified in the fiscal quarter ended December 31, 2017 that have materially affected, or are reasonably likely to materially affect, the Company's internal control over financial reporting. |
NONE
113
Item 10.DIRECTORS, EXECUTIVE OFFICERS AND CORPORATE GOVERNANCE
The information called for by this item is incorporated herein by reference to the material under the captions "Information Regarding Directors, Director Nominees and Executive Officers,” "Section 16(a) Beneficial Ownership Reporting Compliance," “Corporate Governance – Code of Ethics for Chief Executive Officer and Principal Financial Officers,” and "Board of Director Committees – Audit Committee" in the Company's definitive proxy statement relating to its 2018 annual meeting of shareholders to be held on April 26, 2018 (the "Proxy Statement").
Item 11.EXECUTIVE COMPENSATION
The information called for by this item is incorporated herein by reference to the material under the captions "Director Compensation," “Executive Compensation," “Corporate Governance – Compensation Risk,” “Corporate Governance – Availability of Committee Charters and Other Corporate Governance Documents,” “Board of Director Committees – Human Resource and Compensation Committee,” "Human Resource and Compensation Committee Interlocks and Insider Participation" and "Human Resource and Compensation Committee Report" in the Proxy Statement.
The material incorporated herein by reference to the material under the caption, "Human Resource and Compensation Committee Report" in the Proxy Statement is deemed “furnished” in this Annual Report on Form 10-K and shall not be deemed to be “soliciting material” or to be “filed” with the SEC or subject to the liabilities of Section 18 of the Exchange Act, except to the extent that the Company specifically incorporates it by reference into a document filed under the Securities Act or the Exchange Act.
Item 12.SECURITY OWNERSHIP OF CERTAIN BENEFICIAL OWNERS AND MANAGEMENT
AND RELATED STOCKHOLDER MATTERS
The information called for by this item is incorporated herein by reference to the material under the captions "General Information - Security Ownership of Management and Certain Beneficial Owners" and “General Information – Equity Compensation Plans” in the Proxy Statement.
Item 13.CERTAIN RELATIONSHIPS AND RELATED TRANSACTIONS, AND DIRECTOR
INDEPENDENCE
The information called for by this item is incorporated herein by reference to the material under the captions "Corporate Governance – Independence of Directors" and "Transactions with Related Persons" in the Proxy Statement.
Item 14.PRINCIPAL ACCOUNTANT FEES AND SERVICES
The information called for by this item is incorporated herein by reference to the material under the caption "Independent Registered Public Accounting Firm" in the Proxy Statement.
114
Item 15.EXHIBITS AND FINANCIAL STATEMENT SCHEDULES
The following documents are filed as a part of this Report on Form 10-K:
1.Financial statements: The following audited consolidated financial statements and notes thereto and the material under the caption "Report of Independent Registered Public Accounting Firm" in Part II, Item 8 of this Annual Report on Form 10-K are incorporated herein by reference:
Report of Independent Registered Public Accounting Firm (internal control over financial reporting)
Report of Independent Registered Public Accounting Firm (consolidated financial statements)
Consolidated Balance Sheets - December 31, 2017 and 2016
Consolidated Statements of Income - Years Ended December 31, 2017, 2016 and 2015
Consolidated Statements of Stockholders' Equity - Years Ended December 31, 2017, 2016 and 2015
Consolidated Statements of Cash Flows - Years Ended December 31, 2017, 2016 and 2015
Notes to Consolidated Financial Statements
2.All other financial statement schedules are omitted because they are not applicable or the required information is included in the Company’s Consolidated Financial Statements or Notes thereto included in Part II, Item 8 of this Annual Report on Form 10-K.
3.Exhibits
The information called for by this item is incorporated herein by reference to the Exhibit Index included immediately following the signature page to this Annual Report on Form 10-K.
Not applicable
115
EXHIBIT INDEX
|
Exhibit No. |
Exhibit Description |
||||
|
3.1 |
Certificate of Incorporation of the Company (incorporated by reference to Exhibit 3a to the Company’s Registration Statement on Form S-4 (Registration No. 33-25321), as filed on November 7, 1988). (Filed on paper – hyperlink is not required pursuant to Rule 105 of Regulation S-T) |
||||
|
3.1.1 |
Certificate of Amendment to the Company’s Certificate of Incorporation (incorporated by reference to Exhibit 3.3 to the Company’s Quarterly Report on Form 10-Q for the fiscal quarter ended March 31, 1997, as filed on May 14, 1997). (Filed on paper – hyperlink is not required pursuant to Rule 105 of Regulation S-T) |
||||
|
3.2 |
|||||
|
4.1 |
|||||
|
4.2 |
|||||
|
4.3 |
|||||
|
4.4 |
|||||
|
10.1 |
|||||
|
10.2* |
|||||
|
10.3* |
|||||
|
10.4* |
|||||
|
10.5* |
|||||
|
10.6* |
|||||
|
10.7* |
|||||
|
10.8* |
|||||
|
10.9* |
|||||
|
10.10* |
|||||
|
10.11* |
|||||
|
10.12* |
|||||
|
10.13* |
|||||
|
10.14* |
|||||
|
10.15* |
|||||
116
|
10.16* |
|||||
|
10.17* |
|||||
|
10.18* |
|||||
|
10.19* |
|||||
|
10.20* |
|||||
|
10.21* |
|||||
|
10.22* |
|||||
|
21.1 |
|||||
|
23.1 |
Independent Registered Public Accounting Firm’s Consent from KPMG LLP (filed herewith). |
||||
|
24 |
Power of Attorney (included on the signature page of this Annual Report on Form 10-K). |
||||
|
31.1 |
|||||
|
31.2 |
|||||
|
32.1 |
|||||
|
32.2 |
|||||
|
101 |
The following materials from Evans Bancorp, Inc.’s Annual Report on Form 10-K for the year ended December 31, 2017, formatted in XBRL (eXtensible Business Reporting Language): (i) Consolidated Balance Sheets – December 31, 2017 and 2016; (ii) Consolidated Statements of Income – years ended December 31, 2017, 2016, and 2015; (iii) Consolidated Statements of Stockholder’s Equity – years ended December 31, 2017, 2016, and 2015; (iv) Consolidated Statements of Cash Flows – years ended December 31, 2017 and 2016; and (vi) Notes to Consolidated Financial Statements. |
||||
* Indicates a management contract or compensatory plan or arrangement.
117
Pursuant to the requirements of Section 13 or 15(d) of the Securities Exchange Act of 1934, the registrant has duly caused this Annual Report on Form 10-K to be signed on its behalf by the undersigned, thereunto duly authorized:
EVANS BANCORP, INC.
|
By: |
/s/ David J. Nasca |
|
|
David J. Nasca |
|
|
President and Chief Executive Officer |
|
|
Date: March 1, 2018 |
118
KNOW ALL PERSONS BY THESE PRESENTS, that each person whose signature appears below constitutes and appoints, jointly and severally, David J. Nasca and John B. Connerton and each of them, as his true and lawful attorneys-in-fact and agents, each with full power of substitution, for him, and in his name, place and stead, in any and all capacities, to sign any amendments to this Report on Form 10-K, and to file the same, with Exhibits thereto and other documents in connection therewith, with the Securities and Exchange Commission, granting unto said attorneys-in-fact and agents, and each of them, full power and authority to do and perform each and every act and thing requisite or necessary to be done as fully to all intents and purposes as he might or could do in person, hereby ratifying and confirming all that said attorneys-in-fact and agents, or any of them, or their substitutes, may lawfully do or cause to be done by virtue hereof.
Pursuant to the requirements of the Securities Exchange Act of 1934, this report has been signed below by the following persons on behalf of the registrant and in the capacities and on the dates indicated:
|
Signature |
Title |
Date |
||
|
|
||||
|
/s/ David J. Nasca |
President and Chief Executive Officer/ Director |
March 1, 2018 |
||
|
David J. Nasca |
||||
|
|
||||
|
/s/ John B. Connerton |
Treasurer (Principal Financial Officer) |
March 1, 2018 |
||
|
John B. Connerton |
||||
|
|
||||
|
/s/ Nicholas J. Snyder |
Principal Accounting Officer |
March 1, 2018 |
||
|
Nicholas J. Snyder |
||||
|
|
||||
|
/s/ John R. O'Brien |
Chairman of the Board / Director |
March 1, 2018 |
||
|
John R. O'Brien |
||||
|
|
||||
|
/s/ Lee C. Wortham |
Vice Chairman of the Board / Director |
March 1, 2018 |
||
|
Lee C. Wortham |
||||
|
|
||||
|
/s/ Michael A. Battle |
Director |
March 1, 2018 |
||
|
Michael A. Battle |
||||
|
|
||||
|
/s/ James E. Biddle, Jr. |
Director |
March 1, 2018 |
||
|
James E. Biddle, Jr. |
||||
|
|
||||
|
/s/ Jody L. Lomeo |
Director |
March 1, 2018 |
||
|
Jody L. Lomeo |
||||
|
|
||||
|
/s/ Robert G. Miller, Jr. |
Director |
March 1, 2018 |
||
|
Robert G. Miller, Jr. |
||||
|
|
||||
|
/s/ David R. Pfalzgraf, Jr. |
Director |
March 1, 2018 |
||
|
David R. Pfalzgraf, Jr. |
||||
|
|
||||
|
/s/ Michael J. Rogers |
Director |
March 1, 2018 |
||
|
Michael J. Rogers |
||||
|
|
||||
|
/s/ Oliver H. Sommer |
Director |
March 1, 2018 |
||
|
Oliver H. Sommer |
||||
|
|
||||
|
/s/ Nora B. Sullivan |
Director |
March 1, 2018 |
||
|
Nora B. Sullivan |
||||
|
|
||||
|
/s/ Thomas H. Waring, Jr. |
Director |
March 1, 2018 |
||
|
Thomas H. Waring, Jr. |
119
Similar companies
See also JPMORGAN CHASE & CO - Annual report 2022 (10-K 2022-12-31) Annual report 2023 (10-Q 2023-09-30)See also BANK OF AMERICA CORP /DE/ - Annual report 2022 (10-K 2022-12-31) Annual report 2023 (10-Q 2023-09-30)
See also WELLS FARGO & COMPANY/MN - Annual report 2023 (10-K 2023-12-31) Annual report 2023 (10-Q 2023-09-30)
See also CITIGROUP INC - Annual report 2022 (10-K 2022-12-31) Annual report 2023 (10-Q 2023-09-30)
See also PNC FINANCIAL SERVICES GROUP, INC. - Annual report 2022 (10-K 2022-12-31) Annual report 2023 (10-Q 2023-09-30)