|
|
|
|
|
|
| Net income (loss) per share, basic and diluted | | $ | (0.27) | | | $ | (0.78) | | | $ | 0.23 | |
|
| Dividends declared per share | | $ | 0.43 | | | $ | 1.72 | | | $ | 1.72 | |
Distributable Earnings
Distributable Earnings, a measure that is not prepared in accordance with GAAP, is a key indicator of our ability to generate sufficient income to pay our quarterly dividends and in determining the amount of such dividends, which is the primary focus of yield/income investors who comprise a significant portion of our investor base. Accordingly, we believe providing Distributable Earnings on a supplemental basis to our net income as determined in accordance with GAAP is helpful to our stockholders in assessing the overall performance of our business.
We define Distributable Earnings as net income (loss) attributable to our stockholders or, without duplication, owners of our subsidiaries, computed in accordance with GAAP, including realized losses not otherwise included in GAAP net income (loss) and excluding (i) non-cash equity compensation expense, (ii) depreciation and amortization, (iii) any unrealized gains or losses or other similar non-cash items that are included in net income for the applicable reporting period, regardless of whether such items are included in other comprehensive income or loss, or in net income, and (iv) one-time events pursuant to changes in GAAP and certain material non-cash income or expense items agreed upon after discussions between our Manager and our board of directors and after approval by a majority of our independent directors. The exclusion of depreciation and amortization from the calculation of Distributable Earnings only applies to debt investments related to real estate to the extent we foreclose upon the property or properties underlying such debt investments.
While Distributable Earnings excludes the impact of our unrealized current provision for (reversal of) credit losses, any loan losses are charged off and realized through Distributable Earnings when deemed non-recoverable. Non-recoverability is generally determined (i) upon the resolution of a loan (i.e. when the loan is repaid, fully or partially, or, in the case of foreclosure, when the underlying asset is sold), or (ii) if, in our determination, it is nearly certain that all amounts due under a loan will not be collected.
Distributable Earnings should not be considered as a substitute for GAAP net income or taxable income. We caution readers that our methodology for calculating Distributable Earnings may differ from the methodologies employed by other REITs to calculate the same or similar supplemental performance measures, and as a result, our reported Distributable Earnings may not be comparable to similar measures presented by other REITs.
We also use Distributable Earnings (before incentive compensation payable to our Manager) to determine the management and incentive compensation we pay our Manager. For its services to KREF, our Manager is entitled to a quarterly management fee equal to the greater of $62,500 or 0.375% of weighted average adjusted equity and quarterly incentive compensation equal to 20.0% of the excess of (a) the trailing 12-month Distributable Earnings (before incentive compensation payable to our Manager) over (b) 7.0% of the trailing 12-month weighted average adjusted equity(1) (“Hurdle Rate”), less incentive compensation KREF already paid to the Manager with respect to the first three calendar quarters of such trailing 12-month period. The quarterly incentive compensation is calculated and paid in arrears with a three-month lag.
(1) For purposes of calculating incentive compensation under our Management Agreement, adjusted equity excludes: (i) the effects of equity issued that provides for fixed distributions or other debt characteristics and (ii) the unrealized provision for (reversal of) credit losses.
The following table provides a reconciliation of GAAP net income attributable to common stockholders to Distributable Earnings (amounts in thousands, except share and per share data):
| | | | | | | | | | | | | | | | | | | | |
| | Three Months Ended December 31, | | Year Ended December 31, |
| | 2023 | | 2023 | | 2022 |
| Net Income (Loss) Attributable to Common Stockholders | | $ | (18,738) | | | $ | (53,919) | | | $ | 15,371 | |
| Adjustments | | | | | | |
| Non-cash equity compensation expense | | 1,565 | | | 8,075 | | | 7,835 | |
| Unrealized (gains) or losses, net | | 419 | | | 1,859 | | | (1,326) | |
| Provision for (reversal of) credit losses, net | | 49,500 | | | 175,116 | | | 112,373 | |
| Non-cash convertible notes discount amortization | | — | | | 133 | | | 361 | |
Loan write-offs(A) | | (58,706) | | | (73,706) | | | (25,000) | |
Distributable Earnings (Loss) | | $ | (25,960) | | | $ | 57,558 | | | $ | 109,614 | |
| Weighted average number of shares of common stock outstanding | | | | | | |
| Basic and Diluted | | 69,384,309 | | 69,180,039 | | 67,553,578 |
|
|
|
|
|
|
|
|
|
|
|
Book value as of December 31, 2023 included the impact of an estimated CECL credit loss allowance of $212.5 million, or ($3.06) per share. See Note 2 — Summary of Significant Accounting Policies, to our consolidated financial statements included in this Form 10-K for detailed discussion of allowance for credit losses.
Our Portfolio
We have established a $7,752.3 million portfolio of diversified investments, consisting primarily of senior commercial real estate loans as of December 31, 2023.
During the year ended December 31, 2023, we collected 97.6% of interest payments due on our loan portfolio. As of December 31, 2023, the average risk rating of our loan portfolio was 3.2, weighted by total loan exposure. As of December 31, 2023, the average loan commitment in our portfolio was $121.6 million and multifamily and industrial loans comprised 55% of our loan portfolio.
In addition, as a result of taking title to the collateral of defaulted senior loans, we owned REO assets with a net carrying value of $158.6 million, comprised of the fair value of the acquired properties and capitalized redevelopment costs, as of December 31, 2023. These properties are reflected on our Consolidated Balance Sheet.
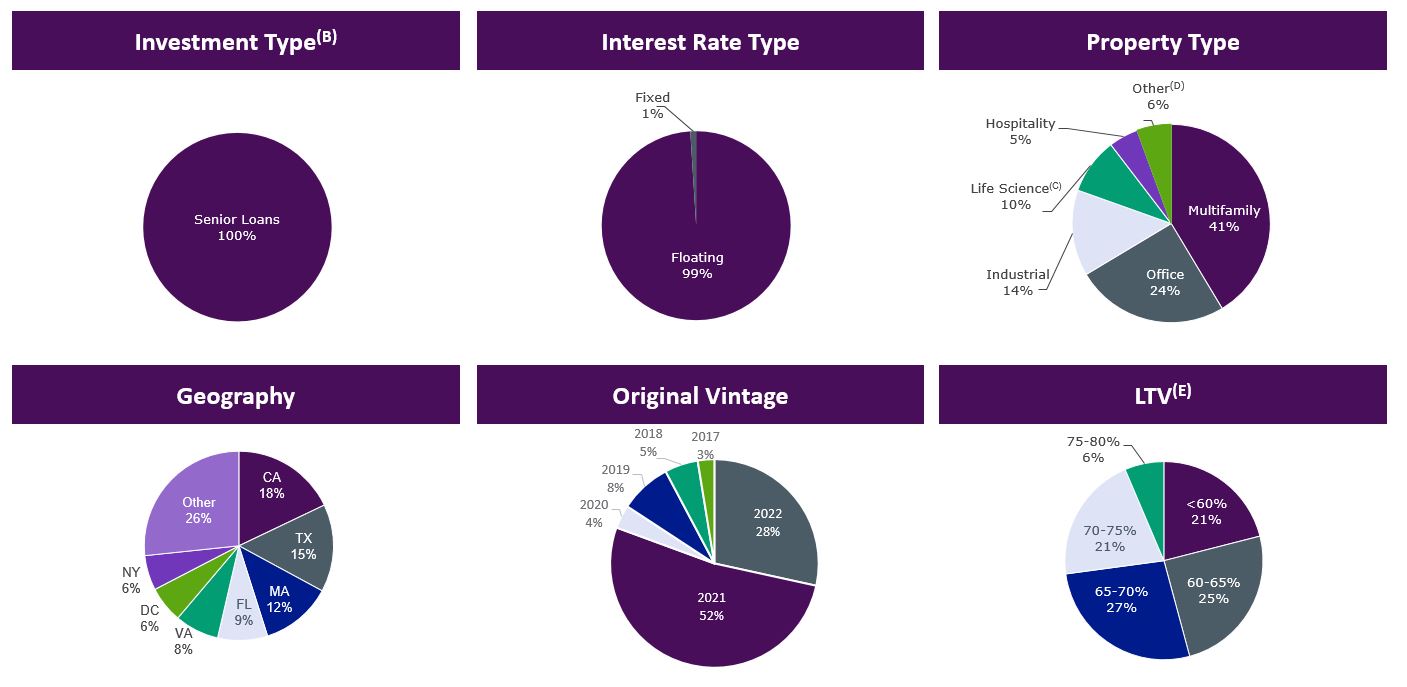
Since our IPO, we have continued to execute on our primary investment strategy of originating floating-rate transitional senior loans and, as we continue to scale our loan portfolio, we expect that our originations will continue to be heavily weighted toward floating-rate loans. As of December 31, 2023, 99% of our loans by total loan exposure earned a floating rate of interest. We expect the majority of our future investment activity to focus on originating floating-rate senior loans that we finance with our repurchase and other financing facilities, with a secondary focus on originating floating-rate loans for which we syndicate a senior position and retain a subordinated interest for our portfolio. As of December 31, 2023, all of our investments were located in the United States.
The following charts illustrate the diversification and composition of our loan portfolio(A), based on type of investment, interest rate, underlying property type, geographic location, vintage and LTV as of December 31, 2023:
The charts above are based on total loan exposure of our commercial real estate loans.
(A) Excludes: (i) REO with net carrying value of $158.6 million, (ii) CMBS B-Piece investments held through an equity method investment and (iii) fully written off risk-rated 5 loans with a combined outstanding principal balance of $45.5 million.
(B) Senior loans include senior mortgages and similar credit quality loans, including related contiguous junior participations in senior loans where we have financed a loan with structural leverage through the non-recourse sale of a corresponding first mortgage.
(C) We classify a loan as life science if more than 50% of the gross leasable area is leased to, or will be converted to, life science-related space.
(D) "Other" property type includes Condo (Residential) (2%), Self-Storage (2%), Student Housing (1%) and Single Family Rental (1%).
(E) LTV is generally based on the initial loan amount divided by the as-is appraised value as of the date the loan was originated or by the current principal amount as of the date of the most recent as-is appraised value. Weighted average LTV includes non-consolidated senior interests and excludes risk-rated 5 loans.
The following table details our quarterly loan activity (dollars in thousands):
| | | | | | | | | | | | | | | | | | | | | | | | | | | | | | | | | | | | | | |
| | Three Months Ended | | Year Ended December 31, |
| | December 31, 2023 | | September 30, 2023 | | June 30, 2023 | | March 31, 2023 | | 2023 | | 2022 |
| Loan originations | | $ | — | | | $ | — | | | $ | — | | | $ | — | | | $ | — | | | $ | 2,705,900 | |
Loan fundings(A) | | $ | 138,655 | | | $ | 164,882 | | | $ | 177,162 | | | $ | 203,612 | | | $ | 684,311 | | | $ | 2,469,378 | |
Loan repayments(B) | | (188,106) | | | (152,301) | | | (339,288) | | | (86,928) | | | (766,623) | | | (1,323,011) | |
| Net fundings | | (49,451) | | | 12,581 | | | (162,126) | | | 116,684 | | | (82,312) | | | 1,146,367 | |
| PIK interest | | — | | | — | | | — | | | — | | | — | | | 1,870 | |
Write-offs(C) | | (58,706) | | | (15,000) | | | — | | | — | | | (73,706) | | | (25,000) | |
| Transfer to REO | | (86,422) | | | — | | | — | | | — | | | (86,422) | | | — | |
| Total activity | | $ | (194,579) | | | $ | (2,419) | | | $ | (162,126) | | | $ | 116,684 | | | $ | (242,440) | | | $ | 1,123,237 | |
(A) Includes initial funding of new loans and additional fundings made under existing loans.
(B) Includes $4.7 million of cost recovery interest applied as a reduction to loan principal during the three months ended December 31, 2023.
(C) Includes a $58.7 million write-off on a defaulted senior loan upon deed-in-lieu of foreclosure during the three months ended December 31, 2023, and a $15.0 million write-off of a subordinated loan during the three months ended September 30, 2023. Includes a $25.0 million partial write-off of a defaulted senior loan during the year ended December 31, 2022.
The following table details overall statistics for our loan portfolio as of December 31, 2023 (dollars in thousands):
| | | | | | | | | | | | | | | | | | | | | | | | | | |
| | | | Total Loan Exposure(A)(B) |
| | Balance Sheet Portfolio(A) | | Total Loan Portfolio | | Floating Rate Loans | | Fixed Rate Loans(C) |
| Number of loans | | 69 | | 69 | | 69 | | — |
| Principal balance | | $ | 7,369,425 | | | $ | 7,558,036 | | | $ | 7,480,579 | | | $ | 77,457 | |
| Amortized cost | | $ | 7,343,548 | | | $ | 7,532,159 | | | $ | 7,458,989 | | | $ | 73,170 | |
Unfunded loan commitments(D) | | $ | 816,400 | | | $ | 816,428 | | | $ | 809,484 | | | $ | 6,943 | |
Weighted average cash coupon(E) | | 8.7 | % | | 8.7 | % | | S + 3.4% | | * |
Weighted average all-in yield(E) | | 9.0 | % | | 9.0 | % | | S + 3.6% | | * |
Weighted average maximum maturity (years)(F) | | 2.7 | | 2.7 | | 2.7 | | 1.6 |
LTV(G) | | 66 | % | | 66 | % | | 66 | % | | n/a |
* Rounds to zero
(A) Excludes fully written off risk-rated 5 loans with a combined outstanding principal balance of $45.5 million.
(B) In certain instances, we finance our loans through the non-recourse sale of a senior interest that is not included in our consolidated financial statements. Total loan exposure includes the entire loan we originated and financed.
(C) Represents mezzanine notes with commitments of $79.4 million and $5.0 million, respectively, accompanying two senior loans. $77.5 million of loan principal was funded, of which $74.4 million was placed on nonaccrual status, as of December 31, 2023. The remaining $3.1 million funded principal earned a fixed interest rate of 10.0% as of December 31, 2023. Refer to Note 3 to our consolidated financial statements for additional information.
(D) Unfunded commitments will primarily be funded to finance property improvements and renovations or lease-related expenditures by the borrowers. These future commitments will be funded over the term of each loan, subject in certain cases to an expiration date.
(E) In addition to cash coupon, all-in yield includes the amortization of deferred origination fees, loan origination costs and purchase discounts. The calculations of weighted average cash coupon and all-in yield excludes loans accounted for under the cost recovery method.
(F) Maximum maturity assumes all extension options are exercised by the borrower; however, our loans may be repaid prior to such date. As of December 31, 2023, based on total loan exposure, 13.3% of our loans were subject to yield maintenance or other prepayment restrictions and 86.7% were open to repayment by the borrower without penalty.
(G) LTV is generally based on the initial loan amount divided by the as-is appraised value as of the date the loan was originated or by the current principal amount as of the date of the most recent as-is appraised value. Weighted average LTV includes non-consolidated senior interests and excludes risk-rated 5 loans.
The table below sets forth additional information relating to our portfolio as of December 31, 2023 (dollars in millions):
| | | | | | | | | | | | | | | | | | | | | | | | | | | | | | | | | | | | | | | | | | | | | | | | | | | | | | | | | | | | | | | | | | | | | | | | | | | | | | | | |
| Investment(A) | | Location | | Property Type | | Investment Date | | Total Whole Loan(B) | | Committed Principal Amount(B) | | Current Principal Amount | | Net Equity(C) | | Coupon(D)(E) | | Max Remaining Term (Years)(D)(F) | | Loan Per SF / Unit / Key(G) | | LTV(D)(H) | | Risk Rating |
| Senior Loans(I) | | | | | | | | | | | | | | | | | | | |
| 1 | Senior Loan | | Arlington, VA | | Multifamily | | 9/30/2021 | | $ | 381.0 | | | $ | 381.0 | | | $ | 369.0 | | | $ | 74.1 | | | + | 3.3 | | 2.8 | | | $332,439 / unit | | 69 | % | | 3 |
| 2 | Senior Loan | | Boston, MA | | Life Science | | 8/3/2022 | | 312.5 | | | 312.5 | | | 195.4 | | | 27.3 | | | + | 4.2 | | 3.6 | | | $747 / SF | | 56 | | | 3 |
| 3 | Senior Loan | | Bellevue, WA | | Office | | 9/13/2021 | | 520.8 | | | 260.4 | | | 182.5 | | | 47.7 | | | + | 3.7 | | 3.3 | | | $855 / SF | | 63 | | | 3 |
| 4 | Senior Loan | | Various | | Industrial | | 4/28/2022 | | 504.5 | | | 252.3 | | | 252.3 | | | 50.6 | | | + | 2.7 | | 3.4 | | | $98 / SF | | 64 | | | 3 |
| 5 | Senior Loan | | Mountain View, CA | | Office | | 7/14/2021 | | 362.8 | | | 250.0 | | | 200.9 | | | 118.5 | | | + | 3.4 | | 2.6 | | | $654 / SF | | n.a. | | 5 |
| 6 | Senior Loan | | Bronx, NY | | Industrial | | 8/27/2021 | | 381.2 | | | 228.7 | | | 198.9 | | | 43.0 | | | + | 4.2 | | 2.7 | | | $277 / SF | | 52 | | | 3 |
| 7 | Senior Loan | | Los Angeles, CA | | Multifamily | | 2/19/2021 | | 220.0 | | | 220.0 | | | 220.0 | | | 33.9 | | | + | 2.9 | | 2.2 | | | $410,430 / unit | | 68 | | | 3 |
| 8 | Senior Loan | | Various | | Multifamily | | 5/31/2019 | | 206.5 | | | 206.5 | | | 206.5 | | | 41.9 | | | + | 4.0 | | 1.4 | | | $192,991 / unit | | 74 | | | 3 |
| 9 | Senior Loan | | Minneapolis, MN | | Office | | 11/13/2017 | | 199.4 | | | 199.4 | | | 194.4 | | | 89.0 | | | + | 2.3 | | 1.5 | | | $182 / SF | | n.a. | | 5 |
| 10 | Senior Loan | | Various | | Industrial | | 6/15/2022 | | 375.5 | | | 187.8 | | | 173.3 | | | 37.7 | | | + | 2.9 | | 3.5 | | | $125 / SF | | 50 | | | 3 |
| 11 | Senior Loan | | Boston, MA | | Office | | 2/4/2021 | | 375.0 | | | 187.5 | | | 187.5 | | | 37.5 | | | + | 3.4 | | 2.1 | | | $506 / SF | | 71 | | | 4 |
| 12 | Senior Loan | | The Woodlands, TX | | Hospitality | | 9/15/2021 | | 183.3 | | | 183.3 | | | 180.9 | | | 33.0 | | | + | 4.3 | | 2.8 | | | $199,015 / key | | 64 | | | 3 |
| 13 | Senior Loan | | Washington, D.C. | | Office | | 11/9/2021 | | 181.0 | | | 181.0 | | | 163.4 | | | 54.8 | | | + | 2.9 | | 3.9 | | | $458 / SF | | 55 | | | 3 |
| 14 | Senior Loan(J) | | Washington, D.C. | | Office | | 12/20/2019 | | 175.5 | | | 175.5 | | | 173.4 | | | 83.4 | | | + | 3.5 | | 1.0 | | | $848 / SF | | 58 | | | 3 |
| 15 | Senior Loan | | West Palm Beach, FL | | Multifamily | | 12/29/2021 | | 171.5 | | | 171.5 | | | 170.9 | | | 26.1 | | | + | 2.8 | | 3.0 | | | $210,456 / unit | | 73 | | | 3 |
| 16 | Senior Loan | | Various | | Self-Storage | | 12/21/2022 | | 336.6 | | | 168.3 | | | 129.6 | | | 26.1 | | | + | 3.8 | | 4.0 | | | $19,498 / unit | | 64 | | | 3 |
| 17 | Senior Loan | | Boston, MA | | Life Science | | 4/27/2021 | | 332.3 | | | 166.2 | | | 161.1 | | | 31.5 | | | + | 3.7 | | 2.4 | | | $669 / SF | | 66 | | | 3 |
| 18 | Senior Loan(J) | | New York, NY | | Condo (Residential) | | 12/20/2018 | | 151.3 | | | 151.3 | | | 149.9 | | | 55.6 | | | + | 3.7 | | — | | | $2,498,416 / unit | | 69 | | | 3 |
| 19 | Senior Loan | | Plano, TX | | Office | | 2/6/2020 | | 150.7 | | | 150.7 | | | 150.7 | | | 23.3 | | | + | 2.8 | | 1.1 | | | $208 / SF | | 64 | | | 3 |
| 20 | Senior Loan | | Redwood City, CA | | Life Science | | 9/30/2022 | | 580.7 | | | 145.2 | | | — | | | (1.0) | | | + | 4.5 | | 3.8 | | | $885 / SF | | 53 | | | 3 |
| 21 | Senior Loan | | Seattle, WA | | Life Science | | 10/1/2021 | | 188.0 | | | 140.3 | | | 116.8 | | | 45.6 | | | + | 3.2 | | 2.8 | | | $745 / SF | | n.a. | | 5 |
| 22 | Senior Loan | | Dallas, TX | | Office | | 12/10/2021 | | 138.0 | | | 138.0 | | | 138.0 | | | 25.8 | | | + | 3.7 | | 2.9 | | | $439 / SF | | 68 | | | 3 |
| 23 | Senior Loan | | Boston, MA | | Multifamily | | 3/29/2019 | | 137.0 | | | 137.0 | | | 137.0 | | | 27.8 | | | + | 3.4 | | 0.3 | | | $351,282 / unit | | 64 | | | 3 |
| 24 | Senior Loan | | Arlington, VA | | Multifamily | | 1/20/2022 | | 135.3 | | | 135.3 | | | 133.1 | | | 30.6 | | | + | 2.9 | | 3.1 | | | $443,550 / unit | | 78 | | | 3 |
| 25 | Senior Loan | | Fontana, CA | | Industrial | | 5/11/2021 | | 132.0 | | | 132.0 | | | 109.4 | | | 42.9 | | | + | 4.7 | | 2.4 | | | $113 / SF | | 64 | | | 3 |
| 26 | Senior Loan | | Fort Lauderdale, FL | | Hospitality | | 11/9/2018 | | 127.5 | | | 127.5 | | | 127.5 | | | 65.5 | | | + | 5.0 | | 0.2 | | | $368,497 / key | | 66 | | | 3 |
| 27 | Senior Loan | | San Carlos, CA | | Life Science | | 2/1/2022 | | 195.9 | | | 125.0 | | | 102.8 | | | 30.5 | | | + | 3.6 | | 3.1 | | | $702 / SF | | 68 | | | 3 |
| 28 | Senior Loan | | Cambridge, MA | | Life Science | | 12/22/2021 | | 401.3 | | | 115.7 | | | 87.6 | | | 21.3 | | | + | 4.0 | | 3.0 | | | $1,072 / SF | | 51 | | | 3 |
| 29 | Senior Loan(K) | | Philadelphia, PA | | Office | | 6/19/2018 | | 114.3 | | | 114.3 | | | 114.3 | | | 20.4 | | | + | 2.8 | | 3.1 | | | $117 / SF | | 64 | | | 3 |
| 30 | Senior Loan | | Pittsburgh, PA | | Student Housing | | 6/8/2021 | | 112.5 | | | 112.5 | | | 112.5 | | | 17.3 | | | + | 3.0 | | 2.4 | | | $155,602 / unit | | 74 | | | 3 |
| 31 | Senior Loan | | West Hollywood, CA | | Multifamily | | 1/26/2022 | | 107.0 | | | 107.0 | | | 105.1 | | | 18.6 | | | + | 3.1 | | 3.1 | | | $2,839,392 / unit | | 65 | | | 4 |
| 32 | Senior Loan | | Las Vegas, NV | | Multifamily | | 12/28/2021 | | 106.3 | | | 106.3 | | | 102.0 | | | 17.4 | | | + | 2.8 | | 3.0 | | | $193,182 / unit | | 75 | | | 3 |
| 33 | Senior Loan(L) | | Chicago, IL | | Office | | 7/15/2019 | | 105.0 | | | 105.0 | | | 88.4 | | | 19.9 | | | + | 2.3 | | 4.6 | | | $85 / SF | | 57 | | | 3 |
| 34 | Senior Loan | | San Diego, CA | | Multifamily | | 10/20/2021 | | 103.5 | | | 103.5 | | | 103.5 | | | 18.9 | | | + | 2.9 | | 2.9 | | | $448,052 / unit | | 71 | | | 4 |
| 35 | Senior Loan | | Boston, MA | | Industrial | | 6/28/2022 | | 285.5 | | | 100.0 | | | 99.3 | | | 20.5 | | | + | 3.0 | | 3.5 | | | $198 / SF | | 52 | | | 3 |
| 36 | Senior Loan | | Washington, D.C. | | Office | | 1/13/2022 | | 228.5 | | | 100.0 | | | 65.8 | | | 13.1 | | | + | 3.3 | | 4.1 | | | $241 / SF | | 55 | | | 3 |
| 37 | Senior Loan | | Phoenix, AZ | | Industrial | | 1/13/2022 | | 195.3 | | | 100.0 | | | 58.1 | | | 14.1 | | | + | 4.0 | | 3.1 | | | $57 / SF | | 57 | | | 3 |
| | | | | | | | | | | | | | | | | | | | | | | | | | | | | | | | | | | | | | | | | | | | | | | | | | | | | | | | | | | | | | | | | | | | | | | | | | | | | | | | |
| Investment(A) | | Location | | Property Type | | Investment Date | | Total Whole Loan(B) | | Committed Principal Amount(B) | | Current Principal Amount | | Net Equity(C) | | Coupon(D)(E) | | Max Remaining Term (Years)(D)(F) | | Loan Per SF / Unit / Key(G) | | LTV(D)(H) | | Risk Rating |
| 38 | | Senior Loan | | Cary, NC | | Multifamily | | 11/21/2022 | | 100.0 | | | 100.0 | | | 95.0 | | | 18.2 | | | + | 3.4 | | 3.9 | | | $243,656 / unit | | 63 | | | 3 |
| 39 | | Senior Loan | | Orlando, FL | | Multifamily | | 12/14/2021 | | 97.4 | | | 97.4 | | | 89.3 | | | 23.3 | | | + | 3.1 | | 3.0 | | | $235,601 / unit | | 74 | | | 3 |
| 40 | | Senior Loan | | Brisbane, CA | | Life Science | | 7/22/2021 | | 95.0 | | | 95.0 | | | 90.8 | | | 18.0 | | | + | 3.1 | | 2.6 | | | $784 / SF | | 71 | | | 3 |
| 41 | | Senior Loan | | Brandon, FL | | Multifamily | | 1/13/2022 | | 90.3 | | | 90.3 | | | 67.4 | | | 10.1 | | | + | 3.1 | | 3.1 | | | $193,586 / unit | | 75 | | | 3 |
| 42 | | Senior Loan | | Dallas, TX | | Multifamily | | 12/23/2021 | | 90.0 | | | 90.0 | | | 80.1 | | | 17.2 | | | + | 2.9 | | 3.0 | | | $246,511 / unit | | 67 | | | 3 |
| 43 | | Senior Loan | | Miami, FL | | Multifamily | | 10/14/2021 | | 89.5 | | | 89.5 | | | 89.5 | | | 17.4 | | | + | 2.9 | | 2.9 | | | $304,422 / unit | | 76 | | | 3 |
| 44 | | Senior Loan | | Dallas, TX | | Office | | 1/22/2021 | | 87.0 | | | 87.0 | | | 87.0 | | | 14.6 | | | + | 3.4 | | 2.1 | | | $294 / SF | | 63 | | | 3 |
| 45 | | Senior Loan | | San Antonio, TX | | Multifamily | | 6/1/2022 | | 246.5 | | | 86.3 | | | 80.3 | | | 19.8 | | | + | 2.8 | | 3.4 | | | $103,007 / unit | | 68 | | | 3 |
| 46 | | Senior Loan | | Scottsdale, AZ | | Multifamily | | 5/9/2022 | | 169.0 | | | 84.5 | | | 84.5 | | | 13.0 | | | + | 2.9 | | 3.4 | | | $457,995 / unit | | 64 | | | 3 |
| 47 | | Senior Loan | | Raleigh, NC | | Multifamily | | 4/27/2022 | | 82.9 | | | 82.9 | | | 80.1 | | | 16.7 | | | + | 3.0 | | 3.4 | | | $250,170 / unit | | 68 | | | 4 |
| 48 | | Senior Loan | | Hollywood, FL | | Multifamily | | 12/20/2021 | | 81.0 | | | 81.0 | | | 81.0 | | | 15.1 | | | + | 3.1 | | 3.0 | | | $327,935 / unit | | 74 | | | 3 |
| 49 | | Senior Loan | | Charlotte, NC | | Multifamily | | 12/14/2021 | | 79.3 | | | 79.3 | | | 75.5 | | | 12.0 | | | + | 3.1 | | 3.0 | | | $205,055 / unit | | 74 | | | 3 |
| 50 | | Senior Loan(M) | | Various | | Industrial | | 6/30/2021 | | 153.0 | | | 76.5 | | | 63.7 | | | 27.1 | | | + | 5.5 | | 2.5 | | | $74 / SF | | 59 | | | 3 |
| 51 | | Senior Loan | | Phoenix, AZ | | Single Family Rental | | 4/22/2021 | | 72.1 | | | 72.1 | | | 67.7 | | | 17.7 | | | + | 4.9 | | 2.4 | | | $157,092 / unit | | 50 | | | 3 |
| 52 | | Senior Loan | | Denver, CO | | Multifamily | | 9/14/2021 | | 70.3 | | | 70.3 | | | 70.3 | | | 10.7 | | | + | 2.8 | | 2.8 | | | $290,496 / unit | | 78 | | | 3 |
| 53 | | Senior Loan | | Washington, D.C. | | Multifamily | | 12/4/2020 | | 69.0 | | | 69.0 | | | 66.8 | | | 10.7 | | | + | 3.6 | | 1.9 | | | $267,000 / unit | | 63 | | | 3 |
| 54 | | Senior Loan | | Dallas, TX | | Multifamily | | 8/18/2021 | | 68.2 | | | 68.2 | | | 68.2 | | | 10.2 | | | + | 3.9 | | 2.7 | | | $189,444 / unit | | 70 | | | 3 |
| 55 | | Senior Loan | | Manassas Park, VA | | Multifamily | | 2/25/2022 | | 68.0 | | | 68.0 | | | 68.0 | | | 13.3 | | | + | 2.7 | | 3.2 | | | $223,684 / unit | | 73 | | | 3 |
| 56 | | Senior Loan | | Plano, TX | | Multifamily | | 3/31/2022 | | 67.8 | | | 67.8 | | | 67.4 | | | 19.0 | | | + | 2.8 | | 3.3 | | | $253,226 / unit | | 75 | | | 3 |
| 57 | | Senior Loan | | Nashville, TN | | Hospitality | | 12/9/2021 | | 66.0 | | | 66.0 | | | 64.7 | | | 10.1 | | | + | 3.7 | | 3.0 | | | $281,237 / key | | 68 | | | 3 |
| 58 | | Senior Loan | | Oakland, CA | | Office | | 10/23/2020 | | 205.5 | | | 64.4 | | | 45.8 | | | 7.2 | | | + | 4.4 | | 1.9 | | | $141 / SF | | 55 | | | 2 |
| 59 | | Senior Loan | | Atlanta, GA | | Multifamily | | 12/10/2021 | | 61.5 | | | 61.5 | | | 59.3 | | | 14.8 | | | + | 3.0 | | 3.0 | | | $196,421 / unit | | 67 | | | 3 |
| 60 | | Senior Loan | | Durham, NC | | Multifamily | | 12/15/2021 | | 60.0 | | | 60.0 | | | 56.5 | | | 10.1 | | | + | 3.0 | | 3.0 | | | $163,879 / unit | | 67 | | | 3 |
| 61 | | Senior Loan | | San Antonio, TX | | Multifamily | | 4/20/2022 | | 57.6 | | | 57.6 | | | 56.4 | | | 10.6 | | | + | 2.7 | | 3.4 | | | $164,950 / unit | | 79 | | | 3 |
| 62 | | Senior Loan | | Queens, NY | | Industrial | | 2/22/2022 | | 55.3 | | | 55.3 | | | 54.7 | | | 13.9 | | | + | 4.0 | | 0.7 | | | $89 / SF | | 68 | | | 3 |
| 63 | | Senior Loan | | Sharon, MA | | Multifamily | | 12/1/2021 | | 51.9 | | | 51.9 | | | 51.9 | | | 7.7 | | | + | 2.9 | | 2.9 | | | $270,443 / unit | | 70 | | | 3 |
| 64 | | Senior Loan | | Reno, NV | | Industrial | | 4/28/2022 | | 140.4 | | | 50.5 | | | 50.5 | | | 11.4 | | | + | 2.7 | | 3.4 | | | $117 / SF | | 74 | | | 3 |
| 65 | | Senior Loan | | Carrollton, TX | | Multifamily | | 4/1/2022 | | 48.5 | | | 48.5 | | | 47.5 | | | 13.8 | | | + | 2.9 | | 3.3 | | | $148,428 / unit | | 74 | | | 3 |
| 66 | | Senior Loan | | Dallas, TX | | Multifamily | | 4/1/2022 | | 43.9 | | | 43.9 | | | 42.6 | | | 11.6 | | | + | 2.9 | | 3.3 | | | $119,706 / unit | | 73 | | | 3 |
| 67 | | Senior Loan | | Georgetown, TX | | Multifamily | | 12/16/2021 | | 41.8 | | | 41.8 | | | 41.8 | | | 10.3 | | | + | 3.4 | | 3.0 | | | $199,048 / unit | | 68 | | | 3 |
| 68 | | Senior Loan | | San Diego, CA | | Multifamily | | 4/29/2022 | | 203.0 | | | 40.0 | | | 39.7 | | | 6.2 | | | + | 2.6 | | 3.4 | | | $455,485 / unit | | 63 | | | 3 |
| 69 | | Senior Loan | | Denver, CO | | Industrial | | 12/11/2020 | | 15.4 | | | 15.4 | | | 12.1 | | | 4.4 | | | + | 3.8 | | 2.0 | | | $47 / SF | | 61 | | | 2 |
| Total/Weighted Average
Senior Loans Unlevered | | $ | 11,842.2 | | | $ | 8,390.1 | | | $ | 7,558.0 | | | $ | 1,821.0 | | | | 3.3% | | 2.7 | | | | | 66 | % | | 3.2 |
| Non-Senior Loans | | | | | | | | | | | | | | | | | | | |
| CMBS B-Pieces | | | | | | | | | | | | | | | | | | | |
| 1 | RECOP I(N) | | Various | | Various | | 2/13/2017 | | n.a. | | 40.0 | | | 35.7 | | | 35.7 | | | | 4.7 | | 5.5 | | | n.a. | | 58 | | | n.a. |
| Total/Weighted Average
CMBS B-Pieces Unlevered | | | | $ | 40.0 | | | $ | 35.7 | | | $ | 35.7 | | | | 4.7% | | 5.5 | | | | | 58 | % | | |
| Real Estate Owned | | | | | | | | | | | | | | | | | | | |
| 1 | | Real Estate Asset | | Portland, OR | | Retail | | 12/16/2021 | | n.a. | | n.a. | | 82.1 | | | 82.1 | | | | n.a. | | n.a. | | n.a. | | n.a. | | n.a. |
| | | | | | | | | | | | | | | | | | | | | | | | | | | | | | | | | | | | | | | | | | | | | | | | | | | | | | | | | | | | | | | | | | | | | | | | | | | | | | | | |
| Investment(A) | | Location | | Property Type | | Investment Date | | Total Whole Loan(B) | | Committed Principal Amount(B) | | Current Principal Amount | | Net Equity(C) | | Coupon(D)(E) | | Max Remaining Term (Years)(D)(F) | | Loan Per SF / Unit / Key(G) | | LTV(D)(H) | | Risk Rating |
| 2 | Real Estate Asset | | Philadelphia, PA | | Office | | 12/22/2023 | | n.a. | | n.a. | | $ | 76.5 | | | $ | 26.5 | | | | n.a. | | n.a. | | n.a. | | n.a. | | n.a. |
| Total/Weighted Average
Real Estate Owned | | | | | | $ | 158.6 | | | $ | 108.6 | | | | | | | | | | | | |
| | | | | | | | | | | | |
| | | | | | | | | | | | | | | | | | |
|
|
|
| 6,268,427 | | | $ | 494,004 | | | $ | 6,323,037 | |
(A) Maximum facility size represents the largest amount of borrowings available under a given facility once sufficient collateral assets have been approved by the lender and pledged by us.
(B) Represents the principal balance of the collateral assets.
(C) Available borrowings represents the undrawn amount we could draw under the terms of each credit facility, based on collateral already approved and pledged.
Master Repurchase Agreements
We utilize master repurchase facilities to finance the origination of senior loans. After a mortgage asset is identified by us, the lender agrees to advance a certain percentage of the principal of the mortgage to us in exchange for a secured interest in the mortgage. We have not received any margin calls on any of our master repurchase facilities to date.
Repurchase agreements effectively allow us to borrow against loans and participations that we own in an amount generally equal to (i) the market value of such loans and/or participations multiplied by (ii) the applicable advance rate. Under these agreements, we sell our loans and participations to a counterparty and agree to repurchase the same loans and participations from the counterparty at a price equal to the original sales price plus an interest factor. The transaction is treated as a secured loan from the financial institution for GAAP purposes. During the term of a repurchase agreement, we receive the principal and interest on the related loans and participations and pay interest to the lender under the master repurchase agreement. At any point in time, the amounts and the cost of our repurchase borrowings will be based upon the assets being financed—higher risk assets will result in lower advance rates (i.e., levels of leverage) at higher borrowing costs and vice versa. In addition, these facilities include various financial covenants and limited recourse guarantees, including those described below.
Each of our existing master repurchase facilities includes "credit mark-to-market" features. "Credit mark-to-market" provisions in repurchase facilities are designed to keep the lenders' credit exposure generally constant as a percentage of the underlying collateral value of the assets pledged as security to them. If the credit underlying collateral value decreases, the gross amount of leverage available to us will be reduced as our assets are marked-to-market, which would reduce our liquidity. The lender under the applicable repurchase facility sets the valuation and any revaluation of the collateral assets in its sole, good faith discretion.
As a contractual matter, the lender has the right to reset the value of the assets at any time based on then-current market conditions, but the market convention is to reassess valuations on a monthly, quarterly and annual basis using the financial information delivered pursuant to the facility documentation regarding the real property, borrower and guarantor under such underlying loans. Generally, if the lender determines (subject to certain conditions) that the market value of the collateral in a repurchase transaction has decreased by more than a defined minimum amount, the lender may require us to provide additional collateral or lead to margin calls that may require us to repay all or a portion of the funds advanced. We closely monitor our liquidity and intend to maintain sufficient liquidity on our balance sheet in order to meet any margin calls in the event of any significant decreases in asset values. As of December 31, 2023, the weighted average haircut under our repurchase agreements was 33.8% (or 32.2%, if we had borrowed the maximum amount approved by its repurchase agreement counterparties as of such dates). In addition, our existing master repurchase facilities are not entirely term-matched financings and may mature before our CRE debt investments that represent underlying collateral to those financings. As we negotiate renewals and extensions of these liabilities, we may experience lower advance rates and higher pricing under the renewed or extended agreements.
Term Lending Agreements
In August 2018, we entered into a $200.0 million loan financing facility with BMO Harris Bank (the "BMO Facility”). In May 2019, we increased the borrowing capacity to $300.0 million. The facility provides financing on a non-mark-to-market basis with match-term up to five years with partial recourse to us.
In June 2019, we entered into a Master Repurchase and Securities Contract Agreement ("KREF Lending V Facility") with Morgan Stanley Mortgage Capital Holdings LLC ("Administrative Agent"), as administrative agent on behalf of Morgan Stanley Bank, N.A. ("Initial Buyer"), which provides non-mark-to-market financing. In June 2023, the current stated maturity was extended to June 2024, subject to two additional one-year extension options, which we may exercise upon the satisfaction of certain customary conditions and thresholds. The Initial Buyer subsequently syndicated a portion of the facility to multiple financial institutions. As of December 31, 2023, the Initial Buyer held 23% of the total commitment under the facility.
In July 2021, we entered into a $500.0 million Master Repurchase and Securities Contract Agreement with a financial institution (“KREF Lending IX Facility”). In March 2022, we increased the borrowing capacity to $750.0 million. In August 2022, we further increased the borrowing capacity to $1,000.0 million. The facility, which provides financing on a non-mark-to-market basis with partial recourse to us, has a three-year draw period and match- term to the underlying loans.
In June 2022, we entered into a $350.0 million Master Repurchase Agreement and Securities Contract with a financial institution (“KREF Lending XII Facility”). The facility, which provides financing on a non-mark-to-market basis with partial recourse to KREF, has a two-year draw period and match-term to the underlying loans. In addition, we have the option to increase the facility amount to $500.0 million.
Term Loan Facility
In April 2018, we entered into a term loan financing agreement with third party lenders for an initial borrowing capacity of $200.0 million that was increased to $1.0 billion in October 2018 (“Term Loan Facility”). The facility provides us with asset-based financing on a non-mark-to-market basis with match-term up to five years, with additional two-year extension available, and is non-recourse to us.
Warehouse Facility
In March 2020, we entered into a $500.0 million Loan and Security Agreement with HSBC Bank USA, National Association (“HSBC Facility”). In March 2023, we extended the facility maturity date to March 2026. The facility provides warehouse financing on a non-mark-to-market basis with partial recourse to us.
Asset Specific Financing
In April 2022, we entered into a $100.0 million loan financing facility with a financial institution ("KREF Lending XI Facility"). The facility provides non-recourse match-term asset-based financing on a non-mark-to-market basis.
In August 2022, we entered into a $265.6 million loan financing facility with a financial institution ("KREF Lending XIII Facility"). The facility provides non-recourse match-term asset-based financing on a non-mark-to-market basis.
In October 2022, we entered into a $125.0 million loan financing facility with a financial institution ("KREF Lending XIV Facility"). The facility provides non-recourse match-term asset-based financing on a non-mark-to-market basis.
Revolving Credit Agreement
In March 2022, we upsized our corporate revolving credit agreement (“Revolver”), administered by Morgan Stanley Senior Funding, Inc., to $520.0 million and extended the maturity date to March 2027. In April 2022, we further upsized our Revolver to $610.0 million. We may use our Revolver as a source of financing, which is designed to provide short-term liquidity to originate or de-lever loans, pay operating expenses and borrow amounts for general corporate purposes. Our Revolver is secured by corporate level guarantees and includes net equity interests in the investment portfolio.
Collateralized Loan Obligations
In August 2021, we financed a pool of loan participations from our existing loan portfolio through a managed collateralized loan obligation ("CLO" or "KREF 2021-FL2") and, in February 2022, we financed a pool of loan participations from our existing multifamily loan portfolio through a managed CLO ("KREF 2022-FL3"). The CLOs provide us with match-term financing on a non-mark-to-market and non-recourse basis. The CLOs have a two-year reinvestment feature that allows principal proceeds of the collateral assets to be reinvested in qualifying replacement assets, subject to the satisfaction of certain conditions set forth in the indentures.
The following table outlines the CLO collateral assets and respective borrowing (dollars in thousands):
| | | | | | | | | | | | | | | | | | | | | | | | | | | | | | | | | | | | | | |
| | December 31, 2023 |
| | Count | | Outstanding Principal | | Amortized Cost | | Carrying Value | | Wtd. Avg. Yield/Cost(A) | | Wtd. Avg. Term(B) |
| KREF 2021-FL2 | | | | | | | | | | | | |
Collateral assets(C) | | 18 | | $ | 1,300,000 | | | $ | 1,300,000 | | | $ | 1,288,464 | | | S + 3.1% | | July 2026 |
| Financing provided | | 1 | | 1,095,250 | | | 1,095,128 | | | 1,095,128 | | | S + 1.5% | | February 2039 |
| KREF 2022-FL3 | | | | | | | | | | | | |
Collateral assets(C)(D) | | 16 | | $ | 1,000,000 | | | $ | 1,000,000 | | | $ | 990,320 | | | S + 3.0% | | September 2026 |
| Financing provided | | 1 | | 847,500 | | | 847,043 | | | 847,043 | | | S + 2.2% | | February 2039 |
(A)In addition to cash coupon, yield/cost includes the amortization of deferred origination/financing costs.
(B)Loan term represents weighted-average final maturity, assuming all extension options are exercised by the borrower, weighted by outstanding principal. Repayments of CLO notes are dependent on timing of underlying collateral loan asset repayments post reinvestment period. The term of the CLO notes represents the rated final distribution date.
(C)Collateral assets represent 31.0% of the principal of our commercial real estate loans as of December 31, 2023. As of December 31, 2023, 100% of our loans financed through the CLOs are floating-rate loans.
(D)Including $5.0 million cash held in the KREF 2021-FL3 as of December 31, 2023.
Non-Consolidated Senior Interests
In certain instances, we finance our loans through the non-recourse sale of a senior loan interest that is not included in our consolidated financial statements. These non-consolidated senior interests provide structural leverage on a non-mark-to-market, match-term basis for our net investments, which are typically reflected in the form of mezzanine loans or other subordinate interests on our consolidated balance sheet and in our consolidated statement of income.
The following table details the subordinate interests retained on our balance sheet and the related non-consolidated senior interests (dollars in thousands):
| | | | | | | | | | | | | | | | | | | | | | | | | | | | | | | | | | | | | | |
| | December 31, 2023 |
| Non-Consolidated Senior Interests | | Count | | Principal Balance | | Carrying Value | | Wtd. Avg. Yield/Cost | | Guarantee | | Wtd. Avg. Term |
| Total loan | | 2 | | $ | 233,278 | | | n.a | | S + 3.6% | | n.a. | | January 2026 |
| Senior participation | | 2 | | 188,611 | | | n.a | | S + 2.3% | | n.a. | | January 2026 |
| Interests retained | | | | 44,667 | | | | | S + 8.8% | | | | January 2026 |
Secured Term Loan
In September 2020, we entered into a $300.0 million secured term loan at a price of 97.5%. The secured term loan is partially amortizing, with an amount equal to 1.0% per annum of the principal balance due in quarterly installments. In November 2021, we completed a repricing of a $297.8 million existing secured term loan and a $52.2 million add-on, for an aggregate principal amount of $350.0 million, which was issued at par. In June 2023, the secured term loan was amended to transition the benchmark rate from LIBOR to SOFR. The new secured term loan bears coupon interest at Adjusted Term SOFR, as defined in the secured term loan agreements, plus a 3.50% margin, and is subject to a 0.50% SOFR floor.
The secured term loan matures on September 1, 2027 and contains restrictions relating to liens, asset sales, indebtedness, investments and transactions with affiliates. Our secured term loan is secured by corporate level guarantees and does not include asset-based collateral. Refer to Notes 2 and 7 to our consolidated financial statements for additional discussion of our secured term loan.
Covenants—Each of our repurchase facilities, term lending agreements, warehouse facility and our Revolver contain customary terms and conditions, including, but not limited to, negative covenants relating to restrictions on our operations with respect to our status as a REIT, and financial covenants, such as:
•a trailing four quarter interest income to interest expense ratio covenant (1.4 to 1.0);
•a consolidated tangible net worth covenant (75.0% of the aggregate net cash proceeds of any equity issuances made and any capital contributions received by us and KKR Real Estate Finance Holdings L.P. (our "Operating Partnership") or up to approximately $1,307.7 million, depending on the agreement;
•a cash liquidity covenant (the greater of $10.0 million or 5.0% of our recourse indebtedness);
•a total indebtedness covenant (83.3% of our Total Assets, as defined in the applicable financing agreements);
With respect to our secured term loan, we are required to comply with customary loan covenants and event of default provisions that include, but are not limited to, negative covenants relating to restrictions on operations with respect to our status as a REIT, and financial covenants. Such financial covenants include a minimum consolidated tangible net worth of $650.0 million and a maximum total debt to total assets ratio of 83.3% (the “Leverage Covenant”).
As of December 31, 2023, we were in compliance with the covenants of our financing facilities.
Guarantees—In connection with our financing arrangements including; master repurchase agreements, our term lending agreements, and our asset specific financing, our Operating Partnership has entered into a limited guarantee in favor of each lender, under which our Operating Partnership guarantees the obligations of the borrower under the respective financing agreement (i) in the case of certain defaults, up to a maximum liability of 25.0% of the then-outstanding repurchase price of the eligible loans, participations or securities, as applicable, or (ii) up to a maximum liability of 100.0% in the case of certain "bad boy" defaults. The borrower in each case is a special purpose subsidiary of ours. In addition, some guarantees include certain full recourse insolvency-related trigger events.
With respect to our Revolver, amounts borrowed are full recourse to certain guarantor wholly-owned subsidiaries of ours.
Real Estate Owned and Joint Venture
In 2015, we originated a $177.0 million senior loan secured by a retail property in Portland, Oregon. In December 2021, we took title to the retail property; such acquisition was accounted for as an asset acquisition under ASC 805. Accordingly, we recognized the property on our balance sheet as REO with a carrying value of $78.6 million, which included the estimated fair value of the property. In addition, we assumed $2.0 million in other net assets of the REO.
Concurrently with taking the title to the REO asset, we contributed a portion of the REO asset to a joint venture (the "REO JV") with a third party local development operator (“JV Partner”), whereby we have a 90% interest and the JV Partner has a 10% interest. As of December 31, 2023, the REO JV held REO assets with a net carrying value of $72.4 million. We have priority of distributions up to $78.1 million before the JV Partner can participate in the economics of the REO JV.
In 2019, we originated a $182.6 million senior loan secured by an office property in Philadelphia, PA. In December 2022, this loan was placed on nonaccrual status and subsequent interest collections were accounted for under the cost recovery method. As of September 30, 2023, the loan had a risk rating of 5 with an amortized cost of $151.1 million. On December 22, 2023, we received a $6.0 million partial repayment and then took title to the office property through a deed-in-lieu of foreclosure. The transaction was accounted for as an asset acquisition under ASC 805. Accordingly, we recorded the property with its net assets on the Consolidated Balance Sheet with an estimated fair value of $86.4 million, which included $1.3 million of cash received and $76.5 million, $24.6 million and $15.9 million allocated to REO held for sale, lease intangible and other assets, and leasing and other liabilities, respectively. As a result, we recognized a $58.7 million loan write-off for the difference between the carrying value of the foreclosed loan and the fair value of the REO’s net assets. As of December 31, 2023, the REO's assets and liabilities met the criteria to be classified as held for sale under ASC 360. As such, depreciation on the building and building improvements was suspended.
Results of Operations
The following table summarizes the changes in our results of operations for years ended December 31, 2023, 2022, and 2021 (dollars in thousands, except per share data):
| | | | | | | | | | | | | | | | | | | | | | | | | | | | | | | | | | | | | | | | | | | | | | | | | | |
| | For the Year Ended December 31, | | Increase (Decrease) | | For the Year Ended
December 31, | | Increase (Decrease) |
| | 2023 | | 2022 | | Dollars | | Percentage | | 2022 | | 2021 | | Dollars | | Percentage |
| Net Interest Income | | | | | | | | | | | | | | | | |
| Interest income | | $ | 640,412 | | | $ | 421,968 | | | $ | 218,444 | | | 52 | % | | $ | 421,968 | | | $ | 279,950 | | | $ | 142,018 | | | 51 | % |
| Interest expense | | 458,802 | | | 236,095 | | | 222,707 | | | 94 | | | 236,095 | | | 114,439 | | | 121,656 | | | 106 | |
| Total net interest income | | 181,610 | | | 185,873 | | | (4,263) | | | (2) | | | 185,873 | | | 165,511 | | | 20,362 | | | 12 | |
| Other Income | | | | | | | | | | | | | | | | |
| Revenue from real estate owned operations | | 8,545 | | | 8,971 | | | (426) | | | (5) | | | 8,971 | | | — | | | 8,971 | | | 100 | |
| Income (loss) from equity method investments | | 1,417 | | | 4,655 | | | (3,238) | | | (70) | | | 4,655 | | | 6,371 | | | (1,716) | | | (27) | |
| Other income | | 11,237 | | | 5,568 | | | 5,669 | | | 102 | | | 5,568 | | | 686 | | | 4,882 | | | 712 | |
| Gain on sale of investments | | — | | | — | | | — | | | — | | | — | | | 5,126 | | | (5,126) | | | (100) | |
| | | | | | | | |
|
|
|
|
| | $ | 629,902 | | | $ | 951,800 | |
We also had $43.1 million and $179.4 million of unencumbered senior loans that can be pledged to financing facilities subject to lender approval, as of December 31, 2023 and 2022, respectively. In addition to our primary sources of liquidity, we have the ability to access further liquidity through our ATM program and public offerings of debt and equity securities. Our existing loan portfolio also provides us with liquidity as loans are repaid or sold, in whole or in part, and the proceeds from repayment become available for us to invest.
Cash Flows
The following table sets forth changes in cash and cash equivalents for the years ended December 31, 2023, 2022 and 2021 (dollars in thousands):
| | | | | | | | | | | | | | | | | | | | |
| | Year Ended December 31, |
| | 2023 | | 2022 | | 2021 |
| Cash Flows From Operating Activities | | $ | 155,715 | | | $ | 141,125 | | | $ | 124,793 | |
| Cash Flows From Investing Activities | | 13,487 | | | (1,177,133) | | | (1,540,836) | |
| Cash Flows From Financing Activities | | (271,510) | | | 1,012,859 | | | 1,578,981 | |
| Net Increase (Decrease) in Cash, Cash Equivalents, and Restricted Cash | | $ | (102,308) | | | $ | (23,149) | | | $ | 162,938 | |
Cash Flows from Operating Activities
Our cash flows from operating activities were primarily driven by our net interest income, which is driven by the income generated by our investments less financing costs. The following table sets forth interest received from, and paid for, our investments for the years ended December 31, 2023, 2022 and 2021 (dollars in thousands):
| | | | | | | | | | | | | | | | | | | | |
| | Year Ended December 31, |
| | 2023 | | 2022 | | 2021 |
| Interest Received: | | | | | | |
| Commercial real estate loans | | $ | 612,046 | | | $ | 362,178 | | | $ | 249,564 | |
|
| | 612,046 | | | 362,178 | | | 249,564 | |
| Interest Paid: | | | | | | |
| Interest expense | | 430,275 | | | 201,007 | | | 95,256 | |
| Net interest collections | | $ | 181,771 | | | $ | 161,171 | | | $ | 154,308 | |
Our net interest collections were partially offset by cash used to pay management and incentive fees, as follows (dollars in thousands):
| | | | | | | | | | | | | | | | | | | | |
| | Year Ended December 31, |
| | 2023 | | 2022 | | 2021 |
| Management Fees to affiliate | | $ | 26,225 | | | $ | 24,391 | | | $ | 18,341 | |
| Incentive Fees to affiliate | | 2,491 | | | 634 | | | 10,273 | |
| Total management and incentive fee payments | | $ | 28,716 | | | $ | 25,025 | | | $ | 28,614 | |
Cash Flows from Investing Activities
Our cash flows from investing activities consisted of cash outflows to fund new loan originations and our commitments under existing loan investments, partially offset by cash inflows from the principal repayments and sale/syndication of our loan investments. During the year ended December 31, 2023, we funded $677.3 million of CRE loans and received $691.3 million from repayments of CRE loans.
During the year ended December 31, 2022, we funded $2,419.7 million of CRE loans and received $1,244.3 million from the repayments of CRE loans.
Cash Flows from Financing Activities
Our cash flows from financing activities were primarily driven by proceeds from borrowings under our financing agreements of $811.1 million during year ended December 31, 2023, partially offset by (i) repayments of $791.3 million on borrowings under our financing agreements, (ii) repayment of $143.75 million convertible notes, and (iii) payment of $140.2 million in dividends.
During the year ended December 31, 2022, our cash flows from financing activities were primarily driven by proceeds from borrowings under our financing agreements of $2,483.9 million, proceeds from CLO KREF 2022-FL3 issuance of $847.5 million and net proceeds from Series A Preferred and Common stock issuance of $345.4 million during 2022, partially offset by (i) repayments of $2,454.6 million on borrowings under our financing agreements, (ii) payment of $136.9 million in dividends, and (iii) payment of $35.8 million for share repurchases.
Contractual Obligations and Commitments
The following table presents our contractual obligations and commitments (including interest payments) as of December 31, 2023 (dollars in thousands):
| | | | | | | | | | | | | | | | | | | | | | | | | | | | | |
| Total | | Less than 1 year | | 1 to 3 years | | 3 to 5 years | | Thereafter |
Master Repurchase Facilities(A) | $ | 1,477,227 | | | $ | 89,186 | | | $ | 1,248,693 | | | $ | 139,347 | | | $ | — | |
Term Lending Agreements(A) | 1,329,390 | | | 94,256 | | | 538,690 | | | 696,444 | | | — | |
| Warehouse Facility | — | | | — | | | — | | | — | | | — | |
| Term Loan Facility | 561,377 | | | 61,950 | | | 215,523 | | | 283,904 | | | — | |
| Asset Specific Facility | 266,072 | | | — | | | 100,000 | | | 166,072 | | | — | |
Revolver(B) | 160,000 | | | 160,000 | | | — | | | — | | | — | |
| Total secured financing agreements | 3,794,066 | | | 405,392 | | | 2,102,906 | | | 1,285,767 | | | — | |
| Collateralized Loan Obligations | 1,942,750 | | | — | | | — | | | — | | | 1,942,750 | |
| Secured Term Loan | 343,000 | | | 3,500 | | | 7,000 | | | 332,500 | | | — | |
Interest payable(C) | 1,513,606 | | | 434,470 | | | 740,932 | | | 338,204 | | | — | |
Future funding obligations(D) | 816,428 | | | 470,414 | | | 338,301 | | | 7,713 | | | — | |
| RECOP I commitment | 4,324 | | | 4,324 | | | — | | | — | | | — | |
| Total | $ | 8,414,174 | | | $ | 1,318,100 | | | $ | 3,189,139 | | | $ | 1,964,184 | | | $ | 1,942,750 | |
(A) The allocation of repurchase facilities and term lending agreements is based on the earlier of (i) the maximum maturity of the underlying loans pledged as collateral or (ii) the maximum maturity of the respective financing agreements. Amounts borrowed are subject to a maximum 25.0% recourse limit.
(B) Any amounts borrowed are full recourse to certain subsidiaries of KREF. Amounts are estimated based on the amount outstanding under the Revolver and the interest rate in effect as of December 31, 2023. This is only an estimate as actual amounts borrowed, the timing of repayments and interest rates may vary over time. The Revolver matures in March 2027.
(C) The amounts are estimated by assuming the amounts outstanding under these facilities and the interest rates in effect as of December 31, 2023 will remain constant into the future. The actual amounts borrowed and rates may vary over time.
(D) We have future funding obligations related to our investments in senior loans. These future funding obligations primarily relate to construction projects, capital improvements, tenant improvements and leasing commissions. Generally, funding obligations are subject to certain conditions that must be met, such as customary construction draw certifications, minimum debt service coverage ratios, minimal debt yield tests, or executions of new leases before advances are made to the borrower. As such, the allocation of our future funding obligations is based on the earlier of the expected funding or commitment expiration date.
We are required to pay our Manager a base management fee, an incentive fee and reimbursements for certain expenses pursuant to our management agreement. The table above does not include the amounts payable to our Manager under our management agreement as they are not fixed and determinable. See Note 14 to our consolidated financial statements included in this Form 10-K for additional terms and details of the fees payable under our management agreement.
As a REIT, we generally must distribute at least 90% of our REIT taxable income, determined without regard to the deduction for dividends paid and excluding net capital gains, to stockholders in the form of dividends to comply with the REIT provisions of the Code. Our taxable income does not necessarily equal our net income as calculated in accordance with GAAP, or our Distributable Earnings as described above under "Key Financial Measures and Indicators — Distributable Earnings".
Subsequent Events
Our subsequent events are detailed in Note 17 to our consolidated financial statements.
Critical Accounting Policies and Use of Estimates
Our consolidated financial statements are prepared in accordance with GAAP, which requires the use of estimates and assumptions that involve the exercise of judgment and use of assumptions as to future uncertainties. Accounting estimates and assumptions discussed in this section are those that we consider to be the most critical to understanding our financial statements because they involve significant judgments and uncertainties that could affect our reported assets and liabilities, as well as our reported revenue and expenses. All of these estimates reflect our best judgment about current, and for some estimates, future economic and market conditions and their effects based on information available as of the date of the financial statements. If conditions change from those expected, it is possible that the judgments and estimates described below could change, which may result in a change in our allowance for credit losses, future write-offs of our investments, and valuation of our investment
portfolio, among other effects. We believe that the following accounting policies are among the most important to the portrayal of our financial condition and results of operations and require the most difficult, subjective or complex judgments.
Real Estate Owned
Upon the acquisition of a property, we assess the fair value of the acquired tangible and intangible assets (including land, buildings, tenant improvements, favorable and unfavorable leases, acquired in-place leases, other identified intangible assets and assumed liabilities) and allocate the purchase price to the acquired assets and assumed liabilities, which are on a relative fair value basis. The most significant portion of the allocation is to building and land and requires the use of market based estimates and assumptions. We assess and consider fair value based on estimated cash flow projections that utilize appropriate discount and/or capitalization rates, as well as other available market information. Estimates of future cash flows are based on a number of factors including the historical operating results, known and anticipated trends, and market and economic conditions.
The fair value of the tangible assets of an acquired property considers the value of the property as if it were vacant. We also consider an allocation of purchase price of other acquired intangibles, including acquired in-place leases that may have a customer relationship intangible value, including (but not limited to) the nature and extent of the existing relationship with the tenants, the tenants’ credit quality and expectations of lease renewals.
Acquired favorable and unfavorable leases are recorded at their fair values (using a discount rate which reflects the risks associated with the leases acquired) equal to the difference between (i) the contractual amounts to be paid pursuant to each in-place lease and (ii) management’s estimate of fair market lease rates for each corresponding in-place lease, measured over a period equal to the remaining term of the lease for favorable leases and the initial term plus the term of any below-market fixed rate renewal options for unfavorable leases. Other intangible assets acquired include amounts for in-place lease values that are based on our evaluation of the specific characteristics of each tenant’s lease. Factors to be considered include estimates of carrying costs during hypothetical expected lease-up periods considering current market conditions, and costs to execute similar leases. In estimating carrying costs, we include real estate taxes, insurance and other operating expenses and estimates of lost rentals at market rates during the expected lease-up periods, depending on local market conditions. In estimating costs to execute similar leases, we consider leasing commissions, legal and other related expenses.
Allowance for Credit Losses
We originate and purchase CRE debt and related instruments generally to be held as long-term investments at amortized cost. We adopted ASU No. 2016-13, Financial Instruments—Credit Losses, and subsequent amendments (“ASU 2016-13”), which replaced the incurred loss methodology with an expected loss model known as the Current Expected Credit Loss or CECL model. CECL amends the previous credit loss model to reflect our current estimate of all expected credit losses, not only based on historical experience and current conditions, but also by including reasonable and supportable forecasts incorporating forward-looking information.
We have implemented loan loss forecasting models for estimating expected life-time credit losses, at the individual loan level, for our commercial mortgage loan portfolio. The CECL forecasting methods used by us include (i) a probability of default and loss given default method using underlying third-party CMBS/CRE loan database with historical loan losses from 1998 through 2023, and (ii) a probability weighted expected cash flow method, depending on the type of loan and the availability of relevant historical market loan loss data. We might use other acceptable alternative approaches in the future depending on, among other factors, the type of loan, underlying collateral, and availability of relevant historical market loan loss data.
We estimate our CECL allowance for our loan portfolio, including unfunded loan commitments, at the individual loan level. Significant inputs to our forecasting methods include (i) key loan-specific inputs such as vintage year, loan-term, underlying property type, geographic location, and expected timing and amount of future loan fundings, (ii) performance against the underwritten business plan and our internal loan risk rating and (iii) a macro-economic forecast. In certain instances, we consider relevant loan-specific qualitative factors to certain loans to estimate its CECL allowance.
For collateral dependent loans that we determine foreclosure of the collateral is probable, we measure the expected losses based on the difference between the fair value of the collateral and the amortized cost basis of the loan as of the measurement date. For collateral dependent loans where we determine foreclosure is not probable, we apply a practical expedient to estimate expected losses using the difference between the collateral’s fair value (less costs to sell the asset if repayment is expected through the sale of the collateral) and the amortized cost basis of the loan. A loan is determined to be collateral dependent if (i)
a borrower or sponsor is experiencing financial difficulty, and (ii) the loan is expected to be substantially repaid through the sale of the underlying collateral; such determination requires the use of significant judgment and can be based on several factors subject to uncertainty.
In conjunction with reviewing commercial real estate loans held-for-investment for impairment, the Manager evaluates our commercial real estate loans at least once per quarter, assesses the risk factors of each loan, and assigns a risk rating based on a variety of factors, including, without limitation, underlying real estate performance, values of comparable properties, durability and quality of property cash flows, sponsor experience and financial wherewithal, and the existence of a risk-mitigating loan structure. Additional key considerations include debt service coverage ratios, loan structure, real estate and credit market dynamics, and risk of default or principal loss. Based on a five-point scale, our loans are rated "1" through "5," from less risk to greater risk.
Recent Accounting Pronouncements
In March 2020, the FASB issued ASU No. 2020-04, Reference Rate Reform (Topic 848): Facilitation of the Effects of Reference Rate Reform on Financial Reporting, which provides temporary optional expedients and exceptions to the US GAAP guidance on contract modifications and hedge accounting to ease the financial reporting burdens of the expected market transition from LIBOR and other interbank offered rates to alternative reference rates. The guidance is effective upon issuance and generally may be elected over time through December 31, 2024, as extended under ASU No. 2022-06, Reference Rate Reform (Topic 848): Deferral of the Sunset Date of Topic 848. We have not adopted any of the optional expedients or exceptions through December 31, 2023, but will continue to evaluate the possible adoption of any such expedients or exceptions during the effective period as circumstances evolve.
In March 2022, the FASB issued ASU No. 2022-02, Financial Instruments — Credit Losses (Topic 326): Troubled Debt Restructurings and Vintage Disclosures, which eliminates the recognition and measurement guidance for a troubled debt restructuring for creditors that have adopted CECL and requires public business entities to present gross write-offs by year of origination in their vintage disclosures. On January 1, 2023, we adopted ASU 2022-02 on a prospective basis and the adoption had no significant impact on our consolidated financial statements.
In November 2023, the FASB issued ASU No. 2023-07, Segment Reporting (Topic 280): Improvements to Reportable Segment Disclosures, which requires a public entity to disclose significant segment expenses and other segment items on an annual and interim basis and to provide in interim periods all disclosures about a reportable segment’s profit or loss and assets that are currently required annually. Public entities with a single reportable segment are required to provide the new disclosures and all the disclosures required under ASC 280. The guidance is effective for our 2024 annual reporting. The guidance is applied retrospectively to all periods presented in the financial statements, unless it is impracticable. We are evaluating the impact of ASU 2023-07.
ITEM 7A. QUANTITATIVE AND QUALITATIVE DISCLOSURES ABOUT MARKET RISK
We seek to manage our risks related to the credit quality of our assets, interest rates, liquidity, prepayment rates and market value, while at the same time seeking to provide an opportunity to stockholders to realize attractive risk-adjusted returns. While risks are inherent in any business enterprise, we seek to quantify and justify risks in light of available returns and to maintain capital levels consistent with the risks we undertake.
Credit Risk
Our investments are subject to credit risk, including the risk of default. The performance and value of our investments depend upon the sponsors' ability to operate the properties that serve as our collateral so that they produce cash flows adequate to pay interest and principal due to us. To monitor this risk, our Manager reviews our investment portfolio and is in regular contact with the sponsors, monitoring performance of the collateral and enforcing our rights as necessary.
Inflation, rising interest rates and increasing costs may dampen consumer spending and slow corporate profit growth, which may negatively impact the value of underlying real estate collateral relating to KREF’s investments and impair KREF's borrowers’ ability to execute on their business plans and potentially their ability to perform under the terms of their loan obligations.
Credit Yield Risk
Credit yields measure the return demanded on financial instruments by the lending market based on their risk of default. Increasing supply of credit-sensitive financial instruments and reduced demand will generally cause the market to require a higher yield on such financial instruments, resulting in a lower price for the financial instruments we hold.
Interest Rate Risk
The composition of our investments is such that rising interest rates will increase our net income, while declining interest rates will generally decrease our net income. Rate floors relating to our loan portfolio may offset some of the impact from declining rates. There can be no assurance that we will continue to utilize rate floors. There can be no assurance of how our net income may be affected in future quarters, which will depend on, among other things, the interest rate environment and our then-current portfolio.
In light of increasing inflation in recent years, the U.S. Federal Reserve has raised interest rates eleven times since January 2022.
In addition to the risks related to fluctuations in cash flows and asset values associated with movements in interest rates, there is also the risk of non-performance on floating-rate assets. In the case of a significant increase in interest rates, the cash flows of the collateral real estate assets may not be sufficient to pay debt service due under our loans, which may contribute to non-performance or, in severe cases, default.
Notwithstanding the current period of relatively high interest rates, the U.S. Federal Reserve has indicated that it may decrease in interest rates in 2024. In a period of declining interest rates, our interest income on floating-rate investments would generally decrease, while any decrease in the interest we are charged on our floating-rate debt may be subject to floors and may not compensate for such decrease in interest income. However, rate floors relating to our loan portfolio may offset some of the impact from declining rates. In addition, interest we are charged on our fixed-rate debt would not change.
As of December 31, 2023, our accruing loan portfolio and related portfolio financing by principal amount earned or paid a floating rate of interest indexed to Term SOFR. Accordingly, our interest income and expense will generally change directionally with index rates; however, in certain circumstances, rate floors relating to our loan portfolio may partially offset the impact from changing rates. As of December 31, 2023, a 50 basis point and a 100 basis point decrease in the index rates would decrease our expected cash flows by approximately $1.1 million and $2.2 million, or ($0.02) and ($0.03) per common share, respectively, for the following three-month period. Conversely, a 50 basis point and a 100 basis point increase in the index rates would increase our expected cash flows by approximately $1.1 million and $2.2 million, or $0.02 and $0.03 per common share, respectively, for the same period.
LIBOR Transition
On March 5, 2021, the Financial Conduct Authority of the U.K. (the “FCA”), which regulates LIBOR, announced (the “FCA Announcement”) that all relevant LIBOR tenors would cease to be published or would no longer be representative after June 30, 2023. The FCA Announcement coincided with the March 5, 2021 announcement of LIBOR’s administrator, the ICE Benchmark Administration Limited (the “IBA”), indicating that, as a result of not having access to input data necessary to calculate relevant LIBOR tenors on a representative basis after June 30, 2023, the IBA would have to cease publication of such LIBOR tenors immediately after the last publication on June 30, 2023. Further, on March 15, 2022, the Consolidated Appropriations Act of 2022, which includes the Adjustable Interest Rate (LIBOR) Act, was signed into law in the United States. This legislation established a uniform benchmark replacement process for financial contracts maturing after June 30, 2023 that do not contain clearly defined or practicable fallback provisions. The legislation also created a safe harbor that shields lenders from litigation if they choose to utilize a replacement rate recommended by the Board of Governors of the Federal Reserve.
The Federal Reserve, in conjunction with the Alternative Reference Rate Committee, a committee convened by the Federal Reserve that includes major market participants, identified the Secured Overnight Financing Rate, or SOFR, an index calculated by short-term repurchase agreements, backed by Treasury securities, as its preferred alternative rate for LIBOR. There are significant differences between LIBOR and SOFR, such as LIBOR being an unsecured lending rate while SOFR is a secured lending rate, and SOFR is an overnight rate while LIBOR reflects term rates at different maturities. The differences between LIBOR and SOFR, could result in higher interest costs for us, which could have a material adverse effect on our operating results.
As of December 31, 2023, our floating-rate loan portfolio and financing arrangements were all indexed to Term SOFR.
Prepayment Risk
Prepayment risk is the risk that principal will be repaid at an earlier date than anticipated, potentially causing the return on certain investments to be less than expected. As we receive prepayments of principal on our assets, any premiums paid on such assets are amortized against interest income. In general, an increase in prepayment rates accelerates the amortization of purchase premiums, thereby reducing the interest income earned on the assets. Conversely, discounts on such assets are accreted into interest income. In general, an increase in prepayment rates accelerates the accretion of purchase discounts, thereby increasing the interest income earned on the assets. Additionally, we may not be able to reinvest the principal repaid at the same or higher yield of the original investment.
Higher interest rates imposed by the Federal Reserve may lead to a decrease in prepayment speeds and an increase in the number of our borrowers who exercise extension options, which could extend beyond the term of certain secured financing agreements we use to finance our loan investments. This could have a negative impact on our results of operations, and in some situations, we may be forced to sell assets to maintain adequate liquidity, which could cause us to incur losses.
Financing Risk
We finance our target assets using our repurchase facilities, our term lending agreements, our Term Loan Facility, Warehouse Facility, Asset Based Financing, secured term loan, collateralized loan obligations and through syndicating senior participations in our originated senior loans. Over time, as market conditions change, we may use other forms of leverage in addition to these methods of financing. Weakness or volatility in the financial markets, the CRE and mortgage markets or the economy generally could adversely affect one or more of our lenders or potential lenders and could cause one or more of our lenders or potential lenders to be unwilling or unable to provide us with financing, or to decrease the amount of our available financing through a market to market, or to increase the costs of that financing.
Real Estate Risk
The market values of commercial real estate assets are subject to volatility and may be adversely affected by a number of factors, including, but not limited to, national, regional and local economic conditions (which may be adversely affected by industry slowdowns and other factors); local real estate conditions; changes or continued weakness in specific industry segments; construction quality, age and design; demographic factors; and retroactive changes to building or similar codes. In
addition, decreases in property values reduce the value of the collateral and the potential proceeds available to a borrower to repay the underlying loans, which could also cause us to suffer losses.
ITEM 8. FINANCIAL STATEMENTS AND SUPPLEMENTARY DATA
INDEX TO CONSOLIDATED FINANCIAL STATEMENTS AND SCHEDULE
REPORT OF INDEPENDENT REGISTERED PUBLIC ACCOUNTING FIRM
To the Stockholders and the Board of Directors of
KKR Real Estate Finance Trust Inc.
Opinions on the Financial Statements and Internal Control over Financial Reporting
We have audited the accompanying consolidated balance sheets of KKR Real Estate Finance Trust Inc. and subsidiaries (the "Company") as of December 31, 2023 and 2022, the related consolidated statements of income, changes in equity and cash flows, for each of the three years in the period ended December 31, 2023, and the related notes and the schedule listed in Index at Item 15(a) (collectively referred to as the "financial statements"). We also have audited the Company’s internal control over financial reporting as of December 31, 2023, based on criteria established in Internal Control — Integrated Framework (2013) issued by the Committee of Sponsoring Organizations of the Treadway Commission (COSO).
In our opinion, the financial statements referred to above present fairly, in all material respects, the financial position of the Company as of December 31, 2023 and 2022, and the results of its operations and its cash flows for each of the three years in the period ended December 31, 2023, in conformity with accounting principles generally accepted in the United States of America. Also, in our opinion, the Company maintained, in all material respects, effective internal control over financial reporting as of December 31, 2023, based on criteria established in Internal Control — Integrated Framework (2013) issued by COSO.
Basis for Opinions
The Company’s management is responsible for these financial statements, for maintaining effective internal control over financial reporting, and for its assessment of the effectiveness of internal control over financial reporting, included in the accompanying Management’s Annual Report on Internal Control Over Financial Reporting. Our responsibility is to express an opinion on these financial statements and an opinion on the Company’s internal control over financial reporting based on our audits. We are a public accounting firm registered with the Public Company Accounting Oversight Board (United States) (PCAOB) and are required to be independent with respect to the Company in accordance with the U.S. federal securities laws and the applicable rules and regulations of the Securities and Exchange Commission and the PCAOB.
We conducted our audits in accordance with the standards of the PCAOB. Those standards require that we plan and perform the audits to obtain reasonable assurance about whether the financial statements are free of material misstatement, whether due to error or fraud, and whether effective internal control over financial reporting was maintained in all material respects.
Our audits of the financial statements included performing procedures to assess the risks of material misstatement of the financial statements, whether due to error or fraud, and performing procedures to respond to those risks. Such procedures included examining, on a test basis, evidence regarding the amounts and disclosures in the financial statements. Our audits also included evaluating the accounting principles used and significant estimates made by management, as well as evaluating the overall presentation of the financial statements. Our audit of internal control over financial reporting included obtaining an understanding of internal control over financial reporting, assessing the risk that a material weakness exists, and testing and evaluating the design and operating effectiveness of internal control based on the assessed risk. Our audits also included performing such other procedures as we considered necessary in the circumstances. We believe that our audits provide a reasonable basis for our opinions.
Definition and Limitations of Internal Control over Financial Reporting
A company’s internal control over financial reporting is a process designed to provide reasonable assurance regarding the reliability of financial reporting and the preparation of financial statements for external purposes in accordance with generally accepted accounting principles. A company’s internal control over financial reporting includes those policies and procedures that (1) pertain to the maintenance of records that, in reasonable detail, accurately and fairly reflect the transactions and dispositions of the assets of the company; (2) provide reasonable assurance that transactions are recorded as necessary to permit preparation of financial statements in accordance with generally accepted accounting principles, and that receipts and expenditures of the company are being made only in accordance with authorizations of management and directors of the company; and (3) provide reasonable assurance regarding prevention or timely detection of unauthorized acquisition, use, or disposition of the company’s assets that could have a material effect on the financial statements.
Because of its inherent limitations, internal control over financial reporting may not prevent or detect misstatements. Also, projections of any evaluation of effectiveness to future periods are subject to the risk that controls may become inadequate because of changes in conditions, or that the degree of compliance with the policies or procedures may deteriorate.
Critical Audit Matters
The critical audit matters communicated below are matters arising from the current-period audit of the financial statements that were communicated or required to be communicated to the audit committee and that (1) relate to accounts or disclosures that are material to the financial statements and (2) involved our especially challenging, subjective, or complex judgments. The communication of critical audit matters does not alter in any way our opinion on the financial statements, taken as a whole, and we are not, by communicating the critical audit matters below, providing separate opinions on the critical audit matters or on the accounts or disclosures to which they relate.
Allowance for Credit Losses – Estimation of Economic Conditions – Refer to Notes 2 and 3 of the financial statements
Critical Audit Matter Description
The Company estimates the allowance for credit losses for its loan portfolio, including unfunded loan commitments, at the individual loan level. The CECL forecasting methods used by KREF include a probability of default and loss given default method using a third-party Commercial Mortgage Back Securities and Commercial Real Estate loan database with historical loan losses from 1998 to 2023. In determining the CECL allowance, the Company considers various factors including (i) historical loss experience in the commercial real estate lending market, (ii) timing of expected repayments, (iii) expected future funding, (iv) capital subordinate to the Company when they are the senior lender, (v) capital senior to the Company when they are the subordinate lender, and (vi) the Company’s current and future view of the macroeconomic environment. Management’s estimation of the current and future economic conditions that may impact the performance of the commercial real estate properties securing the Company’s assets include factors such as the unemployment rate, commercial real estate prices, and market liquidity. The Company uses projections, obtained from third-party service providers, of each factor to approximate the impact the macroeconomic outlook may have on the loss rate.
We identified the macroeconomic factors within the CECL allowance as a critical audit matter because of the subjectivity, complexity, and estimation uncertainty in determining the impact of the factors on the Company’s loss rate. This required a high degree of auditor judgment and an increased extent of effort when performing audit procedures to evaluate whether the macroeconomic factors determined by management reasonably and appropriately quantify the current and future macroeconomic risks associated with the Company’s loan portfolio.
How the Critical Audit Matter Was Addressed in the Audit
Our audit procedures to assess the macroeconomic factors applied by management to the CECL allowance to account for current and future economic conditions included, among others: Our audit procedures to assess the macroeconomic factors applied by management to the CECL allowance to account for current and future economic conditions included, among others:
•We tested the effectiveness of controls over management’s review of the macroeconomic factors applied to the loss rate.
•With the assistance of our credit specialist, we evaluated the reasonableness of the methodology and significant assumptions used to determine the macroeconomic factors by considering relevant industry trends and economic conditions.
•We tested the accuracy and completeness of quantitative data used by management to estimate the current and future view of macroeconomic conditions.We tested the effectiveness of controls over management’s review of the macroeconomic factors applied to the loss rate.With the assistance of our credit specialist, we evaluated the reasonableness of the methodology and significant assumptions used to determine the macroeconomic factors by considering relevant industry trends and economic conditions. We tested the accuracy and completeness of quantitative data used by management to estimate the current and future view of macroeconomic conditions.
Allowance for Credit Losses Allowance – Determination of Collateral Value – Refer to Notes 2 and 3 of the financial statements
Critical Audit Matter Description
The Company determines a loan to be collateral dependent if (i) a borrower or sponsor is experiencing financial difficulty, and (ii) the loan is expected to be substantially repaid through the sale of the underlying collateral. For collateral dependent loans, the Company estimates expected losses using the difference between the collateral’s fair value and the amortized cost basis of the loan.
We identified the determination of the CECL allowance for collateral dependent loans as a critical audit matter due to the significant judgment and assumptions relating to the determination of the fair value of the collateral. A high degree of auditor judgement and increased extent of effort was required when performing audit procedures, including the use of our specialists to evaluate management’s CECL assessment.
How the Critical Audit Matter Was Addressed in the Audit
Our audit procedures related to the determination of the fair value of the collateral for collateral dependent loans, among others:
•We tested the effectiveness of controls over management’s determination of fair value of the collateral.
•We evaluated the Company’s determination of fair value by performing the following:
◦With the assistance of our fair value specialists, we evaluated the reasonableness of the (1) valuation methodology; (2) significant assumptions made, including whether the significant inputs used to determine the fair value were appropriate and consistent with what market participants would use to value the collateral; and (3) mathematical accuracy of the overall valuation model.
◦We tested the underlying data used to determine fair value to determine that the information used in the analysis was accurate and complete.
Real Estate Owned — Refer to Notes 2 and 4 of the financial statements
Critical Audit Matter Description
The Company accounts for the acquisition of properties by recording the purchase price of tangible and intangible assets acquired and liabilities assumed based on their relative fair values. The value of the tangible assets, consisting of land, tenant improvements, and buildings is determined as if these assets are vacant. Intangible assets may include the value of in-place leases and favorable lease intangibles, which are each recorded at their relative fair values. Intangible liabilities may include the value of unfavorable leases which are recorded at their relative fair values.
We identified the determination of the relative fair value of assets acquired and liabilities assumed as a critical audit matter. This fair value analysis required management to make estimates related to the future expected cash flows, including market information as well as discount rates and capitalization rates. We performed audit procedures to evaluate the reasonableness of these estimates which required a high degree of auditor judgment and an increased extent of effort, including the need to involve our fair value specialists.
How the Critical Audit Matter Was Addressed in the Audit
Our audit procedures related to the relative fair value of assets acquired and liabilities assumed by the Company included the following, among others:
•We tested the effectiveness of controls over management’s critical assumptions including:
◦The selection of the methods and valuation techniques used to determine that fair value is appropriate and consistent with industry standards.
◦The assumptions for allocating the purchase price to tangible and intangible assets and liabilities.
•We obtained and evaluated the purchase price allocation report prepared by management’s expert along with relevant supporting documentation in order to corroborate our understanding of the substance of the acquisition and assess the completeness of the assets acquired and liabilities assumed as part of the acquisition.
•With the assistance of our fair value specialists, we evaluated the reasonableness of the valuation methodology, costs to replace certain assets, and significant assumptions used in the cash flow models, including testing the mathematical accuracy of the calculation and comparing the key inputs used in the projections to external market sources.
•We tested the reasonableness of management's capitalization and discount rates by comparing the assumptions used to external market sources.
•We tested the reasonableness of management's projections of the property's net operating income by comparing the assumptions used in the projections to external market sources, executed lease agreements, historical data, and results from other areas of the audit.
/s/
February 6, 2024
We have served as the Company's auditor since 2016.
KKR Real Estate Finance Trust Inc. and Subsidiaries
Consolidated Balance Sheets
(Amounts in thousands, except share and per share data)
| | | | | | | | | | | | | | |
| | December 31, 2023 | | December 31, 2022 |
| Assets | | | | |
Cash and cash equivalents(A) | | $ | | | | $ | | |
| Commercial real estate loans, held-for-investment | | | | | | |
| Less: Allowance for credit losses | | () | | | () | |
| Commercial real estate loans, held-for-investment, net | | | | | | |
| Real estate owned assets, held for sale | | | | | | |
| Real estate owned, held for investment, net | | | | | | |
| Accrued interest receivable | | | | | | |
| Equity method investments | | | | | | |
| Other assets | | | | | | |
| Total Assets | | $ | | | | $ | | |
| | | | |
| Liabilities and Equity | | | | |
| Liabilities | | | | |
| Secured financing agreements, net | | $ | | | | $ | | |
| Collateralized loan obligations, net | | | | | | |
| Secured term loan, net | | | | | | |
| Convertible notes, net | | | | | | |
|
| Dividends payable | | | | | | |
| Accrued interest payable | | | | | | |
| Real estate owned liabilities, held for sale | | | | | | |
|
| Due to affiliates | | | | | | |
| Other liabilities | | | | | | |
| Total Liabilities | | | | | | |
| | | | |
| Commitments and Contingencies (Note 13) | | | | | | |
| | | | |
|
|
|
| Equity | | | | |
Preferred Stock, $ par value, shares authorized | | | | |
|
Series A cumulative redeemable preferred stock, ( shares issued and outstanding as of December 31, 2023 and 2022); liquidation preference of $ per share | | | | | | |
Common stock, $ par value, authorized ( and shares issued; and shares outstanding; as of December 31, 2023 and 2022, respectively) | | | | | | |
| Additional paid-in capital | | | | | | |
| Accumulated deficit | | () | | | () | |
Repurchased stock ( shares repurchased as of December 31, 2023 and 2022) | | () | | | () | |
| Total KKR Real Estate Finance Trust Inc. Stockholders’ Equity | | | | | | |
Noncontrolling interests in equity of consolidated joint venture | | () | | | () | |
| Total Equity | | | | | | |
| Total Liabilities and Equity | | $ | | | | $ | | |
(A) million and $ million of cash held in collateralized loan obligation as of December 31, 2023 and 2022, respectively.
See Notes to Consolidated Financial Statements.
KKR Real Estate Finance Trust Inc. and Subsidiaries
Consolidated Statements of Income
(Amounts in thousands, except share and per share data)
| | | | | | | | | | | | | | | | | | | | |
| | For the Year Ended December 31, |
| | 2023 | | 2022 | | 2021 |
| Net Interest Income | | | | | | |
| Interest income | | $ | | | | $ | | | | $ | | |
| Interest expense | | | | | | | | | |
| Total net interest income | | | | | | | | | |
| Other Income | | | | | | |
| Revenue from real estate owned operations | | | | | | | | | |
| Income from equity method investments | | | | | | | | | |
| Other income | | | | | | | | | |
| Gain on sale of investments | | | | | | | | | |
|
| Total other income | | | | | | | | | |
| Operating Expenses | | | | | | |
| General and administrative | | | | | | | | | |
| Provision for (reversal of) credit losses, net | | | | | | | | () | |
| Management fees to affiliate | | | | | | | | | |
| Incentive compensation to affiliate | | | | | | | | | |
| Expenses from real estate owned operations | | | | | | | | | |
| Total operating expenses | | | | | | | | | |
Income (Loss) Before Income Taxes, Noncontrolling Interests, Preferred Dividends, Redemption Value Adjustment and Participating Securities' Share in Earnings | | () | | | | | | | |
| Income tax expense | | | | | | | | | |
| Net Income (Loss) | | () | | | | | | | |
Net income (loss) attributable to noncontrolling
interests | | () | | | () | | | | |
| Net Income (Loss) Attributable to KKR Real Estate Finance Trust Inc. and Subsidiaries | | () | | | | | | | |
| Preferred stock dividends and redemption value adjustment | | | | | | | | | |
| Participating securities' share in earnings | | | | | | | | | |
| Net Income (Loss) Attributable to Common Stockholders | | $ | () | | | $ | | | | $ | | |
| | | | | | |
| Net Income (Loss) Per Share of Common Stock | | | | | | |
| Basic | | $ | () | | | $ | | | | $ | | |
| Diluted | | $ | () | | | $ | | | | $ | | |
| | | | | | |
| Weighted Average Number of Shares of Common Stock Outstanding | | | | | | |
| Basic | | | | | | | | | |
| Diluted | | | | | | | | | |
| | | | | | |
| Dividends Declared per Share of Common Stock | | $ | | | | $ | | | | $ | | |
See Notes to Consolidated Financial Statements.
KKR Real Estate Finance Trust Inc. and Subsidiaries
Consolidated Statements of Changes in Equity
(Amounts in thousands, except share data)
| | | | | | | | | | | | | | | | | | | | | | | | | | | | | | | | | | | | | | | | | | | | | | | | | | | | | | | | | | | | | | | | | | | | | | | | | | | | | | | | |
| | Temporary Equity |
| | | |
| | Preferred Stock | | Series A Preferred Stock | | Common Stock | | | | | | | | | | | | | | |
| | Shares | | Par Value | | Shares | | Par Value | | Shares | | Par Value | | Additional
Paid-In Capital | | Retained Earnings (Accumulated Deficit) | | Repurchased Stock | | Total KKR Real Estate Finance Trust Inc. Stockholders' Equity | | Noncontrolling Interests in Equity of Consolidated Joint Venture | | Total Permanent Equity | | Redeemable Preferred Stock |
| Balance at December 31, 2020 | | | | | $ | | | | | | | $ | | | | | | | $ | | | | $ | | | | $ | () | | | $ | () | | | $ | | | | $ | | | | $ | | | | $ | | |
| Issuance of common stock | | — | | | — | | | — | | | — | | | | | | | | | | | | — | | | — | | | | | | — | | | | | | — | |
Issuance of Series A cumulative redeemable preferred stock (liquidation preference of $ per share) | | — | | | — | | | | | | | | | — | | | — | | | | | | — | | | — | | | | | | — | | | | | | — | |
| Offering costs | | — | | | — | | | — | | | — | | | — | | | — | | | () | | | — | | | — | | | () | | | — | | | () | | | — | |
Conversion of special voting preferred stock | | () | | | * | | — | | | — | | | | | | * | | — | | | — | | | — | | | — | | | — | | | — | | | — | |
Redemption of special non-voting preferred stock | | — | | | — | | | — | | | — | | | — | | | — | | | — | | | — | | | — | | | — | | | — | | | — | | | () | |
| Contribution by noncontrolling interests | | — | | | — | | | — | | | — | | | — | | | — | | | — | | | — | | | — | | | — | | | | | | | | | — | |
| Special non-voting preferred dividends declared | | — | | | — | | | — | | | — | | | — | | | — | | | — | | | — | | | — | | | — | | | — | | | — | | | () | |
Series A preferred dividends declared, $ per share | | — | | | — | | | — | | | — | | | — | | | — | | | — | | | () | | | — | | | () | | | — | | | () | | | — | |
Common dividends declared, $ per share | | — | | | — | | | — | | | — | | | — | | | — | | | — | | | () | | | — | | | () | | | — | | | () | | | — | |
Participating security dividends declared, $ per share | | — | | | — | | | — | | | — | | | — | | | — | | | — | | | () | | | — | | | () | | | — | | | () | | | — | |
| Stock-based compensation, net | | — | | | — | | | — | | | — | | | | | | | | | | | | — | | | — | | | | | | — | | | | | | — | |
| Adjustment of redeemable preferred stock to redemption value | | — | | | — | | | — | | | — | | | — | | | — | | | — | | | () | | | — | | | () | | | — | | | () | | | | |
| Net income (loss) | | — | | | — | | | — | | | — | | | — | | | — | | | — | | | | | | — | | | | | | — | | | | | | | |
| Balance at December 31, 2021 | | | | | $ | | | | | | | $ | | | | | | | $ | | | | $ | | | | $ | () | | | $ | () | | | $ | | | | $ | | | | $ | | | | $ | | |
| Issuance of common stock | | — | | | — | | | — | | | — | | | | | | | | | | | | — | | | — | | | | | | — | | | | | | — | |
Issuance of Series A cumulative redeemable preferred stock (liquidation preference of $ per share) | | — | | | — | | | | | | | | | — | | | — | | | | | | — | | | — | | | | | | — | | | | | | — | |
| Offering costs | | — | | | — | | | — | | | — | | | — | | | — | | | () | | | — | | | — | | | () | | | — | | | () | | | — | |
| Contribution by noncontrolling interest | | — | | | — | | | — | | | — | | | — | | | — | | | — | | | — | | | — | | | — | | | | | | | | | — | |
| Repurchase of common stock | | — | | | — | | | — | | | — | | | () | | | () | | | — | | | — | | | () | | | () | | | — | | | () | | | — | |
Series A preferred dividends declared, $ per share | | — | | | — | | | — | | | — | | | — | | | — | | | — | | | () | | | — | | | () | | | — | | | () | | | — | |
Common dividends declared, $ per share | | — | | | — | | | — | | | — | | | — | | | — | | | — | | | () | | | — | | | () | | | — | | | () | | | — | |
Participating security dividends declared, $ per share | | — | | | — | | | — | | | — | | | — | | | — | | | — | | | () | | | — | | | () | | | — | | | () | | | — | |
| Stock-based compensation, net | | — | | | — | | | — | | | — | | | | | | | | | | | | — | | | — | | | | | | — | | | | | | — | |
| Net income (loss) | | — | | | — | | | — | | | — | | | — | | | — | | | — | | | | | | — | | | | | | () | | | | | | — | |
| Balance at December 31, 2022 | | | | | $ | | | | | | | $ | | | | | | | $ | | | | $ | | | | $ | () | | | $ | () | | | $ | | | | $ | () | | | $ | | | | $ | | |
| Contribution by noncontrolling interest | | — | | | — | | | — | | | — | | | — | | | — | | | — | | | — | | | — | | | — | | | | | | | | | — | |
Series A preferred dividends declared, $ per share | | — | | | — | | | — | | | — | | | — | | | — | | | — | | | () | | | — | | | () | | | — | | | () | | | — | |
Common dividends declared, $ per share | | — | | | — | | | — | | | — | | | — | | | — | | | — | | | () | | | — | | | () | | | — | | | () | | | — | |
Participating security dividends declared, $ per share | | — | | | — | | | — | | | — | | | — | | | — | | | — | | | () | | | — | | | () | | | — | | | () | | | — | |
| Stock-based compensation, net | | — | | | — | | | — | | | — | | | | | | | | | | | | — | | | — | | | | | | — | | | | | | — | |
| Net income (loss) | | — | | | — | | | — | | | — | | | — | | | — | | | — | | | () | | | — | | | () | | | () | | | () | | | — | |
| Balance at December 31, 2023 | | | | | $ | | | | | | | $ | | | | | | | $ | | | | $ | | | | $ | () | | | $ | () | | | $ | | | | $ | () | | | $ | | | | $ | | |
* Rounds to zero.
See Notes to Consolidated Financial Statements.
KKR Real Estate Finance Trust Inc. and Subsidiaries
Consolidated Statements of Cash Flows
(Amounts in thousands)
| | | | | | | | | | | | | | | | | | | | |
| | For the Year Ended December 31, |
| | 2023 | | 2022 | | 2021 |
| Cash Flows From Operating Activities | | | | | | |
| Net income (loss) | | $ | () | | | $ | | | | $ | | |
| Adjustments to reconcile net income (loss) to net cash provided by (used in) operating activities: | | | | | | |
| Amortization of deferred debt issuance costs and discounts | | | | | | | | | |
| Accretion of net deferred loan fees and discounts | | () | | | () | | | () | |
| Payment-in-kind interest | | | | | () | | | () | |
| Loss (gain) on sale of investment | | | | | | | | () | |
| Loss (income) from equity method investments | | | | | () | | | () | |
| Provision for (reversal of) credit losses, net | | | | | | | | () | |
| Stock-based compensation expense | | | | | | | | | |
| Changes in operating assets and liabilities: | | | | | | |
| Accrued interest receivable, net | | () | | | () | | | | |
| Other assets | | | | | | | | () | |
| Accrued interest payable | | | | | | | | | |
| Accounts payable, accrued expenses and other liabilities | | () | | | () | | | | |
| Due to affiliates | | () | | | | | | | |
| Net cash provided by (used in) operating activities | | | | | | | | | |
| | | | | | |
| Cash Flows From Investing Activities | | | | | | |
| Proceeds from principal repayments and sale/syndication of commercial real estate loans, held-for-investment | | | | | | | | | |
| Origination of commercial real estate loans, held-for-investment | | () | | | () | | | () | |
| Investment in real estate owned | | () | | | () | | | | |
| Net cash assumed from investment in real estate owned and related joint venture | | | | | | | | | |
|
|
|
| Net cash provided by (used in) investing activities | | | | | () | | | () | |
| | | | | | |
| Cash Flows From Financing Activities | | | | | | |
| Proceeds from borrowings under secured financing agreements | | | | | | | | | |
| Proceeds from issuance of collateralized loan obligations | | | | | | | | | |
| Net proceeds from issuance of secured term loan | | | | | | | | | |
| Net proceeds from issuances of common stock | | | | | | | | | |
| Net proceeds from issuances of preferred stock | | | | | | | | | |
| Proceeds from noncontrolling interest contributions | | | | | | | | | |
| Payments of common stock dividends | | () | | | () | | | () | |
| Payments of preferred stock dividends | | () | | | () | | | () | |
| Principal repayments on borrowings under secured financing agreements | | () | | | () | | | () | |
| Principal repayments on borrowings under convertible notes | | () | | | | | | | |
| Principal repayments on borrowings under collateralized loan obligations | | | | | | | | () | |
| Payments of debt and collateralized debt obligation issuance costs | | () | | | () | | | () | |
| Principal repayments on loan participations | | | | | | | | () | |
| Payments of stock issuance costs | | | | | () | | | () | |
| Payments to reacquire common stock | | | | | () | | | | |
| Tax withholding on stock-based compensation | | () | | | () | | | () | |
|
| Net cash provided by (used in) financing activities | | () | | | | | | | |
| | | | | | |
| Net Increase (Decrease) in Cash, Cash Equivalents and Restricted Cash | | () | | | () | | | | |
| Cash, Cash Equivalents and Restricted Cash at Beginning of Period | | | | | | | | | |
| Cash, Cash Equivalents and Restricted Cash at End of Period | | $ | | | | $ | | | | $ | | |
|
|
| | | | | | | | | | | | | | | | | | | | |
| | For the Year Ended December 31, |
| | 2023 | | 2022 | | 2021 |
| Reconciliation of cash, cash equivalents and restricted cash | | | | | | |
| Cash and cash equivalents | | $ | | | | $ | | | | $ | | |
| Restricted cash | | | | | | | | | |
| Total cash, cash equivalents and restricted cash shown in the Consolidated Statements of Cash Flows | | $ | | | | $ | | | | $ | | |
| | | | | | |
| Supplemental Disclosure of Cash Flow Information | | | | | | |
| Cash paid during the period for interest | | $ | | | | $ | | | | $ | | |
| Cash paid during the period for income taxes | | | | | | | | | |
| | | | | | |
| Supplemental Schedule of Non-Cash Investing and Financing Activities | | | | | | |
| Dividend declared, not yet paid | | $ | | | | $ | | | | $ | | |
|
| Assumption of real estate owned | | | | | | | | | |
|
| Assumption of other assets related to real estate owned | | | | | | | | | |
| Assumption of other liabilities related to real estate owned | | | | | | | | | |
| Transfer of senior loans to real estate owned | | | | | | | | | |
Loan principal payments held by servicer | | | | | | | | |
Modifications accounted for as repayments and new loans, net of write-offs | | | | | | | | | |
|
|
See Notes to Consolidated Financial Statements.
KKR Real Estate Finance Trust Inc.
Notes to Consolidated Financial Statements
(amount in tables in thousands, except per share amounts)
Note 1.
shares, or % of KREF's outstanding common stock.
KREF's principal business activities are related to the origination and purchase of credit investments related to CRE. Management assesses the performance of KREF's current portfolio of leveraged and unleveraged commercial real estate loans and makes operating decisions accordingly. As a result, management presents KREF's operations within a single reporting segment.
KKR Real Estate Finance Trust Inc.
Notes to Consolidated Financial Statements
(amount in tables in thousands, except per share amounts)
Note 2.
KKR Real Estate Finance Trust Inc.
Notes to Consolidated Financial Statements
(amount in tables in thousands, except per share amounts)
Noncontrolling Interests — Noncontrolling interests represent the ownership interests in certain consolidated subsidiaries held by entities or persons other than KREF. These noncontrolling interests do not include redemption features and are presented as "Noncontrolling interests in equity of consolidated joint venture" on the Consolidated Balance Sheets.
KKR Real Estate Finance Trust Inc.
Notes to Consolidated Financial Statements
(amount in tables in thousands, except per share amounts)
See Note 15 for additional information regarding the valuation of KREF's financial assets and liabilities.
KKR Real Estate Finance Trust Inc.
Notes to Consolidated Financial Statements
(amount in tables in thousands, except per share amounts)
Balance Sheet Measurement
As of December 31, 2023 and 2022, KREF was required to maintain unrestricted cash and cash equivalents of at least $ million and $ million, respectively, to satisfy its liquidity covenants (Note 5).
As of December 31, 2023 and 2022, KREF had $ million and $ million of restricted cash held in lender-controlled bank accounts, respectively. Such amounts are presented within "Other Assets" in the Consolidated Balance Sheets.
(Note 3).
KKR Real Estate Finance Trust Inc.
Notes to Consolidated Financial Statements
(amount in tables in thousands, except per share amounts)
See "Expense Recognition — Commercial Real Estate Loans, Held-For-Investment" for additional discussion regarding management’s determination for loan losses.
KKR Real Estate Finance Trust Inc.
Notes to Consolidated Financial Statements
(amount in tables in thousands, except per share amounts)
% convertible senior notes due May 15, 2023 (“Convertible Notes”) as of the issuance date based on KREF’s nonconvertible debt borrowing rate. The equity component of the Convertible Notes was reflected within "Additional paid-in capital" on the Consolidated Balance Sheets, and the resulting debt discount was amortized over the period during which such Convertible Notes were expected to be outstanding (through the maturity date) as additional non-cash interest expense using the interest method, or on a straight line basis when it approximates the interest method. The additional non-cash interest expense attributable to such convertible notes increased in subsequent periods through the maturity date as the notes accrete to their par value over the same period (Note 8). The entire $ million principal balance of the Convertible Notes matured and was repaid in cash on May 15, 2023. As of December 31, 2023, there were convertible notes outstanding.
Other Assets and Other Liabilities — As of December 31, 2023, other assets included $ million of restricted cash and $ million of deferred financing costs related to KREF's Revolver (Note 5). As of December 31, 2022, other assets included $ million of restricted cash, $ million of deferred financing costs related to KREF's Revolver and $ million of prepaid expenses.
As of December 31, 2023, other liabilities included $ million of allowance for credit losses related to KREF's unfunded loan commitments, $ million of REO, held for investment, liabilities (Note 4) and $ million of accrued expenses. As of December 31, 2022, other liabilities included $ million of allowance for credit losses related to KREF's unfunded loan commitments, $ million of REO, held for investment, liabilities and $ million of accrued expenses.
In December 2023, KREF's board of directors declared a dividend of $ per share of common stock to stockholders of record as of December 29, 2023, which was accrued in “Dividends payable” on KREF’s Consolidated Balance Sheets as of December 31, 2023 and was subsequently paid on January 12, 2024. In October 2023, KREF's board of directors declared a dividend of $ per each issued and outstanding share of the Company’s % Series A Cumulative Redeemable Preferred Stock, which represents an annual dividend of $ per share. The dividend was paid on December 15, 2023 to KREF’s preferred stockholders of record as of November 30, 2023.
As of December 31, 2023, KREF had not retired any repurchased stock.
KKR Real Estate Finance Trust Inc.
Notes to Consolidated Financial Statements
(amount in tables in thousands, except per share amounts)
Expense Recognition
KKR Real Estate Finance Trust Inc.
Notes to Consolidated Financial Statements
(amount in tables in thousands, except per share amounts)
(Note 14).
Refer to Note 11 for additional information.
KKR Real Estate Finance Trust Inc.
Notes to Consolidated Financial Statements
(amount in tables in thousands, except per share amounts)
Refer to Note 12 for additional discussion of earnings per share.
KKR Real Estate Finance Trust Inc.
Notes to Consolidated Financial Statements
(amount in tables in thousands, except per share amounts)
Note 3.
| | $ | | | | $ | | | | | | | | % | | | % | | | | Mezzanine loans | | | | | | | | | | | | | | | | | | | | |
| Total/Weighted Average | | $ | | | | $ | | | | $ | | | | | | | | % | | | % | | |
| December 31, 2022 | | | | | | | | | | | | | | |
Loans held-for-investment(F) | | | | | | | | | | | | | | |
Senior loans(G) | | $ | | | | $ | | | | $ | | | | | | | | % | | | % | | |
Mezzanine and other loans(H) | | | | | | | | | | | | | | | | | | | | |
| Total/Weighted Average | | $ | | | | $ | | | | $ | | | | | | | | % | | | % | | |
(A) Amortized cost represents the outstanding principal of loan, net of applicable unamortized discounts, loan origination fees, cost recovery interest and write-offs on uncollectible loan balances.
(B) Carrying value represents the amortized cost of loan, net of applicable allowance for credit losses.
(C) Average weighted by outstanding loan principal.
(D) Weighted average coupon assumes the greater of applicable index rate, including one-month Term SOFR and LIBOR, or the applicable contractual rate floor. Excludes loans accounted for under the cost recovery method.
(E) The weighted average life assumes all extension options are exercised by the borrowers.
(F) Excludes fully written off risk-rated 5 loans with a combined outstanding principal balance of $ million as of December 31, 2023. Excludes fully written off risk-rated 5 mezzanine loan with an outstanding principal balance of $ million as of December 31, 2022.
(G) Senior loans may include accommodation mezzanine loans in connection with the senior mortgage financing.
(H) Includes real estate corporate loan to a multifamily operator with a principal and a carrying value of $ million and $ million, respectively, as of December 31, 2022. This loan was fully repaid during the first quarter of 2023.
Activity —
| | $ | () | | | $ | | | Originations and future fundings, net(A) | | | | — | | | | |
| Proceeds from sales and loan repayments | () | | | — | | | () | |
| Accretion of loan discount and other amortization, net | | | | — | | | | |
| Payment-in-kind interest | | | | — | | | | |
| (Provision for) Reversal of credit losses | — | | | () | | | () | |
Write-offs charged(B) | () | | | | | | — | |
Balance at December 31, 2022 | $ | | | | $ | () | | | $ | | |
Originations and future fundings, net(A)(C) | | | | — | | | | |
Proceeds from loan repayments and cost recovery interest(C)(D) | () | | | — | | | () | |
| Accretion of loan discount and other amortization, net | | | | — | | | | |
|
|
|
| | | | | | | | | |
| | | | | | | | | | |
)
|
|
|
|
|
|
|
|
|
|
|
|
|
|
|
|
|
|
|
(A) Excludes a fully written off risk-rated 5 loan with an outstanding principal balance of $ million.
KKR Real Estate Finance Trust Inc.
Notes to Consolidated Financial Statements
(amount in tables in thousands, except per share amounts)
| | $ | | | | $ | | |
| Provision for (reversal of) credit losses, net | | | | | | | | | |
| Write-offs charged | | () | | | | | | () | |
|
| Balance at December 31, 2022 | | $ | | | | $ | | | | $ | | |
| Provision for (reversal of) credit losses, net | | | | | () | | | | |
| Write-offs charged | | () | | | | | | () | |
|
|
|
|
|
|
|
|
|
|
|
|
|
|
|
|
|
|
|
|
|
(A) Excludes real estate corporate loan to a multifamily operator with an outstanding principal amount of $ million, representing % of KREF’s commercial real estate loans, as of December 31, 2022. This loan was fully repaid during the first quarter of 2023.
KKR Real Estate Finance Trust Inc.
Notes to Consolidated Financial Statements
(amount in tables in thousands, except per share amounts)
Note 4.
million senior loan secured by a retail property in Portland, OR. In December 2021, KREF took title to the retail property. The transaction was accounted for as an asset acquisition under ASC 805. Accordingly, KREF recognized the property on the Consolidated Balance Sheet as REO with a carrying value of $ million, which included the estimated fair value of the property.
Concurrently with taking title to the REO, KREF contributed a portion of the REO asset with a carrying value of $ million to a joint venture (the "REO JV") with a third party local developer operator (“JV Partner”), whereby KREF has a % interest and the JV Partner has a % interest. In September 2023, the REO JV submitted a conceptual master plan to the City of Portland’s Bureau of Development Services in an application for a Design Advice Request (DAR) meeting with the City's Design Commission.
Philadelphia Office — In 2019, KREF originated a $ million senior loan secured by an office property in Philadelphia, PA. In December 2022, this loan was placed on nonaccrual status and subsequent interest collections were accounted for under the cost recovery method. As of September 30, 2023, the loan had a risk rating of 5 with an amortized cost of $ million. On December 22, 2023, KREF received a $ million partial repayment and then took title to the office property through a deed-in-lieu of foreclosure. The transaction was accounted for as an asset acquisition under ASC 805. Accordingly, KREF recorded the property with its net assets on the Consolidated Balance Sheet with an estimated fair value of $ million, which included $ million of cash received and $ million, $ million and $ million allocated to REO held for sale, lease intangible and other assets, and leasing and other liabilities, respectively. As a result, KREF recognized a $ million loan write-off for the difference between the carrying value of the foreclosed loan and the fair value of the REO’s net assets. As of December 31, 2023, the REO's assets and liabilities met the criteria to be classified as held for sale under ASC 360. As such, depreciation and amortization on the REO and related lease intangibles were suspended.
KREF assumed certain legacy lease arrangements upon the acquisition of the REO assets and entered into lease arrangements during the hold period. These arrangements entitle KREF to receive contractual rent payments during the lease periods and tenant reimbursements for certain property operating expenses, including common area costs, insurance, utilities and real estate taxes. KREF elects the practical expedient to not separate the lease and non-lease components of the rent payments and accounts for these lease arrangements as operating leases.
KKR Real Estate Finance Trust Inc.
Notes to Consolidated Financial Statements
(amount in tables in thousands, except per share amounts)
| | $ | | |
| Real estate owned - land improvements | | | | | | |
|
|
| Real estate owned, net | | | | | | |
| Cash | | | | | | |
In-place lease intangibles(A) | | | | |
Tenant receivables(A) | | | | | | |
Other assets(A) | | | | | | |
| Total | | $ | | | | $ | | |
| Liabilities | | | | |
Unfavorable lease intangibles(B) | | $ | | | | $ | | |
Other liabilities(B) | | | | | | |
| Total | | $ | | | | $ | | |
| | | | |
Real estate owned, held for sale(C) | | | | |
| Assets | | | | |
|
|
|
|
| Real estate owned, held for sale | | $ | | | | $ | | |
|
|
|
)
|
|
|
|
|
|
|
|
|
|
|
|
)) | | |
(A) Final Stated Maturity is determined based on the maximum maturity of the underlying financing agreements or corresponding loans, assuming all extension options in KREF's discretion are exercised. The weighted average life of the match-term facilities was and years, based on the current and final stated maturities, respectively, of the average weighted outstanding principal of collateral loans as of December 31, 2023.
(B) Net of $ million and $ million unamortized deferred financing costs as of December 31, 2023 and 2022, respectively.
(C) Including deferred financing costs and applicable index in effect as of December 31, 2023. Average weighted by the outstanding principal of the collateral.
(D) Borrowings under these repurchase agreements are collateralized by senior loans, held-for-investment, and bear interest equal to the sum of (i) Term SOFR, and (ii) a financing spread. As of December 31, 2023 and 2022, the percentage of the outstanding principal of the collateral sold and not borrowed under these repurchase agreements, or average "haircut" weighted by outstanding principal of collateral, was % and %, respectively (or % and %, respectively, if KREF had borrowed the maximum amount approved by its repurchase agreement counterparties as of such dates).
(E) The term loan facility provides asset-based financing on a non-mark-to-market basis with match-term up to , with additional extension available to KREF.
(F) As of December 31, 2023, the revolver carrying value excluded $ million unamortized debt issuance costs presented within "Other assets" on KREF's Consolidated Balance Sheets.
As of December 31, 2023 and 2022, KREF had outstanding repurchase agreements and term lending agreements where the amount at risk with any individual counterparty, or group of related counterparties, exceeded 10.0% of KREF’s stockholders' equity. The amount at risk under these agreements is the net counterparty exposure, defined as the excess of the carrying amount (or market value, if higher than the carrying amount, for repurchase agreements) of the assets sold under agreement to repurchase, including accrued interest plus any cash or other assets on deposit to secure the repurchase obligation, over the amount of the repurchase liability, adjusted for accrued interest.
KKR Real Estate Finance Trust Inc.
Notes to Consolidated Financial Statements
(amount in tables in thousands, except per share amounts)
| | $ | | | | | % | | | | Morgan Stanley | | | | | | | | | | | |
| KREF Lending IX | | | | | | | | | | | |
| Goldman Sachs | | | | | | | | | | | |
| Total / Weighted Average | | $ | | | | $ | | | | | % | | |
| December 31, 2022 | | | | | | | | |
| Wells Fargo | | $ | | | | $ | | | | | % | | |
| Morgan Stanley | | | | | | | | | | | |
| Goldman Sachs | | | | | | | | | | | |
KREF Lending V(B) | | | | | | | | | | | |
| KREF Lending IX | | | | | | | | | | | |
| Total / Weighted Average | | $ | | | | $ | | | | | % | | |
(A) Average weighted by the outstanding principal of borrowings under the secured financing agreement.
(B) There were multiple counterparties to the KREF Lending V Facility. Morgan Stanley Bank, N.A. represented % of the net counterparty exposure as a percent of stockholders' equity as of December 31, 2022.
Debt obligations included in the tables above are obligations of KREF’s consolidated subsidiaries, which own the related collateral, and such collateral is generally not available to other creditors of KREF.
While KREF is generally not required to post margin under certain repurchase agreement terms for changes in general capital market conditions such as changes in credit spreads or interest rates, KREF may be required to post margin for changes in conditions to specific loans that serve as collateral for those repurchase agreements. Such changes may include declines in the appraised value of property that secures a loan or a negative change in the borrower's ability or willingness to repay a loan. To the extent that KREF is required to post margin, KREF's liquidity could be significantly impacted. Both KREF and its lenders work cooperatively to monitor the performance of the properties and operations related to KREF's loan investments to mitigate investment-specific credit risks. Additionally, KREF incorporates terms in the loans it originates to further mitigate risks related to loan nonperformance.
Activity —
| | Principal borrowings | | | |
| Principal repayments/sales | | () | |
| Deferred debt issuance costs | | () | |
| Amortization of deferred debt issuance costs | | | |
| Balance as of December 31, 2022 | | $ | | |
| Principal borrowings | | | |
| Principal repayments/sales | | () | |
| Deferred debt issuance costs | | () | |
| Amortization of deferred debt issuance costs | | | |
| Balance as of December 31, 2023 | | $ | | |
KKR Real Estate Finance Trust Inc.
Notes to Consolidated Financial Statements
(amount in tables in thousands, except per share amounts)
| | $ | | | | $ | | | | 2025 | | | | | | | | | |
| 2026 | | | | | | | | | |
| 2027 | | | | | | | | | |
| Thereafter | | | | | | | | | |
| | $ | | | | $ | | | | $ | | |
(A) Represents the earlier of (i) the maximum maturity of the underlying loans pledged as collateral or (ii) the maximum maturity of the respective financing agreements.
(B) Except for the Revolver, which is full recourse, amounts borrowed are subject to a maximum % recourse limit. The Revolver matures in March 2027.
Covenants — KREF is required to comply with customary loan covenants and event of default provisions related to its secured financing agreements and Revolver, including, but not limited to, negative covenants relating to restrictions on operations with respect to KREF’s status as a REIT, and financial covenants. Such financial covenants include a trailing four quarter interest income to interest expense ratio covenant ( to 1.0); a consolidated tangible net worth covenant (% of the aggregate cash proceeds of any equity issuances made and any capital contributions received by KREF and certain subsidiaries, or up to approximately $ million depending upon the facility); a cash liquidity covenant (the greater of $ million or % of KREF's recourse indebtedness); and a total indebtedness covenant (% of KREF's Total Assets, as defined in the applicable financing agreements). As of December 31, 2023 and 2022, KREF was in compliance with its financial debt covenants.
KKR Real Estate Finance Trust Inc.
Notes to Consolidated Financial Statements
(amount in tables in thousands, except per share amounts)
Note 6.
reinvestment feature that allows principal proceeds of the collateral assets to be reinvested in qualifying replacement assets, subject to the satisfaction of certain conditions set forth in the indenture. Upon the execution of the KREF 2021-FL2, KREF recorded $ million in issuance costs, inclusive of $ million in structuring and placement agent fees paid to KKR Capital Markets LLC ("KCM"), an affiliate of KREF.
In February 2022, KREF financed a pool of loan participations from its existing multifamily loan portfolio through a managed CLO ("KREF 2022-FL3"). KREF 2022-FL3 provides KREF with match-term financing on a non-mark-to-market and non-recourse basis and has a reinvestment feature. Upon the execution of the KREF 2022-FL3, KREF recorded $ million in issuance costs, inclusive of $ million in structuring and placement agent fees paid to KCM.
The CLO issuance costs are netted against the outstanding principal balance of the CLO notes in "Collateralized loan obligations, net" in the Consolidated Balance Sheets.
| $ | | | | $ | | | | $ | | | | S + % | | July 2026 | | Financing provided | | | | | | | | | | | | | S + % | | February 2039 |
| KREF 2022-FL3 | | | | | | | | | | | | |
Collateral assets(C)(D) | | | | $ | | | | $ | | | | $ | | | | S + % | | September 2026 |
| Financing provided | | | | | | | | | | | | | S + % | | February 2039 |
| | | | | | | | | | | | | | | | | | | | | | | | | | | | | | | | | | | | | | |
| | December 31, 2022 |
| | Count | | Outstanding Principal | | Amortized Cost | | Carrying Value | | Wtd. Avg. Yield/Cost(A) | | Wtd. Avg. Term(B) |
| KREF 2021-FL2 | | | | | | | | | | | | |
Collateral assets(C)(D) | | | | $ | | | | $ | | | | $ | | | | + % | | April 2026 |
| Financing provided | | | | | | | | | | | | | L + % | | February 2039 |
| KREF 2022-FL3 | | | | | | | | | | | | |
Collateral assets(C) | | | | $ | | | | $ | | | | $ | | | | + % | | October 2026 |
| Financing provided | | | | | | | | | | | | | S + % | | February 2039 |
(A) Expressed as a spread over the relevant benchmark rates, which include one-month Term SOFR and LIBOR, as applicable to each loan. As of December 31, 2023, % of the CLO collateral loan assets by principal balance earned a floating rate of interest indexed to Term SOFR. As of December 31, 2022, % and % of the CLO collateral loan assets by principal balance earned a floating rate of interest indexed to one-month Term SOFR and LIBOR, respectively. In addition to cash coupon, yield/cost includes the amortization of deferred origination/financing costs.
(B) Loan term represents weighted-average final maturity, assuming all extension options are exercised by the borrowers, weighted by outstanding principal. Repayments of CLO notes are dependent on timing of underlying collateral loan asset repayments post reinvestment period. The term of the CLO notes represents the rated final distribution date.
(C) Collateral loan assets represent % and % of the principal of KREF's commercial real estate loans as of December 31, 2023 and 2022, respectively. As of December 31, 2023 and 2022, % of KREF loans financed through the CLOs are floating-rate loans.
million cash held in CLO 2022-FL3 as of December 31, 2023. Including $ million cash held in CLO 2021-FL2 as of December 31, 2022
KKR Real Estate Finance Trust Inc.
Notes to Consolidated Financial Statements
(amount in tables in thousands, except per share amounts)
| | $ | | | | Commercial real estate loans, held-for-investment | | | | | | |
| Less: Allowance for credit losses | | () | | | () | |
| Commercial real estate loans, held-for-investment, net | | | | | | |
| Accrued interest receivable | | | | | | |
| Other assets | | | | | | |
| Total | | $ | | | | $ | | |
| Liabilities | | | | |
| Collateralized loan obligations | | $ | | | | $ | | |
| Deferred financing costs | | () | | | () | |
| Collateralized loan obligations, net | | $ | | | | $ | | |
| Accrued interest payable | | | | | | |
|
|
|
|
|
|
|
|
|
|
|
|
|
| | | | | | |
|
|
|
|
|
| | | | $ | | | | $ | | |
In connection with the ATM, KCM, in its capacity as one of the sales agents, will receive commissions for the shares of KREF’s common stock it sells. This amount is not to exceed, but may be less than, % of the gross sales price per share. KREF sold and shares under the ATM through a third-party broker during the years ended December 31, 2023 and 2022, respectively. KREF did incur or pay any commissions to KCM during the years ended December 31, 2023 and 2022.
In connection with the BMO Facility, and in consideration for its services as the structuring agent, KREF is obligated to pay KCM a structuring fee equal to % of the respective committed loan advances under the agreement. Such fees are capitalized as deferred financing cost and amortized to interest expense over the draw period of the facility. KREF paid and $ million KCM structuring fees in connection with the facility during the years ended December 31, 2023 and 2022.
In connection with the HSBC Facility entered into in March 2020, and in consideration for structuring and sourcing this arrangement, KREF is obligated to pay KCM a structuring fee equal to % of the respective committed loan advances under the agreement. Such fees are capitalized as deferred financing cost and amortized to interest expense over the lesser of the initial term of the loan or the facility. During the years ended December 31, 2023 and 2022, KREF did not incur or pay any KCM structuring fees in connection with the facility.
In connection with the Series A Preferred Stock issuance in April 2021 and January 2022, and in consideration for its services as joint bookrunner, KREF incurred and paid KCM $ million and $ million in underwriting discount and commission, respectively. The underwriting discount and commission was settled net of the preferred stock issuance proceeds and recorded as a reduction to additional paid-in-capital in KREF's consolidated financial statements.
In connection with the KREF Lending IX Facility entered into in July 2021, and in consideration for structuring and sourcing this arrangement, KREF is obligated to pay KCM a structuring fee equal to % of the respective committed loan advances under the agreement. Such fees are capitalized as deferred financing cost and amortized to interest expense over the draw period of the facility. During the years ended December 31, 2023 and 2022, KREF paid KCM $ million and $ million in structuring fees in connection with the facility, respectively.
KKR Real Estate Finance Trust Inc.
Notes to Consolidated Financial Statements
(amount in tables in thousands, except per share amounts)
In connection with the extension and upsize of the Revolver in March 2022, and in consideration for its services as the arranger, KREF is obligated to pay KCM an arrangement fee equal to % of the aggregate amount of existing commitments plus % of the aggregate amount of new commitments. KREF paid $ million of arrangement fees in connection with the Revolver in 2022. Such fees were capitalized as deferred financing cost and amortized to interest expense over the estimated life of the Revolver.
In connection with the KREF Lending XI Facility entered into in April 2022, and in consideration for its services as the structuring agent, KREF paid KCM $ million in structuring fees in 2022. Such fees are capitalized as deferred financing cost and amortized to interest expense over the estimated life of the facility.
In connection with the KREF Lending XII Facility entered into in June 2022, and in consideration for structuring and sourcing this arrangement, KREF is obligated to pay KCM a structuring fee equal to % of the respective loan advances under the agreement. KREF paid $ million in KCM structuring fees in connection with the facility in 2022. Such fees are capitalized as deferred financing cost and amortized to interest expense over the draw period of the facility.
In connection with the KREF Lending XIII Facility entered into in August 2022, and in consideration for structuring and sourcing this arrangement, KREF is obligated to pay KCM a structuring fee equal to % of the facility amount under the agreement. KREF paid $ million in KCM structuring fees in connection with the facility in 2022. Such fees are capitalized as deferred financing cost and amortized to interest expense over the draw period of the facility.
In connection with the KREF Lending XIV Facility entered into in October 2022, and in consideration for its services as the structuring agent, KREF paid KCM $ million in structuring fees in 2022. Such fees are capitalized as deferred financing cost and amortized to interest expense over the estimated life of the facility.
KKR Real Estate Finance Trust Inc.
Notes to Consolidated Financial Statements
(amount in tables in thousands, except per share amounts)
Note 15.
| | $ | | | | $ | | | | $ | | | | $ | | | | $ | | | | $ | | | Commercial real estate loans, held-for-investment, net(C) | | | | | | | | | | | | | | | | | | | | |
| Equity method investments | | | | | | | | | | | | | | | | | | | | |
| $ | | | | $ | | | | $ | | | | $ | | | | $ | | | | $ | | | | $ | | |
| Liabilities | | | | | | | | | | | | | |
| Secured financing agreements, net | $ | | | | $ | | | | $ | | | | $ | | | | $ | | | | $ | | | | $ | | |
| Collateralized loan obligations, net | | | | | | | | | | | | | | | | | | | | |
| Secured term loan, net | | | | | | | | | | | | | | | | | | | | |
| $ | | | | $ | | | | $ | | | | $ | | | | $ | | | | $ | | | | $ | | |
(A) The amortized cost of commercial real estate loans is net of $ million of unamortized origination discounts, cost recovery interest and deferred fees. The amortized cost of secured financing agreements is net of $ million unamortized debt issuance costs. The amortized cost of collateralized loan obligations is net of $ million unamortized debt issuance costs.
(B) The carrying value of commercial mortgage loans is net of $ million allowance for credit losses.
(C) Includes $ million of CLO loan participations as of December 31, 2023. Excludes fully written off risk-rated 5 loans with a combined outstanding principal balance of $ million as of December 31, 2023.
The carrying values and fair values of KREF’s financial assets recorded at fair value on a recurring basis, as well as other financial instruments for which fair value is disclosed, as of December 31, 2022, were as follows:
| | | | | | | | | | | | | | | | | | | | | | | | | | | | | | | | | | | | | | | | | | | | |
| | | | | | | | Fair Value |
| | Principal Balance | | Amortized Cost(A) | | Carrying Value(B) | | Level 1 | | Level 2 | | Level 3 | | Total |
| Assets | | | | | | | | | | | | | | |
| Cash and cash equivalents | | $ | | | | $ | | | | $ | | | | $ | | | | $ | | | | $ | | | | $ | | |
Commercial real estate loans, held-for-investment, net(C) | | | | | | | | | | | | | | | | | | | | | |
| Equity method investments | | | | | | | | | | | | | | | | | | | | | |
| | $ | | | | $ | | | | $ | | | | $ | | | | $ | | | | $ | | | | $ | | |
| Liabilities | | | | | | | | | | | | | | |
| Secured financing agreements, net | | $ | | | | $ | | | | $ | | | | $ | | | | $ | | | | $ | | | | $ | | |
| Collateralized loan obligations, net | | | | | | | | | | | | | | | | | | | | | |
| Secured term loan, net | | | | | | | | | | | | | | | | | | | | | |
| Convertible notes, net | | | | | | | | | | | | | | | | | | | | | |
| | $ | | | | $ | | | | $ | | | | $ | | | | $ | | | | $ | | | | $ | | |
(A) The amortized cost of commercial real estate loans is net of $ million of unamortized origination discounts and deferred fees, a $ million write-off on a defaulted senior loan. The amortized cost of secured financing agreements is net of $ million of unamortized debt issuance costs. The amortized cost of collateralized loan obligations is net of $ million of unamortized debt issuance costs.
(B) The carrying value of commercial mortgage loans is net of $ million allowance for credit losses.
million of CLO loan participations as of December 31, 2022. million as of December 31, 2022.
KKR Real Estate Finance Trust Inc.
Notes to Consolidated Financial Statements
(amount in tables in thousands, except per share amounts)
| | Discounted cash flow | | Discount margin | | % | | % - % | | | | | | | Discount rate | | % | | % - % |
| | | | | | Capitalization rate | | % | | % - % |
| | $ | | | | | | | | | | |
| | |
| | |
| | |
(A) An increase (decrease) in the valuation input results in a decrease (increase) in value.
(B) Represents the average of the input value, weighted by the unpaid principal balance of the financial instrument.
(C) KREF carries a $ million investment in an aggregator vehicle alongside RECOP I (Note 9) at its pro rata share of the aggregator's net asset value, which management believes approximates fair value.
(D) Commercial real estate loans are generally valued using a discounted cash flow model using a discount rate derived from relevant market indices and/or estimates of the underlying property's value.
Assets and Liabilities Measured at Fair Value on a Nonrecurring Basis
Certain assets not measured at fair value on an ongoing basis but subject to fair value adjustments only in certain circumstances, such as when there is evidence of impairment, are measured at fair value on a nonrecurring basis. KREF measures commercial real estate loans held-for-sale at the lower of cost or fair value and may be required, from time to time, to record a nonrecurring fair value adjustment. KREF measures commercial real estate loans held-for-investment at amortized cost, but may be required, from time to time, to record a nonrecurring fair value adjustment in the form of a valuation provision or impairment.
Assets and Liabilities for Which Fair Value is Only Disclosed
KREF does not carry its secured financing agreements at fair value as management did not elect the fair value option for these liabilities. As of December 31, 2023, the fair value of KREF's financing facilities approximated their respective carrying value.
KKR Real Estate Finance Trust Inc.
Notes to Consolidated Financial Statements
(amount in tables in thousands, except per share amounts)
Note 16.
million, $ million and $ million, respectively, related to the operations of its taxable REIT subsidiaries and various other state and local taxes. There were material deferred tax assets or liabilities as of December 31, 2023 and 2022.
% | | | % | | | % | | | % |
| 2022 | | | | | | | | | | | | |
| 2021 | | | | | | | | | | | | |
| 2020 | | | | | | | | | | | | |
|
KKR Real Estate Finance Trust Inc.
Notes to Consolidated Financial Statements
(amount in tables in thousands, except per share amounts)
Note 17.
million in principal repayments, comprised of a full loan repayment of $ million on a senior office loan in Washington, D.C. and a full loan repayment of $ million on a senior condo loan in New York, NY.
Corporate Activities
Dividends
In January 2024, KREF paid $ million in dividends on its common stock, or $ per share, with respect to the fourth quarter of 2023, to stockholders of record on December 29, 2023.
On February 1, 2024, KREF’s Board of Directors declared a dividend of $ per share of common stock with respect to the first quarter of 2024. The dividend is payable on April 15, 2024 to KREF’s common stockholders of record as of March 28, 2024.
KKR Real Estate Finance Trust Inc.
Notes to Consolidated Financial Statements
(amount in tables in thousands, except per share amounts)
Note 18.
| | $ | | | | $ | | | | $ | | | | $ | | |
| Interest expense | | | | | | | | | | | | | | |
| Total net interest income | | | | | | | | | | | | | | |
| Other Income | | | | | | | | | | | | | | |
| Operating Expenses | | | | | | | | | | | | | | |
Income (Loss) Before Income Taxes, Noncontrolling Interests, Preferred Dividends and Participating Securities' Share in Earnings | () | | | () | | | | | | () | | | () | |
| Income tax expense | | | | | | | | | | | | | | |
| Net Income (Loss) | $ | () | | | $ | () | | | $ | | | | $ | () | | | $ | () | |
| Noncontrolling interests in income (loss) of consolidated joint venture | () | | | () | | | () | | | () | | | () | |
| Net Income (Loss) Attributable to KKR Real Estate Finance Trust Inc. and Subsidiaries | $ | () | | | $ | () | | | $ | | | | $ | () | | | $ | () | |
| Preferred stock dividends | | | | | | | | | | | | | | |
Participating securities' share in earnings | | | | | | | | | | | | | | |
| Net Income (Loss) Attributable to Common Stockholders | $ | () | | | $ | () | | | $ | | | | $ | () | | | $ | () | |
| | | | | | | | | |
| Net Income (Loss) Per Share of Common Stock | | | | | | | | | |
| Basic and Diluted | $ | () | | | $ | () | | | $ | | | | $ | () | | | $ | () | |
| |
| | | | | | | | | |
| Weighted Average Number of Shares of Common Stock Outstanding | | | | | | | | | |
| Basic and Diluted | | | | | | | | | | | | | | |
| |
KKR Real Estate Finance Trust Inc.
Notes to Consolidated Financial Statements
(amount in tables in thousands, except per share amounts)
| | $ | | | | $ | | | | $ | | | | $ | | |
| Interest expense | | | | | | | | | | | | | | |
| Total net interest income | | | | | | | | | | | | | | |
| Other Income | | | | | | | | | | | | | | |
| Operating Expenses | | | | | | | | | | | | | | |
Income (Loss) Before Income Taxes, Noncontrolling Interests, Preferred Dividends and Participating Securities' Share in Earnings | | | | | | | () | | | | | | | |
| Income tax expense | | | | | | | | | | | | | | |
| Net Income (Loss) | $ | | | | $ | | | | $ | () | | | $ | | | | $ | | |
| Noncontrolling interests in income (loss) of consolidated joint venture | () | | | () | | | () | | | () | | | () | |
| Net Income (Loss) Attributable to KKR Real Estate Finance Trust Inc. and Subsidiaries | $ | | | | $ | | | | $ | () | | | $ | | | | $ | | |
| Preferred stock dividends | | | | | | | | | | | | | | |
| Participating securities' share in earnings | | | | | | | | | | | | | | |
| Net Income (Loss) Attributable to Common Stockholders | $ | | | | $ | | | | $ | () | | | $ | | | | $ | | |
| | | | | | | | | |
| Net Income (Loss) Per Share of Common Stock | | | | | | | | | |
| Basic | $ | | | | $ | | | | $ | () | | | $ | | | | $ | | |
| Diluted | $ | | | | $ | | | | $ | () | | | $ | | | | $ | | |
| | | | | | | | | |
| Weighted Average Number of Shares of Common Stock Outstanding | | | | | | | | | |
| Basic | | | | | | | | | | | | | | |
| Diluted | | | | | | | | | | | | | | |
| |
Schedule IV - Mortgage Loans on Real Estate
December 31, 2023
(dollars in millions)
| October 2026 | | I/O | | $ | | | | $ | | |
| Senior Loan 2 | | Industrial / Various | | + | % | | May 2027 | | I/O | | | | | | |
| Senior Loan 3 | | Multifamily / California | | + | % | | March 2026 | | I/O | | | | | |
| Senior Loans less than 3% of the carrying amount of total loans | | | | | | | | |
| Senior Loans | | Multifamily / Diversified | | + | % | — | % | | 2024 - 2027 | | I/O | | | | | | |
| Senior Loans | | Office / Diversified | | + | % | — | % | | 2025 - 2028 | | I/O | | | | | | |
| Senior Loans | | Industrial / Diversified | | + | % | — | % | | 2024 - 2027 | | I/O | | | | | | |
| Senior Loans | | Life Science / Diversified | | + | % | — | % | | 2026 - 2027 | | I/O | | | | | | |
| Senior Loans | | Hospitality / Diversified | | + | % | — | % | | 2024 - 2027 | | I/O | | | | | | |
| Senior Loan | | Condo (Residential) / New York | | + | % | | January 2024 | | I/O | | | | | | |
| Senior Loan | | Self-Storage / Various | | + | % | | January 2028 | | I/O | | | | | | |
| Senior Loan | | Student Housing / Pennsylvania | | + | % | | June 2026 | | I/O | | | | | | |
| Senior Loan | | Single Family Rental / Arizona | | + | % | | May 2026 | | I/O | | | | | | |
| | | | | | | |
|
|
|
|
| Date: | February 6, 2024 | By: | /s/ Terrence R. Ahern |
| | | Name: Terrence R. Ahern |
| | | Title: Director |
| | | |
| Date: | February 6, 2024 | By: | /s/ Jonathan A. Langer |
| | | Name: Jonathan A. Langer |
| | | Title: Director |
| | | |
| Date: | February 6, 2024 | By: | /s/ Deborah H. McAneny |
| | | Name: Deborah H. McAneny |
| | | Title: Director |
| | | |
| Date: | February 6, 2024 | By: | /s/ Irene M. Esteves |
| | | Name: Irene M. Esteves |
| | | Title: Director |
| | | |
| Date: | February 6, 2024 | By: | /s/ Paula Madoff |
| | | Name: Paula Madoff |
| | | Title: Director |

Similar companies
See also AMERICAN TOWER CORP /MA/ -
Annual report 2024 (10-K 2024-12-31)
Annual report 2025 (10-Q 2025-06-30)
See also Prologis, Inc. -
Annual report 2022 (10-K 2022-12-31)
Annual report 2023 (10-Q 2023-09-30)
See also CROWN CASTLE INC. -
Annual report 2022 (10-K 2022-12-31)
Annual report 2023 (10-Q 2023-09-30)
See also EQUINIX INC -
Annual report 2022 (10-K/A 2022-12-31)
Annual report 2023 (10-Q 2023-09-30)
See also Public Storage -
Annual report 2022 (10-K 2022-12-31)
Annual report 2023 (10-Q 2023-09-30)