|
|
|
|
|
|
| CSPV | Crystalline Silicon Photovoltaic |
| CWIP | Construction work in progress |
| D.C. Circuit | United States Court of Appeals for the District of Columbia Circuit |
| DECON | Decommissioning method where radioactive contamination is removed and safely disposed of at a requisite facility or decontaminated to a permitted level |
| DRIP | Dividend Reinvestment Program |
| EEI | Edison Electric Institute |
| EIP | Energy Impact Partners |
|
| EMANI | European Mutual Association for Nuclear Insurance |
| EPS | Earnings per share |
|
| ETR | Effective tax rate |
|
|
|
| FTR | Financial transmission right |
| GAAP | Generally accepted accounting principles |
| GE | General Electric |
| GHG | Greenhouse gas |
| HDD | Heating degree-days |
| INPO | Institute of Nuclear Power Operations |
|
|
| IPP | Independent power producing entity |
| IRP | Integrated Resource Plan |
| ISO | Independent System Operator |
| ITC | Investment Tax Credit |
| JTIQ | Joint Target Interconnection Queue |
| LP&L | Lubbock Power & Light |
|
| MGP | Manufactured gas plant |
| MISO | Midcontinent Independent System Operator, Inc. |
|
| Native load | Demand of retail and wholesale customers that a utility has an obligation to serve under statute or contract |
| NAV | Net asset value |
| NEIL | Nuclear Electric Insurance Ltd. |
| NOL | Net operating loss |
| NOx | Nitrogen Oxides |
| O&M | Operating and maintenance |
|
| OATT | Open Access Transmission Tariff |
| ONES | Operations, Nuclear, Environmental and Safety |
| PFAS | Per- and Polyfluoroalkyl Substances |
| PI | Prairie Island nuclear generating plant |
| PIM | Performance Incentive Mechanism |
| Post-65 | Post-Medicare |
| PPA | Power purchase agreement |
| Pre-65 | Pre-Medicare |
| PTC | Production tax credit |
| RDF | Refuse-derived fuel |
| REC | Renewable energy credit |
| RFP | Request for proposal |
| ROE | Return on equity |
| | | | | |
| ROU | Right-of-use |
| RTO | Regional Transmission Organization |
| S&P | Standard & Poor’s Global Ratings |
| SERP | Supplemental executive retirement plan |
|
| SPP | Southwest Power Pool, Inc. |
| TCJA | 2017 federal tax reform enacted as Public Law No: 115-97, commonly referred to as the Tax Cuts and Jobs Act |
| THI | Temperature-humidity index |
| TSR | Total shareholder return |
| VaR | Value at Risk |
| VIE | Variable interest entity |
| WACC | Weighted Average Cost of Capital |
| | | | | |
| Measurements |
| Bcf | Billion cubic feet |
| KV | Kilovolts |
| KWh | Kilowatt hours |
| MMBtu | Million British thermal units |
| MW | Megawatts |
| MWh | Megawatt hours |
| | |
Where to Find More Information |
Xcel Energy’s website address is www.xcelenergy.com. Xcel Energy makes available through its website, free of charge, its annual report on Form 10-K, quarterly reports on Form 10-Q, current reports on Form 8-K and all amendments to those reports filed or furnished pursuant to Section 13(a) or 15(d) of the Securities Exchange Act of 1934 as soon as reasonably practicable after the reports are electronically filed with or furnished to the SEC.
The SEC maintains an internet site that contains reports, proxy and information statements, and other information regarding issuers that file electronically at http://www.sec.gov. The information on Xcel Energy’s website is not a part of, or incorporated by reference in, this annual report on Form 10-K. Xcel Energy intends to make future announcements regarding Company developments and financial performance through its website, www.xcelenergy.com, as well as through press releases, filings with the SEC, conference calls and webcasts.
| | |
Forward-Looking Statements |
Except for the historical statements contained in this report, the matters discussed herein are forward-looking statements that are subject to certain risks, uncertainties and assumptions. Such forward-looking statements, including those relating to 2024 EPS guidance, long-term EPS and dividend growth rate objectives, future sales, future expenses, future tax rates, future operating performance, estimated base capital expenditures and financing plans, projected capital additions and forecasted annual revenue requirements with respect to rider filings, expected rate increases to customers, expectations and intentions regarding regulatory proceedings, and expected impact on our results of operations, financial condition and cash flows of resettlement calculations and credit losses relating to certain energy transactions, as well as assumptions and other statements are intended to be identified in this document by the words “anticipate,” “believe,” “could,” “estimate,” “expect,” “intend,” “may,” “objective,” “outlook,” “plan,” “project,” “possible,” “potential,” “should,” “will,” “would” and similar expressions. Actual results may vary materially. Forward-looking statements speak only as of the date they are made, and we expressly disclaim any obligation to update any forward-looking information. The following factors, in addition to those discussed elsewhere in this Annual Report on Form 10-K for the fiscal year ended Dec. 31, 2023 (including risk factors listed from time to time by Xcel Energy Inc. in reports filed with the SEC, including “Risk Factors” in Item 1A of this Annual Report on Form 10-K), could cause actual results to differ materially from management expectations as suggested by such forward-looking information: operational safety, including our nuclear generation facilities and other utility operations; successful long-term operational planning; commodity risks associated with energy markets and production; rising energy prices and fuel costs; qualified employee workforce and third-party contractor factors; violations of our Codes of Conduct; our ability to recover costs and our subsidiaries’ ability to recover costs from customers; changes in regulation; reductions in our credit ratings and the cost of maintaining certain contractual relationships; general economic conditions, including recessionary conditions, inflation rates, monetary fluctuations, supply chain constraints and their impact on capital expenditures and/or the ability of Xcel Energy Inc. and its subsidiaries to obtain financing on favorable terms; availability or cost of capital; our customers’ and counterparties’ ability to pay their debts to us; assumptions and costs relating to funding our employee benefit plans and health care benefits; our subsidiaries’ ability to make dividend payments; tax laws; uncertainty regarding epidemics, the duration and magnitude of business restrictions including shutdowns (domestically and globally), the potential impact on the workforce, including shortages of employees or third-party contractors due to quarantine policies, vaccination requirements or government restrictions, impacts on the transportation of goods and the generalized impact on the economy; effects of geopolitical events, including war and acts of terrorism; cybersecurity threats and data security breaches; seasonal weather patterns; changes in environmental laws and regulations; climate change and other weather events; natural disaster and resource depletion, including compliance with any accompanying legislative and regulatory changes; costs of potential regulatory penalties and wildfire damages in excess of liability insurance coverage; regulatory changes and/or limitations related to the use of natural gas as an energy source; challenging labor market conditions and our ability to attract and retain a qualified workforce; and our ability to execute on our strategies or achieve expectations related to environmental, social and governance matters including as a result of evolving legal, regulatory and other standards, processes, and assumptions, the pace of scientific and technological developments, increased costs, the availability of requisite financing, and changes in carbon markets.
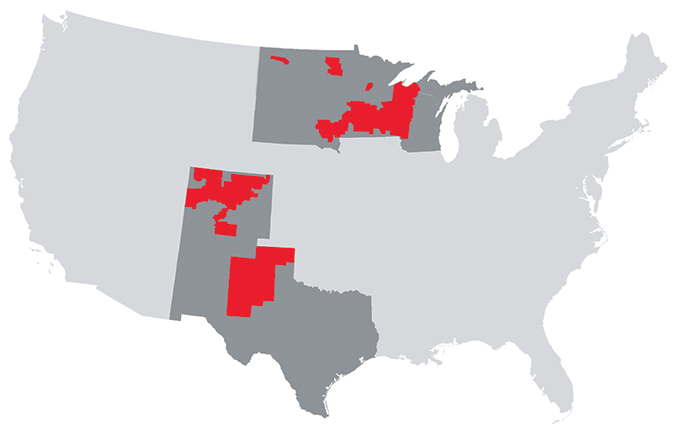
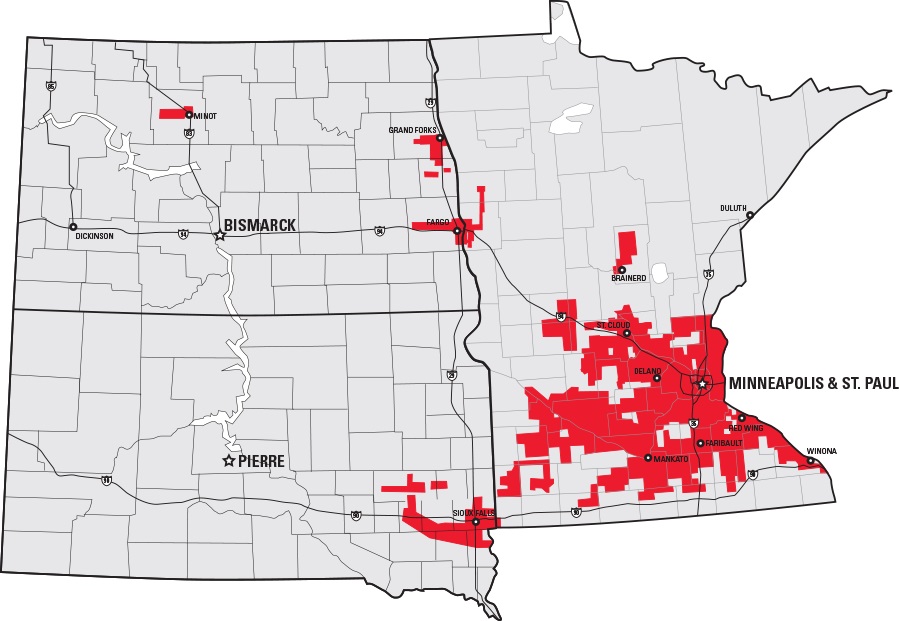
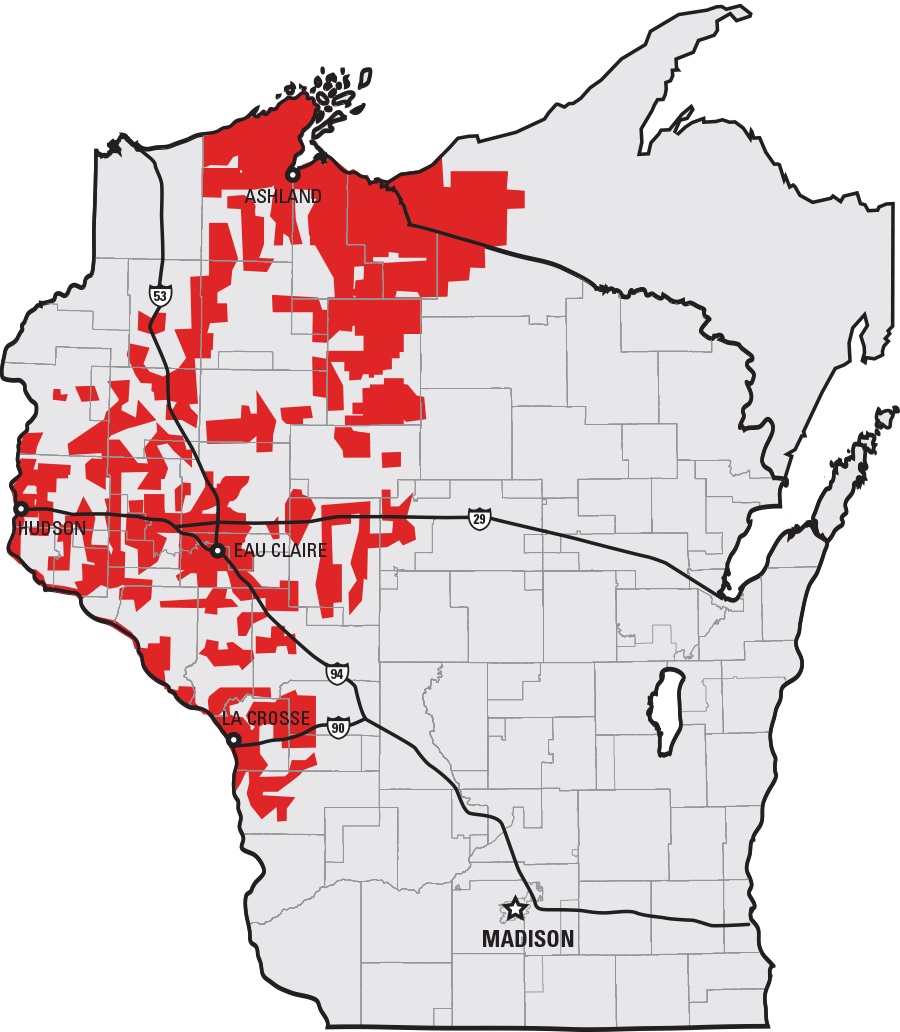
Xcel Energy (the “Company”) is a major U.S. regulated electric and natural gas delivery company headquartered in Minneapolis, Minnesota (incorporated in Minnesota in 1909). The Company serves customers in eight states, including portions of Colorado, Michigan, Minnesota, New Mexico, North Dakota, South Dakota, Texas and Wisconsin. Xcel Energy provides a comprehensive portfolio of energy-related products and services to approximately 3.8 million electric customers and 2.2 million natural gas customers through four utility subsidiaries (i.e., NSP-Minnesota, NSP-Wisconsin, PSCo and SPS). Along with the utility subsidiaries, the transmission-only subsidiaries, WYCO (a joint venture formed with CIG to develop and lease natural gas pipelines, storage and compression facilities) and WGI (an interstate natural gas pipeline company) comprise the regulated utility operations. The Company’s nonregulated subsidiaries include Eloigne, Capital Services, Venture Holdings and Nicollet Project Holdings.
| | | | | | | | |
| Subsidiary / Affiliate | | Function |
| NSP-Minnesota | | Electric & Gas |
| NSP-Wisconsin | | Electric & Gas |
| PSCo | | Electric & Gas |
| SPS | | Electric |
| WGI | | Interstate gas pipeline |
| WYCO | | Gas storage and transportation |
| Other Subsidiaries | | See Note 1 to the consolidated financial statements for further information. |
| | | | | | | | |
| Utility Subsidiary Overview | | |
| Electric customers | | 3.8 million |
| Natural gas customers | | 2.2 million |
| Total assets | | $64 billion |
| Electric generating capacity | | 20,935 MW |
| Natural gas storage capacity | | 53.5 Bcf |
| Electric transmission lines (conductor miles) | | 111,000 miles |
| Electric distribution lines (conductor miles) | | 216,000 miles |
| Natural gas transmission lines | | 2,200 miles |
| Natural gas distribution lines | | 37,000 miles |
Xcel Energy’s vision is to be the preferred and trusted provider of the energy our customers need. We will deliver on this vision while offering a competitive total return to shareholders. Our mission is to provide our customers with safe, clean, reliable energy services they want and value at a competitive price.
We execute on our vision and mission through three strategic priorities.
| | | | | | | | |
| LEAD THE CLEAN ENERGY TRANSITION | ENHANCE THE CUSTOMER EXPERIENCE | KEEP BILLS LOW |
Our employees are guided by four corporate values: Connected, Committed, Safe, and Trustworthy.
Our values, culture and Code of Conduct serve as the foundation upon which Xcel Energy’s employees, Board of Directors, contractors and suppliers approach their work in delivering on our three strategic priorities.
Deliver a Competitive Total Return to Investors
Successful strategy execution, along with our disciplined approach to growth, operations and management of environmental, social and governance issues, positions us to continue delivering a competitive TSR.
We have consistently achieved our financial objectives, meeting or exceeding our initial ongoing earnings guidance range for 19 consecutive years and delivering dividend growth for 21 consecutive years.
Over the past five years, ongoing earnings per share have grown annually by 6.3% and our dividend per share by 6.5% annually. Xcel Energy works to maintain senior secured debt credit ratings in the A range and senior unsecured debt credit ratings in the BBB+ to A range.
LEAD THE CLEAN ENERGY TRANSITION
Xcel Energy manages the risk of climate change and has worked to meet the increasing demand for cleaner energy for over 20 years.
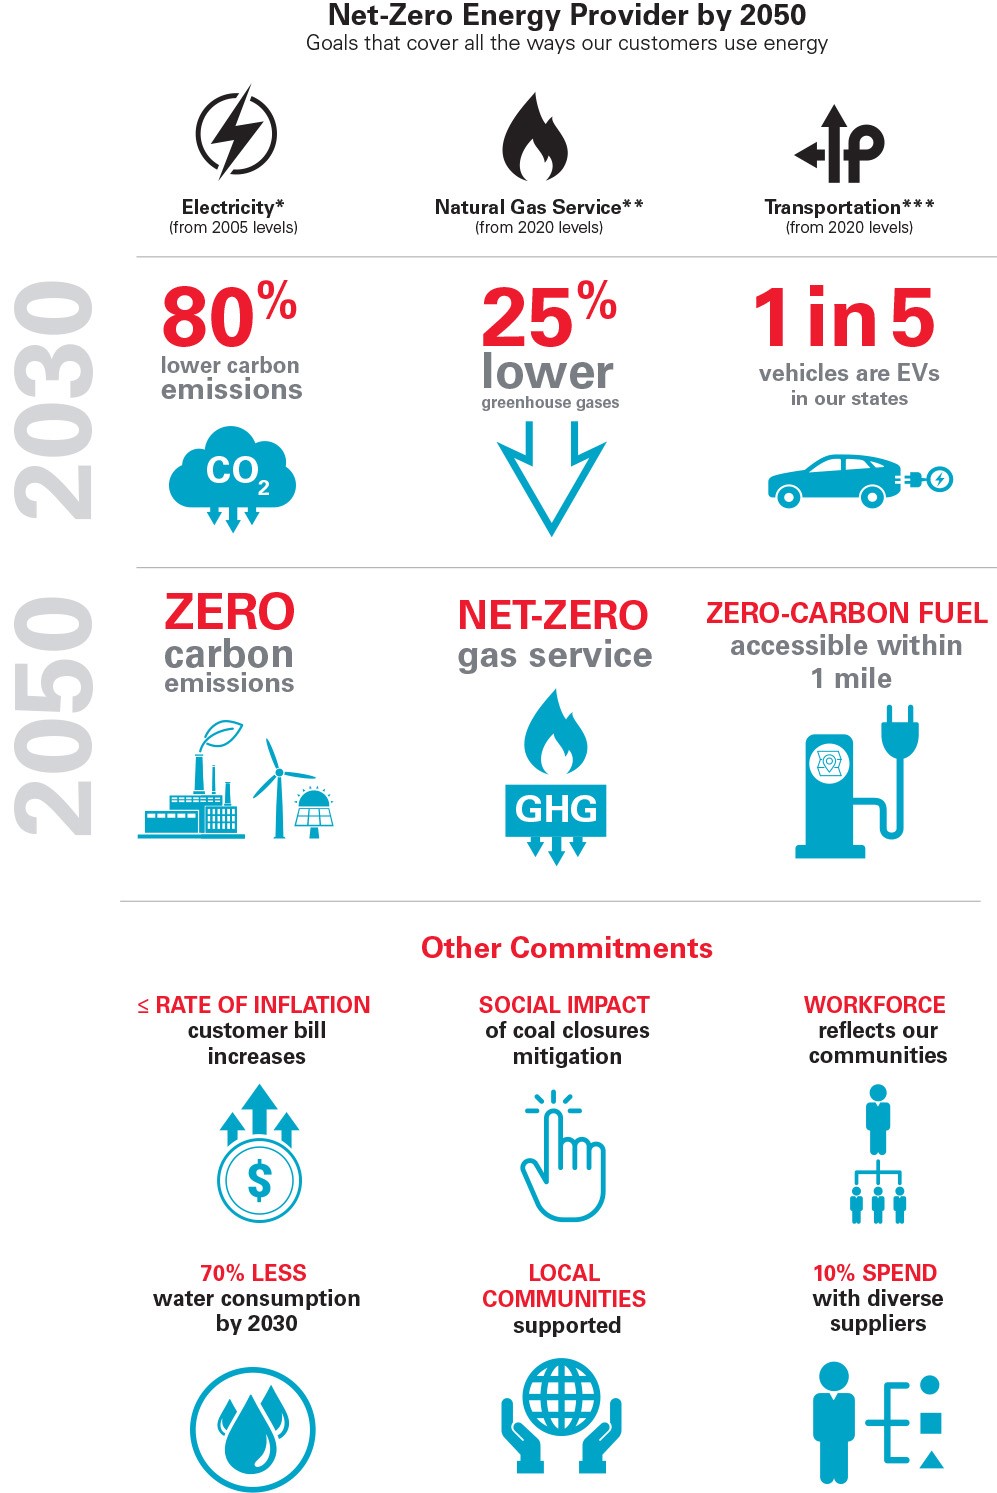
Our sustainability commitments are summarized as follows:
*Companywide goal; work also underway to meet state clean energy goals in our service area.
**Spans natural gas supply, delivery and customer use.
***Includes Xcel Energy fleet; zero-carbon fuel is carbon free electricity or other clean energy.
Carbon-free Electricity by 2050
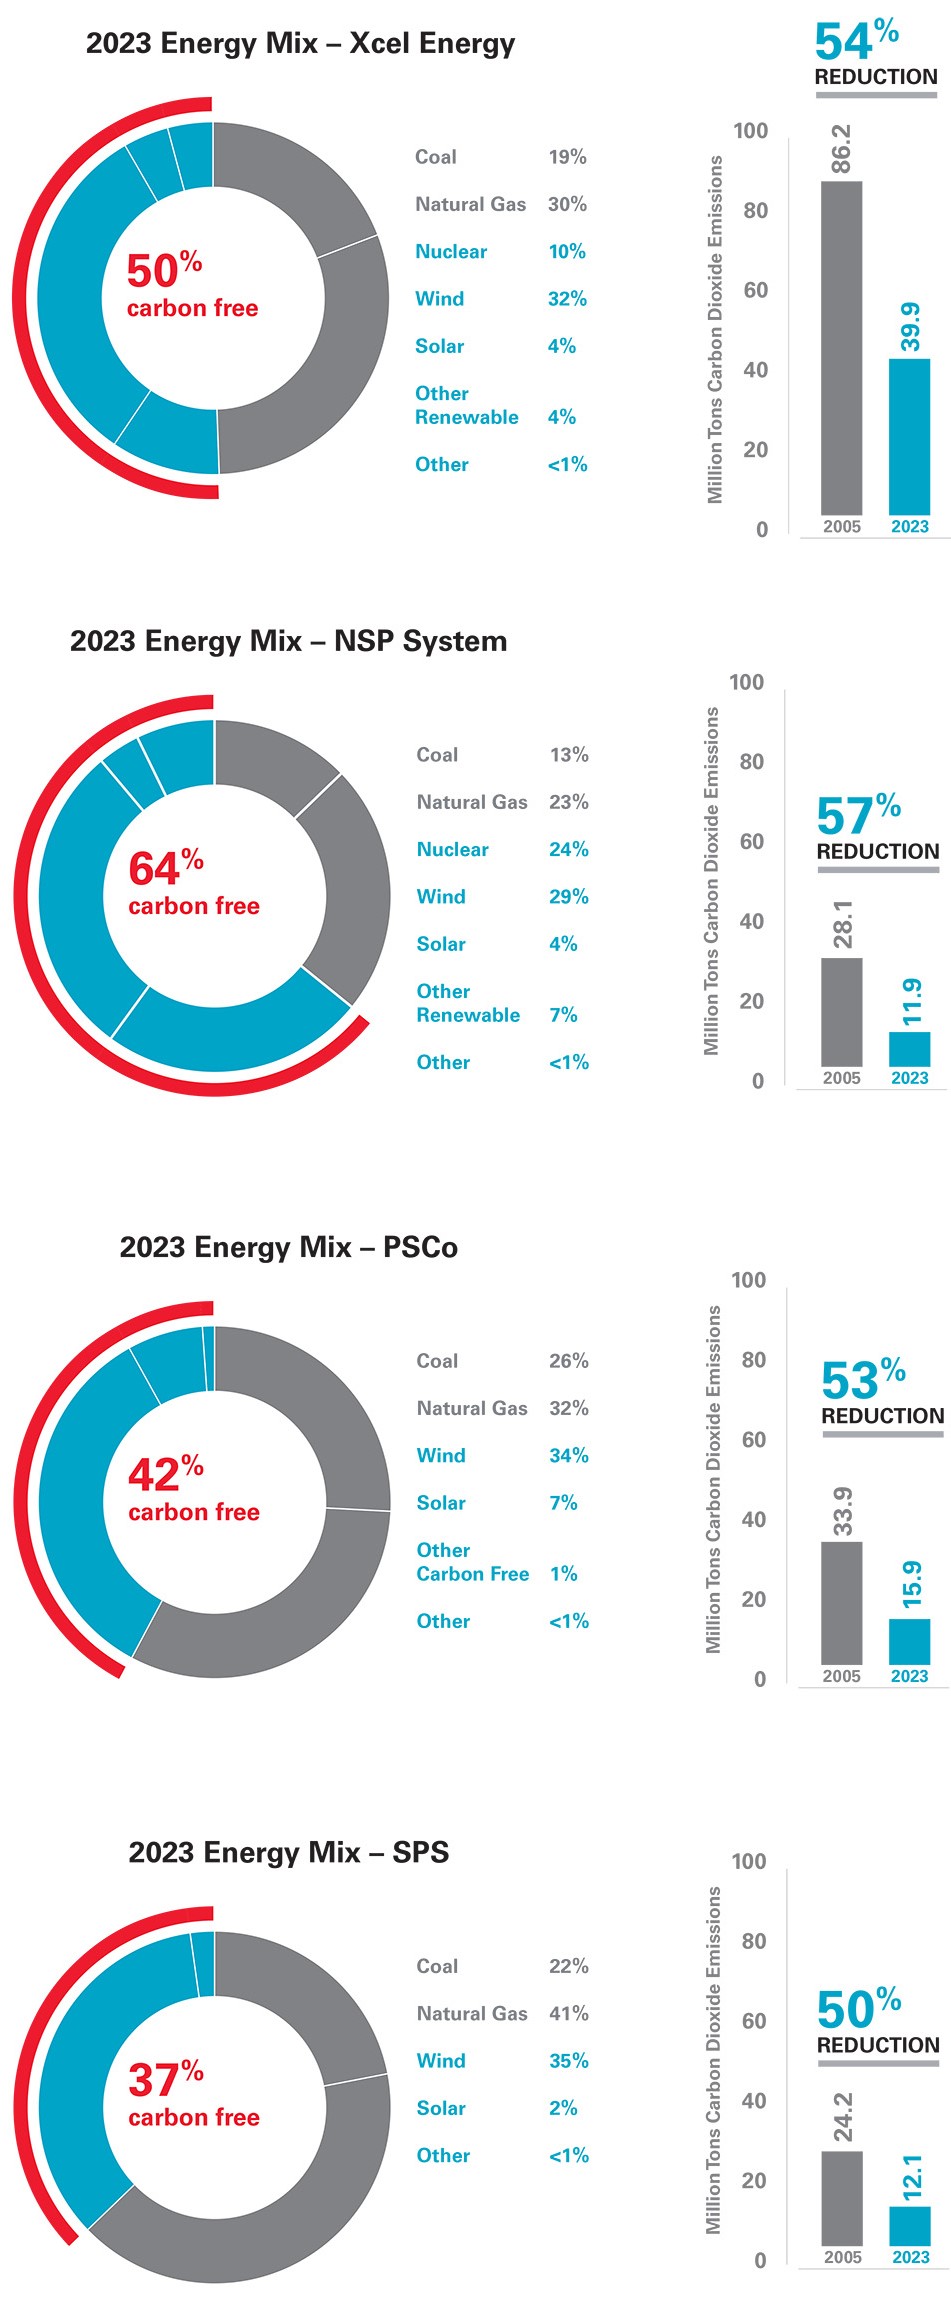
Xcel Energy was the first U.S. utility to establish a carbon-free vision, targeting 100% carbon-free electricity by 2050 with an interim goal to reduce carbon emissions 80% by 2030 (from 2005 levels), including owned and purchased power. A lead author for the Intergovernmental Panel on Climate Change (IPCC) confirmed that our vision aligns with science-based scenarios likely to limit global warming to 1.5 degrees Celsius from pre-industrial levels, in alignment with the Paris Climate Accords.
The pace of achieving a carbon-free vision is also governed by reliability and customer affordability. Our approved resource plans outline a clear, transparent path for reducing carbon emissions by 80% using current technologies, while maintaining customer bill increases at or below the rate of inflation. Moving from 80% carbon reduction to 100% carbon-free electricity will require new, dispatchable technologies that are economically viable, as well as supportive public policy.
See Item 1A for risks and uncertainties related to strategic and sustainability goals and objectives.
Xcel Energy’s operating footprint includes some of the best wind and solar resources in the country, providing for higher capacity factors and lower operating costs. Our “Steel for Fuel” strategy reduces costs for our customers by taking advantage of these higher capacity factors along with savings provided by renewable tax credits and avoided fuel costs that mitigate higher cost fossil generation.
Through 2023, we reduced carbon emissions from generation serving customers by an estimated 54% (from 2005 levels) and remain on track to achieve 80% carbon reduction and fully exit coal by the end of 2030. At the same time, our Steel for Fuel strategy has saved customers nearly $4 billion since 2017.
Xcel Energy’s wind capacity is now over 11,000 MW, including nearly 4,500 MW of owned wind. In Colorado, we anticipate adding an additional 1,850 MW of wind, 1,700 MW of solar, 1,850 MW of storage and 650 MW of gas generation to ensure reliability on our system by 2028. In Minnesota, we have approvals for more than 700 MW of new solar at our Sherco facility, making it one of the largest solar facilities in the country. In 2024, we filed our NSP Resource Plan, which proposes adding 3,600 MW of new wind and solar, 600 MW of battery storage and 2,200 MW of dispatchable resources by 2030, pending Commission approval. In SPS, we filed for approval of 400 MW of solar generation, a 200 MW PPA and a broader system IRP, which could include between 5,000 to 10,000 MW of new generation by 2030.
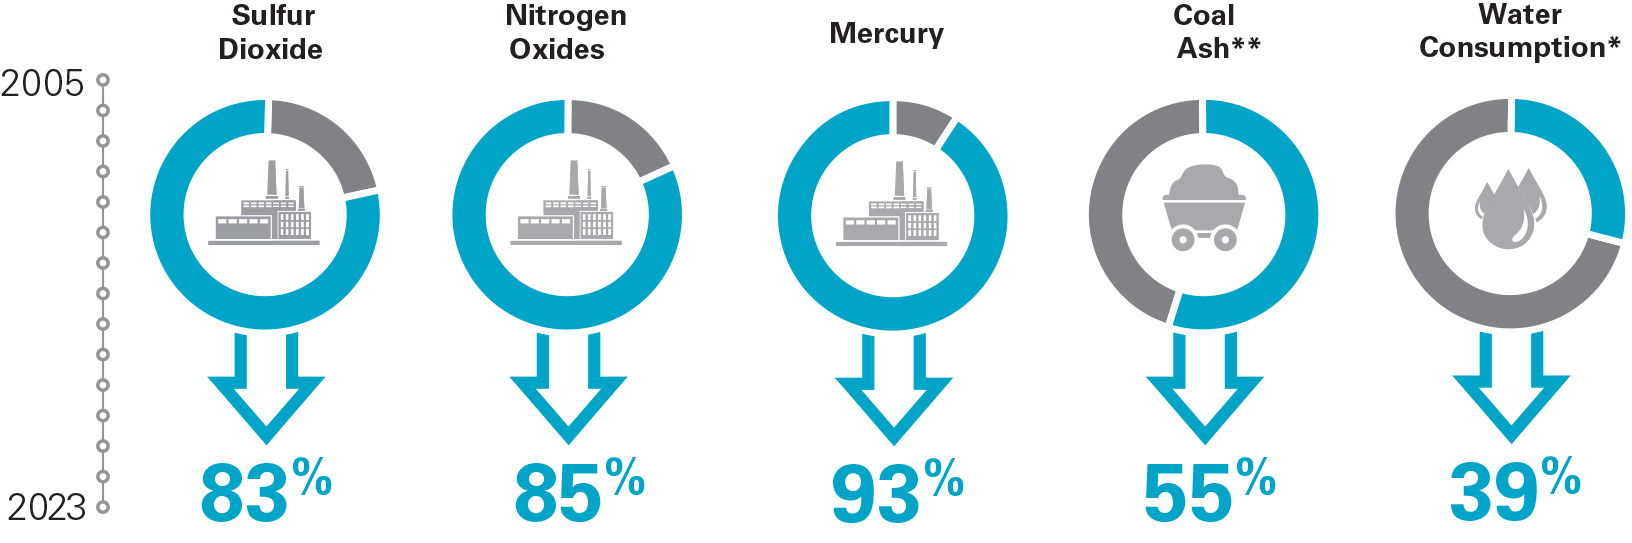
Beyond carbon, we have significantly reduced other emissions and environmental impacts, including:
*Reductions in water consumption are from owned and purchased electricity that serves our customers. All other reductions are from owned generating plants.
**Coal ash and water consumption data are as of 2022.
As we prepare for early coal plant retirements, employees are provided advanced notice and offered retraining and relocation opportunities. To date, we have been successful in avoiding layoffs associated with our early coal plant retirements. We also help foster economic development opportunities to offset community impacts associated with coal plant closures. Xcel Energy has a long track record of working with our communities on energy, climate and environmental initiatives that impact them and has publicly committed to furthering environmental justice.
Significant investment in our transmission and distribution systems is essential to ensure resiliency and reliability for customers through the clean energy transition. We have nearly $12 billion in our 2024 - 2028 capital plan focused specifically on this, including our $1.7 billion Pathway project in Colorado, and additional investments to further support our recently approved Colorado resource portfolio. As part of MISO’s planned transmission expansion over the next decade, Xcel Energy has been awarded $1.2 billion of projects as part of Tranche 1. We anticipate MISO Tranche 2 awards in 2024.
Natural Gas Use in Buildings – Net-Zero GHG by 2050
Xcel Energy is committed to reducing GHG emissions 25% by 2030 (from 2020 levels) and provide net-zero natural gas service by 2050 from the supply, distribution and end-use of natural gas. In 2023, we filed our Clean Heat Plan in Colorado and Natural Gas Innovation Plan in Minnesota, which provide a framework for this transition.
Similar to our electric plan, the lead author for the IPCC confirmed our vision to deliver natural gas service with net-zero emissions by 2050 aligns with science-based scenarios likely to limit global warming by 1.5 C.
Our net-zero natural gas frameworks include the following priorities:
•Work with suppliers to purchase only low emissions gas by 2030.
•Operate the cleanest possible system to achieve net-zero methane emissions on the system by 2030.
•Offer customer options for conservation, beneficial electrification, and clean fuels such as hydrogen and renewable natural gas.
•Apply high-quality carbon offsets through projects that remove emissions while providing additional environmental and social benefit.
Electrification of the Transportation Sector
We are also helping reduce carbon emissions in other sectors, including transportation. We aim to enable one out of five vehicles in our service areas to be electric by 2030, representing nearly $2 billion of investment, 0.6% - 0.7% of average incremental annual retail sales growth and avoidance of roughly 5 million tons of CO2 emissions annually. By 2050, our vision is to run all vehicles in our service area with carbon-free electricity or other clean energy. We have approved, transportation electrification programs and plans in Colorado, New Mexico, Minnesota and Wisconsin and updated transportation plans pending commission approval in Minnesota and Colorado.
Innovation and Policy
In 2023, the Department of Energy announced awards of nearly $1.5 billion to support multiple Xcel Energy affiliated projects. The Heartland Hydrogen Hub, which includes multiple projects from Xcel Energy and others in the Upper Midwest, received an award of up to $925 million by the DOE. This funding will serve as a catalyst for a clean hydrogen ecosystem in the region. The DOE also awarded Xcel Energy up to $70 million to support our two 10-MW, 100-hour battery pilots with Form Energy. Combined with grants committed by Breakthrough Energy Catalyst, we have secured up to $90 million to support these long duration energy storage pilots, a critical asset class to ensure cost effective reliability in a high-renewable grid.
Xcel Energy was selected as part of two different awards from the DOE’s Grid Resilience and Innovation Partnership program. The DOE awarded Xcel Energy $100 million to support projects to mitigate the threat of wildfires and ensure resiliency of the grid through extreme weather. Xcel Energy was also party to GRIP’s $464 million grant to expand transmission as part of the MISO and SPP program to fund high-voltage transmission to improve inter-regional transfer capability, reliability and resolve grid constraints.
Xcel Energy actively engages in wildfire mitigation activities across our operating territories. For the past three years, we have operated under a commission-approved wildfire plan in Colorado. We are currently evaluating updates to these plans with a wide range of options for consideration including new technologies, undergrounding, additional vegetation management, composite poles, selective use of covered conductor and preventative power system shutoffs.
Sustainability Governance and Oversight
In 2000, we instituted oversight of environmental performance by the Board of Directors and were among the first U.S. energy providers to tie carbon reduction to executive compensation more than 15 years ago.
Xcel Energy has provided a voluntary, third-party verified annual GHG disclosure since 2005, longer than any other U.S. utility. We are a founding member of The Climate Registry and a supporter of the Task Force on Climate-Related Financial Disclosures. Our disclosures also align with the Global Reporting Initiative, Sustainability Accounting Standards Board and United Nations Sustainable Development Goals frameworks.
ENHANCE THE CUSTOMER EXPERIENCE
Xcel Energy has invested more than $2 billion over the past decade in a portfolio of renewable and conservation programs that provide customers with clean energy options and help keep bills low. New demand remains robust in our territories, including load growth from new data centers, industrial electrification and electric vehicle adoption. As such, we are transforming and expanding our electric grid to accommodate load growth, renewable energy and distributed energy resources.
We are in the process of installing smart electric meters, which will deliver customer and operational benefits, providing near-real-time communication, allowing customers to know how much energy they are using and what it will cost. In addition, customers will have new digital tools to make it easier to access their energy information, gain useful insights to understand and manage their energy use and make energy choices that lower their bills.
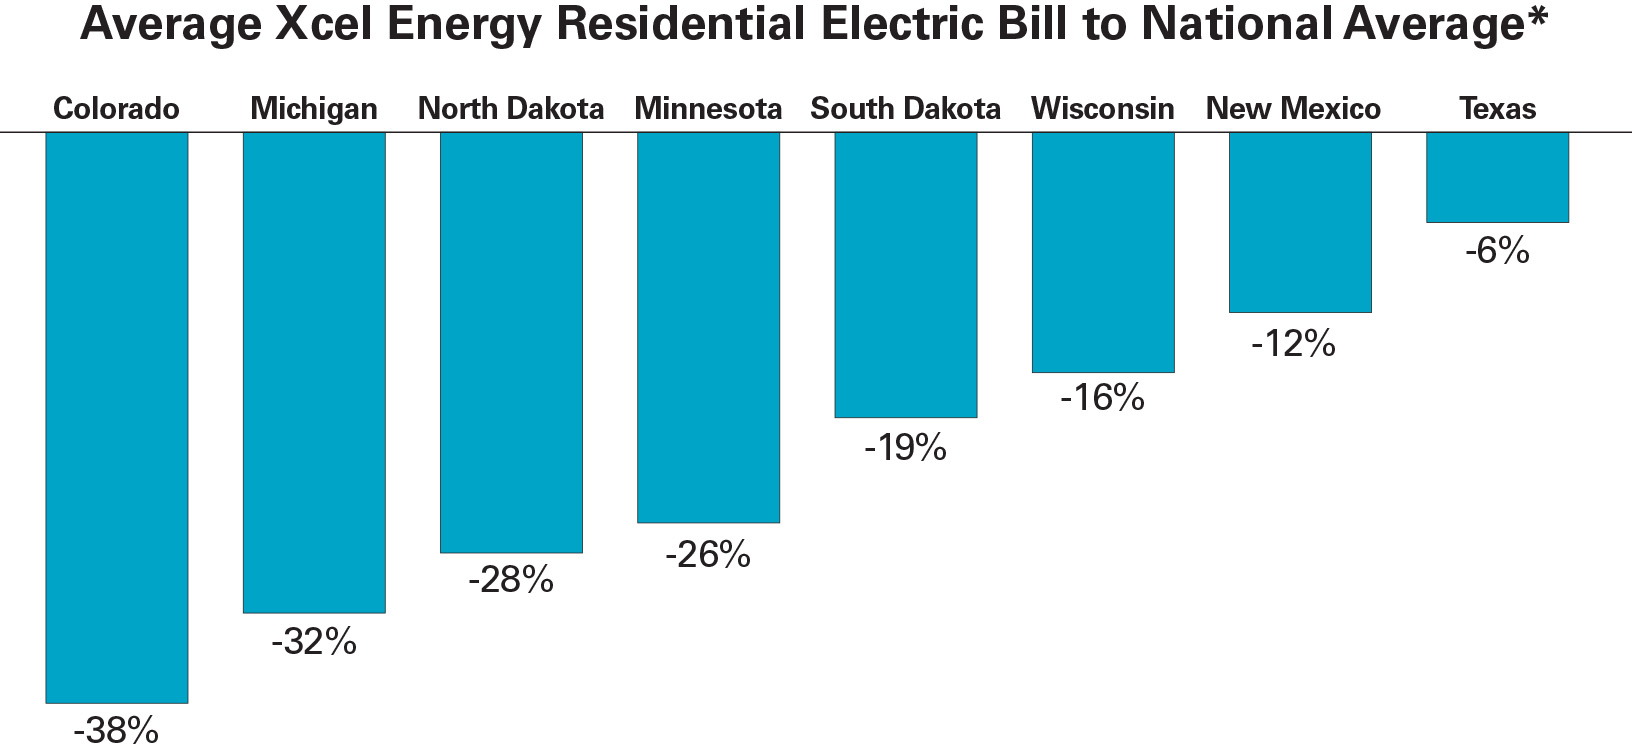
KEEP BILLS LOW
Customer affordability is critical to successful strategy execution. From 2014 - 2023, we have kept residential electric bill growth to 1.8% per year and natural gas bill growth to 1.1% per year, both below the rate of inflation. Based on available EIA data, the five year average residential electric and natural gas bills for an Xcel Energy customer were 28% and 14% below the national average, respectively.
Going forward, our goal is to enable the clean energy transition while keeping customer bill growth below the rate of inflation through initiatives including conservation programs, O&M cost control, our One Xcel Energy Way lean management initiative, advanced operational technologies and our Steel for Fuel program.
*Based on 2019 - Q3 2023 EIA Data
STRENGTHEN OUR COMMUNITIES
We provide a fundamental service, powering communities with safe, reliable, competitively priced and increasingly clean energy.
Investing in our communities is important to our collective success. We initiated 18 economic development projects for our local communities in 2023, which are projected to create more than $2.3 billion in capital investments and 1,400 jobs. Nearly 63% of our supply chain spend was local, with approximately $638 million spent with diverse suppliers.
Approximately 300 employees served on more than 530 nonprofit organizations or local community boards, providing over 28,000 volunteer hours in 2023. Our annual Day of Service attracted 2,500 people who volunteered over 7,200 combined hours at over 120 nonprofit projects across the company’s service footprint.
In 2023, the Xcel Energy Foundation contributed $4 million to 409 nonprofit organizations that support its three charitable giving focus areas of STEM Career Pathways, Environmental Sustainability, and Community Vitality. Through our 2023 Power Your Purpose Giving Campaign, Xcel Energy employees, contractors and retirees donated more than $2 million to over 1,300 nonprofit and community organizations – exceeding our fundraising goal. Combined with the Xcel Energy Foundation match to local United Way chapters, this campaign raised over $4 million for our communities.
VALUE PEOPLE AND OPERATE WITH INTEGRITY
Champion Safety
Continuously elevating the quality and safety of the workplace is a top priority. We are considered a benchmark company for our Safety Always approach, focused on eliminating life-altering injuries through a trusted, transparent culture and the use of critical controls. All employees have “stop work authority” and are expected to keep each other, our customers and the public safe. Employees are encouraged to speak up, share experiences and learn from events to help protect themselves, their coworkers and the public.
The Board of Directors has oversight for employee and public safety through the Operations, Nuclear, Environmental and Safety committee, both of which are also tied to annual incentive compensation.
Cultivate a Diverse, Best-in-Class Workforce
We aim to create an inclusive culture where employees are treated equitably, and diversity is not only accepted but celebrated. This starts with our Board of Directors.
The Board of Directors oversees our workforce strategy, including diversity and inclusion initiatives. Xcel Energy has an incentive-based metric focused on diverse interview panels, executive sponsorship and employee feedback on inclusion in the workplace.
A total of 70% of annual incentive compensation was tied to safety, system reliability and inclusion metrics.
Management evaluates compensation and benefits to maintain a market-competitive, performance-based, shareholder-aligned total rewards package that supports our ability to attract, engage and retain a talented and diverse workforce, while reinforcing and rewarding strong performance.
We partner with educational and community organizations to attract and hire employees who reflect the communities we serve and live our values. Xcel Energy had 11,311 full-time employees and workforce demographics as of December 2023 were as follows:
| | | | | | | | |
| Female | Ethnically Diverse |
| Board of Directors | 31 | % | 15 | % |
| CEO direct reports | 30 | | 10 | |
| Management | 26 | | 13 | |
| Employees | 23 | | 19 | |
| New hires | 35 | | 29 | |
| Interns (hired throughout 2023) | 33 | | 14 | |
We offer leaders and employees training on microinequities and unconscious bias to help foster a culture of inclusivity. Xcel Energy hosts 12 business resource groups to support employee interests and obtain diverse perspectives when solving challenges and achieving goals.
Xcel Energy also respects employees’ freedom of association and their right to collectively organize. As of Dec. 31, 2023, approximately 46% of our employees (5,155) were covered by collective bargaining agreements.
Employee turnover for 2023 and future projected retirement eligibility:
| | | | | | | | | | | | | | |
| Employee Turnover | | Retirement Eligibility |
| Bargaining | 6 | % | | Within next 5 years | 19 | % |
Non-Bargaining (a) | 22 | | | Within next 10 years | 31 | |
Overall (b) | 15 | | | | |
(a)37% of turnover was due to workforce reduction initiatives.
(b)38% of turnover was due to retirements, including the impacts of the workforce reduction initiatives.
We are committed to the advancement and protection of human rights, consistent with U.S. human rights laws and the general principles in the International Labour Organization Conventions.
Annual Code of Conduct training is required for all employees and the Board of Directors. We do not tolerate Code of Conduct violations or other unacceptable behaviors. We expect and offer employees multiple avenues to raise concerns or report wrong-doing and do not permit any retaliation.
Xcel Energy is proud of our track record and continue to invest in building a best-in-class workforce. We recently received the following recognitions:
•For the seventh consecutive year, The Human Rights Campaign selected Xcel Energy as a recipient of the Equality 100 Award: Leader in LGBTQ+ Workplace Inclusion in 2023.
•For the eleventh consecutive year, Xcel Energy is one of Fortune’s Most Admired Companies in 2024.
•For the ninth consecutive year, Xcel Energy was listed as a Best for Vets employer by Military Times and also recognized as a 2024 Military Friendly Employer by VIQTORY.
•Xcel Energy is among the 2023 World’s Most Ethical Companies® according to Ethisphere.
Utility Subsidiaries | | | | | | | | | | | | | | | | | |
NSP-Minnesota |
| | | | | |
| Electric customers | 1.5 million | | | NSP-Minnesota conducts business in Minnesota, North Dakota and South Dakota and has electric operations in all three states including the generation, purchase, transmission, distribution and sale of electricity. NSP-Minnesota and NSP-Wisconsin electric operations are managed on the NSP System. NSP-Minnesota also purchases, transports, distributes and sells natural gas to retail customers and transports customer-owned natural gas in Minnesota and North Dakota. |
| Natural gas customers | 0.6 million | | |
| |
| Total assets | $25.0 billion | | |
| Rate Base (estimated) | $15.7 billion | | |
| GAAP ROE | 8.82% | | |
| |
| Electric generating capacity | 9,081 MW | | |
| Gas storage capacity | 17.1 Bcf | | |
| Electric transmission lines (conductor miles) | 33,000 miles | | |
| Electric distribution lines (conductor miles) | 84,000 miles | | |
| Natural gas transmission lines | 78 miles | | |
| Natural gas distribution lines | 11,000 miles | | |
| | | | | | | | | | | | | | | | | |
NSP-Wisconsin |
| | | | | |
| Electric customers | 0.3 million | | | NSP-Wisconsin conducts business in Wisconsin and Michigan and generates, transmits, distributes and sells electricity. NSP-Minnesota and NSP-Wisconsin electric operations are managed on the NSP System. NSP-Wisconsin also purchases, transports, distributes and sells natural gas to retail customers and transports customer-owned natural gas. |
| Natural gas customers | 0.1 million | | |
| |
| Total assets | $3.7 billion | | |
| Rate Base (estimated) | $2.4 billion | | |
| GAAP ROE | 10.38% | | |
| |
| Electric generating capacity | 551 MW | | |
| Gas storage capacity | 4.3 Bcf | | |
| Electric transmission lines (conductor miles) | 12,000 miles | | |
| Electric distribution lines (conductor miles) | 28,000 miles | | |
| Natural gas transmission lines | 3 miles | | |
| Natural gas distribution lines | 3,000 miles | | |
| | | | | | | | | | | | | | | | | |
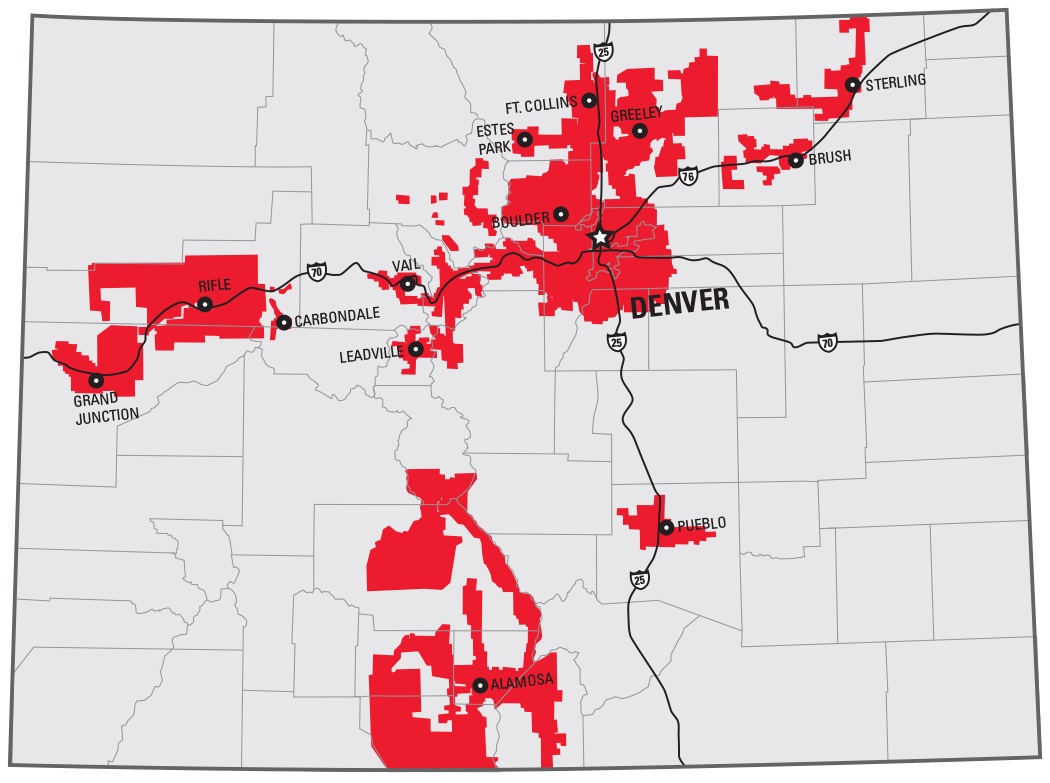
PSCo |
| | | | | |
| Electric customers | 1.6 million | | | PSCo conducts business in Colorado and generates, purchases, transmits, distributes and sells electricity. PSCo also purchases, transports, distributes and sells natural gas to retail customers and transports customer-owned natural gas. |
| Natural gas customers | 1.5 million | | |
| |
| Total assets | $24.6 billion | | |
| Rate Base (estimated) | $16.9 billion | | |
| GAAP ROE | 7.32% | | |
| |
| Electric generating capacity | 6,203 MW | | |
| Gas storage capacity | 32.1 Bcf | | |
| Electric transmission lines (conductor miles) | 25,000 miles | | |
| Electric distribution lines (conductor miles) | 80,000 miles | | |
| Natural gas transmission lines | 2,000 miles | | |
| Natural gas distribution lines | 23,000 miles | | | |
| | | | | | | | | | | | | | | | | |
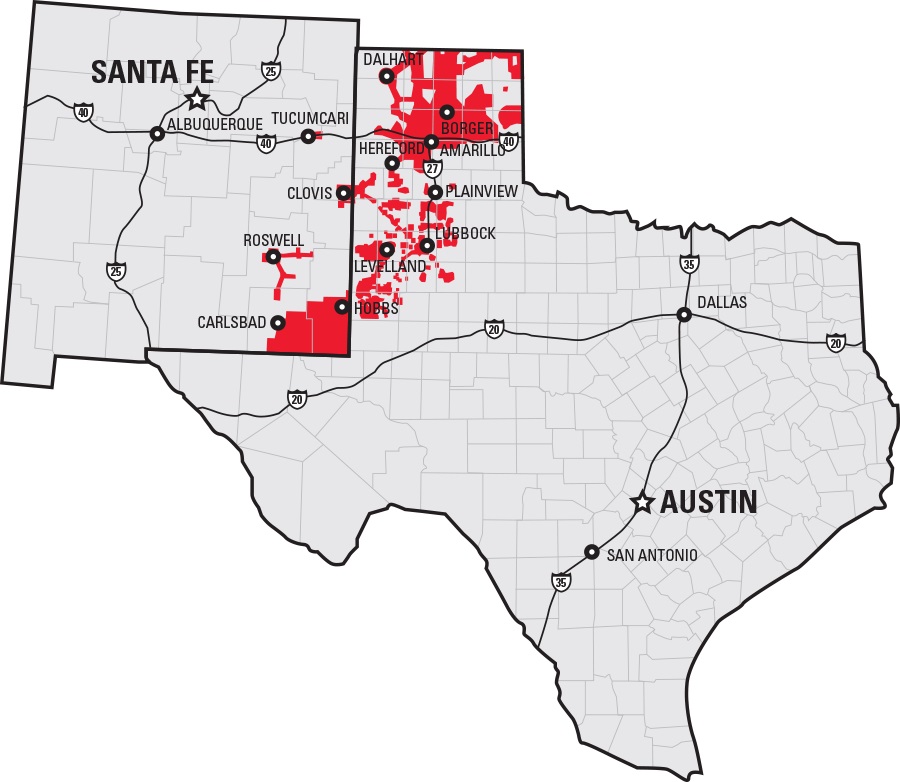
| SPS |
| | | | | |
| | | | | |
| | | | SPS conducts business in Texas and New Mexico and generates, purchases, transmits, distributes and sells electricity. |
| |
| Electric customers | 0.4 million | | |
| |
| Total assets | $9.9 billion | | |
| Rate Base (estimated) | $7.2 billion | | |
| GAAP ROE | 9.80% | | |
| |
| Electric generating capacity | 5,100 MW | | |
| Electric transmission lines (conductor miles) | 41,000 miles | | |
| Electric distribution lines (conductor miles) | 24,000 miles | | |
| | | | |
Utility operations are generally conducted as either electric or gas utilities in our four utility subsidiaries.
Electric operations consist of energy supply, generation, transmission and distribution activities across all four operating companies. Xcel Energy had electric sales volume of 114,980 (millions of KWh), 3.8 million customers and electric revenues of $11,446 million for 2023.
| | | | | | | | | | | | | | | | | | | | |
| Electric Operations (percentage of total) | | Sales Volume | | Number of Customers | | Revenues |
| Residential | | 22 | % | | 86 | % | | 31 | % |
| C&I | | 56 | | | 12 | | | 50 | |
| Other | | 22 | | | 2 | | | 19 | |
Retail Sales/Revenue Statistics (a)
| | | | | | | | | | | | | | |
| | 2023 | | 2022 |
| KWh sales per retail customer | | 23,939 | | | 24,285 | |
| Revenue per retail customer | | $ | 2,464 | | | $ | 2,513 | |
| Residential revenue per KWh | | 13.80 | ¢ | | 13.41 | ¢ |
| C&I revenue per KWh | | 8.82 | ¢ | | 9.02 | ¢ |
| Total retail revenue per KWh | | 10.29 | ¢ | | 10.35 | ¢ |
(a)See Note 6 to the consolidated financial statements for further information.
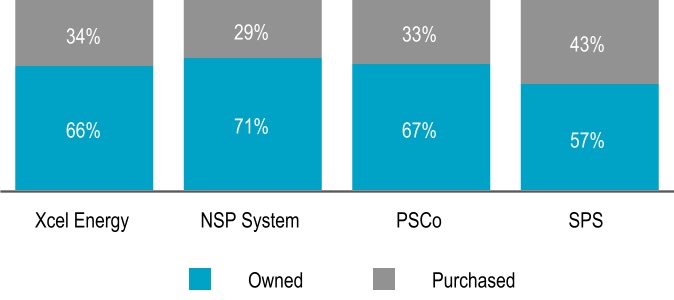
Owned and Purchased Energy Generation — 2023
Electric Energy Sources
Total electric energy generation by source for the year ended Dec. 31:
Carbon-Free
Xcel Energy’s carbon-free energy portfolio includes wind, nuclear, hydroelectric, biomass and solar power from both owned generation facilities and PPAs. Carbon-free percentages will vary year-over-year based on system additions, commodity costs, weather, system demand and transmission constraints.
See Item 2 — Properties for further information.
Wind
Wind capacity is shown as net maximum capacity. Net maximum capacity is attainable only when wind conditions are sufficiently available.
Owned — Owned and operated wind farms with corresponding capacity:
| | | | | | | | | | | | | | | | | | | | | | | | | | |
| Utility Subsidiary | | 2023 | | 2022 |
| Wind Farms | | Capacity (MW) | | Wind Farms | | Capacity (MW) |
| NSP System | | 17 | | | 2,444 | | | 16 | | | 2,352 | |
| PSCo | | 2 | | | 1,059 | | | 2 | | | 1,059 | |
| SPS | | 2 | | | 985 | | | 2 | | | 984 | |
| Total | | 21 | | | 4,488 | | | 20 | | | 4,395 | |
PPAs — Number of PPAs with capacity range: | | | | | | | | | | | | | | | | | | | | | | | | | | |
| Utility Subsidiary | | 2023 | | 2022 |
| PPAs | | Range (MW) | | PPAs | | Range (MW) |
| NSP System | | 120 | | 1 — 206 | | 129 | | 1 — 206 |
| PSCo | | 17 | | | 23 — 301 | | 17 | | | 23 — 301 |
| SPS | | 16 | | | 1 — 250 | | 17 | | | 1 — 250 |
PPAs — Contracted wind capacity (MW) for PPAs:
| | | | | | | | | | | | | | |
| Utility Subsidiary | | 2023 | | 2022 |
| NSP System | | 2,066 | | | 2,163 | |
| PSCo | | 3,026 | | | 3,023 | |
| SPS | | 1,562 | | | 1,564 | |
Average Cost — Average cost per MWh of wind energy from owned generation and existing PPAs:
| | | | | | | | | | | | | | | | | | | | |
| Type: | | Utility Subsidiary | | 2023 | | 2022 |
| Owned Generation | | NSP System | | $ | 7 | | | $ | 18 | |
| PPA | | NSP System | | 33 | | | 37 | |
| Owned Generation | | PSCo | | 7 | | | 11 | |
| PPA | | PSCo | | 42 | | | 38 | |
| Owned Generation | | SPS | | 6 | | | 13 | |
| PPA | | SPS | | 26 | | | 27 | |
Wind Development — Xcel Energy placed into service, repowered, or contracted for the following during 2023:
| | | | | | | | | | | | | | |
| Project | | Utility Subsidiary | | Capacity (MW) |
| Northern Wind | | NSP-Minnesota | | 92 |
| Grand Meadow Repower | | NSP-Minnesota | | 99 |
| | |
| | |
Xcel Energy currently has approximately 1,900 MW of owned wind under development or being repowered. This includes 350 MW of approved repowering projects at the NSP System estimated to be completed in 2025, as well as an anticipated approximately 1,550 MW at PSCo as part of the Colorado Resource Plan. The Company also anticipates approval of an additional 300 MW of PPAs as part of the Colorado Resource Plan, additions are expected to be placed in service between 2026 - 2028.
Solar
PPAs — Solar PPAs capacity by type:
| | | | | | | | | | | | | | | | | |
| Type | | Utility Subsidiary | | Capacity (MW) | |
| Distributed Generation | | NSP System | | 1,117 | | |
| Utility-Scale | | NSP System | | 269 | | |
| Distributed Generation | | PSCo | | 887 | | |
| Utility-Scale | | PSCo | | 1,530 | | (a) |
| Distributed Generation | | SPS | | 28 | | |
| Utility-Scale | | SPS | | 192 | | |
| Total | | | | 4,023 | | |
(a)Includes battery storage capacity of 225 MW.
Average Cost (PPAs) — Average cost per MWh of solar energy under existing PPAs:
| | | | | | | | | | | | | | |
| Utility Subsidiary | | 2023 | | 2022 |
| NSP System | | $ | 90 | | | $ | 79 | |
| PSCo | | 34 | | | 69 | |
| SPS | | 67 | | | 62 | |
Xcel Energy currently has approximately 2,900 MW of owned and PPA solar under development. For the NSP System, this includes 700 MW of solar approved at the Sherco site which are expected to be placed in service in 2024 and 2025. PSCo anticipates development of approximately 1,700 MW of solar generation resources (650 MW Company Owned, 1,050 MW as PPAs) as part of the Colorado Resource Plan. Colorado Resource Plan additions are expected to be placed in service between 2026 - 2028.
For SPS, approximately 400 MW of solar and storage are pending regulatory approval (expected to be placed in service in 2026 and 2027).
Additionally, various PPAs totaling approximately 100 MW are expected to be completed throughout 2024 and 2025.
Nuclear
Xcel Energy has two nuclear plants with approximately 1,700 MW of total 2023 net summer dependable capacity that serve the NSP System. Our nuclear fleet safely and reliably generates carbon free electricity at consistently high levels of performance among the industry. Xcel Energy secures contracts for uranium concentrates, uranium conversion, uranium enrichment and fuel fabrication to operate its nuclear plants. We use varying contract lengths as well as multiple producers for uranium concentrates, conversion services and enrichment services to minimize potential impacts caused by supply interruptions due to geographical and world political issues.
Nuclear Fuel Cost — Delivered cost per MMBtu of nuclear fuel consumed for owned electric generation and the percentage of total fuel requirements (nuclear, natural gas and coal):
| | | | | | | | | | | | | | |
| Utility Subsidiary | | Nuclear |
| NSP System | | Cost | | Percent |
| 2023 | | $ | 0.76 | | | 50 | % |
| 2022 | | 0.76 | | | 51 | |
Other — Xcel Energy’s other carbon-free energy portfolio includes hydro from owned generating facilities.
PSCo anticipates development of approximately 1,850 MW of storage capacity (400 MW Company Owned, 1,450 MW as PPAs) as part of the Colorado Resource Plan. Colorado Resource Plan additions are expected to be placed in service between 2026 - 2028.
See Item 2 — Properties for further information.
Fossil Fuel
Xcel Energy’s fossil fuel energy portfolio includes coal and natural gas power from both owned generating facilities and PPAs.
Coal
Xcel Energy owned and operated coal units with approximately 6,200 MW of total 2023 net summer dependable capacity, which provided 19% of Xcel Energy’s energy mix in 2023. Amount includes Sherco Unit 2, which was retired on Dec. 31, 2023, net summer dependable capacity of 682 MW and approximately 100 MW derived from RDF and wood fuel sources.
Xcel Energy has plans to retire or convert to natural gas all of its existing coal generation by the end of 2030. Approved early coal plant retirements:
| | | | | | | | | | | | | | | | | | | | | | | |
| Year | | Utility Subsidiary | | Plant Unit | | Capacity (MW) | |
| 2024 | | SPS | | Harrington (a) | | 1,018 | |
| 2025 | | PSCo | | Comanche 2 | | 330 | |
| 2025 | | PSCo | | Craig 1 | | 42 | (b) |
| 2025 | | PSCo | | Pawnee (a) | | 505 | |
| 2026 | | NSP-Minnesota | | Sherco 1 | | 680 | |
| 2027 | | PSCo | | Hayden 2 | | 98 | (b) |
| 2028 | | PSCo | | Hayden 1 | | 135 | (b) |
| 2028 | | PSCo | | Craig 2 | | 40 | (b) |
| 2028 | | NSP-Minnesota | | A.S. King | | 511 | |
| 2030 | | NSP-Minnesota | | Sherco 3 | | 517 | (b) |
| 2030 | | PSCo | | Comanche 3 | | 500 | (b) |
| 2034 | | SPS | | Tolk 1 (c) | | 532 | |
| 2034 | | SPS | | Tolk 2 (c) | | 535 | |
(a)Reflects conversion from coal to natural gas.
(b)Based on Xcel Energy’s ownership interest.
(c)Tolk Unit 1 and 2 are approved to be retired early in 2034. The NMPRC has approved a retirement date of 2028. SPS has filed a Texas rate case settlement agreement pending PUCT approval for a retirement date of 2028.
Coal Fuel Cost — Delivered cost per MMBtu of coal consumed for owned electric generation and the percentage of fuel requirements (nuclear, natural gas and coal):
| | | | | | | | | | | | | | |
| | Coal (a) |
| Utility Subsidiary | | Cost | | Percent |
| NSP System | | | | |
| 2023 | | $ | 2.43 | | | 29 | % |
| 2022 | | 2.27 | | | 37 | |
| PSCo | | | | |
| 2023 | | 1.57 | | | 54 | |
| 2022 | | 1.48 | | | 55 | |
| SPS | | | | |
| 2023 | | 2.73 | | | 48 | |
| 2022 | | 2.37 | | | 59 | |
(a)Includes RDF and wood for the NSP System.
Natural Gas
Xcel Energy has 23 natural gas plants with approximately 8,100 MW of total 2023 net summer dependable capacity, which provided 30% of Xcel Energy’s mix in 2023.
Natural gas supplies, transportation and storage services for power plants are procured to provide an adequate supply of fuel. Remaining requirements are procured through a liquid spot market. Generally, natural gas supply contracts have variable pricing that is tied to natural gas indices. Natural gas supply and transportation agreements include obligations for the purchase and/or delivery of specified volumes or payments in lieu of delivery.
Natural Gas Cost — Delivered cost per MMBtu of natural gas consumed for owned electric generation and the percentage of total fuel requirements (nuclear, natural gas and coal):
| | | | | | | | | | | | | | |
| | Natural Gas |
| Utility Subsidiary | | Cost | | Percent |
| NSP System | | | | |
| 2023 | | $ | 3.91 | | | 21 | % |
| 2022 | | 7.58 | | | 12 | |
| PSCo | | | | |
| 2023 | | 3.06 | | | 46 | |
| 2022 | | 7.09 | | | 45 | |
| SPS | | | | |
| 2023 | | 2.35 | | | 52 | |
| 2022 | | 5.87 | | | 41 | |
PSCo anticipates development of approximately 650 MW of Company Owned natural gas generation, as part of the Colorado Resource Plan to help ensure resiliency and reliability. Colorado Resource Plan additions are expected to be placed in service between 2026 - 2028.
Capacity and Demand
Uninterrupted system peak demand and occurrence date:
| | | | | | | | | | | | | | | | | | | | | | | | | | |
| | System Peak Demand (MW) |
| | 2023 | | 2022 |
NSP System | | 9,231 | | | Aug. 23 | | 9,245 | | | June 20 |
| PSCo | | 6,909 | | | July 24 | | 6,821 | | | Sept. 6 |
| SPS | | 4,372 | | | Aug. 17 | | 4,280 | | | July 19 |
Transmission
Transmission lines deliver electricity at high voltages and over long distances from power sources to substations closer to customers. A strong transmission system ensures continued reliable and affordable service, ability to meet state and regional energy policy goals, and support for a diverse generation mix, including renewable energy. Xcel Energy owns approximately 110,000 conductor miles of transmission lines, serving 22,000 MW of customer load, across its service territory.
Xcel Energy plans to build approximately 1,750 additional conductor miles of transmission lines, primarily as part of the MISO Tranche 1, MN Energy Connection and Colorado Power Pathway projects between 2024 and 2028.
See Item 2 - Properties for further information.
Distribution
Distribution lines allow electricity to travel at lower voltages from substations directly to customers. Xcel Energy has a vast distribution network, owning and operating approximately 215,000 conductor miles of distribution lines across our eight-state service territory.
As of Dec. 31, 2023, Xcel Energy has invested approximately $1.1 billion of $1.6 billion to implement new network infrastructure, smart meters, advanced software, equipment sensors and related data analytics capabilities.
These investments will improve reliability and reduce outage restoration times for our customers, while enabling new options and opportunities for increased efficiency savings. The new capabilities will also enable integration of battery storage and other distributed energy resources into the grid, including electric vehicles.
See Item 2 - Properties for further information.
Natural gas operations consist of purchase, transportation and distribution of natural gas to end-use residential, C&I and transport customers in NSP-Minnesota, NSP-Wisconsin and PSCo. Xcel Energy had natural gas deliveries of 406,742 (thousands of MMBtu), 2.2 million customers and natural gas revenues of $2,645 million for 2023.
| | | | | | | | | | | | | | | | | | | | |
Natural Gas
(percentage of total) | | Deliveries | | Number of Customers | | Revenues |
| Residential | | 37 | % | | 92 | % | | 59 | % |
| C&I | | 24 | | | 8 | | | 31 | |
| Transportation and other | | 39 | | | <1 | | 10 | |
Sales/Revenue Statistics (a)
| | | | | | | | | | | | | | |
| | 2023 | | 2022 |
| MMBtu sales per retail customer | | 115 | | | 116 | |
| Revenue per retail customer | | $ | 1,113 | | | $ | 1,318 | |
| Residential revenue per MMBtu | | 10.54 | | | 11.97 | |
| C&I revenue per MMBtu | | 8.48 | | | 10.45 | |
| Transportation and other revenue per MMBtu | | 1.01 | | | 1.16 | |
(a)See Note 6 to the consolidated financial statements for further information.
Capability and Demand
Natural gas supply requirements are categorized as firm or interruptible (customers with an alternate energy supply).
Maximum daily output (firm and interruptible) and occurrence date:
| | | | | | | | | | | | | | | | | | | | | | | | | | |
| | 2023 | | 2022 |
| Utility Subsidiary | | MMBtu | | Date | | MMBtu | | Date |
| NSP-Minnesota | | 753,642 | | | Feb. 3 | | 867,385 | | | Feb. 12 |
| NSP-Wisconsin | | 158,029 | | | Jan. 30 | | 187,961 | | | Jan. 6 |
| PSCo | | 2,190,155 | | | Jan. 30 | | 2,243,552 | | | Dec. 22 |
Natural Gas Supply and Cost
Xcel Energy seeks natural gas supply, transportation and storage alternatives to yield a diversified portfolio, which increases flexibility, decreases interruption, financial risks and customer rates. In addition, the utility subsidiaries conduct natural gas price hedging activities approved by their states’ commissions.
Average delivered cost per MMBtu of natural gas for regulated retail distribution:
| | | | | | | | | | | | | | |
| Utility Subsidiary | | 2023 | | 2022 |
| NSP-Minnesota | | $ | 5.31 | | | $ | 7.00 | |
| NSP-Wisconsin | | 5.26 | | | 6.68 | |
| PSCo | | 4.91 | | | 6.33 | |
NSP-Minnesota, NSP-Wisconsin and PSCo have natural gas supply transportation and storage agreements that include obligations for purchase and/or delivery of specified volumes or to make payments in lieu of delivery.
General Economic Conditions
Economic conditions may have a material impact on Xcel Energy’s operating results. Management cannot predict the impact of fluctuating energy or commodity prices, pandemics, terrorist activity, war or the threat of war. We could experience a material impact to our results of operations, future growth or ability to raise capital resulting from a sustained general slowdown in economic growth or a significant increase in interest rates or inflation.
Seasonality
Demand for electric power and natural gas is affected by seasonal differences in the weather. In general, peak sales of electricity occur in the summer months and peak sales of natural gas occur in the winter months. As a result, the overall operating results may fluctuate substantially on a seasonal basis. Additionally, Xcel Energy’s operations have historically generated less revenues and income when weather conditions are warmer in the winter and cooler in the summer. Sales true-up and decoupling mechanisms mitigate the impacts of weather in certain jurisdictions.
Competition
Xcel Energy is subject to public policies that promote competition and development of energy markets. Xcel Energy’s industrial and large commercial customers have the ability to generate their own electricity. In addition, customers may have the option of substituting other fuels or relocating their facilities to a lower cost region.
Customers have the opportunity to supply their own power with distributed generation including solar generation and can currently avoid paying for most of the fixed production, transmission and distribution costs incurred to serve them in most jurisdictions.
Several states have incentives for the development of rooftop solar, community solar gardens and other distributed energy resources. Distributed generating resources are potential competitors to Xcel Energy’s electric service business with these incentives and federal tax subsidies.
The FERC has continued to promote competitive wholesale markets through open access transmission and other means. Xcel Energy’s wholesale customers can purchase energy from generation resources of competing generation resources quantities and transmission services from other service providers to serve their native load.
FERC Order No. 1000 established competition for ownership of certain new electric transmission facilities under Federal regulations. Some states have state laws that allow the incumbent a Right of First Refusal to own these transmission facilities.
FERC Order 2222 requires that RTO and ISO markets allow participation of aggregations of distributed energy resources. This order is expected to incentivize distributed energy resource adoption, however implementation is expected to vary by RTO/ISO and the near, medium, and long-term impacts of Order 2222 remain unclear.
Xcel Energy Inc.’s utility subsidiaries have franchise agreements with cities subject to periodic renewal; however, a city could seek alternative means to access electric power or gas, such as municipalization. No municipalization activities are occurring presently.
While each utility subsidiary faces these challenges, Xcel Energy believes their rates and services are competitive with alternatives currently available.
Public Utility Regulation
See Item 7 for discussion of public utility regulation.
Environmental Regulation
Our facilities are regulated by federal and state agencies that have jurisdiction over air emissions, water quality, wastewater discharges, solid and hazardous wastes or substances. Certain Xcel Energy activities require registrations, permits, licenses, inspections and approvals from these agencies.
Xcel Energy has received necessary authorizations for the construction and continued operation of its generation, transmission and distribution systems. Our facilities strive to operate in compliance with applicable environmental standards and related monitoring and reporting requirements.
However, it is not possible to determine what additional facilities or modifications to existing or planned facilities will be required as a result of changes to regulations, interpretations or enforcement policies or what effect future laws or regulations may have. We may be required to incur expenditures in the future for remediation of historic and current operating sites and other waste treatment, storage and disposal sites.
There are significant environmental regulations to encourage use of clean energy technologies and regulate emissions of GHGs. We have undertaken numerous initiatives to meet current requirements and prepare for potential future regulations, reduce GHG emissions and respond to state renewable and energy efficiency goals. Future environmental regulations may result in substantial costs.
Emerging Environmental Regulation
Clean Air Act
Power Plant Greenhouse Gas Regulations — In May 2023, the EPA published proposed rules addressing control of CO2 emissions from the power sector. The rule proposed regulations for new natural gas generating units and emission guidelines for existing coal and certain natural gas generation. The proposed rules create subcategories of coal units based on planned retirement date and subcategories of natural gas combustion turbines and combined cycle units based on utilization. The CO2 control requirements vary by subcategory. Until final rules are issued, it is not certain what the impact will be on Xcel Energy. Xcel Energy believes that the cost of these initiatives or replacement generation would be recoverable through rates based on prior state commission practices.
Coal Ash Regulation
In May 2023, the EPA published proposed rules to regulate legacy CCR surface impoundments at inactive facilities and previously exempt areas where CCR was placed directly on land at regulated CCR facilities under the CCR Rule for the first time. The proposed rule would subject these areas to the CCR Rule requirements, including groundwater monitoring, corrective action, closure, and post-closure care requirements, among other requirements, with several of the deadlines accelerated.
The EPA has committed to a May 2024 publication date for those new rules. It is also anticipated that the EPA may issue other CCR proposed rules in 2024 and 2025 that further expand the scope of the CCR Rule. Until final rules are issued, it is not certain what the impact will be on Xcel Energy. Xcel Energy believes that the cost of these initiatives would be recoverable through rates based on prior state commission practices.
Emerging Contaminants of Concern
PFAS are man-made chemicals that are widely used in consumer products and can persist and bio-accumulate in the environment. Xcel Energy does not manufacture PFAS but because PFAS are so ubiquitous in products and the environment, it may impact our operations.
In September 2022, the EPA proposed to designate two types of PFAS as “hazardous substances” under the CERCLA. In March 2023, the EPA published a proposed rule that would establish enforceable drinking water standards for certain PFAS chemicals. Final rules are expected in 2024. Costs are uncertain until a final rule is published.
The proposed rules could result in new obligations for investigation and cleanup. Xcel Energy is monitoring changes to state laws addressing PFAS. The impact of these proposed regulations is uncertain.
Effluent Limitation Guidelines
In March 2023, the EPA released a proposed rule under the Clean Water Act, setting forth proposed Effluent Limitations Guidelines and Standards for steam generating coal plants. This proposed rule establishes more stringent wastewater discharge standards for bottom ash transport water, flue-gas desulfurization wastewater, and combustion residuals leachate from steam electric power plants, particularly coal-fired power plants. The impact of these proposed regulations is uncertain until a final rule is published.
Environmental Costs
Environmental costs include amounts for nuclear plant decommissioning and payments for storage of spent nuclear fuel, disposal of hazardous materials and waste, remediation of contaminated sites, monitoring of discharges to the environment and compliance with laws and permits with respect to emissions.
Costs charged to operating expenses for nuclear decommissioning, spent nuclear fuel disposal, environmental monitoring and remediation and disposal of hazardous materials and waste and depreciation of previously incurred capital expenditures for environmental improvements were approximately:
•$275 million in 2023.
•$365 million in 2022.
•$365 million in 2021.
Average annual expense of approximately $320 million from 2024 – 2028 is estimated for similar costs. The precise timing and amount of environmental costs, including those for site remediation and disposal of hazardous materials, are unknown. Additionally, the extent to which environmental costs will be recovered through rates may fluctuate.
Capital expenditures for environmental improvements were approximately:
•$20 million in 2023.
•$20 million in 2022.
•$60 million in 2021.
Certain previously collected nuclear storage costs for the federal nuclear waste program are reimbursed to customers by the federal government as a result of a settlement we pursued regarding the government’s failure to deliver a disposal program. Installments received are reimbursed to customers as approved by the MPUC and other state regulators.
Other
Our operations are subject to workplace safety standards under the Federal Occupational Safety and Health Act of 1970 (“OSHA”) and comparable state laws that regulate the protection of worker health and safety. In addition, the Company is subject to other government regulations impacting such matters as labor, competition, data privacy, etc. Based on information to date and because our policies and business practices are designed to comply with all applicable laws, we do not believe the effects of compliance on our operations, financial condition or cash flows are material.
| | |
| Capital Spending and Financing |
See Item 7 for discussion of capital expenditures and funding sources.
| | | | | | | | | | | | | | | | | | | | |
Information about our Executive Officers (a) |
| Name | | Age | | Current and Recent Positions | | Time in Position |
| | | | |
| | | | |
| | | | |
| Robert C. Frenzel | | 53 | | Chairman of the Board of Directors, Xcel Energy Inc. | | December 2021 — Present |
| | | | President and Chief Executive Officer and Director, Xcel Energy Inc. | | August 2021 — Present |
| | | | Chief Executive Officer, NSP-Minnesota, NSP-Wisconsin, PSCo, and SPS | | August 2021 — Present |
| | | | President and Chief Operating Officer, Xcel Energy Inc. | | March 2020 — August 2021 |
| | | | Executive Vice President, Chief Financial Officer, Xcel Energy Inc. | | May 2016 — March 2020 |
| | | | Senior Vice President and Chief Financial Officer, Luminant, a subsidiary of Energy Future Holdings Corp. (b) | | February 2012 — April 2016 |
| Patricia Correa | | 50 | | Senior Vice President, Chief Human Resources Officer, Xcel Energy Inc. | | February 2022 — Present |
| | | | Senior Vice President, Human Resources, Eaton Corporation, a power management company | | July 2019 — January 2022 |
| | | | Vice President, Human Resources, Eaton Corporation | | March 2016 — July 2019 |
| | | | |
| Timothy O’Connor | | 64 | | Executive Vice President, Chief Operations Officer, Xcel Energy Inc. | | August 2021 — Present |
| | | | Executive Vice President, Chief Generation Officer, Xcel Energy Inc. | | March 2020 — August 2021 |
| | | | Senior Vice President, Chief Nuclear Officer, Xcel Energy Services Inc | | February 2013 — March 2020 |
| Frank Prager | | 61 | | Senior Vice President, Strategy, Security and External Affairs and Chief Sustainability Officer, Xcel Energy Inc. | | March 2022 — Present |
| | | | Senior Vice President, Strategy, Planning and External Affairs, Xcel Energy Inc. | | March 2020 — March 2022 |
| | | | Vice President, Policy and Federal Affairs, Xcel Energy Services Inc. | | January 2015 — March 2020 |
| Amanda Rome | | 43 | | Executive Vice President, Group President, Utilities, and Chief Customer Officer, Xcel Energy Inc. | | October 2023 — Present |
| | | | Interim General Counsel, Xcel Energy Inc. | | January 2024 — Present |
| | | | Executive Vice President, Chief Legal and Compliance Officer, Xcel Energy Inc. | | June 2022 — October 2023 |
| | | | Executive Vice President, General Counsel, Xcel Energy Inc. | | June 2020 — June 2022 |
| | | | Vice President and Deputy General Counsel, Xcel Energy Services Inc. | | October 2019 — June 2020 |
| | | | Positions of increasing responsibility in the Legal Department, Xcel Energy Services Inc. | | July 2015 — October 2019 |
| Brian J. Van Abel | | 42 | | Executive Vice President, Chief Financial Officer, Xcel Energy Inc. | | March 2020 — Present |
| | | | Senior Vice President, Finance and Corporate Development, Xcel Energy Services Inc. | | September 2018 — March 2020 |
| | | | Vice President, Treasurer, Xcel Energy Services Inc. | | July 2015 — September 2018 |
(a) No family relationships exist between any of the executive officers or directors.
(b)In April 2014, Energy Future Holdings Corp., the majority of its subsidiaries, including Texas Competitive Energy Holdings the parent company of Luminant, filed a voluntary bankruptcy petition under Chapter 11 of the United States Bankruptcy Code. Texas Competitive Energy Holdings emerged from Chapter 11 in October 2016.
Xcel Energy is subject to a variety of risks, many of which are beyond our control. Risks that may adversely affect the business, financial condition, results of operations or cash flows are described below. Although the risks are organized by heading, and each risk is described separately, many of the risks are interrelated. These risks should be carefully considered together with the other information set forth in this report and future reports that we file with the SEC.
While we believe we have identified and discussed below the key risk factors affecting our business, there may be additional risks and uncertainties that are not presently known or that are not currently believed to be significant that may adversely affect our business, financial condition, results of operations or cash flows in the future.
Oversight of Risk and Related Processes
The Board of Directors is responsible for the oversight of material risk and maintaining an effective risk monitoring process. Management and the Board of Directors’ committees have responsibility for overseeing the identification and mitigation of key risks and reporting its assessments and activities to the full Board of Directors.
Xcel Energy maintains a robust compliance program and promotes a culture of compliance beginning with the tone at the top. The risk mitigation process includes adherence to our Code of Conduct and compliance policies, operation of formal risk management structures and overall business management. Xcel Energy further mitigates inherent risks through formal risk committees and corporate functions such as internal audit, and internal controls over financial reporting and legal.
Management identifies and analyzes risks to determine materiality and other attributes such as timing, probability and controllability. Identification and risk analysis occurs formally through risk assessment conducted by senior management, the financial disclosure process, hazard risk procedures, internal audit and compliance with financial and operational controls.
Management also identifies and analyzes risk through the business planning process, development of goals and establishment of key performance indicators, including identification of barriers to implementing Xcel Energy’s strategy. The business planning process also identifies likelihood and mitigating factors to prevent the assumption of inappropriate risk to meet goals.
Management communicates regularly with the Board of Directors and key stakeholders regarding risk. Senior management presents and communicates a periodic risk assessment to the Board of Directors, providing information on the risks that management believes are material, including financial impact, timing, likelihood and mitigating factors. The Board of Directors regularly reviews management’s key risk assessments, which includes areas of existing and future macroeconomic, financial, operational, policy, environmental, safety and security risks.
The oversight, management and mitigation of risk is an integral and continuous part of the Board of Directors’ governance of Xcel Energy. The Board of Directors assigns oversight of critical risks to each of its four committees to confirm these risks are well understood and given appropriate focus.
The Audit Committee is responsible for reviewing the adequacy of the committees’ risk oversight and affirming appropriate aggregate oversight occurs. Committees regularly report on their oversight activities and certain risk issues may be brought to the full Board of Directors for consideration when deemed appropriate.
Emerging risks are considered and assigned as appropriate during the annual Board of Directors and committee evaluation process, resulting in updates to the committee charters and annual work plans. Additionally, the Board of Directors conducts an annual strategy session where Xcel Energy’s future plans and initiatives are reviewed.
Risks Associated with Our Business
Operational Risks
Our natural gas and electric generation/transmission and distribution operations involve numerous risks that may result in accidents and other operating risks and costs.
Our natural gas transmission and distribution activities include inherent hazards and operating risks, such as leaks, explosions, outages and mechanical problems. Our electric generation, transmission and distribution activities include inherent hazards and operating risks such as contact, fire and outages.
These risks could result in loss of life, significant property damage, environmental pollution, impairment of our operations and substantial financial losses to employees, third-party contractors, customers or the public. We maintain insurance against most, but not all, of these risks and losses.
The occurrence of these events, if not fully covered by insurance, could have a material effect on our financial condition, results of operations and cash flows as well as potential loss of reputation.
Other uncertainties and risks inherent in operating and maintaining Xcel Energy's facilities include, but are not limited to:
•Risks associated with facility start-up operations, such as whether the facility will achieve projected operating performance on schedule and otherwise as planned.
•Failures in the availability, acquisition or transportation of fuel or other supplies.
•Impact of adverse weather conditions and natural disasters, including, tornadoes, avalanches, icing events, floods, high winds and droughts.
•Performance below expected or contracted levels of output or efficiency.
•Availability of replacement equipment.
•Availability of adequate water resources and ability to satisfy water intake and discharge requirements.
•Availability or changes to wind patterns.
•Inability to identify, manage properly or mitigate equipment defects.
•Use of new or unproven technology.
•Risks associated with dependence on a specific type of fuel or fuel source, such as commodity price risk, availability of adequate fuel supply and transportation and lack of available alternative fuel sources.
•Increased competition due to, among other factors, new facilities, excess supply, shifting demand and regulatory changes.
Additionally, compliance with existing and potential new regulations related to the operation and maintenance of our natural gas infrastructure could result in significant costs. The PHMSA is responsible for administering the DOT’s national regulatory program to assure the safe transportation of natural gas, petroleum and other hazardous materials by pipelines. The PHMSA continues to develop regulations and other approaches to risk management to assure safety in design, construction, testing, operation, maintenance and emergency response of natural gas pipeline infrastructure. We have programs in place to comply with these regulations and systematically monitor and renew infrastructure over time, however, a significant incident or material finding of non-compliance could result in penalties and higher costs of operations.
Our natural gas and electric transmission and distribution operations are dependent upon complex information technology systems and network infrastructure, the failure of which could disrupt our normal business operations, which could have a material adverse effect on our ability to process transactions and provide services.
Our utility operations are subject to long-term planning and project risks.
Most utility investments are planned to be used for decades. Transmission and generation investments typically have long lead times and are planned well in advance of in-service dates and typically subject to long-term resource plans. These plans are based on numerous assumptions such as: sales growth, customer usage, commodity prices, economic activity, costs, regulatory mechanisms, customer behavior, available technology and public policy. Xcel Energy’s long-term resource plan is dependent on our ability to obtain required approvals (including regulatory approval in jurisdictions where Xcel Energy operates), develop necessary technical expertise, allocate and coordinate sufficient resources and adhere to budgets and timelines.
In addition, the long-term nature of both our planning processes and our asset lives are subject to risk. The utility sector is undergoing significant change (e.g., increases in energy efficiency, wider adoption of distributed generation and shifts away from fossil fuel generation to renewable generation). Customer adoption of these technologies and increased energy efficiency could result in excess transmission and generation resources, downward pressure on sales growth, and potentially stranded costs if we are not able to fully recover costs and investments.
The magnitude and timing of resource additions and changes in customer demand may not coincide with evolving customer preference for generation resources and end-uses, which introduces further uncertainty into long-term planning. Efforts to electrify the transportation and building sectors to reduce GHG emissions may result in higher electric demand and lower natural gas demand over time. New data centers and crypto mining facilities could generate significant increase in demand. Higher electric demand may require us to adopt new technologies and make significant transmission and distribution investments including advanced grid infrastructure, which increases exposure to overall grid instability and technology obsolescence. Evolving stakeholder preference for lower emissions from generation sources and end-uses, like heating, may impact our resource mix and put pressure on our ability to recover capital investments in natural gas generation and delivery. Multiple states may not agree as to the appropriate resource mix, which may lead to costs to comply with one jurisdiction that are not recoverable across all jurisdictions served by the same assets.
We require inputs such as coal, natural gas, uranium and water. Lack of availability of these resources could jeopardize long-term operations of our facilities or make them uneconomic to operate.
Our utilities are highly dependent on suppliers to deliver components in accordance with short and long-term project schedules.
Our products contain components that are globally sourced from suppliers. A shortage of key components in which an alternative supplier is not identified could significantly impact operations and project plans for Xcel Energy and our customers. Such impacts could include timing of projects and the potential for project cancellation. Failure to adhere to project budgets and timelines could adversely impact our results of operations, financial condition or cash flows.
We are subject to commodity risks and other risks associated with energy markets and energy production.
A significant increase in fuel costs could cause a decline in customer demand, adverse regulatory outcomes and an increase in bad debt expense which may have a material impact on our results of operations. Despite existing fuel cost recovery mechanisms in most of our states, higher fuel costs could significantly impact our results of operations if costs are not recovered. Delays in the timing of the collection of fuel cost recoveries could impact our cash flows and liquidity.
A significant disruption in supply could cause us to seek alternatives at potentially higher costs. Additionally, supply shortages may not be fully resolved, which negatively impacts our ability to provide services to our customers. Failure to provide service due to disruptions may also result in fines, penalties or cost disallowances through the regulatory process. Also, significantly higher energy or fuel costs relative to sales commitments negatively impacts our cash flows and results of operations.
We also engage in wholesale sales and purchases of electric capacity, energy and energy-related products as well as natural gas. In many markets, emission allowances and/or RECs are also needed to comply with various statutes and commission rulings. As a result, we are subject to market supply and commodity price risk.
Commodity price changes can affect the value of our commodity trading derivatives. We mark certain derivatives to estimated fair market value on a daily basis. Settlements can vary significantly from estimated fair values recorded and significant changes from the assumptions underlying our fair value estimates could cause earnings variability. The management of risks associated with hedging and trading is based, in part, on programs and procedures which utilize historical prices and trends.
Public perception often does not distinguish between pass through commodity costs and base rates. High commodity prices that are passed through to customer bills could impact our ability to recover costs for other improvements and operations.
Due to the uncertainty involved in price movements and potential deviation from historical pricing, Xcel Energy is unable to fully assure that its risk management programs and procedures would be effective to protect against all significant adverse market deviations.
In addition, Xcel Energy cannot fully assure that its controls will be effective against all potential risks. If such programs and procedures are not effective, Xcel Energy’s results of operations, financial condition or cash flows could be materially impacted.
Failure to attract and retain a qualified workforce could have an adverse effect on operations.
The competition for talent has become increasingly prevalent, and we have experienced increased employee turnover due to the condition of the labor market and decisions related to strategic workforce planning. In addition, specialized knowledge and skills are required for many of our positions, which may pose additional difficulty for us as we work to recruit, retain and motivate employees in this climate.
Failure to hire, adequately train replacement employees, transfer knowledge/expertise or future availability and cost of contract labor may adversely affect the ability to manage and operate our business. Inability to attract and retain these employees could adversely impact our results of operations, financial condition or cash flows.
Our businesses have collective bargaining agreements with labor unions. Failure to renew or renegotiate these contracts could lead to labor disruptions, including strikes or boycotts. Such disruptions or any negotiated wage or benefit increases could have a material adverse impact to our results of operations, financial condition or cash flows.
National unionization efforts could affect our business, as an increase in unionized workers could challenge our operational efficiency and increase costs.
Our operations use third-party contractors in addition to employees to perform periodic and ongoing work.
We rely on third-party contractors to perform operations, maintenance and construction work. Our contractual arrangements with these contractors typically include performance and safety standards, progress payments, insurance requirements and security for performance. Poor vendor performance or contractor unavailability could impact ongoing operations, restoration operations, regulatory recovery, our reputation and could introduce financial risk or risks of fines.
Our employees, directors, third-party contractors, or suppliers may violate or be perceived to violate our Codes of Conduct, which could have an adverse effect on our reputation.
We are exposed to risk of employee or third-party contractor fraud or misconduct. All employees and members of the Board of Directors are subject to compliance with our Code of Conduct and are required to participate in annual training. Additionally, suppliers are subject to compliance with our Supplier Code of Conduct.
Xcel Energy does not tolerate discrimination, violations of our Code of Conduct or other unacceptable behaviors. However, it is not always possible to identify and deter misconduct by employees and other third-parties, which may result in governmental investigations, other actions or lawsuits. If such actions are taken against us we may suffer loss of reputation and such actions could have a material effect on our financial condition, results of operations and cash flows.
Our subsidiary, NSP-Minnesota, is subject to the risks of nuclear generation.
NSP-Minnesota has two nuclear generation plants, PI and Monticello. Risks of nuclear generation include:
•Hazards associated with the use of radioactive material in energy production, including management, handling, storage and disposal.
•Limitations on insurance available to cover losses that may arise in connection with nuclear operations, as well as obligations to contribute to an insurance pool in the event of damages at a covered U.S. reactor.
•Technological and financial uncertainties related to the costs of decommissioning nuclear plants may cause our funding obligations to change.
The NRC has authority to impose licensing and safety-related requirements for the operation of nuclear generation facilities, including the ability to impose fines and/or shut down a unit until compliance is achieved. NRC safety requirements could necessitate substantial capital expenditures or an increase in operating expenses. In addition, the INPO reviews NSP-Minnesota’s nuclear operations. Compliance with the INPO’s recommendations could result in substantial capital expenditures or a substantial increase in operating expenses.
If a nuclear incident did occur, it could have a material impact on our results of operations, financial condition or cash flows. Furthermore, non-compliance or the occurrence of a serious incident at other nuclear facilities could result in increased industry regulation, which may increase NSP-Minnesota’s compliance costs.
Financial Risks
Our profitability depends on the ability of our utility subsidiaries to recover their costs and changes in regulation may impair the ability of our utility subsidiaries to recover costs from their customers.
We are subject to comprehensive regulation by federal and state utility regulatory agencies, including siting and construction of facilities, customer service and the rates that we can charge customers.
The profitability of our utility operations is dependent on our ability to recover the costs of providing energy and utility services and earn a return on capital investment. Our rates are generally regulated and are based on an analysis of the utility’s costs incurred in a test year. The utility subsidiaries are subject to both future and historical test years depending upon the regulatory jurisdiction. Thus, the rates a utility is allowed to charge may or may not match its costs at any given time. Rate regulation is premised on providing an opportunity to earn a reasonable rate of return on invested capital.
There can also be no assurance that our regulatory commissions will judge all the costs of our utility subsidiaries to be prudent, which could result in disallowances, or that the regulatory process will always result in rates that will produce full recovery.
Overall, management believes prudently incurred costs are recoverable given the existing regulatory framework. However, there may be changes in the regulatory environment that could impair the ability of our utility subsidiaries to recover costs historically collected from customers, or these subsidiaries could exceed caps on capital costs required by commissions and result in less than full recovery.
Changes in the long-term cost-effectiveness or to the operating conditions of our assets may result in early retirements of utility facilities. While regulation typically provides cost recovery for these types of changes, there is no assurance that regulators would allow full recovery of all remaining costs.
Higher than expected inflation or tariffs may increase costs of construction and operations. Also, rising fuel costs could increase the risk that our utility subsidiaries will not be able to fully recover their fuel costs from their customers.
Adverse regulatory rulings (including changes in recovery mechanisms) or the imposition of additional regulations could have an adverse impact on our results of operations and materially affect our ability to meet our financial obligations, including debt payments and the payment of dividends on common stock.
Any reductions in our credit ratings could increase our financing costs and the cost of maintaining certain contractual relationships.
Our credit ratings are subject to change and our credit ratings may be lowered or withdrawn by a rating agency. Significant events including disallowance of costs, use of historic test years, elimination of riders or interim rates, increasing depreciation lives, lower returns on equity, changes to equity ratios and impacts of tax policy may impact our cash flows and credit metrics, potentially resulting in a change in our credit ratings. In addition, our credit ratings may change as a result of the differing methodologies or change in the methodologies used by the various rating agencies.
Any credit ratings downgrade could lead to higher borrowing costs or lower proceeds from equity issuances. It could also impact our ability to access capital markets. Also, our utility subsidiaries may enter into contracts that require posting of collateral or settlement if credit ratings fall below investment grade.
We are subject to capital market and interest rate risks.
Utility operations require significant capital investment. As a result, we frequently need to access capital markets. Any disruption in capital markets could have a material impact on our ability to fund our operations. Capital market disruption and financial market distress could prevent us from issuing commercial paper, issuing new securities or cause us to issue securities with unfavorable terms and conditions, such as higher interest rates or lower proceeds from equity issuances. Higher interest rates on short-term borrowings with variable interest rates could also have an adverse effect on our operating results.
The performance of capital markets impacts the value of assets held in trusts to satisfy future obligations to decommission NSP-Minnesota’s nuclear plants and satisfy our defined benefit pension and postretirement benefit plan obligations. These assets are subject to market fluctuations and yield uncertain returns, which may fall below expected returns. A decline in the market value of these assets may increase funding requirements. Additionally, the fair value of the debt securities held in the nuclear decommissioning and/or pension trusts may be impacted by changes in interest rates.
We are subject to credit risks.
Credit risk includes the risk that our customers will not pay their bills, which may lead to a reduction in our cash flow and liquidity and an increase in bad debt expense. Credit risk is comprised of numerous factors including the price of products and services provided, the economy and unemployment rates.
Credit risk also includes the risk that counterparties that owe us money or product will become insolvent and may breach their obligations. Should the counterparties fail to perform, we may be forced to enter into alternative arrangements. In that event, our financial results could be adversely affected and incur losses.
Xcel Energy may have direct credit exposure in our short-term wholesale and commodity trading activity to financial institutions trading for their own accounts or issuing collateral support on behalf of other counterparties. We may also have some indirect credit exposure due to participation in organized markets, (e.g., MISO, SPP, ERCOT and California Independent System Operator), in which any credit losses are socialized to all market participants.
We have additional indirect credit exposure to financial institutions from letters of credit provided as security by power suppliers under various purchased power contracts. If any of the credit ratings of the letter of credit issuers were to drop below investment grade, the supplier would need to replace that security with an acceptable substitute. If the security were not replaced, the party could be in default under the contract.
Increasing costs of our defined benefit retirement plans and employee benefits may adversely affect our results of operations, financial condition or cash flows.
We have defined benefit pension and postretirement plans that cover most of our employees. Assumptions related to future costs, return on investments, interest rates and other actuarial assumptions have a significant impact on our funding requirements of these plans. Estimates and assumptions may change. In addition, the Pension Protection Act sets the minimum funding requirements for defined benefit pension plans. Therefore, our funding requirements and contributions may change in the future.
Also, the payout of a significant percentage of pension plan liabilities in a single year, due to high numbers of retirements or employees leaving, would trigger settlement accounting and could require Xcel Energy to recognize incremental pension expense related to unrecognized plan losses in the year liabilities are paid. Changes in industry standards utilized in key assumptions (e.g., mortality tables) could have a significant impact on future obligations and benefit costs.
Increasing costs associated with health care plans may adversely affect our results of operations.
Increasing levels of large individual health care claims and overall health care claims could have an adverse impact on our results of operations, financial condition or cash flows. Health care legislation could also significantly impact our benefit programs and costs.
We must rely on cash from our subsidiaries to make dividend payments.
Investments in our subsidiaries are our primary assets. Substantially all our operations are conducted by our subsidiaries. Consequently, our operating cash flow and ability to service our debt and pay dividends depends upon the operating cash flows of our subsidiaries and their payment of dividends.
Our subsidiaries are separate legal entities that have no obligation to pay any amounts due pursuant to our obligations or to make any funds available for dividends on our common stock. In addition, each subsidiary’s ability to pay dividends depends on statutory and/or contractual restrictions which may include requirements to maintain minimum levels of equity ratios, working capital or assets.
If the utility subsidiaries were to cease making dividend payments, our ability to pay dividends on our common stock or otherwise meet our financial obligations could be adversely affected. Our utility subsidiaries are regulated by state utility commissions, which possess broad powers to prioritize that the needs of the utility customers are met. We may be negatively impacted by the actions of state commissions that limit the payment of dividends by our utility subsidiaries.
Federal tax law may significantly impact our business.
Our utility subsidiaries collect estimated federal, state and local tax payments through their regulated rates. Changes to federal tax law may benefit or adversely affect our earnings and customer costs. Tax depreciable lives and the value/availability of various tax credits or the timeliness of their utilization may impact the economics or selection of resources. If tax rates are increased, there could be timing delays before regulated rates provide for recovery of such tax increases in revenues. In addition, certain IRS tax policies, such as tax normalization, may impact our ability to economically deliver certain types of resources relative to market prices.
Macroeconomic Risks
Economic conditions impact our business.
Xcel Energy’s operations are affected by economic conditions, which correlates to customers/sales growth (decline). Economic conditions may be impacted by recessionary factors, rising interest rates and insufficient financial sector liquidity leading to potential increased unemployment, which may impact customers’ ability to pay their bills, which could lead to additional bad debt expense.
Our utility subsidiaries face competitive factors, which could have an adverse impact on our financial condition, results of operations and cash flows. Further, worldwide economic activity impacts the demand for basic commodities necessary for utility infrastructure, which may inhibit our ability to acquire sufficient supplies. We operate in a capital-intensive industry and federal trade policy could significantly impact the cost of materials we use. There may be delays before these additional material costs can be recovered in rates.
The oil and gas industry represents our largest commercial and industrial customer base. Oil and natural gas prices are sensitive to market risk factors which may impact demand.
We face risks related to health epidemics and other outbreaks, which may have a material effect on our financial condition, results of operations and cash flows.
Health epidemics impact countries, communities, supply chains and markets. Uncertainty continues to exist regarding epidemics; the duration and magnitude of business restrictions including shutdowns (domestically and globally); the potential impact on the workforce including shortages of employees and third-party contractors due to quarantine policies, vaccination requirements or government restrictions; impacts on the transportation of goods, and the generalized impact on the economy.
We cannot ultimately predict whether an epidemic will have a material impact on our future liquidity, financial condition or results of operations. Nor can we predict the impact on the health of our employees, our supply chain or our ability to recover higher costs associated with managing an outbreak.
Operations could be impacted by war, terrorism or other events.
Our generation plants, fuel storage facilities, transmission and distribution facilities and information and control systems may be targets of terrorist activities. Any disruption could impact operations or result in a decrease in revenues and additional costs to repair and insure our assets. These disruptions could have a material impact on our financial condition, results of operations or cash flows.
The potential for terrorism has subjected our operations to increased risks and could have a material effect on our business. We have incurred increased costs for security and capital expenditures in response to these risks. The insurance industry has also been affected by these events and the availability of insurance may decrease. In addition, insurance may have higher deductibles, higher premiums and more restrictive policy terms.
A disruption of the regional electric transmission grid, interstate natural gas pipeline infrastructure or other fuel sources, could negatively impact our business, brand and reputation. Because our facilities are part of an interconnected system, we face the risk of possible loss of business due to a disruption caused by the actions of a neighboring utility.
We also face the risks of possible loss of business due to significant events such as severe storms, temperature extremes, wildfires (particularly in Colorado), widespread pandemic, generator or transmission facility outage, pipeline rupture, railroad disruption, operator error, sudden and significant increase or decrease in wind generation or a workforce disruption.
In addition, major catastrophic events throughout the world may disrupt our business. While we have business continuity plans in place, our ability to recover may be prolonged due to the type and extent of the event. Xcel Energy participates in a global supply chain, which includes materials and components that are globally sourced. A prolonged disruption could result in the delay of equipment and materials that may impact our ability to connect, restore and reliably serve our customers.
A major disruption could result in a significant decrease in revenues, additional costs to repair assets, and an adverse impact on the cost and availability of insurance, which could have a material impact on our results of operations, financial condition or cash flows.
A cybersecurity incident or security breach could have a material effect on our business.
We operate in an industry that requires the continued operation of sophisticated information technology, control systems and network infrastructure. In addition, we use our systems and infrastructure to create, collect, use, disclose, store, dispose of and otherwise process sensitive information, including Company data, customer energy usage data, and personal information regarding customers, employees and their dependents, contractors, shareholders and other individuals.
Xcel Energy’s generation, transmission, distribution and fuel storage facilities, information technology systems and other infrastructure or physical assets as well as information processed in our systems (e.g., information regarding our customers, employees, operations, infrastructure and assets) could be affected by cybersecurity incidents, including those caused by human error.
The utility industry has been the target of several attacks on operational systems and has seen an increased volume and sophistication of cybersecurity incidents from international activist organizations, other countries and individuals. We expect to continue to experience attempts to compromise our information technology and control systems, network infrastructure and other assets. To date, no cybersecurity incident or attack has had a material impact on our business or results of operations.
Cybersecurity incidents could harm our businesses by limiting our generation, transmission and distribution capabilities, delaying our development and construction of new facilities or capital improvement projects to existing facilities, disrupting our customer operations or causing the release of customer information, all of which would likely receive state and federal regulatory scrutiny and could expose us to liability.
Xcel Energy’s generation, transmission systems and natural gas pipelines are part of an interconnected system. Therefore, a disruption caused by the impact of a cybersecurity incident on the regional electric transmission grid, natural gas pipeline infrastructure or other fuel sources of our third-party service providers’ operations, could also negatively impact our business.
Generative Artificial Intelligence, such as large language models like ChatGPT, present a range of challenges and potential risks as we consider impacts to the business. These challenges involve navigating the complexities of creating and deploying AI models that generate content autonomously. Data privacy, legal concerns, and security issues are all risks as this technology continues to be adopted.
Our supply chain for procurement of digital equipment and services may expose software or hardware to these risks and could result in a breach or significant costs of remediation. We are unable to quantify the potential impact of cybersecurity threats or subsequent related actions. Cybersecurity incidents and regulatory action could result in a material decrease in revenues and may cause significant additional costs (e.g., penalties, third-party claims, repairs, insurance or compliance) and potentially disrupt our supply and markets for natural gas, oil and other fuels.
We maintain security measures to protect our information technology and control systems, network infrastructure and other assets. However, these assets and the information they process may be vulnerable to cybersecurity incidents, including asset failure or unauthorized access to assets or information.
A failure or breach of our technology systems or those of our third-party service providers could disrupt critical business functions and may negatively impact our business, our brand, and our reputation. The cybersecurity threat is dynamic and evolves continually, and our efforts to prioritize network protection may not be effective given the constant changes to threat vulnerability.
While the Company maintains insurance relating to cybersecurity events, such insurance is subject to a number of exclusions and may be insufficient to offset any losses, costs or damages experienced. Also, the market for cybersecurity insurance is relatively new and coverage available for cybersecurity events is evolving as the industry matures.
Our operating results may fluctuate on a seasonal and quarterly basis and can be adversely affected by milder weather.
Our electric and natural gas utility businesses are seasonal and weather patterns can have a material impact on our operating performance. Demand for electricity is often greater in the summer and winter months associated with cooling and heating. Because natural gas is heavily used for residential and commercial heating, the demand depends heavily upon weather patterns. A significant amount of natural gas revenues are recognized in the first and fourth quarters related to the heating season. Accordingly, our operations have historically generated less revenues and income when weather conditions are milder in the winter and cooler in the summer. Unusually mild winters and summers could have an adverse effect on our financial condition, results of operations or cash flows.
Public Policy Risks
Increased risks of regulatory penalties could negatively impact our business.
The Energy Act increased civil penalty authority for violation of FERC statutes, rules and orders. FERC can impose penalties of up to $1.5 million per violation per day, particularly as it relates to energy trading activities for both electricity and natural gas. In addition, NERC electric reliability standards and critical infrastructure protection requirements are mandatory and subject to potential financial penalties. Also, the PHMSA, Occupational Safety and Health Administration and other federal agencies have the authority to assess penalties.
In the event of serious incidents, these agencies may pursue penalties. In addition, certain states have the authority to impose substantial penalties. If a serious reliability, cybersecurity or safety incident did occur, it could have a material effect on our results of operations, financial condition or cash flows.
The continued use of natural gas for both power generation and gas distribution have increasingly become a public policy advocacy target. These efforts may result in a limitation of natural gas as an energy source for both power generation and heating, which could impact our ability to reliably and affordably serve our customers.
In recent years, there have been various local and state agency proposals within and outside our service territories that would attempt to restrict the use and availability of natural gas. If such policies were to prevail, we may be forced to make new resource investment decisions which could potentially result in stranded costs if we are not able to fully recover costs and investments and impact the overall reliability of our service.
Environmental Policy Risks
We may be subject to legislative and regulatory responses to climate change, with which compliance could be difficult and costly.
Legislative and regulatory responses related to climate change may create financial risk as our facilities may be subject to additional regulation at either the state or federal level in the future. International agreements could additionally lead to future federal or state regulations.
In 2015, the United Nations Framework Convention on Climate Change reached consensus among 190 nations on an agreement (the Paris Agreement) that establishes a framework for GHG mitigation actions by all countries, with a goal of holding the increase in global average temperature to below 2º Celsius above pre-industrial levels and an aspiration to limit the increase to 1.5º Celsius.
International commitments and agreements could result in future additional GHG reductions in the United States. In addition, in 2023 the EPA intends to publish draft regulations for GHG emissions from the power sector consistent with the agency’s Clean Air Act authorities.
Many states and localities continue to pursue their own climate policies. The steps Xcel Energy has taken to date to reduce GHG emissions, including energy efficiency measures, adding renewable generation and retiring or converting coal plants to natural gas, occurred under state-endorsed resource plans, renewable energy standards and other state policies.
We may be subject to climate change lawsuits. An adverse outcome could require substantial capital expenditures and possibly require payment of substantial penalties or damages. Defense costs associated with such litigation can also be significant and could affect results of operations, financial condition or cash flows if such costs are not recovered through regulated rates.
If our regulators do not allow us to recover all or a part of the cost of capital investment or the O&M costs incurred to comply with the mandates, it could have a material effect on our results of operations, financial condition or cash flows.
We are subject to environmental laws and regulations, with which compliance could be difficult and costly.
We are subject to environmental laws and regulations that affect many aspects of our operations, including air emissions, water quality, wastewater discharges and the generation, transport and disposal of solid wastes and hazardous substances. Laws and regulations require us to obtain permits, licenses, and approvals and to comply with a variety of environmental requirements.
Environmental laws and regulations can also require us to restrict or limit the output of facilities or the use of certain fuels, shift generation to lower-emitting facilities, install pollution control equipment, clean up spills and other contamination and correct environmental hazards. Failure to meet requirements of environmental mandates may result in fines or penalties. We may be required to pay all or a portion of the cost to remediate sites where our past activities, or the activities of other parties, caused environmental contamination.
Changes in environmental policies and regulations or regulatory decisions may result in early retirements of our generation facilities. While regulation typically provides relief for these types of changes, there is no assurance that regulators would allow full recovery of all remaining costs.
We are subject to mandates to provide customers with clean energy, renewable energy and energy conservation offerings. It could have a material effect on our results of operations, financial condition or cash flows if our regulators do not allow us to recover the cost of capital investment or O&M costs incurred to comply with the requirements.
In addition, existing environmental laws or regulations may be revised and new laws or regulations may be adopted. We may also incur additional unanticipated obligations or liabilities under existing environmental laws and regulations.
We are subject to physical and financial risks associated with climate change and other weather, natural disaster and resource depletion impacts.
Climate change can create physical and financial risk. Physical risks include changes in weather conditions and extreme weather events. Our customers’ energy needs vary with weather. To the extent weather conditions are affected by climate change, customers’ energy use could increase or decrease. Increased energy use due to weather changes may require us to invest in generating assets, transmission and infrastructure. Decreased energy use due to weather changes may result in decreased revenues.
Climate change may impact the economy, which could impact our sales and revenues. The price of energy has an impact on the economic health of our communities. The cost of additional regulatory requirements, such as regulation of GHG, could impact the availability of goods and prices charged by our suppliers which would normally be borne by consumers through higher prices for energy and purchased goods.
To the extent financial markets view climate change and emissions of GHGs as a financial risk, this could negatively affect our ability to access capital markets or cause us to receive less than ideal terms and conditions.
We establish strategies and expectations related to climate change and other environmental matters. Our ability to achieve any such strategies or expectations is subject to numerous factors and conditions, many of which are outside of our control. Examples of such factors include, but are not limited to, evolving legal, regulatory, and other standards, processes, and assumptions, the pace of scientific and technological developments, increased costs, the availability of requisite financing, and changes in carbon markets. Failures or delays (whether actual or perceived) in achieving our strategies or expectations related to climate change and other environmental matters could adversely affect our business, operations, and reputation, and increase risk of litigation.
Severe weather impacts our service territories, primarily when thunderstorms, flooding, tornadoes, wildfires and snow or ice storms or extreme temperatures (high heating/cooling days) occur. Extreme weather conditions in general require system backup and can contribute to increased system stress, including service interruptions. Extreme weather conditions creating high energy demand may raise electricity prices, increasing the cost of energy we provide to our customers.
To the extent the frequency of extreme weather events increases, this could increase our cost of providing service and result in more frequent service interruptions. Periods of extreme temperatures could also impact our ability to meet demand.
More frequent and severe drought conditions, extreme swings in amount and timing of precipitation, changes in vegetation, unseasonably warm temperatures, very low humidity, stronger winds and other factors have increased the duration of the wildfire season and the potential impact of an event. Also, the expansion of the wildland urban interface increases the wildfire risk to surrounding communities and Xcel Energy's electric and natural gas infrastructure.
Other potential risks associated with wildfires and other climate events include the inability to secure sufficient insurance coverage, or increased costs of insurance, regulatory recovery risk, and the potential for a credit downgrade and subsequent additional costs to access capital markets.
While we carry liability insurance, given an extreme event, if Xcel Energy was found to be liable for wildfire damages, amounts that potentially exceed our coverage could negatively impact our results of operations, financial condition or cash flows.
Drought or water depletion could adversely impact our ability to provide electricity to customers, cause early retirement of power plants and increase the cost for energy. Adverse events may result in increased insurance costs and/or decreased insurance availability. We may not recover all costs related to mitigating these physical and financial risks.
| | |
ITEM 1B — UNRESOLVED STAFF COMMENTS |
None.
As described in Item 1A – Risk Factors, Xcel Energy operates in an industry that requires the continued operation of sophisticated information technology, control systems and network infrastructure, as such, our business is subject to the risk of interruption by cybersecurity incidents that range from attacks common to most industries, such as phishing and denial-of-service, to attacks from more sophisticated adversaries, including nation state actors, that target the critical infrastructure used in the operation of our business.
The Company has a security risk program in place to identify, assess, manage and report material risks from cybersecurity incidents. As a utility provider, Xcel Energy complies with reliability standards imposed by NERC, including critical infrastructure protection standards related to both cybersecurity and physical security. These standards imposed by NERC, in alignment with the NIST Cybersecurity Framework, are the basis for which Xcel Energy has designed the cybersecurity control framework within its security risk program.
Annually, as part of Xcel Energy’s enterprise risk program, an integrated cybersecurity risk identification and assessment is completed across Xcel Energy’s business, including generation, transmission, distribution and fuel storage facilities, information technology systems and other infrastructure or physical assets as well as information processed in our systems (including systems hosted by third parties) that could be affected by cybersecurity incidents. This analysis includes the impact, likelihood, timeframe and controllability of cybersecurity risks and is presented to the Board of Directors. Management monitors and reviews the results of this analysis, integrating them into the enterprise risk assessment processes and implements appropriate mitigating actions as needed.
Xcel Energy’s cybersecurity policies, standards, practices and readiness are regularly assessed by third-party consultants. These partners are engaged to perform independent penetration testing and other security related services to assist in the prevention, detection, monitoring, mitigation and remediation of cybersecurity incidents and risks. The results of these assessments are communicated to management and the Board of Directors by the Chief Security Officer.
Xcel Energy employs a comprehensive risk based approach to assess the magnitude and significance of a vendor’s risk to the Company. Certain third-party service providers are subject to vendor security risk assessments at the time of integration, contract execution/renewal, and upon detection of any increase in risk profile. Xcel Energy uses a variety of inputs in such risk assessments, including information supplied by providers and third parties (including information analysis centers that share daily threat intelligence and improve organizational agility associated with management of cybersecurity risks). In addition, the Company requires certain third-party service providers to meet appropriate security requirements, controls and responsibilities. The Company deploys periodic monitoring activities to assess compliance with our cybersecurity control framework and investigates security incidents that have impacted our third-party service providers as appropriate.
Management has assigned responsibility for the security risk program to the Chief Security Officer who has extensive experience in critical infrastructure protection, including multiple years of experience with the Department of Defense. The Chief Security Officer is informed about and monitors prevention, detection, mitigation and remediation efforts through a team of security professionals, many of whom are Certified Information Systems Security Professionals, Certified Information Security Managers or have received other cybersecurity certifications. The team has extensive experience selecting, deploying and operating cybersecurity technologies, initiatives and processes that aid in preventing, remediating and mitigating known and unknown cybersecurity threats.
The Chief Security Officer or members of management brief the Board on routine and regular cybersecurity risk and threat updates, typically on a quarterly basis. In the event of a significant threat or incident, management and the Chief Security Officer leverage Xcel Energy’s incident response processes to assess impacts and resolve incidents. When a significant cybersecurity incident occurs, management communicates with the Board of Directors and relevant committees.
The Board of Directors oversees the risks associated with cybersecurity and the physical security of our assets, with information security matters being discussed at each regular board meeting as well as at the ONES and Audit Committee meetings throughout the year.
While the ONES Committee has primary committee responsibility for cybersecurity due to the operational issues involved, the Board of Directors has determined that the topic is of sufficient importance to warrant this comprehensive oversight approach. Augmenting such oversight efforts, the Board of Directors conducts drills to practice its response in a possible emergency situation to ensure it is well prepared and positioned to perform in a possible crisis.
Cybersecurity risks are a part of Xcel Energy’s normal course of business. To date, no cybersecurity incident or attack has had a material impact on our business or results of operations. As of Feb. 21, 2024 there have been no material cybersecurity incidents to report.
Virtually all of the utility plant property of the operating companies is subject to the lien of their respective first mortgage bond indentures.
| | | | | | | | | | | | | | | | | | | | | | | |
NSP-Minnesota Station, Location and Unit at Dec. 31, 2023 | | Fuel | | Installed | | MW (a) | |
| Steam: | | | | | | | |
| A.S. King-Bayport, MN, 1 Unit | | Coal | | 1968 | | 511 | | |
| Sherco-Becker, MN | | | | | | | |
| Unit 1 | | Coal | | 1976 | | 680 | | |
| Unit 2 | | Coal | | 1977 | | 682 | | (b) |
| Unit 3 | | Coal | | 1987 | | 517 | | (c) |
| Monticello, MN, 1 Unit | | Nuclear | | 1971 | | 617 | | |
| PI-Welch, MN | | | | | | | |
| Unit 1 | | Nuclear | | 1973 | | 521 | | |
| Unit 2 | | Nuclear | | 1974 | | 519 | | |
| Various locations, 4 Units | | Wood/RDF | | Various | | 36 | | (d) |
| Combustion Turbine: | | | | | | | |
| Angus Anson-Sioux Falls, SD, 3 Units | | Natural Gas | | 1994 - 2005 | | 343 | | |
| Black Dog-Burnsville, MN, 3 Units | | Natural Gas | | 1987 - 2018 | | 491 | | |
| Blue Lake-Shakopee, MN, 6 Units | | Natural Gas/Oil | | 1974 - 2005 | | 454 | | |
| High Bridge-St. Paul, MN, 3 Units | | Natural Gas | | 2008 | | 530 | | |
| Inver Hills-Inver Grove Heights, MN, 8 Units | | Natural Gas/ Oil | | 1972 - 1996 | | 276 | | |
| Riverside-Minneapolis, MN, 3 Units | | Natural Gas | | 2009 | | 454 | | |
| Hydro: | | | | | | | |
| Hennepin Island-Minneapolis, MN 5 Units | | Hydro | | 1954-1955 | | 6 | | |
| Wind: | | | | | | | |
| Blazing Star 1-Lincoln County, MN, 100 Units | | Wind | | 2020 | | 200 | | (e) |
| Blazing Star 2-Lincoln County, MN, 100 Units | | Wind | | 2021 | | 200 | | (e) |
| Border-Rolette County, ND, 75 Units | | Wind | | 2015 | | 148 | | (e) |
| Community Wind North-Lincoln County, MN, 12 Units | | Wind | | 2020 | | 26 | | (e) |
| Courtenay Wind-Stutsman County, ND, 100 Units | | Wind | | 2016 | | 190 | | (e) |
| Crowned Ridge 2-Grant County, SD, 88 Units | | Wind | | 2020 | | 192 | | (e) |
| Dakota Range, SD, 72 Units | | Wind | | 2022 | | 298 | | (e) |
| Foxtail-Dickey County, ND, 75 Units | | Wind | | 2019 | | 150 | | (e) |
| Freeborn-Freeborn County, MN, 100 Units | | Wind | | 2021 | | 200 | | (e) |
Grand Meadow-Mower County, MN, 67 Units (f) | | Wind | | 2008 | | 99 | | (e) |
| Jeffers-Cottonwood County, MN, 20 Units | | Wind | | 2020 | | 43 | | (e) |
| Lake Benton-Pipestone County, MN, 44 Units | | Wind | | 2019 | | 99 | | (e) |
| Mower-Mower County, MN, 43 Units | | Wind | | 2021 | | 91 | | (e) |
| Nobles-Nobles County, MN, 133 Units | | Wind | | 2010 | | 200 | | (e) |
Northern Wind-Murray County, MN, 37 Units (g) | | Wind | | 2023 | | 92 | | (e) |
| Pleasant Valley-Mower County, MN, 100 Units | | Wind | | 2015 | | 196 | | (e) |
| Rock Aetna - Murray County, MN, 8 Units | | Wind | | 2022 | | 20 | | (e) |
| | | | Total | | 9,081 | | |
(a)Summer 2023 net dependable capacity. Wind is presented as net maximum capacity.
(b)Retired on Dec. 31, 2023.
(c)Based on NSP-Minnesota’s ownership of 59%.
(d)RDF is made from municipal solid waste.
(e)Net maximum capacity is attainable only when wind conditions are sufficiently available. Typical average capacity factors are 35-50% for wind facilities. For the year ended Dec. 31, 2023, NSP-Minnesota’s wind facilities had a weighted-average capacity factors of 43%.
(f)Repowered in 2023.
(g)Purchased in 2023.
| | | | | | | | | | | | | | | | | | | | | | | |
NSP-Wisconsin Station, Location and Unit at Dec. 31, 2023 | | Fuel | | Installed | | MW (a) | |
| Steam: | | | | | | | |
| Bay Front-Ashland, WI, 2 Units | | Wood/Natural Gas | | 1948 - 1956 | | 41 | | |
| French Island-La Crosse, WI, 2 Units | | Wood/RDF | | 1940 - 1948 | | 16 | | (b) |
| Combustion Turbine: | | | | | | | |
| French Island-La Crosse, WI, 2 Units | | Oil | | 1974 | | 119 | | |
| Wheaton-Eau Claire, WI, 5 Units | | Natural Gas/Oil | | 1973 | | 240 | | |
| Hydro: | | | | | | | |
| Various locations, 62 Units | | Hydro | | Various | | 135 | | |
| | | | Total | | 551 | | |
(a)Summer 2023 net dependable capacity.
(b)RDF is made from municipal solid waste.
| | | | | | | | | | | | | | | | | | | | | | | |
PSCo Station, Location and Unit at Dec. 31, 2023 | | Fuel | | Installed | | MW (a) | |
| Steam: | | | | | | | |
| Comanche-Pueblo, CO | | | | | | | |
| Unit 2 | | Coal | | 1975 | | 330 | | |
| Unit 3 | | Coal | | 2010 | | 500 | | (b) |
| Craig-Craig, CO, 2 Units | | Coal | | 1979 - 1980 | | 82 | | (c) |
Hayden-Hayden, CO, 2 Units | | Coal | | 1965 - 1976 | | 233 | | (d) |
| Pawnee-Brush, CO, 1 Unit | | Coal | | 1981 | | 505 | | |
| Cherokee-Denver, CO, 1 Unit | | Natural Gas | | 1968 | | 310 | | |
| Combustion Turbine: | | | | | | | |
| Blue Spruce-Aurora, CO, 2 Units | | Natural Gas | | 2003 | | 264 | | |
| Cherokee-Denver, CO, 3 Units | | Natural Gas | | 2015 | | 576 | | |
| Fort St. Vrain-Platteville, CO, 6 Units | | Natural Gas | | 1972 - 2009 | | 1,022 | | |
| Manchief, CO, 2 Units | | Natural Gas | | 2000 | | 250 | | |
| Rocky Mountain-Keenesburg, CO, 3 Units | | Natural Gas | | 2004 | | 592 | | |
| Various locations, 8 Units | | Natural Gas | | Various | | 247 | | |
| Hydro: | | | | | | | |
| Cabin Creek-Georgetown, CO | | | | | | | |
| Pumped Storage, 2 Units | | Hydro | | 1967 | | 210 | | |
| Various locations, 6 Units | | Hydro | | Various | | 23 | | |
| Wind: | | | | | | | |
| Rush Creek, CO, 300 units | | Wind | | 2018 | | 582 | | (e) |
| Cheyenne Ridge, CO, 229 units | | Wind | | 2020 | | 477 | | (e) |
| | | | Total | | 6,203 | | |
(a)Summer 2023 net dependable capacity. Wind is presented as net maximum capacity.
(b)Based on PSCo’s ownership of 67%.
(c)Based on PSCo’s ownership of 10%.
(d)Based on PSCo’s ownership of 76% of Unit 1 and 37% of Unit 2.
(e)Net maximum capacity is attainable only when wind conditions are sufficiently available. Typical average capacity factors are 35-50% for wind facilities. For the year ended Dec. 31, 2023, PSCo’s wind facilities had a weighted-average capacity factors of 43%.
| | | | | | | | | | | | | | | | | | | | | | | |
SPS Station, Location and Unit at Dec. 31, 2023 | | Fuel | | Installed | | MW (a) | |
| Steam: | | | | | | | |
| Cunningham-Hobbs, NM, 1 Unit | | Natural Gas | | 1957 - 1965 | | 183 | | (b) |
| Harrington-Amarillo, TX, 3 Units | | Coal | | 1976 - 1980 | | 1,018 | | |
| Jones-Lubbock, TX, 2 Units | | Natural Gas | | 1971 - 1974 | | 486 | | |
| Maddox-Hobbs, NM, 1 Unit | | Natural Gas | | 1967 | | 112 | | |
| Nichols-Amarillo, TX, 3 Units | | Natural Gas | | 1960 - 1968 | | 457 | | |
| Plant X-Earth, TX, 1 Unit | | Natural Gas | | 1952 - 1964 | | 190 | | (b) |
| Tolk-Muleshoe, TX, 2 Units | | Coal | | 1982 - 1985 | | 1,067 | | |
| Combustion Turbine: | | | | | | | |
| Cunningham-Hobbs, NM, 2 Units | | Natural Gas | | 1997 | | 207 | | |
| Jones-Lubbock, TX, 2 Units | | Natural Gas | | 2011 - 2013 | | 334 | | |
| Maddox-Hobbs, NM, 1 Unit | | Natural Gas | | 1963 - 1976 | | 61 | | |
| Wind: | | | | | | | |
| Hale-Plainview, TX, 239 Units | | Wind | | 2019 | | 478 | | (c) |
| Sagamore-Dora, NM, 240 Units | | Wind | | 2020 | | 507 | | (c) |
| | | | Total | | 5,100 | | |
(a)Summer 2023 net dependable capacity. Wind is presented as net maximum capacity.
(b)Retired unit(s) in 2023.
(c)Net maximum capacity is attainable only when wind conditions are sufficiently available. Typical average capacity factors are 35-50% for wind facilities. For the year ended Dec. 31, 2023 SPS’ wind facilities had a weighted-average capacity factors of 48%.
Electric utility overhead and underground transmission and distribution lines at Dec. 31, 2023:
| | | | | | | | | | | | | | | | | | | | | | | | | | |
| Conductor Miles | | NSP-Minnesota | | NSP-Wisconsin | | PSCo | | SPS |
| Transmission | | | | | | | | |
| 500 KV | | 2,916 | | | — | | | — | | | — | |
| 345 KV | | 12,845 | | | 3,019 | | | 5,421 | | | 11,701 | |
| 230 KV | | 2,300 | | | — | | | 12,244 | | | 9,854 | |
| 161 KV | | 626 | | | 1,818 | | | — | | | — | |
| 138 KV | | — | | | — | | | 92 | | | — | |
| 115 KV | | 8,071 | | | 1,862 | | | 4,994 | | | 14,896 | |
| Less than 115 KV | | 6,640 | | | 5,467 | | | 1,782 | | | 4,494 | |
| Total Transmission | | 33,398 | | | 12,166 | | | 24,533 | | | 40,945 | |
| | | | | | | | |
| Distribution | | | | | | | | |
| Less than 115 KV | | 83,854 | | | 27,971 | | | 80,176 | | | 23,965 | |
| | | | | | | | |
| Total | | 117,252 | | | 40,137 | | | 104,709 | | | 64,910 | |
Electric utility transmission and distribution substations at Dec. 31, 2023:
| | | | | | | | | | | | | | | | | | | | | | | | | | |
| | NSP-Minnesota | | NSP-Wisconsin | | PSCo | | SPS |
| Substations | | 353 | | | 201 | | | 233 | | | 449 | |
Natural gas utility mains at Dec. 31, 2023:
| | | | | | | | | | | | | | | | | | | | | | | | | | | | | | | | |
| Miles | | NSP-Minnesota | | NSP-Wisconsin | | PSCo | | SPS | | WGI |
| Transmission | | 78 | | | 3 | | | 2,024 | | | 20 | | | 11 | |
| Distribution | | 10,894 | | | 2,564 | | | 23,494 | | | — | | | — | |
| | |
ITEM 3 — LEGAL PROCEEDINGS |
Xcel Energy is involved in various litigation matters in the ordinary course of business. The assessment of whether a loss is probable or is a reasonable possibility, and whether the loss or a range of loss is estimable, often involves a series of complex judgments about future events. Management maintains accruals for losses probable of being incurred and subject to reasonable estimation.
Management is sometimes unable to estimate an amount or range of a reasonably possible loss in certain situations, including but not limited to when (1) the damages sought are indeterminate, (2) the proceedings are in the early stages, or (3) the matters involve novel or unsettled legal theories. In such cases, there is considerable uncertainty regarding the timing or ultimate resolution of such matters, including a possible eventual loss.
For current proceedings not specifically reported herein, management does not anticipate that the ultimate liabilities, if any, would have a material effect on Xcel Energy’s consolidated financial statements. Legal fees are generally expensed as incurred.
See Note 12 to the consolidated financial statements, Item 1 and Item 7 for further information.
| | |
ITEM 4 — MINE SAFETY DISCLOSURES |
None.
PART II
| | |
ITEM 5 — MARKET FOR REGISTRANT’S COMMON EQUITY, RELATED STOCKHOLDER MATTERS AND ISSUER PURCHASES OF EQUITY SECURITIES. |
Stock Data
Xcel Energy Inc.’s common stock is listed on the Nasdaq Global Select Market (Nasdaq). The trading symbol is XEL. The number of common stockholders of record as of Feb. 15, 2024 was 45,486.
The following compares our cumulative TSR on common stock with the cumulative TSR of the EEI Investor-Owned Electrics Index and the S&P 500 Composite Stock Price Index over the last five years.
The EEI Investor-Owned Electrics Index (market capitalization-weighted) included 39 companies at year-end and is a broad measure of industry performance.
Comparison of Five Year Cumulative Total Return*
* $100 invested on Dec. 31, 2018 in stock or index — including reinvestment of dividends. Fiscal years ended Dec. 31.
Purchases of Equity Securities by Issuer and Affiliated Purchasers
For the quarter ended Dec. 31, 2023, no equity securities that are registered by Xcel Energy Inc. pursuant to Section 12 of the Securities Exchange Act of 1934 were purchased by or on behalf of us or any of our affiliated purchasers.
| | |
| ITEM 7 — MANAGEMENT’S DISCUSSION AND ANALYSIS OF FINANCIAL CONDITION AND RESULTS OF OPERATIONS |
Non-GAAP Financial Measures
The following discussion includes financial information prepared in accordance with GAAP, as well as certain non-GAAP financial measures such as ongoing ROE, ongoing earnings and ongoing diluted EPS. Generally, a non-GAAP financial measure is a measure of a company’s financial performance, financial position or cash flows that is adjusted from measures calculated and presented in accordance with GAAP.
Xcel Energy’s management uses non-GAAP measures for financial planning and analysis, for reporting of results to the Board of Directors, in determining performance-based compensation and communicating its earnings outlook to analysts and investors. Non-GAAP financial measures are intended to supplement investors’ understanding of our performance and should not be considered alternatives for financial measures presented in accordance with GAAP. These measures are discussed in more detail below and may not be comparable to other companies’ similarly titled non-GAAP financial measures.
Ongoing ROE
Ongoing ROE is calculated by dividing the net income or loss of Xcel Energy or each subsidiary, adjusted for certain nonrecurring items, by each entity’s average stockholder’s equity. We use these non-GAAP financial measures to evaluate and provide details of earnings results.
Earnings Adjusted for Certain Items (Ongoing Earnings and Ongoing Diluted EPS)
GAAP diluted EPS reflects the potential dilution that could occur if securities or other agreements to issue common stock (i.e., common stock equivalents) were settled. The weighted average number of potentially dilutive shares outstanding used to calculate Xcel Energy Inc.’s diluted EPS is calculated using the treasury stock method. Ongoing earnings reflect adjustments to GAAP earnings (net income) for certain items. Ongoing diluted EPS is calculated by dividing the net income or loss of each subsidiary, adjusted for certain items, by the weighted average fully diluted Xcel Energy Inc. common shares outstanding for the period. Ongoing diluted EPS for each subsidiary is calculated by dividing the net income or loss of such subsidiary, adjusted for certain items, by the weighted average fully diluted Xcel Energy Inc. common shares outstanding for the period.
We use these non-GAAP financial measures to evaluate and provide details of Xcel Energy’s core earnings and underlying performance. For instance, to present ongoing earnings and ongoing diluted earnings per share, we may adjust the related GAAP amounts for certain items that are non-recurring in nature. We believe these measurements are useful to investors to evaluate the actual and projected financial performance and contribution of our subsidiaries. These non-GAAP financial measures should not be considered as an alternative to measures calculated and reported in accordance with GAAP.
The following table provides a reconciliation of GAAP earnings (net income) to ongoing earnings:
| | | | | | | | | | | | | | |
| (Millions of Dollars) | | 2023 | | 2022 |
| GAAP net income | | $ | 1,771 | | | $ | 1,736 | |
| Loss on Comanche Unit 3 litigation | | 35 | | | — | |
| Workforce reduction expenses | | 72 | | | — | |
| Less: tax effect of adjustments | | (27) | | | — | |
| Ongoing earnings | | $ | 1,851 | | | $ | 1,736 | |
| | | | | | | | | | | | | | | | | | | | |
| | Twelve Months Ended Dec. 31, 2023 |
Diluted Earnings (Loss)
Per Share | | GAAP Diluted EPS | | Impact of Adjustments | | Ongoing Diluted EPS |
| NSP-Minnesota | | $ | 1.28 | | | $ | 0.04 | | | $ | 1.32 | |
PSCo (a) | | 1.26 | | | 0.08 | | | 1.33 | |
| SPS | | 0.70 | | | 0.01 | | | 0.71 | |
| NSP-Wisconsin | | 0.25 | | | — | | | 0.25 | |
| Earnings from equity method investments — WYCO | | 0.04 | | | — | | | 0.04 | |
Regulated utility (a) | | 3.52 | | | 0.14 | | | 3.66 | |
| Xcel Energy Inc. and Other | | (0.31) | | | — | | | (0.31) | |
Total (a) | | $ | 3.21 | | | 0.14 | | | $ | 3.35 | |
| | | | | | | | | | | | | | | | | | | | |
| | Twelve Months Ended Dec. 31, 2022 |
Diluted Earnings (Loss)
Per Share | | GAAP Diluted EPS | | Impact of Adjustments | | Ongoing Diluted EPS |
| NSP-Minnesota | | $ | 1.23 | | | $ | — | | | $ | 1.23 | |
| PSCo | | 1.33 | | | — | | | 1.33 | |
| SPS | | 0.64 | | | — | | | 0.64 | |
| NSP-Wisconsin | | 0.23 | | | — | | | 0.23 | |
| Earnings from equity method investments — WYCO | | 0.04 | | | — | | | 0.04 | |
Regulated utility (a) | | 3.47 | | | — | | | 3.47 | |
| Xcel Energy Inc. and Other | | (0.29) | | | — | | | (0.29) | |
Total (a) | | $ | 3.17 | | | — | | | $ | 3.17 | |
(a)Amounts may not add due to rounding.
Comanche Unit 3 Litigation — In the third quarter of 2023, PSCo recognized a $34 million loss due to a jury verdict in Denver County District Court awarding CORE lost power damages and other costs. PSCo intends to file an appeal of this decision. Given the non-recurring nature of this specific item, it has been excluded from ongoing earnings.
See Note 12 to the consolidated financial statements for further information.
Workforce Reduction — In 2023, Xcel Energy implemented workforce actions to align resources and investments with our evolving business and customer needs, and streamline the organization for long-term success. Xcel Energy initiated a voluntary retirement program, under which approximately 400 eligible non-bargaining employees retired. Xcel Energy also eliminated approximately 150 non-bargaining employees through an involuntary severance program.
Total workforce reduction expenses of $72 million were recorded in the fourth quarter of 2023. Given the non-recurring nature of this item, it has been excluded from ongoing earnings.
See Note 15 to the consolidated financial statements for further information.
Diluted EPS for Xcel Energy at Dec. 31:
| | | | | | | | | | | | | | |
| | 2023 | | 2022 |
| Diluted Earnings (Loss) Per Share | | GAAP Diluted EPS | | GAAP Diluted EPS |
| NSP-Minnesota | | $ | 1.28 | | | $ | 1.23 | |
| PSCo | | 1.26 | | | 1.33 | |
| SPS | | 0.70 | | | 0.64 | |
| NSP-Wisconsin | | 0.25 | | | 0.23 | |
| Earnings from equity method investments — WYCO | | 0.04 | | | 0.04 | |
Regulated utility (a) | | 3.52 | | | 3.47 | |
| Xcel Energy Inc. and Other | | (0.31) | | | (0.29) | |
GAAP Diluted EPS (a) | | 3.21 | | | 3.17 | |
| Loss on Comanche Unit 3 litigation | | 0.05 | | | — | |
| Workforce reduction expenses | | 0.09 | | | — | |
Ongoing Diluted EPS (a) | | $ | 3.35 | | | $ | 3.17 | |
(a)Amounts may not add due to rounding.
Xcel Energy’s management believes that ongoing earnings reflects management’s performance in operating Xcel Energy and provides a meaningful representation of the performance of Xcel Energy’s core business. In addition, Xcel Energy’s management uses ongoing earnings internally for financial planning and analysis, reporting results to the Board of Directors and when communicating its earnings outlook to analysts and investors.
2023 Comparison with 2022
Xcel Energy — GAAP diluted earnings were $3.21 per share compared to $3.17 per share in 2022 and ongoing diluted earnings were $3.35 per share in 2023, compared with $3.17 per share in 2022. The increase in ongoing earnings per share was driven by increased recovery of infrastructure investments, higher sales and demand and lower O&M expenses, partially offset by higher depreciation and interest charges and unfavorable weather.
Fluctuations in electric and natural gas revenues associated with changes in fuel and purchased power and/or natural gas sold and transported generally do not significantly impact earnings (changes in costs are offset by the related variation in revenues).
NSP-Minnesota — GAAP earnings increased $0.05 per share and ongoing earnings increased $0.09 per share for 2023 compared to 2022. The change to ongoing earnings was driven by increased recovery of electric infrastructure investments, partially offset by increased interest charges and unfavorable weather.
PSCo — GAAP earnings decreased $0.07 per share and ongoing earnings was flat for 2023 compared to 2022. Ongoing earnings primarily reflects higher recovery of infrastructure investment and lower O&M expenses, which were partially offset by increased depreciation, interest charges and unfavorable weather.
SPS — GAAP earnings increased $0.06 per share and ongoing earnings increased $0.07 per share for 2023 compared to 2022. Ongoing earnings were largely impacted by regulatory rate outcomes, sales growth, partially offset by increased depreciation, interest charges and unfavorable weather.
NSP-Wisconsin — GAAP and ongoing earnings increased $0.02 per share for 2023 compared to 2022. The increase in ongoing earnings was primarily a result of higher recovery of electric infrastructure investment, partially offset by unfavorable weather and, higher depreciation, O&M expenses and interest charges.
Xcel Energy Inc. and Other — Primarily includes financing costs and interest income at the holding company and earnings from EIP funds equity method investments. Fluctuations from 2022 levels were largely attributable to increased interest rates.
Changes in Diluted EPS
Components significantly contributing to changes in EPS:
| | | | | | | | |
| 2023 vs. 2022 |
| Diluted Earnings (Loss) Per Share | | Dec. 31 |
| GAAP and ongoing diluted EPS — 2022 | | $ | 3.17 | |
| | |
| Components of change — 2023 vs. 2022 | | |
| Higher electric revenues, net of electric fuel and purchased power | | 0.07 | |
| Lower O&M expenses | | 0.06 | |
| Lower conservation and demand side management expenses (offset in electric revenues) | | 0.06 | |
| Higher other income (expense) | | 0.05 | |
| Lower taxes (other than income taxes) | | 0.04 | |
| Higher natural gas revenues, net of cost of natural gas sold and transported | | 0.03 | |
| Higher interest expense | | (0.14) | |
| Higher depreciation and amortization | | (0.05) | |
| Workforce reduction expenses | | (0.09) | |
| Loss on Comanche Unit 3 litigation | | (0.05) | |
| Other (net) | | 0.06 | |
| GAAP diluted EPS — 2023 | | $ | 3.21 | |
| Workforce reduction expenses | | 0.09 | |
| Loss on Comanche Unit 3 litigation | | 0.05 | |
| Ongoing diluted EPS — 2023 | | $ | 3.35 | |
ROE for Xcel Energy and its utility subsidiaries:
| | | | | | | | | | | | | | | | | | | | |
| | 2023 | | 2022 |
| ROE | | GAAP ROE | | Ongoing ROE | | GAAP and Ongoing ROE |
| NSP-Minnesota | | 8.82 | % | | 9.11 | % | | 8.76 | % |
| PSCo | | 7.32 | | | 7.77 | | | 8.23 | |
| SPS | | 9.80 | | | 9.98 | | | 9.36 | |
| NSP-Wisconsin | | 10.38 | | | 10.67 | | | 10.57 | |
| Operating Companies | | 8.45 | | | 8.79 | | | 8.74 | |
| Xcel Energy | | 10.33 | | | 10.79 | | | 10.76 | |
Statement of Income Analysis
The following summarizes the items that affected the individual revenue and expense items reported in the consolidated statements of income.
Estimated Impact of Temperature Changes on Regulated Earnings — Unusually hot summers or cold winters increase electric and natural gas sales, while mild weather reduces electric and natural gas sales. The estimated impact of weather on earnings is based on the number of customers, temperature variances, the amount of natural gas or electricity historically used per degree of temperature and excludes any incremental related operating expenses that could result due to storm activity or vegetation management requirements.
As a result, weather deviations from normal levels can affect Xcel Energy’s financial performance. However, electric decoupling mechanisms in Colorado (mechanism expired in September 2023) and electric sales true-up mechanisms in Minnesota and gas decoupling mechanism in Minnesota predominately mitigate the positive and adverse impacts of weather in those jurisdictions.
Degree-day or THI data is used to estimate amounts of energy required to maintain comfortable indoor temperature levels based on each day’s average temperature and humidity.
HDD is the measure of the variation in the weather based on the extent to which the average daily temperature falls below 65° Fahrenheit. CDD is the measure of the variation in the weather based on the extent to which the average daily temperature rises above 65° Fahrenheit.
Each degree of temperature above 65° Fahrenheit is counted as one CDD, and each degree of temperature below 65° Fahrenheit is counted as one HDD.
In Xcel Energy’s more humid service territories, a THI is used in place of CDD, which adds a humidity factor to CDD. HDD, CDD and THI are most likely to impact the usage of Xcel Energy’s residential and commercial customers. Industrial customers are less sensitive to weather.
Normal weather conditions are defined as either the 10, 20 or 30-year average of actual historical weather conditions. The historical period of time used in the calculation of normal weather differs by jurisdiction, based on regulatory practice. To calculate the impact of weather on demand, a demand factor is applied to the weather impact on sales. Extreme weather variations, windchill and cloud cover may not be reflected in weather-normalized estimates.
Percentage increase (decrease) in normal and actual HDD, CDD and THI:
| | | | | | | | | | | | | | | | | |
| 2023 vs.
Normal | | 2022 vs.
Normal | | 2023 vs. 2022 |
| HDD | (7.3) | % | | 6.5 | % | | (12.9) | % |
| CDD | 5.2 | | | 23.7 | | | (13.8) | |
| THI | 16.0 | | | 5.6 | | | 9 | |
Weather — Estimated impact of temperature variations on EPS compared with normal weather conditions: | | | | | | | | | | | | | | | | | |
| 2023 vs. Normal | | 2022 vs. Normal | | 2023 vs. 2022 |
| Retail electric | $ | 0.013 | | | $ | 0.138 | | | $ | (0.125) | |
| Decoupling and sales true-up | (0.007) | | | (0.061) | | | 0.054 | |
| Electric total | $ | 0.006 | | | $ | 0.077 | | | $ | (0.071) | |
| Firm natural gas | (0.010) | | | 0.037 | | | (0.047) | |
| Decoupling | $ | 0.013 | | | $ | — | | | $ | 0.013 | |
| Gas total | $ | 0.003 | | | $ | 0.037 | | | $ | (0.034) | |
| Total | $ | 0.009 | | | $ | 0.114 | | | $ | (0.105) | |
Sales — Sales growth (decline) for actual and weather-normalized sales:
| | | | | | | | | | | | | | | | | | | | | | | | | | | | | | | | |
| | 2023 vs. 2022 |
| | NSP-Minnesota | | PSCo | | SPS | | NSP-Wisconsin | | Xcel Energy |
| Actual | | | | | | | | | | |
| Electric residential | | (0.5) | % | | (4.0) | % | | (3.0) | % | | (2.6) | % | | (2.3) | % |
| Electric C&I | | (1.1) | | | (1.9) | | | 5.2 | | | (0.5) | | | 0.5 | |
| Total retail electric sales | | (0.9) | | | (2.6) | | | 3.6 | | | (1.1) | | | (0.3) | |
| Firm natural gas sales | | (12.0) | | | (1.5) | | | N/A | | (12.6) | | | (5.7) | |
| | | | | | | | | | | | | | | | | | | | | | | | | | | | | | | | |
| | 2023 vs. 2022 |
| | NSP-Minnesota | | PSCo | | SPS | | NSP-Wisconsin | | Xcel Energy |
| Weather-normalized | | | | | | |
| Electric residential | | 1.0 | % | | 1.6 | % | | 1.1 | % | | 0.1 | % | | 1.2 | % |
| Electric C&I | | (1.1) | | | (0.4) | | | 5.3 | | | (0.4) | | | 1.0 | |
| Total retail electric sales | | (0.4) | | | 0.3 | | | 4.5 | | | (0.3) | | | 1.0 | |
| Firm natural gas sales | | — | | | 2.3 | | | N/A | | (0.4) | | | 1.4 | |
Annual weather-normalized electric sales growth (decline)
•NSP-Minnesota — Residential sales increased due to a 1.2% increase in customers outpacing declines in use per customer. The decline in C&I sales was due to lower use per customer, particularly due to weakness in the manufacturing sector compared to prior year.
•PSCo — Residential sales increased due to increased use per customer and a 1.3% increase in customers. The decline in C&I sales was attributable to decreased use per customer, primarily in the manufacturing sector.
•SPS — Residential sales growth was primarily attributable to a 0.7% increase in customers and increased use per customer. C&I sales increased due to higher use per customer, primarily driven by the energy sector.
•NSP-Wisconsin — The C&I sales decline was associated with lower use per customer, experienced primarily in the transportation and manufacturing sectors.
Annual weather-normalized natural gas sales growth (decline)
•Natural gas sales reflect 1.2% residential and 0.7% C&I customer growth and an increase in C&I use per customer at PSCo. Partially offsetting these increases were lower use per residential customer in all jurisdictions.
Electric Margin
Electric margin is presented as electric revenues less electric fuel and purchased power expenses. Expenses incurred for electric fuel and purchased power are generally recovered through various regulatory recovery mechanisms.
As a result, changes in these expenses are generally offset in operating revenues.
Electric revenues and fuel and purchased power expenses are impacted by fluctuations in the price of natural gas, coal and uranium. These price fluctuations generally have minimal impact on earnings impact due to fuel recovery mechanisms. In addition, electric customers receive a credit for PTCs generated, which reduce electric revenue and income taxes.
Electric Revenues, Fuel and Purchased Power and Electric Margin
| | | | | | | | | | | | | | |
| (Millions of Dollars) | | 2023 | | 2022 |
| Electric revenues | | $ | 11,446 | | | $ | 12,123 | |
| Electric fuel and purchased power | | (4,278) | | | (5,005) | |
| Electric margin | | $ | 7,168 | | | $ | 7,118 | |
Change in Electric Margin
| | | | | | | | |
| (Millions of Dollars) | | 2023 vs. 2022 |
| Regulatory rate outcomes (MN, CO, TX, NM, WI, SD and MI) | | $ | 100 | |
| Non-fuel riders | | 89 | |
Sales and demand (a) | | 57 | |
| Wholesale transmission (net) | | 28 | |
Revenue recognition of the Texas rate case surcharge (b) | | (85) | |
| Estimated impact of weather (net of decoupling/sales true-up) | | (51) | |
| Conservation and demand side management (offset in expense) | | (43) | |
| PTCs flowed back to customers (offset by lower ETR) | | (28) | |
|
| Other (net) | | (17) | |
| Total increase | | $ | 50 | |
(a)Sales excludes weather impact, net of partial decoupling in Colorado (mechanism expired in September 2023) and sales true-up mechanism in Minnesota.
(b)The decline in electric margin is due to the recognition of the Texas rate case outcome in the second quarter of 2022, which was largely offset by recognition of previously deferred costs.
Natural Gas Margin
Natural gas margin is presented as natural gas revenues less the cost of natural gas sold and transported. Expenses incurred for the cost of natural gas sold are generally recovered through various regulatory recovery mechanisms. As a result, changes in these expenses are generally offset in operating revenues.
Natural gas expense varies with changing sales and the cost of natural gas. However, fluctuations in the cost of natural gas generally have minimal earnings impact due to cost recovery mechanisms.
Natural Gas Revenues, Cost of Natural Gas Sold and Transported and Natural Gas Margin
| | | | | | | | | | | | | | |
| (Millions of Dollars) | | 2023 | | 2022 |
| Natural gas revenues | | $ | 2,645 | | | $ | 3,080 | |
| Cost of natural gas sold and transported | | (1,456) | | | (1,910) | |
| Natural gas margin | | $ | 1,189 | | | $ | 1,170 | |
Change in Natural Gas Margin
| | | | | | | | |
| (Millions of Dollars) | | 2023 vs. 2022 |
| Regulatory rate outcomes (CO, WI, MI) | | $ | 50 | |
| Estimated impact of weather (net of decoupling) | | (25) | |
|
|
|
| Other (net) | | (6) | |
|
| Total increase | | $ | 19 | |
Non-Fuel Operating Expenses and Other Items
O&M Expenses — O&M expenses decreased $47 million in 2023, primarily due to the impact of management cost containment efforts, the exit of our appliance repair services business and the change in deferred costs associated with the Texas Electric Rate Cases (offset in Electric revenues), offset by higher bad debt expenses, the impact of inflationary pressures, including labor, and timing of unplanned maintenance at generating plants.
Depreciation and Amortization — Depreciation and amortization increased $35 million for the year, primarily related to system expansion, offset by the change in deferred costs associated with the Texas Electric Rate Case and depreciation life extensions implemented in the Minnesota Electric Rate Case.
Taxes (other than Income Taxes) —Taxes (other than income taxes) decreased $31 million in 2023, primarily due to lower property tax expense (lower tax rates in Minnesota offset by increase in Colorado) and deferrals related to the Minnesota Electric Rate Case and Texas Electric Rate Case.
Other Income (Expense) — Other income (expense) increased $35 million for the year, primarily related to rabbi trust performance, which is primarily offset in employee benefit cost in O&M expenses.
Interest Charges — Interest charges increased $102 million in 2023. The increase was largely due to higher long-term debt levels to fund capital investments and higher interest rates.
Xcel Energy Inc. and Other Results
Net income and diluted EPS contributions of Xcel Energy Inc. and its nonregulated businesses:
| | | | | | | | | | | | | | |
| (Millions of Dollars) | | 2023 | | 2022 |
| Xcel Energy Inc. financing costs | | $ | (174) | | | $ | (153) | |
| | |
| | |
Venture Holdings (a) | | 3 | | | 5 | |
| Xcel Energy Inc. taxes and other results | | (2) | | | (12) | |
| Total Xcel Energy Inc. and other costs | | $ | (173) | | | $ | (160) | |
| | | | | | | | | | | | | | |
| (Diluted Earnings (Loss) Per Share) | | 2023 | | 2022 |
| Xcel Energy Inc. financing costs | | $ | (0.32) | | | $ | (0.28) | |
| | |
| | |
Venture Holdings (a) | | 0.01 | | | 0.01 | |
| Xcel Energy Inc. taxes and other results | | — | | | (0.02) | |
| Total Xcel Energy Inc. and other costs | | $ | (0.31) | | | $ | (0.29) | |
(a)Amounts include gains or losses associated with EIP investments.
Xcel Energy Inc.’s results include interest charges, which are incurred at Xcel Energy Inc. and are not directly assigned to individual subsidiaries.
2022 Comparison with 2021
A discussion of changes in Xcel Energy’s results of operations, cash flows and liquidity and capital resources from the year ended Dec. 31, 2021 to Dec. 31, 2022 can be found in Part II, “Item 7, Management’s Discussion and Analysis of Financial Condition and Results of Operations” of our Annual Report on Form 10-K for the fiscal year 2022, which was filed with the SEC on Feb. 23, 2023. However, such discussion is not incorporated by reference into, and does not constitute a part of, this Annual Report on Form 10-K. | | |
| Public Utility Regulation |
The FERC and various state and local regulatory commissions regulate Xcel Energy Inc.’s utility subsidiaries and West Gas Interstate. Xcel Energy is subject to rate regulation by state utility regulatory agencies, which have jurisdiction with respect to the rates of electric and natural gas distribution companies in Minnesota, North Dakota, South Dakota, Wisconsin, Michigan, Colorado, New Mexico and Texas.
Rates are designed to recover plant investment, operating costs and an allowed return on investment. Our utility subsidiaries request changes in utility rates through commission filings. Changes in operating costs can affect Xcel Energy’s financial results, depending on the timing of rate cases and implementation of final rates. Other factors affecting rate filings are new investments, sales, conservation and DSM efforts, and the cost of capital.
In addition, the regulatory commissions authorize the ROE, capital structure and depreciation rates in rate proceedings. Decisions by these regulators can significantly impact Xcel Energy’s results of operations and credit quality.
See Rate Matters and Other within Note 12 to the consolidated financial statements for further information.
NSP-Minnesota
Summary of Regulatory Agencies / RTO and Areas of Jurisdiction
| | | | | | | | |
| Regulatory Body / RTO | | Additional Information |
| MPUC | | Retail rates, services, security issuances, property transfers, mergers, disposition of assets, affiliate transactions, and other aspects of electric and natural gas operations. Reviews and approves Integrated Resource Plans for meeting future energy needs. Certifies the need and siting for generating plants greater than 50 MW and transmission lines greater than 100 KV in Minnesota. Reviews and approves natural gas supply plans. |
| NDPSC | | Retail rates, services and other aspects of electric and natural gas operations. Reviews and approves Integrated Resource Plans for meeting future energy needs. Regulatory authority over generation and transmission facilities, along with the siting and routing of new generation and transmission facilities in North Dakota. Pipeline safety compliance. |
| SDPUC | | Retail rates, services and other aspects of electric operations. Regulatory authority over generation and transmission facilities, along with the siting and routing of new generation and transmission facilities in South Dakota. Pipeline safety compliance. |
| FERC | | Wholesale electric operations, hydroelectric licensing, accounting practices, wholesale sales for resale, transmission of electricity in interstate commerce, compliance with NERC electric reliability standards, asset transfers and mergers, and natural gas transactions in interstate commerce. |
| MISO | | NSP-Minnesota is a transmission owning member of the MISO RTO and operates within the MISO RTO and wholesale markets. NSP-Minnesota makes wholesale sales in other RTO markets at market-based rates. NSP-Minnesota and NSP-Wisconsin also make wholesale electric sales at market-based prices to customers outside of their balancing authority as jointly authorized by the FERC. |
| DOT | | Pipeline safety compliance. |
| Minnesota Office of Pipeline Safety | | Pipeline safety compliance. |
Recovery Mechanisms
| | | | | | | | |
| Mechanism | | Additional Information |
CIP Rider (a) | | Recovers costs of conservation and DSM programs. |
|
| Customer Protection Mechanisms | | MISO capacity revenue tracker, property tax tracker, annual incentive plan, capital true-up, and deferred tax asset refund are all mechanisms that mitigate the impact of changes to costs as compared to a baseline for NSP-Minnesota customers. |
| Decoupling | | Measures natural gas revenues against a baseline revenue per-customer for all Minnesota gas customers in classes with more than 50 customers. |
| FCA | | Recovers prudently incurred costs of fuel related items and purchased energy (Minnesota, North Dakota and South Dakota). |
| GUIC Rider | | Recovers costs for transmission and distribution pipeline integrity management programs, including funding for pipeline assessments, deferred costs for sewer separation and pipeline integrity management programs in Minnesota. |
| Infrastructure Rider | | Recovers costs for investments in generation in South Dakota. |
| Purchased Gas Adjustment | | Provides for prospective monthly rate adjustments in Minnesota and North Dakota for costs of purchased natural gas, transportation and storage service. Includes a true-up process for difference between projected and actual costs. |
| Renewable Development Fund | | Allocates money collected from customers to support research and development of emerging renewable energy projects and technologies in Minnesota. |
| Renewable Energy Rider | | Recovers cost of renewable generation in North Dakota. |
| RES | | Recovers cost of renewable generation in Minnesota. |
| Sales True-up | | Mitigates the impact of changes to sales levels as compared to a baseline for all Minnesota electric customers. |
| Transmission Cost Recovery | | Recovers costs for investments in Minnesota, North Dakota, and South Dakota for electric transmission and distribution grid modernization. |
(a)Minnesota state law requires NSP-Minnesota to spend 2% of its state electric revenues and 0.5% of its state natural gas revenues on CIP. These costs are recovered through an annual cost-recovery mechanism.
Pending and Recently Concluded Regulatory Proceedings
2022 Minnesota Electric Rate Case — In October 2021, NSP-Minnesota filed a three-year electric rate case with the MPUC. The rate request was based on a ROE of 10.2%, a 52.5% equity ratio and forward test years. In December 2021, the MPUC approved interim rates, subject to refund, of $247 million, effective Jan. 1, 2022. In November 2022, NSP-Minnesota revised its rate request to $498 million over three years.
In July 2023, the MPUC approved a three-year rate increase of approximately $332 million for 2022-2024, based on a ROE of 9.25% and an equity ratio of 52.5%. The MPUC also approved a continuation of the sales true-up mechanism.
In October 2023, the MPUC denied NSP-Minnesota’s request for reconsideration of certain aspects of the decision. NSP-Minnesota filed an appeal of the decision to the Minnesota Court of Appeals in November 2023.
2024 Minnesota Natural Gas Rate Case — In November 2023, NSP-Minnesota filed a request with the MPUC for an annual natural gas rate increase of approximately $59 million, or 9.6%. The request is based on a ROE of 10.2%, a 52.5% equity ratio and a 2024 forward test year with rate base of approximately $1.27 billion. In Dec. 2023, the MPUC approved NSP-Minnesota’s request for interim rates, subject to refund, of approximately $51 million (implemented on Jan. 1, 2024).
Next steps in the procedural schedule are expected to be as follows:
•Intervenor direct testimony: April 19, 2024
•Rebuttal testimony: May 24, 2024
•Evidentiary hearings: July 10-12, 2024
•ALJ Report: October 28, 2024
•MPUC Order Due: March 14, 2025
2024 North Dakota Natural Gas Rate Case — In December 2023, NSP-Minnesota filed a request with the NDPSC for an annual natural gas rate increase of approximately $8 million, or 9.4%. The filing is based on a ROE of 10.2%, a 52.5% equity ratio and a 2024 forecast test year with rate base of approximately $168 million. NSP-Minnesota requested interim rates, subject to refund, of approximately $8 million to be implemented on March 1, 2024.
Nuclear Power Operations
Nuclear power plant operations produce gaseous, liquid and solid radioactive wastes, which are covered by federal regulation. High-level radioactive wastes primarily include used nuclear fuel. Low-level waste consists primarily of demineralizer resins, paper, protective clothing, rags, tools and equipment contaminated through use.
NRC Regulation — The NRC regulates nuclear operations. Costs of complying with NRC requirements can affect both operating expenses and capital investments of the plants. NSP-Minnesota has obtained recovery of these compliance costs and expects to recover future compliance costs.
Low-Level Waste Disposal — Low level waste from Monticello and PI is disposed of at the Clive facility located in Utah and the Waste Control Specialists facility in Texas. NSP-Minnesota has storage capacity available on-site at PI and Monticello which would allow both plants to continue to operate until the end of their current licensed lives if off-site low-level waste disposal facilities become unavailable.
High-Level Radioactive Waste Disposal — The federal government has responsibility to permanently dispose of domestic spent nuclear fuel and other high-level radioactive wastes. The Nuclear Waste Policy Act requires the DOE to implement a program for nuclear high-level waste management.
This includes the siting, licensing, construction and operation of a repository for spent nuclear fuel from civilian nuclear power reactors and other high-level radioactive wastes at a permanent federal storage or disposal facility. Currently, there are no definitive plans for a permanent federal storage facility site.
Nuclear Spent Fuel Storage — NSP-Minnesota has interim on-site storage for spent nuclear fuel at its Monticello and PI nuclear generating plants. Authorized storage capacity is sufficient to allow NSP-Minnesota to operate until the end of the current operating licenses in 2030 for Monticello, 2033 for PI Unit 1, and 2034 for PI Unit 2.
In February 2023, NSP-Minnesota filed a CON with the MPUC for additional storage at PI to support possible life extension to 2054.
In October 2023, the MPUC issued an order approving NSP-Minnesota’s application for a CON for additional spent fuel storage (existing Independent Spent Fuel Storage Installation) at the Monticello Nuclear Power Generating Plant to allow continued operation of the Monticello Plant until 2040.
Authorizations for additional spent fuel storage capacity may be required at each site to support either continued operation or decommissioning if the federal government does not commence storage operations.
NSP-Wisconsin
Summary of Regulatory Agencies / RTO and Areas of Jurisdiction
| | | | | | | | |
| Regulatory Body / RTO | | Additional Information |
| PSCW | | Retail rates, services and other aspects of electric and natural gas operations. Certifies the need for new generating plants and electric transmission lines before the facilities may be sited and built. The PSCW has a biennial base rate filing requirement. By June of each odd numbered year, NSP-Wisconsin must submit a rate filing for the test year beginning the following January. Pipeline safety compliance. |
| Michigan Public Service Commission | | Retail rates, services and other aspects of electric and natural gas operations. Certifies the need for new generating plants and electric transmission lines before the facilities may be sited and built. Pipeline safety compliance. |
| FERC | | Wholesale electric operations, hydroelectric generation licensing, accounting practices, wholesale sales for resale, transmission of electricity in interstate commerce, compliance with NERC electric reliability standards, asset transactions and mergers and natural gas transactions in interstate commerce. |
| MISO | | NSP-Wisconsin is a transmission owning member of the MISO RTO that operates within the MISO RTO and wholesale energy market. NSP-Wisconsin and NSP-Minnesota are jointly authorized by the FERC to make wholesale electric sales at market-based prices. |
| DOT | | Pipeline safety compliance. |
Recovery Mechanisms
| | | | | | | | |
| Mechanism | | Additional Information |
| Annual Fuel Cost Plan | | NSP-Wisconsin does not have an automatic electric fuel adjustment clause. Under Wisconsin rules, utilities submit a forward-looking annual fuel cost plan to the PSCW. Once the PSCW approves the plan, utilities defer the amount of any fuel cost under-recovery or over-recovery in excess of a 2% annual tolerance band, for future rate recovery or refund. Approval of a fuel cost plan and any rate adjustment for refund or recovery of deferred costs is determined by the PSCW. Rate recovery of deferred fuel cost is subject to an earnings test based on the most recently authorized ROE. Under-collections that exceed the 2% annual tolerance band may not be recovered if the utility earnings for that year exceed the authorized ROE. |
| Natural Gas Cost-Recovery Factor (MI) | | NSP-Wisconsin’s natural gas rates for Michigan customers include a natural gas cost-recovery factor, based on 12-month projections and trued-up to actual amounts on an annual basis. |
| Power Supply Cost Recovery Factors | | NSP-Wisconsin’s retail electric rate schedules for Michigan customers include power supply cost recovery factors, based on 12-month projections. After each 12-month period, a reconciliation is submitted whereby over-recoveries are refunded and any under-recoveries are collected from customers. |
| Purchased Gas Adjustment | | A retail cost-recovery mechanism to recover the actual cost of natural gas, transportation, and storage services. |
| Wisconsin Energy Efficiency Program | | The primary energy efficiency program is funded by the utilities, but operated by independent contractors subject to oversight by the PSCW and utilities. NSP-Wisconsin recovers these costs from customers. |
Recently Concluded Regulatory Proceedings
Wisconsin Rate Case — In 2023, NSP-Wisconsin filed a Wisconsin rate case seeking a revised electric increase of $25 million and a natural gas increase of $7 million. The filing was based on a 2024 forecast test year, a ROE of 10.25%, an equity ratio of 52.5% and a forecasted average net rate base of approximately $2.1 billion for the electric utility and $284 million for the natural gas utility.
In December 2023, the PSCW approved a ROE of 9.8% and an equity ratio of 52.5% as well as a rate increase of approximately $1 million for the electric utility. Adjustments to NSP-Wisconsin’s rate request included removal of a proposed residential affordability program and other earnings neutral adjustments and fuel and purchased power costs. The PSCW also approved a $5 million rate increase for the natural gas utility in 2024. The new rates were implemented on Jan. 1, 2024.
NSP System
Pending and Recently Concluded Regulatory Proceedings
2022 Upper Midwest IRP Resource Acquisition — Following the MPUC’s approval of NSP-Minnesota and NSP-Wisconsin’s latest IRP in April 2022, NSP-Minnesota and NSP-Wisconsin have been engaged in multiple resource acquisition processes and proceedings to meet the need identified in the IRP for the NSP System.
•In August 2022, NSP-Minnesota and NSP-Wisconsin jointly filed an RFP seeking at least 900 MW of solar or solar plus storage capacity. In May 2023, NSP-Minnesota filed a recommended portfolio, which proposed an additional 250 MW of self-build solar generation at the site of our retiring Sherco coal units and a 100 MW solar PPA located in Wisconsin as part of the resource plan RFP. In September 2023, the MPUC approved the request for 350 MW, subject to a cost cap based on projected costs for the Sherco solar project.
•In the second quarter of 2023, NSP-Minnesota initiated the process with the MPUC for acquisition of 800 MW of firm dispatchable resources. In January 2024, NSP-Minnesota and other companies submitted proposed resources. NSP-Minnesota expects a decision by the fourth quarter of 2024.
•In July 2023, NSP-Wisconsin issued an RFP seeking approximately 650 MW of solar and/or solar plus storage development assets that will be developed in the 2027-2029 timeframe to replace the capacity from the retiring King Generating Station. The RFP closed in September 2023 and bids are being evaluated.
•In October 2023, NSP-Minnesota issued an RFP seeking approximately 1,200 MW of wind development assets to replace capacity and reutilize interconnection rights associated with the retiring Sherco coal facilities. The RFP closed in December 2023 and the NSP-Minnesota expects to file for approval of recommended projects by mid-2024.
2024 Upper Midwest Energy Plan — In February 2024, NSP-Minnesota filed its resource plan with the MPUC. Key components of the plan include the following:
•Reduced carbon emissions by more than 80%, potentially up to 88%, by 2030.
•Extends the operation of Prairie Island and Monticello nuclear plants through the early 2050s.
•Adds 3,600 MW of new wind and solar resources by 2030.
•Adds 600 MW of battery energy storage by 2030.
•Adds more than 2,200 MW of dispatchable resources by 2030.
NSP-Minnesota anticipates a MPUC decision in 2025.
Purchased Power and Transmission Services
The NSP System expects to use power plants, power purchases, conservation and DSM options, new generation facilities and expansion of power plants to meet its system capacity requirements.
Purchased Power — Through the Interchange Agreement, NSP-Wisconsin receives power purchased by NSP-Minnesota from other utilities and independent power producers. Long-term purchased power contracts for dispatchable resources typically require a capacity charge and an energy charge. NSP-Minnesota makes short-term purchases to meet system requirements, replace company owned generation, meet operating reserve obligations or obtain energy at a lower cost.
Purchased Transmission Services — NSP-Minnesota and NSP-Wisconsin have contracts with MISO and other regional transmission service providers to deliver power and energy to their customers.
Wholesale and Commodity Marketing Operations
NSP-Minnesota conducts wholesale marketing operations, including the purchase and sale of electric capacity, energy, ancillary services and energy-related products. NSP-Minnesota uses physical and financial instruments to minimize commodity price risk and to hedge sales and purchases.
NSP-Minnesota also engages in trading activity unrelated to these hedging activities. Sharing of any margins is determined through state regulatory proceedings as well as the operation of the FERC approved joint operating agreement. NSP-Minnesota and NSP-Wisconsin do not serve any wholesale requirements customers at cost-based regulated rates.
PSCo
Summary of Regulatory Agencies / RTO and Areas of Jurisdiction
| | | | | | | | |
| Regulatory Body / RTO | | Additional Information on Regulatory Authority |
| CPUC | | Retail rates, accounts, services, issuance of securities and other aspects of electric, natural gas and steam operations. Reviews and approves Integrated Resource Plans for meeting future energy needs. Certifies the need and siting for generating plans greater than 50 MW. Pipeline safety compliance. |
| FERC | | Wholesale electric operations, accounting practices, hydroelectric licensing, wholesale sales for resale, transmission of electricity in interstate commerce, compliance with the NERC electric reliability standards, asset transactions and mergers and natural gas transactions in interstate commerce. Wholesale electric sales at cost-based prices to customers inside PSCo’s balancing authority area and at market-based prices to customers outside PSCo’s balancing authority area. PSCo holds a FERC certificate that allows it to transport natural gas in interstate commerce without PSCo becoming subject to full FERC jurisdiction. |
| RTO | | PSCo is not presently a member of an RTO and does not operate within an RTO energy market. However, PSCo does make certain sales to other RTO’s, including SPP and participates in the SPP Western Energy Imbalance Service market, an energy imbalance market. |
| DOT | | Pipeline safety compliance. |
Recovery Mechanisms
| | | | | | | | |
| Mechanism | | Additional Information |
| Colorado Energy Plan Adjustment | | Recovers the early retirement costs of Comanche Units 1 and 2 to a maximum of 1% of the customer’s bill. |
| Decoupling | | Mechanism to true-up revenue to a baseline amount for residential (excluding lighting and demand) and metered non-demand small C&I classes (pilot program ended Sept. 2023, with amortization of previously deferred amounts expected through 2026). |
| DSM Cost Adjustment | | Recovers electric and gas DSM, interruptible service costs and performance incentives for achieving energy savings goals. |
| ECA | | Recovers fuel and purchased energy costs. Short-term sales margins are shared with customers. The ECA is revised quarterly. |
| FCA | | PSCo recovers fuel and purchased energy costs from wholesale electric customers through a fuel cost adjustment clause approved by the FERC. Wholesale customers pay production costs through a forecasted formula rate subject to true-up. |
| GCA | | Recovers costs of purchased natural gas and transportation and is revised quarterly to allow for changes in natural gas rates. |
| Purchased Capacity Cost Adjustment | | Recovers purchased capacity payments. |
| RES Adjustment | | Recovers the incremental costs of compliance with the RES with a maximum of 1% of the customer’s bill. |
| Steam Cost Adjustment | | Recovers fuel costs to operate the steam system. The Steam Cost Adjustment rate is revised quarterly. |
| Transmission Cost Adjustment | | Recovers costs between rate cases for transmission projects that result in a net increase in capacity or are part of an approved wildfire mitigation plan. |
|
| Transportation Electrification Plan | | Recovers costs associated with the investment in and adoption of transportation electrification infrastructure. |
|
Pending and Recently Concluded Regulatory Proceedings
Colorado Electric Rate Case — In 2022, PSCo filed a Colorado electric rate case seeking a revised net increase of $253 million. The total request reflected a $303 million increase, which includes $50 million of authorized costs previously recovered through various rider mechanisms. The request was based on a 10.25% ROE, an equity ratio of 55.7% and a 2023 forecast test year with a 2023 average rate base of $11.3 billion.
In September 2023, the CPUC approved a settlement between PSCo and various parties, which included the following terms:
•Retail revenue increase (excluding rider roll-ins) of $95 million (2.96%), based on a 2022 historic test year using year-end rate base with forward looking known and measurable adjustments.
•Weighted-average cost of capital of 6.95% (based on 55.69% equity ratio and 9.3% ROE).
•Termination of the revenue decoupling pilot.
•Continuation of previously authorized trackers and deferrals.
Rates became effective in September 2023.
Colorado Resource Plan — In August 2022, the CPUC approved a settlement for the Colorado Resource Plan, which provides for an expected carbon reduction and the retirement of PSCo’s remaining coal plant by the end of 2030.
In September 2023 (updated in October 2023), PSCo filed its recommended Preferred Portfolio of resources, which proposed a total of 7,521 MW of generation resources, including 4,716 owned MW and 2,805 purchased power MW. The filing also included several other alternative portfolios.
In December 2023, the CPUC approved an alternative portfolio of 5,835 MW. The decision provides an opportunity to assess timing and levels of incremental renewable resources in the Just Transition Plan filing expected to be submitted by June 1, 2024.
Approved portfolio includes the following resources:
| | | | | | | | | | | |
| Generation Resource (in MW) | Company Owned | PPAs | Total |
| Wind Resources | 1,325 | | 375 | | 1,700 | |
| Solar | 858 | | 760 | | 1,618 | |
| Storage | 500 | | 1,348 | | 1,848 | |
| Natural Gas | 450 | | 219 | | 669 | |
| Total | 3,133 | | 2,702 | | 5,835 | |
PSCo expects to invest approximately $4.8 billion in generation resources under the alternative portfolio for the benefit of its customers and achieving the state’s clean energy goals. The CPUC did not approve the May Valley to Longhorn Transmission Line, which was estimated at $250 million.
In December 2023, the CPUC approved two PIMs associated with the generation projects in the portfolio, including a two-way sharing measure related to capital construction costs and another related to ongoing levelized energy costs. These PIMs will be further defined in the written order and related proceedings throughout 2024.
In February 2024, PSCo filed an ARRR to seek approval for an updated portfolio, reflecting inclusion of certain back-up bids and clarifications of the application of PIMs.
Colorado Natural Gas Rate Case — In January 2024, PSCo filed a request with the CPUC seeking an increase to retail natural gas rates of $171 million, or an approximately 9.5% increase in the average residential customer bill. The request is based on a 2023 test year, a 10.25% ROE, an equity ratio of 55% and a $4.2 billion retail rate base which includes projected capital additions through Dec. 31, 2023. PSCo has requested a proposed effective date of Nov. 1, 2024.
PSCo has proposed to defer collection of the increased rates until Feb. 15, 2025 (following the expiration of the rider to recover Winter Storm Uri costs) to mitigate customer bill impacts, with revenues for the deferred period collected over a 12-month period beginning on that date.
The request supports fundamental infrastructure investments to serve customers, consistent with PSCo’s obligation to provide safe, reliable service while enabling PSCo to continue to be a leader of the clean energy transition in partnership with the CPUC to achieve clean heat goals.
| | | | | | | | |
| Revenue Request (millions of dollars) | | |
| Changes since 2022 rate case: | | |
Plant related investments (a) | | $ | 145 | |
| Operations and maintenance, amortization and other expenses | | 23 | |
| Property tax expense | | 10 | |
| Sales growth | | (7) | |
|
|
|
| Total base revenue request | | $ | 171 | |
|
|
| | 5 | | | — | |
Nuclear Fuel Supply — NSP-Minnesota has contracted for its 2024 through 2027 enriched nuclear material requirements, which are in various stages of processing in Canada, Europe and the United States. NSP-Minnesota is scheduled to take delivery of approximately 29% of its average enriched nuclear material requirements from Russia through 2030. Given the evolving situation in Ukraine and its global impacts, we have entered into additional new contracts that cover potential supply interruptions of nuclear material from Russia.
Interest Rate Risk — Xcel Energy is subject to interest rate risk. Our risk management policy allows interest rate risk to be managed through the use of fixed rate debt, floating rate debt and interest rate derivatives.
A 100 basis point change in the benchmark rate on Xcel Energy’s variable rate debt would impact pretax interest expense annually by approximately $9 million and $8 million in 2023 and 2022, respectively.
NSP-Minnesota maintains a nuclear decommissioning fund, as required by the NRC. The nuclear decommissioning fund is subject to interest rate and equity price risk. The fund is invested in a diversified portfolio of debt securities, equity securities and other investments. These investments may be used only for the purpose of decommissioning NSP-Minnesota’s nuclear generating plants.
Fluctuations in equity prices or interest rates affecting the nuclear decommissioning fund do not have a direct impact on earnings due to the application of regulatory accounting. Realized and unrealized gains on the decommissioning fund investments are deferred as an offset of NSP-Minnesota’s regulatory asset for nuclear decommissioning costs.
The value of pension and postretirement plan assets and benefit costs are impacted by changes in discount rates and expected return on plan assets. Xcel Energy’s ongoing pension and postretirement investment strategy is based on plan-specific investment recommendations that seek to optimize potential investment risk and minimize interest rate risk associated with changes in the obligations as a plan’s funded status increases over time. The impacts of fluctuations in interest rates on pension and postretirement costs are mitigated by pension cost calculation methodologies and regulatory mechanisms that minimize the earnings impacts of such changes.
Credit Risk — Xcel Energy is also exposed to credit risk. Credit risk relates to the risk of loss resulting from counterparties’ nonperformance on their contractual obligations. Xcel Energy maintains credit policies intended to minimize overall credit risk and actively monitors these policies to reflect changes and scope of operations.
At Dec. 31, 2023, a 10% increase in commodity prices would have resulted in an increase in credit exposure of $27 million, while a decrease in prices of 10% would have resulted in a decrease in credit exposure of $24 million. At Dec. 31, 2022, a 10% increase in commodity prices would have resulted in an increase in credit exposure of $56 million, while a decrease in prices of 10% would have resulted in an decrease in credit exposure of $47 million.
Xcel Energy conducts credit reviews for all wholesale, trading and non-trading commodity counterparties and employs credit risk controls, such as letters of credit, parental guarantees, master netting agreements and termination provisions.
Credit exposure is monitored, and when necessary, the activity with a specific counterparty is limited until credit enhancement is provided. Distress in the financial markets could increase our credit risk.
Fair Value Measurements
Derivative contracts, with the exception of those designated as normal purchases and normal sales, are reported at fair value. Xcel Energy’s investments held in the nuclear decommissioning fund, rabbi trusts, pension and other postretirement funds are also subject to fair value accounting. See Notes 10 and 11 to the consolidated financial statements for further information.
| | |
Liquidity and Capital Resources |
Cash Flows
Operating Cash Flows
| | | | | | | | |
| (Millions of Dollars) | | Twelve Months Ended Dec. 31 |
| Cash provided by operating activities — 2022 | | $ | 3,932 | |
| | |
| Components of change — 2023 vs. 2022 | | |
| Higher net income | | 35 | |
| Non-cash transactions | | 88 | |
| Changes in working capital | | 900 | |
| Changes in net regulatory and other assets and liabilities | | 372 | |
| Cash provided by operating activities — 2023 | | $ | 5,327 | |
Net cash provided by operating activities increased by $1,395 million for 2023 as compared to 2022. The increase was largely due to continued collections of prior year deferred net natural gas, fuel and purchased energy costs, as well as the impact of decreased natural gas prices on accounts payable and receivables.
Investing Cash Flows
| | | | | | | | |
| (Millions of Dollars) | | Twelve Months Ended Dec. 31 |
| Cash used in investing activities — 2022 | | $ | (4,653) | |
| | |
| Components of change — 2023 vs. 2022 | | |
| Increased capital expenditures | | (1,216) | |
|
| Other investing activities | | (57) | |
| Cash used in investing activities — 2023 | | $ | (5,926) | |
Net cash used in investing activities increased by $1,273 million for 2023 as compared to 2022. The increase in capital expenditures was largely due to continued system expansion.
Financing Cash Flows
| | | | | | | | |
| (Millions of Dollars) | | Twelve Months Ended Dec. 31 |
| Cash provided by financing activities — 2022 | | $ | 666 | |
| | |
| Components of change — 2023 vs. 2022 | | |
| Higher debt issuances, net of repayments | | 80 | |
| Lower proceeds from issuance of common stock | | (52) | |
| Higher dividends paid to shareholders | | (80) | |
| Other financing activities | | 3 | |
| Cash provided by financing activities — 2023 | | $ | 617 | |
Net cash provided by financing activities decreased by $49 million for 2023 as compared to 2022. The decrease was largely related to the amount/timing of debt issuances and repayments.
See Note 5 to the consolidated financial statements for further information.
Capital Requirements
Xcel Energy has contractual obligations and other commitments that will need to be funded in the future. Xcel Energy expects to have adequate amounts of cash from operating and financing activities to meet both its short-term and long-term cash requirements. Xcel Energy’s financing requirements are dependent on both existing contractual obligations and other commitments, as well as projected capital forecasts. Xcel Energy expects to meet future financing requirements by periodically issuing short-term debt, long-term debt, common stock, hybrid and other securities to maintain desired capitalization ratios. Projected future financing requirements can be impacted by various factors including constraints to supply chain and labor, regulatory lag and inflation.
Material Cash Requirements and Other Commitments
| | | | | | | | | | | | | | | | | | | | | | | | | | | | | | | | |
| | Payments Due by Period (as of Dec. 31, 2023) |
| (Millions of Dollars) | | Total | | Less than 1 Year | | 1 to 3 Years | | 3 to 5 Years | | After 5 Years |
| Long-term debt, principal and interest payments | $ | 43,659 | | | $ | 1,567 | | | $ | 3,631 | | | $ | 3,564 | | | $ | 34,897 | |
| Finance lease obligations | 218 | | | 10 | | | 19 | | | 16 | | | 173 | |
Operating leases obligations (a) | 1,520 | | | 277 | | | 509 | | | 313 | | | 421 | |
Unconditional purchase obligations (b) (c) | 4,022 | | | 1,429 | | | 1,267 | | | 686 | | | 640 | |
Other long-term obligations, including current portion (d) | 57 | | | 18 | | | 27 | | | 12 | | | — | |
| Other short-term obligations | 591 | | | 591 | | | — | | | — | | | — | |
| Short-term debt | 785 | | | 785 | | | — | | | — | | | — | |
| Total contractual cash obligations | $ | 50,852 | | | $ | 4,677 | | | $ | 5,453 | | | $ | 4,591 | | | $ | 36,131 | |
(a)Included in operating lease obligations are $244 million, $461 million, $269 million and $259 million, for the less than 1 year, 1 - 3 years, 3 - 5 years and after 5 years categories, respectively, pertaining to PPAs that were accounted for as operating leases.
(b)Xcel Energy Inc. and its subsidiaries have contracts providing for the purchase and delivery of a significant portion of its fuel (nuclear, natural gas and coal) requirements. Additionally, the utility subsidiaries of Xcel Energy Inc. have entered into non-lease purchase power agreements. Certain contractual purchase obligations are adjusted on indices. Effects of price changes are mitigated through cost of energy adjustment mechanisms.
(c)Amounts exclude approximately $1 billion of minimum payments related to SPS’ extension of a non-lease PPA that otherwise expires in 2026, pending PUCT and NMPRC approvals to extend the agreement to 2039. Approval processes are expected to conclude in 2024.
(d)Primarily consists of contracts for information technology services.
Capital Expenditures — Base capital expenditures and incremental capital forecasts:
| | | | | | | | | | | | | | | | | | | | | | | | | | | | | | | | | | | | | | | | | | | | |
| | Actual | | Base Capital Forecast (Millions of Dollars) |
| By Regulated Utility | | 2023 | | 2024 | | 2025 | | 2026 | | 2027 | | 2028 | | 2024 - 2028 Total |
| PSCo | | $ | 2,310 | | | $ | 3,300 | | | $ | 5,230 | | | $ | 4,320 | | | $ | 3,620 | | | $ | 2,730 | | | $ | 19,200 | |
| NSP-Minnesota | | 2,370 | | | 2,660 | | | 2,970 | | | 2,380 | | | 2,500 | | | 2,540 | | | 13,050 | |
| SPS | | 750 | | | 910 | | | 780 | | | 660 | | | 870 | | | 830 | | | 4,050 | |
| NSP-Wisconsin | | 450 | | | 570 | | | 600 | | | 570 | | | 600 | | | 650 | | | 2,990 | |
Other (a) | | 330 | | | (20) | | | (300) | | | 10 | | | 10 | | | 10 | | | (290) | |
| Total base capital expenditures | | $ | 6,210 | | | $ | 7,420 | | | $ | 9,280 | | | $ | 7,940 | | | $ | 7,600 | | | $ | 6,760 | | | $ | 39,000 | |
(a)Other category includes intercompany transfers for safe harbor wind turbines.
| | | | | | | | | | | | | | | | | | | | | | | | | | | | | | | | | | | | | | | | | | | | |
| | Actual | | Base Capital Forecast (Millions of Dollars) |
| By Function | | 2023 | | 2024 | | 2025 | | 2026 | | 2027 | | 2028 | | 2024 - 2028 Total |
| Electric transmission | | $ | 1,320 | | | $ | 1,710 | | | $ | 2,020 | | | $ | 2,450 | | | $ | 2,850 | | | $ | 2,470 | | | $ | 11,500 | |
| Electric distribution | | 1,730 | | | 1,770 | | | 1,960 | | | 2,200 | | | 2,200 | | | 2,470 | | | 10,600 | |
| Renewables | | 350 | | | 1,500 | | | 2,910 | | | 940 | | | 240 | | | 20 | | | 5,610 | |
| Electric generation | | 780 | | | 940 | | | 1,290 | | | 1,050 | | | 1,060 | | | 600 | | | 4,940 | |
| Natural gas | | 780 | | | 740 | | | 680 | | | 630 | | | 620 | | | 570 | | | 3,240 | |
| Other | | 1,250 | | | 760 | | | 420 | | | 670 | | | 630 | | | 630 | | | 3,110 | |
| | | | | | | | | | | | |
| Total base capital expenditures | | $ | 6,210 | | | $ | 7,420 | | | $ | 9,280 | | | $ | 7,940 | | | $ | 7,600 | | | $ | 6,760 | | | $ | 39,000 | |
The base plan does not include potential renewable generation additions at the NSP System, SPS and PSCo, which could result in additional capital expenditures of approximately $5 billion. Xcel Energy generally expects to fund additional capital investment with approximately 40% equity and 60% debt.
Xcel Energy’s capital expenditure forecast is subject to continuing review and modification. Actual capital expenditures may vary from estimates due to changes in electric and natural gas projected load growth, safety and reliability needs, regulatory decisions, legislative initiatives (e.g., federal clean energy and tax policy), reserve requirements, availability of purchased power, alternative plans for meeting long-term energy needs, environmental initiatives and regulation, and merger, acquisition and divestiture opportunities.
Financing for Capital Expenditures through 2028 — Xcel Energy issues debt and equity securities to refinance retiring maturities, reduce short-term debt, fund capital programs, infuse equity in subsidiaries, fund asset acquisitions and for other general corporate purposes.
Current estimated financing plans of Xcel Energy for 2024 through 2028 (includes the impact of tax credit transferability):
| | | | | | | | |
| (Millions of Dollars) | | |
| Funding Capital Expenditures | | |
Cash from operations (a) | | $ | 22,000 | |
New debt (b) | | 13,000 | |
| Equity through the DRIP and benefit program | | 500 | |
| Other equity | | 3,500 | |
| Base capital expenditures 2024 - 2028 | | $ | 39,000 | |
| | |
| Maturing Debt | | $ | 3,780 | |
(a)Net of dividends and pension funding.
(b)Reflects a combination of short and long-term debt; net of refinancing.
Off-Balance Sheet Arrangements
Xcel Energy does not have any off-balance-sheet arrangements, other than those currently disclosed, that have or are reasonably likely to have a current or future effect on financial condition, changes in financial condition, revenues or expenses, results of operations, liquidity, capital expenditures or capital resources that is material to investors.
Common Stock Dividends — Future dividend levels will be dependent on Xcel Energy’s results of operations, financial condition, cash flows, reinvestment opportunities and other factors, and will be evaluated by the Xcel Energy Inc. Board of Directors. In February 2024, Xcel Energy announced an increase in the annual dividend of 11 cents per share, which represents an increase of 5.3%.
Xcel Energy’s dividend policy balances the following:
•Projected cash generation.
•Projected capital investment.
•A reasonable rate of return on shareholder investment.
•The impact on Xcel Energy’s capital structure and credit ratings.
In addition, there are certain statutory limitations that could affect dividend levels. Federal law places limits on the ability of public utilities within a holding company to declare dividends. Under the Federal Power Act, a public utility may not pay dividends from any funds properly included in a capital account. The utility subsidiaries’ dividends may be limited directly or indirectly by state regulatory commissions or bond indenture covenants.
See Note 5 to the consolidated financial statements for further information.
Pension Fund — Xcel Energy’s pension assets are invested in a diversified portfolio of domestic and international equity securities, short-term to long-duration fixed income securities and alternative investments, including private equity, real estate and hedge funds.
Funded status and pension assumptions:
| | | | | | | | | | | | | | |
| (Millions of Dollars) | | Dec. 31, 2023 | | Dec. 31, 2022 |
| Fair value of pension assets | | $ | 2,690 | | | $ | 2,685 | |
Projected pension obligation (a) | | 2,943 | | | 2,871 | |
| Funded status | | $ | (253) | | | $ | (186) | |
(a)Excludes non-qualified plan of $12 million and $11 million at Dec. 31, 2023 and 2022, respectively.
| | | | | | | | | | | | | | |
| Pension Assumptions | | 2023 | | 2022 |
| Discount rate | | 5.49 | % | | 5.80 | % |
| Expected long-term rate of return | | 6.93 | | | 6.93 | |
Capital Sources
Short-Term Funding Sources — Xcel Energy generally funds short-term needs, through operating cash flows, notes payable, commercial paper and bank lines of credit. The amount and timing of short-term funding needs depend on construction expenditures, working capital and dividend payments.
Short-Term Investments — Xcel Energy Inc., NSP-Minnesota, NSP-Wisconsin, PSCo and SPS maintain cash and short-term investment accounts.
Short-Term Debt — Xcel Energy Inc., NSP-Minnesota, NSP-Wisconsin, PSCo and SPS each have individual commercial paper programs. Authorized levels for these commercial paper programs are:
•$1.50 billion for Xcel Energy Inc.
•$700 million for PSCo.
•$700 million for NSP-Minnesota.
•$500 million for SPS.
•$150 million for NSP-Wisconsin.
See Note 5 to the consolidated financial statements for further information.
Credit Facility Agreements — Xcel Energy Inc., NSP-Minnesota, PSCo and SPS each have the right to request an extension of the revolving credit facility for two additional one-year periods. NSP-Wisconsin has the right to request an extension of the revolving credit facility for an additional year. All extension requests are subject to majority bank group approval.
As of Feb. 20, 2024, Xcel Energy Inc. and its utility subsidiaries had the following committed credit facilities available to meet liquidity needs:
| | | | | | | | | | | | | | | | | | | | | | | | | | | | | | | | |
| (Millions of Dollars) | | Facility (a) | | Drawn (b) | | Available | | Cash | | Liquidity |
| Xcel Energy Inc. | | $ | 1,500 | | | $ | 486 | | | $ | 1,014 | | | $ | 2 | | | $ | 1,016 | |
| PSCo | | 700 | | | 258 | | | 442 | | | 6 | | | 448 | |
| NSP-Minnesota | | 700 | | | 273 | | | 427 | | | 10 | | | 437 | |
| SPS | | 500 | | | 99 | | | 401 | | | 3 | | | 404 | |
| NSP-Wisconsin | | 150 | | | 43 | | | 107 | | | 8 | | | 115 | |
| Total | | $ | 3,550 | | | $ | 1,159 | | | $ | 2,391 | | | $ | 29 | | | $ | 2,420 | |
(a)Credit facilities expire in September 2027.
(b)Includes outstanding commercial paper and letters of credit.
Registration Statements — Xcel Energy Inc.’s Articles of Incorporation authorize the issuance of one billion shares of $2.50 par value common stock. As of Dec. 31, 2023 and 2022, Xcel Energy had approximately 555 million shares and 550 million shares of common stock outstanding, respectively.
Xcel Energy Inc. and its utility subsidiaries have registration statements on file with the SEC which are uncapped, permitting Xcel Energy Inc. and its utility subsidiaries to issue debt, equity and other securities. Debt issuance at our utility subsidiaries are subject to commission approval.
Planned Financing Activity — Xcel Energy’s 2024 financing plans reflect the following:
| | | | | | | | | | | | | | | | | | | | | | | | | | |
| Issuer | | Security | | Amount (Millions of Dollars) | | Anticipated Timing | | Expected Tenor |
| Xcel Energy Inc. | | Senior Unsecured Notes | | $ | 900 | | | First Quarter | | 10 Year |
| PSCo | | First Mortgage Bonds | | 1,200 | | | Second Quarter | | 10 Year and 30 Year |
| NSP-Minnesota | | First Mortgage Bonds | | 700 | | First Quarter | | 30 Year |
| SPS | | First Mortgage Bonds | | 550 | | Second Quarter | | 30 Year |
| NSP-Wisconsin | | First Mortgage Bonds | | 400 | | Second Quarter | | 30 Year |
Long-Term Borrowings, Equity Issuances and Other Financing Instruments — Xcel Energy may issue equity through its at-the-market program or other offerings. Financing plans are subject to change, depending on capital expenditures, regulatory outcomes, internal cash generation, market conditions, changes in tax policies and other factors.
See Note 5 to the consolidated financial statements for further information.
Earnings Guidance and Long-Term EPS and Dividend Growth Rate Objectives
Xcel Energy 2024 Earnings Guidance — Xcel Energy’s 2024 ongoing earnings guidance is a range of $3.50 to $3.60 per share.(a)
Key assumptions as compared with 2023 actual levels unless noted:
•Constructive outcomes in all pending rate case and regulatory proceedings.
•Normal weather patterns for the remainder of the year.
•Weather-normalized retail electric sales are projected to increase 2% to 3%.
•Weather-normalized retail firm natural gas sales are projected to be flat.
•Capital rider revenue is projected to increase $70 million to $80 million (net of PTCs).
•O&M expenses are projected to increase 1% to 2%.
•Depreciation expense is projected to increase approximately $250 million to $260 million.
•Property taxes are projected to increase $50 million to $60 million.
•Interest expense (net of AFUDC - debt) is projected to increase $130 million to $140 million, net of interest income.
•AFUDC - equity is projected to increase $45 million to $55 million.
•ETR is projected to be ~(4%) to (6%). The negative ETR is largely offset by PTCs flowing back to customers in the capital riders and fuel mechanisms and is largely earnings neutral. The projected ETR does not reflect the potential impact of nuclear PTCs, which are also expected to flow back to customers.
(a)Ongoing earnings is calculated using net income and adjusting for certain nonrecurring or infrequent items that are, in management’s view, not reflective of ongoing operations. Ongoing earnings could differ from those prepared in accordance with GAAP for unplanned and/or unknown adjustments. As Xcel Energy is unable to quantify the financial impacts of any additional adjustments that may occur for the year, we are unable to provide a quantitative reconciliation of the guidance for ongoing EPS to corresponding GAAP EPS.
Long-Term EPS and Dividend Growth Rate Objectives — Xcel Energy expects to deliver an attractive total return to our shareholders through a combination of earnings growth and dividend yield, based on the following long-term objectives:
• Deliver long-term annual EPS growth of 5% to 7% based off of a 2023 actual ongoing earnings base of $3.35 per share.
• Deliver annual dividend increases of 5% to 7%.
• Target a dividend payout ratio of 50% to 60%.
• Maintain senior secured debt credit ratings in the A range.
| | |
ITEM 7A — QUANTITATIVE AND QUALITATIVE DISCLOSURES ABOUT MARKET RISK |
See the “Derivatives, Risk Management and Market Risk” section in Item 7, incorporated by reference.
| | |
ITEM 8 — FINANCIAL STATEMENTS AND SUPPLEMENTARY DATA |
See Item 15-1 for an index of financial statements included herein.
See Note 15 to the consolidated financial statements for further information.
Management Report on Internal Control Over Financial Reporting
The management of Xcel Energy Inc. is responsible for establishing and maintaining adequate internal control over financial reporting. Xcel Energy Inc.’s internal control system was designed to provide reasonable assurance to Xcel Energy Inc.’s management and Board of Directors regarding the preparation and fair presentation of published financial statements.
All internal control systems, no matter how well designed, have inherent limitations. Therefore, even those systems determined to be effective can provide only reasonable assurance with respect to financial statement preparation and presentation.
Xcel Energy Inc. management assessed the effectiveness of Xcel Energy Inc.’s internal control over financial reporting as of Dec. 31, 2023. In making this assessment, it used the criteria set forth by the Committee of Sponsoring Organizations of the Treadway Commission (COSO) in Internal Control — Integrated Framework (2013). Based on our assessment, we believe that, as of Dec. 31, 2023, Xcel Energy Inc.’s internal control over financial reporting is effective at the reasonable assurance level based on those criteria.
Xcel Energy Inc.’s independent registered public accounting firm has issued an attestation report on Xcel Energy Inc.’s internal control over financial reporting. Its report appears herein.
| | | | | | | | | | | | | | |
| /s/ ROBERT C. FRENZEL | | | /s/ BRIAN J. VAN ABEL | |
| Robert C. Frenzel | | | Brian J. Van Abel | |
| Chairman, President, Chief Executive Officer and Director | | Executive Vice President, Chief Financial Officer |
| Feb. 21, 2024 | | | Feb. 21, 2024 | |
| | | | |
REPORT OF INDEPENDENT REGISTERED PUBLIC ACCOUNTING FIRM
To the stockholders and the Board of Directors of Xcel Energy Inc.
Opinions on the Financial Statements and Internal Control over Financial Reporting
We have audited the accompanying consolidated balance sheets of Xcel Energy Inc. and subsidiaries (the "Company") as of December 31, 2023 and 2022, the related consolidated statements of income, comprehensive income, stockholders' equity, and cash flows, for each of the three years in the period ended December 31, 2023, and the related notes and the schedules listed in the Index at Item 15 (collectively referred to as the "financial statements"). We also have audited the Company’s internal control over financial reporting as of December 31, 2023, based on criteria established in Internal Control — Integrated Framework (2013) issued by the Committee of Sponsoring Organizations of the Treadway Commission (COSO).
In our opinion, the financial statements referred to above present fairly, in all material respects, the financial position of the Company as of December 31, 2023 and 2022, and the results of its operations and its cash flows for each of the three years in the period ended December 31, 2023, in conformity with accounting principles generally accepted in the United States of America. Also, in our opinion, the Company maintained, in all material respects, effective internal control over financial reporting as of December 31, 2023, based on criteria established in Internal Control — Integrated Framework (2013) issued by COSO.
Basis for Opinions
The Company’s management is responsible for these financial statements, for maintaining effective internal control over financial reporting, and for its assessment of the effectiveness of internal control over financial reporting, included in the accompanying Management Report on Internal Controls over Financial Reporting. Our responsibility is to express an opinion on these financial statements and an opinion on the Company’s internal control over financial reporting based on our audits. We are a public accounting firm registered with the Public Company Accounting Oversight Board (United States) (PCAOB) and are required to be independent with respect to the Company in accordance with the U.S. federal securities laws and the applicable rules and regulations of the Securities and Exchange Commission and the PCAOB.
We conducted our audits in accordance with the standards of the PCAOB. Those standards require that we plan and perform the audits to obtain reasonable assurance about whether the financial statements are free of material misstatement, whether due to error or fraud, and whether effective internal control over financial reporting was maintained in all material respects.
Our audits of the financial statements included performing procedures to assess the risks of material misstatement of the financial statements, whether due to error or fraud, and performing procedures to respond to those risks. Such procedures included examining, on a test basis, evidence regarding the amounts and disclosures in the financial statements. Our audits also included evaluating the accounting principles used and significant estimates made by management, as well as evaluating the overall presentation of the financial statements. Our audit of internal control over financial reporting included obtaining an understanding of internal control over financial reporting, assessing the risk that a material weakness exists, and testing and evaluating the design and operating effectiveness of internal control based on the assessed risk. Our audits also included performing such other procedures as we considered necessary in the circumstances. We believe that our audits provide a reasonable basis for our opinions.
Definition and Limitations of Internal Control over Financial Reporting
A company’s internal control over financial reporting is a process designed to provide reasonable assurance regarding the reliability of financial reporting and the preparation of financial statements for external purposes in accordance with generally accepted accounting principles. A company’s internal control over financial reporting includes those policies and procedures that (1) pertain to the maintenance of records that, in reasonable detail, accurately and fairly reflect the transactions and dispositions of the assets of the company; (2) provide reasonable assurance that transactions are recorded as necessary to permit preparation of financial statements in accordance with generally accepted accounting principles, and that receipts and expenditures of the company are being made only in accordance with authorizations of management and directors of the company; and (3) provide reasonable assurance regarding prevention or timely detection of unauthorized acquisition, use, or disposition of the company’s assets that could have a material effect on the financial statements.
Because of its inherent limitations, internal control over financial reporting may not prevent or detect misstatements. Also, projections of any evaluation of effectiveness to future periods are subject to the risk that controls may become inadequate because of changes in conditions, or that the degree of compliance with the policies or procedures may deteriorate.
Critical Audit Matter
The critical audit matter communicated below is a matter arising from the current-period audit of the financial statements that was communicated or required to be communicated to the audit committee and that (1) relates to accounts or disclosures that are material to the financial statements and (2) involved our especially challenging, subjective, or complex judgments. The communication of critical audit matters does not alter in any way our opinion on the financial statements, taken as a whole, and we are not, by communicating the critical audit matter below, providing a separate opinion on the critical audit matter or on the accounts or disclosures to which it relates.
Regulatory Assets and Liabilities - Impact of Rate Regulation on the Financial Statements — Refer to Notes 4 and 12 to the consolidated financial statements.
Critical Audit Matter Description
The Company is subject to rate regulation by state utility regulatory agencies, which have jurisdiction with respect to the rates of electric and natural gas distribution companies in Minnesota, North Dakota, South Dakota, Wisconsin, Michigan, Colorado, New Mexico, and Texas. The Company is also subject to the jurisdiction of the Federal Energy Regulatory Commission for its wholesale electric operations, hydroelectric generation licensing, accounting practices, wholesale sales for resale, transmission of electricity in interstate commerce, compliance with North American Electric Reliability Corporation standards, asset transactions and mergers and natural gas transactions in interstate commerce, (collectively with state utility regulatory agencies, the “Commissions”). Management has determined it meets the requirements under accounting principles generally accepted in the United States of America to prepare its financial statements applying the specialized rules to account for the effects of cost-based rate regulation. Accounting for the economics of rate regulation affects multiple financial statement line items and disclosures, including property, plant and equipment, regulatory assets and liabilities, operating revenues and expenses, and income taxes.
The Company is subject to regulatory rate setting processes. Rates are determined and approved in regulatory proceedings based on an analysis of the Company’s costs to provide utility service and a return on, and recovery of, the Company’s investment in assets required to deliver services to customers. Accounting for the Company’s regulated operations provides that rate-regulated entities report assets and liabilities consistent with the recovery of those incurred costs in rates, if it is probable that such rates will be charged and collected. The Commissions’ regulation of rates is premised on the full recovery of incurred costs and a reasonable rate of return on invested capital. Decisions by the Commissions in the future will impact the accounting for regulated operations, including decisions about the amount of allowable costs and return on invested capital included in rates and any refunds that may be required. In the rate setting process, the Company’s rates result in the recording of regulatory assets and liabilities based on the probability of future cash flows. Regulatory assets generally represent incurred or accrued costs that have been deferred because future recovery from customers is probable. Regulatory liabilities generally represent amounts that are expected to be refunded to customers in future rates or amounts collected in current rates for future costs.
We identified the impact of rate regulation as a critical audit matter due to the significant judgments made by management to support its assertions about impacted account balances and disclosures and the high degree of subjectivity involved in assessing the impact of future regulatory orders on the financial statements. Management judgments include assessing the likelihood of recovery in future rates of incurred costs and refunds due to customers. Given that management’s accounting judgments are based on assumptions about the outcome of future decisions by the Commissions, auditing these judgments required specialized knowledge of accounting for rate regulation and the rate setting process due to its inherent complexities.
How the Critical Audit Matter Was Addressed in the Audit
Our audit procedures related to the uncertainty of future decisions by the Commissions included the following, among others:
•We tested the effectiveness of management’s controls over the evaluation of the likelihood of (1) the recovery in future rates of costs deferred as regulatory assets, and (2) a refund or a future reduction in rates that should be reported as regulatory liabilities. We also tested the effectiveness of management’s controls over the recognition of regulatory assets or liabilities and the monitoring and evaluation of regulatory developments that may affect the likelihood of recovering costs in future rates or of a future reduction in rates.
•We evaluated the Company’s disclosures related to the impacts of rate regulation, including the balances recorded and regulatory developments.
•We read relevant regulatory orders issued by the Commissions for the Company, other regulatory filings, legal decisions and recommendations being evaluated by the Commissions, and other publicly available information to assess the likelihood of recovery in future rates or of a future reduction in rates. We evaluated historic orders for precedents of the Commissions’ treatment of similar costs under similar circumstances. We compared the regulatory orders, filings and other publicly available information to the Company’s recorded regulatory assets and liabilities for completeness.
•We obtained management’s analysis and correspondence from counsel, as appropriate, regarding regulatory assets or liabilities not yet addressed in a regulatory order to assess management’s assertion that amounts are probable of recovery or a future reduction in rates.
| | |
/s/ |
|
| February 21, 2024 |
|
| We have served as the Company’s auditor since 2002. |
XCEL ENERGY INC. AND SUBSIDIARIES
CONSOLIDATED STATEMENTS OF INCOME
(amounts in millions, except per share data)
| | | | | | | | | | | | | | | | | | | | |
| | Year Ended Dec. 31 |
| | 2023 | | 2022 | | 2021 |
| Operating revenues | | | | | | |
| Electric | | $ | | | | $ | | | | $ | | |
| Natural gas | | | | | | | | | |
| Other | | | | | | | | | |
| Total operating revenues | | | | | | | | | |
| | | | | | |
| Operating expenses | | | | | | |
| Electric fuel and purchased power | | | | | | | | | |
| Cost of natural gas sold and transported | | | | | | | | | |
| Cost of sales — other | | | | | | | | | |
| Operating and maintenance expenses | | | | | | | | | |
| Conservation and demand side management expenses | | | | | | | | | |
| Depreciation and amortization | | | | | | | | | |
| Taxes (other than income taxes) | | | | | | | | | |
| Loss on Comanche Unit 3 litigation | | | | | | | | | |
| Workforce reduction expenses | | | | | | | | | |
| Total operating expenses | | | | | | | | | |
| | | | | | |
| Operating income | | | | | | | | | |
| | | | | | |
| Other income (expense), net | | | | | () | | | | |
| Earnings from equity method investments | | | | | | | | | |
| Allowance for funds used during construction — equity | | | | | | | | | |
| | | | | | |
| Interest charges and financing costs | | | | | | |
Interest charges — includes other financing costs of $, $ and $, respectively | | | | | | | | | |
| Allowance for funds used during construction — debt | | () | | | () | | | () | |
| Total interest charges and financing costs | | | | | | | | | |
| | | | | | |
| Income before income taxes | | | | | | | | | |
| Income tax benefit | | () | | | () | | | () | |
| Net income | | $ | | | | $ | | | | $ | | |
| | | | | | |
| Weighted average common shares outstanding: | | | | | | |
| Basic | | | | | | | | | |
| Diluted | | | | | | | | | |
| | | | | | |
| Earnings per average common share: | | | | | | |
| Basic | | $ | | | | $ | | | | $ | | |
| Diluted | | | | | | | | | |
| | | | | | |
| See Notes to Consolidated Financial Statements |
XCEL ENERGY INC. AND SUBSIDIARIES
CONSOLIDATED STATEMENTS OF COMPREHENSIVE INCOME
(amounts in millions)
| | | | | | | | | | | | | | | | | | | | |
| | Year Ended Dec. 31 |
| | 2023 | | 2022 | | 2021 |
| | | | | | |
| Net income | | $ | | | | $ | | | | $ | | |
| Other comprehensive income | | | | | | |
| Pension and retiree medical benefits: | | | | | | |
| Net pension and retiree medical (losses) gains arising during the period, net of tax | | () | | | | | | | |
| Reclassification of losses to net income, net of tax | | | | | | | | | |
| Derivative instruments: | | | | | | |
| Net fair value (decrease) increase, net of tax | | () | | | | | | | |
| Reclassification of losses to net income, net of tax | | | | | | | | | |
| | | | | | |
| Total other comprehensive (loss) income | | () | | | | | | | |
| Total comprehensive income | | $ | | | | $ | | | | $ | | |
| See Notes to Consolidated Financial Statements |
XCEL ENERGY INC. AND SUBSIDIARIES
CONSOLIDATED STATEMENTS OF CASH FLOWS
(amounts in millions)
| | | | | | | | | | | | | | | | | |
| | Year Ended Dec. 31 |
| | 2023 | | 2022 | | 2021 |
| Operating activities | | | | | |
| Net income | $ | | | | $ | | | | $ | | |
| Adjustments to reconcile net income to cash provided by operating activities: | | | | | |
| Depreciation and amortization | | | | | | | | |
| Nuclear fuel amortization | | | | | | | | |
| Deferred income taxes | () | | | () | | | () | |
| Allowance for equity funds used during construction | () | | | () | | | () | |
| Earnings from equity method investments | () | | | () | | | () | |
| Dividends from equity method investments | | | | | | | | |
| Provision for bad debts | | | | | | | | |
| Share-based compensation expense | | | | | | | | |
| | | |
| Changes in operating assets and liabilities: | | | | | |
| Accounts receivable | () | | | () | | | () | |
| Accrued unbilled revenues | | | | () | | | () | |
| Inventories | () | | | () | | | () | |
| Other current assets | | | | () | | | () | |
| Accounts payable | () | | | | | | | |
| Net regulatory assets and liabilities | | | | | | | () | |
| Other current liabilities | | | | | | | () | |
| Pension and other employee benefit obligations | | | | () | | | () | |
| Other, net | () | | | () | | | () | |
| Net cash provided by operating activities | | | | | | | | |
| | | | | |
| Investing activities | | | | | |
| Capital/construction expenditures | () | | | () | | | () | |
| | | |
| Purchase of investment securities | () | | | () | | | () | |
| Proceeds from the sale of investment securities | | | | | | | | |
| Other, net | () | | | | | | () | |
| Net cash used in investing activities | () | | | () | | | () | |
| | | | | |
| Financing activities | | | | | |
| (Repayments of) proceeds from short-term borrowings, net | () | | | () | | | | |
| Proceeds from issuances of long-term debt | | | | | | | | |
| Repayments of long-term debt | () | | | () | | | () | |
| Proceeds from issuance of common stock | | | | | | | | |
| Dividends paid | () | | | () | | | () | |
| Other, net | () | | | () | | | () | |
| Net cash provided by financing activities | | | | | | | | |
| | | | | |
| Net change in cash and cash equivalents | | | | () | | | | |
| Cash, cash equivalents and restricted cash at beginning of period | | | | | | | | |
| Cash, cash equivalents and restricted cash at end of period | $ | | | | $ | | | | $ | | |
| | | | | |
| Supplemental disclosure of cash flow information: | | | | | |
| Cash paid for interest (net of amounts capitalized) | $ | () | | | $ | () | | | $ | () | |
| Cash received (paid) for income taxes, net | | | | () | | | () | |
| | | | | |
| Supplemental disclosure of non-cash investing and financing transactions: | | | | | |
| Accrued property, plant and equipment additions | $ | | | | $ | | | | $ | | |
| Inventory transfers to property, plant and equipment | | | | | | | | |
| Operating lease right-of-use assets | | | | | | | | |
| Allowance for equity funds used during construction | | | | | | | | |
| Issuance of common stock for reinvested dividends and/or equity awards | | | | | | | | |
| See Notes to Consolidated Financial Statements |
XCEL ENERGY INC. AND SUBSIDIARIES
CONSOLIDATED BALANCE SHEETS
(amounts in millions, except share and per share) | | | | | | | | | | | | | | |
| | Dec. 31 |
| | 2023 | | 2022 |
| Assets | | | | |
| Current assets | | | | |
| Cash and cash equivalents | | $ | | | | $ | | |
| Accounts receivable, net | | | | | | |
| Accrued unbilled revenues | | | | | | |
| Inventories | | | | | | |
| Regulatory assets | | | | | | |
| Derivative instruments | | | | | | |
| Prepaid taxes | | | | | | |
| Prepayments and other | | | | | | |
| Total current assets | | | | | | |
| | | | |
| Property, plant and equipment, net | | | | | | |
| | | | |
| Other assets | | | | |
| Nuclear decommissioning fund and other investments | | | | | | |
| Regulatory assets | | | | | | |
| Derivative instruments | | | | | | |
| Operating lease right-of-use assets | | | | | | |
| Other | | | | | | |
| Total other assets | | | | | | |
| Total assets | | $ | | | | $ | | |
| | | | |
| Liabilities and Equity | | | | |
| Current liabilities | | | | |
| Current portion of long-term debt | | $ | | | | $ | | |
| Short-term debt | | | | | | |
| Accounts payable | | | | | | |
| Regulatory liabilities | | | | | | |
| Taxes accrued | | | | | | |
| Accrued interest | | | | | | |
| Dividends payable | | | | | | |
| Derivative instruments | | | | | | |
| Operating lease liabilities | | | | | | |
| Other | | | | | | |
| Total current liabilities | | | | | | |
| | | | |
| Deferred credits and other liabilities | | | | |
| Deferred income taxes | | | | | | |
| Deferred investment tax credits | | | | | | |
| Regulatory liabilities | | | | | | |
| Asset retirement obligations | | | | | | |
| Derivative instruments | | | | | | |
| Customer advances | | | | | | |
| Pension and employee benefit obligations | | | | | | |
| Operating lease liabilities | | | | | | |
| Other | | | | | | |
| Total deferred credits and other liabilities | | | | | | |
| | | | |
| Commitments and contingencies | | | | |
| Capitalization | | | | |
| Long-term debt | | | | | | |
Common stock — shares authorized of $ par value; and shares outstanding at Dec. 31, 2023 and Dec. 31, 2022, respectively | | | | | | |
| Additional paid in capital | | | | | | |
| Retained earnings | | | | | | |
| Accumulated other comprehensive loss | | () | | | () | |
| Total common stockholders’ equity | | | | | | |
| Total liabilities and equity | | $ | | | | $ | | |
| | | | |
| See Notes to Consolidated Financial Statements |
XCEL ENERGY INC. AND SUBSIDIARIES
CONSOLIDATED STATEMENTS OF COMMON STOCKHOLDERS’ EQUITY
(amounts in millions, except per share data; shares in actual amounts)
| | | | | | | | | | | | | | | | | | | | | | | | | | | | | | | | | | | |
| Common Stock Issued | | Retained Earnings | | Accumulated Other Comprehensive Loss | | Total Common Stockholders’ Equity |
| Shares | | Par Value | | Additional Paid
In Capital | | | |
| | | | | | | | | | | |
| Balance at Dec. 31, 2020 | | | | $ | | | | $ | | | | $ | | | | $ | () | | | $ | | |
| | | | | | | | | | | |
| Net income | | | | | | | | | | | | | |
| Other comprehensive income | | | | | | | | | | | | | |
Dividends declared on common stock ($ per share) | | | | | | | () | | | | | () | |
| Issuances of common stock | | | | | | | | | | | | | | | |
| | | | | | | | | |
| Share-based compensation | | | | | | | | () | | | | | | |
| | | | | | | | | |
| Balance at Dec. 31, 2021 | | | | $ | | | | $ | | | | $ | | | | $ | () | | | $ | | |
| | | | | | | | | | | |
| Net Income | | | | | | | | | | | | | |
| Other comprehensive loss | | | | | | | | | | | | | |
Dividends declared on common stock ($ per share) | | | | | | | () | | | | | () | |
| Issuances of common stock | | | | | | | | | | | | | | | |
| | | | | | | | | |
| Share-based compensation | | | | | | | | () | | | | | | |
| | | | | | | | | |
| Balance at Dec. 31, 2022 | | | | $ | | | | $ | | | | $ | | | | $ | () | | | $ | | |
| | | | | | | | | | | |
| Net income | | | | | | | | | | | | | |
| Other comprehensive income | | | | | | | | | () | | | () | |
Dividends declared on common stock ($ per share) | | | | | | | () | | | | | () | |
| Issuances of common stock | | | | | | | | | | | | | | | |
| | | | | | | | | |
| Share-based compensation | | | | | | | | () | | | | | | |
| | | | | | | | | |
|
|
|
|
|
|
|
|
|
|
|
|
(a) million in CWIP.
Each company’s share of operating expenses and construction expenditures is included in the applicable utility accounts. Respective owners are responsible for providing their own financing.
| | |
4. Regulatory Assets and Liabilities |
| | $ | | | | $ | | | | $ | | |
| Recoverable deferred taxes on AFUDC | | | | Plant lives | | | | | | | | | | | | |
Net AROs (b) | | 1, 12 | | Various | | | | | | | | | | | | |
Excess deferred taxes — TCJA | | 7 | | Various | | | | | | | | | | | | |
| Depreciation differences | | | | One to years | | | | | | | | | | | | |
| Environmental remediation costs | | 1, 12 | | Various | | | | | | | | | | | | |
| Deferred natural gas, electric, steam energy/fuel costs | | | | One to three years | | | | | | | | | | | | |
Conservation programs (c) | | 1 | | One to two years | | | | | | | | | | | | |
| Purchased power contract costs | | | | Term of related contract | | | | | | | | | | | | |
| PI extended power uprate | | | | years | | | | | | | | | | | | |
| Benson biomass PPA termination and asset purchase | | | | Five years | | | | | | | | | | | | |
| Sales true-up and revenue decoupling | | | | One to two years | | | | | | | | | | | | |
| State commission adjustments | | | | Plant lives | | | | | | | | | | | | |
| Losses on reacquired debt | | | | Term of related debt | | | | | | | | | | | | |
| MISO capacity revenue tracker | | | | One to two years | | | | | | | | | | | | |
| Gas pipeline inspection and remediation costs | | | | One to two years | | | | | | | | | | | | |
Contract valuation adjustments (d) | | 1, 10 | | Term of related contract | | | | | | | | | | | | |
| Nuclear refueling outage costs | | 1 | | One to two years | | | | | | | | | | | | |
| Grid modernization costs | | | | One to two years | | | | | | | | | | | | |
| Renewable resources and environmental initiatives | | | | One to two years | | | | | | | | | | | | |
| | | | | | | | | | |
| | | | | | | | | | |
| | | | | | | | | | |
| Other | | | | Various | | | | | | | | | | | | |
| Total regulatory assets | | | | | | $ | | | | $ | | | | $ | | | | $ | | |
(a)
(b)
(c)
(d)
| | $ | | | | $ | | | | $ | | | | Plant removal costs | | 1, 12 | | Various | | | | | | | | | | | | |
Effects of regulation on employee benefit costs (b) | | | | Various | | | | | | | | | | | | |
| Renewable resources and environmental initiatives | | | | Various | | | | | | | | | | | | |
Net AROs (c) | | | | Various | | | | | | | | | | | | |
| Sales true-up and revenue decoupling | | | | Two years | | | | | | | | | | | | |
| | | | | | | | | | |
ITC deferrals | | 1 | | Various | | | | | | | | | | | | |
| LP&L departure payment | | | | Up to years | | | | | | | | | | | | |
| Formula rates | | | | One to two years | | | | | | | | | | | | |
| DOE settlement | | | | One to two years | | | | | | | | | | | | |
| Deferred natural gas, electric, steam energy/fuel costs | | | | Less than one year | | | | | | | | | | | | |
Contract valuation adjustments (d) | | 1, 10 | | Less than one year | | | | | | | | | | | | |
Conservation programs (e) | | 1 | | Less than one year | | | | | | | | | | | | |
| Other | | | | Various | | | | | | | | | | | | |
Total regulatory liabilities (f) | | | | | | $ | | | | $ | | | | $ | | | | $ | | |
(a)
(b)
(c)
(d)
(e)
(f) million and $ million for 2023 and 2022, respectively, is included in other current liabilities.
Xcel Energy’s regulatory assets not earning a return include past expenditures of $ million and $ million at Dec. 31, 2023 and 2022 respectively, which predominately relate to purchased natural gas and electric energy costs (including certain costs related to Winter Storm Uri), sales true-up and revenue decoupling, various renewable resources/environmental initiatives and certain prepaid pension amounts. Additionally, the unfunded portion of pension and retiree medical obligations and net AROs (i.e. deferrals for which cash has not been disbursed) do not earn a return.
| | |
5. Borrowings and Other Financing Instruments |
| | $ | | | | $ | | | | $ | | | | Amount outstanding at period end | | | | | | | | | | | | |
| Average amount outstanding | | | | | | | | | | | | |
| Maximum amount outstanding | | | | | | | | | | | | |
| Weighted average interest rate, computed on a daily basis | | | % | | | % | | | % | | | % |
| Weighted average interest rate at period end | | | | | | | | | | | | |
Letters of Credit — Xcel Energy uses letters of credit, typically with terms of , to provide financial guarantees for certain operating obligations. As of Dec. 31, 2023 and 2022, there were $ million and $ million of letters of credit outstanding under the credit facilities, respectively. Amounts approximate their fair value.
Credit Facilities — In order to use commercial paper programs to fulfill short-term funding needs, Xcel Energy Inc. and its utility subsidiaries must have revolving credit facilities in place at least equal to the amount of their respective commercial paper borrowing limits and cannot issue commercial paper exceeding available capacity under these credit facilities.
The lines of credit provide short-term financing in the form of notes payable to banks, letters of credit and back-up support for commercial paper borrowings.
Terms of Credit Agreements — In September 2022, Xcel Energy Inc., NSP-Minnesota, NSP-Wisconsin, PSCo and SPS each entered into an amended five-year credit agreement with a syndicate of banks. The aggregate borrowing limit is $ billion. The amended credit agreements mature in September 2027.
% | | | % | | $ | | | | | | | NSP-Minnesota | | | | | | | | | | | | |
| NSP-Wisconsin | | | | | | | | N/A | | | |
| SPS | | | | | | | | | | | | |
| PSCo | | | | | | | | | | | | |
(a)%.
(b)
(c)
(d)% of Xcel Energy’s consolidated total assets) default on indebtedness in an aggregate principal amount exceeding $ million.
If Xcel Energy Inc. or its utility subsidiaries do not comply with the covenant, an event of default may be declared, and if not remedied, any outstanding amounts due under the facility can be declared due by the lender. As of Dec. 31, 2023, Xcel Energy Inc. and its subsidiaries were in compliance with all financial covenants.
| | $ | | | | $ | | | | PSCo | | | | | | | | | |
| NSP-Minnesota | | | | | | | | | |
| SPS | | | | | | | | | |
| NSP-Wisconsin | | | | | | | | | |
| Total | | $ | | | | $ | | | | $ | | |
(a)
(b)
All credit facility bank borrowings, outstanding letters of credit and outstanding commercial paper reduce the available capacity under the credit facilities. Xcel Energy Inc. and its utility subsidiaries had direct advances on facilities outstanding as of Dec. 31, 2023 and 2022.
Long-Term Borrowings and Other Financing Instruments
Generally, the property of NSP-Minnesota, NSP-Wisconsin, PSCo and SPS is subject to the liens of their respective first mortgage indentures for the benefit of bondholders.
Debt premiums, discounts and expenses are amortized over the life of the related debt. The premiums, discounts and expenses for refinanced debt are deferred and amortized over the life of the new issuance.
% | | Oct. 15, 2023 | | $ | | | | $ | | | | Unsecured senior notes | | | | | June 1, 2025 | | | | | | |
| Unsecured senior notes | | | | | June 1, 2025 | | | | | | |
| Unsecured senior notes | | | | | Dec. 1, 2026 | | | | | | |
| Unsecured senior notes | | | | | March 15, 2027 | | | | | | |
| Unsecured senior notes | | | | | June 15, 2028 | | | | | | |
| Unsecured senior notes | | | | | June 15, 2028 | | | | | | |
| Unsecured senior notes | | | | | Dec. 1, 2029 | | | | | | |
| Unsecured senior notes | | | | | June 1, 2030 | | | | | | |
Unsecured senior notes | | | | | Nov. 15, 2031 | | | | | | |
Unsecured senior notes (a) | | | | | June 1, 2032 | | | | | | |
Unsecured senior notes (b) | | | | | Aug. 15, 2033 | | | | | | |
| Unsecured senior notes | | | | | July 1, 2036 | | | | | | |
| Unsecured senior notes | | | | | Sept. 15, 2041 | | | | | | |
| Unsecured senior notes | | | | | Dec. 1, 2049 | | | | | | |
| Unamortized discount | | | | | | () | | | () | |
| Unamortized debt issuance cost | | | | | | () | | | () | |
| Current maturities | | | | | | | | | () | |
| Total long-term debt | | | | | | $ | | | | $ | | |
(a).
(b).
| | | | | | | | | | | | | | | | | | | | | | | | | | |
| NSP-Minnesota |
| Financing Instrument | | Interest Rate | | Maturity Date | | 2023 | | 2022 |
| First mortgage bonds | | | % | | May 15, 2023 | | $ | | | | $ | | |
| First mortgage bonds | | | | | July 1, 2025 | | | | | | |
| First mortgage bonds | | | | | March 1, 2028 | | | | | | |
| First mortgage bonds | | | | | April 1, 2031 | | | | | | |
| First mortgage bonds | | | | | July 15, 2035 | | | | | | |
| First mortgage bonds | | | | | June 1, 2036 | | | | | | |
| First mortgage bonds | | | | | July 1, 2037 | | | | | | |
| First mortgage bonds | | | | | Nov. 1, 2039 | | | | | | |
| First mortgage bonds | | | | | Aug. 15, 2040 | | | | | | |
| First mortgage bonds | | | | | Aug. 15, 2042 | | | | | | |
| First mortgage bonds | | | | | May 15, 2044 | | | | | | |
| First mortgage bonds | | | | | Aug. 15, 2045 | | | | | | |
| First mortgage bonds | | | | | May 15, 2046 | | | | | | |
| First mortgage bonds | | | | | Sept. 15, 2047 | | | | | | |
| First mortgage bonds | | | | | March 1, 2050 | | | | | | |
| First mortgage bonds | | | | | June 1, 2051 | | | | | | |
| First mortgage bonds | | | | | April 1, 2052 | | | | | | |
First mortgage bonds (a) | | | | | June 1, 2052 | | | | | | |
First mortgage bonds (b) | | | | | May 15, 2053 | | | | | | |
| Other long-term debt | | | | | | | | | | |
| Unamortized discount | | | | | | () | | | () | |
| Unamortized debt issuance cost | | | | | | () | | | () | |
| Current maturities | | | | | | | | | () | |
| Total long-term debt | | | | | | $ | | | | $ | | |
(a)
(b)
% | | June 15, 2024 | | $ | | | | $ | | | | First mortgage bonds | | | | | June 15, 2024 | | | | | | |
| First mortgage bonds | | | | | Sept. 1, 2038 | | | | | | |
| First mortgage bonds | | | | | Oct. 1, 2042 | | | | | | |
| First mortgage bonds | | | | | Dec. 1, 2047 | | | | | | |
| First mortgage bonds | | | | | Sept. 1, 2048 | | | | | | |
| First mortgage bonds | | | | | May 1, 2051 | | | | | | |
| First mortgage bonds | | | | | May 1, 2051 | | | | | | |
First mortgage bonds (a) | | | | | Sept. 15, 2052 | | | | | | |
First mortgage bonds (b) | | | | | June 15, 2053 | | | | | | |
| | | | | | |
| Unamortized discount | | | | | | () | | | () | |
| Unamortized debt issuance cost | | | | | | () | | | () | |
| Current maturities | | | | | | () | | | | |
| Total long-term debt | | | | | | $ | | | | $ | | |
(a)
(b)
| | | | | | | | | | | | | | | | | | | | | | | | | | |
| PSCo |
| Financing Instrument | | Interest Rate | | Maturity Date | | 2023 | | 2022 |
| First mortgage bonds | | | % | | March 15, 2023 | | $ | | | | $ | | |
| First mortgage bonds | | | | | May 15, 2025 | | | | | | |
| First mortgage bonds | | | | | June 15, 2028 | | | | | | |
| First mortgage bonds | | | | | Jan. 15, 2031 | | | | | | |
| First mortgage bonds | | | | | June 15, 2031 | | | | | | |
First mortgage bonds (a) | | | | | June 1, 2032 | | | | | | |
| First mortgage bonds | | | | | Sept. 1, 2037 | | | | | | |
| First mortgage bonds | | | | | Aug. 1, 2038 | | | | | | |
| First mortgage bonds | | | | | Aug. 15, 2041 | | | | | | |
| First mortgage bonds | | | | | Sept. 15, 2042 | | | | | | |
| First mortgage bonds | | | | | March 15, 2043 | | | | | | |
| First mortgage bonds | | | | | March 15, 2044 | | | | | | |
| First mortgage bonds | | | | | June 15, 2046 | | | | | | |
| First mortgage bonds | | | | | June 15, 2047 | | | | | | |
| First mortgage bonds | | | | | June 15, 2048 | | | | | | |
| First mortgage bonds | | | | | Sept. 15, 2049 | | | | | | |
| First mortgage bonds | | | | | March 1, 2050 | | | | | | |
| First mortgage bonds | | | | | Jan. 15, 2051 | | | | | | |
First mortgage bonds (a) | | | | | June 1, 2052 | | | | | | |
First mortgage bonds (b) | | | | | April 1, 2053 | | | | | | |
| Unamortized discount | | | | | | () | | | () | |
| Unamortized debt issuance cost | | | | | | () | | | () | |
| Current maturities | | | | | | | | | () | |
| Total long-term debt | | | | | | $ | | | | $ | | |
(a).
(b)
| % | | June 15, 2024 | | $ | | | | $ | | | | First mortgage bonds | | | | | June 15, 2024 | | | | | | |
| Unsecured senior notes | | | | | Oct. 1, 2033 | | | | | | |
| Unsecured senior notes | | | | | Oct. 1, 2036 | | | | | | |
| First mortgage bonds | | | | | Aug. 15, 2041 | | | | | | |
| First mortgage bonds | | | | | Aug. 15, 2041 | | | | | | |
| First mortgage bonds | | | | | Aug. 15, 2041 | | | | | | |
| First mortgage bonds | | | | | Aug. 15, 2046 | | | | | | |
| First mortgage bonds | | | | | Aug. 15, 2047 | | | | | | |
| First mortgage bonds | | | | | Nov. 15, 2048 | | | | | | |
| First mortgage bonds | | | | | June 15, 2049 | | | | | | |
| First mortgage bonds | | | | | May 1, 2050 | | | | | | |
| First mortgage bonds | | | | | May 1, 2050 | | | | | | |
First mortgage bonds (a) | | | | | June 1, 2052 | | | | | | |
First mortgage bonds (b) | | | | | Sept. 15, 2053 | | | | | | |
| Unamortized discount | | | | | | () | | | () | |
| Unamortized debt issuance cost | | | | | | () | | | () | |
| Current maturities | | | | | | () | | | | |
| Total long-term debt | | | | | | $ | | | | $ | | |
(a)
(b).
| | | | | | | | | | | | | | | | | | | | | | | | | | |
| Other Subsidiaries |
| Financing Instrument | | Interest Rate | | Maturity Date | | 2023 | | 2022 |
| Various Eloigne affordable housing project notes | | 0.00% - 8.00% | | 2024 - 2055 | | $ | | | | $ | | |
| Current maturities | | | | | | () | | | () | |
| Total long-term debt | | | | | | $ | | | | $ | | |
Maturities of long-term debt:
| | 2025 | | | |
| 2026 | | | |
| 2027 | | | |
| 2028 | | | |
Deferred Financing Costs — Deferred financing costs of approximately $ million and $ million, net of amortization, are presented as a deduction from the carrying amount of long-term debt as of Dec. 31, 2023 and 2022, respectively.
Equity through DRIP and Benefits Program — Xcel Energy issued $ million of equity in 2023 and $ million of equity in 2022 through the DRIP and benefits programs. The program allows shareholders to reinvest their dividends directly in Xcel Energy Inc. common stock.
ATM Equity Offering — In November 2021, Xcel Energy Inc. filed a prospectus supplement under which it may sell up to $ million of its common stock through an ATM program. In 2021, million shares of common stock were issued (approximately $ million in net proceeds and $ million in transaction fees paid). In 2022, million shares of common stock were issued (approximately $ million in net proceeds and $ million in transaction fees paid). In 2023, million shares of common stock were issued ($ million in net proceeds and $ million in transaction fees paid). In October 2023, the 2021 ATM offering was closed.
billion of its common stock through an ATM program. In the fourth quarter, through this ATM Program, Xcel Energy Inc. issued million shares of common stock ($ million in net proceeds and $ million in transaction fees paid).
| | $ | | | | | | | PSCo | | | | | | | | | |
| SPS | | | | | | | | | |
Xcel Energy Inc. had the following common stock authorized/outstanding:
| | | | | | | | | | | | | | | | | | | | |
| Common Stock Authorized (Shares) | | Par Value of Common Stock | | Common Stock Outstanding (Shares) as of Dec. 31, 2023 | | Common Stock Outstanding (Shares) as of Dec. 31, 2022 |
| | | | $ | | | | | | | | |
Dividend and Other Capital-Related Restrictions — Xcel Energy depends on its utility subsidiaries to pay dividends. Xcel Energy Inc.’s utility subsidiaries’ dividends are subject to the FERC’s jurisdiction, which prohibits the payment of dividends out of capital accounts. Dividends are solely to be paid from retained earnings. Certain covenants also require Xcel Energy Inc. to be current on interest payments prior to dividend disbursements.
State regulatory commissions impose dividend limitations for NSP-Minnesota, NSP-Wisconsin and SPS, which are more restrictive than those imposed by the FERC.
% | | | % | | | % | NSP-Wisconsin (a) | | | | | N/A | | | |
SPS (b) | | | | | | | | | |
(a)
(b)
| | | | | | | | | | | | | | | | | | | | |
| (Amounts in Millions) | | Unrestricted Retained Earnings | | Total Capitalization | | Limit on Total Capitalization |
| NSP-Minnesota | | $ | | | | $ | | | | $ | | |
| NSP-Wisconsin | | | | | | | | N/A |
SPS (a) | | | | | | | | N/A |
Issuance of securities by Xcel Energy Inc. is not generally subject to regulatory approval. However, utility financings and intra-system financings are subject to the jurisdiction of state regulatory commissions and/or the FERC. Xcel Energy may seek additional authorization as necessary.
| (a) | | NSP-Wisconsin | | $ | | | | | | |
| PSCo | | | | | | | |
| SPS | | | |
| | | |
% of total capitalization.
| | $ | | | | $ | | | | $ | | | | C&I | | | | | | | | | | | | |
| Other | | | | | | | | | | | | |
| Total retail | | | | | | | | | | | | |
| Wholesale | | | | | | | | | | | | |
| Transmission | | | | | | | | | | | | |
| Other | | | | | | | | | | | | |
| Total revenue from contracts with customers | | | | | | | | | | | | |
| Alternative revenue and other | | | | | | | | | | | | |
| Total revenues | | $ | | | | $ | | | | $ | | | | $ | | |
| | | | | | | | | | | | | | | | | | | | | | | | | | |
| | Year Ended Dec. 31, 2022 |
| (Millions of Dollars) | | Electric | | Natural Gas | | All Other | | Total |
| Major revenue types | | | | | | | | |
| Revenue from contracts with customers: |
| Residential | | $ | | | | $ | | | | $ | | | | $ | | |
| C&I | | | | | | | | | | | | |
| Other | | | | | | | | | | | | |
| Total retail | | | | | | | | | | | | |
| Wholesale | | | | | | | | | | | | |
| Transmission | | | | | | | | | | | | |
| Other | | | | | | | | | | | | |
| Total revenue from contracts with customers | | | | | | | | | | | | |
| Alternative revenue and other | | | | | | | | | | | | |
| Total revenues | | $ | | | | $ | | | | $ | | | | $ | | |
| | $ | | | | $ | | | | $ | | | | C&I | | | | | | | | | | | | |
| Other | | | | | | | | | | | | |
| Total retail | | | | | | | | | | | | |
| Wholesale | | | | | | | | | | | | |
| Transmission | | | | | | | | | | | | |
| Other | | | | | | | | | | | | |
| Total revenue from contracts with customers | | | | | | | | | | | | |
| Alternative revenue and other | | | | | | | | | | | | |
| Total revenues | | $ | | | | $ | | | | $ | | | | $ | | |
% | | | % | | | % | | State income tax on pretax income, net of federal tax effect | | | | | | | | | |
| (Decreases) increases in tax from: | | | | | | |
Wind PTCs (a) | | () | | | () | | | () | |
Plant regulatory differences (b) | | () | | | () | | | () | |
| Other tax credits, net NOL & tax credit allowances | | () | | | () | | | () | |
| Other, net | | | | | () | | | | |
| Effective income tax rate | | () | % | | () | % | | () | % |
(a)
(b).
| | $ | | | | $ | | | | Current state tax expense (benefit) | | | | | | | | () | |
| Current change in unrecognized tax (benefit) expense | | () | | | | | | | |
| Deferred federal tax benefit | | () | | | () | | | () | |
| Deferred state tax expense | | | | | | | | | |
| Deferred change in unrecognized tax expense | | | | | | | | | |
| Deferred ITCs | | () | | | () | | | () | |
| Total income tax benefit | | $ | () | | | $ | () | | | $ | () | |
| | $ | () | | | $ | | | Adjustments to deferred income taxes for wind production tax credit cash transfers (a) | | () | | | | | | | |
| Amortization and adjustments to deferred income taxes on income tax regulatory assets and liabilities | | () | | | | | | () | |
| Tax benefit allocated to other comprehensive income and other | | | | | () | | | () | |
| Deferred tax benefit | | $ | () | | | $ | () | | | $ | () | |
| | $ | | | | Regulatory assets | | | | | | |
| Operating lease assets | | | | | | |
| Pension expense | | | | | | |
| Deferred fuel costs | | | | | | |
| Other | | | | | | |
| Total deferred tax liabilities | | $ | | | | $ | | |
| | | | |
| Deferred tax assets: | | | | |
| Tax credit carryforward | | $ | | | | $ | | |
| Regulatory liabilities | | | | | | |
| Operating lease liabilities | | | | | | |
| Other employee benefits | | | | | | |
| Deferred investment tax credits | | | | | | |
| NOL carryforward | | | | | | |
| NOL and tax credit valuation allowances | | () | | | () | |
| Other | | | | | | |
| Total deferred tax assets | | | | | | |
| Net deferred tax liability | | $ | | | | $ | | |
(a).
Other Income Tax Matters —
| | $ | | | | Federal tax credit carryforwards | | | | | | |
| Valuation allowances for federal credit carryforwards | | () | | | | |
| State NOL carryforwards | | | | | | |
| Valuation allowances for state NOL carryforwards | | () | | | () | |
State tax credit carryforwards, net of federal detriment (a) | | | | | | |
Valuation allowances for state credit carryforwards, net of federal benefit (b) | | () | | | () | |
(a) million and $ million as of Dec. 31, 2023 and 2022, respectively.
(b) million as of Dec. 31, 2023 and 2022.
Federal carryforward periods expire between 2037 and 2043 and state carryforward periods expire starting 2024.
Additionally, the statute of limitations related to the federal tax credit carryforwards will remain open until those credits are utilized in subsequent returns. Further, the statute of limitations related to the additional federal tax loss carryback claim filed in 2020 has been extended. As of Dec. 31, 2023 the IRS issued its Revenue Agent’s Report related to the federal tax loss carryback claim. The Company materially agrees with the report and re-recognized the related benefit in December 2023.
State Audits — Xcel Energy files consolidated state tax returns based on income in its major operating jurisdictions and various other state income-based tax returns.
As of Dec. 31, 2023, Xcel Energy’s earliest open tax years (subject to examination by state taxing authorities in its major operating jurisdictions) were as follows:
•In 2020, Minnesota began an audit of tax years 2015 - 2018. In 2022, the state of Minnesota issued its audit report and in 2023, the Company agreed to the report without any material adjustments.
•In 2021, Texas began an audit of tax years 2016 - 2019. As of Dec. 31, 2023, no material adjustments have been proposed.
•In 2021, Wisconsin began an audit of tax years 2016-2019. As of Dec. 31, 2023, no material adjustments have been proposed.
• other state income tax audits are in progress for its major operating jurisdictions as of Dec. 31, 2023.
Unrecognized tax benefit balance includes permanent tax positions, which if recognized would affect the ETR. In addition, the unrecognized tax benefit balance includes temporary tax positions for which deductibility is highly certain, but for which there is uncertainty about the timing. A change in the period of deductibility would not affect the ETR but would accelerate the payment to the taxing authority.
| | $ | | | | Unrecognized tax benefit — Temporary tax positions | | | | | | |
| Total unrecognized tax benefit | | $ | | | | $ | | |
| | $ | | | | $ | | | | Additions based on tax positions related to the current year | | | | | | | | | |
| Additions for tax positions of prior years | | | | | | | | | |
| Reductions for tax positions of prior years | | () | | | () | | | () | |
| Reductions for tax positions related to settlements with taxing authorities | | () | | | () | | | | |
| Reductions for tax positions related to statute of limitations | | () | | | () | | | | |
| Balance at Dec. 31 | | $ | | | | $ | | | | $ | | |
) | | $ | () | | As IRS audits resume and as state audits progress, it is reasonably possible that the amount of unrecognized tax benefit could decrease up to approximately $ million in the next 12 months.
Payable for interest related to unrecognized tax benefits is partially offset by the interest benefit associated with NOL and tax credit carryforwards.
) | | $ | () | | | $ | () | | | Interest benefit (expense) related to unrecognized tax benefits | | | | | () | | | | |
| Payable for interest related to unrecognized tax benefits at Dec. 31 | | $ | () | | | $ | () | | | $ | () | |
penalties were accrued related to unrecognized tax benefits as of Dec. 31, 2023, 2022 or 2021.
| | |
8. Share-Based Compensation |
Equity Awards — Xcel Energy‘s Board of Directors has granted equity awards under the 2015 Omnibus Incentive Plan, which includes various vesting conditions and performance goals. At the end of the restricted period, such grants will be awarded if vesting conditions and/or performance goals are met.
Certain employees are granted equity awards with a portion subject only to service conditions, and the other portion subject to performance conditions. The total time-based equity shares granted subject only to service conditions was million in 2023 and million in 2022 and 2021 respectively.
The performance conditions for a portion of the awards granted from 2021 to 2023 are based on relative TSR and environmental goals. Equity awards with performance conditions will be settled after , with payouts ranging from to % depending on achievement.
| | | | | | | | Weighted average grant date fair value | | $ | | | | $ | | | | $ | | |
| | | | | | | | Total Fair Value | | $ | | | | $ | | | | $ | | |
Changes in the nonvested portion of equity award units:
| | | | | | | | | | | | | | |
| (Units in Thousands) | | Units | | Weighted Average
Grant Date Fair Value |
| Nonvested Units at Jan. 1, 2023 | | | | | $ | | |
| Granted | | | | | | |
| Forfeited | | () | | | | |
| Vested | | () | | | | |
| Dividend equivalents | | | | | | |
| Nonvested Units at Dec. 31, 2023 | | | | | | |
Stock Equivalent Units — Non-employee members of Xcel Energy‘s Board of Directors may elect to receive their annual equity grant as stock equivalent units in lieu of common stock. Each unit’s value is equal to share of common stock. The annual equity grant is vested as of the date of each member’s election to the Board of Directors; there is no further service or other condition. Directors may also elect to receive their fees as stock equivalent units in lieu of cash. Stock equivalent units are payable as a distribution of common stock upon a director’s termination of service.
| | | | | | | | Weighted average grant date fair value | | $ | | | | $ | | | | $ | | |
Changes in stock equivalent units:
| | | | | | | | | | | | | | |
| (Units in Thousands) | | Units | | Weighted Average
Grant Date Fair Value |
| Stock equivalent units at Jan. 1, 2023 | | | | | $ | | |
| Granted | | | | | | |
| Units distributed | | () | | | | |
| Dividend equivalents | | | | | | |
| Stock equivalent units at Dec. 31, 2023 | | | | | | |
Liability Awards — Xcel Energy’s Board of Directors has granted TSR liability awards under the 2015 Omnibus Incentive Plan. This plan allows Xcel Energy to attach various performance goals to the awards granted. The liability awards have been historically dependent on relative TSR measured over a three-year period. Xcel Energy Inc.’s TSR is compared to a peer group of other utility companies. Potential payouts of the awards range from to %.
| | | | | | | Liability awards settled:
| | | | | | | | | | | | | | | | | | | | |
| (Units In Thousands, Settlement Amount in Millions) | | 2023 | | 2022 | | 2021 |
| Awards settled | | | | | | | | | |
| Settlement amount (cash, common stock and deferred amounts) | | $ | | | | $ | | | | $ | | |
TSR liability awards of $ million were settled in cash in 2023.
| | $ | | | | $ | | | | Tax benefit recognized in income | | | | | | | | | |
(a) million in 2023.
There was approximately $ million and $ million as of Dec. 31, 2023 and 2022, respectively, of total unrecognized compensation cost related to nonvested share-based compensation awards. Xcel Energy expects to recognize the unrecognized amount over a weighted average period of years.
(a)Diluted common shares outstanding included common stock equivalents of million shares for 2023, 2022 and 2021.
| | |
10. Fair Value of Financial Assets and Liabilities |
billion and $ billion as of Dec. 31, 2023 and 2022, respectively, and unrealized losses were $ million and $ million as of Dec. 31, 2023 and 2022, respectively.
| | $ | | | | $ | | | | $ | | | | $ | | | | $ | | | | Commingled funds | | | | | | | | | | | | | | | | | | |
| Debt securities | | | | | | | | | | | | | | | | | | |
| Equity securities | | | | | | | | | | | | | | | | | | |
| Total | | $ | | | | $ | | | | $ | | | | $ | | | | $ | | | | $ | | |
(a) million of equity method investments and $ million of rabbi trust assets and other miscellaneous investments.
| | $ | | | | $ | | | | $ | | | | $ | | | | $ | | | | Commingled funds | | | | | | | | | | | | | | | | | | |
| Debt securities | | | | | | | | | | | | | | | | | | |
| Equity securities | | | | | | | | | | | | | | | | | | |
| Total | | $ | | | | $ | | | | $ | | | | $ | | | | $ | | | | $ | | |
(a) million of equity investments in unconsolidated subsidiaries and $ million of rabbi trust assets and other miscellaneous investments.
For the years ended Dec. 31, 2023 and 2022, there were immaterial Level 3 nuclear decommissioning fund investments or transfer of amounts between levels.
| | $ | | | | $ | | | | $ | | | | $ | | | Rabbi Trusts
Xcel Energy has established rabbi trusts to provide partial funding for future deferred compensation plan distributions. The fair value of assets held in the rabbi trusts were $ million and $ million at Dec. 31, 2023 and 2022, respectively, comprised of cash equivalents and mutual funds (level 1 valuation methods). Amounts are reported in nuclear decommissioning fund and other investments on the consolidated balance sheet.
million of net losses expected to be reclassified into earnings during the next 12 months as the hedged transactions impact earnings. As of Dec. 31, 2023, Xcel Energy had unsettled interest swaps outstanding with a notional amount of $ million. These interest rate derivatives were designated as cash flow hedges, with changes in fair value recorded to other comprehensive income.See Note 13 for the financial impact of qualifying interest rate cash flow hedges on Xcel Energy’s accumulated other comprehensive loss included in the consolidated statements of common stockholder’s equity and in the consolidated statements of comprehensive income.
commodity contracts designated as cash flow hedges. | | | | | MMBtu of natural gas | | | | | | |
(a)
(b)
Consideration of Credit Risk and Concentrations — Xcel Energy continuously monitors the creditworthiness of counterparties to its interest rate derivatives and commodity derivative contracts prior to settlement and assesses each counterparty’s ability to perform on the transactions set forth in the contracts. Impact of credit risk was immaterial to the fair value of unsettled commodity derivatives presented on the consolidated balance sheets.
Xcel Energy’s utility subsidiaries’ most significant concentrations of credit risk with particular entities or industries are contracts with counterparties to their wholesale, trading and non-trading commodity activities.
of Xcel Energy’s most significant counterparties for these activities, comprising $ million or % of this credit exposure, had investment grade credit ratings from S&P Global Ratings, Moody’s Investor Services or Fitch Ratings. of the most significant counterparties, comprising $ million or % of this credit exposure, were not rated by these external ratings agencies, but based on Xcel Energy’s internal analysis, had credit quality consistent with investment grade.
of these significant counterparties, comprising $ million or % of this credit exposure, had credit quality less than investment grade, based on internal analysis.
of these significant counterparties are municipal or cooperative electric entities, RTOs or other utilities.
Credit Related Contingent Features — Contract provisions for derivative instruments that the utility subsidiaries enter, including those accounted for as normal purchase and normal sale contracts and therefore not reflected on the consolidated balance sheets, may require the posting of collateral or settlement of the contracts for various reasons, including if the applicable utility subsidiary’s credit ratings are downgraded below its investment grade credit rating by any of the major credit rating agencies.
As of Dec. 31, 2023 and 2022, there were $ million and $ million, respectively, of derivative liabilities with such underlying contract provisions, respectively.
Also, certain contracts may contain cross default provisions that may require the posting of collateral or settlement of the contracts if there was a failure under other financing arrangements related to payment terms or other covenants.
As of Dec. 31, 2023 and 2022, there were approximately $ million and $ million of derivative liabilities with such underlying contract provisions, respectively.
Certain derivative instruments are also subject to contract provisions that contain adequate assurance clauses. These provisions allow counterparties to seek performance assurance, including cash collateral, in the event that a given utility subsidiary’s ability to fulfill its contractual obligations is reasonably expected to be impaired.
Xcel Energy had collateral posted related to adequate assurance clauses in derivative contracts as of Dec. 31, 2023 and 2022.
Recurring Derivative Fair Value Measurements
)
| | $ | | | | Total | | $ | () | | | $ | | |
| Other derivative instruments | | | | |
| Electric commodity | | $ | | | | $ | () | |
| Natural gas commodity | | | | | () | |
| Total | | $ | | | | $ | () | |
| | | | |
| Year Ended Dec. 31, 2022 | | | | |
| Interest rate | | $ | | | | $ | | |
| Total | | $ | | | | $ | | |
| Other derivative instruments | | | | |
| Electric commodity | | $ | | | | $ | () | |
| Natural gas commodity | | | | | () | |
| Total | | $ | | | | $ | () | |
| | | | |
| Year Ended Dec. 31, 2021 | | | | |
| Interest rate | | $ | | | | $ | | |
| Total | | $ | | | | $ | | |
| Other derivative instruments | | | | |
| Electric commodity | | $ | | | | $ | | |
| Natural gas commodity | | | | | () | |
| Total | | $ | | | | $ | | |
| (a) | $ | | | | $ | | | | | Total | | $ | | | | $ | | | | $ | | | |
| Other derivative instruments | | | |
| Commodity trading | | $ | | | | $ | | | | $ | () | | (b) |
| Electric commodity | | | | | | | (c) | | | |
| Natural gas commodity | | | | | | | (d) | () | | (d)(e) |
| Total | | $ | | | | $ | | | | $ | () | | |
| | | | | | | |
| Year Ended Dec. 31, 2022 | | | | | | | |
| Derivatives designated as cash flow hedges | | | |
| Interest rate | | $ | | | (a) | $ | | | | $ | | | |
| Total | | $ | | | | $ | | | | $ | | | |
| Other derivative instruments | | | |
| Commodity trading | | $ | | | | $ | | | | $ | | | (b) |
| Electric commodity | | | | | | | (c) | | | |
| Natural gas commodity | | | | | | | (d) | () | | (d)(e) |
| Total | | $ | | | | $ | | | | $ | () | | |
| | | | | | | |
| Year Ended Dec. 31, 2021 | | | | | | | |
| Derivatives designated as cash flow hedges | | | |
| Interest rate | | $ | | | (a) | $ | | | | $ | | | |
| Total | | $ | | | | $ | | | | $ | | | |
| Other derivative instruments | | | |
| Commodity trading | | $ | | | | $ | | | | $ | | | (b) |
| Electric commodity | | | | | () | | (c) | | | |
| Natural gas commodity | | | | | | | (d) | () | | (d)(e) |
| Total | | $ | | | | $ | () | | | $ | | | |
(a)
(b)
(c)
(d)
Xcel Energy had derivative instruments designated as fair value hedges during the years ended Dec. 31, 2023, 2022 and 2021.
| | $ | | | | $ | | | | $ | | | | $ | () | | | $ | | | | $ | | | | $ | | | | $ | | | | $ | | | | $ | () | | | $ | | | | Electric commodity | | | | | | | | | | | | | | () | | | | | | | | | | | | | | | | | | () | | | | |
| Natural gas commodity | | | | | | | | | | | | | | | | | | | | | | | | | | | | | | | | | | | | |
| Total current derivative assets | | $ | | | | $ | | | | $ | | | | $ | | | | $ | () | | | | | | $ | | | | $ | | | | $ | | | | $ | | | | $ | () | | | | |
PPAs (b) | | | | | | | | | | | | | | | | | | | | | | | | | | |
| Current derivative instruments | | | | | | | | | | | | $ | | | | | | | | | | | | | | $ | | |
| Noncurrent derivative assets | | | | | | | | | | | | | | | | | | | | | | | | |
| Other derivative instruments: | | | | | | | | | | | | | | | | | | | | | | | | |
| Commodity trading | | $ | | | | $ | | | | $ | | | | $ | | | | $ | () | | | $ | | | | $ | | | | $ | | | | $ | | | | $ | | | | $ | () | | | $ | | |
| Total noncurrent derivative assets | | $ | | | | $ | | | | $ | | | | $ | | | | $ | () | | | | | | $ | | | | $ | | | | $ | | | | $ | | | | $ | () | | | | |
PPAs (b) | | | | | | | | | | | | | | | | | | | | | | | | | | |
| Noncurrent derivative instruments | | | | | | | | | | | | $ | | | | | | | | | | | | | | $ | | |
| | | | | | | | | | | | | | | | | | | | | | | | | | | | | | | | | | | | | | | | | | | | | | | | | | | | | | | | | | | | | | | | | | | | | | | | | | |
| | Dec. 31, 2023 | | Dec. 31, 2022 |
| | Fair Value | | Fair Value Total | | Netting (a) | | Total | | Fair Value | | Fair Value Total | | Netting (a) | | Total |
| (Millions of Dollars) | | Level 1 | | Level 2 | | Level 3 | | | | | Level 1 | | Level 2 | | Level 3 | | | |
| Current derivative liabilities | | | | | | | | | | | | | | | | | | | | | | | | |
| Derivatives designated as cash flow hedges: | | | | | | | | | | | | | | | | | | | | | | | | |
| Interest rate | | $ | | | | $ | | | | $ | | | | $ | | | | $ | | | | $ | | | | $ | | | | $ | | | | $ | | | | $ | | | | $ | | | | $ | | |
| Other derivative instruments: | | | | | | | | | | | | | | | | | | | | | | | | |
| Commodity trading | | | | | | | | | | | | | | () | | | | | | | | | | | | | | | | | | () | | | | |
| Electric commodity | | | | | | | | | | | | | | () | | | | | | | | | | | | | | | | | | () | | | | |
| Natural gas commodity | | | | | | | | | | | | | | | | | | | | | | | | | | | | | | | | | | | | |
| Total current derivative liabilities | | $ | | | | $ | | | | $ | | | | $ | | | | $ | () | | | | | | $ | | | | $ | | | | $ | | | | $ | | | | $ | () | | | | |
PPAs (b) | | | | | | | | | | | | | | | | | | | | | | | | | | |
| Current derivative instruments | | | | | | | | | | | | $ | | | | | | | | | | | | | | $ | | |
| Noncurrent derivative liabilities | | | | | | | | | | | | | | | | | | | | | | | | |
| Other derivative instruments: | | | | | | | | | | | | | | | | | | | | | | | | |
| Commodity trading | | $ | | | | $ | | | | $ | | | | $ | | | | $ | () | | | $ | | | | $ | | | | $ | | | | $ | | | | $ | | | | $ | () | | | $ | | |
| Total noncurrent derivative liabilities | | $ | | | | $ | | | | $ | | | | $ | | | | $ | () | | | | | | $ | | | | $ | | | | $ | | | | $ | | | | $ | () | | | | |
PPAs (b) | | | | | | | | | | | | | | | | | | | | | | | | | | |
| Noncurrent derivative instruments | | | | | | | | | | | | $ | | | | | | | | | | | | | | $ | | |
(a) obligations to return cash collateral. At Dec. 31, 2023 and 2022, derivative assets and liabilities include rights to reclaim cash collateral of $ million and $ million, respectively. Counterparty netting amounts presented exclude settlement receivables and payables and non-derivative amounts that may be subject to the same master netting agreements.
(b)
| | $ | | | | $ | () | | Purchases (a) | | | | | | | | | |
Settlements (a) | | () | | | () | | | () | |
| Net transactions recorded during the period: | | | | | | |
Gains recognized in earnings (b) | | | | | | | | | |
Net (losses) gains recognized as regulatory assets and liabilities (a) | | () | | | | | | | |
| Balance at Dec. 31 | | $ | | | | $ | | | | $ | | |
(a)
(b)
| | $ | | | | $ | | | | $ | | | Fair value of Xcel Energy’s long-term debt is estimated based on recent trades and observable spreads from benchmark interest rates for similar securities. Fair value estimates are based on information available to management as of Dec. 31, 2023 and 2022, and given the observability of the inputs, fair values presented for long-term debt were assigned as Level 2.
, and % in 2023, 2022, and 2021, respectively. Some employees may participate under legacy formulas such as the traditional final average pay or pension equity. Xcel Energy’s policy is to fully fund into an external trust the actuarially determined pension costs subject to the limitations of applicable employee benefit and tax laws.
In addition to the qualified pension plans, Xcel Energy maintains a SERP and a nonqualified pension plan. The SERP is maintained for certain executives who participated in the plan in 2008, when the SERP was closed to new participants.
million and $ million, respectively. Xcel Energy recognized net benefit cost for the SERP and nonqualified plans of $ million in 2023 and $ million in 2022. Xcel Energy’s postretirement health care benefit plan is a continuation of certain welfare benefit programs for current employees. A full time employee’s date of hire or a retiree’s date of retirement determine eligibility for each of the programs.
Xcel Energy’s investment-return assumption considers the expected long-term performance for each of the asset classes in its pension and postretirement health care portfolio. Xcel Energy considers the historical returns achieved by its asset portfolios over long time periods, as well as the long-term projected return levels from investment experts.
Pension cost determination assumes a forecasted mix of investment types over the long-term.
•Investment returns in 2023 were above the assumed level of %.
•Investment returns in 2022 were below the assumed level of %.
•Investment returns in 2021 were above the assumed level of %.
•In 2024, expected investment-return assumption is %.
Pension plan and postretirement benefit assets are invested in a portfolio according to Xcel Energy’s return, liquidity and diversification objectives to provide a source of funding for plan obligations and minimize contributions to the plan, within appropriate levels of risk.
The principal mechanism for achieving these objectives is the asset allocation given the long-term risk, return, correlation and liquidity characteristics of each particular asset class.
There were no significant concentrations of risk in any industry, index, or entity. Market volatility can impact even well-diversified portfolios and significantly affect the return levels achieved by the assets in any year.
State agencies also have issued guidelines to the funding of postretirement benefit costs. SPS is required to fund postretirement benefit plans for Texas and New Mexico equal to amounts collected in rates. These assets are invested in a manner consistent with the investment strategy for the pension plan.
Xcel Energy’s ongoing investment strategy is based on plan-specific investment recommendations that seek to minimize potential investment and interest rate risk as a plan’s funded status increases over time.
The investment recommendations consider many factors and generally result in a greater percentage of long-duration fixed income securities being allocated to specific plans having relatively higher funded status ratios and a greater percentage of growth assets being allocated to plans having relatively lower funded status ratios.
| | $ | | | | $ | | | | $ | | | | $ | | | | $ | | | | $ | | | | $ | | | | $ | | | | $ | | | | Commingled funds | | | | | | | | | | | | | | | | | | | | | | | | | | | | | | |
| Debt securities | | | | | | | | | | | | | | | | | | | | | | | | | | | | | | |
| Equity securities | | | | | | | | | | | | | | | | | | | | | | | | | | | | | | |
| Other | | | | | | | | | | | | | | | | | | | | | | | | | | | | | | |
| Total | | $ | | | | $ | | | | $ | | | | $ | | | | $ | | | | $ | | | | $ | | | | $ | | | | $ | | | | $ | | |
(a)
For each of the fair value hierarchy levels, Xcel Energy’s postretirement benefit plan assets that were measured at fair value:
| | | | | | | | | | | | | | | | | | | | | | | | | | | | | | | | | | | | | | | | | | | | | | | | | | | | | | | | | | | | | | |
| | Dec. 31, 2023 (a) | | Dec. 31, 2022 (a) |
| (Millions of Dollars) | | Level 1 | | Level 2 | | Level 3 | | Measured at NAV | | Total | | Level 1 | | Level 2 | | Level 3 | | Measured at NAV | | Total |
| Cash equivalents | | $ | | | | $ | | | | $ | | | | $ | | | | $ | | | | $ | | | | $ | | | | $ | | | | $ | | | | $ | | |
| Insurance contracts | | | | | | | | | | | | | | | | | | | | | | | | | | | | | | |
| Commingled funds | | | | | | | | | | | | | | | | | | | | | | | | | | | | | | |
| Debt securities | | | | | | | | | | | | | | | | | | | | | | | | | | | | | | |
| Other | | | | | | | | | | | | | | | | | | | | () | | | | | | | | | () | |
| Total | | $ | | | | $ | | | | $ | | | | $ | | | | $ | | | | $ | | | | $ | | | | $ | | | | $ | | | | $ | | |
(a)
assets were transferred in or out of Level 3 for 2023 and 2022.
Funded Status — Comparisons of the actuarially computed benefit obligation, changes in plan assets and funded status of the pension and postretirement health care plans for Xcel Energy are as follows:
| | $ | | | | $ | | | | $ | | | | Service cost | | | | | | | | | | | | |
| Interest cost | | | | | | | | | | | | |
| Plan amendments | | () | | | | | | | | | | |
| Actuarial (gain) loss | | | | | () | | | | | | () | |
| Plan participants’ contributions | | | | | | | | | | | | |
| Medicare subsidy reimbursements | | | | | | | | | | | | |
Benefit payments (a) | | () | | | () | | | () | | | () | |
| Obligation at Dec. 31 | | $ | | | | $ | | | | $ | | | | $ | | |
| Change in Fair Value of Plan Assets: | | | | | | | | |
| Fair value of plan assets at Jan. 1 | | $ | | | | $ | | | | $ | | | | $ | | |
| Actual return on plan assets | | | | | () | | | | | | () | |
| Employer contributions | | | | | | | | | | | | |
| Plan participants’ contributions | | | | | | | | | | | | |
| Benefit payments | | () | | | () | | | () | | | () | |
| Fair value of plan assets at Dec. 31 | | | | | | | | | | | | |
| Funded status of plans at Dec. 31 | | $ | () | | | $ | () | | | $ | () | | | $ | () | |
| Amounts recognized in the Consolidated Balance Sheet at Dec. 31: | | | | | | | | |
| Noncurrent assets | | $ | | | | $ | | | | $ | | | | $ | | |
| Current liabilities | | | | | | | | () | | | () | |
| Noncurrent liabilities | | () | | | () | | | () | | | () | |
| Net amounts recognized | | $ | () | | | $ | () | | | $ | () | | | $ | () | |
(a) million of in 2022.
% | | | % | | | % | | | % | | Expected average long-term increase in compensation level | | | % | | | % | | N/A | | N/A |
| Mortality table | | PRI-2012 | | PRI-2012 | | PRI-2012 | | PRI-2012 |
| Health care costs trend rate — initial: Pre-65 | | N/A | | N/A | | | % | | | % |
| Health care costs trend rate — initial: Post-65 | | N/A | | N/A | | | % | | | % |
| Ultimate trend assumption — initial: Pre-65 | | N/A | | N/A | | | % | | | % |
| Ultimate trend assumption — initial: Post-65 | | N/A | | N/A | | | % | | | % |
| Years until ultimate trend is reached | | N/A | | N/A | | | | |
Accumulated benefit obligation for the pension plan was $ million and $ million as of Dec. 31, 2023 and 2022, respectively.
Net Periodic Benefit Cost (Credit) — Net periodic benefit cost (credit), other than the service cost component, is included in other income (expense) in the consolidated statements of income.
| | $ | | | | $ | | | | $ | | | | $ | | | | $ | | | | Interest cost | | | | | | | | | | | | | | | | | | |
| Expected return on plan assets | | () | | | () | | | () | | | () | | | () | | | () | |
| Amortization of prior service credit | | () | | | () | | | () | | | () | | | () | | | () | |
| Amortization of net loss | | | | | | | | | | | | | | | | | | |
Settlement charge (a) | | | | | | | | | | | | | | | | | | |
| Net periodic pension cost (credit) | | | | | | | | | | | | | | () | | | () | |
| Effects of regulation | | | | | () | | | () | | | | | | | | | | |
| Net benefit cost (credit) recognized for financial reporting | | $ | | | | $ | | | | $ | | | | $ | | | | $ | () | | | $ | () | |
| Significant Assumptions Used to Measure Costs: | | | | | | | | | | | | |
| Discount rate | | | % | | | % | | | % | | | % | | | % | | | % |
| Expected average long-term increase in compensation level | | | | | | | | | | | | | | | | | | |
| Expected average long-term rate of return on assets | | | | | | | | | | | | | | | | | | |
(a) settlement charges recorded for the qualified pension plans in 2023. In 2022 and 2021, as a result of lump-sum distributions during each plan year, Xcel Energy recorded a total pension settlement charge of $ million and $ million, respectively, the majority of which was not recognized due to the effects of regulation. A total of $ million and $ million was recorded in the consolidated statements of income in 2022 and 2021, respectively.
| | $ | | | | $ | | | | $ | | | | Prior service credit | | () | | | () | | | | | | () | |
| Total | | $ | | | | $ | | | | $ | | | | $ | | |
| Amounts Not Yet Recognized as Components of Net Periodic Benefit Cost Have Been Recorded as Follows Based Upon Expected Recovery in Rates: | | | | | | | | |
| Current regulatory assets | | $ | | | | $ | | | | $ | | | | $ | | |
| Noncurrent regulatory assets | | | | | | | | | | | | |
| Current regulatory liabilities | | | | | | | | () | | | () | |
| Noncurrent regulatory liabilities | | | | | | | | () | | | () | |
| Deferred income taxes | | | | | | | | | | | | |
| Net-of-tax accumulated other comprehensive income | | | | | | | | | | | | |
| Total | | $ | | | | $ | | | | $ | | | | $ | | |
| | | | | | | | | | | | | | | | | | | | | | | | | | |
| Measurement date | | Dec. 31, 2023 | | Dec. 31, 2022 | | Dec. 31, 2023 | | Dec. 31, 2022 |
million in January 2024.
•$ million in 2023.
•$ million in 2022.
•$ million in 2021.
The postretirement health care plans have no funding requirements other than fulfilling benefit payment obligations when claims are presented and approved. Additional cash funding requirements are prescribed by certain state and federal rate regulatory authorities.
Voluntary postretirement funding contributions:
•$ million expected during 2024.
•$ million during 2023.
•$ million during 2022.
•$ million during 2021.
% | | | % | | | % | | | % | | Domestic and international equity securities | | | | | | | | | | | | |
| Alternative investments | | | | | | | | | | | | |
| Short-to-intermediate fixed income securities | | | | | | | | | | | | |
| Cash | | | | | | | | | | | | |
| Total | | | % | | | % | | | % | | | % |
The asset allocations above reflect target allocations approved in the calendar year to take effect in the subsequent year.
Plan Amendments — In 2023, Xcel Energy amended the Xcel Energy Pension Plan and Xcel Energy Inc. Nonbargaining Pension Plan (South) to reduce supplemental social security benefits for all active participants on and after Jan. 1, 2024.
There were significant plan amendments made in 2022 which affected the postretirement benefit obligation.
In 2021, Xcel Energy amended the Xcel Energy Pension Plan and Xcel Energy Inc. Nonbargaining Pension Plan (South) to reduce supplemental benefits for non-bargaining participants as well as to allow the transfer of a portion of non-qualified pension obligations into the qualified plans.
Projected Benefit Payments
Xcel Energy’s projected benefit payments:
| | $ | | | | $ | | | | $ | | | | 2025 | | | | | | | | | | | | |
| 2026 | | | | | | | | | | | | |
| 2027 | | | | | | | | | | | | |
| 2028 | | | | | | | | | | | | |
| 2029 - 2033 | | | | | | | | | | | | |
million for health plan subsidies and $ million for other medical benefits, each commencing in 2024, were recognized in the fourth quarter of 2023. These unfunded obligations are presented in other current liabilities and noncurrent pension and employee benefit obligations in the consolidated balance sheet as of Dec. 31, 2023.
| | | | | | | | |
| Significant Assumptions to Measure Benefit Obligations: | | 2023 |
| Discount rate for year-end valuation | | | % |
| Mortality table | | PRI-2012 |
| Health care costs trend rate and ultimate trend assumption | | | % |
Defined Contribution Plans
Xcel Energy maintains 401(k) and other defined contribution plans that cover most employees. Total expense to these plans was approximately
$49 million in 2023, $ million in 2022 and $ million in 2021.
Multiemployer Plans
NSP-Minnesota and NSP-Wisconsin each contribute to several union multiemployer pension and other postretirement benefit plans, none of which are individually significant. These plans provide pension and postretirement health care benefits to certain union employees who may perform services for multiple employers and do not participate in the NSP-Minnesota and NSP-Wisconsin sponsored pension and postretirement health care plans.
Contributing to these types of plans creates risk that differs from providing benefits under NSP-Minnesota and NSP-Wisconsin sponsored plans, in that if another participating employer ceases to contribute to a multiemployer pension plan, additional unfunded obligations may need to be funded over time by remaining participating employers.
| | |
12. Commitments and Contingencies |
case remains active which includes a multi-district litigation matter consisting of a Wisconsin purported class (Arandell Corp.). The Court issued a ruling in June 2022 granting plaintiffs’ class certification. In April 2023, the Seventh Circuit Court of Appeals heard the defendants’ appeal challenging whether the district court properly assessed class certification. A decision relating to class certification is expected imminently. Xcel Energy considers the reasonably possible loss associated with this litigation to be immaterial.Comanche Unit 3 Litigation — In 2021, CORE filed a lawsuit in Denver County District Court, alleging PSCo breached ownership agreement terms by failing to operate Comanche Unit 3 in accordance with prudent utility practices. In April 2022, CORE filed a supplement to include damages related to a 2022 outage. Also in 2022, CORE sent notice of withdrawal from the ownership agreement based on the same alleged breaches.
In February 2023, the court granted PSCo’s motion precluding CORE from seeking damages related to its withdrawal as part of the lawsuit. In October 2023, the jury ruled that CORE may not withdraw as a joint owner of the facility but awarded CORE lost power damages of $ million. PSCo recognized a $ million loss for the verdict in the third quarter of 2023, including estimated interest and other costs. PSCo intends to file an appeal of this decision.
Marshall Wildfire Litigation — In December 2021, a wildfire ignited in Boulder County, Colorado (the “Marshall Fire”), which burned over 6,000 acres and destroyed or damaged over 1,000 structures. On June 8, 2023, the Boulder County Sheriff’s Office released its Marshall Fire Investigative Summary and Review and its supporting documents (the “Sheriff’s Report”). According to an October 2022 statement from the Colorado Insurance Commissioner, the Marshall Fire is estimated to have caused more than $ billion in property losses.
According to the Sheriff’s Report, on Dec. 30, 2021, a fire ignited on a residential property in Boulder, Colorado, located in PSCo’s service territory, for reasons unrelated to PSCo’s power lines. According to the Sheriff’s Report, approximately one hour and 20 minutes after the first ignition, a second fire ignited just south of the Marshall Mesa Trailhead in unincorporated Boulder County, Colorado, also located in PSCo’s service territory. According to the Sheriff’s Report, the second ignition started approximately 80 to 110 feet away from PSCo’s power lines in the area.
The Sheriff’s Report states that the most probable cause of the second ignition was hot particles discharged from PSCo’s power lines after one of the power lines detached from its insulator in strong winds, and further states that it cannot be ruled out that the second ignition was caused by an underground coal fire. According to the Sheriff’s Report, no design, installation or maintenance defects or deficiencies were identified on PSCo’s electrical circuit in the area of the second ignition. PSCo disputes that its power lines caused the second ignition.
PSCo is aware of complaints, most of which have also named Xcel Energy Inc. and Xcel Energy Services, Inc. as additional defendants, relating to the Marshall Fire. The complaints are on behalf of at least plaintiffs, and one complaint is filed on behalf of a putative class of first responders who allegedly were exposed to the threat of serious bodily injury, or smoke, soot and ash from the Marshall Fire. The complaints generally allege that PSCo’s equipment ignited the Marshall Fire and assert various causes of action under Colorado law, including negligence, premises liability, trespass, nuisance, wrongful death, willful and wanton conduct, negligent infliction of emotional distress, loss of consortium and inverse condemnation. In addition to seeking compensatory damages, certain of the complaints also seek exemplary damages.
In September 2023, the Boulder County District Court Judge consolidated eight lawsuits that were pending at that time into a single action for pretrial purposes and has subsequently consolidated additional lawsuits that have been filed. At the case management conference in February 2024, a trial date was set for September 2025.
Colorado courts do not apply strict liability in determining an electric utility company’s liability for fire-related damages. For inverse condemnation claims, Colorado courts assess whether a defendant acted with intent to take a plaintiff’s property or intentionally took an action which has the natural consequence of taking the property. For negligence claims, Colorado courts look to whether electric power companies have operated their system with a heightened duty of care consistent with the practical conduct of its business, and liability does not extend to occurrences that cannot be reasonably anticipated.
Colorado law does not impose joint and several liability in tort actions. Instead, under Colorado law, a defendant is liable for the degree or percentage of the negligence or fault attributable to that defendant, except where the defendant conspired with another defendant. A jury’s verdict in a Colorado civil case must be unanimous. Under Colorado law, in a civil action other than a medical malpractice action, the total award for noneconomic loss is capped at $ million per defendant for claims that accrued at the time of the Marshall Fire unless the court finds justification to exceed that amount by clear and convincing evidence, in which case the maximum doubles.
Colorado law caps punitive or exemplary damages to an amount equal to the amount of the actual damages awarded to the injured party, except the court may increase any award of punitive damages to a sum up to three times the amount of actual damages if the conduct that is the subject of the claim has continued during the pendency of the case or the defendant has acted in a willful and wanton manner during the action which further aggravated plaintiff’s damages.
In the event Xcel Energy Inc. or PSCo was found liable related to this litigation and were required to pay damages, such amounts could exceed our insurance coverage of approximately $ million and have a material adverse effect on our financial condition, results of operations or cash flows. However, due to uncertainty as to the cause of the fire and the extent and magnitude of potential damages, Xcel Energy Inc. and PSCo are unable to estimate the amount or range of possible losses in connection with the Marshall Fire.
million of replacement power costs previously recovered through the FCA. NSP-Minnesota responded that it acted prudently in connection with the Sherco Unit 3 outage, the MPUC has previously disallowed $ million of related costs and no additional refund or disallowance is appropriate.
In July 2022, the MPUC referred the matter to the Office of Administrative Hearings to conduct a contested case on the prudence of the replacement power costs incurred by NSP-Minnesota. In 2023, NSP-Minnesota and various parties filed recommendations, including the DOC which recommended a $ million customer refund. The Xcel Large Industrial customer group recommended a refund of $ million. A final decision by the MPUC is expected in mid-2024. A loss related to this matter is deemed remote.
MISO ROE Complaints — In November 2013 and February 2015, customer groups filed two ROE complaints against MISO TOs, which includes NSP-Minnesota and NSP-Wisconsin. The first complaint requested a reduction in base ROE transmission formula rates from % to % for the time period of Nov. 12, 2013 to Feb. 11, 2015, and removal of ROE adders (including those for RTO membership). The second complaint requested, for a subsequent time period, a base ROE reduction from % to %.
The FERC subsequently issued various related orders related to ROE methodology/calculations and timing. NSP-Minnesota has processed refunds to customers for applicable complaint periods based on the ROE in the most recent applicable opinions.
The MISO TOs and various other parties have filed petitions for review of the FERC’s most recent applicable opinions at the D.C. Circuit. In August 2022, the D.C. Circuit ruled that FERC had not adequately supported its conclusions, vacated FERC’s related orders and remanded the issue back to FERC for further proceedings, which remain pending. Additional exposure, if any related to this matter is expected to be immaterial.
Xcel Energy has recognized approximately $ million of costs/liabilities from final resolution of these issues; however, the outcome and timing are unknown. In addition, there may be insurance recovery and/or recovery from other potentially responsible parties, offsetting a portion of costs incurred.
Environmental Requirements — Water and Waste
Coal Ash Regulation — Xcel Energy’s operations are subject to federal and state regulations that impose requirements for handling, storage, treatment and disposal of solid waste, including the CCR Rule. As a specific requirement of the CCR Rule, utilities must complete groundwater sampling around their applicable landfills and surface impoundments as well as perform corrective actions where offsite groundwater has been impacted.
If certain impacts to groundwater are detected, utilities are required to perform additional groundwater investigations and/or perform corrective actions beginning with an Assessment of Corrective Measures.
Investigation and/or corrective action related to groundwater impacts are currently underway at Xcel Energy sites under the federal CCR program at a current estimated cost of at least $ million. A liability has been recorded and is expected to be fully recoverable through regulatory mechanisms.
For required coal ash disposal, PSCo has executed an agreement with a third party that will excavate and process ash for beneficial use (at sites) at a cost of approximately $ million. An estimated liability has been recorded and amounts are expected to be fully recoverable through regulatory mechanisms.
Federal Clean Water Act Section 316(b) — The Federal Clean Water Act requires the EPA to regulate cooling water intake structures to assure they reflect the best technology available for minimizing impingement and entrainment of aquatic species.
Estimated capital expenditures of approximately $ million may be required to comply with the requirements. Xcel Energy anticipates these costs will be recoverable through regulatory mechanisms.
billion and $ billion for 2023 and 2022, respectively.
| | $ | | | | $ | | | | $ | | | | $ | () | | | $ | | | | Wind | | | | | | | | | | | | | | () | | | | |
| Steam, hydro and other production | | | | | | | | () | | | | | | () | | | | |
| Distribution | | | | | | | | | | | | | | | | | | |
| Natural gas | | | | | | | | | | | | |
| Transmission and distribution | | | | | | | | | | | | | () | | | | |
| | | | | | | | | | |
| Other | | | | | | | | | | | | |
| Miscellaneous | | | | | | | | | | | | | | | | | | |
| | | | | | | | | | |
| | | | | | | | | | |
| Total liability | | $ | | | | $ | | | | $ | () | | | $ | | | | $ | () | | | $ | | |
(a)
(b)
| | | | | | | | | | | | | | | | | | | | | | | | | | | | | | | | | | |
(Millions
of Dollars) | | Jan. 1, 2022 | | Amounts Incurred (a) | | | | Accretion | | Cash Flow Revisions (b) | | Dec. 31, 2022 |
| Electric | | | | | | | | | | | | |
| Nuclear | | $ | | | | $ | | | | | | $ | | | | $ | | | | $ | | |
| Wind | | | | | | | | | | | | | () | | | | |
| Steam, hydro and other production | | | | | | | | | | | | | | | | | |
| Distribution | | | | | | | | | | | | | | | | | |
| Natural gas | | | | | | | | | | | | |
Transmission and distribution (c) | | | | | | | | | | | | | | | | | |
| Other | | | | | | | | | | | | |
| Miscellaneous | | | | | | | | | | | | | | | | | |
| | | | | | | | | | |
| | | | | | | | | | |
| Total liability | | $ | | | | $ | | | | | | $ | | | | $ | | | | $ | | |
(a)
(b)
(c)
Indeterminate AROs — Outside of the recorded asbestos AROs, other plants or buildings may contain asbestos due to the age of many of Xcel Energy’s facilities, but confirmation or measurement of the cost of removal could be determined as of Dec. 31, 2023. Therefore, an ARO was not recorded for these facilities.
billion under the Price-Anderson amendment to the Atomic Energy Act. NSP-Minnesota has $ million of coverage for its public liability exposure with a pool of insurance companies. The remaining $ billion of exposure is funded by the Secondary Financial Protection Program available from assessments by the federal government.
NSP-Minnesota is subject to assessments of up to $ million per reactor-incident for each of its reactors, for public liability arising from a nuclear incident at any licensed nuclear facility in the United States. The maximum funding requirement is $ million per reactor-incident during any one year. Maximum assessments are subject to inflation adjustments.
NSP-Minnesota purchases insurance for property damage and site decontamination cleanup costs from NEIL and EMANI. The coverage limits are $ billion for each of NSP-Minnesota’s nuclear plant sites. NEIL also provides business interruption insurance coverage up to $ million and $ million at Monticello and Prairie Island, respectively, including the cost of replacement power during prolonged accidental outages of nuclear generating units. Premiums are expensed over the policy term.
All companies insured with NEIL are subject to retroactive premium adjustments if losses exceed accumulated reserve funds. Capital has been accumulated in the reserve funds of NEIL and EMANI to the extent that NSP-Minnesota would have no exposure for retroactive premium assessments in case of a single incident under the business interruption and the property damage insurance coverage.
NSP-Minnesota could be subject to annual maximum assessments of $ million for business interruption insurance and $ million for property damage insurance if losses exceed accumulated reserve funds.
of the authorized canisters. Monticello’s future spent fuel will continue to be placed in its spent fuel pool. The decommissioning plan addresses the disposition of spent fuel at the end of the licensed life. In October 2023, a CON for additional storage at the Monticello site was approved by the MPUC to support possible life extension to 2040.
The PI dry-cask storage facility currently stores of the authorized casks. In February 2023, NSP-Minnesota filed a CON with the MPUC for additional storage at PI to support possible life extension to 2054.
Regulatory Plant Decommissioning Recovery — Decommissioning activities for NSP-Minnesota’s nuclear facilities are planned to begin at the end of each unit’s authorized retirement dates, which can be different than the currently approved NRC operating licenses. These decommissioning activities are planned to be completed at both facilities by 2101.
NSP-Minnesota’s current operating licenses allow continued use of its Monticello nuclear plant until 2030 and its PI nuclear plant until 2033 for Unit 1 and 2034 for Unit 2. The MPUC reaffirmed a 60-year DECON scenario, where Monticello continues operations under a 10-year license extension (approved in August 2022). NRC approval of the extension is pending.
% by the external decommissioning trust fund. NSP-Minnesota had $ billion and $ billion of assets held in external decommissioning trusts at Dec. 31, 2023, and 2022, respectively.
See Note 10 to the consolidated financial statements for additional discussion.
%). For currently exiting asset classes, Xcel Energy has elected the practical expedient under which non-lease components, such as asset maintenance costs included in payments, are not deducted from lease payments for the purposes of lease accounting and disclosure.Leases with an initial term of months or less are classified as short-term leases and are not recognized on the consolidated balance sheet.
| | $ | | | | Other | | | | | | |
| Gross operating lease ROU assets | | | | | | |
| Accumulated amortization | | () | | | () | |
| Net operating lease ROU assets | | $ | | | | $ | | |
ROU assets for finance leases are included in other noncurrent assets, and the present value of future finance lease payments is included in other current liabilities and other noncurrent liabilities.
Xcel Energy’s most significant finance lease activities are related to WYCO, a joint venture with CIG, to develop and lease natural gas pipeline, storage and compression facilities. Xcel Energy Inc. has a % ownership interest in WYCO. WYCO leases its facilities to CIG, and CIG operates the facilities, providing natural gas storage and transportation services to PSCo under separate service agreements.
% of the finance lease obligation related to WYCO in the consolidated balance sheet along with an equal amount of Xcel Energy Inc.’s equity investment in WYCO.
| | $ | | | | Gas pipeline | | | | | | |
| Gross finance lease ROU assets | | | | | | |
| Accumulated amortization | | () | | | () | |
| Net finance lease ROU assets | | $ | | | | $ | | |
| | $ | | | | $ | | | Other operating leases (a) | | | | | | | | | |
Total operating lease expense (b) | | $ | | | | $ | | | | $ | | |
| Finance leases | | | | | | |
| Amortization of ROU assets | | $ | | | | $ | | | | $ | | |
| Interest expense on lease liability | | | | | | | | | |
| Total finance lease expense | | $ | | | | $ | | | | $ | | |
(a) million, $ million, and $ million for 2023, 2022 and 2021, respectively.
| | $ | | | | $ | | | | $ | | | | 2025 | | | | | | | | | | | | |
| 2026 | | | | | | | | | | | | |
| 2027 | | | | | | | | | | | | |
| 2028 | | | | | | | | | | | | |
| Thereafter | | | | | | | | | | | | |
| Total minimum obligation | | | | | | | | | | | | |
| Interest component of obligation | | () | | | () | | | () | | | () | |
| Present value of minimum obligation | | $ | | | | | | | | | | | |
| Less current portion | | | | | | () | | | () | |
| Noncurrent operating and finance lease liabilities | | | | | | $ | | | | $ | | |
| | | | | | | | |
| Weighted-average remaining lease term in years | | | | | | | | |
(a)
(b)
(c)% ownership interest in WYCO.
million, $ million and $ million in 2023, 2022 and 2021, respectively.Included in electric fuel and purchased power expenses for PPAs accounted for as executory contracts were payments for capacity of $ million, $ million and $ million in 2023, 2022 and 2021, respectively.
Capacity and energy payments are contingent on the IPPs meeting contract obligations, including plant availability requirements. Certain contractual payments are adjusted based on market indices. The effects of price adjustments on financial results are mitigated through purchased energy cost recovery mechanisms.
| | $ | | | | 2025 | | | | | | |
| 2026 | | | | | | |
| 2027 | | | | | | |
| 2028 | | | | | | |
| Thereafter | | | | | | |
| Total | | $ | | | | $ | | |
(a)
Fuel Contracts — Xcel Energy has entered into various long-term commitments for the purchase and delivery of a significant portion of its coal, nuclear fuel and natural gas requirements. These contracts expire between 2024 and 2060. Xcel Energy is required to pay additional amounts depending on actual quantities delivered under these agreements.
| | $ | | | | $ | | | | $ | | | | 2025 | | | | | | | | | | | | |
| 2026 | | | | | | | | | | | | |
| 2027 | | | | | | | | | | | | |
| 2028 | | | | | | | | | | | | |
| Thereafter | | | | | | | | | | | | |
| Total | | $ | | | | $ | | | | $ | | | | $ | | |
MW and MW of capacity under long-term PPAs at Dec. 31, 2023 and 2022, respectively, with entities that have been determined to be VIEs. These agreements have expiration dates through 2041.
Fuel Contracts — SPS purchases all of its coal requirements for its Harrington and Tolk plants from TUCO Inc. under contracts that will expire in December 2024 and December 2027, respectively. TUCO arranges for the purchase, receiving, transporting, unloading, handling, crushing, weighing and delivery of coal to meet SPS’ requirements. TUCO is responsible for negotiating and administering contracts with coal suppliers, transporters and handlers.
SPS has not provided any significant financial support to TUCO, other than contractual payments for delivered coal. However, the fuel contracts create a variable interest in TUCO due to SPS’ reimbursement of fuel procurement costs.
SPS has determined that TUCO is a VIE, however it has concluded that SPS is not the primary beneficiary because it does not have the power to direct the activities that most significantly impact TUCO’s economic performance.
Low-Income Housing Limited Partnerships — Eloigne and NSP-Wisconsin have entered into limited partnerships with affordable rental housing activities that qualify for low-income housing tax credits.
Eloigne and NSP-Wisconsin, as primary beneficiaries of these activities, consolidate these limited partnerships in their consolidated financial statements.
Amounts reflected in Xcel Energy’s consolidated balance sheets for these investments include $ million of assets and $ million of liabilities at Dec. 31, 2023, and $ million of assets and $ million of liabilities at Dec. 31, 2022.
million, $ million and $ million associated with these vendors in 2023, 2022 and 2021, respectively.
| | 2025 | | | |
| 2026 | | | |
| 2027 | | | |
| 2028 | | | |
| Thereafter | | | |
Guarantees and Bond Indemnifications — Xcel Energy Inc. and its subsidiaries provide guarantees and bond indemnities, which guarantee payment or performance. Xcel Energy Inc.’s exposure is based upon the net liability under the specified agreements or transactions. Most of the guarantees and bond indemnities issued by Xcel Energy Inc. and its subsidiaries have a stated maximum amount.
As of Dec. 31, 2023 and 2022, Xcel Energy Inc. and its subsidiaries had assets held as collateral related to their guarantees, bond indemnities and indemnification agreements. Guarantees and bond indemnities issued and outstanding for Xcel Energy were $ million and $ million at Dec. 31, 2023 and 2022, respectively.
Other Indemnification Agreements — Xcel Energy Inc. and its subsidiaries provide indemnifications through various contracts. These are primarily indemnifications against adverse litigation outcomes in connection with underwriting agreements, as well as breaches of representations and warranties, including corporate existence, transaction authorization and income tax matters with respect to assets sold.
Xcel Energy Inc.’s and its subsidiaries’ obligations under these agreements may be limited in terms of duration and amount. Maximum future payments under these indemnifications cannot be reasonably estimated as the dollar amounts are often not explicitly stated.
| | |
13. Other Comprehensive Income |
| | $ | () | | | $ | () | | | Other comprehensive loss before reclassifications | | () | | | () | | | () | |
| Losses reclassified from net accumulated other comprehensive loss: |
| Amortization of interest rate hedges | | | | (a) | | | | | |
| Amortization of net actuarial loss | | | | | | | (b) | | |
| Net current period other comprehensive income (loss) | | | | | () | | | () | |
| Accumulated other comprehensive loss at Dec. 31 | | $ | () | | | $ | () | | | $ | () | |
(a)
(b)
)
| | $ | () | | | $ | () | | | Other comprehensive gain before reclassifications | | | | | | | | | |
| Losses reclassified from net accumulated other comprehensive loss: |
| Amortization of interest rate hedges | | | | (a) | | | | | |
| Amortization of net actuarial loss | | | | | | | (b) | | |
| Net current period other comprehensive income | | | | | | | | | |
| Accumulated other comprehensive loss at Dec. 31 | | $ | () | | | $ | () | | | $ | () | |
(a)
(b)
million and $ million as of Dec. 31, 2023 and 2022, respectively, included in the natural gas utility and all other segments.
Asset and capital expenditure information is not provided for Xcel Energy’s reportable segments. As an integrated electric and natural gas utility, Xcel Energy operates significant assets that are not dedicated to a specific business segment.
| | $ | | | | $ | | | | Intersegment revenue | | | | | | | | | |
| Total revenues | | $ | | | | $ | | | | $ | | |
| Depreciation and amortization | | | | | | | | | |
| Interest charges and financing costs | | | | | | | | | |
| Income tax benefit | | () | | | () | | | () | |
| Net income | | | | | | | | | |
| Regulated Natural Gas | | | | | | |
| Operating revenues — external | | $ | | | | $ | | | | $ | | |
| Intersegment revenue | | | | | | | | | |
| Total revenues | | $ | | | | $ | | | | $ | | |
| Depreciation and amortization | | | | | | | | | |
| Interest charges and financing costs | | | | | | | | | |
| Income tax expense | | | | | | | | | |
| Net income | | | | | | | | | |
| All Other | | | | | | |
| Total revenues | | $ | | | | $ | | | | $ | | |
| Depreciation and amortization | | | | | | | | | |
| Interest charges and financing costs | | | | | | | | | |
| Income tax benefit | | () | | | () | | | () | |
| Net loss | | () | | | () | | | () | |
| | | | | | |
| Consolidated Total | | | | | | |
| Total revenues | | $ | | | | $ | | | | $ | | |
| Reconciling eliminations | | () | | | () | | | () | |
| Total operating revenues | | $ | | | | $ | | | | $ | | |
| Depreciation and amortization | | | | | | | | | |
| Interest charges and financing costs | | | | | | | | | |
| Income tax benefit | | () | | | () | | | () | |
| Net income | | | | | | | | | |
employees retired under this program in December 2023.In November 2023, Xcel Energy, Inc. also reduced its non-bargaining workforce by approximately employees through an involuntary severance program.
million related to these workforce actions, primarily related to the estimated cost of future health plan subsidies and other medical benefits for the voluntary retirement program, as well as severance and other employee payouts and legal and other professional fees.
| | |
ITEM 9 — CHANGES IN AND DISAGREEMENTS WITH ACCOUNTANTS ON ACCOUNTING AND FINANCIAL DISCLOSURE |
None.
| | |
ITEM 9A — CONTROLS AND PROCEDURES |
Disclosure Controls and Procedures
Xcel Energy maintains a set of disclosure controls and procedures designed to ensure that information required to be disclosed in reports that it files or submits under the Securities Exchange Act of 1934 is recorded, processed, summarized, and reported within the time periods specified in SEC rules and forms. In addition, the disclosure controls and procedures ensure that information required to be disclosed is accumulated and communicated to management, including the CEO and CFO, allowing timely decisions regarding required disclosure.
As of Dec. 31, 2023, based on an evaluation carried out under the supervision and with the participation of Xcel Energy’s management, including the CEO and CFO, of the effectiveness of its disclosure controls and procedures, the CEO and CFO have concluded that Xcel Energy’s disclosure controls and procedures were effective.
Internal Control Over Financial Reporting
No changes in Xcel Energy’s internal control over financial reporting occurred during the most recent fiscal quarter ended Dec. 31, 2023 that materially affected, or are reasonably likely to materially affect, Xcel Energy’s internal control over financial reporting. Xcel Energy maintains internal control over financial reporting to provide reasonable assurance regarding the reliability of the financial reporting. Xcel Energy has evaluated and documented its controls in process activities, general computer activities, and on an entity-wide level.
During the year and in preparation for issuing its report for the year ended Dec. 31, 2023 on internal controls under section 404 of the Sarbanes-Oxley Act of 2002, Xcel Energy conducted testing and monitoring of its internal control over financial reporting. Based on the control evaluation, testing and remediation performed, Xcel Energy did not identify any material control weaknesses, as defined under the standards and rules issued by the Public Company Accounting Oversight Board, as approved by the SEC and as indicated in Xcel Energy’s Management Report on Internal Controls over Financial Reporting, which is contained in Item 8 herein.
| | |
ITEM 9B — OTHER INFORMATION |
Effective March 1, 2024, Melissa Ostrom, Vice President, Controller at Xcel Energy Inc., will begin serving as principal accounting officer of Xcel Energy. Brian Van Abel, Xcel Energy’s Executive Vice President, Chief Financial Officer will cease serving as Xcel Energy’s principal accounting officer effective March 1, 2024.
Melissa Ostrom, age 40, has served as Vice President, Controller at Xcel Energy since April 2022. Prior to that Ms. Ostrom served as Director, Financial Forecasting and Reporting from November 2018 to March 2022 and as Director, Capital Asset Accounting from April 2016 to November 2018. Ms. Ostrom served in various other finance and accounting positions of increasing responsibility since joining Xcel Energy in 2010.
There are no arrangements or understandings between Ms. Ostrom and any other person pursuant to which she was selected to serve as principal accounting officer. There are no family relationships between Ms. Ostrom and any director or officer of Xcel Energy or any other related-party transaction involving Ms. Ostrom and Xcel Energy.
There were no material amendments made to Ms. Ostrom’s compensation in connection with her service as principal accounting officer.
On Feb. 21, 2024, the Board of Directors of Xcel Energy approved the Xcel Energy Inc. Annual Incentive Plan (the “Plan”) in order to provide for annual incentive awards to eligible employees. The Plan replaces the Xcel Energy Inc. Executive Annual Incentive Award Subplan pursuant to the Xcel Energy Inc. Amended and Restated 2015 Omnibus Incentive Plan. The Governance, Compensation and Nominating Committee (the “Committee”) of Xcel Energy’s Board of Directors administers the Plan and has authority to determine when and to whom awards will be granted, the amount of awards, and the terms and conditions of awards including the applicable performance goals, and will certify the level of goal achievement for award payouts. Awards will be paid in the form of cash or, if provided by the Committee, eligible employees may elect to receive payment in the form of stock or restricted stock, or a combination of the foregoing, and any shares of stock will be issued under Xcel Energy’s then-current equity compensation plan, all on such terms as the Committee may determine. The Plan also includes a “clawback” provision providing that awards are subject to recoupment under Xcel Energy’s clawback policies in effect from time to time. A copy of the Plan is filed as Exhibit 10.18 hereto and incorporated herein by reference.
None of the Company’s directors or officers adopted, modified, or terminated a Rule 10b5-1 trading arrangement or a non-Rule 10b5-1 trading arrangement during the Company’s fiscal quarter ended Dec. 31, 2023.
| | |
ITEM 9C — DISCLOSURE REGARDING FOREIGN JURISDICTIONS THAT PREVENT INSPECTIONS |
Not applicable.
PART III
| | |
ITEM 10 — DIRECTORS, EXECUTIVE OFFICERS AND CORPORATE GOVERNANCE |
Information required under this Item with respect to Directors and Corporate Governance is set forth in Xcel Energy Inc.’s Proxy Statement for its 2024 Annual Meeting of Shareholders, which is expected to be filed on April 9, 2024, which is incorporated by reference. Information with respect to Executive Officers is included in Item 1 to this report.
| | |
ITEM 11 — EXECUTIVE COMPENSATION |
Information required under this Item is set forth in Xcel Energy Inc.’s Proxy Statement for its 2024 Annual Meeting of Shareholders, which is incorporated by reference.
| | |
ITEM 12 — SECURITY OWNERSHIP OF CERTAIN BENEFICIAL OWNERS AND MANAGEMENT AND RELATED STOCKHOLDER MATTERS |
Information required under this Item is contained in Xcel Energy Inc.’s Proxy Statement for its 2024 Annual Meeting of Shareholders, which is incorporated by reference.
| | |
ITEM 13 — CERTAIN RELATIONSHIPS AND RELATED TRANSACTIONS, AND DIRECTOR INDEPENDENCE |
Information required under this Item is contained in Xcel Energy Inc.’s Proxy Statement for its 2024 Annual Meeting of Shareholders, which is incorporated by reference.
| | |
ITEM 14 — PRINCIPAL ACCOUNTANT FEES AND SERVICES |
Information required under this Item (aggregate fees billed to us by our principal accountant, Deloitte & Touche LLP (PCAOB ID No. )) is contained in Xcel Energy Inc.’s Proxy Statement for its 2024 Annual Meeting of Shareholders, which is incorporated by reference.
PART IV
| | |
| ITEM 15 — EXHIBIT AND FINANCIAL STATEMENT SCHEDULES |
| | | | | | | | | | | |
| 1 | Consolidated Financial Statements |
| Management Report on Internal Controls Over Financial Reporting — For the year ended Dec. 31, 2023. |
| Report of Independent Registered Public Accounting Firm — Financial Statements and Internal Controls Over Financial Reporting |
| Consolidated Statements of Income — For each of the three years ended Dec. 31, 2023, 2022, and 2021. |
| Consolidated Statements of Comprehensive Income — For each of the three years ended Dec. 31, 2023, 2022, and 2021. |
| Consolidated Statements of Cash Flows — For each of the three years ended Dec. 31, 2023, 2022, and 2021. |
| Consolidated Balance Sheets — As of Dec. 31, 2023, 2022. |
| Consolidated Statements of Common Stockholders’ Equity — For each of the three years ended Dec. 31, 2023, 2022, and 2021. |
| |
| 2 | Schedule I — Condensed Financial Information of Registrant. |
| Schedule II — Valuation and Qualifying Accounts and Reserves for the years ended Dec. 31, 2023, 2022, and 2021. |
| |
| 3 | Exhibits |
| * | Indicates incorporation by reference |
| + | Executive Compensation Arrangements and Benefit Plans Covering Executive Officers and Directors |
| |
| Xcel Energy Inc. |
| Exhibit Number | Description | Report or Registration Statement | Exhibit Reference |
| | Xcel Energy Inc. Form 8-K dated May 16, 2012 | 3.01 |
| | Xcel Energy Inc. Form 8-K dated August 23, 2023 | 3.02 |
| | Xcel Energy Inc. Form 10-K for the year ended Dec. 31, 2019 | 4.01 |
| | Xcel Energy Inc. Form 8-K dated Dec. 14, 2000 | 4.01 |
| | Xcel Energy Inc. Form 8-K dated June 6, 2006 | 4.01 |
| | Xcel Energy Inc. Form 8-K dated Jan. 16, 2008 | 4.01 |
| | Xcel Energy Inc. Form 8-K dated Jan. 16, 2008 | 4.03 |
| | Xcel Energy Inc. Form 8-K dated Sept. 12, 2011 | 4.01 |
| | Xcel Energy Inc. Form 8-K dated June 1, 2015 | 4.01 |
| | Xcel Energy Inc. Form 8-K dated Dec. 1, 2016 | 4.01 |
| | Xcel Energy Inc. Form 8-K dated June 25, 2018 | 4.01 |
| | | | | | | | | | | |
| | Xcel Energy Inc. Form 8-K dated Nov. 7, 2019 | 4.01 |
| | Xcel Energy Inc. Form 8-K dated April 1, 2020 | 4.01 |
| Supplemental Indenture No. 15, dated as of Nov. 3, 2021 between Xcel Energy Inc. and Computershare Trust Company, N.A. (as successor to Wells Fargo Bank, National Association), as Trustee, creating $500 million aggregate principal amount of 1.75% Senior Notes, Series due March 15, 2027 and $300 million aggregate principal amount of 2.35% Senior Notes, Series due Nov. 15, 2031 | Xcel Energy Inc. Form 8-K dated Nov. 3, 2021 | 4.01 |
| | Xcel Energy Form 8-K dated May 6, 2022 | 4.01 |
| | Xcel Energy Form 8-K dated August 3, 2023 | 4.01 |
| | Xcel Energy Inc. Form 10-K for the year ended Dec. 31, 2008 | 10.02 |
| | Xcel Energy Inc. Form 10-K for the year ended Dec. 31, 2008 | 10.05 |
| | Xcel Energy Inc. Form 10-K for the year ended Dec. 31, 2011 | 10.18 |
| | Xcel Energy Inc. Form 10-Q for the quarter ended June 30, 2016 | 10.01 |
| | Xcel Energy Inc. Form 10-Q for the quarter ended June 30, 2018 | 10.01 |
| | Xcel Energy Inc. Form 10-Q for the quarter ended March 31, 2020 | 10.02 |
| | Xcel Energy Inc. Form 10-Q for the quarter ended June 30, 2020 | 10.01 |
| | Xcel Energy Inc. Form 10-K for the year ended Dec. 31, 2008 | 10.17 |
| |
| |
| |
| | Xcel Energy Inc. Form 10-K for the year ended Dec. 31, 2008 | 10.07 |
| | Xcel Energy Inc. Form 10-K for the year ended Dec. 31, 2011 | 10.17 |
| | Xcel Energy Inc. Form 10-K for the year ended Dec. 31, 2013 | 10.22 |
| | Xcel Energy Inc. Form 10-Q for the quarter ended Sept. 30, 2016 | 10.01 |
| | Xcel Energy Inc. Form 10-Q for the quarter ended Sept. 30, 2017 | 10.1 |
| | Xcel Energy Inc. Form 10-K for the year ended Dec. 31, 2018 | 10.34 |
| | Xcel Energy Inc. Form 10-K for the year ended Dec. 31, 2019 | 10.32 |
| | | |
| | Xcel Energy Inc. Form 8-K dated Dec. 10, 2021 | 10.01 |
| | | |
| | Xcel Energy Inc. Form 10-Q for the quarter ended June 30, 2023 | 10.01 |
| | Xcel Energy Inc. Definitive Proxy Statement dated April 5, 2011 | Appendix A |
| | Xcel Energy Inc. Form 10-K for the year ended Dec. 31, 2018 | 10.36 |
| | Xcel Energy Inc. Form U5B dated Nov. 16, 2000 | H-1 |
| Fourth Amended and Restated Credit Agreement, dated as of September 19, 2022, among Xcel Energy Inc., as Borrower, the several lenders from time to time parties thereto, JPMorgan Chase Bank, N.A., as Administrative Agent, Bank of America, N.A. and Barclays Bank PLC, as Syndication Agents, and Citibank, N.A., MUFG Bank, Ltd., and Wells Fargo Bank, National Association., as Documentation Agents | Xcel Energy Inc. Form 8-K dated Sept. 19, 2022
| 99.01 |
| | | |
| NSP-Minnesota |
| | Xcel Energy Inc. Form S-3 dated April 18, 2018 | 4(b)(3) |
| | Xcel Energy Inc. Form 10-K for the year ended Dec. 31, 2017 | 4.11 |
| | | | | | | | | | | |
| | Xcel Energy Inc. Form 10-K for the year ended Dec. 31, 2017 | 4.12 |
| | NSP-Minnesota Form 10-12G dated Oct. 5, 2000 | 4.51 |
| | Xcel Energy Inc. Form S-3 dated April 18, 2018 | 4(b)(7) |
| Supplemental Indenture No. 2, dated Aug. 18, 2000, supplemental to the Indenture, dated as of July 1, 1999, among Xcel Energy Inc., NSP-Minnesota and Wells Fargo Bank Minnesota, NA (as successor to Norwest Bank Minnesota, NA), as Trustee | NSP-Minnesota Form 10-12G dated Oct. 5, 2000 | 4.63 |
| | NSP-Minnesota Form 8-K dated July 14, 2005 | 4.01 |
| | NSP-Minnesota Form 8-K dated May 18, 2006 | 4.01 |
| | NSP-Minnesota Form 8-K dated June 19, 2007 | 4.01 |
| | NSP-Minnesota Form 8-K dated Nov. 16, 2009 | 4.01 |
| | NSP-Minnesota Form 8-K dated Aug. 4, 2010 | 4.01 |
| | NSP-Minnesota Form 8-K dated Aug. 13, 2012 | 4.01 |
| | NSP-Minnesota Form 8-K dated May 13, 2014 | 4.01 |
| | NSP-Minnesota Form 8-K dated Aug. 11, 2015 | 4.01 |
| | NSP-Minnesota Form 8-K dated May 31, 2016 | 4.01 |
| | NSP-Minnesota Form 8-K dated Sept. 13, 2017 | 4.01 |
| | NSP-Minnesota Form 8-K dated Sept. 10, 2019 | 4.01 |
| | NSP-Minnesota 8-K dated June 15, 2020 | 4.01 |
| Supplemental Indenture, dated as of March 1, 2021, by and between NSP-Minnesota and The Bank of New York Mellon Trust Company, N.A., as Trustee, creating $425 million principal amount of 2.25% First Mortgage Bonds, Series due April 1, 2031 and $425 million principal amount of 3.20% First Mortgage Bonds, Series due April 1, 2052 | NSP-Minnesota 8-K dated March 30, 2021 | 4.01 |
| | NSP-Minnesota 8-K dated May 9, 2022 | 4.01 |
| | NSP-Minnesota 8-K dated May 8, 2023 | 4.01 |
| | NSP-Wisconsin Form S-4 dated Jan. 21, 2004 | 10.01 |
| Fourth Amended and Restated Credit Agreement, dated as of September 19, 2022, among NSP-Minnesota, as Borrower, the several lenders from time to time parties thereto, JPMorgan Chase Bank, N.A., as Administrative Agent, Bank of America, N.A. and Barclays Bank PLC, as Syndication Agents, and Citibank, N.A., MUFG Bank, Ltd., and Wells Fargo Bank, National Association, as Documentation Agents | Xcel Energy Inc. Form 8-K dated Sept. 19, 2022 | 99.02 |
| | | |
| NSP-Wisconsin |
| | Xcel Energy Inc. Form S-3 dated April 18, 2018 | 4(c)(3) |
| | NSP-Wisconsin Form 8-K dated Sept. 25, 2000 | 4.01 |
| | NSP-Wisconsin Form 8-K dated Sept. 3, 2008 | 4.01 |
| | NSP-Wisconsin Form 8-K dated Oct. 10, 2012 | 4.01 |
| | NSP-Wisconsin Form 8-K dated June 23, 2014 | 4.01 |
| | | | | | | | | | | |
| | NSP-Wisconsin Form 8-K dated Dec. 4, 2017 | 4.01 |
| | NSP-Wisconsin Form 8-K dated Sept. 12, 2018 | 4.01 |
| | NSP-Wisconsin Form 8-K dated May 26, 2020 | 4.01 |
| | NSP-Wisconsin Form 8-K dated July 20, 2021 | 4.01 |
| | NSP-Wisconsin Form 8-K dated July 15, 2022 | 4.01 |
| | NSP-Wisconsin Form 8-K dated May 10, 2023 | 4.01 |
| | NSP-Wisconsin Form S-4 dated Jan. 21, 2004 | 10.01 |
| Fourth Amended and Restated Credit Agreement, dated as of Sept. 19, 2022, among NSP-Wisconsin, as Borrower, the several lenders from time to time parties thereto, JPMorgan Chase Bank, N.A., as Administrative Agent, Bank of America, N.A. and Barclays Bank PLC, as Syndication Agents, and Citibank, N.A., MUFG Bank, Ltd. and Wells Fargo Bank, National Association, as Documentation Agents | Xcel Energy Inc. Form 8-K dated Sept. 19, 2022 | 99.05 |
| | | |
| PSCo |
| | Xcel Energy Inc. Form S-3 dated April 18, 2018 | 4(d)(3) |
| | PSCo Form 8-K dated Aug. 8, 2007 | 4.01 |
| | PSCo Form 8-K dated Aug. 6, 2008 | 4.01 |
| | PSCo Form 8-K dated Aug. 9, 2011 | 4.01 |
| | PSCo Form 8-K dated Sept. 11, 2012 | 4.01 |
| | PSCo Form 8-K dated March 10, 2014 | 4.01 |
| | PSCo Form 8-K dated May 12, 2015 | 4.01 |
| | PSCo Form 8-K dated June 13, 2016 | 4.01 |
| | PSCo Form 8-K dated June 19, 2017 | 4.01 |
| Supplemental Indenture No. 28, dated as of June 1, 2018, by and between PSCo and U.S. Bank Trust Company, National Association (as successor to U.S. Bank National Association), as Trustee, creating $350 million aggregate principal amount of 3.70% First Mortgage Bonds, Series No. 31 due June 15, 2028, and $350 million aggregate principal amount of 4.10% First Mortgage Bonds, Series No. 32 due June 15, 2048 | PSCo Form 8-K dated June 21, 2018 | 4.01 |
| | PSCo Form 8-K dated March 13, 2019 | 4.01 |
| | PSCo Form 8-K dated August 13, 2019 | 4.01 |
| Supplemental Indenture No. 31, dated as of May 1, 2020, by and between PSCo and U.S. Bank Trust Company, National Association (as successor to U.S. Bank National Association), as Trustee, creating $375 million aggregate principal amount of 2.70% First Mortgage Bonds, Series No. 35 due Jan. 15, 2051 and $375 million aggregate principal amount of 1.90% First Mortgage Bonds, Series No. 36 due Jan. 15, 2031 | PSCo Form 8-K dated May 15, 2020 | 4.01 |
| | PSCo Form 8-K dated March 1, 2021 | 4.01 |
| Supplemental Indenture No. 33, dated as of May 1, 2022, by and between PSCo and U.S. Bank Trust Company, National Association, as Trustee, creating $300 million aggregate principal amount of 4.10% First Mortgage Bonds, Series No. 38 due June 1, 2032 and $400 million aggregate principal amount of 4.50% First Mortgage Bonds, Series No. 39 due June 1, 2052 | PSCo Form 8-K dated May 17, 2022 | 4.01 |
| | PSCo Form 8-K dated April 3, 2023 | 4.01 |
| | Xcel Energy Inc. Form 8-K dated Dec. 3, 2004 | 99.02 |
| | | | | | | | | | | |
| Fourth Amended and Restated Credit Agreement, dated as of September 19, 2022, among PSCo, as Borrower, the several lenders from time to time parties thereto, JPMorgan Chase Bank, N.A., as Administrative Agent, Bank of America, N.A. and Barclays Bank PLC, as Syndication Agents, and Citibank, N.A., MUFG Bank, Ltd., and Wells Fargo Bank, National Association, as Documentation Agents | Xcel Energy Inc. Form 8-K dated Sept. 19, 2022 | 99.03 |
| | | |
| SPS |
| | SPS Form 8-K dated Feb. 25, 1999 | 99.2 |
| | Xcel Energy Inc. Form 10-Q for the quarter ended Sept. 30, 2003 | 4.04 |
| | SPS Form 8-K dated Oct. 3, 2006 | 4.01 |
| | SPS Form 8-K dated Aug. 10, 2011 | 4.01 |
| | SPS Form 8-K dated Aug. 10, 2011 | 4.02 |
| | SPS Form 8-K dated June 9, 2014 | 4.02 |
| | SPS Form 8-K dated Aug. 12, 2016 | 4.02 |
| | SPS Form 8-K dated Aug 9. 2017 | 4.02 |
| | SPS Form 8-K dated Nov. 5, 2018 | 4.02 |
| | SPS Form 8-K dated June 18, 2019 | 4.02 |
| | SPS Form 8-K dated May 18, 2020 | 4.02 |
| | SPS Form 8-K dated May 31, 2022 | 4.02 |
| | SPS Form 8-K dated August 21, 2023 | 4.01 |
| Fourth Amended and Restated Credit Agreement, dated as of Sept. 19, 2022, among SPS, as Borrower, the several lenders from time to time parties thereto, JPMorgan Chase Bank, N.A., as Administrative Agent, Bank of America, N.A. and Barclays Bank PLC, as Syndication Agents, and Citibank, N.A., MUFG Bank, Ltd. and Wells Fargo Bank, National Association, as Documentation Agents | Xcel Energy Inc. Form 8-K dated Sept. 19, 2022 | 99.04 |
| | | |
| Xcel Energy Inc. |
| |
| |
| |
| |
| |
| |
| | | |
| 101.INS | Inline XBRL Instance Document - the instance document does not appear in the Interactive Data File because its XBRL tags are embedded within the Inline XBRL document |
| 101.SCH | Inline XBRL Schema |
| 101.CAL | Inline XBRL Calculation |
| 101.DEF | Inline XBRL Definition |
| 101.LAB | Inline XBRL Label |
| 101.PRE | Inline XBRL Presentation |
| 104 | Cover Page Interactive Data File (formatted as Inline XBRL and contained in Exhibit 101) |
SCHEDULE I
XCEL ENERGY INC.
CONDENSED STATEMENTS OF INCOME AND COMPREHENSIVE INCOME
(amounts in millions, except per share data)
| | $ | | | | $ | | | | Total income | | | | | | | | |
| Expenses and other deductions | | | | | |
| Operating expenses | | | | | | | | |
| Other (income) expenses | () | | | () | | | | |
| Interest charges and financing costs | | | | | | | | |
| Total expenses and other deductions | | | | | | | | |
| Income before income taxes | | | | | | | | |
| Income tax benefit | () | | | () | | | () | |
| Net income | $ | | | | $ | | | | $ | | |
| | | | | |
| Other Comprehensive Income | | | | | |
| Pension and retiree medical benefits, net of tax | $ | () | | | $ | | | | $ | | |
| Derivative instruments, net of tax | | | | | | | | |
| Other comprehensive income | () | | | | | | | |
| Comprehensive income | $ | | | | $ | | | | $ | | |
| | | | | |
| Weighted average common shares outstanding: | | | | | |
| Basic | | | | | | | | |
| Diluted | | | | | | | | |
| Earnings per average common share: | | | | | |
| Basic | $ | | | | $ | | | | $ | | |
| Diluted | | | | | | | | |
| See Notes to Condensed Financial Statements |
XCEL ENERGY INC.
CONDENSED STATEMENTS OF CASH FLOWS
(amounts in millions)
| | $ | | | | $ | | | | Investing activities | | | | | |
| Capital contributions to subsidiaries | () | | | () | | | () | |
| Net return in the utility money pool | | | | | | | | |
| | | |
| Net cash used in investing activities | () | | | () | | | () | |
| Financing activities | | | | | |
| (Repayment of) proceeds from short-term borrowings, net | () | | | () | | | | |
| Proceeds from issuance of long-term debt | | | | | | | | |
| Repayment of long-term debt | () | | | | | | () | |
| Proceeds from issuance of common stock | | | | | | | | |
| | | |
| Dividends paid | () | | | () | | | () | |
| Other | () | | | () | | | () | |
| Net cash (used in) provided by financing activities | () | | | () | | | | |
| Net change in cash, cash equivalents, and restricted cash | | | | | | | () | |
| Cash, cash equivalents and restricted cash at beginning of period | | | | | | | | |
| Cash, cash equivalents and restricted cash at end of period | $ | | | | $ | | | | $ | | |
| See Notes to Condensed Financial Statements |
XCEL ENERGY INC.
CONDENSED BALANCE SHEETS
(amounts in millions)
| | $ | | | | | Accounts receivable from subsidiaries | | | | | | |
| Derivative instruments | | | | | | |
| Other current assets | | | | | | |
| Total current assets | | | | | | |
| Investment in subsidiaries | | | | | | |
| Other assets | () | | | () | | |
| Total other assets | | | | | | |
| Total assets | $ | | | | $ | | | |
| Liabilities and Equity | | | | |
| Current portion of long-term debt | | | | | | |
| Dividends payable | | | | | | |
| Short-term debt | | | | | | |
| Other current liabilities | | | | | | |
| Total current liabilities | | | | | | |
| Other liabilities | | | | | | |
| Total other liabilities | | | | | | |
| Commitments and contingencies | | | | |
| Capitalization | | | | |
| Long-term debt | | | | | | |
| Common stockholders' equity | | | | | | |
| Total capitalization | | | | | | |
| Total liabilities and equity | $ | | | | $ | | | |
| See Notes to Condensed Financial Statements | |
| | (b) | | (c) | | Guarantees of Xcel Energy Inc.’s utility subsidiaries’ performance on tax credit sale agreements | | Xcel Energy Inc. | | | | | (d) | | (c) |
Guarantee performance and payment of surety bonds for Xcel Energy Inc.’s utility subsidiaries (e) | | Xcel Energy Inc. | | | | | (f) | | (g) |
(a)
(b)
(c)
(d)
(e)
(f)
(g)
Indemnification Agreements
Xcel Energy Inc. provides indemnifications through contracts entered into in the normal course of business. Indemnifications are primarily against adverse litigation outcomes in connection with underwriting agreements, breaches of representations and warranties, including corporate existence, transaction authorization and certain income tax matters. Obligations under these agreements may be limited in terms of duration or amount. Maximum future payments under these indemnifications cannot be reasonably estimated as the dollar amounts are often not explicitly stated.
Related Party Transactions — Xcel Energy Inc. presents related party receivables net of payables. Accounts receivable net of payables with affiliates at Dec. 31:
| | | | | | | | | | | | | | |
| (Millions of Dollars) | | 2023 | | 2022 |
| NSP-Minnesota | | $ | | | | $ | | |
| NSP-Wisconsin | | | | | | |
| PSCo | | | | | | |
| SPS | | | | | | |
| Xcel Energy Services Inc. | | | | | | |
| | |
| Other subsidiaries of Xcel Energy Inc. | | | | | | |
| | $ | | | | $ | | |
Dividends — Cash dividends paid to Xcel Energy Inc. by its subsidiaries were $ million, $ million and $ million for the years ended Dec. 31, 2023, 2022 and 2021, respectively. These cash receipts are included in operating cash flows of the condensed statements of cash flows.
Money Pool — FERC approval was received to establish a utility money pool arrangement with the utility subsidiaries, subject to receipt of required state regulatory approvals. The utility money pool allows for short-term investments in and borrowings between the utility subsidiaries. Xcel Energy Inc. may make investments in the utility subsidiaries at market-based interest rates; however, the money pool arrangement does not allow the utility subsidiaries to make investments in Xcel Energy Inc.
Money pool lending for Xcel Energy Inc.:
| | | | | | | | |
| (Amounts in Millions, Except Interest Rates) | | Three Months Ended Dec. 31, 2023 |
| Loan outstanding at period end | | $ | | |
| Average loan outstanding | | | |
| Maximum loan outstanding | | | |
| Weighted average interest rate, computed on a daily basis | | | % |
| Weighted average interest rate at end of period | | |
| Money pool interest income | | $ | | |
| | | | | | | | | | | | | | | | | | | | |
| (Amounts in Millions, Except Interest Rates) | | Year Ended Dec. 31, 2023 | | Year Ended Dec. 31, 2022 | | Year Ended Dec. 31, 2021 |
| Loan outstanding at period end | | $ | | | | $ | | | | $ | | |
| Average loan outstanding | | | | | | | | | |
| Maximum loan outstanding | | | | | | | | | |
| Weighted average interest rate, computed on a daily basis | | | % | | | % | | | % |
| Weighted average interest rate at end of period | | | | | N/A | | N/A |
| Money pool interest income | | $ | | | | $ | | | | $ | | |
See notes to the consolidated financial statements in Part II, Item 8.
SCHEDULE II
| | $ | | | | $ | | | | $ | | | | $ | | | | $ | | | | | Additions charged to costs and expenses | | | | | | | | | | | | | | | | | | | |
| Additions charged to other accounts | | | | (a) | | | (a) | | | (a) | | | | | | | | | |
| Deductions from reserves | | () | | (b) | () | | (b) | () | | (b) | () | | (c) | () | | (c) | () | | (c) |
| Balance at Dec. 31 | | $ | | | | $ | | | | $ | | | | $ | | | | $ | | | | $ | | | |
(a)
(b)
(c).
| | |
ITEM 16 — FORM 10-K SUMMARY |
None.
Signatures
Pursuant to the requirements of Section 13 or 15(d) of the Securities Exchange Act of 1934, the registrant has duly caused this annual report to be signed on its behalf by the undersigned thereunto duly authorized.
| | | | | | | | |
| | XCEL ENERGY INC. |
| | |
| Feb. 21, 2024 | By: | /s/ BRIAN J. VAN ABEL |
| | Brian J. Van Abel |
| | Executive Vice President, Chief Financial Officer |
Pursuant to the requirements of the Securities Exchange Act of 1934, this report has been signed below by the following persons on behalf of the registrant and in the capacities on the date indicated above.
| | | | | | | | | | | |
| /s/ ROBERT C. FRENZEL | | Chairman, President, Chief Executive Officer and Director |
| Robert C. Frenzel | | (Principal Executive Officer) |
| | | |
| /s/ BRIAN J. VAN ABEL | | Executive Vice President, Chief Financial Officer |
| Brian J. Van Abel | | (Principal Accounting Officer and Principal Financial Officer) |
| | | |
| |
| |
| |
| * | | | |
| Megan Burkhart | | Director |
| | | |
| * | | | |
| Lynn Casey | | Director |
| | | |
| * | | | |
| Netha Johnson | | Director |
| | | |
| * | | | |
| Patricia L. Kampling | | Director |
| | | |
| * | | | |
| George J. Kehl | | Director |
| | | |
| * | | | |
| Richard T. O’Brien | | Director |
| | | |
| * | | | |
| Charles Pardee | | Director |
| | | |
| * | | | |
| Christopher J. Policinski | | Director |
| | | |
| * | | | |
| James Prokopanko | | Director |
| | | |
| * | | | |
| Timothy Welsh | | Director |
| | | |
| * | | | |
| Kim Williams | | Director |
| | | |
| |
| |
| |
| * | | | |
| Daniel Yohannes | | Director |
| | | |
| *By: | /s/ BRIAN J. VAN ABEL | | |
| Brian J. Van Abel | | Attorney-in-Fact |

Similar companies
See also Duke Energy CORP -
Annual report 2022 (10-K 2022-12-31)
Annual report 2023 (10-Q 2023-09-30)
See also EXELON CORP -
Annual report 2022 (10-K 2022-12-31)
Annual report 2023 (10-Q 2023-09-30)
See also CONSOLIDATED EDISON INC -
Annual report 2022 (10-K 2022-12-31)
Annual report 2023 (10-Q 2023-09-30)
See also PUBLIC SERVICE ENTERPRISE GROUP INC -
Annual report 2022 (10-K 2022-12-31)
Annual report 2023 (10-Q 2023-09-30)
See also WEC ENERGY GROUP, INC. -
Annual report 2022 (10-K 2022-12-31)
Annual report 2023 (10-Q 2023-09-30)