|
|
|
|
|
|
|
|
|
|
|
|
|
|
|
|
|
|
|
|
|
|
|
|
|
|
|
|
|
|
|
|
|
|
|
|
|
|
|
|
|
|
|
|
|
|
|
|
|
|
|
|
|
|
|
|
|
|
|
|
|
|
|
|
1 See “Non-GAAP Financial Measures” on page 77 for more information.
2 The common dividend payout ratio is equal to common dividends paid divided by net earnings applicable to common shareholders.
3 This ratio is the common dividends paid plus share repurchases for the year, divided by net earnings applicable to common shareholders.
ZIONS BANCORPORATION, NATIONAL ASSOCIATION AND SUBSIDIARIES
Net Interest Income and Net Interest Margin
Net interest income is the difference between interest earned on interest-earning assets and interest paid on interest-bearing liabilities, and represented 78% and 80% of our net revenue (net interest income plus noninterest income) during 2023 and 2022, respectively. The NIM is calculated as net interest income as a percent of average interest-earning assets.
Schedule 5
NET INTEREST INCOME AND NET INTEREST MARGIN
| | | | | | | | | | | | | | | | | | | | | | | | | | | | | | | | | | | | | | | | | |
| | | Amount change | | Percent change | | | | Amount change | | Percent change | | |
| (Dollar amounts in millions) | 2023 | | | | 2022 | | | | 2021 |
| | | | | | | | | | | | | |
| Interest and fees on loans | $ | 3,196 | | $ | 1,084 | | | 51 | % | | $ | 2,112 | | $ | 177 | | | 9 | % | | $ | 1,935 |
| Interest on money market investments | 188 | | 107 | | | NM | | 81 | | 60 | | | NM | | 21 |
| Interest on securities | 563 | | 51 | | | 10 | | | 512 | | 201 | | | 65 | | | 311 |
| Total interest income | 3,947 | | 1,242 | | | 46 | | | 2,705 | | 438 | | | 19 | | | 2,267 |
| Interest on deposits | 1,063 | | 993 | | | NM | | 70 | | 40 | | | NM | | 30 |
| Interest on short- and long-term borrowings | 446 | | 331 | | | NM | | 115 | | 86 | | | NM | | 29 |
| Total interest expense | 1,509 | | 1,324 | | | NM | | 185 | | 126 | | | NM | | 59 |
| Net interest income | $ | 2,438 | | $ | (82) | | | (3) | | | $ | 2,520 | | $ | 312 | | | 14 | | | $ | 2,208 |
| | | | | | | | | | | | | |
| Average interest-earning assets | $ | 81,984 | | $ | (1,654) | | | (2) | % | | $ | 83,638 | | $ | 1,371 | | | 2 | % | | $ | 82,267 |
| Average interest-bearing liabilities | 51,876 | | 9,738 | | | 23 | % | | 42,138 | | 1,388 | | | 3 | % | | 40,750 |
| | | bps | | | | | | bps | | | | |
Yield on interest-earning assets 1 | 4.86 | % | | 158 | | | | | 3.28 | % | | 49 | | | | | 2.79 | % |
Rate paid on total deposits and interest-bearing liabilities 1 | 1.87 | % | | 164 | | | | | 0.23 | % | | 16 | | | | | 0.07 | % |
Cost of total deposits 1 | 1.46 | % | | 137 | | | | | 0.09 | % | | 5 | | | | | 0.04 | % |
Net interest margin 1 | 3.02 | % | | (4) | | | | | 3.06 | % | | 34 | | | | | 2.72 | % |
1 Taxable-equivalent rates used where applicable.
Net interest income decreased $82 million, or 3%, in 2023, relative to the prior year, as higher earning asset yields were offset by higher funding costs. The NIM was 3.02%, compared with 3.06%.
The yield on average interest-earning assets was 4.86% in 2023, an increase of 158 basis points, reflecting higher interest rates and a favorable mix change to higher yielding assets. The yield on average loans and leases increased 163 basis points to 5.69% in 2023, compared with 4.06% in 2022, reflecting the higher interest rate environment. The yield on average securities increased 58 basis points to 2.64% in 2023.
The rate paid on average interest-bearing liabilities was 2.91% in 2023, compared with 0.44% in the prior year, and the cost of total deposits was 1.46%, compared with 0.09% in the prior year, also reflecting the higher interest rate environment, and the impact of the change in deposit composition away from noninterest-bearing deposits. The rate paid on total borrowed funds was 5.11%, compared with 3.27%, for the same time periods.
Net interest income was also impacted by a reduction in interest-earning assets and an increase in interest-bearing liabilities. Average interest-earning assets decreased $1.7 billion, or 2%, from the prior year, driven by declines in average securities and average money market investments. The decrease in average securities was primarily due to principal reductions. These decreases were partially offset by an increase of $4.1 billion in average loans and leases.
Average interest-bearing liabilities increased $9.7 billion, or 23%, primarily due to increases in average interest-bearing deposits and average borrowed funds. These increases were offset by a decline of $10.2 billion, or 26%, in average noninterest-bearing deposits, as customers migrated to interest-bearing products in response to the higher interest rate environment.
ZIONS BANCORPORATION, NATIONAL ASSOCIATION AND SUBSIDIARIES
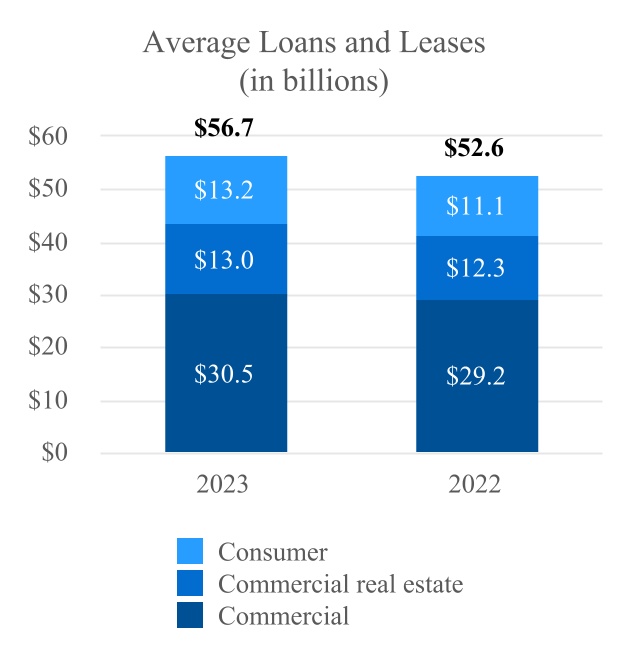
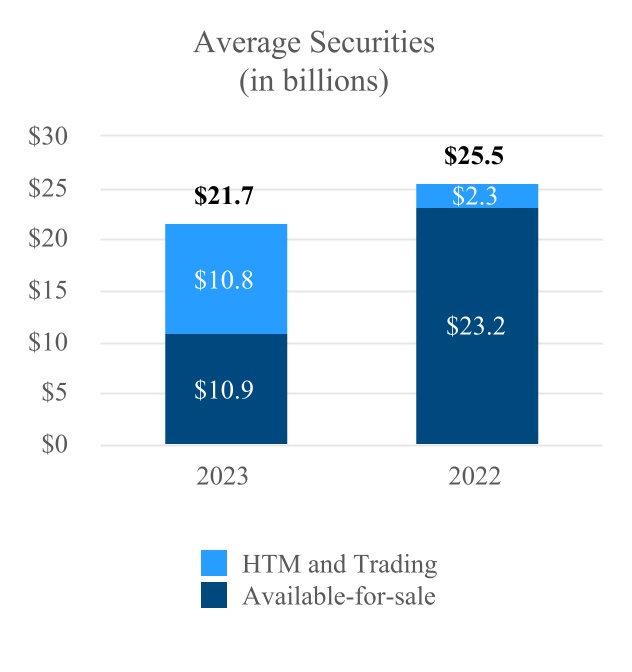
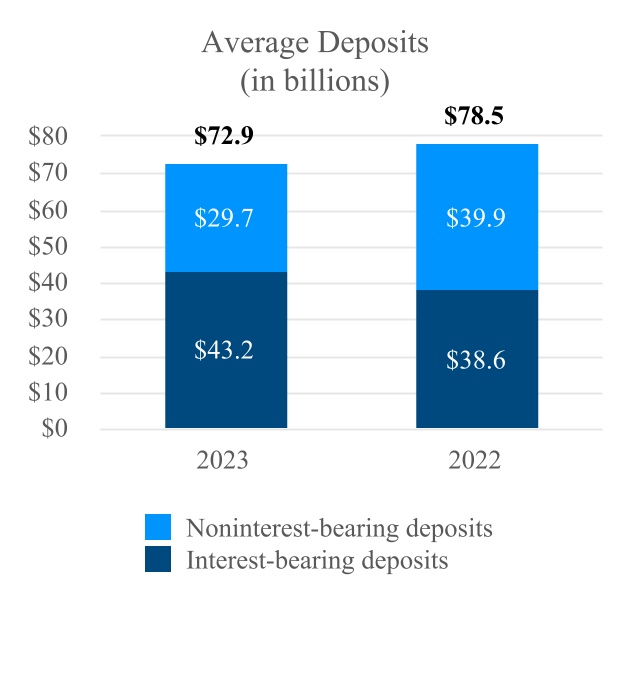
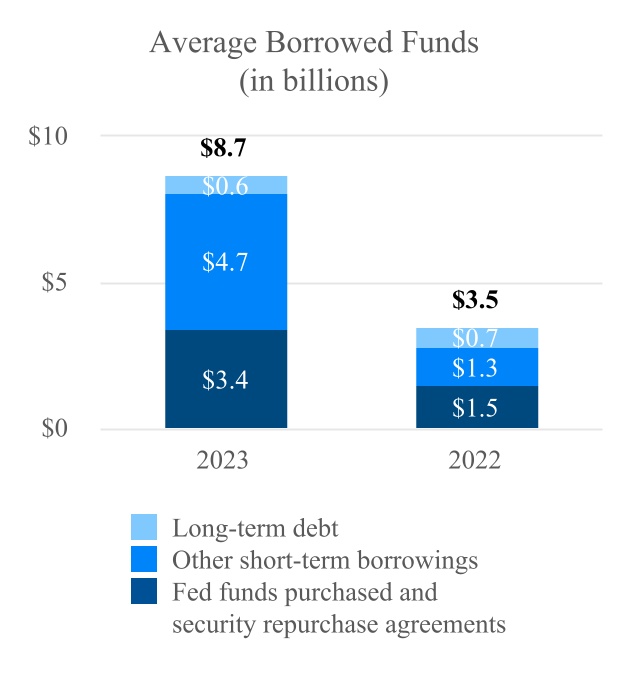
The following charts further illustrate the changes in average interest-earning assets and average interest-bearing liabilities:
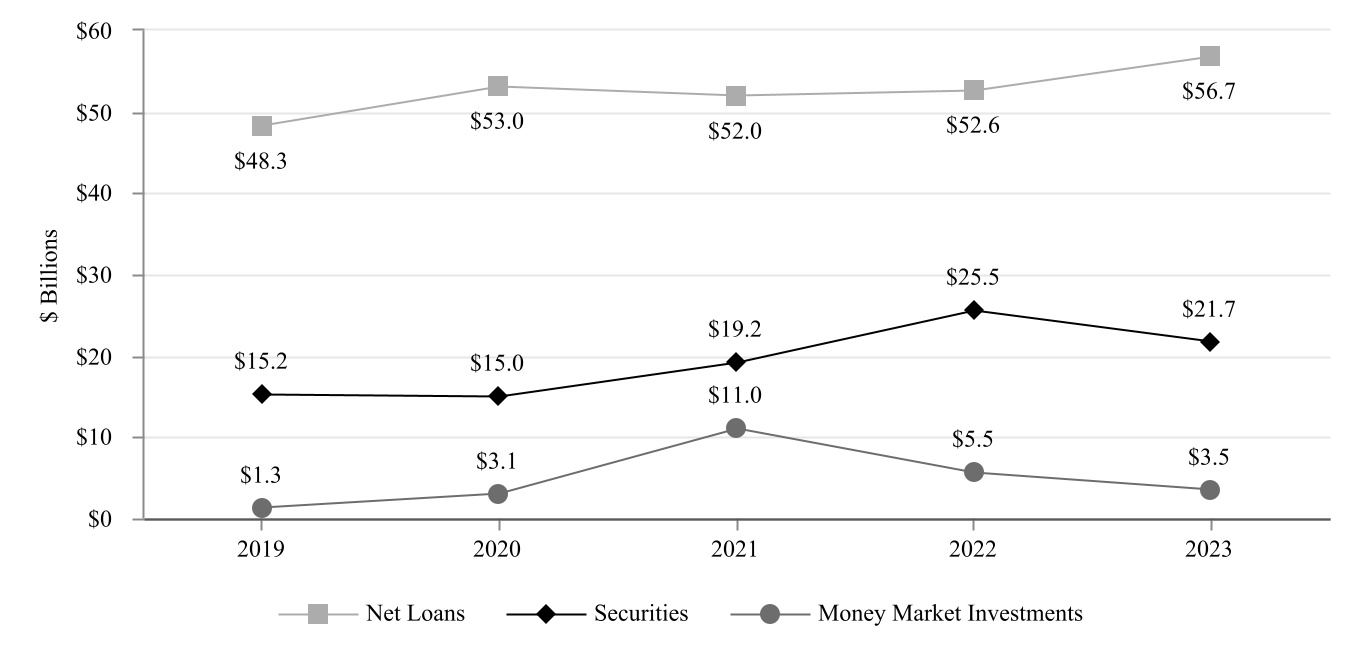
Average loans and leases increased $4.1 billion, or 8%, to $56.7 billion, primarily due to growth in average consumer and commercial loans. Average securities decreased $3.8 billion, or 15%, to $21.7 billion, primarily due to principal reductions. During the fourth quarter of 2022, we transferred approximately $10.7 billion fair value ($13.1 billion amortized cost) of mortgage-backed AFS securities to the held-to-maturity (“HTM”) category.
Average deposits decreased $5.6 billion, or 7%, to $72.9 billion, driven largely by the reduction in noninterest-bearing deposits. Average noninterest-bearing deposits as a percentage of total deposits decreased to 41% in 2023, compared with 51% during 2022. Our loan-to-deposit ratio was 77%, compared with 78% in the prior year.
ZIONS BANCORPORATION, NATIONAL ASSOCIATION AND SUBSIDIARIES
Average borrowed funds, consisting primarily of secured borrowings, increased $5.2 billion, or 149%, to $8.7 billion, due largely to a shift in wholesale funding needs as a result of fluctuations in deposit levels during 2023.
For more information on our investment securities portfolio and borrowed funds and how we manage liquidity risk, refer to the “Investment Securities Portfolio” section on page 46 and the “Liquidity Risk Management” section on page 67. For further discussion of the effects of market rates on net interest income and how we manage interest rate risk, refer to the “Interest Rate and Market Risk Management” section on page 63.
The following schedule summarizes the average balances, the amount of interest earned or paid, and the applicable yields for interest-earning assets and the costs of interest-bearing liabilities:
ZIONS BANCORPORATION, NATIONAL ASSOCIATION AND SUBSIDIARIES
Schedule 6
AVERAGE BALANCE SHEETS, YIELDS, AND RATES
| | | | | | | | | | | | | | | | | | | | | | | | | | | | | | | | | | | |
| Year Ended December 31, |
| 2023 | | 2022 | | 2021 |
| (In millions) | Average balance | Interest | Yield/ Rate 1 | | Average balance | Interest | Yield/ Rate 1 | | Average balance | Interest | Yield/ Rate 1 |
| ASSETS | | | | | | | | | | | |
| Money market investments: | | | | | | | | | | | |
| Interest-bearing deposits | $ | 2,163 | | $ | 112 | | 5.18 | % | | $ | 3,066 | | $ | 27 | | 0.87 | % | | $ | 8,917 | | $ | 12 | | 0.14 | % |
| Federal funds sold and securities purchased under agreements to resell | 1,358 | | 76 | | 5.57 | | | 2,482 | | 54 | | 2.16 | | | 2,129 | | 9 | | 0.40 | |
| Total money market investments | 3,521 | | 188 | | 5.33 | | | 5,548 | | 81 | | 1.45 | | | 11,046 | | 21 | | 0.19 | |
| Securities: | | | | | | | | | | | |
| Held-to-maturity | 10,731 | | 240 | | 2.24 | | | 1,999 | | 47 | | 2.36 | | | 562 | | 17 | | 2.97 | |
| Available-for-sale | 10,900 | | 331 | | 3.03 | | | 23,132 | | 461 | | 1.99 | | | 18,365 | | 292 | | 1.59 | |
| Trading account | 53 | | 1 | | 2.86 | | | 322 | | 16 | | 4.79 | | | 246 | | 11 | | 4.43 | |
| Total securities | 21,684 | | 572 | | 2.64 | | | 25,453 | | 524 | | 2.06 | | | 19,173 | | 320 | | 1.67 | |
| Loans held for sale | 39 | | 2 | | 5.95 | | | 39 | | 1 | | 2.57 | | | 65 | | 1 | | 2.35 | |
Loans and leases: 2 | | | | | | | | | | | |
| Commercial | 30,519 | | 1,679 | | 5.50 | | | 29,225 | | 1,194 | | 4.09 | | | 29,580 | | 1,185 | | 4.01 | |
| Commercial real estate | 13,023 | | 908 | | 6.98 | | | 12,251 | | 544 | | 4.44 | | | 12,136 | | 418 | | 3.44 | |
| Consumer | 13,198 | | 639 | | 4.84 | | | 11,122 | | 398 | | 3.58 | | | 10,267 | | 354 | | 3.44 | |
| Total loans and leases | 56,740 | | 3,226 | | 5.69 | | | 52,598 | | 2,136 | | 4.06 | | | 51,983 | | 1,957 | | 3.76 | |
| Total interest-earning assets | 81,984 | | 3,988 | | 4.86 | | | 83,638 | | 2,742 | | 3.28 | | | 82,267 | | 2,299 | | 2.79 | |
| Cash and due from banks | 662 | | | | | 621 | | | | | 605 | | | |
| Allowance for credit losses on loans and debt securities | (632) | | | | | (514) | | | | | (612) | | | |
| Goodwill and intangibles | 1,062 | | | | | 1,022 | | | | | 1,015 | | | |
| Other assets | 5,579 | | | | | 4,908 | | | | | 4,122 | | | |
| Total assets | $ | 88,655 | | | | | $ | 89,675 | | | | | $ | 87,397 | | | |
| LIABILITIES AND SHAREHOLDERS’ EQUITY | | | | | | | | | | |
| Interest-bearing deposits: | | | | | | | | | | | |
| Savings and money market | $ | 34,135 | | $ | 650 | | 1.90 | | | $ | 37,045 | | $ | 61 | | 0.16 | | | $ | 36,717 | | $ | 21 | | 0.06 | |
| Time | 9,028 | | 413 | | 4.58 | | | 1,594 | | 9 | | 0.58 | | | 2,020 | | 9 | | 0.41 | |
|
| Total interest-bearing deposits | 43,163 | | 1,063 | | 2.46 | | | 38,639 | | 70 | | 0.18 | | | 38,737 | | 30 | | 0.08 | |
| Borrowed funds: | | | | | | | | | | | |
| Federal funds purchased and security repurchase agreements | 3,380 | | 169 | | 4.98 | | | 1,531 | | 38 | | 2.49 | | | 797 | | 1 | | 0.07 | |
| Other short-term borrowings | 4,741 | | 241 | | 5.08 | | | 1,263 | | 46 | | 3.65 | | | 5 | | — | | 0.04 | |
| Long-term debt | 592 | | 36 | | 6.09 | | | 705 | | 31 | | 4.28 | | | 1,211 | | 28 | | 2.36 | |
| Total borrowed funds | 8,713 | | 446 | | 5.11 | | | 3,499 | | 115 | | 3.27 | | | 2,013 | | 29 | | 1.45 | |
| Total interest-bearing funds | 51,876 | | 1,509 | | 2.91 | | | 42,138 | | 185 | | 0.44 | | | 40,750 | | 59 | | 0.14 | |
| Noninterest-bearing demand deposits | 29,703 | | | | | 39,890 | | | | | 37,520 | | | |
|
| Other liabilities | 1,797 | | | | | 1,735 | | | | | 1,259 | | | |
| Total liabilities | 83,376 | | | | | 83,763 | | | | | 79,529 | | | |
| Shareholders’ equity: | | | | | | | | | | | |
| Preferred equity | 440 | | | | | 440 | | | | | 497 | | | |
| Common equity | 4,839 | | | | | 5,472 | | | | | 7,371 | | | |
|
|
| Total shareholders’ equity | 5,279 | | | | | 5,912 | | | | | 7,868 | | | |
| Total liabilities and shareholders’ equity | $ | 88,655 | | | | | $ | 89,675 | | | | | $ | 87,397 | | | |
| Spread on average interest-bearing funds | | | 1.95 | % | | | | 2.84 | % | | | | 2.65 | % |
| Impact of net noninterest-bearing sources of funds | | | 1.07 | % | | | | 0.22 | % | | | | 0.07 | % |
| Net interest margin | | $ | 2,479 | | 3.02 | % | | | $ | 2,557 | | 3.06 | % | | | $ | 2,240 | | 2.72 | % |
| Memo: total cost of deposits | | | 1.46 | % | | | | 0.09 | % | | | | 0.04 | % |
| Memo: total deposits and interest-bearing liabilities | 81,579 | | 1,509 | | 1.87 | % | | 82,028 | | 185 | | 0.23 | % | | 78,270 | | 59 | | 0.07 | % |
1 Taxable-equivalent rates used where applicable.
2 Net of unamortized purchase premiums, discounts, and deferred loan fees and costs. Loans include nonaccrual and restructured loans.
ZIONS BANCORPORATION, NATIONAL ASSOCIATION AND SUBSIDIARIES
The following schedule presents year-over-year changes in net interest income on a fully taxable-equivalent basis for the years indicated. For purposes of calculating the yields in this schedule, the average loan balances also include the principal amounts of nonaccrual and restructured loans. Interest payments received on nonaccrual loans are not recognized into interest income, but are applied as a reduction to the principal outstanding. In addition, interest on modified loans is generally accrued at the modified rates.
In the analysis of changes in taxable-equivalent net interest income attributed to volume and rate, changes are allocated to volume with the following exceptions: when volume and rate both increase, the variance is allocated proportionately to both volume and rate; when the rate increases and volume decreases, the variance is allocated to rate.
Schedule 7
ANALYSIS OF CHANGES IN TAXABLE-EQUIVALENT NET INTEREST INCOME
| | | | | | | | | | | | | | | | | | | | | | | | | | | | | | | | | | | |
| 2023 over 2022 | | 2022 over 2021 |
| Changes due to | | Total changes | | Changes due to | | Total changes |
| (In millions) | Volume | | Rate1 | | | Volume | | Rate1 | |
| INTEREST-EARNING ASSETS | | | | | | | | | | | |
| Money market investments: | | | | | | | | | | | |
| Interest-bearing deposits | $ | (8) | | | $ | 93 | | | $ | 85 | | | $ | (8) | | | $ | 23 | | | $ | 15 | |
| Federal funds sold and securities purchased under agreements to resell | (25) | | | 47 | | | 22 | | | 1 | | | 44 | | | 45 | |
| Total money market investments | (33) | | | 140 | | | 107 | | | (7) | | | 67 | | | 60 | |
| Securities: | | | | | | | | | | | |
| Held-to-maturity | 195 | | | (2) | | | 193 | | | 34 | | | (4) | | | 30 | |
| Available-for-sale | (244) | | | 114 | | | (130) | | | 86 | | | 83 | | | 169 | |
| Trading account | (8) | | | (7) | | | (15) | | | 4 | | | 1 | | | 5 | |
| Total securities | (57) | | | 105 | | | 48 | | | 124 | | | 80 | | | 204 | |
| Loans held for sale | — | | | 1 | | | 1 | | | — | | | — | | | — | |
Loans and leases2 | | | | | | | | | | | |
| Commercial | 56 | | | 429 | | | 485 | | | (59) | | | 68 | | | 9 | |
| Commercial real estate | 36 | | | 328 | | | 364 | | | 3 | | | 123 | | | 126 | |
| Consumer | 84 | | | 157 | | | 241 | | | 30 | | | 14 | | | 44 | |
| Total loans and leases | 176 | | | 914 | | | 1,090 | | | (26) | | | 205 | | | 179 | |
| Total interest-earning assets | 86 | | | 1,160 | | | 1,246 | | | 91 | | | 352 | | | 443 | |
| INTEREST-BEARING LIABILITIES | | | | | | | | | | | |
| Interest-bearing deposits: | | | | | | | | | | | |
| Saving and money market | (6) | | | 595 | | | 589 | | | 1 | | | 39 | | | 40 | |
| Time | 163 | | | 241 | | | 404 | | | (2) | | | 2 | | | — | |
|
|
|
|
|
|
|
|
|
|
The effective tax rates for the periods presented above were decreased by nontaxable municipal interest income and nontaxable income from certain bank-owned life insurance (“BOLI”), and were increased by the nondeductibility of certain FDIC premiums, certain executive compensation, and other fringe benefits. The increase in the effective tax rate for 2023 was primarily due to higher FDIC premium expense (regular FDIC insurance premiums are non-deductible) and interest expense related to tax-exempt income. Additionally, investments in technology initiatives, low-income housing, and municipal securities during 2023, 2022, and 2021, generated tax credits and nontaxable income that benefited the effective tax rate for each respective year.
We had a net DTA of $1.0 billion and $1.1 billion at December 31, 2023 and 2022, respectively. The decrease in the net DTA was driven largely by a decrease in unrealized losses in AOCI associated with investment securities and derivative instruments and a reduction of certain capitalized expenses for tax purposes. These decreases were partially offset by an increase in the provision for credit losses during 2023.
We had no valuation allowance at December 31, 2023 and December 31, 2022. See Note 20 of the Notes to Consolidated Financial Statements for more information about the factors that impacted our effective tax rate, significant components of our DTAs and DTLs, and unrecognized tax benefits for uncertain tax positions.
Preferred Stock Dividends
Preferred stock dividends totaled $32 million in 2023, and $29 million in both 2022 and 2021. See further details in Note 14 of the Notes to Consolidated Financial Statements.
Business Segment Results
We manage our operations through seven affiliate banks located in different geographic markets, each with its own local branding and management team. These affiliate banks comprise our primary business segments and include: Zions Bank, California Bank & Trust (“CB&T”), Amegy Bank (“Amegy”), National Bank of Arizona (“NBAZ”), Nevada State Bank (“NSB”), Vectra Bank Colorado (“Vectra”), and The Commerce Bank of Washington (“TCBW”). We emphasize local authority, responsibility, pricing, and customization of certain products that are designed to maximize customer satisfaction, strengthen community relations, and improve profitability and shareholder returns. Our affiliate banks are supported by an enterprise operating segment (referred to as the “Other” segment) that provides governance and risk management, allocates capital, establishes strategic objectives, and includes centralized technology, back-office functions, and certain lines of business not operated through our affiliate banks.
We allocate the cost of centrally provided services to the business segments based upon estimated or actual usage of those services. We also allocate capital based on the risk-weighted assets held at each business segment. We use an internal funds transfer pricing (“FTP”) allocation process to report results of operations for business segments. This process is subject to change and refinement over time. For more performance information related to our business segments, including the Other segment, see Note 22 of the Notes to Consolidated Financial Statements.
The following schedule summarizes selected financial information of our business segments. Ratios are calculated based on amounts in thousands.
ZIONS BANCORPORATION, NATIONAL ASSOCIATION AND SUBSIDIARIES
Schedule 13
SELECTED SEGMENT INFORMATION
| | | | | | | | | | | | | | | | | | | | | | | | | | | | | | | | | | | |
| (Dollar amounts in millions) | Zions Bank | | CB&T | | Amegy |
| 2023 | 2022 | 2021 | | 2023 | 2022 | 2021 | | 2023 | 2022 | 2021 |
| KEY FINANCIAL INFORMATION | | | | | | | | | | |
| Total average loans | $ | 14,298 | $ | 13,277 | $ | 13,198 | | $ | 14,128 | $ | 13,129 | $ | 12,892 | | $ | 12,851 | $ | 12,110 | $ | 12,189 |
| Total average deposits | 20,233 | 24,317 | 23,588 | | 14,253 | 16,160 | 15,796 | | 13,569 | 15,735 | 15,496 |
| Income before income taxes | 311 | 387 | 380 | | 282 | 314 | 405 | | 218 | 311 | 362 |
| CREDIT QUALITY | | | | | | | | | | | |
| Provision for credit losses | $ | 20 | $ | 43 | $ | (26) | | $ | 44 | $ | 49 | $ | (78) | | $ | 15 | $ | 5 | $ | (96) |
| Net loan and lease charge-offs (recoveries) | 19 | 29 | — | | 10 | 3 | — | | 5 | 3 | 2 |
Ratio of net charge-offs to average loans and leases | 0.13 | % | 0.22 | % | — | % | | 0.07 | % | 0.02 | % | — | % | | 0.04 | % | 0.02 | % | 0.02 | % |
| Allowance for credit losses | $ | 157 | $ | 155 | $ | 142 | | $ | 162 | $ | 122 | $ | 90 | | $ | 139 | $ | 122 | $ | 128 |
Ratio of allowance for credit losses to net loans and leases, at year-end | 1.10 | % | 1.17 | % | 1.08 | % | | 1.15 | % | 0.93 | % | 0.70 | % | | 1.08 | % | 1.01 | % | 1.05 | % |
| Nonperforming assets | $ | 26 | $ | 36 | $ | 84 | | $ | 82 | $ | 25 | $ | 41 | | $ | 35 | $ | 59 | $ | 90 |
Ratio of nonperforming assets to net loans and leases and other real estate owned | 0.18 | % | 0.26 | % | 0.65 | % | | 0.58 | % | 0.18 | % | 0.32 | % | | 0.27 | % | 0.46 | % | 0.77 | % |
|
|
| | | | | | | | | | | | | | | | | | | | | | | | | | | | | | | | | | | | | | | | | | | | | | | |
| (Dollar amounts in millions) | NBAZ | | NSB | | Vectra | | TCBW |
| 2023 | 2022 | 2021 | | 2023 | 2022 | 2021 | | 2023 | 2022 | 2021 | | 2023 | 2022 | 2021 |
| KEY FINANCIAL INFORMATION | | | | | | | | | | | | |
| Total average loans | $ | 5,318 | $ | 4,911 | $ | 4,849 | | $ | 3,392 | $ | 2,987 | $ | 3,015 | | $ | 4,004 | $ | 3,632 | $ | 3,414 | | $ | 1,705 | $ | 1,630 | $ | 1,569 |
| Total average deposits | 7,008 | 8,035 | 7,288 | | 6,964 | 7,436 | 6,691 | | 3,482 | 4,109 | 4,386 | | 1,196 | 1,571 | 1,537 |
Income before income taxes | 107 | 111 | 126 | | 23 | 76 | 89 | | 34 | 55 | 67 | | 38 | 45 | 41 |
| CREDIT QUALITY | | | | | | | | | | | | | | | |
Provision for credit losses | $ | 4 | $ | 11 | $ | (27) | | $ | 42 | $ | 4 | $ | (35) | | $ | 7 | $ | 9 | $ | (12) | | $ | 2 | $ | 1 | $ | (3) |
Net loan and lease charge-offs (recoveries) | 1 | (1) | (1) | | 3 | (2) | 1 | | 2 | 9 | — | | — | — | 1 |
Ratio of net charge-offs to average loans and leases | 0.02 | % | (0.02) | % | (0.02) | % | | 0.09 | % | (0.07) | % | 0.03 | % | | 0.05 | % | 0.25 | % | — | % | | — | % | — | % | 0.06 | % |
Allowance for credit losses | $ | 54 | $ | 40 | $ | 38 | | $ | 66 | $ | 27 | $ | 26 | | $ | 45 | $ | 36 | $ | 37 | | $ | 11 | $ | 9 | $ | 8 |
Ratio of allowance for credit losses to net loans and leases, at year-end | 1.02% | 0.81% | 0.79% | | 1.95% | 0.90% | 0.86% | | 1.12% | 0.99% | 1.08% | | 0.65% | 0.55% | 0.51% |
Nonperforming assets | $ | 12 | $ | 6 | $ | 11 | | $ | 46 | $ | 9 | $ | 24 | | $ | 16 | $ | 14 | $ | 18 | | $ | 8 | $ | — | $ | 1 |
Ratio of nonperforming assets to net loans and leases and other real estate owned | 0.21% | 0.12% | 0.24% | | 1.34% | 0.27% | 0.85% | | 0.40% | 0.36% | 0.53% | | 0.46% | —% | 0.06% |
| | | |
| | | |
All references below to domestic deposits by state are based on FDIC deposit market share data for full-service institutions with at least three branches at June 30, 2023.
Zions Bank
Zions Bank is headquartered in Salt Lake City, Utah, and conducts operations in Utah, Idaho, and Wyoming. As measured by domestic deposits in these states, Zions Bank was the largest full-service commercial bank in Utah and the fifth largest in Idaho.
ZIONS BANCORPORATION, NATIONAL ASSOCIATION AND SUBSIDIARIES
Zions Bank’s income before income taxes decreased $76 million, or 20%, during 2023. The decrease was due to a $45 million decrease in net interest income and a $62 million increase in noninterest expense, partially offset by a $23 million decrease in the provision for credit losses and an $8 million increase in noninterest income. The loan portfolio increased $852 million during 2023, including increases of $557 million and $424 million in consumer and commercial loans, respectively, and a decrease of $129 million in CRE loans. The ratio of ACL to net loans and leases decreased to 1.10% at December 31, 2023, compared with 1.17%. Nonperforming assets decreased $10 million, or 28%, from the prior year. Total deposits decreased 3% in 2023.
California Bank & Trust
California Bank & Trust is headquartered in San Diego, California. As measured by domestic deposits in the state, CB&T was the 17th largest full-service commercial bank in California.
CB&T’s income before income taxes decreased $32 million, or 10%, during 2023. The decrease was due to a $48 million increase in noninterest expense, partially offset by an $8 million increase in noninterest income, a $5 million decrease in the provision for credit losses, and a $3 million increase in net interest income. The loan portfolio increased $291 million during 2023, including increases of $243 million and $164 million in consumer and CRE loans, respectively, and a decrease of $116 million in commercial loans. The ratio of ACL to net loans and leases increased to 1.15% at December 31, 2023, compared with 0.93%. Nonperforming assets increased $57 million from the prior year, driven largely by two suburban office commercial real estate loans totaling $46 million. Total deposits increased 2% in 2023.
Amegy Bank
Amegy Bank is headquartered in Houston, Texas. As measured by domestic deposits in the state, Amegy was the 9th largest full-service commercial bank in Texas.
Amegy’s income before income taxes decreased $93 million, or 30%, during 2023. The decrease was due to a $60 million decrease in net interest income, a $49 million increase in noninterest expense, and a $10 million increase in the provision for credit losses, partially offset by a $26 million increase in noninterest income. The loan portfolio increased $237 million during 2023, including increases of $171 million and $156 million in CRE and consumer loans, respectively, and a decrease of $90 million in commercial loans. The ratio of ACL to net loans and leases increased to 1.08% at December 31, 2023, compared with 1.01%. Nonperforming assets decreased $24 million, or 41%, from the prior year. Total deposits increased 9% in 2023.
National Bank of Arizona
National Bank of Arizona is headquartered in Phoenix, Arizona. As measured by domestic deposits in the state, NBAZ was the fifth largest full-service commercial bank in Arizona.
NBAZ’s income before income taxes decreased $4 million, or 4%, during 2023. The decrease was due to a $22 million increase in noninterest expense and an $8 million decrease in noninterest income, partially offset by a $19 million increase in net interest income and a $7 million decrease in the provision for credit losses. The loan portfolio increased $509 million during 2023, including increases of $259 million, $177 million, and $73 million in CRE, consumer, and commercial loans, respectively. The ratio of ACL to net loans and leases increased to 1.02% at December 31, 2023, compared with 0.81%. Nonperforming assets increased $6 million from the prior year. Total deposits decreased 6% in 2023.
Nevada State Bank
Nevada State Bank is headquartered in Las Vegas, Nevada. As measured by domestic deposits in the state, NSB was the fifth largest full-service commercial bank in Nevada.
NSB’s income before income taxes decreased $53 million, or 70%, during 2023. The decrease was due to a $38 million increase in the provision for credit losses, a $20 million increase in noninterest expense, and a $3 million decrease in noninterest income, partially offset by an $8 million increase in net interest income. The loan
ZIONS BANCORPORATION, NATIONAL ASSOCIATION AND SUBSIDIARIES
portfolio increased $158 million during 2023, including increases of $104 million and $56 million in consumer and CRE loans, respectively, and a decrease of $2 million in commercial loans. The ratio of ACL to net loans and leases increased to 1.95% at December 31, 2023, compared with 0.90%. Nonperforming assets increased $37 million from the prior year. Total deposits increased 1% in 2023.
In July 2022, NSB purchased three Northern Nevada City National Bank branches and their associated deposit, credit card, and loan accounts. In addition to the three branches, the purchase included approximately $430 million in deposits and $95 million in commercial and consumer loans.
Vectra Bank Colorado
Vectra Bank Colorado is headquartered in Denver, Colorado. As measured by domestic deposits in the state, Vectra was the 14th largest full-service commercial bank in Colorado.
Vectra’s income before income taxes decreased $21 million, or 38%, during 2023. The decrease was due to a $17 million increase in noninterest expense, a $3 million decrease in noninterest income, and a $3 million decrease in net interest income, partially offset by a $2 million decrease in the provision for credit losses. The loan portfolio increased $114 million during 2023, including increases of $160 million and $43 million in consumer and CRE loans, respectively, and a decrease of $89 million in commercial loans. The ratio of ACL to net loans and leases increased to 1.12% at December 31, 2023, compared with 0.99%. Nonperforming assets increased $2 million, or 14%, from the prior year. Total deposits decreased 9% in 2023.
The Commerce Bank of Washington
The Commerce Bank of Washington is headquartered in Seattle, Washington, and operates in Washington under The Commerce Bank of Washington name and in Portland, Oregon, under The Commerce Bank of Oregon name. The FDIC deposit market share data at June 30, 2023 for TCBW in Washington and Oregon was not meaningful.
TCBW’s income before income taxes decreased $7 million, or 16%, during 2023. The decrease was due to a $3 million increase in noninterest expense, a $3 million decrease in net interest income, and a $1 million increase in the provision for credit losses. The loan portfolio decreased $14 million during 2023, including a decrease of $83 million in commercial loans, partially offset by increases of $68 million and $1 million in CRE and consumer loans, respectively. The ratio of ACL to net loans and leases increased to 0.65% at December 31, 2023, compared with 0.55%. Nonperforming assets increased $8 million from the prior year. Total deposits decreased 23% in 2023.
BALANCE SHEET ANALYSIS
Interest-earning Assets
Interest-earning assets have associated interest rates or yields, and generally consist of loans and leases, securities, and money market investments. We strive to maintain a high level of interest-earning assets relative to total assets. For more information regarding the average balances, associated revenue generated, and the respective yields of our interest-earning assets, see Schedule 6 on page 35.
ZIONS BANCORPORATION, NATIONAL ASSOCIATION AND SUBSIDIARIES
AVERAGE NET LOANS, SECURITIES, AND MONEY MARKET INVESTMENTS
(at December 31)
Investment Securities Portfolio
We invest in securities to actively manage liquidity and interest rate risk and to generate interest income. We primarily own securities that can readily provide us cash and liquidity through secured borrowing agreements without the need to sell the securities. We also manage the duration of our investment securities portfolio to help balance the inherent interest rate mismatch between loans and deposits, and to protect the economic value of shareholders’ equity. At December 31, 2023, the estimated duration of our securities portfolio decreased to 3.6 percent, compared with 4.1 percent at December 31, 2022, primarily due to the addition of fair value hedges of fixed-rate securities during the second quarter of 2023.
For information about our borrowing capacity associated with the investment securities portfolio and how we manage our liquidity risk, refer to the “Liquidity Risk Management” section on page 67. See also Note 3 and Note 5 of the Notes to Consolidated Financial Statements for more information on fair value measurements and the accounting for our investment securities portfolio.
ZIONS BANCORPORATION, NATIONAL ASSOCIATION AND SUBSIDIARIES
Schedule 14
INVESTMENT SECURITIES PORTFOLIO
| | | | | | | | | | | | | | | | | | | | | | | | | | | | | | | | | | | |
| December 31, 2023 | | December 31, 2022 |
| (In millions) | Par Value | | Amortized
cost | | Fair
value | | Par Value | | Amortized
cost | | Fair
value |
| Held-to-maturity | | | | | | | | | | | |
| U.S. Government agencies and corporations: | | | | | | | | | | | |
| Agency securities | $ | 93 | | | $ | 93 | | | $ | 87 | | | $ | 100 | | | $ | 100 | | | $ | 93 | |
Agency guaranteed mortgage-backed securities 1 | 11,966 | | | 9,935 | | | 10,041 | | | 12,921 | | | 10,621 | | | 10,772 | |
| Municipal securities | 354 | | | 354 | | | 338 | | | 404 | | | 405 | | | 374 | |
| Total held-to-maturity | 12,413 | | | 10,382 | | | 10,466 | | | 13,425 | | | 11,126 | | | 11,239 | |
| Available-for-sale | | | | | | | | | | | |
| U.S. Treasury securities | 585 | | | 585 | | | 492 | | | 555 | | | 557 | | | 393 | |
| U.S. Government agencies and corporations: | | | | | | | | | | | |
| Agency securities | 669 | | | 663 | | | 630 | | | 790 | | | 782 | | | 736 | |
| Agency guaranteed mortgage-backed securities | 8,460 | | | 8,530 | | | 7,291 | | | 9,566 | | | 9,652 | | | 8,367 | |
| Small Business Administration loan-backed securities | 535 | | | 571 | | | 546 | | | 691 | | | 740 | | | 712 | |
| Municipal securities | 1,269 | | | 1,385 | | | 1,318 | | | 1,571 | | | 1,732 | | | 1,634 | |
| Other debt securities | 25 | | | 25 | | | 23 | | | 75 | | | 75 | | | 73 | |
| Total available-for-sale | 11,543 | | | 11,759 | | | 10,300 | | | 13,248 | | | 13,538 | | | 11,915 | |
|
|
|
|
|
|
|
|
|
|
|
|
|
|
|
|
|
|
|
|
|
|
|
|
|
|
|
|
|
|
|
|
|
|
|
|
|
|
|
|
|
|
|
|
|
| % of
total
deposits | | |
| Deposits by type | | | | | | | | | | | | | | | | | |
| | | | 49.9 | % | | |
| Interest-bearing: | | | | | | | | | | | | | | | | | |
| | 46.7 | | | |
| | 2.1 | | | |
| | 1.3 | | | |
| 71,652 | | | 100.0 | % | | |
| Deposit-related metrics | | | | | | | | | | | | | | | | | |
| 33,589 | | | 47 | % | | |
| | 53 | % | | |
| 2,861 | | | 4 | % | | |
| | | | 1 Includes both insured and uninsured deposits.
Total deposits increased $3.3 billion, or 5%, in 2023. Interest-bearing deposits increased $12.8 billion, or 36%, and were partially offset by a decrease of $9.5 billion, or 27%, in noninterest-bearing demand deposits, as customers migrated to interest-bearing products in response to the higher interest rate environment. Our noninterest-bearing deposits are generally more valuable in a rising interest rate environment, creating meaningful economic value that is not fully reflected on our balance sheet since core deposits and related intangible assets are not recorded at fair value for accounting purposes.
At December 31, 2023, customer deposits (excluding brokered deposits) totaled $70.5 billion and included approximately $6.8 billion of reciprocal deposit products, where we distributed our customers’ deposits in a placement network to increase their FDIC insurance, and in return, we received a matching amount of deposits from other network banks.
At December 31, 2023, the total estimated amount of uninsured deposits was $33.2 billion, or 44%, of total deposits, compared with $38.1 billion, or 53%, of total deposits at December 31, 2022, respectively. Our loan-to-deposit ratio was 77%, compared with 78% for the same respective time periods.
See “Liquidity Risk Management” on page 67 for additional information on liquidity, including the ratio of available liquidity to uninsured deposits.
RISK MANAGEMENT
We engage in risk management practices to ensure prudent risk-taking and appropriate oversight. Risk management is an integral part of our operations and an essential determinant of our overall performance as one of our key strategic objectives.
We utilize the three lines of defense approach to risk management with responsibilities for each line of defense defined in our Risk Management Framework. The first line of defense represents units and functions throughout the Bank engaged in activities related to revenue generation, expense reduction, operational support, and technology services. These units and functions are accountable for owning and managing the risks associated with these activities. The second line of defense represents functions responsible for independently assessing and overseeing risk management activities. The third line of defense is our internal audit function that provides independent assessment of the effectiveness of the first and second lines of defense.
ZIONS BANCORPORATION, NATIONAL ASSOCIATION AND SUBSIDIARIES
In support of management’s efforts, the Board has established certain committees to oversee our risk management processes. The Audit Committee oversees financial reporting risk, and the ROC oversees the other risk management processes. The ROC meets on a regular basis to monitor and review ERM activities. As required by its charter, the ROC provides oversight for various ERM activities and approves ERM policies and activities as detailed in the ROC charter.
We employ various strategies to reduce the risks to which our operations are exposed, including credit risk, market and interest rate risk, liquidity risk, strategic and business risk, operational risk, technology risk, cybersecurity risk, capital/financial reporting risk, legal/compliance risk (including regulatory risk), and reputational risk. These risks are overseen by various management committees of which the Enterprise Risk Management Committee is the focal point.
Credit Risk Management
Credit risk is the possibility of loss from the failure of a borrower, guarantor, or another obligor to fully perform under the terms of a credit-related contract. Credit risk arises primarily from our lending activities, as well as from off-balance sheet credit instruments. The Board, through the ROC, is responsible for approving key credit policies. The ROC also oversees and monitors adherence to these policies and the credit risk appetite as defined in the Risk Management Framework. The Board has delegated responsibility for managing credit risk and approving changes to credit policies to the Chief Credit Officer, who chairs the Credit Risk Committee.
Credit policies, credit risk management, and credit examination functions inform and support the oversight of credit risk. Our credit policies emphasize strong underwriting standards and early detection of potential problem credits in order to develop and implement action plans on a timely basis to mitigate potential losses. These formal credit policies and procedures provide us with a framework for consistent underwriting and a basis for sound credit decisions at the local banking affiliate level. Policies include standards for sensitivity and scenario analyses that assess the resilience of the borrower, including the borrower’s ability to service the loan in a rising interest rate environment.
Our credit policies and practices are also designed to help manage potential risks, including those arising from environmental issues. Environmental risk related to our lending practices is primarily covered in our environmental credit policy and by our environmental subject matter experts and management. The extent of environmental due diligence performed by our environmental risk team is based on the risks identified at each property and the loan amount. The extension of credit to certain borrowers, or those connected with certain activities, may be restricted or require escalated approval, by policy, because of various environmental risks.
Our credit risk management function is separate from the lending function and strengthens control over, and the independent evaluation of, credit activities. In addition, we have a well-defined set of standards for evaluating our loan portfolio, and we utilize a comprehensive loan risk-grading system to determine the risk potential in the portfolio.
The internal credit examination department, which is independent of the lending function, periodically conducts examinations of our lending departments and credit activities. These examinations are designed to review credit quality, adequacy of documentation, appropriate loan risk-grading administration, and compliance with credit policies. Credit examinations related to the ACL are reported to both the Audit Committee and the ROC.
Our business activity is conducted primarily within the geographic footprint of our banking affiliates. We strive to avoid the risk of undue concentrations of credit in any particular industry, collateral type, location, or with any individual customer or counterparty. We have adopted and adhere to concentration limits on certain commercial industries, including leveraged lending, municipal lending, oil and gas-related lending, and various types of CRE lending, particularly construction and land development and office lending. Concentration limits are regularly monitored and revised as necessary.
ZIONS BANCORPORATION, NATIONAL ASSOCIATION AND SUBSIDIARIES
U.S. Government Agency Guaranteed Loans
We participate in various guaranteed lending programs sponsored by U.S. government agencies, such as the U.S. Small Business Administration (“SBA”), Federal Housing Authority, U.S. Department of Veterans Affairs, Export-Import Bank of the U.S., and the U.S. Department of Agriculture. At December 31, 2023, $554 million of related loans were guaranteed, primarily by the SBA, and included $77 million of Paycheck Protection Program (“PPP”) loans. The following schedule presents the composition of U.S. government agency guaranteed loans:
Schedule 22
U.S. GOVERNMENT AGENCY GUARANTEED LOANS
| | | | | | | | | | | | | | | | | | | | | | | |
| (Dollar amounts in millions) | December 31,
2023 | | Percent
guaranteed | | December 31,
2022 | | Percent
guaranteed |
| | | | | | | |
| Commercial | $ | 664 | | | 80 | % | | $ | 753 | | | 83 | % |
| Commercial real estate | 24 | | | 79 | | | 21 | | | 76 | |
| Consumer | 4 | | | 100 | | | 5 | | | 100 | |
| Total loans | $ | 692 | | | 80 | % | | $ | 779 | | | 83 | % |
Commercial Lending
The following schedule provides information regarding lending exposures to certain industries in our commercial lending portfolio:
Schedule 23
COMMERCIAL LENDING BY INDUSTRY GROUP 1
| | | | | | | | | | | | | | | | | | | | | | | |
| December 31, 2023 | | December 31, 2022 |
| (Dollar amounts in millions) | Amount | | Percent | | Amount | | Percent |
| | | | | | | |
| Retail trade | $ | 2,995 | | | 9.8 | % | | $ | 2,751 | | | 9.0 | % |
| Real estate, rental and leasing | 2,946 | | | 9.6 | | | 2,802 | | | 9.2 | |
| Finance and insurance | 2,918 | | | 9.5 | | | 2,992 | | | 9.8 | |
| Healthcare and social assistance | 2,527 | | | 8.3 | | | 2,373 | | | 7.8 | |
| Public Administration | 2,279 | | | 7.5 | | | 2,366 | | | 7.8 | |
| Manufacturing | 2,190 | | | 7.2 | | | 2,387 | | | 7.8 | |
| Wholesale trade | 1,850 | | | 6.0 | | | 1,880 | | | 6.2 | |
| Transportation and warehousing | 1,499 | | | 4.9 | | | 1,464 | | | 4.8 | |
Utilities 2 | 1,409 | | | 4.6 | | | 1,418 | | | 4.6 | |
| Construction | 1,355 | | | 4.4 | | | 1,355 | | | 4.4 | |
| Educational services | 1,298 | | | 4.2 | | | 1,302 | | | 4.3 | |
| Hospitality and food services | 1,180 | | | 3.9 | | | 1,238 | | | 4.1 | |
| Mining, quarrying, and oil and gas extraction | 1,133 | | | 3.7 | | | 1,349 | | | 4.4 | |
| Other Services (except Public Administration) | 1,047 | | | 3.4 | | | 1,041 | | | 3.4 | |
| Professional, scientific, and technical services | 1,010 | | | 3.3 | | | 995 | | | 3.3 | |
Other 3 | 2,952 | | | 9.7 | | | 2,782 | | | 9.1 | |
| Total | $ | 30,588 | | | 100.0 | % | | $ | 30,495 | | | 100.0 | % |
1 Industry groups are determined by North American Industry Classification System (“NAICS”) codes.
2 Includes primarily utilities, power, and renewable energy.
3 At December 31, 2023, no other industry group individually exceeded 3.3%.
Commercial Real Estate Loans
At December 31, 2023 and 2022, our CRE loan portfolio totaled $13.4 billion and $12.7 billion, respectively, representing 23% of the total loan portfolio for both periods. The majority of our CRE loans are secured by real estate primarily located within our geographic footprint.
ZIONS BANCORPORATION, NATIONAL ASSOCIATION AND SUBSIDIARIES
The following schedule presents the geographic distribution of our CRE loan portfolio based on the location of the primary collateral:
Schedule 24
COMMERCIAL REAL ESTATE LENDING BY COLLATERAL LOCATION
| | | | | | | | | | | | | | | | | | | | | | | |
| December 31, 2023 | | December 31, 2022 |
| (Dollar amounts in millions) | Amount | | Percent | | Amount | | Percent |
| | | | | | | |
| Arizona | $ | 1,726 | | | 12.9 | % | | $ | 1,521 | | | 11.9 | % |
| California | 3,865 | | | 28.9 | | | 3,805 | | | 29.9 | |
| Colorado | 709 | | | 5.3 | | | 637 | | | 5.0 | |
| Nevada | 1,072 | | | 8.0 | | | 910 | | | 7.1 | |
| Texas | 2,385 | | | 17.8 | | | 2,139 | | | 16.8 | |
| Utah/Idaho | 2,214 | | | 16.6 | | | 2,397 | | | 18.8 | |
| Washington/Oregon | 1,004 | | | 7.5 | | | 899 | | | 7.1 | |
| Other | 396 | | | 3.0 | | | 431 | | | 3.4 | |
| Total CRE | $ | 13,371 | | | 100.0 | % | | $ | 12,739 | | | 100.0 | % |
Term CRE loans generally mature within a three- to seven-year period and consist of full, partial, and non-recourse guarantee structures. Typical term CRE loan structures include annually tested operating covenants that require loan rebalancing based on minimum debt service coverage, debt yield, or loan-to-value tests. Construction and land development loans generally mature in 18 to 36 months and contain full or partial recourse guarantee structures with one- to five-year extension options or roll-to-perm options that often result in term loans. At December 31, 2023, approximately 83% of our CRE loan portfolio was variable-rate, and approximately 22% of these variable-rate loans were swapped to a fixed rate.
The following schedule provides information regarding lending exposures to certain collateral types in our commercial real estate lending portfolio:
Schedule 25
COMMERCIAL REAL ESTATE LENDING BY COLLATERAL TYPE
| | | | | | | | | | | | | | | | | | | | | | | |
| December 31, 2023 | | December 31, 2022 |
| (Dollar amounts in millions) | Amount | | Percent | | Amount | | Percent |
| Commercial property | | | | | | | |
| Multi-family | $ | 3,709 | | | 27.7 | % | | $ | 3,068 | | | 24.1 | % |
| Industrial | 3,062 | | | 22.9 | | | 2,509 | | | 19.7 | |
| Office | 1,984 | | | 14.8 | | | 2,281 | | | 17.9 | |
| Retail | 1,503 | | | 11.2 | | | 1,529 | | | 12.0 | |
| Hospitality | 688 | | | 5.2 | | | 695 | | | 5.4 | |
| Land | 211 | | | 1.6 | | | 276 | | | 2.2 | |
Other 1 | 1,682 | | | 12.6 | | | 1,728 | | | 13.5 | |
Residential property 2 | | | | | | | |
| Single family | 287 | | | 2.1 | | | 340 | | | 2.7 | |
| Land | 90 | | | 0.7 | | | 75 | | | 0.6 | |
| Condo/Townhome | 37 | | | 0.3 | | | 13 | | | 0.1 | |
Other 1 | 118 | | | 0.9 | | | 225 | | | 1.8 | |
| Total | $ | 13,371 | | | 100.0 | % | | $ | 12,739 | | | 100.0 | % |
1 Included in the total amount of the “Other” category was approximately $202 million and $301 million of unsecured loans at December 31, 2023 and 2022, respectively.
2 Residential property collateral type consists primarily of loans provided to commercial homebuilders for single-family housing developments, land and lots, and condo/townhome developments.
ZIONS BANCORPORATION, NATIONAL ASSOCIATION AND SUBSIDIARIES
Underwriting on commercial properties is primarily based on the economic viability of the project with significant consideration given to the creditworthiness and experience of the sponsor. We generally require that the owner’s equity be injected prior to any advances. Re-margining requirements (required equity infusions upon a decline in value or cash flow of the collateral) are often included in the loan agreement along with guarantees of the sponsor.
Within the residential construction and development sector, many of the requirements previously mentioned, such as creditworthiness and experience of the developer, up-front injection of the developer’s equity, principal curtailment requirements, and the viability of the project are also important in underwriting a residential development loan. Consideration is given to the expected market acceptance of the product, location, strength of the developer, and the ability of the developer to stay within budget. Progress inspections by qualified independent inspectors are routinely performed before disbursing loan funds. Advance rates will vary based on the collateral, viability of the project, and the creditworthiness of the sponsor, with exceptions granted on a case-by-case basis.
Real estate appraisals are performed in accordance with regulatory guidelines and are validated independently of the loan officer and the borrower, generally by our internal appraisal review team. In some cases, reports from automated valuation services are used or internal evaluations are performed. A new appraisal or evaluation is required when a loan deteriorates to a certain level of credit weakness.
Loan agreements require regular reporting of financial information on the project and the sponsor in addition to lease schedules, rent rolls and, on construction projects, independent progress inspection reports. We monitor this financial information to ensure adherence to covenants set forth in the loan agreement.
The existence of a guarantee that improves the likelihood of repayment is taken into consideration when evaluating CRE loans for expected losses. If guarantor support is quantifiable and documented, it is considered in the potential cash flows and liquidity available for debt repayment. Our expected loss methodology also considers these sources of repayment. In general, we obtain and evaluate updated financial information for the guarantor as part of our determination to extend credit. The quality and frequency of financial reporting collected and analyzed varies depending on the contractual requirements for reporting, the size of the transaction, and the strength of the guarantor.
In the event of default, we pursue any and all available sources of repayment, including from collateral and guarantors. A number of factors are considered when deciding whether to pursue a guarantor, including, but not limited to, the value and liquidity of other sources of repayment (collateral), the financial strength and liquidity of the guarantor, possible statutory limitations, and the overall cost of pursuing a guarantee versus the amount we are likely to recover.
Our CRE portfolio is diversified across geography and collateral type, with the largest concentration in multi-family. We provide additional analysis of our office CRE portfolio below in view of increased investor interest in that collateral type in recent periods.
Office CRE loan portfolio
At December 31, 2023 and December 31, 2022, our office CRE loan portfolio totaled $2.0 billion and $2.3 billion, representing 15% and 18% of the total CRE loan portfolio, respectively. Approximately 26% of the office CRE loan portfolio is scheduled to mature in the next 12 months. The following schedule presents the composition of our office CRE loan portfolio and other related credit quality metrics:
ZIONS BANCORPORATION, NATIONAL ASSOCIATION AND SUBSIDIARIES
Schedule 26
OFFICE CRE LOAN PORTFOLIO
| | | | | | | | | | | |
| (Dollar amounts in millions) | December 31, 2023 | | December 31, 2022 |
| Office CRE | | | |
| Construction and land development | $ | 191 | | | $ | 208 | |
| Term | 1,793 | | | 2,073 | |
| Total office CRE | $ | 1,984 | | | $ | 2,281 | |
| Credit quality metrics | | | |
| Criticized loan ratio | 11.9 | % | | 7.2 | % |
| Classified loan ratio | 8.9 | % | | 5.8 | % |
| Nonaccrual loan ratio | 2.4 | % | | — | % |
| Delinquency ratio | 2.3 | % | | 1.5 | % |
| Ratio of net loan and lease charge-offs | 0.2 | % | | — | % |
| Ratio of allowance for credit losses to office CRE loans, at period end | 3.80 | % | | 1.36 | % |
The following schedules present our office CRE loan portfolio by collateral location for the periods presented:
Schedule 27
OFFICE CRE LOAN PORTFOLIO BY COLLATERAL LOCATION
| | | | | | | | | | | | | | | | | | | | | | | | | | | | | | | | | | | | | | | | | | | | | | | | | | | | | | | | |
| (Dollar amounts in millions) | | December 31, 2023 |
| Collateral Location | | |
| Loan type | | Arizona | | California | | Colorado | | Nevada | | Texas | | Utah/
Idaho | | Wash-ington | | Other 1 | | Total |
| Office CRE | | | | | | | | | | | | | | | | | | |
| Construction and land development | | $ | — | | | $ | 64 | | | $ | — | | | $ | 2 | | | $ | 22 | | | $ | 29 | | | $ | 74 | | | $ | — | | | $ | 191 | |
| Term | | 281 | | | 412 | | | 92 | | | 86 | | | 179 | | | 488 | | | 226 | | | 29 | | | 1,793 | |
Total Office CRE | | $ | 281 | | | $ | 476 | | | $ | 92 | | | $ | 88 | | | $ | 201 | | | $ | 517 | | | $ | 300 | | | $ | 29 | | | $ | 1,984 | |
| % of total | | 14.2 | % | | 24.0 | % | | 4.6 | % | | 4.4 | % | | 10.1 | % | | 26.1 | % | | 15.1 | % | | 1.5 | % | | 100.0 | % |
| | | | | | |
| | | | | | |
| | | | | | |
| | | | | | |
| | | | | | |
| | | | | | |
| | | | | | |
| | | | | | | | | | | | | | | | | | | | | | | | | | | | | | | | | | | | | | | | | | | | | | | | | | | | | | | | |
| (Dollar amounts in millions) | | December 31, 2022 |
| Collateral Location | | |
| Loan type | | Arizona | | California | | Colorado | | Nevada | | Texas | | Utah/
Idaho | | Wash-ington | | Other 1 | | Total |
| Office CRE | | | | | | | | | | | | | | | | | | |
| Construction and land development | | $ | 8 | | | $ | 79 | | | $ | — | | | $ | 2 | | | $ | — | | | $ | 18 | | | $ | 101 | | | $ | — | | | $ | 208 | |
| Term | | 295 | | | 525 | | | 97 | | | 99 | | | 217 | | | 613 | | | 195 | | | 32 | | | 2,073 | |
Total Office CRE | | $ | 303 | | | $ | 604 | | | $ | 97 | | | $ | 101 | | | $ | 217 | | | $ | 631 | | | $ | 296 | | | $ | 32 | | | $ | 2,281 | |
| % of total | | 13.1 | % | | 27.0 | % | | 4.3 | % | | 4.3 | % | | 9.6 | % | | 26.8 | % | | 13.5 | % | | 1.4 | % | | 100.0 | % |
| | | | | | |
| | | | | | |
| | | | | | |
| | | | | | |
| | | | | | |
| | | | | | |
| | | | | | |
1 No other geography exceeds $17 million and $18 million at December 31, 2023 and December 31, 2022, respectively.
Consumer Loans
We originate first-lien residential home mortgages considered to be of prime quality. We generally hold variable-rate loans in our portfolio and sell “conforming” fixed-rate loans to third parties, including Federal National Mortgage Association and Federal Home Loan Mortgage Corporation, for which we make representations and warranties that the loans meet certain underwriting and collateral documentation standards.
During 2023, consumer loans increased $1.4 billion, primarily in the 1-4 family residential and consumer construction loan portfolios. Increased funding of construction lending commitments contributed to growth in these portfolios, although the rate of growth slowed in the latter half of the year.
ZIONS BANCORPORATION, NATIONAL ASSOCIATION AND SUBSIDIARIES
We also originate home equity credit lines (“HECLs”). At December 31, 2023 and December 31, 2022, our HECL portfolio totaled $3.4 billion for both periods. Approximately 39% and 44% of our HECLs are secured by first liens for the same respective time periods.
At December 31, 2023, loans representing less than 1% of the outstanding balance in the HECL portfolio were estimated to have combined loan-to-value (“CLTV”) ratios above 100%. An estimated CLTV ratio is the ratio of our loan plus any prior lien amounts divided by the estimated current collateral value. At origination, underwriting standards for the HECL portfolio generally include a maximum 80% CLTV with a Fair Isaac Corporation (“FICO”) credit score greater than 700.
Approximately 90% of our HECL portfolio is still in the draw period, and about 18% of those loans are scheduled to begin amortizing within the next five years. We believe the risk of loss and borrower default in the event of a loan becoming fully amortizing and the effect of significant interest rate changes is low, given the rate shock analysis performed at origination. The ratio of HECL net charge-offs (recoveries) for the trailing twelve months to average balances at December 31, 2023 and December 31, 2022, was 0.05% and (0.03)%, respectively. See Note 6 of the Notes to Consolidated Financial Statements for additional information on the credit quality of the HECL portfolio.
Nonperforming Assets
Nonperforming assets include nonaccrual loans and other real estate owned (“OREO”) or foreclosed properties. The following schedule presents our nonperforming assets:
ZIONS BANCORPORATION, NATIONAL ASSOCIATION AND SUBSIDIARIES
Schedule 28
NONPERFORMING ASSETS
| | | | | | | | | | | | | | | | |
| (Dollar amounts in millions) | December 31, | | | | | |
| 2023 | | 2022 | | | | | |
| Nonaccrual loans: | | | | | | | | |
| Loans held for sale | $ | — | | | $ | — | | | | | | |
| Commercial: | | | | | | | | |
| Commercial and industrial | 82 | | | 63 | | | | | | |
| Leasing | 2 | | | — | | | | | | |
| Owner-occupied | 20 | | | 24 | | | | | | |
| Municipal | — | | | — | | | | | | |
| Commercial real estate: | | | | | | | | |
| Construction and land development | 22 | | | — | | | | | | |
| Term | 39 | | | 14 | | | | | | |
| Consumer: | | | | | | | | |
| Real estate | 57 | | | 48 | | | | | | |
| Other | — | | | — | | | | | | |
| Nonaccrual loans | 222 | | | 149 | | | | | | |
Other real estate owned 1: | | | | | | | | |
| Commercial: | | | | | | | | |
| Commercial properties | 4 | | | — | | | | | | |
| Developed land | — | | | — | | | | | | |
| Land | 2 | | | — | | | | | | |
| Residential: | | | | | | | | |
| 1-4 family | — | | | — | | | | | | |
|
|
| Other real estate owned | 6 | | | — | | | | | | |
| Total nonperforming assets | $ | 228 | | | $ | 149 | | | | | | |
| Accruing loans past due 90 days or more: | | | | | | | | |
| Commercial: | $ | 2 | | | $ | 5 | | | | | | |
| Commercial real estate | — | | | — | | | | | | |
| Consumer | 1 | | | 1 | | | | | | |
| Total | $ | 3 | | | $ | 6 | | | | | | |
Ratio of nonaccrual loans to net loans and leases 2 | 0.38 | % | | 0.27 | % | | | | | |
Ratio of nonperforming assets to net loans and leases2 and other real estate owned | 0.39 | % | | 0.27 | % | | | | | |
Ratio of accruing loans past due 90 days or more to net loans and leases 2 | 0.01 | % | | 0.01 | % | | | | | |
|
|
|
For additional information regarding loan modifications to borrowers experiencing financial difficulty, including information related to TDRs prior to our adoption of ASU 2022-02, see Note 6 of the Notes to Consolidated Financial Statements.
Allowance for Credit Losses
The ACL includes the ALLL and the RULC. The ACL represents our estimate of current expected credit losses related to the loan and lease portfolio and unfunded lending commitments as of the balance sheet date. To determine the adequacy of the allowance, our loan and lease portfolio is segmented based on loan type.
The RULC is a reserve for potential losses associated with off-balance sheet commitments and is included in “Other liabilities” on the consolidated balance sheet. Any related increases or decreases in the reserve are included in “Provision for unfunded lending commitments” on the consolidated statement of income.
The following schedules present the changes in, and allocation of, the ACL:
ZIONS BANCORPORATION, NATIONAL ASSOCIATION AND SUBSIDIARIES
Schedule 30
CHANGES IN THE ALLOWANCE FOR CREDIT LOSSES
| | | | | | | | | | | | | | | | | | | | |
| Year Ended December 31, | | | |
| (Dollar amounts in millions) | 2023 | | 2022 | | 2021 | | | |
| | | | | | | | |
| Loans and leases outstanding, | $ | 57,779 | | $ | 55,653 | | $ | 50,851 | | | |
| Average loans and leases outstanding: | | | | | | | | |
| Commercial | 30,519 | | 29,225 | | 29,580 | | | |
| Commercial real estate | 13,023 | | 12,251 | | 12,136 | | | |
| Consumer | 13,198 | | 11,122 | | 10,267 | | | |
| Total average loans and leases outstanding | $ | 56,740 | | $ | 52,598 | | $ | 51,983 | | | |
| Allowance for loan and lease losses: | | | | | | | | |
Balance at beginning of year 1, 2 | $ | 572 | | | $ | 513 | | | $ | 777 | | | | |
| Provision for loan losses | 148 | | | 101 | | | (258) | | | | |
| Charge-offs: | | | | | | | | |
| Commercial | 45 | | | 72 | | | 35 | | | | |
| Commercial real estate | 3 | | | — | | | — | | | | |
| Consumer | 14 | | | 10 | | | 13 | | | | |
| Total | 62 | | | 82 | | | 48 | | | | |
| Recoveries: | | | | | | | | |
| Commercial | 20 | | | 32 | | | 29 | | | | |
| Commercial real estate | — | | | — | | | 3 | | | | |
| Consumer | 6 | | | 11 | | | 10 | | | | |
| Total | 26 | | | 43 | | | 42 | | | | |
| Net loan and lease charge-offs | 36 | | | 39 | | | 6 | | | | |
| Balance at end of year | $ | 684 | | | $ | 575 | | | $ | 513 | | | | |
| Reserve for unfunded lending commitments: | | | | | | | | |
Balance at beginning of year 1, 2 | $ | 61 | | | $ | 40 | | | $ | 58 | | | | |
| Provision for unfunded lending commitments | (16) | | | 21 | | | (18) | | | | |
| Balance at end of year | $ | 45 | | | $ | 61 | | | $ | 40 | | | | |
| Total allowance for credit losses: | | | | | | | | |
| Allowance for loan and lease losses | $ | 684 | | | $ | 575 | | | $ | 513 | | | | |
| Reserve for unfunded lending commitments | 45 | | | 61 | | | 40 | | | | |
| Total allowance for credit losses | $ | 729 | | | $ | 636 | | | $ | 553 | | | | |
| | | | | | | | |
| Ratio of allowance for credit losses to net loans and leases | 1.26 | % | | 1.14 | % | | 1.09 | % | | | |
| Ratio of allowance for credit losses to nonaccrual loans | 328 | % | | 427 | % | | 204 | % | | | |
| Ratio of allowance for credit losses to nonaccrual loans and accruing loans past due 90 days or more | 324 | % | | 410 | % | | 198 | % | | | |
| Ratio of total net charge-offs to average total loans and leases | 0.06 | % | | 0.07 | % | | 0.01 | % | | | |
| Ratio of commercial net charge-offs to average commercial loans | 0.08 | % | | 0.14 | % | | 0.02 | % | | | |
| Ratio of commercial real estate net charge-offs to average commercial real estate loans | 0.02 | % | | — | % | | (0.02) | % | | | |
| Ratio of consumer net charge-offs to average consumer loans | 0.06 | % | | (0.01) | % | | 0.03 | % | | | |
1 Beginning balances at January 1, 2020 for the allowance for loan and lease losses and reserve for unfunded lending commitments do not agree to their respective ending balances at December 31, 2019 because of the adoption of the CECL accounting standard.
2 The beginning balance at January 1, 2023 for the allowance for loan and lease losses and reserve for unfunded lending commitments do not agree to the ending balance at December 31, 2022 because of the adoption of the new accounting standard related to loan modifications to borrowers experiencing financial difficulties.
ZIONS BANCORPORATION, NATIONAL ASSOCIATION AND SUBSIDIARIES
Schedule 31
ALLOCATION OF THE ALLOWANCE FOR CREDIT LOSSES
| | | | | | | | | | | | | | | | | | | | | | | | | | | | | | | | | | | | | |
| December 31, | | |
| 2023 | | 2022 | | 2021 | | | |
| (Dollar amounts in millions) | % of total loans | | Allocation of ACL | | % of total loans | | Allocation of ACL | | % of total loans | | Allocation of ACL |
| Loan segment | | | | | | | | | | | | | |
| Commercial | 53.0 | % | | $ | 321 | | | 54.8 | % | | $ | 316 | | | 55.9 | % | | $ | 330 | | | |
Commercial real estate | 23.1 | | | 258 | | | 22.9 | | | 189 | | | 24.0 | | | 118 | | | |
| Consumer | 23.9 | | | 150 | | | 22.3 | | | 131 | | | 20.1 | | | 105 | | | |
| Total | 100.0 | % | | $ | 729 | | | 100.0 | % | | $ | 636 | | | 100.0 | % | | $ | 553 | | | |
| December 31, 2022 |
| | | |
|
| 1.9% | | 3.1% | | 2.8% |
The effective duration of the deposits has shortened considerably due to faster deposit repricing.
As noted previously, we utilize derivatives to manage interest rate risk. The following schedule presents derivatives that are designated in qualifying hedging relationships at December 31, 2023. Included are the average outstanding derivative notional amounts for each period presented and the weighted average fixed-rate paid or received for each category of cash flow and fair value hedge. Fair value hedges of assets include $2.5 billion in notional of hedges of AFS securities designated under the portfolio layer method that were added during the second quarter of 2023. See Note 7 of the Notes to Consolidated Financial Statements for additional information regarding the impact of these hedging relationships on interest income and expense.
ZIONS BANCORPORATION, NATIONAL ASSOCIATION AND SUBSIDIARIES
Schedule 33
DERIVATIVES DESIGNATED IN QUALIFYING HEDGING RELATIONSHIPS
| | | | | | | | | | | | | | | | | | | | | | | | | | | | | | | | | | | | | | | | | | | | | | | | | | | | | | | | | | | | | | | | |
| 2024 | | 2025 | | 2026 | | 2027 | | | | | |
| (Dollar amounts in millions) | First Quarter | | Second Quarter | | Third Quarter | | Fourth Quarter | | First Quarter | | Second Quarter | | Third Quarter | | Fourth Quarter | | | | | | | |
| Cash flow hedges | | | | | | | | | | | | | | | | | | | | | | | | |
Cash flow hedges of assets 1 | | | | | | | | | | | | | | | | | | | | | | | | |
| Average outstanding notional | $ | 1,017 | | $ | 683 | | $ | 350 | | $ | 350 | | $ | 350 | | $ | 350 | | $ | 350 | | $ | 300 | | $ | 108 | | $ | 100 | | | | | |
| Weighted-average fixed-rate received | 2.50 | % | | 2.55 | % | | 2.34 | % | | 2.34 | % | | 2.34 | % | | 2.34 | % | | 2.34 | % | | 2.13 | % | | 1.65 | % | | 1.65 | % | | | | | |
Cash flow hedges of liabilities 2 | | | | | | | | | | | | | | | | | | | | | | | | |
| Average outstanding notional | $ | 500 | | $ | 500 | | $ | 500 | | $ | 500 | | $ | 500 | | $ | 500 | | $ | — | | $ | — | | $ | — | | $ | — | | | | | |
| Weighted-average fixed-rate paid | 3.67 | % | | 3.67 | % | | 3.67 | % | | 3.67 | % | | 3.67 | % | | 3.67 | % | | — | % | | — | % | | — | % | | — | % | | | | | |
| 2024 | | 2025 | | 2026 | | 2027 | | 2028 | | 2029 | | 2030 | | 2031 | | 2032 | | 2033 | | | | | |
| Fair value hedges | | | | | | | | | | | | | | | | | | | | | | | | |
| | | | | | | | | | | | | | | |
| | | | | | | | | | | | | | | |
| | | | | | | | | | | | | | | |
Fair value hedges of assets 3 | | | | | | | | | | | | | | | | | | | | | | | | |
| Average outstanding notional | $ | 4,444 | | $ | 4,558 | | $ | 4,562 | | $ | 4,558 | | $ | 2,428 | | $ | 1,049 | | $ | 1,044 | | $ | 1,037 | | $ | 1,001 | | $ | 973 | | | | | |
| Weighted-average fixed-rate paid | 3.24 | % | | 3.21 | % | | 3.21 | % | | 3.21 | % | | 2.47 | % | | 1.84 | % | | 1.83 | % | | 1.83 | % | | 1.83 | % | | 1.82 | % | | | | | |
| | | | | | | | | | | | | | | |
| | | | | | | | | | | | | | | |
| | | | | | | | | | | | | | | |
| | | | | | | | | | | | | | | |
1 Cash flow hedges of assets consist of receive-fixed swaps hedging pools of floating-rate loans. The longest dated cash flow hedge matures in February 2027. Amounts for 2027 have not been prorated to reflect this hedge maturing during the period.
2 Cash flow hedges of liabilities consists of a pay-fixed swaps hedging rolling FHLB advances. This swap matures in May of 2025.
3 Fair value asset hedges consist of pay-fixed swaps hedging fixed-rate AFS securities and fixed-rate commercial loans, as further discussed in Note 7 of the Notes to Consolidated Financial Statements. Increasing notional amounts are due to forward starting swaps.
At December 31, 2023, we had receive-fixed interest rate swaps with an aggregate notional amount of $1.5 billion designated as cash flow hedges of the variability of interest receipts on floating-rate commercial loans. During 2023, we terminated receive-fixed swaps with an aggregate notional amount of $5.0 billion. At December 31, 2023, we had $201 million of net losses deferred in AOCI related to terminated cash flow hedges. Amounts deferred in AOCI from terminated cash flow hedges will be amortized into interest income on a straight-line basis through the original maturity dates of the hedges as long as the hedged forecasted transactions continue to be expected to occur.
The following schedule summarizes amounts deferred in AOCI related to terminated cash flow hedges that will be fully reclassified into interest income by the fourth quarter of 2027:
Schedule 34
SCHEDULED OCI AMORTIZATION FOR TERMINATED CASH FLOW HEDGES
| | | | | | | | | | | | | | | | | | | | | | | | | | | | | | | | | | | | | | | | | | | | | | | | | | | | | | | | | | | |
| 2024 | | 2025 | | 2026 | | 2027 |
| (Dollar amounts in millions) | First Quarter | | Second Quarter | | Third Quarter | | Fourth Quarter | | First Quarter | | Second Quarter | | Third Quarter | | Fourth Quarter | | |
| Cash flow hedges | | | | | | | | | | | | | | | | | | | |
| Cash flow hedges of assets | | | | | | | | | | | | | | | | | | | |
| Periodic amortization of deferred gains (losses) | $ | (28) | | $ | (28) | | $ | (28) | | $ | (23) | | $ | (18) | | $ | (16) | | $ | (13) | | $ | (11) | | $ | (29) | | $ | (8) |
| | | | | | | |
Earnings at Risk (EaR) and Economic Value of Equity (EVE)
Incorporating our deposit assumptions and the impact of derivatives in qualifying hedging relationships previously discussed, the following schedule presents earnings at risk (“EaR”), or the percentage change in 12-month forward-looking net interest income, and our estimated percentage change in EVE. Both EaR and EVE are based on a static balance sheet size under parallel interest rate changes ranging from -100 bps to +300 bps. These measures highlight the sensitivity to changes in interest rates across various scenarios; the outcomes are not intended to be forecasts of expected net interest income.
ZIONS BANCORPORATION, NATIONAL ASSOCIATION AND SUBSIDIARIES
Schedule 35
INCOME SIMULATION – CHANGE IN NET INTEREST INCOME AND CHANGE IN ECONOMIC VALUE OF EQUITY
| | | | | | | | | | | | | | | | | | | | | | | | | | | | | | | | | | | | | | | | | | | | | | | | | | | | | | | | | | | | | | |
| | December 31, 2023 | | December 31, 2022 |
| | Parallel shift in rates (in bps) | | Parallel shift in rates (in bps) |
| Repricing scenario | | -100 | | 0 | | +100 | | +200 | | +300 | | -100 | | 0 | | +100 | | +200 | | +300 |
| | | | | | |
Earnings at Risk (EaR) | | (2.5) | % | | — | % | | 2.4 | % | | 4.9 | % | | 7.4 | % | | (2.4) | % | | — | % | | 2.4 | % | | 4.8 | % | | 7.1 | % |
Economic Value of Equity (EVE) | | 2.8 | % | | — | % | | (1.4) | % | | (3.3) | % | | (5.2) | % | | 2.0 | % | | — | % | | (1.1) | % | | (2.3) | % | | (3.7) | % |
| | | | | | | | |
| | | | | | |
| | | | | | | | |
| | | | | | | | |
The asset sensitivity, as measured by EaR, increased slightly during 2023, primarily due to an increase in pay-fixed interest rate swap notional, partially offset by deposit migration from low beta products (e.g., checking accounts) to high beta products (e.g., money market accounts). Under our current deposit assumptions, interest rate risk remains within policy limits. For interest-bearing deposits with indeterminable maturities, the weighted average modeled beta is 53%.
Prepayment assumptions are an important factor in how we manage interest rate risk. Certain assets in our portfolio, such as 1-4 family residential mortgages and mortgage-backed securities, can be prepaid at any time by the borrower, which may significantly affect our expected cash flows. At December 31, 2023, lifetime prepayment speeds on loans and mortgage-backed securities were estimated to be 8.7% and 6.1%, respectively.
The EaR analysis focuses on parallel rate shocks across the term structure of benchmark interest rates. In a non-parallel rate scenario where shorter-term rates increase slightly, but the ten-year rate increases by 200 bps, the increase in EaR would be approximately 50 percent larger than the change associated with the parallel +200 bps rate change.
EaR has inherent limitations in describing expected changes in net interest income in rapidly changing interest rate environments due to a lag in asset and liability repricing behavior. As such, we expect net interest income to change due to “latent” and “emergent” interest rate sensitivity. Unlike EaR, which measures net interest income over 12 months, latent and emergent interest rate sensitivity explains changes in current quarter net interest income, compared with expected net interest income in the same quarter one year forward.
Latent interest rate sensitivity refers to future changes in net interest income based upon past rate movements that have yet to be fully recognized in revenue, but will be recognized over the near term. We expect latent sensitivity to increase net interest income by approximately 1% at December 31, 2024, compared with December 31, 2023.
Emergent interest rate sensitivity refers to future changes in net interest income based upon future interest rate movements and is measured from the latent level of net interest income. If interest rates rise consistent with the forward curve at December 31, 2023, we expect emergent sensitivity to increase net interest income by approximately 1% from the latent sensitivity level, for a cumulative 2% increase in net interest income.
Our focus on business banking also plays a significant role in determining the nature of our asset-liability management posture. At December 31, 2023, $26.3 billion of our commercial lending and CRE loan balances were scheduled to reprice in the next six months. For these variable-rate loans, we have executed $1.5 billion of cash flow hedges by receiving fixed rates on interest rate swaps. At December 31, 2023, we also had $3.7 billion of variable-rate consumer loans scheduled to reprice in the next six months. The impact on asset sensitivity from commercial or consumer loans with floors has become insignificant as rates have risen. See Notes 3 and 7 of the Notes to Consolidated Financial Statements for additional information regarding derivative instruments.
ZIONS BANCORPORATION, NATIONAL ASSOCIATION AND SUBSIDIARIES
LIBOR Transition
The London Interbank Offered Rate (“LIBOR”) was phased out globally, and banks migrated to alternative reference rates by June 30, 2023. We implemented processes, procedures, and systems to mitigate contract risk. We believe we have remediated our LIBOR exposure through fallback language, replacement indices, and reliance upon the provisions under the LIBOR Act.
Market Risk — Fixed Income
We are exposed to market risk through changes in fair value. This includes market risk for trading securities and for interest rate swaps used to hedge interest rate risk. We underwrite municipal and corporate securities. We also trade municipal, agency, and treasury securities. This underwriting and trading activity exposes us to a risk of loss arising from adverse changes in the prices of these fixed-income securities.
Changes in the fair value of AFS securities and in interest rate swaps that qualify as cash flow hedges are included in AOCI for each financial reporting period. During 2023, the $66 million after-tax decrease in AOCI loss related to investment securities was driven largely by paydowns on the AFS securities. For more discussion regarding investment securities and AOCI, see the “Capital Management” section on page 72. See also Note 5 of the Notes to Consolidated Financial Statements for further information regarding the accounting for investment securities.
Market Risk — Equity Investments
Through our equity investment activities, we own equity securities that are publicly traded. In addition, we own equity securities in governmental entities and companies, e.g., FRB and the FHLB, that are not publicly traded. Equity investments may be accounted for at cost less impairment and adjusted for observable price changes, fair value, the equity method, or proportional or full consolidation methods of accounting, depending on our ownership position and degree of influence over the investees’ business. Regardless of the accounting method, the values of our investments are subject to fluctuation. Because the fair value of these securities may fall below the cost at which we acquired them, we are exposed to the possibility of loss. Equity investments in private and public companies are evaluated, monitored, and approved by members of management in our Equity Investments Committee and Securities Valuation Committee.
We hold both direct and indirect investments in predominantly pre-public companies, primarily through various SBIC venture capital funds as a strategy to provide beneficial financing, growth, and expansion opportunities to diverse businesses generally in communities within our geographic footprint. Our equity exposure to these investments was approximately $190 million and $172 million at December 31, 2023 and December 31, 2022, respectively. On occasion, some of the companies within our SBIC portfolio may issue an initial public offering (“IPO”). In this case, the fund is generally subject to a lockout period before we can liquidate the investment, which can introduce additional market risk. See Note 3 of the Notes to Consolidated Financial Statements for additional information regarding the valuation of our SBIC investments.
Liquidity Risk Management
Liquidity refers to our ability to meet our cash, contractual, and collateral obligations, and to manage both expected and unexpected cash flows without adversely impacting our operations or financial strength. We manage our liquidity to provide funds for our customers’ credit needs, our anticipated financial and contractual obligations, and other corporate activities. Sources of liquidity include deposits, borrowings, and equity. Our investment securities are primarily held as a source of contingent liquidity. We generally own securities that can readily provide us with cash and liquidity through secured borrowing agreements with securities pledged as collateral.
Our Treasury group manages our liquidity and funding, with oversight by ALCO. The Treasurer is responsible for recommending changes to existing funding plans and our policies related to liquidity and funding. These recommendations are submitted for approval to ALCO, and changes to the policies are also approved by the ERMC and the Board. We maintain and regularly test a contingency funding plan to identify sources and uses of liquidity. Our Board-approved liquidity policy requires us to monitor and maintain adequate liquidity, diversify funding positions, and anticipate future funding needs. In accordance with this policy, we monitor our liquidity positions by
ZIONS BANCORPORATION, NATIONAL ASSOCIATION AND SUBSIDIARIES
conducting various stress tests and evaluating certain liquid asset measurements, such as a 30-day liquidity coverage ratio.
We perform regular liquidity stress tests and assess our portfolio of highly liquid assets (sufficient to cover 30-day funding needs under stress scenarios). These stress tests include projections of funding maturities, uses of funds, and assumptions of deposit runoff. The assumptions consider the size of deposit account, operational nature of deposits, type of depositor, and concentrations of funding sources including large depositors and aggregate levels of uncollateralized deposits exceeding insured levels. Concentrated funding sources are given large runoff factors up to 100% in projecting stressed funding needs. Our liquidity stress testing considers multiple timeframes ranging from overnight to 12 months. Our liquidity policy requires us to maintain sufficient on-balance sheet liquidity in the form of FRB reserve balance and other highly liquid assets to meet stressed outflow assumptions.
We have a dedicated funding desk that monitors real-time inflows and outflows of our FRB account, and we have tools, including ready access to repo markets and FHLB advances, to manage intraday liquidity. FHLB borrowings are “open-term,” allowing us the ability to retain or return funds based on our liquidity needs. We pledge a large portion of our highly liquid investment securities portfolio through the General Collateral Funding (“GCF”) repo program. Through this program, high-quality collateral is pledged, and program participants exchange funds anonymously, which allows for near instant access to funding during market hours.
Additionally, we have pledged collateral to the FRB’s primary credit facility (or discount window) and the Bank Term Funding Program (“BTFP”), which provide additional contingent funding sources outside the normal operating hours of the FHLB and the GCF program. The BTFP offers loans of up to one year in length to eligible depository institutions pledging U.S. Treasuries, agency debt and government mortgage-backed securities, and other qualifying assets as collateral. Unlike other funding sources, borrowing capacity under the BTFP is based on the par value, not the fair value, of collateral. Advances can be requested under the program through mid-March 2024.
During 2023, the primary sources of cash came from an increase in deposits, a decrease in investment securities, and net decrease in money market investments. Uses of cash during the same period primarily included a decrease in short-term borrowings, an increase in loans and leases, and dividends paid on common and preferred stock. Cash payments for interest reflected in operating expenses were $1.4 billion and $160 million during 2023 and 2022, respectively.
The FHLB and FRB have been, and continue to be, a significant source of back-up liquidity and funding. We are a member of the FHLB of Des Moines, which allows member banks to borrow against eligible loans and securities to satisfy liquidity and funding requirements. We are required to invest in FHLB and FRB stock to maintain our borrowing capacity. At December 31, 2023, our total investment in FHLB and FRB stock was $79 million and $65 million, respectively, compared with $294 million and $68 million at December 31, 2022. Average FHLB activity stock holdings in 2023 was $179 million, compared with $61 million in 2022, which contributed to the increase in dividends on FHLB activity stock during the year.
At December 31, 2023, loans with a carrying value of $24.8 billion and $11.5 billion, compared with $23.7 billion and $3.9 billion at December 31, 2022, were pledged at the FHLB and FRB, respectively, as collateral for current and potential borrowings.
At December 31, 2023 and December 31, 2022, investment securities with a carrying value of $20.5 billion and $13.5 billion, respectively, were pledged as collateral for potential borrowings. For the same time periods, these pledges included $9.5 billion and $8.3 billion for available use through the GCF repo program, $5.5 billion and $1.0 billion to the FRB, and $5.5 billion and $4.2 billion to secure collateralized public and trust deposits, advances, and for other purposes.
A large portion of these pledged assets are unencumbered, but are pledged to provide immediate access to contingency sources of funds. The following schedule presents our total available liquidity including unused collateralized borrowing capacity:
ZIONS BANCORPORATION, NATIONAL ASSOCIATION AND SUBSIDIARIES
Schedule 36
AVAILABLE LIQUIDITY
| | | | | | | | | | | | | | | | | | | | | | | | | | | | | | | | | | | | | | | | | | | | | | | | | | | | | | | | | | | |
| December 31, 2023 | | December 31, 2022 |
| (Dollar amounts in billions) | FHLB | | FRB | | GCF | | BTFP | | Total | | FHLB | | FRB | | GCF | | BTFP | | Total |
| | | | | | | | | | | | | | | | | | | |
| | | | | | | |
| | | | | | | |
| Total borrowing capacity | $ | 16.6 | | | $ | 9.8 | | | $ | 9.6 | | | $ | 5.8 | | | $ | 41.8 | | | $ | 16.6 | | | $ | 4.0 | | | $ | 8.4 | | | $ | — | | | $ | 29.0 | |
| Borrowings outstanding | 1.6 | | | — | | | 1.8 | | | — | | | 3.4 | | | 7.2 | | | — | | | 2.7 | | | — | | | 9.9 | |
| Remaining capacity, at period end | $ | 15.0 | | | $ | 9.8 | | | $ | 7.8 | | | $ | 5.8 | | | $ | 38.4 | | | $ | 9.4 | | | $ | 4.0 | | | $ | 5.7 | | | $ | — | | | $ | 19.1 | |
| | | | | | | | | | | | | | | | | | | |
| Cash and due from banks | | | | | | | | 0.7 | | | | | | | | | | | 0.7 | |
Interest-bearing deposits 1 | | | | | | | | 1.5 | | | | | | | | | | | 1.3 | |
| Total available liquidity | | | | $ | 40.6 | | | | | | | | | | | $ | 21.1 | |
| Ratio of available liquidity to uninsured deposits | | | | | | | | | 122 | % | | | | | | | | | | 56 | % |
1 Represents funds deposited by the Bank primarily at the Federal Reserve Bank.
At December 31, 2023 and December 31, 2022, our total available liquidity was $40.6 billion, compared with $21.1 billion, respectively. At December 31, 2023, we had sources of liquidity that exceeded our uninsured deposits without the need to sell any investment securities.
Credit Ratings
General financial market and economic conditions impact our access to, and cost of, external financing. Access to funding markets is also directly affected by the credit ratings we receive from various rating agencies. The ratings not only influence the costs associated with borrowings, but can also influence the sources of the borrowings. All of the credit rating agencies rate our debt at an investment-grade level.
The following schedule presents our credit ratings:
Schedule 37
CREDIT RATINGS
| | | | | | | | | | | | | | | | | | | | | | | | | | |
| as of January 31, 2024: |
| Rating agency | | Outlook | | Long-term issuer/senior
debt rating | | Subordinated debt rating | | Short-term debt rating |
| | | | | | | | |
| Kroll | | Stable | | A- | | BBB+ | | K2 |
| S&P | | Negative | | BBB+ | | BBB | | NR |
| Fitch | | Stable | | BBB+ | | BBB | | F2 |
| Moody’s | | Stable | | Baa2 | | NR | | P2 |
Uncertainties in the banking industry during 2023 resulted in ratings pressure for a number of banks, including Zions. As a result, the credit rating agencies took the following actions related to our issuer, debt, and deposit ratings:
•In April 2023, Moody’s downgraded our long-term issuer rating to Baa2 from Baa1, our short-term debt rating to P2 from P1, and changed their outlook on our long-term deposit and issuer ratings to “Stable” from “Ratings under review.”
•In May 2023, S&P changed their outlook on our long-term deposit and issuer ratings to “Negative” from “Stable.”
•In October 2023, Fitch downgraded our short-term debt rating to F2 from F1.
•In November 2023, Kroll changed their outlook on our long-term deposit and issuer ratings to “Stable” from “Positive.”
ZIONS BANCORPORATION, NATIONAL ASSOCIATION AND SUBSIDIARIES
We may, from time to time, issue additional preferred stock, senior or subordinated notes, or other forms of capital or debt instruments, depending on our capital, funding, asset-liability management, or other needs as market conditions warrant. These additional issuances may be subject to required regulatory approvals. We believe that our sources of available liquidity are adequate to meet all reasonably foreseeable short- and intermediate-term demands.
For more information about a recent regulatory proposal that would expand long-term debt requirements and impact our sources of available liquidity, see “Recent Regulatory Developments” on page 8 in Supervision and Regulation.
Contractual Obligations
The following schedule summarizes our contractual obligations at December 31, 2023:
Schedule 38
CONTRACTUAL OBLIGATIONS
| | | | | | | | | | | | | | | | | | | | | | | | | | | | | | | | | | | |
| (In millions) | One year or less | | Over one year through three years | | Over three years through five years | | Over five years | | Indeterminable maturity 1 | | Total |
| | | | | | | | | | | |
| Deposits | $ | 9,798 | | | $ | 155 | | | $ | 42 | | | $ | 1 | | | $ | 64,965 | | | $ | 74,961 | |
| Unfunded lending commitments | 7,995 | | | 8,372 | | | 3,512 | | | 9,061 | | | — | | | 28,940 | |
| Standby letters of credit: | | | | | | | | | | | |
| Financial | 548 | | | — | | | — | | | — | | | — | | | 548 | |
| Performance | 206 | | | — | | | — | | | — | | | — | | | 206 | |
| Commercial letters of credit | 22 | | | — | | | — | | | — | | | — | | | 22 | |
Mortgage-backed security purchase agreements 2 | — | | | — | | | — | | | 66 | | | — | | | 66 | |
Commitments to make venture and other noninterest-bearing investments 3 | — | | | — | | | — | | | — | | | 62 | | | 62 | |
| Federal funds and other short-term borrowings | 4,379 | | | — | | | — | | | — | | | — | | | 4,379 | |
Long-term debt 4 | — | | | — | | | 88 | | | 500 | | | — | | | 588 | |
| Operating leases | 42 | | | 67 | | | 40 | | | 83 | | | — | | | 232 | |
| Total contractual obligations | $ | 22,990 | | | $ | 8,594 | | | $ | 3,682 | | | $ | 9,711 | | | $ | 65,027 | | | $ | 110,004 | |
1 Indeterminable maturity deposits include noninterest-bearing demand, savings, and money market deposits.
2 Represents agreements with Farmer Mac to purchase securities backed by certain agricultural mortgage loans.
3 Commitments to make venture and other noninterest-bearing investments do not have defined maturity dates. They are due upon demand and may be drawn immediately. Therefore, these commitments are shown as having indeterminable maturities.
4 The values presented do not reflect the impact of associated fair value hedges.
In addition to the commitments specifically noted in the schedule above, we enter into a number of contractual commitments in the ordinary course of business. These include software licensing and maintenance, telecommunications services, facilities maintenance and equipment servicing, supplies purchasing, and other goods and services used in the operation of our business. Some of these contracts are renewable or cancellable annually or in shorter time intervals. To secure favorable pricing concessions, we may also commit to contracts that may extend several years.
We enter into derivative contracts that may require us to pay cash, depending on changes in interest rates. These contracts are measured at fair value on the balance sheet, reflecting the net present value of the expected future cash receipts and payments based on market interest rates. See Note 7 of the Notes to Consolidated Financial Statements for further information on derivative contracts.
Operational, Technology, and Cybersecurity Risk Management
Operational Risk Management
Operational risk is the risk to current or anticipated earnings or capital arising from inadequate or failed internal processes or systems, human errors or misconduct, or adverse external events. ERM assists employees, management, and the Board with assessing, measuring, managing, and monitoring this risk in accordance with our
ZIONS BANCORPORATION, NATIONAL ASSOCIATION AND SUBSIDIARIES
Risk Management Framework. For example, we have documented control self-assessments related to financial reporting under the 2013 framework issued by the Committee of Sponsoring Organizations of the Treadway Commission (“COSO”) and the FDICIA.
We have instituted a number of measures to manage our operational risk, including, but not limited to: (1) transactional documentation requirements; (2) systems and procedures to monitor transactions and positions; (3) systems and procedures to detect and mitigate attempts to commit fraud, penetrate our systems, access customer data, or deny normal access to those systems to our legitimate customers; (4) regulatory compliance reviews; and (5) periodic reviews by our Compliance Risk Management, Internal Audit, Operational Risk Management, and Credit Examination departments. Reconciliation procedures have been established to ensure that data processing systems consistently and accurately capture critical data. In addition, the Data Governance department provides additional oversight of data integrity and data availability. Further, we maintain disaster recovery and business continuity plans for operational support in the event of natural or other disasters. We also mitigate certain operational risks through the purchase of insurance, including errors and omissions and professional liability insurance.
We continually strive to improve our operational risk management, including enhancement of risk identification, risk and control self-assessments, business process mappings, regular tests of controls, and anti-fraud measures, which are reported on a regular basis to enterprise management committees. Key measures have been established in line with our Risk Management Framework to increase oversight by ERM and Operational Risk Management through the strengthening of new initiative reviews and enhancements to enterprise supply chain and vendor risk management. We also continue to review and enhance our Enterprise Business Continuity and Enterprise Security programs.
Significant enhancements have also been made to governance, technology, and reporting, including the establishment of Policy and Committee Governance programs; the implementation of a governance, risk, and control system to manage and integrate business processes, risks, controls, assessments, and control testing; and the creation of an Enterprise Risk Profile. In addition, our Enterprise Exam Management department has standardized our response and reporting, and increased our effectiveness and efficiencies with regulatory examination, communications, and issues management.
Technology Risk Management
Technology risk is the risk of adverse impact to business operations and customers due to reduced or denied availability or inadequate value delivery related to technology-related applications, infrastructure, strategy, or processes. We make significant investments to enhance our technology capabilities and to mitigate the risk from outdated and unsupported technologies (technical debt). This includes updating core banking systems, as well as introducing new digital customer-facing capabilities. Technology projects, initiatives, and operations are governed by a change management framework that assesses the activities and risk within our business processes to limit disruption and resource constraints. New, expanded, or modified products and services, as well as new lines of business, change initiatives, and other risks are regularly reviewed and approved by the Change, Initiatives, and Technology Committee. This Committee includes, among other senior executives, the Chief Executive Officer, Chief Financial Officer, Chief Operating Officer, CTOO, and Chief Risk Officer. Initiative risk and change impact from the framework are reported to the ROC.
Technology governance exists at the operational level within our Enterprise and Technology Operations (“ETO”) division to help ensure safety, soundness, operational resiliency, and compliance with our technology policies. ETO management regularly participates in enterprise architecture review boards and technology risk committees to assess ongoing objectives related to enterprise standards compliance and strategic alignment, end-of-life, audit, risk and compliance issue management, and asset management. Thresholds are defined to escalate associated risks to the attention of the ERMC and ROC committees as appropriate.
ZIONS BANCORPORATION, NATIONAL ASSOCIATION AND SUBSIDIARIES
Cybersecurity Risk Management
Cybersecurity risk is the risk of adverse impacts to the confidentiality, integrity, and availability of data owned, stored, or processed by the Bank. For information about how we manage cybersecurity risk, see Part I, Item 1C. Cybersecurity on page 24.
Capital Management
The Board is responsible for approving key policies associated with capital management. The Board has delegated responsibility of managing our capital risk to the Capital Management Committee (“CMC”), which is chaired by the Chief Financial Officer, consists of members of management, and whose primary responsibility is to recommend and administer the approved capital policies that govern our capital management. Other major CMC responsibilities include:
•Setting overall capital targets within the Board-approved Capital Policy, monitoring performance compared with our Capital Policy limits, and recommending changes to capital including dividends, common stock issuances and repurchases, subordinated debt, and changes in major strategies to maintain ourselves at well-capitalized levels;
•Maintaining an adequate capital cushion to withstand adverse stress events while continuing to meet the borrowing needs of our customers, and to provide reasonable assurance of continued access to wholesale funding, consistent with fiduciary responsibilities to depositors and bondholders; and
•Reviewing our credit agency ratings.
A strong capital position is vital to the achievement of our key corporate objectives, our continued profitability, and to promoting depositor and investor confidence. We seek to (1) maintain sufficient capital to support the current needs and growth of our businesses, consistent with our assessment of their potential to create value for shareholders, and (2) fulfill responsibilities to depositors and bondholders while managing capital distributions to shareholders through dividends and repurchases of common stock.
We utilize stress testing as an important mechanism to inform our decisions on the appropriate level of capital, based upon actual and hypothetically stressed economic conditions, which are comparable in severity to the scenarios published by the FRB. The timing and amount of capital actions are subject to various factors, including our financial performance, business needs, prevailing and anticipated economic conditions, and the results of our internal stress testing, as well as Board and OCC approval. Shares may be repurchased occasionally in the open market or through privately negotiated transactions.
Schedule 39
SHAREHOLDERS’ EQUITY
| | | | | | | | | | | | | | | | | | | | | | | |
| (Dollar amounts in millions) | December 31,
2023 | | December 31,
2022 | | Amount change | | Percent change |
| Shareholders’ equity: | | | | | | | |
| Preferred stock | $ | 440 | | | $ | 440 | | | $ | — | | | — | % |
| Common stock and additional paid-in capital | 1,731 | | | 1,754 | | | (23) | | | (1) | |
| Retained earnings | 6,212 | | | 5,811 | | | 401 | | | 7 | |
| Accumulated other comprehensive income | (2,692) | | | (3,112) | | | 420 | | | 13 | |
Total shareholders’ equity | $ | 5,691 | | | $ | 4,893 | | | $ | 798 | | | 16 | % |
Total shareholders’ equity increased $798 million, or 16% to $5.7 billion at December 31, 2023, compared with $4.9 billion at December 31, 2022. Common stock and additional paid-in capital decreased $23 million. During the first quarter of 2023, we repurchased 0.9 million common shares outstanding for $50 million. As the macroeconomic environment remained uncertain, we suspended our share repurchase program and did not repurchase common shares during the second, third, or fourth quarters of 2023. During 2022, we repurchased 3.6 million common shares outstanding for $200 million.
ZIONS BANCORPORATION, NATIONAL ASSOCIATION AND SUBSIDIARIES
In February 2024, the Board approved a plan to repurchase up to $35 million of common shares outstanding during the fiscal year 2024. In February 2024, we repurchased 0.9 million common shares outstanding for $35 million at an average price of $39.32.
The AOCI loss was $2.7 billion at December 31, 2023, and primarily reflects declines in the fair value of fixed-rate available-for-sale securities as a result of changes in interest rates. When compared to the prior year end, AOCI improved $420 million during 2023, driven largely by $208 million in unrealized loss amortization associated with the securities transferred from AFS to HTM during the fourth quarter of 2022, and $66 million primarily related to paydowns on AFS securities. AOCI was also impacted by a $145 million increase in unrealized gains and other adjustments associated with derivative instruments used for risk management purposes. Absent any sales or credit impairment of the AFS securities, the unrealized losses will not be recognized in earnings. We do not intend to sell any securities with unrealized losses. Although changes in AOCI are reflected in shareholders’ equity, they are excluded from regulatory capital, and therefore do not impact our regulatory ratios.
Bank regulators recently issued a proposal to implement Basel III Endgame, which would significantly revise certain capital requirements, such as the inclusion of unrealized gains and losses on AFS debt securities in regulatory capital, and would potentially impact our current and future capital planning, including share repurchase activity. For more information about the regulatory proposals, see “Recent Regulatory Developments” in Supervision and Regulation on page 8. For more discussion on our investment securities portfolio and related unrealized gains and losses, see Note 5 of the Notes to Consolidated Financial Statements.
Schedule 40
CAPITAL DISTRIBUTIONS
| | | | | | | | | | | |
| (In millions, except share data) | 2023 | | 2022 |
| Capital distributions: | | | |
| Preferred dividends paid | $ | 32 | | $ | 29 |
|
| Total capital distributed to preferred shareholders | 32 | | 29 |
| Common dividends paid | 245 | | 240 |
Bank common stock repurchased 1 | 51 | | 202 |
| Total capital distributed to common shareholders | 296 | | 442 |
| Total capital distributed to preferred and common shareholders | $ | 328 | | $ | 471 |
| Weighted average diluted common shares outstanding (in thousands) | 147,756 | | 150,271 |
| Common shares outstanding, at year-end (in thousands) | 148,153 | | 148,664 |
1 Includes amounts related to the common shares acquired from our publicly announced plans and those acquired in connection with our stock compensation plan. Shares were acquired from employees to pay for their payroll taxes and stock option exercise cost upon the exercise of stock options.
Pursuant to the OCC’s “Earnings Limitation Rule,” our dividend payments are restricted to an amount equal to the sum of the total of (1) our net income for that year, and (2) retained earnings for the preceding two years, unless the OCC approves the declaration and payment of dividends in excess of such amount. As of January 1, 2024, we had $1.0 billion of retained net profits available for distribution.
We paid dividends on preferred stock of $32 million in 2023, compared with $29 million in 2022. We paid dividends on common stock of $245 million, or $1.64 per share, in 2023, compared with $240 million, or $1.58 per share, in 2022. In February 2024, the Board declared a quarterly dividend of $0.41 per common share payable on February 22, 2024, to shareholders of record at the close of business on February 15, 2024.
Basel III
We are subject to Basel III capital requirements that include certain minimum regulatory capital ratios. At December 31, 2023, we exceeded all capital adequacy requirements under the Basel III capital rules. Based on our internal stress testing and other assessments of capital adequacy, we believe we hold capital sufficiently in excess of internal and regulatory requirements for well-capitalized banks. See the “Supervision and Regulation” section on
ZIONS BANCORPORATION, NATIONAL ASSOCIATION AND SUBSIDIARIES
page 7 and Note 15 of the Notes to Consolidated Financial Statements for more information about Basel III capital requirements. The following schedule presents our capital amounts, capital ratios, and other selected performance ratios:
Schedule 41
CAPITAL AMOUNTS AND RATIOS
| | | | | | | | | | | | | | | | | |
| (Dollar amounts in millions) | December 31,
2023 | | December 31,
2022 | | December 31,
2021 |
Basel III risk-based capital amounts: | | | | | |
| Common equity Tier 1 capital | $ | 6,863 | | | $ | 6,481 | | | $ | 6,068 | |
| Tier 1 risk-based | 7,303 | | | 6,921 | | | 6,508 | |
| Total risk-based | 8,553 | | | 8,077 | | | 7,652 | |
| Risk-weighted assets | 66,934 | | | 66,111 | | | 59,604 | |
| Basel III risk-based capital ratios: | | | | | |
| Common equity Tier 1 capital | 10.3 | % | | 9.8 | % | | 10.2 | % |
| Tier 1 risk-based | 10.9 | % | | 10.5 | % | | 10.9 | % |
| Total risk-based | 12.8 | % | | 12.2 | % | | 12.8 | % |
| Tier 1 leverage | 8.3 | % | | 7.7 | % | | 7.2 | % |
| Other ratios: | | | | | |
| Average equity to average assets | 6.0 | % | | 6.6 | % | | 9.0 | % |
| Return on average common equity | 13.4 | % | | 16.0 | % | | 14.9 | % |
Return on average tangible common equity 1 | 17.3 | % | | 19.8 | % | | 17.3 | % |
Tangible equity ratio 1 | 5.4 | % | | 4.3 | % | | 7.0 | % |
Tangible common equity ratio 1 | 4.9 | % | | 3.8 | % | | 6.5 | % |
1 See “Non-GAAP Financial Measures” on page 77 for more information regarding these ratios.
During the latter half of 2023, federal bank regulators issued certain proposals applicable to large banking organizations that would significantly revise the capital requirements, expand long-term debt requirements, and revise requirements for resolution planning. For more information about these regulatory proposals, see “Recent Regulatory Developments” in Supervision and Regulation on page 8.
CRITICAL ACCOUNTING POLICIES AND SIGNIFICANT ESTIMATES
Note 1 of the Notes to Consolidated Financial Statements contains a summary of our significant accounting policies. Certain accounting policies that we consider critical are described below because their related balances and estimates are significant to the financial statements. Any changes to these amounts, including changes in estimates, may also be significant to the financial statements. We believe that an understanding of these policies, along with the related estimates we are required to make in recording our financial transactions, is important to have a complete picture of our financial condition. Additionally, in making these estimates, we are required to make complex and subjective judgments, many of which include a high degree of uncertainty. We discuss these critical accounting policies and related estimates below.
We have included, where applicable in this document, sensitivity schedules and other examples to demonstrate the impact of the changes in estimates made for various financial transactions. The sensitivities in these schedules and examples are hypothetical and should be viewed with caution. Changes in estimates are based on variations in assumptions and are not subject to simple extrapolation, as the relationship of the change in the assumption to the change in the amount of the estimate may not be linear. In addition, the effect of a variation in one assumption is likely to cause changes in other assumptions, which could potentially magnify or counteract the sensitivities.
Allowance for Credit Losses
The ACL includes the ALLL and the RULC and represents our estimate of current expected credit losses related to the loan and lease portfolio and unfunded lending commitments as of the balance sheet date. The ACL for our AFS and HTM debt securities portfolio is estimated separately from loans and is not presented separately on the
ZIONS BANCORPORATION, NATIONAL ASSOCIATION AND SUBSIDIARIES
consolidated balance sheet due to immateriality. The ACL for debt securities was less than $1 million at both December 31, 2023 and 2022.
The ACL may change significantly each period because the ACL is subject to economic forecasts that may change materially from period to period. We believe that our methodology for determining an appropriate level for the ACL adequately addresses the various components that could potentially result in credit losses. Any unfavorable differences between the actual outcome of credit-related events and our estimates could require an additional provision for credit losses.
The ACL is calculated based on quantitative models and management’s qualitative judgment based on many factors over the life of loan. The primary assumptions of the quantitative model are the economic forecast, the length of the reasonable and supportable forecast period, the length of the reversion period, prepayment rates, and the credit quality of the portfolio. The quantitative ACL estimate is based on losses under multiple economic scenarios that reflect optimistic, baseline, and stressed economic conditions. Management uses qualitative judgment to adjust scenario weights to more closely reflect management’s assessments of current conditions and reasonable and supportable forecasts.
If the ACL was evaluated on the baseline economic scenario rather than weighting multiple scenarios, the quantitatively determined amount of the ACL at December 31, 2023 would decrease by approximately $138 million. Additionally, if the probability of default risk-grade for all pass-graded loans was immediately downgraded one grade on our internal risk-grading scale, the quantitatively determined amount of the ACL at December 31, 2023 would increase by approximately $51 million. These sensitivity analyses are hypothetical and have been provided only to indicate the potential impact that changes in economic forecasts and changes in risk-grades may have on the ACL estimate. See Note 6 of the Notes to Consolidated Financial Statements for more information on the processes and methodologies used to estimate the ACL.
Fair Value Estimates
We measure certain assets and liabilities at fair value. Fair value is the price that would be received to sell an asset or paid to transfer a liability in an orderly transaction between market participants. To increase consistency and comparability in fair value measurements, we prioritize valuation inputs in accordance with a three-level hierarchy: (1) observable inputs that reflect quoted prices in active markets, (2) inputs other than quoted prices with observable market data, and (3) unobservable data such as our own data.
When observable market prices are not available, fair value is estimated using modeling techniques such as discounted cash flow analysis. These modeling techniques use assumptions that market participants would consider in pricing the asset or the liability.
The selection and weighting of the various fair value techniques may result in a fair value higher or lower than the carrying value of the item being valued. Considerable judgment may be involved in determining the amount that is most representative of fair value.
For assets and liabilities measured at fair value, our policy is to maximize the use of observable inputs, when available, and minimize the use of unobservable inputs when estimating fair value. In certain cases, when market observable inputs for model-based valuation techniques may not be readily available, we are required to make judgments about the assumptions that we believe market participants would consider in estimating the fair value of financial instruments. The models used to estimate fair value are regularly evaluated by management for relevance under current facts and circumstances. Changes in market conditions may reduce the availability of quoted prices or observable data. For example, reduced liquidity in the capital markets or changes in secondary market activities could result in observable market inputs becoming unavailable.
Fair value is used on a recurring basis for certain assets and liabilities in which fair value is the primary measure of accounting. Fair value is used on a nonrecurring basis for certain assets or liabilities to determine any impairment or for disclosure purposes.
ZIONS BANCORPORATION, NATIONAL ASSOCIATION AND SUBSIDIARIES
AFS securities are valued using several methodologies, which depend on the nature of the security, availability of current market information, and other factors. AFS securities in an unrealized loss position are formally reviewed on a quarterly basis for the presence of credit impairment. If we have the intent to sell an identified security, or it is more likely than not we will be required to sell the security before recovery of its amortized cost basis, we first recognize an identified impairment. If we do not have the intent to sell a security, and it is more likely than not that we will not be required to sell a security prior to recovery of its amortized cost basis, then we determine whether there is any impairment attributable to credit-related factors. Credit-related impairment is recognized as an allowance. Full or partial write-offs of an AFS security are recorded in the period in which the security is deemed to be uncollectible.
While certain assets and liabilities are measured at fair value, such as our AFS securities, the majority of our assets and liabilities are not adjusted for changes in fair value. This asymmetrical accounting creates volatility in AOCI and equity.
Notes 1, 3, 5, 7, and 10 of the Notes to Consolidated Financial Statements and the “Investment Securities Portfolio” on page 46 contain further information regarding the use of fair value estimates.
Goodwill
Goodwill is recorded at fair value in the financial statements of a reporting unit at the time of its acquisition and is subsequently evaluated at least annually for impairment.
We perform an evaluation during the fourth quarter of each year, or more frequently if events or circumstances indicate that the carrying value exceeds fair value. We may elect to perform a qualitative analysis to determine if it is more likely than not that the fair value of a reporting unit is less than its carrying amount. If the carrying amount is more likely than not to exceed its fair value, additional quantitative analysis is performed to determine the amount of goodwill impairment. If the fair value is less than the carrying value, an impairment is recorded for the difference. Goodwill impairment does not impact our regulatory capital ratios or tangible common equity ratio.
To determine the fair value of a reporting unit, we use (1) a market value approach that incorporates comparable publicly traded commercial banks, and (2) an income method that consists of a discounted present value of management’s estimates of future cash flows.
Critical assumptions used as part of these methods include:
•Selection of comparable publicly traded companies based on location, size, and business focus and composition;
•Selection of market comparable acquisition transactions, if available, based on location, size, business focus and composition, and date of the transaction;
•The discount rate, which is based on our estimate of the cost of equity capital;
•The projections of future earnings and cash flows of the reporting unit;
•The relative weight given to the valuations derived by the two methods described previously; and
•The control premium associated with reporting units.
Since estimates are an integral part of the impairment test computations, changes in these estimates could have a significant impact on our reporting units’ fair value and the goodwill impairment amount, if any. Estimates include economic conditions, which impact the assumptions related to interest and growth rates, loss rates, and imputed cost of equity capital. Additional factors that may significantly affect the estimates include, among others, competitive forces, customer behaviors and attrition, loan losses, changes in growth trends, cost structures and technology, changes in equity market values and merger and acquisition valuations, and changes in industry conditions.
We performed our annual goodwill impairment evaluation, effective October 1, 2023. We concluded that none of our reporting units were impaired. Furthermore, the evaluation process determined that the fair values of Amegy, CB&T, Zions Bank, and NSB exceeded their carrying values by 38%, 70%, 80%, and 139%, respectively. Additionally, we performed a hypothetical sensitivity analysis on the discount rate assumption to evaluate the
ZIONS BANCORPORATION, NATIONAL ASSOCIATION AND SUBSIDIARIES
impact of an adverse change to this assumption. If the discount rate applied to future earnings was increased by 100 bps, the fair values of Amegy, CB&T, Zions Bank, and NSB would exceed their carrying values by 32%, 60%, 63%, and 124%, respectively.
RECENT ACCOUNTING PRONOUNCEMENTS AND DEVELOPMENTS
Note 2 of the Notes to Consolidated Financial Statements discusses recently issued accounting pronouncements that we are, or will be, required to adopt. Also described is our expectation of the impact these new accounting pronouncements will have, to the extent they are material, on our financial condition or results of operations.
NON-GAAP FINANCIAL MEASURES
This Form 10-K presents non-GAAP financial measures in addition to GAAP financial measures. The adjustments to reconcile from the applicable GAAP financial measures to the non-GAAP financial measures are presented in the following schedules. We consider these adjustments to be relevant to ongoing operating results and provide a meaningful basis for period-to-period comparisons. We use these non-GAAP financial measures to assess our performance and financial position. We believe that presenting these non-GAAP financial measures allows investors to assess our performance on the same basis as that applied by our management and the financial services industry.
Non-GAAP financial measures have inherent limitations and are not necessarily comparable to similar financial measures that may be presented by other financial services companies. Although non-GAAP financial measures are frequently used by stakeholders to evaluate a company, they have limitations as an analytical tool and should not be considered in isolation or as a substitute for analysis of results reported under GAAP.
Tangible Common Equity and Related Measures
Tangible common equity and related measures are non-GAAP measures that exclude the impact of intangible assets and their related amortization. We believe these non-GAAP measures provide useful information about our use of shareholders’ equity and provide a basis for evaluating the performance of a business more consistently, whether acquired or developed internally.
Schedule 42
RETURN ON AVERAGE TANGIBLE COMMON EQUITY (NON-GAAP)
| | | | | | | | | | | | | | | | | | | | |
| | Year Ended December 31, |
| (Dollar amounts in millions) | | 2023 | | 2022 | | 2021 |
| | | | | | |
| Net earnings applicable to common shareholders (GAAP) | | $ | 648 | | | $ | 878 | | | $ | 1,100 | |
| Adjustment, net of tax: | | | | | | |
| Amortization of core deposit and other intangibles | | 5 | | | 1 | | | 1 | |
| Net earnings applicable to common shareholders, net of tax | (a) | $ | 653 | | | $ | 879 | | | $ | 1,101 | |
| Average common equity (GAAP) | | $ | 4,839 | | | $ | 5,472 | | | $ | 7,371 | |
| Average goodwill and intangibles | | (1,062) | | | (1,022) | | | (1,015) | |
| | | |
| Average tangible common equity (non-GAAP) | (b) | $ | 3,777 | | | $ | 4,450 | | | $ | 6,356 | |
Return on average tangible common equity (non-GAAP) 1 | (a/b) | 17.3 | % | | 19.8 | % | | 17.3 | % |
1 Excluding the effect of AOCI from average tangible common equity would result in associated returns of 9.7%, 13.9%, and 17.8% for the periods presented, respectively.
ZIONS BANCORPORATION, NATIONAL ASSOCIATION AND SUBSIDIARIES
Schedule 43
TANGIBLE EQUITY RATIO, TANGIBLE COMMON EQUITY RATIO, AND TANGIBLE BOOK VALUE PER COMMON SHARE (ALL NON-GAAP MEASURES)
| | | | | | | | | | | | | | | | | | | | |
| (Dollar amounts in millions, except per share amounts) | | December 31, |
| 2023 | | 2022 | | 2021 |
| | | | | | |
| Total shareholders’ equity (GAAP) | | $ | 5,691 | | $ | 4,893 | | $ | 7,463 |
| Goodwill and intangibles | | (1,059) | | (1,065) | | (1,015) |
| | | |
| Tangible equity (non-GAAP) | (a) | 4,632 | | 3,828 | | 6,448 |
| Preferred stock | | (440) | | (440) | | (440) |
| Tangible common equity (non-GAAP) | (b) | $ | 4,192 | | $ | 3,388 | | $ | 6,008 |
| Total assets (GAAP) | | $ | 87,203 | | $ | 89,545 | | $ | 93,200 |
| Goodwill and intangibles | | (1,059) | | (1,065) | | (1,015) |
| | | |
| Tangible assets (non-GAAP) | (c) | $ | 86,144 | | $ | 88,480 | | $ | 92,185 |
| Common shares outstanding (in thousands) | (d) | 148,153 | | 148,664 | | 151,625 |
| Tangible equity ratio (non-GAAP) | (a/c) | 5.4 | % | | 4.3 | % | | 7.0 | % |
| Tangible common equity ratio (non-GAAP) | (b/c) | 4.9 | % | | 3.8 | % | | 6.5 | % |
| Tangible book value per common share (non-GAAP) | (b/d) | $28.30 | | $22.79 | | $39.62 |
Efficiency Ratio and Adjusted Pre-Provision Net Revenue
The efficiency ratio is a measure of operating expense relative to revenue. We believe the efficiency ratio provides useful information regarding the cost of generating revenue. We make adjustments to exclude certain items that are not generally expected to recur frequently, as identified in the subsequent schedule, which we believe allow for more consistent comparability across periods. Adjusted noninterest expense provides a measure as to how we are managing our expenses. Adjusted pre-provision net revenue enables management and others to assess our ability to generate capital. Taxable-equivalent net interest income allows us to assess the comparability of revenue arising from both taxable and tax-exempt sources.
ZIONS BANCORPORATION, NATIONAL ASSOCIATION AND SUBSIDIARIES
Schedule 44
EFFICIENCY RATIO (NON-GAAP) AND ADJUSTED PRE-PROVISION NET REVENUE (NON-GAAP)
| | | | | | | | | | | | | | | | | | | | |
| (Dollar amounts in millions) | | 2023 | | 2022 | | 2021 |
| | | | | | |
| Noninterest expense (GAAP) | (a) | $ | 2,097 | | | $ | 1,878 | | | $ | 1,741 | |
| Adjustments: | | | | | | |
| Severance costs | | 14 | | | 1 | | | 1 | |
| Other real estate expense, net | | — | | | 1 | | | — | |
| | | |
| Amortization of core deposit and other intangibles | | 6 | | | 1 | | | 1 | |
| Restructuring costs | | 1 | | | — | | | — | |
Pension termination-related expense (income) 1 | | — | | | — | | | (5) | |
SBIC investment success fee accrual 2 | | — | | | (1) | | | 7 | |
| FDIC special assessment | | 90 | | | — | | | — | |
| Total adjustments | (b) | 111 | | | 2 | | | 4 | |
| Adjusted noninterest expense (non-GAAP) | (a-b)=(c) | $ | 1,986 | | | $ | 1,876 | | | $ | 1,737 | |
| | | | | | |
| Net interest income (GAAP) | (d) | $ | 2,438 | | | $ | 2,520 | | | $ | 2,208 | |
| Fully taxable-equivalent adjustments | (e) | 41 | | | 37 | | | 32 | |
| Taxable-equivalent net interest income (non-GAAP) | (d+e)=(f) | 2,479 | | | 2,557 | | | 2,240 | |
| Noninterest income (GAAP) | (g) | 677 | | | 632 | | | 703 | |
| Combined income (non-GAAP) | (f+g)=(h) | 3,156 | | | 3,189 | | | 2,943 | |
| Adjustments: | | | | | | |
| Fair value and nonhedge derivative gain (loss) | | (4) | | | 16 | | | 14 | |
| Securities gains (losses), net | | 4 | | | (15) | | | 71 | |
| Total adjustments | (i) | — | | | 1 | | | 85 | |
| Adjusted taxable-equivalent revenue (non-GAAP) | (h-i)=(j) | $ | 3,156 | | | $ | 3,188 | | | $ | 2,858 | |
| | | | | | |
| Pre-provision net revenue (non-GAAP) | (h)-(a) | $ | 1,059 | | | $ | 1,311 | | | $ | 1,202 | |
Adjusted pre-provision net revenue (non-GAAP) | (j-c) | 1,170 | | | 1,312 | | | 1,121 | |
Efficiency ratio (non-GAAP) 3 | (c/j) | 62.9 | % | | 58.8 | % | | 60.8 | % |
1 Represents a subsequent valuation adjustment related to the termination of our defined benefit pension plan in 2020.
2 The success fee accrual is associated with the gains and losses from our SBIC investments, which are excluded from the efficiency ratio through securities gains (losses), net.
3 Including the one-time $90 million accrual associated with the FDIC special assessment recorded in deposit insurance and regulatory expense during the fourth quarter of 2023, the efficiency ratio for 2023 would have been 65.8%.
ITEM 7A. QUANTITATIVE AND QUALITATIVE DISCLOSURES ABOUT MARKET RISK
Information required by this Item is included in “Interest Rate and Market Risk Management” in MD&A beginning on page 63, and is hereby incorporated by reference.
ITEM 8. FINANCIAL STATEMENTS AND SUPPLEMENTARY DATA
ZIONS BANCORPORATION, NATIONAL ASSOCIATION AND SUBSIDIARIES
REPORT ON MANAGEMENT’S ASSESSMENT OF INTERNAL CONTROL OVER FINANCIAL REPORTING
The management of Zions Bancorporation, N.A is responsible for establishing and maintaining adequate internal control over financial reporting as defined by Exchange Act Rules 13a-15 and 15d-15.
Because of its inherent limitations, internal control over financial reporting may not prevent or detect misstatements. Also, projections of any evaluation of effectiveness to future periods are subject to the risk that controls may become inadequate because of changes in conditions, or that the degree of compliance with the policies or procedures may deteriorate. Although any system of internal control can be compromised by human error or intentional circumvention of required procedures, we believe our system provides reasonable assurance that financial transactions are recorded and reported properly, providing an adequate basis for reliable financial statements.
Our management has used the criteria established in Internal Control – Integrated Framework (2013 framework) issued by the Committee of Sponsoring Organizations of the Treadway Commission (“COSO”) to evaluate the effectiveness of our internal control over financial reporting.
Our management has assessed the effectiveness of our internal control over financial reporting as of December 31, 2023, and has concluded that such internal control over financial reporting is effective. There are no material weaknesses in our internal control over financial reporting that have been identified by our management.
Ernst & Young LLP, an independent registered public accounting firm, has audited our consolidated financial statements for the year ended December 31, 2023, and has also issued an attestation report, which is included herein, on internal control over financial reporting in accordance with the standards of the Public Company Accounting Oversight Board (“PCAOB”).
ZIONS BANCORPORATION, NATIONAL ASSOCIATION AND SUBSIDIARIES
REPORTS OF ERNST & YOUNG LLP, INDEPENDENT REGISTERED PUBLIC ACCOUNTING FIRM (PCAOB ID: )
REPORT ON INTERNAL CONTROL OVER FINANCIAL REPORTING
To the Shareholders and the Board of Directors of Zions Bancorporation, National Association
Opinion on Internal Control Over Financial Reporting
We have audited Zions Bancorporation, National Association’s (“the Bank”) internal control over financial reporting as of December 31, 2023, based on criteria established in Internal Control — Integrated Framework issued by the Committee of Sponsoring Organizations of the Treadway Commission (2013 framework) (“the COSO criteria”). In our opinion, the Bank maintained, in all material respects, effective internal control over financial reporting as of December 31, 2023, based on the COSO criteria.
We also have audited, in accordance with the standards of the Public Company Accounting Oversight Board (United States) (“PCAOB”), the 2023 consolidated financial statements of the Bank and our report dated February 23, 2024, expressed an unqualified opinion thereon.
Basis for Opinion
The Bank’s management is responsible for maintaining effective internal control over financial reporting and for its assessment of the effectiveness of internal control over financial reporting included in the accompanying Report on Management’s Assessment of Internal Control over Financial Reporting. Our responsibility is to express an opinion on the Bank’s internal control over financial reporting based on our audit. We are a public accounting firm registered with the PCAOB and are required to be independent with respect to the Bank in accordance with the U.S. federal securities laws and the applicable rules and regulations of the Securities and Exchange Commission and the PCAOB.
We conducted our audit in accordance with the standards of the PCAOB. Those standards require that we plan and perform the audit to obtain reasonable assurance about whether effective internal control over financial reporting was maintained in all material respects.
Our audit included obtaining an understanding of internal control over financial reporting, assessing the risk that a material weakness exists, testing and evaluating the design and operating effectiveness of internal control based on the assessed risk, and performing such other procedures as we considered necessary in the circumstances. We believe that our audit provides a reasonable basis for our opinion.
Definition and Limitations of Internal Control Over Financial Reporting
A company’s internal control over financial reporting is a process designed to provide reasonable assurance regarding the reliability of financial reporting and the preparation of financial statements for external purposes in accordance with generally accepted accounting principles. A company’s internal control over financial reporting includes those policies and procedures that (1) pertain to the maintenance of records that, in reasonable detail, accurately and fairly reflect the transactions and dispositions of the assets of the company; (2) provide reasonable assurance that transactions are recorded as necessary to permit preparation of financial statements in accordance with generally accepted accounting principles, and that receipts and expenditures of the company are being made only in accordance with authorizations of management and directors of the company; and (3) provide reasonable assurance regarding prevention or timely detection of unauthorized acquisition, use, or disposition of the company’s assets that could have a material effect on the financial statements.
Because of its inherent limitations, internal control over financial reporting may not prevent or detect misstatements. Also, projections of any evaluation of effectiveness to future periods are subject to the risk that controls may become inadequate because of changes in conditions, or that the degree of compliance with the policies or procedures may deteriorate.
/s/ Ernst & Young LLP
Salt Lake City, Utah
February 23, 2024
ZIONS BANCORPORATION, NATIONAL ASSOCIATION AND SUBSIDIARIES
REPORT ON CONSOLIDATED FINANCIAL STATEMENTS
To the Shareholders and the Board of Directors of Zions Bancorporation, National Association
Opinion on the Financial Statements
We have audited the accompanying consolidated balance sheets of Zions Bancorporation, National Association (“the Bank”) as of December 31, 2023 and 2022, the related consolidated statements of income, comprehensive income (loss), changes in shareholders’ equity, and cash flows for each of the three years in the period ended December 31, 2023, and the related notes (collectively referred to as the “consolidated financial statements”). In our opinion, the consolidated financial statements present fairly, in all material respects, the financial position of the Bank at December 31, 2023 and 2022, and the results of its operations and its cash flows for each of the three years in the period ended December 31, 2023, in conformity with U.S. generally accepted accounting principles.
We also have audited, in accordance with the standards of the Public Company Accounting Oversight Board (United States) (“PCAOB”), the Bank’s internal control over financial reporting as of December 31, 2023, based on criteria established in Internal Control-Integrated Framework issued by the Committee of Sponsoring Organizations of the Treadway Commission (2013 framework), and our report dated February 23, 2024 expressed an unqualified opinion thereon.
Basis for Opinion
These financial statements are the responsibility of the Bank’s management. Our responsibility is to express an opinion on the Bank’s financial statements based on our audits. We are a public accounting firm registered with the PCAOB and are required to be independent with respect to the Bank in accordance with the U.S. federal securities laws and the applicable rules and regulations of the Securities and Exchange Commission and the PCAOB.
We conducted our audits in accordance with the standards of the PCAOB. Those standards require that we plan and perform the audit to obtain reasonable assurance about whether the financial statements are free of material misstatement, whether due to error or fraud. Our audits included performing procedures to assess the risks of material misstatement of the financial statements, whether due to error or fraud, and performing procedures that respond to those risks. Such procedures included examining, on a test basis, evidence regarding the amounts and disclosures in the financial statements. Our audits also included evaluating the accounting principles used and significant estimates made by management, as well as evaluating the overall presentation of the financial statements. We believe that our audits provide a reasonable basis for our opinion.
Critical Audit Matter
The critical audit matter communicated below is a matter arising from the current period audit of the financial statements that was communicated or required to be communicated to the audit committee and that: (1) relates to accounts or disclosures that are material to the financial statements and (2) involved our especially challenging, subjective or complex judgments. The communication of the critical audit matter does not alter in any way our opinion on the consolidated financial statements, taken as a whole, and we are not, by communicating the critical audit matter below, providing a separate opinion on the critical audit matter or on the account and the disclosures to which it relates.
ZIONS BANCORPORATION, NATIONAL ASSOCIATION AND SUBSIDIARIES
Allowance for loan and lease losses | | | | | |
| Description of the Matter | The Bank’s loan and lease portfolio and the associated allowance for loan and lease losses (ALLL), were $57.8 billion and $684 million as of December 31, 2023, respectively. The provision for loan and lease losses was $148 million for the year ended December 31, 2023.
As discussed in Note 1 and 6 to the consolidated financial statements, the ALLL represented the Bank’s estimate of current expected credit losses over the contractual remaining life of the loan and lease portfolio as of the consolidated balance sheet date. Management’s ALLL estimate includes quantitative calculations based on the statistical analysis of historical loss experience dependent on weighted economic scenarios and other loan-level characteristics forecasted over a reasonable period, losses estimated using historical loss experience for periods outside the reasonable economic forecast period (collectively the quantitative portion), supplemented with qualitative adjustments that bring the ALLL to the level management deemed appropriate based on factors that are not fully considered in the quantitative analysis. The statistical analysis of historical loss experience was derived from credit loss models used to determine the quantitative portion of the ALLL. Judgment was required by management to determine the weightings of the economic scenarios and the magnitude of the impact of the qualitative adjustments to the ALLL.
Auditing management’s ALLL estimate is complex due to the judgment used to weigh the economic scenarios and the judgment involved in determining the magnitude of the impact of the various risk factors used to derive the qualitative adjustments to the ALLL. |
| |
| How We Addressed the Matter in Our Audit | We obtained an understanding, evaluated the design, and tested the operating effectiveness of controls that address the risk of material misstatement in determining the weightings of the economic scenarios and in determining the impact of the qualitative adjustments to the ALLL. We tested controls over the Bank’s ALLL governance process, model development and model risk management as it relates to the credit loss models used in the ALLL process. Such testing included testing controls over model governance, controls over data input into the models, and controls over model calculation accuracy and observing key management meetings where weightings of the economic scenarios and the magnitude of qualitative adjustments are reviewed and approved. |
| |
| To test the reasonableness of the weightings of the economic scenarios, our procedures consisted of obtaining an understanding of the forecasted economic scenarios used, including agreeing the economic scenarios to third party published data and economic scenarios developed from market information as well as evaluating management’s methodology. We also performed analytical procedures and sensitivity analyses on the weightings of the economic scenarios and searched for and evaluated information that corroborated or contradicted these weightings. |
| |
| Regarding the completeness of qualitative adjustments identified and incorporated into measuring the ALLL, we evaluated the potential impact of imprecision in the credit loss models and emerging risks related to changes in the economic environment impacting the Bank’s loan and lease portfolio. We also evaluated and tested internal and external data used in the qualitative adjustments by agreeing significant inputs and underlying data to internal and external sources. |
| |
| Further, we assessed whether the total amount of the ALLL estimate was consistent with the Bank’s historical loss information, peer bank information, credit quality statistics, subsequent events and transactions, and publicly observable indicators of macroeconomic financial conditions and whether the total ALLL amount was reflective of current expected losses in the loan and lease portfolio as of the consolidated balance sheet date. |
/s/
We have served as the Bank’s auditor since 2000.
February 23, 2024
ZIONS BANCORPORATION, NATIONAL ASSOCIATION AND SUBSIDIARIES
CONSOLIDATED BALANCE SHEETS
| | | | | | | | | | | |
| (In millions, shares in thousands) | December 31, |
| 2023 | | 2022 |
| ASSETS | | | |
| Cash and due from banks | $ | | | | $ | | |
| Money market investments: | | | |
| Interest-bearing deposits | | | | | |
| Federal funds sold and securities purchased under agreements to resell | | | | | |
| Investment securities: | | | |
Held-to-maturity, at amortized cost (fair value $ and $) | | | | | |
| Available-for-sale, at fair value | | | | | |
| Trading account, at fair value | | | | | |
| Total investment securities | | | | | |
| Loans held for sale | | | | | |
| Loans and leases, net of unearned income and fees | | | | | |
| Less allowance for loan and lease losses | | | | | |
| Loans, net of allowance | | | | | |
| Other noninterest-bearing investments | | | | | |
| Premises, equipment and software, net | | | | | |
| Goodwill and intangibles | | | | | |
| Other real estate owned | | | | | |
| Other assets | | | | | |
| Total assets | $ | | | | $ | | |
| LIABILITIES AND SHAREHOLDERS’ EQUITY | | | |
| Deposits: | | | |
| Noninterest-bearing demand | $ | | | | $ | | |
| Interest-bearing: | | | |
| Savings and money market | | | | | |
| Time | | | | | |
|
| Total deposits | | | | | |
| Federal funds and other short-term borrowings | | | | | |
| Long-term debt | | | | | |
| Reserve for unfunded lending commitments | | | | | |
| Other liabilities | | | | | |
| Total liabilities | | | | | |
| Shareholders’ equity: | | | |
Preferred stock, without par value; authorized shares | | | | | |
Common stock ($ par value; authorized shares; issued and outstanding and shares and additional paid-in capital) | | | | | |
| Retained earnings | | | | | |
| Accumulated other comprehensive income | () | | | () | |
|
|
| Total shareholders’ equity | | | | | |
| Total liabilities and shareholders’ equity | $ | | | | $ | | |
See accompanying notes to consolidated financial statements.
ZIONS BANCORPORATION, NATIONAL ASSOCIATION AND SUBSIDIARIES
CONSOLIDATED STATEMENTS OF INCOME
| | | | | | | | | | | | | | | | | |
| (In millions, except shares and per share amounts) | Year Ended December 31, |
| 2023 | | 2022 | | 2021 |
| Interest income: | | | | | |
| Interest and fees on loans | $ | | | | $ | | | | $ | | |
| Interest on money market investments | | | | | | | | |
| Interest on securities | | | | | | | | |
| Total interest income | | | | | | | | |
| Interest expense: | | | | | |
| Interest on deposits | | | | | | | | |
| Interest on short- and long-term borrowings | | | | | | | | |
| Total interest expense | | | | | | | | |
| Net interest income | | | | | | | | |
| Provision for credit losses: | | | | | |
| Provision for loan losses | | | | | | | () | |
| Provision for unfunded lending commitments | () | | | | | | () | |
| Total provision for credit losses | | | | | | | () | |
| Net interest income after provision for credit losses | | | | | | | | |
| Noninterest income: | | | | | |
| Commercial account fees | | | | | | | | |
| Card fees | | | | | | | | |
| Retail and business banking fees | | | | | | | | |
| Loan-related fees and income | | | | | | | | |
| Capital markets fees | | | | | | | | |
| Wealth management fees | | | | | | | | |
| | |
| Other customer-related fees | | | | | | | | |
| Customer-related noninterest income | | | | | | | | |
| Fair value and nonhedge derivative income (loss) | () | | | | | | | |
| Dividends and other income | | | | | | | | |
| Securities gains (losses), net | | | | () | | | | |
| Total noninterest income | | | | | | | | |
| Noninterest expense: | | | | | |
| Salaries and employee benefits | | | | | | | | |
| Technology, telecom, and information processing | | | | | | | | |
| Occupancy and equipment, net | | | | | | | | |
| Professional and legal services | | | | | | | | |
| Marketing and business development | | | | | | | | |
| Deposit insurance and regulatory expense | | | | | | | | |
| Credit-related expense | | | | | | | | |
| Other real estate expense, net | | | | | | | | |
| Other | | | | | | | | |
| Total noninterest expense | | | | | | | | |
| Income before income taxes | | | | | | | | |
| Income taxes | | | | | | | | |
| Net income | | | | | | | | |
| | |
| | |
| Preferred stock dividends | () | | | () | | | () | |
| | |
| Net earnings applicable to common shareholders | $ | | | | $ | | | | $ | | |
| Weighted average common shares outstanding during the year: | | | | | |
| Basic shares (in thousands) | | | | | | | | |
| Diluted shares (in thousands) | | | | | | | | |
| Net earnings per common share: | | | | | |
| Basic | $ | | | | $ | | | | $ | | |
| Diluted | | | | | | | | |
See accompanying notes to consolidated financial statements.
ZIONS BANCORPORATION, NATIONAL ASSOCIATION AND SUBSIDIARIES
CONSOLIDATED STATEMENTS OF COMPREHENSIVE INCOME (LOSS)
| | | | | | | | | | | | | | | | | |
| (In millions) | Year Ended December 31, |
| 2023 | | 2022 | | 2021 |
| | | | | |
| Net income | $ | | | | $ | | | | $ | | |
| Other comprehensive income (loss), net of tax: | | | | | |
| Net unrealized holding gains (losses) on investment securities | | | | () | | | () | |
| Unrealized loss amortization associated with the securities transferred from AFS to HTM | | | | | | | | |
Net unrealized gains (losses) on other noninterest-bearing investments | | | | () | | | | |
Net unrealized holding gains (losses) on derivative instruments | | | | () | | | () | |
Reclassification adjustment for decrease (increase) in interest income recognized in earnings on derivative instruments | | | | | | | () | |
Pension and post-retirement | | | | | | | | |
| | |
|
| | | | | |
| |
| |
) | | () | |
| |
))) | | | | | |
| |
)) | | | | | | () | |
| |
))) ) | | | | | | () | |
| |
)))| | | | $ | | | | $ | () | | | $ | | |
See accompanying notes to consolidated financial statements.
ZIONS BANCORPORATION, NATIONAL ASSOCIATION AND SUBSIDIARIES
CONSOLIDATED STATEMENTS OF CASH FLOWS
| | | | | | | | | | | | | | | | | |
| (In millions) | Year Ended December 31, |
| 2023 | | 2022 | | 2021 |
| CASH FLOWS FROM OPERATING ACTIVITIES | | | | | |
| Net income | $ | | | | $ | | | | $ | | |
| Adjustments to reconcile net income to net cash provided by operating activities: | | | | | |
Provision for credit losses | | | | | | | () | |
Depreciation and amortization | | | | | | | () | |
Share-based compensation | | | | | | | | |
Deferred income tax expense (benefit) | () | | | () | | | | |
Net decrease (increase) in trading securities | | | | () | | | () | |
Net decrease (increase) in loans held for sale | () | | | | | | | |
Change in other liabilities | () | | | | | | | |
Change in other assets | | | | () | | | () | |
Other, net | | | | () | | | () | |
| Net cash provided by operating activities | | | | | | | | |
| CASH FLOWS FROM INVESTING ACTIVITIES | | | | | |
| Net decrease (increase) in money market investments | | | | | | | () | |
| Proceeds from maturities and paydowns of investment securities held-to-maturity | | | | | | | | |
| Purchases of investment securities held-to-maturity | () | | | () | | | () | |
Proceeds from sales, maturities, and paydowns of investment securities available-for-sale | | | | | | | | |
| Purchases of investment securities available-for-sale | () | | | () | | | () | |
| Net change in loans and leases | () | | | () | | | | |
| Purchases and sales of other noninterest-bearing investments | | | | () | | | | |
| Purchases of premises and equipment | () | | | () | | | () | |
| Acquisition of Nevada branches, net of cash acquired | | | | | | | | |
Other, net | () | | | | | | | |
| Net cash provided by (used in) investing activities | | | | | | | () | |
| CASH FLOWS FROM FINANCING ACTIVITIES | | | | | |
| Net increase (decrease) in deposits | | | | () | | | | |
| Net change in short-term funds borrowed | () | | | | | | () | |
| | |
| | |
| Cash paid for preferred stock redemption | | | | | | | () | |
| Redemption of long-term debt | () | | | () | | | () | |
| | |
| Proceeds from the issuance of common stock | | | | | | | | |
| Dividends paid on common and preferred stock | () | | | () | | | () | |
| Bank common stock repurchased | () | | | () | | | () | |
| Other, net | () | | | () | | | () | |
| Net cash provided by (used in) financing activities | () | | | () | | | | |
| Net increase in cash and due from banks | | | | | | | | |
| Cash and due from banks at beginning of year | | | | | | | | |
| Cash and due from banks at end of year | $ | | | | $ | | | | $ | | |
| | | | | |
| Cash paid for interest | $ | | | | $ | | | | $ | | |
| Net cash paid for income taxes | | | | | | | | |
Noncash activities: | | | | | |
| Loans held for investment transferred to other real estate owned | | | | | | | | |
| Loans held for investment reclassified to loans held for sale, net | | | | | | | | |
| Trading securities reclassified to money market investments | | | | | | | | |
Investment securities available-for-sale transferred to held-to-maturity, at amortized cost (fair value $) | | | | | | | | |
| Deposits acquired in purchase of Nevada branches | | | | | | | | |
| Loans acquired in purchase of Nevada branches, net | | | | | | | | |
See accompanying notes to consolidated financial statements.
ZIONS BANCORPORATION, NATIONAL ASSOCIATION AND SUBSIDIARIES
NOTES TO CONSOLIDATED FINANCIAL STATEMENTS
December 31, 2023
1.
Western and Southwestern states through separately managed affiliates: Zions Bank in Utah, Idaho, and Wyoming; California Bank & Trust (“CB&T”); Amegy Bank (“Amegy”) in Texas; National Bank of Arizona (“NBAZ”); Nevada State Bank (“NSB”); Vectra Bank Colorado (“Vectra”) in Colorado and New Mexico; and The Commerce Bank of Washington (“TCBW”) which operates under that name in Washington and under The Commerce Bank of Oregon in Oregon. At December 31, 2023, and 2022, we had no VIEs that have been consolidated in our financial statements.
ZIONS BANCORPORATION, NATIONAL ASSOCIATION AND SUBSIDIARIES
days. These agreements are generally treated as collateralized financing transactions and are carried at amounts at which the securities were acquired plus accrued interest. We, or in some instances third parties on our behalf, take possession of the underlying securities. The fair value of such securities is monitored throughout the contract term to ensure that asset values remain sufficient to protect against counterparty default. We are permitted by contract to sell or repledge certain securities that we accept as collateral for securities purchased under agreements to resell. If sold, our obligation to return the collateral is recorded as “securities sold, not yet purchased” and included as a liability in “Federal funds and other short-term borrowings” on the consolidated balance sheet. At December 31, 2023, and 2022, we held $ million and $ billion of securities for which we were permitted by contract to sell or repledge, respectively. Securities purchased under agreements to resell averaged $ billion and $ billion during 2023 and 2022, and the maximum amount outstanding at any month-end during those same time periods was $ billion and $ billion, respectively.
ZIONS BANCORPORATION, NATIONAL ASSOCIATION AND SUBSIDIARIES
See Note 8 for further information regarding the accounting for leases.
ZIONS BANCORPORATION, NATIONAL ASSOCIATION AND SUBSIDIARIES
See Note 7 for more information.
ZIONS BANCORPORATION, NATIONAL ASSOCIATION AND SUBSIDIARIES
See Note 7 for more information regarding the accounting for derivatives designated as hedging instruments.
See Note 17 for further information regarding how we recognize revenue for contracts with customers.
See further discussion in Note 19.
See Note 20 for more information about the factors that impacted our effective tax rate, significant components of our DTAs and DTLs, including our assessment regarding valuation allowances and unrecognized tax benefits for uncertain tax positions.
See further discussion in Note 21.
ZIONS BANCORPORATION, NATIONAL ASSOCIATION AND SUBSIDIARIES
2.
ZIONS BANCORPORATION, NATIONAL ASSOCIATION AND SUBSIDIARIES
3.
ZIONS BANCORPORATION, NATIONAL ASSOCIATION AND SUBSIDIARIES
ZIONS BANCORPORATION, NATIONAL ASSOCIATION AND SUBSIDIARIES
ZIONS BANCORPORATION, NATIONAL ASSOCIATION AND SUBSIDIARIES
| | $ | | | | $ | | | | $ | | | | Municipal securities | | | | | | | | | |
| Other debt securities | | | | | | | | | |
| | | | |
| Total available-for-sale | | | | | | | | | | | |
| Trading securities | | | | | | | | | |
| Other noninterest-bearing investments: | | | | | | | |
| Bank-owned life insurance | | | | | | | | | |
Private equity investments 1 | | | | | | | | | | |
| Other assets: | | | | | | | |
| Agriculture loan servicing | | | | | | | | | |
| Loans held for sale | | | | | | | | | |
| Deferred compensation plan assets | | | | | | | | | |
| Derivatives | | | | | | | | | |
| Total assets | $ | | | | $ | | | | $ | | | | $ | | |
| LIABILITIES | | | | | | | |
| Securities sold, not yet purchased | $ | | | | $ | | | | $ | | | | $ | | |
| Other liabilities: | | | | | | | |
| | | | |
| Derivatives | | | | | | | | | |
| Total liabilities | $ | | | | $ | | | | $ | | | | $ | | |
1 The level 1 PEIs relate to the portion of our SBIC investments that are publicly traded.
| | | | | | | | | | | | | | | | | | | | | | | |
| (In millions) | December 31, 2022 |
| Level 1 | | Level 2 | | Level 3 | | Total |
| ASSETS | | | | | | | |
| Available-for-sale securities: | | | | | | | |
| U.S. Treasury, agencies, and corporations | $ | | | | $ | | | | $ | | | | $ | | |
| Municipal securities | | | | | | | | | |
| Other debt securities | | | | | | | | | |
| | | | |
| Total available-for-sale | | | | | | | | | | | |
| Trading securities | | | | | | | | | | |
| Other noninterest-bearing investments: | | | | | | | |
| Bank-owned life insurance | | | | | | | | | |
Private equity investments 1 | | | | | | | | | | |
| Other assets: | | | | | | | |
| Agriculture loan servicing | | | | | | | | | |
| Deferred compensation plan assets | | | | | | | | | |
| Derivatives | | | | | | | | | |
| Total assets | $ | | | | $ | | | | $ | | | | $ | | |
| LIABILITIES | | | | | | | |
| Securities sold, not yet purchased | $ | | | | $ | | | | $ | | | | $ | | |
| Other liabilities: | | | | | | | |
| Derivatives | | | | | | | | | |
| Total liabilities | $ | | | | $ | | | | $ | | | | $ | | |
1 The level 1 PEIs relate to the portion of our SBIC investments that are publicly traded.
ZIONS BANCORPORATION, NATIONAL ASSOCIATION AND SUBSIDIARIES
| | $ | | | | $ | | | | $ | | | | $ | | | | $ | | | |
| Unrealized securities gains (losses), net | () | | | | | | | | | | | | | | | | |
Other noninterest income (expense) 1 | | | | | | | | | | | | | | | | () | |
| Purchases | | | | | | | | | | | | | | | | | |
| Cost of investments sold | () | | | | | | () | | | | | | () | | | | |
| Redemptions and paydowns | | | | | | | | | | | | | | | | () | |
Transfers out 2 | | | | | | | () | | | | | | () | | | | |
| Balance at end of year | $ | | | | $ | | | | $ | | | | $ | | | | $ | | | | $ | | |
1 Represents the valuation adjustments related to the agricultural loan servicing asset.
2 Represents the transfer of SBIC investments out of Level 3 and into Level 1 because they are publicly traded.
) | | $ | () | | | $ | | | | | | Nonrecurring Fair Value Measurements
Certain assets and liabilities may be recorded at fair value on a nonrecurring basis, including impaired loans that have been measured based on the fair value of the underlying collateral, OREO, and equity investments without readily determinable fair values. Nonrecurring fair value adjustments generally include changes in value resulting from observable price changes for equity investments without readily determinable fair values, write-downs of individual assets, or the application of lower of cost or fair value accounting. At December 31, 2023, we had an insignificant amount of assets or liabilities that had fair value changes measured on a nonrecurring basis.
Loans that are collateral dependent were measured at the lower of amortized cost or the fair value of the collateral. OREO was measured initially at fair value based on collateral appraisals at the time of transfer and subsequently at the lower of cost or fair value (less any selling costs). Measurement of fair value for collateral-dependent loans and OREO was based on third-party appraisals that utilize one or more valuation techniques (income, market and/or cost approaches). Any adjustments to calculated fair value were made based on recently completed and validated third-party appraisals, third-party appraisal services, automated valuation services, or our informed judgment. Automated valuation services may be used primarily for residential properties when values from any of the previous methods were not available within 90 days of the balance sheet date. These services use models based on market, economic, and demographic values. At December 31, 2023, we had less than $ million of collateral-dependent loans classified in Level 2, and we recognized an insignificant amount of losses from fair value changes related to these loans.
ZIONS BANCORPORATION, NATIONAL ASSOCIATION AND SUBSIDIARIES
| | $ | | | | 2 | | $ | | | | $ | | | | 2 |
Loans and leases (including loans held for sale), net of allowance | | | | | | | 3 | | | | | | | | 3 |
| Financial liabilities: | | | | | | | | | | | |
| Time deposits | | | | | | | 2 | | | | | | | | 2 |
|
|
| Long-term debt | | | | | | | 2 | | | | | | | | 2 |
The preceding schedule does not include certain financial instruments that are recorded at fair value on a recurring basis, as well as certain financial assets and liabilities for which the carrying value approximates fair value, such as cash and due from banks; money market investments; demand, savings, and money market deposits; federal funds purchased and other short-term borrowings; and security repurchase agreements. The estimated fair value of demand, savings and money market deposits is the amount payable on demand at the reporting date. Carrying value is used because the accounts have no stated maturity, the customer has the ability to withdraw funds immediately, and there is generally negligible credit risk. Instruments for which carrying value approximates fair value are generally classified in Level 2 in the fair value hierarchy because their pricing is largely based on observable market inputs. Time and foreign deposits are measured at fair value by discounting future cash flows using the applicable yield curve to the given maturity dates. Long-term debt is measured at fair value based on actual market trades (i.e., an asset value) when available, or discounting cash flows to maturity using the applicable yield curve adjusted for credit spreads.
For loans measured at amortized cost, fair value is estimated for disclosure purposes by discounting future cash flows using the applicable yield curve adjusted by a factor that is derived from analyzing recent loan originations and combined with a liquidity premium inherent in the loan. These future cash flows are then reduced by the estimated life-of-the-loan aggregate credit losses in the loan portfolio. The methods used to measure fair value for HTM securities was previously described.
These fair value disclosures represent our best estimates based on relevant market information. Fair value estimates are based on judgments regarding current economic conditions, future expected loss experience, risk characteristics of the various instruments, and other factors. These estimates are subjective in nature, involve uncertainties and matters of significant judgment, and cannot be determined with precision. Changes in these methodologies and assumptions would significantly affect the estimates.
Fair Value Option for Certain Loans Held for Sale
During the second quarter of 2023, we elected the fair value option for certain commercial real estate loans that are intended for sale to a third-party conduit for securitization and are hedged with derivative instruments. Electing the fair value option reduces the accounting volatility that would otherwise result from the asymmetry created by accounting for the loans held for sale at the lower of cost or fair value and the derivatives at fair value without the complexity of applying hedge accounting. These loans are included in “Loans held for sale” on the consolidated balance sheet, and associated gains and losses are included in “Capital markets fees” on the consolidated statement of income. At December 31, 2023, we had $ million of loans measured at fair value ($ million par value). During 2023, we recognized approximately $ million of net gains from valuation adjustments of loans carried at fair value and the associated derivatives.
ZIONS BANCORPORATION, NATIONAL ASSOCIATION AND SUBSIDIARIES
4.
| | $ | () | | | $ | | | | $ | | | | $ | | | | $ | | | Derivatives (included in Other assets) | | | | | | | | | | | () | | | () | | | | |
| Total assets | | $ | | | | $ | () | | | $ | | | | $ | () | | | $ | () | | | $ | | |
| Liabilities: | | | | | | | | | | | | |
Federal funds and other short-term borrowings | | $ | | | | $ | () | | | $ | | | | $ | | | | $ | | | | $ | | |
Derivatives (included in Other liabilities) | | | | | | | | | | | () | | | () | | | | |
| Total liabilities | | $ | | | | $ | () | | | $ | | | | $ | () | | | $ | () | | | $ | | |
| | | | | | | | | | | | | | | | | | | | | | | | | | | | | | | | | | | | | | |
| | December 31, 2022 |
| (In millions) | | | | | | | | Gross amounts not offset on the balance sheet | | |
| Description | | Gross amounts recognized | | Gross amounts offset on the balance sheet | | Net amounts presented on the balance sheet | | Financial instruments | | Cash collateral received/pledged | | Net amount |
| Assets: | | | | | | | | | | | | |
Federal funds sold and securities purchased under agreements to resell | | $ | | | | $ | () | | | $ | | | | $ | | | | $ | | | | $ | | |
Derivatives (included in Other assets) | | | | | | | | | | | () | | | () | | | | |
| Total assets | | $ | | | | $ | () | | | $ | | | | $ | () | | | $ | () | | | $ | | |
| Liabilities: | | | | | | | | | | | | |
Federal funds and other short-term borrowings | | $ | | | | $ | () | | | $ | | | | $ | | | | $ | | | | $ | | |
Derivatives (included in Other liabilities) | | | | | | | | | | | () | | | | | | | |
| Total liabilities | | $ | | | | $ | () | | | $ | | | | $ | () | | | $ | | | | $ | | |
Security repurchase and reverse repurchase agreements are offset, when applicable, on the balance sheet according to master netting agreements. Security repurchase agreements are included in “Federal funds and other short-term borrowings.” on the consolidated balance sheet. Derivative instruments may be offset under their master netting agreements; however, for accounting purposes, we present these items on a gross basis on our balance sheet. See Note 7 for further information regarding derivative instruments.
ZIONS BANCORPORATION, NATIONAL ASSOCIATION AND SUBSIDIARIES
5.
million and $ million at December 31, 2023, and 2022, respectively. These receivables are included in “Other assets” on the consolidated balance sheet. The purchase premiums for callable debt securities classified as HTM or AFS are amortized into interest income at an effective yield to the earliest call date. The purchase premiums and discounts for all other HTM and AFS securities are recorded as interest income over the contractual life of the security using the effective yield method. As principal prepayments are received on securities, a proportionate amount of the related premium or discount is recognized in income so that the effective yield on the remaining portion of the security continues unchanged. See Note 3 for more information about the process to estimate fair value for investment securities.
When a security is transferred from AFS to HTM, the difference between its amortized cost basis and fair value at the date of transfer is amortized as a yield adjustment through interest income, and the fair value at the date of transfer results in either a premium or discount to the amortized cost basis of the HTM securities. The amortization of unrealized gains or losses reported in AOCI will offset the effect of the amortization of the premium or discount in interest income that is created by the transfer.
| | $ | | | | $ | | | | $ | | | | Agency guaranteed mortgage-backed securities | | | | | | | | | |
| Municipal securities | | | | | | | | | | | |
| Total held-to-maturity | | | | | | | | | | | |
| Available-for-sale | | | | | | | |
| U.S. Treasury securities | | | | | | | | | | | |
| U.S. Government agencies and corporations: | | | | | | | |
| Agency securities | | | | | | | | | | | |
| Agency guaranteed mortgage-backed securities | | | | | | | | | | | |
| Small Business Administration loan-backed securities | | | | | | | | | | | |
| Municipal securities | | | | | | | | | | | |
| Other | | | | | | | | | | | |
| | | | |
| | | | |
| Total available-for-sale | | | | | | | | | | | |
| Total HTM and AFS investment securities | $ | | | | $ | | | | $ | | | | $ | | |
1 Gross unrealized gains for the respective AFS security categories were individually less than $ million.
ZIONS BANCORPORATION, NATIONAL ASSOCIATION AND SUBSIDIARIES
| | $ | | | | $ | | | | $ | | | | Agency guaranteed mortgage-backed securities | | | | | | | | | | | |
| Municipal securities | | | | | | | | | | | |
| Total held-to-maturity | | | | | | | | | | | |
| Available-for-sale | | | | | | | |
| U.S. Treasury securities | | | | | | | | | | | |
| U.S. Government agencies and corporations: | | | | | | | |
| Agency securities | | | | | | | | | | | |
Agency guaranteed mortgage-backed securities 1 | | | | | | | | | | | |
| Small Business Administration loan-backed securities | | | | | | | | | | | |
| Municipal securities | | | | | | | | | | | |
Other 1 | | | | | | | | | | | |
| Total available-for-sale | | | | | | | | | | | |
| Total HTM and AFS investment securities | $ | | | | $ | | | | $ | | | | $ | | |
1 Gross unrealized gains for these security categories were less than $ million.
During the fourth quarter of 2022, we transferred approximately $ billion fair value ($ billion amortized cost) of mortgage-backed AFS securities to HTM. The transfer of these securities resulted in a discount to the amortized cost basis of the HTM securities equivalent to the $ billion ($ billion after tax) of unrealized losses in AOCI attributable to these securities. The amortization of the unrealized losses will offset the effect of the accretion of the discount created by the transfer. At December 31, 2023, the unamortized discount on the HTM securities totaled approximately $ billion ($ billion after tax).
Maturities
ZIONS BANCORPORATION, NATIONAL ASSOCIATION AND SUBSIDIARIES
| | | % | | $ | | | | | % | | $ | | | | | % | | $ | | | | | % | | $ | | | | | % | Agency guaranteed mortgage-backed securities | | | | | | | | | | | | | | | | | | | | | | | | | | | | | |
Municipal securities 1 | | | | | | | | | | | | | | | | | | | | | | | | | | | | | |
| Total held-to-maturity securities | | | | | | | | | | | | | | | | | | | | | | | | | | | | | |
| Available-for-sale | | | | | | | | | | | | | | | | | | | |
| U.S. Treasury securities | | | | | | | | | | | | | | | | | | | | | | | | | | | | | |
U.S. Government agencies and corporations: | | | | | | | | | | | | | | | | | | | |
| Agency securities | | | | | | | | | | | | | | | | | | | | | | | | | | | | | |
Agency guaranteed mortgage-backed securities | | | | | | | | | | | | | | | | | | | | | | | | | | | | | |
Small Business Administration loan-backed securities | | | | | | | | | | | | | | | | | | | | | | | | | | | | | |
Municipal securities 1 | | | | | | | | | | | | | | | | | | | | | | | | | | | | | |
| Other debt securities | | | | | | | | | | | | | | | | | | | | | | | | | | | | | |
| | | | | | | |
| | | | | | | |
| Total available-for-sale securities | | | | | | | | | | | | | | | | | | | | | | | | | | | | | |
| Total HTM and AFS investment securities | $ | | | | | % | | $ | | | | | % | | $ | | | | | % | | $ | | | | | % | | $ | | | | | % |
1 The yields on tax-exempt securities are calculated on a tax-equivalent basis.
| | $ | | | | $ | | | | $ | | | | $ | | | | $ | | | | U.S. Government agencies and corporations: | | | | | | | | | | | |
| Agency securities | | | | | | | | | | | | | | | | | |
| Agency guaranteed mortgage-backed securities | | | | | | | | | | | | | | | | | |
| Small Business Administration loan-backed securities | | | | | | | | | | | | | | | | | |
| Municipal securities | | | | | | | | | | | | | | | | | |
| Other | | | | | | | | | | | | | | | | | |
|
|
|
|
|
|
|
| Total available-for-sale investment securities | $ | | | | $ | | | | $ | | | | $ | | | | $ | | | | $ | | |
ZIONS BANCORPORATION, NATIONAL ASSOCIATION AND SUBSIDIARIES
| | $ | | | | $ | | | | $ | | | | $ | | | | $ | | | | U.S. Government agencies and corporations: | | | | | | | | | | | |
| Agency securities | | | | | | | | | | | | | | | | | |
| Agency guaranteed mortgage-backed securities | | | | | | | | | | | | | | | | | |
| Small Business Administration loan-backed securities | | | | | | | | | | | | | | | | | |
| Municipal securities | | | | | | | | | | | | | | | | | |
| Other | | | | | | | | | | | | | | | | | |
|
|
|
|
|
|
|
| Total available-for-sale investment securities | $ | | | | $ | | | | $ | | | | $ | | | | $ | | | | $ | | |
At December 31, 2023, and 2022, approximately and AFS investment securities were in an unrealized loss position, respectively.
Impairment
AFS Impairment
We did not recognize any impairment on our AFS investment securities portfolio during 2023 or 2022. Unrealized losses primarily relate to changes in interest rates subsequent to purchase and are not attributable to credit; as such, absent any future sales, we would expect to receive the full principal value at maturity. At December 31, 2023, we had not initiated any sales of AFS securities, nor did we have an intent to sell any identified securities with unrealized losses. We do not believe it is more likely than not that we would be required to sell such securities before recovery of their amortized cost basis.
ZIONS BANCORPORATION, NATIONAL ASSOCIATION AND SUBSIDIARIES
Securities Gains and Losses Recognized in Income
| | | | | | | | | | | | | | | | | Trading | | | | | | | | | | | | | | | | | |
| Other noninterest-bearing investments | $ | | | | $ | | | | $ | | | | $ | | | | $ | | | | $ | | |
| Total | | | | | | | | | | | | | | | | | |
Net gains (losses) 1 | | | $ | | | | | | $ | () | | | | | $ | | |
|
|
|
|
|
|
|
)
)
|
|
| | |
ZIONS BANCORPORATION, NATIONAL ASSOCIATION AND SUBSIDIARIES
| | $ | | | | $ | | | | $ | | | | Leasing | | | | | | | | | | | |
| Owner-occupied | | | | | | | | | | | |
| | | | |
| Total commercial | | | | | | | | | | | |
| Commercial real estate: | | | | | | | |
| Construction and land development | | | | | | | | | | | |
| Term | | | | | | | | | | | |
| Total commercial real estate | | | | | | | | | | | |
| Consumer: | | | | | | | |
| Home equity credit line | | | | | | | | | | | |
| 1-4 family residential | | | | | | | | | | | |
| | | | |
| | | | |
| | | | |
| Total consumer loans | | | | | | | | | | | |
| Total | $ | | | | $ | | | | $ | | | | $ | | |
| | | | | | | | | | | | | | | | | | | | | | | |
| December 31, 2022 |
| Amortized cost basis | | Total amortized cost basis | | |
| (In millions) | with no allowance | | with allowance | | | Related allowance |
| | | | | | | |
| | | | |
| | | | |
| Commercial: | | | | | | | |
| Commercial and industrial | $ | | | | $ | | | | $ | | | | $ | | |
| | | | |
| Owner-occupied | | | | | | | | | | | |
| | | | |
| Total commercial | | | | | | | | | | | |
| Commercial real estate: | | | | | | | |
| | | | |
| Term | | | | | | | | | | | |
| Total commercial real estate | | | | | | | | | | | |
| Consumer: | | | | | | | |
| Home equity credit line | | | | | | | | | | | |
| 1-4 family residential | | | | | | | | | | | |
| | | | |
| | | | |
| | | | |
| Total consumer loans | | | | | | | | | | | |
| Total | $ | | | | $ | | | | $ | | | | $ | | |
ZIONS BANCORPORATION, NATIONAL ASSOCIATION AND SUBSIDIARIES
| | $ | | | | $ | | | | Commercial real estate | | | | | | | | |
| Consumer | | | | | | | | |
| Total | $ | | | | $ | | | | $ | | |
Past Due Loans
Closed-end loans with payments scheduled monthly are reported as past due when the borrower is in arrears for two or more monthly payments. Similarly, open-end credits, such as bankcard and other revolving credit plans, are reported as past due when the minimum payment has not been made for two or more billing cycles. Other multi-payment obligations (i.e., quarterly, semi-annual, etc.), single payment, and demand notes, are reported as past due when either principal or interest is due and unpaid for a period of 30 days or more.
| | $ | | | | $ | | | | $ | | | | $ | | | | $ | | | | $ | | | | Leasing | | | | | | | | | | | | | | | | | | | | |
| Owner-occupied | | | | | | | | | | | | | | | | | | | | |
| Municipal | | | | | | | | | | | | | | | | | | | | |
| Total commercial | | | | | | | | | | | | | | | | | | | | |
| Commercial real estate: | | | | | | | | | | | | | |
Construction and land development | | | | | | | | | | | | | | | | | | | | |
| Term | | | | | | | | | | | | | | | | | | | | |
| Total commercial real estate | | | | | | | | | | | | | | | | | | | | |
| Consumer: | | | | | | | | | | | | | |
| Home equity credit line | | | | | | | | | | | | | | | | | | | | |
| 1-4 family residential | | | | | | | | | | | | | | | | | | | | |
Construction and other consumer real estate | | | | | | | | | | | | | | | | | | | |
Bankcard and other revolving plans | | | | | | | | | | | | | | | | | | | | |
| Other | | | | | | | | | | | | | | | | | | | | |
| Total consumer loans | | | | | | | | | | | | | | | | | | | | |
| Total | $ | | | | $ | | | | $ | | | | $ | | | | $ | | | | $ | | | | $ | | |
ZIONS BANCORPORATION, NATIONAL ASSOCIATION AND SUBSIDIARIES
| | $ | | | | $ | | | | $ | | | | $ | | | | $ | | | | $ | | | | Leasing | | | | | | | | | | | | | | | | | | | | |
| Owner-occupied | | | | | | | | | | | | | | | | | | | | |
| Municipal | | | | | | | | | | | | | | | | | | | | |
| Total commercial | | | | | | | | | | | | | | | | | | | | |
| Commercial real estate: | | | | | | | | | | | | | |
Construction and land development | | | | | | | | | | | | | | | | | | | | |
| Term | | | | | | | | | | | | | | | | | | | | |
| Total commercial real estate | | | | | | | | | | | | | | | | | | | | |
| Consumer: | | | | | | | | | | | | | |
| Home equity credit line | | | | | | | | | | | | | | | | | | | | |
| 1-4 family residential | | | | | | | | | | | | | | | | | | | | |
Construction and other consumer real estate | | | | | | | | | | | | | | | | | | | | |
Bankcard and other revolving plans | | | | | | | | | | | | | | | | | | | | |
| Other | | | | | | | | | | | | | | | | | | | | |
| Total consumer loans | | | | | | | | | | | | | | | | | | | | |
| Total | $ | | | | $ | | | | $ | | | | $ | | | | $ | | | | $ | | | | $ | | |
1 Represents nonaccrual loans that are not past due more than 30 days; however, full payment of principal and interest is not expected.
Credit Quality Indicators
In addition to the nonaccrual and past due criteria, we also analyze loans using loan risk-grading systems, which vary based on the size and type of credit risk exposure. The internal risk-grades assigned to loans follow our definitions of Pass, Special Mention, Substandard, and Doubtful, which are consistent with published definitions of regulatory risk classifications.
Definitions of Pass, Special Mention, Substandard, and Doubtful are summarized as follows:
•Pass — A Pass asset is higher-quality and does not fit any of the other categories described below. The likelihood of loss is considered low.
•Special Mention — A Special Mention asset has potential weaknesses that deserve management’s close attention. If left uncorrected, these potential weaknesses may result in deterioration of the repayment prospects for the asset or in our credit position at some future date.
•Substandard — A Substandard asset is inadequately protected by the current sound worth and paying capacity of the obligor or of the collateral pledged, if any. Assets so classified have well-defined weaknesses and are characterized by the distinct possibility that we may sustain some loss if deficiencies are not corrected.
•Doubtful — A Doubtful asset has all the weaknesses inherent in a Substandard asset with the added characteristics that the weaknesses make collection or liquidation in full highly questionable and improbable.
There were loans classified as Doubtful at both December 31, 2023, and December 31, 2022.
For commercial and CRE loans with commitments greater than $ million, we assign one of multiple grades within the Pass classification or one of the risk classifications described previously. We assess our internal risk-grades quarterly, or as soon as we identify information that affects the credit risk of the loan.
ZIONS BANCORPORATION, NATIONAL ASSOCIATION AND SUBSIDIARIES
The following schedule presents t
ZIONS BANCORPORATION, NATIONAL ASSOCIATION AND SUBSIDIARIES
| $ | | | $ | | | $ | | | $ | | | $ | | | $ | | | $ | | | $ | | | | | Special Mention | | | | | | | | | | | | | | | | | | | |
| Accruing Substandard | | | | | | | | | | | | | | | | | | | |
| Nonaccrual | | | | | | | | | | | | | | | | | | | |
| Total commercial and industrial | | | | | | | | | | | | | | | | | | | |
| Gross charge-offs | | | | | | | | | | | | | | | | | | | |
| Leasing | | | | | | | | | | |
| Pass | | | | | | | | | | | | | | | | | | | |
| Special Mention | | | | | | | | | | | | | | | | | | | |
| Accruing Substandard | | | | | | | | | | | | | | | | | | | |
| Nonaccrual | | | | | | | | | | | | | | | | | | | |
| Total leasing | | | | | | | | | | | | | | | | | | | |
| Gross charge-offs | | | | | | | | | | | | | | | | | | | |
| Owner-occupied | | | | | | | | | | |
| Pass | | | | | | | | | | | | | | | | | | | |
| Special Mention | | | | | | | | | | | | | | | | | | | |
| Accruing Substandard | | | | | | | | | | | | | | | | | | | |
| Nonaccrual | | | | | | | | | | | | | | | | | | | |
| Total owner-occupied | | | | | | | | | | | | | | | | | | | |
| Gross charge-offs | | | | | | | | | | | | | | | | | | | |
| Municipal | | | | | | | | | | |
| Pass | | | | | | | | | | | | | | | | | | | |
| Special Mention | | | | | | | | | | | | | | | | | | | |
| Accruing Substandard | | | | | | | | | | | | | | | | | | | |
| Nonaccrual | | | | | | | | | | | | | | | | | | | |
| Total municipal | | | | | | | | | | | | | | | | | | | |
| Gross charge-offs | | | | | | | | | | | | | | | | | | | |
| Total commercial | | | | | | | | | | | | | | | | | | | |
| Total commercial gross charge-offs | | | | | | | | | | | | | | | | | | | |
| Commercial real estate: | | | | | | | | | | |
| Construction and land development | | | | | | | | |
| Pass | | | | | | | | | | | | | | | | | | | |
| Special Mention | | | | | | | | | | | | | | | | | | | |
| Accruing Substandard | | | | | | | | | | | | | | | | | | | |
| Nonaccrual | | | | | | | | | | | | | | | | | | | |
| Total construction and land development | | | | | | | | | | | | | | | | | | | |
| Gross charge-offs | | | | | | | | | | | | | | | | | | | |
| Term | | | | | | | | | | |
| Pass | | | | | | | | | | | | | | | | | | | |
| Special Mention | | | | | | | | | | | | | | | | | | | |
| Accruing Substandard | | | | | | | | | | | | | | | | | | | |
| Nonaccrual | | | | | | | | | | | | | | | | | | | |
| Total term | | | | | | | | | | | | | | | | | | | |
| Gross charge-offs | | | | | | | | | | | | | | | | | | | |
| Total commercial real estate | | | | | | | | | | | | | | | | | | | |
| Total commercial real estate gross charge-offs | | | | | | | | | | | | | | | | | | | |
ZIONS BANCORPORATION, NATIONAL ASSOCIATION AND SUBSIDIARIES
| | | | | | | | | | | | | | | | | | | Special Mention | | | | | | | | | | | | | | | | | | | |
| Accruing Substandard | | | | | | | | | | | | | | | | | | | |
| Nonaccrual | | | | | | | | | | | | | | | | | | | |
| Total home equity credit line | | | | | | | | | | | | | | | | | | | |
| Gross charge-offs | | | | | | | | | | | | | | | | | | | |
| 1-4 family residential | | | | | | | | | | |
| Pass | | | | | | | | | | | | | | | | | | | |
| Special Mention | | | | | | | | | | | | | | | | | | | |
| Accruing Substandard | | | | | | | | | | | | | | | | | | | |
| Nonaccrual | | | | | | | | | | | | | | | | | | | |
| Total 1-4 family residential | | | | | | | | | | | | | | | | | | | |
| Gross charge-offs | | | | | | | | | | | | | | | | | | | |
| Construction and other consumer real estate | | | | | | | | |
| Pass | | | | | | | | | | | | | | | | | | | |
| Special Mention | | | | | | | | | | | | | | | | | | | |
| Accruing Substandard | | | | | | | | | | | | | | | | | | | |
| Nonaccrual | | | | | | | | | | | | | | | | | | | |
| Total construction and other consumer real estate | | | | | | | | | | | | | | | | | | | |
| Gross charge-offs | | | | | | | | | | | | | | | | | | | |
| Bankcard and other revolving plans | | | | | | | | | |
| Pass | | | | | | | | | | | | | | | | | | | |
| Special Mention | | | | | | | | | | | | | | | | | | | |
| Accruing Substandard | | | | | | | | | | | | | | | | | | | |
| Nonaccrual | | | | | | | | | | | | | | | | | | | |
| Total bankcard and other revolving plans | | | | | | | | | | | | | | | | | | | |
| Gross charge-offs | | | | | | | | | | | | | | | | | | | |
| Other consumer | | | | | | | | | | |
| Pass | | | | | | | | | | | | | | | | | | | |
| Special Mention | | | | | | | | | | | | | | | | | | | |
| Accruing Substandard | | | | | | | | | | | | | | | | | | | |
| Nonaccrual | | | | | | | | | | | | | | | | | | | |
| Total other consumer | | | | | | | | | | | | | | | | | | | |
| Gross charge-offs | | | | | | | | | | | | | | | | | | | |
| Total consumer | | | | | | | | | | | | | | | | | | | |
| Total consumer gross charge-offs | | | | | | | | | | | | | | | | | | | |
| Total loans | $ | | | $ | | | $ | | | $ | | | $ | | | $ | | | $ | | | $ | | | $ | | | |
| Total gross charge-offs | $ | | | $ | | | $ | | | $ | | | $ | | | $ | | | $ | | | $ | | | $ | | | |
ZIONS BANCORPORATION, NATIONAL ASSOCIATION AND SUBSIDIARIES
| $ | | | $ | | | $ | | | $ | | | $ | | | $ | | | $ | | | $ | | | | | Special Mention | | | | | | | | | | | | | | | | | | | |
| Accruing Substandard | | | | | | | | | | | | | | | | | | | |
| Nonaccrual | | | | | | | | | | | | | | | | | | | |
| Total commercial and industrial | | | | | | | | | | | | | | | | | | | |
| Leasing | | | | | | | | | | |
| Pass | | | | | | | | | | | | | | | | | | | |
| Special Mention | | | | | | | | | | | | | | | | | | | |
| Accruing Substandard | | | | | | | | | | | | | | | | | | | |
| Nonaccrual | | | | | | | | | | | | | | | | | | | |
| Total leasing | | | | | | | | | | | | | | | | | | | |
| Owner-occupied | | | | | | | | | | |
| Pass | | | | | | | | | | | | | | | | | | | |
| Special Mention | | | | | | | | | | | | | | | | | | | |
| Accruing Substandard | | | | | | | | | | | | | | | | | | | |
| Nonaccrual | | | | | | | | | | | | | | | | | | | |
| Total owner-occupied | | | | | | | | | | | | | | | | | | | |
| Municipal | | | | | | | | | | |
| Pass | | | | | | | | | | | | | | | | | | | |
| Special Mention | | | | | | | | | | | | | | | | | | | |
| Accruing Substandard | | | | | | | | | | | | | | | | | | | |
| Nonaccrual | | | | | | | | | | | | | | | | | | | |
| Total municipal | | | | | | | | | | | | | | | | | | | |
| Total commercial | | | | | | | | | | | | | | | | | | | |
| Commercial real estate: | | | | | | | | | | |
| Construction and land development | | | | | | | | |
| Pass | | | | | | | | | | | | | | | | | | | |
| Special Mention | | | | | | | | | | | | | | | | | | | |
| Accruing Substandard | | | | | | | | | | | | | | | | | | | |
| Nonaccrual | | | | | | | | | | | | | | | | | | | |
| Total construction and land development | | | | | | | | | | | | | | | | | | | |
| Term | | | | | | | | | | |
| Pass | | | | | | | | | | | | | | | | | | | |
| Special Mention | | | | | | | | | | | | | | | | | | | |
| Accruing Substandard | | | | | | | | | | | | | | | | | | | |
| Nonaccrual | | | | | | | | | | | | | | | | | | | |
| Total term | | | | | | | | | | | | | | | | | | | |
| Total commercial real estate | | | | | | | | | | | | | | | | | | | |
ZIONS BANCORPORATION, NATIONAL ASSOCIATION AND SUBSIDIARIES
| | | | | | | |
| | | | | | |
| | | |
|
|
|
| | |
|
|
|
|
|
|
|
|
| | |
|
| | |
|
| | |
|
1 Primarily relates to a small number of loans within each respective loan class.
Loan modifications to borrowers experiencing financial difficulty during the twelve months ended December 31, 2023, resulted in less than $ million of principal forgiveness for the total loan portfolio for the period.
| | $ | | | | $ | | | | $ | | | | $ | | |
| | | | | | |
| Owner-occupied | | | | | | | | | | | | | | |
| Municipal | | | | | | | | | | | | | | |
| Total commercial | | | | | | | | | | | | | | |
| Commercial real estate: | | | | | | | | | |
Construction and land development | | | | | | | | | | | | | | |
| Term | | | | | | | | | | | | | | |
| Total commercial real estate | | | | | | | | | | | | | | |
| Consumer: | | | | | | | | | |
| | | | | | |
| 1-4 family residential | | | | | | | | | | | | | | |
| | | | | | |
Bankcard and other revolving plans | | | | | | | | | | | | | | |
| | | | | | |
| Total consumer loans | | | | | | | | | | | | | | |
| Total | $ | | | | $ | | | | $ | | | | $ | | | | $ | | |
ZIONS BANCORPORATION, NATIONAL ASSOCIATION AND SUBSIDIARIES
Loan modifications provided to borrowers experiencing financial difficulties exclusively related to the COVID-19 pandemic, in which we provided certain short-term modifications or payment deferrals, were not classified as TDRs. The TDRs disclosed subsequently do not include these loan modifications. Other loan modifications above and beyond these short-term modifications or payment deferrals were assessed for TDR classification.
ZIONS BANCORPORATION, NATIONAL ASSOCIATION AND SUBSIDIARIES
| | $ | | | | $ | | | | $ | | | | $ | | | | $ | | | | $ | | | | Owner-occupied | | | | | | | | | | | | | | | | | | | | |
| |
| Total commercial | | | | | | | | | | | | | | | | | | | | |
| Commercial real estate: | | | | | | | | | | | | | |
| Construction and land development | | | | | | | | | | | | | | | | | | | | |
| Term | | | | | | | | | | | | | | | | | | | | |
| Total commercial real estate | | | | | | | | | | | | | | | | | | | | |
| Consumer: | | | | | | | | | | | | | |
| Home equity credit line | | | | | | | | | | | | | | | | | | | | |
| 1-4 family residential | | | | | | | | | | | | | | | | | | | | |
| |
| |
| Total consumer loans | | | | | | | | | | | | | | | | | | | | |
| Total accruing | $ | | | | $ | | | | $ | | | | $ | | | | $ | | | | $ | | | | $ | | |
| Nonaccruing | | | | | | | | | | | | | |
| Commercial: | | | | | | | | | | | | | |
| Commercial and industrial | $ | | | | $ | | | | $ | | | | $ | | | | $ | | | | $ | | | | $ | | |
| Owner-occupied | | | | | | | | | | | | | | | | | | | | |
| |
| Total commercial | | | | | | | | | | | | | | | | | | | | |
| Commercial real estate: | | | | | | | | | | | | | |
| |
| Term | | | | | | | | | | | | | | | | | | | | |
| Total commercial real estate | | | | | | | | | | | | | | | | | | | | |
| Consumer: | | | | | | | | | | | | | |
| Home equity credit line | | | | | | | | | | | | | | | | | | | | |
| 1-4 family residential | | | | | | | | | | | | | | | | | | | | |
| |
| |
| Total consumer loans | | | | | | | | | | | | | | | | | | | | |
| Total nonaccruing | | | | | | | | | | | | | | | | | | | | |
| Total | $ | | | | $ | | | | $ | | | | $ | | | | $ | | | | $ | | | | $ | | |
1 Includes TDRs that resulted from other modification types including, but not limited to, a legal judgment awarded on different terms, a bankruptcy plan confirmed on different terms, a settlement that includes the delivery of collateral in exchange for debt reduction, etc.
2 Includes TDRs that resulted from a combination of any of the previous modification types.
Unfunded lending commitments on TDRs totaled $ million at December 31, 2022.
The total amortized cost of all TDRs in which interest rates were modified below market was $ million at December 31, 2022. These loans are included in the previous schedule in the columns for interest rate below market and multiple modification types.
The net financial impact on interest income due to interest rate modifications below market for accruing TDRs for the year ended December 31, 2022 was not significant.
On an ongoing basis, we monitor the performance of all TDRs according to their restructured terms. Subsequent payment default is defined in terms of delinquency, when principal or interest payments are past due 90 days or more for commercial loans, or 60 days or more for consumer loans.
ZIONS BANCORPORATION, NATIONAL ASSOCIATION AND SUBSIDIARIES
Collateral-dependent Loans
When a loan is individually evaluated for expected credit losses, we estimate a specific reserve for the loan based on the projected present value of the loan’s future cash flows discounted at the loan’s effective interest rate, the observable market price of the loan, or the fair value of the loan’s underlying collateral.
| | Hospital | | % | | | |
| | |
| Commercial real estate: | | | | | |
| Construction and land development | | | | Office Building | | % |
| Term | | | | Office Building | | % |
| | |
| | |
| | |
| | |
| | |
| | |
| | |
| | |
| Total | $ | | | | | | |
| | | | | | | | | | | | | | | | | |
| December 31, 2022 |
| (In millions) | Amortized Cost | | Major Types of Collateral | | Weighted Average LTV1 |
| Commercial: | | | | | |
| | |
| | |
| Owner-occupied | $ | | | | Land, Warehouse | | % |
| | |
| | |
| Commercial real estate: | | | | | |
| | |
| Term | | | | Multi-family | | % |
| | |
| Consumer: | | | | | |
| Home equity credit line | | | | Single family residential | | % |
| 1-4 family residential | | | | Single family residential | | % |
| | |
| | |
| | |
| | |
| Total | $ | | | | | | |
1 The fair value is based on the most recent appraisal or other collateral evaluation.
Foreclosed Residential Real Estate
At December 31, 2023, and December 31, 2022, we did t have any foreclosed residential real estate property. The amortized cost basis of consumer mortgage loans collateralized by residential real estate property that are in the process of foreclosure was $ million and $ million for the same respective periods.
7.
ZIONS BANCORPORATION, NATIONAL ASSOCIATION AND SUBSIDIARIES
ZIONS BANCORPORATION, NATIONAL ASSOCIATION AND SUBSIDIARIES
At December 31, 2023, we also had pay-fixed, receive-floating interest rate swaps with an aggregate notional amount of $ billion designated as fair value hedges of specifically identified AFS securities. Fair value hedges of fixed-rate assets effectively convert certain fixed interest income to a floating rate on the hedged portion of the assets. Changes in fair value of derivatives designated as fair value hedges of fixed-rate financial assets were largely offset by changes in the value of the hedged assets, as presented in the schedules on the following pages.
Cash Flow Hedges — For derivatives designated and qualifying as cash flow hedges, as long as the hedging relationship continues to qualify for hedge accounting, the entire change in the fair value of the hedging instrument is recorded in OCI and recognized in earnings as the hedged transaction affects earnings. Ineffectiveness is not measured or separately disclosed. Gains or losses on derivatives designated as cash flow hedges are recognized in the same financial statement line item as the hedged transactions. We may use interest rate swaps, options, or a combination of options in our cash flow hedging strategy to eliminate or reduce the variability of interest receipts on floating-rate commercial loans and interest payments on floating rate debt due to changes in any separately identifiable and reliably measurable contractual interest rate index.
At December 31, 2023, we had receive-fixed interest rate swaps with an aggregate notional amount of $ billion designated as cash flow hedges of the variability of interest receipts on floating-rate commercial loans. During 2023, we terminated receive-fixed swaps with an aggregate notional amount of $ billion. At December 31, 2023, we had $ million of net losses deferred in AOCI related to terminated cash flow hedges. Amounts deferred in AOCI from terminated cash flow hedges will be amortized into interest income on a straight-line basis through the original maturity dates of the hedges as long as the hedged forecasted transactions continue to be expected to occur. Amounts deferred in AOCI related to terminated cash flow hedges will be fully reclassified to interest income by the fourth quarter of 2027. Additionally, at December 31, 2023, we had one pay-fixed interest rate swap with a notional amount of $ million designated as a cash flow hedge of the variability in the interest payments on certain FHLB advances.
Hedge Effectiveness — We assess the effectiveness of each hedging relationship by comparing the changes in fair value or cash flows on the derivative hedging instrument with the changes in fair value or cash flows on the designated hedged item or transactions for the risk being hedged. If a hedging relationship ceases to qualify for hedge accounting, the relationship is discontinued and future changes in the fair value of the derivative instrument are recognized in current period earnings. For a discontinued or terminated fair value hedging relationship, all remaining basis adjustments to the carrying amount of the hedged item are amortized to interest income or expense over the remaining life of the hedged item consistent with the amortization of other discounts or premiums. Previous balances deferred in AOCI from discontinued or terminated cash flow hedges are reclassified to interest income or expense as the hedged transactions affect earnings or over the originally specified term of the hedging relationship.
Collateral and Credit Risk
Credit risk arises from the possibility of nonperformance by counterparties. No significant losses on derivative instruments have occurred during 2023 as a result of counterparty nonperformance. We reduce our counterparty exposure for derivative contracts by centrally clearing all eligible derivatives and by executing dealer-facing derivative transactions with well-capitalized financial institutions.
For those derivatives that are not centrally cleared, the counterparties are typically financial institutions or our customers. For those that are financial institutions, as noted above, we manage our credit exposure through the use of a Credit Support Annex (“CSA”) to an ISDA master agreement with each counterparty. Eligible collateral types are documented by the CSA and controlled under our general credit policies. Collateral balances are typically
ZIONS BANCORPORATION, NATIONAL ASSOCIATION AND SUBSIDIARIES
ZIONS BANCORPORATION, NATIONAL ASSOCIATION AND SUBSIDIARIES
We pledge loans and investment securities as collateral for current and potential borrowings. We may borrow from the FHLB under lines of credit that are secured by blanket pledge arrangements. We maintain collateral with carrying amounts adjusted for the types of collateral pledged, equal to at least % of the outstanding advances. We may also borrow from the Federal Reserve Board (“FRB”) based on the amount of collateral pledged.
A large portion of these pledged assets are unencumbered, but are pledged to provide immediate access to contingency sources of funds. At December 31, 2023, our remaining FHLB and FRB collateralized borrowing capacity was $ billion and $ billion, respectively, compared with $ billion and $ billion at December 31, 2022.
ZIONS BANCORPORATION, NATIONAL ASSOCIATION AND SUBSIDIARIES
13.
| | $ | | | | Senior notes | | | | | |
| Finance lease obligations | | | | | |
| Total | $ | | | | $ | | |
The carrying values presented above include the par value of the debt, adjusted for any unamortized premium or discount, unamortized debt issuance costs, and fair value hedge basis adjustments. The decrease in long-term debt from the prior year was primarily due to the maturity of $ million, % senior notes during the second quarter of 2023.
During 2023, we terminated the remaining receive-fixed interest rate swap designated as a hedge of the $ million subordinated notes due in October 2029. The remaining unamortized hedge basis adjustment from the terminated hedging relationship is amortized into earnings through the contractual maturity date of the hedged notes. See Note 7 for more information on derivatives designated as qualifying hedges.
Subordinated Notes
% | $ | | | | $ | | | | September 2028 | | % | | | | | | | | October 2029 |
| Total | | $ | | | | $ | | | | |
The % subordinated notes are unsecured, with interest payable quarterly; the earliest redemption date for these notes was September 15, 2023, after which the interest rate changed to an annual floating rate equal to 3-month Term SOFR + %. The % subordinated notes are unsecured, interest is payable semi-annually, and the earliest redemption date is July 29, 2029.
Senior Notes
The senior notes are unsecured, with interest payable semi-annually. They were issued under a shelf registration filed with the Securities and Exchange Commission (“SEC”).
ZIONS BANCORPORATION, NATIONAL ASSOCIATION AND SUBSIDIARIES
| | 2025 | | |
| 2026 | | |
| 2027 | | |
| 2028 | | |
| Thereafter | | |
| Total | $ | | |
1 Does not include basis adjustments related to terminated or active fair value hedges.
14.
million authorized shares of preferred stock without par value and with a liquidation preference of $ per share, or $ per depositary share. Except for Series I and J, all preferred shares were issued in the form of depositary shares, with each depositary share representing a 1/40th ownership interest in a share of the preferred stock. All preferred shares are registered with the SEC. In addition, Series A and G preferred shares are listed and traded on the National Association of Securities Dealers Automated Quotations (“NASDAQ”) Global Select Market.Preferred shareholders generally receive asset distributions before common shareholders; however, preferred shareholders have only limited voting rights. Preferred stock dividends reduce earnings applicable to common shareholders and are paid on the 15th day of the months indicated in the following schedule. Dividends are subject to approval by the Board.
The preferred shares are redeemable at our option after the expiration of any applicable redemption restrictions. The redemption amount is computed at the per share liquidation preference plus any declared but unpaid dividends. Redemptions are subject to certain regulatory provisions including satisfying well-capitalized minimum requirements.
| | $ | | | | | | | | | | > of % or 3M Term SOFR + % | | Qtrly Mar, Jun, Sep, Dec | | | | | | | | | |
| Series G | | | | | | | | | | | | | annual floating rate = 3M Term SOFR + % | | Qtrly Mar, Jun, Sep, Dec | | | |
| | | | | |
| Series I | | | | | | | | | | | | | annual floating rate = 3M Term SOFR + % | | Qtrly Mar, Jun, Sep, Dec | | | |
| Series J | | | | | | | | | | | | | annual floating rate = 3M Term SOFR + % | | Qtrly Mar, Jun, Sep, Dec | | | |
| Total | $ | | | | $ | | | | | | | | | | | | | |
ZIONS BANCORPORATION, NATIONAL ASSOCIATION AND SUBSIDIARIES
During the first quarter of 2023, we repurchased million common shares outstanding for $ million at an average price of $ per share. As the macroeconomic environment remained uncertain, we suspended our share repurchase program and did not repurchase common shares during the second, third, or fourth quarters of 2023. During 2022, we repurchased million common shares outstanding for $ million at an average price of $ per share.
In February 2024, the Board approved a plan to repurchase up to $ million of common shares outstanding during the fiscal year 2024. In February 2024, we repurchased million common shares outstanding for $ million at an average price of $.
Accumulated Other Comprehensive Income
The AOCI loss was $ billion at December 31, 2023, and primarily reflects declines in the fair value of fixed-rate available-for-sale securities as a result of changes in interest rates.
During the fourth quarter of 2022, we transferred approximately $ billion fair value ($ billion amortized cost) of mortgage-backed AFS securities to the HTM category to reflect our intent for these securities. The amortized cost basis of these securities does not include $ billion of unrealized losses in AOCI that is amortized over the life of the securities. The amortization of the unrealized losses reported in AOCI will offset the effect of the accretion of the discount in interest income that is created by adjusting the amortized cost basis to the securities’ fair value on the date of the transfer. At December 31, 2023, the unamortized discount on the HTM securities totaled approximately $ billion ($ billion after tax).
) | | $ | () | | | $ | () | | | $ | () | |
Other comprehensive income before reclassifications, net of tax | | | | | | | | | | | |
| Amounts reclassified from AOCI, net of tax | | | | | | | | | | | |
| | | | |
| Other comprehensive income | | | | | | | | | | | |
| Balance at December 31, 2023 | $ | () | | | $ | () | | | $ | () | | | $ | () | |
Income tax expense included in other comprehensive income | $ | | | | $ | | | | $ | | | | $ | | |
| 2022 | | | | | | | |
| Balance at December 31, 2021 | $ | () | | | $ | | | | $ | () | | | $ | () | |
Other comprehensive loss before reclassifications, net of tax | () | | | () | | | | | | () | |
| Amounts reclassified from AOCI, net of tax | | | | | | | | | | | |
| | | | |
|
|
|
|
|
|
|
| | | | | | | |
| | | | | | | |
| | | | | | | |
| | | | | | | |
|
|
Financial institutions with a ratio of CET1 to risk-weighted assets above the minimum but below the capital conservation buffer may face constraints on dividends, equity repurchases, and compensation based on the amount of the shortfall. Our internal triggers and limits under actual conditions and baseline projections are more restrictive than the capital conservation buffer requirements.
16.
ZIONS BANCORPORATION, NATIONAL ASSOCIATION AND SUBSIDIARIES
| | $ | | | | Standby letters of credit: | | | |
| Financial | | | | | |
| Performance | | | | | |
| Commercial letters of credit | | | | | |
Mortgage-backed security purchase agreements 2 | | | | | |
| Total unfunded commitments | $ | | | | $ | | |
1 Net of participations.
2 Represents agreements with Farmer Mac to purchase securities backed by certain agricultural mortgage loans.
Loan commitments are agreements to lend to a customer subject to specified conditions. Commitments generally have fixed expiration dates or other termination clauses and may require the payment of a fee. The amount of collateral obtained, if deemed necessary by us upon extension of credit, is based on our initial credit evaluation of the counterparty. Types of collateral vary, but may include accounts receivable, inventory, property, plant and equipment, and income-producing properties.
While making loan commitments creates credit risk, a significant portion of such commitments is expected to expire without being drawn upon. At December 31, 2023, we had $ billion of commitments scheduled to expire in 2024. We use the same credit policies and procedures in making loan commitments and conditional obligations as we do for on-balance sheet instruments. These policies and procedures include credit approvals, limits, and ongoing monitoring.
We issue standby and commercial letters of credit as conditional commitments generally to guarantee the performance of a customer to a third party. The guarantees are primarily issued to support public and private borrowing arrangements, including commercial paper, bond financing, and similar transactions. Standby letters of credit include commitments of $ million expiring in 2024. The credit risk involved in issuing letters of credit is equivalent to the risk involved in extending credit to customers. We generally hold marketable securities and cash equivalents as collateral.
Certain mortgage loans sold have limited recourse provisions for periods ranging from to . The amount of losses resulting from the exercise of these provisions has not been significant.
Legal Matters
We are involved in various legal proceedings or governmental inquiries, which may include litigation in court and arbitral proceedings, as well as investigations, examinations, and other actions brought or considered by governmental and self-regulatory agencies. Litigation may relate to lending, deposit and other customer relationships, vendor and contractual issues, employee matters, intellectual property matters, personal injuries and torts, regulatory and legal compliance, and other matters. While most matters relate to individual claims, we are also subject to putative class action claims and similar broader claims. Proceedings, investigations, examinations, and other actions brought or considered by governmental and self-regulatory agencies may relate to our banking, investment advisory, trust, securities, and other products and services; our customers’ involvement in money laundering, fraud, securities violations and other illicit activities or our policies and practices relating to such customer activities; and our compliance with the broad range of banking, securities and other laws and regulations applicable to us. At any given time, we may be in the process of responding to subpoenas, requests for documents, data and testimony relating to such matters and engaging in discussions to resolve the matters.
ZIONS BANCORPORATION, NATIONAL ASSOCIATION AND SUBSIDIARIES
•Sipple v. Zions Bancorporation, N.A., brought against us in the District Court of Clark County, Nevada in February 2021 with respect to foreign transaction fees. This case is in the discovery phase and trial has been scheduled for October 2024. The parties are currently engaged in settlement discussions.
At least quarterly, we review outstanding and new legal matters, utilizing then available information. In accordance with applicable accounting guidance, if we determine that a loss from a matter is probable and the amount of the loss can be reasonably estimated, we establish an accrual for the loss. In the absence of such a determination, no accrual is made. Once established, accruals are adjusted to reflect developments relating to the matters.
In our review, we also assess whether we can determine the range of reasonably possible losses for significant matters in which we are unable to determine that the likelihood of a loss is remote. Because of the difficulty of predicting the outcome of legal matters, discussed subsequently, we are able to meaningfully estimate such a range only for a limited number of matters. Based on information available at December 31, 2023, we estimated that the aggregate range of reasonably possible losses for those matters to be from to approximately $ million in excess of amounts accrued. The matters underlying the estimated range will change from time to time, and actual results may vary significantly from this estimate. Those matters for which a meaningful estimate is not possible are not included within this estimated range and, therefore, this estimated range does not represent our maximum loss exposure.
Based on our current knowledge, we believe that our current estimated liability for litigation and other legal actions and claims, reflected in our accruals and determined in accordance with applicable accounting guidance, is adequate and that liabilities in excess of the amounts currently accrued, if any, arising from litigation and other legal actions and claims for which an estimate as previously described is possible, will not have a material impact on our financial condition, results of operations, or cash flows. However, in light of the significant uncertainties involved in these matters, and the very large or indeterminate damages sought in some of these matters, an adverse outcome in one or more of these matters could be material to our financial condition, results of operations, or cash flows for any given reporting period.
Any estimate or determination relating to the future resolution of litigation, arbitration, governmental or self-regulatory examinations, investigations or actions or similar matters is inherently uncertain and involves significant judgment. This is particularly true in the early stages of a legal matter, when legal issues and facts have not been well articulated, reviewed, analyzed, and vetted through discovery, preparation for trial or hearings, substantive and productive mediation or settlement discussions, or other actions. It is also particularly true with respect to class action and similar claims involving multiple defendants, matters with complex procedural requirements or substantive issues or novel legal theories, and examinations, investigations and other actions conducted or brought by governmental and self-regulatory agencies, in which the normal adjudicative process is not applicable. Accordingly, we are usually unable to determine whether a favorable or unfavorable outcome is remote, reasonably likely, or probable, or to estimate the amount or range of a probable or reasonably likely loss, until relatively late in the course of a legal matter, sometimes not until a number of years have elapsed. Accordingly, our judgments and estimates relating to claims will change from time to time in light of developments, and actual outcomes will differ from our estimates. These differences may be material.
ZIONS BANCORPORATION, NATIONAL ASSOCIATION AND SUBSIDIARIES
17.
% of our total revenue (interest income plus noninterest income) in 2023. Noninterest income and revenue from contracts with customers is recognized when control of the promised goods or services is transferred to our customers, in an amount that reflects the consideration we expect to be entitled to in exchange for those goods or services. We recognize the incremental cost of obtaining a contract as an expense, when incurred, if the amortization period of the asset that we would have recognized is one year or less. For performance obligations satisfied over time, if we have a right to consideration from a customer in an amount that corresponds directly with the value to the customer of our performance completed to date, we will generally recognize revenue in the amount to which we have a right to invoice. We do not generally disclose information about our remaining performance obligations for those performance obligations that have an original expected duration of one year or less, or where we recognize revenue in the amount to which we have a right to invoice.The following is a description of revenue from contracts with customers:
Commercial Account Fees
Commercial account fee income is comprised of account analysis fees, merchant fees, and payroll services income. Revenue is recognized as the services are rendered or upon completion of services.
Card Fees
Card fee income includes interchange fees from credit and debit cards, net fees earned from processing card transactions for merchants, and automated teller machine (“ATM”) services. Card fee income is recognized as earned. Reward program costs are recorded when the rewards are earned by the customer and as a reduction to interchange income.
Retail and Business Banking Fees
Retail and business banking fees typically consist of fees charged for providing customers with deposit services. These fees are primarily comprised of insufficient funds fees, noncustomer ATM charges, and other various fees on deposit accounts. Service charges on deposit accounts include fees earned in lieu of compensating balances, and fees earned for performing cash management services and other deposit account services. Service charges on deposit accounts are recognized over the period in which the related service is provided. Treasury management fees are billed monthly based on services rendered for the month.
Capital Markets Fees
Capital markets fees primarily consist of municipal advisory services, customer swap fees, loan syndication fees, and foreign exchange services provided to customers. Revenue is recognized as the services are rendered or upon completion of services.
Wealth Management Fees
Wealth management fees are primarily comprised of wealth management commissions, as well as other portfolio and advisory services. Revenue is recognized as the services are rendered or upon completion of services. Financial planning, fiduciary, and estate services typically have performance obligations that are greater than 12 months, although the amount of future performance obligations are not significant.
Other Customer-related Fees
Other customer-related fees generally consist of miscellaneous income sources, including fees associated with compliance and other support services to pharmacies and healthcare providers; corporate trust fees; other advisory
ZIONS BANCORPORATION, NATIONAL ASSOCIATION AND SUBSIDIARIES
| | $ | | | | $ | | | | $ | | | | $ | | | | $ | | | | $ | | | | $ | | | | $ | | | Card fees | | | | | | | | | | | | | | | | | | | | | | | | | | |
Retail and business banking fees | | | | | | | | | | | | | | | | | | | | | | | | | | |
| | | | | |
Capital markets fees | | | | | | | | | | | | | | | | | | | | | | | | | | |
| Wealth management fees | | | | | | | | | | | | | | | | | | | | | | | | | | |
| Other customer-related fees | | | | | | | | | | | | | | | | | | | | | | | | | | |
Total noninterest income from contracts with customers (ASC 606) | | | | | | | | | | | | | | | | | | | | | | | | | | |
Other noninterest income (non-ASC 606 customer-related) | | | | | | | | | | | | | | | | | | | | | | | | | | |
Total customer-related noninterest income | | | | | | | | | | | | | | | | | | | | | | | | | | |
Other noncustomer-related noninterest income | | | | | | | | | | | | | | | | | | | | | | | | | | |
Total noninterest income | | | | | | | | | | | | | | | | | | | | | | | | | | |
| | | | | |
Net interest income | | | | | | | | | | | | | | | | | | | | | | | | | | |
Total net revenue | $ | | | | $ | | | | $ | | | | $ | | | | $ | | | | $ | | | | $ | | | | $ | | | | $ | | |
| | | | | | | | | | | | | | | | | | | | | | | | | | | | | | | | | | | | | | | | | | | | | | | | | | | | | |
| NBAZ | | NSB | | Vectra |
| (In millions) | 2023 | | 2022 | | 2021 | | 2023 | | 2022 | | 2021 | | 2023 | | 2022 | | 2021 |
| | | | | | | | | | | | | | | | | |
Commercial account fees | $ | | | | $ | | | | $ | | | | $ | | | | $ | | | | $ | | | | $ | | | | $ | | | | $ | | |
Card fees | | | | | | | | | | | | | | | | | | | | | | | | | | |
Retail and business banking fees | | | | | | | | | | | | | | | | | | | | | | | | | | |
| | | | | |
Capital markets fees | | | | | | | | | | | | | | | | | | | | | | | | | | |
| Wealth management fees | | | | | | | | | | | | | | | | | | | | | | | | | | |
| Other customer-related fees | | | | | | | | | | | | | | | | | | | | | | | | | | |
Total noninterest income from contracts with customers (ASC 606) | | | | | | | | | | | | | | | | | | | | | | | | | | |
Other noninterest income (non-ASC 606 customer-related) | | | | | | | | | | | | | | | | | | | | | | | | | | |
Total customer-related noninterest income | | | | | | | | | | | | | | | | | | | | | | | | | | |
Other noncustomer-related noninterest income | | | | | | | | | | | | | | | | | | | | | | | | | | |
Total noninterest income | | | | | | | | | | | | | | | | | | | | | | | | | | |
| | | | | |
Net interest income | | | | | | | | | | | | | | | | | | | | | | | | | | |
Total net revenue | $ | | | | $ | | | | $ | | | | $ | | | | $ | | | | $ | | | | $ | | | | $ | | | | $ | | |
ZIONS BANCORPORATION, NATIONAL ASSOCIATION AND SUBSIDIARIES
| | $ | | | | $ | | | | $ | | | | $ | | | | $ | | | | $ | | | | $ | | | | $ | | | Card fees | | | | | | | | | | | | | | | | | | | | | | | | | | |
Retail and business banking fees | | | | | | | | | | | | | | | | | | | | | | | | | | |
| | | | | |
Capital markets fees | | | | | | | | | | | | | | | | | | | | | | | | | | |
| Wealth management fees | | | | | | | | | | () | | | | | | () | | | | | | | | | | |
| Other customer-related fees | | | | | | | | | | | | | | | | | | | | | | | | | | |
Total noninterest income from contracts with customers (ASC 606) | | | | | | | | | | | | | | | | | | | | | | | | | | |
Other noninterest income (non-ASC 606 customer-related) | | | | | | | | | | | | | | | | () | | | | | | | | | | |
Total customer-related noninterest income | | | | | | | | | | | | | | | | | | | | | | | | | | |
Other noncustomer-related noninterest income | | | | | | | | | | | | | | | | | | | | | | | | | | |
Total noninterest income | | | | | | | | | | | | | | | | | | | | | | | | | | |
| | | | | |
Net interest income | | | | | | | | | | | | | | | | | | | | | | | | | | |
Total net revenue | $ | | | | $ | | | | $ | | | | $ | | | | $ | | | | $ | | | | $ | | | | $ | | | | $ | | |
Revenue from contracts with customers did not generate significant contract assets and liabilities. Contract receivables are included in “Other assets” on the consolidated balance sheet. Payment terms vary by services offered, and the timing between completion of performance obligations and payment is generally not significant.
18.
million and $ million at December 31, 2023, and 2022, respectively.Post-retirement Plan — This unfunded health care and life insurance plan provides post-retirement benefits to certain former full-time employees who meet minimum age and service requirements. Our contribution toward the retiree medical premium has been permanently frozen at an amount that does not increase in any future year. Each year, our contributions to the plan are made in amounts sufficient to meet the portion of the premiums that are our responsibility. Our liability for this plan was less than $ million at December 31, 2023 and 2022.
The liability for supplemental retirement and post-retirement benefits is included in “Other liabilities” on the consolidated balance sheet.
Defined Contribution Plan
We offer a 401(k) and employee stock ownership plan under which employees select from several investment alternatives. Employees can contribute up to % of their earnings subject to the annual maximum allowed contribution. We match % of the first % of employee contributions and % of the next % of employee contributions. Matching contributions to participants totaled $ million, $ million, and $ million in 2023, 2022, and 2021, respectively.
The 401(k) plan also has a noncontributory profit-sharing feature that is discretionary and may range from % to % of eligible compensation based upon our performance according to a formula approved annually by the Board. The profit-sharing expense was $ million, $ million, and $ million in 2023, 2022, and 2021, respectively. The profit-sharing contribution to participants consisted of shares of our common stock purchased in the open market.
ZIONS BANCORPORATION, NATIONAL ASSOCIATION AND SUBSIDIARIES
19.
, of which were available for future grants.All share-based payments to employees, including grants of employee stock options, are recorded as compensation expense based on their grant date values with consideration of service and performance vesting requirements. The value of an equity award is estimated on the grant date using a fair value model without regard to service or performance vesting conditions, but does consider post-vesting restrictions.
We classify all share-based awards as equity instruments. Compensation expense is included in “Salaries and employee benefits” on the consolidated statement of income, and the corresponding equity effect is included in shareholders’ equity. We account for forfeitures of share-based compensation awards as they occur. Substantially all share-based awards of stock options, restricted stock, and RSUs have graded vesting that is recognized on a straight-line basis over the vesting period.
| | $ | | | | $ | | | | Reduction of income tax expense | | | | | | | | |
At December 31, 2023, compensation expense not yet recognized for nonvested share-based awards was approximately $ million, which is expected to be recognized over a weighted average period of years.
Stock Options
Stock options granted to employees generally vest at the rate of one third each year and expire after the date of grant. For all stock options granted in 2023, 2022, and 2021, we used the Black-Scholes option pricing model to estimate the grant date value of stock options in determining compensation expense.
| | $ | | | | $ | | | | Weighted average assumptions used: | | | | | |
| Expected dividend yield | | % | | | % | | | % |
| Expected volatility | | % | | | % | | | % |
| Risk-free interest rate | | % | | | % | | | % |
| Expected life (in years) | | | | | |
The assumptions for expected dividend yield, expected volatility, and expected life reflect management’s judgment and include consideration of historical experience. Expected volatility is based in part on historical volatility. The risk-free interest rate is based on the U.S. Treasury yield curve in effect at the time of grant for periods corresponding with the expected life of the option.
ZIONS BANCORPORATION, NATIONAL ASSOCIATION AND SUBSIDIARIES
| | $ | | | | Granted | | | | | |
| Exercised | () | | | | |
| Expired | () | | | | |
| Forfeited | () | | | | |
| Balance at December 31, 2021 | | | | | |
| Granted | | | | | |
| Exercised | () | | | | |
| Expired | () | | | | |
| Forfeited | () | | | | |
| Balance at December 31, 2022 | | | | | |
| Granted | | | | | |
| Exercised | () | | | | |
| Expired | () | | | | |
| Forfeited | () | | | | |
| Balance at December 31, 2023 | | | | | |
| Outstanding stock options exercisable as of: | | | |
| December 31, 2023 | | | | $ | | |
| December 31, 2022 | | | | | |
| December 31, 2021 | | | | | |
We issue new authorized common shares for the exercise of stock options. The total intrinsic value of stock options exercised was approximately $ million in 2023, $ million in 2022, and $ million in 2021. Cash received from the exercise of stock options was $ million in 2023, $ million in 2022, and $ million in 2021.
to $ | | | | $ | | | 1 | | | | | | | | $ | | | |
$ to $ | | | | | | | | | | | | | | | | |
|
$ to $ | | | | | | | | | | | | | | | | |
$.00 to $ | | | | | | | | | | | | | | | | |
$ to $ | | | | | | | | | | | | | | | | |
$ to $ | | | | | | | | | | | | | | | | |
|
|
| | | | | | | 1 | | | | | | | | | |
1 The weighted average remaining contractual life excludes stock options without a fixed expiration date that were assumed with the Amegy acquisition. They expire between the date of termination and one year from the date of termination, depending upon certain circumstances.
The aggregate intrinsic value of outstanding stock options at December 31, 2023 and 2022 was less than $ million and $ million, respectively, while the aggregate intrinsic value of exercisable options was less than $ million and $ million at the same respective dates. For exercisable options, the weighted average remaining contractual life was years and years at December 31, 2023 and 2022, respectively, excluding the stock options previously noted without a fixed expiration date. At December 31, 2023, stock options with a weighted average exercise price of $, and a weighted average remaining life of years, were expected to vest according to their respective schedules with an aggregate intrinsic value of $.
ZIONS BANCORPORATION, NATIONAL ASSOCIATION AND SUBSIDIARIES
RSUs represent rights to share of common stock for each unit and generally vest over . Holders of RSUs receive dividend equivalents during the vesting period, but do not have voting rights. Compensation expense is determined based on the number of restricted shares or RSUs granted and the market price of our common stock at the issue date. During 2023, 2022, and 2021, we granted , , and RSUs, respectively, to nonemployee directors. The RSUs vested immediately upon grant.
| | $ | | | | Issued | | | | | |
| Vested | () | | | | |
|
| Nonvested restricted shares at December 31, 2021 | | | | | |
| Issued | | | | | |
| Vested | () | | | | |
|
| Nonvested restricted shares at December 31, 2022 | | | | | |
| Issued | | | | | |
| Vested | () | | | | |
|
| Nonvested restricted shares at December 31, 2023 | | | | | |
| | $ | | | | Granted | | | | | |
| Vested | () | | | | |
| Forfeited | () | | | | |
| Restricted stock units at December 31, 2021 | | | | | |
| Granted | | | | | |
| Vested | () | | | | |
| Forfeited | () | | | | |
| Restricted stock units at December 31, 2022 | | | | | |
| Granted | | | | | |
| Vested | () | | | | |
| Forfeited | () | | | | |
| Restricted stock units at December 31, 2023 | | | | | |
The total value at grant date of restricted stock and RSUs vested during the year was $ million in 2023, $ million in 2022, and $ million in 2021. At December 31, 2023, shares of restricted stock and RSUs were expected to vest according to their respective schedules with an aggregate intrinsic value of $ million and $ million, respectively.
ZIONS BANCORPORATION, NATIONAL ASSOCIATION AND SUBSIDIARIES
20.
| | $ | | | | $ | | | | Deferred | | | | () | | | | |
| Total Federal | | | | | | | | |
| State: | | | | | |
| Current | | | | | | | | |
| Deferred | () | | | () | | | | |
| Total State | | | | | | | | |
| Total income tax expense | $ | | | | $ | | | | $ | | |
| | $ | | | | $ | | | | State income taxes including credits, net | | | | | | | | |
| Other nondeductible expenses | | | | | | | | |
| Nontaxable income | () | | | () | | | () | |
| Share-based compensation | () | | | () | | | () | |
| Other | | | | () | | | () | |
| | |
| | |
| Total income tax expense | $ | | | | $ | | | | $ | | |
ZIONS BANCORPORATION, NATIONAL ASSOCIATION AND SUBSIDIARIES
| | $ | | | |
| Deferred compensation | | | | | |
|
|
| Security investments and derivative fair value adjustments | | | | | |
| Lease liabilities | | | | | |
| Capitalized costs | | | | | |
| Other | | | | | |
| Total deferred tax assets before valuation allowance | | | | | |
| Valuation allowance | | | | | |
| Total deferred tax assets | | | | | |
| Gross deferred tax liabilities: | | | |
|
| Premises and equipment, due to differences in depreciation | () | | | () | |
| Federal Home Loan Bank stock dividends | () | | | () | |
| Leasing operations | () | | | () | |
| Prepaid expenses | () | | | () | |
| Prepaid pension reserves | | | | () | |
| Mortgage servicing | () | | | () | |
|
| Deferred loan costs | () | | | () | |
| ROU assets | () | | | () | |
| Qualified opportunity fund deferred gains | () | | | () | |
| Equity investments | () | | | () | |
| Total deferred tax liabilities | () | | | () | |
| Net deferred tax assets (liabilities) | $ | | | | $ | | |
We have certain fixed-rate AFS securities whose fair value has declined due to increases in benchmark interest rates, resulting in unrealized losses in the AFS portfolio and a corresponding DTA. The sale of these securities could result in significant realized losses, which would require future earnings to utilize the deferred tax assets. We have the ability and intent to hold these securities to recovery.
We evaluate DTAs on a regular basis to determine whether a valuation allowance is required. In conducting this evaluation, we consider all available evidence, both positive and negative, based on the more-likely-than-not criteria that such assets will be realized. This evaluation includes, but is not limited to, the following:
•Future reversals of existing DTLs — These DTLs have a reversal pattern generally consistent with DTAs, and are used to realize the DTAs.
•Tax planning strategies — We have considered prudent and feasible tax planning strategies that we would implement to preserve the value of the DTAs, if necessary.
•Future projected taxable income — We expect future taxable income will offset the reversal of remaining net DTAs.
Based on this evaluation, we concluded that a valuation allowance was not required at December 31, 2023 and December 31, 2022.
At December 31, 2023, the tax effect of remaining net operating loss and tax credit carryforwards was less than $ million, expiring through 2039.
ZIONS BANCORPORATION, NATIONAL ASSOCIATION AND SUBSIDIARIES
| | $ | | | | $ | | | | Tax positions related to current year: | | | | | |
| Additions | | | | | | | | |
| | |
| Tax positions related to prior years: | | | | | |
| Additions | | | | | | | | |
| Reductions | | | | () | | | | |
| Settlements with taxing authorities | () | | | | | | | |
| Lapses in statutes of limitations | () | | | () | | | | |
| Balance at end of year | $ | | | | $ | | | | $ | | |
At December 31, 2023 and 2022, the liability for unrecognized tax benefits included approximately $ million and $ million (net of the federal tax benefit on state taxes) that, if recognized, would affect the effective tax rate. The amount of gross unrecognized tax benefits related to tax credits on technology initiatives that may increase or decrease during the 12 months subsequent to December 31, 2023 is dependent on the timing and outcome of various ongoing federal and state examinations. For tax years not currently under examination, the gross unrecognized tax benefits on technology initiatives may decrease by approximately $ million.
Interest and penalties related to unrecognized tax benefits are included in “Income tax expense” on the statement of income. At December 31, 2023 and 2022, accrued interest and penalties included in “Other liabilities” on the consolidated balance sheet, net of any federal and state tax benefits, totaled approximately $ million and $ million, respectively.
We file income tax returns in U.S. federal and various state jurisdictions, and we are no longer subject to income tax examinations for years prior to 2013 for federal and certain state returns.
ZIONS BANCORPORATION, NATIONAL ASSOCIATION AND SUBSIDIARIES
21.
| | $ | | | | $ | | | | Less common and preferred dividends | | | | | | | | |
| Less impact from redemption of preferred stock | | | | | | | | |
| Undistributed earnings | | | | | | | | |
| Less undistributed earnings applicable to nonvested shares | | | | | | | | |
| Undistributed earnings applicable to common shares | | | | | | | | |
| Distributed earnings applicable to common shares | | | | | | | | |
| Total earnings applicable to common shares | $ | | | | $ | | | | $ | | |
| Weighted average common shares outstanding (in thousands) | | | | | | | | |
| Net earnings per common share | $ | | | | $ | | | | $ | | |
| Diluted: | | | | | |
| Total earnings applicable to common shares | $ | | | | $ | | | | $ | | |
| | |
| | |
| Weighted average common shares outstanding (in thousands) | | | | | | | | |
| | |
|
| 2023 | | | | | | | |
| Total interest income | $ | | | | $ | | | | $ | | | | $ | | |
| Net interest income | | | | | | | | | | | |
| Provision for credit losses | | | | | | | | | | | |
| Noninterest income | | | | | | | | | | | |
| Noninterest expense | | | | | | | | | | | |
| Income before income taxes | | | | | | | | | | | |
| Net income | | | | | | | | | | | |
| Preferred stock dividends | | | | | | | | | | | |
| | | | |
| Net earnings applicable to common shareholders | | | | | | | | | | | |
| Net earnings per common share: | | | | | | | |
| Basic | | | | | | | | | | | |
| Diluted | | | | | | | | | | | |
| 2022 | | | | | | | |
| Total interest income | $ | | | | $ | | | | $ | | | | $ | | |
| Net interest income | | | | | | | | | | | |
| Provision for credit losses | | | | | | | | | | () | |
| Noninterest income | | | | | | | | | | | |
| Noninterest expense | | | | | | | | | | | |
| Income before income taxes | | | | | | | | | | | |
| Net income | | | | | | | | | | | |
| Preferred stock dividends | | | | | | | | | | | |
| | | | |
| Net earnings applicable to common shareholders | | | | | | | | | | | |
| Net earnings per common share: | | | | | | | |
| Basic | | | | | | | | | | | |
| Diluted | | | | | | | | | | | |
ITEM 9. CHANGES IN AND DISAGREEMENTS WITH ACCOUNTANTS ON ACCOUNTING AND FINANCIAL DISCLOSURE
None.
ITEM 9A. CONTROLS AND PROCEDURES
Our management, with the participation of our Chief Executive Officer and Chief Financial Officer, has evaluated the effectiveness of our disclosure controls and procedures as of December 31, 2023. Based on that evaluation, our Chief Executive Officer and Chief Financial Officer concluded that our disclosure controls and procedures were effective as of December 31, 2023. There were no changes in our internal control over financial reporting during the fourth quarter of 2023 that have materially affected, or are reasonably likely to materially affect, our internal control over financial reporting. See “Report on Management’s Assessment of Internal Control over Financial Reporting” included in Item 8 on page 80 for management’s report on the adequacy of internal control over financial reporting. Also see “Report on Internal Control over Financial Reporting” issued by Ernst & Young LLP included in Item 8 on page 81.
ZIONS BANCORPORATION, NATIONAL ASSOCIATION AND SUBSIDIARIES
ITEM 9B. OTHER INFORMATION
We have adopted insider trading policies and procedures governing the purchase, sale, and other dispositions of securities by directors, officers, and non-executive employees that are reasonably designed to promote compliance with insider trading laws, rules, and regulations, and any applicable listing standards.
None of our directors or officers have , modified, or a Rule 10b5-1(c) trading arrangement during the year ended December 31, 2023. Our directors and officers participate in certain of our benefits plans, such as our Omnibus Incentive Plan and Payshelter 401(k) and Employee Stock Ownership Plan, and may from time to time make elections to have shares withheld to cover withholding taxes or pay the exercise price of options granted thereunder. These elections may be designed to satisfy the affirmative defense conditions of Rule 10b5-1 under the Exchange Act or may constitute non-Rule 10b5-1 trading arrangements as defined in Item 408(c) of Regulation S-K.
ITEM 9C. DISCLOSURE REGARDING FOREIGN JURISDICTIONS THAT PREVENT INSPECTIONS
None.
PART III
ITEM 10. DIRECTORS, EXECUTIVE OFFICERS, AND CORPORATE GOVERNANCE
Incorporated by reference from our Proxy Statement to be subsequently filed.
ITEM 11. EXECUTIVE COMPENSATION
Incorporated by reference from our Proxy Statement to be subsequently filed.
ITEM 12. SECURITY OWNERSHIP OF CERTAIN BENEFICIAL OWNERS AND MANAGEMENT AND RELATED STOCKHOLDER MATTERS
Equity Compensation Plan Information
The following schedule provides information as of December 31, 2023 with respect to the shares of our common stock that may be issued under existing equity compensation plans:
| | | | | | | | | | | | | | | | | | | | | | | | | | | | | | | | | | | | | | |
| | (a) | | (b) | | (c) |
Plan category 1 | | Number of securities to be issued upon exercise of outstanding options, warrants, and rights | | Weighted average exercise price of outstanding options, warrants, and rights | | Number of securities remaining available for future issuance under equity compensation plans (excluding securities reflected in column (a)) |
| | | | | | | | | | | | |
Equity compensation plan approved by security holders: | | | | | | | | | | | | |
| | | | | | | | | | | | |
Zions Bancorporation, N.A. 2022 Omnibus Incentive Plan | | | 1,415,155 | | | | | $ | 53.00 | | | | | 2,747,546 | | |
|
|
|
1 Column (a) excludes 35,771 shares of unvested restricted stock, and 1,329,945 RSUs (each unit representing the right to one share of common stock). The schedule also excludes 5,223 shares of common stock issuable upon the exercise of stock options, with a weighted average exercise price of $6.41, granted under plans assumed in mergers that are outstanding.
Other information required by Item 12 is incorporated by reference from our Proxy Statement to be subsequently filed.
ITEM 13. CERTAIN RELATIONSHIPS AND RELATED TRANSACTIONS, AND DIRECTOR INDEPENDENCE
Incorporated by reference from our Proxy Statement to be subsequently filed.
ZIONS BANCORPORATION, NATIONAL ASSOCIATION AND SUBSIDIARIES
ITEM 14. PRINCIPAL ACCOUNTANT FEES AND SERVICES
Incorporated by reference from our Proxy Statement to be subsequently filed.
PART IV
ITEM 15. EXHIBITS AND FINANCIAL STATEMENT SCHEDULES
a.(1) Financial statements — The following consolidated financial statements of Zions Bancorporation, N.A. are filed as part of this Form 10-K under Item 8, Financial Statements and Supplementary Data:
Consolidated balance sheets — December 31, 2023 and 2022
Consolidated statements of income — Years ended December 31, 2023, 2022, and 2021
Consolidated statements of comprehensive income — Years ended December 31, 2023, 2022, and 2021
Consolidated statements of changes in shareholders’ equity — Years ended December 31, 2023, 2022, and 2021
Consolidated statements of cash flows — Years ended December 31, 2023, 2022, and 2021
Notes to consolidated financial statements — December 31, 2023
(2) Financial statement schedules — All financial statement schedules for which provision is made in the applicable accounting regulations of the SEC are not required under the related instructions, the required information is contained elsewhere in the Form 10-K, or the schedules are inapplicable and have therefore been omitted.
(3) List of Exhibits:
| | | | | | | | | | | |
| Exhibit Number | | Description | |
| | | |
| | | |
| | Second Amended and Restated Articles of Association of Zions Bancorporation, National Association, incorporated by reference to Exhibit 3.1 of Form 8-K filed on October 2, 2018. | * |
| | | |
| | Second Amended and Restated Bylaws of Zions Bancorporation, National Association, incorporated by reference to Exhibit 3.2 of Form 8-K filed on April 4, 2019. | * |
| | | |
| | Description of Securities of Zions Bancorporation, National Association, as of December 31, 2023 (filed herewith). | |
| | | |
| | Zions Bancorporation 2021-2023 Value Sharing Plan, incorporated by reference to Exhibit 10.2 of Form 10-Q for the quarter ended June 30, 2022. | * |
| | | |
| | Zions Bancorporation 2023-2025 Value Sharing Plan, incorporated by reference to Exhibit 10.1 of Form 10-Q for the quarter ended March 31, 2023. | * |
| | | |
| | Zions Bancorporation 2021-2023 Value Sharing Plan with conditional incentives, incorporated by reference to Exhibit 10.3 of Form 10-Q for the quarter ended June 30, 2022. | * |
| | | |
| | Zions Bancorporation 2022-2024 Value Sharing Plan, incorporated by reference to Exhibit 10.4 of Form 10-Q for the quarter ended June 30, 2022. | * |
| | | |
| | Zions Bancorporation 2017 Management Incentive Compensation Plan, incorporated by reference to Appendix I of our Proxy Statement dated April 14, 2016. | * |
| | | |
ZIONS BANCORPORATION, NATIONAL ASSOCIATION AND SUBSIDIARIES
| | | | | | | | | | | |
| Exhibit Number | | Description | |
| | | |
| | Zions Bancorporation Third Restated and Revised Deferred Compensation Plan, incorporated by reference to Exhibit 10.5 of Form 10-K for the year ended December 31, 2018. | * |
| | | |
| | Zions Bancorporation Fourth Restated Deferred Compensation Plan for Directors, incorporated by reference to Exhibit 10.6 of Form 10-K for the year ended December 31, 2018. | * |
| | | |
| | Amendment to the Zions Bancorporation Fourth Restated Deferred Compensation Plan for Directors, incorporated by reference to Exhibit 10.8 of Form 10-K for the year ended December 31, 2015. | * |
| | | |
| | Amegy Bancorporation, Inc. Fifth Amended and Restated Non-Employee Directors Deferred Fee Plan (Frozen upon merger with Zions Bancorporation in 2005), incorporated by reference to Exhibit 10.8 of Form 10-K for the year ended December 31, 2018. | * |
| | | |
| | Zions Bancorporation Executive Management Pension Plan, incorporated by reference to Exhibit 10.8 of Form 10-K for the year ended December 31, 2020. | * |
| | | |
| | Zions Bancorporation First Restated Excess Benefit Plan, incorporated by reference to Exhibit 10.9 of Form 10-K for the year ended December 31, 2020. | * |
| | | |
| | Amegy Bancorporation 2004 (formerly Southwest Bancorporation of Texas, Inc.) Omnibus Incentive Plan, incorporated by reference to Exhibit 10.38 of Form 10-K for the year ended December 31, 2015. | * |
| | | |
| | Trust Agreement establishing the Zions Bancorporation Deferred Compensation Plan Trust by and between Zions Bancorporation and Cigna Bank & Trust Company, FSB effective October 1, 2002, incorporated by reference to Exhibit 10.12 of Form 10-K for the year ended December 31, 2018. | * |
| | | |
| | Amendment to the Trust Agreement Establishing the Zions Bancorporation Deferred Compensation Plans Trust, effective September 1, 2006, incorporated by reference to Exhibit 10.13 of Form 10-K for the year ended December 31, 2018. | * |
| | | |
| | Amendment to the Trust Agreement establishing the Zions Bancorporation Deferred Compensation Plan Trust by and between Zions Bancorporation and Cigna Bank & Trust Company, FSB substituting Prudential Bank & Trust, FSB as the trustee, incorporated by reference to Exhibit 10.12 of Form 10-K for the year ended December 31, 2016. | * |
| | | |
| | Zions Bancorporation Deferred Compensation Plans Master Trust between Zions Bancorporation and Fidelity Management Trust Company, effective September 1, 2006, incorporated by reference to Exhibit 10.15 of Form 10-K for the year ended December 31, 2018. | * |
| | | |
| | Revised schedule C to Zions Bancorporation Deferred Compensation Plans Master Trust between Zions Bancorporation and Fidelity Management Trust Company, effective September 13, 2006, incorporated by reference to Exhibit 10.16 of Form 10-K for the year ended December 31, 2018. | * |
| | | |
| | Third Amendment to the Trust Agreement between Fidelity Management Trust Company and Zions Bancorporation for the Deferred Compensation Plans, dated June 13, 2012, incorporated by reference to Exhibit 10.17 of Form 10-K for the year ended December 31, 2017. | * |
| | | |
| | Fifth Amendment to the Trust Agreement between Fidelity Management Trust Company and Zions Bancorporation for the Deferred Compensation Plans, incorporated by reference to Exhibit 10.18 of Form 10-K for the year ended December 31, 2018. | * |
| | | |
ZIONS BANCORPORATION, NATIONAL ASSOCIATION AND SUBSIDIARIES
| | | | | | | | | | | |
| Exhibit Number | | Description | |
| | | |
| | Sixth Amendment to the Trust Agreement between Fidelity Management Trust Company and Zions Bancorporation for the Deferred Compensation Plans, dated August 17, 2015, incorporated by reference to Exhibit 10.18 of Form 10-K for the year ended December 31, 2020. | * |
| | | |
| | Seventh Amendment to the Trust Agreement between Fidelity Management Trust Company and Zions Bancorporation for the Deferred Compensation Plans, effective September 30, 2018, incorporated by reference to Exhibit 10.2 of Form 10-Q for the quarter ended September 30, 2018. | * |
| | | |
| | Ninth Amendment to the Trust Agreement between Fidelity Management Trust Company and Zions Bancorporation for the Deferred Compensation Plans, effective April 1, 2022, incorporated by reference to Exhibit 10.1 of Form 10-Q for the quarter ended September 30, 2022. | * |
| | | |
| | Zions Bancorporation Payshelter 401(k) and Employee Stock Ownership Plan, Restated and Amended effective January 1, 2007, incorporated by reference to Exhibit 10.3 of Form 10-Q for the quarter ended June 30, 2018. | * |
| | | |
| | Second Amendment to the Zions Bancorporation Payshelter 401(k) and Employee Stock Ownership Plan, dated December 31, 2018, effective January 1, 2019, incorporated by reference to Exhibit 10.27 of Form 10-K for the year ended December 31, 2018. | * |
| | | |
| | Third Amendment to the Zions Bancorporation Payshelter 401(k) and Employee Stock Ownership Plan, dated June 27, 2019, effective September 30, 2018, incorporated by reference to Exhibit 10.1 of Form 10-Q for the quarter ended June 30, 2019. | * |
| | | |
| | Fourth Amendment to the Zions Bancorporation Payshelter 401(k) and Employee Stock Ownership Plan, dated September 11, 2020, effective January 1, 2020, incorporated by reference to Exhibit 10.1 of Form 10-Q for the quarter ended September 30, 2020. | * |
| | | |
| | Fifth Amendment to the Zions Bancorporation Payshelter 401(k) and Employee Stock Ownership Plan, dated September 11, 2020, effective January 1, 2020, incorporated by reference to Exhibit 10.2 of Form 10-Q for the quarter ended September 30, 2020. | * |
| | | |
| | Sixth Amendment to the Zions Bancorporation Payshelter 401(k) and Employee Stock Ownership Plan, dated September 11, 2020, effective October 1, 2020, incorporated by reference to Exhibit 10.3 of Form 10-Q for the quarter ended September 30, 2020. | * |
| | | |
| | Seventh Amendment to the Zions Bancorporation Payshelter 401(k) and Employee Stock Ownership Plan, dated December 23, 2020, effective January 1, 2021, incorporated by reference to Exhibit 10.32 of Form 10-K for the year ended December 31, 2020. | * |
| | | |
| | Eighth Amendment to the Zions Bancorporation Payshelter 401(k) and Employee Stock Ownership Plan, dated December 20, 2022, effective January 1, 2023, incorporated by reference to Exhibit 10.30 of Form 10-K for the year ended December 31, 2022. | * |
| | | |
| | Zions Bancorporation Payshelter 401(k) and Employee Stock Ownership Plan Trust Agreement between Zions Bancorporation and Fidelity Management Trust Company, dated July 3, 2006, incorporated by reference to Exhibit 10.28 of Form 10-K for the year ended December 31, 2018. | * |
| | | |
| | First Amendment to the Zions Bancorporation Payshelter 401(k) and Employee Stock Ownership Plan Trust Agreement between Zions Bancorporation and Fidelity Management Trust Company, dated April 5, 2010, incorporated by reference to Exhibit 10.25 of Form 10-K for the year ended December 31, 2015. | * |
| | | |
ZIONS BANCORPORATION, NATIONAL ASSOCIATION AND SUBSIDIARIES
| | | | | | | | | | | |
| Exhibit Number | | Description | |
| | | |
| | Second Amendment to the Zions Bancorporation Payshelter 401(k) and Employee Stock Ownership Plan Trust Agreement between Zions Bancorporation and Fidelity Management Trust Company, dated April 5, 2010, incorporated by reference to Exhibit 10.26 of Form 10-K for the year ended December 31, 2015. | * |
| | | |
| | Third Amendment to the Zions Bancorporation Payshelter 401(k) and Employee Stock Ownership Plan Trust Agreement between Zions Bancorporation and Fidelity Management Trust Company, dated April 30, 2010, incorporated by reference to Exhibit 10.27 of
Form 10-K for the year ended December 31, 2015. | * |
| | | |
| | Fourth Amendment to the Zions Bancorporation Payshelter 401(k) and Employee Stock Ownership Plan Trust Agreement between Zions Bancorporation and Fidelity Management Trust Company, dated October 1, 2014, incorporated by reference to Exhibit 10.37 of Form 10-K for the year ended December 31, 2020. | * |
| | | |
| | Fifth Amendment to the Zions Bancorporation Payshelter 401(k) and Employee Stock Ownership Plan Trust Agreement between Zions Bancorporation and Fidelity Management Trust Company, dated October 1, 2014, incorporated by reference to Exhibit 10.38 of Form 10-K for the year ended December 31, 2020. | * |
| | | |
| | Sixth Amendment to the Zions Bancorporation Payshelter 401(k) and Employee Stock Ownership Plan Trust Agreement between Zions Bancorporation and Fidelity Management Trust Company, dated August 17, 2015, incorporated by reference to Exhibit 10.39 of Form 10-K for the year ended December 31, 2020. | * |
| | | |
| | Seventh Amendment to the Zions Bancorporation Payshelter 401(k) and Employee Stock Ownership Plan Trust Agreement between Zions Bancorporation and Fidelity Management Trust Company, dated April 27, 2016, incorporated by reference to Exhibit 10.31 of
Form 10-K for the year ended December 31, 2016. | * |
| | | |
| | Eighth Amendment to the Zions Bancorporation Payshelter 401(k) and Employee Stock Ownership Plan Trust Agreement between Zions Bancorporation and Fidelity Management Trust Company, effective September 30, 2018, incorporated by reference to Exhibit 10.3 of Form 10-Q for the quarter ended September 30, 2018. | * |
| | | |
| | Ninth Amendment to the Zions Bancorporation Payshelter 401(k) and Employee Stock Ownership Plan Trust Agreement between Zions Bancorporation and Fidelity Management Trust Company, effective October 27, 2020, incorporated by reference to Exhibit 10.1 of Form 10-Q for the quarter ended June 30, 2021. | * |
| | | |
| | Tenth Amendment to the Zions Bancorporation Payshelter 401(k) and Employee Stock Ownership Plan Trust Agreement between Zions Bancorporation and Fidelity Management Trust Company, effective October 1, 2019, incorporated by reference to Exhibit 10.5 of Form 10-Q for the quarter ended June 30, 2022. | * |
| | | |
| | Eleventh Amendment to the Zions Bancorporation Payshelter 401(k) and Employee Stock Ownership Plan Trust Agreement between Zions Bancorporation and Fidelity Management Trust Company, effective November 1, 2020, incorporated by reference to Exhibit 10.6 of Form 10-Q for the quarter ended June 30, 2022. | * |
| | | |
| | Twelfth Amendment to the Zions Bancorporation Payshelter 401(k) and Employee Stock Ownership Plan Trust Agreement between Zions Bancorporation and Fidelity Management Trust Company, effective April 1, 2022, incorporated by reference to Exhibit 10.7 of Form 10-Q for the quarter ended June 30, 2022. | * |
| | | |
| | Zions Bancorporation 2015 Omnibus Incentive Plan, incorporated by reference to Exhibit 10.42 of Form 10-K for the year ended December 31, 2020. | * |
| | | |
ZIONS BANCORPORATION, NATIONAL ASSOCIATION AND SUBSIDIARIES
| | | | | | | | | | | |
| Exhibit Number | | Description | |
| | | |
| | Form of Restricted Stock Award Agreement subject to holding requirement, Zions Bancorporation 2015 Omnibus Incentive Plan, incorporated by reference to Exhibit 10.43 of Form 10-K for the year ended December 31, 2020. | * |
| | | |
| | Form of Standard Restricted Stock Award Agreement, Zions Bancorporation 2015 Omnibus Incentive Plan, incorporated by reference to Exhibit 10.44 of Form 10-K for the year ended December 31, 2020. | * |
| | | |
| | Form of Standard Restricted Stock Unit Award Agreement, Zions Bancorporation 2015 Omnibus Incentive Plan, incorporated by reference to Exhibit 10.45 of Form 10-K for the year ended December 31, 2020. | * |
| | | |
| | Form of Restricted Stock Unit Agreement subject to holding requirement, Zions Bancorporation 2015 Omnibus Incentive Plan, incorporated by reference to Exhibit 10.46 of Form 10-K for the year ended December 31, 2020. | * |
| | | |
| | Form of Standard Stock Option Award Agreement, Zions Bancorporation 2015 Omnibus Incentive Plan, incorporated by reference to Exhibit 10.47 of Form 10-K for the year ended December 31, 2020. | * |
| | | |
| | Form of Standard Directors Stock Award Agreement, Zions Bancorporation 2015 Omnibus Incentive Plan, incorporated by reference to Exhibit 10.48 of Form 10-K for the year ended December 31, 2020. | * |
| | | |
| | Zions Bancorporation 2022 Omnibus Incentive Plan, incorporated by reference to Appendix I of Schedule 14A, dated March 17, 2022. | * |
| | | |
| | Form of Standard Restricted Stock Award Agreement, Zions Bancorporation 2022 Omnibus Incentive Plan, incorporated by reference to Exhibit 10.8 of Form 10-Q for the quarter ended June 30, 2022. | * |
| | | |
| | Form of Restricted Stock Award Agreement subject to holding requirement, Zions Bancorporation 2022 Omnibus Incentive Plan, incorporated by reference to Exhibit 10.9 of Form 10-Q for the quarter ended June 30, 2022. | * |
| | | |
| | Form of Standard Restricted Stock Unit Award Agreement, Zions Bancorporation 2022 Omnibus Incentive Plan, incorporated by reference to Exhibit 10.10 of Form 10-Q for the quarter ended June 30, 2022. | * |
| | | |
| | Form of Restricted Stock Unit Award Agreement subject to holding requirement, Zions Bancorporation 2022 Omnibus Incentive Plan, incorporated by reference to Exhibit 10.11 of Form 10-Q for the quarter ended June 30, 2022. | * |
| | | |
| | Form of Standard Stock Option Award Agreement, Zions Bancorporation 2022 Omnibus Incentive Plan, incorporated by reference to Exhibit 10.12 of Form 10-Q for the quarter ended June 30, 2022). | * |
| | | |
| | Form of Standard Directors Stock Award Agreement, Zions Bancorporation 2022 Omnibus Incentive Plan, incorporated by reference to Exhibit 10.13 of Form 10-Q for the quarter ended June 30, 2022. | * |
| | | |
| | Form of Change in Control Agreement between the Bank and Certain Executive Officers, incorporated by reference to Exhibit 10.49 of Form 10-K for the year ended December 31, 2020. | * |
| | | |
| | Form of Change in Control Agreement between the Bank and Dallas E. Haun, dated May 23, 2008, incorporated by reference to Exhibit 10.50 of Form 10-K for the year ended December 31, 2020. | * |
ZIONS BANCORPORATION, NATIONAL ASSOCIATION AND SUBSIDIARIES
| | | | | | | | | | | |
| Exhibit Number | | Description | |
| | | |
| | | |
| | List of Subsidiaries of Zions Bancorporation, National Association (filed herewith). | |
| | | |
| | Consent of Independent Registered Public Accounting Firm (filed herewith). | |
| | | |
| | Certification by Chief Executive Officer required by Rules 13a-15(f) and 15d-15(f) under the Securities Exchange Act of 1934 (filed herewith). | |
| | | |
| | Certification by Chief Financial Officer required by Rules 13a-15(f) and 15d-15(f) under the Securities Exchange Act of 1934 (filed herewith). | |
| | | |
| | Certification by Chief Executive Officer and Chief Financial Officer required by Sections 13(a) or 15(d), as applicable, of the Securities Exchange Act of 1934 (15 U.S.C. 78m) and 18 U.S.C. Section 1350 (furnished herewith). | |
| | | |
| | Recoupment policy of Zions Bancorporation, National Association (filed herewith). | |
| | | |
| 101 | | Pursuant to Rules 405 and 406 of Regulation S-T, the following information is formatted in inline XBRL: (i) the Consolidated Balance Sheets as of December 31, 2023 and December 31, 2022, (ii) the Consolidated Statements of Income for the years ended December 31, 2023, December 31, 2022, and December 31, 2021, (iii) the Consolidated Statements of Comprehensive Income for the years ended December 31, 2023, December 31, 2022, and December 31, 2021, (iv) the Consolidated Statements of Changes in Shareholders’ Equity for the years ended December 31, 2023, December 31, 2022, and December 31, 2021, (v) the Consolidated Statements of Cash Flows for the years ended December 31, 2023, December 31, 2022, and December 31, 2021, and (vi) the Notes to Consolidated Financial Statements (filed herewith). | |
| | | |
| 104 | | The cover page from this Form 10-K, formatted as Inline XBRL. | |
* Incorporated by reference
Pursuant to Item 601(b)(4)(iii)(A) of Regulation S-K, copies of certain instruments defining the rights of holders of long-term debt are not filed. We agree to furnish a copy thereof to the SEC and the OCC upon request.
ITEM 16. FORM 10-K SUMMARY
Not applicable.
ZIONS BANCORPORATION, NATIONAL ASSOCIATION AND SUBSIDIARIES
SIGNATURES
Pursuant to the requirements of Section 13 or 15(d) of the Securities Exchange Act of 1934, the Registrant has duly caused this report to be signed on its behalf by the undersigned, thereunto duly authorized.
February 23, 2024 ZIONS BANCORPORATION, NATIONAL ASSOCIATION
| | | | | | | | |
| By | /s/ Harris H. Simmons |
| | HARRIS H. SIMMONS, Chairman
and Chief Executive Officer |
Pursuant to the requirements of the Securities Exchange Act of 1934, this report has been signed below by the following persons on behalf of the Registrant and in the capacities and on the date indicated.
February 23, 2024
| | | | | | | | |
| /s/ Harris H. Simmons | | /s/ Paul E. Burdiss |
HARRIS H. SIMMONS, Director, Chairman
and Chief Executive Officer
(Principal Executive Officer) | | PAUL E. BURDISS, Executive Vice President
and Chief Financial Officer
(Principal Financial Officer) |
| | | | | | | | |
| /s/ R. Ryan Richards | | /s/ Maria Contreras-Sweet |
R. RYAN RICHARDS, Controller
(Principal Accounting Officer) | | MARIA CONTRERAS-SWEET, Director |
| | | | | | | | |
| /s/ Gary L. Crittenden | | /s/ Suren K. Gupta |
| GARY L. CRITTENDEN, Director | | SUREN K. GUPTA, Director |
| | | | | | | | |
| /s/ Claire A. Huang | | /s/ Vivian S. Lee |
| CLAIRE A. HUANG, Director | | VIVIAN S. LEE, Director |
| | | | | | | | |
| /s/ Scott J. McLean | | /s/ Edward F. Murphy |
| SCOTT J. MCLEAN, Director | | EDWARD F. MURPHY, Director |
| | | | | | | | |
| /s/ Stephen D. Quinn | | /s/ Aaron B. Skonnard |
| STEPHEN D. QUINN, Director | | AARON B. SKONNARD, Director |
| | | | | | | | |
| /s/ Barbara A. Yastine | | |
| BARBARA A. YASTINE, Director | | |

Similar companies
See also JPMORGAN CHASE & CO -
Annual report 2022 (10-K 2022-12-31)
Annual report 2023 (10-Q 2023-09-30)
See also BANK OF AMERICA CORP /DE/ -
Annual report 2022 (10-K 2022-12-31)
Annual report 2023 (10-Q 2023-09-30)
See also WELLS FARGO & COMPANY/MN -
Annual report 2023 (10-K 2023-12-31)
Annual report 2023 (10-Q 2023-09-30)
See also CITIGROUP INC -
Annual report 2022 (10-K 2022-12-31)
Annual report 2023 (10-Q 2023-09-30)
See also PNC FINANCIAL SERVICES GROUP, INC. -
Annual report 2022 (10-K 2022-12-31)
Annual report 2023 (10-Q 2023-09-30)
 Open main menu